The biogeochemical cycle of Hg in the high altitude and ...
266
HAL Id: tel-01587825 https://tel.archives-ouvertes.fr/tel-01587825 Submitted on 14 Sep 2017 HAL is a multi-disciplinary open access archive for the deposit and dissemination of sci- entific research documents, whether they are pub- lished or not. The documents may come from teaching and research institutions in France or abroad, or from public or private research centers. L’archive ouverte pluridisciplinaire HAL, est destinée au dépôt et à la diffusion de documents scientifiques de niveau recherche, publiés ou non, émanant des établissements d’enseignement et de recherche français ou étrangers, des laboratoires publics ou privés. The biogeochemical cycle of Hg in the high altitude and tropical hydrosystemof Lake Uru-Uru, Bolivian Altiplano Lucia Alanoca To cite this version: Lucia Alanoca. The biogeochemical cycle of Hg in the high altitude and tropical hydrosystemof Lake Uru-Uru, Bolivian Altiplano. Earth Sciences. Université Toulouse 3 Paul Sabatier (UT3 Paul Sabatier), 2016. Español. tel-01587825
-
Upload
khangminh22 -
Category
Documents
-
view
1 -
download
0
Transcript of The biogeochemical cycle of Hg in the high altitude and ...
HAL Id: tel-01587825https://tel.archives-ouvertes.fr/tel-01587825
Submitted on 14 Sep 2017
HAL is a multi-disciplinary open accessarchive for the deposit and dissemination of sci-entific research documents, whether they are pub-lished or not. The documents may come fromteaching and research institutions in France orabroad, or from public or private research centers.
L’archive ouverte pluridisciplinaire HAL, estdestinée au dépôt et à la diffusion de documentsscientifiques de niveau recherche, publiés ou non,émanant des établissements d’enseignement et derecherche français ou étrangers, des laboratoirespublics ou privés.
The biogeochemical cycle of Hg in the high altitude andtropical hydrosystemof Lake Uru-Uru, Bolivian
AltiplanoLucia Alanoca
To cite this version:Lucia Alanoca. The biogeochemical cycle of Hg in the high altitude and tropical hydrosystemofLake Uru-Uru, Bolivian Altiplano. Earth Sciences. Université Toulouse 3 Paul Sabatier (UT3 PaulSabatier), 2016. Español. �tel-01587825�
THÈSE
En vue de l’obtention du
DOCTORAT DE L’UNIVERSITÉ DE TOULOUSE Delivré par :
Université Toulouse III Paul sabatier (UT3 Paul sabatier)
Discipline ou spécialité :
Sciences de la Terre et des Planètes Solides
Présentée et soutenue par : Lucia Alanoca
Le 16 décembre 2016
Titre : Cycle biogéochimique du Hg dans l’hydrosystème tropical d’altitude
lac Uru-Uru, Altiplano bolivien
Ecole doctorale :
Sciences de l’Univers, de l’Environnement et de l’Espace (SDU2E)
Unité de recherche :
Géosciences Environnement Toulouse
Directeurs de Thèse :
Patrick Seyler, David Point
Rapporteurs :
Alberto de Diego Rodriguez - Université du pays Basque Sarriena auzoa z/g, Espagne
Rosa Carmen Rodríguez Martín-Doimeadios - Université de Castilla-La Mancha, Espagne
Jury :
David Amouroux
Alberto de Diego
David Point
Rosa Rodriguez
Patrick Seyler
Jeroen Sonke

2
Agradecimientos
El presente estudio fue financiado y enmarcado dentro del proyecto INSU ECCO
CYTRIX “COMIBOL 2010-2012”, bajo la dirección científica de investigadores del Instituto
de Investigación Francés (IRD) y del Centro Nacional de Investigación Científica (CNRS),
Francia.
Agradezco de manera especial a mis directores de tesis David Point y PhD. Patrick
Seyler por la oportunidad brindada para realizar este trabajo, por sus incomparables
enseñanzas y por el apoyo moral a lo largo de estos años. Mis agradecimientos especiales van
también para un gran científico, David Amouroux, por su enseñanza paciente para
comprender este amplio tema del mercurio. Con mucho cariño muchas gracias a Stéphane
Guedron por el apoyo y la confianza brindada para terminar esta tesis. No podía faltar
nombrar a un gran equipo de trabajo científico técnico Mathilde Monperrus y Emannuel
Tessier quienes me apoyaron y enseñaron las metodologías analíticas y de campo y de
laboratorio utilizadas en este estudio, muchas gracias por toda su enseñanza.
Un gran agradecimiento a la Universidad Paul Sabatier, a la Escuela doctoral de
Toulouse, al Laboratorio de Géosciences Environnement Toulouse (GET), a su director
Michel Gregoire, así como al personal técnico Manuel Henry, Jonathan Prunier, Stephanie
Mounic, Carole Causserand y a todas aquellas personas que gentilmente me ayudaron. Al
Instituto de Investigaciones para el Desarrollo (IRD) y al señor Representante del IRD en
Francia Dominique Cavet muchas gracias por la confianza al otorgarme la beca de doctorado.
A todo el personal del IRD muchas gracias por toda su colaboración para la realización de
diferentes actividades académicas y de laboratorio. Mis agradecimientos especiales son
también para el director del IRD en Bolivia, Jacques Gardon muchas gracias doctor por su
valioso e incondicional apoyo para la realización y finalización de este trabajo. Agradezco
también a Laurence Maurice con quien empezó mi formación en el campo de la geoquímica
del mercurio, por su enseñanza, apoyo y colaboración. A Marc Roulet mis agradecimientos
gratos por su gran enseñanza desprendida mientras estuvo con nosotros. A mi querido amigo
y jefe Jean Loup Guyot muchas gracias por todo el apoyo dado en este largo camino de mi
formación académica.
Del mismo modo agradezco a la Universidad Mayor de San Andrés, al señor Rector
Waldo Albarracin, al Director de la carrera de Ciencias Químicas Luís Morales, a la
Vicedecana de la Facultad de Ciencias Puras y Naturales María Eugenia Garcia y al director
3
del área de Hidroquímica Jorge Quintanilla, por su grata acogida académica dentro de los
ambientes del Instituto de Ciencias Químicas de la UMSA.
Mis agradecimientos especiales son también para mis queridos amigos Tereza, Jean y
Luc Bourel por todo el apoyo brindado, en los buenos y malos momentos de mi estadia en
Francia y en Bolivia. Mis agradecimientos especiales también son para Vincent Perrot por su
invaluable ayuda en los últimos momentos de la culminación de la tesis, gracias Vincent. A
mis amigos Sylvaine, Georgia, Andrea, María Eliana y Ana muchas gracias por todo su
apoyo.
Agradezco infinitamente a mis queridos padres Mateo Alanoca y Francisca Chura, a
mis queridos hermanos Fely, José y Lidia Alanoca por todo su apoyo y cariño incondicional
que me han dado en diferentes circunstancias de estos últimos años. Finalmente agradezco a
mi amada hija Lucia Marcela por su paciente espera en Bolivia, por su fehaciente y firme
apoyo durante la redacción de esta tesis, gracias hijita!!
4
Con todo cariño
a mi hija
Lucía Marcela
5
Resumen
En el lago Uru-Uru, ubicado sobre la planicie altiplánica boliviana a más de 3700 m de
altitud, se ha estudiado por primera vez el ciclo biogeoquímico del mercurio. La región del
Altiplano boliviano presenta condiciones ambientales extremas, donde las concentraciones de
oxígeno son poco disponibles (60% de presión parcial de oxígeno a 4000 m en comparación a
nivel del mar) e intensas las incidencias de la radiación UV (entre un 7 y 19% más alto por
cada 1000 metros de elevación (Blumthaler et al., 1997; Zaratti et al., 2003). La temperatura
ambiental promedio anual oscila entre 8 y 10°C; las temperaturas diarias fluctúan de -2 a
25°C durante el verano y de -15 a 14°C en invierno. Existen variaciones de hasta 20 y 25°C
entre el día y la noche.
Los recursos hídricos son escasos, las precipitaciones anuales promedio varían según
el año desde 300 hasta 500 mm, con una evaporación muy elevada (1800 mm) (Pillco Zolá
and Bengtsson, 2006), llegando a experimentar sequías y hasta la desaparición de lagos, como
es el caso del lago Poopó, probablemente como producto de la fuerte presión antropogénica y
el cambio climático global. Además de los cambios climáticos adversos, el recurso hídrico es
cada vez menos disponible, debido a que existe el uso indiscriminado del agua por las
actividades mineras de la zona.
En Bolivia las intensas actividades mineras ubicadas en la Cordillera Oriental y
Occidental de los Andes, se vienen desarrollando desde los tiempos de la colonia hasta
nuestros días. Las mismas se encuentran dedicadas a la recuperación de metales de gran
interés económico tales como Sn, Sb, Pb, Ag, Zn y Au. Durante los años 1950, Bolivia de
enormes reservas estanníferas, se convirtió en uno de los grandes productores mundiales de
Sn, ocupando en la actualidad el 4to lugar. La minería, después de recursos hidrocarburíferos,
continúa siendo la base de la economía boliviana; pero a la vez viene siendo responsable de la
liberación directa de enormes cantidades de desechos sólidos y aguas ácidas de minas sobre
los suelos circundantes a las operaciones mineras y sobre los lechos de los ríos afluentes del
lago Uru-Uru y Poopó. La mezcla de estos residuos ha dado lugar a la liberación de un gran
número de metales pesados y en altas concentraciones en la fase acuosa, los cuales son
biodisponibles para los organismos presentes en diferentes compartimientos del medio
ambiente.
El lago Uru-Uru fué originado el año 1952, debido al desborde de las aguas del Río
Desaguadero (drenaje del lago Titicaca) a la altura de la mina La Joya cuya actividad es la
6
explotación de oro. Estas aguas se depositaron sobre la planicie de Santo Tomas,
constituyéndose en el actual lago Uru-Uru. Desde su formación hasta la actualidad este lago
viene siendo contaminado por desechos generados durante las actividades mineras, muy
intentas de la región. A esta contaminación se añade los desechos de origen urbano
provenientes de la ciudad de Oruro (localizada al Norte del lago) a partir del año 2005 hasta la
actualidad. El lago Uru-Uru actúa como un sumidero de desechos inorgánicos y orgánicos
pero a la vez desempeña el rol de un gran reactor para la metilación del mercurio (Hg) en
combinación con las condiciones medioambientales extremas. El origen del Hg en este lago,
como veremos más adelante, probablemente es de origen minero. Diferentes especies
endémicas de aves y peces de este ecosistema presentaron elevadas concentraciones de Hg
(Molina et al., 2012), reflejando la bioacumulación y posterior biomagnificación del
monometilmercurio (MMHg), un compuesto altamente tóxico de efectos adversos graves para
el hombre y la fauna silvestre, los cuales se encuentran al final de la cadena trófica.
El estudio de la biogeoquímica del Hg en ecosistemas a nivel del mar o a bajas
altitudes, está bastante bien documentada, pero son escasos los estudios realizados a elevadas
altitudes en las zonas intertropicales y hasta ahora son desconocidos los estudios que
muestren los mecanismos de transformación del mercurio en un medio extremo altamente
contaminado por metales pesados y por materia orgánica de origen urbano.
En el presente trabajo se estudia, por primera vez, el ciclo biogeoquímico del mercurio
en un medio de condiciones ambientales extremas, a través del estudio de su reactividad para
la transformación en las diferentes especies de Hg en la columna de agua y la dinámica de la
transferencia de las diferentes especies de Hg como el Hg inorgánico (iHg) y el MMHg entre
compartimientos. Por otro lado se estudia y determina las capacidades de metilación y/o
demetilación que tienen estos compartimientos, procesos que son determinantes y además
regulan la producción neta de MMHg. Los objetivos de este trabajo son: i) documentar los
niveles de concentración, la especiación y el origen del Hg en un medio ambiente extremo
respecto a cambios temporales y espaciales y ii) documentar la reactividad, la transformación
de las especies de Hg y su flujo entre los diferentes compartimientos
(agua/sedimentos/material particulado/agregados bio-orgánicos flotantes/perifiton de totora).
Para dar respuesta al primer objetivo fueron determinadas las concentraciones de
diferentes especies químicas en muestras de aguas, sedimentos y aguas intersticiales
colectadas en las épocas seca y húmeda (octubre, 2010 y mayo 2011), a lo largo del transecto
Norte-Sur del lago Uru-Uru. Los parámetros medidos en las muestras de aguas fueron metales
7
y metaloides (Fe, Mn, Sb, Ti y W), elementos mayoritarios y especies de Hg (mercurio total y
monometilmercurio en la fracción filtrada (THgF, MMHgF) y mercurio total y
monometilmercurio en la fracción no filtrada (THgUNF, MMHgUNF), mercurio vapor (Hg0) y
dimetilmercurio (DMHg) en las fracciones no filtradas. En los sedimentos se determinaron
MMHg y THg y en las aguas intersticiales las formas disueltas de monometilmercurio y
mercurio inorgánico (iMMHgFPW y iHgFPW respectivamente).
Para dar respuesta al estudio de la reactividad y transformación de las diferentes
especies de Hg, fueron determinados los potenciales de metilación (M) y demetilación (D) en
muestras de sedimentos, aguas, perifiton y agregados bio-orgánicos flotantes, colectadas en
los sitios norte (NS) y sur (SS) del lago Uru-Uru. Para este experimento se utilizaron
trazadores isotópicos estables enriquecidos en 199IHg y MM201Hg.
En el transecto Norte-Sur del lago Uru-Uru, se han encontrado elevadas
concentraciones de boro (B) (1581-9911 µ L-1), manganeso (Mn) (23,4-493 µ L-1), hierro
(Fe) (36,1-195 µ L-1), arsénico (As) (46,4-93,4 µ L-1), estroncio (Sr) (1210-5475 µ L-1), bario
(Ba) (5-176 µ L-1), antimonio (Sb) (1,3-19,5 µ L-1) y MMHgF (0,2-2,0 ng L-1). El porcentaje
promedio de MMHgF, para las épocas seca y húmeda, fue de 49 ± 11% con respecto al THgF.
Los análisis de los coeficientes de correlación encontrados entre el iHg y el estaño (Sn),
plomo (Pb) y Sb en los sedimentos, indican que la fuente principal del Hg es probablemente
de origen minero. La evaluación de los cálculos de los coeficientes de partición en base a las
concentraciones de MMHg y iHg en los sedimentos, aguas intersticiales y en la columna de
agua, muestra que los sedimentos son los mayores contribuidores de MMHg en el lago
durante la época seca, cuyo flujo difusivo alcanza hasta 227 ng m-2 day-1 de MMHg. Esta
aseveración es sustentada con la medición de los potenciales de M/D en los sedimentos.
En esta región de elevadas radiaciones solares y UV, se ha evidenciado que el proceso
de fotoreducción del Hg en el agua es limitado, probablemente por las elevadas
concentraciones de materia orgánica disuelta (~16,5 mg L-1), más aún si se trata de materia
orgánica de naturaleza húmica, esta última aún no identificada.
Las altas concentraciones de MMHg en el agua, podría ser explicadas 1) que se debe a
la formación de complejos estables entre la materia orgánica húmica y el Hg, formas químicas
que disminuyen el proceso de fotoreducción y 2) que el MMHg probablemente se encuentra
asociado a FeS o materia orgánica en la fase coloidal.
8
El estudio de la reactividad del Hg, cuyo comportamiento fue observado en un ciclo de
24 horas en los sitio Norte (contaminado) y Sur (sitio no contaminado), en las épocas seca y
húmeda, indica que la produción de MMHg está atribuida de manera prioritaria a los procesos
bióticos bacterianos de las sulfatoreductoras, favorecida durante la noche con el
decrecimiento en la concentración de oxígeno. Las diferentes concentraciones de MMHg
medidos en la columna de agua se podrían explicar que se deben a las diferentes interacciones
entre sedimento/agua/material particulado suspendido. El promedio de las concentraciones de
MMHgF (o disuelto), a lo largo del transecto Norte-Sur del lago correspondiente a las dos
épocas, fue de 0,69 ± 0,47 ng L-1, representando alrededor del ~50% del iHgF. Mientras que
las concentraciones de mercurio total (THg) (forma disuelta y particulada) en el lago, variaron
de 0,9 a 38,5 ng L-1. Las concentraciones de THg en el lago Uru-Uru se encuentran en el
rango superior de las concentraciones reportadas para THg en lagos pristinos de todo el
mundo. Mientras que las concentraciones de MMHg en la fracción filtrada, son hasta ahora
los más altos reportados en lagos de diferente altitud (lago oligotrófico Moreno de la
Patagonia (0,002 a 0,01 ng L-1), lago hiper eutrófico contaminado Dianchi del Tibet (0,07-
0,19 ng L-1) y lagos de los Alpes franceses (1,9-9,2 pg L-1)). Por lo que probablemente esta
región se trate de una zona hotspot mundial, con una gama de concentraciones muy elevadas
de Hg, registradas para aguas óxicas de ecosistemas lacustres.
El estudio de los procesos de transformación del Hg, espaciales y estacionales
demostraron que las producciones de MMHg en los sedimentos (3,4 ± 1,2 ng g-1 día−1 para la
época seca), fueron favorecidas en el sitio más contaminado. De las diferentes matrices
ensayadas, fueron los agregados bio-orgánicos flotantes, observados durante el periodo seco,
los mayores metiladores de Hg (5,8 ng MMHg g-1 día-1, en la época seca), seguido de los
sedimentos. Mientras que el perifiton de las totoras ha demostrado tener una gran capacidad
para descomponer MMHg (2,1 ng MMHg g−1 day-1). Tomando en cuenta las masas de los
agregados bio-orgánicos flotantes y el de las capas superficiales de los sedimentos, en el lago
Uru-Uru, probablemente son los sedimentos los mayores metiladores de Hg y productores de
MMHg a nivel anual. En los sedimentos y en los agregados bio-orgánicos flotantes se han
evidenciado las mismas comunidades de bacterianas sulfatoreductoras (promotoras de la
metilación del Hg), mientras que en la columna de agua estas comunidades fueron distintas.
El conjunto del estudio nos muestra que el lago Uru-Uru es un ambiente muy
dinámico, donde las transformaciones del Hg en diferentes especies de Hg están regidas
principalmente por las características fisicoquímicas del ecosistema acuático y mediadas por
las poblaciones de bacterias sulfatoreductoras y muy probablemente por otras poblaciones
9
bacterianas propias de ambientes oxigenados. Dichas caraterísticas son fuertemente
influencias por la combinación de contaminantes de origen minero y urbano.
Las elevadas concentraciones de MMHg en forma disuelta en la columna de agua, y
las bajas concentraciones de Hg0, indican que este ecosistema tiene una escasa capacidad de
autodepuración respecto al Hg y una mayor disponibilidad de MMHg para su bioacumulación
y posterior biomagnificación en los organismos acuáticos. En este contexto la población
consumidora de pescado podría estar en riesgo de ser contaminada por MMHg.
La tesis desglosada en tres capítulos, en el primer capítulo de introducción se describe
el ciclo biogeoquímico del Hg en el medio ambiente, según diferentes estudios realizados a
poca altitud, a nivel del mar y a gran altitud; el segundo y tercer capítulo describe el estudio
del ciclo biogeoquímico del Hg en el ecosistema acuático del Altiplano boliviano, la
reactividad y los factores que gobiernan a este proceso. Este estudio se ha realizado en base a
las cuantificaciones de las concentraciones de las diferentes especies de Hg, de metales
pesados y elementos mayoritarios, además de las tasas de metilación de Hg, en los diferentes
compartimientos de lago Uru-Uru. Finalmente se realiza una conclusión general de todo el
estudio, perpectivas científicas y recomendaciones.
10
Résumé étendu
Le cycle biogéochimique du Hg dans le lac Uru-Uru, situé à plus de 3700 mètres
d’altitude sur l’Altiplano bolivien, fait l’objet de ce travail de thèse. Cette région de
l’Altiplano bolivien a été choisie en raison de conditions environnementales particulières :
l’altitude (la masse totale de l’oxygène à 4000 m d’altitude représente 60% de la masse totale
au niveau de la mer) et l’intensité du rayonnement solaire. La température annuelle moyenne
oscille entre 8 et 10°C; la température du jour varie très fortement, de -2 à 25°C pendant l’été
et de -15 à 14°C en hiver et les variations diurnes peuvent atteindre 20 à 25°C. Les
précipitations annuelles moyennes varient selon les années de 300 à 500 mm et l’évaporation
mesurée est de 1800 mm (Pillco Zolá and Bengtsson, 2006). Dans ce contexte aride, les
périodes de sécheresses peuvent provoquer la disparition transitoire de lac, comme c’est le cas
du lac Poopó, probablement lié à la fois à une forte pression anthropique et aux variations
climatiques climatique globales. La ressource hydrique, qui est rare dans la région, est
d’autant plus limitée pour la population locale, essentiellement agricole, que les activités
minières utilisent aujourd’hui de façon indiscriminée de grandes quantités de cette ressource
pour ses activités.
En Bolivie, l’importante activité minière liée à l’extraction de métaux d’intérêt
économique comme Sn, Sb, Pb, Ag, Zn et Au s’est développée depuis l’époque coloniale dans
les Cordillères Orientale et Occidentale. Depuis les années 1850, la Bolivie, est devenue un
des principaux producteurs mondiaux, d’étain, occupant actuellement la quatrième position en
terme de production. Cette activité est à l’origine de la dissémination d’énormes quantités de
déchets solides et de la production d’eaux acides de drainages de mines non traités qui
rejoignent le réseau hydrologique des lacs. Le mélange de ces résidus provoque la libération
de grandes quantités de métaux lourds qui sont à l’origine des fortes concentrations dissoutes
rencontrées, dont une fraction importante est biodisponible pour les organismes présents dans
les différents compartiments de l’environnement.
Le lac Uru-Uru reçoit les eaux du río Desaguadero, exutoire du lac Titicaca qui
traverse la plaine de Santo Tomas sur laquelle a été déposée les rejets de la mine de La Joya
depuis 1952 et qui reçoit également depuis 2005 les rejets urbains et industriels non traités de
la ville d’Oruro.
11
L’objectif de ce travail est de documenter le cycle biogéochimique du Hg dans les
eaux du lac Uru-Uru, à travers l’étude de sa spéciation et de la dynamique spatiale et
temporelle des différentes espèces chimiques (iHg et MMHg) dans la colonne d’eau et les
différents compartiments du lac. La capacité de méthylation et/ou déméthylation qui sont les
processus qui déterminent et régulent la production de MMHg ont également été étudiés.
Enfin, les flux de iHg y MMHg entre les différents compartiments (eau / sédiments / matériel
particulaire / agrégats bio-organiques flottants / périphyton de totoras) ont été estimés.
Pour répondre au premier objectif, nous avons déterminé les concentrations des
différentes espèces chimiques dans les échantillons d’eau, de sédiments et d’eau interstitielles
prélevées en saison sèche et humide (octobre 2010 et mai 2011), tout au long d’un transect
nord-sud du lac Uru-Uru. Les paramètres mesurés dans les échantillons d’eaux ont été les
métaux et métalloïdes (Fe, Mn, Sb, Ti et W), les éléments majeurs et différentes espèces
chimiques du Hg, Hg inorganique (iHg), monomethylHg (MMHg), Hg vapeur (Hg0) et
dimethylHg (DMHg). Dans les sédiments le MMHgT et le Hg total (THg) a été determinés
alors que dans les eaux interstitielles nous avons mesuré les concentrations des formes
dissoutes de MMHg et iHg (MMHgFPW et iHgFPW respectivement).
Pour étudier la réactivité et la transformation des différentes espèces de Hg, nous
avons déterminé les potentiels de méthylation (M) et déméthylation (D) dans les échantillons
de sédiments, d’eaux, de périphyton et agrégats bio-organiques flottants, collectés sur les sites
nord (NS) et sud (SS) du lac Uru-Uru. Les déterminations des potentiels de M et de D ont été
réalisées au travers d’expérimentations réalisées in situ, consistant à l’incubation de traceurs
isotopiques stables enrichis en 199IHg et MM201Hg, pendant 24 heures, dans différents types
de prélèvements collectés dans le lac en saison sèche et humide des années 2010 et 2011.
L’étude de la réactivité du Hg, observée dans différents compartiments par cycles de
24 heures sur le site nord (contaminé) et sud (non contaminé) en saison sèche et saison des
pluies, indique que la production de MMHg est à attribuer principalement aux processus
biotiques des bactéries sulfatoréductrices, favorisé pendant la nuit par la diminution de la
concentration en oxygène. Pour un cycle annuel, les différentes concentrations de MMHg
mesurées dans la colonne d’eau pourraient être expliquées par les différentes interactions
entre sédiment / eau / matériel particulaire en suspension. Les concentrations de MMHg total
dans l’eau ont varié de 0,2 à 5,7 ng L-1, avec une moyenne de 1,3±1,3 ng L-1. Dans le même
temps, les teneurs en MMHg dissout se situaient entre 0,2-2,0 ng L-1 avec en moyenne 0,69 ±
0,47 ng L-1, représentant autour de 50% du Hg total dissout ou filtré (THgF: 0,4-3,5 ng L-1).
12
Les concentrations de Hg total (THg) (formes dissoutes + particulaires) dans le lac sont
comprises entre 0,9 a 38,5 ng L-1. Dans tous les cas les valeurs les plus élevées étaient
retrouvées au nord du lac. Comparées aux concentrations de la littérature concernant les lacs
non contaminés, les concentrations de THg mesurées dans le lac Uru-Uru sont parmi dans les
valeurs les plus hautes observées. Pour le MMHg, les concentrations dans la fraction filtrée
sont à ce jour les valeurs les plus élevées jamais rapportées dans la littérature (lacs
oligotrophes Moreno de Patagonie (0,002 a 0,01 ng L-1), lac hyper eutrophe contaminé
Dianchi du Tibet (0,07- 0,19 ng L-1) et lac des Alpes françaises (1,9-9,2 pg L-1). L’étude des
processus spatiaux-temporels de transformation du Hg démontre que la production de MMHg
dans les sédiments (3,4±1,2 ng g-1 j-1 en saison sèche) est plus élevé dans le site le plus
contaminé au nord du lac. Des différentes matrices étudiées, les agrégats bio-organiques
flottants, observés pendant la saison sèche, est le compartiment où les taux de methylation du
Hg (5,8 ng MMHg g-1 día-1) sont les plus élevés, suivis des compartiments sédimentaires. Le
périphyton de la « totora » (végétation endémique du lac) possède une forte capacité pour
décomposer le MMHg (-2,1 ng MMHg g-1 día-1). Si on tient compte de la masse des agrégats
bio-organiques flottants comparés à celle des couches superficielles des sédiments, le
comportement sédimentaire est le site principal de méthylation de Hg et donc le plus
producteurs de MMHg au niveau annuel (figure 36). Dans les sédiments comme dans les
agrégats nous avons mis en évidence les mêmes communautés de bactéries sulfatoréductrices
(promotrices de la méthylation du Hg), communautés qui sont distinctes de celles rencontrées
dans la colonne d’eau. Les résultats du transect nord-sud du lac Uru-Uru, quelque soit la
saison montrent des concentrations dissoutes élevées en métaux et métalloïdes (de 1581 à
9911 pour le B, de 23,4 à 493 pour le Mn, de 36,1 à 195 pour le Fe), de 46,4 à 93,4 pour l’As,
de 1210 à 5475 pour le Sr, de 5 à 176 pour le Ba et de 1,3 à 19,5 µ L-1 pour le Sb) alors que
les concentrations de MMHg se situaient entre 0,2 et 2,0 ng L-1. Les niveaux de
concentrations dans les sédiments (Sn : 5-24, Sb: 3-25, Pb: 17-95, As: 41-86, Cu: 25-83, Zn:
195-60, W: 1,2-2,4 ng g-1) et les concentrations de HgT et de MMHg variaient de 385 à 54 y
de 0,04 à 7,84 ng g-1 respectivement. Le pourcentage moyen de MMHg dissout dans les eaux,
pendant la saison sèche et la saison des pluies a été de 49 ± 11% par rapport au Hg total
dissout (THgd). L’analyse des coefficients de corrélation de Hg / Sb et de Hg / W (0,75 y 0,6
respectivement; p<0,01) (Sb et W sont deux métaux très exploités dans la région) dans les
sédiments des sites de confluence des affluents miniers indique que la source de Hg est
probablement d’origine minière. L’évaluation des coefficients de partition basés sur les
concentrations de MMHg et de IHg dans les sédiments, eaux superficielles et colonne d’eau,
montre que les sédiments sont les principaux contributeurs du MMHg de la colonne d’eau du
13
lac pendant la saison sèche avec un flux diffusif qui atteint des valeurs jusqu’à 227 ng m-2 día-
1 de MMHg (figure 29). Ces déductions sont étayées par la détermination des potentiels de M
/ D des sédiments.
Dans cette région où le rayonnement solaire et UV est très élevé, on a mis en évidence
que le processus de photoréduction du Hg dans l’eau est limité, probablement à cause des
concentrations élevées en matériel organique dissous (~16,5 mg L-1) même s’il s’agit de
matière organique humique. Les fortes concentrations en MMHg dans les eaux pourraient
avoir deux explications : 1) la formation de complexes stables entre la matière organique
humique et le Hg, complexes fortement résistant à la photoréduction et 2) la formation de
colloïdes entre MMHg, le sulfures de fer (FeS) et la la matière organique.
L’ensemble des ces résultas montre que le lac Uru-Uru est un environnement très
dynamique où les transformations du Hg en différentes formes chimiques sont contrôlées à la
fois par les caractéristiques physicochimiques de l’écosystème et par la présence de
populations de bactéries sulfatoréductrices (et probablement par d’autres populations
bactériennes spécifiques d’un environnement très oxique). L’activité minière constitue la
source principale du Hg. La présence de fortes concentrations de MMHg sous forme dissoute
dans la colonne d’eau et les basses concentrations de Hg0 dans cet écosystème de type alcalin
(pH = 8,3 ± 0,6; concentrations en sulfates : 5,5 ± 3,2 g L-1; HCO3-1 = 197,9 ± 50,2 mg L-1) et
impacté par les eaux usées d’origine urbaine, est le signe que cet écosystème a de faibles
possibilités d’autoépuration en ce qui concerne le Hg. Cela induit une forte disponibilité du
MMHg pour les processus de bioaccumulation et de bioamplification dans la chaine
trophique. Une contamination de la population locale, consommatrice de poissons, n’est donc
pas à exclure.
En conclusion, dans le lac d’altitude Uru-Uru, la réactivité du Hg se trouve déterminée
par des conditions physicochimiques extrêmes, lesquelles fluctuent au cours de l’année
(saison sèche et humide). Pendant la saison sèche, la forte radiation solaire associée à la
sècheresse provoque l’évaporation des eaux, ce qui entraine une augmentation de la salinité.
Pendant la saison des pluies, un effet de dilution est observé pour les éléments majeurs sans
effet significatif sur le Hg. Cet environnement alcalin fortement concentré en sulfates et en
bicarbonates possède une grande capacité tampon favorisant la précipitation de carbonates et
le stockage du Hg et de différents métaux et métalloïdes depuis la colonne d’eau vers les
sédiments. Les stocks de Hg, métaux et métalloïdes et de matière organique dans le lac
proviennent de l’activité minière et urbaine qui se développe dans la région. Ces conditions
14
favorisent la photosynthèse, la production primaire de matière organique et l’augmentation de
la concentration d’oxygène dans la colonne d’eau pendant le jour. A l’inverse, pendant la nuit
la consommation d’oxygène par la respiration des organismes aquatiques crée
progressivement des conditions anoxiques, favorables à la production de MMHg par les
populations de bactéries sulfatoréductrices. L’autoépuration ou la détoxification du Hg dans le
lac, générée par la photodégradation du MMHg et la réduction du Hg2+ est probablement
limitée par la formation de complexes stables avec des ligands organiques (humiques)
difficiles à décomposer, mais aussi par la forte concentration de matière organique (d’origine
humique) qui pourrait limiter la pénétration des radiations ultraviolettes. La forte
concentration en MMHg et en THg dans la fraction filtrée des eaux du site situé au nord du
lac ainsi qu’à la confluence entre les eaux du lac avec celles du río Huanuni, témoignent d’une
même origine des apports en Hg depuis les régions minières pendant la saison des pluies. Ce
résultat est confirmé par l’observation pendant la saison des pluies des différentes formes
chimiques du Hg, des métaux et métalloïdes sous formes dissoutes qui ne subissent pas de
dilution comme c’est observé pour les éléments majeurs. Les coefficients de corrélation
observés entre THg et certains éléments métalliques exploités (Sb et W), confirment que les
apports liés aux déchets produits à l’activité minière (matériel inerte et eaux acides), sont
probablement la source principale de Hg pour le lac, en association avec les flux d’origine
urbaine. La faible profondeur du lac pourrait influencer la contribution en MMHg depuis les
sédiments vers la colonne d’eau. Les coefficients de partition et les flux diffusifs calculés en
utilisant la loi de Fick à partir des concentrations de MMHgF présents dans les eaux
interstitielles et surnagentes indiquent qu’il existe un transfert important de MMHg des
sédiments à la colonne d’eau pendant la saison sèche et un processus inverse pendant la saison
des pluies. Laproduction de MMHg dans la colonne d’eau est favorisée pendant la nuit en
conditions anoxiques (créée par les processus de respiration), et par la présence de
populations bactériennes sulfatoréductrices. Les potentiels de méthylation et déméthylation
mesurés dans les différentes matrices nous montrent que ces compartiments sont, de façon
variable, capables de méthyler le Hg à l’exception du périphyton associé à la végétation du lac
(totora). Nous avons identifié des agrégats bio-organiques flottants (présents uniquement
pendant la saison sèche) comme les principaux contributeurs à la méthylation du Hg avec une
capacité de méthylation de 9,58 ± 0,05 % jour-1.
De l’ensemble de ce travail, nous pouvons conclure que le lac Uru-Uru est un
écosystème aquatique très réactif en ce qui concerne le Hg et la production de MMHg,
production qui est contrôlée par des processus biotiques et abiotiques, régulés par des facteurs
15
environnementaux naturels et anthropiques. Il est probable que la forme la plus disponible du
Hg (MMHg) soit incorporée aux différents organismes aquatiques, bioaccumulée et
biomagnifiée tout au long de la chaine alimentaire, ce qui expliquerait les concentrations
élevées retrouvées dans les poissons et les oiseaux du lac Uru-Uru et Poopó (Molina et al.,
2012). Face taux élevés de MMHg en forme dissoutes dans les eaux et à sa possible
bioaccumulation dans les organismes (poissons, oiseaux, humains consommateurs de
poissons), favorisée par la forte concentration en matière organique, en métaux lourds et
métalloïdes, dont la source est liée à la l’activité minière et urbaine, il sera nécessaire de
réaliser une évaluation de l’impact du Hg chez les communautés consommatrices de poissons
du lac Uru-Uru. Il apparait également nécessaire que les politiques publiques recherchent à
mettre en œuvre des solutions efficaces pour réguler l’émission des contaminants issus des
eaux usées, des eaux acides de drainage de mines, des résidus solides de mines et des résidus
urbains.
16
Tabla de contenido
Agradecimientos ________________________________________________ 2
Resumen _______________________________________________________ 5
Résumé étendu _________________________________________________ 10
Tabla de contenido _____________________________________________ 16
Lista de abreviaciones y símbolos _________________________________ 19
Lista de figuras ________________________________________________ 20
Lista de tablas _________________________________________________ 23
Anexos _______________________________________________________ 24
Introducción___________________________________________________ 26
1. Capítulo I: Ciclo biogeoquímico del Hg _________________________ 31
1.1 Características fisicoquímicas del Hg ______________________________________ 31
1.2 Antecedentes históricos del Hg ____________________________________________ 33
1.3 Toxicidad y vías de exposición de las formas inorgánicas y orgánicas del Hg. _____ 34
1.4 Mecanismos de absorción del MMHg en el organismo ________________________ 36
1.5 Efectos debidos a la exposición crónica de MMHg ____________________________ 37
1.6 Niveles de exposición a Hg que causan riesgo ________________________________ 38
1.7 Fuentes y ciclo biogeoquímico global del Hg _________________________________ 41 1.7.1 Fuentes naturales y antropogénicas de Hg ___________________________________________ 41
1.7.1.1 Fuentes naturales __________________________________________________________ 41 1.7.1.2 Re-emisión de Hg _________________________________________________________ 43 1.7.1.3 Fuentes antropogénicas _____________________________________________________ 45
1.7.2 Balance global del Hg ___________________________________________________________ 49
1.8 Ciclo biogeoquímico del Hg en los ecosistemas acuáticos _______________________ 50 1.8.1 Transformación y especiación del Hg en el medio ambiente ____________________________ 51
1.8.1.1 Oxidación y reducción del Hg en la atmósfera __________________________________ 52 1.8.1.2 Oxidación y reducción del Hg en los suelos _____________________________________ 53 1.8.1.3 Oxidación y reducción del Hg en las aguas _____________________________________ 55 1.8.1.4 Oxidación y reducción en los sedimentos _______________________________________ 58
1.9 Metilación y demetilación ________________________________________________ 59 1.9.1 Metilación en la atmósfera _______________________________________________________ 59 1.9.2 Metilación en los ecosistemas acuáticos_____________________________________________ 59
1.10 Aspectos generales de la formación de MMHg y DMHg _______________________ 61 1.10.1 Metilación abiótica ___________________________________________________________ 62 1.10.2 Metilación biótica ____________________________________________________________ 65 1.10.3 Demetilación abiótica _________________________________________________________ 69 1.10.4 Demetilación biótica _________________________________________________________ 69
1.11 Distribución y especiación de Hg en los diferentes ecosistemas terrestres _________ 70 1.11.1 Ecosistemas acuáticos ________________________________________________________ 70 1.11.2 Atmósfera __________________________________________________________________ 72 1.11.3 Suelos _____________________________________________________________________ 73
17
1.11.4 Biota ______________________________________________________________________ 74
1.12 Bioconcentración, bioacumulación y biomagnificación del MMHg en los ecosistemas
acuáticos. ____________________________________________________________________ 74
1.13 Hg en los ecosistemas de altitud ___________________________________________ 76
1.14 Métodos analíticos y experimentales utilizados para la determinación de Hg ______ 81 1.14.1 Técnicas de análisis de HgT ____________________________________________________ 81
1.15 Técnicas de análisis para la especiación de Hg _______________________________ 84 1.15.1 Métodos de especiación de Hg por dilución isotópica ID-GC-ICPMS __________________ 85 1.15.2 Método de la dilución isotópica clásica “Simple spike Isotope Dilution Mass Spectrometry,
SS-IDMS” 87 1.15.3 Método de dilución isotópica de doble-spike (DSIDA) ______________________________ 88 1.15.4 Tratamiento de datos _________________________________________________________ 89
1.16 Uso de trazadores isotópicos para investigaciones ambientales _________________ 91 1.16.1 Aproximaciones experimentales ________________________________________________ 91 1.16.2 Aplicaciones medioambientales _________________________________________________ 92
1.16.2.1 Método de la medición de Metilación/Demetilación y Reducción del Hg en los ecosistemas
acuáticos. 92
2. Sitio de estudio _______________________________________________ 95
2.1 El Altiplano boliviano ___________________________________________________ 95
2.2 El lago Uru-Uru ________________________________________________________ 96
2.3 Geología y distribución de los yacimientos metalíferos ________________________ 98
2.4 Actividades mineras en el sitio de estudio __________________________________ 100
3. Problemática _______________________________________________ 104
4. Objetivos de la tesis __________________________________________ 107
5. Capítulo II: Synergistic effects of mining and urban effluents on the level
and distribution of methylHg in a shallow aquatic ecosystem of the Bolivian
Altiplano _____________________________________________________ 108
Introducción__________________________________________________ 109
Abstract _____________________________________________________ 112
5.1 Introduction _____________________________________________________________ 113
5.2 Materials and methods _____________________________________________________ 114
5.2.1 Study area ______________________________________________________________ 114 5.2.1.2 The Bolivian Altiplano: general settings ____________________________________________ 114 5.2.1.2 Lake Uru-Uru __________________________________________________________________ 115 5.2.1.3 Historical and current anthropogenic (urban and mining) activities in the watershed _________ 116
5.2.2 Sample strategy _________________________________________________________ 117 5.2.2.1 Sampling Strategy ______________________________________________________________ 117 5.2.2.2 Sample conditioning ____________________________________________________________ 117
5.2.3 Analytical methods _______________________________________________________ 117 5.2.3.1 Surface and pore water analysis ___________________________________________________ 117 5.2.3.2 Sediment analysis ______________________________________________________________ 118
5.2.4 Statistical treatment and data presentation ___________________________________ 119
5.3 Results and discussion _____________________________________________________ 119
18
5.3.1 Geochemistry and MMHg content in Lake Uru-Uru ___________________________ 119 5.3.1.1 Eutrophication in high altitude ecosystem context _____________________________________ 119 5.3.1.2 MMHg levels and distribution in the water compartment _______________________________ 121 5.3.1.3 Mining effluents: a source of Hg and dissolved colloidal carrier phase ____________________ 123
5.3.2 Sediment of Lake Uru-Uru: a major source of MMHg for surface water __________ 125 5.3.2.1 Source of THg in surface sediment _________________________________________________ 125 5.3.2.2 Seasonal contribution of MMHg from sediment to lake water ___________________________ 127
5.4 Conclusion _______________________________________________________________ 129
Conclusiones _________________________________________________ 131
6. Capítulo III: Diurnal variability and biogeochemical reactivity of Hg
species in an extreme high-altitude lake ecosystem of the Bolivian Altiplano
132
Introducción__________________________________________________ 133
Abstract _____________________________________________________ 135
6.1 Introduction ______________________________________________________________ 136
6.2 Materials and methods _____________________________________________________ 137 6.2.1 Study area ______________________________________________________________________ 137 6.2.2 Samples collection and processing ___________________________________________________ 137 6.2.3 Hg transformations assays _________________________________________________________ 139 6.2.4 Samples analyses methodologies ____________________________________________________ 139 6.2.5 Bacterial communities characterization _______________________________________________ 139 6.2.6 Statistics _______________________________________________________________________ 140
6.3 Results and discussion _____________________________________________________ 140 6.3.1 Major biogeochemical characteristics ________________________________________________ 140 6.3.2 Sulfate reducing bacteria communities _______________________________________________ 143 6.3.3 Hg methylation and demethylation in surface sediments _________________________________ 144
6.3.3.1 Methylation _________________________________________________________________ 144 6.3.3.2 Demethylation _______________________________________________________________ 146 6.3.3.3 Net methylation assessment ____________________________________________________ 147
6.3.4 Hg species distribution and transformation in the water column ___________________________ 148 6.3.4.1 Hg species seasonal and diurnal variations ________________________________________ 148 6.3.4.2 Biogeochemical transformation of Hg species in water ______________________________ 150
6.3.5 Methylation and Demethylation in Bio-organic substrates _____________________________ 153 6.3.5.1 Net methylation assessment in Bio-organic substrates _______________________________ 153
6.4 Implications for MMHg contamination in Lake Uru-Uru ________________________ 154
Conclusiones _________________________________________________ 156
7. Conclusiones finales de la tesis _________________________________ 157
8. Perspectivas científicas _______________________________________ 161
Conclusions de la thèse _________________________________________ 163
Perspectives scientifiques _______________________________________ 167
9. Referencias bibliográficas _____________________________________ 169
19
Lista de abreviaciones y símbolos
AMD Drenajes ácidos mineros (sigla en inglés)
CNRS Centro Nacional de Investigación Científica (sigla en francés)
COMIBOL Corporación Minera de Bolivia
DMHg Dimetilmercurio
FAO Organización de las Naciones Unidas para la Alimentación y la
Agricultura (sigla en inglés)
Hg0 Mercurio vapor
HgT Mercurio total
IHg Mercurio inorgánico
INERIS Instituto Nacional para el Medio Ambiente y Riesgos Industriales (sigla
en francés)
IRD Instituto de Investigación francés para el Desarrollo
MMAyA Ministerio de Medio Ambiente y Aguas
MMHg Monometilmercurio
PPO Proyecto Piloto Oruro
RUV Radiación ultravioleta
SNHN Servicio Nacional de Hidrología
UNEP=PNUE Programa de las Naciones Unidas para el Medio Ambiente
USEPA Agencia de Protección Ambiental de Estados Unidos (sigla en inglés)
WHO=OMS Organización Mundial de la Salud (sigla en inglés)
NRCC Consejo Nacional de Investigación de Canadá (sigla en francés)
20
Lista de figuras
Figura 1 : Abundancia natural de los isótopos estables de Hg. ........................................................... 31
Figura 2 : Diagrama conceptual del ciclo biogéoquímico del Hg en el medio ambiente (Harris et al.,
2007. (Mercurio divalente (HgII), monometilmercurio (MeHg) dimetilmercurio (DMeHg),
mercurio elemental en forma de vapor (Hg0), mercurio particular (Hgp ), mercurio gaseoso
reactivo (RGM) ). ......................................................................................................................... 32
Figura 3: Cinabrio (HgS), principal mineral del Hg (UNEP, 2013). ................................................... 33
Figura 4 : Cinturón y principales sitios mercuríferos en el mundo (Jonassen et Boyle, 1972) ............ 42
Figura 5 : Recontrución de emisiones naturales y antropogénicas de Hg durante 270 años, a partir de
testigos glaciares (97 muestras provenientes del glaciar “Upper Fremont”, en Wyoming)
(Schuster et al., 2002). .................................................................................................................. 43
Figura 6 : Distribución global de las emisiones antropogénicas de Hg en el aire durante el año 2010
(UNEP, 2013a). ............................................................................................................................ 49
Figura 7: Estimaciones mundiales de Hg a partir de modelos, la figura ilustra los principales
compartimentos ambientales y las vías que son de importancia en el ciclo global del Hg, y las
formas naturales y antropogénicas en que son liberadas en el aire, tierra y aguas y su
movimiento entre estos compartimientos. Emisiones al aire desde fuentes naturales y
antropogénicas, así como las re-emisiones de Hg previamente depositados desde el aire sobre
los suelos, aguas superficiales, y la vegetación (UNEP, 2013). .................................................. 50
Figura 8 : Principales procesos bióticos y abióticos del ciclo biogeoquímico del Hg ......................... 51
Figura 9 : Transferencias y transformaciones de las especies químicas del mercurio en el ecosistema
acuático (Stein et al., 1996). ......................................................................................................... 52
Figura 10 : Resumen de algunas transformaciones físicas y químicas importantes del Hg en la
atmósfera, adaptado desde Shia et al., 1999 y Lin and Penhkonen, 1999. .................................. 53
Figura 11 : Mecanismos de reducción del Hg por las bacteria (Osborn et al., 1997, modificado a
partir de Brown, 1985). ................................................................................................................ 57
Figura 12 : Mecanismos principales de la metilación del Hg y demetilación del MMHg (Monperrus,
2014). ............................................................................................................................................ 60
Figura 13 : Reacción de metilación del Hg2+ por la metilcobalamina (MeCo, CH3B12), estructura
molecular y cambios de conformación de la MeCo en función del pH. ....................................... 63
Figura 14 : Mecanismo de metilación del Hg en las bacterias sulfatorecductoras, Park et al., (2013).
...................................................................................................................................................... 67
Figura 15 : Gama de concentraciones de HgT salvo mención contraria (ng L-1 o ng Kg-1 de peso
fresco) en el medio ambiente y proporciones de Hg orgánico (Tessier, 2004; Fitzgerald and
Lamborg, 2003, Bouffard ans Amyot, 2009). ............................................................................... 71
Figura 16 : Ciclo biogeoquímico del Hg en el océano (Fitzgerald et al., 2007b) ............................... 71
21
Figura 17 : Transformaciones físicas y químicas del Hg en la atmósfera. Estilo de la figura adaptado
de Shia et al. (1999); reacciones de Shia et al. (1999), and Lin and Pehkonen (1999). ............. 73
Figura 18 : ICP-MS acoplado a un cromatógrafo de gases (GC) (Bouchet, 2009). ............................ 85
Figura 19 : GC acoplado al ICPMS en el LCABIE (Thermo Focus-Thermo X-series), Pau, Francia. . 86
Figura 20 : Principio de la dilución isotópica del Hg. ......................................................................... 87
Figura 21 : Transformaciones de las especies a través de los trazadores isotópicos durante el análisis
por dilución isotópica multi-spike. F1, degración de 201MMHg o demetilación y F2: formación
de MMHg a partir de 199IHg (Bouchet, 2009). ............................................................................. 88
Figura 22 : Cromatogramas GC-ICPMS para la especiación de Hg despues del doble dopage con
199IHg and 201MMHg y etilación/propilación derivatización en (a) agua de mar (W1), (b)
tejido de ostra (CRM 710), (c) sedimentos de estuario (IAEA 405) Monperrus et al., 2008. ...... 89
Figura 23: Principio de la utilización de trazadores isotópicos estables para la
metilación/demetilación del Hg (Monperrus, 2004). .................................................................... 93
Figura 24 : Mapa del sitio de estudio mostrando el Sistema TPDS y el laago Uru-Uru. .................... 97
Figura 25 : Lago Uru-Uru, sitio RAMSAR, sometido a fuertes presiones antrópicas mineras y
urbanas. En la parte superior se observa al Canal de evacuación de aguas servidas de la ciudad
de Oruro, Tagarete, que contiene altos contenidos de desechos orgánicos, materiales inertes
(botellas pet, plásticos), desechos mineros sólidos y aguas ácidas. La figura contigua muestra a
la mina San José, fuera de actividad, emitiendo aguas ácidas, las que llegan al lago Uru-Uru a
través del Canal Tagarete. En la parte derecha superior se muestra la parte Norte del lago
(contaminado) con la presencia de flamencos. En la parte inferior se observa las actividades
mineras de la región; a continuación se observa a un habitante de la región portando especies
de aves muertas a consecuencia de la contaminación del lago. Finalmente en la parte derecha
inferior se muestra las diferentes especies de plantas acuáticas de la parte Sur del lago. .......... 98
Figura 26 : Map of Lake Uru-Uru in the Bolivian Altiplano, with sampling locations (white circles)
along the transect (presented as kilometric points from the Tagarete wastewater channel). The
main rivers affected by mining or urban effluents are also reported. ........................................ 115
Figura 27 : pH, electrical conductivity and concentrations of dissolved organic carbon (DOC), sulfate
(SO4 2_) in filtered surface water (upper 2 panels), filtered (F) and unfiltered (UNF) Hg (Hg)
and monomethylHg (MMHg), dissolved gaseous Hg (DGM) and dimethylHg (DMHg)
concentrations in surface waters (lower 6 panels) along the Lake Uru-Uru transect during the
late dry season (left) and the late wet season (right). Additional data of pH and electric
conductivity are also given for Rio Huanuni (HU) in the first panel. ........................................ 121
Figura 28 : Linear regressions for filtered (F) and unfiltered (UNF) total Hg (THg) vs. monomethylHg
(MMHg) concentrations (upper 2 panels), filtered vs. unfiltered monomethylHg concentrations
(lower left panel) and filtered iron (Fe) vs. total Hg (THg) concentrations (lower right panel) in
surface waters collected along the Lake Uru-Uru transect (empty symbols) and downstream the
confluence with mining effluents (crossed symbols) during the late dry season (white symbols)
and the late wet season (blue symbols). ...................................................................................... 125
Figura 29 : Upper 4 panels: filtered (F) and unfiltered (UNF) inorganic Hg (iHg) and monomethylHg
(MMHg) concentrations in surface sediment pore water and total Hg (THg) and monomethylHg
(MMHg) concentrations in surface sediments of Lake Uru-Uru. Lower 4 panels: log partitioning
coefficient (log Kd) and daily diffusive fluxes of THg (iHg) and MMHg in surface sediments (PW
and solid) of Lake Uru-Uru for the end of the dry season (October 2010 – left panels) and of the
22
wet season (May 2011 – right panels). Dotted line refers to mean log Kd values of THg (black
dotted line) and MMHg (blue dotted line). ................................................................................. 127
Figura 30 : Map of Lake Uru-Uru and its location in the Bolivian Altiplano (Bolivia, South América),
showing the investigated sites in the northern (NS) and southern (SS) part of the lake, during late
dry and wet seasons (October 2010 and May 2011). The major sources of contamination are
also indicated: urban effluent (north) and mining effluent (south). ........................................... 138
Figura 31 : a–h Diurnal variability (24 h) of the different Hg species (iHgUNF, iHgF, MMHgUNF,
MMHgF, Hg0, DMHg) in comparison with oxygen and temperature at the southern site (SS) of
Lake Uru-Uru for late dry and wet seasons. UNF unfiltered, F filtered. ................................... 141
Figura 32: a–d Diurnal variability (24 h) of the different Hg species (iHgUNF, iHgF, MMHgUNF,
MMHgF, Hg0, DMHg) in comparison with oxygen and temperature at the northern site (NS) of
Lake Uru-Uru for the late wet season. ....................................................................................... 142
Figura 33 : Correspondence analysis based on T-RFLP results for the dsrAB genes in the samples
collected during the late dry season at stations SS and NS and in different compartments (W
water, Sed sediments, Agg floating bio-organic aggregates). The letters A, B, and C refer to
triplicates for each sample.......................................................................................................... 143
Figura 34 : Diurnal methylation potentials of Hg determined in the different compartments (bulk and
filtered water, sediments, bioorganic substrates) at station SS and NS of Lake Uru-Uru for the
dry (solid bars) and wet (striped bars) ....................................................................................... 146
Figura 35 : Diurnal demethylation potentials of Hg determined in the different compartments (bulk
and filtered water, sediments, bioorganic substrates) at station SS and NS of Lake Uru-Uru for
the dry (solid bars) and wet (striped bars) season ..................................................................... 147
Figura 36 : Schematic representation of the potential net methylation of Hg occurring in different
compartments of Lake Uru-Uru for a dry season and b wet season. Net methylation are
expressed in nanograms per gram per day in order to compare water, sediment, and bio-organic
substrate incubation measurements. ........................................................................................... 155
23
Lista de tablas
Tabla 1. Ejemplos de niveles máximos de Hg en peces recomendados o permitidos en diferentes países
y la WHO/FAO (basado en reportes presentados a la UNEP, a menos que se indique lo contrario
(UNEP, 2002). .............................................................................................................................. 39
Tabla 2. Ingesta diaria promedio y la retención de las diferentes formas de Hg estimada en el cuerpo,
en un escenario relevante para la población en general no expuestos a Hg, valores en µg día-1
(WHO/IPCS, 1991). ..................................................................................................................... 40
Tabla 3. Emisiones naturales de Hg a través de fuentes naturales, ...................................................... 45
Tabla 4. Emisiones de Hg antropogénico de diversos sectores, en toneladas por año, rango de
estimación y porcentajes del total de las emisiones antropogénicas, (UNEP, 2013). .................. 48
Tabla 5. Concentración de HgT en diferentes matrices de escenarios geográficos de altitud. .............. 80
Tabla 6. Técnicas de especiación de mercurio empleando trazadores isotópicos, en combinación con la
dilución isotópica simple, (Bouchet, 2009). ................................................................................. 90
Tabla 7. iHg methylation, methylHg demethylation, and Hg net methylation (mean±SD, n=3)
estimates in surface sediments and bio-organic substrates (aggregates and periphyton) in the
Lake Uru-Uru, under dark and diurnal conditions, during late dry and wet seasons (October 2010
and May 2011) at both southern and northern sites and Lake Titicaca and Popoo (sediments
only). ........................................................................................................................................... 144
Tabla 8. Comparison of potential methylation of iHg and demethylation of MMHg obtained in water,
sediment, and bio-organic substrates (e.g., macrophytic and rhizospheric periphyton, or
aggregated biofilms) of Lake Uru-Uru with values obtained from incubations in different regions
and ecosystems. .......................................................................................................................... 145
Tabla 9. iHg methylation, MMHg demethylation, iHg reduction, and Hg net methylation (mean±SD,
n=3) estimates in the water column of the Lake Uru-Uru, under dark and diurnal conditions,
during late dry and wet seasons (October 2010 and May 2011) at both southern and northern sites
.................................................................................................................................................... 151
24
Anexos Pag.
Información suplementaria 1 : Capítulo II 200
Información suplementaria 2 : Capítulo III 222
Artículo 1 : Synergistic effects of mining and urban effluents on the level and distribution of
methylHg in a shallow aquatic ecosystem of the Bolivian Altiplano 233
Artículo 2 : Diurnal variability and biogeochemical reactivity of Hg species in an extreme
high-altitude lake ecosystem of the Bolivian Altiplano
Error! Bookmark not defined.
245
25
Introducción
26
Introducción
El Hg es un elemento ubiquista, considerado como metal pesado que transita entre los
diferentes reservorios geoquímicos y biológicos vía los procesos biogeoquímicos naturales. El
Hg es el único metal de coloración gris-plateado que se encuentra en forma líquida a
temperatura ambiente (20°C), con punto de ebullición relativamente bajo (357°C) y con un
punto de fusión de -38,8°C propiedad por la cual es utilizado en los termómetros. El Hg tiene
una alta densidad específica (13,6 veces más que el agua) y es altamente volátil debido a su
elevada presión de vapor (0,16 Pa). Estas propiedades físicas permiten un amplio uso del Hg
en la industria para la fabricación de baterias, cables e interruptores eléctricos, aparatos de
medida y lámparas, los mismos que derivan después de su uso en desechos para el medio
ambiente (UNEP, 2013a). Muchos metales pueden disolverse en Hg (salvo el hierro y el
platino) y formar amalgamas, esta propiedad es aprovechada para la elaboración de
amalgamas dentarias y la recuperación de oro y plata en la minería (UNEP, 2013a).
El Hg tiene un peso atómico de 200,59 g mol-1 y 80 electrones distribuidos en
diferentes capas ([Xe] 4f14 5d10 6s2), de los cuales la última (6s2) contiene los electrones de
valencia. Debido a las diferentes disposiciones de estos dos electrones el Hg puede
presentarse en tres estados de oxidación: Hg0 (metálico), Hg1+ (mercurioso) y Hg2+
(mercúrico).
Varios minerales contienen Hg, incluyendo al cinabrio (HgS) aprovechado para la
producción de Hg. El Hg también está presente, en forma de impurezas en varios minerales de
valor económico, en particular en metales no ferrosos, combustibles fósiles y en el carbón.
La mayoría de las elevadas emisiones de Hg se han producido desde 1800, asociado
con la revolución industrial, basada en la combustión de carbón, fundido de minerales y la
recuperación de oro en diversas partes del mundo (UNEP, 2013a). Dichas emisiones han
incrementado la movilización de Hg en el medio ambiente, elevando su concentración en la
atmósfera, suelos, aguas superficiales y en los océanos (Schuster et al., 2002; Sunderland et
al., 2008; Dietz et al., 2009; Pirrone et al., 2010; UNEP, 2013a; Lamborg et al., 2014).
Se ha observado que en ciertas áreas geográficas del mundo los niveles de Hg han
excedido los niveles de fondo o naturales, produciendo enfermedades crónicas en los seres
humanos (UNEP, 2013a). La enfermedad de Minamata que presentaron los pobladores del
entorno de la bahía de Minamata, en la prefectura de Kumamoto, Japón, fue reportada en
27
1956. Esta enfermedad fue el resultado de la exposición ambiental de los pobladores a
MMHg, a través del consumo de pescado y mariscos contaminados (Murata and Sakamoto,
2013). El mercurio inorgánico (iHg) y el MMHg productos secundarios formados durante la
síntesis de acetaldehído, fueron vertidos en esta bahía por la fábrica Chisso (Murata and
Sakamoto, 2013).
Otra área geográfica donde se observó los efectos del Hg en la salud humana fue en
Serra Pelada de la Amazonía sudamericana en 1980. Los efectos del Hg fueron observados en
mineros expuestos a altas concentraciones de Hg0 en forma de vapor liberado durante la etapa
de calentamiento de la amalgama de oro (Corbett et al., 2007). El Hg liberado durante estas
actividades mineras también se acumuló en la cadena trófica (Akagi et al., 1996).
El impacto del Hg sobre la salud no solamente depende de su concentración sino sobre
todo de su forma química. El Hg en forma de MMHg, a bajas concentraciones, afecta de
manera irreversible el sistema nervioso (Grandjean and Landrigan, 2006; Debes et al., 2016).
Esto se debe a que una vez formado el MMHg es asimilado y acumulado por los organismos
vivos (Mason et al., 1996). En este caso se habla de procesos de bioacumulación porque
ocurre dentro de un mismo organismo con una absorción mayor que la excreción (Mason et
al., 1995b). Por otro lado tiene lugar el proceso de bioamplificación, esto ocurre cuando la
concentración aumenta entre los niveles tróficos de la cadena alimentaria (Atwell et al.,
1998). Estos procesos han pemitido explicar la diferencia entre la concentraciones de Hg en
los peces y crustáceos que fue cien a un millón de veces más alto que en las aguas del mismo
medio (Mason et al., 1995b); y por otro lado las elevadas concentraciones que presentan
ciertos predadores que se encuentran al final de la cadena alimentaria (WHO, 1990; Lailson-
Brito et al., 2012). Por otro lado también explica el porqué en el hombre puede encontrarse
elevadas concentraciones de Hg, siendo él mismo un predador terminal.
Varios estudios realizados en diferentes partes del mundo han revelado elevadas
concentraciones de Hg en la sangre y en los cabellos, además de transtornos neurológicos en
habitantes con un régimen alimentario a base de pescado como los ocurridos por ejemplo en
la Amazonia (Malm, 1998; de Oliveira Corvelo et al., 2014), en Japón (Harada et al., 1998;
Yorifuji et al., 2011), en China (Liu et al., 2014), en las islas Faeroe del Océano Atlántico
Norte (Grandjean et al., 1997), en el Mediterráneo (Renzoni et al., 1998) y en Estados Unidos
(Castaño et al., 2015; Dong et al., 2015) o bien por consumo elevado de numerosas especies
de mamíferos marinos cuyas concentraciones de Hg fueron superiores a los recomendados por
28
la Organización Mundial de la salud (UNEP, 2002; Egeland et al., 2009; Endo and Haraguchi,
2010; Tian et al., 2011).
En la actualidad las concentraciones de Hg en los habitantes de la región del Altiplano
son desconocidos, sí se encontraron concentraciones de Hg en peces y macroinvertebrados de
los lagos Uru-Uru y Poopó (0,2 a 1,2 mg Kg-1 en peces y de 0,03 a 1mg Kg-1 en
macroinvertebrados por peso de tejido seco) (Molina et al., 2012). La concentración de Hg
por peso de tejido húmedo corresponde a 0,04 y 0,24 mg Kg-1, en el caso de los peces, los
cuales se encuentran por debajo de los valores máximos permitidos o recomendados en las
normas de diferentes países y la Organización Mundial de la Salud (0,5 mg Hg Kg-1 por peso
húmedo) (UNEP, 2002).
Cabe destacar que en respuesta a la preocupación internacional sobre el Hg, tras
evaluaciones realizadas por el Consejo de Administración del PNUMA (2002), seguida de la
creación de la Asociación Mundial sobre el Hg del PNUMA (2005), finalmente el Comité
Intergubernamental de Negociación (CIN) (2009) crea un instrumento jurídicamente
vinculante sobre el Hg, llamado “Convenio de Minamata sobre el Mercurio” (UNEP, 2013b).
Bolivia se ratifica con dicho Convenio el año 2015 (Ley 759). El Convenio en su primer
artículo establece como objetivo proteger la salud humana y el medio ambiente de las
emisiones y liberaciones antropógenas del Hg y sus compuestos (UNEP, 2013b). Con este fin
el Convenio incluye una serie de medidas para controlar las emisiones y liberaciones del Hg a
lo largo de su ciclo de vida (UNEP, 2013b).
La región del Altiplano Boliviano en la que se encuentra nuestro sitio de estudio el
lago Uru-Uru, está ubicada a una altitud mayor a 3600 metros sobre el nivel del mar. En esta
región la disponibilidad de oxígeno es menor (40% menos saturación de oxígeno en el aire
que a nivel del mar) y la radiación ultravioleta B (UV-B) se ve increntada en un 7% por cada
kilómetro (Zaratti et al., 2003) con respecto a la cantidad de radiación UVB que llega a la
superficie terrestre a nivel del mar. A nivel del mar y hasta una altitud de 450 m la radiación
UV que llega a estas superficies se encuentran entre 300-340 W/m2 (IUV: 0 – 7) mientras que
en el Altiplano ubicada a una altitud de 3800 m la radiación que llega se encuentra entre 400-
430 W/m2 (IUV: <6 – 18). Otra de las características de esta región es la sequedad y aridez
del clima, en el Altiplano boliviano las precipitaciones pluviales alcanzan hasta 200 mm/año,
mientras que a nivel del mar o a poca altitud las precipitaciones pluviales se encuentran entre
500 -2000 mm/año. Además de estas características en los ecosistemas acuáticos de la región
la productividad primaria es elevada, debida a su ubicación en la zona tropical a nivel
29
planetario. Tomando en cuenta el conjunto de estas características ambientales podemos decir
que nos encontramos con un medio de codiciones ambientales extremas.
En la región se tienen indicios de la utilización de Hg para recuperación de plata
durante la colonia española (Braudel, 1982); sin embargo antes y después de la
nacionalización minera, seguida de la incursión de cooperativas, ocurrida en Bolivia durante
los años 1950, no se utilizó Hg para la recuperación de plata y oro. Al mismo periodo
corresponde la formación del lago Uru-Uru, por desborde del río Desaguadero sus aguas se
depositaron sobre la planicie de Santo Tomás formando el lago Uru-Uru. Diferentes estudios
realizados en la zona determinan elevados tenores de metales pesados y de arsénico en las
aguas superficiales (Garcia Moreno, 2006; Ormachea Muñoz et al., 2013) y en sedimentos
(Tapia et al., 2012). Hasta el momento no se tiene conocimiento de algún estudio que nos
pueda dar una idea de las fuentes y transformaciones biogeoquímicas que sufre el Hg en este
medio tan particular. Por lo que en este estudio damos respuesta a esas interrogantes.
Para responder a las preguntas sobre el origen y reactividad del Hg en el lago Uru-Uru,
se ha trabajado en dos etapas; en la primera etapa afin de determinar las fuentes y
transferencia de especies de Hg entre compartimientos del lago Uru-Uru, se determinaron
especies de Hg, metales y metaloides en aguas, sedimentos y aguas intersticiales del transecto
Norte a Sur del lago. En la segunda etapa, tomando en cuenta las diferencias notables de las
caraterísticas fisicoquímicas del agua de los sitios Norte y Sur, se estudió la reactividad del
Hg por compartimiento, mediante experimentos in situ. Los experimentos consistieron en la
incubación de trazadores moleculares de Hg enriquecidos con isótopos estables de MM201Hg
y 199IHg los cuales fueron incubados en diferentes matrices (agua, sedimentos, agredados bio-
orgánicos flotantes y perifiton de totoras).
30
1. Capítulo I: Ciclo biogeoquímico del
Hg
31
1. Capítulo I: Ciclo biogeoquímico del Hg
El Hg, forma parte del grupo de metales pesados (Cd, Pb, Ni, Sb, Bi) que no tiene una
función biológica conocida, excepcionalmente es altamente tóxico a bajas concentraciones y
acumulable en los organismos vivos en sus formas organometálicas (Gregoire and Poulain,
2016).
Los síntomas y efectos en la salud por exposicón a Hg son diferentes y según el tipo
de especie química de Hg presente en el organismo.
1.1 Características fisicoquímicas del Hg
El Hg en su forma elemental tiene una densidad de 3,546 g cm-3 a 20°C. En
comparación con las temperaturas de fusión y de ebullición de otros metales, tiene la
temperatura de fusión (-38,829°C) y ebullición (356,58°C) más bajas. Es el único metal que
en su estado metálico (Hg0) se encuentra en forma líquida a temperatura ambiente (Hg0(l)). En
este mismo estado de oxidación se encuentra en forma de vapor (Hg0(v)). El Hg metálico es
escasamente soluble en agua (Onat, 1974; Sanemasa, 1975); pero altamente volátil debido a
su elevada presión de vapor (0,16 Pa). El peso atómico promedio del elemento es de 200,59 g
mol-1 con un número atómico de 80 y una configuración electrónica 1s2 2s2 2p6 3s2 3p6 3d10
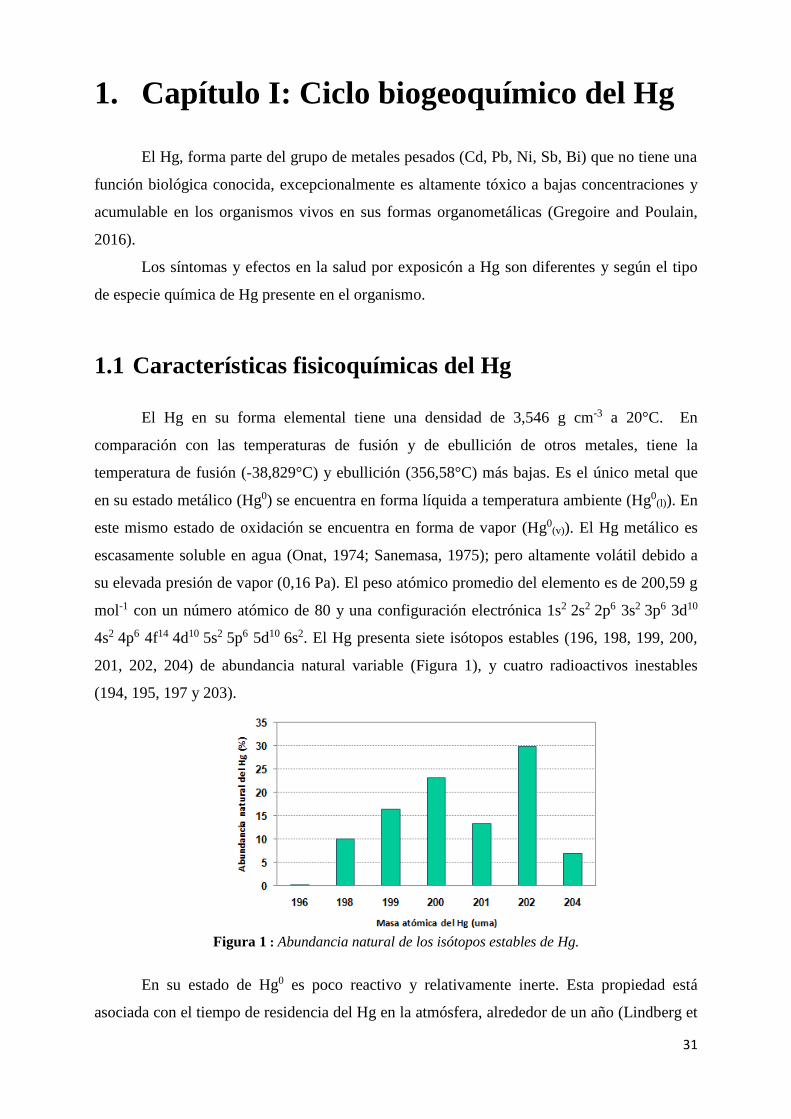
4s2 4p6 4f14 4d10 5s2 5p6 5d10 6s2. El Hg presenta siete isótopos estables (196, 198, 199, 200,
201, 202, 204) de abundancia natural variable (Figura 1), y cuatro radioactivos inestables
(194, 195, 197 y 203).
Figura 1 : Abundancia natural de los isótopos estables de Hg.
En su estado de Hg0 es poco reactivo y relativamente inerte. Esta propiedad está
asociada con el tiempo de residencia del Hg en la atmósfera, alrededor de un año (Lindberg et
32
al., 2007), permitiéndole difundirse en la atmósfera a escala planetaria (Morel et al., 1998;
Lamborg et al., 2002).
El Hg está catalogado como un elemento ubiquista, debido a que se encuentra presente
en todos los compartimientos del medio ambiente (atmósfera, litósfera e hidrósfera) bajo
diferentes formas químicas: en forma líquida o gaseosa, en forma disuelta o particular y en
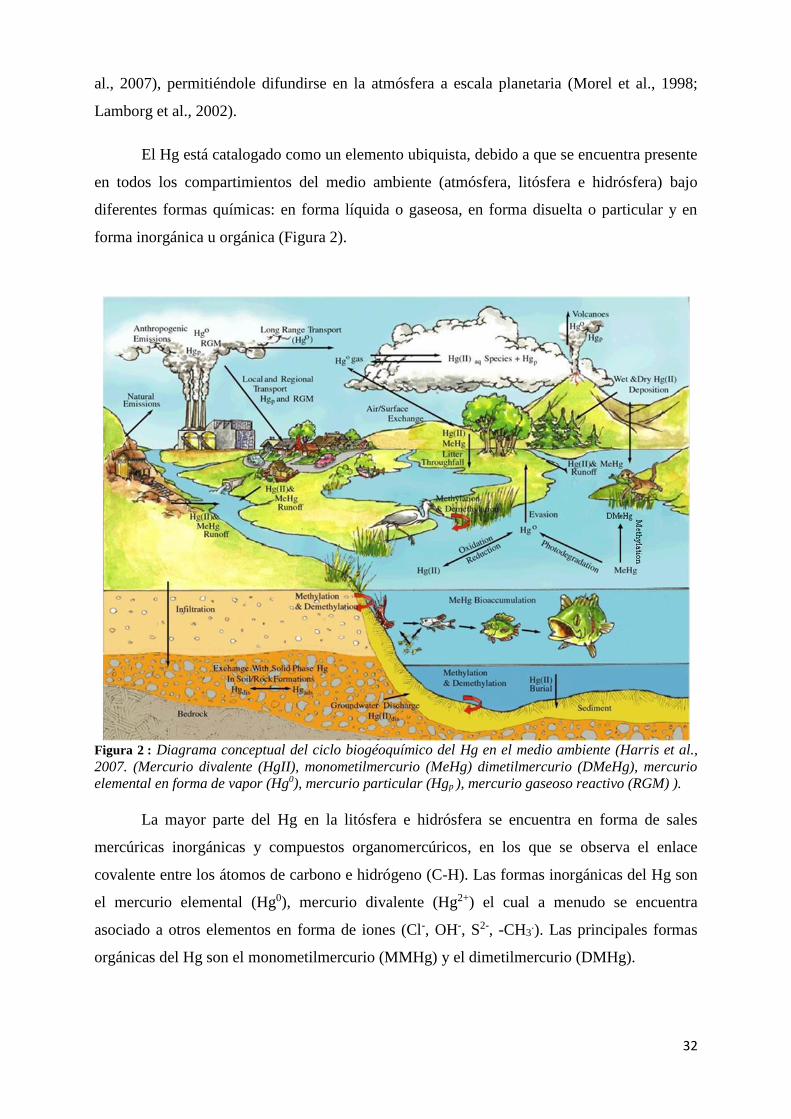
forma inorgánica u orgánica (Figura 2).
Figura 2 : Diagrama conceptual del ciclo biogéoquímico del Hg en el medio ambiente (Harris et al.,
2007. (Mercurio divalente (HgII), monometilmercurio (MeHg) dimetilmercurio (DMeHg), mercurio
elemental en forma de vapor (Hg0), mercurio particular (Hgp ), mercurio gaseoso reactivo (RGM) ).
La mayor parte del Hg en la litósfera e hidrósfera se encuentra en forma de sales
mercúricas inorgánicas y compuestos organomercúricos, en los que se observa el enlace
covalente entre los átomos de carbono e hidrógeno (C-H). Las formas inorgánicas del Hg son
el mercurio elemental (Hg0), mercurio divalente (Hg2+) el cual a menudo se encuentra
asociado a otros elementos en forma de iones (Cl-, OH-, S2-, -CH3.). Las principales formas
orgánicas del Hg son el monometilmercurio (MMHg) y el dimetilmercurio (DMHg).
33
1.2 Antecedentes históricos del Hg
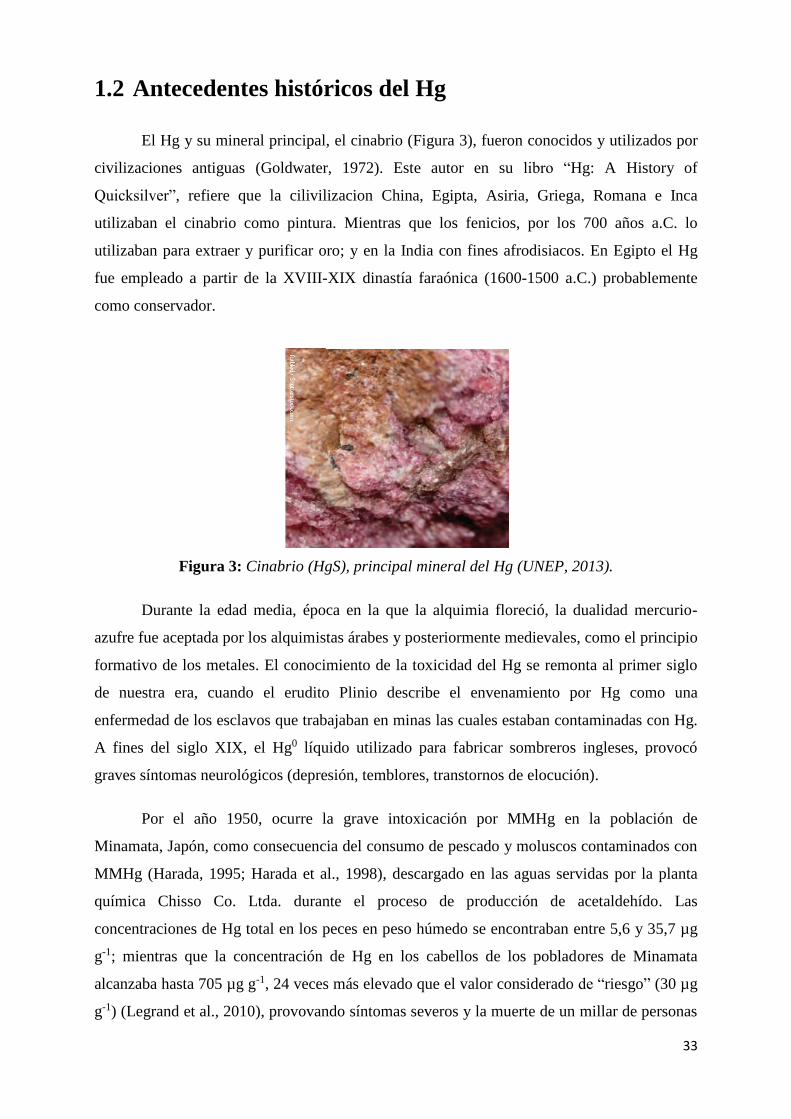
El Hg y su mineral principal, el cinabrio (Figura 3), fueron conocidos y utilizados por
civilizaciones antiguas (Goldwater, 1972). Este autor en su libro “Hg: A History of
Quicksilver”, refiere que la cilivilizacion China, Egipta, Asiria, Griega, Romana e Inca
utilizaban el cinabrio como pintura. Mientras que los fenicios, por los 700 años a.C. lo
utilizaban para extraer y purificar oro; y en la India con fines afrodisiacos. En Egipto el Hg
fue empleado a partir de la XVIII-XIX dinastía faraónica (1600-1500 a.C.) probablemente
como conservador.
Figura 3: Cinabrio (HgS), principal mineral del Hg (UNEP, 2013).
Durante la edad media, época en la que la alquimia floreció, la dualidad mercurio-
azufre fue aceptada por los alquimistas árabes y posteriormente medievales, como el principio
formativo de los metales. El conocimiento de la toxicidad del Hg se remonta al primer siglo
de nuestra era, cuando el erudito Plinio describe el envenamiento por Hg como una
enfermedad de los esclavos que trabajaban en minas las cuales estaban contaminadas con Hg.
A fines del siglo XIX, el Hg0 líquido utilizado para fabricar sombreros ingleses, provocó
graves síntomas neurológicos (depresión, temblores, transtornos de elocución).
Por el año 1950, ocurre la grave intoxicación por MMHg en la población de
Minamata, Japón, como consecuencia del consumo de pescado y moluscos contaminados con
MMHg (Harada, 1995; Harada et al., 1998), descargado en las aguas servidas por la planta
química Chisso Co. Ltda. durante el proceso de producción de acetaldehído. Las
concentraciones de Hg total en los peces en peso húmedo se encontraban entre 5,6 y 35,7 µg
g-1; mientras que la concentración de Hg en los cabellos de los pobladores de Minamata
alcanzaba hasta 705 µg g-1, 24 veces más elevado que el valor considerado de “riesgo” (30 µg
g-1) (Legrand et al., 2010), provovando síntomas severos y la muerte de un millar de personas
34
(Harada, 1995). Otra grave intoxicación ocurrió en Irak durante los años 1956, 1960 y 1971,
debido al consumo de harina elaborada a partir de granos tratados con fungicidas que
contenían compuestos organo-mercuriales (Bakir et al., 1973).
1.3 Toxicidad y vías de exposición de las formas
inorgánicas y orgánicas del Hg.
La toxicidad del Hg varía según su forma química, los síntomas y signos de
intoxicación también son diferentes y variadas las fuentes de exposición (PNUE, 2005).
La absorción del Hg0 e IHg por vía oral son bajas (Wright et al., 1980; Ineris, 2010); el
Hg0(l), tal como puede ser tragado de un termómetro roto, se absorbe lentamente por el tracto
gastrointestinal en un 0,01%, a una velocidad relacionada con la vaporización del Hg,
mientras que la absorción de compuestos mercúricos presentes en la comida se absorben en
un 15% (Goyer and Clarkson, 1996). La principal vía de exposición a Hg0 es la inhalación de
los vapores de Hg, alrededor del 80 a 100% de los vapores son absorbidos por los tejidos
pulmonares y puede atravesar la barrera hematoencefálica (PNUE, 2005), otros expertos
indican que la retención de Hg0 en el tejido humano es 74 a 80% (Teisinger and Fiserova-
Bergerova, 1965; Hursh et al., 1976). Los vapores de Hg tienen mayor afinidad por el sistema
nervioso central que las sales inorgánicas de Hg (Goyer and Clarkson, 1996). El Hg0 también
puede ser adsorbido por los cabellos de las personas, asi lo demostró un estudio realizado en
cabellos humanos después de la exposición ocupacional a vapor de Hg (Queipo Abad et al.,
2016).
El IHg y Hg0, cual sea el valor de su absorción, son principalmente excretados en la
orina y en las heces, con un tiempo de vida media de 58 días, en un intervalo de 35 a 90 días
(Clarkson and Magos, 2006).
Los efectos tóxicos de Hg0 se producen después de la oxidación a iones de Hg (Hg2+),
que inhibe la función celular (actuando como un agente desnaturalizante de proteínas e inhibe
las enzimas no específicas) en la actividad de transporte en la membrana, así como en la
absorción y la liberación de los neurotransmisores cerebrales (Ozuah, 2000). La forma
oxidada de Hg puede atravesar la placenta y concentrarse en los fetos de madres embarazadas
(Kuhnert et al., 1981; Vahter et al., 2000).
Se ha demostrado que el Hg2+ tiene una fuerte afinidad por los grupos de proteínas y
sulfidrilo que se combina con otros ligandos, incluyendo los grupos carboxilo, fosforilo,
35
amida y amina (Klaassen, 1990). En el cuerpo humano el Hg0 tiene un tiempo de vida media
de 60 días (Magos, 1988) y es expulsado mediante el aire exalado, orinas, heces fecales,
transpiración y la saliva (Joselow et al., 1968).
Una exposición aguda a altas dosis de Hg0 produce daños en los pulmones, en la piel,
en los ojos y en las encías. La primera señal es dificultad para respirar (disnea). Esto puede ser
seguido por tos paroxística, dolor en el pecho, infiltración pulmonar, escalofríos, náuseas y
vómitos (Clarkson and Magos, 2006). Las manifestaciones pulmonares son los más
fulminantes desencadenándose en neumonitis intersticial, bronquiolitis necrotizante, edema
pulmonar e incluso insuficiencia pulmonar. Las caracteristicas principales de los síntomas de
una intoxicación crónica por Hg0 inhalado son los temblores y alteraciones psicológicas. Este
último tiene la connotación antigua como erethymus mercurialis o eretismo (Clarkson and
Magos, 2006). La gingivitis, estomatitis y salivación excesiva también se asocian con altas
exposiciones ocupacionales (Goldwater, 1972). Además puede presentarse un daño severo
renal a veces asociada con el síndrome nefrótico. El síndrome nefrótico es una reacción
idiosincrásica que se caracteriza por la albuminuria y edema (Clarkson and Magos, 2006).
La exposición a bajas dosis de Hg0 produce efectos tóxicos a nivel del sistema
nervioso central periférico (Ozuah, 2000). Las poblaciones expuestas a vapores de Hg0 son
aquellas dedicadas a la recuperación de oro mediante amalgación (Barbosa et al., 1995), a la
industria metalúrgica (Queipo Abad et al., 2016) y la población que tiene amalgamas dentales
(PNUE, 2005).
De la absorción de las sales mercuriales se sabe que solo el 15 % de la dosis de nitrato
de Hg administrado por vía oral en una solución acuosa o acoplada a proteínas de hígado de
vaca es absorbido por el tracto intestinal del organismo humano (Ineris, 2010). Las sales
mercuriales producen insuficiencia renal y lesiones gastro-intestinales y la ingestión de 1 a 4 g
de sales de Hg2+ y Hg+, pueden provocar los efectos antes citados hasta la muerte (ATSDR,
1999). La exposición crónica a estos compuestos causa daños permanentes en el sistema
nervioso central (Boadi et al., 1992).
El MMHg es un neurotóxico potente que tiene efectos nocivos sobre el desarrollo del
cerebro, por lo que su presencia durante el embarazo es preocupante ya que es capaz de
atravesar fácilmente la barrera placentaria y hematoencefálica fetal (PNUE, 2005).
El medio por el cual ingresa al organismo es principalmente por la vía oral, con una
absorción del 95% (Aberg et al., 1969). La concentración de MMHg en la sangre llega a un
36
máximo en las 4 a 14 horas después de la ingestión (WHO, 2008). Una vez distribuida en
todo el cuerpo a través de la sangre, preferentemente se acumula en los riñones (Ineris, 2010).
En la sangre se encuentra asociada a los grupos sulfidrilos, en particular con la cisteína
(Berlin et al., 1986). Un estudio reciente da cuenta de que la hemoglobina es la principal
proteína de unión para el MMHg a través de su residuo cisteína 93 (Pedrero Zayas et al.,
2014) sitios activos que contienen el grupo –SH. La cisteína 93 es uno de los aminoácidos que
constituye el polipeptido β de la hemoglobina. La hemoglobina está constituida por
polipeptidos (o cadenas) α y β, que a su vez se encuentran conformados por 141 y 146
aminoácidos respectivamente.
El tiempo de vida media del MMHg en el cuerpo, es aproximadamente de 70 a 80 días
y el tiempo de vida media en la sangre de 48 a 53 días (Cernichiari et al., 2007). El Hg
orgánico es excretado del organismo humano en las heces fecales en forma de IHg. El MMHg
también es excretado en la leche materna (Weihe, 1994; Iwai-Shimada et al., 2015) por lo que
los niños lactantes están expuestos a este tóxico.
El Hg orgánico afecta principalmente el cerebro, con parestesia, malestar, cambios y
alteraciones sensoriales, induciendo a transtornos neurológicos graves, además de causar
daños en los riñones (Ineris, 2010).
La mayor fuente de exposición a MMHg para el hombre es el consumo de pescado
(Marques et al.; Bastos et al., 2015) y en los peces predadores casi todo el Hg se encuentra en
forma de MMHg (PNUE, 2005).
1.4 Mecanismos de absorción del MMHg en el organismo
El MMHg ingestado, presente en los alimentos, es absorbido en el tracto intestinal,
aunque aún no se conoce el sitio exacto de la absorción (ATSDR, 1999; USEPA, 2001). Hasta
el momento se sabe que el Hg pasa directamente al torrente sanguíneo asociada a los grupos
sulfidrilos de la cisteína que contiene la hemoglobina (Berlin et al., 1986; Pedrero Zayas et al.,
2014). En el organismo de los animales, los microsomas del hígado pueden degradar el
MMHg a IHg. Esta reacción es propiciada por los radicales hidroxilados formados por la
NADHcytocromo P-450 reductasa (Dunn and Clarkson, 1980). Otros experimentos
demuestran que el cloruro de metilmercurio (MMHgCl) ingerido puede ser también
transformado a IHg por la flora intestinal (Nakamura et al., 1977). El MMHg también puede
ser secretado en la bilis en forma de complejo MMHg-glutationa, o ser redistribuida por el
37
sistema sanguíneo o demetilado y eliminado en las heces fecales (Clarkson et al., 2007). El
MM secretado en la bilis no puede ser re-absorbido en el intestino posiblemente debido a que
se encuentra acomplejado con compuestos sulfidros no proteínicos presentes en la bilis
(Norseth and Clarkson, 1971 ; Urano et al., 1990 ).
1.5 Efectos debidos a la exposición crónica de MMHg
El Hg produce efectos prooxidativos en la célula y su enlace con los grupos sulfidrilos,
altera ciertas funciones celulares como la polimerización de los microtúbulos (Yole et al.,
2007), la transcripción del ADN (Rodgers et al., 2001), la síntesis de glutamina (Allen et al.,
2001) y la homeostasis del calcio (Yole et al., 2007). Estos efectos conducen a numerosas
disfunciones celulares y la muerte celular. Estos mismos efectos se ven agravados por la
capacidad del Hg para inducir respuestas auto-inmunes (Rowley and Monestier, 2005).
Los porcentajes de MMHg encontrados en la sangre y en el cerebro fueron alrededor
del 5 y 10% respectivamente; los niveles de este compuesto en los cerebros fetales es 5 a 7
veces más elevado que en la sangre materna (Cernichiari et al., 1995). El MMHg presente en
el cerebro inhibe la actividad de las enzimas responsables del crecimiento de las neuronas
durante el desarrollo del cerebro, causando defectos y retrasos mentales en el desarrollo de los
niños (Clarkson et al., 2007; Grandjean et al., 2014).
Los primeros reportes epidemiológicos de intoxicación con MMHg ocurrido en
humanos fueron registrados en Minamata, Japón (1953-1960). El 59% de esta población
presentó transtornos neurógicos y mentales; con signos clínicos de parestesia (hormigueo),
ataxia (transtorno en la cordinación del movimiento), transtornos sensoriales, auditivos y
dificultad al caminar. Los exámenes cerebrales en pacientes fallecidos, mostró atrofia cerebral
importante en el 55% de la masa y volumen normal del cerebro. Los efectos congénitos del
MMHg (retardo en la atención y desarrollo) se vieron reflejados en niños de madres expuestas
a MMHg durante la edad adulta (PNUE, 2005). El sistema cardiovascular e inmune también
se vieron afectados por el MMHg (NRC, 2000 ; Gardner et al., 2010). Los estudios
relacionados entre la exposición a MMHg y una respuesta cancerogénica han sido realizados,
sin embargo ninguno ha demostrado que existe una correlación (Crespo-López et al., 2009).
De los diferentes bioindicadores de MMHg (orinas, leche materna, la sangre total,
plasmasanguíneo) los bioindicadores capilares (cabellos) son comúnmente utilizados para
evaluar las exposiciones medioambientales por Hg (Airey, 1983). De manera particular la
exposición a MMHg a través de la dieta puede ser evaluada a través del contenido total de Hg
38
en el cabello (Airey, 1983). Las concentraciones de MMHg en el cabello reflejan las
exposiciones anteriores y depende de la tasa de crecimiento del cabello ya que existe una
relación casi lineal entre el contenido de MMHg en la sangre y en los cabellos (NRC, 2000 ;
Bensefa-Colas et al., 2011). La medición de Hg en los cabellos es el método menos invasivo y
óptimo para determinar la exposición a MMHg; en los fetos y los niños de corta edad se mide
en los cabellos de la madre (Grandjean and Perez, 2008). Sin embargo las exposiciones a
Hg0(v) y óxidos de Hg vía oral pueden ser examinados en los cabellos empleando ablación
laser ICP-MS (Legrand et al., 2004). Esta técnica fué aplicada para la determinación de las
concentraciones de Hg en las diferentes secciones a lo largo del cabello, cuyos resultados
fueron congruentes con las fechas de exposición a Hg0 (Queipo Abad et al., 2016).
1.6 Niveles de exposición a Hg que causan riesgo
La alimentación representa la principal fuente de exposición a MMHg para los seres
humanos, en particular el pescado y los productos del mar (PNUE, 2005; Sunderland et al.,
2009). El pescado es un elemento importante de la alimentación humana en numerosas
regiones del mundo debido a su aporte de elementos nutritivos (proteínas y ácidos grasos
oméga-3) difícilmente remplazables, por lo que, pensando en la salud, se debería consumir
peces con bajos contenidos de Hg (PNUE, 2005).
En base a las evaluaciones de riesgo y consideraciones sociales, varios países y
organizaciones internacionales han establecido herramientas de evaluación de riesgo, tales
como los niveles de ingesta diarios o semanales de MMHg o Hg considerados seguros (dosis
de referencia e ingesta semanal tolerable provisional), límites/directrices para las
concentraciones máximas en el pescado y recomendaciones sobre el consumo de pescado.
Según los informes presentados por los diferentes países a la UNEP, la tabla 1 muestra
un conjunto de ejemplos de niveles de Hg máximos permitidos o recomendados para pescado
en diferentes países (UNEP, 2002). También se mencionan ejemplos de los niveles de ingesta
tolerable de Hg o MMHg.
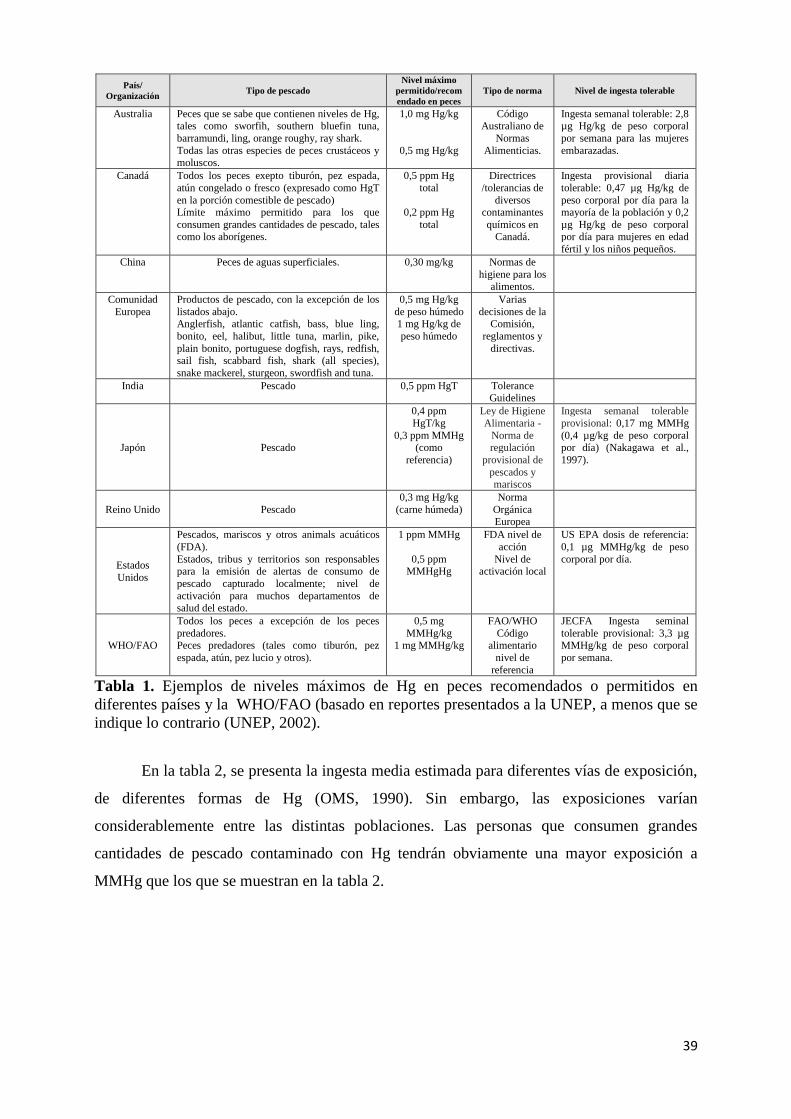
39
País/
Organización Tipo de pescado
Nivel máximo
permitido/recom
endado en peces
Tipo de norma Nivel de ingesta tolerable
Australia Peces que se sabe que contienen niveles de Hg, tales como sworfih, southern bluefin tuna,
barramundi, ling, orange roughy, ray shark.
Todas las otras especies de peces crustáceos y moluscos.
1,0 mg Hg/kg
0,5 mg Hg/kg
Código Australiano de
Normas
Alimenticias.
Ingesta semanal tolerable: 2,8 µg Hg/kg de peso corporal
por semana para las mujeres
embarazadas.
Canadá Todos los peces exepto tiburón, pez espada,
atún congelado o fresco (expresado como HgT
en la porción comestible de pescado) Límite máximo permitido para los que
consumen grandes cantidades de pescado, tales como los aborígenes.
0,5 ppm Hg
total
0,2 ppm Hg
total
Directrices
/tolerancias de
diversos contaminantes
químicos en Canadá.
Ingesta provisional diaria
tolerable: 0,47 µg Hg/kg de
peso corporal por día para la mayoría de la población y 0,2
µg Hg/kg de peso corporal por día para mujeres en edad
fértil y los niños pequeños.
China Peces de aguas superficiales. 0,30 mg/kg Normas de
higiene para los alimentos.
Comunidad
Europea
Productos de pescado, con la excepción de los
listados abajo. Anglerfish, atlantic catfish, bass, blue ling,
bonito, eel, halibut, little tuna, marlin, pike,
plain bonito, portuguese dogfish, rays, redfish, sail fish, scabbard fish, shark (all species),
snake mackerel, sturgeon, swordfish and tuna.
0,5 mg Hg/kg
de peso húmedo 1 mg Hg/kg de
peso húmedo
Varias
decisiones de la Comisión,
reglamentos y
directivas.
India Pescado 0,5 ppm HgT Tolerance Guidelines
Japón Pescado
0,4 ppm
HgT/kg
0,3 ppm MMHg (como
referencia)
Ley de Higiene
Alimentaria -
Norma de regulación
provisional de
pescados y mariscos
Ingesta semanal tolerable
provisional: 0,17 mg MMHg
(0,4 µg/kg de peso corporal por día) (Nakagawa et al.,
1997).
Reino Unido Pescado
0,3 mg Hg/kg
(carne húmeda)
Norma
Orgánica Europea
Estados
Unidos
Pescados, mariscos y otros animals acuáticos
(FDA).
Estados, tribus y territorios son responsables para la emisión de alertas de consumo de
pescado capturado localmente; nivel de
activación para muchos departamentos de salud del estado.
1 ppm MMHg
0,5 ppm MMHgHg
FDA nivel de
acción
Nivel de activación local
US EPA dosis de referencia:
0,1 µg MMHg/kg de peso
corporal por día.
WHO/FAO
Todos los peces a excepción de los peces
predadores. Peces predadores (tales como tiburón, pez
espada, atún, pez lucio y otros).
0,5 mg
MMHg/kg 1 mg MMHg/kg
FAO/WHO
Código alimentario
nivel de
referencia
JECFA Ingesta seminal
tolerable provisional: 3,3 µg MMHg/kg de peso corporal
por semana.
Tabla 1. Ejemplos de niveles máximos de Hg en peces recomendados o permitidos en
diferentes países y la WHO/FAO (basado en reportes presentados a la UNEP, a menos que se
indique lo contrario (UNEP, 2002).
En la tabla 2, se presenta la ingesta media estimada para diferentes vías de exposición,
de diferentes formas de Hg (OMS, 1990). Sin embargo, las exposiciones varían
considerablemente entre las distintas poblaciones. Las personas que consumen grandes
cantidades de pescado contaminado con Hg tendrán obviamente una mayor exposición a
MMHg que los que se muestran en la tabla 2.
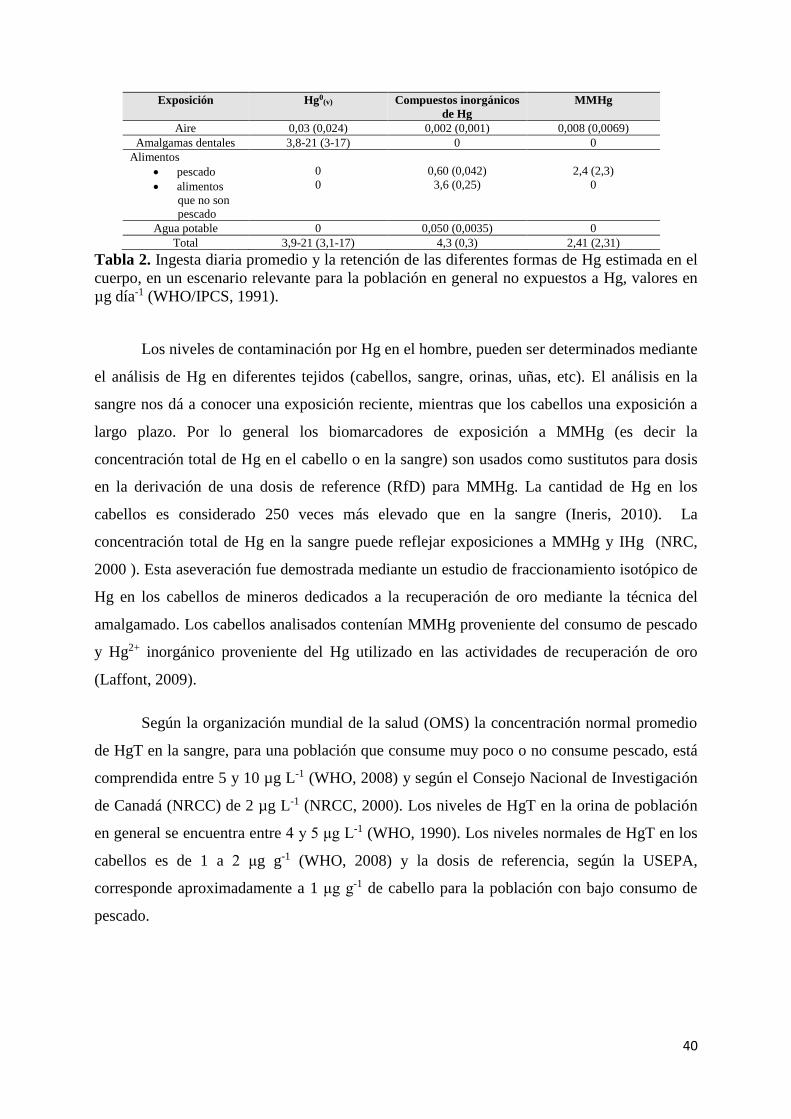
40
Exposición Hg0
(v) Compuestos inorgánicos
de Hg
MMHg
Aire 0,03 (0,024) 0,002 (0,001) 0,008 (0,0069)
Amalgamas dentales 3,8-21 (3-17) 0 0
Alimentos
• pescado
• alimentos
que no son
pescado
0
0
0,60 (0,042)
3,6 (0,25)
2,4 (2,3)
0
Agua potable 0 0,050 (0,0035) 0
Total 3,9-21 (3,1-17) 4,3 (0,3) 2,41 (2,31)
Tabla 2. Ingesta diaria promedio y la retención de las diferentes formas de Hg estimada en el
cuerpo, en un escenario relevante para la población en general no expuestos a Hg, valores en
µg día-1 (WHO/IPCS, 1991).
Los niveles de contaminación por Hg en el hombre, pueden ser determinados mediante
el análisis de Hg en diferentes tejidos (cabellos, sangre, orinas, uñas, etc). El análisis en la
sangre nos dá a conocer una exposición reciente, mientras que los cabellos una exposición a
largo plazo. Por lo general los biomarcadores de exposición a MMHg (es decir la
concentración total de Hg en el cabello o en la sangre) son usados como sustitutos para dosis
en la derivación de una dosis de reference (RfD) para MMHg. La cantidad de Hg en los
cabellos es considerado 250 veces más elevado que en la sangre (Ineris, 2010). La
concentración total de Hg en la sangre puede reflejar exposiciones a MMHg y IHg (NRC,
2000 ). Esta aseveración fue demostrada mediante un estudio de fraccionamiento isotópico de
Hg en los cabellos de mineros dedicados a la recuperación de oro mediante la técnica del
amalgamado. Los cabellos analisados contenían MMHg proveniente del consumo de pescado
y Hg2+ inorgánico proveniente del Hg utilizado en las actividades de recuperación de oro
(Laffont, 2009).
Según la organización mundial de la salud (OMS) la concentración normal promedio
de HgT en la sangre, para una población que consume muy poco o no consume pescado, está
comprendida entre 5 y 10 µg L-1 (WHO, 2008) y según el Consejo Nacional de Investigación
de Canadá (NRCC) de 2 µg L-1 (NRCC, 2000). Los niveles de HgT en la orina de población
en general se encuentra entre 4 y 5 μg L-1 (WHO, 1990). Los niveles normales de HgT en los
cabellos es de 1 a 2 μg g-1 (WHO, 2008) y la dosis de referencia, según la USEPA,
corresponde aproximadamente a 1 μg g-1 de cabello para la población con bajo consumo de
pescado.
41
1.7 Fuentes y ciclo biogeoquímico global del Hg
1.7.1 Fuentes naturales y antropogénicas de Hg
El Hg se encuentra presente naturalmente a nivel de ultratrazas (10–9 a 10–12 g g–1) en
el medio ambiente, bajo diversas especies inorgánicas y orgánicas en las rocas, suelos, agua,
aire y en las cenizas volcánicas. La distribución del Hg en la actualidad esta muy influenciada
por las atividades antrópicas, tales como la actividad industrial, la combustión de
hidrocarburos principalmente por el uso el carbón para la obtención de energía y todas las
actividades que movilizan el Hg almacenado en los suelos y en las rocas (UNEP, 2013a).
El Hg es emitido directamente desde las fuentes primarias o naturales y desde fuentes
secundarias o reservorios, donde el Hg es o ha sido depositado desde fuentes primarias.
1.7.1.1 Fuentes naturales
La estimación de las emisiones de Hg desde fuentes naturales engloba la contribución
primaria de Hg desde fuentes naturales y procesos de re-emisión de Hg históricamente
depositados sobre la superficie de tierra y mares. El Hg emitido desde los volcanes, las
fuentes geotermales, los suelos superficiales enriquecidos en Hg pertenecen a las fuentes
naturales primarias; mientras que la re-emisión de Hg previamente depositado sobre la
vegetación, la tierra o las aguas superficales, principalmente se encuentra relacionado con los
cambios de uso de suelo, quema de biomasa, condiciones meteorológicas y mecanismos de
intercambio de Hg gaseoso en aire-agua/suelos superficales/interfaces de la capa de nieve-
hielo (Mason, 2009).
Las emanaciones naturales de Hg que provienen de la corteza terrestre, durante una
actividad volcánica o falla tectónica, son consideradas como fuentes primarias (Jonasson and
Boyle, 1972; Pyle and Mather, 2003). El Hg es emitido hacia la atmósfera en forma de
vapores de Hg (Schroeder and Munthe, 1998) o asociado a los aerosoles en escasa proporción,
con un flujo de 700 Mg año-1 (Pyle and Mather, 2003). La alteración de las rocas en las
zonas de subducción, volcanismo, geotérmicas, fracturas, fallas tectónicas, límites de placas
tectónicas o en los sitios donde las rocas están enriquecidas en Hg, se constituyen en una
fuente de Hg (Varekamp and Buseck, 1986; Nriagu, 1989; Friske and Coker, 1995). Estas
zonas se encuentran distribuidas en todo el mundo como lo muestra la figura 4, y se denomina
cinturón global de Hg (Jonasson and Boyle, 1972; Gustin et al., 2008). Los aportes de Hg
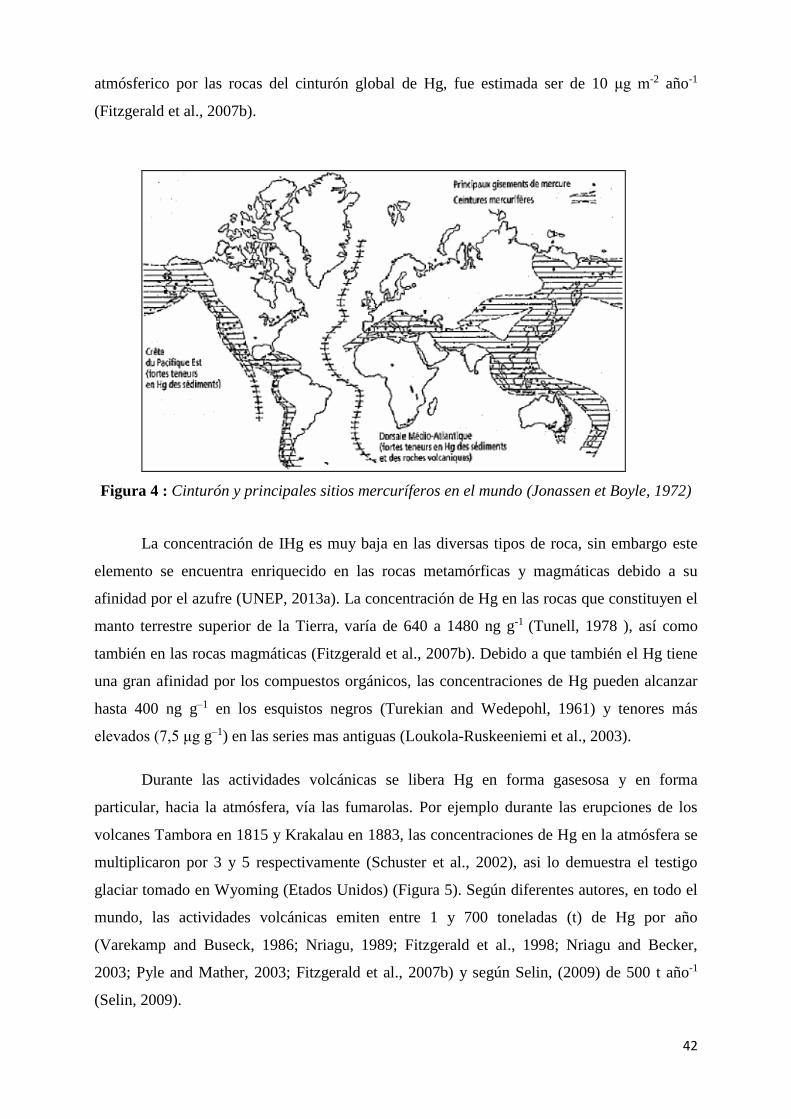
42
atmósferico por las rocas del cinturón global de Hg, fue estimada ser de 10 μg m-2 año-1
(Fitzgerald et al., 2007b).
Figura 4 : Cinturón y principales sitios mercuríferos en el mundo (Jonassen et Boyle, 1972)
La concentración de IHg es muy baja en las diversas tipos de roca, sin embargo este
elemento se encuentra enriquecido en las rocas metamórficas y magmáticas debido a su
afinidad por el azufre (UNEP, 2013a). La concentración de Hg en las rocas que constituyen el
manto terrestre superior de la Tierra, varía de 640 a 1480 ng g-1 (Tunell, 1978 ), así como
también en las rocas magmáticas (Fitzgerald et al., 2007b). Debido a que también el Hg tiene
una gran afinidad por los compuestos orgánicos, las concentraciones de Hg pueden alcanzar
hasta 400 ng g–1 en los esquistos negros (Turekian and Wedepohl, 1961) y tenores más
elevados (7,5 μg g–1) en las series mas antiguas (Loukola-Ruskeeniemi et al., 2003).
Durante las actividades volcánicas se libera Hg en forma gasesosa y en forma
particular, hacia la atmósfera, vía las fumarolas. Por ejemplo durante las erupciones de los
volcanes Tambora en 1815 y Krakalau en 1883, las concentraciones de Hg en la atmósfera se
multiplicaron por 3 y 5 respectivamente (Schuster et al., 2002), asi lo demuestra el testigo
glaciar tomado en Wyoming (Etados Unidos) (Figura 5). Según diferentes autores, en todo el
mundo, las actividades volcánicas emiten entre 1 y 700 toneladas (t) de Hg por año
(Varekamp and Buseck, 1986; Nriagu, 1989; Fitzgerald et al., 1998; Nriagu and Becker,
2003; Pyle and Mather, 2003; Fitzgerald et al., 2007b) y según Selin, (2009) de 500 t año-1
(Selin, 2009).
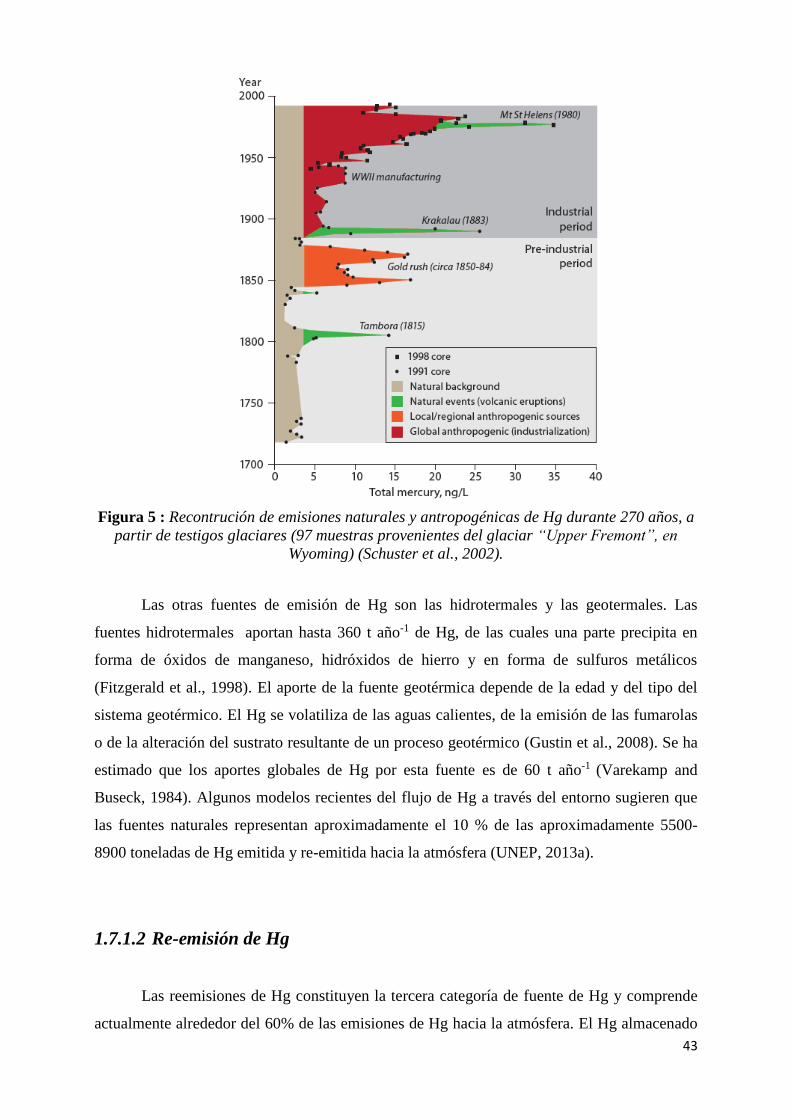
43
Figura 5 : Recontrución de emisiones naturales y antropogénicas de Hg durante 270 años, a
partir de testigos glaciares (97 muestras provenientes del glaciar “Upper Fremont”, en
Wyoming) (Schuster et al., 2002).
Las otras fuentes de emisión de Hg son las hidrotermales y las geotermales. Las
fuentes hidrotermales aportan hasta 360 t año-1 de Hg, de las cuales una parte precipita en
forma de óxidos de manganeso, hidróxidos de hierro y en forma de sulfuros metálicos
(Fitzgerald et al., 1998). El aporte de la fuente geotérmica depende de la edad y del tipo del
sistema geotérmico. El Hg se volatiliza de las aguas calientes, de la emisión de las fumarolas
o de la alteración del sustrato resultante de un proceso geotérmico (Gustin et al., 2008). Se ha
estimado que los aportes globales de Hg por esta fuente es de 60 t año-1 (Varekamp and
Buseck, 1984). Algunos modelos recientes del flujo de Hg a través del entorno sugieren que
las fuentes naturales representan aproximadamente el 10 % de las aproximadamente 5500-
8900 toneladas de Hg emitida y re-emitida hacia la atmósfera (UNEP, 2013a).
1.7.1.2 Re-emisión de Hg
Las reemisiones de Hg constituyen la tercera categoría de fuente de Hg y comprende
actualmente alrededor del 60% de las emisiones de Hg hacia la atmósfera. El Hg almacenado
44
en el aire como producto de pasadas emisiones, subsecuentemente es depositado sobre los
suelos, superficie de las aguas y la vegetación, compartimientos desde donde es nuevamente
re-emitido hacia la atmósfera. La re-emisión de Hg es el resultado del proceso natural por el
cual el IHg y Hg orgánico se reduce a Hg0 mediante reacciones fotolíticas. No se descarta que
la interacción de la temperatura o biológicos, probablemente, estén involucrados en algún
grado (UNEP, 2013a). El Hg depositado sobre la superficie de las plantas puede ser re-
emitido durante el incendio de bosques o la quema de la biomasa. Este metal puede ser
depositado y re-emitido varias veces en el medio ambiente.
Las re-emisiones de Hg no se deberían considerar como fuentes de Hg natural ya que
originalmente proviene de fuentes naturales y antropogénicas.
El incremento de las emisiones antropogénicas de Hg, tiene como resultado el
aumento de las re-emisiones. Esto se vé agravado por los cambios en las prácticas de uso de la
tierra, así como el aumento de las temperaturas debido al cambio climático.
En el medio acuático, la removilización de Hg se produce cuando el Hg depositado y
acumulado sobre los suelos o sedimentos se vuelve a movilizar. Las lluvias, inundaciones y
tormentas causan el ingreso de Hg en los sistemas acuáticos (UNEP, 2013a). Otra de las
remobilizaciones ocurre cuando las rocas que contienen Hg son lixiviadas o erosionadas
físicamente. Después de la alteración química, el Hg en forma de Hg2+ puede acomplejarse
con la materia orgánica y entrar en el sistema acuático en forma disuelta o coloidal o en forma
particular asociada al material mineral de los suelos y las rocas. La deposición y re-emisión de
Hg en el medio ambiente va a ocurrir constantemente, siendo difícil cuantificar y definir el
origen del mismo.
Las estimaciones de re-emisiones de Hg hacia la atmósfera a escala global, fueron
realizadas por diferentes autores y varían según los años. Selin et al., (2008) y Sunderland and
Mason, (2007), estimaron una re-emisión de 2500 a 4100 t de Hg año-1 (Sunderland and
Mason, 2007; Selin et al., 2008).
Para el año 2008, Pirrone et al., (2010), estima 5207 t de Hg por año-1, emitido desde
procesos naturales (emisiones primarias de Hg + re-emisiones), incluyendo los episodios de
agotamiento de Hg (Tabla 4) (Pirrone et al., 2010). La emisión natural de Hg representa el
70% del total de las emisiones. Los océanos son la fuente más importante (36%) dentro de las
fuentes naturales, desde donde el Hg es volatilizado mediante procesos de fotoreducción.
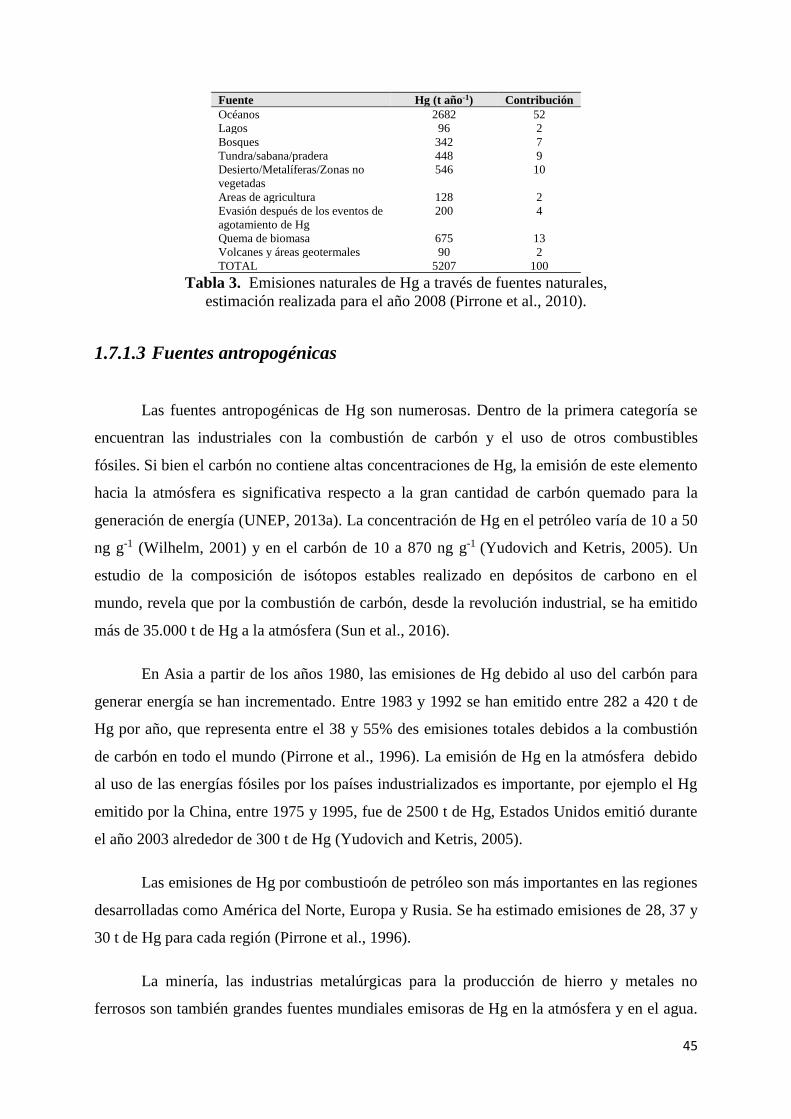
45
Fuente Hg (t año-1) Contribución
Océanos 2682 52
Lagos 96 2
Bosques 342 7
Tundra/sabana/pradera 448 9
Desierto/Metalíferas/Zonas no
vegetadas
546 10
Areas de agricultura 128 2
Evasión después de los eventos de
agotamiento de Hg
200 4
Quema de biomasa 675 13
Volcanes y áreas geotermales 90 2
TOTAL 5207 100
Tabla 3. Emisiones naturales de Hg a través de fuentes naturales,
estimación realizada para el año 2008 (Pirrone et al., 2010).
1.7.1.3 Fuentes antropogénicas
Las fuentes antropogénicas de Hg son numerosas. Dentro de la primera categoría se
encuentran las industriales con la combustión de carbón y el uso de otros combustibles
fósiles. Si bien el carbón no contiene altas concentraciones de Hg, la emisión de este elemento
hacia la atmósfera es significativa respecto a la gran cantidad de carbón quemado para la
generación de energía (UNEP, 2013a). La concentración de Hg en el petróleo varía de 10 a 50
ng g-1 (Wilhelm, 2001) y en el carbón de 10 a 870 ng g-1 (Yudovich and Ketris, 2005). Un
estudio de la composición de isótopos estables realizado en depósitos de carbono en el
mundo, revela que por la combustión de carbón, desde la revolución industrial, se ha emitido
más de 35.000 t de Hg a la atmósfera (Sun et al., 2016).
En Asia a partir de los años 1980, las emisiones de Hg debido al uso del carbón para
generar energía se han incrementado. Entre 1983 y 1992 se han emitido entre 282 a 420 t de
Hg por año, que representa entre el 38 y 55% des emisiones totales debidos a la combustión
de carbón en todo el mundo (Pirrone et al., 1996). La emisión de Hg en la atmósfera debido
al uso de las energías fósiles por los países industrializados es importante, por ejemplo el Hg
emitido por la China, entre 1975 y 1995, fue de 2500 t de Hg, Estados Unidos emitió durante
el año 2003 alrededor de 300 t de Hg (Yudovich and Ketris, 2005).
Las emisiones de Hg por combustioón de petróleo son más importantes en las regiones
desarrolladas como América del Norte, Europa y Rusia. Se ha estimado emisiones de 28, 37 y
30 t de Hg para cada región (Pirrone et al., 1996).
La minería, las industrias metalúrgicas para la producción de hierro y metales no
ferrosos son también grandes fuentes mundiales emisoras de Hg en la atmósfera y en el agua.
46
En la minería y el procesamiento de metales, la mayor parte del Hg capturado y almacenado
es vendido para su uso en diversos productos. No obstante, el volumen de los minerales y los
metales involucrados dan como resultado grandes emisiones de Hg (UNEP, 2013a).
La producción de cemento, que normalmente consiste en la quema de combustibles
fósiles para calentar los materiales necesarios para fabricar cemento, es otra fuente importante
de emisión antropogénica de mercurio. Según la UNEP el sector dedicado a la producción de
cemento emite 173 t de Hg por año (UNEP, 2013a), además de Pb. El Hg y el Pb que se
encuentran como impurezas en la materia prima y el combustible utilizado, son emitidos o
liberados como “subproductos” o de manera “no intencional” (UNEP, 2013a).
La biomasa terrestre y los suelos son una reserva mundial primaria de Hg derivado de
fuentes naturales y antropogénicas (Wang et al., 2009; Gamby et al., 2015). Las actividades
agrícolas y la deforestación son también responsables de las emisiones de Hg hacia la
atmósfera (Fostier et al., 2000; UNEP, 2013a; Fostier et al., 2015). Se estima que 550 Mmol
de Hg en promedio global fueron movilizados, desde el suelo, como resultado de la
deforestación en los últimos 200 años (Gamby et al., 2015). La liberación de Hg se dá con la
deforestación y el chaqueo de los suelos (quema de biomasa que contiene el suelo), las cuales
son prácticas preliminares de la agricultura de ciertos países de Africa, Asia y América Latina
(UNEP, 2013a). La deforestación favorece a la erosión eólica de los suelos y contribuye a la
formación de aerosoles enriquecidos en Hg (Fostier et al., 2000). Las copas de los árboles
presentan una gran absorción y asimilación superficial de partículas y Hg0 gaseoso (Fay and
Gustin, 2007), posteriormente el Hg acumulado en el follaje se transfiere al suelo por el
lavado de las hojas por las lluvias y por la descomposición de la hojarasca (Rea et al., 2002).
En la selva tropical amazónica se ha estimado que el 56 % de Hg presente en la
atmosféra son provenientes de la biomasa (Artaxo et al., 2000). La emisión anual de Hg por la
biomasa es de 268 Mg de Hg, esta masa constituye el 8% del total de Hg depositado sobre la
Tierra desde la atmósfera (Fostier et al., 2015). Otra estimación del aporte de Hg en la
Amazonía, considerando la deforestación, la tala de árboles y la agricultura sobre suelos
chaqueados, es de 370 g km-2 por año (Roulet et al., 1999). Por otra parte en la agricultura el
Hg puede ser aportado directamente a los suelos por el uso de fungicidas y fertilizantes que
contienen Hg.
Una segunda categoría de fuente de Hg incluye los sectores donde el Hg es utilizado
de manera intencional. La minería artesanal a pequeña escala es la más importante, donde el
47
Hg emitido y liberado resulta del uso de Hg para extraer oro de las rocas, suelos y sedimentos
(UNEP, 2013).
Con la invención del proceso de amalgamado, el Hg ha sido utilizado en diferentes
partes del mundo principalmente en América, Australia, Sudeste de Africa incluso en
Inglaterra, para la producción de oro y plata a gran escala (de Lacerda and Salomons, 1997).
El Hg liberado en la biósfera por esta actividad, entre los años 1550 a 1930, es alrededor de
260 t de Hg (de Lacerda and Salomons, 1997). La técnica del amalgamado sigue siendo
utilizada para la producción de oro en Sud América especialmente en la Amazonia, China,
Sudeste de Asia y en algunos países africanos, habiéndose estimado hasta el año 2002, para la
minería aurífera a pequeña escala, una emisión de 727 t de Hg por año hacia la atmósfera
(UNEP, 2013a). Esta cifra representa el 37% de las emisiones totales antropogénicas (UNEP,
2013a). La extracción de metales preciosos, las actividades de extracción de Hg a partir de los
yacimientos de cinabrio se suman a la contribución de Hg en el medio ambiente.
Otro uso intensional está relacionado con el sector que incluye desechos de productos
de consumo (incluye el reciclado de metales), la industria de cloro-alcali en la que se utiliza
células de Hg para la produción de cloro y sosa cáustica, para la producción de cloruro de
vinilo monómero de acetileno en la China, donde el Hg es utilizado como catalizador (UNEP,
2013a).
Los residuos de productos de consumo que contienen Hg pueden terminar en
vertederos o incineradores. El Hg utilizado en una amplia gama de productos, incluyendo
baterías, pinturas, interruptores, dispositivos eléctricos y electrónicos, termómetros,
medidores de presión sanguínea, lámparas fluorescentes de bajo consumo de energía,
pesticidas, fungicidas, medicinas y cosméticos. Una vez utilizados, muchos de estos
productos y el Hg que contiene, entran en los flujos de los residuos. En los vertederos parte
del Hg es remobilizado lentamente hacia el medio ambiente; mientras que el Hg contenido en
residuos que se incinera puede ser una fuente importante de Hg atmosférico, especialmente en
la incineración no controlada.
La cantidad de Hg que se libera durante el reciclaje de la chatarra, en la producción
secundaria de acero y metales no ferrosos, se supone que es mucho menor que la liberada
durante la producción primaria del metal (UNEP, 2013a). Sin embargo entre los países existen
grandes diferencias en la forma de tratamiento de sus desechos.
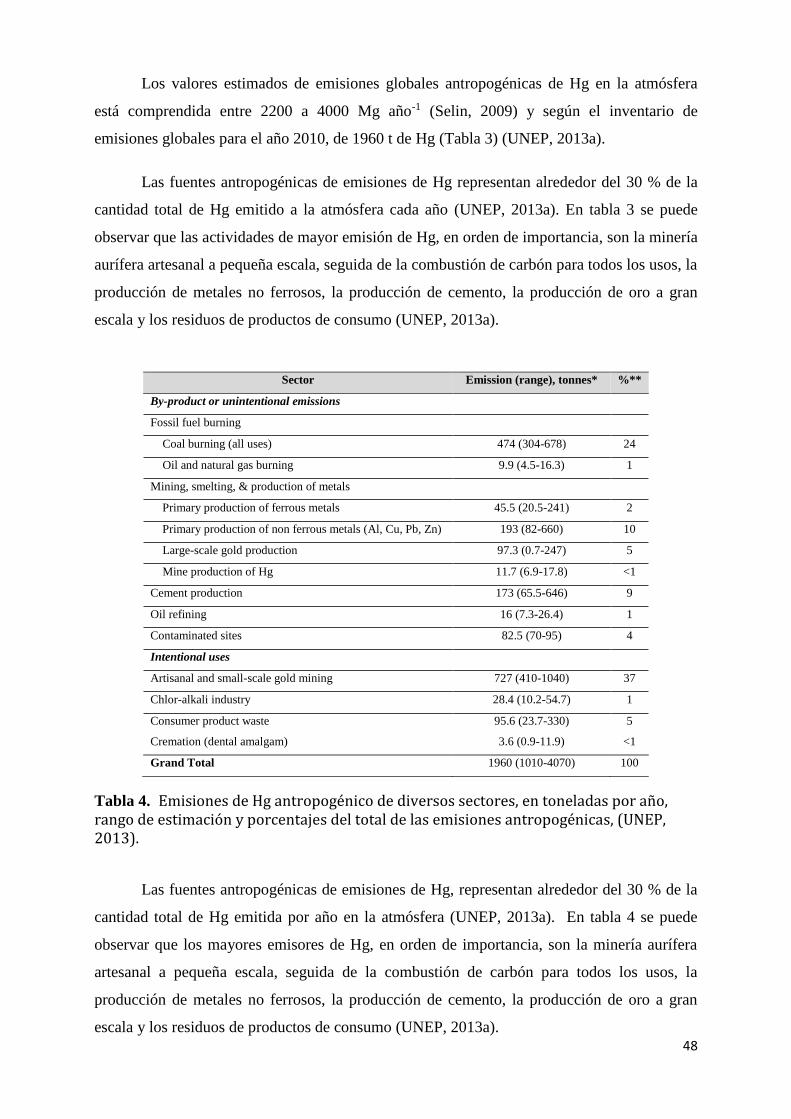
48
Los valores estimados de emisiones globales antropogénicas de Hg en la atmósfera
está comprendida entre 2200 a 4000 Mg año-1 (Selin, 2009) y según el inventario de
emisiones globales para el año 2010, de 1960 t de Hg (Tabla 3) (UNEP, 2013a).
Las fuentes antropogénicas de emisiones de Hg representan alrededor del 30 % de la
cantidad total de Hg emitido a la atmósfera cada año (UNEP, 2013a). En tabla 3 se puede
observar que las actividades de mayor emisión de Hg, en orden de importancia, son la minería
aurífera artesanal a pequeña escala, seguida de la combustión de carbón para todos los usos, la
producción de metales no ferrosos, la producción de cemento, la producción de oro a gran
escala y los residuos de productos de consumo (UNEP, 2013a).
Sector Emission (range), tonnes* %**
By-product or unintentional emissions
Fossil fuel burning
Coal burning (all uses) 474 (304-678) 24
Oil and natural gas burning 9.9 (4.5-16.3) 1
Mining, smelting, & production of metals
Primary production of ferrous metals 45.5 (20.5-241) 2
Primary production of non ferrous metals (Al, Cu, Pb, Zn) 193 (82-660) 10
Large-scale gold production 97.3 (0.7-247) 5
Mine production of Hg 11.7 (6.9-17.8) <1
Cement production 173 (65.5-646) 9
Oil refining 16 (7.3-26.4) 1
Contaminated sites 82.5 (70-95) 4
Intentional uses
Artisanal and small-scale gold mining 727 (410-1040) 37
Chlor-alkali industry 28.4 (10.2-54.7) 1
Consumer product waste 95.6 (23.7-330) 5
Cremation (dental amalgam) 3.6 (0.9-11.9) <1
Grand Total 1960 (1010-4070) 100
Tabla 4. Emisiones de Hg antropogénico de diversos sectores, en toneladas por año, rango de estimación y porcentajes del total de las emisiones antropogénicas, (UNEP, 2013).
Las fuentes antropogénicas de emisiones de Hg, representan alrededor del 30 % de la
cantidad total de Hg emitida por año en la atmósfera (UNEP, 2013a). En tabla 4 se puede
observar que los mayores emisores de Hg, en orden de importancia, son la minería aurífera
artesanal a pequeña escala, seguida de la combustión de carbón para todos los usos, la
producción de metales no ferrosos, la producción de cemento, la producción de oro a gran
escala y los residuos de productos de consumo (UNEP, 2013a).
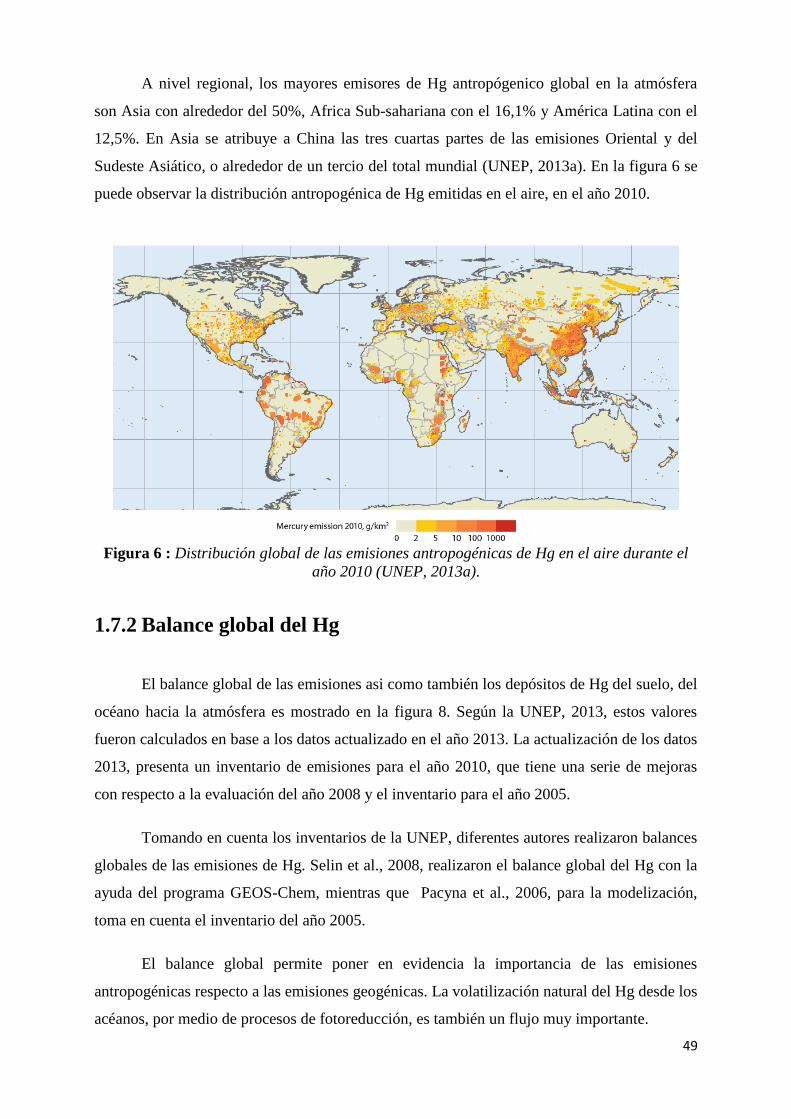
49
A nivel regional, los mayores emisores de Hg antropógenico global en la atmósfera
son Asia con alrededor del 50%, Africa Sub-sahariana con el 16,1% y América Latina con el
12,5%. En Asia se atribuye a China las tres cuartas partes de las emisiones Oriental y del
Sudeste Asiático, o alrededor de un tercio del total mundial (UNEP, 2013a). En la figura 6 se
puede observar la distribución antropogénica de Hg emitidas en el aire, en el año 2010.
Figura 6 : Distribución global de las emisiones antropogénicas de Hg en el aire durante el
año 2010 (UNEP, 2013a).
1.7.2 Balance global del Hg
El balance global de las emisiones asi como también los depósitos de Hg del suelo, del
océano hacia la atmósfera es mostrado en la figura 8. Según la UNEP, 2013, estos valores
fueron calculados en base a los datos actualizado en el año 2013. La actualización de los datos
2013, presenta un inventario de emisiones para el año 2010, que tiene una serie de mejoras
con respecto a la evaluación del año 2008 y el inventario para el año 2005.
Tomando en cuenta los inventarios de la UNEP, diferentes autores realizaron balances
globales de las emisiones de Hg. Selin et al., 2008, realizaron el balance global del Hg con la
ayuda del programa GEOS-Chem, mientras que Pacyna et al., 2006, para la modelización,
toma en cuenta el inventario del año 2005.
El balance global permite poner en evidencia la importancia de las emisiones
antropogénicas respecto a las emisiones geogénicas. La volatilización natural del Hg desde los
acéanos, por medio de procesos de fotoreducción, es también un flujo muy importante.
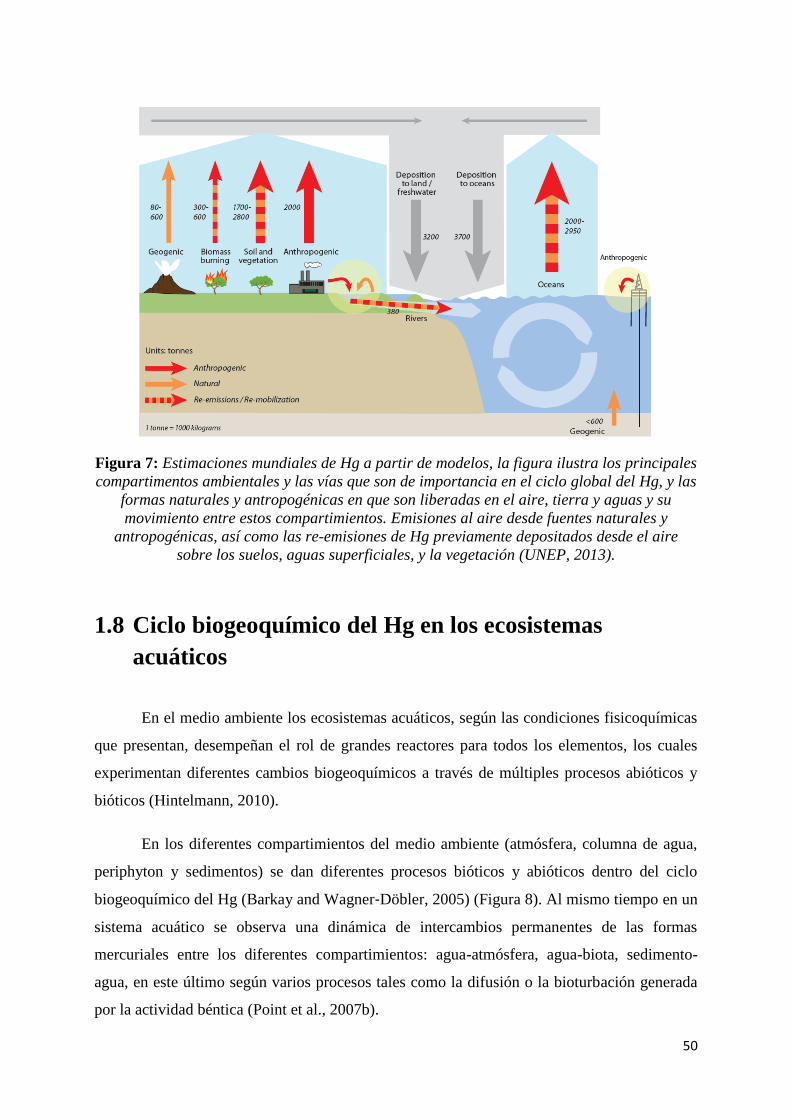
50
Figura 7: Estimaciones mundiales de Hg a partir de modelos, la figura ilustra los principales
compartimentos ambientales y las vías que son de importancia en el ciclo global del Hg, y las
formas naturales y antropogénicas en que son liberadas en el aire, tierra y aguas y su
movimiento entre estos compartimientos. Emisiones al aire desde fuentes naturales y
antropogénicas, así como las re-emisiones de Hg previamente depositados desde el aire
sobre los suelos, aguas superficiales, y la vegetación (UNEP, 2013).
1.8 Ciclo biogeoquímico del Hg en los ecosistemas
acuáticos
En el medio ambiente los ecosistemas acuáticos, según las condiciones fisicoquímicas
que presentan, desempeñan el rol de grandes reactores para todos los elementos, los cuales
experimentan diferentes cambios biogeoquímicos a través de múltiples procesos abióticos y
bióticos (Hintelmann, 2010).
En los diferentes compartimientos del medio ambiente (atmósfera, columna de agua,
periphyton y sedimentos) se dan diferentes procesos bióticos y abióticos dentro del ciclo
biogeoquímico del Hg (Barkay and Wagner‐Döbler, 2005) (Figura 8). Al mismo tiempo en un
sistema acuático se observa una dinámica de intercambios permanentes de las formas
mercuriales entre los diferentes compartimientos: agua-atmósfera, agua-biota, sedimento-
agua, en este último según varios procesos tales como la difusión o la bioturbación generada
por la actividad béntica (Point et al., 2007b).
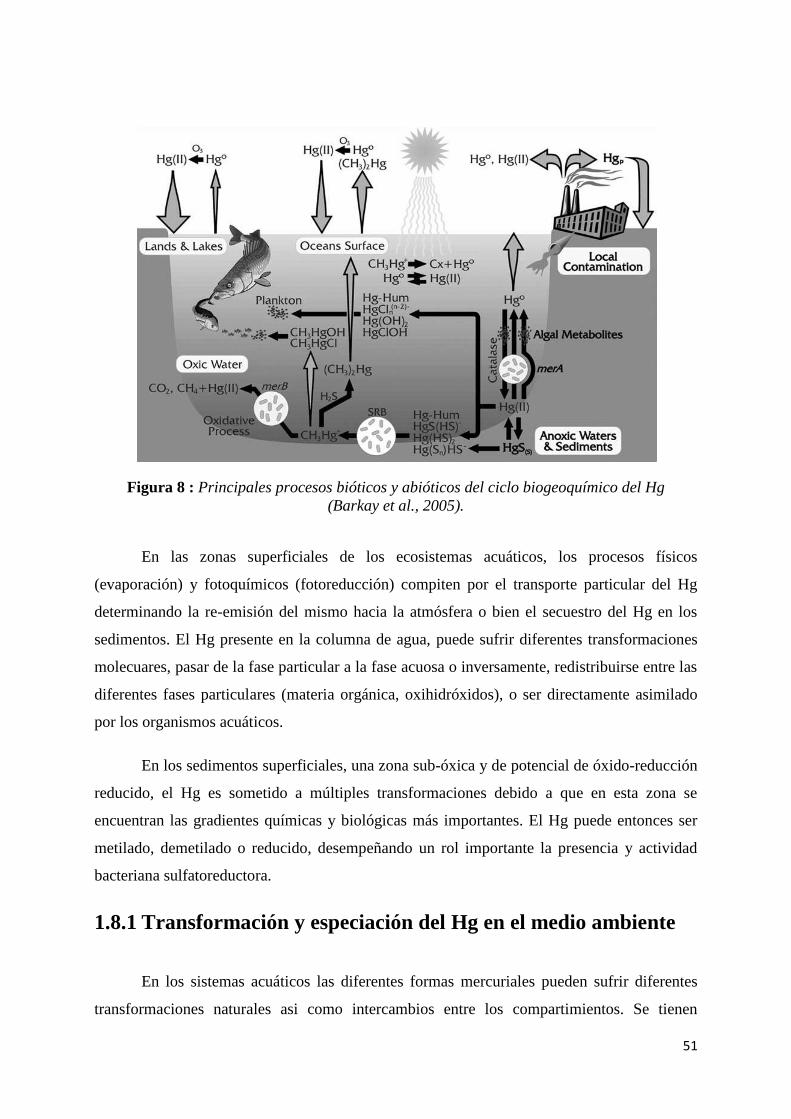
51
Figura 8 : Principales procesos bióticos y abióticos del ciclo biogeoquímico del Hg
(Barkay et al., 2005).
En las zonas superficiales de los ecosistemas acuáticos, los procesos físicos
(evaporación) y fotoquímicos (fotoreducción) compiten por el transporte particular del Hg
determinando la re-emisión del mismo hacia la atmósfera o bien el secuestro del Hg en los
sedimentos. El Hg presente en la columna de agua, puede sufrir diferentes transformaciones
molecuares, pasar de la fase particular a la fase acuosa o inversamente, redistribuirse entre las
diferentes fases particulares (materia orgánica, oxihidróxidos), o ser directamente asimilado
por los organismos acuáticos.
En los sedimentos superficiales, una zona sub-óxica y de potencial de óxido-reducción
reducido, el Hg es sometido a múltiples transformaciones debido a que en esta zona se
encuentran las gradientes químicas y biológicas más importantes. El Hg puede entonces ser
metilado, demetilado o reducido, desempeñando un rol importante la presencia y actividad
bacteriana sulfatoreductora.
1.8.1 Transformación y especiación del Hg en el medio ambiente
En los sistemas acuáticos las diferentes formas mercuriales pueden sufrir diferentes
transformaciones naturales asi como intercambios entre los compartimientos. Se tienen
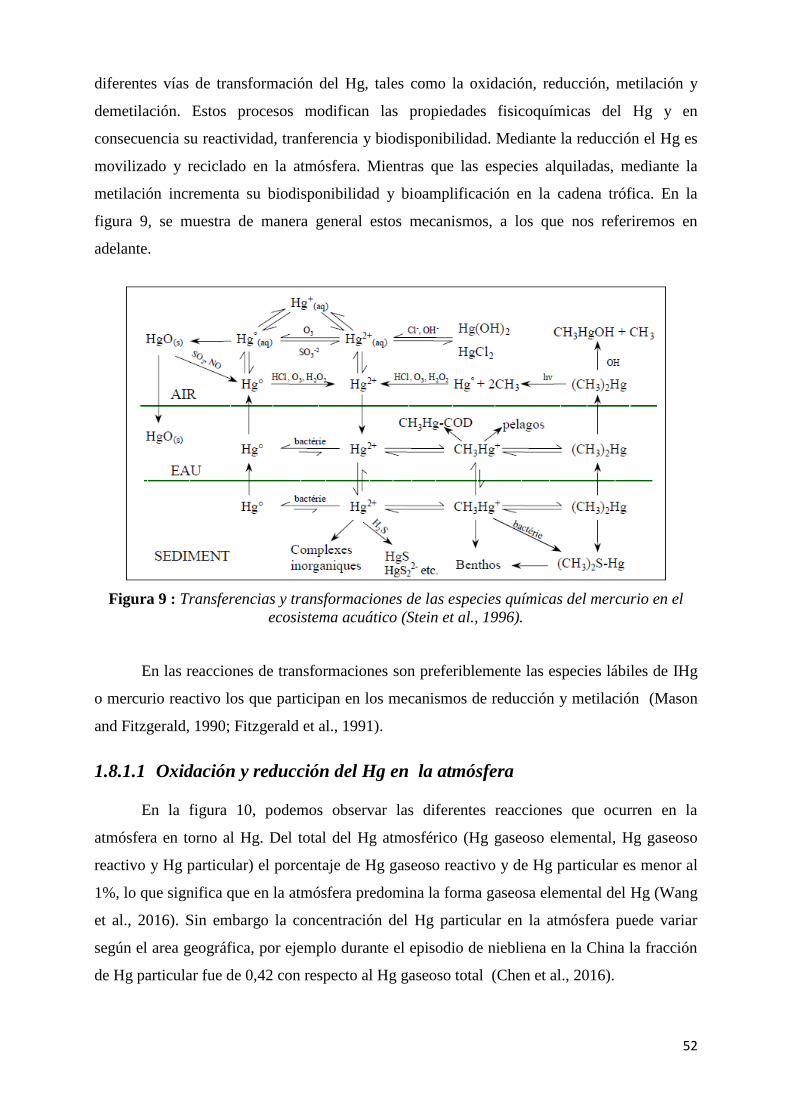
52
diferentes vías de transformación del Hg, tales como la oxidación, reducción, metilación y
demetilación. Estos procesos modifican las propiedades fisicoquímicas del Hg y en
consecuencia su reactividad, tranferencia y biodisponibilidad. Mediante la reducción el Hg es
movilizado y reciclado en la atmósfera. Mientras que las especies alquiladas, mediante la
metilación incrementa su biodisponibilidad y bioamplificación en la cadena trófica. En la
figura 9, se muestra de manera general estos mecanismos, a los que nos referiremos en
adelante.
Figura 9 : Transferencias y transformaciones de las especies químicas del mercurio en el
ecosistema acuático (Stein et al., 1996).
En las reacciones de transformaciones son preferiblemente las especies lábiles de IHg
o mercurio reactivo los que participan en los mecanismos de reducción y metilación (Mason
and Fitzgerald, 1990; Fitzgerald et al., 1991).
1.8.1.1 Oxidación y reducción del Hg en la atmósfera
En la figura 10, podemos observar las diferentes reacciones que ocurren en la
atmósfera en torno al Hg. Del total del Hg atmosférico (Hg gaseoso elemental, Hg gaseoso
reactivo y Hg particular) el porcentaje de Hg gaseoso reactivo y de Hg particular es menor al
1%, lo que significa que en la atmósfera predomina la forma gaseosa elemental del Hg (Wang
et al., 2016). Sin embargo la concentración del Hg particular en la atmósfera puede variar
según el area geográfica, por ejemplo durante el episodio de niebliena en la China la fracción
de Hg particular fue de 0,42 con respecto al Hg gaseoso total (Chen et al., 2016).
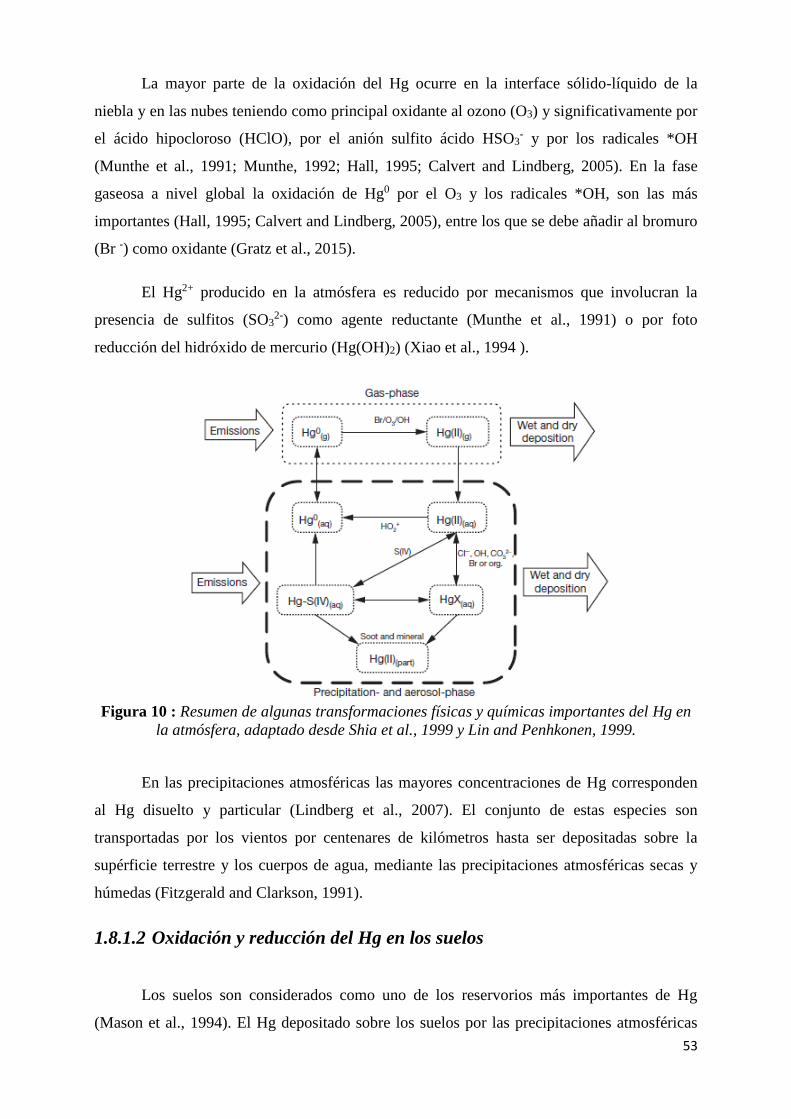
53
La mayor parte de la oxidación del Hg ocurre en la interface sólido-líquido de la
niebla y en las nubes teniendo como principal oxidante al ozono (O3) y significativamente por
el ácido hipocloroso (HClO), por el anión sulfito ácido HSO3- y por los radicales *OH
(Munthe et al., 1991; Munthe, 1992; Hall, 1995; Calvert and Lindberg, 2005). En la fase
gaseosa a nivel global la oxidación de Hg0 por el O3 y los radicales *OH, son las más
importantes (Hall, 1995; Calvert and Lindberg, 2005), entre los que se debe añadir al bromuro
(Br -) como oxidante (Gratz et al., 2015).
El Hg2+ producido en la atmósfera es reducido por mecanismos que involucran la
presencia de sulfitos (SO32-) como agente reductante (Munthe et al., 1991) o por foto
reducción del hidróxido de mercurio (Hg(OH)2) (Xiao et al., 1994 ).
Figura 10 : Resumen de algunas transformaciones físicas y químicas importantes del Hg en
la atmósfera, adaptado desde Shia et al., 1999 y Lin and Penhkonen, 1999.
En las precipitaciones atmosféricas las mayores concentraciones de Hg corresponden
al Hg disuelto y particular (Lindberg et al., 2007). El conjunto de estas especies son
transportadas por los vientos por centenares de kilómetros hasta ser depositadas sobre la
supérficie terrestre y los cuerpos de agua, mediante las precipitaciones atmosféricas secas y
húmedas (Fitzgerald and Clarkson, 1991).
1.8.1.2 Oxidación y reducción del Hg en los suelos
Los suelos son considerados como uno de los reservorios más importantes de Hg
(Mason et al., 1994). El Hg depositado sobre los suelos por las precipitaciones atmosféricas
54
secas y húmedas, se encuentra en forma de Hg0 y Hg2+, de las cuales la segunda forma
mercurial es la predominante (Lindberg et al., 2007; Schmeltz et al., 2011). Mientras que el
Hg de origen geogénico está presente en los suelos en forma de Hg+2, Hg+1 y Hg0, los cuales
son liberados desde depósitos minerales y/o rocas por oxidación o meteorización
(solubilización) reciente; al que se agrega el Hg originado desde fuentes geotérmicas
(Jonasson and Boyle, 1972; Tunell, 1978 ).
Los parámetros fisicoquímicos del suelo como el pH, la capacidad de intercambio
catiónico, el tamaño de las partículas, el contenido de materia orgánica, las arcillas minerales,
juegan un rol muy importante en la variación del estado de oxidación y tipo de interacción del
Hg con los componentes del suelo (Roulet and Lucotte, 1995; Zhang et al., 2013; Windmöller
et al., 2015), y por lo tanto con su movilidad y su biodisponibilidad.
En los suelos las diferentes formas mercuriales experimentan transformaciones
químicas, físicas y microbiológicas, oxidaciones y/o reducciones, que dan lugar a compuestos
estables, los cuales se re-distribuyen o adsorben de acuerdo a la afinidad de los componentes
del suelo. El Hg2+ es fuertemente adsorbido a compuestos húmicos (Guifen et al., 2004;
Zhang et al., 2013) y/o puede ser firmemente adsorbido por los minerales de los suelos
(arcillas y oxihidroxidos) (Roulet and Lucotte, 1995), los que relativamente son menos
biodisponibles para los procesos abióticos y bióticos (Schlüter, 2000). En solución acuosa de
los suelos y en presencia de ligandos, el Hg iónico tiene una fuerte tendencia a formar
complejos con Cl-, OH-, S2- y con ligandos orgánicos cuyos grupos funcionales contienen
sulfuros S2- (Schuster, 1991).
Diferentes factores intervienen y favorecen la oxidación del Hg en los suelos, entre
ellos la presencia de microorganismos y materia orgánica (Windmöller et al., 2015). Mientras
que la presencia de bacterias Fe reductoras modifican la distribución del Hg en los suelos
(Harris-Hellal et al., 2011).
La movilidad del Hg en los suelos, se incrementa si el Hg se encuentra en forma de
HgC12 y Hg(OH)2 debido a la elevada solubilidad de estos compuestos; mientras que el Hg2+
hidrolizado puede adsoberse a coloides minerales. La alta afinidad de Hg2+ por S-2 explica la
fuerte unión entre el Hg y la materia orgánica asi como también la estabilidad de HgS
(Schuster, 1991). La remoción de Hg2+ desde la solución donde se encuentra formando fuertes
complejos orgánicos del suelo, hace que el Hg0 vaya a ser re-oxidado y el Hg1+, poco estable
bajo condiciones ambientales, dismute en Hg2+ y Hg0 (Schuster, 1991).
55
La emisión de Hg desde los suelos superficiales está controlada principalmente por la
temperatura, la exposición a la radiación UV-B, UV-A y el contenido de agua; siendo
mayores las emisiones de Hg en los suelos húmedos expuestos a radiación UV-B e
incrementos de tempertura que en los suelos secos (Park et al., 2014).
1.8.1.3 Oxidación y reducción del Hg en las aguas
En las zonas superficiales de los cuerpos de aguas, los procesos físicos (evaporación) y
fotoquímicos (fotoreducción) entran en competencia respecto al transporte particular, para
determinar si el Hg va a ser re-emitido hacia la atmósfera o bien ser secuestrado en los
sedimentos. Una vez que pasan hacia la columna de agua pueden experimentar múltiples
transformaciones desde ser disueltos por la fase acuosa o viceversa, o redistribuirse en las
diferentes fases particulares (material orgánico, oxihidróxidos).
1.8.1.3.1 Oxidación en las aguas
En los medios acuáticos la reacción de oxidación del Hg0, es posible bajo condiciones
de oscuridad, los cuales son mejorados cuando son elevadas las concentraciones de cloruros
(Cl-1), así como por la presencia de partículas, coloides (Amyot et al., 1997) y la presencia de
carbono orgánico disuelto (DOC) (Vaughan and Blough, 1998). Las vías indirectas de la
oxidación implica la producción de radicales *OH, que parece ser el oxidante principal del
Hg0 en las aguas naturales (Gårdfeldt et al., 2001). Mientras que la actividad oxidante
microbiológica parece inducir a la producción fotoquímica de peróxido de hidrógeno (H2O2)
(Siciliano et al., 2002). Los cloruros y bromuros incrementan potencialmente la oxidación del
Hg0 por la formación de oxidantes secundarios o de complejos estables con IHg. La
fotooxidación directa o indirecta es otra de las posibilidades de oxidación del Hg0 (Lalonde et
al., 2001).
1.8.1.3.2 Reducción en las aguas
Existe la probabilidad de que la volatilización del Hg en las aguas se dé durante los
procesos de: demetilación, reducción bacteriana en el agua o en el sedimento, reducción de
Hg1+ y Hg2+ por los ácidos húmicos y fúlvicos, reducción fisiológica por el fitoplancton como
medio de desintoxicación, y reducción fotoquímica de Hg2+ a Hg0. La concentración de Hg0,
en los medios acuosos está determinada por los procesos bióticos (actividad bacteriana) y
principalmente por los procesos abióticos de reducción del Hg lábil (fotoquímicos) (Amyot et
al., 1994; Costa and Liss, 1999). Esto ha sido comprobado midiendo las tasas de Hg0
56
producidos en ambos procesos. Las tasas de Hg0 producidas durante los procesos de
demetilación biológica fueron muy bajas (Mason and Fitzgerald, 1993; Amyot et al., 1994)
con respecto a los producidos por reacciones de fotoreducción (Amyot et al., 1994; Costa and
Liss, 1999).
Diferentes estudios experimentales demostraron que la luz y los contenidos de ácidos
húmicos y fúlvicos promueven la reacción de fotoredución del Hg (Costa and Liss, 1999).
Esto ocurre debido a que los ácidos húmicos tienen la capacidad de reducir metales de
transición en las aguas naturales (Alberts et al., 1974; Skogerboe and Wilson, 1981), debido a
su capacidad de absorber la luz y transferir esta energía absorbida a un receptor de electrones
adecuado (Nriagu, 1994b).
De la misma forma en medio ambientes naturales el Hg2+ puede ser reducido a Hg0 por
la radiación solar en presencia de materia orgánica disuelta (Amyot et al., 1997; O'Driscoll et
al., 2004), reacciones que dependen de la concentración, las propiedades y características de
la materia orgánica (Amyot et al., 1997; O'Driscoll et al., 2003; He et al., 2012).
El proceso de reducción del IHg es muy importante debido a que permite reducir la
cantidad de IHg en las aguas marinas (Mason and Fitzgerald, 1993) o lacustres y por lo tanto
limita la metilación del Hg (Fitzgerald et al., 1991; Amyot et al., 2000), o la acomplejación
del IHg con otros ligandos.
1.8.1.3.3 Reducción biótica en las aguas
En las capas eufóticas la producción de Hg0 en diferentes tipos de aguas (lacustres,
costeras contaminadas y no contaminadas y salobres) bajo condiciones de oscuridad, está
relacionada con la actividad biológica (Fantozzi et al., 2009). Los microoganismos resistentes
al Hg (expresada en la enzima reductasa de Hg), tienen un alto potencial para afectar la
producción de Hg elemental gaseoso cuando y donde la luz del día es limitada (Barkay et al.,
2011).
Los procesos de reducción bióticos del Hg también están vinculados con las bacterias
aerobias Gram-negativas y Gram-positivas operon mer (bacterias resistentes al Hg), en
diversos ambientes naturales del mundo (Osborn et al., 1997). En estas bacterias las
determinates RTPCDAB de los genes se encuentran a menudo en los plásmidos (pequeñas
moléculas de ADN presentes en las bacterias), en los transposones (fragmentos de ADN que
puede pasar de un cromosoma a otro) o en los cromosomas de las bacterias (Reaney, 1981;
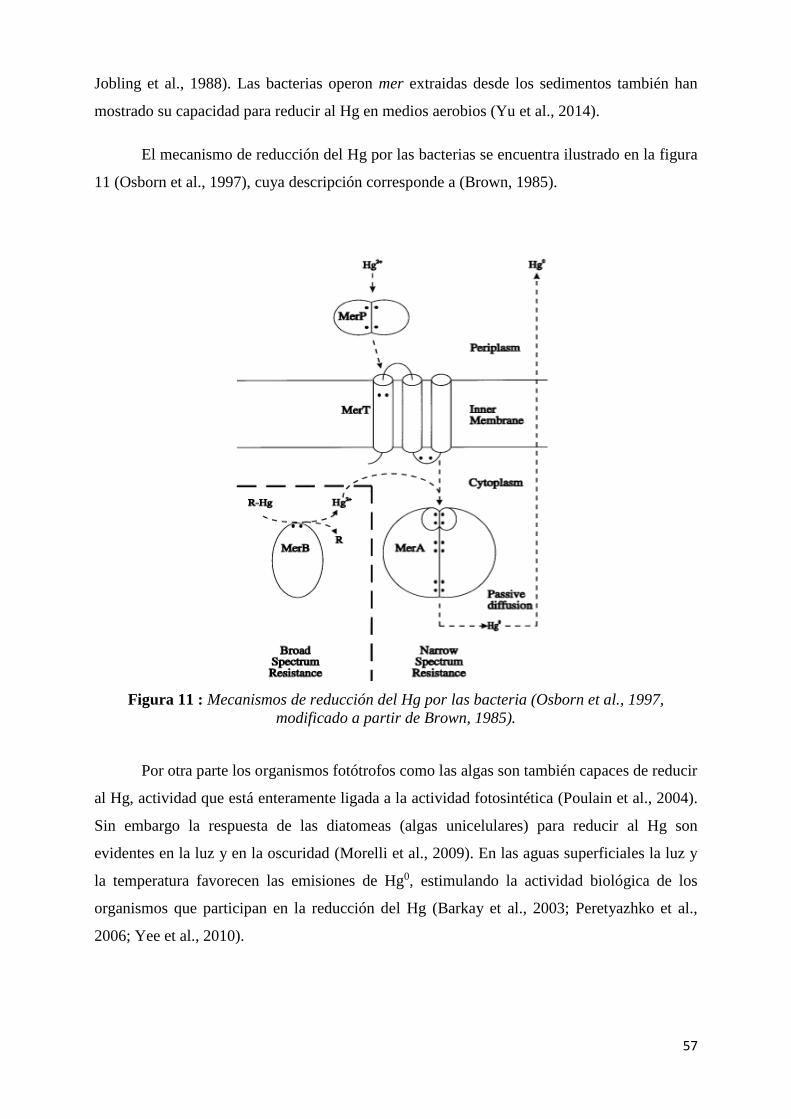
57
Jobling et al., 1988). Las bacterias operon mer extraidas desde los sedimentos también han
mostrado su capacidad para reducir al Hg en medios aerobios (Yu et al., 2014).
El mecanismo de reducción del Hg por las bacterias se encuentra ilustrado en la figura
11 (Osborn et al., 1997), cuya descripción corresponde a (Brown, 1985).
Figura 11 : Mecanismos de reducción del Hg por las bacteria (Osborn et al., 1997,
modificado a partir de Brown, 1985).
Por otra parte los organismos fotótrofos como las algas son también capaces de reducir
al Hg, actividad que está enteramente ligada a la actividad fotosintética (Poulain et al., 2004).
Sin embargo la respuesta de las diatomeas (algas unicelulares) para reducir al Hg son
evidentes en la luz y en la oscuridad (Morelli et al., 2009). En las aguas superficiales la luz y
la temperatura favorecen las emisiones de Hg0, estimulando la actividad biológica de los
organismos que participan en la reducción del Hg (Barkay et al., 2003; Peretyazhko et al.,
2006; Yee et al., 2010).
58
1.8.1.3.4 Reducción abiótica en las aguas
En los procesos abióticos, en las capas superiores de los cuerpos de aguas la reducción
del Hg se dá directamente mediante reacciones fotoquímicas (Lanzillotta et al., 2002;
O'Driscoll et al., 2006; Fantozzi et al., 2007). Las concentraciones de Hg0 en forma disuelta se
incrementan durante el día (Amyot et al., 1997; Dill et al., 2006; Alanoca et al., 2016), en
función de la intensidad de la luz solar, observándose una correlación lineal entre la
intensidad de la luz y la producción de Hg gaseoso en los lagos de agua dulce (Amyot et al.,
1997). También se ha observado una influencia de la radiación UV en las reacciones de
reducción (Lalonde et al., 2001; Lalonde et al., 2004; Dill et al., 2006; Black et al., 2012).
La concentración de carbono orgánico disuelto (DOC) es uno de los factores limitantes
para la producción de Hg gaseoso, en aguas con bajos contenidos de ácido húmico y bajo la
incidencia de la radiación UVB, la producción de Hg gaseoso es elevada; así como también
bajo la incidencia de la radiación UVA en aguas con alto contenido de ácido húmico (Garcia
et al., 2005). Lo que permite deducir que el Hg gaseoso suele ser producido indirectamente
por reacciones secundarias con carbono orgánico disuelto (DOC) o hierro (Fe) (Zhang and
Lindberg, 2001; Lalonde et al., 2004; Lanzillotta et al., 2004; Garcia et al., 2005; O'Driscoll et
al., 2006). En estas reacciones el fitoplancton y las bacterias también participan (Mason et al.,
1995a; Baeyens and Leermakers, 1998; Siciliano et al., 2002) (Baeyens and Leermakers,
1998; Mason et al., 1995; Siciliano et al., 2002) aunque su importancia sea menor (Poulain et
al., 2004; Rolfhus and Fitzgerald, 2004).
Los procesos de reducción del IHg, con una gran producción de Hg0, es considerado
como la fuente principal de Hg elemental en las aguas marinas (Mason and Fitzgerald, 1993)
y lacustres (Fitzgerald et al., 1991; Amyot et al., 2000). Estos procesos reducen la
biodisponibilidad del IHg para su metilación en los ecosistemas acuáticos.
1.8.1.4 Oxidación y reducción en los sedimentos
Diversos componentes constituyen la compleja matrix de los sedimentos, entre ellos
los compuestos orgánicos e inorgánicos detríticos, como producto de las reacciones derivadas
de la diagénesis y óxidos de Fe y Mn (Davis and Kent, 1990).
En los sedimentos la abundancia de la forma reducida u oxidada del Hg, está
controlada por las transformaciones redox mediadas por procesos bióticos y abióticos así
59
como por las reacciones con sustancias húmicas o ferrosas (Allard and Arsenie, 1991; Charlet
et al., 2002; Barkay et al., 2003; Wiatrowski et al., 2006; Gu et al., 2011; Zheng et al., 2012).
En los sedimentos y aguas, la forma oxidada del mercurio (Hg2+) puede ser reducida a
Hg0 en condiciones anaerobias a bajas concentraciones de materia orgánica disuelta (DOM)
(e.g. ácido húmico), a medida que aumenta la concentración de materia orgánica la
producción de Hg0 es inhibida por la formación de complejos de Hg (Gu et al., 2011).
Diferentes estudios han demostrado que las bacterias operon mer catalizan la
reducción del Hg2+, pricipalmente bajo condiciones óxicas (Barkay et al., 2010); sin embargo
también es posible, aunque en baja medida, en ambientes anóxicos (Schaefer et al., 2002).
Otros estudios han mostrado que las bacterias anaerobias también pueden reducir al Hg vía
patrones no específicos (Wiatrowski et al., 2006).
1.9 Metilación y demetilación
1.9.1 Metilación en la atmósfera
Se sabe que una proporción menor al 5% del total de Hg atmosférico se encuentra en
forma metilada, la concentración de MMHg en las deposiciones húmedas son < a 0,05 pM y
pueden alcanzar hasta 1 pM (Hammerschmidt et al., 2007). Otros autores indican que la
concentración de MMHg varía de 3 a 10% (Poissant et al., 2008; Marusczak et al., 2011c;
Huang et al., 2013). El MMHg en la atmósfera puede ser originada por la oxidación del
dimetilmercurio (DMHg) (Brosset and Lord, 1995), por la metilación de Hg2+ o la
descompocisión de DMHg en dos moléculas de MMHg+ (Hammerschmidt et al., 2007). Esta
reación tiene lugar en la fase acuosa atmosférica donde probablemente el Hg forme complejos
con los acetatos (acetato-Hg) (Gårdfeldt et al., 2003) inducida por la acción de la radiación
UV en presencia de ácido acético. Sin embargo las metilaciones de Hg más importantes
ocurren en los ecosistemas acuáticos.
1.9.2 Metilación en los ecosistemas acuáticos
La metilación del Hg en la fase acuosa es llevada a cabo por procesos naturales
abióticos y bióticos, predominando el último proceso. Los sedimentos, la columna de agua y
el perifiton son compartimientos en los que se presentan una actividad importante de
metilación (Achá et al., 2005; Monperrus et al., 2007a; Monperrus et al., 2007b; Hamelin et
al., 2011). El interior de las zonas de transición red-ox de las aguas y sedimentos, han sido
identificados como sitios privilegiados para la producción de MMHg donde los procesos de
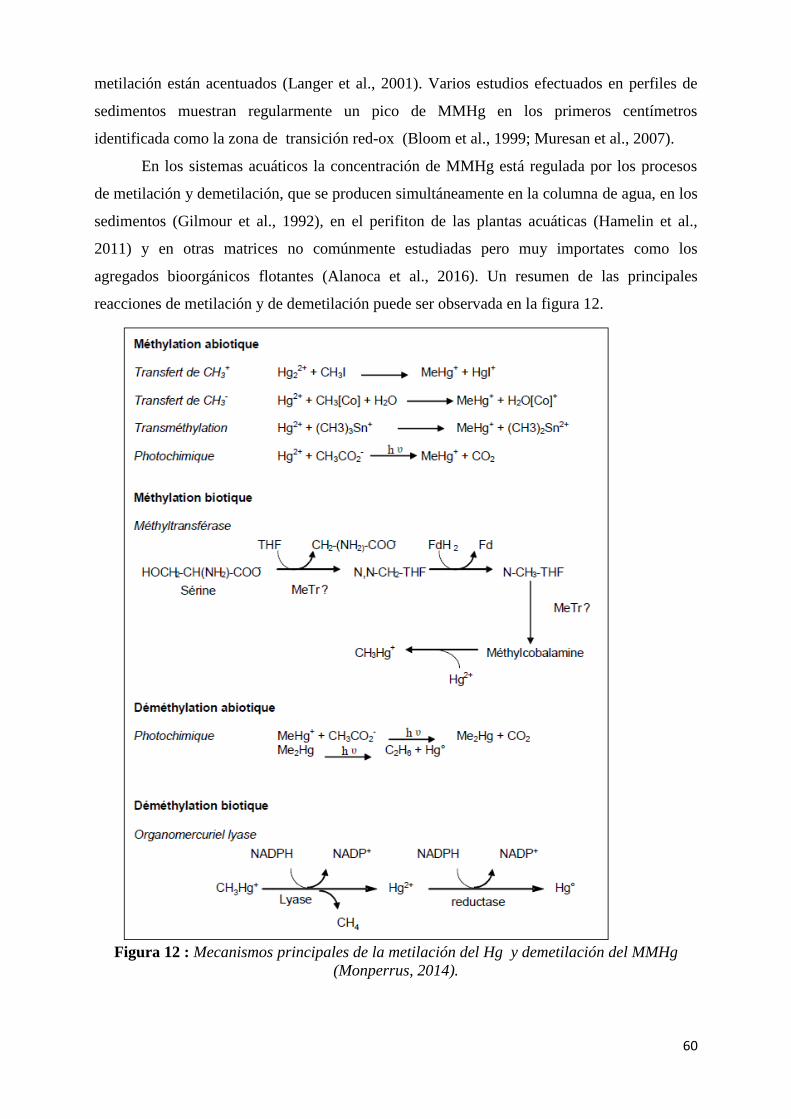
60
metilación están acentuados (Langer et al., 2001). Varios estudios efectuados en perfiles de
sedimentos muestran regularmente un pico de MMHg en los primeros centímetros
identificada como la zona de transición red-ox (Bloom et al., 1999; Muresan et al., 2007).
En los sistemas acuáticos la concentración de MMHg está regulada por los procesos
de metilación y demetilación, que se producen simultáneamente en la columna de agua, en los
sedimentos (Gilmour et al., 1992), en el perifiton de las plantas acuáticas (Hamelin et al.,
2011) y en otras matrices no comúnmente estudiadas pero muy importates como los
agregados bioorgánicos flotantes (Alanoca et al., 2016). Un resumen de las principales
reacciones de metilación y de demetilación puede ser observada en la figura 12.
Figura 12 : Mecanismos principales de la metilación del Hg y demetilación del MMHg
(Monperrus, 2014).
61
1.10 Aspectos generales de la formación de MMHg y
DMHg
Los procesos de metilación del Hg son afectados por numerosos factores
medioambientales como el pH, temperatura, condiciones red-ox, salinidad, concentración de
materia orgánica y de la especie de Hg inorgánico disponible (Ullrich et al., 2001).
El monometilmercurio (MMHg) y el dimetilmercurio (DMHg) son dos formas
organomercuriales muy tóxicas, producto de las diversas reacciones naturales abióticas y
bióticas entre el IHg y los grupo metilo (CH3). Los procesos bióticos involucran la
participación de las bacterias sulfato-reductoras, microorganismos considerados como las
principales metiladoras de Hg (Compeau and Bartha, 1985; Hamelin et al., 2011). Mientras
que el mecanismo de la formación del DMHg es incierto; según algunas investigaciones el
DMHg podría ser formado por la metilación del MMHg, sin embargo esto no es una
evidencia concluyente (Hintelmann, 2010). Se conoce un solo proceso de naturaleza química
y se dá en presencia de altas concentraciones de sulfuro. El MMHg puede reaccionar con el
sulfuro y formar un complejo sulfuro-metilmercúrico, que dismuta en cinabrio y DMHg
(Sanchez Uria and Sanz-Medel, 1998).
La afinidad que tiene el MMHg por los grupos sulfidrilos de la cisteína contenida en
las proteínas (Pedrero Zayas et al., 2014), le ha permitido biomagnificarse a lo largo de la
cadena trófica de los ecosistemas acuáticos, donde se encuentra dirigido y controlado por
ligandos con los cuales se encuentra acomplejado. El MMHg es fácilmente fotodegradable
pero relativamente estable, salvo frente a reactivos fuertemente oxidantes; mientras que el
DMHg no permanece en forma disuelta por mucho tiempo en los cuerpos de agua por su alta
presión de vapor (8,3*103 Pa) (Hintelmann, 2010).
En los ambientes marinos los procesos de demetilación del DMHg y MMHg están
mediados biológicamente. Las constantes de las velocidades de descomposición del DMHg y
el MMHg (0,98 y 0,35) respectivamente, indican que la degradación del DMHg es más rápida
que la de MMHg, por lo que el DMHg puede ser una fuente de MMHg. La concentración neta
de MMHg, no solo está controlada por la metilación del Hg2+ sino que también por el proceso
de descomposición del DMHg (Baya, 2015).
La concentración del HgT medido en los ecosistemas acuáticos no es un buen
indicador de los niveles de MMHg. La presencia y abundancia de los iones que compiten con
62
los agentes de metilación y la biodisponibilidad del metal, influyen significativamente en la
especiación del Hg (Chen et al., 2008). Por otra parte los procesos de reducción del Hg
limitan la cantidad de IHg en los compartimientos acuáticos así como su metilación
(Fitzgerald et al., 1991).
El MMHg en el ecosistema acuático se encuentra acomplejado a ligandos mediante
enlaces covalentes coordinados; por lo que puede formar un amplio rango de complejos. A
nivel de estructura molecular las formaciones de estos complejos se dan mediante reacciones
ácido-base de Lewis, en el que el CH3Hg+ (un ácido) acepta un par de electrones
proporcionado por un ligando (una base). Las reaciones se dan en una proporción de 1:1, es
decir el CH3Hg+ solo puede acomplejarse con un solo ligando a la vez (Hintelmann, 2010).
Por su gran afinidad por los ligandos que contienen sulfuros, en los cuerpos de agua el
MMHg se encuentra ligado a sulfuros de la materia orgánica disuelta (DOM), o a las cisteínas
de las proteínas en la biota. Otros ligandos importantes son los halógenos, hidróxidos, aminas
y grupos funcionales que contienen oxígeno.
1.10.1 Metilación abiótica
Sea en los sedimentos o la columna de agua varios mecanismos de metilación abiótica
son inducidas por reacciones químicas y fotoquímicas (Weber, 1993). Para que la metilación
de Hg tenga lugar, el medio natural debe contener moléculas donadoras de grupos metilo.
Experimentos de laboratorio han identificado tres reacciones químicas de metilación
del Hg: la metilación por metilcobalamina (MeCo), la transmetilación que involucra otros
metales metilados y la metilación oxidativa. La reacción por MeCo fue observada en las aguas
dulces (Celo et al., 2006), mientras que la transmetilación por compuestos organoestánicos
tiene lugar en medios marinos. Como veremos más adelante la transferencia del carbanión
metilado (CH3-) parece ser el proceso principal para la metilación del Hg ya que el Hg2+ tiene
una característica muy electrofílica.
En la primera reacción la MeCo (un derivado de la vitamina B12), liberada por una
bacteria, transfiere un carbanión metilado (CH3-) al Hg2+ por medio de una reacción de ataque
nucleofílico o electrofílico en ausencia de enzimas (Bertilsson and Neujahr, 1971; Imura et
al., 1971; Celo et al., 2006; Chen et al., 2007). Esta reacción también puede producir DMHg
(Wood et al., 1968; Filippelli and Baldi, 1993; Rosenkranz et al., 1997). Otros investigadores
demostraron que este mecanismo puede llevarse a cabo en presencia de bacterias sulfato-
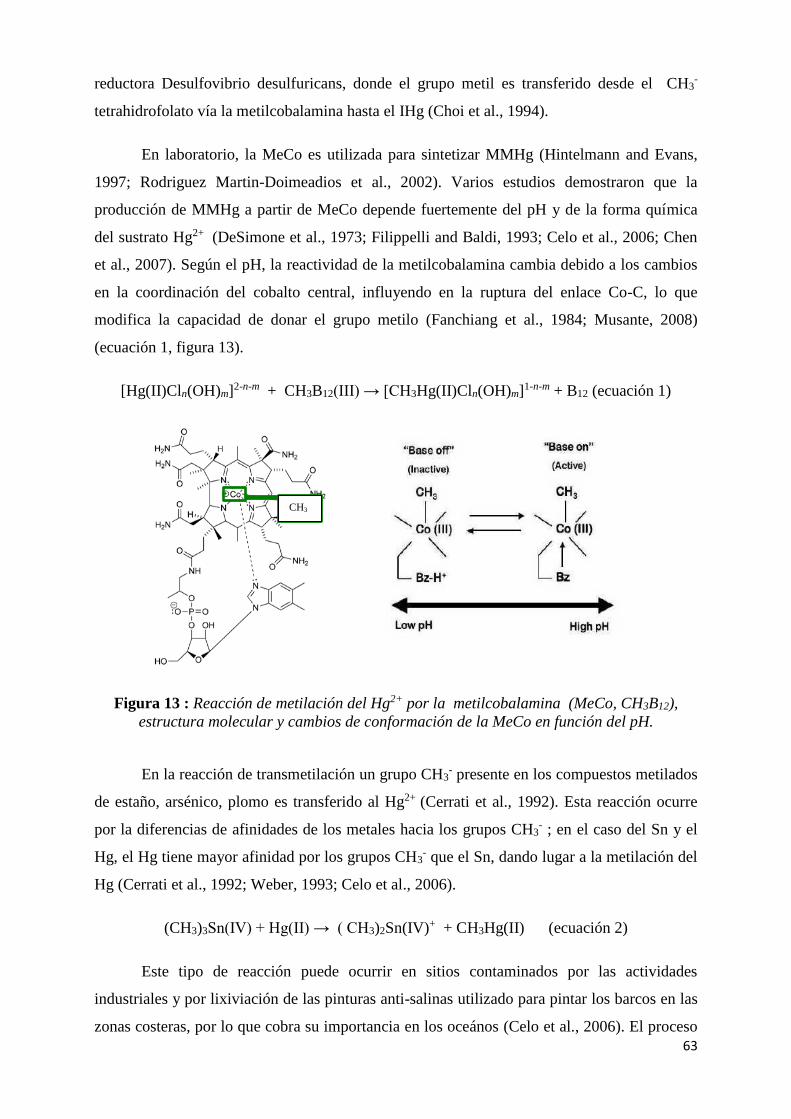
63
reductora Desulfovibrio desulfuricans, donde el grupo metil es transferido desde el CH3-
tetrahidrofolato vía la metilcobalamina hasta el IHg (Choi et al., 1994).
En laboratorio, la MeCo es utilizada para sintetizar MMHg (Hintelmann and Evans,
1997; Rodriguez Martin-Doimeadios et al., 2002). Varios estudios demostraron que la
producción de MMHg a partir de MeCo depende fuertemente del pH y de la forma química
del sustrato Hg2+ (DeSimone et al., 1973; Filippelli and Baldi, 1993; Celo et al., 2006; Chen
et al., 2007). Según el pH, la reactividad de la metilcobalamina cambia debido a los cambios
en la coordinación del cobalto central, influyendo en la ruptura del enlace Co-C, lo que
modifica la capacidad de donar el grupo metilo (Fanchiang et al., 1984; Musante, 2008)
(ecuación 1, figura 13).
[Hg(II)Cln(OH)m]2-n-m + CH3B12(III) → [CH3Hg(II)Cln(OH)m]1-n-m + B12 (ecuación 1)
Figura 13 : Reacción de metilación del Hg2+ por la metilcobalamina (MeCo, CH3B12),
estructura molecular y cambios de conformación de la MeCo en función del pH.
En la reacción de transmetilación un grupo CH3- presente en los compuestos metilados
de estaño, arsénico, plomo es transferido al Hg2+ (Cerrati et al., 1992). Esta reacción ocurre
por la diferencias de afinidades de los metales hacia los grupos CH3- ; en el caso del Sn y el
Hg, el Hg tiene mayor afinidad por los grupos CH3- que el Sn, dando lugar a la metilación del
Hg (Cerrati et al., 1992; Weber, 1993; Celo et al., 2006).
(CH3)3Sn(IV) + Hg(II) → ( CH3)2Sn(IV)+ + CH3Hg(II) (ecuación 2)
Este tipo de reacción puede ocurrir en sitios contaminados por las actividades
industriales y por lixiviación de las pinturas anti-salinas utilizado para pintar los barcos en las
zonas costeras, por lo que cobra su importancia en los oceános (Celo et al., 2006). El proceso
CH3
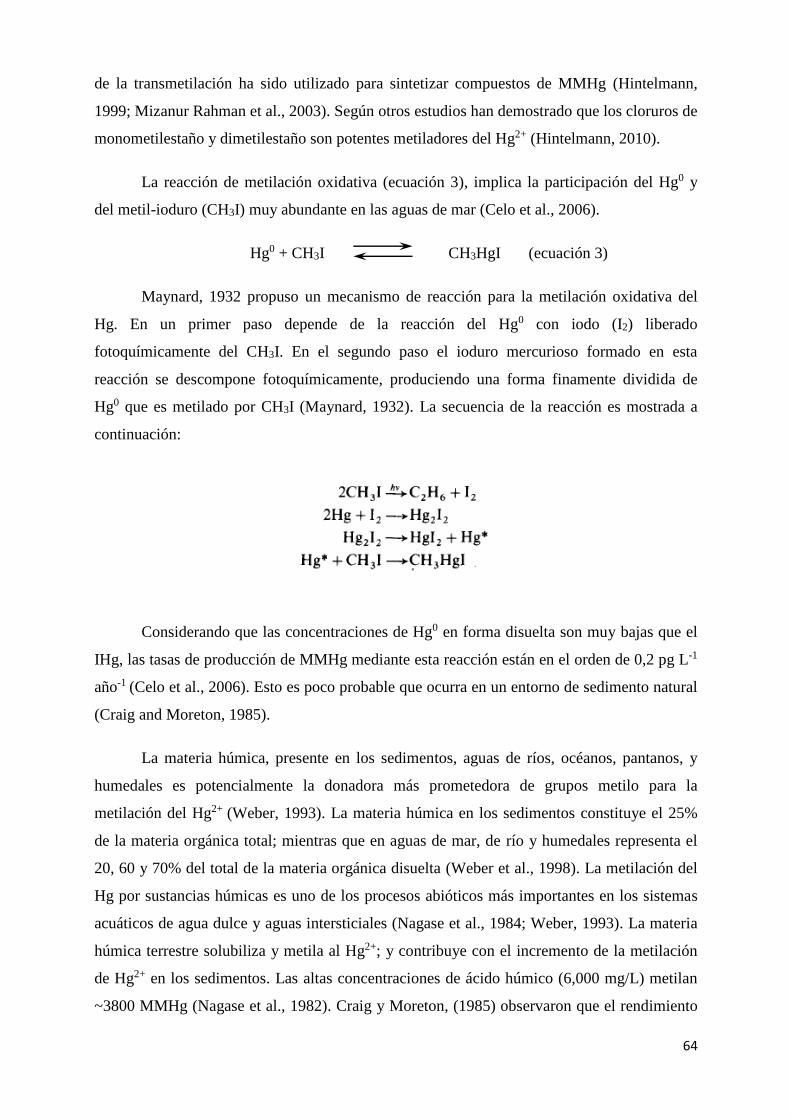
64
de la transmetilación ha sido utilizado para sintetizar compuestos de MMHg (Hintelmann,
1999; Mizanur Rahman et al., 2003). Según otros estudios han demostrado que los cloruros de
monometilestaño y dimetilestaño son potentes metiladores del Hg2+ (Hintelmann, 2010).
La reacción de metilación oxidativa (ecuación 3), implica la participación del Hg0 y
del metil-ioduro (CH3I) muy abundante en las aguas de mar (Celo et al., 2006).
Hg0 + CH3I CH3HgI (ecuación 3)
Maynard, 1932 propuso un mecanismo de reacción para la metilación oxidativa del
Hg. En un primer paso depende de la reacción del Hg0 con iodo (I2) liberado
fotoquímicamente del CH3I. En el segundo paso el ioduro mercurioso formado en esta
reacción se descompone fotoquímicamente, produciendo una forma finamente dividida de
Hg0 que es metilado por CH3I (Maynard, 1932). La secuencia de la reacción es mostrada a
continuación:
Considerando que las concentraciones de Hg0 en forma disuelta son muy bajas que el
IHg, las tasas de producción de MMHg mediante esta reacción están en el orden de 0,2 pg L-1
año-1 (Celo et al., 2006). Esto es poco probable que ocurra en un entorno de sedimento natural
(Craig and Moreton, 1985).
La materia húmica, presente en los sedimentos, aguas de ríos, océanos, pantanos, y
humedales es potencialmente la donadora más prometedora de grupos metilo para la
metilación del Hg2+ (Weber, 1993). La materia húmica en los sedimentos constituye el 25%
de la materia orgánica total; mientras que en aguas de mar, de río y humedales representa el
20, 60 y 70% del total de la materia orgánica disuelta (Weber et al., 1998). La metilación del
Hg por sustancias húmicas es uno de los procesos abióticos más importantes en los sistemas
acuáticos de agua dulce y aguas intersticiales (Nagase et al., 1984; Weber, 1993). La materia
húmica terrestre solubiliza y metila al Hg2+; y contribuye con el incremento de la metilación
de Hg2+ en los sedimentos. Las altas concentraciones de ácido húmico (6,000 mg/L) metilan
~3800 MMHg (Nagase et al., 1982). Craig y Moreton, (1985) observaron que el rendimiento
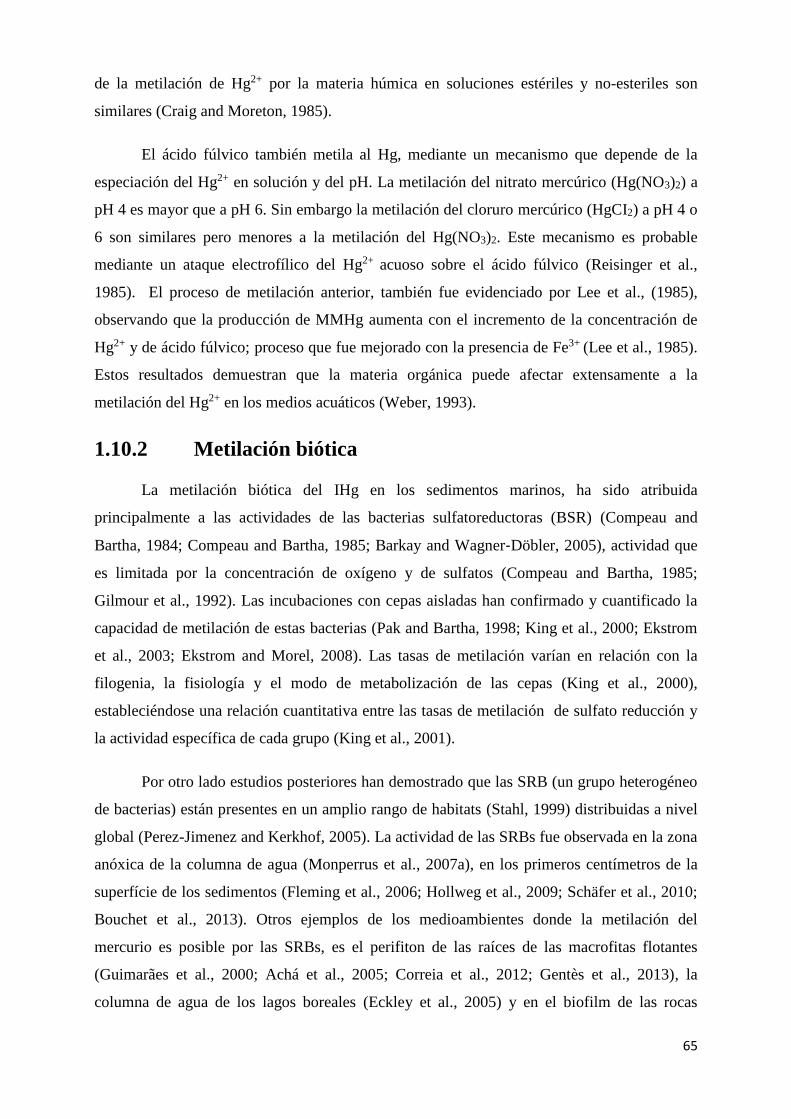
65
de la metilación de Hg2+ por la materia húmica en soluciones estériles y no-esteriles son
similares (Craig and Moreton, 1985).
El ácido fúlvico también metila al Hg, mediante un mecanismo que depende de la
especiación del Hg2+ en solución y del pH. La metilación del nitrato mercúrico (Hg(NO3)2) a
pH 4 es mayor que a pH 6. Sin embargo la metilación del cloruro mercúrico (HgCI2) a pH 4 o
6 son similares pero menores a la metilación del Hg(NO3)2. Este mecanismo es probable
mediante un ataque electrofílico del Hg2+ acuoso sobre el ácido fúlvico (Reisinger et al.,
1985). El proceso de metilación anterior, también fue evidenciado por Lee et al., (1985),
observando que la producción de MMHg aumenta con el incremento de la concentración de
Hg2+ y de ácido fúlvico; proceso que fue mejorado con la presencia de Fe3+ (Lee et al., 1985).
Estos resultados demuestran que la materia orgánica puede afectar extensamente a la
metilación del Hg2+ en los medios acuáticos (Weber, 1993).
1.10.2 Metilación biótica
La metilación biótica del IHg en los sedimentos marinos, ha sido atribuida
principalmente a las actividades de las bacterias sulfatoreductoras (BSR) (Compeau and
Bartha, 1984; Compeau and Bartha, 1985; Barkay and Wagner‐Döbler, 2005), actividad que
es limitada por la concentración de oxígeno y de sulfatos (Compeau and Bartha, 1985;
Gilmour et al., 1992). Las incubaciones con cepas aisladas han confirmado y cuantificado la
capacidad de metilación de estas bacterias (Pak and Bartha, 1998; King et al., 2000; Ekstrom
et al., 2003; Ekstrom and Morel, 2008). Las tasas de metilación varían en relación con la
filogenia, la fisiología y el modo de metabolización de las cepas (King et al., 2000),
estableciéndose una relación cuantitativa entre las tasas de metilación de sulfato reducción y
la actividad específica de cada grupo (King et al., 2001).
Por otro lado estudios posteriores han demostrado que las SRB (un grupo heterogéneo
de bacterias) están presentes en un amplio rango de habitats (Stahl, 1999) distribuidas a nivel
global (Perez-Jimenez and Kerkhof, 2005). La actividad de las SRBs fue observada en la zona
anóxica de la columna de agua (Monperrus et al., 2007a), en los primeros centímetros de la
superfície de los sedimentos (Fleming et al., 2006; Hollweg et al., 2009; Schäfer et al., 2010;
Bouchet et al., 2013). Otros ejemplos de los medioambientes donde la metilación del
mercurio es posible por las SRBs, es el perifiton de las raíces de las macrofitas flotantes
(Guimarães et al., 2000; Achá et al., 2005; Correia et al., 2012; Gentès et al., 2013), la
columna de agua de los lagos boreales (Eckley et al., 2005) y en el biofilm de las rocas
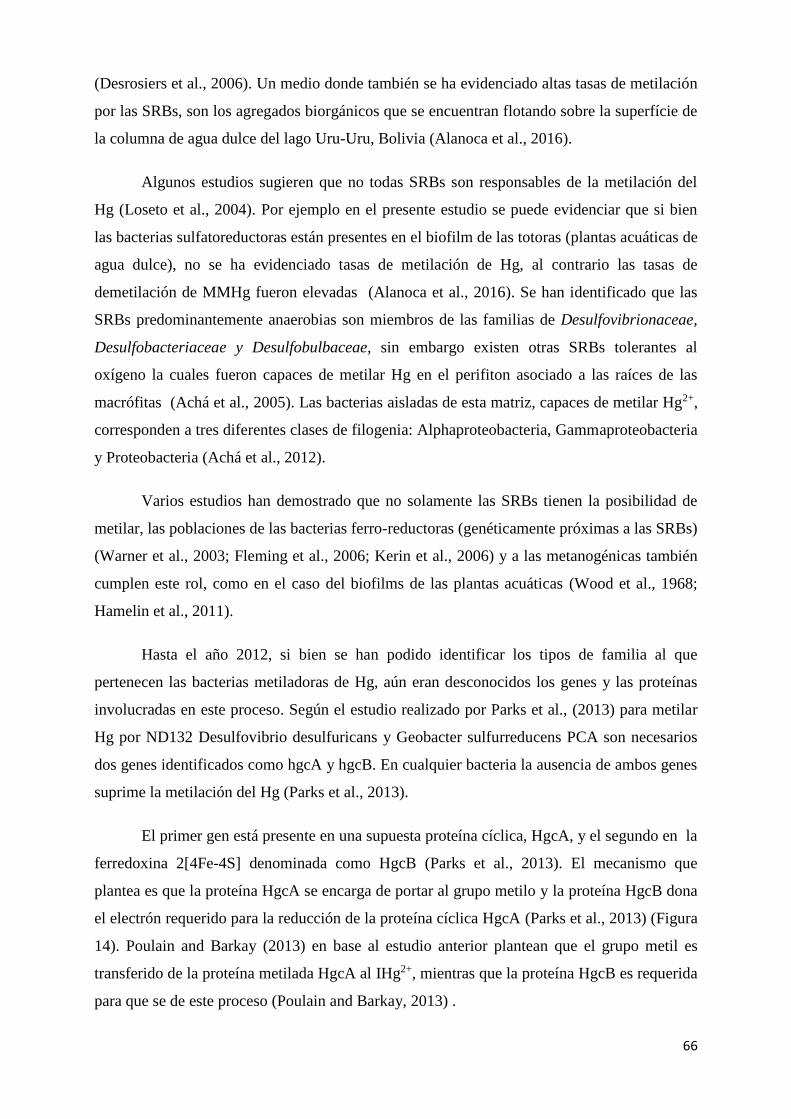
66
(Desrosiers et al., 2006). Un medio donde también se ha evidenciado altas tasas de metilación
por las SRBs, son los agregados biorgánicos que se encuentran flotando sobre la superfície de
la columna de agua dulce del lago Uru-Uru, Bolivia (Alanoca et al., 2016).
Algunos estudios sugieren que no todas SRBs son responsables de la metilación del
Hg (Loseto et al., 2004). Por ejemplo en el presente estudio se puede evidenciar que si bien
las bacterias sulfatoreductoras están presentes en el biofilm de las totoras (plantas acuáticas de
agua dulce), no se ha evidenciado tasas de metilación de Hg, al contrario las tasas de
demetilación de MMHg fueron elevadas (Alanoca et al., 2016). Se han identificado que las
SRBs predominantemente anaerobias son miembros de las familias de Desulfovibrionaceae,
Desulfobacteriaceae y Desulfobulbaceae, sin embargo existen otras SRBs tolerantes al
oxígeno la cuales fueron capaces de metilar Hg en el perifiton asociado a las raíces de las
macrófitas (Achá et al., 2005). Las bacterias aisladas de esta matriz, capaces de metilar Hg2+,
corresponden a tres diferentes clases de filogenia: Alphaproteobacteria, Gammaproteobacteria
y Proteobacteria (Achá et al., 2012).
Varios estudios han demostrado que no solamente las SRBs tienen la posibilidad de
metilar, las poblaciones de las bacterias ferro-reductoras (genéticamente próximas a las SRBs)
(Warner et al., 2003; Fleming et al., 2006; Kerin et al., 2006) y a las metanogénicas también
cumplen este rol, como en el caso del biofilms de las plantas acuáticas (Wood et al., 1968;
Hamelin et al., 2011).
Hasta el año 2012, si bien se han podido identificar los tipos de familia al que
pertenecen las bacterias metiladoras de Hg, aún eran desconocidos los genes y las proteínas
involucradas en este proceso. Según el estudio realizado por Parks et al., (2013) para metilar
Hg por ND132 Desulfovibrio desulfuricans y Geobacter sulfurreducens PCA son necesarios
dos genes identificados como hgcA y hgcB. En cualquier bacteria la ausencia de ambos genes
suprime la metilación del Hg (Parks et al., 2013).
El primer gen está presente en una supuesta proteína cíclica, HgcA, y el segundo en la
ferredoxina 2[4Fe-4S] denominada como HgcB (Parks et al., 2013). El mecanismo que
plantea es que la proteína HgcA se encarga de portar al grupo metilo y la proteína HgcB dona
el electrón requerido para la reducción de la proteína cíclica HgcA (Parks et al., 2013) (Figura
14). Poulain and Barkay (2013) en base al estudio anterior plantean que el grupo metil es
transferido de la proteína metilada HgcA al IHg2+, mientras que la proteína HgcB es requerida
para que se de este proceso (Poulain and Barkay, 2013) .
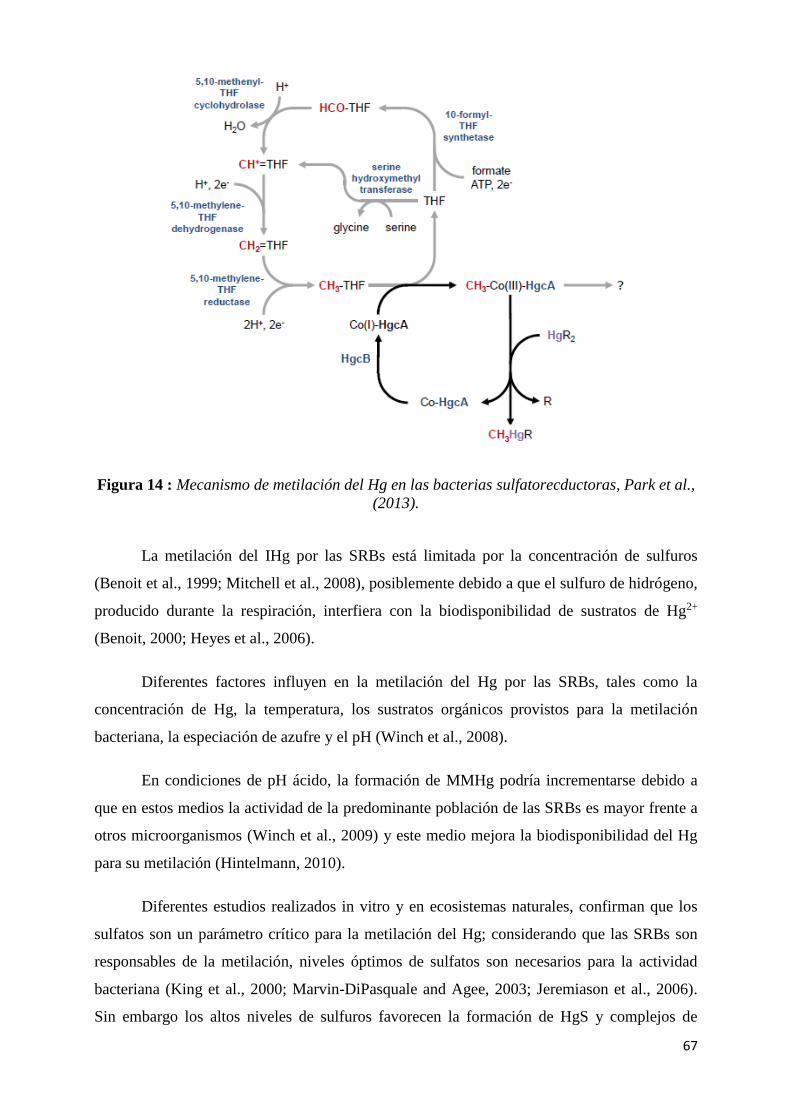
67
Figura 14 : Mecanismo de metilación del Hg en las bacterias sulfatorecductoras, Park et al.,
(2013).
La metilación del IHg por las SRBs está limitada por la concentración de sulfuros
(Benoit et al., 1999; Mitchell et al., 2008), posiblemente debido a que el sulfuro de hidrógeno,
producido durante la respiración, interfiera con la biodisponibilidad de sustratos de Hg2+
(Benoit, 2000; Heyes et al., 2006).
Diferentes factores influyen en la metilación del Hg por las SRBs, tales como la
concentración de Hg, la temperatura, los sustratos orgánicos provistos para la metilación
bacteriana, la especiación de azufre y el pH (Winch et al., 2008).
En condiciones de pH ácido, la formación de MMHg podría incrementarse debido a
que en estos medios la actividad de la predominante población de las SRBs es mayor frente a
otros microorganismos (Winch et al., 2009) y este medio mejora la biodisponibilidad del Hg
para su metilación (Hintelmann, 2010).
Diferentes estudios realizados in vitro y en ecosistemas naturales, confirman que los
sulfatos son un parámetro crítico para la metilación del Hg; considerando que las SRBs son
responsables de la metilación, niveles óptimos de sulfatos son necesarios para la actividad
bacteriana (King et al., 2000; Marvin-DiPasquale and Agee, 2003; Jeremiason et al., 2006).
Sin embargo los altos niveles de sulfuros favorecen la formación de HgS y complejos de
68
azufre los cuales no son asimilables por SRBs (Compeau and Bartha, 1985; Gilmour et al.,
1992; Heyes et al., 2006) y la menor biodisponibilidad del Hg para su metilación por la
formación de HgS (Sunderland et al., 2006).
Las concentraciones de Hg disuelto son a menudo elevadas en ambientes anóxicos, en
aguas relativamente sulfúricas y aeróbicas donde no están presentes los sulfuros. El Hg se
encuentra formando iones acomplejados, y complejos neutrales multinucleares tales como el
HS22-, Hg(SH)2, Hg(SH)-, Hg(SH)(OH) y quizá HgS(0) (Hintelmann, 2010).
Se ha pensado que a una concentración moderada de complejos no cargados de
HgS(0) y Hg(SH)2, los demás complejos pueden ser capaces de penetrar la membrana celular
llevando consigo al Hg dentro de la bacteria, para su subsecuente metilación (Jay et al., 2002;
Mehrotra and Sedlak, 2005).
La materia orgánica disuelta es otro de los factores que controla la formación de
MMHg. La materia orgánica disuelta (DOM), sirve como un sustrato orgánico para los
microorganismos, mejora la actividad biológica y controla la biodisponibilidad del Hg
(Hammerschmidt and Fitzgerald, 2004). El Hg2+ correlacionada con la DOM, mejora su
mobilidad y su distribución en los sitios de metilación. La materia orgánica disuelta forma
complejos con el MMHg, lo que permite incrementar las tasas de bioacumulación (Regnell
and Hammar, 2004). Al mismo tiempo el Hg2+ y el MMHg ligado a largas moléculas de
DOM disminuye la biodisponibilidad del Hg2+ para la bio-absorción del MMHg (Barkay and
Gillman, 1997; Miller et al., 2007).
El efecto de la temperatura en la producción de MMHg en los sedimentos fue
observado durante las épocas de invierno y verano. En verano las tasas de producción de
MMHg son mayores que en invierno debido a que el incremento en la temperatura mejora la
actividad bacteriana (Canario et al., 2007). Otro de los medioambientes donde usualmente se
muestran altas tasas de metilación son los medios tropicales. En suma los factores
bioquímicos, fisicoquímicos son determinantes para la formación del MMHg.
Con la identificación de los genes de metilación del Hg (HgcAB) en las poblaciones
microbianas y su amplia distribución en la naturaleza (que incluyen ambientes óxicos y
anóxicos), existe la posibilidad de que la metilación del Hg sea posible por otras vías aún
desconocidas, por lo tanto es difícil concluir que el origen del MMHg sea biótico o abiótico
(Podar et al., 2015).
69
1.10.3 Demetilación abiótica
La fotodegradación es el mecanismo más importante para la descomposición de
MMHg en las aguas superficiales (Sellers et al., 1996; Black et al., 2012) y en la superficie de
los océanos (Hammerschmidt and Fitzgerald, 2006b). El MMHg es degradado por la
radiación UV (100-400 nm) y por la luz visible (400-800 nm) (Gårdfeldt et al., 2001; Chen et
al., 2003). La eficiencia de la fotodegradación del MMHg está en función de la intensidad de
la longitud de onda que permite la ruptura del enlace entre el Hg-C y de la concentración del
tipo de materia orgánica disuelta (DOM) (Black et al., 2012).
La cantidad y la calidad de la materia orgánica presente en forma disuelta y en
suspensión pueden atenuar la reacción de demetilación, limitando la penetración de la
radiación solar en la superfície del agua o en la columna de agua (Hammerschmidt and
Fitzgerald, 2006b; Black et al., 2012). En las aguas claras de los lagos, las longitudes de onda
corta y larga son igualmente importantes para la demetilación del MMHg, ya que son muy
poco atenuados (Hintelmann, 2010). Mientras que en las aguas oscuras predominantemente la
radiación UV descompone al MMHg. En un 50% la radiación UVA y UVB son responsables
de la demetilación del MMHg en las aguas claras y en un 75% en las aguas oscuras (Lehnherr
and St. Louis, 2009). Por otro lado la fotodescomposición del MMHg también decrece con el
incremento de la salinidad de las aguas (Black et al., 2012).
En los océanos, la elevada concentración de cloruros facilita la formación de
CH3HgCl, una especie estable difícilmente fotodegradable (Mason et al., 2001; Whalin et al.,
2007), sin embargo puede ser demetilada indirectamente por la acción de los radicales
oxidrilo (OH*) (Chen et al., 2003).
1.10.4 Demetilación biótica
Por otro lado se distinguen dos mecanismos de demetilación biótica en la que
desempeñan un rol importante las bacterias sulfatogénicas y metanogénicas resistentes al Hg
que alberga en su genoma el operón mer (Mason and Benoit, 2003; Whalin et al., 2007). Estas
reacciones se dan en medios aerobios y anaerobios.
Diferentes experimentos de incubaciones de bacterias sulfatogénicas y metanogénicas
en sedimentos acuáticos, mostraron que estas bacterias son las principales demetiladoras de
MMHg (Oremland et al., 1991; Pak and Bartha, 1998). Dos tipos de reacciones de
demetilación pueden ser observadas: 1) la oxidativa, con la producción de dióxido de carbono
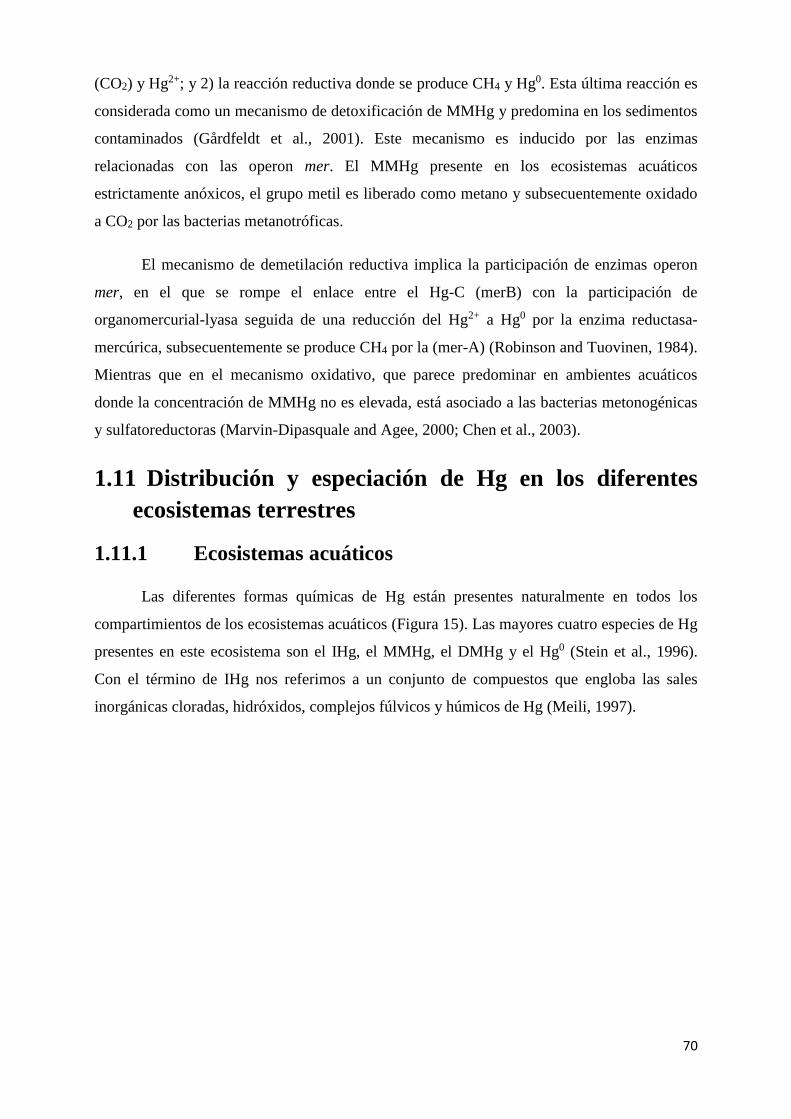
70
(CO2) y Hg2+; y 2) la reacción reductiva donde se produce CH4 y Hg0. Esta última reacción es
considerada como un mecanismo de detoxificación de MMHg y predomina en los sedimentos
contaminados (Gårdfeldt et al., 2001). Este mecanismo es inducido por las enzimas
relacionadas con las operon mer. El MMHg presente en los ecosistemas acuáticos
estrictamente anóxicos, el grupo metil es liberado como metano y subsecuentemente oxidado
a CO2 por las bacterias metanotróficas.
El mecanismo de demetilación reductiva implica la participación de enzimas operon
mer, en el que se rompe el enlace entre el Hg-C (merB) con la participación de
organomercurial-lyasa seguida de una reducción del Hg2+ a Hg0 por la enzima reductasa-
mercúrica, subsecuentemente se produce CH4 por la (mer-A) (Robinson and Tuovinen, 1984).
Mientras que en el mecanismo oxidativo, que parece predominar en ambientes acuáticos
donde la concentración de MMHg no es elevada, está asociado a las bacterias metonogénicas
y sulfatoreductoras (Marvin-Dipasquale and Agee, 2000; Chen et al., 2003).
1.11 Distribución y especiación de Hg en los diferentes
ecosistemas terrestres
1.11.1 Ecosistemas acuáticos
Las diferentes formas químicas de Hg están presentes naturalmente en todos los
compartimientos de los ecosistemas acuáticos (Figura 15). Las mayores cuatro especies de Hg
presentes en este ecosistema son el IHg, el MMHg, el DMHg y el Hg0 (Stein et al., 1996).
Con el término de IHg nos referimos a un conjunto de compuestos que engloba las sales
inorgánicas cloradas, hidróxidos, complejos fúlvicos y húmicos de Hg (Meili, 1997).
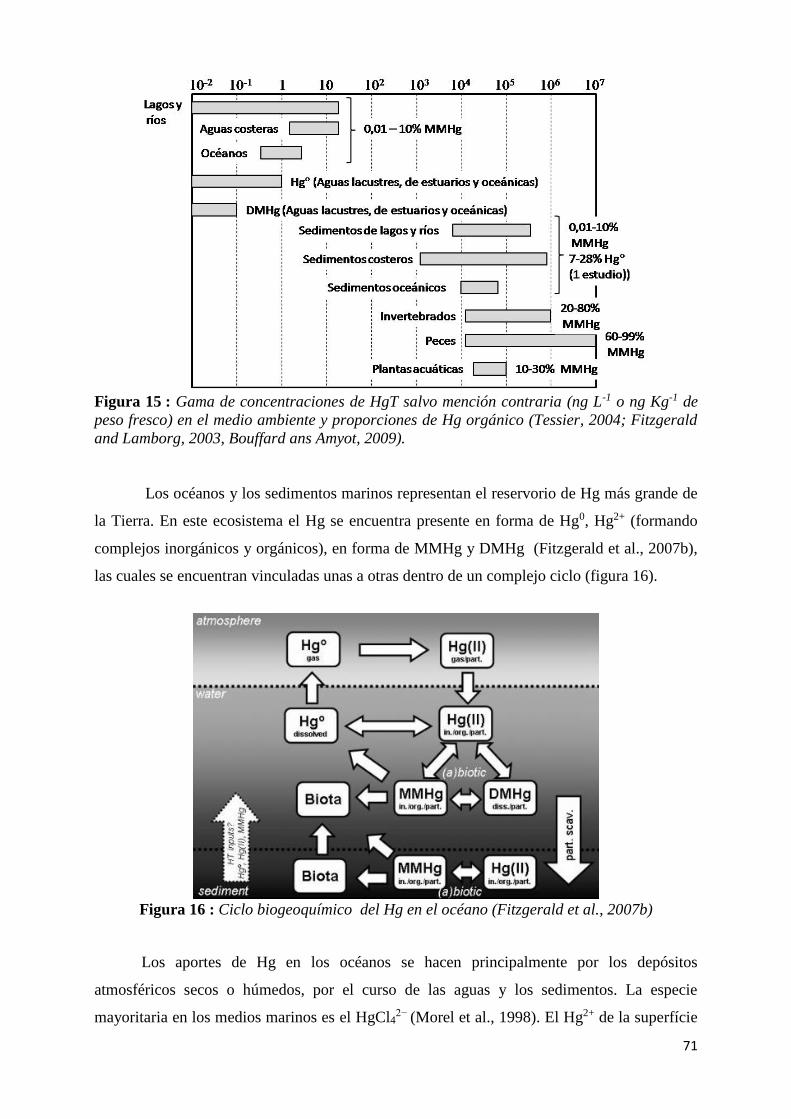
71
Figura 15 : Gama de concentraciones de HgT salvo mención contraria (ng L-1 o ng Kg-1 de
peso fresco) en el medio ambiente y proporciones de Hg orgánico (Tessier, 2004; Fitzgerald
and Lamborg, 2003, Bouffard ans Amyot, 2009).
Los océanos y los sedimentos marinos representan el reservorio de Hg más grande de
la Tierra. En este ecosistema el Hg se encuentra presente en forma de Hg0, Hg2+ (formando
complejos inorgánicos y orgánicos), en forma de MMHg y DMHg (Fitzgerald et al., 2007b),
las cuales se encuentran vinculadas unas a otras dentro de un complejo ciclo (figura 16).
Figura 16 : Ciclo biogeoquímico del Hg en el océano (Fitzgerald et al., 2007b)
Los aportes de Hg en los océanos se hacen principalmente por los depósitos
atmosféricos secos o húmedos, por el curso de las aguas y los sedimentos. La especie
mayoritaria en los medios marinos es el HgCl42− (Morel et al., 1998). El Hg2+ de la superfície
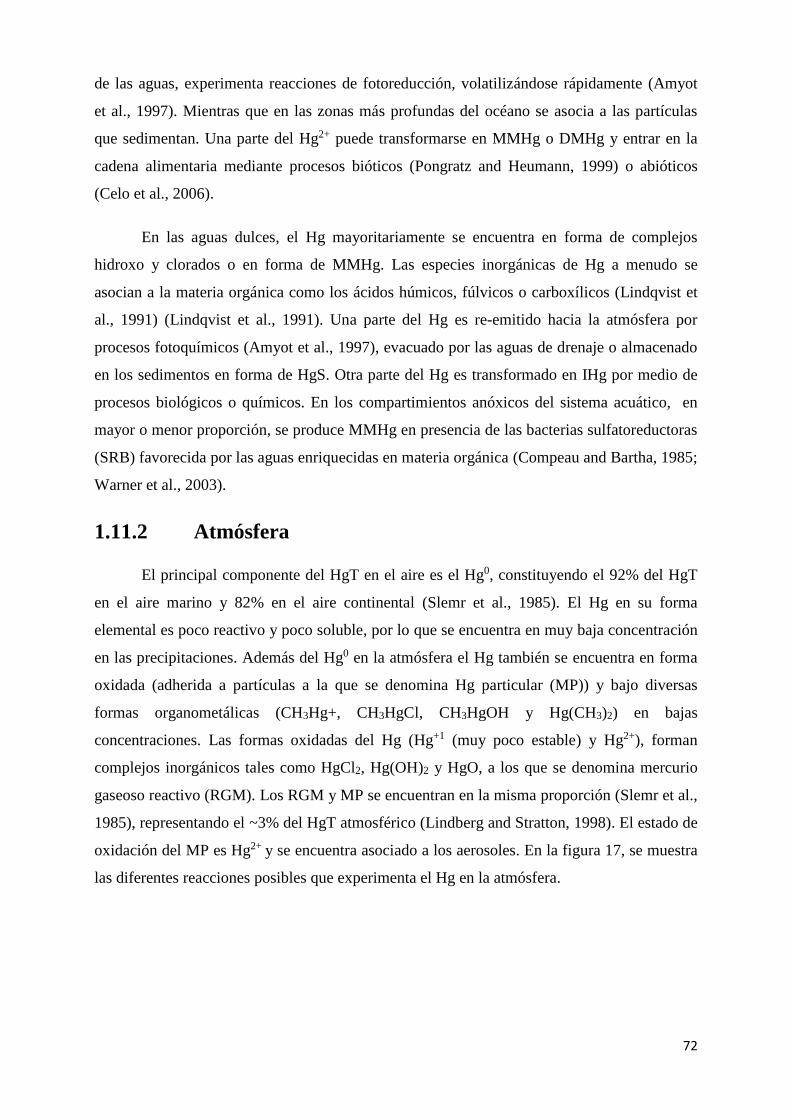
72
de las aguas, experimenta reacciones de fotoreducción, volatilizándose rápidamente (Amyot
et al., 1997). Mientras que en las zonas más profundas del océano se asocia a las partículas
que sedimentan. Una parte del Hg2+ puede transformarse en MMHg o DMHg y entrar en la
cadena alimentaria mediante procesos bióticos (Pongratz and Heumann, 1999) o abióticos
(Celo et al., 2006).
En las aguas dulces, el Hg mayoritariamente se encuentra en forma de complejos
hidroxo y clorados o en forma de MMHg. Las especies inorgánicas de Hg a menudo se
asocian a la materia orgánica como los ácidos húmicos, fúlvicos o carboxílicos (Lindqvist et
al., 1991) (Lindqvist et al., 1991). Una parte del Hg es re-emitido hacia la atmósfera por
procesos fotoquímicos (Amyot et al., 1997), evacuado por las aguas de drenaje o almacenado
en los sedimentos en forma de HgS. Otra parte del Hg es transformado en IHg por medio de
procesos biológicos o químicos. En los compartimientos anóxicos del sistema acuático, en
mayor o menor proporción, se produce MMHg en presencia de las bacterias sulfatoreductoras
(SRB) favorecida por las aguas enriquecidas en materia orgánica (Compeau and Bartha, 1985;
Warner et al., 2003).
1.11.2 Atmósfera
El principal componente del HgT en el aire es el Hg0, constituyendo el 92% del HgT
en el aire marino y 82% en el aire continental (Slemr et al., 1985). El Hg en su forma
elemental es poco reactivo y poco soluble, por lo que se encuentra en muy baja concentración
en las precipitaciones. Además del Hg0 en la atmósfera el Hg también se encuentra en forma
oxidada (adherida a partículas a la que se denomina Hg particular (MP)) y bajo diversas
formas organometálicas (CH3Hg+, CH3HgCl, CH3HgOH y Hg(CH3)2) en bajas
concentraciones. Las formas oxidadas del Hg (Hg+1 (muy poco estable) y Hg2+), forman
complejos inorgánicos tales como HgCl2, Hg(OH)2 y HgO, a los que se denomina mercurio
gaseoso reactivo (RGM). Los RGM y MP se encuentran en la misma proporción (Slemr et al.,
1985), representando el ~3% del HgT atmosférico (Lindberg and Stratton, 1998). El estado de
oxidación del MP es Hg2+ y se encuentra asociado a los aerosoles. En la figura 17, se muestra
las diferentes reacciones posibles que experimenta el Hg en la atmósfera.
73
Figura 17 : Transformaciones físicas y químicas del Hg en la atmósfera. Estilo de la figura
adaptado de Shia et al. (1999); reacciones de Shia et al. (1999), and Lin and Pehkonen
(1999).
En las regiones industrializadas la emisión de RGM y MP antropogénico en la
atmósfera es importante; debido al tamaño de los aerosoles el MP no recorre grandes
distancias, se deposita cerca de las fuentes de emisión (Xiao et al., 1991).
1.11.3 Suelos
El Hg contenido en los suelos se debe a las deposiciones de Hg atmosféricas húmedas
y secas, además de los provenientes desde la corteza terrestre. Los suelos en la mayoría de los
casos, es la principal fuente de Hg para los cuerpos de agua. Los niveles de fondo de Hg en
suelos no son fáciles de estimar debido a la contaminación generalizada de Hg. Según los
datos reportados para distintos tipos de suelo de todo el mundo, las concentraciones en los
suelos superficiales no exceden de 1,5 µg g-1 (Kabata-Pendias, 2011), mientras que en las
capas superficiales de los suelos afectadas por actividades antropogénicas, la concentración de
Hg puede ser mayor. Las concentraciones de Hg en los suelos varía con la profundidad, la
mayor proporción de Hg se encuentra en los primeros 20 cm (USEPA, 1997). Debido a las
características del suelo (pH, temperatura y tenores en materia orgánica) es favorecida la
formación de compuestos inorgánicos de Hg, tales como cloruro de mercurio y/o hidróxidos
de mercurio o compuestos orgánicos (Schuster, 1991). Un buen porcentaje de Hg presente en
los suelos se encuentra asociado a la materia orgánica bruta, suceptible de ser movilizado por
las aguas superficiales. El Hg2+ en forma de diferentes compuestos, puede ser reducido a Hg0
por acción de la luz (Carpi and Lindberg, 1998); o bien ser metilado por procesos microbianos
formando compuestos orgánicos de Hg (USEPA, 1997).
74
Las concentraciones de Hg en los sedimentos son mayores que en los suelos. Los
niveles de Hg en los sedimentos siguen la misma tendencia que los suelos observando la
profundidad, materia húmica, incrementos históricos y porcentajes de MMHg.
1.11.4 Biota
Se designa como biota al conjunto de las plantas, micro-organismos, animales
acuáticos y terrestres que se encuentran en una región. Debido a la retención eficaz del Hg por
la vegetación y los suelos (50% a 80%) (Graydon et al., 2008), los mismos están considerados
como sumideros de Hg (USEPA, 1997). Otro claro ejemplo son los peces, en los cuales los
porcentajes de MMHg biocumulado se encuentran entre 80 y 99% con respecto al contenido
total de Hg (Sloof et al., 1995).
El ciclo del Hg en la biósfera es complejo e implica procesos de depósito y de re-
emisión de Hg. Prácticamente todo el Hg que se encuentra en la vegetación tiene origen
atmosférico (Grigal, 2002). Del contenido total de Hg en las hojas y en las raíces el ~90% y el
45% de Hg respectivamente, es de origen atmosférico (MosbÆK et al., 1988).
Numerosos estudios revelan una contaminación por Hg en los ecosistemas árticos
(Wagemann et al., 1996; Muir et al., 2005; Sprovieri and Pirrone, 2005), donde elevadas
concentraciones de Hg fueron encontradas en los mamiferos marinos situados al final de la
cadena alimentaria. Las concentraciones de Hg en las ballenas fueron muy elevadas al igual
que en las focas y en los osos polares (Wagemann et al., 1996; Dietz et al., 2000). Los tenores
de Hg en estos organismos varían de 0,05 a 1,4 mg/kg de tejido (UNEP, 2002), y se
incrementan con con talla y la edad para un mismo nivel trófico (Lockhart et al., 2005). La
población consumidora de pescado presentó altos niveles de MMHg; así como también las
aves de corral y ganado los cuales eran alimentados con harina de pescado.
1.12 Bioconcentración, bioacumulación y biomagnificación
del MMHg en los ecosistemas acuáticos.
La bioacumulación del MMHg empieza con la asimilación de Hg a través de las
membranas bacterianas. La asimilación de las especies de Hg al inicio de la cadena
alimentaria por el fitoplacton, determina la bioacumulación a lo largo de la cadena trófica
(Mason et al., 1996; Watras et al., 1998).
Se cree que la acumulación del Hg ocurre por difusión pasiva de sus complejos
lipófilos neutros, tales como HgCl2 o CH3HgCl a través de la membrana biológica (Mason et
75
al., 1996; Benoit et al., 2001), subsecuentemente el MMHg es acumulado en el citoplasma de
la célula y el Hg2+ es secuestrado por los tioles de la membrana (Mason et al., 1996).
Posteriormente el MMHg es transferido al nivel trófico superior, donde la fracción de MMHg
se incrementa y disminuye la del Hg2+ (Watras et al., 1998; Baeyens et al., 2003). Es por esta
razón que los organismos de los ecosistemas acuáticos contaminados con Hg contienen altas
concentraciones de Hg respecto a los sistemas acuáticos cuyas tasas de Hg en los sedimentos
son similares que en el fondo geoquímico (Edwards et al., 1999; Bravo et al., 2010).
Los determinantes potenciales de la bioacumulación del Hg en los ecosistemas
acuáticos naturales incluyen factores ambientales (como las tasas de Hg, el pH, DOC, y la
temperatura), factores ecológicos (como la productividad y la posición trófica) y factores
fisiológicos (tales como la respiración y la asimilación) (Watras et al., 1998).
Los factores fisiológicos tales como el peso, la talla, la edad y la estrategia alimentaria,
controlan las concentraciones observadas en los diferentes niveles tróficos (Watras et al.,
1998; Baeyens et al., 2003).
Para un mismo nivel trófico, la bioacumulación del Hg es fácilmente observable
debido a que la concentración de Hg aumenta con la talla, el peso y la edad de la especie
considerada (Baeyens et al., 2003; Hammerschmidt and Fitzgerald, 2006a). Sin embargo
organismos de un nivel trófico inferior pueden contener más Hg que el del nivel trófico
superior, esto se debe al modo de vida y de alimentación (George and Batzer, 2008). La
bioacumulación del Hg en los sistemas acuáticos se define mediante dos factores: el factor de
bioacumulación (BCF) que es la fracción de la concentración de Hg en la columna de agua y
el organismo considerado; y el factor de bioamplificación (BMF) calculado con la
concentración de Hg de una presa y un predador.
Diferentes estudios realizados en peces han demostrado que según el tamaño de los
peces el Hg bioacumulado, a menudo, se correlaciona con el pH y el DOC de manera
incompatible (Watras et al., 1998); pero en otros casos no se reporta una correlación
significativa (Driscoll et al., 1995), lo que significa que existe un importante grado de
interacción entre las variables y/o múltiples efectos de las variables individuales que controlan
la bioacumulación del Hg (Watras et al., 1998).
76
1.13 Hg en los ecosistemas de altitud
La bioquímica del Hg en escenarios geográficos de gran altitud es poco conocida a
diferencia de los estudios realizado a nivel del mar o a poca altitud. En general las áreas
geográficas de gran altura se caraterizan por su aridez (falta de agua en el suelo y humedad en
el aire), bajas temperaturas, alta incidencia de radiación solar y UV. En este contexto el
conocimiento de la bioquímica del Hg en estos medios es de interés, dado que bajo
condiciones ambientales extremas la velocidad de su transformación para su reducción o
metilación podría acelerarse. El Hg en estado oxidado (Hg+2), es capaz de metilarse en medios
poco oxigenados y los sistemas de altitud tienen esta condición a nivel macro. Por otro lado
en estos medios la incidencia de radiación solar y UV son elevados, factores que podrían
jugar un rol importante en la fotoreducción del Hg y su posterior re-emisión hacia la
atmósfera.
Los pocos estudios realizados sobre el Hg en las montañas muestran que el Hg no es
de origen local, sino más bien es el resultado de las deposisiones meteorológicas secas y
húmedas de Hg. El Hg depositado en estos medios procede desde fuentes naturales y
antropogénicas. El transporte y deposición atmosférica del Hg depende del estado de
oxidación del elemento. El Hg0 permanece en la atmósfera el tiempo suficiente para que sea
transportado en todo el planeta, mientras que en forma de Hg2+ o MP es capturado y
depositado relativamente rápido (UNEP, 2013a).
Entre los escenarios geográficos más altos del mundo se tiene al Tibet (continente
asiático), a los Alpes en Europa, a la Coordillera Andina en Sudamérica y al Altiplano
Sudamericano.
En el Tibet, la región más alta del mundo (4900 m) se presentan áreas prístinas u otras
muy poco habitadas donde las actividades industriales están ausentes. En la montaña glaciar
de Gongga (7556 m) en el Tibet, los hongos mostraron ser muy buenos acumuladores de Hg
(1,168 mg Kg-1), seguido de los suelos donde se encuentran estas cetas (0,02-132 mg Kg-1) y
los suelos de los bosques pristinos del Himalaya (0,116 mg kg-1) (Falandysz et al., 2014). En
comparación con los valores reportados para la misma especie de hongo y la línea base de Hg
en los suelos de Polonia (0,58 a 0,70 y 0,047-0,048 mg kg-1 respectivamente) (Falandysz et
al., 2002), son muy elevados. Otro estudio muestra concentraciones bajas de Hg en los suelos
de la meseta y de parte oriental del Tibet, la concentración promedio del HgT se encuentra en
un intervalo de 0,02 a 0,08 mg kg-1 (Xie et al., 2014; Tang et al., 2015). Mientras que las
77
concentraciones de HgT en los peces varían de 0,025 a 1,2 mg Kg-1 de peso húmedo (Zhang et
al., 2014). Estos valores se encuentran por debajo y por encima del valor límite permisible
dado por la OMS (0,5 mg kg-1 de peso húmedo) (WHO, 1990). Por otro lado los porcentajes
de MMHg en el zooplancton y anfípodos bentónicos son superiores al de los peces, lo que
sugiere una transferencia eficaz de MMHg a partir de la base de la cadena alimentaria (Zhang
et al., 2014). El estudio realizado por Huang et al. (2013) muestra que el Hg proviene desde
otras zonas antropogénicas, movilizado por la atmósfera y depositado por los fenómenos
meteorológicos húmedos, principalmente durante el periodo monzónico (Huang et al., 2013).
La concentración promedio de HgT en las precipitaciones pluviales es de 24,8 ng L−1 (Zhang
et al., 2014), en la nieve varía de <1 ng L-1 a 13 ng L-1 (Huang et al., 2012a) y en las aguas de
ríos de 1,5-5,0 ng L−1 (Zheng, 2009).
En los Alpes franceses, el depósito de Hg ocurre a través de los depósitos de nieve y se
piensa que la formación de MMHg puede ocurrir en la atmósfera (Marusczak et al., 2011c).
Las concentraciones de HgT medidas en la nieve varían de 1,8 ng L−1 a 169,5 ng L−1 (Ferrari
et al., 2002; Fain et al., 2007; Marusczak et al., 2011c). Mientras que la concentración de
MMHg varía de ~2,4 pg L−1 a ~330 pg L−1 (Marusczak et al., 2011c). La concentración de
HgT en las aguas de las lagunas es mucho menor que la medida en la nieve. En las aguas de 4
lagunas de las montañas Belledonne y Grandes Rousses, ubicadas en los Alpes las
concentraciones de HgT varían de 0,1 a 4,3 ng L−1; y la concentración de MMHg de 1,9 a 9,2
pg L−1 (Marusczak et al., 2011b). En los peces de estas lagunas las concentraciones de HgT se
encuentran en un intervalo de 0,14 a 0,23 mg Kg-1 de peso húmedo (Marusczak et al., 2011b).
Las bajas concentraciones en MMHg podrían deberse al tiempo de residencia limitado que
tiene el Hg en la columna de agua para que ocurran los pocesos de sedimentación o de
metilación (Marusczak et al., 2011b). Las concentraciones de Hg en los sedimentos
superficiales del lago Luitel, ubicado en los Alpes franceses, alcanza a 230 ng g-1 (Guédron et
al., 2016a). Los depósitos de Hg en este lago son meteorológicos de origen antropogénico.
Según el perfil sedimentario la tasa de depósito de Hg atmosférico desde 1860 hasta la
Primera Guerra mundial fue alrededor de 45 g m-2 año-1, alcanzando el máximo valor al final
de la Segunda Guerra Mundial (250 g m-2 año-1), seguida de una disminución gradual (90 mg
m-2 año-1) en el período actual (Guédron et al., 2016a).
La Patagonia es otro de los sitios de altura ubicada en la cordillera de los Andes,
donde no son relevantes las emisiones de Hg asociado con la actividad industrial o minera, sin
embargo las elevadas concentraciones de Hg corresponden a la última década (Daga et al.,
2016). Los estudios realizados en los sedimentos de lago Nahuel Huapi, ubicado al norte de la
78
Patagonia de la cordillera de los Andes, muestra que el Hg es de origen antrópico, al igual que
el Sb, As, Br, Cs, Co, Cr y Ag (Ribeiro Guevara et al., 2002). Los niveles de Hg en los sólidos
en suspensión se encontraron en un intervalo de 4,3 a 9,9 µg g-1. Las concentraciones de Hg
en la capa superficial de los sedimentos de este lago variaron de 200 a 500 ng g-1,
correspondiendo las concentraciones más elevadas (400 a 650 ng g-1) a los siglos XVIII y
XIX. Los incrementos en las concentraciones de Hg, sugieren un vínculo con eventos
volcánicos en la Patagonia e incendios extendidos, además de aportes atmosféricos globales
(Ribeiro Guevara et al., 2010). Otro estudio similar realizado en sedimentos del lago
Futalaufquen, también ubicado en el norte de la Patagonia, asocia los altos picos de Hg
durante los últimos 300 años con las erupciones volcánicas en la Patagonia septentrional y
con episodios de incendios bastante irregulares, realizados por las poblaciones asentadas en
los Andes (Daga et al., 2016). Los líquenes y mejillones fueron estudiados como
bioindicadores de aire y agua en esta zona; las concentraciones de Hg medidas fueron
compatibles con los que se encuentran en lugares expuestos a contaminación moderada
(Guevara et al., 2004; Ribeiro Guevara et al., 2004). Mientras que las concentraciones de HgT
en el plancton de los lagos Moreno y del Lago Nahuel Huapi variaron desde 0,1 a 260 µg g-1
de plancton seco (Rizzo et al., 2014). Mientras que la cocentración de HgT en los peces se
encuentra entre 0,05 y 4 mg Kg-1 de peso húmedo en diferentes lagos y en el Lago
Futalaufquen (Rizzo et al., 2011). La producción de MMHg ocurre principalmente en la
columna de agua y es atribuida a la presencia de plancton. Las tasas de producción de MMHg
por las aguas ultraoligotróficas del lago Moreno conteniendo plancton de diámetro < a 50 µm,
fueron elevados en condiciones de radiación PAR + UV-A (27,3 ± 9,0 % a 50,8 ± 6,9%) que
en condiciones de oscuridad (15,44 ± 0,77% a 23,5 ± 1,4%) (Ribeiro Guevara et al., 2008) y
bajas en los sedimentos (Ribeiro Guevara et al., 2009).
El Altiplano boliviano es una meseta predominantemente metasedimentaria de gran
altitud ubicada entre la Cordillera Oriental y la Cordillera Occidental volcánica de los Andes
(USGS and GEOBOL, 1992). Presenta condiciones ambientales extremas con un clima árido,
fuertes gradientes de temperatura ambiente entre el día (18°C) y la noche (-4°C), fuertes
incidencias de radiación solar y UV y baja disponibilidad de oxígeno en el aire. A nivel
planetario este ecosistema se encuentra en la zona tropical, caracterizada principalmente por
la alta producción primaria de materia orgánica debido a la elevada cantidad de radiación
solar recibida. A diferencia de otras áreas geográficas que se encuentran en la zona tropical,
en el Altiplano boliviano sí se tienen fuertes heladas y sequías durante la época seca.
79
Según las áreas de explotación de metales de importancia económica en Bolivia, como
el oro en el Altiplano Boliviano, la fuente del Hg puede ser de origen antrópico, natural
(meteorización de rocas) y por deposiciones atmosféricas globales de Hg (Nriagu, 1994a). En
los suelos (0 a 15 cm de profundidad) de la región de Apolombamba respecto a la
concentración habitual de Hg en los suelos (0,01-0,03 mg kg-1) (Senesil et al., 1999), se ha
encontrado altas concentraciones de Hg (0,2 a 22 mg Kg-1) (Faz et al., 2014). Las
concentraciones de Hg en los suelos de esta región están asociadas con las actividades minero
auríferas, las cuales utilizan Hg para la recuperación de oro (Au). Por otro lado el Hg se
encuentra geológicamente asociado a minerales sulfurados que contienen oro (Lentz, 2005)
por lo que podría ser liberado durante las actividades mineras. A ello se debe añadir los
aportes atmosféricos globales de Hg (Nriagu, 1994a).
En cuanto a la acumulación de Hg en los peces de esta región, los niveles de HgT en
los tejidos de los peces del lago Titicaca varían de 0,4 a 0,9 mg Kg-1 de peso húmedo
(Monroy et al., 2014). Mientras que el el lago Uru-Uru y Poopó, dos lagos impactados por
intensas actividades mineras, las concentraciones de HgT por peso seco de tejido muscular
variaron entre 0,2 y 1,2 mg Kg-1 de tejido seco (Molina et al., 2012). Multiplicando estos
valores por un factor de 0,2 (Pourang et al., 2004), obtenemos las correspondientes
concentraciones de HgT (0,04-0,24 mg Kg-1) por peso húmedo. Estos valores se encuentran
por debajo del valor recomendado por la OMS (0,5 mg Hg Kg-1 de peso húmedo (WHO,
1990)). Por otro lado se han reportado niveles de HgT en los tallos, raíces de las totoras y
sedimentos superficiales del lago Uru-Uru, estos valores se encuentran entre <30-72, 4-129 y
500 µg Kg-1 de peso seco respectivamente (PPO-9612, 1996).
Como resumen la tabla 5 muestra las concentraciones de HgT y MMHg en las
diferentes matrices por área geográfica a gran altura, sin tomar en cuenta las concentraciones
determinadas en el presente trabajo en diferentes matrices del lago Uru-Uru.
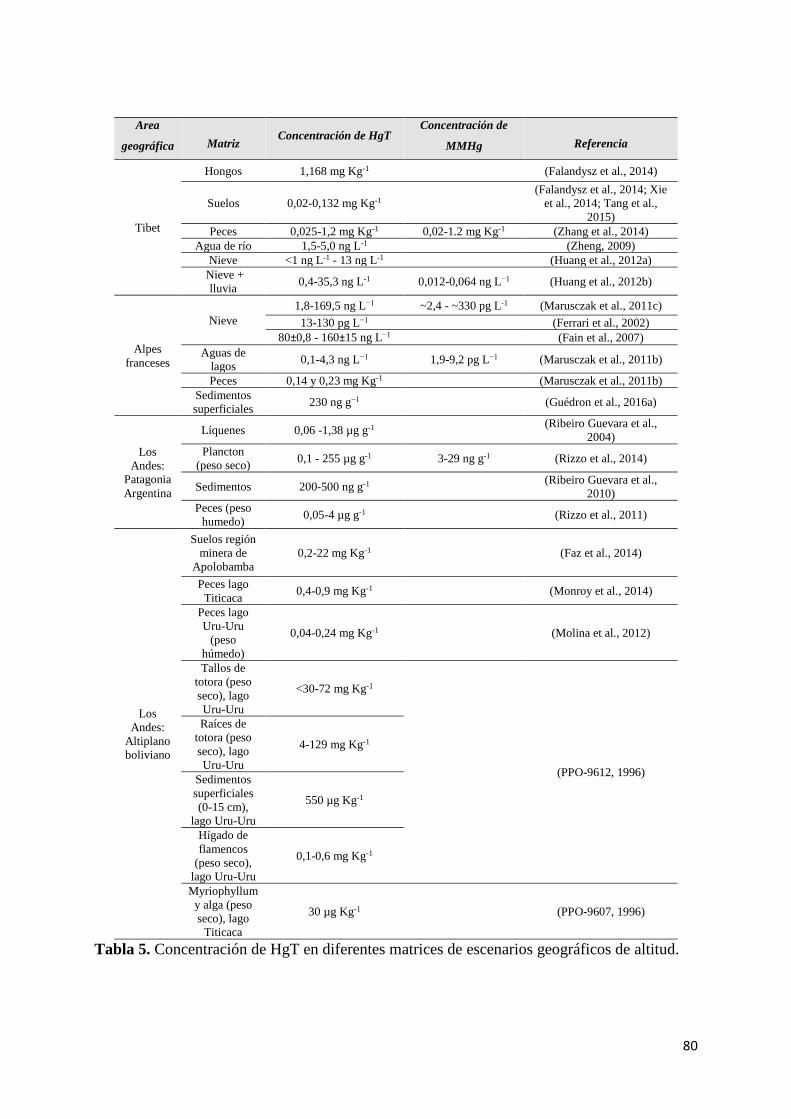
80
Area
geográfica Matriz Concentración de HgT
Concentración de
MMHg Referencia
Tibet
Hongos 1,168 mg Kg-1 (Falandysz et al., 2014)
Suelos 0,02-0,132 mg Kg-1
(Falandysz et al., 2014; Xie
et al., 2014; Tang et al.,
2015)
Peces 0,025-1,2 mg Kg-1 0,02-1.2 mg Kg-1 (Zhang et al., 2014)
Agua de río 1,5-5,0 ng L-1 (Zheng, 2009)
Nieve <1 ng L-1 - 13 ng L-1 (Huang et al., 2012a)
Nieve +
lluvia 0,4-35,3 ng L-1 0,012-0,064 ng L−1 (Huang et al., 2012b)
Alpes
franceses
Nieve
1,8-169,5 ng L−1 ~2,4 - ~330 pg L-1 (Marusczak et al., 2011c)
13-130 pg L−1 (Ferrari et al., 2002)
80±0,8 - 160±15 ng L−1 (Fain et al., 2007)
Aguas de
lagos 0,1-4,3 ng L−1 1,9-9,2 pg L−1 (Marusczak et al., 2011b)
Peces 0,14 y 0,23 mg Kg-1 (Marusczak et al., 2011b)
Sedimentos
superficiales 230 ng g−1
(Guédron et al., 2016a)
Los
Andes:
Patagonia
Argentina
Líquenes 0,06 -1,38 µg g-1 (Ribeiro Guevara et al.,
2004)
Plancton
(peso seco) 0,1 - 255 µg g-1 3-29 ng g-1 (Rizzo et al., 2014)
Sedimentos 200-500 ng g-1 (Ribeiro Guevara et al.,
2010)
Peces (peso
humedo) 0,05-4 µg g-1
(Rizzo et al., 2011)
Los
Andes:
Altiplano
boliviano
Suelos región
minera de
Apolobamba
0,2-22 mg Kg-1
(Faz et al., 2014)
Peces lago
Titicaca 0,4-0,9 mg Kg-1
(Monroy et al., 2014)
Peces lago
Uru-Uru
(peso
húmedo)
0,04-0,24 mg Kg-1
(Molina et al., 2012)
Tallos de
totora (peso
seco), lago
Uru-Uru
<30-72 mg Kg-1
(PPO-9612, 1996)
Raíces de
totora (peso
seco), lago
Uru-Uru
4-129 mg Kg-1
Sedimentos
superficiales
(0-15 cm),
lago Uru-Uru
550 µg Kg-1
Hígado de
flamencos
(peso seco),
lago Uru-Uru
0,1-0,6 mg Kg-1
Myriophyllum
y alga (peso
seco), lago
Titicaca
30 µg Kg-1
(PPO-9607, 1996)
Tabla 5. Concentración de HgT en diferentes matrices de escenarios geográficos de altitud.
81
1.14 Métodos analíticos y experimentales utilizados para
la determinación de Hg
Las técnicas o métodos analíticos experimentales para la determinación de mercurio y
las diferentes especies de este elemento en diferentes matrices, han sido implementados desde
simples test para la identificación de Hg, hasta sofisticadas técnicas de cuantificación de
diferentes especies e isótopos estables de un mismo elemento. Estas técnicas precisas y
exactas permiten analizar concentraciones de Hg de diferentes especies a nivel trazas, del
orden de picogramos (pg) a microgramos (µg).
1.14.1 Técnicas de análisis de HgT
Existen diferentes técnicas para la determinación de Hg total en muestras sólidas y
líquidas en función de los niveles de concentración. Las principales 4 técnicas utilizadas para
la determinación de HgT son: la espectrometría de absorción atómica de vapor frío (CV-
AAS), la espectrometría de flurescencia atómica de vapor frío (CV-AFS), la técnica de
análisis directo de Hg o técnica de análisis pyro-AFS y la técnica de la espectrómetría de
masas con plasma de acoplamiento inductivo (ICP/MS), a los que nos referiremos a
continuación.
La técnica de espectrofotometría de absorción atómica de vapor frío (CV-AAS), es
una técnica frecuentemente utilizada para la determinación de HgT (Tahan et al., 1993;
Balarama Krishna M V, 2005; Balarama Krishna et al., 2005) en muestras sólidas y residuos
semi-sólidos digeridos por ataque ácido (USEPA, Method 7471B).
El procedimiento está basado en el principio desarrollado por Poluektov et al. (1964) y
Hatch & Ott (1968), que consiste en la reducción de Hg2+ a Hg0 por un agente reductor
(cloruro estanoso (SnCl2) o tetrahidroborato de sodio (NaBH4) (Kopysc et al., 2000). Para la
medición el Hg reducido es transportado por un gas inerte (argón) hasta la celda
espectrofotométrica para su detección a 253,7 nm, libre de agua (Veiga and Baker, 2005). En
otros casos el Hg es pre-concentrado sobre una trampa de oro antes de ser térmicamente
desorbido para el análisis. El límite de detección típico de este método es de 0,05 ng g-1
(Horvat, 2005) para muestras sólidas.
Las limitantes comunes de esta técnica (CV-AAS) son las pérdidas por volatilización,
la contaminación durante la etapa de la digestión ácida de las muestras (Veiga and Baker,
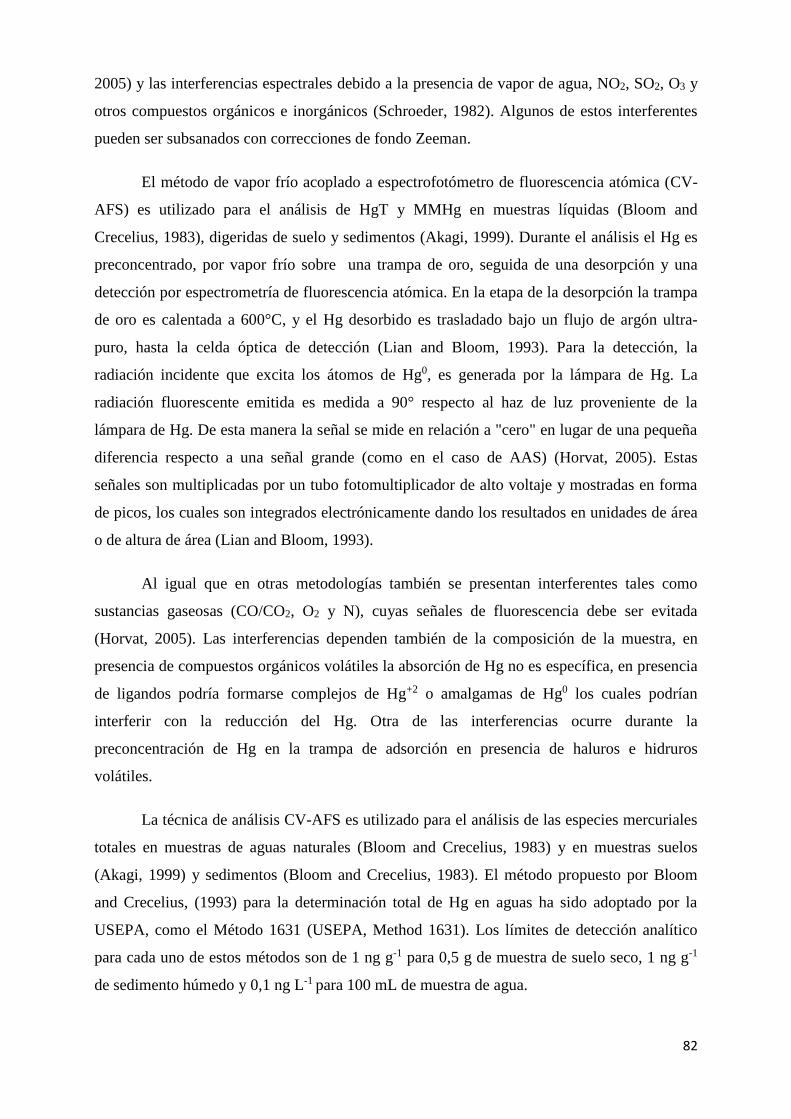
82
2005) y las interferencias espectrales debido a la presencia de vapor de agua, NO2, SO2, O3 y
otros compuestos orgánicos e inorgánicos (Schroeder, 1982). Algunos de estos interferentes
pueden ser subsanados con correcciones de fondo Zeeman.
El método de vapor frío acoplado a espectrofotómetro de fluorescencia atómica (CV-
AFS) es utilizado para el análisis de HgT y MMHg en muestras líquidas (Bloom and
Crecelius, 1983), digeridas de suelo y sedimentos (Akagi, 1999). Durante el análisis el Hg es
preconcentrado, por vapor frío sobre una trampa de oro, seguida de una desorpción y una
detección por espectrometría de fluorescencia atómica. En la etapa de la desorpción la trampa
de oro es calentada a 600°C, y el Hg desorbido es trasladado bajo un flujo de argón ultra-
puro, hasta la celda óptica de detección (Lian and Bloom, 1993). Para la detección, la
radiación incidente que excita los átomos de Hg0, es generada por la lámpara de Hg. La
radiación fluorescente emitida es medida a 90° respecto al haz de luz proveniente de la
lámpara de Hg. De esta manera la señal se mide en relación a "cero" en lugar de una pequeña
diferencia respecto a una señal grande (como en el caso de AAS) (Horvat, 2005). Estas
señales son multiplicadas por un tubo fotomultiplicador de alto voltaje y mostradas en forma
de picos, los cuales son integrados electrónicamente dando los resultados en unidades de área
o de altura de área (Lian and Bloom, 1993).
Al igual que en otras metodologías también se presentan interferentes tales como
sustancias gaseosas (CO/CO2, O2 y N), cuyas señales de fluorescencia debe ser evitada
(Horvat, 2005). Las interferencias dependen también de la composición de la muestra, en
presencia de compuestos orgánicos volátiles la absorción de Hg no es específica, en presencia
de ligandos podría formarse complejos de Hg+2 o amalgamas de Hg0 los cuales podrían
interferir con la reducción del Hg. Otra de las interferencias ocurre durante la
preconcentración de Hg en la trampa de adsorción en presencia de haluros e hidruros
volátiles.
La técnica de análisis CV-AFS es utilizado para el análisis de las especies mercuriales
totales en muestras de aguas naturales (Bloom and Crecelius, 1983) y en muestras suelos
(Akagi, 1999) y sedimentos (Bloom and Crecelius, 1983). El método propuesto por Bloom
and Crecelius, (1993) para la determinación total de Hg en aguas ha sido adoptado por la
USEPA, como el Método 1631 (USEPA, Method 1631). Los límites de detección analítico
para cada uno de estos métodos son de 1 ng g-1 para 0,5 g de muestra de suelo seco, 1 ng g-1
de sedimento húmedo y 0,1 ng L-1 para 100 mL de muestra de agua.
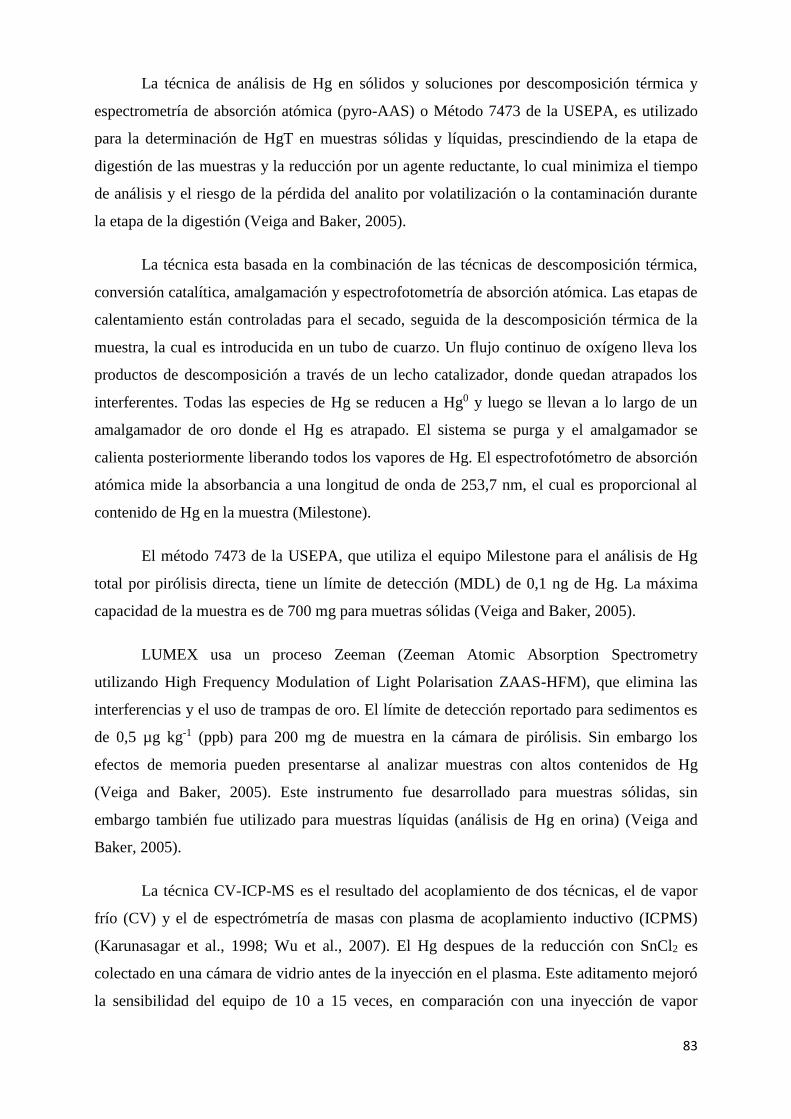
83
La técnica de análisis de Hg en sólidos y soluciones por descomposición térmica y
espectrometría de absorción atómica (pyro-AAS) o Método 7473 de la USEPA, es utilizado
para la determinación de HgT en muestras sólidas y líquidas, prescindiendo de la etapa de
digestión de las muestras y la reducción por un agente reductante, lo cual minimiza el tiempo
de análisis y el riesgo de la pérdida del analito por volatilización o la contaminación durante
la etapa de la digestión (Veiga and Baker, 2005).
La técnica esta basada en la combinación de las técnicas de descomposición térmica,
conversión catalítica, amalgamación y espectrofotometría de absorción atómica. Las etapas de
calentamiento están controladas para el secado, seguida de la descomposición térmica de la
muestra, la cual es introducida en un tubo de cuarzo. Un flujo continuo de oxígeno lleva los
productos de descomposición a través de un lecho catalizador, donde quedan atrapados los
interferentes. Todas las especies de Hg se reducen a Hg0 y luego se llevan a lo largo de un
amalgamador de oro donde el Hg es atrapado. El sistema se purga y el amalgamador se
calienta posteriormente liberando todos los vapores de Hg. El espectrofotómetro de absorción
atómica mide la absorbancia a una longitud de onda de 253,7 nm, el cual es proporcional al
contenido de Hg en la muestra (Milestone).
El método 7473 de la USEPA, que utiliza el equipo Milestone para el análisis de Hg
total por pirólisis directa, tiene un límite de detección (MDL) de 0,1 ng de Hg. La máxima
capacidad de la muestra es de 700 mg para muetras sólidas (Veiga and Baker, 2005).
LUMEX usa un proceso Zeeman (Zeeman Atomic Absorption Spectrometry
utilizando High Frequency Modulation of Light Polarisation ZAAS-HFM), que elimina las
interferencias y el uso de trampas de oro. El límite de detección reportado para sedimentos es
de 0,5 µg kg-1 (ppb) para 200 mg de muestra en la cámara de pirólisis. Sin embargo los
efectos de memoria pueden presentarse al analizar muestras con altos contenidos de Hg
(Veiga and Baker, 2005). Este instrumento fue desarrollado para muestras sólidas, sin
embargo también fue utilizado para muestras líquidas (análisis de Hg en orina) (Veiga and
Baker, 2005).
La técnica CV-ICP-MS es el resultado del acoplamiento de dos técnicas, el de vapor
frío (CV) y el de espectrómetría de masas con plasma de acoplamiento inductivo (ICPMS)
(Karunasagar et al., 1998; Wu et al., 2007). El Hg despues de la reducción con SnCl2 es
colectado en una cámara de vidrio antes de la inyección en el plasma. Este aditamento mejoró
la sensibilidad del equipo de 10 a 15 veces, en comparación con una inyección de vapor

84
continua. El límite de detección es de 6 ng L-1 para un tiempo de 3 segundos (Karunasagar et
al., 1998).
La técnica es utilizada para la determinación de HgT en diferentes matrices entre ellas
en aguas naturales con altos contenidos de ácido húmico (Pyhtilä et al., 2012) y orina
(Bettinelli et al., 2002).
1.15 Técnicas de análisis para la especiación de Hg
La mayoría de los métodos están basados en el método analítico originalmente
desarrollado por Westöö, 1966 y Sumino 1968. Se trata de una primera extracción de cloruro
organomercurial con benceno a partir de muestras homogéneas acidificadas, seguida de una
segunda re-estracción de lo extraído utilizando el mismo solvente. Sin embargo en los últimos
años, los métodos analíticos fueron mejorados significativamente en términos de especificidad
y sensibilidad (Horvat, 2005).
Los métodos de especiación de Hg están clasificados de acuerdo a la técnica de
separación cromatográfica de los analitos (CG, HPLC) (Bouyssiere et al., 2002) y al
instrumento de detección utilizado (Sanchez Uria and Sanz-Medel, 1998).
La cromatografía gaseosa (GC) y la cromatografía en fase líquida (HPLC) son las
técnicas frecuentemente utilizadas en diversas investigaciones para la separación de los
analitos. En investigaciones realizadas por Hintelmann and Evans, (1997); Qvarnström et al.,
2000, muestran que los analitos pueden ser separados por cromatografía en fase líquida
(Hintelmann and Evans, 1997; Qvarnström et al., 2000); mientras que otros estudios muestran
que también es posible separar las especies estudiadas por cromatografía gaseosa (Demuth
and Heumann, 2001; Monperrus et al., 2005; Monperrus et al., 2005b; Point et al., 2007a), o
bien por cromatografía de exclusión por tamaños (SEC) con fines de estudio de biomoléculas
(Shi et al., 2007).
Los detectores más utilizados son básicamente los espectrofotómetros de absorción
atómica (AAS), fluorescencia atómica (AFS), emisión atómica a plasma inducido por micro-
ondas (MIPAES), espectroscopía de emisión atómica de plasma acoplado inductivamente
(ICPAES) o el ICPMS de excelente sensibilidad y especificidad. Este último posibilita el
análisis de multi-elementos y multi-isótopos (Monperrus et al., 2005b). El ICPMS acoplado a
un cromatógrafo de gases (GC), ha sido utilizado en el presente trabajo.
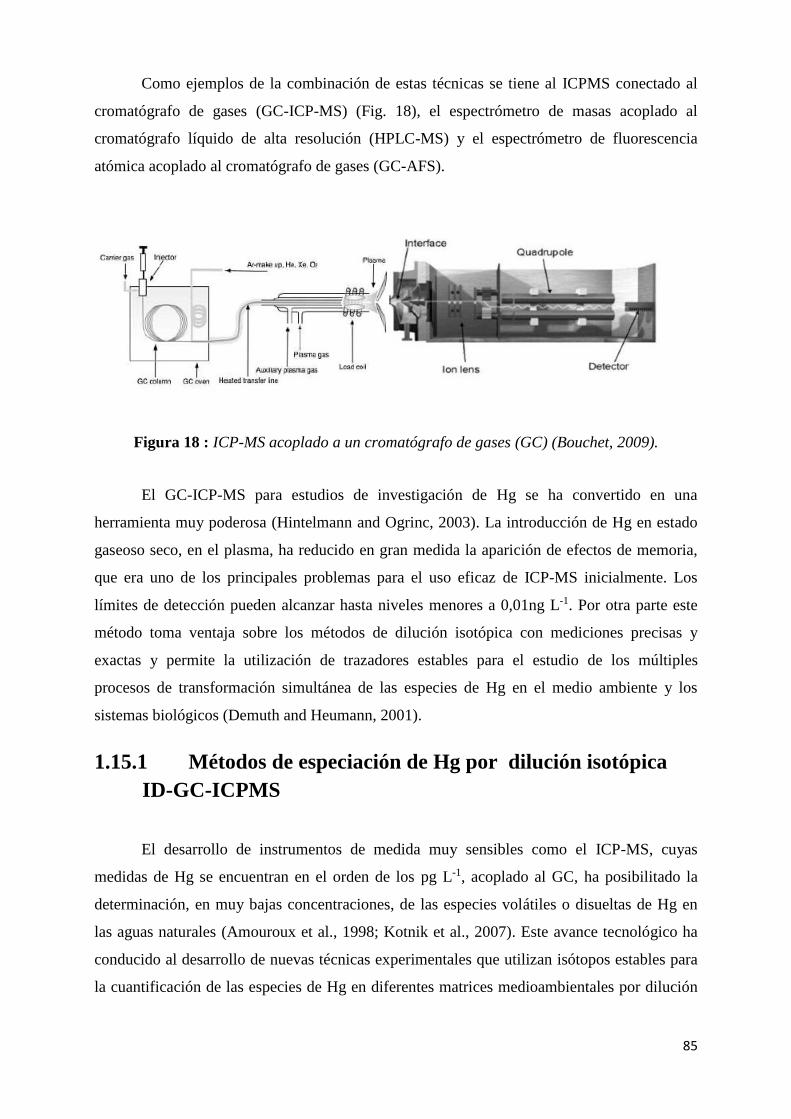
85
Como ejemplos de la combinación de estas técnicas se tiene al ICPMS conectado al
cromatógrafo de gases (GC-ICP-MS) (Fig. 18), el espectrómetro de masas acoplado al
cromatógrafo líquido de alta resolución (HPLC-MS) y el espectrómetro de fluorescencia
atómica acoplado al cromatógrafo de gases (GC-AFS).
Figura 18 : ICP-MS acoplado a un cromatógrafo de gases (GC) (Bouchet, 2009).
El GC-ICP-MS para estudios de investigación de Hg se ha convertido en una
herramienta muy poderosa (Hintelmann and Ogrinc, 2003). La introducción de Hg en estado
gaseoso seco, en el plasma, ha reducido en gran medida la aparición de efectos de memoria,
que era uno de los principales problemas para el uso eficaz de ICP-MS inicialmente. Los
límites de detección pueden alcanzar hasta niveles menores a 0,01ng L-1. Por otra parte este
método toma ventaja sobre los métodos de dilución isotópica con mediciones precisas y
exactas y permite la utilización de trazadores estables para el estudio de los múltiples
procesos de transformación simultánea de las especies de Hg en el medio ambiente y los
sistemas biológicos (Demuth and Heumann, 2001).
1.15.1 Métodos de especiación de Hg por dilución isotópica
ID-GC-ICPMS
El desarrollo de instrumentos de medida muy sensibles como el ICP-MS, cuyas
medidas de Hg se encuentran en el orden de los pg L-1, acoplado al GC, ha posibilitado la
determinación, en muy bajas concentraciones, de las especies volátiles o disueltas de Hg en
las aguas naturales (Amouroux et al., 1998; Kotnik et al., 2007). Este avance tecnológico ha
conducido al desarrollo de nuevas técnicas experimentales que utilizan isótopos estables para
la cuantificación de las especies de Hg en diferentes matrices medioambientales por dilución
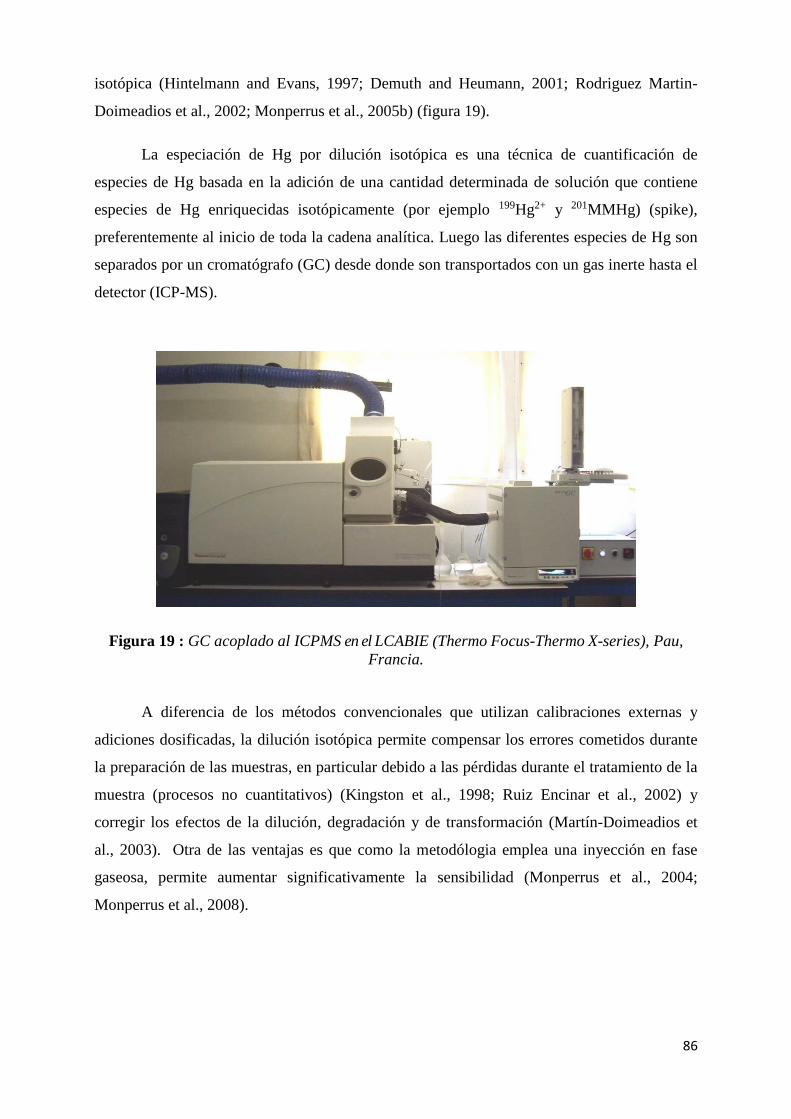
86
isotópica (Hintelmann and Evans, 1997; Demuth and Heumann, 2001; Rodriguez Martin-
Doimeadios et al., 2002; Monperrus et al., 2005b) (figura 19).
La especiación de Hg por dilución isotópica es una técnica de cuantificación de
especies de Hg basada en la adición de una cantidad determinada de solución que contiene
especies de Hg enriquecidas isotópicamente (por ejemplo 199Hg2+ y 201MMHg) (spike),
preferentemente al inicio de toda la cadena analítica. Luego las diferentes especies de Hg son
separados por un cromatógrafo (GC) desde donde son transportados con un gas inerte hasta el
detector (ICP-MS).
Figura 19 : GC acoplado al ICPMS en el LCABIE (Thermo Focus-Thermo X-series), Pau,
Francia.
A diferencia de los métodos convencionales que utilizan calibraciones externas y
adiciones dosificadas, la dilución isotópica permite compensar los errores cometidos durante
la preparación de las muestras, en particular debido a las pérdidas durante el tratamiento de la
muestra (procesos no cuantitativos) (Kingston et al., 1998; Ruiz Encinar et al., 2002) y
corregir los efectos de la dilución, degradación y de transformación (Martín-Doimeadios et
al., 2003). Otra de las ventajas es que como la metodólogia emplea una inyección en fase
gaseosa, permite aumentar significativamente la sensibilidad (Monperrus et al., 2004;
Monperrus et al., 2008).
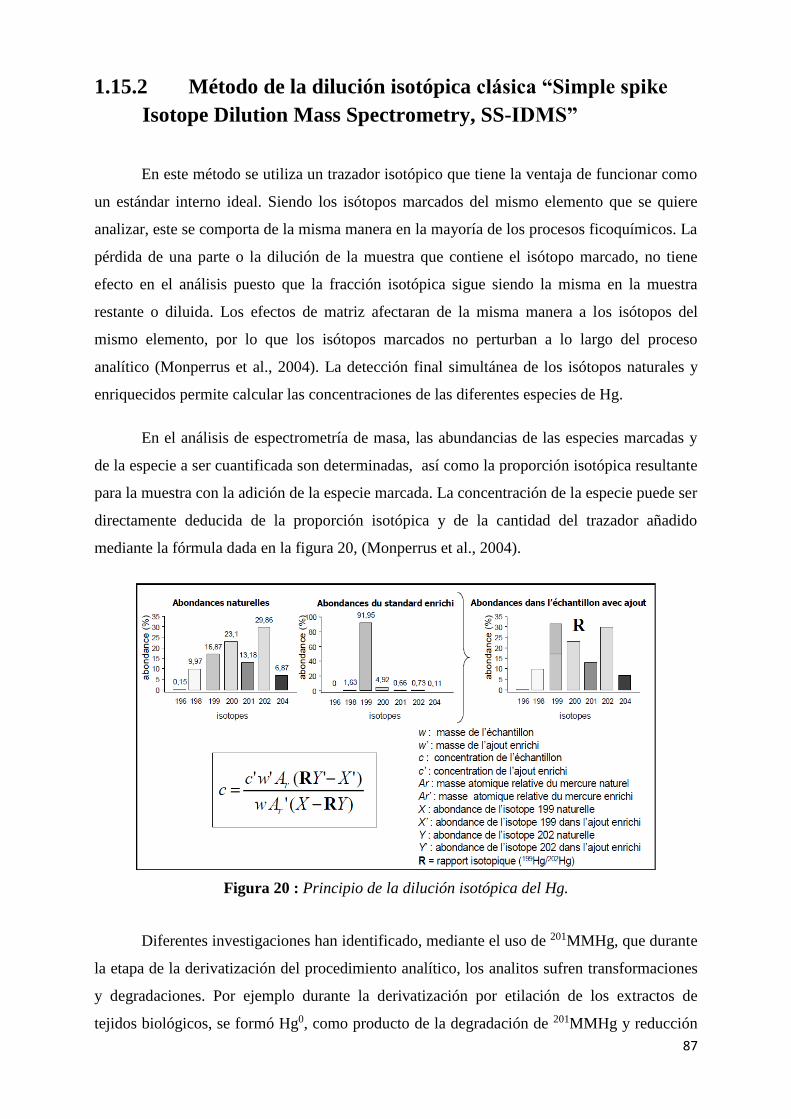
87
1.15.2 Método de la dilución isotópica clásica “Simple spike
Isotope Dilution Mass Spectrometry, SS-IDMS”
En este método se utiliza un trazador isotópico que tiene la ventaja de funcionar como
un estándar interno ideal. Siendo los isótopos marcados del mismo elemento que se quiere
analizar, este se comporta de la misma manera en la mayoría de los procesos ficoquímicos. La
pérdida de una parte o la dilución de la muestra que contiene el isótopo marcado, no tiene
efecto en el análisis puesto que la fracción isotópica sigue siendo la misma en la muestra
restante o diluida. Los efectos de matriz afectaran de la misma manera a los isótopos del
mismo elemento, por lo que los isótopos marcados no perturban a lo largo del proceso
analítico (Monperrus et al., 2004). La detección final simultánea de los isótopos naturales y
enriquecidos permite calcular las concentraciones de las diferentes especies de Hg.
En el análisis de espectrometría de masa, las abundancias de las especies marcadas y
de la especie a ser cuantificada son determinadas, así como la proporción isotópica resultante
para la muestra con la adición de la especie marcada. La concentración de la especie puede ser
directamente deducida de la proporción isotópica y de la cantidad del trazador añadido
mediante la fórmula dada en la figura 20, (Monperrus et al., 2004).
Figura 20 : Principio de la dilución isotópica del Hg.
Diferentes investigaciones han identificado, mediante el uso de 201MMHg, que durante
la etapa de la derivatización del procedimiento analítico, los analitos sufren transformaciones
y degradaciones. Por ejemplo durante la derivatización por etilación de los extractos de
tejidos biológicos, se formó Hg0, como producto de la degradación de 201MMHg y reducción
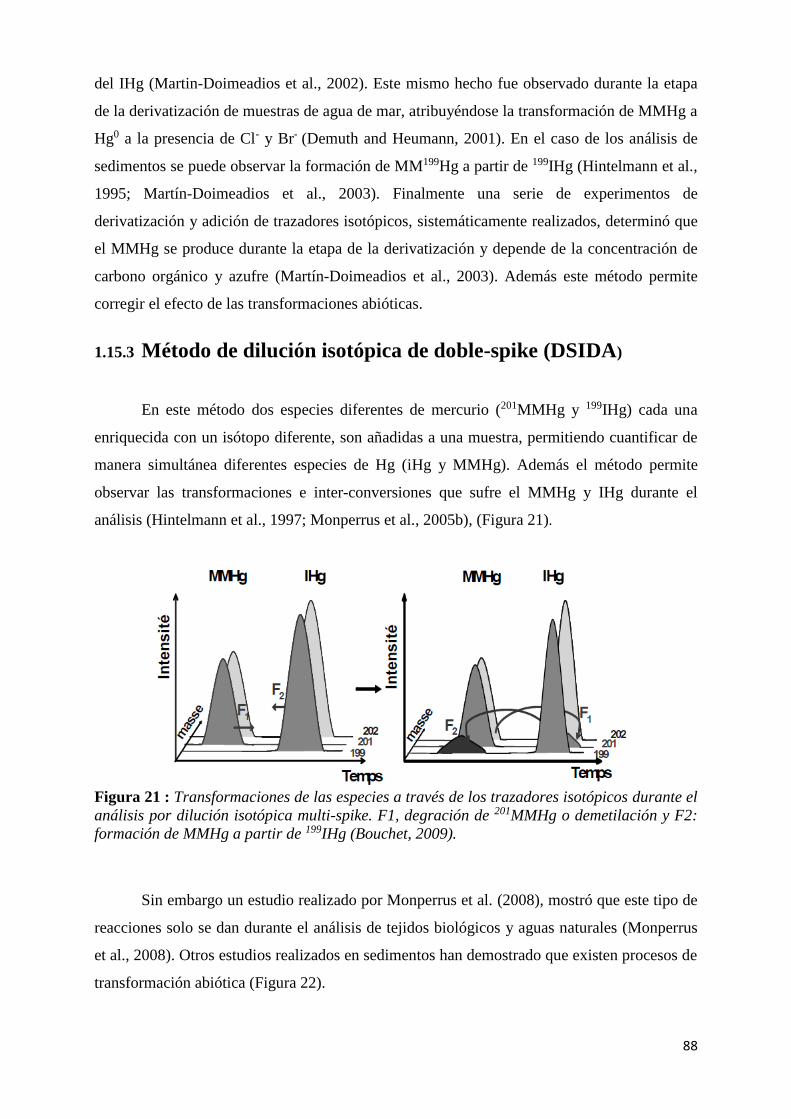
88
del IHg (Martin-Doimeadios et al., 2002). Este mismo hecho fue observado durante la etapa
de la derivatización de muestras de agua de mar, atribuyéndose la transformación de MMHg a
Hg0 a la presencia de Cl- y Br- (Demuth and Heumann, 2001). En el caso de los análisis de
sedimentos se puede observar la formación de MM199Hg a partir de 199IHg (Hintelmann et al.,
1995; Martín-Doimeadios et al., 2003). Finalmente una serie de experimentos de
derivatización y adición de trazadores isotópicos, sistemáticamente realizados, determinó que
el MMHg se produce durante la etapa de la derivatización y depende de la concentración de
carbono orgánico y azufre (Martín-Doimeadios et al., 2003). Además este método permite
corregir el efecto de las transformaciones abióticas.
1.15.3 Método de dilución isotópica de doble-spike (DSIDA)
En este método dos especies diferentes de mercurio (201MMHg y 199IHg) cada una
enriquecida con un isótopo diferente, son añadidas a una muestra, permitiendo cuantificar de
manera simultánea diferentes especies de Hg (iHg y MMHg). Además el método permite
observar las transformaciones e inter-conversiones que sufre el MMHg y IHg durante el
análisis (Hintelmann et al., 1997; Monperrus et al., 2005b), (Figura 21).
Figura 21 : Transformaciones de las especies a través de los trazadores isotópicos durante el
análisis por dilución isotópica multi-spike. F1, degración de 201MMHg o demetilación y F2:
formación de MMHg a partir de 199IHg (Bouchet, 2009).
Sin embargo un estudio realizado por Monperrus et al. (2008), mostró que este tipo de
reacciones solo se dan durante el análisis de tejidos biológicos y aguas naturales (Monperrus
et al., 2008). Otros estudios realizados en sedimentos han demostrado que existen procesos de
transformación abiótica (Figura 22).
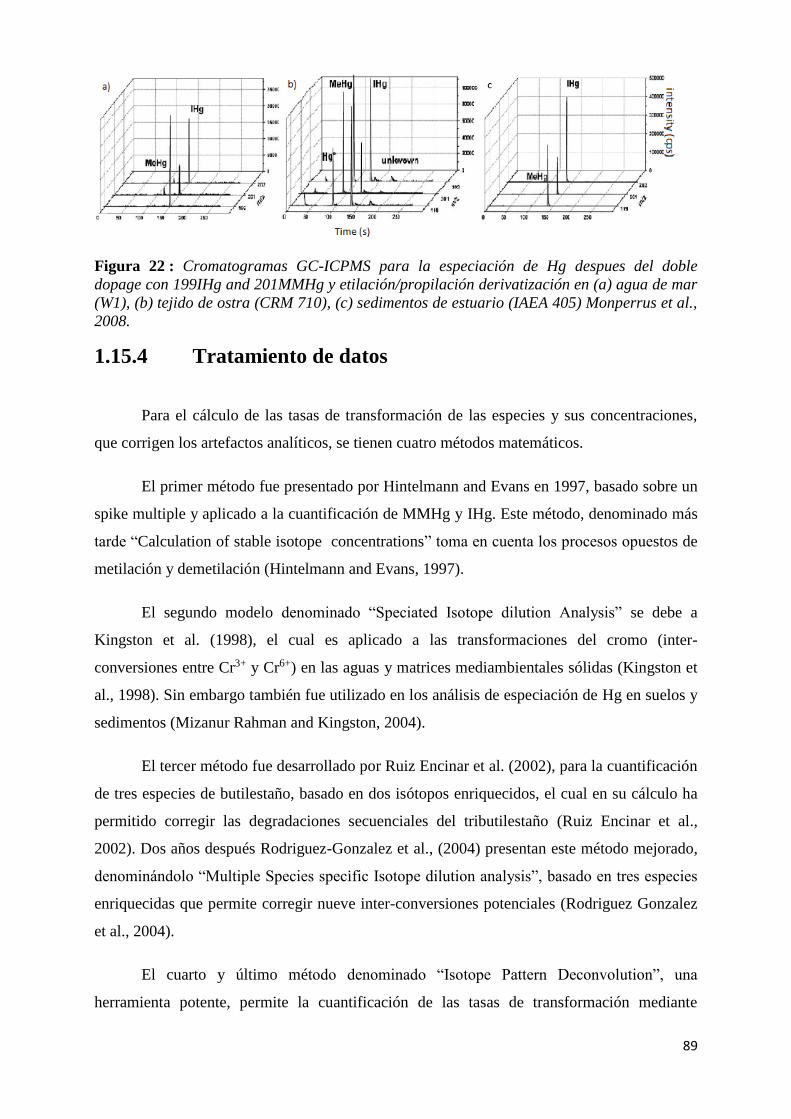
89
Figura 22 : Cromatogramas GC-ICPMS para la especiación de Hg despues del doble
dopage con 199IHg and 201MMHg y etilación/propilación derivatización en (a) agua de mar
(W1), (b) tejido de ostra (CRM 710), (c) sedimentos de estuario (IAEA 405) Monperrus et al.,
2008.
1.15.4 Tratamiento de datos
Para el cálculo de las tasas de transformación de las especies y sus concentraciones,
que corrigen los artefactos analíticos, se tienen cuatro métodos matemáticos.
El primer método fue presentado por Hintelmann and Evans en 1997, basado sobre un
spike multiple y aplicado a la cuantificación de MMHg y IHg. Este método, denominado más
tarde “Calculation of stable isotope concentrations” toma en cuenta los procesos opuestos de
metilación y demetilación (Hintelmann and Evans, 1997).
El segundo modelo denominado “Speciated Isotope dilution Analysis” se debe a
Kingston et al. (1998), el cual es aplicado a las transformaciones del cromo (inter-
conversiones entre Cr3+ y Cr6+) en las aguas y matrices mediambientales sólidas (Kingston et
al., 1998). Sin embargo también fue utilizado en los análisis de especiación de Hg en suelos y
sedimentos (Mizanur Rahman and Kingston, 2004).
El tercer método fue desarrollado por Ruiz Encinar et al. (2002), para la cuantificación
de tres especies de butilestaño, basado en dos isótopos enriquecidos, el cual en su cálculo ha
permitido corregir las degradaciones secuenciales del tributilestaño (Ruiz Encinar et al.,
2002). Dos años después Rodriguez-Gonzalez et al., (2004) presentan este método mejorado,
denominándolo “Multiple Species specific Isotope dilution analysis”, basado en tres especies
enriquecidas que permite corregir nueve inter-conversiones potenciales (Rodriguez Gonzalez
et al., 2004).
El cuarto y último método denominado “Isotope Pattern Deconvolution”, una
herramienta potente, permite la cuantificación de las tasas de transformación mediante
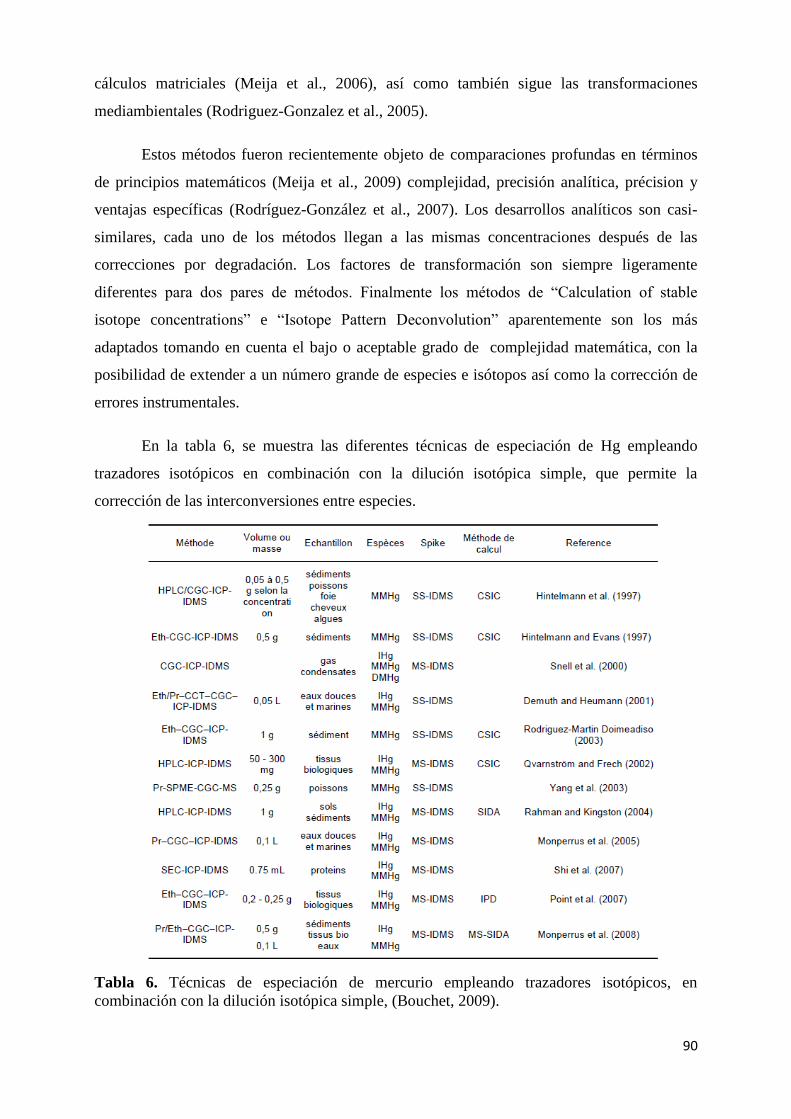
90
cálculos matriciales (Meija et al., 2006), así como también sigue las transformaciones
mediambientales (Rodriguez-Gonzalez et al., 2005).
Estos métodos fueron recientemente objeto de comparaciones profundas en términos
de principios matemáticos (Meija et al., 2009) complejidad, precisión analítica, précision y
ventajas específicas (Rodríguez-González et al., 2007). Los desarrollos analíticos son casi-
similares, cada uno de los métodos llegan a las mismas concentraciones después de las
correcciones por degradación. Los factores de transformación son siempre ligeramente
diferentes para dos pares de métodos. Finalmente los métodos de “Calculation of stable
isotope concentrations” e “Isotope Pattern Deconvolution” aparentemente son los más
adaptados tomando en cuenta el bajo o aceptable grado de complejidad matemática, con la
posibilidad de extender a un número grande de especies e isótopos así como la corrección de
errores instrumentales.
En la tabla 6, se muestra las diferentes técnicas de especiación de Hg empleando
trazadores isotópicos en combinación con la dilución isotópica simple, que permite la
corrección de las interconversiones entre especies.
Tabla 6. Técnicas de especiación de mercurio empleando trazadores isotópicos, en
combinación con la dilución isotópica simple, (Bouchet, 2009).
91
Eth Etilación, Pr Propilación, HPLC High Performance Liquid Chromatography, CGC
Capillary Gas Chromatography, SPME Solid Phase Micro Extraction, SEC Size Exclusion
Chromatography, SS-IDMS Single Species Isotope Dilution Mass Spectrometry, MS-IDMS
Multiple Spike IDMS.
CSIC Calculation of Stable Isotope Concentrations, SIDA Speciated Isotope Dilution
Analysis, IPD Isotopic Pattern Deconvolution, MS-SIDA Multiple Spike SIDA.
1.16 Uso de trazadores isotópicos para investigaciones
ambientales
Los trazadores enriquecidos isotópicamente se han convertido en una herramienta
necesaria para seguir los procesos dinámicos de los contaminantes en el medio ambiente, los
cuales están sujetos a mecanismos complejos e inversos como la adsorción/desorción
(Hintelmann and Harris, 2004), metilación/demetilación (Rodriguez Martin-Doimeadios et
al., 2004), oxidación/reducción (Whalin and Mason, 2006), asimilación/excreción
(Rodriguez-Gonzalez et al., 2005) y transferencia entre diferentes compartamientos
(sedimentos/agua, agua/aire, ..etc.). Una solución que contiene especies isotópicamente
marcados, a diferencia de una solución de composición isotópica natural, está enriquecida
artificialmente con un determinado isótopo del mismo elemento.
Se puede entonces trazar la reactividad de las especies marcadas en cada
compartimiento y pueden ser añadidas al medio bajo diferentes formas químicas. Las
cantidades añadidas están en función de un objetivo inicial, de las transformaciones que se
desea evaluar y de las concentraciones de las especies naturales presentes en la muestra. Para
medios no contaminados generalmente las concentraciones de los isótopos marcados son
bajos y relativamente más elevado cuando se pretende evaluar la respuesta de un medio donde
se observa cambios medioambientales (Bouchet, 2009).
En suma este tipo de método nos ayudan comprender el ciclo biogeoquímico de un
elemento a nivel molecular que puede ser un contaminante, las tasas y la cinética de su
transformación natural en el medio ambiente, en tiempo presente y futuro.
1.16.1 Aproximaciones experimentales
Los métodos experimentales utilizan trazadores isotópicos en diferentes técnicas como
incubaciones experimentales en laboratorio o en el sitio de estudio. La precisión sobre las
92
fracciones isotópicas es excelente y es posible trabajar con trazadores de concentraciones muy
bajas, con el fin de no perturbar el sistema estudiado y detectar las transformaciones mínimas.
El empleo de un método experimental requiere conocer la concentración del isótopo
enriquecido. La determinación de la concentración es realizada mediante el método de la
dilución isotópica inversa. El principio es el mismo que el de la dilución isotópica pero en
este caso, el estándar enriquecido es considerado como una muestra, al cual se añade una
cantidad conocida de estándar natural que es considerado como trazador.
Luego en el protocolo analítico es importante tomar en cuenta que el estándar
introducido esté en la misma forma química que las especies a ser determinadas y que su
adición se realice lo más pronto posible. La proporción entre los dos isótopos considerados
debe ser lo más próximo posible a 1 (uno) para una mejor precisión sobre la medida de la
proporción isotópica (Rodriguez Martin-Doimeadios et al., 2002). Para obtener un equilibrio
óptimo del trazador, debe ser mezclado homogéneamente con la muestra, esto se logra
mediante agitación. Para evitar los problemas de contaminación durante los análisis se debe
trabajar en condiciones “limpias” y se deben tener blancos analíticos de campo y laboratorio,
para su corrección (Monperrus et al., 2004).
Por último se debe tener precaución de tener los instrumentos de separación de los
analitos (GC) así como el instrumento de detección (ICPMS), debidamente optimizados.
1.16.2 Aplicaciones medioambientales
1.16.2.1 Método de la medición de Metilación/Demetilación y Reducción
del Hg en los ecosistemas acuáticos.
El método de medición de las tasas de metilación y demetilación de Hg comienza en el
sitio de estudio, o en sitios experimentales dentro de un laboratorio. El principio así como los
cálculos están resumidos en la figura 23, para el caso de la metilación/demetilación del Hg.
Una o varias especies marcadas isotópicamente (201MMHg para seguir la demetilación y el
199IHg para seguir la metilación) son incubadas en las muestras bajo las mismas condiciones
ambientales del sitio de estudio. Al final del periodo de incubación las conversiones de las
especies pueden ser observadas modificando las fracciones isotópicas de cada especie
introducida.
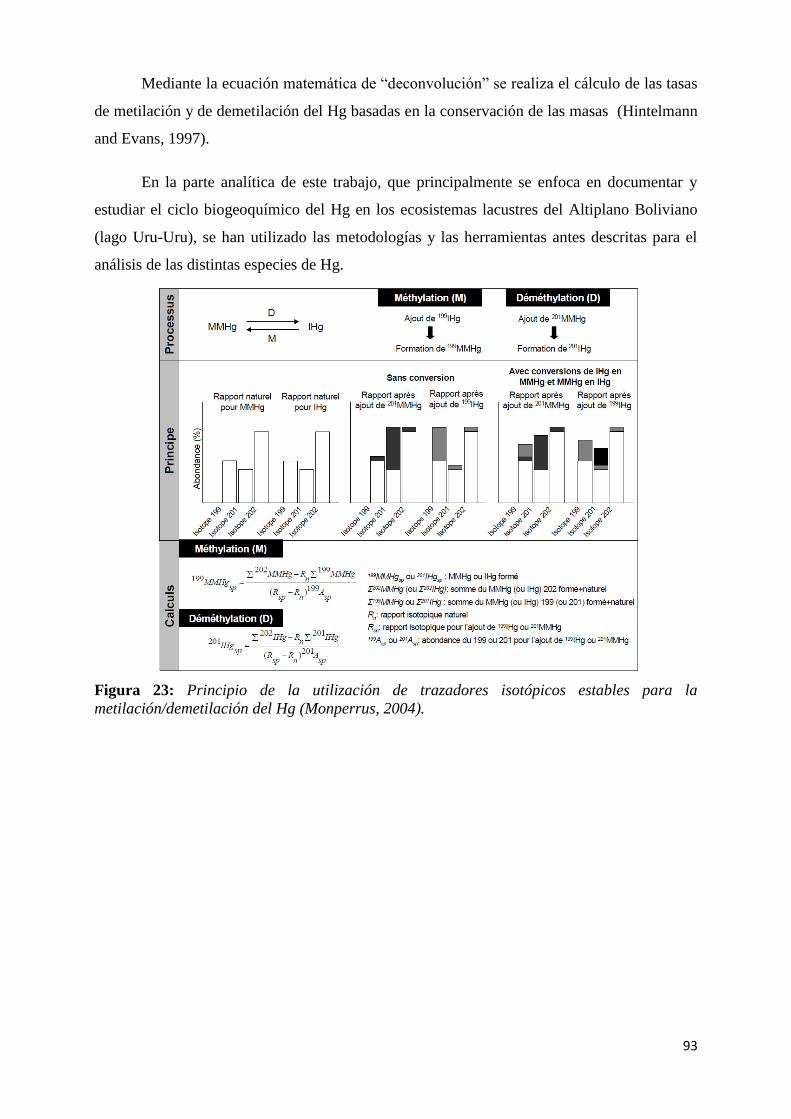
93
Mediante la ecuación matemática de “deconvolución” se realiza el cálculo de las tasas
de metilación y de demetilación del Hg basadas en la conservación de las masas (Hintelmann
and Evans, 1997).
En la parte analítica de este trabajo, que principalmente se enfoca en documentar y
estudiar el ciclo biogeoquímico del Hg en los ecosistemas lacustres del Altiplano Boliviano
(lago Uru-Uru), se han utilizado las metodologías y las herramientas antes descritas para el
análisis de las distintas especies de Hg.
Figura 23: Principio de la utilización de trazadores isotópicos estables para la
metilación/demetilación del Hg (Monperrus, 2004).
94
2. Sitio de estudio
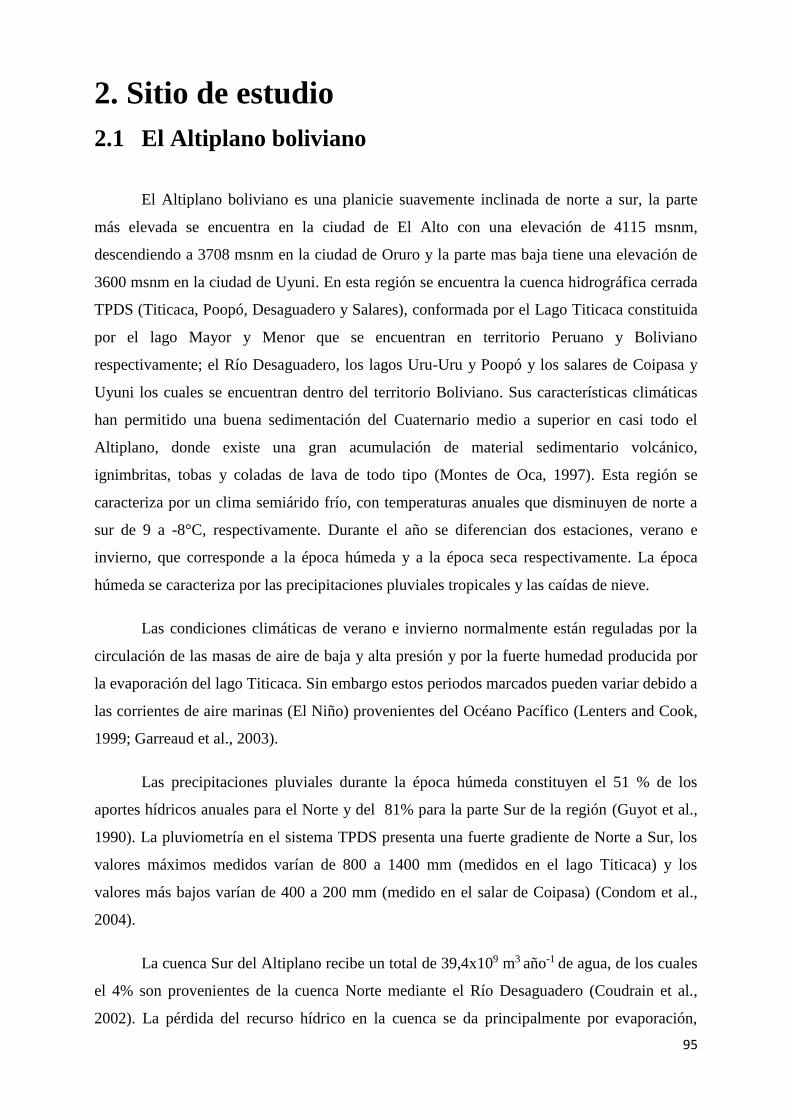
95
2. Sitio de estudio
2.1 El Altiplano boliviano
El Altiplano boliviano es una planicie suavemente inclinada de norte a sur, la parte
más elevada se encuentra en la ciudad de El Alto con una elevación de 4115 msnm,
descendiendo a 3708 msnm en la ciudad de Oruro y la parte mas baja tiene una elevación de
3600 msnm en la ciudad de Uyuni. En esta región se encuentra la cuenca hidrográfica cerrada
TPDS (Titicaca, Poopó, Desaguadero y Salares), conformada por el Lago Titicaca constituida
por el lago Mayor y Menor que se encuentran en territorio Peruano y Boliviano
respectivamente; el Río Desaguadero, los lagos Uru-Uru y Poopó y los salares de Coipasa y
Uyuni los cuales se encuentran dentro del territorio Boliviano. Sus características climáticas
han permitido una buena sedimentación del Cuaternario medio a superior en casi todo el
Altiplano, donde existe una gran acumulación de material sedimentario volcánico,
ignimbritas, tobas y coladas de lava de todo tipo (Montes de Oca, 1997). Esta región se
caracteriza por un clima semiárido frío, con temperaturas anuales que disminuyen de norte a
sur de 9 a -8°C, respectivamente. Durante el año se diferencian dos estaciones, verano e
invierno, que corresponde a la época húmeda y a la época seca respectivamente. La época
húmeda se caracteriza por las precipitaciones pluviales tropicales y las caídas de nieve.
Las condiciones climáticas de verano e invierno normalmente están reguladas por la
circulación de las masas de aire de baja y alta presión y por la fuerte humedad producida por
la evaporación del lago Titicaca. Sin embargo estos periodos marcados pueden variar debido a
las corrientes de aire marinas (El Niño) provenientes del Océano Pacífico (Lenters and Cook,
1999; Garreaud et al., 2003).
Las precipitaciones pluviales durante la época húmeda constituyen el 51 % de los
aportes hídricos anuales para el Norte y del 81% para la parte Sur de la región (Guyot et al.,
1990). La pluviometría en el sistema TPDS presenta una fuerte gradiente de Norte a Sur, los
valores máximos medidos varían de 800 a 1400 mm (medidos en el lago Titicaca) y los
valores más bajos varían de 400 a 200 mm (medido en el salar de Coipasa) (Condom et al.,
2004).
La cuenca Sur del Altiplano recibe un total de 39,4x10⁹ m3 año-1 de agua, de los cuales
el 4% son provenientes de la cuenca Norte mediante el Río Desaguadero (Coudrain et al.,
2002). La pérdida del recurso hídrico en la cuenca se da principalmente por evaporación,
96
estimada en 1600 mm/año. Los vientos dominantes están orientados al Sud-oeste durante la
época húmeda y al Oeste durante la época seca.
En esta región la disponibilidad de oxígeno en el aire es baja y son elevadas las
incidencias de radiación solar y UV debido a la altitud (Blumthaler et al., 1992; Blumthaler et
al., 1997; Zaratti et al., 2003) y su ubicación en la zona tropical a nivel global.
2.2 El lago Uru-Uru
El lago Uru-Uru está ubicado en la parte sud-oriental del Altiplano Boliviano, al sur
de la ciudad de Oruro, a 3600 m de altitud. Al Este está limitado por la cordillera Oriental de
los Andes y al Nor-Oeste por las serranías de Corque-Andamarca. Es un lago que forma parte
de la cuenca endorreica del Altiplano (lago Titicaca, lago Poopó, río Desaguadero y Salares
de Uyuni y Coipasa (TPDS)) de aproximadamente 54 años de edad.
El lago (Fig. 24) fue formado debido al desborde del río Desaguadero a la altura de la
mina La Joya en 1955 (UNEP, 1996). El río Desaguadero se dividió en dos brazos, el brazo
derecho continuo con el antiguo cauce del Río Desaguadero que desemboca en el lago Poopó
y el brazo izquierdo, dirigido hacia el Sur-Este, inundó la planicie de Santo Tomás,
constituyéndo el lago Uru-Uru (PPO-9607, 1996). Posteriormente debajo del sitio Burguillos
a unos kilómetros de la mina La Joya en la rama izquierda se realiza la toma de aguas,
mediante un canal, hacia la planta de concentración de Itos/BAREX y hacia la laguna
Tajarita. Esta laguna intermitente forma una llanura de inundación, la cual es desaguada en la
época de lluvias hacia el lago Uru-Uru a través del río Tajarita (PPO-9607, 1996).
En suma en el Lago Uru-Uru las aguas del Río Desaguadero ingresan por la parte Nor-
Oeste a través del río Tajarita, sobre la que se evacúa las aguas servidas de la mina San José
activa; y por la parte Sud-Oeste del lago ingresa una de las ramas del brazo derecho del río
Desaguadero al cual se debe la formación del lago.
Las aguas del río Tagarete y las aguas utilizadas por la minería, aguas arriba de la
fundición de Vinto, también ingresan en el lago sin recibir ningún tratamiento previo. Las
aguas del río Tagarete son una mezcla de aguas servidas de la ciudad de Oruro y aguas ácidas
de ex mina San José, cuyas concentraciones de materia orgánica y metales pesados son muy
elevadas. En años anteriores estas aguas eran tratadas en la planta de tratamiento de aguas
residuales de Oruro, sin embargo esta planta dejó de funcionar el año 2005 hasta la fecha.
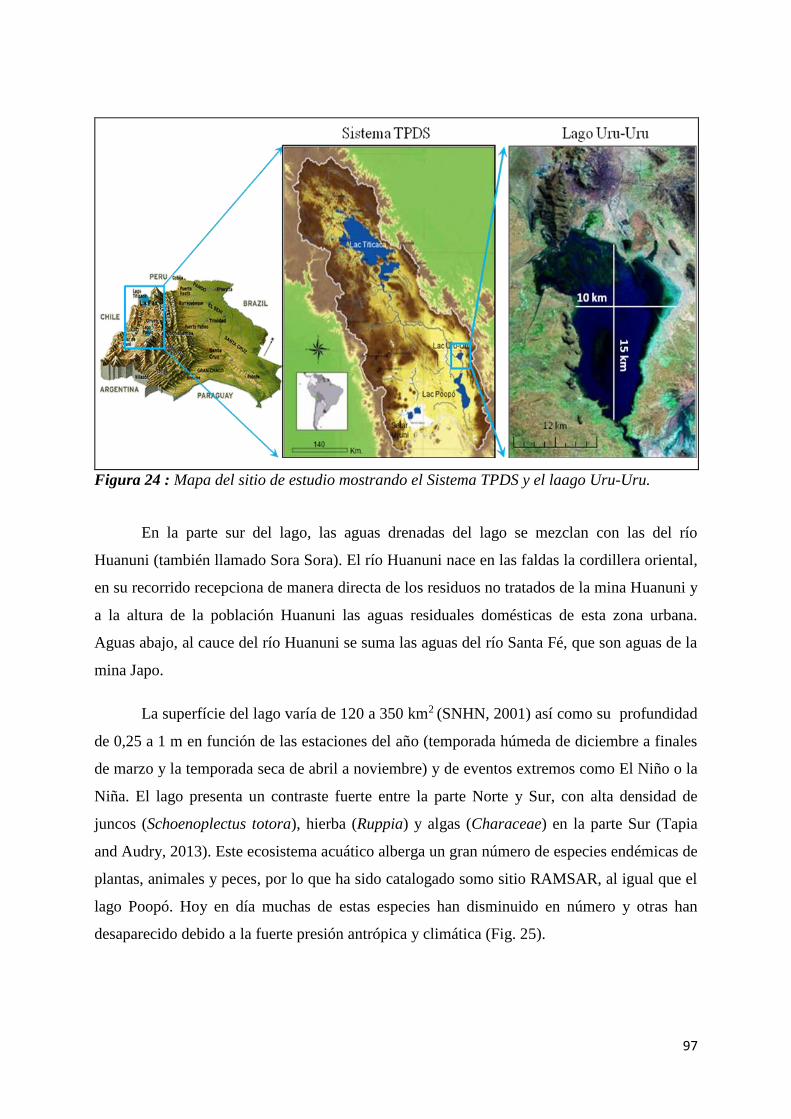
97
Figura 24 : Mapa del sitio de estudio mostrando el Sistema TPDS y el laago Uru-Uru.
En la parte sur del lago, las aguas drenadas del lago se mezclan con las del río
Huanuni (también llamado Sora Sora). El río Huanuni nace en las faldas la cordillera oriental,
en su recorrido recepciona de manera directa de los residuos no tratados de la mina Huanuni y
a la altura de la población Huanuni las aguas residuales domésticas de esta zona urbana.
Aguas abajo, al cauce del río Huanuni se suma las aguas del río Santa Fé, que son aguas de la
mina Japo.
La superfície del lago varía de 120 a 350 km2 (SNHN, 2001) así como su profundidad
de 0,25 a 1 m en función de las estaciones del año (temporada húmeda de diciembre a finales
de marzo y la temporada seca de abril a noviembre) y de eventos extremos como El Niño o la
Niña. El lago presenta un contraste fuerte entre la parte Norte y Sur, con alta densidad de
juncos (Schoenoplectus totora), hierba (Ruppia) y algas (Characeae) en la parte Sur (Tapia
and Audry, 2013). Este ecosistema acuático alberga un gran número de especies endémicas de
plantas, animales y peces, por lo que ha sido catalogado somo sitio RAMSAR, al igual que el
lago Poopó. Hoy en día muchas de estas especies han disminuido en número y otras han
desaparecido debido a la fuerte presión antrópica y climática (Fig. 25).
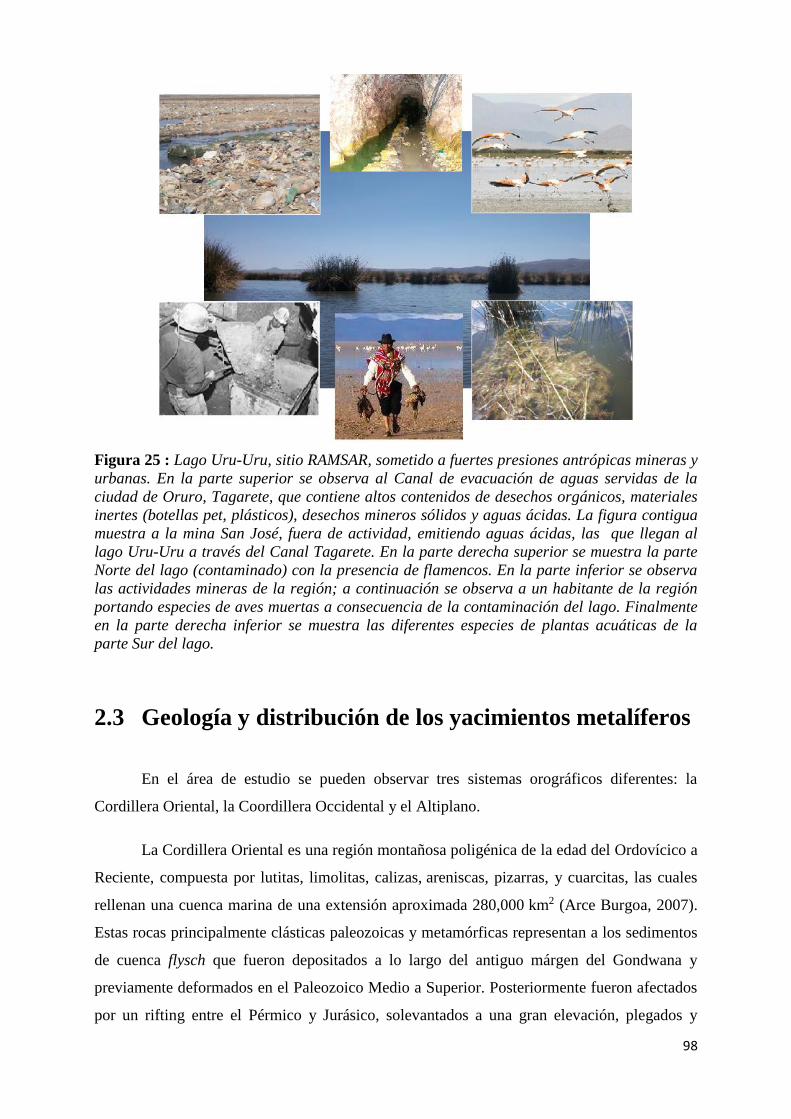
98
Figura 25 : Lago Uru-Uru, sitio RAMSAR, sometido a fuertes presiones antrópicas mineras y
urbanas. En la parte superior se observa al Canal de evacuación de aguas servidas de la
ciudad de Oruro, Tagarete, que contiene altos contenidos de desechos orgánicos, materiales
inertes (botellas pet, plásticos), desechos mineros sólidos y aguas ácidas. La figura contigua
muestra a la mina San José, fuera de actividad, emitiendo aguas ácidas, las que llegan al
lago Uru-Uru a través del Canal Tagarete. En la parte derecha superior se muestra la parte
Norte del lago (contaminado) con la presencia de flamencos. En la parte inferior se observa
las actividades mineras de la región; a continuación se observa a un habitante de la región
portando especies de aves muertas a consecuencia de la contaminación del lago. Finalmente
en la parte derecha inferior se muestra las diferentes especies de plantas acuáticas de la
parte Sur del lago.
2.3 Geología y distribución de los yacimientos metalíferos
En el área de estudio se pueden observar tres sistemas orográficos diferentes: la
Cordillera Oriental, la Coordillera Occidental y el Altiplano.
La Cordillera Oriental es una región montañosa poligénica de la edad del Ordovícico a
Reciente, compuesta por lutitas, limolitas, calizas, areniscas, pizarras, y cuarcitas, las cuales
rellenan una cuenca marina de una extensión aproximada 280,000 km2 (Arce Burgoa, 2007).
Estas rocas principalmente clásticas paleozoicas y metamórficas representan a los sedimentos
de cuenca flysch que fueron depositados a lo largo del antiguo márgen del Gondwana y
previamente deformados en el Paleozoico Medio a Superior. Posteriormente fueron afectados
por un rifting entre el Pérmico y Jurásico, solevantados a una gran elevación, plegados y
99
sobre-escurridos nuevamente durante la compresión andina, la que se habría iniciado en el
Cretácico Superior (McQuarrie et al., 2005).
La Cordillera Occidental consiste en una cadena montañas volcánicas de 750 km de
longitud y 40 km de ancho en promedio. La misma está conformada por flujos de lava y rocas
piroclásticas de edad jurásica tardía y por secuencias marinas de areniscas y limolitas de edad
cretácica temprana (Arce Burgoa, 2007). En Perú y Chile está dominada por flujos y rocas
piroclásticas del Jurásico Superior-Cretácico Inferior y secuencias marinas de areniscas y
limolitas. En el sector boliviano está dominada por estrato-volcanes andesíticos a dacíticos,
formado a partir de aprox. 28 Ma, que definen el estrecho y principal arco magmático
moderno de los Andes Centrales (Arce-Burgoa, 2009).
El Altiplano comprende una cuenca continental del antepaís, de longitud de 850 km y
un ancho de 130 kilómetros aproximadamente. Geomorfológicamente, consiste de una
extensa planicie, interrumpida por serranías aisladas (Arce Burgoa, 2007). Un acortamiento
de la corteza, una rápida subsidencia y una simultánea sedimentación de 15 kilómetros que se
produjeron durante la orogenia andina (USGS and GEOBOL, 1992). El relleno de cuenca
deriva de la erosión de la Cordillera Occidental ocurrida en el Eoceno Superior-Oligoceno.
Los sedimentos más jóvenes son el resultados del acortamiento en la Cordillera Oriental y
Subandino durante el Neógeno (Horton et al., 2002).
En cuanto a la distribución de los yacimientos metalíferos, la parte boliviana de los
Andes Centrales se caracteriza por la presencia de series variadas de yacimientos y de fajas
metalogénicas, que incluyen los depósitos de cobre en estratos-rojos del Mioceno al Plioceno
epitermales del Altiplano, Cordillera Occidental, faja estannífera del Mioceno; las fajas de
oro-antimonio del Paleozoico, y las fajas de plomo-zinc no datadas de la Cordillera Oriental
(Arce-Burgoa, 2009).
Los más de 80 depósitos de cobre se encuentran distribuidos a lo largo del Altiplano
boliviano. Los depósitos de cobre más importante del Altiplano están asociados con diapiros
de yeso que sirven como trampas reductoras locales (Arce-Burgoa, 2009).
La faja polimetálica del Altiplano y de la Cordillera Occidental se compone
principalmente de depósitos epitermales de Ag-Au-Pb-Zn-Cu de intermedia y alta sulfuración
y la zona metalífera enriquecida en Cu, Zn-Pb-(Ag), Pb-(Ag) y Ag-(Au) (Arce-Burgoa, 2009).
En la zona epitermal de baja sulfuración se encuentran los distritos mineros de Pulacayo,
Berenguela, Carangas, Salinas de Garci Mendoza, San Cristóbal, San Antonio de Lípez y
100
Jaquegua y en la zona epitermal de alta sulfuración los distritos mineros de Laurani en el
Altiplano y La Española en la Cordillera Occidental (Arce-Burgoa, 2009).
La faja estannífera de Bolivia tiene una extención de 900 km en dirección Nor-Oeste
a Norte-Sur en la Cordillera Oriental de Bolivia (Turneaure, 1960; Arce-Burgoa, 1990). Los
filones estanníferos hidrotermales de alta ley (1-5% Sn), contienen cantidades importantes de
Ag y W, asociados con granitos peraluminosos e intrusiones de pórfido de las edades del
Pérmico Superior (Arce-Burgoa, 2009), asignables a la serie ilmenita (Sillitoe et al., 1998).
Los depósitos de la faja de estaño se divide en cuatro grupos: pórfidos-(Sn); rocas
volcánicas-(Sn-Ag-Pb-Zn que incluye Ag-Sn); hospedados en rocas sedimentarias (Sn-Ag-
Pb-Zn) que engloba a los yacimientos vetiformes polimetálicos de tipo boliviano; y los
depósitos de estaño-polimetálicos (Sn-W-Au-Zn) relacionados con plutones (Arce-Burgoa,
2009). Los depósitos localizados en la mitad sur de la faja estannífera de Bolivia, incluyen
vetas, vetillas, stockworks y menas diseminadas dentro de una variedad de rocas hospedantes.
El depósito de Llallagua, que produjo más de 1 Mt de Sn, es el mayor depósito de Sn
vetiforme descubierto a nivel mundial (Arce-Burgoa, 2009). Las vetas de Ag-Sn de tipo
Bonanza están hospedadas en complejos de domos volcanogénicos de composición
riodacítica, dacítica y cuarzo latítica (Cunningham et al., 1991).
La mineralización del distrito de Huanuni despliega una profunda zonación, con una
paragénesis de estaño de alta ley en el centro (mina Huanuni), pasando sucesivamente a la
zona W-Sb (mina Quimsa Coya) y la zona polimetálica Ag-Zn-Pb-Sn en el margen (minas
María Francisca, Porvenir y Pepitos). En la zona central la casiterita es el principal mineral de
interés económico, además están presentes otros minerales como pirita, marcasita,
arsenopirita, esfalerita, calcopirita, estanita, pirrotina, bismutita, bismuto nativo, ferberita,
galena, putchblenda. El elevado contenido de Hg en las colas, indica la presencia de minerales
aún no identificados y la ganga incluye una serie de minerales (COMIBOL and Geological,
1995).
2.4 Actividades mineras en el sitio de estudio
La actividad minera en Oruro comienza con la ocupación española en 1557. Los
españoles organizaron el territorio y la población en función de la explotación de la plata
(Ag), además de originar pasivos ambientales en la cuenca del Poopó. A inicios del siglo XX,
el auge del estaño impulso a Oruro como un gran centro minero y comercial (MMAyA,
2015). En 1952 las minas fueron nacionalizadas por el Estado boliviano, siendo la
101
Corporación Minera de Bolivia (COMIBOL) la encargada de la administración y explotación
de las mismas (Michard, 2008). Subsecuentemente la hiperinflación de los años 80 y la
promulgación del Decreto Supremo N° 21060 condujo al retiro paulatino de la COMIBOL de
sus actividades de producción, reduciéndose a administrar las minas y darlas en concesión de
contratos de arrendamiento o de riesgo compartido (Michard, 2008; MMAyA, 2015). Esta
crisis dejó sin empleo a miles de trabajadores, los cuales al no encontrar fuentes laborales en
las ciudades, donde habían migrado, decidieron retornar a las minas. Los trabajadores se
organizaron en cooperativas, la única forma legal que les permitía explotar las minas a pesar
de las bajísimas cotizaciones de los minerales. Varios centros mineros del Estado fueron
entregados a las cooperativas mismas mediante contratos de arrendamiento (Michard, 2008).
De un total de 879 contratos, 540 correponden a las cooperativas mineras, asentadas sobre
139000 hectáreas de superficie, con una exportación minera nacional del 30% (MMAyA,
2015).
En la zona de estudio se distinguen dos distritos mineros importantes, el de San José
que se encuentra ubicada al Nor-Oeste del lago Uru-Uru, en una isla de rocas complejas
ígneas del Terciario (Avila Salinas, 1990 ), que corresponden a la Formación Silúrica de
Uncía; y el de Huanuni ubicado al sud-este del lago Uru-Uru, dentro del cinturón de estaño
Japo-Pucro de la Cordillera Este.
En el distrito minero de San José principalmente se explotaba Ag y Sn desde la época
de la colonia, implementándose, años más tarde (1948), la explotación moderna de Zn, Ag y
Pb. La actividad de la mina cesó en 1992 por razones económicas (Banks et al., 2002).
La actividad minera en el distrito minero de Huanuni data desde la colonia con la
explotación de la plata. La extracción del Sn comenzó a fines del siglo IXX, continuando con
la producción industrial a partir del año 1910. El depósito fue explotado por medio del
método convencional subterráneo, con una capacidad de producción nominal de 1000
toneladas de mineral por día. En el año 1995, el concentrado de estaño alcanzó a 5000 y 8000
t día-1, contando con una planta de tratamiento de mineral denominado Santa Elena. Según el
diseño de la planta, el agua de proceso, las colas de flotación ricas en pirita, los lodos finos de
los tanques y aguas ácidas de pH 4,0, eran descargadas regularmente sobre el río Huanuni
(COMIBOL and Geological, 1995).
En el distrito de Huanuni los yacimientos de sus minerales están compuestos de
minerales hidrotermales dominado por casiterita (SnO2), el cual viene acompañado con varios
102
sulfo rodamiento plata, sales enriquecidas en W, Sb, Ag, Zn y Pb (Moricz et al., 2009 ). En
todo el distrito minero la separación mineral se lleva a cabo mediante molienda del mineral y
la recuperación del metal mediante el proceso de flotación (adición de xantato y ácido
sulfúrico) en combinación con la separación física de los minerales de estaño y plata. Por
último, residuos mineros son generalmente depositados directamente en los ríos limítrofes,
generando drenajes ácidos mineros, pH por debajo de 2 en las aguas de río (Moricz et al.,
2009 ). En el caso de la extracción de oro a gran escala (en su mayoría en el área de Oruro),
estos son recuperados mediante cianuración y fundición. Sin embargo no se tiene información
acerca de la técnica de recuperación de oro por actividades mineras artesanales a pequeña
escala presentes en la zona.
103
3. Problemática
104
3. Problemática
Uno de los mayores problemas medioambientales en Bolivia es concerniente al
impacto de la actividad minera en la región del Altiplano. A este ecosistema árido, de aguas
superficiales escasas, se unen las sequías. Varios metales de interés comercial como oro (Au),
plata (Ag), bismuto (Bi), cobre (Cu), zinc (Zn), wolfram (W), así como otros metales más
específicos como el estaño (Sn) y el antimonio (Sb), contenidos en los yacimientos
polimetálicos vienen siendo explotados a partir de la época colonial. Sin embargo estas
actividades son realizadas de manera descontrolada. Grandes volúmenes de desechos mineros,
colas y aguas de proceso así como efluentes ácidos sin tratamiento son liberadas sobre los ríos
sin ningún tratamiento (COMIBOL and Geological, 1995), constituyendo una fuente
remanente de contaminación para la población y las aguas superficiales de la zona (Garcia
Moreno, 2006; Goix, 2012). A pesar de que el Estado boliviano cuenta con normas para el
cuidado del medio ambiente, enmarcado dentro de la Ley 1333, muy poco ha sido
implementado políticas gubernamentales que mitiguen la contaminación producida.
En los últimos años el uso del agua ha dado lugar al enfrentamiento entre mineros y
comunidades dedicadas a la agricultura, quienes se encuentran en dificultad para encontrar
fuentes de agua libre de metales pesados. Al mismo tiempo la minería demanda más agua,
presenta dificultades tecnológicas y económicas para introducir tecnologías limpias, mientras
continúa con la contaminación de los cuerpos de agua (MMAyA, 2015).
Un claro ejemplo de ecosistema acuático impactado por la actividad minera y urbana
es el lago Uru-Uru. El lago Uru-Uru, una zona húmeda extremadamente frágil que abriga
fauna y flora variada, se comporta como un gran reactor biogeoquímico caracterizado de
Norte a Sur, por gradientes en la conductividad (8,7-5,0 mS cm-1), materia orgánica (22,0-
13,4 mg L-1) y oxígeno disuelto (4,6-5,1 mg L-1) concentración que ha sido medida con
respecto a la saturación de oxígeno del aire en situ. Los mecionados valores corresponden a 2
y 4 mg L-1 a nivel del mar (siendo la tasa de saturación del 60% en O2 a 3800 m, mientras que
a nivel del mar se tiene 100% de saturación en O2). La profundidad varía entre 0,2 y 0,7 m.
La influencia de la actividad minera y urbana no controladas acoplada a los efectos climáticos
y el funcionamiento bioquímico poco conocido de este ecosistema de altitud, constituyen tres
factores potenciales que pueden explicar la pérdida masiva de la biodiversidad y la
productividad observada (desaparisión de especies piscícolas endémicas y disminución de la
actividad de la pesca: 3380 t año-1 (1990) a 550 t año-1 (1992) (PPO-9612, 1996).
105
Estudios realizados dentro del Proyecto Piloto Oruro mostraron una acumulación de
Hg en las totoras (Scirpus californicus), en los sedimentos (PPO-9607, 1996), y en los
hígados de los flamencos (0,1-0,6 mg Kg-1) del lago Uru-Uru (PPO-9612, 1996). La
acumulación de Hg en los peces también se hace evidente. El estudio realizado por Molina et
al., (2012), muestra que los peces del lago Uru-Uru y Poopó, contienen importantes
concentraciones de Hg (Molina et al., 2012), que si bien no sobrepan los niveles límite dados
por la OMS, constituyen una potencial fuente de contaminación por Hg para la población
consumidora de pescado y la fauna silvestre. La presencia de Hg en los flamencos y peces
indica que el Hg presente en el lago, luego de su transformación al compuesto neurotóxico
MMHg, se ha bioacumulado y subsecuentemente biomagnificado.
De estos estudios surgen las preguntas sobre: (i) la fuente del Hg, los procesos
bioquímicos que controlan su movilidad y los procesos de interacción entre compartimientos
sedimentarios, agua, plantas y sistemas tróficos en un ecosistema de gradientes fisicoquímicas
importantes; (ii) los procesos que ocurren en los ecosistemas de altitud para la producción de
MMHg. Para dar respuesta a estas preguntas, en el presente trabajo se ha utilizó tecnologías
analíticas modernas (GC-ICP-MS) y métodos analíticos nuevos.
La producción de MMHg es un proceso clave que dirige la bioacumulación del Hg en
la cadena alimentaria y los procesos de metilación y demetilación son los mayores patrones de
transformación que regulan la producción neta de MMHg.
106
4. Objetivos de la tesis
107
4. Objetivos de la tesis
El presente estudio realizado en el lago Uru-Uru, ecosistema acuático que se encuentra
en una región de condiciones ambientales extremas y sometido a fuertes presiones
antropogénicas mineras y urbanas, tiene como objetivos:
➢ Documentar los niveles de concentración de las diferentes especies de Hg, metales,
metaloides (tales como Fe, Mn, Sb, Ti, W) y elementos mayoritarios en diferentes
matrices del lago (aguas, sedimentos y aguas intersticiales), con respecto a cambios
temporales de la región (época seca y húmeda) y espaciales del lago (transecto Norte-
Sur).
➢ En base a los resultados obtenidos en el objetivo precedente estudiar los efectos de los
efluentes mineros y urbanos, sobre los niveles de distribución de monometilmercurio
en el lago poco profundo Uru-Uru.
➢ Documentar la reactividad y la transformación de las especies de Hg y su flujo entre
los diferentes compartimientos (agua/sedimento/material particulado/agregados bio-
orgánicos flotantes/perifiton de totoras) respecto a cambios temporales (época húmeda
y seca) y espaciales (sitios Norte y Sur). Para este objetivo son determinados los
potenciales de metilación (M) y demetilación (D) en los diferentes compartimientos,
mediante experimentos, in situ, en los que se utiliza trazadores isotópicos estables
enriquecidos en 199IHg y MM201Hg.
108
5. Capítulo II: Synergistic effects of
mining and urban effluents on the level
and distribution of methylHg in a
shallow aquatic ecosystem of the
Bolivian Altiplano
109
Introducción
En los sitios Norte (contaminado) y Sur (no contaminado) de lago Uru-Uru se
observaron altos porcentajes de MMHg (23-68%) en forma disuelta respecto del HgT. En este
ecosistema las incidencias de radiación solar y UV son las más elevadas a nivel terrestre, pero
parece que su efecto es limitado para una efectiva descomposición del MMHg y el
consecuente proceso de fotoreducción del Hg2+. Por lo que se piensa que deben existir otros
patrones u otros factores que rigen y regulan el comportamiento del MMHg en la columna de
agua.
Por otro lado, las diferentes formas mercuriales (especies), medidas a lo largo del lago
Uru-Uru, pone en evidencia la alta reactividad de este elemento. Sin embargo aún se
desconoce su fuente, la cual pobablemente podría ser de origen antropogénico o natural o
ambas. Por lo que en este en este capítulo se aborda el estudio de la influencia de las
descargas de metales pesados, flujos ácidos mineros y flujos urbanos con altos contenidos de
materia orgánica, sobre la distribución del mercurio en la columna de agua del ecosistema
acuático del Uru-Uru.
Para este estudio se ha realizado el seguimiento espacio-temporal de la distribución de
las diferentes especies de Hg, metales pesados, metaloides y elementos mayoritarios en las
aguas, aguas intersticiales y sedimentos del lago. Los resultados obtenidos muestran altas
concentraciones de Hg, metales pesados, metaloides en los sedimentos y aguas colectados a lo
largo del transecto del lago y en la confluencia de las aguas del lago con los efluentes de
mina, aguas abajo del lago. Correlaciones entre el Hg y elementos típicos mineros, indican
que la principal fuente de Hg está relacionada con las actividades mineras. Los altos
porcentajes de MMHg en forma disuelta se llegan a ~50% en promedio a lo largo del
transecto del lago y en las dos épocas del año. En condiciones de pH alcalino probablemente
la alta disponibilidad de MMHg esté relacionada con la formación de complejos estables
cuyos ligandos podrían ser de naturaleza orgánica o que se encuentre en forma de coloides,
limitando la fotoredución del Hg. Los coeficientes de partición y flujos difusivos calculados
en base a las concentraciones de MMHg y Hg ambos en forma disuelta, en las aguas
intersticiales, sedimentos y columna de agua muestran que durante la época seca existe un
aporte significativo de MMHg desde la capa superficial de los sedimentos hacia la columna
de agua, pero no significativo para la época húmeda. Es probable que en esta época existan

110
aportes adicionales de MMHg en la columna de agua del lago desde los suelos y/o aportes
debidos a fenómenos de bioturbación y advección física que ocurren en el medio.
111
Synergistic effects of mining and urban effluents on the
level and distribution of methylHg in a shallow aquatic
ecosystem of the Bolivian Altiplano
L. Alanoca1,2, S. Guédron*2,3,4, D. Amouroux5, 6, S. Audry1, M. Monperrus5, E. Tessier5,
S. Goix1, D. Acha6, P. Seyler1 and D. Point1, 6.
1Géosciences Environnement Toulouse, UMR5563 - IRD UR 234, Université Paul Sabatier,
14 Avenue Edouard Belin 31400 Toulouse, France.
2Laboratorio de Hidroquímica - Instituto de Investigaciones Químicas - Universidad Mayor de
San Andres, Campus Universitario de Cota Cota, casilla 3161, La Paz, Bolivia.
3Institut de Recherche pour le Développement, ISTerre– UMR 5275, F-38041 Grenoble,
France.
4Université Grenoble Alpes, Institut desSciences de la Terre (ISTerre), F-38041 Grenoble,
France.
5Laboratoire de Chimie Analytique Bio-inorganique et Environnement (LCABIE), Institut des
Sciences Analytiques et de Physico-Chimie pour l’Environnement et les Matériaux, IPREM
UMR 5254 CNRS - Université de Pau et des Pays de l’Adour, Hélioparc Pau Pyrénées, 2, av.
P. Angot, 64053 Pau cedex 9, France.
6Laboratorio de Calidad Ambiental (LCA) – Instituto de Ecologia - Universidad Mayor de
San Andres, Campus Universitario de Cota Cota, casilla 3161, La Paz, Bolivia.
*corresponding author:
S. Guédron
Email: [email protected]
112
Abstract
Lake Uru-Uru (3686 m a.s.l.) located on the Bolivian altiplano region receives both mining
effluents and urban wastewater discharges originating from surrounding local cities under
rapid development.
We followed the spatio-temporal distribution of different Hg (Hg) compounds and other
metal(oid)s (e.g., Fe, Mn, Sb, Ti and W) in both water and sediments during the wet and dry
seasons along a North-South transect of this shallow lake system. Along the transect, highest
Hg and metal(oid) concentrations in both water and sediments were found downstream the
confluences with mining effluents. Although a dilution effect was found for major elements
during the wet season, mean Hg and metal(oid) concentrations did not significantly differed
from the dry season due to the rise of acid mine drainage (AMD) inputs into the lake from
upstream mining areas. In particular, high filtered (< 0.45µm) mono-methylHg (MMHg)
concentrations (0.69 ± 0.47 ng L-1) were measured in surface water representing 49 ± 11% of
the total filtered Hg concentrations (THgF) for both seasons. Enhanced MMHg lability in
relation with the water alkalinity, coupled with abundant organic ligands and colloids
(especially for downstream mining effluents), are likely favoring factors for Hg methylation,
while inhibiting Hg photodegradation. Lake sediments were identified as the major source of
MMHg for the shallow water column. During the dry season, diffusive fluxes were estimated
to 227 ng m-2 day-1 for MMHg. This contribution was found negligible during the wet season
due to the probable shift of the redox front downwards in the sediment. During the wet
season, the results obtained suggest that various sources such as mining effluents and benthic
or macrophytic biofilms significantly contribute to MMHg inputs in the water column.
This work demonstrates the seasonally dependent synergistic effect of AMD and urban
effluents on shallow productive and evaporative high altitude lake ecosystems promoting the
formation of natural organometallic toxins like MMHg in the water column.
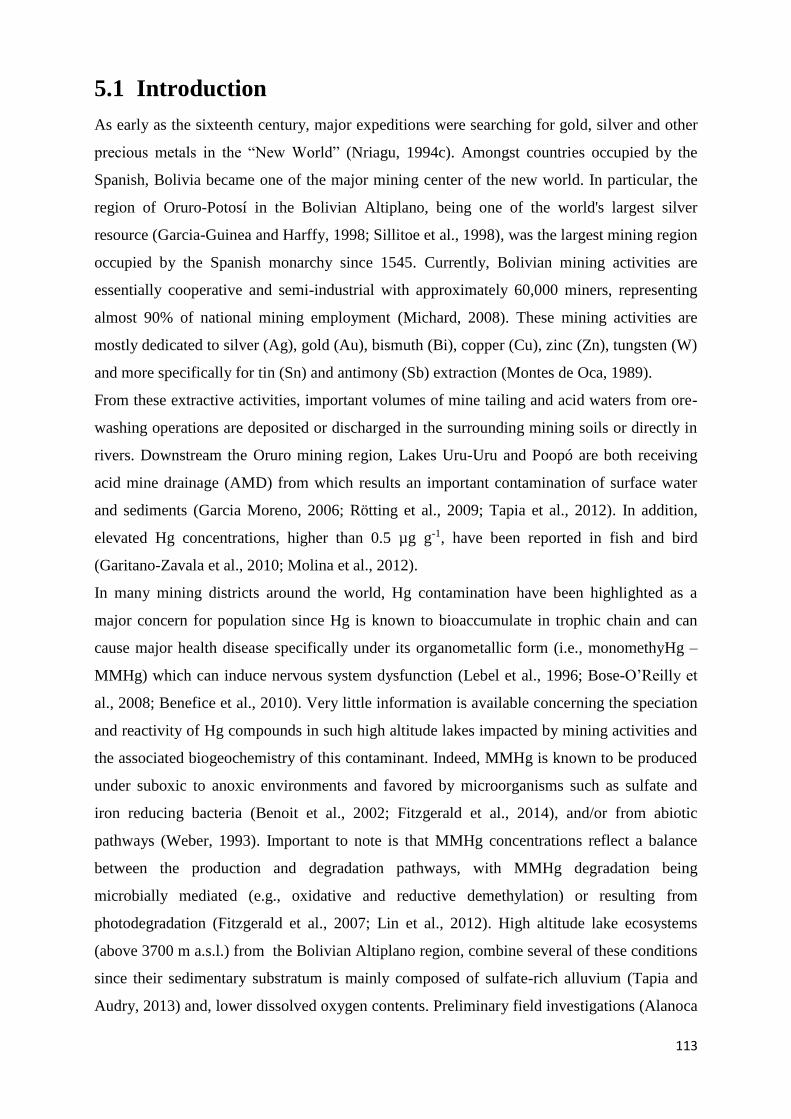
113
5.1 Introduction
As early as the sixteenth century, major expeditions were searching for gold, silver and other
precious metals in the “New World” (Nriagu, 1994c). Amongst countries occupied by the
Spanish, Bolivia became one of the major mining center of the new world. In particular, the
region of Oruro-Potosí in the Bolivian Altiplano, being one of the world's largest silver
resource (Garcia-Guinea and Harffy, 1998; Sillitoe et al., 1998), was the largest mining region
occupied by the Spanish monarchy since 1545. Currently, Bolivian mining activities are
essentially cooperative and semi-industrial with approximately 60,000 miners, representing
almost 90% of national mining employment (Michard, 2008). These mining activities are
mostly dedicated to silver (Ag), gold (Au), bismuth (Bi), copper (Cu), zinc (Zn), tungsten (W)
and more specifically for tin (Sn) and antimony (Sb) extraction (Montes de Oca, 1989).
From these extractive activities, important volumes of mine tailing and acid waters from ore-
washing operations are deposited or discharged in the surrounding mining soils or directly in
rivers. Downstream the Oruro mining region, Lakes Uru-Uru and Poopó are both receiving
acid mine drainage (AMD) from which results an important contamination of surface water
and sediments (Garcia Moreno, 2006; Rötting et al., 2009; Tapia et al., 2012). In addition,
elevated Hg concentrations, higher than 0.5 µg g-1, have been reported in fish and bird
(Garitano-Zavala et al., 2010; Molina et al., 2012).
In many mining districts around the world, Hg contamination have been highlighted as a
major concern for population since Hg is known to bioaccumulate in trophic chain and can
cause major health disease specifically under its organometallic form (i.e., monomethyHg –
MMHg) which can induce nervous system dysfunction (Lebel et al., 1996; Bose-O’Reilly et
al., 2008; Benefice et al., 2010). Very little information is available concerning the speciation
and reactivity of Hg compounds in such high altitude lakes impacted by mining activities and
the associated biogeochemistry of this contaminant. Indeed, MMHg is known to be produced
under suboxic to anoxic environments and favored by microorganisms such as sulfate and
iron reducing bacteria (Benoit et al., 2002; Fitzgerald et al., 2014), and/or from abiotic
pathways (Weber, 1993). Important to note is that MMHg concentrations reflect a balance
between the production and degradation pathways, with MMHg degradation being
microbially mediated (e.g., oxidative and reductive demethylation) or resulting from
photodegradation (Fitzgerald et al., 2007; Lin et al., 2012). High altitude lake ecosystems
(above 3700 m a.s.l.) from the Bolivian Altiplano region, combine several of these conditions
since their sedimentary substratum is mainly composed of sulfate-rich alluvium (Tapia and
Audry, 2013) and, lower dissolved oxygen contents. Preliminary field investigations (Alanoca
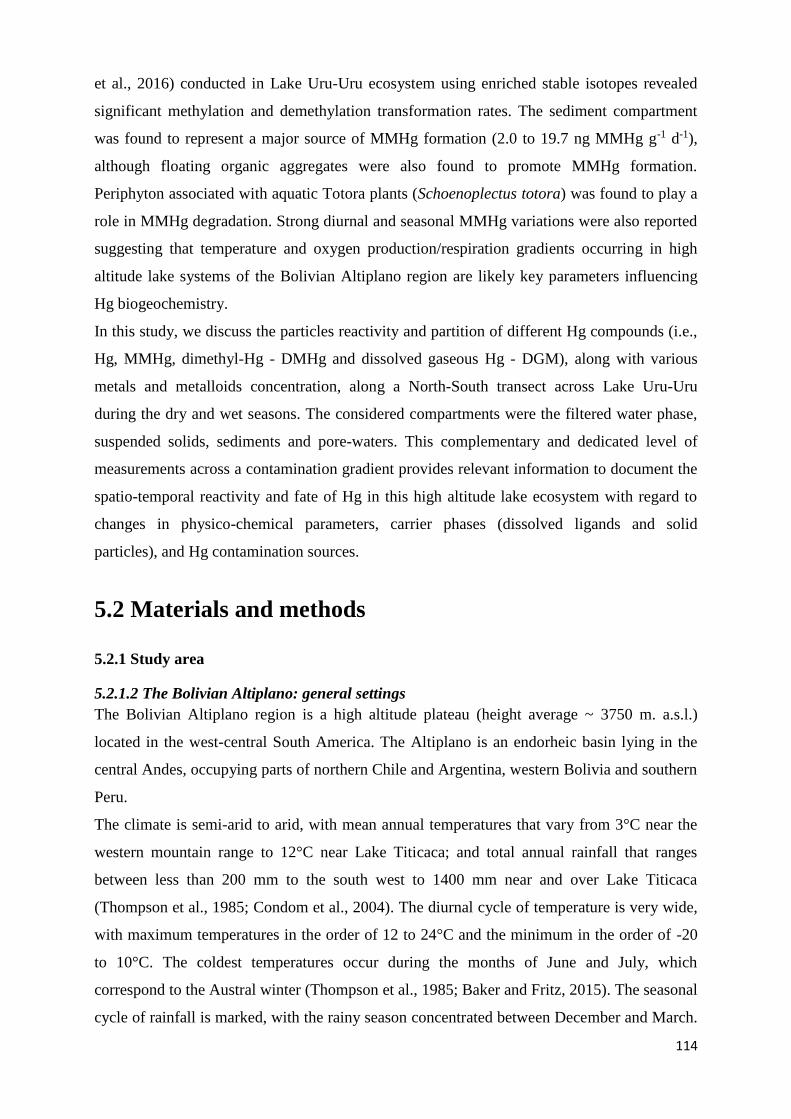
114
et al., 2016) conducted in Lake Uru-Uru ecosystem using enriched stable isotopes revealed
significant methylation and demethylation transformation rates. The sediment compartment
was found to represent a major source of MMHg formation (2.0 to 19.7 ng MMHg g-1 d-1),
although floating organic aggregates were also found to promote MMHg formation.
Periphyton associated with aquatic Totora plants (Schoenoplectus totora) was found to play a
role in MMHg degradation. Strong diurnal and seasonal MMHg variations were also reported
suggesting that temperature and oxygen production/respiration gradients occurring in high
altitude lake systems of the Bolivian Altiplano region are likely key parameters influencing
Hg biogeochemistry.
In this study, we discuss the particles reactivity and partition of different Hg compounds (i.e.,
Hg, MMHg, dimethyl-Hg - DMHg and dissolved gaseous Hg - DGM), along with various
metals and metalloids concentration, along a North-South transect across Lake Uru-Uru
during the dry and wet seasons. The considered compartments were the filtered water phase,
suspended solids, sediments and pore-waters. This complementary and dedicated level of
measurements across a contamination gradient provides relevant information to document the
spatio-temporal reactivity and fate of Hg in this high altitude lake ecosystem with regard to
changes in physico-chemical parameters, carrier phases (dissolved ligands and solid
particles), and Hg contamination sources.
5.2 Materials and methods
5.2.1 Study area
5.2.1.2 The Bolivian Altiplano: general settings
The Bolivian Altiplano region is a high altitude plateau (height average ~ 3750 m. a.s.l.)
located in the west-central South America. The Altiplano is an endorheic basin lying in the
central Andes, occupying parts of northern Chile and Argentina, western Bolivia and southern
Peru.
The climate is semi-arid to arid, with mean annual temperatures that vary from 3°C near the
western mountain range to 12°C near Lake Titicaca; and total annual rainfall that ranges
between less than 200 mm to the south west to 1400 mm near and over Lake Titicaca
(Thompson et al., 1985; Condom et al., 2004). The diurnal cycle of temperature is very wide,
with maximum temperatures in the order of 12 to 24°C and the minimum in the order of -20
to 10°C. The coldest temperatures occur during the months of June and July, which
correspond to the Austral winter (Thompson et al., 1985; Baker and Fritz, 2015). The seasonal
cycle of rainfall is marked, with the rainy season concentrated between December and March.
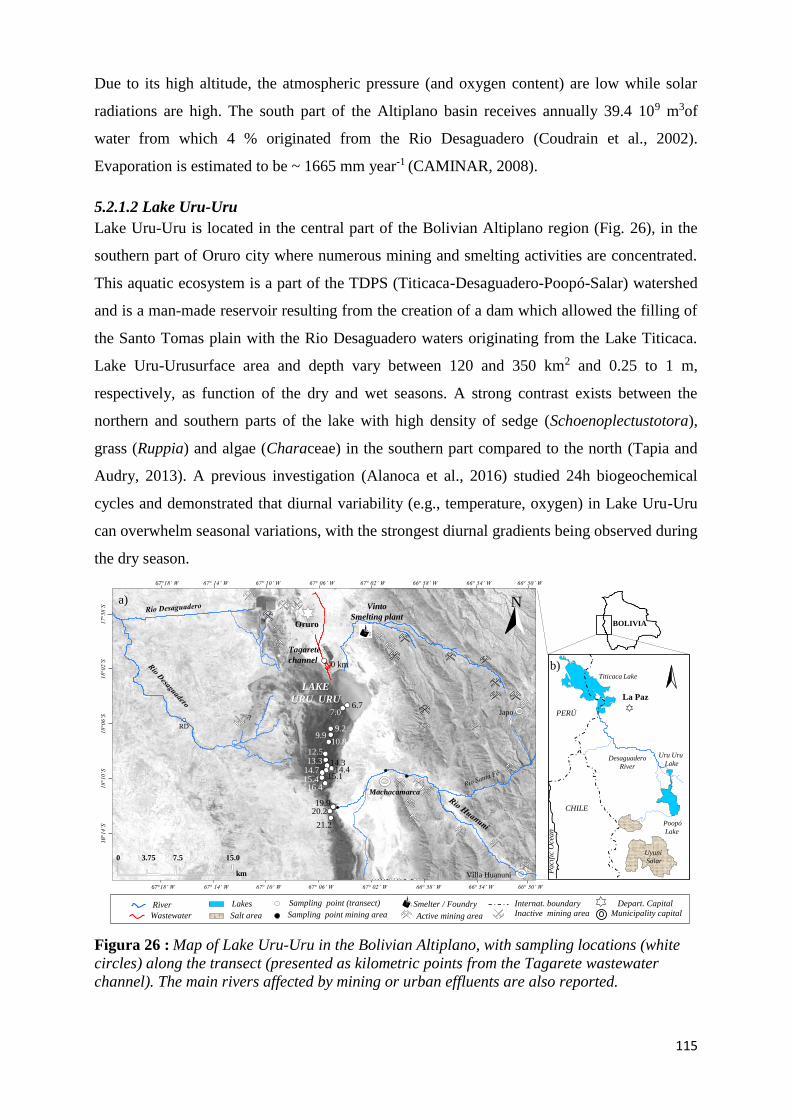
115
Due to its high altitude, the atmospheric pressure (and oxygen content) are low while solar
radiations are high. The south part of the Altiplano basin receives annually 39.4 109 m3of
water from which 4 % originated from the Rio Desaguadero (Coudrain et al., 2002).
Evaporation is estimated to be ~ 1665 mm year-1 (CAMINAR, 2008).
5.2.1.2 Lake Uru-Uru
Lake Uru-Uru is located in the central part of the Bolivian Altiplano region (Fig. 26), in the
southern part of Oruro city where numerous mining and smelting activities are concentrated.
This aquatic ecosystem is a part of the TDPS (Titicaca-Desaguadero-Poopó-Salar) watershed
and is a man-made reservoir resulting from the creation of a dam which allowed the filling of
the Santo Tomas plain with the Rio Desaguadero waters originating from the Lake Titicaca.
Lake Uru-Urusurface area and depth vary between 120 and 350 km2 and 0.25 to 1 m,
respectively, as function of the dry and wet seasons. A strong contrast exists between the
northern and southern parts of the lake with high density of sedge (Schoenoplectustotora),
grass (Ruppia) and algae (Characeae) in the southern part compared to the north (Tapia and
Audry, 2013). A previous investigation (Alanoca et al., 2016) studied 24h biogeochemical
cycles and demonstrated that diurnal variability (e.g., temperature, oxygen) in Lake Uru-Uru
can overwhelm seasonal variations, with the strongest diurnal gradients being observed during
the dry season.
14.4
b)Titicaca Lake
Desaguadero
River
Poopó
Lake
Uyuni
Salar
La Paz
Uru Uru
Lake
PERÚ
CHILE
Pa
cifi
c O
cea
n
18 1
4’S
18 1
0’S
18 0
6’S
18 0
2’S
17 5
8’S
67 18’ W 67 14’ W 67 10’ W 67 06’ W 67 02’ W 66 58’ W 66 54’ W 66 50’ W
LAKE
URU URU6.7
7.0
9.29.9
10.8
12.513.3
15.115.416.4
Tagarete
channel
Vinto
Smelting plant
Villa Huanuni
N
0 km
19.920.2
21.2
a)
Japo
0 3.75 7.5 15.0
RD
14.314.7
km
14.4
Oruro
67 18’ W 67 14’ W 67 10’ W 67 06’ W 67 02’ W 66 58’ W 66 54’ W 66 50’ W
Machacamarca
BOLIVIA
Active mining area
Smelter / FoundryRiver
Wastewater Municipality capital
Sampling point (transect)
Sampling point mining area
Lakes
Salt area
Depart. Capital Internat. boundaryInactive mining area
?
Figura 26 : Map of Lake Uru-Uru in the Bolivian Altiplano, with sampling locations (white
circles) along the transect (presented as kilometric points from the Tagarete wastewater
channel). The main rivers affected by mining or urban effluents are also reported.
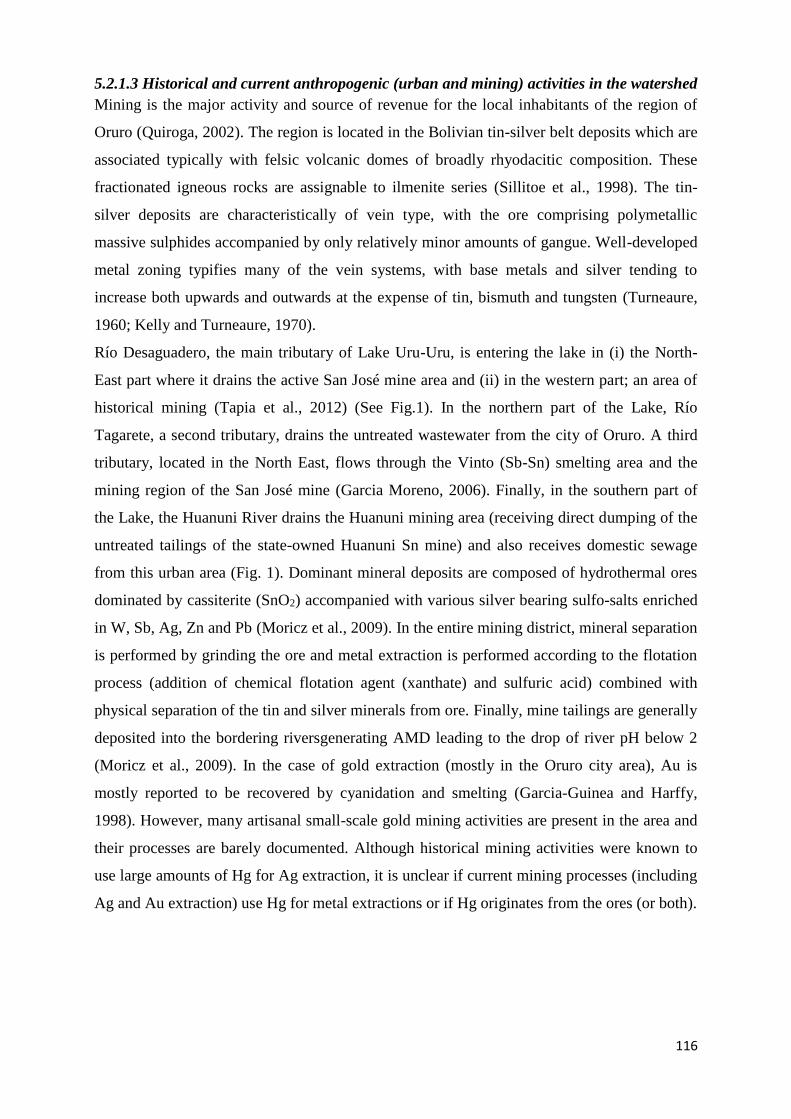
116
5.2.1.3 Historical and current anthropogenic (urban and mining) activities in the watershed
Mining is the major activity and source of revenue for the local inhabitants of the region of
Oruro (Quiroga, 2002). The region is located in the Bolivian tin-silver belt deposits which are
associated typically with felsic volcanic domes of broadly rhyodacitic composition. These
fractionated igneous rocks are assignable to ilmenite series (Sillitoe et al., 1998). The tin-
silver deposits are characteristically of vein type, with the ore comprising polymetallic
massive sulphides accompanied by only relatively minor amounts of gangue. Well-developed
metal zoning typifies many of the vein systems, with base metals and silver tending to
increase both upwards and outwards at the expense of tin, bismuth and tungsten (Turneaure,
1960; Kelly and Turneaure, 1970).
Río Desaguadero, the main tributary of Lake Uru-Uru, is entering the lake in (i) the North-
East part where it drains the active San José mine area and (ii) in the western part; an area of
historical mining (Tapia et al., 2012) (See Fig.1). In the northern part of the Lake, Río
Tagarete, a second tributary, drains the untreated wastewater from the city of Oruro. A third
tributary, located in the North East, flows through the Vinto (Sb-Sn) smelting area and the
mining region of the San José mine (Garcia Moreno, 2006). Finally, in the southern part of
the Lake, the Huanuni River drains the Huanuni mining area (receiving direct dumping of the
untreated tailings of the state-owned Huanuni Sn mine) and also receives domestic sewage
from this urban area (Fig. 1). Dominant mineral deposits are composed of hydrothermal ores
dominated by cassiterite (SnO2) accompanied with various silver bearing sulfo-salts enriched
in W, Sb, Ag, Zn and Pb (Moricz et al., 2009). In the entire mining district, mineral separation
is performed by grinding the ore and metal extraction is performed according to the flotation
process (addition of chemical flotation agent (xanthate) and sulfuric acid) combined with
physical separation of the tin and silver minerals from ore. Finally, mine tailings are generally
deposited into the bordering riversgenerating AMD leading to the drop of river pH below 2
(Moricz et al., 2009). In the case of gold extraction (mostly in the Oruro city area), Au is
mostly reported to be recovered by cyanidation and smelting (Garcia-Guinea and Harffy,
1998). However, many artisanal small-scale gold mining activities are present in the area and
their processes are barely documented. Although historical mining activities were known to
use large amounts of Hg for Ag extraction, it is unclear if current mining processes (including
Ag and Au extraction) use Hg for metal extractions or if Hg originates from the ores (or both).
117
5.2.2 Sample strategy
5.2.2.1 Sampling Strategy
Surface water and surface sediments (0-2 cm) were collected in the late dry season (October
2010) and wet (May 2011) to characterize the major hydrological contrast, along a North-
South transect in the Lake Uru-Uru and its tributaries (i.e., Río Desaguadero, El Choro and
Río Huanuni). Two additional samples were collected in the northern part of Lake Poopó
(Fig. 1). All samples were collected between 12:00 and 15:00 PM (the period of maximum
insolation), for a meaningful comparison of samples collected along the transect to minimize
the confounding effect of diurnal variability (Alanoca et al., 2016).
5.2.2.2 Sample conditioning
All details for the sampling and analytical procedure are described in Alanoca et al., (2016a)
(Alanoca et al., 2016) and supplementary information (SI.1). Briefly, all filtered and
unfiltered surface water samples for Hg speciation were collected in acid-washed FEP Teflon
containers (Cossa et al., 1995), filtered with 0.45-µm PVDF filters (Millipore, Bedford, MA,
USA) and acidified with HCl (1 %, v/v, Ultrex grade - Baker). Besides, filtered subsamples
for metals and cations were stored in acid washed Polypropylene 15 mL vials and acidified
with HNO3 (1% v/v, Ultrex grade - Baker). Filtered subsamples for dissolved organic carbon
(DOC), were stored in 40-ml pre-burnt (550°C) borosilicate vials and acidified with H3PO4
bi-distilled to 2% v/v. Filtered samples for anions were stored in unwashed 15 mL
Polypropylene and stored frozen (-20°C) until analysis. Physico-chemical parameters
(temperature, pH, conductivity, dissolved O2) were measured at each site in parallel to water
samplings.
Surface sediments were recovered using a Large Bore Interface Corer (Aquatic Research
Instruments®) equipped with a polycarbonate core tube (60 cm length, 10 cm inner diameter).
Surface sediment from cores were subsequently extruded, sliced with an acid cleaned plastic
cutter and immediately collected in acid cleaned 200 mL propylene centrifuge vials, N2-
flushed and centrifuged at 4000 r.p.m. for 20 min. For each sample, the supernatant (i.e.
porewater) was divided into three aliquots for nutrient, anions and metal/metalloids analyses.
5.2.3 Analytical methods
All details for QA/QC are given in SI.1.
5.2.3.1 Surface and pore water analysis
55 elements (Ca, Li, Be, Na, Mg, Al, P, K, Ti, V, Cr, Mn, Fe, Co, Ni, Cu, Zn, As, Se, Sr, Mo,
Ag, Cd, Sn, Sb, Pb, U, B, Si, Ga, Ge, Rb, Nb, In, Te, Cs, Ba, La, Ce, Pr, Nd, Sm, Gd, Dy, Ho,
Er, Tm, Yb, Lu, Hf, Ta, W, Tl, Th and Eu) were determined by means of atomic absorption
118
spectroscopyfor major elements, and by means of ICP-MS (quadrupole 7000ce, Agilent
Technologies)for trace elements,which enabled multiple elements to be determined in the
filtered water samples. Anions were determined by means of ionic chromatography, using a
Dionex ICS 2000 chromatograph. The detection limit (DLs) for SO42-, Cl1-, and NO3
1-, was
0.02, 0.04 and 0.002 mg L-1, respectively, with reproducibility of 5%. DOC was determined
by means of the Shimadzu TOC-VCSN organic carbon analyzer. Organic and inorganic
carbon and sulfur in sediments were analyzed by means of a Horiba Jobin Yvon Emia-320v
C/S analyzer.
Hg compoundsanalyses in water were performed by capillary gas chromatography connected
to an inductively coupled plasma mass spectrometer (GC-ICPMS, X Series II, Thermo
Fisher). Analytical set-up and methodology for the GC-ICPMS for Hg speciation analysis by
species specific isotope dilution are described in (Monperrus et al., 2005b; Monperrus et al.,
2008) (SI.1). Gaseous Hg species (i.e., dissolved gaseous Hg (DGM) and dimethylHg
(DMHg)) were purged (generally within ~0.5 h after sampling) and collected on gold-coated
sand (Brooks Rand®) and activated charcoal (Carbotrap®, B, mesh 20-40, Sigma-Aldrich)
traps, respectively. The analysis of the gaseous Hg species (i.e. Hg° and DMHg) was carried
out by cryogenic trapping gas chromatography connected to an inductively coupled plasma
mass spectrometer (CT-GC-ICPMS) according to previous works (Bouchet et al., 2011;
Bouchet et al., 2013).
5.2.3.2 Sediment analysis
Solid samples (sediment, and suspended solids) were freeze-dried and crushed to obtain a size
smaller than 63 µm for elemental analysis. Total particulate organic carbon ([TOC])
concentrations were determined from the dry combustion of solid powder sample aliquots
using a C/S Horiba JobinYvon Emia-320v auto-analyzer.
Sediment digestion was performed using ~ 200 mg of freeze-dried sediment digested in a
mixture of HCl (2 ml, Ultrex grade - Baker), HNO3 (9 ml, Ultrex grade - Baker) and HF (3
ml, Ultrex grade - Baker) in a microwave system (CEM Mars System 5 model). Digestion
solutions were then diluted and subsequently measured by ICP-MS (model 7500ce, Agilent
Technologies) to assess the total amount of metals (Al, Ca, Mg, Fe, Cr, Cd, As, Cu, Mn, Ni,
Pb, Se, and Zn) in each sediment samples. Accuracy was checked using a certified reference
material (CRM), namely PACS-2 (National Research Council of Canada) for QA/QC (give
replicates and values are given in table in SI).
Hg compounds analysis in sediments were also performed by GC-ICPMS and are described
elsewhere (Monperrus et al., 2008). Quantification of Hg species was carried out using
119
species specific isotope dilution and by applying isotope pattern deconvolution for data
treatment.
Total particulate Hg concentrations ([THgP]) was obtained by summing both MMHg and IHg.
Concentrations obtained for repeated analyses of CRMs never exceeded the published range
of concentrations (IAEA 405: 818 ± 17 ng g-1 and 5.29 ± 0.24 ng g-1 for THg and MMHg,
respectively). The detection limits, were 0.20 and 0.01 ng g-1, for THg and MMHg,
respectively.
5.2.4 Statistical treatment and data presentation
Correlation coefficient (R) and p values are reported in the manuscript for the computed linear
regressions. Pair wise slope comparisons for regressions built from individual studies were
realized with a t test. We also used non-parametric tests, the Mann-Whitney rank sum test (U
test), or the Kruskal-Wallis one way analysis of variance on ranks (H test), to compare two, or
more than two sets of data, respectively, and pair wise multiple comparison according to
Dunn’s method to isolate the set or sets that differed from the others. Linear regressions were
performed only when normality test, constant variance test and alpha power of the performed
regression (α test, p>0.8) passed. When datasets did not follow a Normal distribution, we
performed a Spearman rank order correlation test (Rho test). All statistical analyses were
performed using the package Sigmastat® (Systat Software Inc.) or R software (R.2.14.2). All
data are presented in the manuscript and supplementary information 2 (S.I.2) as mean ± SD
and complete data set is presented in supplementary information 3 (S.I.3).
5.3 Results and discussion
5.3.1 Geochemistry and MMHg content in Lake Uru-Uru
5.3.1.1 Eutrophication in high altitude ecosystem context
The water cycle of this high altitude endorheic lake system is dominated by evaporation due
high solar radiation which concentrates salts in the lake as evidenced by its high electrical
conductivity (χ = 5.5 ± 1.5 and 3.6 ± 2.4 mS cm-1 in the dry and wet season, respectively).
Lake Uru-Uru water is characterized by alkaline conditions over the year (pH mean ± SD =
8.3 ± 0.6) with a predominance of sulfate (7.4 ± 2.3 and 3.4 ± 3.0 g L-1, for the dry and wet
seasons, respectively) which originates from the sulfate rich substratum (e.g., gypsum) and
bicarbonates (HCO3-1 = 229 ± 47 and 167 ± 33 mg L-1 in the dry and wet season,
respectively). This brings a strong buffering capacity of the lake water compartment.
120
Particularly high electrical conductivity were recorded downstream the two main tributaries
i.e., (i) in the northern part of the lake (Desaguadero and Tagarete river sinlets - Km 7) for
both season and (ii) at the confluence of the Rio Huanuni (Km 20) only during the dry season
(Fig. 27). Both Oruro and Huanuni areas are the two main sources of contaminants
discharging combined urban wastewater and mining effluents which are illustrated by high
organic matter (OM) inputs (e.g., DOC – Fig. 27) and metal(oid) (e.g., Hg, Fe, Mn, W, Sb -
Fig. 27 and SI. 2) inputs into the lake. The high contents in nutrients (e.g., PO43-) and
metal(oid)s measured in Lake Uru-Uru water are in the range of those reported for
wastewaters and urban impacted aquatic ecosystem around the world (Oliveira et al., 2007;
Balogh and Nollet, 2008; Guédron et al., 2014), typical of eutrophicated conditions, but under
high diurnal oxygen gradients. Such elevated loads of nutrients stimulate photosynthesis, and
OM (e.g., DOC = 16.6 ± 3.4 mg L-1 for both season) productivity, which result in a high
respiration of aquatic (micro) organisms (mean dissolved oxygen = 8.5 ± 3.3 mg L-1).
However, due to the extremely high diurnal biogeochemical gradient (e.g., strong diurnal
insolation and temperature gradients), diurnal cycles showed that minimum O2 concentrations
in the water column drop to less than 3 mg L-1 during the night (Alanoca et al., 2016). Since
samples were collected in the period of maximum insolation and therefore of maximum
photosynthesis, the promoted DO data likely reflect the maximum O2 concentration (Alanoca
et al., 2016).
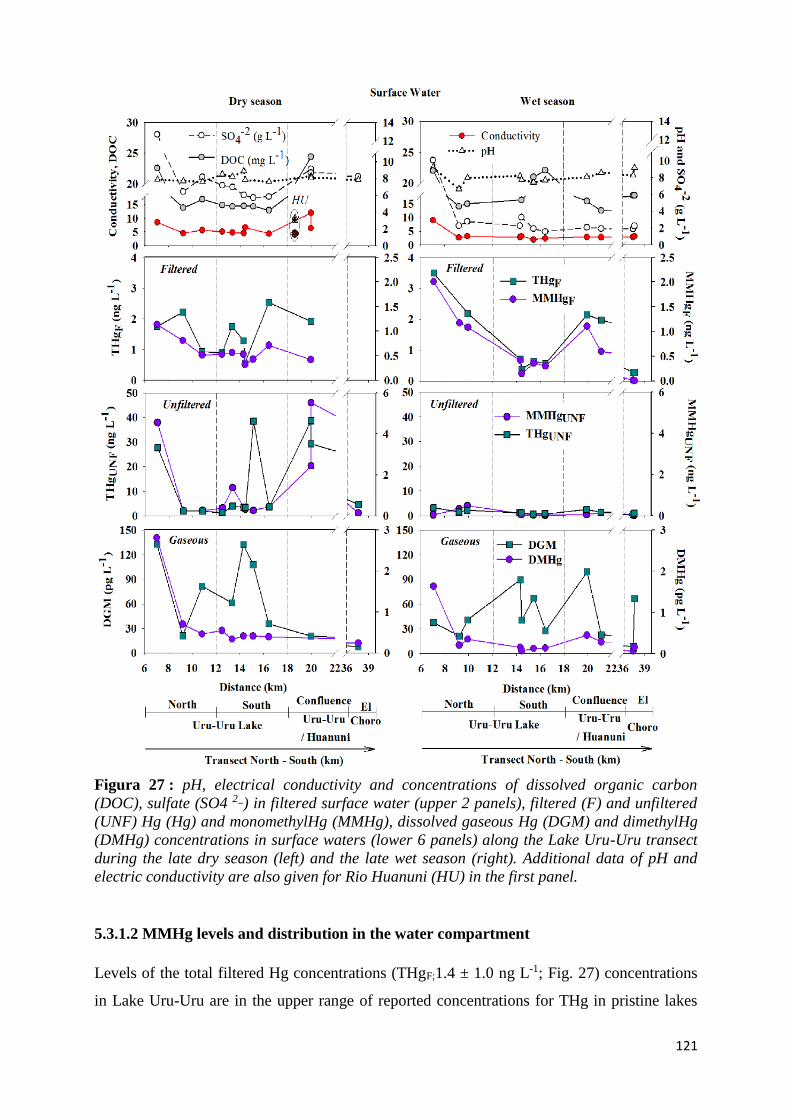
121
Figura 27 : pH, electrical conductivity and concentrations of dissolved organic carbon
(DOC), sulfate (SO4 2_) in filtered surface water (upper 2 panels), filtered (F) and unfiltered
(UNF) Hg (Hg) and monomethylHg (MMHg), dissolved gaseous Hg (DGM) and dimethylHg
(DMHg) concentrations in surface waters (lower 6 panels) along the Lake Uru-Uru transect
during the late dry season (left) and the late wet season (right). Additional data of pH and
electric conductivity are also given for Rio Huanuni (HU) in the first panel.
5.3.1.2 MMHg levels and distribution in the water compartment
Levels of the total filtered Hg concentrations (THgF;1.4 ± 1.0 ng L-1; Fig. 27) concentrations
in Lake Uru-Uru are in the upper range of reported concentrations for THg in pristine lakes
122
around the world (Lindström, 2001; Bowles et al., 2003; Hammerschmidt et al., 2006;
Muresan et al., 2007; Maia et al., 2009) while filtered MMHg (0.69 ± 0.47 ng L-1) are higher
than concentrations reported in altitude lake ecosystems, e.g., compared to the southern
oligotrophic Moreno Lake (Patagonia, atl 768 m, 0.002 to 0.01 ng L-1) (Arcagni et al., 2013)
or in the hyper eutrophic contaminated Dianchi Lake (Tibet, 1881 m, 0.07- 0.19 ng L-1)
(Wang et al., 2012). The most striking finding of our study is the extremely high percentage
of filtered MMHg representing 47 ± 14 and 51 ± 7 % of the THgF concentrations along the
transect for both dry and wet seasons, respectively. Such high filtered MMHg contribution is
probably the highest ever reported in high-altitude lake ecosystems (Wang et al., 2012).
Although, high filtered MMHg contribution were only reported in lake anoxic hypolimnion
(Feyte et al., 2012; Garcia Bravo et al., 2014), typical percentages of MMHg rarely exceed
10% in shallow lakes ecosystems (Fitzgerald et al., 2014). This confirms the strong in situ
MMHg production that operates at the entire lake ecosystem level, as previously documented
at two particular locations (Alanoca et al., 2016). These high MMHg concentrations and
percentages of MMHg/THg in the filtered phase are likely related to the abundance of organic
ligands (e.g., sulfur functional groups of OM) and in a lesser extent of inorganic (e.g., Cl-)
ones that may enhance MMHg solubility. Besides geochemical parameters that favors MMHg
solubility, important local production and/or restricted degradation may favor such levels.
Indeed, the morphology of the lake (e.g., flat basin, shallow water column) promotes large
exchanges with the sediment compartment (e.g., low dilution of benthic fluxes) and the high
dissolved and particulate OM loads which restrict the penetration of UV radiations likely
inhibiting MMHg photodegradation. For the latter, the low measured DGM that never
exceeded 13% of filtered THg (DGM = 4.8 ± 4.6 % of THg for both seasons) suggest that
both photochemical and bacterial reduction of Hg compounds are low as confirmed by in situ
incubations (Alanoca et al., 2016). This likely favors Hg methylation pathways in the net
balance towards MMHg production. In opposition to MMHg, dimethylHg (DMHg) was
found marginally low, and remained at a baseline level of 0.58 ± 0.72 pg L-1 for both seasons.
This accounts for less than 1 ‰ of filtered MMHg. Only a significant rise was observed in the
northern part of the lake (km 7 – downstream Oruro city) which reached 2.8 and 1.6 pg L-1 for
the dry and wet season, respectively (Fig. 27). Such low DMHg levels highlight that DMHg is
not a major end-product for MMHg and Hg evasion from the ecosystem.
Spatial distribution of filtered and particulate THg and MMHg showed the highest
concentrations downstream Oruro (km 7) and at the confluence with the Río Huanuni (km 20)
during the dry season. Aside from these two hotspots, filtered THg and MMHg concentrations
123
remain between 1 and 2 ng L-1, and 0.15 and 0.7 ng L-1 over the year, respectively. During the
wet season, unfiltered THg and MMHg concentrations (expressed in ng L-1) were found
relatively low and close to filtered concentrations. During the dry season, unfiltered THg and
MMHg concentrations downstream mining areas were more than ten times higher than those
of the wet season. Such change in unfiltered concentrations can be attributed to (i) dilution
with fresh eroded particles with a lower enrichment in Hg during the wet season, and (ii) the
presence, during the dry season, of floating organic aggregates enriched in Hg (99.9 ± 14.3 ng
g-1) and MMHg (13.5 ± 0.8 ng g-1) in surface water (Alanoca et al., 2016).
This suggests that the major potential sources of MMHg are likely (i) the sediment
compartment (Alanoca et al., 2016) and (ii) organic substrates present in the water column. In
the second case, the abundance of OM and sulfates in the water column likely favor
microbially mediated Hg methylation (i.e., SRB) especially at night when respiration
processes are dominant (Alanoca et al., 2016). For example, large areas of the lake are
covered by benthic macrophytes (e.g., characeae) and their associated biofilms may be
important MMHg contributors as identified in the near Lake Titicaca (unpublished data).
Beside in situ formation of MMHg, other external sources originating mainly from mining
effluents should also be taken into consideration.
5.3.1.3 Mining effluents: a source of Hg and dissolved colloidal carrier phase
The fact that filtered THg remained in the same concentration range for both seasons suggests
the existence of another source contributor of Hg during the wet season. The contribution of
upstream mining inputs might be significant source during the wet season. While mean
concentrations of major elements (e.g., SO42-, K+, Mg2+ and Na+ – SI. 2 and 3) decrease by 2.5
to 2.8 fold during the wet season along the transect due to dilution by fresh waters, almost no
dilution effect is observed for THg, MMHg and several metal(oid)s (e.g., mean concentration
ratio between dry and wet season for THg, MMHg, Fe, Ti and W are 1.3, 1.0, 0.5, 1.4 and 0.8,
respectively). This likely results from the enhanced leaching and erosion of dissolved and
particulate Hg and metal(oid)s from the upstream mining area (e.g., tailings) during the wet
seasonal illustrated by the rises in filtered and particulate metal(oid)s concentrations (Fig. 27
and S.I.3) downstream mining effluents. Waters originating from the mining area are very
acidic (e.g., pH = 3.1 ± 0.3 in the Huanuni River – Fig. 27). These low pH conditions lead
most of metals and metalloids to remain in their reduced form. At the confluence with the
lake, the sharp rise in pH to above 8 may be accompanied by a drop in solubility of Fe, Al and
Mn allowing their precipitation as oxides (e.g., ferrihydrite or Fe(oxy)hydroxyl-sulfate), thus
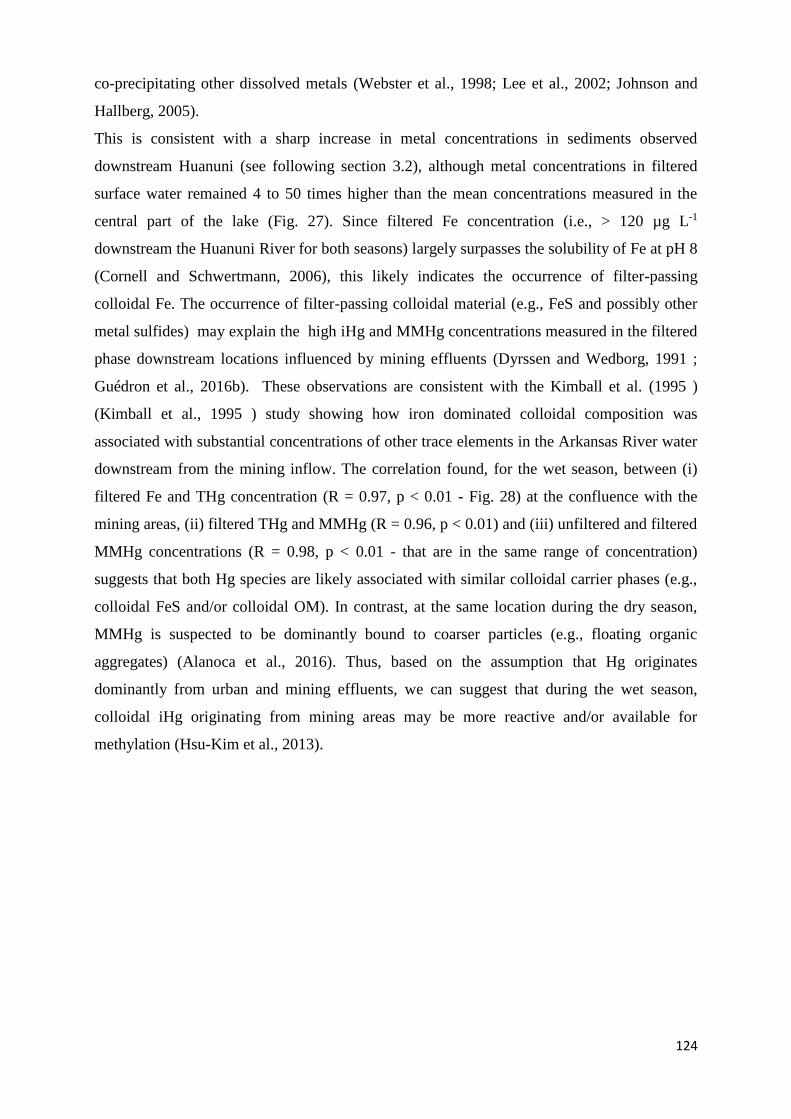
124
co-precipitating other dissolved metals (Webster et al., 1998; Lee et al., 2002; Johnson and
Hallberg, 2005).
This is consistent with a sharp increase in metal concentrations in sediments observed
downstream Huanuni (see following section 3.2), although metal concentrations in filtered
surface water remained 4 to 50 times higher than the mean concentrations measured in the
central part of the lake (Fig. 27). Since filtered Fe concentration (i.e., > 120 µg L-1
downstream the Huanuni River for both seasons) largely surpasses the solubility of Fe at pH 8
(Cornell and Schwertmann, 2006), this likely indicates the occurrence of filter-passing
colloidal Fe. The occurrence of filter-passing colloidal material (e.g., FeS and possibly other
metal sulfides) may explain the high iHg and MMHg concentrations measured in the filtered
phase downstream locations influenced by mining effluents (Dyrssen and Wedborg, 1991 ;
Guédron et al., 2016b). These observations are consistent with the Kimball et al. (1995 )
(Kimball et al., 1995 ) study showing how iron dominated colloidal composition was
associated with substantial concentrations of other trace elements in the Arkansas River water
downstream from the mining inflow. The correlation found, for the wet season, between (i)
filtered Fe and THg concentration (R = 0.97, p < 0.01 - Fig. 28) at the confluence with the
mining areas, (ii) filtered THg and MMHg (R = 0.96, p < 0.01) and (iii) unfiltered and filtered
MMHg concentrations (R = 0.98, p < 0.01 - that are in the same range of concentration)
suggests that both Hg species are likely associated with similar colloidal carrier phases (e.g.,
colloidal FeS and/or colloidal OM). In contrast, at the same location during the dry season,
MMHg is suspected to be dominantly bound to coarser particles (e.g., floating organic
aggregates) (Alanoca et al., 2016). Thus, based on the assumption that Hg originates
dominantly from urban and mining effluents, we can suggest that during the wet season,
colloidal iHg originating from mining areas may be more reactive and/or available for
methylation (Hsu-Kim et al., 2013).
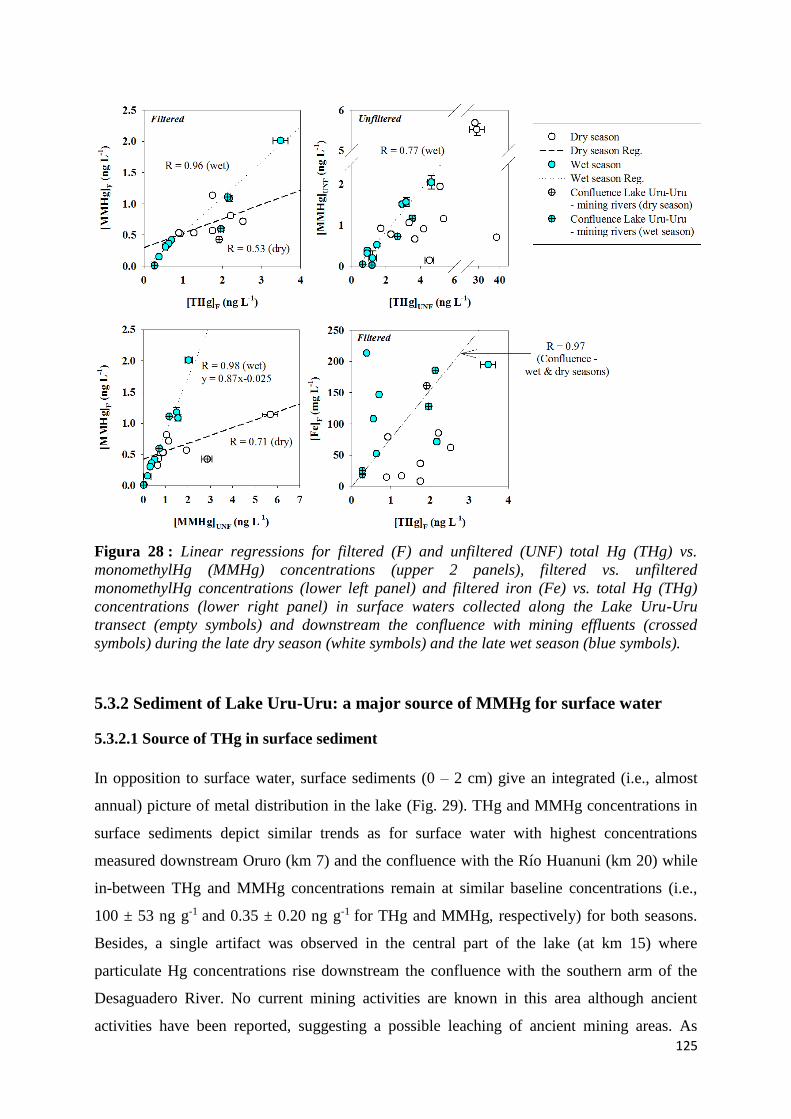
125
Figura 28 : Linear regressions for filtered (F) and unfiltered (UNF) total Hg (THg) vs.
monomethylHg (MMHg) concentrations (upper 2 panels), filtered vs. unfiltered
monomethylHg concentrations (lower left panel) and filtered iron (Fe) vs. total Hg (THg)
concentrations (lower right panel) in surface waters collected along the Lake Uru-Uru
transect (empty symbols) and downstream the confluence with mining effluents (crossed
symbols) during the late dry season (white symbols) and the late wet season (blue symbols).
5.3.2 Sediment of Lake Uru-Uru: a major source of MMHg for surface water
5.3.2.1 Source of THg in surface sediment
In opposition to surface water, surface sediments (0 – 2 cm) give an integrated (i.e., almost
annual) picture of metal distribution in the lake (Fig. 29). THg and MMHg concentrations in
surface sediments depict similar trends as for surface water with highest concentrations
measured downstream Oruro (km 7) and the confluence with the Río Huanuni (km 20) while
in-between THg and MMHg concentrations remain at similar baseline concentrations (i.e.,
100 ± 53 ng g-1 and 0.35 ± 0.20 ng g-1 for THg and MMHg, respectively) for both seasons.
Besides, a single artifact was observed in the central part of the lake (at km 15) where
particulate Hg concentrations rise downstream the confluence with the southern arm of the
Desaguadero River. No current mining activities are known in this area although ancient
activities have been reported, suggesting a possible leaching of ancient mining areas. As
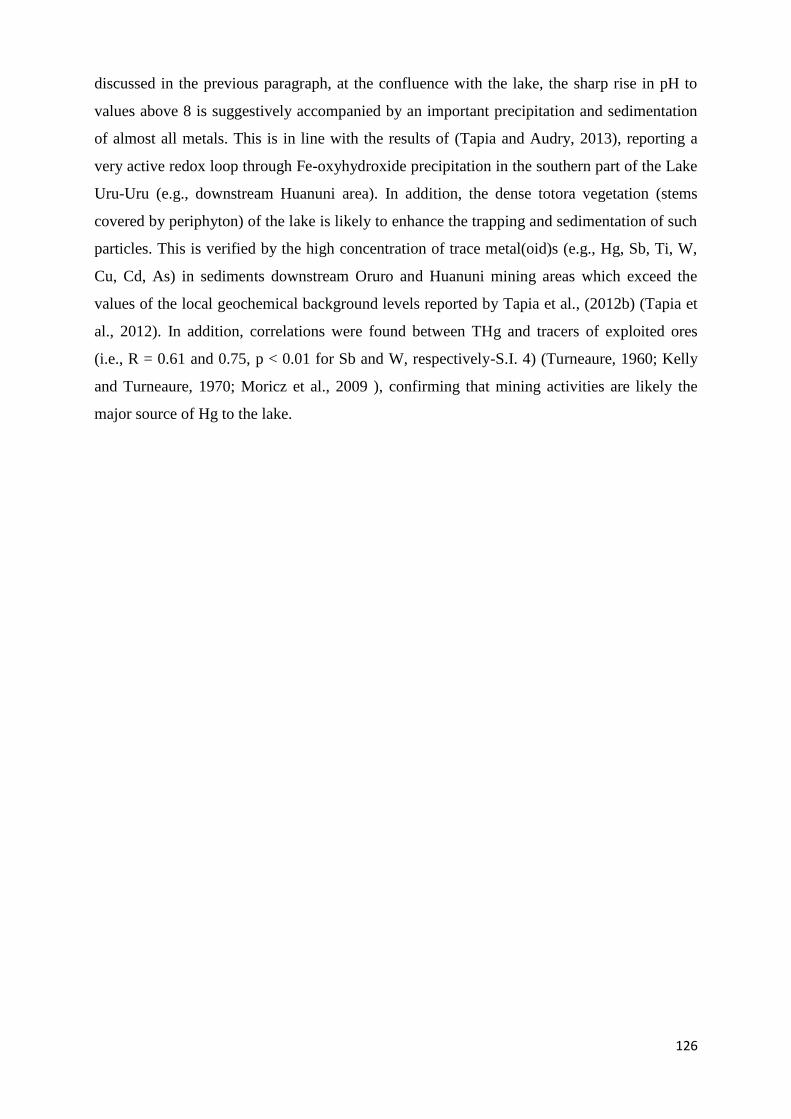
126
discussed in the previous paragraph, at the confluence with the lake, the sharp rise in pH to
values above 8 is suggestively accompanied by an important precipitation and sedimentation
of almost all metals. This is in line with the results of (Tapia and Audry, 2013), reporting a
very active redox loop through Fe-oxyhydroxide precipitation in the southern part of the Lake
Uru-Uru (e.g., downstream Huanuni area). In addition, the dense totora vegetation (stems
covered by periphyton) of the lake is likely to enhance the trapping and sedimentation of such
particles. This is verified by the high concentration of trace metal(oid)s (e.g., Hg, Sb, Ti, W,
Cu, Cd, As) in sediments downstream Oruro and Huanuni mining areas which exceed the
values of the local geochemical background levels reported by Tapia et al., (2012b) (Tapia et
al., 2012). In addition, correlations were found between THg and tracers of exploited ores
(i.e., R = 0.61 and 0.75, p < 0.01 for Sb and W, respectively-S.I. 4) (Turneaure, 1960; Kelly
and Turneaure, 1970; Moricz et al., 2009 ), confirming that mining activities are likely the
major source of Hg to the lake.
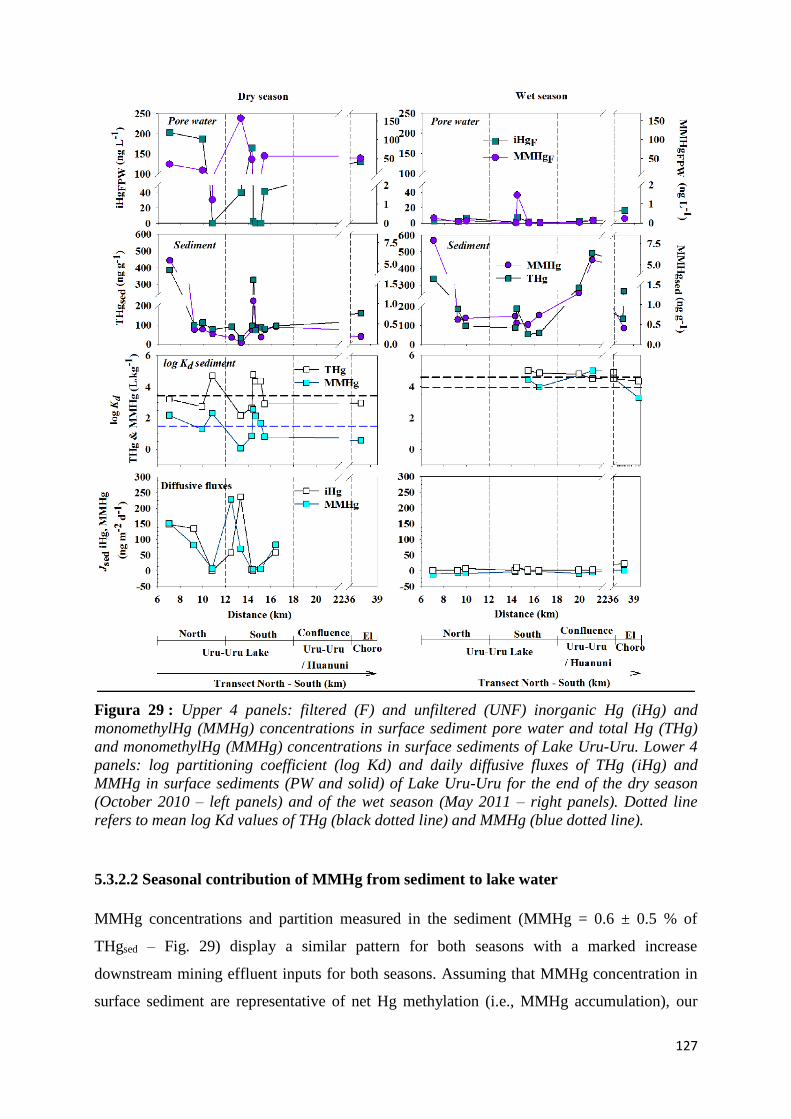
127
Figura 29 : Upper 4 panels: filtered (F) and unfiltered (UNF) inorganic Hg (iHg) and
monomethylHg (MMHg) concentrations in surface sediment pore water and total Hg (THg)
and monomethylHg (MMHg) concentrations in surface sediments of Lake Uru-Uru. Lower 4
panels: log partitioning coefficient (log Kd) and daily diffusive fluxes of THg (iHg) and
MMHg in surface sediments (PW and solid) of Lake Uru-Uru for the end of the dry season
(October 2010 – left panels) and of the wet season (May 2011 – right panels). Dotted line
refers to mean log Kd values of THg (black dotted line) and MMHg (blue dotted line).
5.3.2.2 Seasonal contribution of MMHg from sediment to lake water
MMHg concentrations and partition measured in the sediment (MMHg = 0.6 ± 0.5 % of
THgsed – Fig. 29) display a similar pattern for both seasons with a marked increase
downstream mining effluent inputs for both seasons. Assuming that MMHg concentration in
surface sediment are representative of net Hg methylation (i.e., MMHg accumulation), our
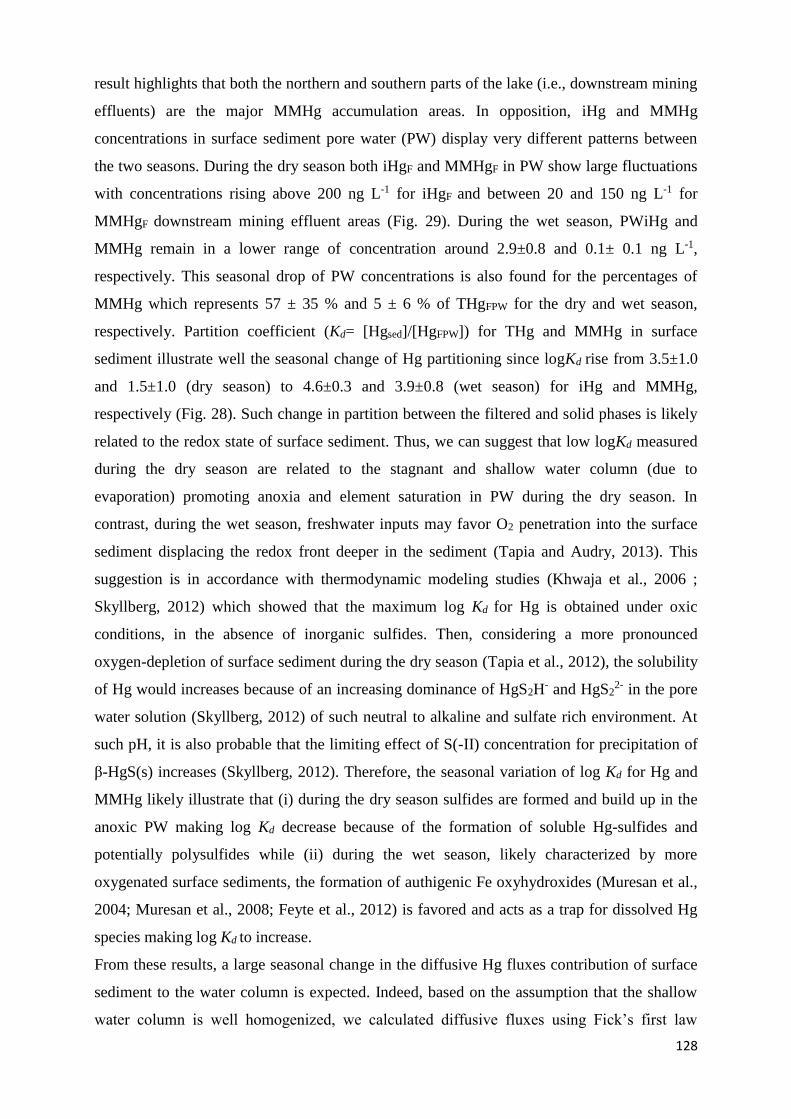
128
result highlights that both the northern and southern parts of the lake (i.e., downstream mining
effluents) are the major MMHg accumulation areas. In opposition, iHg and MMHg
concentrations in surface sediment pore water (PW) display very different patterns between
the two seasons. During the dry season both iHgF and MMHgF in PW show large fluctuations
with concentrations rising above 200 ng L-1 for iHgF and between 20 and 150 ng L-1 for
MMHgF downstream mining effluent areas (Fig. 29). During the wet season, PWiHg and
MMHg remain in a lower range of concentration around 2.9±0.8 and 0.1± 0.1 ng L-1,
respectively. This seasonal drop of PW concentrations is also found for the percentages of
MMHg which represents 57 ± 35 % and 5 ± 6 % of THgFPW for the dry and wet season,
respectively. Partition coefficient (Kd= [Hgsed]/[HgFPW]) for THg and MMHg in surface
sediment illustrate well the seasonal change of Hg partitioning since logKd rise from 3.5±1.0
and 1.5±1.0 (dry season) to 4.6±0.3 and 3.9±0.8 (wet season) for iHg and MMHg,
respectively (Fig. 28). Such change in partition between the filtered and solid phases is likely
related to the redox state of surface sediment. Thus, we can suggest that low logKd measured
during the dry season are related to the stagnant and shallow water column (due to
evaporation) promoting anoxia and element saturation in PW during the dry season. In
contrast, during the wet season, freshwater inputs may favor O2 penetration into the surface
sediment displacing the redox front deeper in the sediment (Tapia and Audry, 2013). This
suggestion is in accordance with thermodynamic modeling studies (Khwaja et al., 2006 ;
Skyllberg, 2012) which showed that the maximum log Kd for Hg is obtained under oxic
conditions, in the absence of inorganic sulfides. Then, considering a more pronounced
oxygen-depletion of surface sediment during the dry season (Tapia et al., 2012), the solubility
of Hg would increases because of an increasing dominance of HgS2H- and HgS2
2- in the pore
water solution (Skyllberg, 2012) of such neutral to alkaline and sulfate rich environment. At
such pH, it is also probable that the limiting effect of S(-II) concentration for precipitation of
β-HgS(s) increases (Skyllberg, 2012). Therefore, the seasonal variation of log Kd for Hg and
MMHg likely illustrate that (i) during the dry season sulfides are formed and build up in the
anoxic PW making log Kd decrease because of the formation of soluble Hg-sulfides and
potentially polysulfides while (ii) during the wet season, likely characterized by more
oxygenated surface sediments, the formation of authigenic Fe oxyhydroxides (Muresan et al.,
2004; Muresan et al., 2008; Feyte et al., 2012) is favored and acts as a trap for dissolved Hg
species making log Kd to increase.
From these results, a large seasonal change in the diffusive Hg fluxes contribution of surface
sediment to the water column is expected. Indeed, based on the assumption that the shallow
water column is well homogenized, we calculated diffusive fluxes using Fick’s first law
129
(details of the calculations are given in S.I.) (Guédron et al., 2012): Jsed = -ϕDsed(∂C/∂z).
Spatial variation of diffusive fluxes (Fig. 29) shows that during the dry season, both iHg and
MMHg exhibit positive Jsed indicating a slight upward-directed flux (efflux from the
sediment into the overlying water column). In contrast, during the wet season Jsed for iHg are
slightly positive (slight upward-directed flux) and Jsed for MMHg are close to zero or
negative indicating a downward-directed flux (influx from the water column into the
sediment).
Therefore, both logKd and Jsed highlight surface sediment PW as a major source of MMHg
for surface waters during the dry season while it appears limited during the wet season when
the water column is higher. This observation is consistent with lower methylation capacity
found in sediments during the wet season by previous in situ Hg methylation (M) and MMHg
demethylation (D) potentials experiments performed in Lake Uru-Uru (Alanoca et al., 2016).
However, we cannot exclude a significant contribution of sediments during the wet season
since probable high diurnal change in the position of the redox front in the sediment may
favor positive fluxes during the night (when photosynthesis is stopped and respiration
consumes O2). This suggestion is pertinent since Alanoca et al. (2016a) have demonstrated
large variation of MMHg concentrations in the water column during a 24-hour cycles with
maximum concentrations measured in the absence of sunlight when the water column
becomes O2 depleted. Note that the contribution of the Lake Uru-Uru surface sediment to the
water column concentration of MMHg, roughly estimated here from diffusion only, is
probably an underestimation. Such contribution should be largely superior when taking into
account bioturbation and physical advection that would result in enhanced fluxes of MMHg
into the water column.
5.4 Conclusion
We showed in this study that current and historical mining activities combined with untreated
urban effluents promote high loads of Hg and metal(oid) to the shallow productive and high
altitude (3686 m a.s.l.) lake Uru-Uru. High percentages MMHg concentrations standing
around 50 % of THgF for both seasons were found along the North-South transect of the
eutrophic Uru-Uru Lake where abundant OM may favor both Hg methylation and
preservation in the water column. In addition, the alkaline pH and the abundant organic
ligands and colloids (especially downstream mining effluents) seems to favor the lability of
MMHg in the water column. Surface sediments were identified as a major MMHg source for
the water column during the dry season while during the wet season its contribution appears
130
limited. However, the calculation of MMHg diffusive fluxes from the sediment to the water
column during the wet season was probably underestimated since intense diurnal
biogeochemical variations and fluxes related to bioturbation and physical advection were not
considered. Other unidentified sources (e.g., urban and mining effluents and biofilms covering
benthic macrophytes) may also significantly contribute to MMHg inputs or in situ production
in the lake during the wet season. In particular, the important discharge of Hg originating
from the AMD (probably associated to colloids) was considered as a potential significant
source of both iHg and MMHg. Such high levels of filtered MMHg in the water column is
likely plausible hypothesis behind the high MMHg levels reported in the local trophic chains
(Molina et al., 2012). Important efforts must be taken regarding Hg and other metal emissions
from mining area to reduce the trophic transfer and environmental concerns.
131
Conclusiones
En este estudio se demuestra que el compartimiento de almacenamiento de Hg,
metales y metaloides en el lago Uru-Uru es el sedimento. Este almacenamiento, por una parte
es promovido por efluentes de actividades mineras (iniciadas el año 1557 y continúa hasta
nuestros días) y por otra parte por efluentes urbanos, los cuales se han incrementado con el
crecimiento demográfico de la ciudad de Oruro y el aumento de centros mineros.
Se observa que las condiciones fisicoquímicas del lago promueven las reacciones de
oxidación/reducción, probablemente dando lugar a la formación de diferentes formas de
compuestos metálicos. En el caso del Hg, las concentraciones de la especie mercurial MMHg
medidas a lo largo del transecto Norte-Sur del lago (en promedio 49±11%), hasta ahora son
las más altas registradas para ecosistemas acuáticos. En este estudio se ha observado que el
compartimiento de los sedimentos es la fuente emisora principal de MMHg hacia la columna
de agua durante la época seca y limitada durante la época húmeda. Sin embargo no se debe
descartar que los flujos de MMHg pudieran ser producidos por fenómenos de bioturbación y
advección física, considerando la poca profundidad del lago. Otras fuentes de MMHg y IHg
podrían ser atribuidas a los aportes de los flujos de aguas ácidas de minas, flujos de aguas
servidas (agua residual doméstica), escorrentías formadas en los suelos por las lluvias, los
provenientes del biofilm de las totoras y los producidos por los agregados bio-orgánicos
flotantes en ambas épocas del año.
La alta producción primaria, el pH alcalino, las altas concentraciones de materia
orgánica y las elevadas concentraciones de metales pesados, pueden ser los factores que
posibilitan que el MMHg se encuentre en la columna de agua, en un gran porcentaje en forma
complejos de ligandos orgánicos húmicos o en formas coloidales.
132
6. Capítulo III: Diurnal variability and
biogeochemical reactivity of Hg species
in an extreme high-altitude lake
ecosystem of the Bolivian Altiplano
133
Introducción
La concentración neta de MMHg se encuentra regulada por los procesos de metilación
de Hg y demetilación de MMHg, procesos que son considerados como los mayores patrones
de transformación. Los estudios realizados acerca de la reactividad y transformación del Hg
en ecosistemas acuáticos de condiciones ambientales extremas a gran altitud, son muy pocos.
El presente trabajo pretende documentar la reactividad y transformación del Hg en el lago
Uru-Uru, un esositema poco profundo y muy productivo sometido a fuertes presiones
antropogénicas mineras y urbanas, ubicado en el Altiplano Boliviano una región de
condiciones ambientales extremas donde la disponibidad del agua es cada vez más escasa para
los habitantes. Concentraciones de diferentes especies de Hg (iHg, MMHg, Hg0 y DMHg) e
in situ potenciales de metilación de Hg (M) y demetilación de MMHg (D) fueron
determinados en aguas, sedimentos, agregados bio-orgánicos flotantes y perifiton de totoras
del lago Uru-Uru. Las muestras fueron colectadas al final de las épocas seca y húmeda
(octubre de 2010 y mayo de 2011 respectivamente), en los sitios Norte y Sur del lago. Las
concentraciones de las diferentes especies de Hg variaron significativamente durante el
transcurso de 24 horas influenciadas por los fuertes gradientes biogeoquímicos. Las
concentraciones de MMHgUNF en la columna de agua variaron de 0,2 a 4,5 ng L-1 mostrando
una importante metilación de Hg. Mientras que los rangos de los potenciales de M y de D
(<0,1 – 16,5 y <0,2 – 68,3 % d-1 respectivamente) fueron muy variables entre
compartimientos, pero superiores durante la época seca. Las metilaciones netas de Hg indican
que la influencia urbana y efluentes de la minería en el sitio Norte (NS), promueven la
producción de MMHg en aguas (hasta 0,45 ng MMHg L-1 d-1) y en sedimentos (2,0 a 19,7 ng
MMHg g-1 d-1). Se ha identificado que la mayor fuente de MMHg son los sedimentos, seguida
de los agregados bio-orgánicos (5,8 ng MMHg g-1 d-1) durante la época seca; mientras que el
perifiton de las totoras actúa como un demetilador de MMHg (-2,1 ng MMHg g-1 d-1). Este
trabajo demuestra que a gran altitud los ecosistemas lacustres productivos pueden promover la
formación de MMHg en varios compartimentos.
134
Diurnal variability and biogeochemical reactivity of Hg species in
an extreme high altitude lake ecosystem of the Bolivian Altiplano
L. Alanoca1, D. Amouroux1,2*, M. Monperrus2, E. Tessier2, M. Goni3, R. Guyoneaud3, D. Acha4,
C. Gassie3, S. Audry1, M. E. Garcia5, J. Quintanilla5, D. Point1
(1) Géosciences Environnement Toulouse, UMR5563 - IRD UR 234, Université Paul Sabatier, 14
Avenue Edouard Belin 31400 Toulouse, France.
(2) Laboratoire de Chimie Analytique Bio-inorganique et Environnement, IPREM UMR 5254 CNRS -
Université de Pau et des Pays de l’Adour, Hélioparc Pau Pyrénées, 2, av. P. Angot, 64053 Pau cedex
9, France.
(3) Equipe Environnement et Microbiologie, IPREMUMR5254CNRs - Université de Pau et des Pays
de l’Adour, Bâtiment IBEAS, BP1153, F-64013 Pau Cedex France.
(4) Laboratorio de Calidad Ambiental – Instituto de Ecologia - Universidad Mayor de San Andres,
Campus Universitario de Cota Cota, casilla 3161, La Paz, Bolivia.
(5) Laboratorio de Hidroquímica- Instituto de Investigaciones Químicas - Universidad Mayor de San
Andres, Campus Universitario de Cota Cota, casilla 3161, La Paz, Bolivia.
*Corresponding author:
D. Amouroux, Email: [email protected]
135
Abstract
Methylation and demethylation represent major transformation pathways regulating the net
production of methylHg (MMHg). Very few studies have documented Hg reactivity and
transformation in extreme high altitude lake ecosystems. Hg (Hg) species concentrations (iHg,
MMHg, Hg0 and DMHg), and in situ Hg methylation (M) and MMHg demethylation (D)
potentials were determined in water, sediment, floating organic aggregates and periphyton
compartments of a shallow productive Lake of the Bolivian Altiplano (Uru-Uru lake, 3686
m). Samples were collected during late dry season (October 2010) and late wet season (May
2011) at a North (NS) and a South (SS) site of the lake, respectively. Hg species
concentrations exhibited significant diurnal variability as influenced by the strong diurnal
biogeochemical gradients. Particularly high methylated Hg concentrations (0.2 to 4.5 ng L-1
for MMHgUNF) were determined in the water column evidencing important Hg methylation in
this ecosystem. Methylation and D potentials range were respectively, <0.1 – 16.5 and <0.2 –
68.3 % d-1, and were highly variable among compartments of the lake, but always higher
during the dry season. Net Hg M indicates that the influence of urban and mining effluent
(NS) promotes MMHg production in both water (up to 0.45 ng MMHg L-1 d-1) and sediment
compartments (2.0 to 19.7 ng MMHg g-1 d-1). While the sediments compartment appears to
represent a major source of MMHg in this shallow ecosystem, floating organic aggregates
(dry season, SS), and Totora’s periphyton (wet season, NS), were found to act as a significant
source (5.8 ng MMHg g-1 d-1), and a sink (-2.1 ng MMHg g-1 d-1) of MMHg, respectively.
This work demonstrates that high altitude productive lake ecosystems can promote MMHg
formation in various compartments supporting recent observations of high Hg contents in fish
and water birds.
Keywords: Hg, biogeochemistry, altiplano, lake, methylation, demethylation, Bolivia
136
6.1 Introduction
MethylHg (MMHg) is considered as a potent neurotoxin, and represents a significant health
concern (Allen et al., 2002). Human MMHg exposure is mainly controlled by the
consumption of fish products (Fitzgerald and Clarkson, 1991; UNEP, 2013a). MMHg can be
produced in different compartments of the aquatic ecosystem as influenced by
biogeochemical conditions (Fitzgerald and Lamborg, 2004; Hintelmann, 2010). In aquatic
ecosystems, Hg methylation may take place in the anoxic zone (Eckley and Hintelmann,
2006) or oxic zone (Monperrus et al., 2007a; Ribeiro Guevara et al., 2008; Bouchet et al.,
2013), in the first few centimeters of sediments (Hollweg et al., 2009; Bouchet et al., 2013),
and in the periphyton mainly associated with the roots of aquatic plants (Guimarães et al.,
2000; Gentès et al., 2013). The mechanisms of Hg methylation (M) mainly involve microbial
processes linked to the activities of various communities such as sulfate-and/or iron-reducing
bacteria (Compeau and Bartha, 1984; Barkay and Wagner‐Döbler, 2005) and, to a lesser
extent, abiotic processes (Craig and Morton, 1978; Weber, 1993). Overall, net production
rates of MMHg, and its bioaccumulation in the food chain of aquatic systems, is drastically
regulated by such transformation processes (Hintelmann, 2010).
Mediated by biotic and abiotic processes, MMHg may be methylated and form dimethylHg
(DMHg) (Baldi et al., 1995), and/or broken down or demethylated (D), giving rise to
inorganic Hg (iHg) and elemental Hg (Hg0). In sediments, the methylation process involves
sulfate-and nitrate-reducing bacteria as well as methanogenic bacteria, along oxidative or
reductive pathways (Spangler et al., 1973; Oremland et al., 1991; Schaefer et al., 2004). In the
water column most of MMHg demethylation likely originates from photodegradation
reactions (Sellers et al., 1996; Hammerschmidt and Fitzgerald, 2006b; Black et al., 2012).
Because of its importance for human health, Hg cycling has been studied in different aquatic
systems (oceans, lakes, lagoons, rivers and wetlands). Hg reactivity and transformation in lake
and wetland ecosystems is well documented (Hintelmann, 2010), but few studies have been
investigated Hg reactivity in extreme high altitude ecosystems (Ribeiro Guevara et al., 2008;
Marusczak et al., 2011, 2011b; Qianggong et al., 2014). Aquatic ecosystems located in the
South American Altiplano region at 3800m, exhibits extreme thermal and solar irradiance
diurnal variability including intense UV radiations (Blumthaler et al., 1997; Zaratti et al.,
2003), contrasted seasonal hydrological cycles, as well as intense primary production (Aguirre
et al., 2014). Lake Uru-Uru (3686 m a.s.l.) is part of the lake system occupying the central
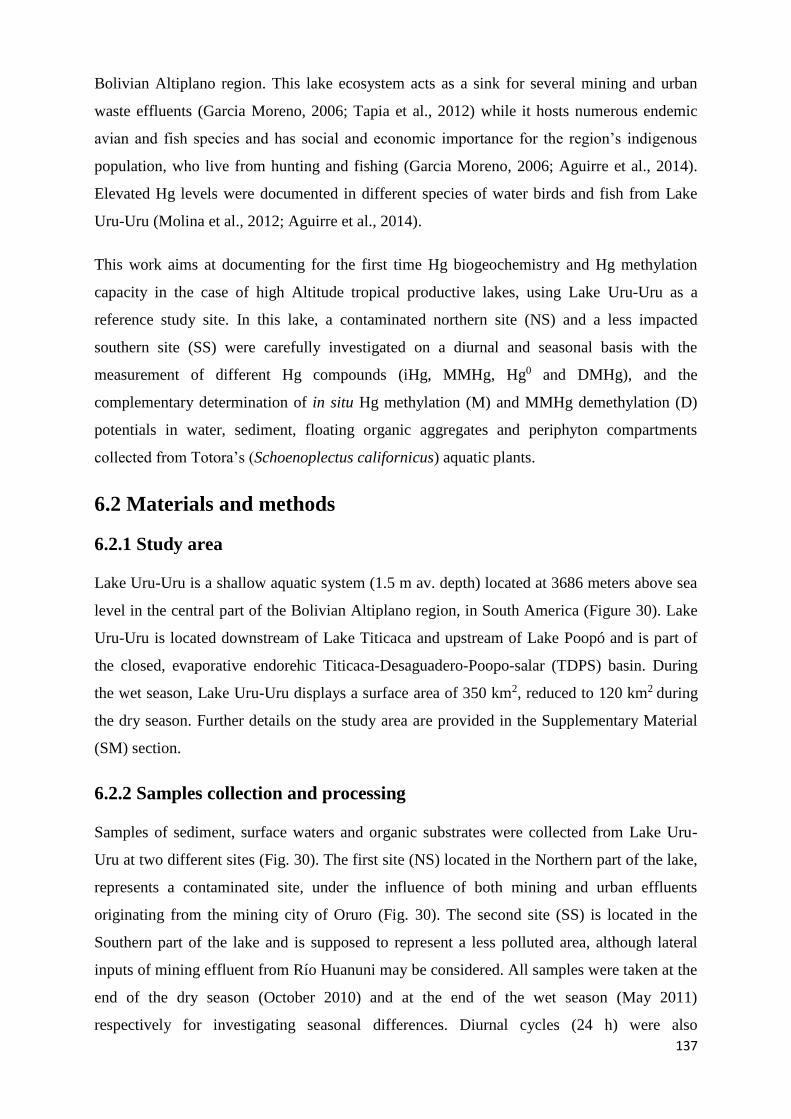
137
Bolivian Altiplano region. This lake ecosystem acts as a sink for several mining and urban
waste effluents (Garcia Moreno, 2006; Tapia et al., 2012) while it hosts numerous endemic
avian and fish species and has social and economic importance for the region’s indigenous
population, who live from hunting and fishing (Garcia Moreno, 2006; Aguirre et al., 2014).
Elevated Hg levels were documented in different species of water birds and fish from Lake
Uru-Uru (Molina et al., 2012; Aguirre et al., 2014).
This work aims at documenting for the first time Hg biogeochemistry and Hg methylation
capacity in the case of high Altitude tropical productive lakes, using Lake Uru-Uru as a
reference study site. In this lake, a contaminated northern site (NS) and a less impacted
southern site (SS) were carefully investigated on a diurnal and seasonal basis with the
measurement of different Hg compounds (iHg, MMHg, Hg0 and DMHg), and the
complementary determination of in situ Hg methylation (M) and MMHg demethylation (D)
potentials in water, sediment, floating organic aggregates and periphyton compartments
collected from Totora’s (Schoenoplectus californicus) aquatic plants.
6.2 Materials and methods
6.2.1 Study area
Lake Uru-Uru is a shallow aquatic system (1.5 m av. depth) located at 3686 meters above sea
level in the central part of the Bolivian Altiplano region, in South America (Figure 30). Lake
Uru-Uru is located downstream of Lake Titicaca and upstream of Lake Poopó and is part of
the closed, evaporative endorehic Titicaca-Desaguadero-Poopo-salar (TDPS) basin. During
the wet season, Lake Uru-Uru displays a surface area of 350 km2, reduced to 120 km2 during
the dry season. Further details on the study area are provided in the Supplementary Material
(SM) section.
6.2.2 Samples collection and processing
Samples of sediment, surface waters and organic substrates were collected from Lake Uru-
Uru at two different sites (Fig. 30). The first site (NS) located in the Northern part of the lake,
represents a contaminated site, under the influence of both mining and urban effluents
originating from the mining city of Oruro (Fig. 30). The second site (SS) is located in the
Southern part of the lake and is supposed to represent a less polluted area, although lateral
inputs of mining effluent from Río Huanuni may be considered. All samples were taken at the
end of the dry season (October 2010) and at the end of the wet season (May 2011)
respectively for investigating seasonal differences. Diurnal cycles (24 h) were also
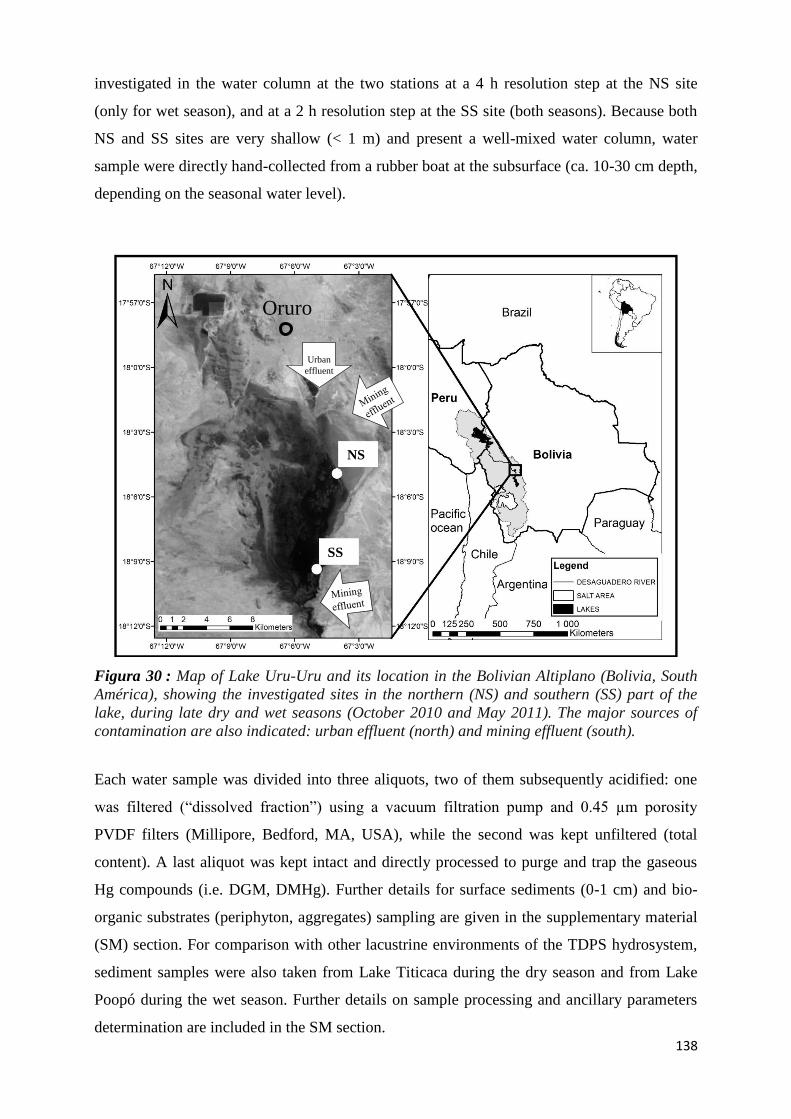
138
investigated in the water column at the two stations at a 4 h resolution step at the NS site
(only for wet season), and at a 2 h resolution step at the SS site (both seasons). Because both
NS and SS sites are very shallow (< 1 m) and present a well-mixed water column, water
sample were directly hand-collected from a rubber boat at the subsurface (ca. 10-30 cm depth,
depending on the seasonal water level).
SS
Urban
effluent
Oruro
NS
SS
Figura 30 : Map of Lake Uru-Uru and its location in the Bolivian Altiplano (Bolivia, South
América), showing the investigated sites in the northern (NS) and southern (SS) part of the
lake, during late dry and wet seasons (October 2010 and May 2011). The major sources of
contamination are also indicated: urban effluent (north) and mining effluent (south).
Each water sample was divided into three aliquots, two of them subsequently acidified: one
was filtered (“dissolved fraction”) using a vacuum filtration pump and 0.45 µm porosity
PVDF filters (Millipore, Bedford, MA, USA), while the second was kept unfiltered (total
content). A last aliquot was kept intact and directly processed to purge and trap the gaseous
Hg compounds (i.e. DGM, DMHg). Further details for surface sediments (0-1 cm) and bio-
organic substrates (periphyton, aggregates) sampling are given in the supplementary material
(SM) section. For comparison with other lacustrine environments of the TDPS hydrosystem,
sediment samples were also taken from Lake Titicaca during the dry season and from Lake
Poopó during the wet season. Further details on sample processing and ancillary parameters
determination are included in the SM section.
139
6.2.3 Hg transformations assays
Hg species transformation potentials were determined through in situ incubations performed
using isotopically enriched Hg species (199HgCl2 and CH3201HgCl) for water, sediment,
periphyton and floating organic aggregates, according to the incubation protocol, analyses and
calculations of methylation (M), demethylation (D) and reduction (R) potentials described
elsewhere (Monperrus et al., 2007a; Rodríguez-González et al., 2013). This methodology,
allows the simultaneous and quantitative determination of newly formed and remaining Hg
species derived from each isotope, and the determination of specific formation/degradation
yields (Monperrus et al., 2007a; Rodríguez-González et al., 2013). Further details on the
incubation protocols and the evaluation of the net Hg methylation obtained from the
incubation experiments and diurnal cycles are described in the SM section.
6.2.4 Samples analyses methodologies
For water samples, the concentrations of unfiltered and filtered Hg species, such as MMHg,
iHg, Hg0 and DMHg were determined. For solid samples concentration of MMHg and IHg
were determined. Hg species analysis in water, sediment and biological substrates were
performed by capillary gas chromatography connected to an inductively coupled plasma mass
spectrometer (GC-ICPMS, Trace). Analytical set-up and methodology for the GC-ICPMS for
Hg speciation analysis are described in detail elsewhere (Monperrus et al., 2005b; Monperrus
et al., 2008). The analysis of the gaseous Hg species (i.e. Hg0 and DMHg) was carried out by
cryogenic trapping gas chromatography connected to an inductively coupled plasma mass
spectrometer (CT-GC-ICPMS) according to previous works (Bouchet et al., 2011; Bouchet et
al., 2013). Other analytical methods used for ancillary parameters are described in SM
section.
6.2.5 Bacterial communities characterization
Water samples (triplicates) were concentrated (250 mL for SS and 60 mL for NS) by filtration
on sterile cellulose acetate filters (Millipore, 0.22 µm). After filtration, the filters were
immediately frozen in liquid nitrogen. Samples from sediments, floating aggregates or
Totora’s biofilms were directly sampled in cryovials and frozen in liquid nitrogen. DNA was
extracted with the Ultra Clean Soil DNA Isolation Kit using the alternative lysis method
(MoBio Laboratories Inc., USA). All extracted genomic DNA samples were stored at -20°C
until further processing. T-RFLP was performed as previously used by Gentes et al. (2013).
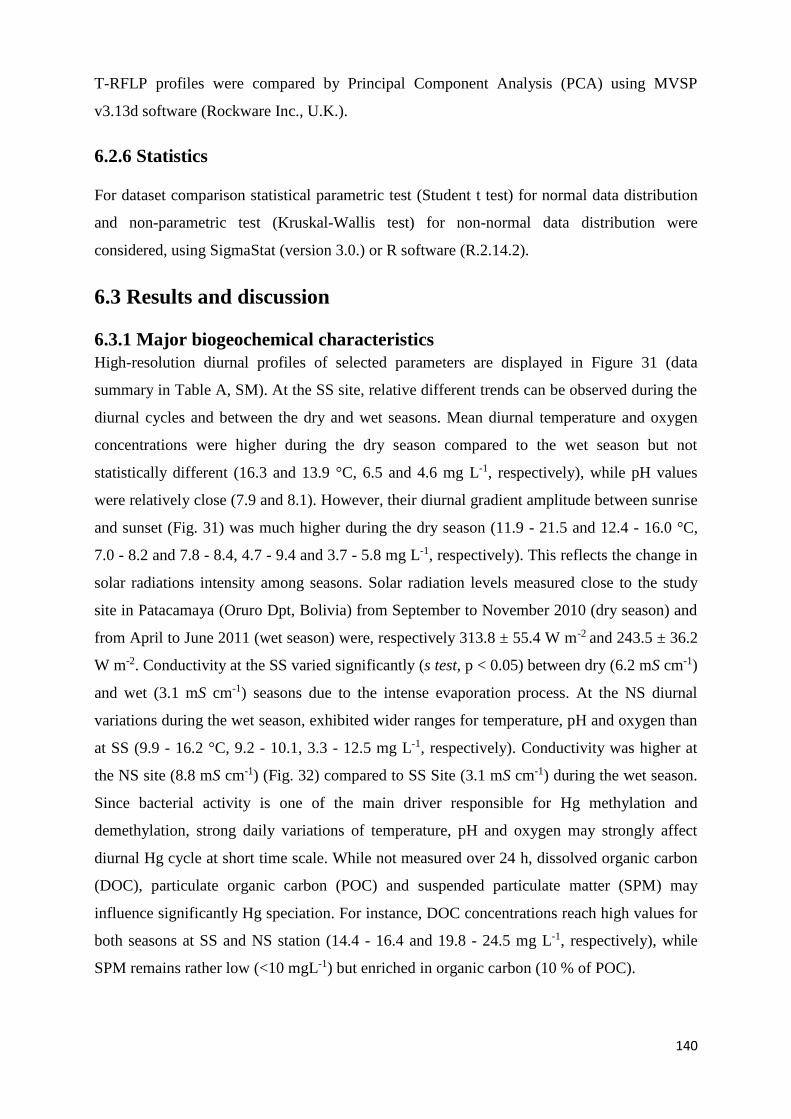
140
T-RFLP profiles were compared by Principal Component Analysis (PCA) using MVSP
v3.13d software (Rockware Inc., U.K.).
6.2.6 Statistics
For dataset comparison statistical parametric test (Student t test) for normal data distribution
and non-parametric test (Kruskal-Wallis test) for non-normal data distribution were
considered, using SigmaStat (version 3.0.) or R software (R.2.14.2).
6.3 Results and discussion
6.3.1 Major biogeochemical characteristics
High-resolution diurnal profiles of selected parameters are displayed in Figure 31 (data
summary in Table A, SM). At the SS site, relative different trends can be observed during the
diurnal cycles and between the dry and wet seasons. Mean diurnal temperature and oxygen
concentrations were higher during the dry season compared to the wet season but not
statistically different (16.3 and 13.9 °C, 6.5 and 4.6 mg L-1, respectively), while pH values
were relatively close (7.9 and 8.1). However, their diurnal gradient amplitude between sunrise
and sunset (Fig. 31) was much higher during the dry season (11.9 - 21.5 and 12.4 - 16.0 °C,
7.0 - 8.2 and 7.8 - 8.4, 4.7 - 9.4 and 3.7 - 5.8 mg L-1, respectively). This reflects the change in
solar radiations intensity among seasons. Solar radiation levels measured close to the study
site in Patacamaya (Oruro Dpt, Bolivia) from September to November 2010 (dry season) and
from April to June 2011 (wet season) were, respectively 313.8 ± 55.4 W m-2 and 243.5 ± 36.2
W m-2. Conductivity at the SS varied significantly (s test, p < 0.05) between dry (6.2 mS cm-1)
and wet (3.1 mS cm-1) seasons due to the intense evaporation process. At the NS diurnal
variations during the wet season, exhibited wider ranges for temperature, pH and oxygen than
at SS (9.9 - 16.2 °C, 9.2 - 10.1, 3.3 - 12.5 mg L-1, respectively). Conductivity was higher at
the NS site (8.8 mS cm-1) (Fig. 32) compared to SS Site (3.1 mS cm-1) during the wet season.
Since bacterial activity is one of the main driver responsible for Hg methylation and
demethylation, strong daily variations of temperature, pH and oxygen may strongly affect
diurnal Hg cycle at short time scale. While not measured over 24 h, dissolved organic carbon
(DOC), particulate organic carbon (POC) and suspended particulate matter (SPM) may
influence significantly Hg speciation. For instance, DOC concentrations reach high values for
both seasons at SS and NS station (14.4 - 16.4 and 19.8 - 24.5 mg L-1, respectively), while
SPM remains rather low (<10 mgL-1) but enriched in organic carbon (10 % of POC).
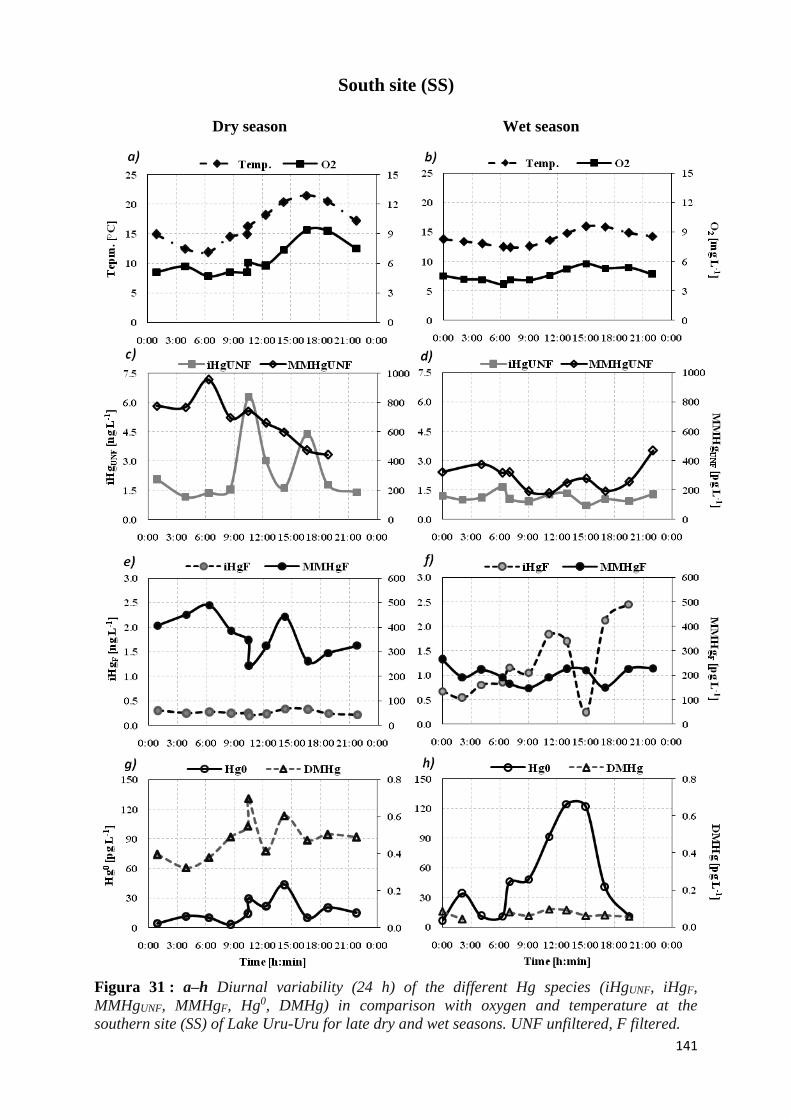
141
South site (SS)
Dry season Wet season
Figura 31 : a–h Diurnal variability (24 h) of the different Hg species (iHgUNF, iHgF,
MMHgUNF, MMHgF, Hg0, DMHg) in comparison with oxygen and temperature at the
southern site (SS) of Lake Uru-Uru for late dry and wet seasons. UNF unfiltered, F filtered.
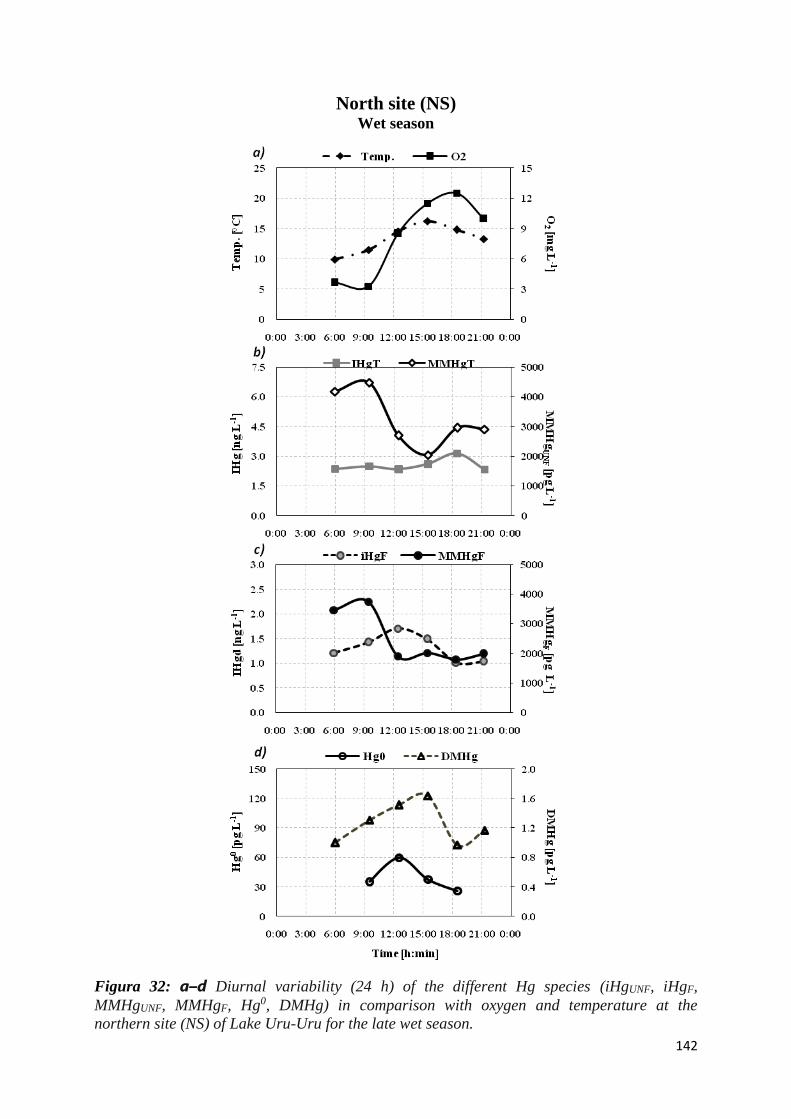
142
North site (NS) Wet season
Figura 32: a–d Diurnal variability (24 h) of the different Hg species (iHgUNF, iHgF,
MMHgUNF, MMHgF, Hg0, DMHg) in comparison with oxygen and temperature at the
northern site (NS) of Lake Uru-Uru for the late wet season.
143
6.3.2 Sulfate reducing bacteria communities
The T-RFLP based on dsr genes polymorphism, applied to detect sulfate-reducing bacteria,
indicated that they were present in all the samples collected at NS and SS in Lake Uru-Uru.
During the dry season, the composition of sulfate reducing bacterial communities in
sediments and bio-organic aggregates was homogeneous (Figure 33), but very heterogeneous
in water samples. Similar results were obtained in the water samples during the wet season
(data not shown). This heterogeneity is probably due to the occurrence in different proportion
of particulate material and also to the lower abundances in dsrAB genes. The correspondence
analysis shows a strong effect of the reducing conditions (sediments vs water) on the samples’
dsrAB diversity as distributed along the axis 1 (32% of the variance). It also high lights the
influence of available organic carbon (water vs bio-organic aggregates) through the axis 2,
explaining 30 % of the sulfate reducing bacteria communities composition.
Figura 33 : Correspondence analysis based on T-RFLP results for the dsrAB genes in the
samples collected during the late dry season at stations SS and NS and in different
compartments (W water, Sed sediments, Agg floating bio-organic aggregates). The letters A,
B, and C refer to triplicates for each sample
SS
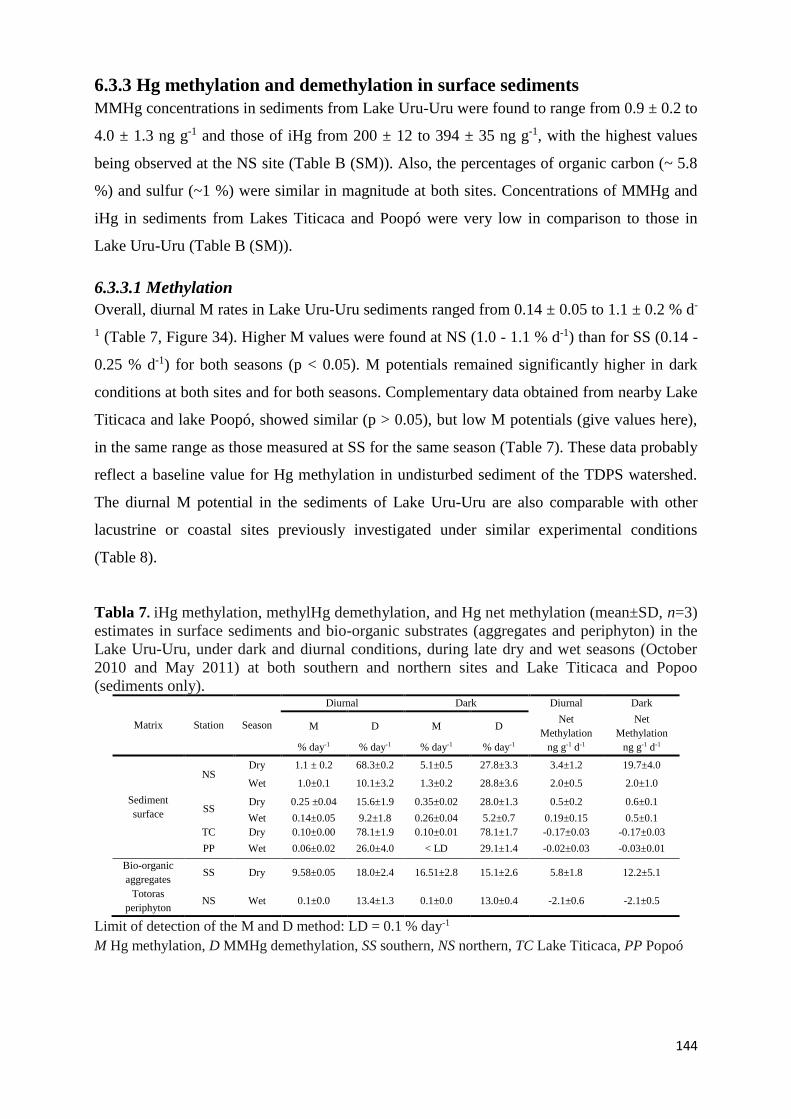
144
6.3.3 Hg methylation and demethylation in surface sediments
MMHg concentrations in sediments from Lake Uru-Uru were found to range from 0.9 ± 0.2 to
4.0 ± 1.3 ng g-1 and those of iHg from 200 ± 12 to 394 ± 35 ng g-1, with the highest values
being observed at the NS site (Table B (SM)). Also, the percentages of organic carbon (~ 5.8
%) and sulfur (~1 %) were similar in magnitude at both sites. Concentrations of MMHg and
iHg in sediments from Lakes Titicaca and Poopó were very low in comparison to those in
Lake Uru-Uru (Table B (SM)).
6.3.3.1 Methylation
Overall, diurnal M rates in Lake Uru-Uru sediments ranged from 0.14 ± 0.05 to 1.1 ± 0.2 % d-
1 (Table 7, Figure 34). Higher M values were found at NS (1.0 - 1.1 % d-1) than for SS (0.14 -
0.25 % d-1) for both seasons (p < 0.05). M potentials remained significantly higher in dark
conditions at both sites and for both seasons. Complementary data obtained from nearby Lake
Titicaca and lake Poopó, showed similar (p > 0.05), but low M potentials (give values here),
in the same range as those measured at SS for the same season (Table 7). These data probably
reflect a baseline value for Hg methylation in undisturbed sediment of the TDPS watershed.
The diurnal M potential in the sediments of Lake Uru-Uru are also comparable with other
lacustrine or coastal sites previously investigated under similar experimental conditions
(Table 8).
Tabla 7. iHg methylation, methylHg demethylation, and Hg net methylation (mean±SD, n=3)
estimates in surface sediments and bio-organic substrates (aggregates and periphyton) in the
Lake Uru-Uru, under dark and diurnal conditions, during late dry and wet seasons (October
2010 and May 2011) at both southern and northern sites and Lake Titicaca and Popoo
(sediments only).
Matrix Station Season
Diurnal Dark Diurnal Dark
M D M D Net
Methylation
Net
Methylation
% day-1 % day-1 % day-1 % day-1 ng g-1 d-1 ng g-1 d-1
Sediment
surface
NS Dry 1.1 ± 0.2 68.3±0.2 5.1±0.5 27.8±3.3 3.4±1.2 19.7±4.0
Wet 1.0±0.1 10.1±3.2 1.3±0.2 28.8±3.6 2.0±0.5 2.0±1.0
SS Dry 0.25 ±0.04 15.6±1.9 0.35±0.02 28.0±1.3 0.5±0.2 0.6±0.1
Wet 0.14±0.05 9.2±1.8 0.26±0.04 5.2±0.7 0.19±0.15 0.5±0.1
TC Dry 0.10±0.00 78.1±1.9 0.10±0.01 78.1±1.7 -0.17±0.03 -0.17±0.03
PP Wet 0.06±0.02 26.0±4.0 < LD 29.1±1.4 -0.02±0.03 -0.03±0.01
Bio-organic
aggregates SS Dry 9.58±0.05 18.0±2.4 16.51±2.8 15.1±2.6 5.8±1.8 12.2±5.1
Totoras
periphyton NS Wet 0.1±0.0 13.4±1.3 0.1±0.0 13.0±0.4 -2.1±0.6 -2.1±0.5
Limit of detection of the M and D method: LD = 0.1 % day-1
M Hg methylation, D MMHg demethylation, SS southern, NS northern, TC Lake Titicaca, PP Popoó
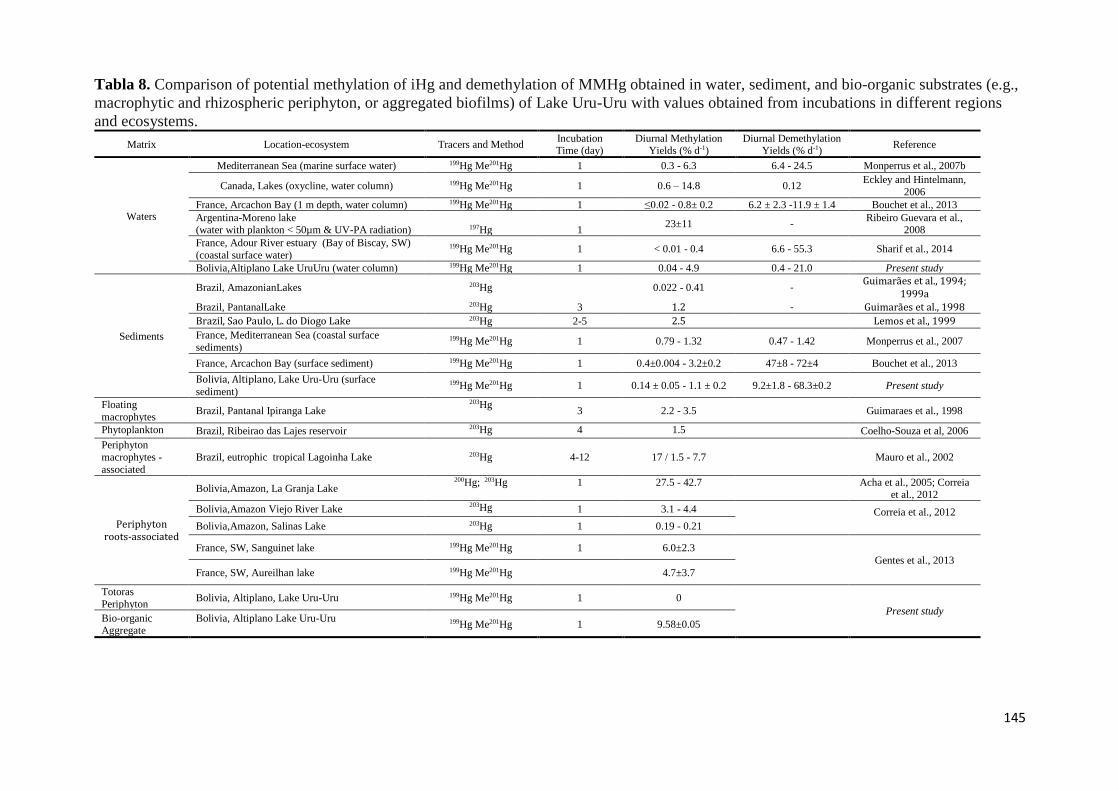
145
Tabla 8. Comparison of potential methylation of iHg and demethylation of MMHg obtained in water, sediment, and bio-organic substrates (e.g.,
macrophytic and rhizospheric periphyton, or aggregated biofilms) of Lake Uru-Uru with values obtained from incubations in different regions
and ecosystems.
Matrix Location-ecosystem Tracers and Method Incubation Time (day)
Diurnal Methylation Yields (% d-1)
Diurnal Demethylation Yields (% d-1)
Reference
Waters
Mediterranean Sea (marine surface water) 199Hg Me201Hg 1 0.3 - 6.3 6.4 - 24.5 Monperrus et al., 2007b
Canada, Lakes (oxycline, water column) 199Hg Me201Hg 1 0.6 – 14.8 0.12 Eckley and Hintelmann,
2006
France, Arcachon Bay (1 m depth, water column) 199Hg Me201Hg 1 ≤0.02 - 0.8± 0.2 6.2 ± 2.3 -11.9 ± 1.4 Bouchet et al., 2013
Argentina-Moreno lake (water with plankton < 50µm & UV-PA radiation)
197Hg
1
23±11 - Ribeiro Guevara et al.,
2008
France, Adour River estuary (Bay of Biscay, SW)
(coastal surface water) 199Hg Me201Hg 1 < 0.01 - 0.4 6.6 - 55.3 Sharif et al., 2014
Bolivia,Altiplano Lake UruUru (water column) 199Hg Me201Hg 1 0.04 - 4.9 0.4 - 21.0 Present study
Sediments
Brazil, AmazonianLakes 203Hg 0.022 - 0.41 - Guimarães et al., 1994;
1999a
Brazil, PantanalLake 203Hg 3 1.2 - Guimarães et al., 1998
Brazil, Sao Paulo, L. do Diogo Lake 203Hg 2-5 2.5 Lemos et al., 1999
France, Mediterranean Sea (coastal surface
sediments) 199Hg Me201Hg 1 0.79 - 1.32 0.47 - 1.42 Monperrus et al., 2007
France, Arcachon Bay (surface sediment) 199Hg Me201Hg 1 0.4±0.004 - 3.2±0.2 47±8 - 72±4 Bouchet et al., 2013
Bolivia, Altiplano, Lake Uru-Uru (surface
sediment) 199Hg Me201Hg 1 0.14 ± 0.05 - 1.1 ± 0.2 9.2±1.8 - 68.3±0.2 Present study
Floating
macrophytes Brazil, Pantanal Ipiranga Lake
203Hg 3 2.2 - 3.5
Guimaraes et al., 1998
Phytoplankton Brazil, Ribeirao das Lajes reservoir 203Hg 4 1.5 Coelho-Souza et al, 2006
Periphyton
macrophytes -
associated Brazil, eutrophic tropical Lagoinha Lake 203Hg 4-12 17 / 1.5 - 7.7
Mauro et al., 2002
Periphyton roots-associated
Bolivia,Amazon, La Granja Lake 200Hg; 203Hg 1 27.5 - 42.7 Acha et al., 2005; Correia
et al., 2012
Bolivia,Amazon Viejo River Lake 203Hg 1 3.1 - 4.4 Correia et al., 2012
Bolivia,Amazon, Salinas Lake 203Hg 1 0.19 - 0.21
France, SW, Sanguinet lake 199Hg Me201Hg 1 6.0±2.3
Gentes et al., 2013
France, SW, Aureilhan lake 199Hg Me201Hg 4.7±3.7
Totoras
Periphyton Bolivia, Altiplano, Lake Uru-Uru 199Hg Me201Hg 1 0
Present study Bio-organic Aggregate
Bolivia, Altiplano Lake Uru-Uru
199Hg Me201Hg 1 9.58±0.05
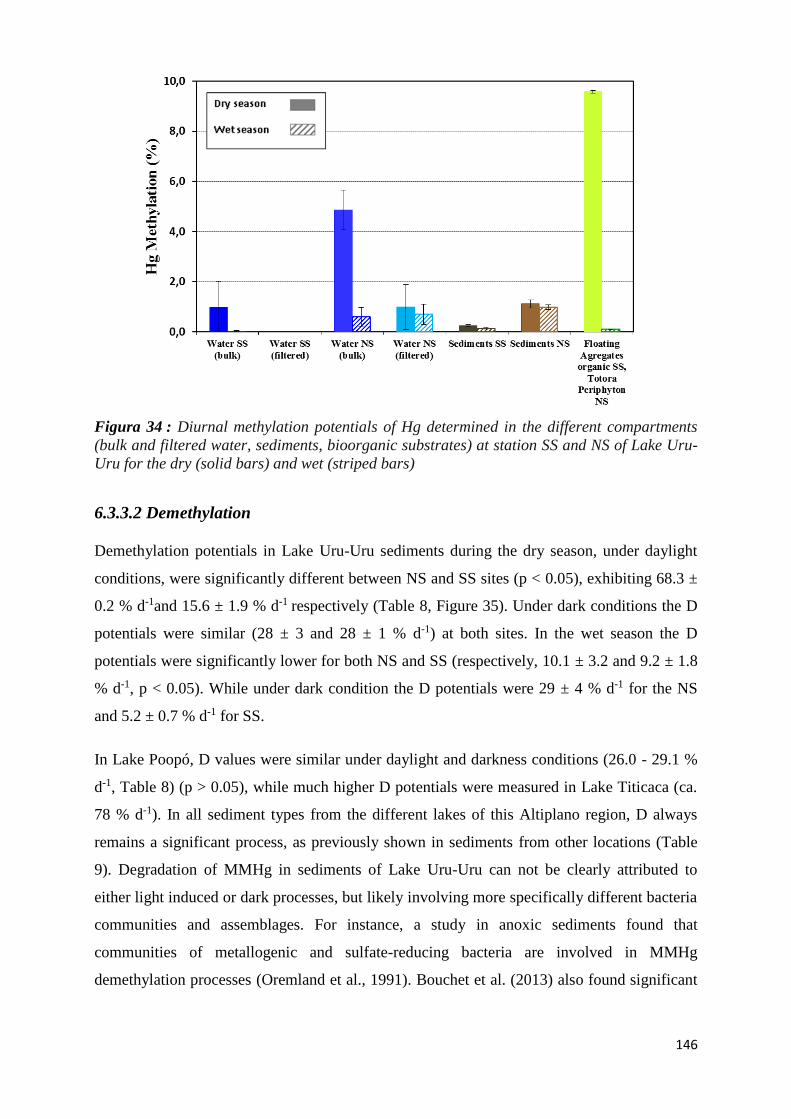
146
Figura 34 : Diurnal methylation potentials of Hg determined in the different compartments
(bulk and filtered water, sediments, bioorganic substrates) at station SS and NS of Lake Uru-
Uru for the dry (solid bars) and wet (striped bars)
6.3.3.2 Demethylation
Demethylation potentials in Lake Uru-Uru sediments during the dry season, under daylight
conditions, were significantly different between NS and SS sites (p < 0.05), exhibiting 68.3 ±
0.2 % d-1and 15.6 ± 1.9 % d-1 respectively (Table 8, Figure 35). Under dark conditions the D
potentials were similar (28 ± 3 and 28 ± 1 % d-1) at both sites. In the wet season the D
potentials were significantly lower for both NS and SS (respectively, 10.1 ± 3.2 and 9.2 ± 1.8
% d-1, p < 0.05). While under dark condition the D potentials were 29 ± 4 % d-1 for the NS
and 5.2 ± 0.7 % d-1 for SS.
In Lake Poopó, D values were similar under daylight and darkness conditions (26.0 - 29.1 %
d-1, Table 8) (p > 0.05), while much higher D potentials were measured in Lake Titicaca (ca.
78 % d-1). In all sediment types from the different lakes of this Altiplano region, D always
remains a significant process, as previously shown in sediments from other locations (Table
9). Degradation of MMHg in sediments of Lake Uru-Uru can not be clearly attributed to
either light induced or dark processes, but likely involving more specifically different bacteria
communities and assemblages. For instance, a study in anoxic sediments found that
communities of metallogenic and sulfate-reducing bacteria are involved in MMHg
demethylation processes (Oremland et al., 1991). Bouchet et al. (2013) also found significant
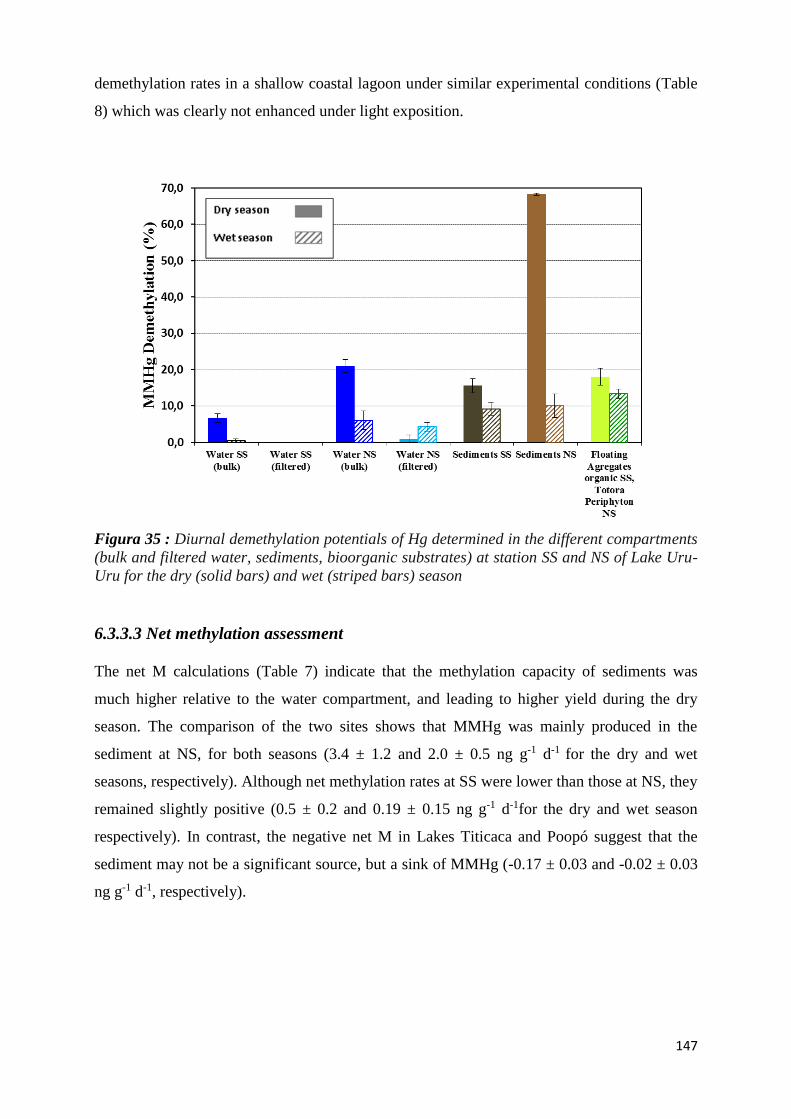
147
demethylation rates in a shallow coastal lagoon under similar experimental conditions (Table
8) which was clearly not enhanced under light exposition.
Figura 35 : Diurnal demethylation potentials of Hg determined in the different compartments
(bulk and filtered water, sediments, bioorganic substrates) at station SS and NS of Lake Uru-
Uru for the dry (solid bars) and wet (striped bars) season
6.3.3.3 Net methylation assessment
The net M calculations (Table 7) indicate that the methylation capacity of sediments was
much higher relative to the water compartment, and leading to higher yield during the dry
season. The comparison of the two sites shows that MMHg was mainly produced in the
sediment at NS, for both seasons (3.4 ± 1.2 and 2.0 ± 0.5 ng g-1 d-1 for the dry and wet
seasons, respectively). Although net methylation rates at SS were lower than those at NS, they
remained slightly positive (0.5 ± 0.2 and 0.19 ± 0.15 ng g-1 d-1for the dry and wet season
respectively). In contrast, the negative net M in Lakes Titicaca and Poopó suggest that the
sediment may not be a significant source, but a sink of MMHg (-0.17 ± 0.03 and -0.02 ± 0.03
ng g-1 d-1, respectively).
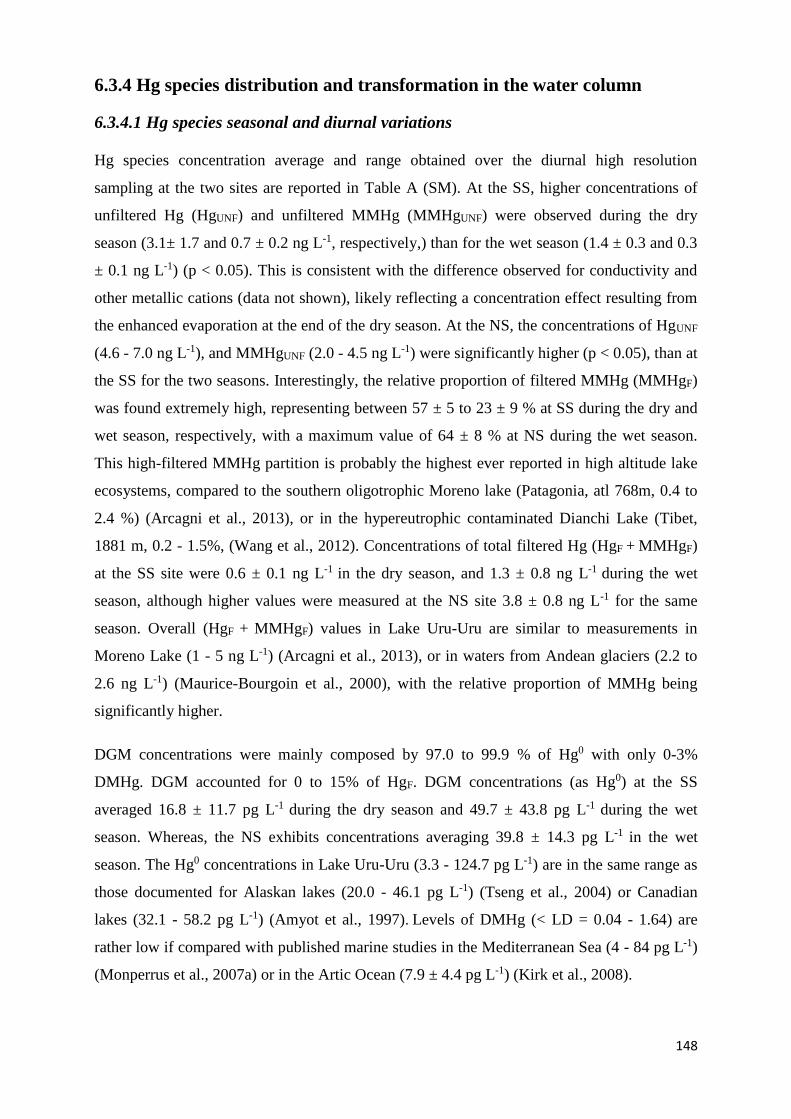
148
6.3.4 Hg species distribution and transformation in the water column
6.3.4.1 Hg species seasonal and diurnal variations
Hg species concentration average and range obtained over the diurnal high resolution
sampling at the two sites are reported in Table A (SM). At the SS, higher concentrations of
unfiltered Hg (HgUNF) and unfiltered MMHg (MMHgUNF) were observed during the dry
season (3.1± 1.7 and 0.7 ± 0.2 ng L-1, respectively,) than for the wet season (1.4 ± 0.3 and 0.3
± 0.1 ng L-1) (p < 0.05). This is consistent with the difference observed for conductivity and
other metallic cations (data not shown), likely reflecting a concentration effect resulting from
the enhanced evaporation at the end of the dry season. At the NS, the concentrations of HgUNF
(4.6 - 7.0 ng L-1), and MMHgUNF (2.0 - 4.5 ng L-1) were significantly higher (p < 0.05), than at
the SS for the two seasons. Interestingly, the relative proportion of filtered MMHg (MMHgF)
was found extremely high, representing between 57 ± 5 to 23 ± 9 % at SS during the dry and
wet season, respectively, with a maximum value of 64 ± 8 % at NS during the wet season.
This high-filtered MMHg partition is probably the highest ever reported in high altitude lake
ecosystems, compared to the southern oligotrophic Moreno lake (Patagonia, atl 768m, 0.4 to
2.4 %) (Arcagni et al., 2013), or in the hypereutrophic contaminated Dianchi Lake (Tibet,
1881 m, 0.2 - 1.5%, (Wang et al., 2012). Concentrations of total filtered Hg (HgF + MMHgF)
at the SS site were 0.6 ± 0.1 ng L-1 in the dry season, and 1.3 ± 0.8 ng L-1 during the wet
season, although higher values were measured at the NS site 3.8 ± 0.8 ng L-1 for the same
season. Overall (HgF + MMHgF) values in Lake Uru-Uru are similar to measurements in
Moreno Lake (1 - 5 ng L-1) (Arcagni et al., 2013), or in waters from Andean glaciers (2.2 to
2.6 ng L-1) (Maurice-Bourgoin et al., 2000), with the relative proportion of MMHg being
significantly higher.
DGM concentrations were mainly composed by 97.0 to 99.9 % of Hg0 with only 0-3%
DMHg. DGM accounted for 0 to 15% of HgF. DGM concentrations (as Hg0) at the SS
averaged 16.8 ± 11.7 pg L-1 during the dry season and 49.7 ± 43.8 pg L-1 during the wet
season. Whereas, the NS exhibits concentrations averaging 39.8 ± 14.3 pg L-1 in the wet
season. The Hg0 concentrations in Lake Uru-Uru (3.3 - 124.7 pg L-1) are in the same range as
those documented for Alaskan lakes (20.0 - 46.1 pg L-1) (Tseng et al., 2004) or Canadian
lakes (32.1 - 58.2 pg L-1) (Amyot et al., 1997). Levels of DMHg (< LD = 0.04 - 1.64) are
rather low if compared with published marine studies in the Mediterranean Sea (4 - 84 pg L-1)
(Monperrus et al., 2007a) or in the Artic Ocean (7.9 ± 4.4 pg L-1) (Kirk et al., 2008).
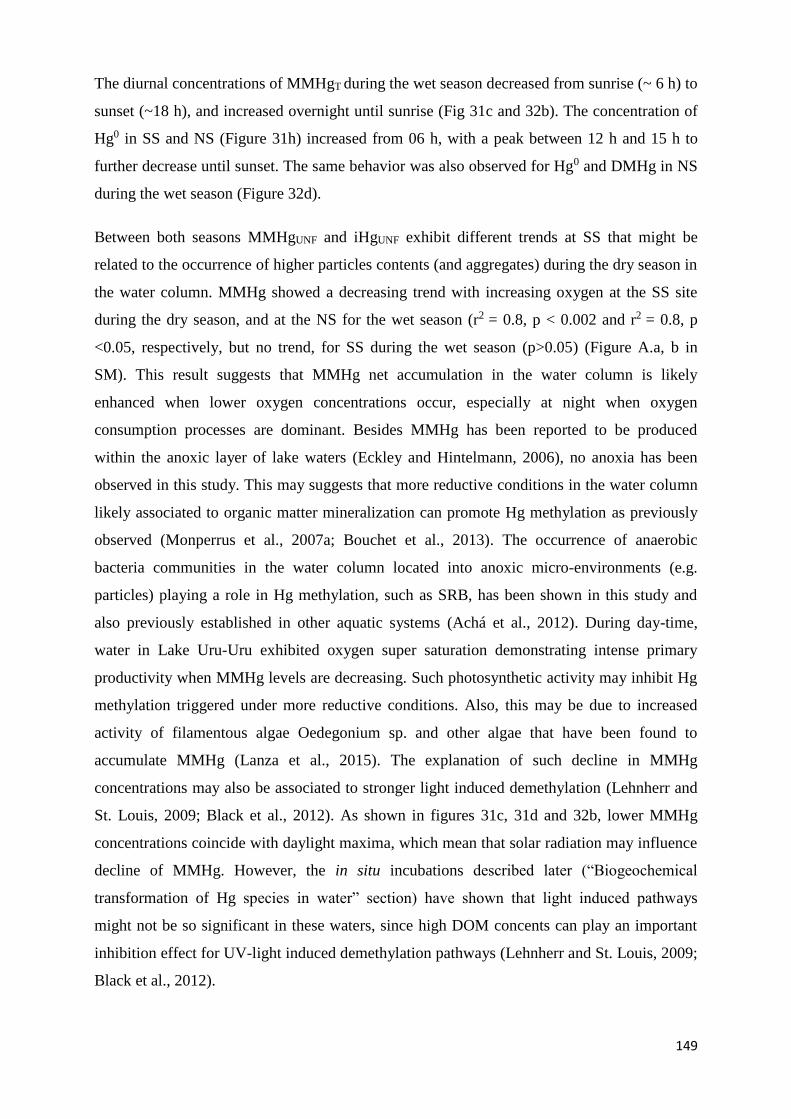
149
The diurnal concentrations of MMHgT during the wet season decreased from sunrise (~ 6 h) to
sunset (~18 h), and increased overnight until sunrise (Fig 31c and 32b). The concentration of
Hg0 in SS and NS (Figure 31h) increased from 06 h, with a peak between 12 h and 15 h to
further decrease until sunset. The same behavior was also observed for Hg0 and DMHg in NS
during the wet season (Figure 32d).
Between both seasons MMHgUNF and iHgUNF exhibit different trends at SS that might be
related to the occurrence of higher particles contents (and aggregates) during the dry season in
the water column. MMHg showed a decreasing trend with increasing oxygen at the SS site
during the dry season, and at the NS for the wet season (r2 = 0.8, p < 0.002 and r2 = 0.8, p
<0.05, respectively, but no trend, for SS during the wet season (p>0.05) (Figure A.a, b in
SM). This result suggests that MMHg net accumulation in the water column is likely
enhanced when lower oxygen concentrations occur, especially at night when oxygen
consumption processes are dominant. Besides MMHg has been reported to be produced
within the anoxic layer of lake waters (Eckley and Hintelmann, 2006), no anoxia has been
observed in this study. This may suggests that more reductive conditions in the water column
likely associated to organic matter mineralization can promote Hg methylation as previously
observed (Monperrus et al., 2007a; Bouchet et al., 2013). The occurrence of anaerobic
bacteria communities in the water column located into anoxic micro-environments (e.g.
particles) playing a role in Hg methylation, such as SRB, has been shown in this study and
also previously established in other aquatic systems (Achá et al., 2012). During day-time,
water in Lake Uru-Uru exhibited oxygen super saturation demonstrating intense primary
productivity when MMHg levels are decreasing. Such photosynthetic activity may inhibit Hg
methylation triggered under more reductive conditions. Also, this may be due to increased
activity of filamentous algae Oedegonium sp. and other algae that have been found to
accumulate MMHg (Lanza et al., 2015). The explanation of such decline in MMHg
concentrations may also be associated to stronger light induced demethylation (Lehnherr and
St. Louis, 2009; Black et al., 2012). As shown in figures 31c, 31d and 32b, lower MMHg
concentrations coincide with daylight maxima, which mean that solar radiation may influence
decline of MMHg. However, the in situ incubations described later (“Biogeochemical
transformation of Hg species in water” section) have shown that light induced pathways
might not be so significant in these waters, since high DOM concents can play an important
inhibition effect for UV-light induced demethylation pathways (Lehnherr and St. Louis, 2009;
Black et al., 2012).
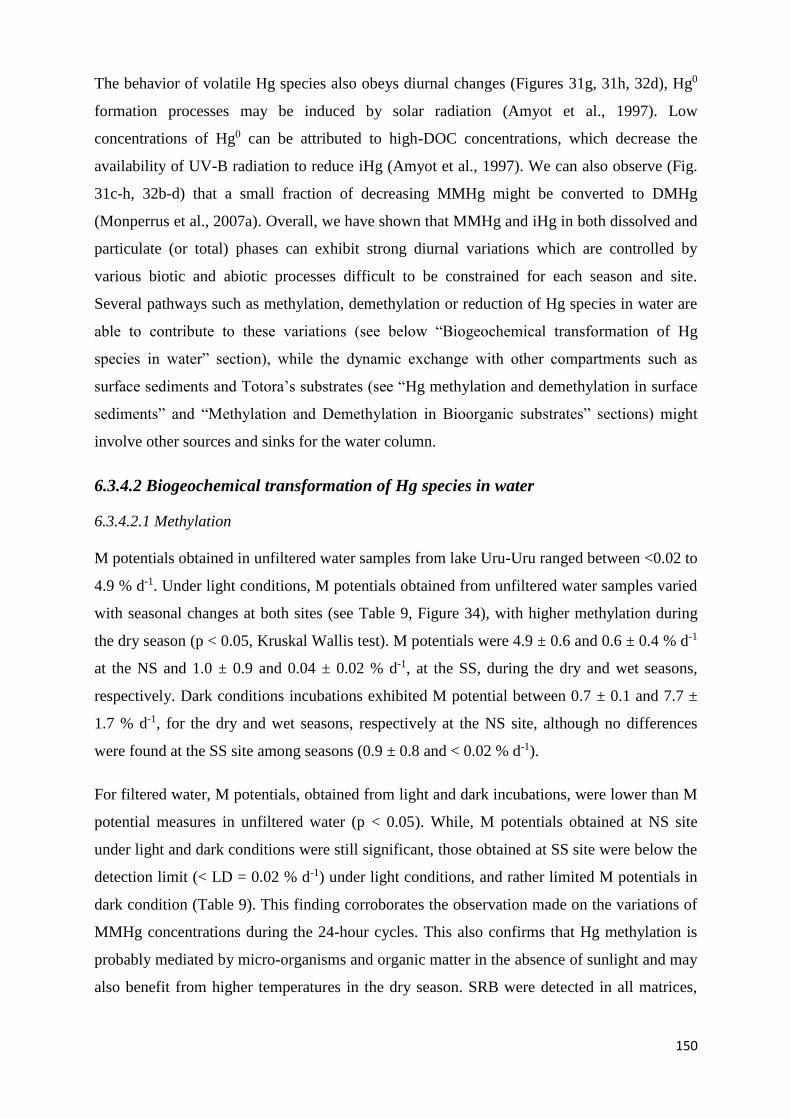
150
The behavior of volatile Hg species also obeys diurnal changes (Figures 31g, 31h, 32d), Hg0
formation processes may be induced by solar radiation (Amyot et al., 1997). Low
concentrations of Hg0 can be attributed to high-DOC concentrations, which decrease the
availability of UV-B radiation to reduce iHg (Amyot et al., 1997). We can also observe (Fig.
31c-h, 32b-d) that a small fraction of decreasing MMHg might be converted to DMHg
(Monperrus et al., 2007a). Overall, we have shown that MMHg and iHg in both dissolved and
particulate (or total) phases can exhibit strong diurnal variations which are controlled by
various biotic and abiotic processes difficult to be constrained for each season and site.
Several pathways such as methylation, demethylation or reduction of Hg species in water are
able to contribute to these variations (see below “Biogeochemical transformation of Hg
species in water” section), while the dynamic exchange with other compartments such as
surface sediments and Totora’s substrates (see “Hg methylation and demethylation in surface
sediments” and “Methylation and Demethylation in Bioorganic substrates” sections) might
involve other sources and sinks for the water column.
6.3.4.2 Biogeochemical transformation of Hg species in water
6.3.4.2.1 Methylation
M potentials obtained in unfiltered water samples from lake Uru-Uru ranged between <0.02 to
4.9 % d-1. Under light conditions, M potentials obtained from unfiltered water samples varied
with seasonal changes at both sites (see Table 9, Figure 34), with higher methylation during
the dry season (p < 0.05, Kruskal Wallis test). M potentials were 4.9 ± 0.6 and 0.6 ± 0.4 % d-1
at the NS and 1.0 ± 0.9 and 0.04 ± 0.02 % d-1, at the SS, during the dry and wet seasons,
respectively. Dark conditions incubations exhibited M potential between 0.7 ± 0.1 and 7.7 ±
1.7 % d-1, for the dry and wet seasons, respectively at the NS site, although no differences
were found at the SS site among seasons (0.9 ± 0.8 and < 0.02 % d-1).
For filtered water, M potentials, obtained from light and dark incubations, were lower than M
potential measures in unfiltered water (p < 0.05). While, M potentials obtained at NS site
under light and dark conditions were still significant, those obtained at SS site were below the
detection limit (< LD = 0.02 % d-1) under light conditions, and rather limited M potentials in
dark condition (Table 9). This finding corroborates the observation made on the variations of
MMHg concentrations during the 24-hour cycles. This also confirms that Hg methylation is
probably mediated by micro-organisms and organic matter in the absence of sunlight and may
also benefit from higher temperatures in the dry season. SRB were detected in all matrices,
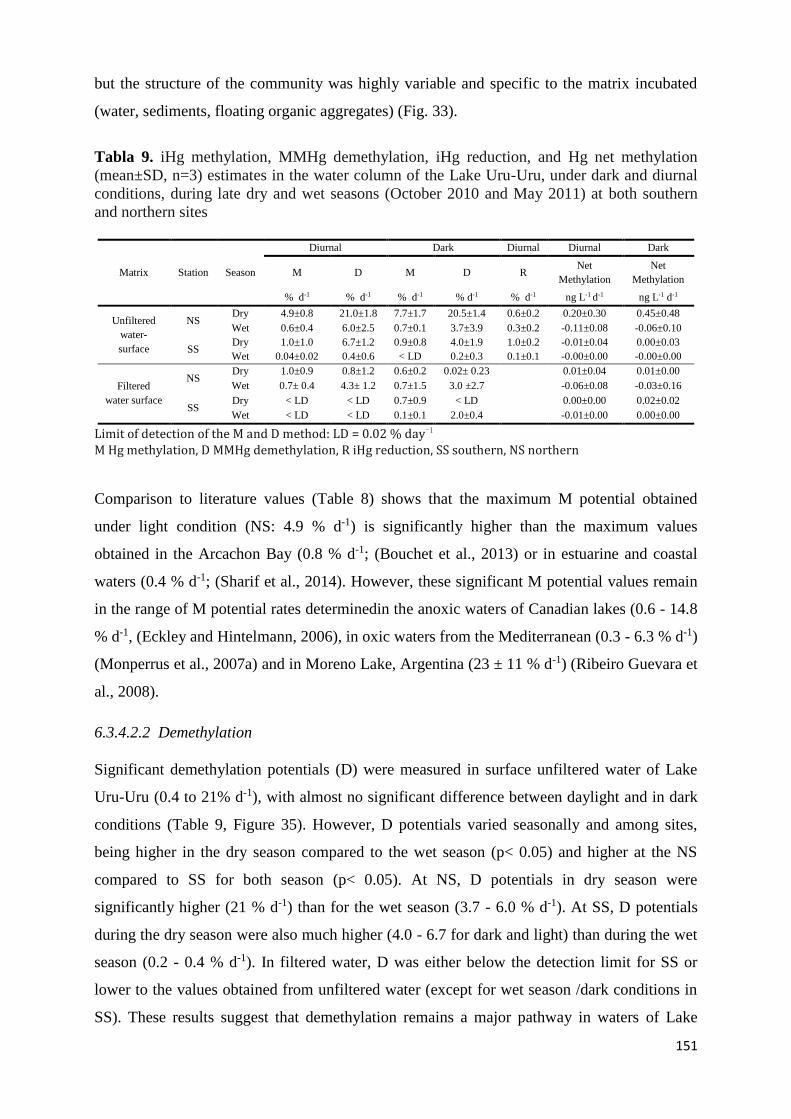
151
but the structure of the community was highly variable and specific to the matrix incubated
(water, sediments, floating organic aggregates) (Fig. 33).
Tabla 9. iHg methylation, MMHg demethylation, iHg reduction, and Hg net methylation
(mean±SD, n=3) estimates in the water column of the Lake Uru-Uru, under dark and diurnal
conditions, during late dry and wet seasons (October 2010 and May 2011) at both southern
and northern sites
Matrix Station Season
Diurnal Dark Diurnal Diurnal Dark
M D M D R Net
Methylation
Net
Methylation
% d-1 % d-1 % d-1 % d-1 % d-1 ng L-1 d-1 ng L-1 d-1
Unfiltered
water-
surface
NS Dry 4.9±0.8 21.0±1.8 7.7±1.7 20.5±1.4 0.6±0.2 0.20±0.30 0.45±0.48
Wet 0.6±0.4 6.0±2.5 0.7±0.1 3.7±3.9 0.3±0.2 -0.11±0.08 -0.06±0.10
SS Dry 1.0±1.0 6.7±1.2 0.9±0.8 4.0±1.9 1.0±0.2 -0.01±0.04 0.00±0.03
Wet 0.04±0.02 0.4±0.6 < LD 0.2±0.3 0.1±0.1 -0.00±0.00 -0.00±0.00
Filtered
water surface
NS Dry 1.0±0.9 0.8±1.2 0.6±0.2 0.02± 0.23 0.01±0.04 0.01±0.00
Wet 0.7± 0.4 4.3± 1.2 0.7±1.5 3.0 ±2.7 -0.06±0.08 -0.03±0.16
SS Dry < LD < LD 0.7±0.9 < LD 0.00±0.00 0.02±0.02
Wet < LD < LD 0.1±0.1 2.0±0.4 -0.01±0.00 0.00±0.00
Limit of detection of the M and D method: LD = 0.02 % day-1 M Hg methylation, D MMHg demethylation, R iHg reduction, SS southern, NS northern
Comparison to literature values (Table 8) shows that the maximum M potential obtained
under light condition (NS: 4.9 % d-1) is significantly higher than the maximum values
obtained in the Arcachon Bay (0.8 % d-1; (Bouchet et al., 2013) or in estuarine and coastal
waters (0.4 % d-1; (Sharif et al., 2014). However, these significant M potential values remain
in the range of M potential rates determinedin the anoxic waters of Canadian lakes (0.6 - 14.8
% d-1, (Eckley and Hintelmann, 2006), in oxic waters from the Mediterranean (0.3 - 6.3 % d-1)
(Monperrus et al., 2007a) and in Moreno Lake, Argentina (23 ± 11 % d-1) (Ribeiro Guevara et
al., 2008).
6.3.4.2.2 Demethylation
Significant demethylation potentials (D) were measured in surface unfiltered water of Lake
Uru-Uru (0.4 to 21% d-1), with almost no significant difference between daylight and in dark
conditions (Table 9, Figure 35). However, D potentials varied seasonally and among sites,
being higher in the dry season compared to the wet season (p< 0.05) and higher at the NS
compared to SS for both season (p< 0.05). At NS, D potentials in dry season were
significantly higher (21 % d-1) than for the wet season (3.7 - 6.0 % d-1). At SS, D potentials
during the dry season were also much higher (4.0 - 6.7 for dark and light) than during the wet
season (0.2 - 0.4 % d-1). In filtered water, D was either below the detection limit for SS or
lower to the values obtained from unfiltered water (except for wet season /dark conditions in
SS). These results suggest that demethylation remains a major pathway in waters of Lake
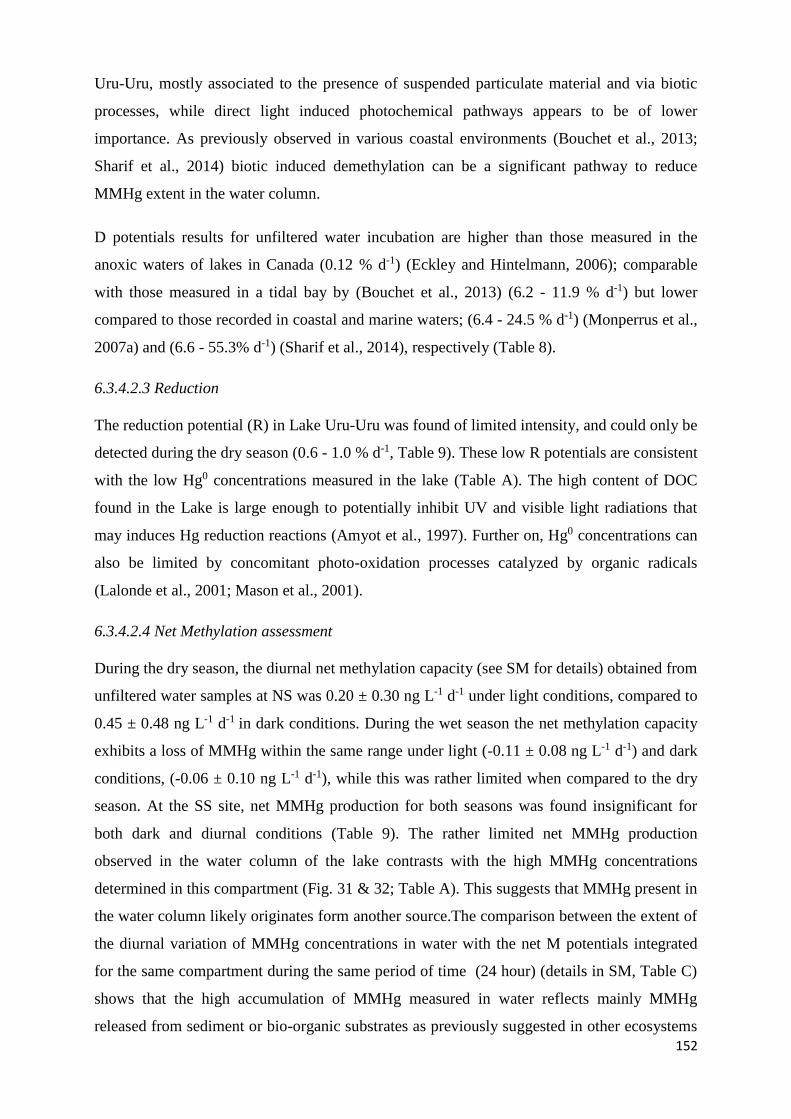
152
Uru-Uru, mostly associated to the presence of suspended particulate material and via biotic
processes, while direct light induced photochemical pathways appears to be of lower
importance. As previously observed in various coastal environments (Bouchet et al., 2013;
Sharif et al., 2014) biotic induced demethylation can be a significant pathway to reduce
MMHg extent in the water column.
D potentials results for unfiltered water incubation are higher than those measured in the
anoxic waters of lakes in Canada (0.12 % d-1) (Eckley and Hintelmann, 2006); comparable
with those measured in a tidal bay by (Bouchet et al., 2013) (6.2 - 11.9 % d-1) but lower
compared to those recorded in coastal and marine waters; (6.4 - 24.5 % d-1) (Monperrus et al.,
2007a) and (6.6 - 55.3% d-1) (Sharif et al., 2014), respectively (Table 8).
6.3.4.2.3 Reduction
The reduction potential (R) in Lake Uru-Uru was found of limited intensity, and could only be
detected during the dry season (0.6 - 1.0 % d-1, Table 9). These low R potentials are consistent
with the low Hg0 concentrations measured in the lake (Table A). The high content of DOC
found in the Lake is large enough to potentially inhibit UV and visible light radiations that
may induces Hg reduction reactions (Amyot et al., 1997). Further on, Hg0 concentrations can
also be limited by concomitant photo-oxidation processes catalyzed by organic radicals
(Lalonde et al., 2001; Mason et al., 2001).
6.3.4.2.4 Net Methylation assessment
During the dry season, the diurnal net methylation capacity (see SM for details) obtained from
unfiltered water samples at NS was 0.20 ± 0.30 ng L-1 d-1 under light conditions, compared to
0.45 ± 0.48 ng L-1 d-1 in dark conditions. During the wet season the net methylation capacity
exhibits a loss of MMHg within the same range under light (-0.11 ± 0.08 ng L-1 d-1) and dark
conditions, (-0.06 ± 0.10 ng L-1 d-1), while this was rather limited when compared to the dry
season. At the SS site, net MMHg production for both seasons was found insignificant for
both dark and diurnal conditions (Table 9). The rather limited net MMHg production
observed in the water column of the lake contrasts with the high MMHg concentrations
determined in this compartment (Fig. 31 & 32; Table A). This suggests that MMHg present in
the water column likely originates form another source.The comparison between the extent of
the diurnal variation of MMHg concentrations in water with the net M potentials integrated
for the same compartment during the same period of time (24 hour) (details in SM, Table C)
shows that the high accumulation of MMHg measured in water reflects mainly MMHg
released from sediment or bio-organic substrates as previously suggested in other ecosystems
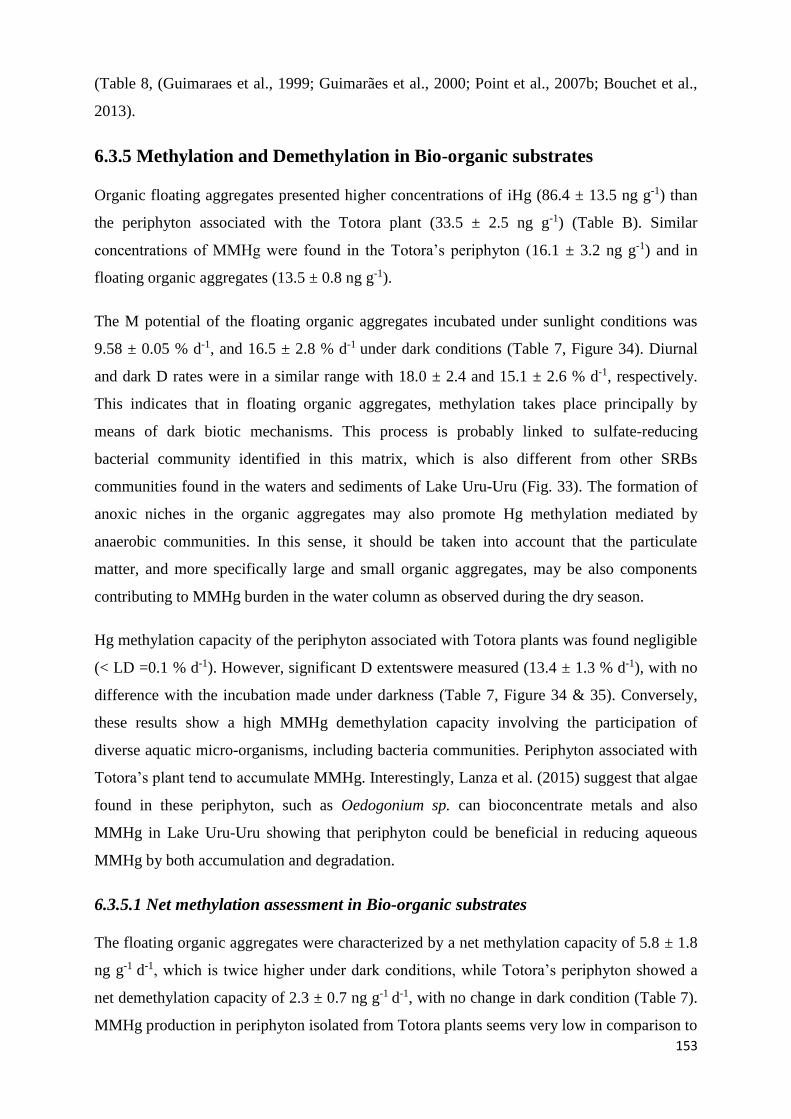
153
(Table 8, (Guimaraes et al., 1999; Guimarães et al., 2000; Point et al., 2007b; Bouchet et al.,
2013).
6.3.5 Methylation and Demethylation in Bio-organic substrates
Organic floating aggregates presented higher concentrations of iHg (86.4 ± 13.5 ng g-1) than
the periphyton associated with the Totora plant (33.5 ± 2.5 ng g-1) (Table B). Similar
concentrations of MMHg were found in the Totora’s periphyton (16.1 ± 3.2 ng g-1) and in
floating organic aggregates (13.5 ± 0.8 ng g-1).
The M potential of the floating organic aggregates incubated under sunlight conditions was
9.58 ± 0.05 % d-1, and 16.5 ± 2.8 % d-1 under dark conditions (Table 7, Figure 34). Diurnal
and dark D rates were in a similar range with 18.0 ± 2.4 and 15.1 ± 2.6 % d-1, respectively.
This indicates that in floating organic aggregates, methylation takes place principally by
means of dark biotic mechanisms. This process is probably linked to sulfate-reducing
bacterial community identified in this matrix, which is also different from other SRBs
communities found in the waters and sediments of Lake Uru-Uru (Fig. 33). The formation of
anoxic niches in the organic aggregates may also promote Hg methylation mediated by
anaerobic communities. In this sense, it should be taken into account that the particulate
matter, and more specifically large and small organic aggregates, may be also components
contributing to MMHg burden in the water column as observed during the dry season.
Hg methylation capacity of the periphyton associated with Totora plants was found negligible
(< LD =0.1 % d-1). However, significant D extentswere measured (13.4 ± 1.3 % d-1), with no
difference with the incubation made under darkness (Table 7, Figure 34 & 35). Conversely,
these results show a high MMHg demethylation capacity involving the participation of
diverse aquatic micro-organisms, including bacteria communities. Periphyton associated with
Totora’s plant tend to accumulate MMHg. Interestingly, Lanza et al. (2015) suggest that algae
found in these periphyton, such as Oedogonium sp. can bioconcentrate metals and also
MMHg in Lake Uru-Uru showing that periphyton could be beneficial in reducing aqueous
MMHg by both accumulation and degradation.
6.3.5.1 Net methylation assessment in Bio-organic substrates
The floating organic aggregates were characterized by a net methylation capacity of 5.8 ± 1.8
ng g-1 d-1, which is twice higher under dark conditions, while Totora’s periphyton showed a
net demethylation capacity of 2.3 ± 0.7 ng g-1 d-1, with no change in dark condition (Table 7).
MMHg production in periphyton isolated from Totora plants seems very low in comparison to
154
previous experiments with periphyton associated to macrophytes from the Bolivian Amazon
(Table 8). Mean while, the diurnal methylation potential of floating organic aggregates (9.58
± 0.05 % d-1) was found to be in the same range than the periphyton associated with
macrophytes from tropical ecosystems and from other temperate lakes (Table 8).
6.4 Implications for MMHg contamination in Lake Uru-Uru
Lake Uru-Uru (and part of the TDPS watershed, Bolivian Altiplano) acts as a sink for several
mining and urban waste effluents (Garcia Moreno, 2006; Tapia et al., 2012). Hg pollution
may become an important threat for local population living from hunting and fishing of
several endemic species. Potential exposure to elevated MMHg levels was assessed in various
species of water birds and fish from Lake Uru-Uru exhibiting Hg levels averaging around 2
and 1 µg.g-1, in birds and fish muscle, respectively (Molina et al., 2012; Aguirre et al., 2014).
Thus the elucidation of the main processes controlling the production of MMHg in the Lake is
of primary importance and is summarized in Figure 36.
During the dry season, the highest Hg methylation potential was found in floating organic
aggregates, followed by sediments (Fig. 36a). A lower methylation capacity in sediments was
found during the wet season (Fig. 36b). The origin of the floating organic aggregates and their
biological composition is not well understood. Their presence was only reported during the
dry season and may result from the decomposition and flocculation of fresh organic matter
originating from the autotrophic production of plankton, Totora’s periphyton exudates and
suspended particulate matter in combination with the higher conductivity reported during this
season. The complementary contribution of organic matter originating from the discharge of
urban effluents localized in the Northern part of Lake Uru-Uru has also to be considered. Hg
methylation potentials measured were low in the water column compared to the sediments.
This suggests that the increasing MMHg concentrations measured in the water during the 24-
hour cycle may also reflect the contribution of MMHg originating from other aquatic
compartments, such as bio-organic substrates during the dry season, but with a constant
resupply from the sediment compartment.
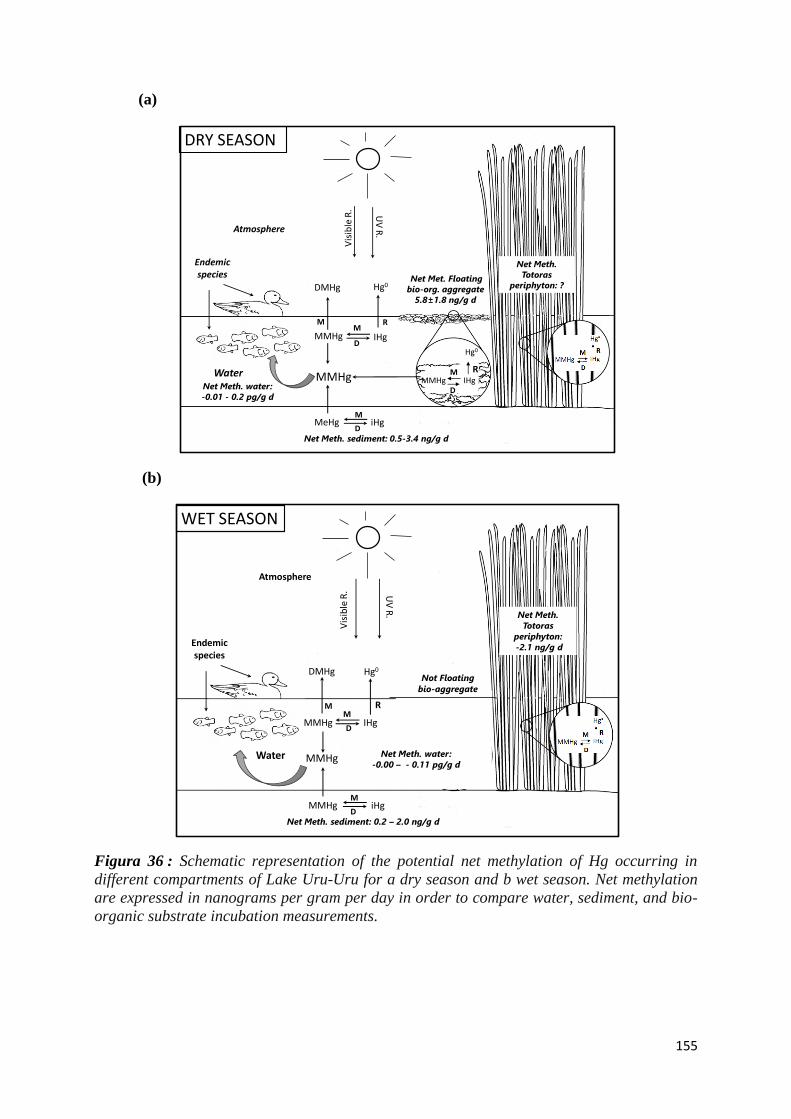
155
(a)
MMHg
MeHg iHgM
D
MMHg IHgM
D
R
Hg0
UV
R.
Vis
ible
R.
Water
Atmosphere
Endemicspecies
Net Meth. sediment: 0.5-3.4 ng/g d
Net Meth. water:
-0.01 - 0.2 pg/g d
Net Meth.
Totoras
periphyton: ?Net Met. Floating
bio-org. aggregate
5.8 1.8 ng/g d
M
DMHg
MMHgM
DIHg
Hg0
R
DRY SEASON
(b)
MMHg
MMHg iHgM
D
MMHg IHgM
D
R
Hg0
UV
R.
Vis
ible
R.
Water
Atmosphere
Endemicspecies
Net Meth. sediment: 0.2 – 2.0 ng/g d
Net Meth.
Totoras
periphyton:
-2.1 ng/g d
Net Meth. water:
-0.00 – - 0.11 pg/g d
Not Floating
bio-aggregate
DMHg
M
WET SEASON
Figura 36 : Schematic representation of the potential net methylation of Hg occurring in
different compartments of Lake Uru-Uru for a dry season and b wet season. Net methylation
are expressed in nanograms per gram per day in order to compare water, sediment, and bio-
organic substrate incubation measurements.
156
Conclusiones
A través del estudio de la reactividad y transformación del Hg realizado en el lago
Uru-Uru, ubicado sobre la planicie del Altiplano Boliviano, en una zona intertropical a nivel
planetario, se puede llegar a concluir:
1. Que este ecositema acuático poco profundo es altamente productivo y muestra fuertes
gradientes en las características fisicoquímicas a nivel espacial y diurno, las cuales son
reguladas por las incidencias de radiación solar según la estación del año.
2. La contaminación minera y urbana observada en la parte Norte del lago influye
favorablemente en la producción de MMHg por los diferentes compartimientos
estudiados, principalmente en la época seca.
3. En la parte Sur del lago (no contaminado), en la época seca fueron los agregados bio-
orgánicos los mayores productores de MMHg (5,8 ng MMHg g-1 d-1), seguidos de los
sedimentos (0,5 ng MMHg g-1 d-1). Sin embargo por la ausencia de los agregados bio-
orgánicos en la época húmeda y por su menor masa respecto a la masa de los
sedimentos superficiales, los mayores representantes de la producción de mercurio en
este ecosistema son los sedimentos.
4. En el sitio Norte se ha identificado que el perifiton de las totoras es el compartimiento
que contiene la mayor concentración de Hg, cuyo rol es degradar ó demetilar MMHg
en una tasa de 2,1 ng MMHg g-1 d-1.
5. Estos resultados nos muestran que en los ecosistemas acuáticos intertropicales de
altitud, la producción de MMHg es favorecida en ambientes contaminados por materia
orgánica y aguas ácidas de mina. Por lo que una bioacumulación y biomagnificación
de este tóxico podría ser observada a lo largo a la cadena alimentaria.
157
7. Conclusiones finales de la tesis
En el lago Uru-Uru un ecosistema acuático de altura, altamente productivo por su
ubicación en la región tropical, la reactividad del Hg está regida por las condiciones
fisicoquímicas del medio, las cuales se encuentran sujetas a cambios estacionales (época seca
y húmeda). Durante la época seca, las fuertes incidencias solares producen la evaporación de
sus aguas, dando como resultado el incremento en la salinidad. En la época de lluvias, un
efecto de dilución es observado para los elementos mayoritarios, mientras que para el Hg no
es significativo. Este medio alcalino de fuertes concentraciones en sulfatos y bicarbonatos
posée una gran capacidad tampón adecuado para la precipitacitación y posterior
almacenamiento de Hg y de diversos metales y metaloides en los sedimentos desde la
columna de agua. Los almacenamientos de Hg, metales, metaloides y materia orgánica en el
lago están promovidos por las actividades mineras y urbanas que se vienen desarrollando en
la región.
Los contaminantes (metales, metaloides y materia orgánica) provenientes desde las
zonas mineras y urbanas circundantes al lago Uru-Uru, además de las altas concentraciones de
fosfatos, le confiere la característica de un lago eutrofizado. Dichas condiciones favorecen la
fotosíntesis, la producción primaria de materia orgánica y el incremento de la concentración
de oxígeno en la columna de agua durante el día. Mientras que durante la noche el consumo
de oxígeno por la respiración de los organismos acuáticos, van disminuyendo creando medios
cada vez más anóxicos, favoreciendo la producción de MMHg por las poblaciones de
bacterias sulfatoreductoras.
Los altos porcentajes de MMHg en forma disuelta o que se encuentra en la fracción
filtrada (~50%), están probablemente relacionadas con la alta concentración de ligandos
orgánicos (como ácidos húmicos) y cloruros que mejoran la solubilidad del MMHg.
La autodepuración o desintoxicación de Hg en el lago, que implica la fotodegración
del MMHg y la reducción bacteriana del Hg, probablemente esté limitada por la formación de
complejos estables de Hg con ligandos orgánicos (húmicos) difíciles de descomponer, pero
además por la alta concentración de materia orgánica que podría restringir la entrada de la
radiación UV.
158
Las altas concentraciones de MMHg y THg en las fracciones filtradas de aguas de los
sitios Norte del lago y en la confluencia de las aguas del lago con el río Huanuni durante la
época seca y húmeda, indican un mismo origen y un aporte significativo de Hg en forma
disuelta desde las áreas mineras durante la época húmeda. Este hecho fue corroborado al
observar que durante la época húmeda las dos formas de mercurio (iHg y MMHg), metales y
metaloides en forma disuelta no sufren una dilución importante, como la observada en los
elementos mayoritarios.
La poca profundidad del lago podría influir en la contribución de MMHg desde los
sedimentos por flujos bénticos o fenómenos de advección en los sedimentos del lago. Las
altas concentraciones de Hg, metales y metaloides en los sedimentos de la confluencia del
drenaje del lago Uru-Uru con el río Huanuni y en sitio Norte, son producto de la precipitación
de estos elementos por las condiciones básicas del medio (pH básico), los cuales se
encontraban en forma oxidada en los drenajes ácidos de minas y en forma reducida al
momento de su emisión.
Por una parte los valores de los coeficientes de correlación entre el Fe y THg; THg y
MMHg en la fracción filtrada de las aguas de los sitios Norte y confluencia del lago con el río
Huanuni, indican que probablemente el hierro se encuentra en forma de coloides de SFe, así
como otros metales y las especies de iHg y MMHg, lo que explicaría las elevadas
concentraciones de estos compuestos en la columna de agua en ambas épocas.
Por otra parte los coefecientes de correlación encontrados entre el THg y elementos
traza (Sb y W dos metales explotados en la región) presentes en los sedimentos, confirma que
los desechos originados por las actividades mineras (material inerte y aguas ácidas)
probablemente son las mayores fuentes de Hg para el lago, en combinación con los flujos
urbanos.
Los coeficientes de partición y los flujos difusivos calculados utilizando la ley de Fick
a partir de las concentraciones de MMHgF presente en las aguas, aguas intersticiales, indican
que existe una transferencia importante de MMHg desde los sedimentos hacia la columna de
agua durante la época seca y un proceso inverso pero poco significativo durante la época
húmeda.
Del estudio realizado acerca de la reactividad temporal del Hg en los sitios puntuales
del lago Uru-Uru se concluye que las producciones de MMHg en la columna de agua están
regidas por las condiciones de las características fisicoquímicas del sistema acuático. Estas
159
condiciones están sujetas a cambios de estaciones y los contaminantes inorgánicos y
orgánicos presentes en el medio.
La producción de MMHg en la columna de agua es favorecida durante la noche, en
condiciones de medios anóxicos (creadas el procesos de respiración) y es promovida por la
presencia de poblaciones de bacterias sulfatoreductoras.
Se ha observado que en los sitios más contaminados por desechos mineros y urbanos
aumentan la producción de MMHg en la columna de agua y en los sedimentos, como es el
caso del sitio Norte del lago Uru-Uru. Sin embargo también deben considerarse, para un lago
poco profundo, los aportes de MMHg generados por los incrementos de los flujos bénticos. Si
bien las incidencias de radiación solar y UV, podrían favorecer las reacciones de reducción
del Hg, esta se encuentra limitada.
Los potenciales de metilación y demetilación medidos en las diferentes matrices nos
muestran que estos compartimientos, en menor o en mayor medida son capaces de metilar el
mercurio, a excepción del perifiton de las totoras. El perifiton de las totoras mostró tener una
gran capacidad para demetilar el MMHg y almacenar este compuesto.
Se ha idenfificado a los agregados bio-orgánicos flotantes (presentes únicamente
durante la época seca) como los mayores metiladores de mercurio, con una capacidad de
metilación de 9,58 ± 0,05. Con una concentración de 99,9 ± 14,3 ng g-1 en HgT y de 13,5 ±
0,8 ng g-1 en MMHg, su aporte podría ser significativo en la columna a agua. Sin embargo
considerando la cantidad de masa de los agregados bio-orgánicos flotantes y la masa de capas
superficiales de los sedimentos, los mayores aportes de MMHg fueron emitidos desde los
sedimentos, durante la época seca. La tasa neta de metilación de Hg de esta matriz, varía entre
0,2 a 3,4 ng g-1 día-1 de la época húmeda a la seca. Este hecho es corroborado por el estudio de
los coeficientes de partición y los flujos difusivos de MMHg y IHg, cuya dirección de flujo va
desde los sedimentos hacia la columna de agua.
De todo el estudio realizado se concluye que el lago Uru-Uru es un ecosistema
acuático de alta reatividad para el Hg y la producción de MMHg, controlada por procesos
abióticos y bióticos los que a la vez están regulados por factores ambientales naturales y
antropogénicos.
Al mismo tiempo nos encontramos en un ambiente donde existe una gran probabilidad
de que la forma más disponible de Hg (MMHg), sea incorporada en los diferentes organismos
160
acuáticos, bioacumulada y biomagnificada a lo largo de la cadena alimentaria, explicando las
elavadas concentraciones encontradas en los peces y aves de los lagos Uru-Uru y Poopó por
Molina et al. (2012).
El lago Uru-Uru es una clara muestra de los muchos ecosistemas acuáticos de altura
del altiplano boliviano impactados por las actividades mineras y/o urbanas, donde los
pobladores consumidores de pescado y las especies silvestres, podrían estar expuestos a
MMHg.
161
8. Perspectivas científicas
Despues de tener conocimiento de los primeros casos de intoxicación por MMHg en
Minamata e Irak por los años 1950, debido a la alta toxicidad y propiedad bioacumulativa del
Hg en los organismos, los estudios respecto a la transformación del Hg en diferentes
compartimientos acuáticos, terrestres y atmosféricos han cobrado relevancia. Para realizar
estos estudios, en el transcurso del tiempo, nuevas e innovadores herramientas tecnológicas y
metodológicas han sido desarrolladas para la determinación de las diferentes especies de Hg
en diferentes órdenes de magnitud y por tipo de matriz. El método analítico de la dilución
isotópica de doble-spike (DSIDA) (Hintelmann et al., 1997; Monperrus et al., 2005b), el uso
de trazadores enriquecidos isotópicamente (201MMHg y 199iHg), la utilización de equipos
combinados GC-ICPMS se han permitido la cuantificación del iHg y MMHg en muestras
ambientales y la observación de las transformaciones del Hg.
En los diferentes ecosistemas a nivel del mar o a poca altitud diferentes estudios dan
cuenta de la cuantificación de las diferentes especies de Hg así como de los procesos de su
transformación. Si bien se cuenta con alguna información de los niveles de Hg en diferentes
matrices de ecositemas de altitud, la información acerca de los procesos de transformación del
Hg es escasa para ecosistemas que se encuentran a gran altitud.
En el Altiplano Boliviano fueron encontrados indicios de la bioacumulación del
MMHg en peces y aves de dos ecositemas acuáticos tropicales de altura (Uru-Uru y Poopó),
sometidos a fuertes presiones antropógenicas mineras y urbanas.
Por lo que este estudio, a través de instrumentos de última tecnología y metodologías
sofisticadas antes descritas, por primera vez, se ha llegado a 1) comprender el ciclo
biogeoquímico del Hg en el lago Uru-Uru, los mecanismos que gobiernan su transformación y
cuantificar el potencial de metilación del Hg; y 2) cuantificar las diferentes especies de Hg
formadas en el lago, comprender su dinámica frente a contaminantes mineros y urbanos; y
determinar las posibles fuentes de Hg y MMHg.
En el lago Uru-Uru los agregados bio-orgánicos, una matriz nunca antes estudiada, ha
sido el mayor metilador de Hg en la época seca. Estudios posteriores acerca de los
mecanismos de metilación de Hg en esta matriz en otros ecosistemas acuáticos, podría ayudar
a comprender mejor la transformación del Hg. Mientras que el perifiton de las totoras, por su
capacidad de almacenamiento y descomposición de MMHg, podría ser utilizado como
detoxificante de MMHg en ecosistemas acuáticos. Sin embargo tal parece que esta capacidad
es limitada, dado que la gran densidad de totoras en el lago Uru-Uru no fue suficiente para la
162
descomposición de las elevadas concentraciones de MMHg. Una evaluación de los niveles de
MMHg en ecosistemas similares de altitud podría ayudar en la toma de decisiones políticas
que ayuden a proteger y mejorar las condiciones de la vida silvestre y humana.
Frente a los elevados porcentajes de MMHg en forma disuelta en el agua y su
inminente bioacumulación en los organismos (peces, aves y humanos consumidores de
peces), promovidos por las altas concentraciones de materia orgánica, metales pesados y
metaloides, es necesario realizar una evaluación del impacto del Hg en las comunidades
consumidoras de pescado del lago Uru-Uru.
Por otra parte será necesario que el gobierno de manera seria y responsable, a través de
sus dependencias como son las gobernaciones, ministerios y viceministerios de Medio
Ambiente y Aguas y Minería, implenten políticas para el tratamiento de aguas servidas, aguas
ácidas de minas y el control de la emisión de residuos sólidos de mina hacia los cuerpos de
agua.
163
Conclusions de la thèse
Dans le lac d’altitude Uru-Uru, hautement productif de par sa situation en région
tropicale, la réactivité du Hg est contrôlée par les conditions physico-chimiques extrêmes du
milieu, lesquelles sont soumises à des changements saisonniers au cours de l’année (saisons
sèche et humide). Pendant la saison sèche, les forts rayonnements solaires accompagnés de
sécheresse conduisent à l’évaporation de ses eaux et ainsi à l’augmentation de la salinité. En
saison humide, on observe un effet de dilution des éléments majeurs mais cela n’est pas
significatif pour le Hg. Ce milieu alcalin à fortes concentration en sulfates et bicarbonates
possède une forte capacité tampon adéquate pour la précipitation en ensuite le stockage du Hg
et autres métaux et métalloïdes dans les sédiments à partir de la colonne d’eau. Le stockage du
Hg, métaux, métalloïdes et matière organique dans le lac sont favorisés par les activités
minières et urbaines qui ont lieu dans la région.
Les contaminants (métaux, métalloïdes et matière organique) qui proviennent des
zones minières et urbaines aux alentours du lac Uru-Uru, en plus des fortes concentrations en
phosphates, lui donnent la caractéristique d’un lac eutrophique. De telles conditions favorisent
la photosynthèse, la production primaire de matière organique et l’augmentation de la
concentration en oxygène pendant la journée. D’un autre côté, pendant la nuit la
consommation de l’oxygène par la respiration des organismes aquatiques diminue cette
concentration, créant des milieux chaque fois un peu plus anoxiques, ce qui favorise la
production de MMHg par les communautés de bactéries sulfato-réductrices.
Les forts pourcentages en MMHg sous forme dissoute, ou qui se trouvent dans la
fraction filtrée (~50%), sont probablement dus à la forte concentration en ligands organiques
(comme les acides humiques par exemple) et les chlorures qui augmentent la solubilité du
MMHg.
L’autoépuration ou détoxification du Hg dans le lac, qui implique la photodégradation
du MMHg et la réduction du Hg2+, est probablement limitée par la formation de complexes
stables du Hg avec des ligands organiques (humiques) plus difficiles à dégrader, mais aussi
par la forte concentration en matière organique qui peut restreindre la pénétration des rayons
UV.
Les fortes concentrations en MMHg et THg dans les fractions filtrées des eaux du site
Nord du lac et à la confluence des eaux du lac avec la rivière Huanuni pendant les saisons
164
sèches et humides indiquent une même origine et un apport significatif de Hg depuis les zones
minières pendant la saison humide. Cette hypothèse est ensuite confirmée par l’observation de
l’absence d’une dilution importante des 2 formes de Hg (iHg et MMHg), métaux et
métalloïdes sous forme dissoute pendant la saison humide, ce qui n’est pas le cas pour les
élément majeurs.
La faible profondeur du lac pourrait influencer la remobilisation du MMHg à partir
des sédiments par des flux benthiques ou des phénomènes d’advection dans les sédiments du
lac. Les fortes concentrations en Hg, métaux et métalloïdes dans les sédiments à la confluence
du drainage du lac Uru-Uru avec la rivière Huanuni au site Nord résultent de la précipitation
de ces éléments, lié aux conditions basiques du milieu (pH basique), qui se trouvent sous
forme oxydée dans les drainages acides des mines et sous forme réduite au moment de leur
émission.
A partir des corrélations observées entre Fe et THg, et entre THg et MMHg, dans la
fraction filtrée des eaux du site Nord et à la confluence du lac avec la rivière Huanuni, nous
avons conclu que le fer se trouve sous forme de colloïdes S-Fe, tout comme d’autres formes
métalliques telles que iHg et MMHg, ce qui expliquerait les concentrations élevées de ces
espèces dans la colonne d’eau pour les deux saisons.
Les coefficients de corrélation observés entre THg et les éléments traces (Sb et W)
présents dans les minerais exploités confirment que les déchets d’origine minière (matériaux
inertes et eaux acides) sont probablement la source principale du Hg pour le lac, en
association avec les flux urbains.
Les coefficients de partition et les flux de diffusion calculés avec la loi de Fick à partir
des concentrations de MMHg dans les eaux et eaux interstitielles indiquent qu’il existe un
transfert important de MMHg des sédiments à la colonne d’eau pendant la saison sèche, et le
phénomène inverse pendant la saison humide.
A partir de cette étude réalisée sur la réactivité temporelle du Hg sur des sites
particuliers du lac Uru-Uru, nous concluons que la production de MMHg dans la colonne
d’eau est contrôlée par les caractéristiques physico-chimiques du système aquatique. Ces
conditions sont affectées par les changements saisonniers et par les contaminants inorganiques
et organiques du milieu.
165
La production de MMHg dans la colonne d’eau est favorisée pendant la nuit en
conditions anoxiques (résultant du processus de respiration) et est liée à la présence de
communautés de bactéries sulfato-réductrices.
Nous avons observé que dans les sites les plus contaminés par les déchets miniers et
urbains, la production de MMHg dans la colonne d’eau et les sédiments est accrue, ce qui est
le cas au site Nord du lac Uru-Uru. D’un autre côté il faut considérer, pour le cas d’un lac de
faible profondeur comme celui-ci, que les apports de MMHg peuvent être dus à
l’augmentation des flux benthiques. Bien que les rayonnements solaires et UV puissent
favoriser les réactions de réduction du Hg, c’est dans ce cas limité à cause des conditions
physico-chimiques du milieu.
Les potentiels de méthylation et déméthylation mesurés dans les différentes matrices
montrent que ces compartiments, de façon plus ou moins importante, sont capables de
méthyler le Hg, sauf le périphyton des roseaux qui possède une grande capacité à déméthyler
et accumuler le MMHg.
Nous avons identifié les agrégats bio-inorganiques flottants (présents seulement
pendant la saison sèche) comme étant les meilleurs méthylateurs du Hg, avec une capacité de
méthylation de 9,58 ± 0,05 % jour-1. Avec une concentration de 99,9 ± 14,3 ng g-1 en Hg et de
13,5 ± 0,8 ng g-1 en MMHg, leurs apports pourraient être significatifs pour la colonne d’eau
pendant la saison sèche. Néanmoins, considérant la masse de ces agrégats bio-inorganiques
flottants et la masse des couches superficielles des sédiments, les plus forts apports en MMHg
sont probablement émis depuis le sédiment. Le taux net de méthylation du Hg pour cette
matrice varie de 0.2 à 3.4 ng g-1 d-1 entre la saison sèche et humide. Ceci est confirmé par
l’étude des coefficients de partition et des flux de diffusion du MMHg et iHg, dont la
direction va des sédiments à la colonne d’eau.
A partir de toute cette étude, nous concluons que le lac Uru-Uru est un système
aquatique à forte réactivité pour le Hg et pour la production de MMHg, et est contrôlé par des
processus biotiques et abiotiques qui sont eux régulés par des facteurs environnementaux
naturels et anthropiques.
En même temps, dans cet environnement il y a une grande probabilité pour que la
forme la plus biodisponible du Hg (MMHg) soit incorporée dans les différents organismes
aquatiques puis bioaccumulée et bioamplifiée le long des chaînes alimentaires. Cela explique
166
les fortes concentrations en Hg trouvées dans les poissons et oiseaux des lac Uru-Uru et
Poopo par Molina et al., 2012.
Le lac Uru-Uru est clairement représentatif de beaucoup d’écosystèmes aquatiques
d’altitude de l’Altiplano bolivien impactés par des activités minières et/ou urbaines, et où les
populations qui consomment du poisson et des espèces sauvages peuvent être exposés au
MMHg.
167
Perspectives scientifiques
Après avoir découvert les premiers cas d’intoxication au MMHg à Minanamata et en
Irak dans les années 1950, dû à sa forte toxicité et sa propriété de bioaccumulation dans les
organismes, les études relatives à la transformation du Hg dans différents compartiments
aquatiques, terrestres et atmosphériques sont devenues importantes. Afin de réaliser ces
études, au cours du temps sont apparus des développements technologiques et
méthodologiques nouveaux et novateurs permettant de déterminer les différentes espèces de
Hg, à différents ordres de magnitude et dans différentes matrices. La méthode analytique de
dilution isotopique double-spike (DSIDA, (Hintelmann et al., 1997; Monperrus et al., 2005b),
par l’utilisation de traceurs isotopiques enrichis (MM201Hg et 199IHg) et le couplage GC-
ICPMS, ont permis la quantification du MMHg et iHg dans des échantillons
environnementaux ainsi que l’étude de leurs transformations.
Dans différents écosystèmes au niveau de la mer ou à faible altitude, multiples études
rapportent la quantification des différentes espèces mercurielles dans différentes matrices et
leurs processus de transformation. Cependant, bien que l’on trouve des études rapportant les
teneurs en Hg dans différentes matrices d’écosystèmes d’altitude, les informations concernant
les processus de transformation du Hg à haute altitude sont très limitées.
Sur l’Altiplano bolivien, il existe des études sur la bioaccumulation du MMHg dans
les poissons et oiseaux d’écosystèmes tropicaux aquatiques d’altitude (Uru-Uru et Poopo).
Pour notre étude, par l’utilisation de technologies et méthodologies récentes et
sophistiquées nous avons pu, pour la première fois, 1) comprendre et documenter le cycle
biogéochimique du Hg dans le lac Uru-Uru, les mécanismes qui gouvernent ses
transformations, et quantifier son potentiel de méthylation ; et 2) quantifier les différentes
espèces de Hg formées dans le lac, comprendre sa dynamique en relation avec des
contaminants miniers et urbains, et déterminer les sources possibles du Hg et MMHg.
Dans le lac Uru-Uru les agrégats bio-inorganiques, une matrice qui n’avait encore
jamais été étudiée, sont le principal méthylateur temporel (ou saisonnier) du Hg pendant la
saison sèche. Cependant il est toujours nécessaire de continuer à faire des recherches sur les
mécanismes de méthylation du Hg dans cette matrice et, plus généralement, dans d’autres
écosystèmes aquatiques afin de mieux comprendre les transformations du Hg. D’un autre
côté, notre étude a démontré que le périphyton de roseau pourrait être utilisé en tant que

168
détoxificateur de MMHg dans les systèmes aquatiques grâce à sa capacité de stockage et de
dégradation du MMHg. Il paraîtrait que cette capacité soit toutefois limitée dans les
écosystèmes comme celui du lac Uru-Uru où les concentrations en MMHg biodisponibles
sont très élevées bien qu’il y ait une forte densité de roseaux.
En général, l’évaluation des niveaux de MMHg dans différentes matrices
d’écosystèmes similaires pourrait aider à la prise de décisions politiques qui aideraient à
améliorer les conditions de vie de leurs habitants et protéger la faune sauvage.
En particulier, au regard des pourcentages élevés en MMHg sous forme dissoute dans
l’eau et l’imminence de sa bioaccumulation dans les organismes (poissons, oiseaux et
humains consommateurs de poissons) qui sont accentués par les fortes concentrations en
matière organique, métaux lourds et métalloïdes (dont la source est en relation avec les
activités minières et urbaines), il serait nécessaire d’effectuer une évaluation de l’impact du
Hg dans les populations consommatrices de poissons du lac Uru-Uru.
D’un autre côté il serait aussi nécessaire que le gouvernement bolivien, de manière
sérieuse et responsable par le biais de ses affiliations telles que les Provinces, Municipalités,
Ministres et Vice-ministres de l’Eau et de l’Environnement et les Mines, cherche et mette en
place des politiques réalistes et applicables pour réguler l’émission et le traitement des eaux
usées, des eaux acides des mines, des déchets solides miniers et urbains dans les sols et les
systèmes aquatiques.
169
9. Referencias bibliográficas
Aberg, B., Ekman, L., Persson, G., Snihs, J.O., 1969. Metabolism of methyl mercury (/sup 203/Hg)
compounds in man: excretion and distribution. Arch. Environ. Health; (United States), 478.
Achá, D., Hintelmann, H., Pabón, C.A., 2005. Sulfate-reducing bacteria in floating macrophyte
rhizosphere from an Amazonian flood plain lake in Bolivia and their association with Hgmethylation.
Appl.Environ.Microbiol. 71(11), 7531-7535.
Achá, D., Pabon, C.A., Hintelmann, H., 2012. Mercury methylation and hydrogen sulfide production
among unexpected strains isolated from periphyton of two macrophytes of the Amazon (English).
Fems Microbiol Ecol 80, 637-645.
Aguirre, M., Lazzaro, X., Point, D., Pouilly, M., 2014. Línea base de conocimientos sobre los recursos
hidrológicos en el sistema TDPS con enfoque en la cuenca del Lago Titicaca. IRD - UICN, Quito,
Ecuador, p. 320.
Airey, D., 1983. Mercury in Human Hair Due to Environment and Diet: A Review. National Institute
of Environmental Health Sciences. National Institutes of Health. Department of Health, Education and
Welfare, p. 303.
Akagi, H., 1999. Improved techniques in the analysis of total and methylmercury in biological and
environmental samples. International Conference - Mercury as a Global Pollutant 5, 55-55.
Akagi, H., Malm, O., Branches, F.J.P., 1996. Human exposure to mercury due to mining in the
Amazon, Brazil - A review. Environ Sci 3, 199-211.
Alanoca, L., Amouroux, D., Monperrus, M., Tessier, E., Goni, M., Guyoneaud, R., Acha, D., Gassie,
C., Audry, S., Garcia, M.E., Quintanilla, J., Point, D., 2016. Diurnal variability and biogeochemical
reactivity of mercury species in an extreme high-altitude lake ecosystem of the Bolivian Altiplano.
Environmental Science And Pollution Research International 23, 6919-6933.
Alberts, J.J., Schindler, J.E., Miller, R.W., Nutter, D.E., Jr., 1974. Elemental mercury evolution
mediated by humic Acid. Science (New York, N.Y.) 184, 895-897.
Allard, B., Arsenie, I., 1991. Abiotic reduction of mercury by humic substances in aquatic system —
an important process for the mercury cycle. Water Air & Soil Pollution 56, 457-464.
Allen, J.W., Mutkus, L.A., Aschner, M., 2001. Mercuric chloride, but not methylmercury, inhibits
glutamine synthetase activity in primary cultures of cortical astrocytes. . Brain Res, 891 148-157.
Allen, J.W., Shanker, G., Tan, K.H., Aschner, M., 2002. The Consequences of Methylmercury
Exposure on Interactive Functions between Astrocytes and Neurons. Neurotoxicology 23, 755-759.
Amouroux, D., Tessier, E., Pecheyran, C., Donard, O.F.X., European Institute for Marine, S., 1998.
Sampling and probing volatile metal(loid) species in natural waters by in-situ purge and cryogenic
trapping followed by gas chromatography and inductively coupled plasma mass spectrometry (P-CT-
GC-ICP/MS) (English) MARCH MOR - Marine Analytical Chemistry for Monitoring and
Oceanographic Research Workshop (English). Elsevier, Amsterdam, pp. 241-254.
Amyot, M., Lean, D.R.S., Poissant, L., Doyon, M.R., 2000. Distribution and transformation of
elemental mercury in the St. Lawrence River and Lake Ontario (English). Canadian journal of
fisheries and aquatic sciences (Print) 57, 155-163.
170
Amyot, M., Mierle, G., Lean, D.R.S., McQueen, D.J., 1994. Sunlight-induced formation of dissolved
gaseous mercury. Environ. Sci. Technol. 28, 2366.
Amyot, M.S., Mierle, G., Lean, D., McQueen, D.J., 1997. Effect of solar radiation on the formation of
dissolved gaseous mercury in temperate lakes. Geochim Cosmochim Ac 61, 975-987.
Arcagni, M., Campbell, L., Arribére, M.A., Marvin-DiPasquale, M., Rizzo, A., Ribeiro Guevara, S.,
2013. Differential mercury transfer in the aquatic food web of a double basined lake associated with
selenium and habitat. Sci Total Environ 454, 170-180.
Arce-Burgoa, O.R., 1990. Fundamental study on processing of ore from the Huanuni mine,
Bolivia:Unpublished Ph.D. thesis. Sendai, Japan, Tohoku University, p. 168.
Arce-Burgoa, O.R., 2009. Metallogeny of Bolivia. Society of Economic Geologists 79, 7-15.
Arce Burgoa, O.R., 2007. Guía a los yacimientos Metalíferos de Bolivia. Minería, Energía
yConstrucción.
Artaxo, P., Calixto de Campos, R., Fernandes, E.T., V. Martins, J., Xiao, Z., Lindqvist, O., Fernández-
Jiménez, M.T., Maenhaut, W., 2000. Large scale mercury and trace element measurements in the
Amazon basin. Atmos Environ 34, 4085-4096.
ATSDR, 1999. Toxicological Profile for Mercury. U.S. Department of Health & Human Services,
Agency for Toxic Substances and Disease Registry Atlanta, GA.
Atwell, L., Hobson, K.A., Welch, H.E., 1998. Biomagnification and bioaccumulation of mercury in an
arctic marine food web : insights from stable nitrogen isotope analysis (English). Canadian journal of
fisheries and aquatic sciences (Print) 55, 1114-1121.
Avila Salinas, W.A., 1990 Petrología del domo resurgente del Cerro de San Pedro (Oruro, Bolivia).
Revista Tecnica de YPFB, pp. 139-149.
Baeyens, W., Leermakers, M., 1998. Elemental mercury concentrations and formation rates in the
Scheldt Estuary and the North Sea. Mar Chem 60, 257-266.
Baeyens, W., Leermakers, M., Papina, T., Saprykin, A., Brion, N., Noyen, J., De Gieter, M., Elskens,
M., Goeyens, L., 2003. Bioconcentration and biomagnification of mercury and methylmercury in
North Sea and Scheldt estuary fish. Arch Environ Con Tox 45, 498-508.
Baker, P.A., Fritz, S.C., 2015. Nature and causes of Quaternary climate variation of tropical South
America. Quaternary Science Reviews 124, 31-47.
Bakir, F., Damluji, S.F., Amin-Zaki, L., Murtadha, M., Khalidi, A., al-Rawi, N.Y., Tikriti, S., Dahahir,
H.I., Clarkson, T.W., Smith, J.C., Doherty, R.A., 1973. Methylmercury poisoning in Iraq. Science
(New York, N.Y.) 181, 230-241.
Balarama Krishna M V, R.M., Karunasagar D, Arunachalam J... , 2005. A rapid ultrasound-assisted
thiourea extraction method for the determination of inorganic and methyl mercury in biological and
environmental samples by CV-AAS. Talanta 67, 70.
Balarama Krishna, M.V., Ranjit, M., Karunasagar, D., Arunachalam, J., 2005. A rapid ultrasound-
assisted thiourea extraction method for the determination of inorganic and methyl mercury in
biological and environmental samples by CV-AAS. Talanta 67, 70.
Baldi, F., Parati, F., Filippelli, M., Electric Power Research Institute, P.A.C.A.U.S., Environment, C.,
Atmospheric Environment Service, C., Ontario Hydro, C., State of, F., Department of Environmental
Protection, U.S., Food, U.S., Drug Administration, W.D.C.U.S., Frontier, G., Wisconsin Department
171
of Natural Resources, U.S., Health Canada, C., 1995. Dimethylmercury and dimethylmercury-sulfide
of microbial origin in the biogeochemical cycle of Hg (English)
Mercury as a global pollutant. International conference (English). Springer, Dordrecht, pp. 805-815.
Balogh, S.J., Nollet, Y.H., 2008. Methylmercury input to the Mississippi River from a large
metropolitan wastewater treatment plant. Sci Tot Environ 406 145-153.
Banks, D., Holden, W., Aguilar, E., Mendez, C., Koller, D., Andia, Z., Rodriguez, J., Saether, O.M.,
Torrico, A., Veneros, R., Flores, J., 2002. Contaminant source characterization of the San Jose Mine,
Oruro, Bolivia. Geological Society Special Publications 198, 215-239.
Barbosa, A.C., Boischio, A.A., East, G.A., Ferrari, I., Gonçalves, A., Silva, P.R.M., da Cruz, T.M.E.,
1995. Mercury contamination in the Brazilian Amazon. Environmental and occupational aspects.
Water, Air, and Soil Pollution 80, 109-121.
Barkay, T., Gillman, M., 1997. Effects of dissolved organic carbon and salinity on bioavailability of
mercury. Applied & Environmental Microbiology 63, 4267.
Barkay, T., Kritee, K., Boyd, E., Geesey, G., 2010. A thermophilic bacterial origin and subsequent
constraints by redox, light and salinity on the evolution of the microbial mercuric reductase.
Environmental Microbiology 12, 2904-2917.
Barkay, T., Kroer, N., Poulain, A.J., 2011. Some like it cold: microbial transformations of mercury in
polar regions. Polar Research (Co-Action Publishing) 30, 1.
Barkay, T., Miller, S.M., Summers, A.O., 2003. Bacterial mercury resistance from atoms to
ecosystems. FEMS Microbiology Reviews 27, 355-384.
Barkay, T., Wagner‐Döbler, I., 2005. Microbial Transformations of Mercury: Potentials, Challenges,
and Achievements in Controlling Mercury Toxicity in the Environment. Advances in Applied
Microbiology 57, 1-52.
Bastos, W.R., Dórea, J.G., Bernardi, J.V.E., Lauthartte, L.C., Mussy, M.H., Lacerda, L.D., Malm, O.,
2015. Mercury in fish of the Madeira river (temporal and spatial assessment), Brazilian Amazon.
Environ Res 140, 191-197.
Baya, P.A., 2015. Investigating the sources and fate of monomethylmercury and dimethylmercury in
the Arctic marine boundary layer and waters. ProQuest Dissertations & Theses Trent University, Place
of Publication: Ann Arbor, MI, USA. Country of Issuing Organization: Canada. Country of
Publication: Canada.
Benefice, E., Luna-Monrroy, S., Lopez-Rodriguez, R., 2010. Fishing activity, health characteristics
and mercury exposure of Amerindian women living alongside the Beni River (Amazonian Bolivia).
International Journal of Hygiene and Environmental Health 213, 458-464.
Benoit, J.M., 2000. Sulfide controls on mercury methylation by sulfate reducing bacteria. United
States.
Benoit, J.M., Ekstrom, E.B., Morel, F.M.M., 2002. Metabolic pathway of mercury methylation. Abstr
Pap Am Chem S 223, U525-U525.
Benoit, J.M., Gilmour, C.C., Mason, R.P., 2001. The influence of sulfide on solid-phase mercury
bioavailability for methylation by pure cultures of Desulfobulbus propionicus (1pr3). Environ. Sci.
Technol. 35, 127.
Benoit, J.M., Gilmour, C.C., Mason, R.P., Heyes, A., 1999. Sulfide controls on mercury speciation
and bioavailability to methylating bacteria in sediment pore waters. Environ. Sci. Technol. 33, 951.
172
Bensefa-Colas, L., Andujar, P., Descatha, A., 2011. Intoxication par le mercure. La Revue de
Médecine Interne 32, 416-424.
Berlin, M., Mercury, F.L., G., N., Vouk, V., 1986. Handbook on the Toxicology of Metals, 1986 In:
Elsevier (Ed.), Amsterdam., pp. 386-445.
Bertilsson, L., Neujahr, H.Y., 1971. Methylation of mercury compounds by methylcobalamin.
Biochemistry 10, 2805-2808.
Bettinelli, M., Spezia, S., Ronchi, A., Minoia, C., 2002. Determination of total urinary mercury by on-
line sample microwave digestion followed by flow injection cold vapour inductively coupled plasma
mass spectrometry or atomic absorption spectrometry. Rapid Communications In Mass Spectrometry:
RCM 16, 1432-1439.
Black, F.J., Poulin, B.A., Flegal, A.R., 2012. Factors controlling the abiotic photo-degradation of
monomethylmercury in surface waters. Geochim Cosmochim Ac 84, 492-507.
Bloom, N.S., Crecelius, E.A., 1983. Determination of mercury in seawater at sub-nanogram per liter
levels (English). Mar Chem 14, 49-59.
Bloom, N.S., Gill, G.A., Cappellino, S., Dobbs, C., McShea, L., 1999. Speciation and cycling of
mercury in Lavaca Bay, Texas, sediments. Environ. Sci. Technol. 33, 7.
Blumthaler, M., Ambach, W., Ellinger, R., 1997. Increase in solar UV radiation with altitude. Journal
of Photochemistry and Photobiology B: Biology 39, 130-134.
Blumthaler, M., Ambach, W., Rehwald, W., 1992. Solar UV-A and UV-B radiation fluxes at two
Alpine stations at different altitudes. Theoretical and Applied Climatology 46, 39-44.
Boadi, W.Y., Urbach, J., Brandes, J.M., Yannai, S., 1992. In vitro effect of mercury on enzyme
activities and its accumulation in the first-trimester human placenta. Environ Res 57, 96-106.
Bose-O’Reilly, S., Lettmeier, B., Matteucci Gothe, R., Beinhoff, C., Siebert, U., Drasch, G., 2008.
Mercury as a serious health hazard for children in gold mining areas. Environ Res 107, 89-97.
Bouchet, S., 2009. Speciation et Biogeochimie du Mercure aux interfaces Sediment-Eau-Atmosphere
des ecosystemes cotiers. Université de Pau et des Pays de l’Adour, Pau, France, p. 263.
Bouchet, S., Amouroux, D., Rodriguez-Gonzalez, P., Tessier, E., Monperrus, M., Thouzeau, G.,
Clavier, J., Amice, E., Deborde, J., Bujan, S., Grall, J., Anschutz, P., 2013. MMHg production and
export from intertidal sediments to the water column of a tidal lagoon (Arcachon Bay, France).
Biogeochemistry 114, 341-358.
Bouchet, S., Tessier, E., Monperrus, M., Bridou, R., Clavier, J., Thouzeau, G., Amouroux, D., 2011.
Measurements of gaseous mercury exchanges at the sediment-water, water-atmosphere and sediment-
atmosphere interfaces of a tidal environment (Arcachon Bay, France). Journal Of Environmental
Monitoring: JEM 13, 1351-1359.
Bouyssiere, B., Baco, F., Savory, L., Lobinski, R., 2002. Speciation analysis for mercury in gas
condensates by capillary gas chromatography with inductively coupled plasma mass spectrometric
detection (English)
7th International Symposium on Hyphenated Techniques in Chromatography and Hyphenated
Chromatographic Analyzers (English). Elsevier, Amsterdam, pp. 431-439.
Bowles, K.C., Apte, S.C., Maher, W.A., Blühdorn, D.R., 2003. Mercury Cycling in Lake Gordon and
Lake Pedder, Tasmania (Australia). II: Catchment Processes. Water, Air, and Soil Pollution 147, 25-
38.
173
Braudel, F., 1982. Civilization and Capitalism, 15th-18th Century: The wheels of commerce.
University of California Press.
Bravo, A.G., Loizeau, J.-L., Bouchet, S., Richard, A., Rubin, J.F., Ungureanu, V.-G., Amouroux, D.,
Dominik, J., 2010. Mercury human exposure through fish consumption in a reservoir contaminated by
a chlor-alkali plant: Babeni reservoir (Romania). Environmental Science And Pollution Research
International 17, 1422-1432.
Brosset, C., Lord, E., 1995. Principal reactions of airborne mercury, ozone and some other
microcomponent in pure water or very dilute sulfuric acid. Water, Air, and Soil Pollution 81, 241-264.
Brown, N.L., 1985. Bacterial resistance to mercury — reductio ad absurdum? Trends Biochem Sci 10,
400-403.
Calvert, J.G., Lindberg, S.E., 2005. Mechanisms of mercury removal by O3 and OH in the
atmosphere. Atmos. Environ. 39, 3355.
CAMINAR, 2008. Catchment Management and Mining Impacts in Arid and Semi-Arid South
America, B. Instituto de Investigaciones Químicas & Centro de Estudios Ecológicos - Universidad
Mayor de San Andres La Paz, European Commission & UMSA - CEEDI. La Paz, Bolivia.
Canario, J., Branco, V., Vale, C., 2007. Seasonal variation of monomethylmercury concentrations in
surface sediments of the Tagus Estuary (Portugal). Environmental Pollution [1987] 148, 380-383.
Carpi, A., Lindberg, S.E., 1998. Application of a Teflon (TM) dynamic flux chamber for quantifying
soil mercury flux: tests and results over background soil. Atmos. Environ. 32, 873.
Castaño, A., Cutanda, F., Esteban, M., Pärt, P., Navarro, C., Gómez, S., Rosado, M., López, A.,
López, E., Exley, K., Schindler, B.K., Govarts, E., Casteleyn, L., Kolossa-Gehring, M., Fiddicke, U.,
Koch, H., Angerer, J., Hond, E.D., Schoeters, G., Sepai, O., Horvat, M., Knudsen, L.E., Aerts, D.,
Joas, A., Biot, P., Joas, R., Jiménez-Guerrero, J.A., Diaz, G., Pirard, C., Katsonouri, A., Cerna, M.,
Gutleb, A.C., Ligocka, D., Reis, F.M., Berglund, M., Lupsa, I.-R., Halzlová, K., Charlier, C., Cullen,
E., Hadjipanayis, A., Krsková, A., Jensen, J.F., Nielsen, J.K., Schwedler, G., Wilhelm, M., Rudnai, P.,
Középesy, S., Davidson, F., Fischer, M.E., Janasik, B., Namorado, S., Gurzau, A.E., Jajcaj, M., Mazej,
D., Tratnik, J.S., Larsson, K., Lehmann, A., Crettaz, P., Lavranos, G., Posada, M., 2015. Fish
consumption patterns and hair mercury levels in children and their mothers in 17 EU countries.
Environ Res 141, 58-68.
Celo, V., Lean, D.R.S., Scott, S.L., 2006. Abiotic methylation of mercury in the aquatic environment.
Sci Total Environ 368, 126-137.
Cernichiari, E., Brewer, R., Myers, G.J., Marsh, D.O., Lapham, L.W., Cox, C., Shamlaye, C.F., Berlin,
M., Davidson, P.W., Clarkson, T.W., 1995. Monitoring methylmercury during pregnancy: maternal
hair predicts fetal brain exposure. Neurotoxicology 16, 705-710.
Cernichiari, E., Myers, G.J., Ballatori, N., Zareba, G., Vyas, J., Clarkson, T., 2007. The biological
monitoring of prenatal exposure to methylmercury. Neurotoxicology 28, 1015-1022.
Cerrati, G., Bernhard, M., Weber, J.H., 1992. Model reactions for abiotic mercury(IIà methylation:
kinetics of methylation of mercury(II) by mono-, di-, and tri-methyltin in seawater (English). Appl
Organomet Chem 6, 587-595.
Clarkson, T.W., Magos, L., 2006. The Toxicology of Mercury and Its Chemical Compounds. Critical
Reviews in Toxicology 36, 609-662.
Clarkson, T.W., Vyas, J.B., Ballatori, N., 2007. Mechanisms of mercury disposition in the body.
American Journal of Industrial Medicine 50, 757-764.
174
COMIBOL, C.M.d.B., Geological, S., 1995. Auditoria Ambiental de la mina Huanuni, Parte 1.
Compeau, G., Bartha, R., 1984. Methylation and demethylation of mercury under controlled redox, pH
and salinity conditions. Appl. Environ. Microbiol. 48, 1203.
Compeau, G.C., Bartha, R., 1985. Sulfate-reducing bacteria: principal methylators of mercury in
anoxic estuarine sediment. Appl. Environ. Microbiol. 50, 498.
Condom, T., Coudrain, A., Dezetter, A., Brunstein, D., Delclaux, F., Sicart, J.E., 2004. Transient
modelling of lacustrine regressions: two case studies from the Andean Altiplano. Hydrological
Processes 18, 2395-2408.
Corbett, C.E.P., El Khouri, M., Costa, A.N., Gyuricza, J.V., Corbett, J.F., Frizzarini, R., de Araújo
Andrade, D.C., Cordeiro, Q., Stravogiannis, A., Chassot, C.A., Vieira, J.L.F., Pinheiro, M.d.C., 2007.
Health evaluation of gold miners living in a mercury-contaminated village in Serra Pelada, Pará,
Brazil. Archives Of Environmental & Occupational Health 62, 121-128.
Cornell, R.M., Schwertmann, U., 2006. The iron oxides: structure, properties, reactions, occurrences
and uses. John Wiley & Sons.
Correia, R.R.S., Miranda, M.R., Guimaraes, J.R.D., 2012. Mercury methylation and the microbial
consortium in periphyton of tropical macrophytes:Effect of different inhibitors. Environ Res 112, 86-
91
Cossa, D., Sanjuan, J., Cloud, J., Stockwell, B., Corns, W., 1995. Automated mercury determination in
waters. Water, air, and soil pollution 80 1279-1284.
Costa, M., Liss, P.S., 1999. Photoreduction of mercury in sea water and its possible implications for
Hg (super 0) air-sea fluxes. Mar Chem 68, 87-95.
Coudrain, A., Loubet, M., Condom, T., Talbi, A., Ribstein, P., Pouyaud, B., Quintanilla, J., Dieulin,
C., Dupre, B., 2002. Donnees isotopiques (8786/Sr) et changements hydrologiques depuis 15 000 ans
sur l'Altiplano andin. Hydrological Sciences Journal 47, 293-306.
Craig, P.J., Moreton, P.A., 1985. The role of speciation in mercury methylation in sediments and
water. Environmental Pollution. Series B: Chemical and Physical 10, 141-158.
Craig, P.J., Morton, S.F., 1978. Kinetics and mechanism of the reaction between methylcobalamin and
mercuric chloride. Journal of Organometallic Chemistry 145, 79-89.
Crespo-López, M.E., Macêdo, G.L., Pereira, S.I.D., Arrifano, G.P.F., Picanço-Diniz, D.L.W.,
Nascimento, J.L.M.d., Herculano, A.M., 2009. Mercury and human genotoxicity: Critical
considerations and possible molecular mechanisms. Pharmacological Research 60, 212-220.
Cunningham, C.G., McNamee, J., Pinto Vasquez, J., Ericksen, G.E., 1991. A model of volcanic dome-
hosted precious metal deposits in Bolivia. Economic Geology 86, 415-421.
Charlet, L., Bosbach, D., Peretyashko, T., 2002. Natural attenuation of TCE, As, Hg linked to the
heterogeneous oxidation of Fe(II); an AFM study. Chem Geol 190, 303-319.
Chen, B., Wang, T., Yin, Y., He, B., Jiang, G., 2007. Methylation of inorganic mercury by
methylcobalamin in aquatic systems. Appl Organomet Chem 21, 462.
Chen, C., Amirbahman, A., Fisher, N., Harding, G., Lamborg, C., Nacci, D., Taylor, D., 2008.
Methylmercury in marine ecosystems: spatial patterns and processes of production, bioaccumulation,
and biomagnification. EcoHealth 5, 399-408.
175
Chen, J., Pehkonen, S.O., Lin, C.-J., 2003. Degradation of monomethylmercury chloride by hydroxyl
radicals in simulated natural waters. Water Research 37, 2496-2504.
Chen, X., Balasubramanian, R., Zhu, Q., Behera, S.N., Bo, D., Huang, X., Xie, H., Cheng, J., 2016.
Characteristics of atmospheric particulate mercury in size-fractionated particles during haze days in
Shanghai. Atmos Environ 131, 400-408.
Choi, S.-C., Chase, T., Jr., Bartha, R., 1994. Metabolic pathways leading to mercury methylation in
Desulfovibrio desulfuricans LS. Appl Environ Microb, 4072.
Daga, R., Ribeiro Guevara, S., Pavlin, M., Rizzo, A., Lojen, S., Vreča, P., Horvat, M., Arribére, M.,
2016. Historical records of mercury in southern latitudes over 1600 years: Lake Futalaufquen,
Northern Patagonia. Sci Total Environ 553, 541-550.
Davis, J.A., Kent, D.B., 1990. Surface complexation modeling in aqueous geochemistry. Reviews in
Mineralogy 23, 177-260.
de Lacerda, L.D., Salomons, W., 1997. Mercury from gold and silver mining; a chemical time bomb?
Springer : Berlin, Federal Republic of Germany, Federal Republic of Germany.
de Oliveira Corvelo, T.C., Oliveira, É.A.F., de Parijós, A.M., de Oliveira, C.S.B., do Socorro Pompeu
de Loiola, R., de Araújo, A.A., da Costa, C.A., de Lima Silveira, L.C., da Conceição Nascimento
Pinheiro, M., 2014. Monitoring mercury exposure in reproductive aged women inhabiting the Tapajós
river basin, Amazon. Bulletin Of Environmental Contamination And Toxicology 93, 42-46.
Debes, F., Weihe, P., Grandjean, P., 2016. Cognitive deficits at age 22 years associated with prenatal
exposure to methylmercury. Cortex 74, 358-369.
Demuth, N., Heumann, K.G., 2001. Validation of methylmercury determinations in aquatic systems by
alkyl derivatization methods for GC analysis using ICP-IDMS (English). Analytical chemistry
(Washington, DC) 73, 4020-4027.
DeSimone, R.E., Penley, M.W., Charbonneau, L., Smith, S.G., Wood, J.M., Hill, H.A.O., Pratt, J.M.,
Ridsdale, S., Williams, R.J.P., 1973. The kinetics and mechanism of cobalamin-dependent methyl and
ethyl transfer to mercuric ion. BBA - General Subjects 304, 851-863.
Desrosiers, M., Planas, D., Mucci, A., 2006. Mercury methylation in the epilithon of boreal shield
aquatic ecosystems (English). Environ Sci Technol 40, 1540-1546.
Dietz, R., Born, E.W., Riget, F., 2000. Geographical differences of zinc, cadmium, mercury and
selenium in polar bears (Ursus maritimus) from Greenland. Sci Total Environ 245, 25.
Dietz, R., Outridge, P.M., Hobson, K.A., 2009. Anthropogenic contributions to mercury levels in
present-day Arctic animals—A review. Sci Total Environ 407, 6120-6131.
Dill, C., Kuiken, T., Zhang, H., Ensor, M., 2006. Diurnal variation of dissolved gaseous mercury
(DGM) levels in a southern reservoir lake (Tennessee, USA) in relation to solar radiation. Sci Total
Environ 357, 176-193.
Dong, Z., Jim, R.C., Hatley, E.L., Backus, A.S.N., Shine, J.P., Spengler, J.D., Schaider, L.A., 2015. A
longitudinal study of mercury exposure associated with consumption of freshwater fish from a
reservoir in rural south central USA. Environ Res 136, 155-162.
Driscoll, C.T., Blette, V., Yan, C., Schofield, C.L., Munson, R., Holsapple, J., Electric Power
Research Institute, P.A.C.A.U.S., Environment, C., Atmospheric Environment Service, C., Ontario
Hydro, C., State of, F., Department of Environmental Protection, U.S., Food, U.S., Drug
Administration, W.D.C.U.S., Frontier, G., Wisconsin Department of Natural Resources, U.S., Health
176
Canada, C., 1995. The role of dissolved organic carbon in the chemistry and bioavailability of mercury
in remote Adirondack lakes (English)
Mercury as a global pollutant. International conference (English). Springer, Dordrecht, pp. 499-508.
Dunn, J.D., Clarkson, T.W., 1980. Does mercury exhalation signal demethylation of methylmercury?
Health Physics 38, 411-414.
Dyrssen, D., Wedborg, M., 1991 The sulphur-mercury(II) system in natural waters Water, air and soil
pollution 56 507-519.
Eckley, C.S., Hintelmann, H., 2006. Determination of mercury methylation potentials in the water
column of lakes across Canada. Sci Total Environ 368, 111-125.
Eckley, C.S., Watras, C.J., Hintelmann, H., Morrison, K., Kent, A.D., Regnell, O., 2005. Mercury
methylation in the hypolimnetic waters of lakes with and without connection to wetlands in northern
Wisconsin. Can. J. Fish. Aquat. Sci. 62, 400.
Edwards, S.C., Macleod, C.L., Lester, J.N., 1999. Mercury contamination of the eel (Anguilla
anguilla) and roach (Rutilus rutilus) in East Anglia, UK (English). Environmental monitoring and
assessment 55, 371-387.
Egeland, G.M., Ponce, R., Bloom, N.S., Knecht, R., Loring, S., Middaugh, J.P., 2009. Hair
methylmercury levels of mummies of the Aleutian Islands, Alaska. Environ Res 109, 281-286.
Ekstrom, E.B., Morel, F.M.M., 2008. Cobalt Limitation of Growth and Mercury Methylation in
Sulfate-Reducing Bacteria (English). Environ Sci Technol 42, 93-99.
Ekstrom, E.B., Morel, F.M.M., Benoit, J.M., 2003. Mercury methylation independent of the acetyl-
coenzyme A pathway in sulfate-reducing bacteria (English). Applied and environmental microbiology
(Print) 69, 5414-5422.
Endo, T., Haraguchi, K., 2010. High mercury levels in hair samples from residents of Taiji, a Japanese
whaling town. Mar Pollut Bull 60, 743-747.
Fain, X., Grangeon, S., Bahlmann, E., Fritsche, J., Obrist, D., Dommergue, A., Ferrari, C.P., Cairns,
W., Ebinghaus, R., Barbante, C., Cescon, P., Boutron, C., 2007. Diurnal production of gaseous
mercury in the alpine snowpack before snowmelt. Journal of Geophysical Research - Part D -
Atmospheres 112.
Falandysz, J., Bielawski, L., Kannan, K., Gucia, M., Lipka, K., Brzostowski, A., 2002. Mercury in
wild mushrooms and underlying soil substrate from the great lakes land in Poland. Journal of
Environmental Monitoring 4, 473-476.
Falandysz, J., Dryżałowska, A., Saba, M., Wang, J., Zhang, D., 2014. Mercury in the fairy-ring of
Gymnopus erythropus (Pers.) and Marasmius dryophilus (Bull.) P. Karst. mushrooms from the
Gongga Mountain, Eastern Tibetan Plateau. Ecotoxicology And Environmental Safety 104, 18-22.
Fanchiang, Y.-T., Bratt, G.T., Harry, P.C.H., 1984. Methyl Transfer from Methylcobalamin to
Diaquocobinamide. National Academy of Sciences of the United States of America, p. 2698.
Fantozzi, L., Ferrara, R., Frontini, F.P., Dini, F., 2007. Factors influencing the daily behaviour of
dissolved gaseous mercury concentration in the Mediterranean Sea. Mar Chem 107, 4-12.
Fantozzi, L., Ferrara, R., Frontini, F.P., Dini, F., 2009. Dissolved gaseous mercury production in the
dark: Evidence for the fundamental role of bacteria in different types of Mediterranean water bodies.
Sci Total Environ 407, 917-924.
177
Fay, L., Gustin, M., 2007. Assessing the Influence of Different Atmospheric and Soil Mercury
Concentrations on Foliar Mercury Concentrations in a Controlled Environment. Water, Air, and Soil
Pollution 181, 373-384.
Faz, Á., Zornoza, R., Ángeles Muñoz, M., Acosta, J.A., 2014. Metals and metalloids in primary gold
mining districts of Western Bolivia: anthropogenic and natural sources. Environmental Earth Sciences
71, 5027-5036.
Ferrari, C.P., Dommergue, A., Veysseyre, A., Planchon, F., Boutron, C.F., 2002. Mercury speciation
in the French seasonal snow cover (English). Sci Total Environ 287, 61-69.
Feyte, S., Gobeil, C., Tessier, A., Cossa, D., 2012. Mercury dynamics in lake sediments. Geochim
Cosmochim Ac 82, 92-112.
Filippelli, M., Baldi, F., 1993. Alkylation of ionic mercury to methylmercury and dimethylmercury by
methylcobalamin: Simultaneous determination by purge-and-trap GC in line with FTIR. Appl
Organomet Chem 7, 487.
Fitzgerald, W.F., Clarkson, T.W., 1991. Mercury and Monomethylmercury - Present and Future
Concerns. Environ Health Persp 96, 159-166.
Fitzgerald, W.F., Engstrom, D.R., Mason, R.P., Nater, E.A., 1998. The case for atmospheric mercury
contamination in remote areas. Environ. Sci. Technol. 32, 1-7.
Fitzgerald, W.F., Lamborg, C.H., 2004. Geochemistry of mercury in the environment Treatise on
geochemistry. Elsevier : Oxford, United Kingdom, United Kingdom, pp. 107-148.
Fitzgerald, W.F., Lamborg, C.H., Editors-in-Chief: Â Â Heinrich, D.H., Karl, K.T., 2007.
Geochemistry of Mercury in the Environment. Treatise on Geochemistry Pergamon, Oxford.
Fitzgerald, W.F., Lamborg, C.H., Hammerschmidt, C.R., 2007b. Marine biogeochemical cycling of
mercury. Chem. Rev. 107, 641.
Fitzgerald, W.F., Lamborg, C.H., Turekian, H.D.H.K., 2014. Geochemistry of Mercury in the
Environment. Treatise on Geochemistry (Second Edition). Elsevier, Oxford, 91-129.
Fitzgerald, W.F., Mason, R.P., Vandal, G.M., 1991. Atmospheric Cycling and Air-Water Exchange of
Mercury over Midcontinental Lacustrine Regions. Water Air Soil Poll 56, 745-767.
Fleming, E.J., Mack, E.E., Green, P.G., Nelson, D.C., 2006. Mercury methylation from unexpected
sources : Molybdate-inhibited freshwater sediments and an iron-reducing bacterium (English).
Applied and environmental microbiology (Print) 72, 457-464.
Fostier, A.H., Forti, M.C., Guimarães, J.R.D., Melfi, A.J., Boulet, R., Espirito Santo, C.M., Krug, F.J.,
2000. Mercury fluxes in a natural forested Amazonian catchment (Serra do Navio, Amapá State,
Brazil). Sci Total Environ 260, 201-211.
Fostier, A.H., Melendez-Perez, J.J., Richter, L., 2015. Litter mercury deposition in the Amazonian
rainforest. Environ Pollut 206, 605-610.
Friske, P.W.B., Coker, W.B., 1995. The importance of geological controls on the natural distribution
of mercury in lake and stream sediments across Canada. Water, Air, and Soil Pollution 80, 1047-1051.
Gamby, R.L., Hammerschmidt, C.R., Costello, D.M., Lamborg, C.H., Runkle, J.R., 2015.
Deforestation and cultivation mobilize mercury from topsoil. Sci Total Environ 532, 467-473.
Garcia-Guinea, J., Harffy, M., 1998. Bolivian mining pollution: past, present and future. Ambio, 251-
253.

178
Garcia Bravo, A., Bouchet, S., Amouroux, D., Poté, J., Dominik, J., 2011. Distribution of mercury and
organic matter in particle-size classes in sediments contaminated by a waste water treatment plant:
Vidy Bay, Lake Geneva, Switzerland. Journal of Environmental Monitoring 13, 974-982.
Garcia Bravo, A., Cosio, C., Amouroux, D., Zopfi, J., Chevalley, P.-A., Spangenberg, J.E.,
Ungureanu, V.-G., Dominik, J., 2014. Extremely elevated methyl mercury levels in water, sediment
and organisms in a Romanian reservoir affected by release of mercury from a chlor-alkali plant. Water
Research 49, 391-405.
Garcia, E., Amyot, M., Ariya, P.A., 2005. Relationship between DOC photochemistry and mercury
redox transformations in temperate lakes and wetlands. Geochim Cosmochim Ac 69, 1917-1924.
Garcia Moreno, M.E., 2006. PhD Thesis, Transport of Arsenic and Heavy Metals to Lake Poopó –
Bolivia Natural Leakage and Antropogenic Effects. Lund Institute of Technology. Lund University,
Lund, Sweden. .
Gårdfeldt, K., Sommar, J., Ferrara, R., Ceccarini, C., Lanzillotta, E., Munthe, J., Wängberg, I.,
Lindqvist, O., Pirrone, N., Sprovieri, F., Pesenti, E., Strömberg, D., 2003. Evasion of mercury from
coastal and open waters of the Atlantic Ocean and the Mediterranean Sea. Atmos Environ 37,
Supplement 1, 73-84.
Gårdfeldt, K., Sommar, J., Strömberg, D., Feng, X., 2001. Oxidation of atomic mercury by hydroxyl
radicals and photoinduced decomposition of methylmercury in the aqueous phase. Atmos Environ 35,
3039-3047.
Gardner, R.M., Nyland, J.F., Silbergeld, E.K., 2010. Differential immunotoxic effects of inorganic and
organic mercury species in vitro (English). Toxicology letters 198, 182-190.
Garitano-Zavala, A., Cotin, J., Borràs, M., Nadal, J., 2010. Trace metal concentrations in tissues of
two tinamou species in mining areas of Bolivia and their potential as environmental sentinels.
Environmental monitoring and assessment 168, 629-644.
Garreaud, R., Vuille, M., Clement, A.C., 2003. The climate of the Altiplano; observed current
conditions and mechanisms of past changes. Palaeogeography, Palaeoclimatology, Palaeoecology 194,
5-22.
Gentès, S., Monperrus, M., Legeay, A., Maury-Brachet, R., Davail, S., André, J.-M., Guyoneaud, R.,
2013. Incidence of invasive macrophytes on methylmercury budget in temperate lakes: Central role of
bacterial periphytic communities. Environ Pollut 172, 116-123.
George, B.M., Batzer, D., 2008. Spatial and temporal variations of mercury levels in Okefenokee
invertebrates: Southeast Georgia. Environ Pollut 152, 484-490.
Gilmour, C.C., Henry, E.A., Mitchell, R., 1992. Sulfate stimulation of mercury methylation in
freshwater sediments (English). Environ Sci Technol 26, 2281-2287.
Goix, S., 2012. Origine et impact des pollutions liées aux activités minières sur l’environnement (eau-
sol-atmosphère) et la santé, cas de Oruro (Bolivie). SDU2E. Université de Toulouse-Toulouse III,
Toulouse, France, pp. 1-306.
Goldwater, L.J., 1972. Mercury; A history of quicksilver, Baltimore Md.
Goyer, R.A., Clarkson, T.W., 1996. Toxic effects of metals. Casarett and Doullis Toxicology: The
Basic Science of Poisons, New York, pp. 811-867.
Grandjean, P., Landrigan, P.J., 2006. Developmental neurotoxicity of industrial chemicals. The Lancet
368, 2167-2178.
179
Grandjean, P., Perez, M., 2008. Development neurotoxicity : implications of methylmercury research
(English). International journal of environment and health (Print) 2, 417-428.
Grandjean, P., Weihe, P., Debes, F., Choi, A.L., Budtz-Jørgensen, E., 2014. Neurotoxicity from
prenatal and postnatal exposure to methylmercury. Neurotoxicology and Teratology 43, 39-44.
Grandjean, P., Weihe, P., White, R.F., Debes, F., Araki, S., Yokoyama, K., Murata, K., SØRensen, N.,
Dahl, R., JØRgensen, P.J., 1997. Cognitive Deficit in 7-Year-Old Children with Prenatal Exposure to
Methylmercury. Neurotoxicology and Teratology 19, 417-428.
Gratz, L.E., Ambrose, J.L., Jaffe, D.A., Shah, V., Jaegle´, L., Stutz, J., Festa, J., Spolaor, M., Tsai, C.,
Selin, N.E., Song, S., Zhou, X., Weinheimer, A.J., Knapp, D.J., Montzka, D.D., Flocke, F.M.,
Campos, T.L., Apel, E., Hornbrook, R., Blake, N.J., Hall, S., Tyndall, G.S., Reeves, M., Stechman, D.,
Stell, M., 2015. Oxidation of mercury by bromine in the subtropical Pacific free troposphere. Geophys
Res Lett 42, 10494-10502.
Graydon, J.A., Louis, V.L.S., Hintelmann, H., Lindberg, S.E., Sandilands, K.A., Rudd, J.W.M., Kelly,
C.A., Hall, B.D., Mowat, L.D., 2008. Long-Term Wet and Dry Deposition of Total and Methyl
Mercury in the Remote Boreal Ecoregion of Canada (English). Environ Sci Technol 42, 8345-8351.
Gregoire, D.S., Poulain, A.J., 2016. A physiological role for HgII during phototrophic growth. Nature
Geosci 9, 121-125.
Grigal, D.F., 2002. Inputs and outputs of mercury from terrestrial watersheds: a review. Environ. Rev.
10, 1.
Gu, B., Bian, Y., Miller, C.L., Dong, W., Jiang, X., Liang, L., 2011. Mercury reduction and
complexation by natural organic matter in anoxic environments. Proceedings of the National Academy
of Sciences 108, 1479-1483.
Guédron, S., Amouroux, D., Sabatier, P., Desplanque, C., Develle, A.-L., Barre, J., Feng, C., Guiter,
F., Arnaud, F., Reyss, J.L., Charlet, L., 2016a. A hundred year record of industrial and urban
development in French Alps combining Hg accumulation rates and isotope composition in sediment
archives from Lake Luitel. Chem Geol 431, 10-19.
Guédron, S., Devin, S., Vignati, D.A.L., 2016b. Total and methylmercury partitioning between
colloids and true solution: From case studies in sediment overlying and porewaters to a generalized
model. Environ Toxicol Chem 35, 330-339.
Guédron, S., Duwig, C., Prado, B.L., Point, D., Flores, M.G., Siebe, C., 2014. (Methyl)Mercury,
Arsenic, and Lead Contamination of the World’s Largest Wastewater Irrigation System: the Mezquital
Valley (Hidalgo State—Mexico). Water, Air, & Soil Pollution 225, 2045.
Guédron, S., Huguet, L., Vignati, D.A.L., Liu, B., Gimbert, F., Ferrari, B.J.D., Zonta, R., Dominik, J.,
2012. Tidal cycling of mercury and methylmercury between sediments and water column in the
Venice Lagoon (Italy). Mar Chem 130–131, 1-11.
Guevara, S.R., Bubach, D., Vigliano, P., Lippolt, G., Arribére, M., 2004. Heavy metal and other trace
elements in native mussel Diplodon chilensis from Northern Patagonia Lakes, Argentina. Biological
Trace Element Research 102, 245-263.
Guifen, Y.U., Hongtao, W.U., Changle, Q., Xin, J., Jiaoyan, Z., 2004. Bioavailability of humic
substance-bound mercury to lettuce and its relationship with soil properties (English).
Communications in soil science and plant analysis 35, 1123-1139.
180
Guimaraes, J.R.D., Fostier, A.-H., Forti, M.C., Melfi, J.A., Kehrig, H., Mauro, J.B.N., Malm, O.,
Krug, J.F., 1999. Mercury in human environmental samples from two lakes in Amapa, Brazilian
Amazon. Ambio 28, 296-301.
Guimarães, J.R.D., Meili, M., Hylander, L.D., Silva, E.d.C.e., Roulet, M., Mauro, J.B.N., de Lemos,
R.A., 2000. Mercury net methylation in five tropical flood plain regions of Brazil: high in the root
zone of floating macrophyte mats but low in surface sediments and flooded soils. Sci Total Environ
261, 99-107.
Gustin, M.S., Lindberg, S.E., Weisberg, P.J., 2008. An update on the natural sources and sinks of
atmospheric mercury. Appl. Geochem. 23, 482.
Guyot, J.L., Roche, M.A., Noriega, L., Calle, H., Quintanilla, J., 1990. Salinities and sediment
transport in the Bolivian highlands. Journal of Hydrology 113, 147-162.
Hall, B., 1995. The gas phase oxidation of elemental mercury by ozone. Water Air Soil Pollut. 80,
301.
Hamelin, S., Amyot, M., Barkay, T., Yanping, W., Planas, D., 2011. Methanogens: Principal
Methylators of Mercury in Lake Periphyton (English). Environ Sci Technol 45, 7693-7700.
Hammerschmidt, C.R., Fitzgerald, W.F., 2004. Geochemical controls on the production and
distribution of methylmercury in near-shore marine sediments. Environ Sci Technol 38, 1487-1495.
Hammerschmidt, C.R., Fitzgerald, W.F., 2006a. Bioaccumulation and trophic transfer of
methylmercury in Long Island Sound. Arch Environ Con Tox 51, 416-424.
Hammerschmidt, C.R., Fitzgerald, W.F., 2006b. Photodecomposition of methylmercury in an Arctic
Alaskan Lake (English). Environ Sci Technol 40, 1212-1216.
Hammerschmidt, C.R., Fitzgerald, W.F., Lamborg, C.H., Balcom, P.H., Tseng, C.M., 2006.
Biogeochemical cycling of methylmercury in lakes and tundra watersheds of Arctic Alaska. Environ
Sci Technol 40, 1204-1211.
Hammerschmidt, C.R., Lamborg, C.H., Fitzgerald, W.F., 2007. Aqueous phase methylation as a
potential source of methylmercury in wet deposition. Atmos Environ 41, 1663-1668.
Harada, M., 1995. Minamata disease: methylmercury poisoning in Japan caused by environmental
pollution. Crit. Rev. Toxicol. 25, 1.
Harada, M., Nakanishi, J., Konuma, S., Ohno, K., Kimura, T., Yamaguchi, H., Tsuruta, K., Kizaki, T.,
Ookawara, T., Ohno, H., 1998. The Present Mercury Contents of Scalp Hair and Clinical Symptoms in
Inhabitants of the Minamata Area. Environ Res 77, 160-164.
Harris-Hellal, J., Grimaldi, M., Garnier-Zarli, E., Bousserrhine, N., 2011. Mercury mobilization by
chemical and microbial iron oxide reduction in soils of French Guyana (English). Biogeochemistry
(Dordrecht) 103, 223-234.
He, F., Zheng, W., Liang, L., Gu, B., 2012. Mercury photolytic transformation affected by low-
molecular-weight natural organics in water. Sci Total Environ 416, 429-435.
Heyes, A., Mason, R.P., Kim, E.H., Sunderland, E.M., 2006. Mercury methylation in estuaries:
insights from using measuring rates using stable mercury isotopes. Mar. Chem. 102, 134.
Hintelmann, H., 1999. Comparison of different extraction techniques used for methylmercuryanalysis
with respect to accidental formation of methylmercury during sample preparation. Chemosphere 39,
1093.
181
Hintelmann, H., 2010. Organomercurials. Their formation and pathways in the environment. Metal
Ions In Life Sciences 7, 365-401.
Hintelmann, H., Evans, R.D., 1997. Application of stable isotopes in environmental tracer studies –
Measurement of monomethylmercury (CH3Hg+) by isotope dilution ICP-MS and detection of species
transformation. Fresenius' Journal of Analytical Chemistry 358, 378.
Hintelmann, H., Falter, R., Ilgen, G., Evans, R.D., 1997. Determination of artifactual formation of
monomethylmercury (CH3Hg+) in environmental samples using stable Hg2+ isotopes with ICP-MS
detection: Calculation of contents applying species specific isotope addition. Fresenius' Journal of
Analytical Chemistry 358, 363.
Hintelmann, H., Harris, R., 2004. Application of multiple stable mercury isotopes to determine the
adsorption and desorption dynamics of Hg(II) and MeHg to sediments. Mar Chem 90, 165-173.
Hintelmann, H., Ogrinc, N., 2003. Determination of stable mercury isotopes by ICP/MS and their
application in environmental studies. ACS Symposium Series 835, 321-338.
Hintelmann, H., Welbourn, P.M., Evans, R.D., 1995. Binding of methylmercury compounds by humic
and fulvic acids. Water Air Soil Pollut. 80, 1031.
Hollweg, T.A., Gilmour, C.C., Mason, R.P., 2009. Methylmercury production in sediments of
Chesapeake Bay and the mid-Atlantic continental margin. Mar Chem 114, 86-101.
Horton, B.K., Hampton, B.A., Lareau, B.N., Baldellon, E., 2002. Tertiary provenance history of the
northern and central Altiplano (Central Andes, Bolivia); a detrital record of plateau-margin tectonics.
Journal of Sedimentary Research 72 711-726.
Horvat, M., 2005. Determination of mercury and its compounds in water, sediment, soil and biological
samples. Springer Science and Business Media : New York, NY, United States, United States, pp.
153-190.
Hsu-Kim, H., Kucharzyk, K.H., Zhang, T., Deshusses, M.A., 2013. Mechanisms regulating mercury
bioavailability for methylating microorganisms in the aquatic environment: a critical review. Environ
Sci Technol 47, 2441-2456.
Huang, J., Kang, S., Wang, S., Wang, L., Zhang, Q., Guo, J., Wang, K., Zhang, G., Tripathee, L.,
2013. Wet deposition of mercury at Lhasa, the capital city of Tibet. Sci Total Environ 447, 123-132.
Huang, J., Kang, S., Zhang, Q., Jenkins, M.G., Guo, J., Zhang, G., Wang, K., 2012a. Spatial
distribution and magnification processes of mercury in snow from high-elevation glaciers in the
Tibetan Plateau. Atmos Environ 46, 140-146.
Huang, J., Kang, S.C., Zhang, Q.G., Yan, H.Y., Guo, J.M., Jenkins, M.G., Zhang, G.S., Wang, K.,
2012b. Wet deposition of mercury at a remote site in the Tibetan Plateau: Concentrations, speciation,
and fluxes. Atmos Environ 62, 540-550.
Hursh, J.B., Cherian, M.G., Clarkson, T.W., Vostal, J.J., Mallie, R.V., 1976. Clearance of mercury
(HG-197, HG-203) vapor inhaled by human subjects. Archives Of Environmental Health 31, 302-309.
Imura, N., Sukegawa, E., Pan, S.-K., Nagao, K., Kim, J.-Y., Kwan, T., Ukita, T., 1971. Chemical
Methylation of Inorganic Mercury with Methylcobalamin, a Vitamin B$_{12}$ Analog. American
Association for the Advancement of Science, p. 1248.
Ineris, 2010. Fiche de données toxicologiques et environnementales des substances chimiques:
Mercure et ses dérivés. p. 120.
182
Iwai-Shimada, M., Satoh, H., Nakai, K., Tatsuta, N., Murata, K., Akagi, H., 2015. Methylmercury in
the breast milk of Japanese mothers and lactational exposure of their infants. Chemosphere 126, 67-
72.
Jay, J.A., Murray, K.J., Gilmour, C.C., Mason, R.P., Morel, F.M.M., Roberts, A.L., Hemond, H.F.,
2002. Mercury Methylation by Desulfovibrio desulfuricans ND132 in the Presence of Polysulfides.
Applied & Environmental Microbiology 68, 5741.
Jeremiason, J.D., Engstrom, D.R., Swain, E.B., Nater, E.A., Johnson, B.M., Almendinger, J.E.,
Monson, B.A., Kolka, R.K., 2006. Sulfate addition increases methylmercury production in an
experimental wetland (English). Environ Sci Technol 40, 3800-3806.
Jobling, M.G., Peters, S.E., Ritchie, D.A., 1988. Plasmid-borne mercury resistance in aquatic bacteria
(English). FEMS microbiology letters 49, 31-37.
Johnson, D.B., Hallberg, K.B., 2005. Acid mine drainage remediation options: a review Sci Total
Environ 338, 3-14.
Jonasson, I.R., Boyle, R.W., 1972. Geochemistry of mercury and origin of natural contamination of
the environment. CIM Bulletin [1974] 65, 32-39.
Joselow, M.M., Ruiz, R., Goldwater, L.J., 1968. Absorption and excretion of mercury in man. XIV.
Salivary excretion of mercury and its relationship to blood and urine mercury. . Arch. Environ. Health
17.
Kabata-Pendias, A., 2011. Trace elements in soils and plants. Taylor and Francis Group, LLC, NW,
United States of America.
Karunasagar, D., Arunachalam, J., Gangadharan, S., 1998. Development of a 'collect and punch' cold
vapour inductively coupled plasma mass spectrometric method for the direct determination of mercury
at nanograms per litre levels (English). Journal of analytical atomic spectrometry (Print) 13, 679-682.
Kelly, W.C., Turneaure, F.S., 1970. Mineralogy, paragenesis and geothermometry of the tin and
tungsten deposits of the eastern Andes, Bolivia. Economic Geology 65, 609-680.
Kerin, E.J., Gilmour, C.C., Roden, E., Suzuki, M.T., Coates, J.D., Mason, R.P., 2006. Mercury
methylation by dissimilatory iron-reducing bacteria. Appl. Environ. Microbiol. 72, 7919.
Khwaja, A.R., Bloom, P.R., Brezonik, P.L., 2006 Binding constants of divalent mercury (Hg2+) in
soil humic acids and soil organic matter. Environ Sci Technol 40, 844-849.
Kimball, B.A., Callender, E., Axtmann, E.V., 1995 Effects of colloids on metal transport in a river
receiving acid mine drainage, upper Arkansas River, Colorado, U.S.A. Appl. Geochem. 10, 285-306.
King, J.K., Kostka, J.E., Frischer, M.E., Saunders, F.M., 2000. Sulfate-reducing bacteria methylate
mercury at variable rates in pure culture and in marine sediments (English). Applied and
environmental microbiology (Print) 66, 2430-2437.
King, J.K., Kostka, J.E., Frischer, M.E., Saunders, F.M., Jahnke, R.A., 2001. A quantitative
relationship that demonstrates mercury methylation rates in marine sediments are based on the
community composition and activity of sulfate-reducing bacteria (English). Environ Sci Technol 35,
2491-2496.
Kingston, H.M., Dengwei, H.U.O., Yusheng, L.U., Chalk, S., 1998. Accuracy in species analysis :
speciated isotope dilution mass spectrometry (SIDMS) exemplified by the evaluation of chromium
species (English). Spectrochimica acta. Part B : Atomic spectroscopy 53, 299-309.
183
Kirk, J.L., Louis, V.L.S., Hintelmann, H., Lehnherr, I., Else, B., Poissant, L., 2008. Methylated
Mercury Species in Marine Waters of the Canadian High and Sub Arctic (English). Environ Sci
Technol 42, 8367-8373.
Klaassen, C., 1990. Heavy metals and heavy-metal antagonists. Goodman and Gilman's the
pharmacological basis of therapeutics. Pergamon Press, New York, pp. 1592-1614
Kopysc, E., Pyrzynska, K., Garbos, S., Bulska, E., 2000. Determination of mercury by cold-vapor
atomic absorption spectrometry with preconcentration on a gold-trap (English). Analytical sciences
16, 1309-1312.
Kotnik, J., Horvat, M., Tessier, E., Ogrinc, N., Monperrus, M., Amouroux, D., Fajon, V., Gibicar, D.,
Zizek, S., Sprovieri, F., Pirrone, N., 2007. Mercury speciation in surface and deep waters of the
Mediterranean Sea. Mar Chem 107, 13-30.
Laffont, L., 2009. Fractionnement des isotopes stables de mercure dans un écosystème tropical en
Amazonie bolivienne et dans les cheveux de populations humaines exposées. Sciences de l'Univers, de
l'Environnement et de l'Espace. Toulouse III - Paul Sabatier, Toulouse France, p. 187.
Lailson-Brito, J., Cruz, R., Dorneles, P.R., Andrade, L., Azevedo, A.d.F., Fragoso, A.B., Vidal, L.G.,
Costa, M.B., Bisi, T.L., Almeida, R., Carvalho, D.P., Bastos, W.R., Malm, O., 2012. Mercury-
Selenium Relationships in Liver of Guiana Dolphin: The Possible Role of Kupffer Cells in the
Detoxification Process by Tiemannite Formation. Plos One 7, e42162.
Lalonde, J.D., Amyot, M., Kraepiel, A.M.L., Morel, F.M.M., 2001. Photooxidation of Hg(0) in
artificial and natural waters (English). Environ Sci Technol 35, 1367-1372.
Lalonde, J.D., Amyot, M., Orvoine, J., Morel, F.M.M., Auclair, J.-C., Ariya, P.A., 2004. Photoinduced
oxidation of Hg[sub]0[/sub](aq) in the waters from the St. Lawrence estuary (English). Environ Sci
Technol 38, 508-514.
Lamborg, C.H., Fitzgerald, W.F., O'Donnell, J., Torgersen, T., 2002. A non-steady-state
compartmental model of global-scale mercury biogeochemistry with interhemispheric atmospheric
gradients. Geochim Cosmochim Ac 66, 1105-1118.
Lamborg, C.H., Hammerschmidt, C.R., Bowman, K.L., Swarr, G.J., Munson, K.M., Ohnemus, D.C.,
Lam, P.J., Heimburger, L.-E., Rijkenberg, M.J.A., Saito, M.A., 2014. A global ocean inventory of
anthropogenic mercury based on water column measurements. Nature [London] 512, 65-68.
Langer, C.S., Fitzgerald, W.F., Visscher, P.T., Vandal, G.M., 2001. Biogeochemical cycling of
methylmercury at Barn Island Salt Marsh, Stonington, CT, USA. Wetlands Ecology and Management
9, 295-310.
Lanza, W.G., Acha, D., Point, D., Masbou, J., Alanoca, L., Amouroux, D., Lazzaro, X., 2015.
Association of a specific algal group to methylmercury accumulation in periphyton of a tropical high-
altitude Andean Lake. Env. Pollut. submitted.
Lanzillotta, E., Ceccarini, C., Ferrara, R., 2002. Photo-induced formation of dissolved gaseous
mercury in coastal and offshore seawater of the Mediterranean basin. Sci Total Environ 300, 179-187.
Lanzillotta, E., Ceccarini, C., Ferrara, R., Dini, F., Frontini, F.P., Banchetti, R., 2004. Importance of
the biogenic organic matter in photo-formation of dissolved gaseous mercury in a culture of the
marine diatom Chaetoceros sp. Sci Total Environ 318, 211-221.
Lebel, J., Mergler, D., Lucotte, M., Amorim, M., Dolbec, J., Miranda, D., Arantes, G., Rheault, I.,
Pichet, P., 1996. Evidence of early nervous system dysfunction in Amazonian populations exposed to
low-levels of methylmercury. Neurotoxicology 17, 157-168.
184
Lee, G., Bigham, J.M., Faure, G., 2002. Removal of trace metals by coprecipitation with Fe, Al and
Mn from natural waters contaminated with acid mine drainage in the Ducktown Mining District,
Tennessee. Appl Geochem 17, 569-581.
Lee, Y.-H., Hultberg, H., Andersson, I., 1985. Catalytic effect of various metal ions on the methylation
of mercury in the presence of humic substances. Water, Air, and Soil Pollution 25, 391-400.
Legrand, M., Feeley, M., Tikhonov, C., Schoen, D., Li-Muller, A., 2010. Methylmercury blood
guidance values for Canada. Canadian Journal Of Public Health = Revue Canadienne De Sante
Publique 101, 28-31.
Legrand, M., Lam, R., Jensen-Fontaine, M., Salin, E.D., Man Chan, H., 2004. Direct detection of
mercury in single human hair strands by laser ablation inductively coupled plasma mass spectrometry
(LA-ICP-MS). J Anal Atom Spectrom 19, 1287-1288.
Lehnherr, I., St. Louis, V.L., 2009. Importance of Ultraviolet Radiation in the Photodemethylation of
Methylmercury in Freshwater Ecosystems (English). Environ Sci Technol 43, 5692-5698.
Lenters, J.D., Cook, K.H., 1999. Summertime Precipitation Variability over South America: Role of
the Large-Scale Circulation. Monthly Weather Review 127, 409-431.
Lentz, D.R., 2005. Mercury as a lithogeochemical exploration vectoring technique: a review of
methodologies and applications with selected VMS case histories. . Gangue 85:1-8.
Lian, L., Bloom, N.S., 1993. Determination of total mercury by single-stage gold amalgmation with
cold vapour atomic spectrometric detection (English). Journal of analytical atomic spectrometry
(Print) 8, 591-594.
Lin, C.-C., Yee, N., Barkay, T., 2012. Microbial transformations in the mercury cycle, Environmental
chemistry and toxicology of mercury. In: Liu, G., Cai, Y., O'Driscoll, N. (Ed.). John Wiley & Sons,
Inc, Hoboken, New Jersey, pp. 155-191.
Lindberg, S., Bullock, R., Ebinghaus, R., Engstrom, D., Feng, X.B., Fitzgerald, W., Pirrone, N.,
Prestbo, E., Seigneur, C., 2007. A synthesis of progress and uncertainties in attributing the sources of
mercury in deposition. Ambio 36, 19-32.
Lindberg, S.E., Stratton, W.J., 1998. Atmospheric mercury speciation: Concentrations and behavior of
reactive gaseous mercury in. Environ Sci Technol 32, 49.
Lindqvist, O., Johansson, K., Bringmark, L., Timm, B., Aastrup, M., Andersson, A., Hovsenius, G.,
Håkanson, L., Iverfeldt, Å., Meili, M., 1991. Mercury in the Swedish environment — Recent research
on causes, consequences and corrective methods. Water, Air, and Soil Pollution 55, xi-261.
Lindström, M., 2001. Distribution of particulate and reactive mercury in surface waters of Swedish
forest lakes — an empirically based predictive model. Ecological Modelling 136, 81-93.
Liu, J.-L., Xu, X.-R., Yu, S., Cheng, H., Peng, J.-X., Hong, Y.-G., Feng, X.-B., 2014. Mercury
contamination in fish and human hair from Hainan Island, South China Sea: Implication for human
exposure. Environ Res 135, 42-47.
Lockhart, W.L., Stern, G.A., Wagemann, R., Hunt, R.V., Metner, D.A., DeLaronde, J., Dunn, B.,
Stewart, R.E.A., Hyatt, C.K., Harwood, L., Mount, K., 2005. Concentrations of mercury in tissues of
beluga whales (Delphinapterus leucas) from several communities in the Canadian Arctic from 1981 to
2002. Sci Total Environ 351, 391-412.
Loseto, L.L., Siciliano, S.D., Lean, D.R.S., 2004. METHYLMERCURY PRODUCTION IN HIGH
ARCTIC WETLANDS. Environmental Toxicology & Chemistry 23, 17-23.
185
Loukola-Ruskeeniemi, K., Kantola, M., Halonen, T., Seppänen, K., Henttonen, P., Kallio, E., Kurki,
P., Savolainen, H., 2003. Mercury-bearing black shales and human Hg intake in eastern Finland:
impact and mechanisms. Environ Geol 43, 283-297.
Magos, L., 1988. Mercury. In: Seller, H., Sigel, H. (Eds.). Handbook on toxicity of inorganic
compounds, New York, pp. 419-436.
Maia, P.D., Maurice, L., Tessier, E., Amouroux, D., Cossa, D., Pérez, M., Moreira-Turcq, P., Rhéault,
I., 2009. Mercury distribution and exchanges between the Amazon River and connected floodplain
lakes. Sci Total Environ 407, 6073-6084.
Malm, O., 1998. Gold Mining as a Source of Mercury Exposure in the Brazilian Amazon. Environ Res
77, 73-78.
Marques, R.C., Abreu, L., Bernardi, J.V.E., Dórea, J.G., Neurodevelopment of Amazonian children
exposed to ethylmercury (from Thimerosal in vaccines) and methylmercury (from fish). Environ Res.
Martin-Doimeadios, R.C.R., Krupp, E., Amouroux, D., Donard, O.F.X., 2002. Application of
Isotopically Labeled Methylmercury for Isotope Dilution Analysis of Biological Samples Using Gas
Chromatography/ICPMS. Anal Chem 74, 2505.
Martín-Doimeadios, R.C.R., Monperrus, M., Krupp, E., Amouroux, D., Donard, O.F.X., 2003. Using
Speciated Isotope Dilution with GC-Inductively Coupled Plasma MS To Determine and Unravel the
Artificial Formation of Monomethylmercury in Certified Reference Sediments. Anal Chem 75, 3202.
Marusczak, N., Larose, C., Dommergue, A., Paquet, S., Beaulne, J.-S., Maury-Brachet, R., Lucotte,
M., Nedjai, R., Ferrari, C.P., 2011. Mercury and methylmercury concentrations in high altitude lakes
and fish (Arctic charr) from the French Alps related to watershed characteristics. Sci Total Environ
409, 1909-1915.
Marusczak, N., Larose, C., Dommergue, A., Paquet, S., Beaulne, J.-S., Maury-Brachet, R., Lucotte,
M., Nedjai, R., Ferrari, C.P., 2011b. Mercury and methylmercury concentrations in high altitude lakes
and fish (Arctic charr) from the French Alps related to watershed characteristics. Sci Total Environ
409, 1909-1915.
Marusczak, N., Larose, C., Dommergue, A., Yumvihoze, E., Lean, D., Nedjai, R., Ferrari, C., 2011c.
Total mercury and methylmercury in high altitude surface snow from the French Alps. Sci Total
Environ 409, 3949-3954.
Marvin-Dipasquale, M., Agee, J., 2000. Methyl-Mercury Degradation Pathways: A Comparison
among Three Mercury-Impacted Ecosystems. Environ Sci Technol 34, 4908.
Marvin-DiPasquale, M., Agee, J.L., 2003. Microbial Mercury Cycling in Sediments of the San
Francisco Bay-Delta. Estuaries 26, 1517.
Mason, R.P., 2009. Mercury emissions from natural processes and their importance in the global
mercury cycle. In: Mason, R., Pirrone, N. (Eds.). Mercury Fate and Transport in the Global
Atmosphere: Emissions, Measurements and Models. Springer US, Boston, MA, pp. 173-191.
Mason, R.P., Benoit, J.M., 2003. Organomercury compounds in the Environment. In In: Craig, E.,
John Wiley & Sons (Ed.). Organomettalic compounds in the Environment.
Mason, R.P., Fitzgerald, W.F., 1990. Alkylmercury species in the equatorial Pacific. Nature 347, 457-
459.
Mason, R.P., Fitzgerald, W.F., 1993. The distribution and biogeochemical cycling of mercury in the
equatorial Pacific Ocean. Deep Sea Res. Part I 40, 1897.
186
Mason, R.P., Fitzgerald, W.F., Morel, F.M.M., 1994. The Biogeochemical Cycling of Elemental
Mercury - Anthropogenic Influences. Geochim Cosmochim Ac 58, 3191-3198.
Mason, R.P., Lawson, N.M., Sheu, G.R., 2001. Mercury in the Atlantic Ocean: factors controlling air–
sea exchange of mercury and its distribution in the upper waters. Deep-Sea Research Part II 48, 2829-
2853.
Mason, R.P., Morel, F.M.M., Hemond, H.F., Electric Power Research Institute, P.A.C.A.U.S.,
Environment, C., Atmospheric Environment Service, C., Ontario Hydro, C., State of, F., Department
of Environmental Protection, U.S., Food, U.S., Drug Administration, W.D.C.U.S., Frontier, G.,
Wisconsin Department of Natural Resources, U.S., Health Canada, C., 1995a. The role of
microorganisms in elemental mercury formation in natural waters (English)
Mercury as a global pollutant. International conference (English). Springer, Dordrecht, pp. 775-787.
Mason, R.P., Reinfelder, J.R., Morel, F.M.M., 1995b. Bioaccumulation of mercury and
methylmercury. Water, Air, and Soil Pollution 80, 915-921.
Mason, R.P., Reinfelder, J.R., Morel, F.M.M., 1996. Uptake, Toxicity, and Trophic Transfer of
Mercury in a Coastal Diatom. Environ Sci Technol 30, 1835-1845.
Maurice-Bourgoin, L., Quiroga, I., Chincheros, J., Courau, P., 2000. Mercury distribution in waters
and fishes of the upper Madeira rivers and mercury exposure in riparian Amazonian populations. Sci
Total Environ 260, 73-86.
Maynard, J.L., 1932. The action of mercury on organic iodides I The formation of methylmercury
iodide and benzylmercuric iodide. . J Am Chem Soc 54, 2108 - 2112.
McQuarrie, N., Horton, B.K., Zandt, G., Beck, S., DeCelles, P.G., 2005. Lithospheric evolution of the
Andean fold–thrust belt, Bolivia, and the origin of the central Andean plateau. Tectonophysics 399,
15-37.
Mehrotra, A.S., Sedlak, D.L., 2005. Decrease in net mercury methylation rates following iron
amendment to anoxic wetland sediment slurries (English). Environ Sci Technol 39, 2564-2570.
Meija, J., Ouerdane, L., Mester, Z., 2009. Describing chemical transformations in multiple spiking
isotope dilution : fundamental aspects and definitions (English). Analyst (London. 1877. Print) 134,
466-471.
Meija, J., Yang, L., Caruso, J.A., Mester, Z., 2006. Calculations of double spike isotope dilution
results revisited. JAAS (Journal of Analytical Atomic Spectrometry) 21, 1294.
Meili, M., 1997. Mercury in lakes and rivers, New York: Marcel Dekker Inc.
Michard, J., 2008. Cooperativas Mineras en Bolivia. Formas de organización, producción y
comercialización. Centro de Documentación e Información Bolivia, Cochabamba - Bolivia.
Miller, C.L., Mason, R.P., Gilmour, C.C., Heyes, A., 2007. Influence of dissolved organic matter on
the complexation of mercury under sulfidic conditions. Environ Toxicol Chem 26, 624-633.
Mitchell, C.P.J., Branfireun, B.A., Kolka, R.K., 2008. Assessing sulfate and carbon controls on net
methylmercury production in peatlands; an in situ mesocosm approach. Appl Geochem 23, 503-518.
Mizanur Rahman, G.M., Kingston, H.M.S., 2004. Application of Speciated Isotope Dilution Mass
Spectrometry To Evaluate Extraction Methods for Determining Mercury Speciation in Soils and
Sediments. Anal Chem 76, 3548-3555.
187
Mizanur Rahman, G.M., Skip Kingston, H.M., Bhandari, S., 2003. Synthesis and characterization of
isotopically enriched methylmercury (CH[sup]3[/sup][sub]201[/sub]Hg[sub]+[/sub]) (English). Appl
Organomet Chem 17, 913-920.
MMAyA, 2015. Plan Director de la Cuena del lago Poopó (Resumen). Ministerio de Medio Ambiente
y Agua, Gobierno Autónomo Departamental de Oruro, Programa de Gestión Sostenible de los
Recursos Naturales de la Cuenca del Lago Poopó, Oruro-Bolivia.
Molina, C.I., Ibañez, C., Gibon, F.M., 2012. Proceso de biomagnificación de metales pesados en un
lago hiperhalino (Poopó, Oruro, Bolivia): Posible riesgo en la salud de consumidores. Ecología en
Bolivia [online] 47, 99-118.
Monperrus, M., Gonzalez, P.R., Amouroux, D., Garcia Alonso, J.I., Donard, O.F.X., 2008. Evaluating
the potential and limitations of double-spiking species-specific isotope dilution analysis for the
accurate quantification of mercury species in different environmental matrices. Analytical &
Bioanalytical Chemistry 390, 655-666.
Monperrus, M., Krupp, E., Amouroux, D., Donard, O.F.X., Rodriguez Martin-Doimeadios, R.C.,
2004. Potential and limits of speciated isotope-dilution analysis for metrology and assessing
environmental reactivity (English). TrAC. Trends in analytical chemistry (Regular ed.) 23, 261-272.
Monperrus, M., Point, D., Grall, J., Chauvaud, L., Amouroux, D., Bareille, G., Donard, O., 2005.
Determination of metal and organometal trophic bioaccumulation in the benthic macrofauna of the
Adour estuary coastal zone (SW France, Bay of Biscay). Journal of Environmental Monitoring 7, 693-
700.
Monperrus, M., Tessier, E., Amouroux, D., Leynaert, A., Huonnic, P., Donard, O.F.X., 2007a.
Mercury methylation, demethylation and reduction rates in coastal and marine surface waters of the
Mediterranean Sea. Mar Chem 107, 49-63.
Monperrus, M., Tessier, E., Point, D., Vidimova, K., Amouroux, D., Guyoneaud, R., Leynaert, A.,
Grall, J., Chauvaud, L., Thouzeau, G., Donard, O.F.X., 2007b. The biogeochemistry of mercury at the
sediment-water interface in the Thau Lagoon. 2. Evaluation of mercury methylation potential in both
surface sediment and the water column. Estuar Coast Shelf S 72, 485-496.
Monperrus, M., Tessier, E., Veschambre, S., Amouroux, D., Donard, O., 2005b. Simultaneous
speciation of mercury and butyltin compounds in natural waters and snow by propylation and species-
specific isotope dilution mass spectrometry analysis. Analytical & Bioanalytical Chemistry 381, 854-
862.
Monroy, M., Maceda-Veiga, A., de Sostoa, A., 2014. Metal concentration in water, sediment and four
fish species from Lake Titicaca reveals a large-scale environmental concern. Sci Total Environ 487,
233-244.
Montes de Oca, I., 1989. Geografía y recursos naturales de Bolivia, La Paz.
Montes de Oca, I., 1997. Geografía y recursos naturales de Bolivia. EDOBOL, COBIJA
Morel, F.M.M., Kraepiel, A.M.L., Amyot, M., 1998. The chemical cycle and bioaccumulation of
mercury. Annual Review of Ecology and Systematics 29, 543-566.
Morelli, E., Ferrara, R., Bellini, B., Dini, F., Di Giuseppe, G., Fantozzi, L., 2009. Changes in the non-
protein thiol pool and production of dissolved gaseous mercury in the marine diatom Thalassiosira
weissflogii under mercury exposure. Sci Total Environ 408, 286-293.
Moricz, F., Walder, I., Madai, F., 2009 Geochemical and Mineralogical Characterization of Waste
Material from the Itos Sn-Ag Deposit, Bolivia. . In: Curran Associates, I. (Ed.). 8th International
188
Conference on Acid Rock Drainage (ICARD) and Securing the Future: Mining, Metals & the
Environment in a Sustainable Society 2009 Skelleftea, Sweden.
Moricz, F., Walder, I.F., Madai, F., 2009. Geochemical and mineralogical characterization of waste
material from Itos Sn-Ag deposit, Bolivia. Proceeding of securing the future and 8th ICARD
Skellefteå, Sweden, pp. 525-534.
MosbÆK, H., Tjell, J.C., Sevel, T., 1988. Plant uptake of airborne mercury in background areas
(English). Chemosphere (Oxford) 17, 1227-1236.
Muir, D.C.G., Shearer, R.G., Van Oostdam, J., Donaldson, S.G., Furgal, C., 2005. Contaminants in
Canadian arctic biota and implications for human health : Conclusions and knowledge gaps (English).
Sci Total Environ 351-52, 539-546.
Munthe, J., 1992. The aqueous oxidation of elemental mercury by ozone. Atmos. Environ. 26A, 1461.
Munthe, J., Xiao, Z.F., Lindqvist, O., 1991. The aqueous reduction of divalent mercury by sulfite.
Water Air Soil Pollut. 56, 621.
Murata, K., Sakamoto, M., 2013. Minamata Disease. In: Inc., E. (Ed.). Minamata Disease.
ScienceDirect, Japan, pp. 1-6.
Muresan, B., Cossa, D., Coquery, M., Richard, S., 2008. Mercury sources and transformations in a
man-perturbed tidal estuary: The Sinnamary Estuary, French Guiana. Geochim Cosmochim Ac 72,
5416-5430.
Muresan, B., Cossa, D., Jezequel, D., 2004. Diagenetic mobility of mercury species in the sediment of
a mediterranean lagoon, France. Materials and Geoenvironment 51, 1247-1250.
Muresan, B., Cossa, D., Jezequel, D., Prevot, F., Kerbellec, S., 2007. The biogeochemistry of mercury
at the sediment-water interface in the Thau Lagoon; 1, Partition and speciation. Estuarine, Coastal and
Shelf Science 72, 472-484.
Musante, A.M., 2008. The Role of Mercury Speciation in its Methylation by Methylcobalamin
(Vitamin-B12). Honors thesis Thesis, , . Wheaton College, Norton, Massachusetts.
Nagase, H., Ose, Y., Sato, T., Ishikawa, T., 1982. Methylation of mercury by humic substances in an
aquatic environment. Sci Total Environ 25, 133-142.
Nagase, H., Ose, Y., Sato, T., Ishikawa, T., 1984. Mercury methylation by compounds in humic
material (English). Sci Total Environ 32, 147-156.
Nakamura, I., Hosokawa, K., Tamura, H., Miura, T., 1977. Reduced mercury excretion with feces in
germfree mice after oral administration of methyl mercury chloride. Bulletin Of Environmental
Contamination And Toxicology 17, 528-533.
Norseth, T., Clarkson, T.W., 1971 Intestinal transport of Hg-203-labeled methylmercury chloride:
Role of biotransformation in rats Arch Environ Health 22, 568-577.
NRC, 2000 Toxicological effects of methylmercury. National Academy Press, Washington, DC.
Nriagu, J., Becker, C., 2003. Volcanic emissions of mercury to the atmosphere: global and regional
inventories. Sci. Total Environ. 304, 3.
Nriagu, J.O., 1989. A global assessment of natural sources of atmospheric trace metals. Nature 338,
47-49.
Nriagu, J.O., 1994a. Sci. Total Environ. 154, 1.
189
Nriagu, J.O., 1994b. Mechanistic steps in the photoreduction of mercury in natural waters. Sci Total
Environ 154, 1-8.
Nriagu, J.O., 1994c. Mercury pollution from the past mining of gold and silver in the Americas.
Science of The Total Environment 149, 167-181.
O'Driscoll, N.J., Beauchamp, S., Siciliano, S.D., Rencz, A.N., Lean, D.R.S., 2003. Continuous
analysis of Dissolved Gaseous Mercury (DGM) and mercury flux in two freshwater lakes in
Kejimkujik Park, Nova Scotia: Evaluating mercury flux models with quantitative data (English).
Environ Sci Technol 37, 2226-2235.
O'Driscoll, N.J., Lean, D.R.S., Loseto, L.L., Carignan, R., Siciliano, S.D., 2004. Effect of dissolved
organic carbon on the photoproduction of dissolved gaseous mercury in lakes: Potential impacts of
forestry (English). Environ Sci Technol 38, 2664-2672.
O'Driscoll, N.J., Siciliano, S.D., Lean, D.R.S., Amyot, M., 2006. Gross photoreduction kinetics of
mercury in temperate freshwater lakes and rivers : Application to a general model of DGM dynamics
(English). Environ Sci Technol 40, 837-843.
Oliveira, A.d.S., Bocio, A., Trevilato, T.M.B., Takayanagui, A.M.M., Doming, J.L., Segura-Munoz,
S.I., 2007. Heavy metals in untreated/treated urban effluent and sludge from a biological wastewater
treatment plant. Environ Sci Poll Res 14, 483-489.
Onat, E., 1974. Solubility studies of metallic mercury in pure water at various temperature. J. Inorg.
Nucl. Chem. 36, 2029.
Oremland, R.S., Culbertson, C.W., Winfrey, M.R., 1991. Methylmercury decomposition in sediments
and bacterial cultures : involvement of methanogens and sulfate reducers in oxidative demethylation
(English). Applied and environmental microbiology (Print) 57, 130-137.
Ormachea Muñoz, M., Wern, H., Johnsson, F., Bhattacharya, P., Sracek, O., Thunvik, R., Quintanilla,
J., Bundschuh, J., 2013. Geogenic arsenic and other trace elements in the shallow hydrogeologic
system of Southern Poopó Basin, Bolivian Altiplano. J Hazard Mater 262, 924-940.
Osborn, A.M., Bruce, K.D., Strike, P., Ritchie, D.A., 1997. Distribution, diversity and evolution of the
bacterial mercury resistance (mer) operon. FEMS Microbiology Reviews 19, 239-262.
Ozuah, P.O., 2000. Mercury poisoning. Current Problems In Pediatrics 30, 91-99.
Pak, K.R., Bartha, R., 1998. Mercury methylation and demethylation in anoxic lake sediments and by
strictly anaerobic bacteria. Appl Environ Microb 64, 1013-1017.
Park, S.-Y., Holsen, T.M., Kim, P.-R., Han, Y.-J., 2014. Laboratory investigation of factors affecting
mercury emissions from soils. Environmental Earth Sciences 72, 2711-2721.
Parks, J.M., Johs, A., Podar, M., Bridou, R., Hurt, R.A., Jr., Smith, S.D., Tomanicek, S.J., Qian, Y.,
Brown, S.D., Brandt, C.C., Palumbo, A.V., Smith, J.C., Wall, J.D., Elias, D.A., Liang, L., 2013. The
genetic basis for bacterial mercury methylation. Science (New York, N.Y.) 339, 1332-1335.
Pedrero Zayas, Z., Ouerdane, L., Mounicou, S., Lobinski, R., Monperrus, M., Amouroux, D., 2014.
Hemoglobin as a major binding protein for methylmercury in white-sided dolphin liver. Analytical &
Bioanalytical Chemistry 406, 1121-1129.
Peretyazhko, T., Charlet, L., Muresan, B., Kazimirov, V., Cossa, D., 2006. Formation of dissolved
gaseous mercury in a tropical lake (Petit-Saut reservoir, French Guiana). Sci Total Environ 364, 260-
271.
190
Perez-Jimenez, J.R., Kerkhof, L.J., 2005. Phylogeography of sulfate-reducing bacteria among
disturbed sediments, disclosed by analysis of the dissimilatory sulfite reductase genes (dsrAB)
(English). Applied and environmental microbiology (Print) 71, 1004-1011.
Pillco Zolá, R., Bengtsson, L., 2006. Long-term and extreme water level variations of the shallow
Lake Poopó, Bolivia. Hydrological Sciences Journal 51, 98-114.
Pirrone, N., Cinnirella, S., Feng, X., Finkelman, R.B., Friedli, H.R., Leaner, J., Mason, R., Mukherjee,
A.B., Stracher, G.B., Streets, D.G., Telmer, K., 2010. Global mercury emissions to the atmosphere
from anthropogenic and natural sources. Atmos. Chem. Phys. 10, 5951-5964.
Pirrone, N., Keeler, G.J., Nriagu, J.O., 1996. Regional differences in worldwide emissions of mercury
to the atmosphere. Atmos Environ 30, 2981-2987.
PNUE, P.d.N.U.p.l.E.S.C., 2005. Evaluation Mondiale du Mercure. Genève, Suisse, pp. 1-292.
Podar, M., Gilmour, C.C., Brandt, C.C., Soren, A., Brown, S.D., Crable, B.R., Palumbo, A.V.,
Somenahally, A.C., Elias, D.A., 2015. Global prevalence and distribution of genes and
microorganisms involved in mercury methylation. Science Advances 1, e1500675-e1500675.
Point, D., Davis, W.C., Ignacio Garcia Alonso, J., Monperrus, M., Christopher, S.J., Donard, O.F.X.,
Becker, P.R., Wise, S.A., 2007a. Simultaneous determination of inorganic mercury, methylmercury,
and total mercury concentrations in cryogenic fresh-frozen and freeze-dried biological reference
materials (English). Analytical And Bioanalytical Chemistry 389, 787-798.
Point, D., Monperrus, M., Tessier, E., Amouroux, D., Chauvaud, L., Thouzeau, G., Jean, F., Amice,
E., Grall, J., Leynaert, A., Clavier, J., Donard, O.F.X., 2007b. Biological control of trace metal and
organometal benthic fluxes in a eutrophic lagoon (Thau Lagoon, Mediterranean Sea, France).
Estuarine, Coastal and Shelf Science 72, 457-471.
Poissant, L., Zhang, H.H., Canario, J., Constant, P., 2008. Critical review of mercury fates and
contamination in the arctic tundra ecosystem. Sci Total Environ 400, 173-211.
Pongratz, R., Heumann, K.G., 1999. Production of methylated mercury, lead, and cadmium by marine
bacteria as a significant natural source for atmospheric heavy metals in polar regions. Chemosphere
39, 89-102.
Poulain, A.J., Amyot, M., Findlay, D., Telor, S., Barkay, T., Hintelmann, H., 2004. Biological and
Photochemical Production of Dissolved Gaseous Mercury in a Boreal Lake. The American Society of
Limnology and Oceanography, p. 2265.
Poulain, A.J., Barkay, T., 2013. Cracking the Mercury Methylation Code. Science 339, 1280.
Pourang, N., Dennis, J.H., Ghourchian, H., 2004. Tissue Distribution and Redistribution of Trace
Elements in Shrimp Species with the Emphasis on the Roles of Metallothionein. Ecotoxicology 13,
519-533.
PPO-9607, 1996. Aspectos Ambientales de los Metales y Metaloides en el Sitema Hidrológico del
Desaguadero. Ministerio de Desarrollo Sostenible y Medio Ambiente, Secretaría Nacional de Minería,
Swedish Geological AB, Oruro, Bolivia, pp. 1-42.
PPO-9612, 1996. Impacto de la Minería y el Procesamiento de Minerales en los cursos de agua y
lagos. Ministerio de Desarrollo Sostenible y Medio Ambiente, Secretaría Nacional de Minería,
Swedish Geological AB, Oruro, Bolivia, pp. 1-119.
Pyhtilä, H., Perämäki, P., Piispanen, J., Niemelä, M., Suoranta, T., Starr, M., Nieminen, T., Kantola,
M., Ukonmaanaho, L., 2012. Development and optimization of a method for detecting low mercury
191
concentrations in humic-rich natural water samples using a CV-ICP-MS technique. Microchemical
Journal 103, 165-169.
Pyle, D.M., Mather, T.A., 2003. The importance of volcanic emissions for the global atmospheric
mercury cycle. Atmos Environ 37, 5115-5124.
Qianggong, Z., Ke, P., Shichang, K., Aijia, Z., Wen-Xiong, W., 2014. Mercury in Wild Fish from
High-Altitude Aquatic Ecosystems in the Tibetan Plateau. Environ Sci Technol 48, 5220-5228.
Queipo Abad, S., Rodríguez-González, P., García Alonso, J.I., 2016. Evidence of the direct adsorption
of mercury in human hair during occupational exposure to mercury vapour. Journal Of Trace Elements
In Medicine And Biology: Organ Of The Society For Minerals And Trace Elements (GMS) 36, 16-21.
Quiroga, E.R., 2002. The case of artisanal mining in Bolivia: Local participatory development and
mining investment opportunities. Natural Resources Forum 26 127-139.
Qvarnström, J., Qiang, T., Frech, W., Lüdke, C., 2000. Flow injection-liquid chromatography-cold
vapour atomic absorption spectrometry for rapid determination of methyl and inorganic mercury.
Analyst, 1193.
Rea, A.W., Lindberg, S.E., Scherbatskoy, T., Keeler, G.J., 2002. Mercury Accumulation in Foliage
over Time in Two Northern Mixed-Hardwood Forests. Water, Air, and Soil Pollution 133, 49-67.
Reaney, D., 1981. Translocatable resistance to mercuric and phenylmercuric ions in soil bacteria. J.
Bacteriol., 1110.
Regnell, O., Hammar, T., 2004. Coupling of methyl and total mercury in a minerotrophic peat bog in
southeastern Sweden. Canadian Journal of Fisheries & Aquatic Sciences 61, 2014.
Reisinger, K., Stoeppler, M., Weber, J.H., 1985. Methylation of mercury (II) by fulvic acid.
Environmental Technology Letters 6, 203.
Renzoni, A., Zino, F., Franchi, E., 1998. Mercury Levels along the Food Chain and Risk for Exposed
Populations. Environ Res 77, 68-72.
Ribeiro Guevara, S., Bubach, D., Arribére, M., 2004. Mercury in lichens of Nahuel Huapi National
Park, Patagonia, Argentina. Journal of Radioanalytical & Nuclear Chemistry 261, 679-687.
Ribeiro Guevara, S., Catán, S.P., Marvin-DiPasquale, M., 2009. Benthic methylmercury production in
lacustrine ecosystems of Nahuel Huapi National Park, Patagonia, Argentina. Chemosphere 77, 471-
477.
Ribeiro Guevara, S., Massaferro, J., Villarosa, G., Arribére, M., Rizzo, A., 2002. Heavy Metal
Contamination in Sediments of Lake Nahuel Huapi, Nahuel Huapi National Park, Northern Patagonia,
Argentina. Water, Air, and Soil Pollution 137, 21-44.
Ribeiro Guevara, S., Meili, M., Rizzo, A., Daga, R., Arribére, M., 2010. Sediment records of highly
variable mercury inputs to mountain lakes in Patagonia during the past millennium. Atmos. Chem.
Phys. 10, 3443-3453.
Ribeiro Guevara, S., Queimaliños, C.P., Diéguez, M.d.C., Arribére, M., 2008. Methylmercury
production in the water column of an ultraoligotrophic lake of Northern Patagonia, Argentina.
Chemosphere 72, 578-585.
Rizzo, A., Arcagni, M., Arribére, M.A., Bubach, D., Guevara, S.R., 2011. Mercury in the biotic
compartments of Northwest Patagonia lakes, Argentina. Chemosphere 84, 70-79.
192
Rizzo, A., Arcagni, M., Campbell, L., Koron, N., Pavlin, M., Arribére, M.A., Horvat, M., Ribeiro
Guevara, S., 2014. Source and trophic transfer of mercury in plankton from an ultraoligotrophic
lacustrine system (Lake Nahuel Huapi, North Patagonia). Ecotoxicology 23, 1184-1194.
Robinson, J.B., Tuovinen, O.H., 1984. Mechanisms of microbial resistance and detoxification of
mercury and organomercury compounds: physiological, biochemical, and genetic analyses.
Microbiological Reviews 48, 95-124.
Rodgers, J.S., Hocker, J.R., Hanas, R.J., Nwosu, E.C., Hanas, J.S., 2001. Mercuric ion inhibition of
eukaryotic transcription factor binding to DNA1. Biochemical Pharmacology 61, 1543-1550.
Rodríguez-González, P., Bouchet, S., Monperrus, M., Tessier, E., Amouroux, D., 2013. In situ
experiments for element species-specific environmental reactivity of tin and mercury compounds
using isotopic tracers and multiple linear regression. Environ Sci Pollut Res Int 20, 1269-1280.
Rodríguez-González, P., Monperrus, M., García Alonso, J.I., Amouroux, D., Donard, O.F.X., 2007.
Comparison of different numerical approaches for multiple spiking species-specific isotope dilution
analysis exemplified by the determination of butyltin species in sediments. JAAS (Journal of
Analytical Atomic Spectrometry) 22, 1373.
Rodriguez-Gonzalez, P., Rodriguez-Cea, A., Garcia Alonso, J.I., Sanz-Medel, A., 2005. Species-
specific isotope dilution analysis and isotope pattern deconvolution for butyltin compounds
metabolism investigations (English). Analytical chemistry (Washington, DC) 77, 7724-7734.
Rodriguez Gonzalez, P., Encinar, J.R., Alonso, J.I.G., Sanz Medel, A., 2004. Development of a triple
spike methodology for validation of butyltin compounds speciation analysis by isotope dilution mass
spectrometry: Part I. Synthesis of the spike, characterisation and development of the mathematical
equations (English). Journal of analytical atomic spectrometry (Print) 19, 685-691.
Rodriguez Martin-Doimeadios, R.C., Stoichev, T., Krupp, E., Amouroux, D., Holeman, M., Donard,
O.F.X., 2002. Micro-scale preparation and characterization of isotopically enriched
monomethylmercury (English). Appl Organomet Chem 16, 610-615.
Rodriguez Martin-Doimeadios, R.C., Tessier, E., Amouroux, D., Guyoneaud, R., Duran, R., Caumette,
P., Donard, O.F.X., 2004. Mercury methylation/demethylation and volatilization pathways in estuarine
sediment slurries using species-specific enriched stable isotopes. Mar Chem 90, 107-123.
Rolfhus, K.R., Fitzgerald, W.F., 2004. Mechanisms and temporal variability of dissolved gaseous
mercury production in coastal seawater. Mar Chem 90, 125-136.
Rosenkranz, B., Bettmer, J., Buscher, W., Breer, C., Cammann, K., 1997. The behaviour of different
organometallic compounds in the presence of inorganic mercury(II) : Transalkylation of mercury
species and their analysis by the GC-MIP-PED system (English). Appl Organomet Chem 11, 721-725.
Rötting, T., Amezaga, J., Younger, P., Jimenez, P., Talavera, C., Quintanilla, J., Oyarzún, R., Soto, G.,
2009. Catchment Management and Mining Impacts in Arid and Semi-Arid South America
(CAMINAR): Case studies in Peru, Bolivia and Chile1.
Roulet, M., Lucotte, M., 1995. Geochemistry of mercury in pristine and flooded ferralitic soils of a
tropical rain forest in French Guiana, South America. Water, Air & Soil Pollution 80, 1079.
Roulet, M., Lucotte, M., Farella, N., Serique, G., Coelho, H., Sousa Passos, C.J., da Silva, E.d.J., de
Andrade, P.S., Mergler, D., Guimaraes, J.R.D., Amorim, M., 1999. Effects of recent human
colonization on the presence of mercury in Amazonian ecosystems. Water, Air and Soil Pollution 112,
297-313.
193
Rowley, B., Monestier, M., 2005. Mechanisms of heavy metal-induced autoimmunity. Molecular
Immunology 42, 833-838.
Ruiz Encinar, J., Rodriguez Gonzalez, P., García Alonso, J.I., Sanz-Medel, A., 2002. Evaluation of
extraction techniques for the determination of butyltin compounds in sediments using isotope dilution-
GC/ICPMS with 118Sn and 119Sn-enriched species. Anal Chem 74, 270-281.
Sanchez Uria, J.E., Sanz-Medel, A., 1998. Inorganic and methylmercury speciation in environmental
samples (English). Talanta (Oxford) 47, 509-524.
Sanemasa, I., 1975. The solubility of elemental mercury vapor in water. Bull. Chem. Soc. Jpn. 48,
1795.
Schaefer, J.K., Jane, Y., Reinfelder, J.R., Cardona, T., Ellickson, K.M., Tel-Or, S., Barkay, T., 2004.
Role of the Bacterial Organomercury Lyase (MerB) in Controlling Methylmercury Accumulation in
Mercury-Contaminated Natural Waters. Environ Sci Technol 38, 4304-4311.
Schaefer, J.K., Letowski, J., Barkay, T., 2002. mer-Mediated Resistance and Volatilization of Hg(II)
Under Anaerobic Conditions. Geomicrobiology Journal 19, 87-102.
Schäfer, J., Castelle, S., Blanc, G., Dabrin, A., Masson, M., Lanceleur, L., Bossy, C., 2010. Mercury
methylation in the sediments of a macrotidal estuary (Gironde Estuary, south-west France). Estuarine,
Coastal and Shelf Science 90, 80-92.
Schlüter, K., 2000. Review: evaporation of mercury from soils. An integration and synthesis of current
knowledge. Environ Geol 39, 249-271.
Schmeltz, D., Evers, D.C., Driscoll, C.T., Artz, R., Cohen, M., Gay, D., Haeuber, R., Krabbenhoft,
D.P., Mason, R., Morris, K., Wiener, J.G., 2011. MercNet: a national monitoring network to assess
responses to changing mercury emissions in the United States. Ecotoxicology 20, 1713-1725.
Schroeder, W.H., 1982. Sampling and Analysis of Mercury and its Compounds in the Atmosphere.
Env. Sci. Technol. 16 394.
Schroeder, W.H., Munthe, J., 1998. Atmospheric mercury: an overview. Atmos. Environ. 32, 809.
Schuster, E., 1991. The behavior of the mercury in the soil with special emphasis on complexation and
adsorption processes; a review of the literature. Water, Air and Soil Pollution 56, 667-680.
Schuster, P.F., Krabbenhoft, D.F., Naftz, D.L., Cecil, L.D., Olson, M.L., 2002. Atmospheric mercury
deposition during the last 270 years: a glacial ice core record of natural and anthropogenic sources.
Environ. Sci. Technol. 36, 2303.
Selin, N.E., 2009. Global Biogeochemical Cycling of Mercury: A Review. Annual Review of
Environment & Resources 34, 43-63.
Selin, N.E., Jacob, D.J., Yantosca, R.M., Strode, S., Jaeglé, L., Sunderland, E.M., 2008. Global 3-D
land-ocean-atmosphere model for mercury: present-day versus preindustrial cycles and anthropogenic
enrichment factors for deposition. Glob. Biogeochem. Cycles 22, GB2011.
Sellers, P., Kelly, C.A., Rudd, J.W.M., MacHutchon, A.R., 1996. Photodegradation of methylmercury
in lakes. Nature [London] 380, 694-697.
Senesil, G.S., Baldassarre, G., Senesi, N., Radina, B., 1999. Trace element inputs into soils by
anthropogenic activities and implications for human health. Chemosphere 39, 343-377.
194
Sharif, A., Monperrus, M., Tessier, E., Amouroux, D., 2013. Determination of methyl mercury and
inorganic mercury in natural waters at the pgL-1 level: Intercomparison between PT-GC-Pyr-AFS and
GC-ICP-MS using Ethylation or Propylation derivatization. E3S Web of Conferences. EDP Sciences.
Sharif, A., Monperrus, M., Tessier, E., Bouchet, S., Pinaly, H., Rodriguez-Gonzalez, P., Maron, P.,
Amouroux, D., 2014. Fate of mercury species in the coastal plume of the Adour River estuary (Bay of
Biscay, SW France). Sci Total Environ 496, 701-713.
Shi, J., Feng, W., Wang, M., Zhang, F., Li, B., Wang, B., Zhu, M., Chai, Z., 2007. Investigation of
mercury-containing proteins by enriched stable isotopic tracer and size-exclusion chromatography
hyphenated to inductively coupled plasma-isotope dilution mass spectrometry. Anal Chim Acta 583,
84-91.
Siciliano, S.D., O'Driscoll, N.J., Lean, D.R.S., 2002. Microbial reduction and oxidation of mercury in
freshwater lakes (English). Environ Sci Technol 36, 3064-3068.
Sillitoe, H.R., Steele, B.G., Thompson, H.J.F., Lang, R.J., 1998. Advanced argillic lithocaps in the
Bolivian tin-silver belt. Mineralium Deposita 33, 539-546.
Skogerboe, R.K., Wilson, S.A., 1981. Reduction of ionic species by fulvic acid. Anal Chem 53 228-
232.
Skyllberg, U., 2012. Chemical speciation of mercury in soil and sediment. In: Liu, G., Cai, Y.,
O'Driscoll, N. (Eds.). Environmental chemistry and toxicology of mercury. John Wiley & Sons, Inc.,
Hoboken, New Jersey, 219-258.
Slemr, F., Schuster, G., Seiler, W., 1985. Distribution, speciation, and budget of atmospheric mercury.
J Atmos Chem 3, 407-434.
Sloof, W., van, P.B., Annema, J.A., Janus, J.A., 1995. Integrated criteria document mercury.
Spangler, W.J., Spigarelli, J.L., Rose, J.M., Flippin, R.S., Miller, H.H., 1973. Degradation of
methylmercury by bacteria isolated from environmental samples. Applied Microbiology 25, 488-493.
Sprovieri, F., Pirrone, N., 2005. Mercury pollution in the Arctic and Antarctic regions. Springer
Science and Business Media : New York, NY, United States, United States, pp. 679-706.
Stahl, D., 1999. Unexpected population distribution in a microbial mat community: Sulfate-reducing
bacteria localized to the highly oxic chemocline in contrast to a eukaryotic preference for anoxia. Appl
Environ Microb.
Stein, E.D., Cohen, Y., Winer, A.M., 1996. Environmental distribution and transformation of mercury
compounds. Critical Reviews in Environmental Science & Technology 26, 1.
Sun, R., Sonke, J.E., Liu, G., 2016. Biogeochemical controls on mercury stable isotope compositions
of world coal deposits: A review. Earth-Science Reviews 152, 1-13.
Sunderland, E.M., Cohen, M.D., Selin, N.E., Chmura, G.L., 2008. Reconciling models and
measurements to assess trends in atmospheric mercury deposition. Environ Pollut 156, 526-535.
Sunderland, E.M., Gobas, F.A.P.C., Branfireun, B.A., Heyes, A., 2006. Environmental controls on the
speciation and distribution of mercury in coastal sediments. Mar Chem 102, 111-123.
Sunderland, E.M., Krabbenhoft, D.P., Moreau, J.W., Strode, S.A., Landing, W.M., 2009. Mercury
sources, distribution, and bioavailability in the North Pacific Ocean: Insights from data and models.
Global Biogeochem Cy 23, n/a-n/a.
195
Sunderland, E.M., Mason, R.P., 2007. Human impacts on open ocean mercury concentrations. Global
Biogeochem Cy 21.
Tahan, J.E., Granadillo, V.A., Sanchez, J.M., Cubillan, H.S., Romero, R.A., 1993. Mineralization of
biological materials prior to determination of total mercury by cold vapour atomic absorption
spectrometry (English). Journal of analytical atomic spectrometry (Print) 8, 1005-1010.
Tang, R., Wang, H., Luo, J., Sun, S., Gong, Y., She, J., Chen, Y., Dandan, Y., Zhou, J., 2015. Spatial
distribution and temporal trends of mercury and arsenic in remote timberline coniferous forests,
eastern of the Tibet Plateau, China. Environmental Science And Pollution Research International 22,
11658-11668.
Tapia, J., Audry, S., 2013. Control of early diagenesis processes on trace metal (Cu, Zn, Cd, Pb and U)
and metalloid (As, Sb) behaviors in mining- and smelting-impacted lacustrine environments of the
Bolivian Altiplano. Appl Geochem 31, 60-78.
Tapia, J., Audry, S., Townley, B., Duprey, J.L., 2012. Geochemical background, baseline and origin of
contaminants from sediments in the mining-impacted Altiplano and Eastern Cordillera of Oruro,
Bolivia. Geochemistry - Exploration, Environment, Analysis 12, 3-20.
Teisinger, J., Fiserova-Bergerova, V., 1965. PULMONARY RETENTION AND EXCRETION OF
MERCURY VAPORS IN MAN. Industrial Medicine & Surgery 34, 580-584.
Thompson, L.G., Mosley-Thompson, E., Bolzan, J.F., Koci, B.R., 1985. A 1500-Year Record of
Tropical Precipitation in Ice Cores from the Quelccaya Ice Cap, Peru. Science 229, 971-973.
Tian, W., Egeland, G.M., Sobol, I., Chan, H.M., 2011. Mercury hair concentrations and dietary
exposure among Inuit preschool children in Nunavut, Canada. Environment International 37, 42-48.
Tseng, C.M., Lamborg, C., Fitzgerald, W.F., Engstrom, D.R., 2004. Cycling of dissolved elemental
mercury in Arctic Alaskan lakes. Geochim Cosmochim Ac 68, 1173-1184.
Tunell, G., 1978 Abundance in igneous rocks and average abundances in Earth's crust Handbook of
Geochemistry, pp. E1-3.
Turekian, K.K., Wedepohl, K.H., 1961. Distribution of the elements in some major units of the Earth's
crust. Geological Society of America Bulletin 72, 175-191.
Turneaure, F.S., 1960. A comparative study of major ore deposits of central Bolivia. Economic
Geology and the Bulletin of the Society of Economic Geologists 55, 217-254.
Ullrich, S.M., Tanton, T.W., Abdrashitova, S.A., 2001. Mercury in the aquatic environment; a review
of factors affecting methylation. Critical Reviews in Environmental Science and Technology 31, 241-
293.
UNEP, 1996. Diagnóstico Ambiental del Sistema Titicaca-Desaguadero-Poopó-Salar de Coipasa
(Sistema TDPS) Bolivia-Perú. División de Aguas Continentales Programa de las Naciones Unidas
para el Medio Ambiente
UNEP, 2002. Global Mercury Assessment.
UNEP, 2013a. Global Mercury Assessment 2013: Sources, Emissions, Releases and Environmental
Transport. UNEP Chemicals Branch, Geneva, Switzerland.
UNEP, 2013b. Minamata Convention on Mercury. pp. 1-59.
Urano, T., Iwasaki, A., Himeno, S., 1990 Absorption of methylmercury compounds from rat intestine
Toxcol Lett 50 159-164.
196
USEPA, 1997. Mercury Report to Congress Office of Air Quality and Standards
Environmental Protection Agency, Washington, DC, US.
USEPA, 2001. Water Quality Criterion for the Protection of Human Health: Methyl Mercury.
Environmental Protection Agency Washington, DC, US.
USEPA, Method 1631. Mercury in Water by Oxidation, Purge and Trap, and Cold Vapor Atomic
Fluorescence
Spectrometry. Washington, DC.
USEPA, Method 7471B. Mercury in solid or semisolid waste (Manual cold-vapor technique). EPA.
USGS and GEOBOL, U.S.G.S.a.S.G.d.B., 1992. Geologyand Mineral Resources of the Altiplano and
Cordillera Occidental, Bolivia. USGS Bulletin: 1975, 365.
Varekamp, J.C., Buseck, P.R., 1984. The speciation of mercury in hydrothermal systems, with
applications to ore deposition. Geochim Cosmochim Ac 48, 177-185.
Varekamp, J.C., Buseck, P.R., 1986. Global mercury flux from volcanic and geothermal sources.
Appl. Geochem. 1, 65.
Vaughan, P.P., Blough, N.V., 1998. Photochemical formation of hydroxyl radical by constituents of
natural waters. Environmental Science and Technology, 2947.
Veiga, M.M., Baker, R.F., 2005. Protocols for Environmental and Health Assessment of Mercury
Released by Artisanal and Small-Scale Gold Miners. Global Mercury Project UNIDO, Vienna
International Center, Vienna, Austria.
Villafañe, V.E., Helbling, E.W., 2003. Radiación ultravioleta solar en el lago Titicaca, Bolivia:
Efectos y adaptación de los organismos planctónicos La radiación ultravioleta en Bolivia, La Paz,
Bolivia, pp. 85-98.
Wagemann, R., Innes, S., Richard, P.R., 1996. Overview and regional and temporal differences of
heavy metals in Arctic whales and ringed seals in the Canadian Arctic (English)
International Conference on Marine Mammals and the Marine Environment (English). Elsevier
Science, Shannon, pp. 41-66.
Wang, C., Ci, Z., Wang, Z., Zhang, X., Guo, J., 2016. Speciated atmospheric mercury in the marine
boundary layer of the Bohai Sea and Yellow Sea. Atmos Environ 131, 360-370.
Wang, S., Zhang, M., Li, B., Xing, D., Wang, X., Wei, C., Jia, Y., 2012. Comparison of mercury
speciation and distribution in the water column and sediments between the algal type zone and the
macrophytic type zone in a hypereutrophic lake (Dianchi Lake) in Southwestern China. Sci Total
Environ 417-418, 204-213.
Wang, Z., Zhang, X., Xiao, J., Zhijia, C., Yu, P., 2009. Mercury fluxes and pools in three subtropical
forested catchments, southwest China. Environ Pollut 157, 801-808.
Warner, K.A., Roden, E.E., Bonzongo, J.-C., 2003. Microbial mercury transformation in anoxic
freshwater sediments under iron-reducing and other electron-accepting conditions (English). Environ
Sci Technol 37, 2159-2165.
Watras, C.J., Back, R.C., Halvorsen, S., Hudson, R.J.M., Morrison, K.A., Wente, S.P., 1998.
Bioaccumulation of mercury in pelagic freshwater food webs (English). Sci Total Environ 219, 183-
208.
Weber, J.H., 1993. Review of possible paths for abiotic methylation of mercury(II) in the aquatic
environment (English). Chemosphere (Oxford) 26, 2063-2077.

197
Weber, J.H., Evans, R., Jones, S.H., Hines, M.E., 1998. Conversion of mercury(II) into mercury(0),
monomethylmercury cation, and dimethylmercury in saltmarsh sediment slurries (English).
Chemosphere (Oxford) 36, 1669-1687.
Webster, J.G., Swedlund, P.J., Webster, K.S., 1998. Trace metal adsorption onto an acid mine
drainage iron (III) oxy hydroxy sulfate. Environ Sci Technol 32, 1361-1368.
Weihe, P., 1994. Human milk as a source of methylmercury exposure in infants. Environ Health
Persp, 74.
Whalin, L., Kim, E.-H., Mason, R., 2007. Factors influencing the oxidation, reduction, methylation
and demethylation of mercury species in coastal waters. Mar Chem 107, 278-294.
Whalin, L.M., Mason, R.P., 2006. A new method for the investigation of mercury redox chemistry in
natural waters utilizing deflatable Teflon® bags and additions of isotopically labeled mercury. Anal
Chim Acta 558, 211-221.
WHO, 1990. Environmental Health Criteria 101. International Programme on Chemical Safety:
Methylmercury.
WHO, 2008. Guidance for identifying populations at risk from mercury exposure. Geneva,
Switzerland.
Wiatrowski, H.A., Ward, P.M., Barkay, T., 2006. Novel reduction of mercury(II) by mercury-sensitive
dissimilatory metal reducing bacteria (English). Environ Sci Technol 40, 6690-6696.
Wilhelm, S.M., 2001. Estimate of Mercury Emissions to the Atmosphere from Petroleum. Environ Sci
Technol 35, 4704.
Winch, S., Mills, H.J., Kostka, J.E., Fortin, D., Lean, D.R.S., 2009. Identification of sulfate-reducing
bacteria in methylmercury-contaminated mine tailings by analysis of SSU rRNA genes. Fems
Microbiol Ecol 68, 94-107.
Winch, S., Praharaj, T., Fortin, D., Lean, D.R.S., 2008. Factors affecting methylmercury distribution
in surficial, acidic, base-metal mine tailings (English). Sci Total Environ 392, 242-251.
Windmöller, C.C., JúniorDurão, W.A., de Oliveira, A., do Valle, C.M., 2015. The redox processes in
Hg-contaminated soils from Descoberto (Minas Gerais, Brazil): Implications for the mercury cycle.
Ecotoxicology & Environmental Safety 112, 201-211.
Wood, J.M., Kennedy, F.S., Rosen, C.G., 1968. Synthesis of Methyl-mercury Compounds by Extracts
of a Methanogenic Bacterium. Nature 220, 173-174.
Wright, N., Yeoman, W.B., Carter, G.F., 1980. Originally published as Volume 1, Issue
8161MASSIVE ORAL INGESTION OF ELEMENTAL MERCURY WITHOUT POISONING. The
Lancet 315, 206.
Wu, L., Zheng, C., Ma, Q., Hu, C., Hou, X., 2007. Chemical Vapor Generation for Determination of
Mercury by Inductively Coupled Plasma Mass Spectrometry. Applied Spectroscopy Reviews 42, 79.
Xiao, Z., Munthe, J., Str6mberg, D., Lindqvist, O., 1994 In: Inc., L.P. (Ed.). Mercury as a Global
Pollutant Wartas and Huckbee(Fxls), MI, USA.
Xiao, Z.F., Munthe, J., Schroeder, W.H., Lindqvist, O., 1991. Vertical fluxes of volatile mercury over
forest soil and lake surfaces in Sweden. Tellus 43, 267.
198
Xie, H., Li, J., Zhang, C., Tian, Z., Liu, X., Tang, C., Han, Y., Liu, W., 2014. Assessment of heavy
metal contents in surface soil in the Lhasa-Shigatse-Nam Co area of the Tibetan Plateau, China.
Bulletin Of Environmental Contamination And Toxicology 93, 192-198.
Yee, N., Barkay, T., Parikh, M., Lin, C.-C., Wiatrowski, H., Das, S., 2010. Biotic/abiotic pathways of
Hg(II) reduction by dissimilatory iron reducing bacteria. Abstracts with Programs - Geological Society
of America 42, 178-178.
Yole, M., Wickstrom, M., Blakley, B., 2007. Cell death and cytotoxic effects in YAC-1 lymphoma
cells following exposure to various forms of mercury. Toxicology 231, 40-57.
Yorifuji, T., Tsuda, T., Inoue, S., Takao, S., Harada, M., 2011. Long-term exposure to methylmercury
and psychiatric symptoms in residents of Minamata, Japan. Environment International 37, 907-913.
Yu, Z., Li, J., Li, Y., Wang, Q., Zhai, X., Wu, G., Liu, P., Li, X., 2014. A mer operon confers mercury
reduction in a Staphylococcus epidermidis strain isolated from Lanzhou reach of the Yellow River.
International Biodeterioration & Biodegradation 90, 57-63.
Yudovich, Y.E., Ketris, M.P., 2005. Mercury in coal: a review. Part 2. Coal use and environmental
problems (English). International journal of coal geology 62, 135-165.
Zaratti, F., Forno, R.N., Garcia Fuentes, J., Andrade, M.F., 2003. Erythemally weighted UV variations
at two high-altitude locations. Journal of Geophysical Research 108, ACH5-ACH1-6.
Zhang, H., Lindberg, S.E., 2001. Sunlight and iron(III)-induced photochemical production of
dissolved gaseous mercury in freshwater. Environ Sci Technol 35, 928-935.
Zhang, Q., Pan, K., Kang, S., Zhu, A., Wang, W.-X., 2014. Mercury in wild fish from high-altitude
aquatic ecosystems in the Tibetan Plateau. Environ Sci Technol 48, 5220-5228.
Zhang, Y.-R., Tong, X.U.E., Wang, R.-Q., Dai, J.-L., 2013. FTIR Spectroscopic Structural
Characterization of Forest Topsoil Humic Substances and Their Adsorption and Desorption for
Mercury (English). Soil science 178, 436-441.
Zheng, W., 2009. Biogeochemical cycle of mercury in typical basins,Tibet. Institute of Tibetan
Plateau Research Chinese Academy of Science, Beijing, China.
Zheng, W., Liang, L., Gu, B., 2012. Mercury Reduction and Oxidation by Reduced Natural Organic
Matter in Anoxic Environments. Environ Sci Technol 46, 292-299.
199
Anexos
200
Información suplementaria 1 : Capítulo II
201
Información suplementaria 1: Capítulo II
Synergistic effects of mining and urban effluents on the level and
distribution of methylHg in a shallow aquatic ecosystem of the
Bolivian Altiplano
Authors: L. Alanoca, S. Guédron, D. Amouroux, S. Audry, M. Monperus, E. Tessier, S.
Goix, D. Acha, P. Seyler and D. Point.
Supplementary information 1 (SI. 1):
Sampling and analytical protocols (QA/QC)
Sample processing, analytical protocols and quality assurance and quality control (QA/QC)
Table SI.1. Mean concentrations and standard deviation (SD) for the analyzed certified
reference material PACS-2 with recoveries (%) related to the certified values (National
Research Council of Canada).
Details for diffusive Hg fluxes calculation
Supplementary information 2 (S.I. 2):
SI.2 Table 1. Mean concentrations ± standard deviation (SD), data range
concentrations presented as minimum (min.) and maximum (max.) concentrations, n =
number of samples analyzed for physico-chemical analysis of surface water of Lake UruUru,
collected in the late dry season (October 2010) and wet season (may 2011).
SI.2 Table 2. Mean concentrations ± standard deviation (SD), data range
concentrations presented as minimum (min.) and maximum (max.) concentrations, n =
number of samples analyzed for Hg speciation (F and UNF refer to filtered and unfiltered
analysis for total Hg (THg) and monomethylHg (MMHg); DMHg and DGM refer to
dimethylHg and dissolved gaseous Hg, respectively) analysis of surface water of Lake
UruUru, collected in the late dry season (October 2010) and wet season (may 2011).
SI.2 Table 3. Mean concentrations ± standard deviation (SD), data range
concentrations presented as minimum (min.) and maximum (max.) concentrations, n =
number of samples analyzed for chemical analysis of surface sediments (0 – 2 cm) of Lake
Uru-Uru, collected in the late dry season (October 2010) and wet season (may 2011).

202
Supplementary information 3 (SI. 3)
SI.3 Table 1. Physico-chemical characteristics and filtered major elemental
concentrations measured in surface water of Lake Uru-Uru, collected during the late dry (D)
and wet (W) season (October 2010 and May 2011, respectively).
SI.3 Table 2. A and B. Filtered trace elemental concentrations (µg L-1) measured in
surface water of Lake Uru-Uru, collected during the late dry (D – TableSI.3.2.A) and wet (W–
TableSI.3.2.B) season (October 2010 and May 2011, respectively).
SI.3 Table 2. C. Filtered Hg species (F and UNF refer to filtered and unfiltered
analysis for total Hg (THg) and monomethylHg (MMHg); DMHg and DGM refer to
dimethylHg and dissolved gaseous Hg, respectively) concentrations measured in surface
water of Lake Uru-Uru, collected during the late dry (D) and wet (W) season (October 2010
and May 2011, respectively).
SI.3 Table 2. D. Hg species (total Hg (THg), inorganic Hg (iHg), monomethyl Hg
(MMHg)), Total and organic carbon (TC and OC, respectively) and total sulfur (S)
concentrations measured in surface sediment (0 - 2cm) of Lake Uru-Uru, collected during the
late dry (D) and wet (W) season (October 2010 and May 2011, respectively).
SI.3 Table 2. E. Filtered Hg species (total Hg (THg), inorganic Hg (iHg),
monomethylHg (MMHg)) concentrations measured in surface sediment pore waters (0 – 2
cm) of Lake Uru-Uru, collected during the late dry (D) and wet (W) season (October 2010
and May 2011, respectively).
SI.3 Table 2. F 1 and 2. Major and trace metal concentrations measured in surface
sediment (0 – 2 cm) of Lake Uru-Uru, collected during the late dry (D - Table SI.3.2F1) and
wet (W – Table SI.3.2F2) season.
Supplementary information 4 (SI. 4)
Linear Regressions for surface sediment concentrations of THg versus W and, Sb.
203
Supplementary information 1 (S.I. 1)
Sampling and Analytical protocols
Water sample processing
To determine the content of dissolved and total Hg species, 100 mL of filtered and unfiltered
samples werestored in Teflon PFA flasks (Nalgene, USA) and acidified with HCl Ultrex
(Baker) to 1% v/v. Some of the filtered samples were acidified with HNO3 Ultrex (Baker) to
1% v/v in order to analyze heavy metals/cations, and others were treated with H3PO4 bi-
distilled to 2% v/v to determine dissolved organic carbon (DOC) content. All samples were
stored at 4°C for transportation and further analysis in the laboratory. A final set of the
filtered samples was frozen for the analysis of anions.
To ensure that the samples were not contaminated, the materials used in the sampling and the
conservation flasks were subjected to prior cleaning treatment. The PFA Teflon,
Polypropylene and Pyrex glass flasks and PVDF filters were cleaned using successive acid
bathsand dried under a laminar flow hood, while the gold traps were burned at 600°C. Each of
the clean materials was kept in three hermetically sealed ziplock bags until they were used in
the field.
Gaseous species were collected in situ from bulk water samples immediately purged
(generally within ~0.5 h after sampling) and collected on a gold–coated sand (Brooks Rand®)
and activated Charcoal (Carbotrap®) traps, respectively.
Analytical protocols
Hg species analysis in water, sediment and biological substrates were performed by capillary
gas chromatography connected to an inductively coupled plasma mass spectrometer (GC-
ICPMS, Trace). Analytical set-up and methodology for the GC-ICPMS for Hg speciation
analysis are described in detail in (Monperrus et al., 2005b, 2008). The MMHg extraction
from sediments was achieved with a focused microwave method (4 minutes, 80W, CEM)
from 200 mg of sediment in 7 mL of a 6 N HNO3 (HNO3, 65 %, Fluka) and remaining
particles were removed by centrifugation. The extracts were analyzed by species-specific
isotope dilution and GC-ICPMS (Trace GC, ThermoFisher) hyphenated to inductively
coupled plasma mass spectrometer (ICPMS, X Serie 2, ThermoFisher) to correct for species
inter-conversion if necessary. Briefly, the extracts were buffered at pH 4 and isotopic enriched
Hg species 199IHg and 201MMHg were then added. Species were then ethylated with sodium
tetraethyl borate and recovered in iso-octane. Each sample was injected three times and
blanks were checked to control for contamination. The measurement error was less than 10 %
and the accuracy of the MMHg measurements was checked by analyzing the certified
reference materials (CRM) IAEA-405 and IAEA - 433. Recoveries of MMHg to the CRMs
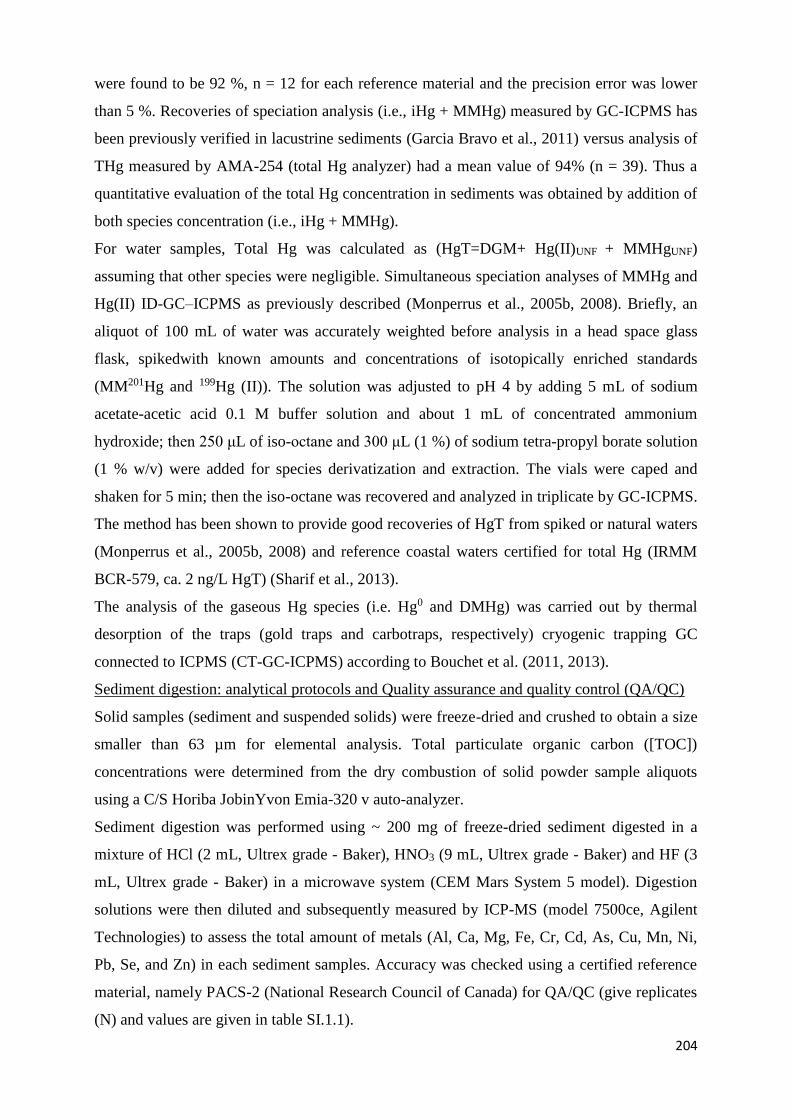
204
were found to be 92 %, n = 12 for each reference material and the precision error was lower
than 5 %. Recoveries of speciation analysis (i.e., iHg + MMHg) measured by GC-ICPMS has
been previously verified in lacustrine sediments (Garcia Bravo et al., 2011) versus analysis of
THg measured by AMA-254 (total Hg analyzer) had a mean value of 94% (n = 39). Thus a
quantitative evaluation of the total Hg concentration in sediments was obtained by addition of
both species concentration (i.e., iHg + MMHg).
For water samples, Total Hg was calculated as (HgT=DGM+ Hg(II)UNF + MMHgUNF)
assuming that other species were negligible. Simultaneous speciation analyses of MMHg and
Hg(II) ID-GC–ICPMS as previously described (Monperrus et al., 2005b, 2008). Briefly, an
aliquot of 100 mL of water was accurately weighted before analysis in a head space glass
flask, spikedwith known amounts and concentrations of isotopically enriched standards
(MM201Hg and 199Hg (II)). The solution was adjusted to pH 4 by adding 5 mL of sodium
acetate-acetic acid 0.1 M buffer solution and about 1 mL of concentrated ammonium
hydroxide; then 250 μL of iso-octane and 300 μL (1 %) of sodium tetra-propyl borate solution
(1 % w/v) were added for species derivatization and extraction. The vials were caped and
shaken for 5 min; then the iso-octane was recovered and analyzed in triplicate by GC-ICPMS.
The method has been shown to provide good recoveries of HgT from spiked or natural waters
(Monperrus et al., 2005b, 2008) and reference coastal waters certified for total Hg (IRMM
BCR-579, ca. 2 ng/L HgT) (Sharif et al., 2013).
The analysis of the gaseous Hg species (i.e. Hg0 and DMHg) was carried out by thermal
desorption of the traps (gold traps and carbotraps, respectively) cryogenic trapping GC
connected to ICPMS (CT-GC-ICPMS) according to Bouchet et al. (2011, 2013).
Sediment digestion: analytical protocols and Quality assurance and quality control (QA/QC)
Solid samples (sediment and suspended solids) were freeze-dried and crushed to obtain a size
smaller than 63 µm for elemental analysis. Total particulate organic carbon ([TOC])
concentrations were determined from the dry combustion of solid powder sample aliquots
using a C/S Horiba JobinYvon Emia-320 v auto-analyzer.
Sediment digestion was performed using ~ 200 mg of freeze-dried sediment digested in a
mixture of HCl (2 mL, Ultrex grade - Baker), HNO3 (9 mL, Ultrex grade - Baker) and HF (3
mL, Ultrex grade - Baker) in a microwave system (CEM Mars System 5 model). Digestion
solutions were then diluted and subsequently measured by ICP-MS (model 7500ce, Agilent
Technologies) to assess the total amount of metals (Al, Ca, Mg, Fe, Cr, Cd, As, Cu, Mn, Ni,
Pb, Se, and Zn) in each sediment samples. Accuracy was checked using a certified reference
material, namely PACS-2 (National Research Council of Canada) for QA/QC (give replicates
(N) and values are given in table SI.1.1).
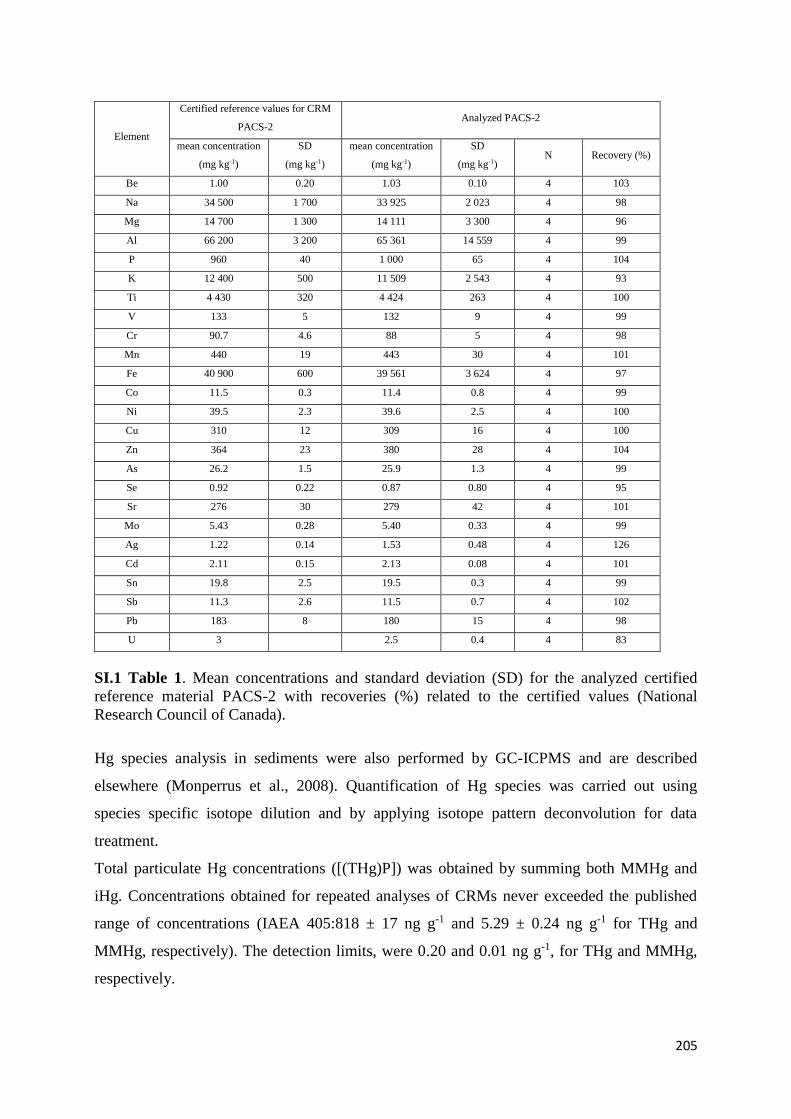
205
Element
Certified reference values for CRM
PACS-2 Analyzed PACS-2
mean concentration
(mg kg-1)
SD
(mg kg-1)
mean concentration
(mg kg-1)
SD
(mg kg-1) N Recovery (%)
Be 1.00 0.20 1.03 0.10 4 103
Na 34 500 1 700 33 925 2 023 4 98
Mg 14 700 1 300 14 111 3 300 4 96
Al 66 200 3 200 65 361 14 559 4 99
P 960 40 1 000 65 4 104
K 12 400 500 11 509 2 543 4 93
Ti 4 430 320 4 424 263 4 100
V 133 5 132 9 4 99
Cr 90.7 4.6 88 5 4 98
Mn 440 19 443 30 4 101
Fe 40 900 600 39 561 3 624 4 97
Co 11.5 0.3 11.4 0.8 4 99
Ni 39.5 2.3 39.6 2.5 4 100
Cu 310 12 309 16 4 100
Zn 364 23 380 28 4 104
As 26.2 1.5 25.9 1.3 4 99
Se 0.92 0.22 0.87 0.80 4 95
Sr 276 30 279 42 4 101
Mo 5.43 0.28 5.40 0.33 4 99
Ag 1.22 0.14 1.53 0.48 4 126
Cd 2.11 0.15 2.13 0.08 4 101
Sn 19.8 2.5 19.5 0.3 4 99
Sb 11.3 2.6 11.5 0.7 4 102
Pb 183 8 180 15 4 98
U 3 2.5 0.4 4 83
SI.1 Table 1. Mean concentrations and standard deviation (SD) for the analyzed certified
reference material PACS-2 with recoveries (%) related to the certified values (National
Research Council of Canada).
Hg species analysis in sediments were also performed by GC-ICPMS and are described
elsewhere (Monperrus et al., 2008). Quantification of Hg species was carried out using
species specific isotope dilution and by applying isotope pattern deconvolution for data
treatment.
Total particulate Hg concentrations ([(THg)P]) was obtained by summing both MMHg and
iHg. Concentrations obtained for repeated analyses of CRMs never exceeded the published
range of concentrations (IAEA 405:818 ± 17 ng g-1 and 5.29 ± 0.24 ng g-1 for THg and
MMHg, respectively). The detection limits, were 0.20 and 0.01 ng g-1, for THg and MMHg,
respectively.
206
Diffusive Hg fluxes calculation
Diffusive fluxes (Jsed) calculations are performed using the Fick’s first law:
Jsed = -ϕDsed(∂C/∂z),
where Dsed is the diffusion coefficient corrected for temperature and tortuosity, ϕ is porosity
(= 71 and 93 % for the Norther and Southern part of the Lake, respectively (Tapia and Audry,
2013) assuming an average sediment density of 2.65 g cm3 and measured water content, and
∂C/∂z is the linear concentration gradient across the water–sediment interface. Values for
Dsed(Dsed = D0/ θ2 expressed in cm2 s-1) were calculated on the basis of a dimension less
tortuosity (θ2) and the diffusion coefficient in free solutions (D0) being equal to 1.2*10-5 and
6*10-6 for Hg and MeHg, respectively (Guédron et al., 2012).
The linear concentration gradient across the water–sediment interface (∂C/∂z) was calculated
from the difference between PW and SW, based on the hypothesis that this shallow water
column is well homogenized. Finally, positive Jsed indicate an upward-directed flux (efflux
from the sediment into the overlying water column and negative Jsed indicate a downward-
directed flux (influx from the water column into the sediment).
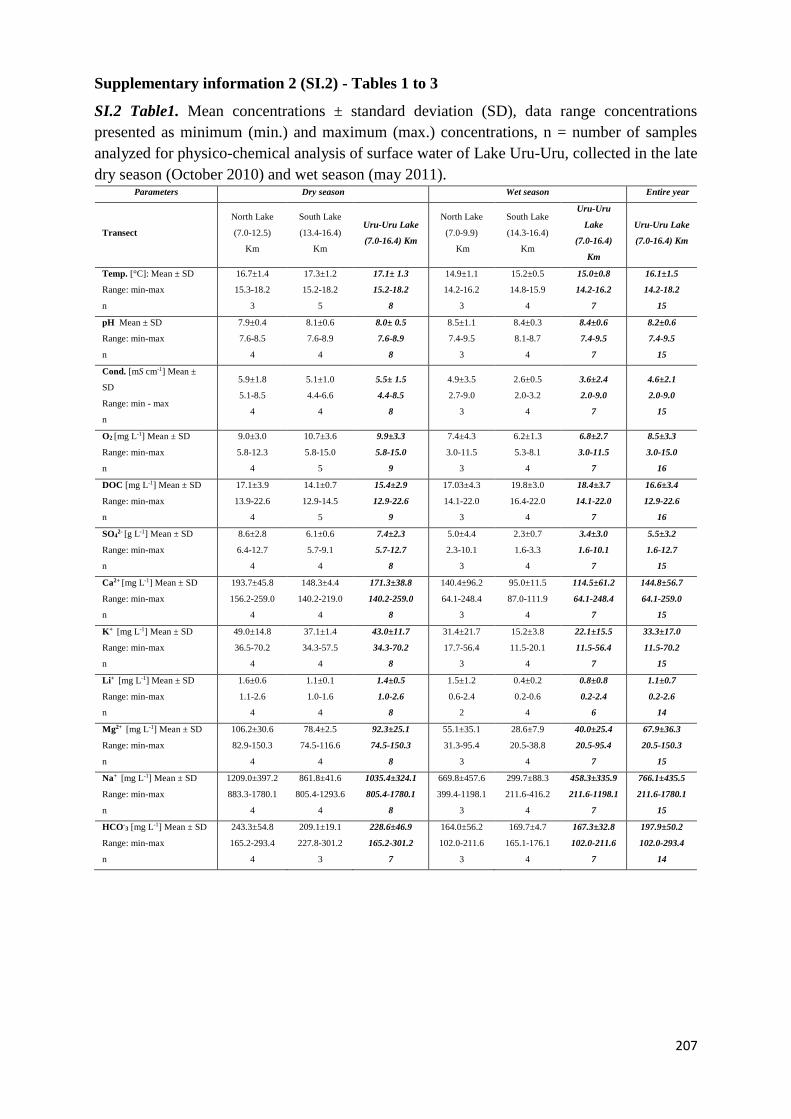
207
Supplementary information 2 (SI.2) - Tables 1 to 3
SI.2 Table1. Mean concentrations ± standard deviation (SD), data range concentrations
presented as minimum (min.) and maximum (max.) concentrations, n = number of samples
analyzed for physico-chemical analysis of surface water of Lake Uru-Uru, collected in the late
dry season (October 2010) and wet season (may 2011). Parameters Dry season Wet season Entire year
Transect
North Lake
(7.0-12.5)
Km
South Lake
(13.4-16.4)
Km
Uru-Uru Lake
(7.0-16.4) Km
North Lake
(7.0-9.9)
Km
South Lake
(14.3-16.4)
Km
Uru-Uru
Lake
(7.0-16.4)
Km
Uru-Uru Lake
(7.0-16.4) Km
Temp. [°C]: Mean ± SD
Range: min-max
n
16.7±1.4
15.3-18.2
3
17.3±1.2
15.2-18.2
5
17.1± 1.3
15.2-18.2
8
14.9±1.1
14.2-16.2
3
15.2±0.5
14.8-15.9
4
15.0±0.8
14.2-16.2
7
16.1±1.5
14.2-18.2
15
pH Mean ± SD
Range: min-max
n
7.9±0.4
7.6-8.5
4
8.1±0.6
7.6-8.9
4
8.0± 0.5
7.6-8.9
8
8.5±1.1
7.4-9.5
3
8.4±0.3
8.1-8.7
4
8.4±0.6
7.4-9.5
7
8.2±0.6
7.4-9.5
15
Cond. [mS cm-1] Mean ±
SD
Range: min - max
n
5.9±1.8
5.1-8.5
4
5.1±1.0
4.4-6.6
4
5.5± 1.5
4.4-8.5
8
4.9±3.5
2.7-9.0
3
2.6±0.5
2.0-3.2
4
3.6±2.4
2.0-9.0
7
4.6±2.1
2.0-9.0
15
O2 [mg L-1] Mean ± SD
Range: min-max
n
9.0±3.0
5.8-12.3
4
10.7±3.6
5.8-15.0
5
9.9±3.3
5.8-15.0
9
7.4±4.3
3.0-11.5
3
6.2±1.3
5.3-8.1
4
6.8±2.7
3.0-11.5
7
8.5±3.3
3.0-15.0
16
DOC [mg L-1] Mean ± SD
Range: min-max
n
17.1±3.9
13.9-22.6
4
14.1±0.7
12.9-14.5
5
15.4±2.9
12.9-22.6
9
17.03±4.3
14.1-22.0
3
19.8±3.0
16.4-22.0
4
18.4±3.7
14.1-22.0
7
16.6±3.4
12.9-22.6
16
SO42- [g L-1] Mean ± SD
Range: min-max
n
8.6±2.8
6.4-12.7
4
6.1±0.6
5.7-9.1
4
7.4±2.3
5.7-12.7
8
5.0±4.4
2.3-10.1
3
2.3±0.7
1.6-3.3
4
3.4±3.0
1.6-10.1
7
5.5±3.2
1.6-12.7
15
Ca2+ [mg L-1] Mean ± SD
Range: min-max
n
193.7±45.8
156.2-259.0
4
148.3±4.4
140.2-219.0
4
171.3±38.8
140.2-259.0
8
140.4±96.2
64.1-248.4
3
95.0±11.5
87.0-111.9
4
114.5±61.2
64.1-248.4
7
144.8±56.7
64.1-259.0
15
K+ [mg L-1] Mean ± SD
Range: min-max
n
49.0±14.8
36.5-70.2
4
37.1±1.4
34.3-57.5
4
43.0±11.7
34.3-70.2
8
31.4±21.7
17.7-56.4
3
15.2±3.8
11.5-20.1
4
22.1±15.5
11.5-56.4
7
33.3±17.0
11.5-70.2
15
Li+ [mg L-1] Mean ± SD
Range: min-max
n
1.6±0.6
1.1-2.6
4
1.1±0.1
1.0-1.6
4
1.4±0.5
1.0-2.6
8
1.5±1.2
0.6-2.4
2
0.4±0.2
0.2-0.6
4
0.8±0.8
0.2-2.4
6
1.1±0.7
0.2-2.6
14
Mg2+ [mg L-1] Mean ± SD
Range: min-max
n
106.2±30.6
82.9-150.3
4
78.4±2.5
74.5-116.6
4
92.3±25.1
74.5-150.3
8
55.1±35.1
31.3-95.4
3
28.6±7.9
20.5-38.8
4
40.0±25.4
20.5-95.4
7
67.9±36.3
20.5-150.3
15
Na+ [mg L-1] Mean ± SD
Range: min-max
n
1209.0±397.2
883.3-1780.1
4
861.8±41.6
805.4-1293.6
4
1035.4±324.1
805.4-1780.1
8
669.8±457.6
399.4-1198.1
3
299.7±88.3
211.6-416.2
4
458.3±335.9
211.6-1198.1
7
766.1±435.5
211.6-1780.1
15
HCO-3 [mg L-1] Mean ± SD
Range: min-max
n
243.3±54.8
165.2-293.4
4
209.1±19.1
227.8-301.2
3
228.6±46.9
165.2-301.2
7
164.0±56.2
102.0-211.6
3
169.7±4.7
165.1-176.1
4
167.3±32.8
102.0-211.6
7
197.9±50.2
102.0-293.4
14
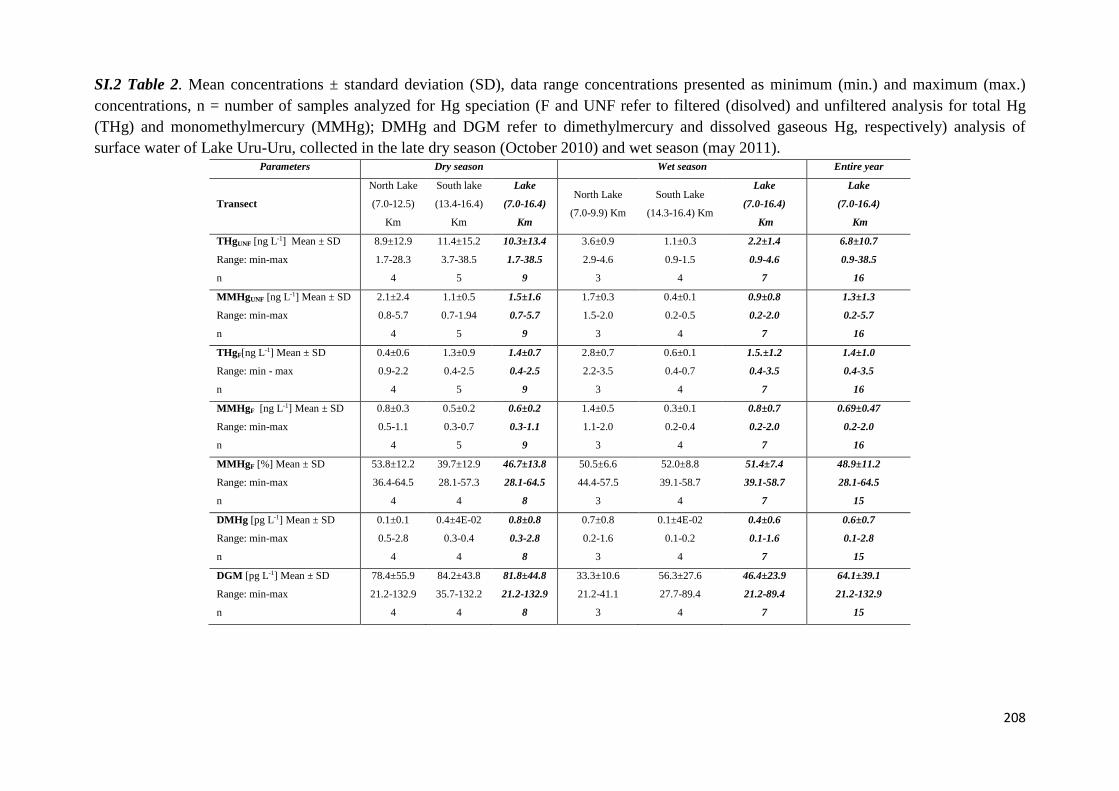
208
SI.2 Table 2. Mean concentrations ± standard deviation (SD), data range concentrations presented as minimum (min.) and maximum (max.)
concentrations, n = number of samples analyzed for Hg speciation (F and UNF refer to filtered (disolved) and unfiltered analysis for total Hg
(THg) and monomethylmercury (MMHg); DMHg and DGM refer to dimethylmercury and dissolved gaseous Hg, respectively) analysis of
surface water of Lake Uru-Uru, collected in the late dry season (October 2010) and wet season (may 2011). Parameters Dry season Wet season Entire year
Transect
North Lake
(7.0-12.5)
Km
South lake
(13.4-16.4)
Km
Lake
(7.0-16.4)
Km
North Lake
(7.0-9.9) Km
South Lake
(14.3-16.4) Km
Lake
(7.0-16.4)
Km
Lake
(7.0-16.4)
Km
THgUNF [ng L-1] Mean ± SD
Range: min-max
n
8.9±12.9
1.7-28.3
4
11.4±15.2
3.7-38.5
5
10.3±13.4
1.7-38.5
9
3.6±0.9
2.9-4.6
3
1.1±0.3
0.9-1.5
4
2.2±1.4
0.9-4.6
7
6.8±10.7
0.9-38.5
16
MMHgUNF [ng L-1] Mean ± SD
Range: min-max
n
2.1±2.4
0.8-5.7
4
1.1±0.5
0.7-1.94
5
1.5±1.6
0.7-5.7
9
1.7±0.3
1.5-2.0
3
0.4±0.1
0.2-0.5
4
0.9±0.8
0.2-2.0
7
1.3±1.3
0.2-5.7
16
THgF[ng L-1] Mean ± SD
Range: min - max
n
0.4±0.6
0.9-2.2
4
1.3±0.9
0.4-2.5
5
1.4±0.7
0.4-2.5
9
2.8±0.7
2.2-3.5
3
0.6±0.1
0.4-0.7
4
1.5.±1.2
0.4-3.5
7
1.4±1.0
0.4-3.5
16
MMHgF [ng L-1] Mean ± SD
Range: min-max
n
0.8±0.3
0.5-1.1
4
0.5±0.2
0.3-0.7
5
0.6±0.2
0.3-1.1
9
1.4±0.5
1.1-2.0
3
0.3±0.1
0.2-0.4
4
0.8±0.7
0.2-2.0
7
0.69±0.47
0.2-2.0
16
MMHgF [%] Mean ± SD
Range: min-max
n
53.8±12.2
36.4-64.5
4
39.7±12.9
28.1-57.3
4
46.7±13.8
28.1-64.5
8
50.5±6.6
44.4-57.5
3
52.0±8.8
39.1-58.7
4
51.4±7.4
39.1-58.7
7
48.9±11.2
28.1-64.5
15
DMHg [pg L-1] Mean ± SD
Range: min-max
n
0.1±0.1
0.5-2.8
4
0.4±4E-02
0.3-0.4
4
0.8±0.8
0.3-2.8
8
0.7±0.8
0.2-1.6
3
0.1±4E-02
0.1-0.2
4
0.4±0.6
0.1-1.6
7
0.6±0.7
0.1-2.8
15
DGM [pg L-1] Mean ± SD
Range: min-max
n
78.4±55.9
21.2-132.9
4
84.2±43.8
35.7-132.2
4
81.8±44.8
21.2-132.9
8
33.3±10.6
21.2-41.1
3
56.3±27.6
27.7-89.4
4
46.4±23.9
21.2-89.4
7
64.1±39.1
21.2-132.9
15
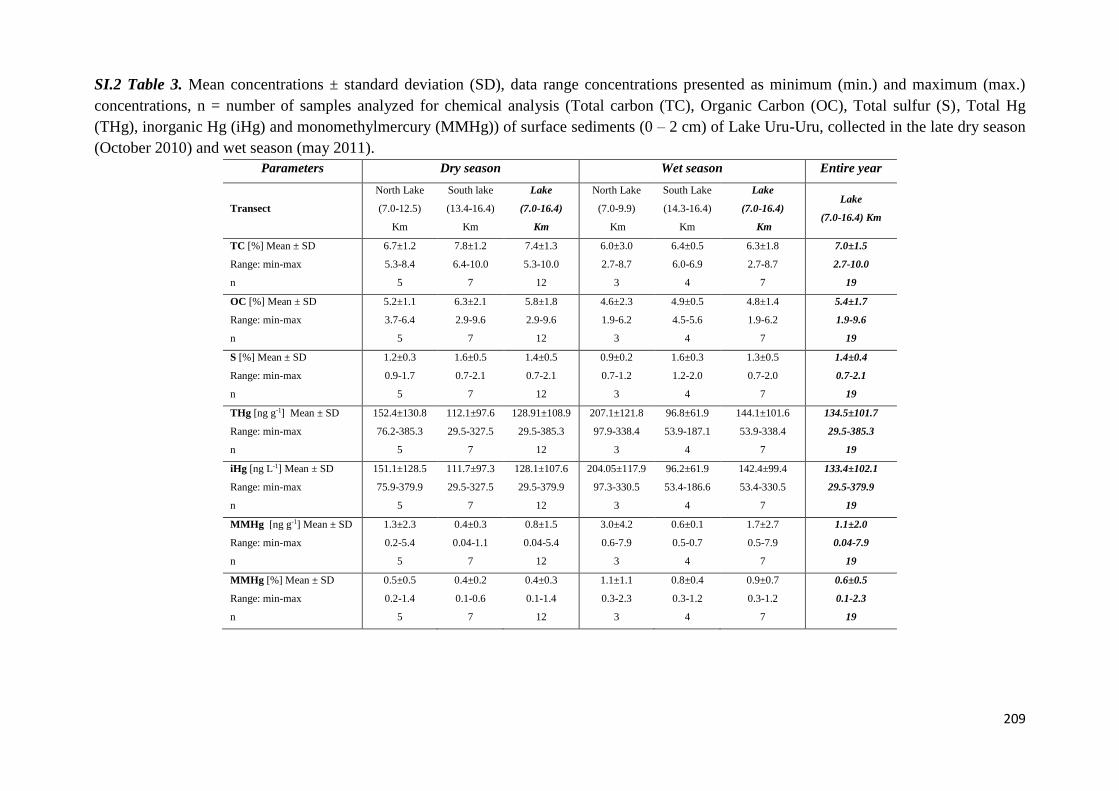
209
SI.2 Table 3. Mean concentrations ± standard deviation (SD), data range concentrations presented as minimum (min.) and maximum (max.)
concentrations, n = number of samples analyzed for chemical analysis (Total carbon (TC), Organic Carbon (OC), Total sulfur (S), Total Hg
(THg), inorganic Hg (iHg) and monomethylmercury (MMHg)) of surface sediments (0 – 2 cm) of Lake Uru-Uru, collected in the late dry season
(October 2010) and wet season (may 2011).
Parameters Dry season Wet season Entire year
Transect
North Lake
(7.0-12.5)
Km
South lake
(13.4-16.4)
Km
Lake
(7.0-16.4)
Km
North Lake
(7.0-9.9)
Km
South Lake
(14.3-16.4)
Km
Lake
(7.0-16.4)
Km
Lake
(7.0-16.4) Km
TC [%] Mean ± SD
Range: min-max
n
6.7±1.2
5.3-8.4
5
7.8±1.2
6.4-10.0
7
7.4±1.3
5.3-10.0
12
6.0±3.0
2.7-8.7
3
6.4±0.5
6.0-6.9
4
6.3±1.8
2.7-8.7
7
7.0±1.5
2.7-10.0
19
OC [%] Mean ± SD
Range: min-max
n
5.2±1.1
3.7-6.4
5
6.3±2.1
2.9-9.6
7
5.8±1.8
2.9-9.6
12
4.6±2.3
1.9-6.2
3
4.9±0.5
4.5-5.6
4
4.8±1.4
1.9-6.2
7
5.4±1.7
1.9-9.6
19
S [%] Mean ± SD
Range: min-max
n
1.2±0.3
0.9-1.7
5
1.6±0.5
0.7-2.1
7
1.4±0.5
0.7-2.1
12
0.9±0.2
0.7-1.2
3
1.6±0.3
1.2-2.0
4
1.3±0.5
0.7-2.0
7
1.4±0.4
0.7-2.1
19
THg [ng g-1] Mean ± SD
Range: min-max
n
152.4±130.8
76.2-385.3
5
112.1±97.6
29.5-327.5
7
128.91±108.9
29.5-385.3
12
207.1±121.8
97.9-338.4
3
96.8±61.9
53.9-187.1
4
144.1±101.6
53.9-338.4
7
134.5±101.7
29.5-385.3
19
iHg [ng L-1] Mean ± SD
Range: min-max
n
151.1±128.5
75.9-379.9
5
111.7±97.3
29.5-327.5
7
128.1±107.6
29.5-379.9
12
204.05±117.9
97.3-330.5
3
96.2±61.9
53.4-186.6
4
142.4±99.4
53.4-330.5
7
133.4±102.1
29.5-379.9
19
MMHg [ng g-1] Mean ± SD
Range: min-max
n
1.3±2.3
0.2-5.4
5
0.4±0.3
0.04-1.1
7
0.8±1.5
0.04-5.4
12
3.0±4.2
0.6-7.9
3
0.6±0.1
0.5-0.7
4
1.7±2.7
0.5-7.9
7
1.1±2.0
0.04-7.9
19
MMHg [%] Mean ± SD
Range: min-max
n
0.5±0.5
0.2-1.4
5
0.4±0.2
0.1-0.6
7
0.4±0.3
0.1-1.4
12
1.1±1.1
0.3-2.3
3
0.8±0.4
0.3-1.2
4
0.9±0.7
0.3-1.2
7
0.6±0.5
0.1-2.3
19
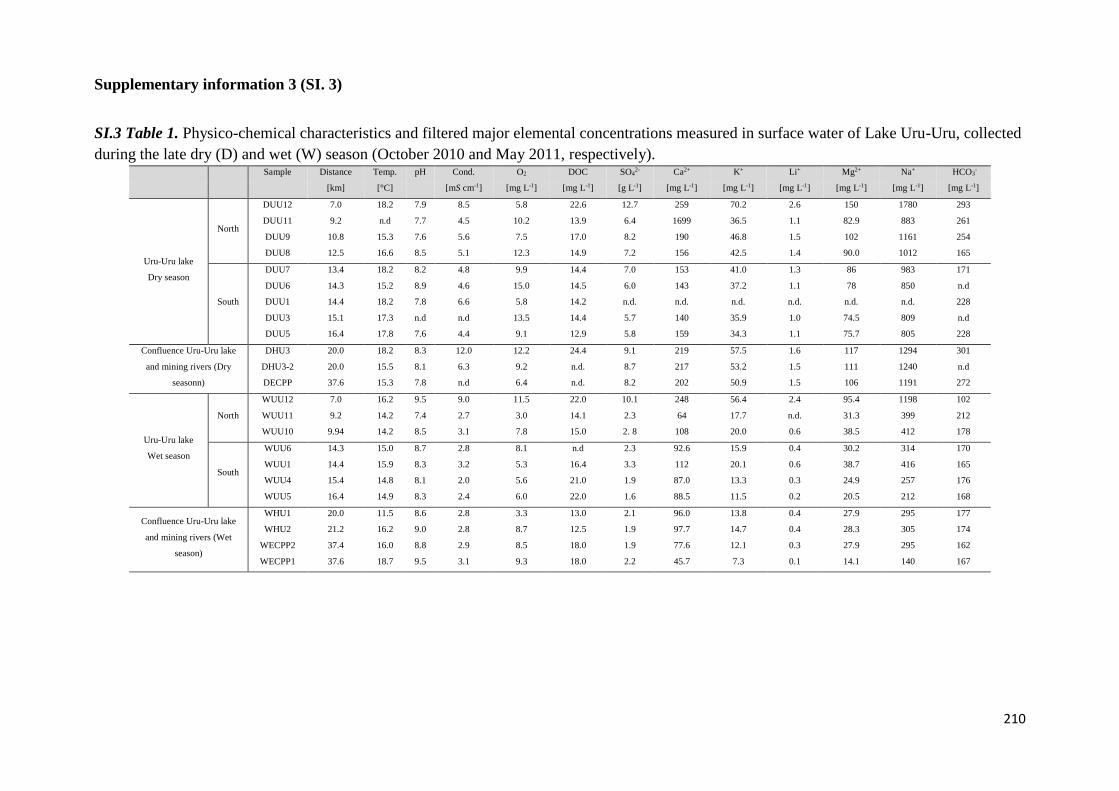
210
Supplementary information 3 (SI. 3)
SI.3 Table 1. Physico-chemical characteristics and filtered major elemental concentrations measured in surface water of Lake Uru-Uru, collected
during the late dry (D) and wet (W) season (October 2010 and May 2011, respectively). Sample Distance Temp. pH Cond. O2 DOC SO4
2- Ca2+ K+ Li+ Mg2+ Na+ HCO3-
[km] [°C] [mS cm-1] [mg L-1] [mg L-1] [g L-1] [mg L-1] [mg L-1] [mg L-1] [mg L-1] [mg L-1] [mg L-1]
Uru-Uru lake
Dry season
North
DUU12 7.0 18.2 7.9 8.5 5.8 22.6 12.7 259 70.2 2.6 150 1780 293
DUU11 9.2 n.d 7.7 4.5 10.2 13.9 6.4 1699 36.5 1.1 82.9 883 261
DUU9 10.8 15.3 7.6 5.6 7.5 17.0 8.2 190 46.8 1.5 102 1161 254
DUU8 12.5 16.6 8.5 5.1 12.3 14.9 7.2 156 42.5 1.4 90.0 1012 165
South
DUU7 13.4 18.2 8.2 4.8 9.9 14.4 7.0 153 41.0 1.3 86 983 171
DUU6 14.3 15.2 8.9 4.6 15.0 14.5 6.0 143 37.2 1.1 78 850 n.d
DUU1 14.4 18.2 7.8 6.6 5.8 14.2 n.d. n.d. n.d. n.d. n.d. n.d. 228
DUU3 15.1 17.3 n.d n.d 13.5 14.4 5.7 140 35.9 1.0 74.5 809 n.d
DUU5 16.4 17.8 7.6 4.4 9.1 12.9 5.8 159 34.3 1.1 75.7 805 228
Confluence Uru-Uru lake
and mining rivers (Dry
seasonn)
DHU3 20.0 18.2 8.3 12.0 12.2 24.4 9.1 219 57.5 1.6 117 1294 301
DHU3-2 20.0 15.5 8.1 6.3 9.2 n.d. 8.7 217 53.2 1.5 111 1240 n.d
DECPP 37.6 15.3 7.8 n.d 6.4 n.d. 8.2 202 50.9 1.5 106 1191 272
Uru-Uru lake
Wet season
North
WUU12 7.0 16.2 9.5 9.0 11.5 22.0 10.1 248 56.4 2.4 95.4 1198 102
WUU11 9.2 14.2 7.4 2.7 3.0 14.1 2.3 64 17.7 n.d. 31.3 399 212
WUU10 9.94 14.2 8.5 3.1 7.8 15.0 2. 8 108 20.0 0.6 38.5 412 178
South
WUU6 14.3 15.0 8.7 2.8 8.1 n.d 2.3 92.6 15.9 0.4 30.2 314 170
WUU1 14.4 15.9 8.3 3.2 5.3 16.4 3.3 112 20.1 0.6 38.7 416 165
WUU4 15.4 14.8 8.1 2.0 5.6 21.0 1.9 87.0 13.3 0.3 24.9 257 176
WUU5 16.4 14.9 8.3 2.4 6.0 22.0 1.6 88.5 11.5 0.2 20.5 212 168
Confluence Uru-Uru lake
and mining rivers (Wet
season)
WHU1 20.0 11.5 8.6 2.8 3.3 13.0 2.1 96.0 13.8 0.4 27.9 295 177
WHU2 21.2 16.2 9.0 2.8 8.7 12.5 1.9 97.7 14.7 0.4 28.3 305 174
WECPP2 37.4 16.0 8.8 2.9 8.5 18.0 1.9 77.6 12.1 0.3 27.9 295 162
WECPP1 37.6 18.7 9.5 3.1 9.3 18.0 2.2 45.7 7.3 0.1 14.1 140 167
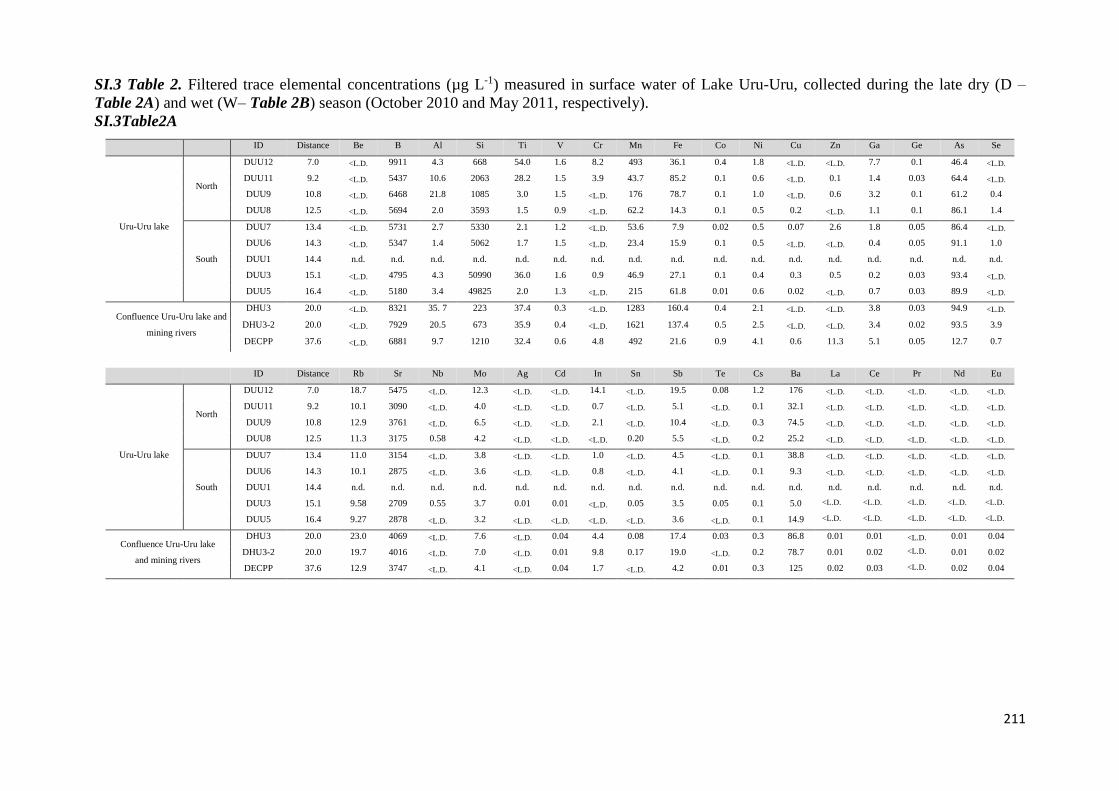
211
SI.3 Table 2. Filtered trace elemental concentrations (µg L-1) measured in surface water of Lake Uru-Uru, collected during the late dry (D –
Table 2A) and wet (W– Table 2B) season (October 2010 and May 2011, respectively).
SI.3Table2A
ID Distance Be B Al Si Ti V Cr Mn Fe Co Ni Cu Zn Ga Ge As Se
Uru-Uru lake
North
DUU12 7.0 <L.D. 9911 4.3 668 54.0 1.6 8.2 493 36.1 0.4 1.8 <L.D. <L.D. 7.7 0.1 46.4 <L.D.
DUU11 9.2 <L.D. 5437 10.6 2063 28.2 1.5 3.9 43.7 85.2 0.1 0.6 <L.D. 0.1 1.4 0.03 64.4 <L.D.
DUU9 10.8 <L.D. 6468 21.8 1085 3.0 1.5 <L.D. 176 78.7 0.1 1.0 <L.D. 0.6 3.2 0.1 61.2 0.4
DUU8 12.5 <L.D. 5694 2.0 3593 1.5 0.9 <L.D. 62.2 14.3 0.1 0.5 0.2 <L.D. 1.1 0.1 86.1 1.4
South
DUU7 13.4 <L.D. 5731 2.7 5330 2.1 1.2 <L.D. 53.6 7.9 0.02 0.5 0.07 2.6 1.8 0.05 86.4 <L.D.
DUU6 14.3 <L.D. 5347 1.4 5062 1.7 1.5 <L.D. 23.4 15.9 0.1 0.5 <L.D. <L.D. 0.4 0.05 91.1 1.0
DUU1 14.4 n.d. n.d. n.d. n.d. n.d. n.d. n.d. n.d. n.d. n.d. n.d. n.d. n.d. n.d. n.d. n.d. n.d.
DUU3 15.1 <L.D. 4795 4.3 50990 36.0 1.6 0.9 46.9 27.1 0.1 0.4 0.3 0.5 0.2 0.03 93.4 <L.D.
DUU5 16.4 <L.D. 5180 3.4 49825 2.0 1.3 <L.D. 215 61.8 0.01 0.6 0.02 <L.D. 0.7 0.03 89.9 <L.D.
Confluence Uru-Uru lake and
mining rivers
DHU3 20.0 <L.D. 8321 35. 7 223 37.4 0.3 <L.D. 1283 160.4 0.4 2.1 <L.D. <L.D. 3.8 0.03 94.9 <L.D.
DHU3-2 20.0 <L.D. 7929 20.5 673 35.9 0.4 <L.D. 1621 137.4 0.5 2.5 <L.D. <L.D. 3.4 0.02 93.5 3.9
DECPP 37.6 <L.D. 6881 9.7 1210 32.4 0.6 4.8 492 21.6 0.9 4.1 0.6 11.3 5.1 0.05 12.7 0.7
ID Distance Rb Sr Nb Mo Ag Cd In Sn Sb Te Cs Ba La Ce Pr Nd Eu
Uru-Uru lake
North
DUU12 7.0 18.7 5475 <L.D. 12.3 <L.D. <L.D. 14.1 <L.D. 19.5 0.08 1.2 176 <L.D. <L.D. <L.D. <L.D. <L.D.
DUU11 9.2 10.1 3090 <L.D. 4.0 <L.D. <L.D. 0.7 <L.D. 5.1 <L.D. 0.1 32.1 <L.D. <L.D. <L.D. <L.D. <L.D.
DUU9 10.8 12.9 3761 <L.D. 6.5 <L.D. <L.D. 2.1 <L.D. 10.4 <L.D. 0.3 74.5 <L.D. <L.D. <L.D. <L.D. <L.D.
DUU8 12.5 11.3 3175 0.58 4.2 <L.D. <L.D. <L.D. 0.20 5.5 <L.D. 0.2 25.2 <L.D. <L.D. <L.D. <L.D. <L.D.
South
DUU7 13.4 11.0 3154 <L.D. 3.8 <L.D. <L.D. 1.0 <L.D. 4.5 <L.D. 0.1 38.8 <L.D. <L.D. <L.D. <L.D. <L.D.
DUU6 14.3 10.1 2875 <L.D. 3.6 <L.D. <L.D. 0.8 <L.D. 4.1 <L.D. 0.1 9.3 <L.D. <L.D. <L.D. <L.D. <L.D.
DUU1 14.4 n.d. n.d. n.d. n.d. n.d. n.d. n.d. n.d. n.d. n.d. n.d. n.d. n.d. n.d. n.d. n.d. n.d.
DUU3 15.1 9.58 2709 0.55 3.7 0.01 0.01 <L.D. 0.05 3.5 0.05 0.1 5.0 <L.D. <L.D. <L.D. <L.D. <L.D. DUU5 16.4 9.27 2878 <L.D. 3.2 <L.D. <L.D. <L.D. <L.D. 3.6 <L.D. 0.1 14.9 <L.D. <L.D. <L.D. <L.D. <L.D.
Confluence Uru-Uru lake
and mining rivers
DHU3 20.0 23.0 4069 <L.D. 7.6 <L.D. 0.04 4.4 0.08 17.4 0.03 0.3 86.8 0.01 0.01 <L.D. 0.01 0.04
DHU3-2 20.0 19.7 4016 <L.D. 7.0 <L.D. 0.01 9.8 0.17 19.0 <L.D. 0.2 78.7 0.01 0.02 <L.D. 0.01 0.02
DECPP 37.6 12.9 3747 <L.D. 4.1 <L.D. 0.04 1.7 <L.D. 4.2 0.01 0.3 125 0.02 0.03 <L.D. 0.02 0.04
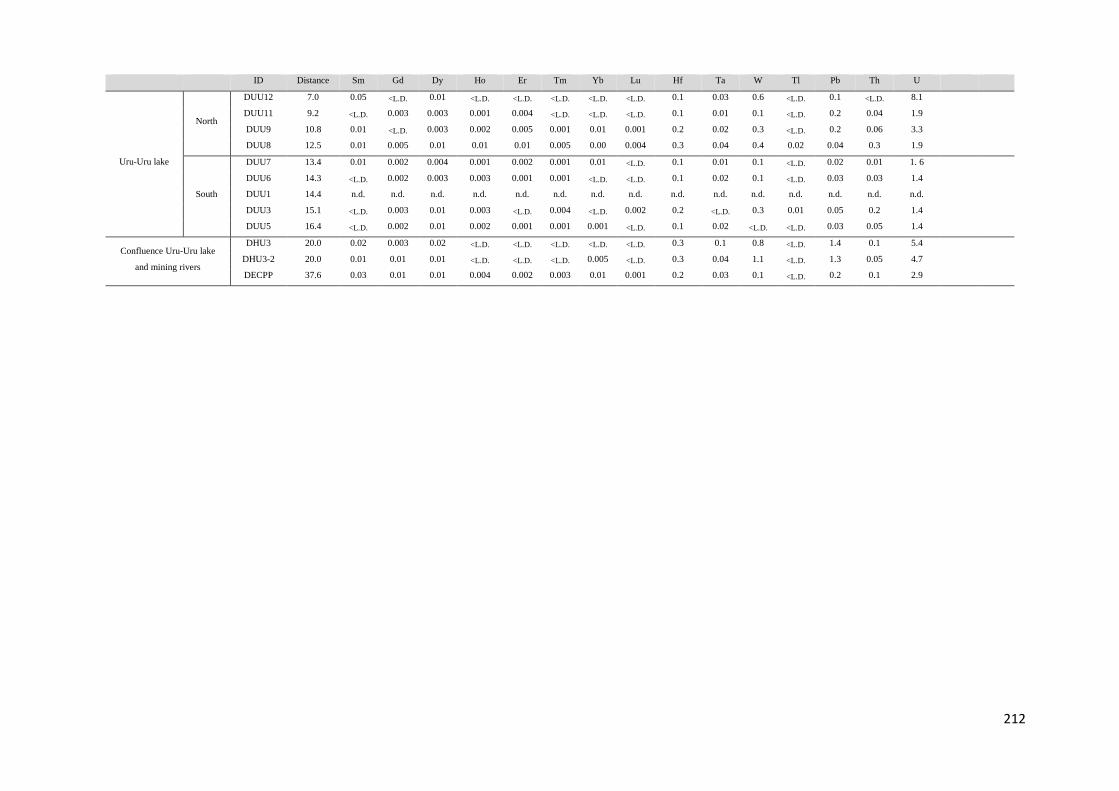
212
ID Distance Sm Gd Dy Ho Er Tm Yb Lu Hf Ta W Tl Pb Th U
Uru-Uru lake
North
DUU12 7.0 0.05 <L.D. 0.01 <L.D. <L.D. <L.D. <L.D. <L.D. 0.1 0.03 0.6 <L.D. 0.1 <L.D. 8.1
DUU11 9.2 <L.D. 0.003 0.003 0.001 0.004 <L.D. <L.D. <L.D. 0.1 0.01 0.1 <L.D. 0.2 0.04 1.9
DUU9 10.8 0.01 <L.D. 0.003 0.002 0.005 0.001 0.01 0.001 0.2 0.02 0.3 <L.D. 0.2 0.06 3.3
DUU8 12.5 0.01 0.005 0.01 0.01 0.01 0.005 0.00 0.004 0.3 0.04 0.4 0.02 0.04 0.3 1.9
South
DUU7 13.4 0.01 0.002 0.004 0.001 0.002 0.001 0.01 <L.D. 0.1 0.01 0.1 <L.D. 0.02 0.01 1. 6
DUU6 14.3 <L.D. 0.002 0.003 0.003 0.001 0.001 <L.D. <L.D. 0.1 0.02 0.1 <L.D. 0.03 0.03 1.4
DUU1 14.4 n.d. n.d. n.d. n.d. n.d. n.d. n.d. n.d. n.d. n.d. n.d. n.d. n.d. n.d. n.d.
DUU3 15.1 <L.D. 0.003 0.01 0.003 <L.D. 0.004 <L.D. 0.002 0.2 <L.D. 0.3 0.01 0.05 0.2 1.4
DUU5 16.4 <L.D. 0.002 0.01 0.002 0.001 0.001 0.001 <L.D. 0.1 0.02 <L.D. <L.D. 0.03 0.05 1.4
Confluence Uru-Uru lake
and mining rivers
DHU3 20.0 0.02 0.003 0.02 <L.D. <L.D. <L.D. <L.D. <L.D. 0.3 0.1 0.8 <L.D. 1.4 0.1 5.4
DHU3-2 20.0 0.01 0.01 0.01 <L.D. <L.D. <L.D. 0.005 <L.D. 0.3 0.04 1.1 <L.D. 1.3 0.05 4.7
DECPP 37.6 0.03 0.01 0.01 0.004 0.002 0.003 0.01 0.001 0.2 0.03 0.1 <L.D. 0.2 0.1 2.9
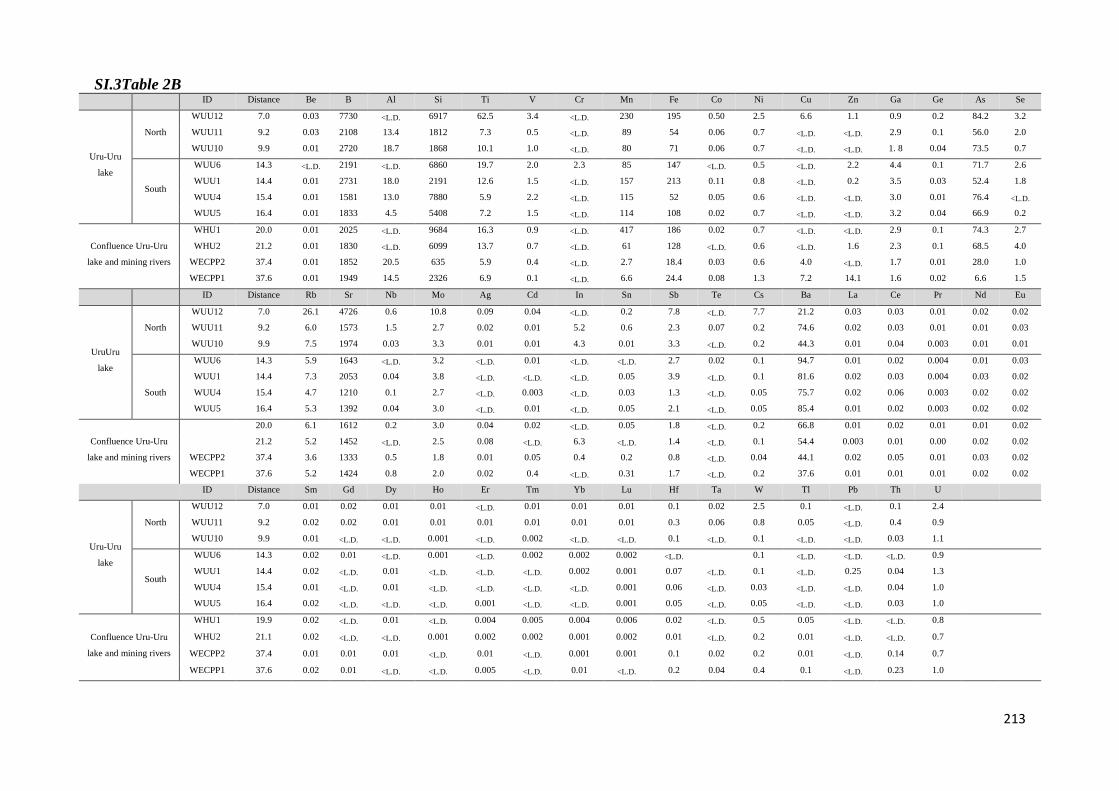
213
SI.3Table 2B ID Distance Be B Al Si Ti V Cr Mn Fe Co Ni Cu Zn Ga Ge As Se
Uru-Uru
lake
North
WUU12 7.0 0.03 7730 <L.D. 6917 62.5 3.4 <L.D. 230 195 0.50 2.5 6.6 1.1 0.9 0.2 84.2 3.2
WUU11 9.2 0.03 2108 13.4 1812 7.3 0.5 <L.D. 89 54 0.06 0.7 <L.D. <L.D. 2.9 0.1 56.0 2.0
WUU10 9.9 0.01 2720 18.7 1868 10.1 1.0 <L.D. 80 71 0.06 0.7 <L.D. <L.D. 1. 8 0.04 73.5 0.7
South
WUU6 14.3 <L.D. 2191 <L.D. 6860 19.7 2.0 2.3 85 147 <L.D. 0.5 <L.D. 2.2 4.4 0.1 71.7 2.6
WUU1 14.4 0.01 2731 18.0 2191 12.6 1.5 <L.D. 157 213 0.11 0.8 <L.D. 0.2 3.5 0.03 52.4 1.8
WUU4 15.4 0.01 1581 13.0 7880 5.9 2.2 <L.D. 115 52 0.05 0.6 <L.D. <L.D. 3.0 0.01 76.4 <L.D.
WUU5 16.4 0.01 1833 4.5 5408 7.2 1.5 <L.D. 114 108 0.02 0.7 <L.D. <L.D. 3.2 0.04 66.9 0.2
Confluence Uru-Uru
lake and mining rivers
WHU1 20.0 0.01 2025 <L.D. 9684 16.3 0.9 <L.D. 417 186 0.02 0.7 <L.D. <L.D. 2.9 0.1 74.3 2.7
WHU2 21.2 0.01 1830 <L.D. 6099 13.7 0.7 <L.D. 61 128 <L.D. 0.6 <L.D. 1.6 2.3 0.1 68.5 4.0
WECPP2 37.4 0.01 1852 20.5 635 5.9 0.4 <L.D. 2.7 18.4 0.03 0.6 4.0 <L.D. 1.7 0.01 28.0 1.0
WECPP1 37.6 0.01 1949 14.5 2326 6.9 0.1 <L.D. 6.6 24.4 0.08 1.3 7.2 14.1 1.6 0.02 6.6 1.5
ID Distance Rb Sr Nb Mo Ag Cd In Sn Sb Te Cs Ba La Ce Pr Nd Eu
UruUru
lake
North
WUU12 7.0 26.1 4726 0.6 10.8 0.09 0.04 <L.D. 0.2 7.8 <L.D. 7.7 21.2 0.03 0.03 0.01 0.02 0.02
WUU11 9.2 6.0 1573 1.5 2.7 0.02 0.01 5.2 0.6 2.3 0.07 0.2 74.6 0.02 0.03 0.01 0.01 0.03
WUU10 9.9 7.5 1974 0.03 3.3 0.01 0.01 4.3 0.01 3.3 <L.D. 0.2 44.3 0.01 0.04 0.003 0.01 0.01
South
WUU6 14.3 5.9 1643 <L.D. 3.2 <L.D. 0.01 <L.D. <L.D. 2.7 0.02 0.1 94.7 0.01 0.02 0.004 0.01 0.03
WUU1 14.4 7.3 2053 0.04 3.8 <L.D. <L.D. <L.D. 0.05 3.9 <L.D. 0.1 81.6 0.02 0.03 0.004 0.03 0.02
WUU4 15.4 4.7 1210 0.1 2.7 <L.D. 0.003 <L.D. 0.03 1.3 <L.D. 0.05 75.7 0.02 0.06 0.003 0.02 0.02
WUU5 16.4 5.3 1392 0.04 3.0 <L.D. 0.01 <L.D. 0.05 2.1 <L.D. 0.05 85.4 0.01 0.02 0.003 0.02 0.02
Confluence Uru-Uru
lake and mining rivers
20.0 6.1 1612 0.2 3.0 0.04 0.02 <L.D. 0.05 1.8 <L.D. 0.2 66.8 0.01 0.02 0.01 0.01 0.02
21.2 5.2 1452 <L.D. 2.5 0.08 <L.D. 6.3 <L.D. 1.4 <L.D. 0.1 54.4 0.003 0.01 0.00 0.02 0.02
WECPP2 37.4 3.6 1333 0.5 1.8 0.01 0.05 0.4 0.2 0.8 <L.D. 0.04 44.1 0.02 0.05 0.01 0.03 0.02
WECPP1 37.6 5.2 1424 0.8 2.0 0.02 0.4 <L.D. 0.31 1.7 <L.D. 0.2 37.6 0.01 0.01 0.01 0.02 0.02
ID Distance Sm Gd Dy Ho Er Tm Yb Lu Hf Ta W Tl Pb Th U
Uru-Uru
lake
North
WUU12 7.0 0.01 0.02 0.01 0.01 <L.D. 0.01 0.01 0.01 0.1 0.02 2.5 0.1 <L.D. 0.1 2.4
WUU11 9.2 0.02 0.02 0.01 0.01 0.01 0.01 0.01 0.01 0.3 0.06 0.8 0.05 <L.D. 0.4 0.9
WUU10 9.9 0.01 <L.D. <L.D. 0.001 <L.D. 0.002 <L.D. <L.D. 0.1 <L.D. 0.1 <L.D. <L.D. 0.03 1.1
South
WUU6 14.3 0.02 0.01 <L.D. 0.001 <L.D. 0.002 0.002 0.002 <L.D. 0.1 <L.D. <L.D. <L.D. 0.9
WUU1 14.4 0.02 <L.D. 0.01 <L.D. <L.D. <L.D. 0.002 0.001 0.07 <L.D. 0.1 <L.D. 0.25 0.04 1.3
WUU4 15.4 0.01 <L.D. 0.01 <L.D. <L.D. <L.D. <L.D. 0.001 0.06 <L.D. 0.03 <L.D. <L.D. 0.04 1.0
WUU5 16.4 0.02 <L.D. <L.D. <L.D. 0.001 <L.D. <L.D. 0.001 0.05 <L.D. 0.05 <L.D. <L.D. 0.03 1.0
Confluence Uru-Uru
lake and mining rivers
WHU1 19.9 0.02 <L.D. 0.01 <L.D. 0.004 0.005 0.004 0.006 0.02 <L.D. 0.5 0.05 <L.D. <L.D. 0.8
WHU2 21.1 0.02 <L.D. <L.D. 0.001 0.002 0.002 0.001 0.002 0.01 <L.D. 0.2 0.01 <L.D. <L.D. 0.7
WECPP2 37.4 0.01 0.01 0.01 <L.D. 0.01 <L.D. 0.001 0.001 0.1 0.02 0.2 0.01 <L.D. 0.14 0.7
WECPP1 37.6 0.02 0.01 <L.D. <L.D. 0.005 <L.D. 0.01 <L.D. 0.2 0.04 0.4 0.1 <L.D. 0.23 1.0
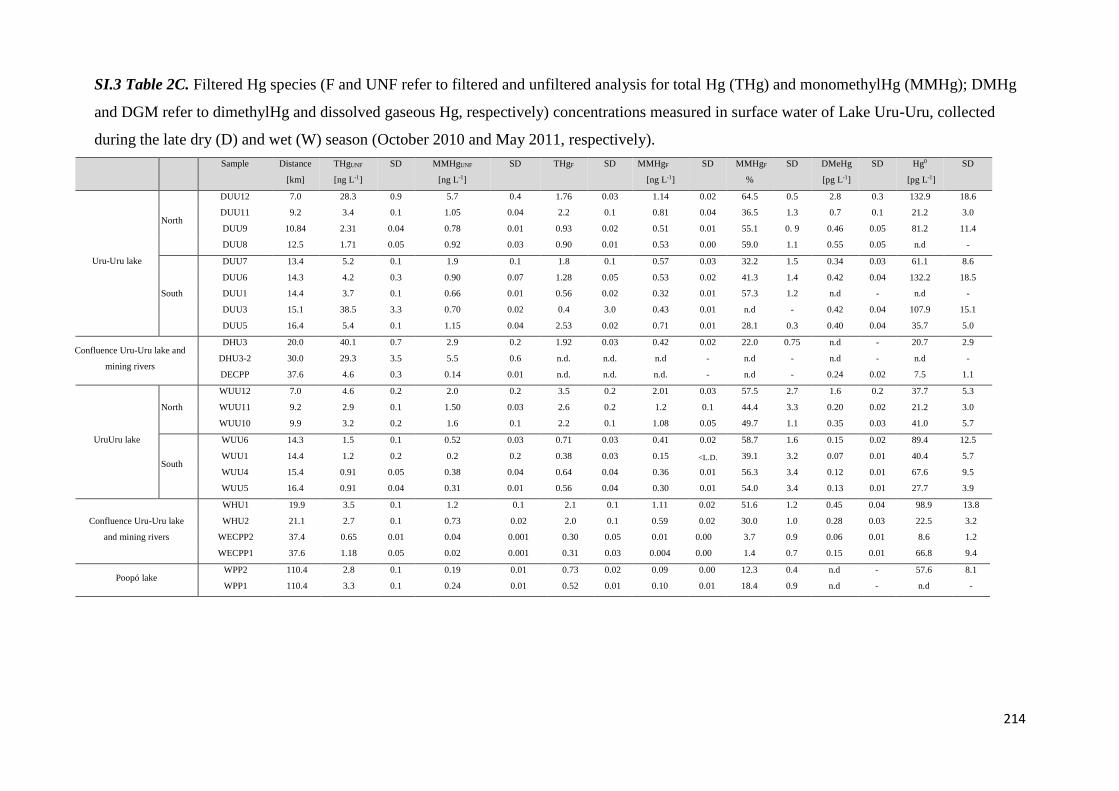
214
SI.3 Table 2C. Filtered Hg species (F and UNF refer to filtered and unfiltered analysis for total Hg (THg) and monomethylHg (MMHg); DMHg
and DGM refer to dimethylHg and dissolved gaseous Hg, respectively) concentrations measured in surface water of Lake Uru-Uru, collected
during the late dry (D) and wet (W) season (October 2010 and May 2011, respectively).
Sample Distance THgUNF SD MMHgUNF SD THgF SD MMHgF SD MMHgF SD DMeHg SD Hg0 SD
[km] [ng L-1] [ng L-1] [ng L-1] % [pg L-1] [pg L-1]
Uru-Uru lake
North
DUU12 7.0 28.3 0.9 5.7 0.4 1.76 0.03 1.14 0.02 64.5 0.5 2.8 0.3 132.9 18.6
DUU11 9.2 3.4 0.1 1.05 0.04 2.2 0.1 0.81 0.04 36.5 1.3 0.7 0.1 21.2 3.0
DUU9 10.84 2.31 0.04 0.78 0.01 0.93 0.02 0.51 0.01 55.1 0. 9 0.46 0.05 81.2 11.4
DUU8 12.5 1.71 0.05 0.92 0.03 0.90 0.01 0.53 0.00 59.0 1.1 0.55 0.05 n.d -
South
DUU7 13.4 5.2 0.1 1.9 0.1 1.8 0.1 0.57 0.03 32.2 1.5 0.34 0.03 61.1 8.6
DUU6 14.3 4.2 0.3 0.90 0.07 1.28 0.05 0.53 0.02 41.3 1.4 0.42 0.04 132.2 18.5
DUU1 14.4 3.7 0.1 0.66 0.01 0.56 0.02 0.32 0.01 57.3 1.2 n.d - n.d -
DUU3 15.1 38.5 3.3 0.70 0.02 0.4 3.0 0.43 0.01 n.d - 0.42 0.04 107.9 15.1
DUU5 16.4 5.4 0.1 1.15 0.04 2.53 0.02 0.71 0.01 28.1 0.3 0.40 0.04 35.7 5.0
Confluence Uru-Uru lake and
mining rivers
DHU3 20.0 40.1 0.7 2.9 0.2 1.92 0.03 0.42 0.02 22.0 0.75 n.d - 20.7 2.9
DHU3-2 30.0 29.3 3.5 5.5 0.6 n.d. n.d. n.d - n.d - n.d - n.d -
DECPP 37.6 4.6 0.3 0.14 0.01 n.d. n.d. n.d. - n.d - 0.24 0.02 7.5 1.1
UruUru lake
North
WUU12 7.0 4.6 0.2 2.0 0.2 3.5 0.2 2.01 0.03 57.5 2.7 1.6 0.2 37.7 5.3
WUU11 9.2 2.9 0.1 1.50 0.03 2.6 0.2 1.2 0.1 44.4 3.3 0.20 0.02 21.2 3.0
WUU10 9.9 3.2 0.2 1.6 0.1 2.2 0.1 1.08 0.05 49.7 1.1 0.35 0.03 41.0 5.7
South
WUU6 14.3 1.5 0.1 0.52 0.03 0.71 0.03 0.41 0.02 58.7 1.6 0.15 0.02 89.4 12.5
WUU1 14.4 1.2 0.2 0.2 0.2 0.38 0.03 0.15 <L.D. 39.1 3.2 0.07 0.01 40.4 5.7
WUU4 15.4 0.91 0.05 0.38 0.04 0.64 0.04 0.36 0.01 56.3 3.4 0.12 0.01 67.6 9.5
WUU5 16.4 0.91 0.04 0.31 0.01 0.56 0.04 0.30 0.01 54.0 3.4 0.13 0.01 27.7 3.9
Confluence Uru-Uru lake
and mining rivers
WHU1 19.9 3.5 0.1 1.2 0.1 2.1 0.1 1.11 0.02 51.6 1.2 0.45 0.04 98.9 13.8
WHU2 21.1 2.7 0.1 0.73 0.02 2.0 0.1 0.59 0.02 30.0 1.0 0.28 0.03 22.5 3.2
WECPP2 37.4 0.65 0.01 0.04 0.001 0.30 0.05 0.01 0.00 3.7 0.9 0.06 0.01 8.6 1.2
WECPP1 37.6 1.18 0.05 0.02 0.001 0.31 0.03 0.004 0.00 1.4 0.7 0.15 0.01 66.8 9.4
Poopó lake WPP2 110.4 2.8 0.1 0.19 0.01 0.73 0.02 0.09 0.00 12.3 0.4 n.d - 57.6 8.1
WPP1 110.4 3.3 0.1 0.24 0.01 0.52 0.01 0.10 0.01 18.4 0.9 n.d - n.d -
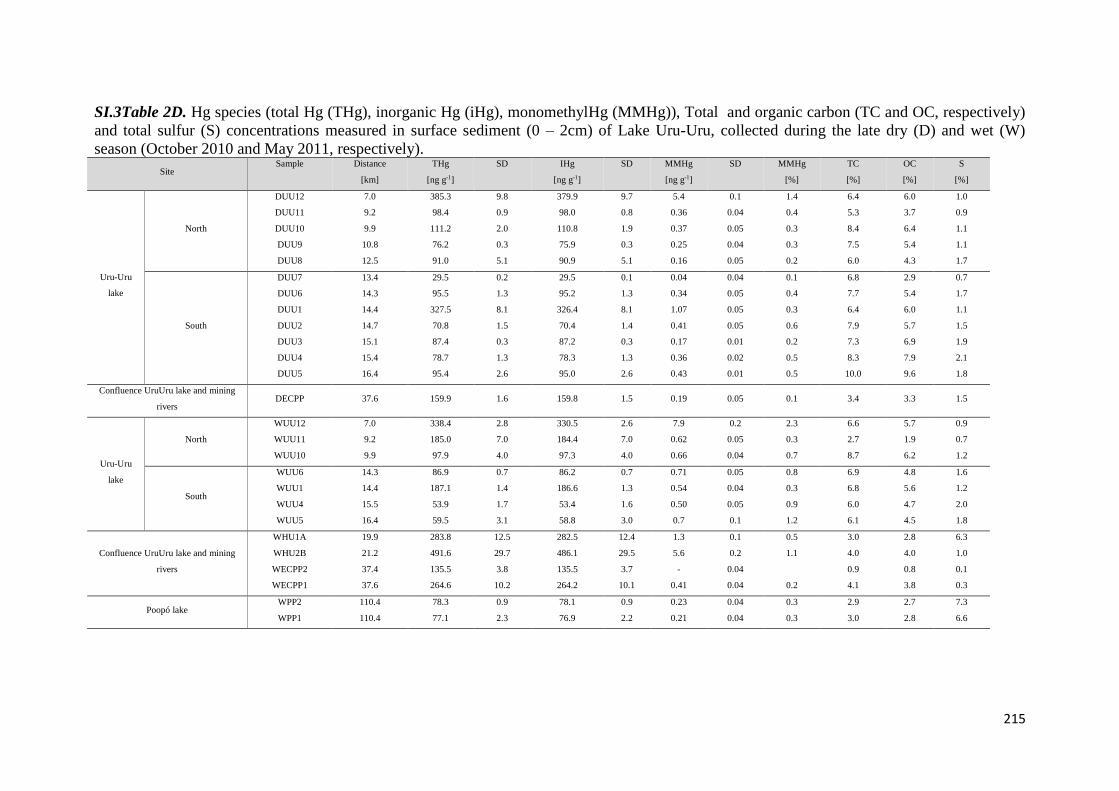
215
SI.3Table 2D. Hg species (total Hg (THg), inorganic Hg (iHg), monomethylHg (MMHg)), Total and organic carbon (TC and OC, respectively)
and total sulfur (S) concentrations measured in surface sediment (0 – 2cm) of Lake Uru-Uru, collected during the late dry (D) and wet (W)
season (October 2010 and May 2011, respectively).
Site Sample Distance THg SD IHg SD MMHg SD MMHg TC OC S
[km] [ng g-1] [ng g-1] [ng g-1] [%] [%] [%] [%]
Uru-Uru
lake
North
DUU12 7.0 385.3 9.8 379.9 9.7 5.4 0.1 1.4 6.4 6.0 1.0
DUU11 9.2 98.4 0.9 98.0 0.8 0.36 0.04 0.4 5.3 3.7 0.9
DUU10 9.9 111.2 2.0 110.8 1.9 0.37 0.05 0.3 8.4 6.4 1.1
DUU9 10.8 76.2 0.3 75.9 0.3 0.25 0.04 0.3 7.5 5.4 1.1
DUU8 12.5 91.0 5.1 90.9 5.1 0.16 0.05 0.2 6.0 4.3 1.7
South
DUU7 13.4 29.5 0.2 29.5 0.1 0.04 0.04 0.1 6.8 2.9 0.7
DUU6 14.3 95.5 1.3 95.2 1.3 0.34 0.05 0.4 7.7 5.4 1.7
DUU1 14.4 327.5 8.1 326.4 8.1 1.07 0.05 0.3 6.4 6.0 1.1
DUU2 14.7 70.8 1.5 70.4 1.4 0.41 0.05 0.6 7.9 5.7 1.5
DUU3 15.1 87.4 0.3 87.2 0.3 0.17 0.01 0.2 7.3 6.9 1.9
DUU4 15.4 78.7 1.3 78.3 1.3 0.36 0.02 0.5 8.3 7.9 2.1
DUU5 16.4 95.4 2.6 95.0 2.6 0.43 0.01 0.5 10.0 9.6 1.8
Confluence UruUru lake and mining
rivers DECPP 37.6 159.9 1.6 159.8 1.5 0.19 0.05 0.1 3.4 3.3 1.5
Uru-Uru
lake
North
WUU12 7.0 338.4 2.8 330.5 2.6 7.9 0.2 2.3 6.6 5.7 0.9
WUU11 9.2 185.0 7.0 184.4 7.0 0.62 0.05 0.3 2.7 1.9 0.7
WUU10 9.9 97.9 4.0 97.3 4.0 0.66 0.04 0.7 8.7 6.2 1.2
South
WUU6 14.3 86.9 0.7 86.2 0.7 0.71 0.05 0.8 6.9 4.8 1.6
WUU1 14.4 187.1 1.4 186.6 1.3 0.54 0.04 0.3 6.8 5.6 1.2
WUU4 15.5 53.9 1.7 53.4 1.6 0.50 0.05 0.9 6.0 4.7 2.0
WUU5 16.4 59.5 3.1 58.8 3.0 0.7 0.1 1.2 6.1 4.5 1.8
Confluence UruUru lake and mining
rivers
WHU1A 19.9 283.8 12.5 282.5 12.4 1.3 0.1 0.5 3.0 2.8 6.3
WHU2B 21.2 491.6 29.7 486.1 29.5 5.6 0.2 1.1 4.0 4.0 1.0
WECPP2 37.4 135.5 3.8 135.5 3.7 - 0.04 0.9 0.8 0.1
WECPP1 37.6 264.6 10.2 264.2 10.1 0.41 0.04 0.2 4.1 3.8 0.3
Poopó lake WPP2 110.4 78.3 0.9 78.1 0.9 0.23 0.04 0.3 2.9 2.7 7.3
WPP1 110.4 77.1 2.3 76.9 2.2 0.21 0.04 0.3 3.0 2.8 6.6
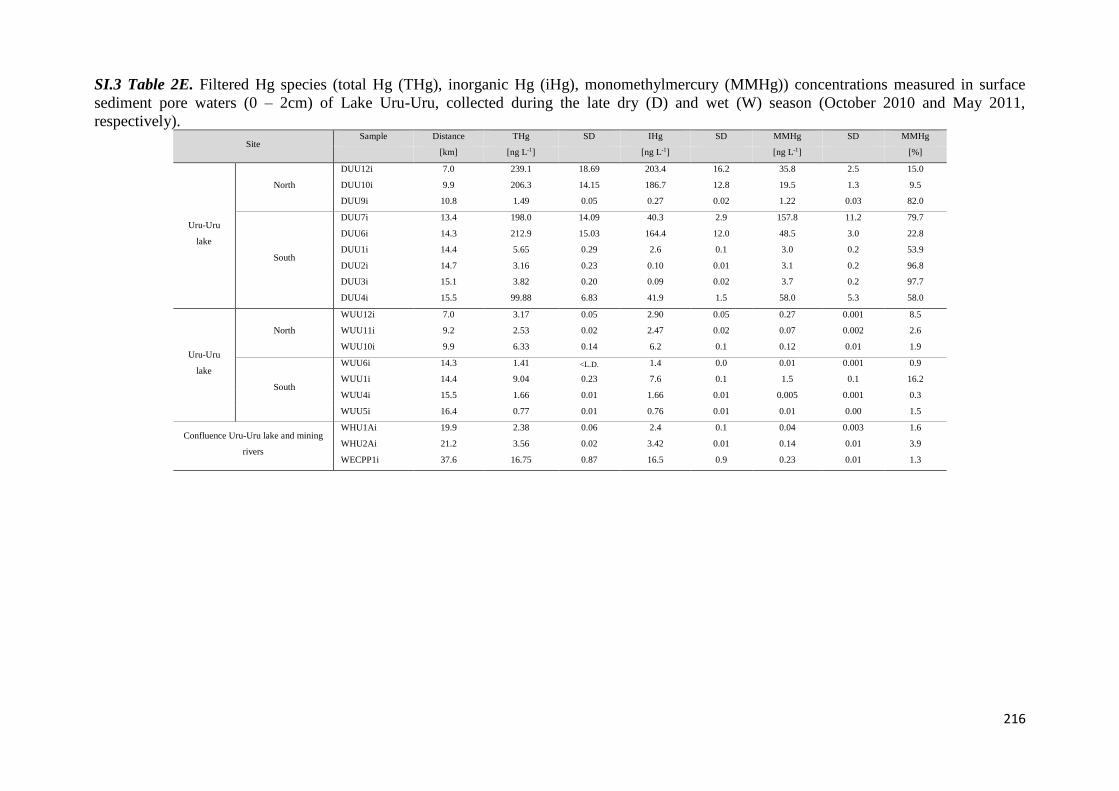
216
SI.3 Table 2E. Filtered Hg species (total Hg (THg), inorganic Hg (iHg), monomethylmercury (MMHg)) concentrations measured in surface
sediment pore waters (0 – 2cm) of Lake Uru-Uru, collected during the late dry (D) and wet (W) season (October 2010 and May 2011,
respectively).
Site Sample Distance THg SD IHg SD MMHg SD MMHg
[km] [ng L-1] [ng L-1] [ng L-1] [%]
Uru-Uru
lake
North
DUU12i 7.0 239.1 18.69 203.4 16.2 35.8 2.5 15.0
DUU10i 9.9 206.3 14.15 186.7 12.8 19.5 1.3 9.5
DUU9i 10.8 1.49 0.05 0.27 0.02 1.22 0.03 82.0
South
DUU7i 13.4 198.0 14.09 40.3 2.9 157.8 11.2 79.7
DUU6i 14.3 212.9 15.03 164.4 12.0 48.5 3.0 22.8
DUU1i 14.4 5.65 0.29 2.6 0.1 3.0 0.2 53.9
DUU2i 14.7 3.16 0.23 0.10 0.01 3.1 0.2 96.8
DUU3i 15.1 3.82 0.20 0.09 0.02 3.7 0.2 97.7
DUU4i 15.5 99.88 6.83 41.9 1.5 58.0 5.3 58.0
Uru-Uru
lake
North
WUU12i 7.0 3.17 0.05 2.90 0.05 0.27 0.001 8.5
WUU11i 9.2 2.53 0.02 2.47 0.02 0.07 0.002 2.6
WUU10i 9.9 6.33 0.14 6.2 0.1 0.12 0.01 1.9
South
WUU6i 14.3 1.41 <L.D. 1.4 0.0 0.01 0.001 0.9
WUU1i 14.4 9.04 0.23 7.6 0.1 1.5 0.1 16.2
WUU4i 15.5 1.66 0.01 1.66 0.01 0.005 0.001 0.3
WUU5i 16.4 0.77 0.01 0.76 0.01 0.01 0.00 1.5
Confluence Uru-Uru lake and mining
rivers
WHU1Ai 19.9 2.38 0.06 2.4 0.1 0.04 0.003 1.6
WHU2Ai 21.2 3.56 0.02 3.42 0.01 0.14 0.01 3.9
WECPP1i 37.6 16.75 0.87 16.5 0.9 0.23 0.01 1.3
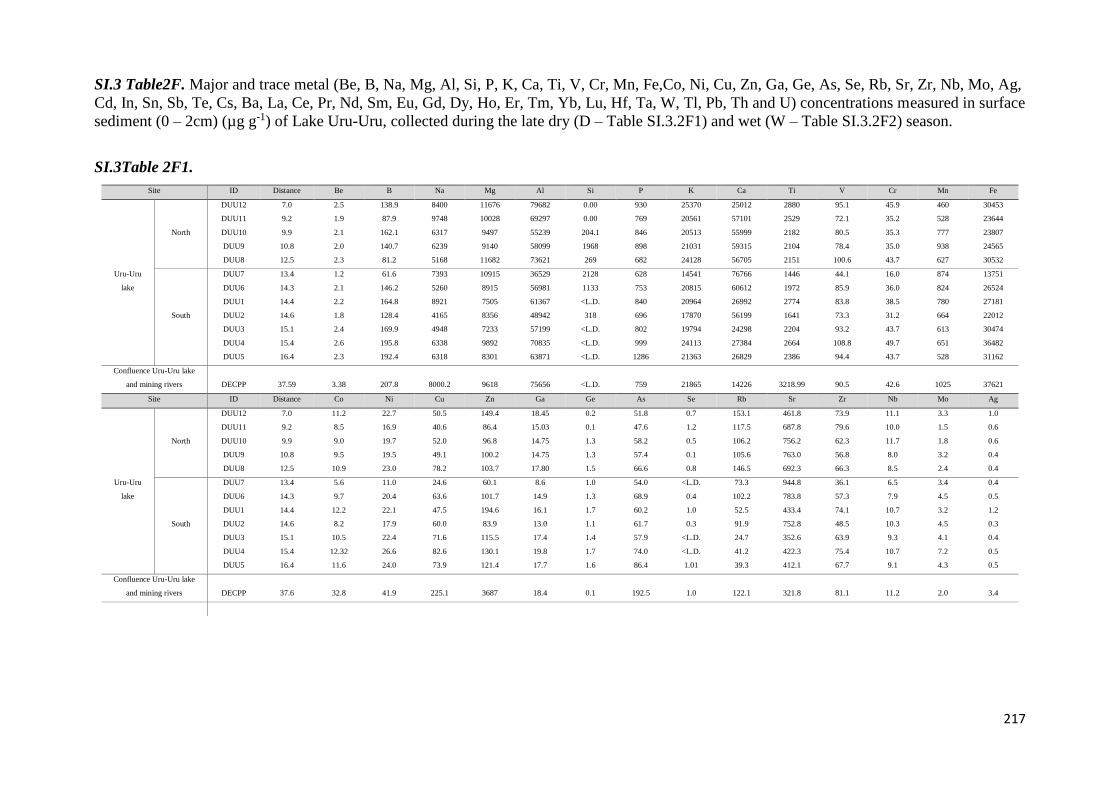
217
SI.3 Table2F. Major and trace metal (Be, B, Na, Mg, Al, Si, P, K, Ca, Ti, V, Cr, Mn, Fe,Co, Ni, Cu, Zn, Ga, Ge, As, Se, Rb, Sr, Zr, Nb, Mo, Ag,
Cd, In, Sn, Sb, Te, Cs, Ba, La, Ce, Pr, Nd, Sm, Eu, Gd, Dy, Ho, Er, Tm, Yb, Lu, Hf, Ta, W, Tl, Pb, Th and U) concentrations measured in surface
sediment (0 – 2cm) (µg g-1) of Lake Uru-Uru, collected during the late dry (D – Table SI.3.2F1) and wet (W – Table SI.3.2F2) season.
SI.3Table 2F1.
Site ID Distance Be B Na Mg Al Si P K Ca Ti V Cr Mn Fe
Uru-Uru
lake
North
DUU12 7.0 2.5 138.9 8400 11676 79682 0.00 930 25370 25012 2880 95.1 45.9 460 30453
DUU11 9.2 1.9 87.9 9748 10028 69297 0.00 769 20561 57101 2529 72.1 35.2 528 23644
DUU10 9.9 2.1 162.1 6317 9497 55239 204.1 846 20513 55999 2182 80.5 35.3 777 23807
DUU9 10.8 2.0 140.7 6239 9140 58099 1968 898 21031 59315 2104 78.4 35.0 938 24565
DUU8 12.5 2.3 81.2 5168 11682 73621 269 682 24128 56705 2151 100.6 43.7 627 30532
South
DUU7 13.4 1.2 61.6 7393 10915 36529 2128 628 14541 76766 1446 44.1 16.0 874 13751
DUU6 14.3 2.1 146.2 5260 8915 56981 1133 753 20815 60612 1972 85.9 36.0 824 26524
DUU1 14.4 2.2 164.8 8921 7505 61367 <L.D. 840 20964 26992 2774 83.8 38.5 780 27181
DUU2 14.6 1.8 128.4 4165 8356 48942 318 696 17870 56199 1641 73.3 31.2 664 22012
DUU3 15.1 2.4 169.9 4948 7233 57199 <L.D. 802 19794 24298 2204 93.2 43.7 613 30474
DUU4 15.4 2.6 195.8 6338 9892 70835 <L.D. 999 24113 27384 2664 108.8 49.7 651 36482
DUU5 16.4 2.3 192.4 6318 8301 63871 <L.D. 1286 21363 26829 2386 94.4 43.7 528 31162
Confluence Uru-Uru lake
and mining rivers DECPP 37.59 3.38 207.8 8000.2 9618 75656 <L.D. 759 21865 14226 3218.99 90.5 42.6 1025 37621
Site ID Distance Co Ni Cu Zn Ga Ge As Se Rb Sr Zr Nb Mo Ag
Uru-Uru
lake
North
DUU12 7.0 11.2 22.7 50.5 149.4 18.45 0.2 51.8 0.7 153.1 461.8 73.9 11.1 3.3 1.0
DUU11 9.2 8.5 16.9 40.6 86.4 15.03 0.1 47.6 1.2 117.5 687.8 79.6 10.0 1.5 0.6
DUU10 9.9 9.0 19.7 52.0 96.8 14.75 1.3 58.2 0.5 106.2 756.2 62.3 11.7 1.8 0.6
DUU9 10.8 9.5 19.5 49.1 100.2 14.75 1.3 57.4 0.1 105.6 763.0 56.8 8.0 3.2 0.4
DUU8 12.5 10.9 23.0 78.2 103.7 17.80 1.5 66.6 0.8 146.5 692.3 66.3 8.5 2.4 0.4
South
DUU7 13.4 5.6 11.0 24.6 60.1 8.6 1.0 54.0 <L.D. 73.3 944.8 36.1 6.5 3.4 0.4
DUU6 14.3 9.7 20.4 63.6 101.7 14.9 1.3 68.9 0.4 102.2 783.8 57.3 7.9 4.5 0.5
DUU1 14.4 12.2 22.1 47.5 194.6 16.1 1.7 60.2 1.0 52.5 433.4 74.1 10.7 3.2 1.2
DUU2 14.6 8.2 17.9 60.0 83.9 13.0 1.1 61.7 0.3 91.9 752.8 48.5 10.3 4.5 0.3
DUU3 15.1 10.5 22.4 71.6 115.5 17.4 1.4 57.9 <L.D. 24.7 352.6 63.9 9.3 4.1 0.4
DUU4 15.4 12.32 26.6 82.6 130.1 19.8 1.7 74.0 <L.D. 41.2 422.3 75.4 10.7 7.2 0.5
DUU5 16.4 11.6 24.0 73.9 121.4 17.7 1.6 86.4 1.01 39.3 412.1 67.7 9.1 4.3 0.5
Confluence Uru-Uru lake
and mining rivers DECPP 37.6 32.8 41.9 225.1 3687 18.4 0.1 192.5 1.0 122.1 321.8 81.1 11.2 2.0 3.4

218
Site ID Distance Cd In Sn Sb Te Cs Ba La Ce Pr Nd Sm Eu Gd
Uru-Uru
lake
North
DUU12 7.0 0.9 <L.D. 23.2 24.9 0.1 51.7 581 36.0 72.2 8.5 30.8 5.9 1.3 4.9
DUU11 9.2 0.2 3.2 7.6 9.4 0.1 27.2 607 28.6 56.0 6.8 24.7 5.0 1.2 4.1
DUU10 9.9 0.3 2.4 11.3 12.2 0.1 18.5 504 24.3 50.9 5.6 20.3 4.0 0.9 3.4
DUU9 10.8 0.3 2.3 8.0 6.5 0.1 18.3 500 23.7 49.3 5.5 19.9 3.9 0.9 3.3
DUU8 12.5 0.4 0.8 6.0 6.6 0.1 28.6 470 30.7 61.4 7.2 26.1 5.0 1.1 4.3
South
DUU7 13.4 0.2 <L.D. 5.0 3.0 0.1 12.1 490 16.2 32.1 3. 8 13.5 2.7 0.7 2.3
DUU6 14.3 0.5 <L.D. 9.4 7.8 0.1 15.3 474 24.4 51.0 5.7 20.4 4.0 0.9 3.4
DUU1 14.4 0.8 0.4 19.1 19.4 0.1 23.2 547 22.4 47.1 5.6 20.9 4.4 1.0 4.0
DUU2 14.6 0.3 <L.D. 7.4 5.3 0.2 15.9 402 21.7 44.7 5.0 18.2 3.6 0.8 3.0
DUU3 15.1 0.5 <L.D. 9.0 7.2 0.1 18.8 348 21.1 46.1 5.6 20.9 4.3 0.9 3.7
DUU4 15.5 0.5 0.5 10.6 7.6 <L.D. 22.6 410 26.3 55.4 6.8 25.0 4.9 1.1 4.3
DUU5 16.4 0.5 <L.D. 12.9 8.3 0.1 20.7 764 23.0 47.8 5.9 21.9 4.6 1.1 3.9
Confluence Uru-Uru lake
and mining rivers DECPP 37.6 49.9 0.8 40.9 26.7 0.1 27.4 481 31.2 65.8 8.0 30.4 6.6 1.5 6.2
Site ID Distance Dy Ho Er Tm Yb Lu Hf Ta W Tl Pb Th U
Uru-Uru
lake
North
DUU12 7.0 3.0 0.5 1.6 0.2 1.5 0.2 2.3 1.5 2.2 1.0 77.4 12.0 4.2
DUU11 9.2 2. 7 0.5 1.4 0.2 1.3 0.2 2.5 1.5 1.5 0.7 40.8 9.2 3.4
DUU10 9.9 2.1 0.4 1.1 0.2 1.1 0.2 2.6 2. 1 2.0 0.8 39.3 8.4 4.6
DUU9 10.8 2.0 0.3 1.0 0.1 0.9 0.2 1.8 1.7 1.3 0.8 33.2 7.6 3.5
DUU8 12.5 2.6 0.5 1.4 0.2 1.3 0.2 2.2 2.2 1.2 0.9 32.9 10.0 3.7
South
DUU7 13.4 1.5 0.3 0.8 0.1 0.7 0.1 1.3 1.5 0.7 0.5 17.1 3.6 2.4
DUU6 14.3 2.0 0.4 1.0 0.2 1.0 0.2 1.9 1.8 1.3 0.8 35.6 8.2 4.5
DUU1 14.4 2.6 0.5 1.4 0.2 1.4 0.2 2.5 1.8 2.1 0.8 95.5 8.2 4.5
DUU2 14.6 1.8 0.3 0.9 0.1 0.8 0.1 2.4 2.1 2.0 0.7 26.2 7.7 3.6
DUU3 15.1 2.3 0.4 1.2 0.2 1.2 0.2 2.2 1.7 1.7 0.9 33.0 7.6 3.4
DUU4 15.4 2.7 0.5 1.4 0.2 1.4 0.2 2.5 2.0 1.9 1.0 35.7 9.1 4.6
DUU5 16.4 2.4 0.4 1.3 0.2 1.2 0.2 2.2 1.7 1.7 0.9 35.9 8.3 3.6
Confluence Uru-Uru lake
and mining rivers DECPP 37.6 4.2 0.8 2.1 0.3 1.9 0.3 2.4 1.4 3.3 1.6 135 10.5 3.3
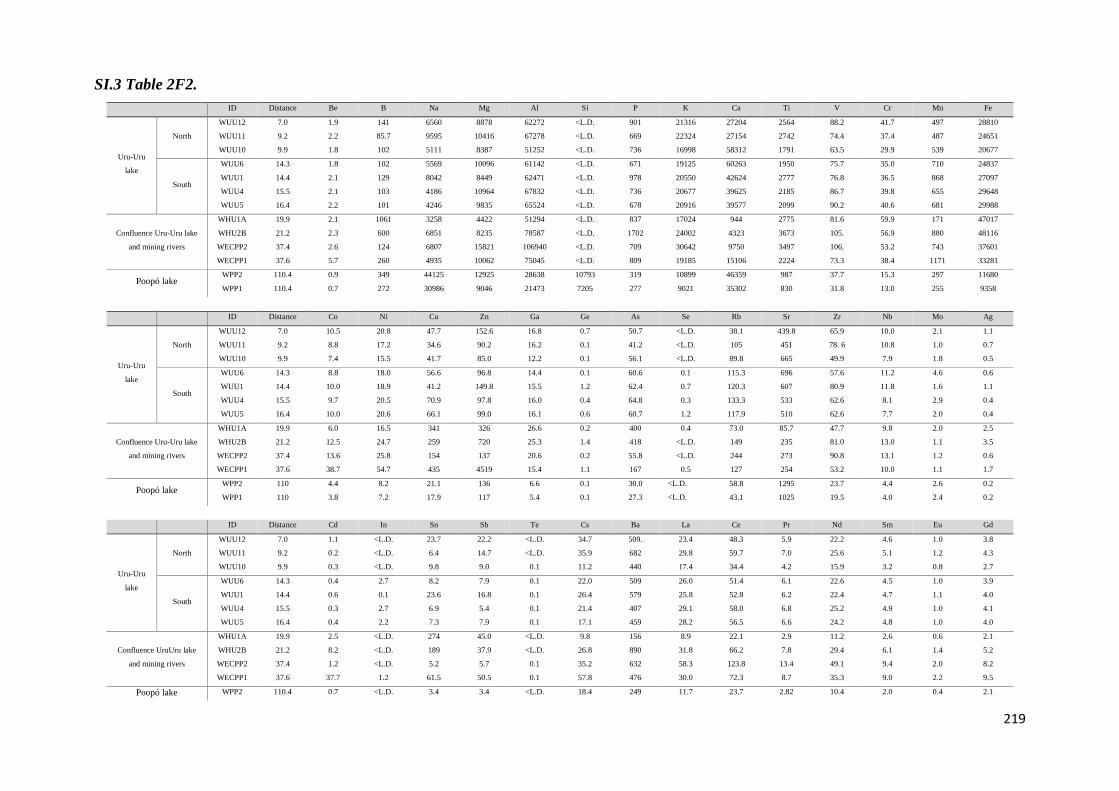
219
SI.3 Table 2F2.
ID Distance Be B Na Mg Al Si P K Ca Ti V Cr Mn Fe
Uru-Uru
lake
North
WUU12 7.0 1.9 141 6560 8878 62272 <L.D. 901 21316 27204 2564 88.2 41.7 497 28810
WUU11 9.2 2.2 85.7 9595 10416 67278 <L.D. 669 22324 27154 2742 74.4 37.4 487 24651
WUU10 9.9 1.8 102 5111 8387 51252 <L.D. 736 16998 58312 1791 63.5 29.9 539 20677
South
WUU6 14.3 1.8 102 5569 10096 61142 <L.D. 671 19125 60263 1950 75.7 35.0 710 24837
WUU1 14.4 2.1 129 8042 8449 62471 <L.D. 978 20550 42624 2777 76.8 36.5 868 27097
WUU4 15.5 2.1 103 4186 10964 67832 <L.D. 736 20677 39625 2185 86.7 39.8 655 29648
WUU5 16.4 2.2 101 4246 9835 65524 <L.D. 678 20916 39577 2099 90.2 40.6 681 29988
Confluence Uru-Uru lake
and mining rivers
WHU1A 19.9 2.1 1061 3258 4422 51294 <L.D. 837 17024 944 2775 81.6 59.9 171 47017
WHU2B 21.2 2.3 600 6851 8235 78587 <L.D. 1702 24002 4323 3673 105. 56.9 880 48116
WECPP2 37.4 2.6 124 6807 15821 106940 <L.D. 709 30642 9750 3497 106. 53.2 743 37601
WECPP1 37.6 5.7 260 4935 10062 75045 <L.D. 809 19185 15106 2224 73.3 38.4 1171 33281
Poopó lake WPP2 110.4 0.9 349 44125 12925 28638 10793 319 10899 46359 987 37.7 15.3 297 11680
WPP1 110.4 0.7 272 30986 9046 21473 7205 277 9021 35302 830 31.8 13.0 255 9358
ID Distance Co Ni Cu Zn Ga Ge As Se Rb Sr Zr Nb Mo Ag
Uru-Uru
lake
North
WUU12 7.0 10.5 20.8 47.7 152.6 16.8 0.7 50.7 <L.D. 38.1 439.8 65.9 10.0 2.1 1.1
WUU11 9.2 8.8 17.2 34.6 90.2 16.2 0.1 41.2 <L.D. 105 451 78. 6 10.8 1.0 0.7
WUU10 9.9 7.4 15.5 41.7 85.0 12.2 0.1 56.1 <L.D. 89.8 665 49.9 7.9 1.8 0.5
South
WUU6 14.3 8.8 18.0 56.6 96.8 14.4 0.1 60.6 0.1 115.3 696 57.6 11.2 4.6 0.6
WUU1 14.4 10.0 18.9 41.2 149.8 15.5 1.2 62.4 0.7 120.3 607 80.9 11.8 1.6 1.1
WUU4 15.5 9.7 20.5 70.9 97.8 16.0 0.4 64.8 0.3 133.3 533 62.6 8.1 2.9 0.4
WUU5 16.4 10.0 20.6 66.1 99.0 16.1 0.6 60.7 1.2 117.9 510 62.6 7.7 2.0 0.4
Confluence Uru-Uru lake
and mining rivers
WHU1A 19.9 6.0 16.5 341 326 26.6 0.2 400 0.4 73.0 85.7 47.7 9.8 2.0 2.5
WHU2B 21.2 12.5 24.7 259 720 25.3 1.4 418 <L.D. 149 235 81.0 13.0 1.1 3.5
WECPP2 37.4 13.6 25.8 154 137 20.6 0.2 55.8 <L.D. 244 273 90.8 13.1 1.2 0.6
WECPP1 37.6 38.7 54.7 435 4519 15.4 1.1 167 0.5 127 254 53.2 10.0 1.1 1.7
Poopó lake WPP2 110 4.4 8.2 21.1 136 6.6 0.1 30.0 <L.D. 58.8 1295 23.7 4.4 2.6 0.2
WPP1 110 3.8 7.2 17.9 117 5.4 0.1 27.3 <L.D. 43.1 1025 19.5 4.0 2.4 0.2
ID Distance Cd In Sn Sb Te Cs Ba La Ce Pr Nd Sm Eu Gd
Uru-Uru
lake
North
WUU12 7.0 1.1 <L.D. 23.7 22.2 <L.D. 34.7 509. 23.4 48.3 5.9 22.2 4.6 1.0 3.8
WUU11 9.2 0.2 <L.D. 6.4 14.7 <L.D. 35.9 682 29.8 59.7 7.0 25.6 5.1 1.2 4.3
WUU10 9.9 0.3 <L.D. 9.8 9.0 0.1 11.2 440 17.4 34.4 4.2 15.9 3.2 0.8 2.7
South
WUU6 14.3 0.4 2.7 8.2 7.9 0.1 22.0 509 26.0 51.4 6.1 22.6 4.5 1.0 3.9
WUU1 14.4 0.6 0.1 23.6 16.8 0.1 26.4 579 25.8 52.8 6.2 22.4 4.7 1.1 4.0
WUU4 15.5 0.3 2.7 6.9 5.4 0.1 21.4 407 29.1 58.0 6.8 25.2 4.9 1.0 4.1
WUU5 16.4 0.4 2.2 7.3 7.9 0.1 17.1 459 28.2 56.5 6.6 24.2 4.8 1.0 4.0
Confluence UruUru lake
and mining rivers
WHU1A 19.9 2.5 <L.D. 274 45.0 <L.D. 9.8 156 8.9 22.1 2.9 11.2 2.6 0.6 2.1
WHU2B 21.2 8.2 <L.D. 189 37.9 <L.D. 26.8 890 31.8 66.2 7.8 29.4 6.1 1.4 5.2
WECPP2 37.4 1.2 <L.D. 5.2 5.7 0.1 35.2 632 58.3 123.8 13.4 49.1 9.4 2.0 8.2
WECPP1 37.6 37.7 1.2 61.5 50.5 0.1 57.8 476 30.0 72.3 8.7 35.3 9.0 2.2 9.5
Poopó lake WPP2 110.4 0.7 <L.D. 3.4 3.4 <L.D. 18.4 249 11.7 23.7 2.82 10.4 2.0 0.4 2.1
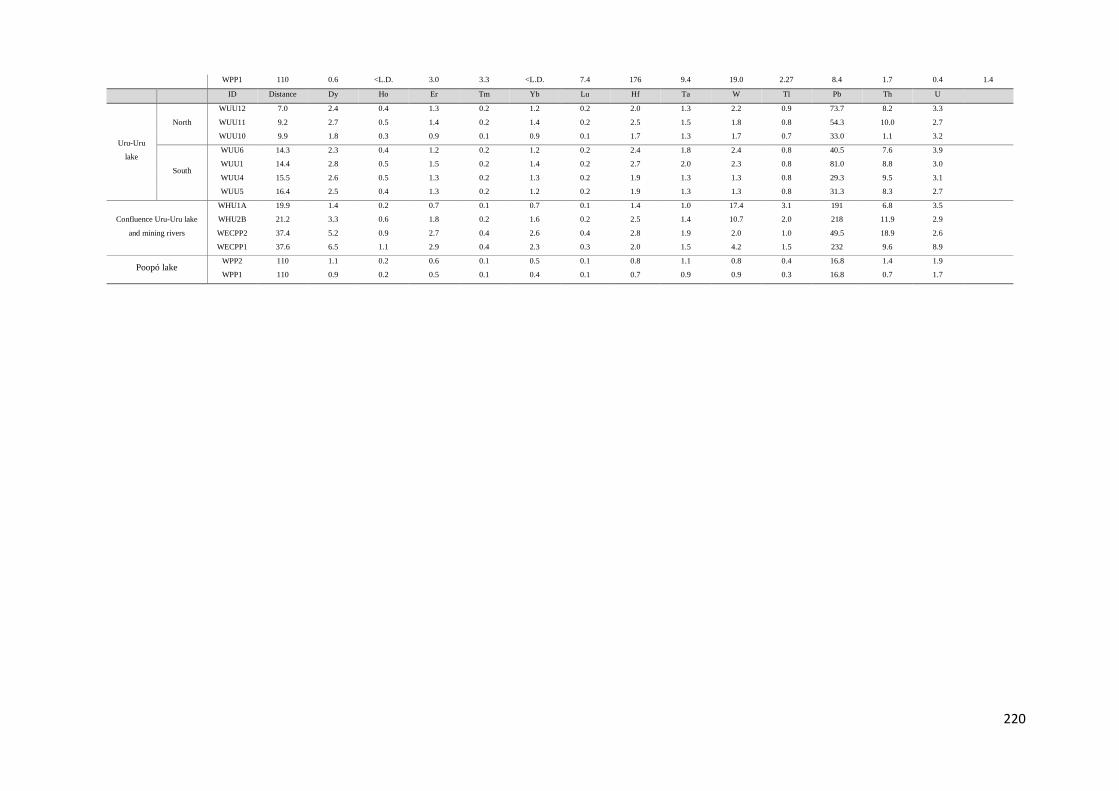
220
WPP1 110 0.6 <L.D. 3.0 3.3 <L.D. 7.4 176 9.4 19.0 2.27 8.4 1.7 0.4 1.4
ID Distance Dy Ho Er Tm Yb Lu Hf Ta W Tl Pb Th U
Uru-Uru
lake
North
WUU12 7.0 2.4 0.4 1.3 0.2 1.2 0.2 2.0 1.3 2.2 0.9 73.7 8.2 3.3
WUU11 9.2 2.7 0.5 1.4 0.2 1.4 0.2 2.5 1.5 1.8 0.8 54.3 10.0 2.7
WUU10 9.9 1.8 0.3 0.9 0.1 0.9 0.1 1.7 1.3 1.7 0.7 33.0 1.1 3.2
South
WUU6 14.3 2.3 0.4 1.2 0.2 1.2 0.2 2.4 1.8 2.4 0.8 40.5 7.6 3.9
WUU1 14.4 2.8 0.5 1.5 0.2 1.4 0.2 2.7 2.0 2.3 0.8 81.0 8.8 3.0
WUU4 15.5 2.6 0.5 1.3 0.2 1.3 0.2 1.9 1.3 1.3 0.8 29.3 9.5 3.1
WUU5 16.4 2.5 0.4 1.3 0.2 1.2 0.2 1.9 1.3 1.3 0.8 31.3 8.3 2.7
Confluence Uru-Uru lake
and mining rivers
WHU1A 19.9 1.4 0.2 0.7 0.1 0.7 0.1 1.4 1.0 17.4 3.1 191 6.8 3.5
WHU2B 21.2 3.3 0.6 1.8 0.2 1.6 0.2 2.5 1.4 10.7 2.0 218 11.9 2.9
WECPP2 37.4 5.2 0.9 2.7 0.4 2.6 0.4 2.8 1.9 2.0 1.0 49.5 18.9 2.6
WECPP1 37.6 6.5 1.1 2.9 0.4 2.3 0.3 2.0 1.5 4.2 1.5 232 9.6 8.9
Poopó lake WPP2 110 1.1 0.2 0.6 0.1 0.5 0.1 0.8 1.1 0.8 0.4 16.8 1.4 1.9
WPP1 110 0.9 0.2 0.5 0.1 0.4 0.1 0.7 0.9 0.9 0.3 16.8 0.7 1.7
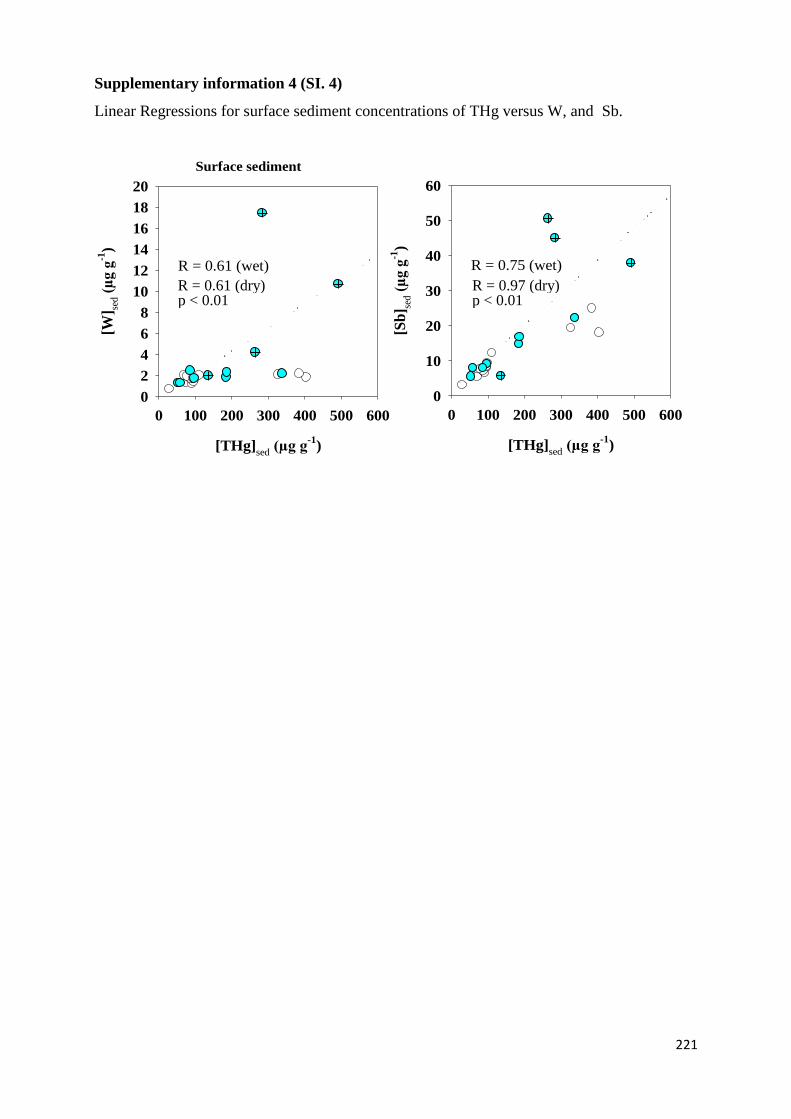
221
Supplementary information 4 (SI. 4)
Linear Regressions for surface sediment concentrations of THg versus W, and Sb.
R = 0.61 (wet)
[THg]sed
(µg g-1
)
0 100 200 300 400 500 600
[W] se
d (
µg g
-1)
0
2
4
6
8
10
12
14
16
18
20
[THg]sed
(µg g-1
)
0 100 200 300 400 500 600[S
b] se
d (
µg g
-1)
0
10
20
30
40
50
60
R = 0.75 (wet)
Surface sediment
p < 0.01 p < 0.01 R = 0.97 (dry) R = 0.61 (dry)
222
Información suplementaria 2 : Capítulo
III
223
Diurnal variability and biogeochemical reactivity of Hg species in an
extreme high altitude lake ecosystem of the Bolivian Altiplano
L. Alanoca1, D. Amouroux1,2*, M. Monperrus2, E. Tessier2, M. Goni3, R. Guyoneaud3, D.
Acha4, C. Gassie3, S. Audry1, M. E. Garcia5, J. Quintanilla5, D. Point1
(1) Géosciences Environnement Toulouse, UMR5563 - IRD UR 234, Université Paul
Sabatier, 14 Avenue Edouard Belin 31400 Toulouse, France.
(2) Laboratoire de Chimie Analytique Bio-inorganique et Environnement, IPREM UMR 5254
CNRS - Université de Pau et des Pays de l’Adour, Hélioparc Pau Pyrénées, 2, av. P. Angot,
64053 Pau cedex 9, France.
(3) Equipe Environnement et Microbiologie, IPREM UMR 5254 CNRs - Université de Pau et
des Pays de l’Adour, Bâtiment IBEAS, BP1153, F-64013 Pau Cedex France.
(4) Laboratorio de Calidad Ambiental – Instituto de Ecologia - Universidad Mayor de San
Andres, Campus Universitario de Cota Cota, casilla 3161, La Paz, Bolivia.
(5) Laboratorio de Hidroquímica - Instituto de Investigaciones Químicas - Universidad Mayor
de San Andres, Campus Universitario de Cota Cota, casilla 3161, La Paz, Bolivia.
*Corresponding author:
D. Amouroux, Email: [email protected]
224
Material and Methods
Study Area:
Lake Uru-Uru is located between coordinates 67° 5’ 46” West and 18° 5’ 40” South, in the
Department of Oruro in Bolivia, South America. Geographically, the aquatic system studied
is located in the South-West section of the Bolivian Altiplano, bordered to the East by the
Eastern cordillera of the Andes and to the North-West by the Corque-Andamarca hills. The
Lake Uru-Uru aquatic system formed in 1962 as a result of flooding from the Desaguadero
River, flowing out from Lake Titicaca (UNEP, 1996). These water resources, together with
Lake Poopó and the salars of Uyuni and Coipasa, form the Altiplano closed endorheic basin
(TPDS). Lake Uru-Uru is regulated by the Desaguadero River and rainfall contributions. The
lake’s surface area varies with yearly seasonal changes (dry season and wet season) and with
extreme events such as the Niño or Niña phenomena. During the rainy or wet season, its
surface area increases to 350 km2, shrinking to 120 km2 in the dry season.
Environmental conditions on the Altiplano are determined by the altitude (3686 meters above
sea level) and the latitude (ca. 18° South). The climate is semi-arid and cold, with
temperatures that may range over the course of the same day from -4°C (at dawn) to 20°C
(after midday). Rainfall during the wet season accounts for 51% of annual water contributions
in the North of the region and 81% in the South (Guyot et al., 1990). The quantity of rainfall
ranges from 750 mm per year in the North to 160 mm per year in the South (Condom et al.,
2004), and rainfall patterns are the same throughout the region. Water loss in the basin is
mainly due to evaporation, at an estimated 1600 mm per year. Prevailing winds are in a
South-Westerly direction during the wet season and Westerly during the dry season. Because
of the high altitude and the geographical location of Lake Uru-Uru (tropical zone), levels of
solar and UV radiation are usually high during the wet season because of the Earth’s position
in relation to the sun. However, this radiation is lessened by cloud, with lower levels of solar
radiation reaching the ground on cloudy days. In the dry season, in contrast, the sky is usually
cloudless, and therefore higher levels of solar radiation (500 W m-2) reach the ground on the
Altiplano (Villafañe and Helbling, 2003).
Locations in the North and the South of Lake Uru-Uru were studied because of their
differences in terms of physical and chemical characteristics, water column levels and the
types of pollution to which they are subjected. For several years, this aquatic system has acted
as a sink for large quantities of mining and urban waste. The Northern part of the ecosystem is
polluted by mining waste discharge from San José mine with high content of heavy metals
(Garcia Moreno, 2006) and urban waste discharge both organic (untreated sewage and waste
water) and solid (plastic bags and bottles) from Oruro city. The final Southern section is
225
polluted by large quantities of untreated solid waste and acid drainage from mines, with high
concentrations of heavy metals from Huanuni mine (Garcia Moreno, 2006), as well as
household waste in the form of solid plastic from Huanuni population.
The sampling site on Lake Titicaca was performed relatively shallow (5m depth) near shore
area of the Lago Menor section near the city of Huatajata (La Paz Dpt, Bolivia, Lat. 16° 15'
27.10" S; Long. 68° 43' 5.34" W), while the sampling site on Lake Poopó was located in
eastern part of the lake near the city of Challapata (Oruro Dpt, Bolivia, Lat. 18° 59' 52.27" S;
Long. 66° 51' 42.43" W).
Sampling and Analytical protocols
Sample processing
To determine the content of dissolved and total Hg species, 100 mL of filtered (disolved) and
unfiltered samples werestored in Teflon PFA flasks (Nalgene, USA) and acidified with HCl
Ultrex (Baker) to 1% v/v. Some of the filtered samples were acidified with HNO3 Ultrex
(Baker) to 1% v/v in order to analyze heavy metals/cations, and others were treated with
H3PO4bi-distilled to 2% v/v to determine dissolved organic carbon (DOC) content. All
samples were stored at 4°C for transportation and further analysis in the laboratory. A final set
of the filtered samples was frozen for the analysis of anions.
To ensure that the samples were not contaminated, the materials used in the sampling and the
conservation flasks were subjected to prior cleaning treatment. The PFA Teflon,
Polypropylene and Pyrex glass flasks and PVDF filters were cleaned using successive acid
bathsand dried under a laminar flow hood, while the gold traps were burned at 600°C. Each of
the clean materials was kept in three hermetically sealed ziplock bags until they were used in
the field.
Gaseous species were collected in situ from bulk water samples immediately purged
(generallywithin ~0.5 h after sampling) and collected on a gold–coated sand (Brooks Rand®)
and activated Charcoal (Carbotrap®) traps, respectively.
Transformation assays protocols
Two sets of unfiltered water samples were incubated in triplicate with the addition of
isotopically enriched Hg species 199HgCl2 (2 ng L-1) and MM201HgCl (0.1 ng L-1) in 125 mL
Teflon FEP flasks. The first set was placed in the environmental conditions of Lake Uru-Uru,
while the second set was isolated from sunlight. After 24 hours the incubation processes were
stopped by adding high-purity HCl (1% v/v), and then kept in darkness at -4 °C. Control tests
226
(initial time) were conducted by stopping the reactions immediately before the addition of the
isotopic tracers.
Another set of water samples, also in triplicate, was incubated with the same Hg isotopic
tracers concentration levels (199HgCl2 2 ng L-1 and MM201HgCl 0.1 ng L-1) to determine Hg
reduction. These were incubated under similar conditions to those used to determine M and D,
with the difference that, at the end of the 24 hours, the 199Hg0 was immediately recovered in
gold traps by purging the water samples with high-purity nitrogen gas (N2) (Monperrus et al.,
2007).
Samples of sediment, periphyton and floating bio-organic aggregates were also incubated
with isotopic tracers 199HgCl2 and MM201HgCl, in order to assess M and D potentials. Surface
sedimentwere collected at a depth of between 0 and 1 cm. The periphyton samples were taken
from the sides of the stems of Totora plants in contact with the water. The samples of floating
bio-organic aggregates were collected from the surface of the water column in which they
were suspended.
For samples of sediment, periphyton and floating bio-organic particles, the incubations were
conducted on mixtures obtained from 5 grams of fresh solid sample and 5 grams of water
from the studied site. The mixtures, in triplicate, were placed in 15 ml borosilicate flasks and
incubated with 199HgCl2 (100 ng g-1) and MM201HgCl (0.5 ng g-1), under similar conditions as
for the water samples. The experiments were stopped at the end of one day by frozen at -80
°C (Gentes et al., 2013). Control tests (initial time) were conducted by stopping the reactions
immediately after the addition of theisotopic tracers.
Analytical protocols
Hg speciesanalysis in water, sediment and biological substrates were performed by capillary
gas chromatography connected to an inductively coupled plasma mass spectrometer (GC-
ICPMS, Trace). Analytical set-up and methodology for the GC-ICPMS for Hg speciation
analysis are described in detail in (Monperrus et al., 2005b; Monperrus et al., 2008). The
analysis of the gaseous Hg species (i.e. Hg0 and DMHg) was carried out by thermal
desorption of the traps (gold traps and carbotraps, respectively) cryogenic trapping gas
chromatography connected to an inductively coupled plasma mass spectrometer (CT-GC-
ICPMS) according to Bouchet et al. (2011).
The amount of exogenous Hg species deriving from the enriched isotopes 199 and 201
(MM199Hg, MM201Hg, 199Hg (II), 201Hg (II)) after the incubation period and endogenous Hg
species were calculated by isotopic pattern deconvolution methodology (Rodriguez-Gonzalez
et al., 2013). Hg transformation yields for methylation (M) and demethylation (D) can then be

227
calculated by dividing the total amount of MM199Hg formed by the amount of 199Hg(II)
spiked and the amount of MM201Hg disappearing by the amount of MM201Hg added,
respectively. The reduction yield (R) is calculated by dividing the amount of 199Hg0 formed by
the amount of 199Hg(II) spiked. Cations were determined by means of atomic absorption
spectroscopy, and heavy metals by means of ICP-MS quadrupole 7000 ce, Agilent
Technologies, which enabled multiple elements to be determined in the water samples.
Dissolved organic carbon was determined by means of the Shimadzu TOC-VCSN organic
carbon analyzer. Organic and inorganic carbon and sulfur in the suspended solids and
sediments were analyzed by means of a Horiba JobinYvon Emia-320v C/S analyzer.
Evaluation of the net Hg Methylation from incubation experiments and diurnal cycles
Net production/degradation of MMHg over a full day, which we define as net Hg methylation
potential, was calculated from the results obtained with samples exposed to and protected
from sunlight (diurnal and in darkness) using equation 1 (Monperrus et al., 2007a); Bouchet et
al., 2013). The equation takes into account natural concentrations of IHg, MMHg (Tables A,
B, ESI) and M and D potentials (Tables 1, 2); whichever is relevant in each case (water or
sediment).
Equation 1.
Where MMHg net prod. is net methylHg production potential (ng MMHg L-1 d-1 or ng MMHg
g-1 d-1); [IHg] the concentration of natural inorganic Hg; [MMHg] (ng L-1 or ng g-1) the
concentration of natural methylHg; and M and D Hg methylation and MMHg demethylation
potentials (%). It isimportant to note that such estimation provide an average daily integrated
variation of MMHg concentrations, comparable with previous studies, but which does not
take into account specific variability at lower time scale.
In this context, water diurnal cycles surveys of MMHg concentrations were very useful to
assess any production or degradation trend during the course of the day and night. Equation 2
was used to determine the concentrations of MMHg produced or degraded during the day or
the night within the water column. Thus it was possible to estimate a net methylation during
night from sunset to sunrise (from ca. 18 h to 06 h, local time). Like wise, net demethylation
reaction was assessed during the daytime (from ca. 06h to 18h, localtime).
228
In equation 2, ΔMMHg cycle is the variation in MMHg concentration over the course of 24
hours; [MMHg]tf and [MMHg]t0 are the concentration of methylHg (ng L-1) at chosen initial
and final times tfandt0(ie. from sunrise to sunset or sunset to sunrise). These in situ assessment
of net methylation or demethylation during the time course of the diurnal cycle have allowed
to distinguish specific dynamic processes occurring in the aquatic system which were not
observable during our 24 h incubation experiments with stable isotopes. In this sense, the
comparison between both approaches is also providing new insights to depict the
biogeochemical processes governing MMHg formation.
Comparison between MMHg diurnal cycles and transformation potentials
We propose here to compare the diurnal variation of MMHg concentrations in water over a
24-hour period with the net M potentials obtained during the 24 hours incubation
experiments. Diurnal variation of MMHg concentrations was calculated by means of equation
2 (details in SM). Net M is obtained from equation 1 and all data were integrated over the
water column depth (Table C). Diurnal MMHg production in surface water at the SS site in
the dry season (45.5 ± 12.0 ng m-2 d-1) (Table C) is higher than that obtained from the
experiment with Hg enriched isotopes over 24h (-9.5 ± 30.2 ng m-2 d-1). The high MMHg
value in water, assessed over a 24-period, probably reflects the quantities of MMHg released
from sediment, floating organic substrates and suspended matter in the water column (Table 3
and references therein). The same phenomenon was observed at NS site during the wet
season, with the difference that MMHg concentration in a 24-hour period (456.4 ± 76.1 ng m-
2 d-1) was 10 times higher than at SS during the dry season (Table C).
Both methylation and demethylation potentials in the water were nil (Table 1). To explain
such difference, it is possible that MMHg input or removal during the night and the day,
respectively, are tightly related to significant exchange with other aquatic compartments such
as sediment and/or bio-organic substrate (see below). Several studies have also proposed that
benthic fluxes and various types of “biofilm” are significant sources or sink of Hg to the water
column (Point et al., 2007b; Bouchet et al., 2013; Lanza et al., 2015).
24 h incubations were not able to depict the reactivity of Hg below a daily scale, thus
probably underestimating the diurnal variability of Hg species in the water column. On the
other hand, they allow to establish a clear mass balance of the Hg species within a 24 h cycle
within the water column and without any contribution from other compartments. Thus
simultaneous in situ measurements and incubation over 24 h are relevant and complementary
to unravel the processes affecting MMHg in such complex ecosystem.
229
References :
Bouchet S., Tessier E., Monperrus M., Bridou R., Clavier J., Thouzeau G., Amouroux D.,
2011. Measurements of gaseous Hg exchanges at the sediment-water, water-atmosphere and
sediment-atmosphere interfaces of a tidal environment (Arcachon Bay, France).J. Environ.
Monitor. 13: 1351.
Bouchet, S., Amouroux, D., Rodriguez-Gonzalez, P., Tessier, E., Monperrus, M., Thouzeau,
G., Clavier, J., Amice, E., Deborde, J., Bujean, S., Anschutz, P., Grall, J., 2013. MMHg
production and export from intertidal sediments to the water column of a tidal lagoon
(Arcachon Bay, France). Biogeochem. 114, 341-358.
Condom, T., Coudrain, A., Dezetter, A., Brunstein, D., Delclaux, F., Sicart. J-E., 2004.
Transient modelling of lacustrine regressions: two case studies from the Andean Altiplano.
Hydrol.Process. 18, 2395-2408.
García M.E., 2006. Transport of Arsenic and Heavy Metals to Lake Poopó – Bolivia Natural
Leakage and AntropogenicEffects.Thesis, Lund, Sweden.
Gentès, S., Monperrus, M., Legeay, A., Maury-Brachet, R., Davail, S., André, J., Guyoneaud,
R., 2013. Incidence of invasive macrophytes on methylHg budget in temperate lakes: central
role of bacterial periphytic communities. Environ. Pollut. 172, 116-123.
Guyot, J.L., Roche, M.A., Noriega, L., Calle, H., Quintanilla, J., 1990. Salinities and
Sediment Transport in the Bolivian Highlands. J. Hydrology, 113,147-162.
Monperrus, M., Rodriguez-Gonzalez, P., Amouroux, D., Garcia Alonso, J.I., Donard, O.F.X.,
2008. Evaluating the potential and limitations of double spiking species-specific isotope
dilution analysis for the accurate quantification of Hg species in different environmental
matrices.Anal.Bioanal. Chem. 390, 655-666.
Monperrus, M., Tessier, E., Amouroux, D., Leynaert, A., Huonnic, P., Donard, O.F.X., 2007.
Hg methylation, demethylation and reduction rates in coastal and marine surface waters of the
Mediterranean.Sea. Mar. Chem. 107, 49-63.
Monperrus, M., Tessier, E., Veschambre, S., Amouroux, D., Donard, O.F.X.,
2005.Simultaneous speciation of Hg and butyltin compounds in natural waters and snow by
propylation and species specific isotope dilution mass spectrometry analysis. Anal. Bioanal.
Chem. 381, 854-862.
Rodriguez-Gonzalez, P., Bouchet, S., Monperrus, M., Tessier, E., Amouroux, D., 2013. In
situ experiments for element species-specific environmental reactivity of tin and Hg
compounds using isotopic tracers and multiple linear regressions.Environ. Sci. Pollut. Res.
20, 1269-1280.
UNEP, 1996. Diagnóstico Ambiental del Sistema TDSP. División de Aguas Continentales
de las Naciones Unidas para el Medio Ambiente.
Villafañe, V.E., Helbling E.W., 2003. Radiación ultravioleta solar en el lago Titicaca, Bolivia:
Efectos y adaptación de los organismos planctónicos. La radiación ultraviolet en Bolivia. 7,
85-98.
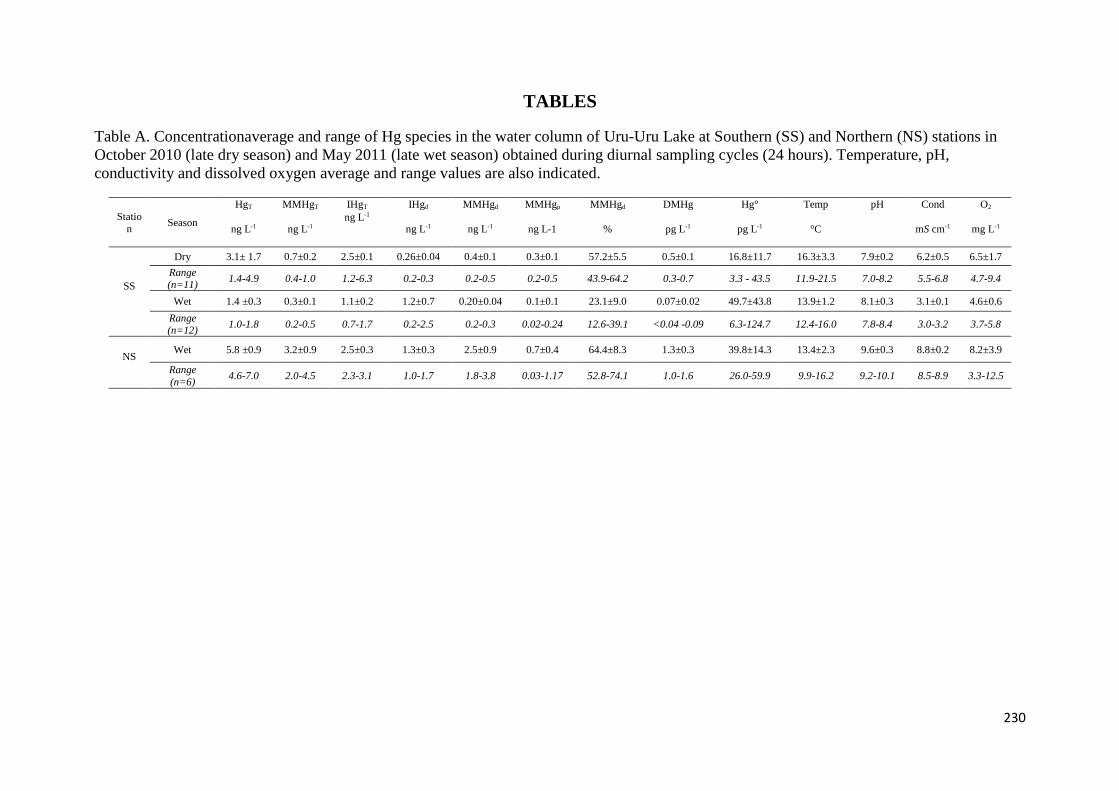
230
TABLES
Table A. Concentrationaverage and range of Hg species in the water column of Uru-Uru Lake at Southern (SS) and Northern (NS) stations in
October 2010 (late dry season) and May 2011 (late wet season) obtained during diurnal sampling cycles (24 hours). Temperature, pH,
conductivity and dissolved oxygen average and range values are also indicated.
Station
Season
HgT MMHgT IHgT IHgd MMHgd MMHgp MMHgd DMHg Hg° Temp pH Cond O2
ng L-1 ng L-1 ng L-1
ng L-1 ng L-1 ng L-1 % pg L-1 pg L-1 °C mS cm-1 mg L-1
SS
Dry 3.1± 1.7 0.7±0.2 2.5±0.1 0.26±0.04 0.4±0.1 0.3±0.1 57.2±5.5 0.5±0.1 16.8±11.7 16.3±3.3 7.9±0.2 6.2±0.5 6.5±1.7
Range (n=11)
1.4-4.9 0.4-1.0 1.2-6.3 0.2-0.3 0.2-0.5 0.2-0.5 43.9-64.2 0.3-0.7 3.3 - 43.5 11.9-21.5 7.0-8.2 5.5-6.8 4.7-9.4
Wet 1.4 ±0.3 0.3±0.1 1.1±0.2 1.2±0.7 0.20±0.04 0.1±0.1 23.1±9.0 0.07±0.02 49.7±43.8 13.9±1.2 8.1±0.3 3.1±0.1 4.6±0.6
Range (n=12)
1.0-1.8 0.2-0.5 0.7-1.7 0.2-2.5 0.2-0.3 0.02-0.24 12.6-39.1 <0.04 -0.09 6.3-124.7 12.4-16.0 7.8-8.4 3.0-3.2 3.7-5.8
NS
Wet 5.8 ±0.9 3.2±0.9 2.5±0.3 1.3±0.3 2.5±0.9 0.7±0.4 64.4±8.3 1.3±0.3 39.8±14.3 13.4±2.3 9.6±0.3 8.8±0.2 8.2±3.9
Range
(n=6) 4.6-7.0 2.0-4.5 2.3-3.1 1.0-1.7 1.8-3.8 0.03-1.17 52.8-74.1 1.0-1.6 26.0-59.9 9.9-16.2 9.2-10.1 8.5-8.9 3.3-12.5
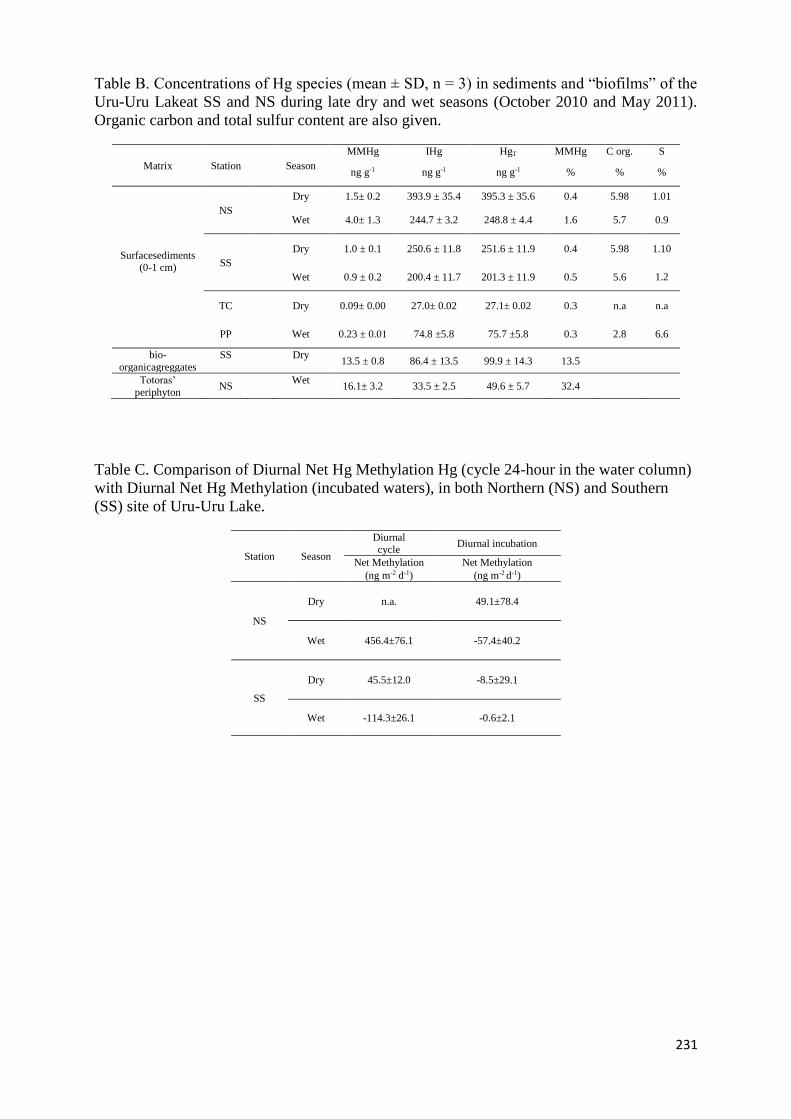
231
Table B. Concentrations of Hg species (mean ± SD, n = 3) in sediments and “biofilms” of the
Uru-Uru Lakeat SS and NS during late dry and wet seasons (October 2010 and May 2011).
Organic carbon and total sulfur content are also given.
Matrix Station Season
MMHg IHg HgT MMHg C org. S
ng g-1 ng g-1 ng g-1 % % %
Surfacesediments (0-1 cm)
NS
Dry 1.5± 0.2 393.9 ± 35.4 395.3 ± 35.6 0.4 5.98 1.01
Wet 4.0± 1.3 244.7 ± 3.2 248.8 ± 4.4 1.6 5.7 0.9
SS
Dry 1.0 ± 0.1 250.6 ± 11.8 251.6 ± 11.9 0.4 5.98 1.10
Wet 0.9 ± 0.2 200.4 ± 11.7 201.3 ± 11.9 0.5 5.6 1.2
TC Dry 0.09± 0.00 27.0± 0.02 27.1± 0.02 0.3 n.a n.a
PP Wet 0.23 ± 0.01 74.8 ±5.8 75.7 ±5.8 0.3 2.8 6.6
bio-
organicagreggates
SS
Dry
13.5 ± 0.8 86.4 ± 13.5 99.9 ± 14.3 13.5
Totoras’
periphyton NS
Wet
16.1± 3.2 33.5 ± 2.5 49.6 ± 5.7 32.4
Table C. Comparison of Diurnal Net Hg Methylation Hg (cycle 24-hour in the water column)
with Diurnal Net Hg Methylation (incubated waters), in both Northern (NS) and Southern
(SS) site of Uru-Uru Lake.
Station Season
Diurnal cycle
Diurnal incubation
Net Methylation Net Methylation
(ng m-2 d-1) (ng m-2 d-1)
NS
Dry n.a. 49.1±78.4
Wet 456.4±76.1 -57.4±40.2
SS
Dry 45.5±12.0 -8.5±29.1
Wet -114.3±26.1 -0.6±2.1
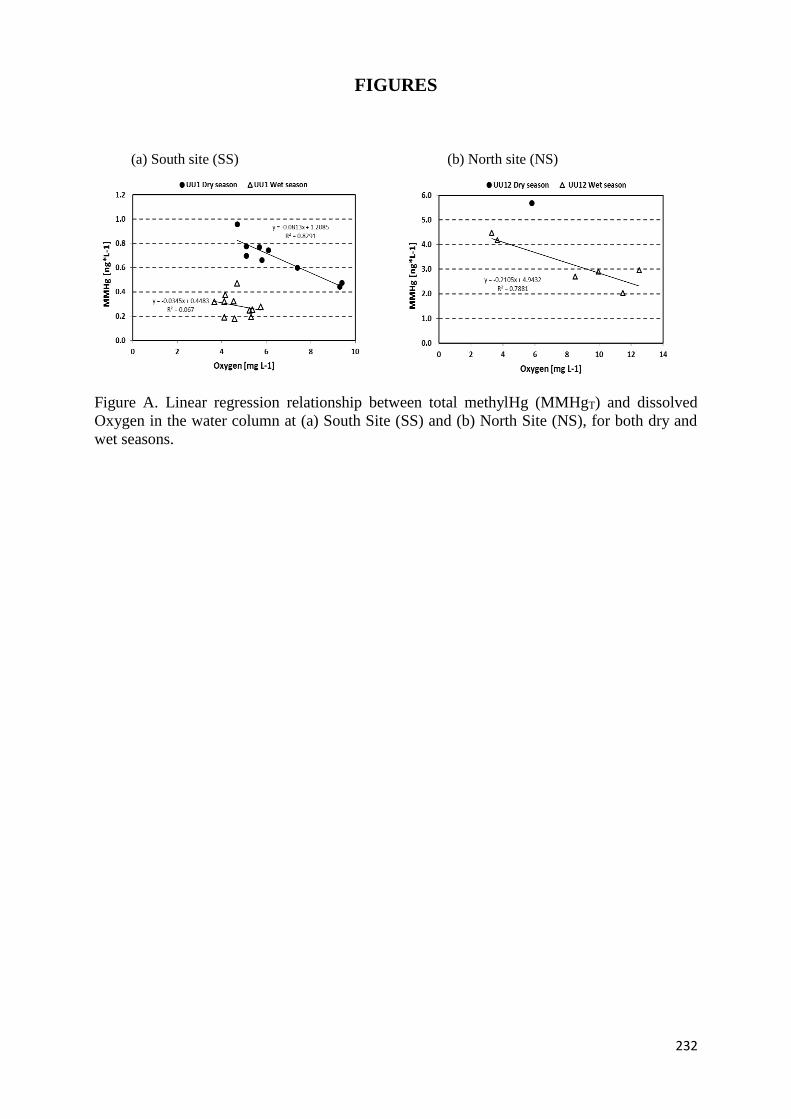
232
FIGURES
(a) South site (SS) (b) North site (NS)
Figure A. Linear regression relationship between total methylHg (MMHgT) and dissolved
Oxygen in the water column at (a) South Site (SS) and (b) North Site (NS), for both dry and
wet seasons.
233
Artículo 1 : Synergistic effects of mining
and urban effluents on the level and
distribution of methylHg in a shallow
aquatic ecosystem of the Bolivian
Altiplano
Synergistic effects of mining and urban effluents onthe level and distribution of methylmercury ina shallow aquatic ecosystem of the BolivianAltiplano†
L. Alanoca,ab S. Guedron,*bcd D. Amouroux,ef S. Audry,a M. Monperrus,e E. Tessier,e
S. Goix,a D. Acha,f P. Seylera and D. Pointaf
Lake Uru Uru (3686m a.s.l.) located in the Bolivian Altiplano region receives bothmining effluents and urban
wastewater discharges originating from the surrounding local cities which are under rapid development. We
followed the spatiotemporal distribution of different mercury (Hg) compounds and other metal(oid)s (e.g.,
Fe, Mn, Sb, Ti and W) in both water and sediments during the wet and dry seasons along a north-south
transect of this shallow lake system. Along the transect, the highest Hg and metal(oid) concentrations in
both water and sediments were found downstream of the confluences with mining effluents. Although
a dilution effect was found for major elements during the wet season, mean Hg and metal(oid)
concentrations did not significantly differ from the dry season due to the increase in acid mine drainage
(AMD) inputs into the lake from upstream mining areas. In particular, high filtered (<0.45 mm) mono-
methylmercury (MMHg) concentrations (0.69 � 0.47 ng L�1) were measured in surface water
representing 49 � 11% of the total filtered Hg concentrations (THgF) for both seasons. Enhanced MMHg
lability in relation with the water alkalinity, coupled with abundant organic ligands and colloids (especially
for downstream mining effluents), are likely factors favoring Hg methylation and MMHg preservation
while inhibiting MMHg photodegradation. Lake sediments were identified as the major source of MMHg
for the shallow water column. During the dry season, diffusive fluxes were estimated to be 227 ng m�2
d�1 for MMHg. This contribution was found to be negligible during the wet season due to a probable
shift of the redox front downwards in the sediments. During the wet season, the results obtained suggest
that various sources such as mining effluents and benthic or macrophytic biofilms significantly
contribute to MMHg inputs in the water column. This work demonstrates the seasonally dependent
synergistic effect of AMD and urban effluents on the shallow, productive and evaporative high altitude
lake ecosystems which promotes the formation of natural organometallic toxins such as MMHg in the
water column.
Environmental impact
Lakes and reservoirs are the central feature of high altitude landscapes since they are unique endemic ecological systems that provide water and halieuticresources for human life. The recent urban development of bordering cities with their associated mining activities disturbs these fragile ecosystems. Byunderstanding the fate and behavior of metal(oid)s (originating from anthropogenic inputs; e.g., wastewater and mining effluents) in these aquatic ecosystems,we can identify the major (a)biotic pathways and biogeochemical conditions that favor or restrict the production and trophic transfer of toxic contaminants tobiota and humans. Finally, this contribution will help and be used to inform policy makers for water resource mitigation and monitoring efforts.
aGeosciences Environnement Toulouse, UMR5563, IRD UR 234, Universite Paul
Sabatier, 14 Avenue Edouard Belin, 31400 Toulouse, FrancebLaboratorio de Hidroquımica, Instituto de Investigaciones Quımicas, Universidad
Mayor de San Andres, Campus Universitario de Cota Cota, Casilla 3161, La Paz,
Bolivia. E-mail: [email protected] de Recherche pour le Developpement, ISTerre, UMR 5275, F-38041
Grenoble, FrancedUniversite Grenoble Alpes, Institut des Sciences de la Terre (ISTerre), F-38041
Grenoble, France
eLaboratoire de Chimie Analytique Bio-inorganique et Environnement (LCABIE),
Institut des Sciences Analytiques et de Physico-Chimie pour l'Environnement et les
Materiaux, IPREM UMR 5254 CNRS, Universite de Pau et des Pays de l'Adour,
Helioparc Pau Pyrenees, 2, av. P. Angot, 64053 Pau Cedex 9, FrancefLaboratorio de Calidad Ambiental (LCA), Instituto de Ecologia, Universidad Mayor
de San Andres, Campus Universitario de Cota Cota, Casilla 3161, La Paz, Bolivia
† Electronic supplementary information (ESI) available. See DOI:10.1039/c6em00547k
Cite this: Environ. Sci.: ProcessesImpacts, 2016, 18, 1550
Received 5th October 2016Accepted 11th November 2016
DOI: 10.1039/c6em00547k
rsc.li/process-impacts
1550 | Environ. Sci.: Processes Impacts, 2016, 18, 1550–1560 This journal is © The Royal Society of Chemistry 2016
EnvironmentalScienceProcesses & Impacts
PAPER
234
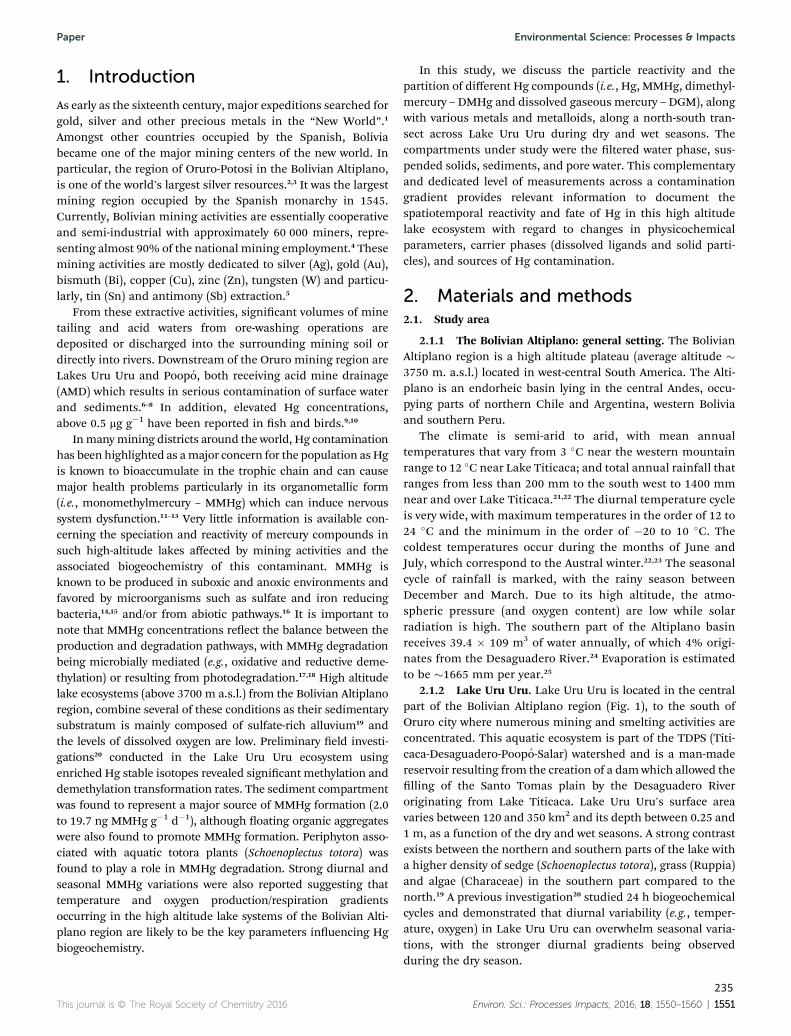
1. Introduction
As early as the sixteenth century, major expeditions searched forgold, silver and other precious metals in the “New World”.1
Amongst other countries occupied by the Spanish, Boliviabecame one of the major mining centers of the new world. Inparticular, the region of Oruro-Potosi in the Bolivian Altiplano,is one of the world's largest silver resources.2,3 It was the largestmining region occupied by the Spanish monarchy in 1545.Currently, Bolivian mining activities are essentially cooperativeand semi-industrial with approximately 60 000 miners, repre-senting almost 90% of the national mining employment.4 Thesemining activities are mostly dedicated to silver (Ag), gold (Au),bismuth (Bi), copper (Cu), zinc (Zn), tungsten (W) and particu-larly, tin (Sn) and antimony (Sb) extraction.5
From these extractive activities, signicant volumes of minetailing and acid waters from ore-washing operations aredeposited or discharged into the surrounding mining soil ordirectly into rivers. Downstream of the Oruro mining region areLakes Uru Uru and Poopo, both receiving acid mine drainage(AMD) which results in serious contamination of surface waterand sediments.6–8 In addition, elevated Hg concentrations,above 0.5 mg g�1 have been reported in sh and birds.9,10
Inmanymining districts around the world, Hg contaminationhas been highlighted as amajor concern for the population as Hgis known to bioaccumulate in the trophic chain and can causemajor health problems particularly in its organometallic form(i.e., monomethylmercury – MMHg) which can induce nervoussystem dysfunction.11–13 Very little information is available con-cerning the speciation and reactivity of mercury compounds insuch high-altitude lakes affected by mining activities and theassociated biogeochemistry of this contaminant. MMHg isknown to be produced in suboxic and anoxic environments andfavored by microorganisms such as sulfate and iron reducingbacteria,14,15 and/or from abiotic pathways.16 It is important tonote that MMHg concentrations reect the balance between theproduction and degradation pathways, with MMHg degradationbeing microbially mediated (e.g., oxidative and reductive deme-thylation) or resulting from photodegradation.17,18 High altitudelake ecosystems (above 3700 m a.s.l.) from the Bolivian Altiplanoregion, combine several of these conditions as their sedimentarysubstratum is mainly composed of sulfate-rich alluvium19 andthe levels of dissolved oxygen are low. Preliminary eld investi-gations20 conducted in the Lake Uru Uru ecosystem usingenriched Hg stable isotopes revealed signicant methylation anddemethylation transformation rates. The sediment compartmentwas found to represent a major source of MMHg formation (2.0to 19.7 ng MMHg g�1 d�1), although oating organic aggregateswere also found to promote MMHg formation. Periphyton asso-ciated with aquatic totora plants (Schoenoplectus totora) wasfound to play a role in MMHg degradation. Strong diurnal andseasonal MMHg variations were also reported suggesting thattemperature and oxygen production/respiration gradientsoccurring in the high altitude lake systems of the Bolivian Alti-plano region are likely to be the key parameters inuencing Hgbiogeochemistry.
In this study, we discuss the particle reactivity and thepartition of different Hg compounds (i.e., Hg, MMHg, dimethyl-mercury – DMHg and dissolved gaseous mercury – DGM), alongwith various metals and metalloids, along a north-south tran-sect across Lake Uru Uru during dry and wet seasons. Thecompartments under study were the ltered water phase, sus-pended solids, sediments, and pore water. This complementaryand dedicated level of measurements across a contaminationgradient provides relevant information to document thespatiotemporal reactivity and fate of Hg in this high altitudelake ecosystem with regard to changes in physicochemicalparameters, carrier phases (dissolved ligands and solid parti-cles), and sources of Hg contamination.
2. Materials and methods2.1. Study area
2.1.1 The Bolivian Altiplano: general setting. The BolivianAltiplano region is a high altitude plateau (average altitude �3750 m. a.s.l.) located in west-central South America. The Alti-plano is an endorheic basin lying in the central Andes, occu-pying parts of northern Chile and Argentina, western Boliviaand southern Peru.
The climate is semi-arid to arid, with mean annualtemperatures that vary from 3 �C near the western mountainrange to 12 �C near Lake Titicaca; and total annual rainfall thatranges from less than 200 mm to the south west to 1400 mmnear and over Lake Titicaca.21,22 The diurnal temperature cycleis very wide, with maximum temperatures in the order of 12 to24 �C and the minimum in the order of �20 to 10 �C. Thecoldest temperatures occur during the months of June andJuly, which correspond to the Austral winter.22,23 The seasonalcycle of rainfall is marked, with the rainy season betweenDecember and March. Due to its high altitude, the atmo-spheric pressure (and oxygen content) are low while solarradiation is high. The southern part of the Altiplano basinreceives 39.4 � 109 m3 of water annually, of which 4% origi-nates from the Desaguadero River.24 Evaporation is estimatedto be �1665 mm per year.25
2.1.2 Lake Uru Uru. Lake Uru Uru is located in the centralpart of the Bolivian Altiplano region (Fig. 1), to the south ofOruro city where numerous mining and smelting activities areconcentrated. This aquatic ecosystem is part of the TDPS (Titi-caca-Desaguadero-Poopo-Salar) watershed and is a man-madereservoir resulting from the creation of a damwhich allowed thelling of the Santo Tomas plain by the Desaguadero Riveroriginating from Lake Titicaca. Lake Uru Uru's surface areavaries between 120 and 350 km2 and its depth between 0.25 and1 m, as a function of the dry and wet seasons. A strong contrastexists between the northern and southern parts of the lake witha higher density of sedge (Schoenoplectus totora), grass (Ruppia)and algae (Characeae) in the southern part compared to thenorth.19 A previous investigation20 studied 24 h biogeochemicalcycles and demonstrated that diurnal variability (e.g., temper-ature, oxygen) in Lake Uru Uru can overwhelm seasonal varia-tions, with the stronger diurnal gradients being observedduring the dry season.
This journal is © The Royal Society of Chemistry 2016 Environ. Sci.: Processes Impacts, 2016, 18, 1550–1560 | 1551
Paper Environmental Science: Processes & Impacts
235
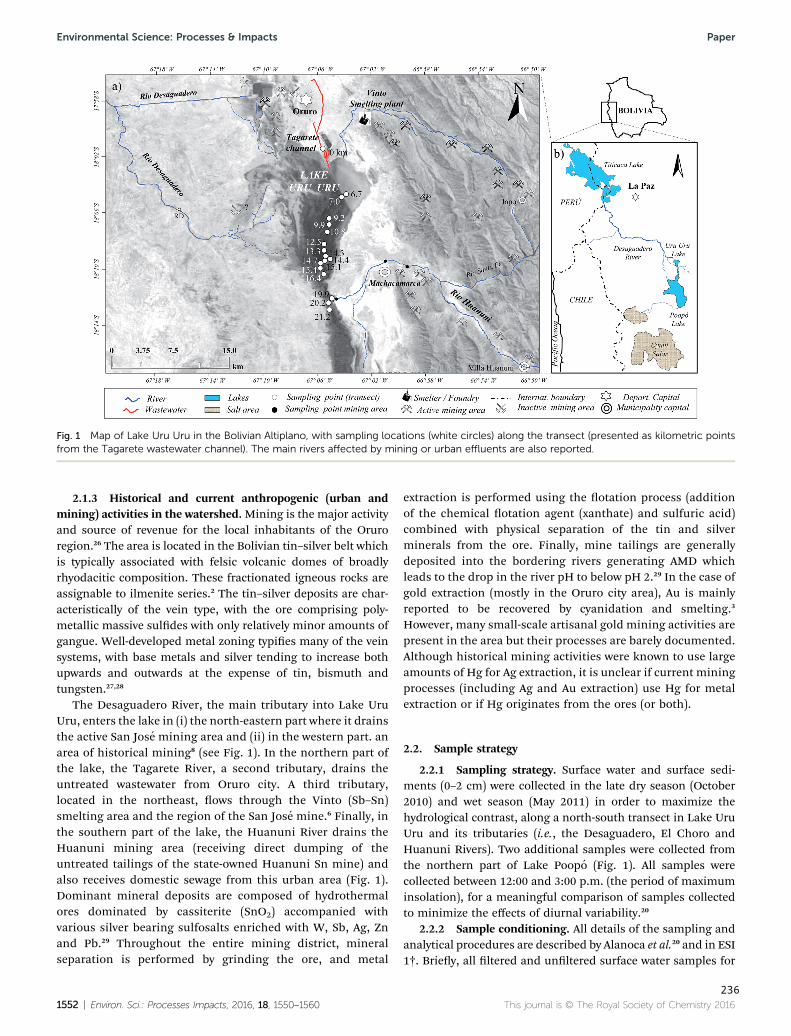
2.1.3 Historical and current anthropogenic (urban andmining) activities in the watershed.Mining is the major activityand source of revenue for the local inhabitants of the Oruroregion.26 The area is located in the Bolivian tin–silver belt whichis typically associated with felsic volcanic domes of broadlyrhyodacitic composition. These fractionated igneous rocks areassignable to ilmenite series.2 The tin–silver deposits are char-acteristically of the vein type, with the ore comprising poly-metallic massive suldes with only relatively minor amounts ofgangue. Well-developed metal zoning typies many of the veinsystems, with base metals and silver tending to increase bothupwards and outwards at the expense of tin, bismuth andtungsten.27,28
The Desaguadero River, the main tributary into Lake UruUru, enters the lake in (i) the north-eastern part where it drainsthe active San Jose mining area and (ii) in the western part. anarea of historical mining8 (see Fig. 1). In the northern part ofthe lake, the Tagarete River, a second tributary, drains theuntreated wastewater from Oruro city. A third tributary,located in the northeast, ows through the Vinto (Sb–Sn)smelting area and the region of the San Jose mine.6 Finally, inthe southern part of the lake, the Huanuni River drains theHuanuni mining area (receiving direct dumping of theuntreated tailings of the state-owned Huanuni Sn mine) andalso receives domestic sewage from this urban area (Fig. 1).Dominant mineral deposits are composed of hydrothermalores dominated by cassiterite (SnO2) accompanied withvarious silver bearing sulfosalts enriched with W, Sb, Ag, Znand Pb.29 Throughout the entire mining district, mineralseparation is performed by grinding the ore, and metal
extraction is performed using the otation process (additionof the chemical otation agent (xanthate) and sulfuric acid)combined with physical separation of the tin and silverminerals from the ore. Finally, mine tailings are generallydeposited into the bordering rivers generating AMD whichleads to the drop in the river pH to below pH 2.29 In the case ofgold extraction (mostly in the Oruro city area), Au is mainlyreported to be recovered by cyanidation and smelting.3
However, many small-scale artisanal gold mining activities arepresent in the area but their processes are barely documented.Although historical mining activities were known to use largeamounts of Hg for Ag extraction, it is unclear if current miningprocesses (including Ag and Au extraction) use Hg for metalextraction or if Hg originates from the ores (or both).
2.2. Sample strategy
2.2.1 Sampling strategy. Surface water and surface sedi-ments (0–2 cm) were collected in the late dry season (October2010) and wet season (May 2011) in order to maximize thehydrological contrast, along a north-south transect in Lake UruUru and its tributaries (i.e., the Desaguadero, El Choro andHuanuni Rivers). Two additional samples were collected fromthe northern part of Lake Poopo (Fig. 1). All samples werecollected between 12:00 and 3:00 p.m. (the period of maximuminsolation), for a meaningful comparison of samples collectedto minimize the effects of diurnal variability.20
2.2.2 Sample conditioning. All details of the sampling andanalytical procedures are described by Alanoca et al.20 and in ESI1†. Briey, all ltered and unltered surface water samples for
Fig. 1 Map of Lake Uru Uru in the Bolivian Altiplano, with sampling locations (white circles) along the transect (presented as kilometric pointsfrom the Tagarete wastewater channel). The main rivers affected by mining or urban effluents are also reported.
1552 | Environ. Sci.: Processes Impacts, 2016, 18, 1550–1560 This journal is © The Royal Society of Chemistry 2016
Environmental Science: Processes & Impacts Paper
236
Hg speciation were collected in acid-washed FEP Teoncontainers,30 ltered with 0.45 mm PVDF lters (Millipore,Bedford, MA, USA) and acidied with HCl (1%, v/v, Ultrex grade– Baker). Filtered subsamples of metals and cations were storedin acid washed polypropylene 15 mL vials, and acidied withHNO3 (1% v/v, Ultrex grade – Baker). Filtered subsamples ofdissolved organic carbon (DOC), were stored in 40 mL pre-burnt(550 �C) borosilicate vials and acidied with H3PO4 bi-distilledto 2% v/v. Filtered samples of anions were stored in unwashed15 mL polypropylene vials and stored frozen (�20 �C) untilanalysis. Physico-chemical parameters (temperature, pH,conductivity, and dissolved O2) were measured at each site inparallel to the water sample collection.
Surface sediments were recovered using a Large Bore Inter-face Corer (Aquatic Research Instruments®) equipped witha polycarbonate core tube (60 cm length; 10 cm inner diameter).Surface sediments from cores was subsequently extruded, slicedwith an acid cleaned plastic cutter and immediately collected inacid cleaned 200 mL propylene centrifuge vials, N2-ushed andcentrifuged at 4000 rpm for 20 min. For each sample, thesupernatant (i.e. porewater) was divided into three aliquots fornutrient, anion, and metal/metalloid analyses.
2.3. Analytical methods
All details for QA/QC are given in ESI 1.†2.3.1 Surface and pore water analysis. 55 elements (Ca, Li,
Be, Na, Mg, Al, P, K, Ti, V, Cr, Mn, Fe, Co, Ni, Cu, Zn, As, Se, Sr,Mo, Ag, Cd, Sn, Sb, Pb, U, B, Si, Ga, Ge, Rb, Nb, In, Te, Cs, Ba, La,Ce, Pr, Nd, Sm, Gd, Dy, Ho, Er, Tm, Yb, Lu, Hf, Ta, W, Tl, Th andEu) were determined by means of atomic absorption spectros-copy for the major elements, and by means of ICP-MS (quad-rupole 7000 ce, Agilent Technologies) for trace elements, whichenabled multiple elements to be determined in the lteredwater samples. Anions were determined by means of ion chro-matography, using a Dionex ICS 2000 chromatograph. Thedetection limits (DLs) of SO4
2�, Cl�, and NO3� were 0.02, 0.04
and 0.002 mg L�1, respectively, with a reproducibility of 5%.DOC was determined by means of the Shimadzu TOC-VCSNorganic carbon analyzer. Organic and inorganic carbon andsulfur in sediments were analyzed by means of a Horiba JobinYvon Emia-320v C/S analyzer.
Hg compound analyses in water were performed by capillarygas chromatography connected to an inductively coupledplasma mass spectrometer (GC-ICPMS, X Series II, ThermoFisher). Analytical set-up and methodology for the GC-ICPMSfor Hg speciation analysis by species-specic isotope dilutionare described by Monperrus et al.31,32 (ESI 1†). Gaseous mercuryspecies (i.e., dissolved gaseous mercury (DGM) and dime-thylmercury (DMHg)) were purged (generally within �0.5 h ofsampling) and collected on gold-coated sand (Brooks Rand®)and activated charcoal (Carbotrap®, B, mesh 20–40, Sigma-Aldrich) traps, respectively. The analysis of the gaseous Hgspecies (i.e. Hg� and DMHg) was carried out by cryogenic trap-ping gas chromatography connected to an inductively coupledplasma mass spectrometer (CT-GC-ICPMS) according toprevious studies.33,34
2.3.2 Sediment analysis. Solid samples (sediments andsuspended solids) were freeze-dried and crushed to obtaina size smaller than 63 mm for elemental analysis. Total partic-ulate organic carbon ([TOC]) concentrations were determinedfrom the dry combustion of the solid powder sample aliquotsusing a C/S Horiba Jobin Yvon Emia-320v auto-analyzer.
Sediment digestion was performed using �200 mg of freeze-dried sediments, digested in a mixture of HCl (2 mL, Ultrexgrade – Baker), HNO3 (9mL, Ultrex grade – Baker) and HF (3mL,Ultrex grade – Baker) in a microwave system (CEM Mars System5 model). Digestion solutions were then diluted and subse-quently measured by ICP-MS (model 7500ce, Agilent Technol-ogies) to assess the total quantity of metals (Al, Ca, Mg, Fe, Cr,Cd, As, Cu, Mn, Ni, Pb, Se, and Zn) in each sediment sample.Accuracy was checked using a certied reference material(CRM), namely PACS-2 (National Research Council of Canada)for QA/QC (given replicates and values are tabulated in theESI†).
Hg compound analysis of the sediments was performed byGC-ICPMS and is described elsewhere.32 Quantication of Hgspecies was carried out using species-specic isotope dilutionand by applying isotope pattern deconvolution for datatreatment.
Total particulate Hg concentrations ([THgP]) were obtainedby summing MMHg and IHg. Concentrations obtained forrepeated analyses of CRMs never exceeded the published rangeof concentrations (IAEA 405: 818� 17 ng g�1 and 5.29� 0.24 ngg�1 for THg andMMHg, respectively). The detection limits, were0.20 and 0.01 ng g�1, for THg and MMHg, respectively.
2.4. Statistical treatment and data presentation
The correlation coefficients (R) and p-values are reported in themanuscript for the computed linear regressions. Pairwise slopecomparison for regressions built from individual studies wasrealized with a t-test. We also used non-parametric tests, theMann–Whitney rank sum test (U-test), and the Kruskal–Wallisone-way analysis of variance on ranks (H-test), to compare two, ormore sets of data, respectively, and pairwise multiple compari-sons according to Dunn's method to isolate the set or sets thatdiffered from the others. Linear regressions were performed onlywhen the data passed the normality test, constant variance testand alpha power of the performed regression (a test, p > 0.8).When datasets did not follow a normal distribution, we per-formed a Spearman rank order correlation test (Rho test). Allstatistical analyses were performed using the Sigmastat® package(Systat Soware Inc.) or R soware (R.2.14.2). All data are pre-sented in the manuscript and (ESI 2†) as mean � SD and thecomplete dataset is presented in ESI 3†.
3. Results and discussion3.1. Geochemistry and methylmercury content in Lake UruUru
3.1.1 Eutrophication in the context of a high altitudeecosystem. The water cycle of this high altitude endorheic lakesystem is dominated by evaporation due to high solar radiation
This journal is © The Royal Society of Chemistry 2016 Environ. Sci.: Processes Impacts, 2016, 18, 1550–1560 | 1553
Paper Environmental Science: Processes & Impacts
237
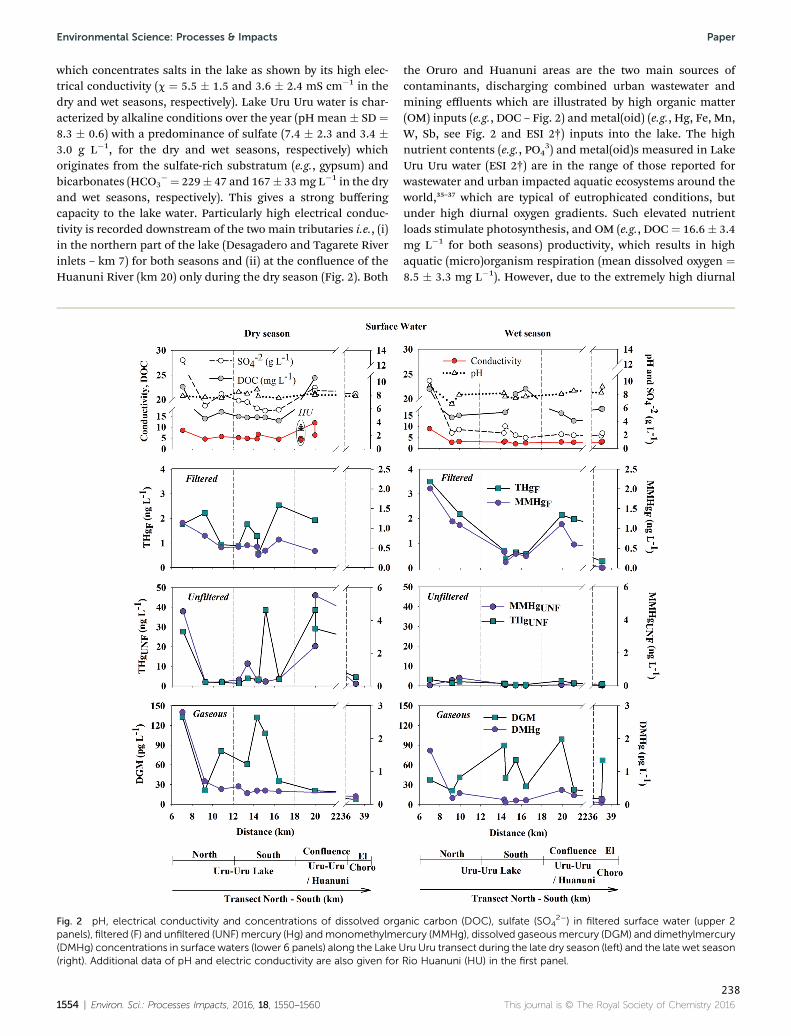
which concentrates salts in the lake as shown by its high elec-trical conductivity (c ¼ 5.5 � 1.5 and 3.6 � 2.4 mS cm�1 in thedry and wet seasons, respectively). Lake Uru Uru water is char-acterized by alkaline conditions over the year (pH mean � SD ¼8.3 � 0.6) with a predominance of sulfate (7.4 � 2.3 and 3.4 �3.0 g L�1, for the dry and wet seasons, respectively) whichoriginates from the sulfate-rich substratum (e.g., gypsum) andbicarbonates (HCO3
� ¼ 229� 47 and 167� 33mg L�1 in the dryand wet seasons, respectively). This gives a strong bufferingcapacity to the lake water. Particularly high electrical conduc-tivity is recorded downstream of the two main tributaries i.e., (i)in the northern part of the lake (Desagadero and Tagarete Riverinlets – km 7) for both seasons and (ii) at the conuence of theHuanuni River (km 20) only during the dry season (Fig. 2). Both
the Oruro and Huanuni areas are the two main sources ofcontaminants, discharging combined urban wastewater andmining effluents which are illustrated by high organic matter(OM) inputs (e.g., DOC – Fig. 2) and metal(oid) (e.g., Hg, Fe, Mn,W, Sb, see Fig. 2 and ESI 2†) inputs into the lake. The highnutrient contents (e.g., PO4
3) and metal(oid)s measured in LakeUru Uru water (ESI 2†) are in the range of those reported forwastewater and urban impacted aquatic ecosystems around theworld,35–37 which are typical of eutrophicated conditions, butunder high diurnal oxygen gradients. Such elevated nutrientloads stimulate photosynthesis, and OM (e.g., DOC¼ 16.6 � 3.4mg L�1 for both seasons) productivity, which results in highaquatic (micro)organism respiration (mean dissolved oxygen ¼8.5 � 3.3 mg L�1). However, due to the extremely high diurnal
Fig. 2 pH, electrical conductivity and concentrations of dissolved organic carbon (DOC), sulfate (SO42�) in filtered surface water (upper 2
panels), filtered (F) and unfiltered (UNF) mercury (Hg) andmonomethylmercury (MMHg), dissolved gaseousmercury (DGM) and dimethylmercury(DMHg) concentrations in surface waters (lower 6 panels) along the Lake Uru Uru transect during the late dry season (left) and the late wet season(right). Additional data of pH and electric conductivity are also given for Rio Huanuni (HU) in the first panel.
1554 | Environ. Sci.: Processes Impacts, 2016, 18, 1550–1560 This journal is © The Royal Society of Chemistry 2016
Environmental Science: Processes & Impacts Paper
238
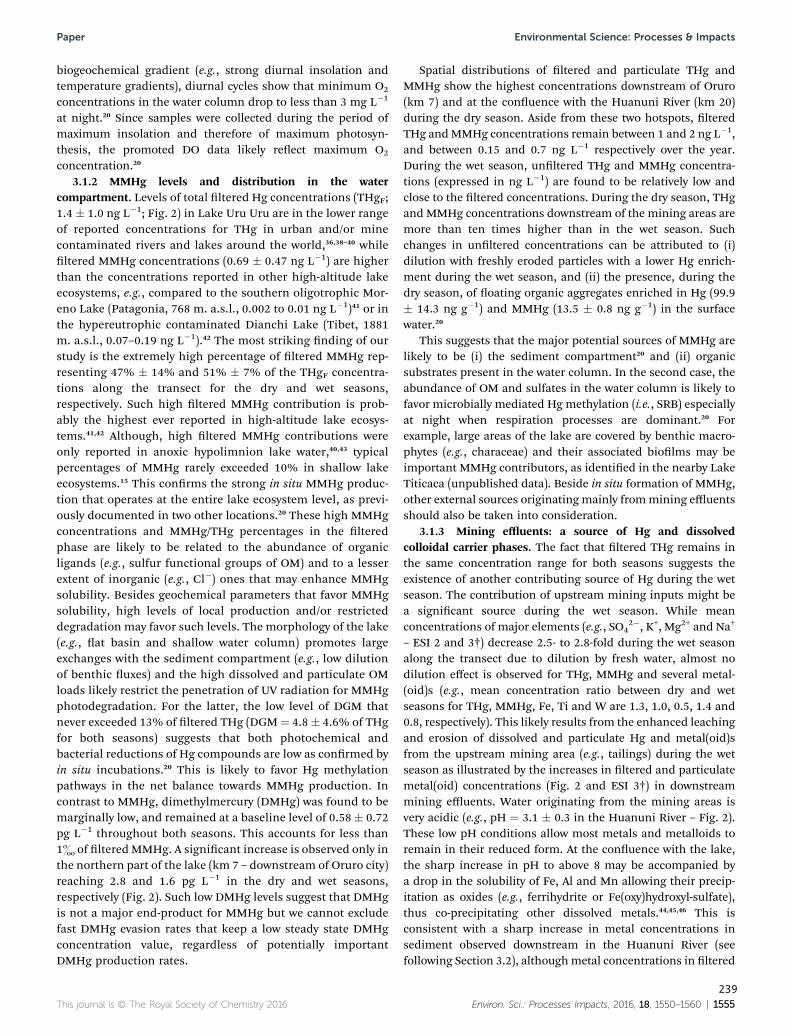
biogeochemical gradient (e.g., strong diurnal insolation andtemperature gradients), diurnal cycles show that minimum O2
concentrations in the water column drop to less than 3 mg L�1
at night.20 Since samples were collected during the period ofmaximum insolation and therefore of maximum photosyn-thesis, the promoted DO data likely reect maximum O2
concentration.20
3.1.2 MMHg levels and distribution in the watercompartment. Levels of total ltered Hg concentrations (THgF;1.4 � 1.0 ng L�1; Fig. 2) in Lake Uru Uru are in the lower rangeof reported concentrations for THg in urban and/or minecontaminated rivers and lakes around the world,36,38–40 whileltered MMHg concentrations (0.69 � 0.47 ng L�1) are higherthan the concentrations reported in other high-altitude lakeecosystems, e.g., compared to the southern oligotrophic Mor-eno Lake (Patagonia, 768 m. a.s.l., 0.002 to 0.01 ng L�1)41 or inthe hypereutrophic contaminated Dianchi Lake (Tibet, 1881m. a.s.l., 0.07–0.19 ng L�1).42 The most striking nding of ourstudy is the extremely high percentage of ltered MMHg rep-resenting 47% � 14% and 51% � 7% of the THgF concentra-tions along the transect for the dry and wet seasons,respectively. Such high ltered MMHg contribution is prob-ably the highest ever reported in high-altitude lake ecosys-tems.41,42 Although, high ltered MMHg contributions wereonly reported in anoxic hypolimnion lake water,40,43 typicalpercentages of MMHg rarely exceeded 10% in shallow lakeecosystems.15 This conrms the strong in situ MMHg produc-tion that operates at the entire lake ecosystem level, as previ-ously documented in two other locations.20 These high MMHgconcentrations and MMHg/THg percentages in the lteredphase are likely to be related to the abundance of organicligands (e.g., sulfur functional groups of OM) and to a lesserextent of inorganic (e.g., Cl�) ones that may enhance MMHgsolubility. Besides geochemical parameters that favor MMHgsolubility, high levels of local production and/or restricteddegradation may favor such levels. The morphology of the lake(e.g., at basin and shallow water column) promotes largeexchanges with the sediment compartment (e.g., low dilutionof benthic uxes) and the high dissolved and particulate OMloads likely restrict the penetration of UV radiation for MMHgphotodegradation. For the latter, the low level of DGM thatnever exceeded 13% of ltered THg (DGM ¼ 4.8 � 4.6% of THgfor both seasons) suggests that both photochemical andbacterial reductions of Hg compounds are low as conrmed byin situ incubations.20 This is likely to favor Hg methylationpathways in the net balance towards MMHg production. Incontrast to MMHg, dimethylmercury (DMHg) was found to bemarginally low, and remained at a baseline level of 0.58 � 0.72pg L�1 throughout both seasons. This accounts for less than1& of ltered MMHg. A signicant increase is observed only inthe northern part of the lake (km 7 – downstream of Oruro city)reaching 2.8 and 1.6 pg L�1 in the dry and wet seasons,respectively (Fig. 2). Such low DMHg levels suggest that DMHgis not a major end-product for MMHg but we cannot excludefast DMHg evasion rates that keep a low steady state DMHgconcentration value, regardless of potentially importantDMHg production rates.
Spatial distributions of ltered and particulate THg andMMHg show the highest concentrations downstream of Oruro(km 7) and at the conuence with the Huanuni River (km 20)during the dry season. Aside from these two hotspots, lteredTHg andMMHg concentrations remain between 1 and 2 ng L�1,and between 0.15 and 0.7 ng L�1 respectively over the year.During the wet season, unltered THg and MMHg concentra-tions (expressed in ng L�1) are found to be relatively low andclose to the ltered concentrations. During the dry season, THgand MMHg concentrations downstream of the mining areas aremore than ten times higher than in the wet season. Suchchanges in unltered concentrations can be attributed to (i)dilution with freshly eroded particles with a lower Hg enrich-ment during the wet season, and (ii) the presence, during thedry season, of oating organic aggregates enriched in Hg (99.9� 14.3 ng g�1) and MMHg (13.5 � 0.8 ng g�1) in the surfacewater.20
This suggests that the major potential sources of MMHg arelikely to be (i) the sediment compartment20 and (ii) organicsubstrates present in the water column. In the second case, theabundance of OM and sulfates in the water column is likely tofavor microbially mediated Hg methylation (i.e., SRB) especiallyat night when respiration processes are dominant.20 Forexample, large areas of the lake are covered by benthic macro-phytes (e.g., characeae) and their associated biolms may beimportant MMHg contributors, as identied in the nearby LakeTiticaca (unpublished data). Beside in situ formation of MMHg,other external sources originating mainly frommining effluentsshould also be taken into consideration.
3.1.3 Mining effluents: a source of Hg and dissolvedcolloidal carrier phases. The fact that ltered THg remains inthe same concentration range for both seasons suggests theexistence of another contributing source of Hg during the wetseason. The contribution of upstream mining inputs might bea signicant source during the wet season. While meanconcentrations of major elements (e.g., SO4
2�, K+, Mg2+ and Na+
– ESI 2 and 3†) decrease 2.5- to 2.8-fold during the wet seasonalong the transect due to dilution by fresh water, almost nodilution effect is observed for THg, MMHg and several metal-(oid)s (e.g., mean concentration ratio between dry and wetseasons for THg, MMHg, Fe, Ti and W are 1.3, 1.0, 0.5, 1.4 and0.8, respectively). This likely results from the enhanced leachingand erosion of dissolved and particulate Hg and metal(oid)sfrom the upstream mining area (e.g., tailings) during the wetseason as illustrated by the increases in ltered and particulatemetal(oid) concentrations (Fig. 2 and ESI 3†) in downstreammining effluents. Water originating from the mining areas isvery acidic (e.g., pH ¼ 3.1 � 0.3 in the Huanuni River – Fig. 2).These low pH conditions allow most metals and metalloids toremain in their reduced form. At the conuence with the lake,the sharp increase in pH to above 8 may be accompanied bya drop in the solubility of Fe, Al and Mn allowing their precip-itation as oxides (e.g., ferrihydrite or Fe(oxy)hydroxyl-sulfate),thus co-precipitating other dissolved metals.44,45,46 This isconsistent with a sharp increase in metal concentrations insediment observed downstream in the Huanuni River (seefollowing Section 3.2), althoughmetal concentrations in ltered
This journal is © The Royal Society of Chemistry 2016 Environ. Sci.: Processes Impacts, 2016, 18, 1550–1560 | 1555
Paper Environmental Science: Processes & Impacts
239
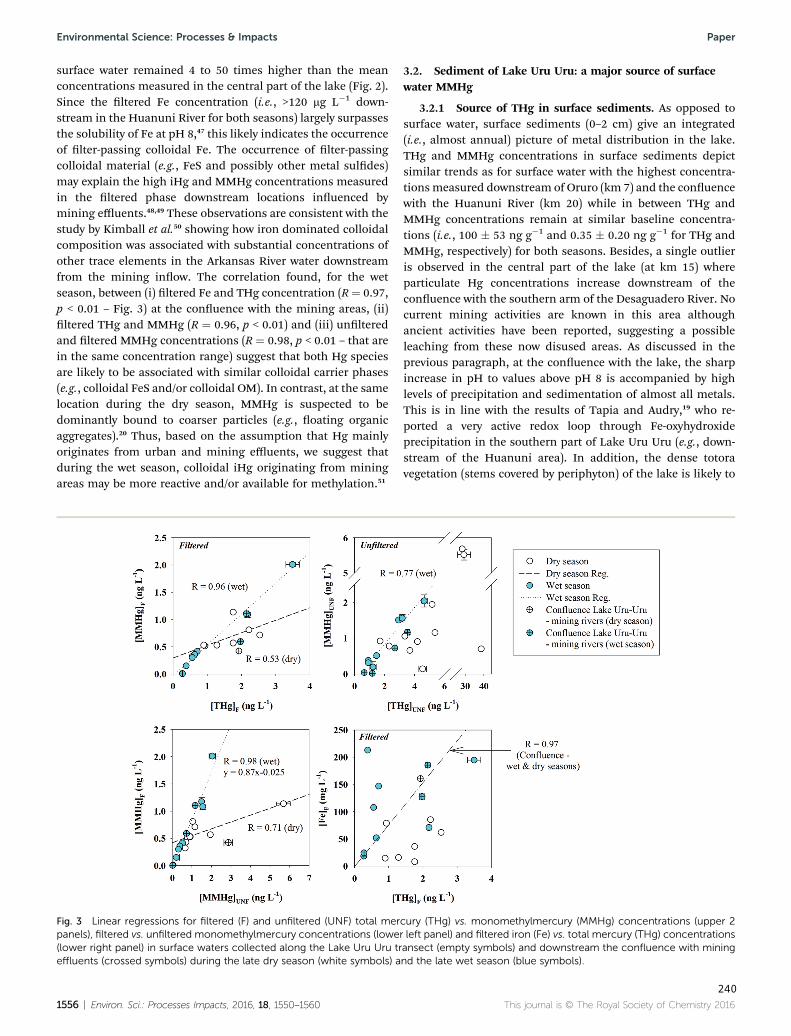
surface water remained 4 to 50 times higher than the meanconcentrations measured in the central part of the lake (Fig. 2).Since the ltered Fe concentration (i.e., >120 mg L�1 down-stream in the Huanuni River for both seasons) largely surpassesthe solubility of Fe at pH 8,47 this likely indicates the occurrenceof lter-passing colloidal Fe. The occurrence of lter-passingcolloidal material (e.g., FeS and possibly other metal suldes)may explain the high iHg and MMHg concentrations measuredin the ltered phase downstream locations inuenced bymining effluents.48,49 These observations are consistent with thestudy by Kimball et al.50 showing how iron dominated colloidalcomposition was associated with substantial concentrations ofother trace elements in the Arkansas River water downstreamfrom the mining inow. The correlation found, for the wetseason, between (i) ltered Fe and THg concentration (R¼ 0.97,p < 0.01 – Fig. 3) at the conuence with the mining areas, (ii)ltered THg and MMHg (R ¼ 0.96, p < 0.01) and (iii) unlteredand ltered MMHg concentrations (R ¼ 0.98, p < 0.01 – that arein the same concentration range) suggest that both Hg speciesare likely to be associated with similar colloidal carrier phases(e.g., colloidal FeS and/or colloidal OM). In contrast, at the samelocation during the dry season, MMHg is suspected to bedominantly bound to coarser particles (e.g., oating organicaggregates).20 Thus, based on the assumption that Hg mainlyoriginates from urban and mining effluents, we suggest thatduring the wet season, colloidal iHg originating from miningareas may be more reactive and/or available for methylation.51
3.2. Sediment of Lake Uru Uru: a major source of surfacewater MMHg
3.2.1 Source of THg in surface sediments. As opposed tosurface water, surface sediments (0–2 cm) give an integrated(i.e., almost annual) picture of metal distribution in the lake.THg and MMHg concentrations in surface sediments depictsimilar trends as for surface water with the highest concentra-tionsmeasured downstream of Oruro (km 7) and the conuencewith the Huanuni River (km 20) while in between THg andMMHg concentrations remain at similar baseline concentra-tions (i.e., 100 � 53 ng g�1 and 0.35 � 0.20 ng g�1 for THg andMMHg, respectively) for both seasons. Besides, a single outlieris observed in the central part of the lake (at km 15) whereparticulate Hg concentrations increase downstream of theconuence with the southern arm of the Desaguadero River. Nocurrent mining activities are known in this area althoughancient activities have been reported, suggesting a possibleleaching from these now disused areas. As discussed in theprevious paragraph, at the conuence with the lake, the sharpincrease in pH to values above pH 8 is accompanied by highlevels of precipitation and sedimentation of almost all metals.This is in line with the results of Tapia and Audry,19 who re-ported a very active redox loop through Fe-oxyhydroxideprecipitation in the southern part of Lake Uru Uru (e.g., down-stream of the Huanuni area). In addition, the dense totoravegetation (stems covered by periphyton) of the lake is likely to
Fig. 3 Linear regressions for filtered (F) and unfiltered (UNF) total mercury (THg) vs. monomethylmercury (MMHg) concentrations (upper 2panels), filtered vs. unfiltered monomethylmercury concentrations (lower left panel) and filtered iron (Fe) vs. total mercury (THg) concentrations(lower right panel) in surface waters collected along the Lake Uru Uru transect (empty symbols) and downstream the confluence with miningeffluents (crossed symbols) during the late dry season (white symbols) and the late wet season (blue symbols).
1556 | Environ. Sci.: Processes Impacts, 2016, 18, 1550–1560 This journal is © The Royal Society of Chemistry 2016
Environmental Science: Processes & Impacts Paper
240
enhance the trapping and sedimentation of such particles. Thisis veried by the high concentration of trace metal(oid)s (e.g.,Hg, Sb, Ti, W, Cu, Cd, and As) in sediments downstream of theOruro and Huanunimining areas which exceed the values of thelocal geochemical background levels reported by Tapia et al.8 Inaddition, correlations were found between THg and tracers ofexploited ores (i.e., R ¼ 0.61 and 0.75, p < 0.01 for Sb and W,respectively – ESI 4†),27–29 conrming that mining activities arelikely to be the major source of Hg in the lake.
3.2.2 Seasonal contribution of MMHg from sediment tolake water. MMHg concentrations and partition measured inthe sediment (MMHg ¼ 0.6 � 0.5% of THgsed – Fig. 4) displaya similar pattern for both seasons with a marked increasedownstream of the mining effluent inputs for both seasons.Assuming that MMHg concentrations in surface sediments are
representative of net Hg methylation (i.e., MMHg accumula-tion), our results highlight that both the northern and southernparts of the lake (i.e., downstream of mining effluents) aremajor MMHg accumulation areas. In contrast, iHg and MMHgconcentrations in surface sediment porewater (PW) display verydifferent patterns between the two seasons. During the dryseason both iHgF and MMHgF in PW show large uctuationswith concentrations rising above 200 ng L�1 for iHgF andbetween 20 and 150 ng L�1 for MMHgF in downstream miningeffluent areas (Fig. 4). During the wet season, PW iHg andMMHg levels remain in a lower range of concentrations around2.9 � 0.8 and 0.1 � 0.1 ng L�1, respectively. This seasonal dropof PW concentrations is also found for the percentages ofMMHg which represents 57% � 35% and 5% � 6% of THgFPWfor the dry and wet seasons, respectively. Partition coefficients
Fig. 4 Upper 4 panels: filtered (F) and unfiltered (UNF) inorganic mercury (iHg) and monomethylmercury (MMHg) concentrations in surfacesediment pore water and total mercury (THg) and monomethylmercury (MMHg) concentrations in surface sediments of Lake Uru Uru. Lower 4panels: log partitioning coefficient (log Kd) and daily diffusive fluxes of THg (iHg) and MMHg in surface sediments (PW and solid) of Lake Uru Urufor the end of the dry season (October 2010 – left panels) and of the wet season (May 2011 – right panels). Dotted line refers to mean log Kd
values of THg (black dotted line) and MMHg (blue dotted line).
This journal is © The Royal Society of Chemistry 2016 Environ. Sci.: Processes Impacts, 2016, 18, 1550–1560 | 1557
Paper Environmental Science: Processes & Impacts
241
(Kd ¼ [Hgsed]/[HgFPW]) for THg and MMHg in surface sedimentsillustrate well the seasonal change in Hg partitioning, as log Kd
increases from 3.5 � 1.0 and 1.5 � 1.0 (dry season) to 4.6 � 0.3and 3.9 � 0.8 (wet season) for IHg and MMHg, respectively(Fig. 4). Such changes in the partition between the ltered andsolid phases are likely to be related to the redox state of surfacesediments. Thus, we can suggest that low log Kd measurementsduring the dry season are related to the stagnant and shallowwater column (due to evaporation) promoting anoxia andelement saturation in PW during the dry season. In contrast,during the wet season, freshwater inputs may favor O2 pene-tration into the surface sediments displacing the redox frontdeeper in the sediments.19 This suggestion is in accordance withthermodynamic modeling studies52,53 which showed that themaximum log Kd for Hg is obtained under oxic conditions, inthe absence of inorganic suldes. Then, considering a morepronounced oxygen-depletion of surface sediments during thedry season,8 the solubility of Hg would increase because of anincreasing dominance of HgS2H
� and HgS22� in the porewater
solution53 of such a neutral to alkaline and sulfate-rich envi-ronment. At this pH, it is also probable that the limiting effect ofS(II) concentration for precipitation of b-HgS(s) increases.53
Therefore, the seasonal variation of log Kd for Hg and MMHgillustrate that (i) during the dry season suldes are formed andbuild up in the anoxic PW decreasing log Kd because of theformation of soluble Hg-suldes and potential polysuldeswhile (ii) the wet season is likely to be characterized by moreoxygenated surface sediments, and the formation of authigenicFe oxyhydroxides8,43,54,55 is favored and act as a trap for dissolvedHg species causing log Kd to increase.
From these results, a large seasonal change in the diffusiveHg ux contribution of surface sediments to the water columnis expected. Based on the assumption that the shallow watercolumn is well homogenized, we calculated diffusive uxesusing Fick's rst law (details of the calculations are given in ESI1†):56 Jsed ¼ �fDsed(vC/vz). Spatial variation of calculateddiffusive uxes (Fig. 4) shows that during the dry season, bothiHg and MMHg exhibit positive Jsed indicating an upward-directed ux (efflux from the sediment into the overlying watercolumn). In contrast, during the wet season Jsed values for iHgare slightly positive (slight upward-directed ux) and Jsed valuesfor MMHg are close to zero or negative indicating a downward-directed ux (inux from the water column into the sediment).Therefore, both log Kd and Jsed highlight surface sediment PWas a major source of MMHg for surface water during the dryseason while it appears limited during the wet season when thewater column is higher. This observation is consistent with thelower methylation capacity found in sediment during the wetseason by previous in situ Hg methylation (M) and MMHgdemethylation (D) potential experiments performed in Lake UruUru.20 We cannot exclude a signicant contribution from thesediment during the wet season, due to the probable highdiurnal change in the position of the redox front in the sedi-ment which may favor positive nocturnal uxes (when photo-synthesis is stopped and respiration consumes O2). Thissuggestion is pertinent since Alanoca et al.20 demonstrated thelarge variation of MMHg concentrations in the water column
during 24 hour cycles with maximum concentrations measuredin the absence of sunlight when the water column becomes O2
depleted. Note that the contribution of the Lake Uru Uru surfacesediments to the water column concentration of MMHg,roughly estimated here from diffusion only, is probably anunderestimation. Such contribution should be signicantlyhigher when bioturbation and physical advection resulting inenhanced MMHg uxes into the water column are taken intoaccount.
4. Conclusion
We showed in this study that current and historical miningactivities combined with untreated urban effluents promotehigh mercury and metal(oid) loads into shallow, productive andhigh altitude (3686 m a.s.l.) Lake Uru Uru. High percentages ofmethylmercury concentrations standing around 50% of THgFfor both seasons were found along the north-south transect ofthe eutrophic Lake Uru Uru where abundant OMmay favor bothHg methylation and preservation in the water column. Inaddition, the alkaline pH and the abundant organic ligands andcolloids (especially downstream of mining effluents) seem tofavor the lability of MMHg in the water column. Surface sedi-ments were identied as a major MMHg source for the watercolumn during the dry season while during the wet season itscontribution appears limited. However, the calculation ofMMHg diffusive uxes from the sediments to the water columnduring the wet season was probably underestimated sinceintense diurnal biogeochemical variations and uxes related tobioturbation and physical advection were not considered. Otherunidentied sources (e.g., urban and mining effluents andbiolms covering benthic macrophytes) may also signicantlycontribute to MMHg inputs or in situ production in the lakeduring the wet season. In particular, the large Hg dischargeoriginating from the AMD (probably associated with colloids)was considered as a potentially signicant source of both iHgand MMHg. Such high levels of ltered MMHg in the watercolumn are likely to be a plausible hypothesis behind the highMMHg levels reported in the local trophic chains.10 Huge effortsmust be taken regarding mercury and other metal emissionsfrom the mining area to reduce trophic transfer and addressenvironmental concerns.
Acknowledgements
This work is a contribution to the COMIBOL project (INSUCNRS/IRD EC2CO Program, PI: D. Point) and LA PACHAMAMAproject (ANR CESA program, No ANR-13-CESA-0015-01, PI: D.Amouroux). We wish to thank J. Tapia, A. Castillo, M. Claure, J.L. Duprey (IRD Bolivia) and Don German Calizaya (FishermenAssociation, Machacamarca, Bolivia) for their help and assis-tance during the eld campaigns.
References
1 J. O. Nriagu, Sci. Total Environ., 1994, 149, 167–181.
1558 | Environ. Sci.: Processes Impacts, 2016, 18, 1550–1560 This journal is © The Royal Society of Chemistry 2016
Environmental Science: Processes & Impacts Paper
242
2 R. H. Sillitoe, G. B. Steele, J. F. H. Thompson and J. R. Lang,Miner. Deposita, 1998, 33, 539–546.
3 J. Garcia-Guinea and M. Harffy, Ambio, 1998, 251–253.4 J. Michard, Cooperativas mineras en Bolivia; formas deorganizacion, production y comercializacion, Centro deDocumentation e Information Bolivia, Cochabamba, 2008.
5 I. Montes de Oca, Geografıa y recursos naturales de Bolivia,Editorial Educacional del Ministerio de Educacion y Cultura(1945), La Paz, 2nd edn, 1989, p. 574.
6 M. E. Garcia Moreno, PhD thesis, Lund Institute ofTechnology, Lund University, 2006.
7 T. Rotting, J. Amezaga, P. Younger, P. Jimenez, C. Talavera,J. Quintanilla, R. Oyarzun and G. Soto, CatchmentManagement and Mining Impacts in Arid and Semi-AridSouth America (CAMINAR): Case studies in Peru, Boliviaand Chile, 8th ICARD, Skelleea, Sweden, 2009, p. 10.
8 J. Tapia, S. Audry, B. Townley and J.-L. Duprey, Geochem.:Explor., Environ., Anal., 2012, 12, 3–20.
9 A. Garitano-Zavala, J. Cotin, M. Borras and J. Nadal, Environ.Monit. Assess., 2010, 168, 629–644.
10 C. I. Molina, C. Ibanez and F.-M. Gibon, Ecologia en Bolivia,2012, 47, 99–118.
11 E. Benece, S. Luna-Monrroy and R. Lopez-Rodriguez, Int. J.Hyg. Environ. Health, 2010, 213, 458–464.
12 S. Bose-O'Reilly, B. Lettmeier, R. Matteucci Gothe,C. Beinhoff, U. Siebert and G. Drasch, Environ. Res., 2008,107, 89–97.
13 J. Lebel, D. Mergler, M. Lucotte, M. Amorin, J. Dolbec,D. Miranda, G. Arantes, I. Rheault and P. Pichet,Neurotoxicology, 1996, 17, 157–168.
14 J. M. Benoit, E. B. Ekstrom and F. M. M. Morel, Abstracts ofPapers of the American Chemical Society, 2002, vol. 223, p.U525.
15 W. F. Fitzgerald, C. H. Lamborg and H. D. H. K. Turekian, inTreatise on Geochemistry, Elsevier, Oxford, 2nd edn, 2014, pp.91–129.
16 J. H. Weber, Chemosphere, 1993, 26, 2063–2077.17 W. F. Fitzgerald, C. H. Lamborg, A. A. Heinrich and
K. T. Karl, in Treatise on Geochemistry, Pergamon, Oxford,2007, pp. 1–47.
18 C.-C. Lin, N. Yee and T. Barkay, in Environmental chemistryand toxicology of mercury, ed. G. Liu, Y. Cai and N.O'Driscoll, John Wiley & Sons, Inc., Hoboken, New Jersey,2012, ch. 5, pp. 155–191.
19 J. Tapia and S. Audry, Appl. Geochem., 2013, 31, 60–78.20 L. Alanoca, D. Amouroux, M. Monperrus, E. Tessier, M. Goni,
R. Guyoneaud, D. Acha, C. Gassie, S. Audry, M. Garcia,J. Quintanilla and D. Point, Environ. Sci. Pollut. Res., 2016,23, 6919–6933.
21 T. Condom, A. Coudrain, A. Dezetter, D. Brunstein,F. Delclaux and J.-E. Sicart, Hydrol. Processes, 2004, 18,2395–2408.
22 L. G. Thompson, E. Mosley-Thompson, J. F. Bolzan andB. R. Koci, Science, 1985, 229, 971–973.
23 P. A. Baker and S. C. Fritz, Quat. Sci. Rev., 2015, 124, 31–47.
24 A. Coudrain, M. Loubet, T. Condom, A. Talbi, P. Ribstein,B. Pouyaud, J. Quintanilla, C. Dieulin and B. Dupre,Hydrol. Sci. J., 2002, 47, 293–306.
25 CAMINAR, Catchment Management and Mining Impacts inArid and Semi-Arid South America, B. Instituto deInvestigaciones Quımicas & Centro de Estudios Ecologicos -Universidad Mayor de San Andres La Paz, EuropeanCommission & UMSA - CEEDI, La Paz, Bolivia, 2008.
26 E. R. Quiroga, Nat. Resour. Forum, 2002, 26, 127–139.27 F. S. Turneaure, Econ. Geol., 1960, 55, 217–254.28 W. C. Kelly and F. S. Turneaure, Econ. Geol., 1970, 65, 609–
680.29 F. Moricz, I. F. Walder and F. Madai, Geochemical and
mineralogical characterization of waste material from ItosSn–Ag deposit, Bolivia, Proceeding of securing the future and8th ICARD, Skelleea, Sweden, 2009.
30 D. Cossa, J. Sanjuan, J. Cloud, B. Stockwell and W. Corns,Water, Air, Soil Pollut., 1995, 80, 1279–1284.
31 M. Monperrus, E. Tessier, S. Veschambre, D. Amouroux andO. Donard, Anal. Bioanal. Chem., 2005, 381, 854–862.
32 M. Monperrus, P. R. Gonzalez, D. Amouroux, J. I. G. Alonsoand O. F. X. Donard, Anal. Bioanal. Chem., 2008, 390, 655–666.
33 S. Bouchet, D. Amouroux, P. Rodriguez-Gonzalez, E. Tessier,M. Monperrus, G. Thouzeau, J. Clavier, E. Amice, J. Debordeand S. Bujan, Biogeochemistry, 2013, 114, 341–358.
34 S. Bouchet, E. Tessier, M. Monperrus, R. Bridou, J. Clavier,G. Thouzeau and D. Amouroux, J. Environ. Monit., 2011, 13,1351.
35 S. J. Balogh and Y. H. Nollet, Sci. Total Environ., 2008, 406,145–153.
36 S. Guedron, C. Duwig, B. L. Prado, D. Point, M. G. Flores andC. Siebe, Water, Air, Soil Pollut., 2014, 225, 1–19.
37 A. D. S. Oliveira, A. Bocio, T. M. B. Trevilato,A. M. M. Takayanagui, J. L. Doming and S. I. Segura-Munoz, Environ. Sci. Pollut. Res., 2007, 14, 483–489.
38 D. Cossa, F. Elbaz-Poulichet and J. M. Nieto, Aquat.Geochem., 2001, 7, 1–12.
39 D. Cossa and C. Gobeil, Can. J. Fish. Aquat. Sci., 2000, 57,138–147.
40 A. Garcıa Bravo, C. Cosio, P.-A. Chevalley, J. Zop,D. Amouroux, J. Spangenberg, V.-G. Ungureanu andJ. Dominik, Water Res., 2014, 49, 391–405.
41 M. Arcagni, L. Campbell, M. A. Arribere, M. Marvin-DiPasquale, A. Rizzo and S. R. Guevara, Sci. Total Environ.,2013, 454, 170–180.
42 S. Wang, M. Zhang, B. Li, D. Xing, X. Wang, C. Wei and Y. Jia,Sci. Total Environ., 2012, 417–418, 204–213.
43 S. Feyte, C. Gobeil, A. Tessier and D. Cossa, Geochim.Cosmochim. Acta, 2012, 82, 92–112.
44 G. Lee, J. M. Bigham and G. Faure, Appl. Geochem., 2002, 17,569–581.
45 J. G. Webster, P. J. Swedlund and K. S. Webster, Environ. Sci.Technol., 1998, 32, 1361–1368.
46 D. B. Johnson and K. B. Hallberg, Sci. Total Environ., 2005,338, 3–14.
This journal is © The Royal Society of Chemistry 2016 Environ. Sci.: Processes Impacts, 2016, 18, 1550–1560 | 1559
Paper Environmental Science: Processes & Impacts
243
47 R. M. Cornell and U. Schwertmann, The iron oxides: structure,properties, reactions, occurrences and uses, John Wiley & Sons,2006.
48 D. Dyrssen andM. Wedborg,Water, Air, Soil Pollut., 1991, 56,507–519.
49 S. Guedron, S. Devin and D. A. L. Vignati, Environ. Toxicol.Chem., 2016, 35, 330–339.
50 B. A. Kimball, E. Callender and E. V. Axtmann, Appl.Geochem., 1995, 10, 285–306.
51 H. Hsu-Kim, K. H. Kucharzyk, T. Zhang andM. A. Deshusses,Environ. Sci. Technol., 2013, 47, 2441–2456.
52 A. R. Khwaja, P. R. Bloom and P. L. Brezonik, Environ. Sci.Technol., 2006, 40, 844–849.
53 U. Skyllberg, in Environmental chemistry and toxicology ofmercury, ed. G. Liu, Y. Cai and N. O'Driscoll, John Wiley &Sons, Inc., Hoboken, New Jersey, 2012, ch. 7, pp. 219–258.
54 B. Muresan, D. Cossa, M. Coquery and S. Richard, Geochim.Cosmochim. Acta, 2008, 72, 5416–5430.
55 B. Muresan, D. Cossa and D. Jezequel, RMZ - Mater.Geoenviron., 2004, 51, 1247–1250.
56 S. Guedron, L. Huguet, D. A. L. Vignati, B. Liu, F. Gimbert,B. J. D. Ferrari, R. Zonta and J. Dominik, Mar. Chem., 2012,130–131, 1–11.
1560 | Environ. Sci.: Processes Impacts, 2016, 18, 1550–1560 This journal is © The Royal Society of Chemistry 2016
Environmental Science: Processes & Impacts Paper
244
245
Artículo 2 : Diurnal variability and
biogeochemical reactivity of Hg species
in an extreme high-altitude lake
ecosystem of the Bolivian Altiplano
1 23
Environmental Science and PollutionResearch ISSN 0944-1344 Environ Sci Pollut ResDOI 10.1007/s11356-015-5917-1
Diurnal variability and biogeochemicalreactivity of mercury species in an extremehigh-altitude lake ecosystem of the BolivianAltiplano
L. Alanoca, D. Amouroux,M. Monperrus, E. Tessier, M. Goni,R. Guyoneaud, D. Acha, C. Gassie,S. Audry, M. E. Garcia, J. Quintanilla, etal.
246
1 23
Your article is protected by copyright and
all rights are held exclusively by Springer-
Verlag Berlin Heidelberg. This e-offprint is
for personal use only and shall not be self-
archived in electronic repositories. If you wish
to self-archive your article, please use the
accepted manuscript version for posting on
your own website. You may further deposit
the accepted manuscript version in any
repository, provided it is only made publicly
available 12 months after official publication
or later and provided acknowledgement is
given to the original source of publication
and a link is inserted to the published article
on Springer's website. The link must be
accompanied by the following text: "The final
publication is available at link.springer.com”.
247
RESEARCH ARTICLE
Diurnal variability and biogeochemical reactivity of mercuryspecies in an extreme high-altitude lake ecosystem of the BolivianAltiplano
L. Alanoca1 & D. Amouroux1,2 & M. Monperrus2 & E. Tessier2 & M. Goni3 &
R. Guyoneaud3& D. Acha4 & C. Gassie3 & S. Audry1 & M. E. Garcia5 & J. Quintanilla5 &
D. Point1,4
Received: 19 August 2015 /Accepted: 2 December 2015# Springer-Verlag Berlin Heidelberg 2015
Abstract Methylation and demethylation represent majortransformation pathways regulating the net production ofmethylmercury (MMHg). Very few studies have documentedHg reactivity and transformation in extreme high-altitude lakeecosystems. Mercury (Hg) species concentrations (IHg,MMHg, Hg°, and DMHg) and in situ Hg methylation (M)and MMHg demethylation (D) potentials were determined inwater, sediment, floating organic aggregates, and periphytoncompartments of a shallow productive Lake of the BolivianAltiplano (Uru Uru Lake, 3686 m). Samples were collectedduring late dry season (October 2010) and late wet season
(May 2011) at a north (NS) and a south (SS) site of the lake,respectively. Mercury species concentrations exhibited signif-icant diurnal variability as influenced by the strong diurnalbiogeochemical gradients. Particularly high methylated mer-cury concentrations (0.2 to 4.5 ng L−1 for MMHgT) weredetermined in the water column evidencing important Hgmethylation in this ecosystem. Methylation and D potentialsrange were, respectively, <0.1–16.5 and <0.2–68.3 % day−1
and were highly variable among compartments of the lake, butalways higher during the dry season. Net Hg M indicates thatthe influence of urban and mining effluent (NS) promotesMMHg production in both water (up to 0.45 ngMMHg L−1 day−1) and sediment compartments (2.0 to19.7 ng MMHg g−1 day−1). While the sediment compartmentappears to represent a major source of MMHg in this shallowecosystem, floating organic aggregates (dry season, SS) andTotora’s periphyton (wet season, NS) were found to act as asignificant source (5.8 ng MMHg g−1 day−1) and a sink(−2.1 ng MMHg g−1 day−1) of MMHg, respectively. Thiswork demonstrates that high-altitude productive lake ecosys-tems can promote MMHg formation in various compartmentssupporting recent observations of high Hg contents in fish andwater birds.
Keywords Mercury . Biogeochemistry . Altiplano . Lake .
Methylation . Demethylation . Bolivia
Introduction
Methylmercury (MMHg) is considered as a potent neurotoxinand represents a significant health concern (Allen et al. 2002).Human MMHg exposure is mainly controlled by the con-sumption of fish products (Fitzgerald and Clarkson 1991;
Responsible editor: Philippe Garrigues
Electronic supplementary material The online version of this article(doi:10.1007/s11356-015-5917-1) contains supplementary material,which is available to authorized users.
* D. [email protected]
1 Géosciences Environnement Toulouse, UMR 5563-IRD UR 234,Université Paul Sabatier, 14 Avenue Edouard Belin,31400 Toulouse, France
2 Laboratoire de Chimie Analytique Bio-inorganique etEnvironnement, IPREMUMR 5254 CNRS, Université de Pau et desPays de l’Adour, Hélioparc Pau Pyrénées, 2, av. P. Angot, 64053 Paucedex 9, France
3 Equipe Environnement etMicrobiologie, IPREMUMR5254CNRS,Université de Pau et des Pays de l’Adour, Bâtiment IBEAS, BP1153,64013 Pau Cedex, France
4 Laboratorio de Calidad Ambiental, Instituto de Ecologia,Universidad Mayor de San Andres, Campus Universitario de CotaCota, casilla 3161, La Paz, Bolivia
5 Laboratorio de Hidroquímica, Instituto de Investigaciones Químicas,Universidad Mayor de San Andres, Campus Universitario de CotaCota, casilla 3161, La Paz, Bolivia
Environ Sci Pollut ResDOI 10.1007/s11356-015-5917-1
Author's personal copy
248
UNEP 2013). MMHg can be produced in different compart-ments of the aquatic ecosystem as influenced by biogeochem-ical conditions (Fitzgerald and Lamborg 2004; Hintelmann2010). In aquatic ecosystems, Hg methylation may take placein the anoxic zone (Eckley and Hintelmann 2006) or oxic zone(Bouchet et al. 2013; Monperrus et al. 2007; Ribeiro Guevaraet al. 2008), in the first few centimeters of sediments (Bouchetet al. 2013; Hollweg et al. 2009) and in the periphyton mainlyassociated with the roots of aquatic plants (Gentès et al. 2013;Guimarães et al. 2000). The mechanisms of mercury methyl-ation (M) mainly involve microbial processes linked to theactivities of various communities such as sulfate- and/oriron-reducing bacteria (Barkay and Wagner‐Döbler 2005;Compeau and Bartha 1984) and, to a lesser extent, abioticprocesses (Craig and Morton 1978; Weber 1993). Overall,net production rates of MMHg, and its bioaccumulation inthe food chain of aquatic systems, is drastically regulated bysuch transformation processes (Hintelmann 2010).
Mediated by biotic and abiotic processes, MMHg may bemethylated and form dimethylmercury (DMHg) (Baldi et al.1995), and/or broken down or demethylated (D), giving rise toinorganic Hg and elemental mercury (Hg°). In sediments, themethylation process involves sulfate- and nitrate-reducingbacteria as well as methanogenic bacteria, along oxidative orreductive pathways (Oremland et al. 1991; Schaefer et al.2004; Spangler et al. 1973). In the water column, most ofMMHg deme t hy l a t i o n l i k e l y o r i g i n a t e s f r omphotodegrada t ion reac t ions (Black e t a l . 2012;Hammerschmidt and Fitzgerald 2006; Sellers et al. 1996).
Because of its importance for human health, Hg cycling hasbeen studied in different aquatic systems (oceans, lakes, la-goons, rivers, and wetlands). Hg reactivity and transformationin lake and wetland ecosystems is well documented(Hintelmann 2010), but few studies have investigated Hg re-activity in extreme high-altitude ecosystems (Marusczak et al.2011; Qianggong et al. 2014; Ribeiro Guevara et al. 2008).Aquatic ecosystems located in the South American Altiplanoregion at 3800 m exhibit extreme thermal and solar irradiancediurnal variability including intense UV radiations(Blumthaler et al. 1997; Zaratti et al. 2003), contrasted sea-sonal hydrological cycles, as well as intense primary produc-tion (Aguirre et al. 2014). Lake Uru Uru (3686 m a.s.l.) is partof the lake system occupying the central Bolivian Altiplanoregion. This lake ecosystem acts as a sink for several miningand urban waste effluents (Garcia 2006; Tapia et al. 2012),while it hosts numerous endemic avian and fish species andhas social and economic importance for the region’s indige-nous population, who live from hunting and fishing (Aguirreet al. 2014; Garcia 2006). Elevated Hg levels were document-ed in different species of water birds and fish from Lake UruUru (Aguirre et al. 2014; Molina et al. 2012)
This work aims at documenting for the first time Hg bio-geochemistry and Hgmethylation capacity in the case of high-
altitude tropical productive lakes, using Lake Uru Uru as areference study site. In this lake, a contaminated northern(NS) and a less impacted southern (SS) site were carefullyinvestigated on a diurnal and seasonal basis with the measure-ment of different Hg compounds (IHg, MMHg, Hg°, andDMHg) and the complementary determination of in situ Hgmethylation (M) and MMHg demethylation (D) potentials inwater, sediment, floating organic aggregates, and periphytoncompartments collected from Totora’s (Schoenoplectuscalifornicus) aquatic plants.
Materials and methods
Study area
Lake Uru Uru is a shallow aquatic system (1.5 m av. depth)located at 3686 m above sea level in the central part of theBolivian Altiplano region, in South America (Fig. 1). LakeUru Uru is located downstream of Lake Titicaca and upstreamof Lake Poopó and is part of the closed, evaporative endorheicTiticaca-Desaguadero-Poopo-salar (TDPS) basin. During thewet season, Lake Uru Uru displays a surface area of 350 km2,reduced to 120 km2 during the dry season. Further details onthe study area are provided in the Supplementary Material(SM) section.
Samples collection and processing
Samples of sediment, surface waters, and organic substrateswere collected from Lake Uru Uru at two different sites(Fig. 1). The first site (NS) located in the northern part of thelake represents a contaminated site, under the influence ofboth mining and urban effluents originating from the miningcity of Oruro (Fig. 1). The second site (SS) is located in thesouthern part of the lake and is supposed to represent a lesspolluted area, although lateral inputs of mining effluent fromRio Huanuni may be considered. All samples were taken atthe end of the dry season (October 2010) and at the end of thewet season (May 2011), respectively, for investigating season-al differences. Diurnal cycles (24 h) were also investigated inthe water column at the two stations at a 4-h resolution step atthe NS site (only for wet season) and at a 2-h resolution step atthe SS site (both seasons). Because both NS and SS sites arevery shallow (<1 m) and present a well-mixed water column,water sample was directly hand-collected from a rubber boatat the subsurface (ca. 10–30 cm depth, depending on the sea-sonal water level). Each water sample was divided into threealiquots, two of them subsequently acidified: one was filtered(Bdissolved fraction^) using a vacuum filtration pump and0.45-μm porosity PVDF filters (Millipore, Bedford, MA,USA), while the second was kept unfiltered (total content).A last aliquot was kept intact and directly processed to purge
Environ Sci Pollut Res
Author's personal copy
249
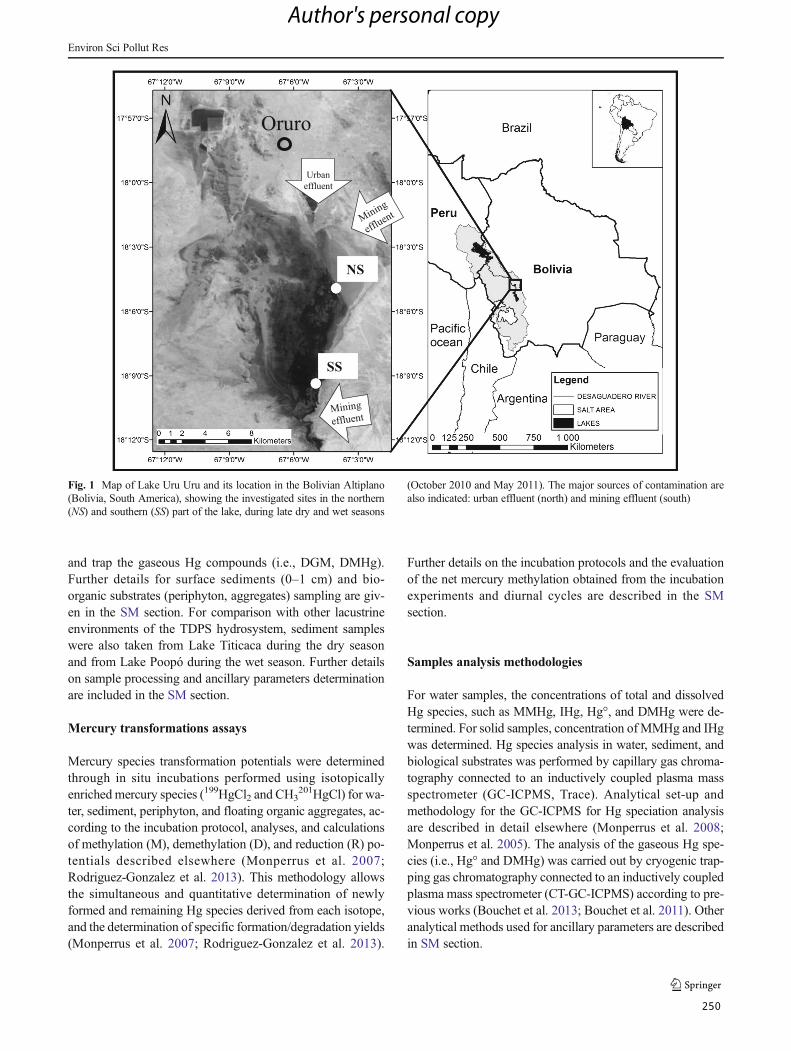
and trap the gaseous Hg compounds (i.e., DGM, DMHg).Further details for surface sediments (0–1 cm) and bio-organic substrates (periphyton, aggregates) sampling are giv-en in the SM section. For comparison with other lacustrineenvironments of the TDPS hydrosystem, sediment sampleswere also taken from Lake Titicaca during the dry seasonand from Lake Poopó during the wet season. Further detailson sample processing and ancillary parameters determinationare included in the SM section.
Mercury transformations assays
Mercury species transformation potentials were determinedthrough in situ incubations performed using isotopicallyenrichedmercury species (199HgCl2 and CH3
201HgCl) for wa-ter, sediment, periphyton, and floating organic aggregates, ac-cording to the incubation protocol, analyses, and calculationsof methylation (M), demethylation (D), and reduction (R) po-tentials described elsewhere (Monperrus et al. 2007;Rodriguez-Gonzalez et al. 2013). This methodology allowsthe simultaneous and quantitative determination of newlyformed and remaining Hg species derived from each isotope,and the determination of specific formation/degradation yields(Monperrus et al. 2007; Rodriguez-Gonzalez et al. 2013).
Further details on the incubation protocols and the evaluationof the net mercury methylation obtained from the incubationexperiments and diurnal cycles are described in the SMsection.
Samples analysis methodologies
For water samples, the concentrations of total and dissolvedHg species, such as MMHg, IHg, Hg°, and DMHg were de-termined. For solid samples, concentration ofMMHg and IHgwas determined. Hg species analysis in water, sediment, andbiological substrates was performed by capillary gas chroma-tography connected to an inductively coupled plasma massspectrometer (GC-ICPMS, Trace). Analytical set-up andmethodology for the GC-ICPMS for Hg speciation analysisare described in detail elsewhere (Monperrus et al. 2008;Monperrus et al. 2005). The analysis of the gaseous Hg spe-cies (i.e., Hg° and DMHg) was carried out by cryogenic trap-ping gas chromatography connected to an inductively coupledplasma mass spectrometer (CT-GC-ICPMS) according to pre-vious works (Bouchet et al. 2013; Bouchet et al. 2011). Otheranalytical methods used for ancillary parameters are describedin SM section.
SS
Urban
effluent
Oruro
NS
SS
Fig. 1 Map of Lake Uru Uru and its location in the Bolivian Altiplano(Bolivia, South America), showing the investigated sites in the northern(NS) and southern (SS) part of the lake, during late dry and wet seasons
(October 2010 and May 2011). The major sources of contamination arealso indicated: urban effluent (north) and mining effluent (south)
Environ Sci Pollut Res
Author's personal copy
250
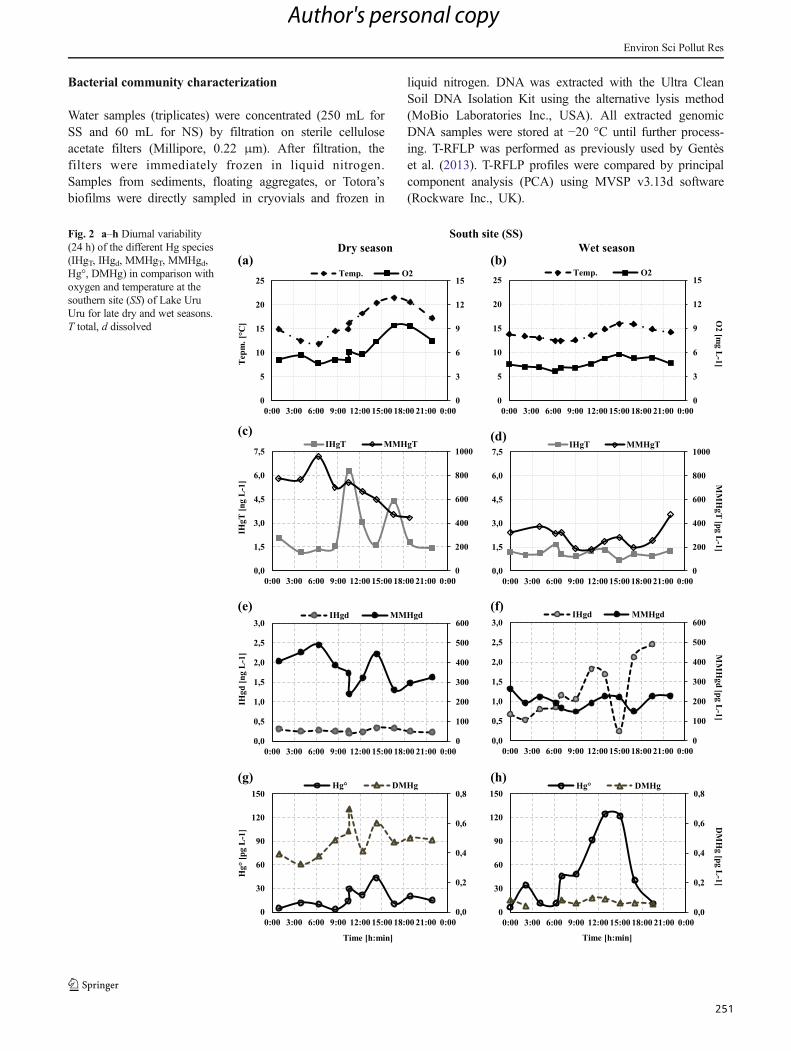
Bacterial community characterization
Water samples (triplicates) were concentrated (250 mL forSS and 60 mL for NS) by filtration on sterile celluloseacetate filters (Millipore, 0.22 μm). After filtration, thefilters were immediately frozen in liquid nitrogen.Samples from sediments, floating aggregates, or Totora’sbiofilms were directly sampled in cryovials and frozen in
liquid nitrogen. DNA was extracted with the Ultra CleanSoil DNA Isolation Kit using the alternative lysis method(MoBio Laboratories Inc., USA). All extracted genomicDNA samples were stored at −20 °C until further process-ing. T-RFLP was performed as previously used by Gentèset al. (2013). T-RFLP profiles were compared by principalcomponent analysis (PCA) using MVSP v3.13d software(Rockware Inc., UK).
(a) (b)
0
3
6
9
12
15
0
5
10
15
20
25
0:00 3:00 6:00 9:00 12:00 15:00 18:00 21:00 0:00
[.mpe
T°C
]
Temp. O2
0
3
6
9
12
15
0
5
10
15
20
25
0:00 3:00 6:00 9:00 12:00 15:00 18:00 21:00 0:00
O2 [m
g L-1]
Temp. O2
0
200
400
600
800
1000
0,0
1,5
3,0
4,5
6,0
7,5
0:00 3:00 6:00 9:00 12:00 15:00 18:00 21:00 0:00
Lgn[
TgHI
-1]
IHgT MMHgT
0
200
400
600
800
1000
0,0
1,5
3,0
4,5
6,0
7,5
0:00 3:00 6:00 9:00 12:00 15:00 18:00 21:00 0:00
MM
HgT
[pgL
-1]
IHgT MMHgT
0
100
200
300
400
500
600
0,0
0,5
1,0
1,5
2,0
2,5
3,0
0:00 3:00 6:00 9:00 12:00 15:00 18:00 21:00 0:00
Lgn[
dgHI
-1]
IHgd MMHgd
0
100
200
300
400
500
600
0,0
0,5
1,0
1,5
2,0
2,5
3,0
0:00 3:00 6:00 9:00 12:00 15:00 18:00 21:00 0:00
MM
Hgd
[pgL
-1]
IHgd MMHgd
0,0
0,2
0,4
0,6
0,8
0
30
60
90
120
150
0:00 3:00 6:00 9:00 12:00 15:00 18:00 21:00 0:00
Hg°
Lgp[
-1]
Time [h:min]
Hg° DMHg
(c) (d)
(e) (f)
(g)
0,0
0,2
0,4
0,6
0,8
0
30
60
90
120
150
0:00 3:00 6:00 9:00 12:00 15:00 18:00 21:00 0:00
DM
Hg [pg L
-1]
Time [h:min]
Hg° DMHg(h)
South site (SS)Dry season Wet season
Fig. 2 a–h Diurnal variability(24 h) of the different Hg species(IHgT, IHgd, MMHgT, MMHgd,Hg°, DMHg) in comparison withoxygen and temperature at thesouthern site (SS) of Lake UruUru for late dry and wet seasons.T total, d dissolved
Environ Sci Pollut Res
Author's personal copy
251
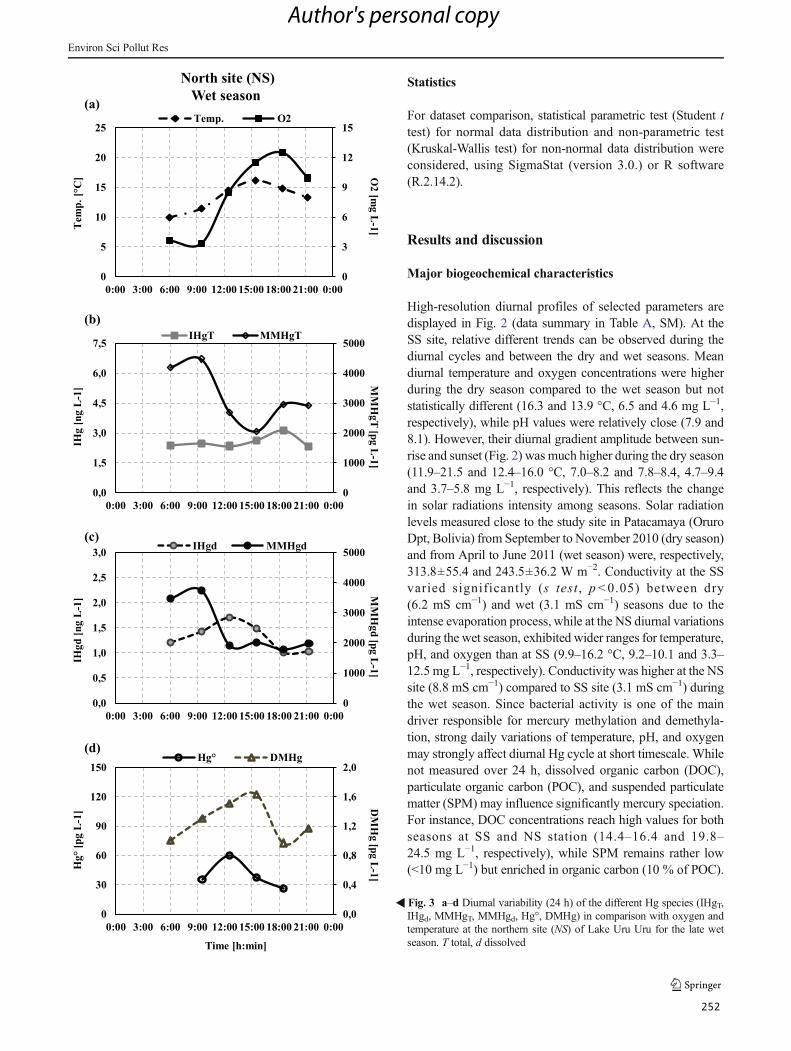
Statistics
For dataset comparison, statistical parametric test (Student ttest) for normal data distribution and non-parametric test(Kruskal-Wallis test) for non-normal data distribution wereconsidered, using SigmaStat (version 3.0.) or R software(R.2.14.2).
Results and discussion
Major biogeochemical characteristics
High-resolution diurnal profiles of selected parameters aredisplayed in Fig. 2 (data summary in Table A, SM). At theSS site, relative different trends can be observed during thediurnal cycles and between the dry and wet seasons. Meandiurnal temperature and oxygen concentrations were higherduring the dry season compared to the wet season but notstatistically different (16.3 and 13.9 °C, 6.5 and 4.6 mg L−1,respectively), while pH values were relatively close (7.9 and8.1). However, their diurnal gradient amplitude between sun-rise and sunset (Fig. 2) was much higher during the dry season(11.9–21.5 and 12.4–16.0 °C, 7.0–8.2 and 7.8–8.4, 4.7–9.4and 3.7–5.8 mg L−1, respectively). This reflects the changein solar radiations intensity among seasons. Solar radiationlevels measured close to the study site in Patacamaya (OruroDpt, Bolivia) from September to November 2010 (dry season)and from April to June 2011 (wet season) were, respectively,313.8±55.4 and 243.5±36.2 W m−2. Conductivity at the SSvaried significantly (s test , p< 0.05) between dry(6.2 mS cm−1) and wet (3.1 mS cm−1) seasons due to theintense evaporation process, while at the NS diurnal variationsduring the wet season, exhibited wider ranges for temperature,pH, and oxygen than at SS (9.9–16.2 °C, 9.2–10.1 and 3.3–12.5 mg L−1, respectively). Conductivity was higher at the NSsite (8.8 mS cm−1) compared to SS site (3.1 mS cm−1) duringthe wet season. Since bacterial activity is one of the maindriver responsible for mercury methylation and demethyla-tion, strong daily variations of temperature, pH, and oxygenmay strongly affect diurnal Hg cycle at short timescale. Whilenot measured over 24 h, dissolved organic carbon (DOC),particulate organic carbon (POC), and suspended particulatematter (SPM) may influence significantly mercury speciation.For instance, DOC concentrations reach high values for bothseasons at SS and NS station (14.4–16.4 and 19.8–24.5 mg L−1, respectively), while SPM remains rather low(<10 mg L−1) but enriched in organic carbon (10 % of POC).
�Fig. 3 a–d Diurnal variability (24 h) of the different Hg species (IHgT,IHgd, MMHgT, MMHgd, Hg°, DMHg) in comparison with oxygen andtemperature at the northern site (NS) of Lake Uru Uru for the late wetseason. T total, d dissolved
0
3
6
9
12
15
0
5
10
15
20
25
0:00 3:00 6:00 9:00 12:00 15:00 18:00 21:00 0:00
O2 [m
g L-1]
[ .pme
T°C
]
Temp. O2(a)
0
1000
2000
3000
4000
5000
0,0
1,5
3,0
4,5
6,0
7,5
0:00 3:00 6:00 9:00 12:00 15:00 18:00 21:00 0:00
MM
HgT
[pg L-1]
L gn[ gHI
-1]
IHgT MMHgT(b)
(c)
(d)
0
1000
2000
3000
4000
5000
0,0
0,5
1,0
1,5
2,0
2,5
3,0
0:00 3:00 6:00 9:00 12:00 15:00 18:00 21:00 0:00
MM
Hgd [pg L
-1]
L gn[ dgHI
-1]
IHgd MMHgd
0,0
0,4
0,8
1,2
1,6
2,0
0
30
60
90
120
150
0:00 3:00 6:00 9:00 12:00 15:00 18:00 21:00 0:00
DM
Hg [pg L
-1]
Hg°
L gp[-1
]
Time [h:min]
Hg° DMHg
North site (NS)Wet season
Environ Sci Pollut Res
Author's personal copy
252
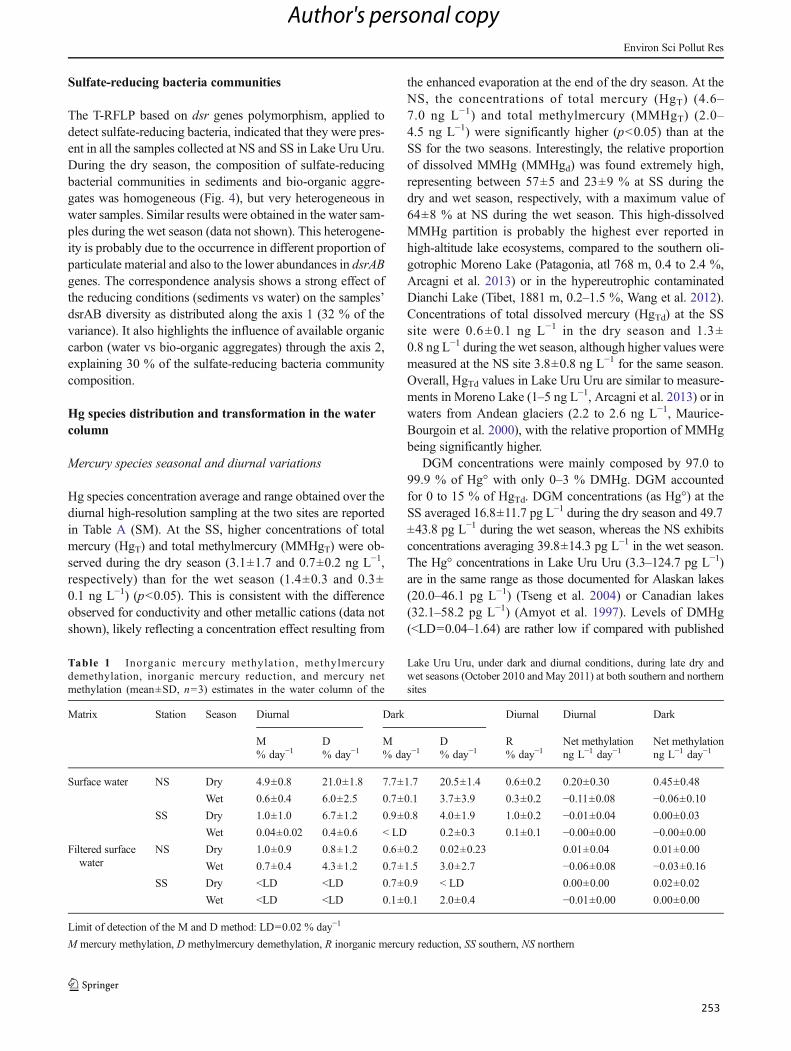
Sulfate-reducing bacteria communities
The T-RFLP based on dsr genes polymorphism, applied todetect sulfate-reducing bacteria, indicated that they were pres-ent in all the samples collected at NS and SS in Lake Uru Uru.During the dry season, the composition of sulfate-reducingbacterial communities in sediments and bio-organic aggre-gates was homogeneous (Fig. 4), but very heterogeneous inwater samples. Similar results were obtained in the water sam-ples during the wet season (data not shown). This heterogene-ity is probably due to the occurrence in different proportion ofparticulate material and also to the lower abundances in dsrABgenes. The correspondence analysis shows a strong effect ofthe reducing conditions (sediments vs water) on the samples’dsrAB diversity as distributed along the axis 1 (32 % of thevariance). It also highlights the influence of available organiccarbon (water vs bio-organic aggregates) through the axis 2,explaining 30 % of the sulfate-reducing bacteria communitycomposition.
Hg species distribution and transformation in the watercolumn
Mercury species seasonal and diurnal variations
Hg species concentration average and range obtained over thediurnal high-resolution sampling at the two sites are reportedin Table A (SM). At the SS, higher concentrations of totalmercury (HgT) and total methylmercury (MMHgT) were ob-served during the dry season (3.1±1.7 and 0.7±0.2 ng L−1,respectively) than for the wet season (1.4±0.3 and 0.3±0.1 ng L−1) (p<0.05). This is consistent with the differenceobserved for conductivity and other metallic cations (data notshown), likely reflecting a concentration effect resulting from
the enhanced evaporation at the end of the dry season. At theNS, the concentrations of total mercury (HgT) (4.6–7.0 ng L−1) and total methylmercury (MMHgT) (2.0–4.5 ng L−1) were significantly higher (p<0.05) than at theSS for the two seasons. Interestingly, the relative proportionof dissolved MMHg (MMHgd) was found extremely high,representing between 57±5 and 23±9 % at SS during thedry and wet season, respectively, with a maximum value of64±8 % at NS during the wet season. This high-dissolvedMMHg partition is probably the highest ever reported inhigh-altitude lake ecosystems, compared to the southern oli-gotrophic Moreno Lake (Patagonia, atl 768 m, 0.4 to 2.4 %,Arcagni et al. 2013) or in the hypereutrophic contaminatedDianchi Lake (Tibet, 1881 m, 0.2–1.5 %, Wang et al. 2012).Concentrations of total dissolved mercury (HgTd) at the SSsite were 0.6±0.1 ng L−1 in the dry season and 1.3±0.8 ng L−1 during the wet season, although higher values weremeasured at the NS site 3.8±0.8 ng L−1 for the same season.Overall, HgTd values in Lake Uru Uru are similar to measure-ments in Moreno Lake (1–5 ng L−1, Arcagni et al. 2013) or inwaters from Andean glaciers (2.2 to 2.6 ng L−1, Maurice-Bourgoin et al. 2000), with the relative proportion of MMHgbeing significantly higher.
DGM concentrations were mainly composed by 97.0 to99.9 % of Hg° with only 0–3 % DMHg. DGM accountedfor 0 to 15 % of HgTd. DGM concentrations (as Hg°) at theSS averaged 16.8±11.7 pg L−1 during the dry season and 49.7±43.8 pg L−1 during the wet season, whereas the NS exhibitsconcentrations averaging 39.8±14.3 pg L−1 in the wet season.The Hg° concentrations in Lake Uru Uru (3.3–124.7 pg L−1)are in the same range as those documented for Alaskan lakes(20.0–46.1 pg L−1) (Tseng et al. 2004) or Canadian lakes(32.1–58.2 pg L−1) (Amyot et al. 1997). Levels of DMHg(<LD=0.04–1.64) are rather low if compared with published
Table 1 Inorganic mercury methylation, methylmercurydemethylation, inorganic mercury reduction, and mercury netmethylation (mean±SD, n=3) estimates in the water column of the
Lake Uru Uru, under dark and diurnal conditions, during late dry andwet seasons (October 2010 and May 2011) at both southern and northernsites
Matrix Station Season Diurnal Dark Diurnal Diurnal Dark
M D M D R Net methylation Net methylation% day−1 % day−1 % day−1 % day−1 % day−1 ng L−1 day−1 ng L−1 day−1
Surface water NS Dry 4.9±0.8 21.0±1.8 7.7±1.7 20.5±1.4 0.6±0.2 0.20±0.30 0.45±0.48
Wet 0.6±0.4 6.0±2.5 0.7±0.1 3.7±3.9 0.3±0.2 −0.11±0.08 −0.06±0.10SS Dry 1.0±1.0 6.7±1.2 0.9±0.8 4.0±1.9 1.0±0.2 −0.01±0.04 0.00±0.03
Wet 0.04±0.02 0.4±0.6 < LD 0.2±0.3 0.1±0.1 −0.00±0.00 −0.00±0.00Filtered surface
waterNS Dry 1.0±0.9 0.8±1.2 0.6±0.2 0.02±0.23 0.01±0.04 0.01±0.00
Wet 0.7±0.4 4.3±1.2 0.7±1.5 3.0±2.7 −0.06±0.08 −0.03±0.16SS Dry <LD <LD 0.7±0.9 < LD 0.00±0.00 0.02±0.02
Wet <LD <LD 0.1±0.1 2.0±0.4 −0.01±0.00 0.00±0.00
Limit of detection of the M and D method: LD=0.02 % day−1
M mercury methylation, D methylmercury demethylation, R inorganic mercury reduction, SS southern, NS northern
Environ Sci Pollut Res
Author's personal copy
253
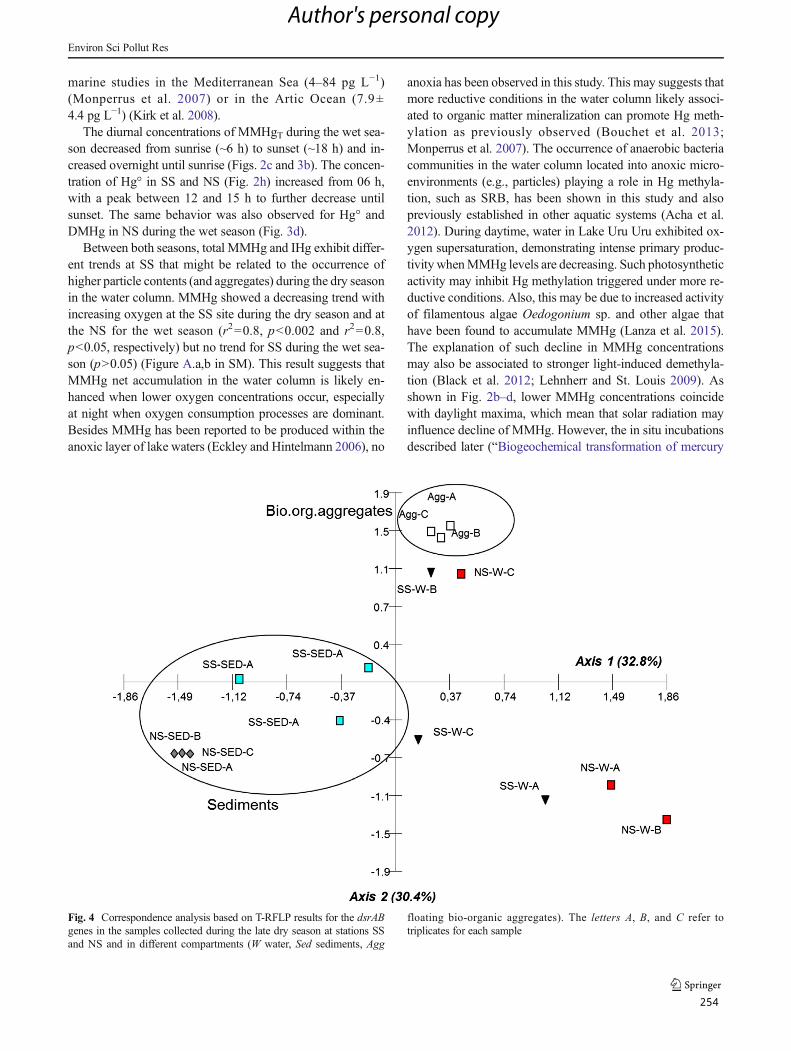
marine studies in the Mediterranean Sea (4–84 pg L−1)(Monperrus et al. 2007) or in the Artic Ocean (7.9±4.4 pg L−1) (Kirk et al. 2008).
The diurnal concentrations of MMHgT during the wet sea-son decreased from sunrise (~6 h) to sunset (~18 h) and in-creased overnight until sunrise (Figs. 2c and 3b). The concen-tration of Hg° in SS and NS (Fig. 2h) increased from 06 h,with a peak between 12 and 15 h to further decrease untilsunset. The same behavior was also observed for Hg° andDMHg in NS during the wet season (Fig. 3d).
Between both seasons, total MMHg and IHg exhibit differ-ent trends at SS that might be related to the occurrence ofhigher particle contents (and aggregates) during the dry seasonin the water column. MMHg showed a decreasing trend withincreasing oxygen at the SS site during the dry season and atthe NS for the wet season (r2=0.8, p<0.002 and r2=0.8,p<0.05, respectively) but no trend for SS during the wet sea-son (p>0.05) (Figure A.a,b in SM). This result suggests thatMMHg net accumulation in the water column is likely en-hanced when lower oxygen concentrations occur, especiallyat night when oxygen consumption processes are dominant.Besides MMHg has been reported to be produced within theanoxic layer of lake waters (Eckley and Hintelmann 2006), no
anoxia has been observed in this study. This may suggests thatmore reductive conditions in the water column likely associ-ated to organic matter mineralization can promote Hg meth-ylation as previously observed (Bouchet et al. 2013;Monperrus et al. 2007). The occurrence of anaerobic bacteriacommunities in the water column located into anoxic micro-environments (e.g., particles) playing a role in Hg methyla-tion, such as SRB, has been shown in this study and alsopreviously established in other aquatic systems (Acha et al.2012). During daytime, water in Lake Uru Uru exhibited ox-ygen supersaturation, demonstrating intense primary produc-tivity whenMMHg levels are decreasing. Such photosyntheticactivity may inhibit Hg methylation triggered under more re-ductive conditions. Also, this may be due to increased activityof filamentous algae Oedogonium sp. and other algae thathave been found to accumulate MMHg (Lanza et al. 2015).The explanation of such decline in MMHg concentrationsmay also be associated to stronger light-induced demethyla-tion (Black et al. 2012; Lehnherr and St. Louis 2009). Asshown in Fig. 2b–d, lower MMHg concentrations coincidewith daylight maxima, which mean that solar radiation mayinfluence decline of MMHg. However, the in situ incubationsdescribed later (BBiogeochemical transformation of mercury
Fig. 4 Correspondence analysis based on T-RFLP results for the dsrABgenes in the samples collected during the late dry season at stations SSand NS and in different compartments (W water, Sed sediments, Agg
floating bio-organic aggregates). The letters A, B, and C refer totriplicates for each sample
Environ Sci Pollut Res
Author's personal copy
254
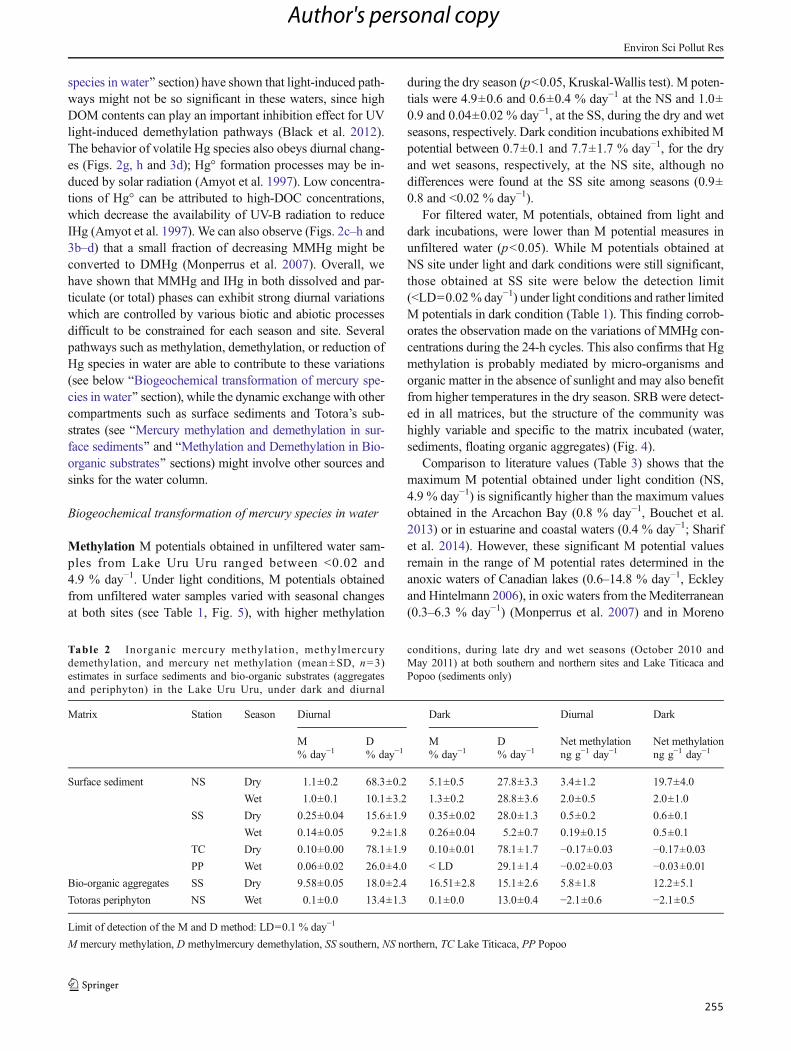
species in water^ section) have shown that light-induced path-ways might not be so significant in these waters, since highDOM contents can play an important inhibition effect for UVlight-induced demethylation pathways (Black et al. 2012).The behavior of volatile Hg species also obeys diurnal chang-es (Figs. 2g, h and 3d); Hg° formation processes may be in-duced by solar radiation (Amyot et al. 1997). Low concentra-tions of Hg° can be attributed to high-DOC concentrations,which decrease the availability of UV-B radiation to reduceIHg (Amyot et al. 1997). We can also observe (Figs. 2c–h and3b–d) that a small fraction of decreasing MMHg might beconverted to DMHg (Monperrus et al. 2007). Overall, wehave shown that MMHg and IHg in both dissolved and par-ticulate (or total) phases can exhibit strong diurnal variationswhich are controlled by various biotic and abiotic processesdifficult to be constrained for each season and site. Severalpathways such as methylation, demethylation, or reduction ofHg species in water are able to contribute to these variations(see below BBiogeochemical transformation of mercury spe-cies in water^ section), while the dynamic exchange with othercompartments such as surface sediments and Totora’s sub-strates (see BMercury methylation and demethylation in sur-face sediments^ and BMethylation and Demethylation in Bio-organic substrates^ sections) might involve other sources andsinks for the water column.
Biogeochemical transformation of mercury species in water
Methylation M potentials obtained in unfiltered water sam-ples from Lake Uru Uru ranged between <0.02 and4.9 % day−1. Under light conditions, M potentials obtainedfrom unfiltered water samples varied with seasonal changesat both sites (see Table 1, Fig. 5), with higher methylation
during the dry season (p<0.05, Kruskal-Wallis test). M poten-tials were 4.9±0.6 and 0.6±0.4 % day−1 at the NS and 1.0±0.9 and 0.04±0.02 % day−1, at the SS, during the dry and wetseasons, respectively. Dark condition incubations exhibited Mpotential between 0.7±0.1 and 7.7±1.7 % day−1, for the dryand wet seasons, respectively, at the NS site, although nodifferences were found at the SS site among seasons (0.9±0.8 and <0.02 % day−1).
For filtered water, M potentials, obtained from light anddark incubations, were lower than M potential measures inunfiltered water (p<0.05). While M potentials obtained atNS site under light and dark conditions were still significant,those obtained at SS site were below the detection limit(<LD=0.02% day−1) under light conditions and rather limitedM potentials in dark condition (Table 1). This finding corrob-orates the observation made on the variations of MMHg con-centrations during the 24-h cycles. This also confirms that Hgmethylation is probably mediated by micro-organisms andorganic matter in the absence of sunlight and may also benefitfrom higher temperatures in the dry season. SRB were detect-ed in all matrices, but the structure of the community washighly variable and specific to the matrix incubated (water,sediments, floating organic aggregates) (Fig. 4).
Comparison to literature values (Table 3) shows that themaximum M potential obtained under light condition (NS,4.9 % day−1) is significantly higher than the maximum valuesobtained in the Arcachon Bay (0.8 % day−1, Bouchet et al.2013) or in estuarine and coastal waters (0.4 % day−1; Sharifet al. 2014). However, these significant M potential valuesremain in the range of M potential rates determined in theanoxic waters of Canadian lakes (0.6–14.8 % day−1, Eckleyand Hintelmann 2006), in oxic waters from the Mediterranean(0.3–6.3 % day−1) (Monperrus et al. 2007) and in Moreno
Table 2 Inorganic mercury methylation, methylmercurydemethylation, and mercury net methylation (mean±SD, n=3)estimates in surface sediments and bio-organic substrates (aggregatesand periphyton) in the Lake Uru Uru, under dark and diurnal
conditions, during late dry and wet seasons (October 2010 andMay 2011) at both southern and northern sites and Lake Titicaca andPopoo (sediments only)
Matrix Station Season Diurnal Dark Diurnal Dark
M D M D Net methylation Net methylation% day−1 % day−1 % day−1 % day−1 ng g−1 day−1 ng g−1 day−1
Surface sediment NS Dry 1.1±0.2 68.3±0.2 5.1±0.5 27.8±3.3 3.4±1.2 19.7±4.0
Wet 1.0±0.1 10.1±3.2 1.3±0.2 28.8±3.6 2.0±0.5 2.0±1.0
SS Dry 0.25±0.04 15.6±1.9 0.35±0.02 28.0±1.3 0.5±0.2 0.6±0.1
Wet 0.14±0.05 9.2±1.8 0.26±0.04 5.2±0.7 0.19±0.15 0.5±0.1
TC Dry 0.10±0.00 78.1±1.9 0.10±0.01 78.1±1.7 −0.17±0.03 −0.17±0.03PP Wet 0.06±0.02 26.0±4.0 < LD 29.1±1.4 −0.02±0.03 −0.03±0.01
Bio-organic aggregates SS Dry 9.58±0.05 18.0±2.4 16.51±2.8 15.1±2.6 5.8±1.8 12.2±5.1
Totoras periphyton NS Wet 0.1±0.0 13.4±1.3 0.1±0.0 13.0±0.4 −2.1±0.6 −2.1±0.5
Limit of detection of the M and D method: LD=0.1 % day−1
M mercury methylation, D methylmercury demethylation, SS southern, NS northern, TC Lake Titicaca, PP Popoo
Environ Sci Pollut Res
Author's personal copy
255
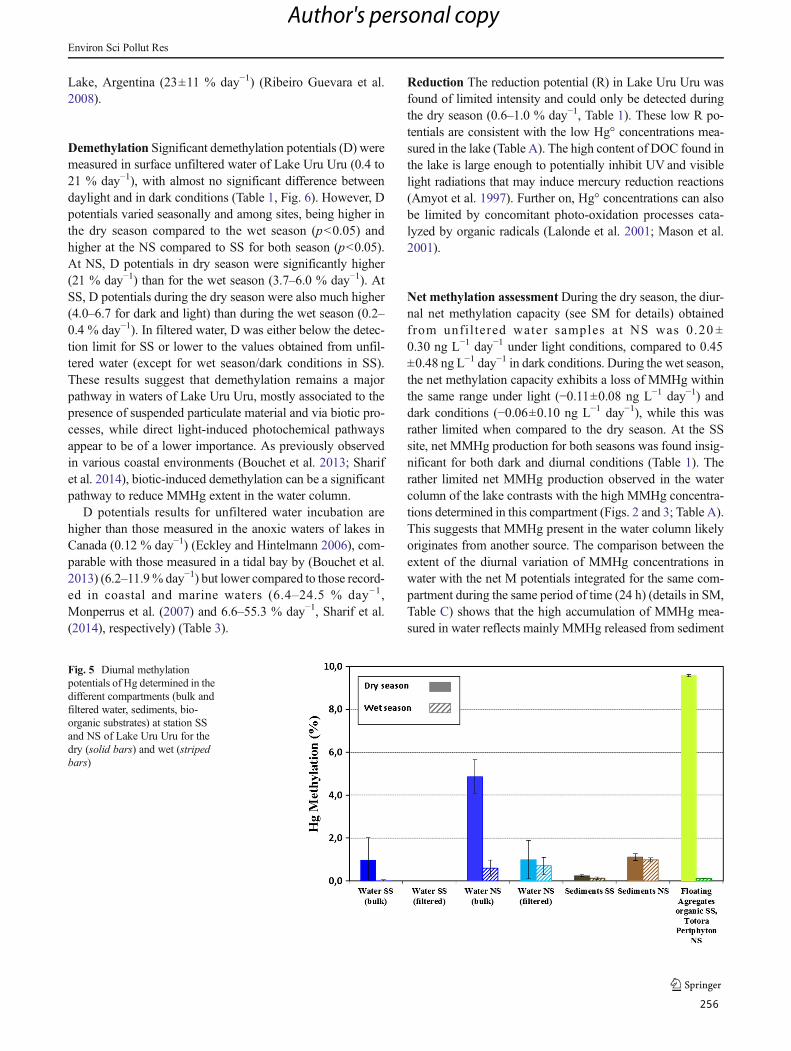
Lake, Argentina (23±11 % day−1) (Ribeiro Guevara et al.2008).
Demethylation Significant demethylation potentials (D) weremeasured in surface unfiltered water of Lake Uru Uru (0.4 to21 % day−1), with almost no significant difference betweendaylight and in dark conditions (Table 1, Fig. 6). However, Dpotentials varied seasonally and among sites, being higher inthe dry season compared to the wet season (p<0.05) andhigher at the NS compared to SS for both season (p<0.05).At NS, D potentials in dry season were significantly higher(21 % day−1) than for the wet season (3.7–6.0 % day−1). AtSS, D potentials during the dry season were also much higher(4.0–6.7 for dark and light) than during the wet season (0.2–0.4 % day−1). In filtered water, D was either below the detec-tion limit for SS or lower to the values obtained from unfil-tered water (except for wet season/dark conditions in SS).These results suggest that demethylation remains a majorpathway in waters of Lake Uru Uru, mostly associated to thepresence of suspended particulate material and via biotic pro-cesses, while direct light-induced photochemical pathwaysappear to be of a lower importance. As previously observedin various coastal environments (Bouchet et al. 2013; Sharifet al. 2014), biotic-induced demethylation can be a significantpathway to reduce MMHg extent in the water column.
D potentials results for unfiltered water incubation arehigher than those measured in the anoxic waters of lakes inCanada (0.12 % day−1) (Eckley and Hintelmann 2006), com-parable with those measured in a tidal bay by (Bouchet et al.2013) (6.2–11.9% day−1) but lower compared to those record-ed in coastal and marine waters (6.4–24.5 % day−1,Monperrus et al. (2007) and 6.6–55.3 % day−1, Sharif et al.(2014), respectively) (Table 3).
Reduction The reduction potential (R) in Lake Uru Uru wasfound of limited intensity and could only be detected duringthe dry season (0.6–1.0 % day−1, Table 1). These low R po-tentials are consistent with the low Hg° concentrations mea-sured in the lake (Table A). The high content of DOC found inthe lake is large enough to potentially inhibit UV and visiblelight radiations that may induce mercury reduction reactions(Amyot et al. 1997). Further on, Hg° concentrations can alsobe limited by concomitant photo-oxidation processes cata-lyzed by organic radicals (Lalonde et al. 2001; Mason et al.2001).
Net methylation assessment During the dry season, the diur-nal net methylation capacity (see SM for details) obtainedfrom unfi l tered water samples at NS was 0.20 ±0.30 ng L−1 day−1 under light conditions, compared to 0.45±0.48 ng L−1 day−1 in dark conditions. During the wet season,the net methylation capacity exhibits a loss of MMHg withinthe same range under light (−0.11±0.08 ng L−1 day−1) anddark conditions (−0.06±0.10 ng L−1 day−1), while this wasrather limited when compared to the dry season. At the SSsite, net MMHg production for both seasons was found insig-nificant for both dark and diurnal conditions (Table 1). Therather limited net MMHg production observed in the watercolumn of the lake contrasts with the high MMHg concentra-tions determined in this compartment (Figs. 2 and 3; Table A).This suggests that MMHg present in the water column likelyoriginates from another source. The comparison between theextent of the diurnal variation of MMHg concentrations inwater with the net M potentials integrated for the same com-partment during the same period of time (24 h) (details in SM,Table C) shows that the high accumulation of MMHg mea-sured in water reflects mainly MMHg released from sediment
Fig. 5 Diurnal methylationpotentials of Hg determined in thedifferent compartments (bulk andfiltered water, sediments, bio-organic substrates) at station SSand NS of Lake Uru Uru for thedry (solid bars) and wet (stripedbars)
Environ Sci Pollut Res
Author's personal copy
256

Tab
le3
Com
parisonof
potentialmethylatio
nof
inorganicmercury
anddemethylatio
nof
methylm
ercury
obtained
inwater,sedim
ent,andbio-organicsubstrates
(e.g.,macrophyticandrhizospheric
periphyton,oraggregated
biofilm
s)of
LakeUru
Uru
with
values
obtained
from
incubatio
nsin
differentregions
andecosystems
Matrix
Location-ecosystem
Tracersandmethod
Incubatio
ntim
e(day)
Diurnalmethylatio
nyields
(%day−
1)
Diurnaldemethylatio
nyields
(%day−
1)
Reference
Waters
MediterraneanSea(m
arinesurfacewater)
199Hg
Me2
01Hg
10.3–6.3
6.4–24.5
Monperrus
etal.(2007)
Canada,Lakes
(oxycline,water
column)
199Hg
Me2
01Hg
10.6–14.8
0.12
EckleyandHintelm
ann(2006)
France,A
rcachonBay
(1m
depth,water
column)
199Hg
Me2
01Hg
1≤0
.02–0.8
6.2–11.9
Bouchetetal.(2013)
Argentina-Morenolake
(water
with
plankton
<50
μm
&UV-PAradiation)
197Hg
123
±11
–Ribeiro
Guevara
etal.(2008)
France,A
dour
River
estuary(Bay
ofBiscay,SW
)(coastalsurfacewater)
199Hg
Me2
01Hg
1<0.01–0.4
6.6–55.3
Sharifetal.(2014)
Bolivia,A
ltiplano
LakeUru
Uru
(water
column)
199Hg
Me2
01Hg
10.04–4.9
0.4–21.0
Presentstudy
Sediments
Brazil,AmazonianLakes
203Hg
0.022–0.41
–Guimarãesetal.(1994,1999)
Brazil,PantanalLake
203Hg
31.2
–Guimarãesetal.(1998)
Brazil,SaoPaulo
L.doDiogo
Lake
203Hg
2–5
2.5
Lem
osetal.(1999)
France,M
editerraneanSea
(coastal
surfacesediments)
199Hg
Me2
01Hg
10.79–1.32
0.47–1.42
Monperrus
etal.(2007)
France,A
rcachonBay
(surface
sediment)
199Hg
Me2
01Hg
10.4–3.2
47–72
Bouchetetal.(2013)
Bolivia,A
ltiplano,
LakeUru
Uru
(surface
sediment)
199HgMe2
01 H
g1
0.14–1.1
9.2–68.3
Presentstudy
Floatingmacrophytes
Brazil,Pantanal
Ipiranga
Lake
203Hg
32.2–3.5
Guimarãesetal.(1998)
Phytoplankton
Brazil,RibeiraodasLajes
Reservoir
203Hg
41.5
Coelho-So
uzaetal(2006)
Periphyton
macrophytes-associated
Brazil,eutrophictropical
LagoinhaLake
203Hg
4–12
17/1
.5–7.7
Mauro
etal.(2002)
Periphyton
roots-associated
Bolivia,A
mazon
LaGranjaLake
200Hg
203Hg
127.5–42.7
Achaetal.(2005);Correia
etal.(2012)
Bolivia,A
mazon
Viejo
River
Lake
203Hg
13.1–4.4
Correiaetal.(2012)
Bolivia,A
mazon,S
alinas
Lake
203Hg
10.19–0.21
France,S
WSanguinetL
ake
199Hg
Me2
01Hg
16.0±2.3
Gentèsetal.(2013)
France,S
WAureilhan
Lake
199Hg
Me2
01Hg
4.7±3.7
TotorasPeriphyton
Bolivia,A
ltiplano,
LakeUru
Uru
199Hg
Me2
01Hg
10
Presentstudy
Bio-organicAggregate
Bolivia,A
ltiplano
LakeUru
Uru
199Hg
Me2
01Hg
19.58
±0.05
Environ Sci Pollut Res
Author's personal copy
257
or bio-organic substrates as previously suggested in other eco-systems (Table 3, Bouchet et al. 2013; Guimaraes et al. 1999;Guimarães et al. 2000; Point et al. 2007).
Mercury methylation and demethylation in surfacesediments
MMHg concentrations in sediments from Lake Uru Uru werefound to range from 0.9±0.2 to 4.0±1.3 ng g−1 and those ofIHg from 200±12 to 394±35 ng g−1, with the highest valuesbeing observed at the NS site (Table B). Also, the percentagesof organic carbon (~ 5.8 %) and sulfur (~1 %) were similar inmagnitude at both sites. Concentrations of MMHg and IHg insediments from Lakes Titicaca and Poopó were very low incomparison to those in Lake Uru Uru (Table B).
Methylation Overall, diurnal M rates in Lake Uru Uru sedi-ments ranged from 0.14±0.05 to 1.1±0.2 % day−1 (Table 2,Fig. 5). Higher M values were found at NS (1.0–1.1 % day−1)than for SS (0.14–0.25 % day−1) for both seasons (p<0.05). Mpotentials remained significantly higher in dark conditions atboth sites and for both seasons. Complementary data obtainedfrom nearby Lake Titicaca and lake Poopó showed similar(p>0.05) but low M potentials (give values here), in the samerange as those measured at SS for the same season (Table 2).These data probably reflect a baseline value for Hg methyla-tion in undisturbed sediment of the TDPS watershed. Thediurnal M potential in the sediments of Lake Uru Uru are alsocomparable with other lacustrine or coastal sites previouslyinvestigated under similar experimental conditions (Table 3).
Demethylation Demethylation potentials in Lake Uru Urusediments during the dry season, under daylight conditions,were significantly different between NS and SS sites
(p<0.05), exhibiting 68.3±0.2 and 15.6±1.9 % day−1, respec-tively (Table 2, Fig. 6). Under dark conditions, the D poten-tials were similar (28±3 and 28±1 % day−1) at both sites. Inthe wet season, the D potentials were significantly lower forboth NS and SS (respectively, 10.1±3.2 and 9.2±1.8 % day−1,p<0.05). While under dark condition, the D potentials were29±4 % day−1 for the NS and 5.2±0.7 % day−1 for SS.
In Lake Poopó, D values were similar under daylight anddarkness conditions (26.0–29.1 % day−1, Table 2) (p>0.05),while much higher D potentials were measured in LakeTiticaca (ca. 78 % day−1). In all sediment types from the dif-ferent lakes of this Altiplano region, D always remains a sig-nificant process, as previously shown in sediments from otherlocations (Table 3). Degradation of MMHg in sediments ofLake Uru Uru cannot be clearly attributed to either light-induced or dark processes, but likely involving more specifi-cally different bacteria communities and assemblages. Forinstance, a study carried out by Oremland et al. (1991) inanoxic sediments found that communities of metallogenicand sulfate-reducing bacteria are involved in MMHg demeth-ylation processes. Bouchet et al. (2013) also found significantdemethylation rates in a shallow coastal lagoon under similarexperimental conditions (Table 3) which was clearly not en-hanced under light exposition.
Netmethylation assessment The netM calculations (Table 2)indicate that the methylation capacity of sediments was muchhigher relative to the water compartment and leading to higheryield during the dry season. The comparison of the two sitesshows that MMHg was mainly produced in the sediment atNS, for both seasons (3.4±1.2 and 2.0±0.5 ng g−1 day−1 forthe dry and wet seasons, respectively). Although net methyl-ation rates at SS were lower than those at NS, they remainedslightly positive (0.5±0.2 and 0.19±0.15 ng g−1 day−1 for the
Fig. 6 Diurnal demethylationpotentials of Hg determined in thedifferent compartments (bulk andfiltered water, sediments, bio-organic substrates) at station SSand NS of Lake Uru Uru for thedry (solid bars) and wet (stripedbars) season
Environ Sci Pollut Res
Author's personal copy
258
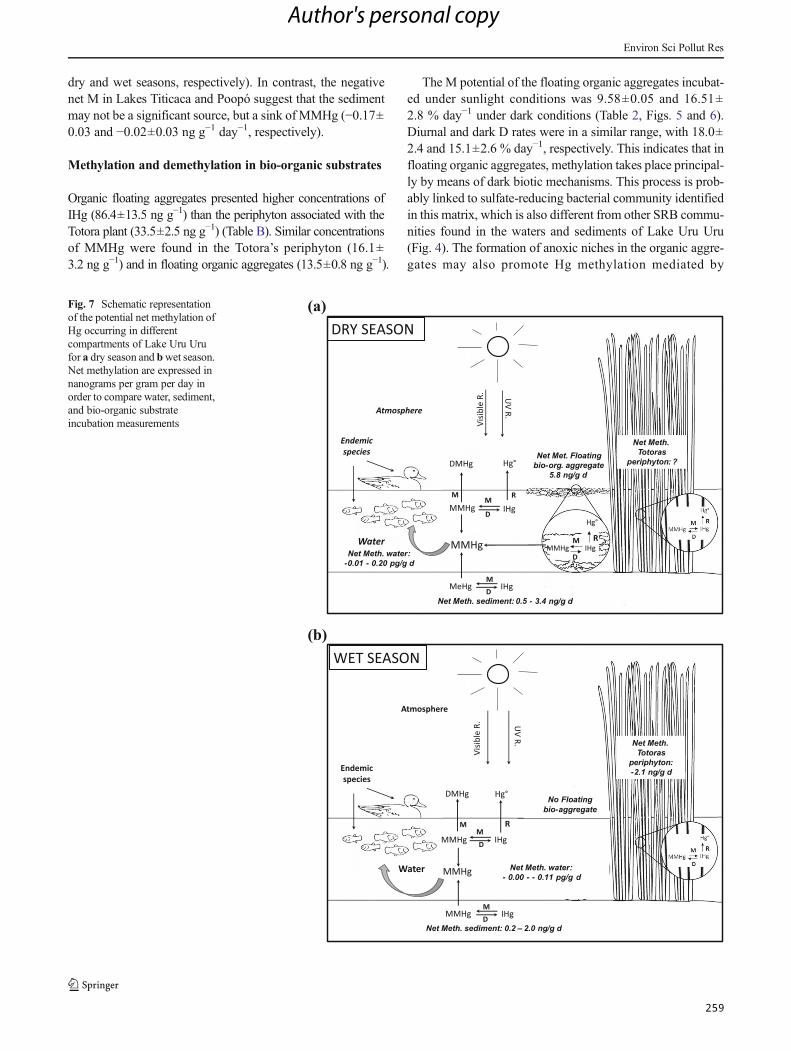
dry and wet seasons, respectively). In contrast, the negativenet M in Lakes Titicaca and Poopó suggest that the sedimentmay not be a significant source, but a sink of MMHg (−0.17±0.03 and −0.02±0.03 ng g−1 day−1, respectively).
Methylation and demethylation in bio-organic substrates
Organic floating aggregates presented higher concentrations ofIHg (86.4±13.5 ng g−1) than the periphyton associated with theTotora plant (33.5±2.5 ng g−1) (Table B). Similar concentrationsof MMHg were found in the Totora’s periphyton (16.1±3.2 ng g−1) and in floating organic aggregates (13.5±0.8 ng g−1).
The M potential of the floating organic aggregates incubat-ed under sunlight conditions was 9.58±0.05 and 16.51±2.8 % day−1 under dark conditions (Table 2, Figs. 5 and 6).Diurnal and dark D rates were in a similar range, with 18.0±2.4 and 15.1±2.6 % day−1, respectively. This indicates that infloating organic aggregates, methylation takes place principal-ly by means of dark biotic mechanisms. This process is prob-ably linked to sulfate-reducing bacterial community identifiedin this matrix, which is also different from other SRB commu-nities found in the waters and sediments of Lake Uru Uru(Fig. 4). The formation of anoxic niches in the organic aggre-gates may also promote Hg methylation mediated by
(a)
(b)
MMHg
MeHg IHgMD
MMHg IHgM
D
R
Hg°
UV R.
Visib
le R
.
Water
Atmosphere
Endemicspecies
Net Meth. sediment: 0.5 - 3.4 ng/g d
Net Meth. water: -0.01 - 0.20 pg/g d
Net Meth. Totoras
periphyton: ?Net Met. Floating
bio-org. aggregate5.8 ng/g d
M
DMHg
MMHgM
DIHg
Hg°
R
DRY SEASON
MMHg
MMHg IHgMD
MMHg IHgMD
R
Hg°
UV R.
Visib
le R
.
Water
Atmosphere
Endemicspecies
Net Meth. sediment: 0.2 – 2.0 ng/g d
Net Meth. Totoras
periphyton: -2.1 ng/g d
Net Meth. water: - 0.00 - - 0.11 pg/g d
No Floatingbio-aggregate
WET SEASON
DMHg
M
Fig. 7 Schematic representationof the potential net methylation ofHg occurring in differentcompartments of Lake Uru Urufor a dry season and bwet season.Net methylation are expressed innanograms per gram per day inorder to compare water, sediment,and bio-organic substrateincubation measurements
Environ Sci Pollut Res
Author's personal copy
259
anaerobic communities. In this sense, it should be taken intoaccount that the particulate matter, and more specifically largeand small organic aggregates, may be also components con-tributing to MMHg burden in the water column as observedduring the dry season.
Hg methylation capacity of the periphyton associated withTotora plants was found negligible (<LD=0.1 % day−1).However, significant D extents were measured (13.4±1.3 % day−1), with no difference with the incubation madeunder darkness (Table 2, Figs. 5 and 6). Conversely, theseresults show a high MMHg demethylation capacity involvingthe participation of diverse aquatic micro-organisms, includ-ing bacteria communities. Periphyton associated with Totora’splant tend to accumulate MMHg. Interestingly, Lanza et al.(2015) suggest that algae found in these periphyton, such asOedogonium sp. can bioconcentrate metals and also MMHgin Lake Uru Uru showing that periphyton could be beneficialin reducing aqueous MMHg by both accumulation anddegradation.
Net methylation assessment The floating organic aggregateswere characterized by a net methylation capacity of 5.8±1.8 ng g−1 day−1, which is twice higher under dark conditions,while Totora’s periphyton showed a net demethylation capac-ity of 2.3±0.7 ng g−1 day−1, with no change in dark conditions(Table 2). MMHg production in periphyton isolated fromTotora plants seems very low in comparison to previous ex-periments with periphyton associated to macrophytes from theBolivian Amazon (Table 3). Meanwhile, the diurnal methyla-tion potential of floating organic aggregates (9.58±0.05 % day−1) was found to be in the same range than theperiphyton associated with macrophytes from tropical ecosys-tems and from other temperate lakes (Table 3).
Implications for MMHg contamination in Lake UruUru
Lake Uru Uru (and part of the TDPS watershed, BolivianAltiplano) acts as a sink for several mining and urban wasteeffluents (Garcia 2006; Tapia et al. 2012). Mercury pollutionmay become an important threat for local population livingfrom hunting and fishing of several endemic species. Potentialexposure to elevated MMHg levels was assessed in variousspecies of water birds and fish from Lake Uru Uru exhibitingHg levels averaging around 2 and 1 μg g−1 in birds and fishmuscle, respectively (Aguirre et al. 2014; Molina et al. 2012).Thus, the elucidation of the main processes controlling theproduction of MMHg in the lake is of primary importanceand is summarized in Fig. 7. During the dry season, thehighest Hg methylation potential was found in floating organ-ic aggregates, followed by sediments (Fig. 7a). A lower meth-ylation capacity in sediments was found during the wet season
(Fig. 7b). The origin of the floating organic aggregates andtheir biological composition is not well understood. Theirpresence was only reported during the dry season and mayresult from the decomposition and flocculation of fresh organ-ic matter originating from the autotrophic production of plank-ton, Totora’s periphyton exudates, and suspended particulatematter in combination with the higher conductivity reportedduring this season. The complementary contribution of organ-ic matter originating from the discharge of urban effluentslocalized in the northern part of Lake Uru Uru has also to beconsidered. Hg methylation potentials measured were low inthe water column compared to the sediments. This suggeststhat the increasing MMHg concentrations measured in thewater during the 24-h cycle may also reflect the contributionof MMHg originating from other aquatic compartments, suchas bio-organic substrates during the dry season, but with aconstant resupply from the sediment compartment.
Acknowledgments This work is a contribution to the COMIBOL pro-ject (INSU CNRS/IRD EC2CO Program) and LAPACHAMAMA pro-ject (ANR CESA program, No. ANR-13-CESA-0015-01). We wish tothank J.L. Duprey, A. Castillo, M. Claure (IRD Bolivia), and Don Ger-man Calizaya (Fishermen Association, Machacamarca, Bolivia) for theirhelp and assistance during the field campaigns.
References
Acha D, Hintelmann H, Pabon CA, Iñiguez V, Roulet M, GuimaraesJRD, Luna R, Alanoca L, Sanchez S (2005) Sulfate-reducing bac-teria in floating macrophyte rhizosphere from an Amazonian floodplain lake in Bolivia and their association with Hg methylation.Appl Environ Microbiol 71(11):7531–7535
Acha D, Pabon CA, Hintelmann H (2012) Mercury methylation andhydrogen sulfide production among unexpected strains isolatedfrom periphyton of two macrophytes of the Amazon. FEMSMicrobiol Ecol 80:637–645
Aguirre M, Lazzaro X, Point D, Pouilly M (2014) Línea base deconocimientos sobre los recursos hidrológicos en el sistema TDPScon enfoque en la cuenca del Lago Titicaca. IRD - UICN, Quito,Ecuador, p 320
Allen JW, Shanker G, Tan KH, Aschner M (2002) The consequences ofmethylmercury exposure on interactive functions between astro-cytes and neurons. Neurotoxicology 23:755–759
Amyot MS, Mierle G, Lean D, McQueen DJ (1997) Effect of solar radi-ation on the formation of dissolved gaseous mercury in temperatelakes. Geochim Cosmochim Acta 61:975–987
Arcagni M, Campbell L, Arribére MA, Marvin-DiPasquale M, Rizzo A,Ribeiro GS (2013) Differential mercury transfer in the aquatic foodweb of a double basined lake associated with selenium and habitat.Sci Total Environ 454–455:170–180
Baldi F, Parati F, Filippelli M, Electric Power Research InstitutePACAUS, Environment C, Atmospheric Environment Service Cet al (1995) Dimethylmercury and dimethylmercury-sulfide of mi-crobial origin in the biogeochemical cycle of Hg (English). In:Mercury as a global pollutant. International conference (English),vol 80. Springer, Dordrecht, pp 805–815
Barkay T,Wagner‐Döbler I (2005)Microbial transformations of mercury:potentials, challenges, and achievements in controlling mercury tox-icity in the environment. Adv Appl Microbiol 57:1–52
Environ Sci Pollut Res
Author's personal copy
260
Black FJ, Poulin BA, Flegal AR (2012) Factors controlling the abioticphoto-degradation of monomethylmercury in surface waters.Geochim Cosmochim Acta 84:492–507
Blumthaler M, Ambach W, Ellinger R (1997) Regular paper: increase insolar UV radiation with altitude. J Photochem Photobiol B Biol 39:130–134
Bouchet S, Tessier E, Monperrus M, Bridou R, Clavier J, Thouzeau G etal (2011) Measurements of gaseous mercury exchanges at the sed-iment-water, water-atmosphere and sediment-atmosphere interfacesof a tidal environment (Arcachon Bay, France). J Environ Monit:JEM 13:1351–1359
Bouchet S, Amouroux D, Rodriguez-Gonzalez P, Tessier E, MonperrusM, Thouzeau G et al (2013) MMHg production and export fromintertidal sediments to the water column of a tidal lagoon (ArcachonBay, France). Biogeochemistry 114:341–358
Coelho-Souza SA, Guimarães JRD, Mauro JBN (2006) Mercury meth-ylation and bacterial activity associated to tropical phytoplankton.Sci Total Environ 364:188–199
Compeau G, Bartha R (1984) Methylation and demethylation of mercuryunder controlled redox, pH and salinity conditions. Appl EnvironMicrobiol 48:1203–1207
Correia RRS,MirandaMR, Guimaraes JRD (2012) Mercury methylationand the microbial consortium in periphyton of tropical macrophytes:effect of different inhibitors. Environ Res 112:86–91
Craig PJ, Morton SF (1978) Kinetics and mechanism of the reactionbetween methylcobalamin and mercuric chloride. J OrganometChem 145:79–89
Eckley CS, Hintelmann H (2006) Determination of mercury methylationpotentials in the water column of lakes across Canada. Sci TotalEnviron 368:111–125
F i t z g e r a l d WF, C l a r k s o n TW ( 1 9 9 1 ) M e r c u r y a n dmonomethylmercury—present and future concerns. EnvironHealth Perspect 96:159–166
Fitzgerald WF, Lamborg CH (2004) Geochemistry of mercury in theenvironment treatise on geochemistry, vol 9. Elsevier, Oxford
Garcia ME (2006) Transport of arsenic and heavy metals to Lake Poopó–Bolivia Natural Leakage and Antropogenic Effects Department ofWater Resource Engineering Lund Institute of Technology. DoctoralThesis. Lund, Sweden
Gentès S,MonperrusM, Legeay A,Maury-Brachet R, Davail S, André J-M et al (2013) Incidence of invasivemacrophytes onmethylmercurybudget in temperate lakes: central role of bacterial periphytic com-munities. Environ Pollut 172:116–123
Guimarães JRD, Malm O, Padovani C, Sanches M, Forsberg B, PfeifferWC (1994) A summary of data on net mercury methylation rates insediment, water, soil and other samples from the Amazon regionobtained through radiochemical methods. Proceedings of the inter-national workshop on environmental mercury pollution and itshealth effects in Amazon River Basin, Rio de Janeiro, p 94-99
Guimarães JRD, Meili M, de Souza Brito EM (1998) Hg methylation insediments and floating meadows of a tropical lake in the Pantanalfloodplain, Brazil. Sci Total Environ 213:165–175
Guimaraes JRD, Fostier A-H, Forti MC,Melfi JA, Kehrig H,Mauro JBNet al (1999) Mercury in human environmental samples from twolakes in Amapa, Brazilian Amazon. Ambio 28:296–301
Guimarães JRD, Meili M, Hylander LD, EdCe S, Roulet M, Mauro JBNet al (2000) Mercury net methylation in five tropical flood plainregions of Brazil: high in the root zone of floating macrophyte matsbut low in surface sediments and flooded soils. Sci Total Environ261:99–107
Hammerschmidt CR, Fitzgerald WF (2006) Photodecomposition ofmethylmercury in an Arctic Alaskan Lake (English). Environ SciTechnol 40:1212–1216
Hintelmann H (2010) Organomercurials. Their formation and pathwaysin the environment. Met Ions Life Sci 7:365–401
Hollweg TA, Gilmour CC, Mason RP (2009) Methylmercury productionin sediments of Chesapeake Bay and the mid-Atlantic continentalmargin. Mar Chem 114:86–101
Kirk JL, Louis VLS, HintelmannH, Lehnherr I, Else B, Poissant L (2008)Methylated mercury species in marine waters of the Canadian highand sub arctic (English). Environ Sci Technol 42:8367–8373
Lalonde JD, Amyot M, Kraepiel AML, Morel FMM (2001)Photooxidation of Hg(0) in artificial and natural waters (English).Environ Sci Technol 35:1367–1372
Lanza WG, Acha D, Point D, Masbou J, Alanoca L, Amouroux D, et al(2015) Association of a specific algal group to methylmercury ac-cumulation in periphyton of a tropical high-altitude Andean Lake.2015; submitted
Lehnherr I, St. Louis VL (2009) Importance of ultraviolet radiation in thephotodemethylation of methylmercury in freshwater ecosystems(English). Environ Sci Technol 43:5692–5698
Lemos RA, Guimarães JRD, Bianchini JI (1999) Mercury methylation inEichhorniaazurea roots and sediments during a seasonal cycle in aBrazilian lake. Proceedings of the 5th International Conference onHg as a Global Pollutant, Rio de Janeiro, Brazil, p 462
Marusczak N, Larose C, Dommergue A, Paquet S, Beaulne J-S, Maury-Brachet R et al (2011) Mercury and methylmercury concentrationsin high altitude lakes and fish (Arctic charr) from the French Alpsrelated to watershed characteristics. Sci Total Environ 409:1909–1915
Mason RP, Lawson NM, Sheu GR (2001) Mercury in the Atlantic Ocean:factors controlling air-sea exchange of mercury and its distributionin the upper waters. Deep-Sea Res II Top Stud Oceanogr 48:2829–2853
Maurice-Bourgoin L, Quiroga I, Chincheros J, Courau P (2000) Mercurydistribution in waters and fishes of the upper Madeira rivers andmercury exposure in riparian Amazonian populations. Sci TotalEnviron 260:73–86
Mauro JBN, Guimarães JRD, Hintelmann H, Watras CJ, Haack EA,Coelho-Souza SA (2002) Mercury methylation in macrophytes, pe-riphyton, and water-comparative studies with stable and radio-mercury additions. Anal Bioanal Chem 374:983–989
Molina CI, Ibañez C, Gibon FM (2012) Proceso de biomagnificación demetales pesados en un lago hiperhalino (Poopó, Oruro, Bolivia):Posible riesgo en la salud de consumidores. Ecología en Bolivia[online] 47:99–118
Monperrus M, Tessier E, Veschambre S, Amouroux D, Donard O (2005)Simultaneous speciation of mercury and butyltin compounds in nat-ural waters and snow by propylation and species-specific isotopedilution mass spectrometry analysis. Anal Bioanal Chem 381:854–862
Monperrus M, Tessier E, Amouroux D, Leynaert A, Huonnic P, DonardOFX (2007) Mercury methylation, demethylation and reductionrates in coastal and marine surface waters of the MediterraneanSea. Mar Chem 107:49–63
Monperrus M, Gonzalez PR, Amouroux D, Garcia Alonso JI, DonardOFX (2008) Evaluating the potential and limitations of double-spiking species-specific isotope dilution analysis for the accuratequantification of mercury species in different environmental matri-ces. Anal Bioanal Chem 390:655–666
Oremland RS, Culbertson CW, Winfrey MR (1991) Methylmercury de-composition in sediments and bacterial cultures: involvement ofmethanogens and sulfate reducers in oxidative demethylation(English). Appl Environ Microbiol (Print) 57:130–137
Point D, Monperrus M, Tessier E, Amouroux D, Chauvaud L, ThouzeauG et al (2007) Biological control of trace metal and organometalbenthic fluxes in a eutrophic lagoon (Thau Lagoon, MediterraneanSea, France). Estuar Coast Shelf Sci 72:457–471
Qianggong Z, Ke P, Shichang K, Aijia Z, Wen-XiongW (2014) Mercuryin wild fish from high-altitude aquatic ecosystems in the TibetanPlateau. Environ Sci Technol 48:5220–5228
Environ Sci Pollut Res
Author's personal copy
261
Ribeiro Guevara S, Queimaliños CP, Diéguez MC, Arribére M (2008)Methylmercury production in the water column of anultraoligotrophic lake of Northern Patagonia, Argentina.Chemosphere 72:578–585
Rodriguez-Gonzalez P, Bouchet S, Monperrus M, Tessier E, Amouroux D(2013) In situ experiments for element species-specific environmentalreactivity of tin and mercury compounds using isotopic tracers andmultiple linear regression. Environ Sci Pollut Res Int 20:1269–1280
Schaefer JK, JaneY, Reinfelder JR, Cardona T, EllicksonKM, Tel-Or S etal (2004) Role of the bacterial organomercury lyase (MerB) in con-trolling methylmercury accumulation in mercury-contaminated nat-ural waters. Environ Sci Technol 38:4304–4311
Sellers P, Kelly CA, Rudd JWM, MacHutchon AR (1996)Photodegradation of methylmercury in lakes. Nature [London]380:694–697
Sharif A, Monperrus M, Tessier E, Bouchet S, Pinaly H, Rodriguez-Gonzalez P et al (2014) Fate of mercury species in the coastal plumeof the Adour River estuary (Bay of Biscay, SW France). Sci TotalEnviron 496:701–713
Spangler WJ, Spigarelli JL, Rose JM, Flippin RS, Miller HH (1973)Degradation of methylmercury by bacteria isolated from environ-mental samples. Appl Microbiol 25:488–493
Tapia J, Audry S, Townley B, Duprey JL (2012) Geochemical back-ground, baseline and origin of contaminants from sediments in themining-impacted Altiplano and Eastern Cordillera of Oruro,Bolivia. Geochem Explor Environ Anal 12:3–20
Tseng CM, Lamborg C, Fitzgerald WF, Engstrom DR (2004) Cycling ofdissolved elemental mercury in Arctic Alaskan lakes. GeochimCosmochim Acta 68:1173–1184
UNEP (2013) Global mercury assessment 2013: sources, emissions, re-leases and environmental transport 2013. UNEP Chemicals Branch,Geneva
Wang S, Zhang M, Li B, Xing D, Wang X, Wei C et al (2012)Comparison of mercury speciation and distribution in the watercolumn and sediments between the algal type zone and the macro-phytic type zone in a hypereutrophic lake (Dianchi Lake) in south-western China. Sci Total Environ 417–418:204–213
Weber JH (1993) Review of possible paths for abiotic methylation ofmercury(II) in the aquatic environment. Chemosphere 26:2063–2077
Zaratti F, Forno RN, Garcia Fuentes J, Andrade MF (2003) Erythemallyweighted UV variations at two high-altitude locations. J GeophysRes 108:ACH5-ACH1-6
Environ Sci Pollut Res
Author's personal copy
262
263
The biogeochemical cycle of Hg in the high altitude and tropical
hydrosystemof Lake Uru-Uru, Bolivian Altiplano
This thesis is dedicated to the study of the biogeochemical cycle of Hg (Hg) in the
high altitude (3800m a.s.l.) and tropical aquatic ecosystem Uru-Uru, located on the Bolivian
Altiplano. The aim of this study is to gather information about the concentration levels of
different Hg species, and to understand the mechanisms involved in the formation of
methylHg (MMHg) which bioaccumulates in trophic food webs. In this environment, Hg
methylation is mediated predominantly by sulphate-reducing bacteria. Floating bio-inorganic
aggregates and surface sediments contributes significantly to the MMHg pool of the
ecosystem. The partition coefficients of MMHg and inorganic Hg (iHg) suggest that
sediments are the main source of MMHg to the water column. High percentages of dissolved
MMHg (~50%) suggest this compound to be highly stable in the water, probably due to the
important attenuation of UV radiation and the occurrence of complexing colloidal material.
Eventually, analyses of correlation factors Hg/Sb and Hg/W in the sediments show that the
main source of Hg is probably from mining origin.
264
Thèse de doctorat
Thèse présentée et soutenue par: Lucia Alanoca
Le : 16 décembre 2016
Au Laboratoire Géosciences de l’Environnement Toulouse (GET), Université Toulouse
Paul Sabatier.
Sous la direction de : Patrick Seyler Directeur de recherche à l’IRD.
Spécialité : Sciences de la Terre et des Planètes Solides.
Cycle biogéochimique du Hg dans l’hydrosystème tropical d’altitude lac
UruUru de l’Altiplano bolivien
Cette thèse est consacrée à l’étude du cycle biogéochimique du Hg (Hg) dans
l’écosystème aquatique tropical Uru-Uru, situé sur l’Altiplano bolivien à 3800m. L’objectif
était de documenter les niveaux de concentrations pour différentes espèces de Hg, et de
comprendre les mécanismes mis en jeu dans la formation du méthylHg (MMHg), qui se
bioaccumule dans la chaine trophique. Dans cet environnement, la methylation du Hg résulte
majoritairement de l’activité des bactéries sulfato-réductrices. Les agrégats bio-inorganiques
flottants et les sédiments de surface contribuent significativement au pool de MMHg de
l’écosystème. Les coefficients de partition du MMHg et du Hg inorganique (iHg) suggèrent
que les sédiments sont la source principale du MMHg vers la colonne d’eau. Les fortes
proportions en MMHg dissous (~50%) suggèrent une grande stabilité de ce composé dans
l‘eau, probablement influencé par l’atténuation forte du rayonnement UV et la présence de
matériel colloïdal complexant. Finalement, les analyses de coefficients de corrélation Hg/Sb
et Hg/W dans les sédiments, indiquent que la source principale du Hg est probablement
d’origine minière.
Mots clés : Hg, methylHg, isotopes stables, Altiplano bolivien, methylation, demethylation,
metaux, lac, coefficients de partition.
Laboratoire Géosciences de l’Environnement Toulouse (GET)
Observatoire Midi-Pyrénées
14, avenue Edouard Bélin
31400 Toulouse