CARDIOVASCULAR RISK IN HIGH ALTITUDE PEOPLE OF ...
246
CARDIOVASCULAR RISK IN HIGH ALTITUDE PEOPLE OF NEPAL Nirmal Aryal A thesis submitted for the degree of Doctor of Philosophy University of Otago, Wellington 2016
-
Upload
khangminh22 -
Category
Documents
-
view
0 -
download
0
Transcript of CARDIOVASCULAR RISK IN HIGH ALTITUDE PEOPLE OF ...
CARDIOVASCULAR RISK IN HIGH
ALTITUDE PEOPLE OF NEPAL
Nirmal Aryal
A thesis submitted for the degree of
Doctor of Philosophy
University of Otago, Wellington
2016
ii
Abstract
Background
Permanently living at high altitude (HA) directly affects the cardiovascular system because
of lower arterial blood oxygen content compared to sea-level and other associated
physiological changes. It is uncertain if there are clear-cut benefits or risks to
cardiovascular health from living at HA and whether these benefits or risks, if they exist,
vary in different populations. In Nepal, a comprehensive cardiovascular risk assessment of
a sample of individuals representing a HA population has not previously been performed.
The main aims of this project were to estimate, in residents at HA, the prevalence of
coronary heart disease (CHD) and cerebrovascular disease; to estimate the distribution of
key cardiovascular risk factors; and to estimate any possible relationships between CHD or
blood pressure with altitude.
Methods
The study design was a cross-sectional survey. The sampling technique was cluster
sampling of study areas on the basis of altitude level, population density and logistical
support to undertake the study, but the participants within the study areas were randomly
selected. The sample consisted of 521 residents aged 30 years or over from the Nepal
districts of Mustang and Humla, permanently living at altitudes of 2800 metre (m), 2890
m, 3270 m, or 3620 m. Data was collected by administering the WHO STEPS interview
questionnaire for non-communicable disease risk factors, a questionnaire for verifying
stroke-free status (QVSFS), bio-physical measurements (blood pressure, height, weight,
waist, hip), biochemical measurements (lipid profile and glycated haemoglobin), and a
resting 12 lead electrocardiogram (ECG). The prevalence of CHD was defined as the
presence of pathological Q waves in the ECG or self-report of personal history of CHD
(previous event of myocardial infarction (MI) or chest pain from heart disease (angina)).
ECG recordings were categorized as definitely abnormal (e.g. showing evidence of
previous MI, borderline (e.g. non-specific T-wave inversion) or normal after review by a
cardiologist using standard widely accepted criteria. Blood pressure (systolic/diastolic) was
iii
classified as normal (<120/80 mmHg), pre-hypertension (HT) (120–39/80–89 mmHg), HT
(≥140/90 mmHg), Stage I HT (140–159/90–99 mmHg), and Stage II HT (≥160/100
mmHg). Analysis of variance (ANOVA) and analysis of covariance (ANCOVA) models
were used for the relationship between systolic blood pressure (SBP), diastolic blood
pressure (DBP) and altitude. Logistic regression was used to estimate the association
between an abnormal (or borderline abnormal) ECG and altitude in univariate and
multivariate models.
Results
None of the participants showed definite electrocardiographic evidence of CHD. Overall,
5.6% of the participants gave a self-reported history of CHD. Altogether 19.6% of the
participants had an abnormal (or borderline abnormal) ECG. The main categories of
abnormality were right axis deviation (5.4%) and left ventricular hypertrophy by voltage
criteria (3.5%). Observed ECG abnormalities differed between ethnic populations:
suggestive of left sided cardiac abnormalities in the Mustang district with a majority
population of Tibetans; and right sided abnormalities in the Humla district with a majority
population of Khas-Arya. There was a moderate association between the probability of
abnormal (or borderline abnormal) ECG and altitude, adjusted for potential confounding
variables, with an odds ratio for a greater probability of an abnormal ECG (95% CI) of
2.83 (1.07 to 7.45), P=0.03 per 1000 m elevation of altitude.
A history of stroke or of symptoms of stroke (by positive self-report of at least one
criterion of the QVSFS) was identified in 6.7% of the participants.
A multivariate model adjusting for potential confounding variables showed that there was
moderate evidence of an association between SBP and altitude; mean SBP (95% CI)
increase by 11.3 mmHg (-0.1 to 22.7), P=0.05 for every 1000 m elevation.
The distribution and prevalence of key cardiovascular disease-related risk factors did not
differ by altitude level. Rather, they differed by ethnicity, residential settings (urban or
rural) and cultural practices. The prevalence of HT or being on treatment for HT was
higher in the Mustang district with dominant Tibetan-related populations (between 41%
and 54.5%) than in the Humla district, with dominant Khas-Arya (29.1%). Only 3.3% to
iv
10.3% participants in Mustang self-reported being current smokers, whereas this rate was
38.6% in Humla. The prevalence of current drinker was high at all altitude levels ranging
from 45.4% (3620 m) to 63.9% (3270 m). The prevalence of abnormal lipid components,
diabetes or being on treatment for diabetes, and overweight or obesity, were all higher in
urban (2800 m and 3620 m) compared to rural (3270 m and 2890 m) residential settings.
Conclusion
The HA populations sampled in this study had a lower prevalence of CHD and a higher
prevalence of stroke than that of relevant comparator low altitude populations. None of the
participants had ECG evidence of past CHD. Cardiovascular risk profiles of HA
populations may depend on altitude, ethnicity, cultural lifestyle practices, and residential
setting (urban or rural). Altitude per se could be an important additional risk factor because
of its association with SBP and abnormal (or borderline abnormal) ECG. Different
ancestry-related physiological responses to the low oxygen environment at HA may affect
cardiovascular health consistent with the evidence of different patterns of ECG
abnormality. The findings of the present study suggest that ethnicity and associated
lifestyle or cultural practices (such as salt and alcohol intake, smoking habit) and
residential settings (mainly differences in physical activity and fruit and vegetable
consumption in urban and rural participants), are also likely to be important determinants
of cardiovascular health for HA residents.
v
Dissemination of and development of work
performed for this thesis
Published peer-reviewed research papers
1. Aryal, N; Weatherall, M; Bhatta Y.K.D; Mann, S. (2016) Blood pressure and
hypertension in adults permanently living at high altitude: a systematic review and meta-
analysis. High Altitude Medicine and Biology, 17(3), pp. 185-193.
2. Aryal, N; Weatherall, M; Bhatta Y.K.D; Mann, S. Electrocardiography in people living
at high altitude in Nepal. Heart Asia, 9 (1), pp. 48-53
Conference presentations and published peer-reviewed abstracts
1. Are high altitude populations at high risk of heart disease ?A comparison of two high
altitude areas of Nepal (2016, 4-7 June). Poster presentation at World Congress of
Cardiology and Cardiovascular Health organized by World Heart Federation in Mexico
City, Mexico.
Aryal N, Weatherall M, Bhatta Y, Mann S. (2016) PS039 Are High Altitude Populations
at High Risk of Heart Disease? A Comparison of Two High Altitude Areas of Nepal.
Global Heart, 11(2):e22-e3.
2. Are high altitude populations at high risk of heart disease ?A comparison of two high
altitude areas of Nepal (2016, 2-5 March). Poster presentation at 11th
Asia Pacific Travel
Health Conference, Kathmandu, Nepal.
3. Are high altitude populations at high risk of heart disease ? A cross-sectional study in
Nepal (2015, 4-6 June). Poster presentation at annual scientific meeting of Cardiac Society
of Australia and New Zealand (CSANZ) in Auckland, New Zealand.
Aryal N, Weatherall M, Bhatt YKD, Mann S. (2015) Are high altitude populations at high
risk of heart disease? A cross-sectional study in Nepal. Heart, Lung and Circulation,
24:S109.
vi
Acknowledgements
I would like to ackowledge following people who have supported me in many ways during
my PhD study:
Associate Professor Stewart Mann, the primary supervisor, for his overall guidance,
suggestions and supervision. Without his expertise and support, this project could not have
been possible.
Professor Mark Weatherall, for his supervision and guidance on overall aspects of this
project. I am specially grateful for his support to advance my statistical knowledge and
helping me in data presentation, analysis and reporting.
Professor Yadav Kumar Deo Bhatta (Nepal), for his supervision and support
particularly during the data collection.
Academic and administrative staffs in Department of Medicine, University of Otago,
Wellington, for helping me in various ways.
Capital Cardiovascular Research Trust, New Zealand, for providing financial support
for my PhD study and field expenses.
Prakash Pant, Ashish Khadayat, Mamata Chand, Sofia Shrestha, Reena Thakali,
Lalita Sherchan, Guyala Rawat, who provided incredible support during my field work
in Nepal.
The participants, without whom this project could not be possible.
Jean McDowall, for providing professional proof-reading service.
My parents (Dharma Raj Aryal and Sabita Aryal), elder brother Prakash Aryal, and
sister-in-law Nirmala Neupane, for being a constant source of encouragement.
Finally, I would like to thank my wife Sharmila, for providing moral support and helping
me in numerous ways. My baby daughter Snigdha, who was borned during my PhD
period, and whose smiles kept me motivated. I am also grateful to my mother in law
Sabitri Kumari Neupane, who came to New Zealand from Nepal and stayed here for nine
months to take care of my daughter, which allowed me to keep focus on my PhD.
vii
Table of Contents
Abstract.................................................................................................................................ii
Dissemination of and development of work performed for this thesis.................................v
Acknowledgements...............................................................................................................vi
Table of Contents.................................................................................................................vii
List of Tables.........................................................................................................................xi
List of Figures.....................................................................................................................xiv
List of Abbreviations...........................................................................................................xvi
1 Introduction .................................................................................................................... 1
1.1 Background ............................................................................................................. 1
1.2 Acclimatization to high altitude .............................................................................. 4
1.3 Health and disease at high altitude ......................................................................... 8
1.3.1 High altitude illness ......................................................................................... 8
1.3.2 Other major diseases...................................................................................... 10
1.4 Cardiovascular disease mortality and morbidity at high altitude ......................... 12
1.5 Life expectancy at high altitude in Nepal ............................................................. 16
1.6 Statement of the problem ...................................................................................... 17
1.7 Significance of the study....................................................................................... 20
1.8 Aims and objectives .............................................................................................. 21
2 Literature Review ......................................................................................................... 22
2.1 Obesity at high altitude ......................................................................................... 22
2.2 Tobacco use at high altitude ................................................................................. 28
2.3 Alcohol intake at high altitude .............................................................................. 32
2.4 Dietary habits at high altitude ............................................................................... 36
2.5 Electrocardiographic abnormalities at high altitude ............................................. 39
2.6 Cardiovascular disease and risk factors in Nepal ................................................. 41
viii
3 Systematic Literature Review ...................................................................................... 48
3.1 Blood pressure and hypertension at high altitude ................................................. 48
3.2 Blood glucose levels and diabetes at high altitude ............................................... 66
3.3 Lipid profile at high altitude ................................................................................. 79
4 Methodology ................................................................................................................ 87
4.1 Geographical study area........................................................................................ 87
4.2 Study population ................................................................................................... 89
4.2.1 Inclusion and exclusion criteria ..................................................................... 89
4.3 Sample design ....................................................................................................... 90
4.3.1 Sample size calculation ................................................................................. 90
4.3.2 Sampling technique ....................................................................................... 90
4.4 Instruments............................................................................................................ 91
4.4.1 World Health Organization non-communicable disease risk factors STEPS
interview questionnaire ................................................................................................ 91
4.4.2 Questionnaire for Verifying Stroke-Free Status ............................................ 97
4.4.3 Electrocardiography recordings ..................................................................... 97
4.5 Data collection procedures.................................................................................... 98
4.5.1 Training and standardization of research personnel ...................................... 98
4.5.2 Data collection techniques ............................................................................. 99
4.6 Data processing and statistical methods ............................................................. 100
4.7 Ethical considerations ......................................................................................... 101
4.8 Candidate’s role in the study .............................................................................. 101
5 Results ........................................................................................................................ 102
5.1 Descriptive statistics ........................................................................................... 102
5.1.1 Socio-economic and demographic characteristics ....................................... 102
5.1.2 Lifestyle-related characteristics ................................................................... 107
5.1.3 Anthropometric measurements .................................................................... 111
5.1.4 Bio-chemical measurements ........................................................................ 112
5.1.5 Stroke and cardiovascular disease risk prediction ....................................... 116
5.2 Blood Pressure .................................................................................................... 119
5.2.1 Blood pressure and altitude ......................................................................... 128
ix
5.3 Electrocardiography recordings .......................................................................... 132
5.3.1 Electrocardiographic analysis ...................................................................... 132
5.3.2 Electrocardiographic abnormalities and altitude ......................................... 143
6 Discussion .................................................................................................................. 146
6.1 General limitations .............................................................................................. 146
6.2 Cardiovascular disease ........................................................................................ 149
6.2.1 Major electrocardiographic abnormalities and patterns .............................. 150
6.2.2 Predictors of an abnormal (or borderline abnormal) electrocardiogram ..... 151
6.2.3 Other important observations ...................................................................... 152
6.2.4 Cerebrovascular disease .............................................................................. 152
6.2.5 New findings ............................................................................................... 153
6.2.6 Strengths and weaknesses............................................................................ 153
6.2.7 Areas for future research ............................................................................. 154
6.3 Blood pressure .................................................................................................... 155
6.3.1 New findings ............................................................................................... 157
6.3.2 Strengths and weaknesses............................................................................ 157
6.3.3 Areas for future research ............................................................................. 158
6.4 Other cardiovascular disease risk factors............................................................ 159
6.4.1 Lipid Profile................................................................................................. 159
6.4.1.1 New findings ............................................................................................ 161
6.4.1.2 Strengths and weaknesses ........................................................................ 161
6.4.1.3 Areas for future research.......................................................................... 161
6.4.2 Diabetes ....................................................................................................... 163
6.4.2.1 New findings ............................................................................................ 165
6.4.2.2 Strengths and weaknesses ........................................................................ 165
6.4.2.3 Areas for future research.......................................................................... 165
6.4.3 Tobacco use ................................................................................................. 166
6.4.3.1 New findings ............................................................................................ 167
6.4.3.2 Strengths and weaknesses ........................................................................ 168
6.4.3.3 Areas for future research.......................................................................... 168
6.4.4 Risk prediction for major cardiovascular events ......................................... 169
x
6.5 Overall conclusion .............................................................................................. 170
7 References..............................................................................................................171
8 Appendices.............................................................................................................204
Appendix A: Modified World Health Organization non-communicable
disease risk factors STEPS questionnaire................................................205
Appendix B: Questionnaire for Verifying Stroke Free Status.................224
Appendix C: Participant Information Sheet.............................................225
Appendix D: Participant Consent Form...................................................227
xi
List of Tables
Table 1.1: Oxygen saturation levels, hemoglobin levels, and arterial oxygen contents of
major high altitude populations ...................................................................................... 6
Table 1.2: Comparisons of physiological characteristics of Tibetan, Andean, and Ethiopian
high altitude populations ................................................................................................ 7
Table 2.1: Prevalence of obesity and central obesity by altitude level ............................... 24
Table 3.1: Key features of included studies on blood pressure and hypertension at high
altitude .......................................................................................................................... 53
Table 3.2: Risk of bias of included studies on blood pressure and hypertension at high
altitude .......................................................................................................................... 56
Table 3.3: Risk of bias for selected studies on blood glucose levels and diabetes at high
altitude .......................................................................................................................... 70
Table 3.4: Key features of included studies on blood glucose levels and diabetes at high
altitude .......................................................................................................................... 71
Table 3.5: Key features of included studies on lipid profile at high altitude.......................83
Table 4.1: Household number and population in study areas ............................................. 89
Table 5.1: Sample size and age distribution of the participants ................................... .....102
Table 5.2: Educational status of the study participants at each altitude level ................... 104
Table 5.3: Occupation and household income of the study participants at each altitude
level ............................................................................................................................ 104
Table 5.4: Birthplace and duration of high altitude residence of study participants by
altitude level ............................................................................................................... 106
Table 5.5: Ethnicity of the study participants by altitude level ......................................... 106
Table 5.6: Smoking-related characteristics of the study participants by altitude level ..... 107
Table 5.7: Self-reported alcohol intake characteristics of the study participants at every
altitude level ............................................................................................................... 108
Table 5.8: Self-reported physical activity-related characteristics at each altitude level ... 109
Table 5.9: Self-reported fruit, vegetable and salt intake by altitude level ......................... 110
Table 5.10: Proportions of anthropometric variables at each altitude level ...................... 112
Table 5.11: Lipid profiles of the participants at each altitude level .................................. 113
xii
Table 5.12: Glycated hemoglobin and diabetes related characteristics at each altitude level
.................................................................................................................................... 115
Table 5.13: Stroke-related symptoms according to the questionnaire for verifying stroke
free status for every altitude level .............................................................................. 116
Table 5.14: Proportions of World Health Organization / International Society of
Hypertension (WHO/ISH)-10 year risk of a fatal or non-fatal major cardio-vascular
events (myocardial infarction and stroke) by altitude level ....................................... 117
Table 5.15: Systolic and diastolic blood pressure by the level of altitude ........................ 119
Table 5.16: Blood pressure and hypertension related characteristics by altitude level ..... 121
Table 5.17: The proportion of hypertension (or those on anti-hypertensive medication) by
socio-economic and demographic characteristics at each altitude level .................... 122
Table 5.18: Hypertension (or on anti-hypertensive medication) by ethnicity at each altitude
level ............................................................................................................................ 123
Table 5.19: Hypertension (or on anti-hypertensive medication) by self-reported tobacco
and alcohol-related characteristics and standard drink units of alcohol at each altitude
level ............................................................................................................................ 124
Table 5.20: Physical activity-related variables in hypertensive (or on anti-hypertensive
medication) participants by altitude level .................................................................. 125
Table 5.21: Self-reported fruit, vegetable and salt intake among hypertensive (or on anti-
hypertensive medication) participants by altitude level ............................................. 126
Table 5.22: Body mass index in hypertensive participants at each altitude level ............. 126
Table 5.23: Estimates of the difference in mean systolic and diastolic blood pressure by
altitude level in a univariate ANOVA model ............................................................. 128
Table 5.24: Estimates of the mean systolic blood pressure for altitude in a multivariate
ANCOVA and associations for confounding variables ............................................. 129
Table 5.25: Estimates of mean diastolic blood pressure for altitude in a multivariate
ANCOVA and associations for confounding variables ............................................. 130
Table 5.26: Key findings of electrocardiographic recordings ........................................... 133
Table 5.27: Abnormal or borderline abnormal electrocardiogram by altitude .................. 134
Table 5.28: The proportion of abnormal (or borderline abnormal) electrocardiogram by
socio-economic and demographic characteristics at each altitude level .................... 136
xiii
Table 5.29: The proportion of abnormal or borderline abnormal electrocardiogram by
ethnicity at each altitude level .................................................................................... 137
Table 5.30: Abnormal or borderline abnormal electrocardiogram by self-reported tobacco
and alcohol related characteristics at each altitude level ........................................... 138
Table 5.31: Self-reported physical activity related characteristics among participants with
abnormal (or borderline abnormal) electrocardiogram at each altitude level ............ 139
Table 5.32: Blood pressure, lipids and blood sugar-related characteristics in participants
with an abnormal (or borderline abnormal) and normal electrocardiogram by altitude
level ............................................................................................................................ 142
Table 5.33: Estimates of the odds ratio for an abnormal or borderline abnormal
electrocardiogram by altitude in a univariate logistic model ..................................... 143
Table 5.34: Estimates of the odds ratio for abnormal or borderline abnormal
electrocardiogram by altitude in a multivariate logistic model and associations for
confounding variables ................................................................................................ 144
xiv
List of Figures
Figure 1.1: Ambient oxygen levels, measured by the partial pressure of oxygen (solid line)
or as a percent of sea-level values (dashed line) decrease with increasing altitude. ...... 2
Figure 3.1: Flow diagram of identification and selection of the articles on blood pressure
and hypertension at high altitude ................................................................................. 50
Figure 3.2: The relationship between altitude and mean systolic blood pressure in Tibetan
(above) and non-Tibetan (below) participants in meta-regression analysis with 95%
confidence interval. ...................................................................................................... 61
Figure 3.3: Flow diagram for identification and selection of articles on blood glucose levels
and diabetes at high altitude ......................................................................................... 68
Figure 3.4: Meta-regression of logit event rate of diabetes on altitude for Tibetan origin
populations ................................................................................................................... 73
Figure 3.5: Meta-regression of logit event rate of diabetes on altitude for non-Tibetan
origin populations.................................................................................................................73
Figure 3.6: Flow diagram for identification and selection of articles on lipid profiles at
high altitude..........................................................................................................................80
Figure 4.1: Map of Mustang district indicating the study areas Jomsom and Muktinath ... 88
Figure 4.2: Map of Humla district indicating the study area Simikot ................................. 88
Figure 5.1: Sex distribution of the study participants at each altitude level.......................103
Figure 5.2: Marital status of the study participants by altitude level ................................ 105
Figure 5.3: Mean consumption of alcohol per day and the proportions of current drinker by
sex at each altitude level ............................................................................................ 109
Figure 5.4: Body mass index by sex at each altitude level ................................................ 112
Figure 5.5: Proportions of high total cholesterol to high-density lipoprotein-cholesterol
(TC/HDL) ratio by sex at each altitude level ............................................................. 114
Figure 5.6 : Boxplot of mean systolic and diastolic blood pressure values by altitude level
.................................................................................................................................... 120
Figure 5.7: The proportion of hypertensive (or on anti-hypertensive medication)
participants among those overweight or obese at each altitude level ........................ 127
xv
Figure 5.8: The line graph of abnormal or borderline abnormal electrocardiogram by
altitude level ............................................................................................................... 135
Figure 5.9: The proportions of abnormal or borderline abnormal electrocardiogram among
the participants with overweight or obesity and central obesity ................................ 140
Figure 5.10: Comparison of hypertension, high total cholesterol to high-density
lipoprotein-cholesterol (TC/HDL) ratio, and diabetes in participants with abnormal or
borderline abnormal electrocardiogram by altitude level...........................................140
xvi
List of Abbreviations
AMS Acute Mountain Sickness
ANCOVA Analysis of Covariance
ANOVA Analysis of Variance
ATP Adenosine Triphosphate
AV Atrioventricular
BMI Body Mass Index
BP Blood Pressure
CBS Central Bureau of Statistics
CHD Coronary Heart Disease
CMS Chronic Mountain Sickness
COPD Chronic Obstructive Pulmonary Disease
CVD Cardiovascular Disease
DBP Diastolic Blood Pressure
DM Diabetes Mellitus
ECG Electrocardiogram
ESH-IP2 European Society of Hypertension International Protocol
Revision 2010
FPG Fasting Plasma Glucose
HA High Altitude
HAPE High Altitude Pulmonary Edema
HAPH High Altitude Pulmonary Hypertension
HARS High Altitude Renal Syndrome
HbA1c Glycated Hemoglobin
HDI Human Development Index
HDL High-Density Lipoprotein-Cholesterol
HIF-1 Hypoxia Inducible Factor-1
HT Hypertension
IDF International Diabetes Federation
xvii
IFG Impaired Fasting Glucose
IHD Ischemic Heart Disease
ISH International Society of Hypertension
LA Low Altitude
LAD Left Axis Deviation
LBBB Left Bundle Branch Block
LDL Low-Density Lipoprotein-Cholesterol
LVH Left Ventricular Hypertrophy
MI Myocardial Infarction
MOOSE Meta-analysis of Observational Studies in Epidemiology
NCD Non-Communicable Disease
NHRC Nepal Health Research Council
NRS Nepalese Rupees
QVSFS Questionnaire for Verifying Stroke Free Status
RA Research Assistant
RAD Right Axis Deviation
RBBB Right Bundle Branch Block
RHD Rheumatic Heart Disease
RMSE Root Mean Square of Error
RVH Right Ventricular Hypertrophy
SBP Systolic Blood Pressure
SDU Standard Drink Unit
SEAR D South East Asia Sub-Region D
SI Student Investigator
SOP Safe Operational Procedure
TC Total Cholesterol
TG Triglyceride
TIA Transient Ischemic Attack
USA United States of America
xviii
UTI Urinary Tract Infection
UVB Ultraviolet B
VLDL Very Low-Density Lipoprotein-Cholesterol
WC Waist Circumference
WHO World Health Organization
WHR Waist to Hip Ratio
WHtR Waist to Height Ratio
1
1 Introduction
This chapter is divided into eight sections:
1.1 Background on populations of the world living at high altitude (HA) and their environmental
challenges.
1.2 Human physiological responses to low atmospheric pressure.
1.3 Health and diseases prevalent at HA.
1.4 A brief overview of cardiovascular disease (CVD) trends, mortality and morbidity at HA.
1.5 Life expectancy, CVD and risk factors for CVD in HA areas of Nepal.
1.6 A statement of the problem.
1.7 The significance of the study.
1.8 The aims and objectives of the study.
1.1 Background
The term 'high altitude' (HA) is not uniformly defined in the scientific literature. However, an
altitude of 2500 metre (m) or above is the conventional demarcation for HA (Pawson & Jest,
1978) because people generally start to experience adverse symptoms such as shortness of breath
and increased heart rate, nausea, dizziness, satiety and fatigue above this altitude (Lossio, 2006).
Using this definition of HA, more than 140 million people in the world permanently live at HA,
comprising 2% of the global population (Moore, Niermeyer, & Zamudio, 1998). Established
human populations living in the Ethiopian summits of Africa, the Himalayan mountains of Asia,
and the Andean mountains of South America have a long history of HA residency: 70,000 years,
25,000 years, and 11,000 years respectively (Beall, 2007). The largest populations at HA are 80
million in the Himalayan mountains of Asia and 35 million in the Andean mountains of South
America (Moore et al., 1998). The capitals of three of the four main Andean countries are
located at HA: La Paz (Bolivia), Bogota (Columbia), and Quito (Ecuador). Between 2% and
2
45% of the populations of Asian Countries – China, India, Nepal, Kyrgyzstan, Afghanistan and
Bhutan – live at HA. An estimated 80 million people live in four high plateaus of China alone:
Qinghai (Tibet), Inner Mongolia, Yun-Gui and the Yellow land plateau (Niermeyer, Zamudio, &
Moore, 2001).
La Rinconada, a mining village in Peru, at an altitude of 5100 m is the highest permanent
settlement in the world, and has a population of around 7000. The Ma Gu area (altitude 5067 m)
of Tibet, with a population around 800, and Dingboche area (4400 m) of Nepal, with a
population of 200, are also other permanent human settlements at the extreme end of the range of
HA residency (West, 2002).
Living at HA is associated with consequences of the geography, such as access problems due to
mountainous and rugged terrain. However, it is also associated with other challenges to human
life such as decreased partial pressure of oxygen, cold temperatures, and increased exposure to
ultraviolet radiation. The most important physiological factor affecting the health and well-being
of HA residents is likely the reduced partial pressure of oxygen.
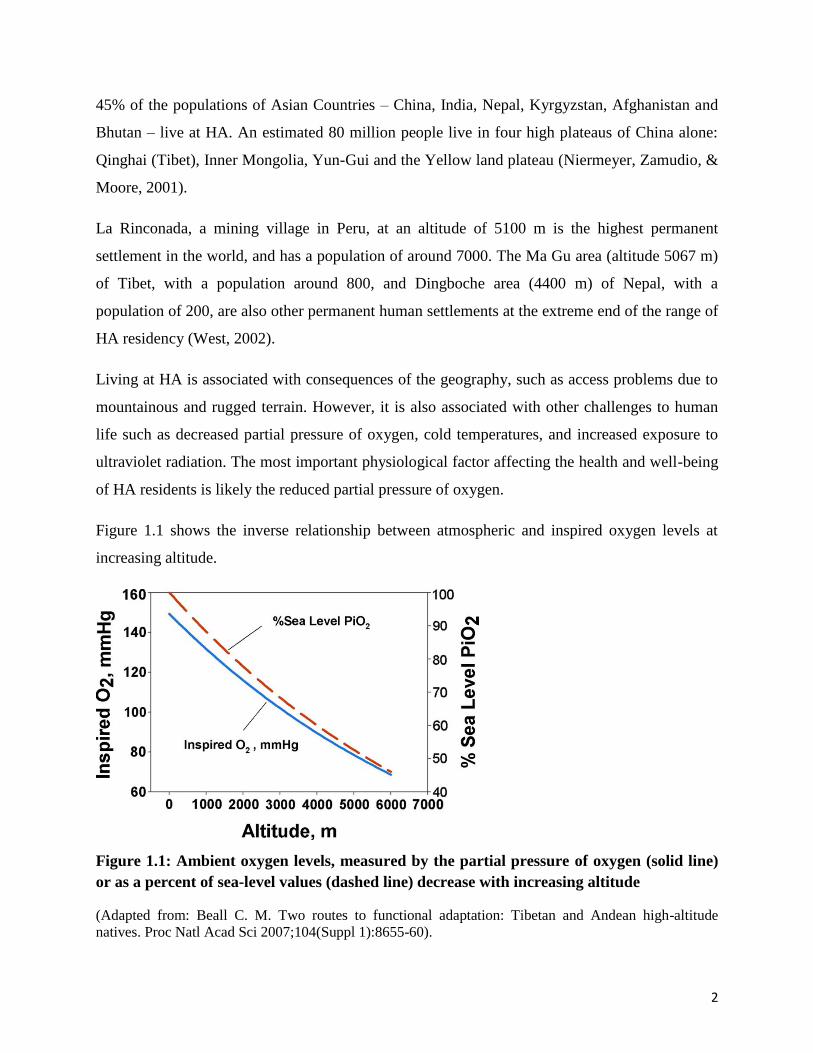
Figure 1.1 shows the inverse relationship between atmospheric and inspired oxygen levels at
increasing altitude.
Figure 1.1: Ambient oxygen levels, measured by the partial pressure of oxygen (solid line)
or as a percent of sea-level values (dashed line) decrease with increasing altitude
(Adapted from: Beall C. M. Two routes to functional adaptation: Tibetan and Andean high-altitude
natives. Proc Natl Acad Sci 2007;104(Suppl 1):8655-60).
3
Those born and habitually living at HA tend to adopt particular lifestyle characteristics. Most HA
populations are involved in agricultural work and their living conditions are poor. They have
very few options for nutrition because only a limited range of crops and vegetables can be
produced in such extreme climatic conditions. Potatoes and highland barleys are perhaps the
most commonly cultivated crops at HA. Fruits and green vegetables are difficult to grow at HA,
particularly in the Himalayan regions of Asia. Most HA natives herd sheep, goats and yaks for
meat, butter and cheese; use animal products such as wool and manure; and also use the animals
as a means of transportation. Interestingly, in Tibet butter production was so universal that it was
used to pay taxes and as an acceptable form of wages for daily labour (Stevens, 1996).
HA residents are usually physically active because of the physical demands of both arable and
pastoral farming, although during the extremely cold winters people mostly stay inside their
houses and outdoor activities virtually cease. Butter-laden salty tea and alcohol intake are central
facets of lifestyle in HA residents of Tibetan cultural regions. The traditional diet of Tibetans
consequently includes high levels of salt, at a minimum of 20 to 30 grams (g) per day (Sehgal,
Krishan, Malhotra, & Gupta, 1968; Sun, 1986). This is five times more than the World Health
Organization (WHO) recommendation for regular dietary intake. Traditional food consumption
also comprises large quantities of meat and a high level of consumption of alcohol (Luobu, 2012;
X. Zhao et al., 2012). In Andean HA areas, chewing coca (the raw material from which cocaine
is produced) is popular among natives as they believe it is beneficial in combating the harsh
climatic conditions (Hanna, 1974). These practices are strongly culturally embedded in social
rituals, such as weddings, funerals and feasts.
Despite hostile environmental conditions and a reduced capacity for physical performance, HA
native populations with the longest history of ancestry and residency have successfully adapted
to their living situation. The extended time over which some populations have resided at HA
means that natural selection may have led to beneficial genetic variants for optimal function
under hypoxic conditions. A recent study reported that Tibetans, Andeans, and Ethiopian
highlanders exhibit different adaptations to the hypoxic hypobaric situation, mediated in turn by
different genes (Huerta-Sánchez et al., 2013). Consequently, different phenotypic responses of
these populations to hypoxia have been observed. Andeans respond to HA primarily through
hematological adaptations and Tibetans through respiratory changes. Both changes lead to the
4
same outcome of improved tissue oxygen delivery (Beall, 2007). These differences may
contribute to varying benefits and risks related to the cardio-pulmonary health of HA
populations.
Most HA areas are rural and remote with very limited health care services and facilities. This
contributes to late diagnosis or non-diagnosis of existing medical conditions, poorer outcomes of
health conditions that are diagnosed, and limited accurate documentation of disease states and
causes of death.
1.2 Acclimatization to high altitude
Acclimatization to HA is defined as the physiological adaptation of the body to a hypoxic
hypobaric environment. Over generations, acclimatization may lead to 'adaptation', which
involves genetic modifications (Lossio, 2006).
A growing consensus among relevant scientists is that full acclimatization cannot be achieved
because it is impossible to achieve full physiological compensation for the physical and mental
impairments triggered by chronic hypoxia (Jourdanet, 1875). A prominent HA physiologist
states: "it is a serious misconception on acclimatization that it will reverse all ill health effects of
HA" (West, 2003b). Acclimatization significantly improves arterial hypoxemia, but despite this
arterial oxygen levels remain far below those achieved at sea level (West, 2003a). This contrasts
with the belief of some earlier scientists that a path to full acclimatization would be through
changes in blood over generations of exposure to hypoxia (Bert, 1878).
The distressing symptoms experienced by those living at or travelling to HA have been known
for centuries. An example of a historical record is a report from the Himalayas of China by a
Chinese official from between 37B.C. and 32B.C. (Gilbert, 1983b). There are reports of serious
difficulties experienced by travellers over the western edge of the Himalayan Karakoram Range
and in the Pamir Range during that period (Gilbert, 1983b). In the Andes, HA symptoms were
first documented by Father Jose De Acosta in 1590 when he experienced nausea, headache, and
heart and stomach pains while crossing the Andean Cordillera. He strongly suggested it might
have been due to the thin air (Gilbert, 1983a). In 1878, a French physiologist, Paul Bert,
scientifically demonstrated that distressing effects were indeed mainly attributable to the rarefied
air (Rudolph, 1992), later confirmed by many other investigations.
5
It is not only reduced levels of inspired oxygen at HA that can induce health problems. Reports
have documented that HA natives temporarily suffer health problems when descending to low
altitude (LA) because of the 'excessive oxygen' (Lossio, 2006). Pulmonary edema is also found
in HA residents when they return from LA back to their usual HA residence. This is termed 're-
ascent high altitude pulmonary edema' (Moore et al., 1998). Thus, the process of acclimatization
seems to apply to both environmental hypoxia and hyperoxia.
The main features of physiological adaptations to HA are hyperventilation, erythrocytosis and
pulmonary vasoconstriction. The degree of these varies in different HA populations.
Hyperventilation is the most commonly observed feature. Increased breathing rates and volumes
of ordinary ventilation act to increase alveolar ventilation (Moore et al., 1998). Tibetans who live
at HA have a two-fold higher hypoxic ventilatory response compared to Andeans who live at HA
(Beall, Strohl, et al., 1997). When compared to HA permanent residents, sojourners from LA
generally show a greater degree of hyperventilation (Stuber & Scherrer, 2010).
Many HA populations produce a more erythrocytes; consequently hemoglobin concentration
rises and both these act to offset oxygen deficiency by increasing the amount of oxygen carried
by the blood. This phenomenon is particularly pronounced in Andean HA populations. Tibetan
natives, on the other hand, compensate for their lower arterial oxygen by relatively a high flow
rate of oxygen carrying blood to tissue and greater diffusion of oxygen from the blood stream
into cells (Beall, 2007). Sherpa populations of Nepal, well-known HA dwellers of Tibetan
ancestry, have a serum erythropoietin level at 3440 m similar to that in non-Sherpa at 1300 m
(Hanaoka et al., 2012). An increased level of hemoglobin is not usually seen in populations
living at an altitude of 1600 m or below when compared with those at sea level (Sullivan, Mei,
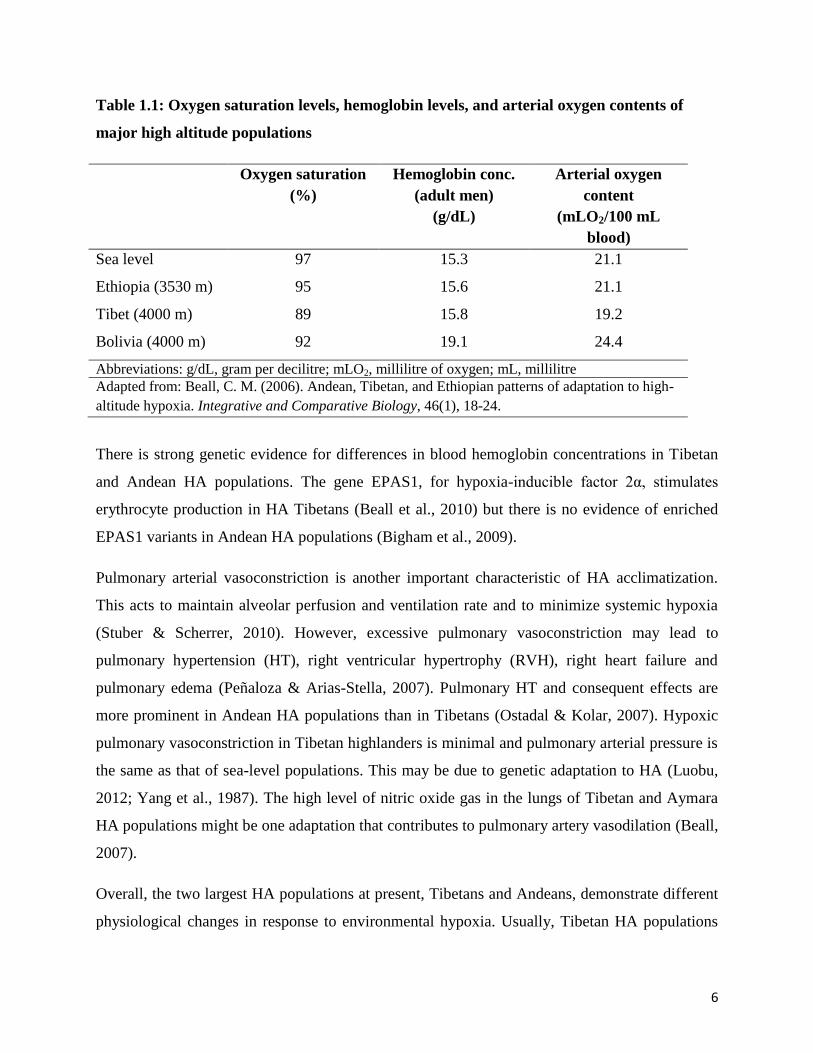
Grummer‐Strawn, & Parvanta, 2008). Table 1.1 shows the oxygen saturated levels, hemoglobin
levels, and arterial oxygen contents of major HA populations.
6
Table 1.1: Oxygen saturation levels, hemoglobin levels, and arterial oxygen contents of
major high altitude populations
Oxygen saturation
(%)
Hemoglobin conc.
(adult men)
(g/dL)
Arterial oxygen
content
(mLO2/100 mL
blood)
Sea level 97 15.3 21.1
Ethiopia (3530 m) 95 15.6 21.1
Tibet (4000 m) 89 15.8 19.2
Bolivia (4000 m) 92 19.1 24.4
Abbreviations: g/dL, gram per decilitre; mLO2, millilitre of oxygen; mL, millilitre
Adapted from: Beall, C. M. (2006). Andean, Tibetan, and Ethiopian patterns of adaptation to high-
altitude hypoxia. Integrative and Comparative Biology, 46(1), 18-24.
There is strong genetic evidence for differences in blood hemoglobin concentrations in Tibetan
and Andean HA populations. The gene EPAS1, for hypoxia-inducible factor 2α, stimulates
erythrocyte production in HA Tibetans (Beall et al., 2010) but there is no evidence of enriched
EPAS1 variants in Andean HA populations (Bigham et al., 2009).
Pulmonary arterial vasoconstriction is another important characteristic of HA acclimatization.
This acts to maintain alveolar perfusion and ventilation rate and to minimize systemic hypoxia
(Stuber & Scherrer, 2010). However, excessive pulmonary vasoconstriction may lead to
pulmonary hypertension (HT), right ventricular hypertrophy (RVH), right heart failure and
pulmonary edema (Peñaloza & Arias-Stella, 2007). Pulmonary HT and consequent effects are
more prominent in Andean HA populations than in Tibetans (Ostadal & Kolar, 2007). Hypoxic
pulmonary vasoconstriction in Tibetan highlanders is minimal and pulmonary arterial pressure is
the same as that of sea-level populations. This may be due to genetic adaptation to HA (Luobu,
2012; Yang et al., 1987). The high level of nitric oxide gas in the lungs of Tibetan and Aymara
HA populations might be one adaptation that contributes to pulmonary artery vasodilation (Beall,
2007).
Overall, the two largest HA populations at present, Tibetans and Andeans, demonstrate different
physiological changes in response to environmental hypoxia. Usually, Tibetan HA populations
7
have better levels of hypoxic ventilation response, blood oxygen saturation, lung function,
maximum cardiac output and sleep quality, and lower levels of pulmonary vasoconstriction and
hemoglobin concentration when compared with Andean HA dwellers (West, 2011; Wu &
Kayser, 2006). Tibetans show two major features that could have advanced their degree of
adaptation further than Andeans; firstly, they have the longest generational history at HA, and
secondly they have least a degree of genetic admixture. Andeans have substantial genetic
admixture with South American Indian and European genes (Moore et al., 1998). The genetic
basis of HA adaptation of Tibetan natives is relatively well understood (Wu & Kayser, 2006).
There is little information on physiological responses of HA Ethiopians; however, available
evidence indicates low levels of blood hemoglobin and pulmonary artery pressure, as in
Tibetans, and higher levels of hemoglobin oxygen saturation and arterial oxygen content than in
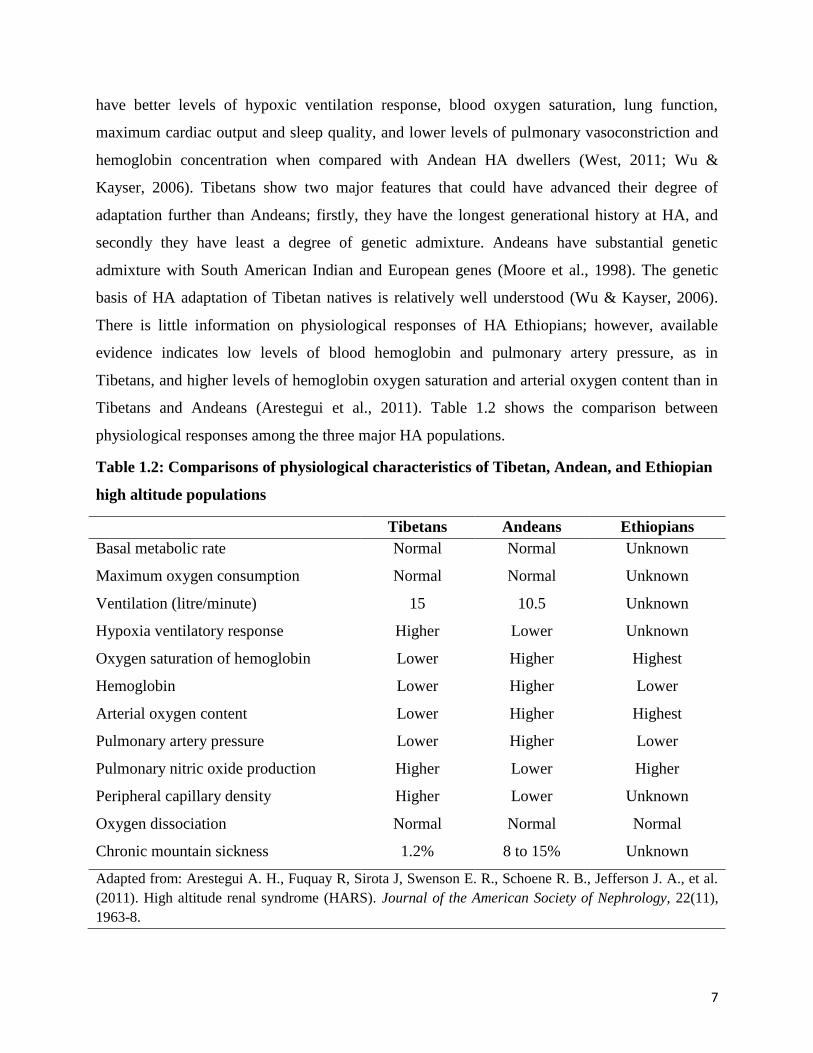
Tibetans and Andeans (Arestegui et al., 2011). Table 1.2 shows the comparison between
physiological responses among the three major HA populations.
Table 1.2: Comparisons of physiological characteristics of Tibetan, Andean, and Ethiopian
high altitude populations
Tibetans Andeans Ethiopians
Basal metabolic rate Normal Normal Unknown
Maximum oxygen consumption Normal Normal Unknown
Ventilation (litre/minute) 15 10.5 Unknown
Hypoxia ventilatory response Higher Lower Unknown
Oxygen saturation of hemoglobin Lower Higher Highest
Hemoglobin Lower Higher Lower
Arterial oxygen content Lower Higher Highest
Pulmonary artery pressure Lower Higher Lower
Pulmonary nitric oxide production Higher Lower Higher
Peripheral capillary density Higher Lower Unknown
Oxygen dissociation Normal Normal Normal
Chronic mountain sickness 1.2% 8 to 15% Unknown
Adapted from: Arestegui A. H., Fuquay R, Sirota J, Swenson E. R., Schoene R. B., Jefferson J. A., et al.
(2011). High altitude renal syndrome (HARS). Journal of the American Society of Nephrology, 22(11),
1963-8.
8
1.3 Health and disease at high altitude
High levels of physical activity and some other features of a traditional lifestyle, as well as
physiological adaptation to the hypoxemic hypoxia of HA, might be expected to be associated
with better health for those living at HA. However, available data on mortality or life expectancy
of HA populations is poor and inconsistent. A recent systematic analysis of the provincial level
burden of disease in China estimated that in 2013, of all 33 provinces of China, Tibet province
(mean altitude 4500 m above sea level) had the lowest life expectancy at birth (68.4 years) (Zhou
et al., 2016). A similar finding of high mortality rate at HA for the period 1996 to 2000 was
reported from the Andean region of Peru, which accounted for half of all mortality despite
having only 32% of the total Peruvian population (Huicho, Trelles, Gonzales, Mendoza, &
Miranda, 2009). The mortality rate in Bolivian highlanders is also higher than in other areas of
Bolivia, increasing for every 1500 m elevation (Virues-Ortega et al., 2009). In contrast, the
mortality rate is reported to be lower in mountainous region of Greece (950 m) than at sea level
during the follow-up period of 15 years between 1981 and 1996 (Baibas, Trichopoulou, Voridis,
& Trichopoulos, 2005). In the United States of America (USA), living at HA (equal to or greater
than 1500 m) has no effect on net life expectancy (Ezzati et al., 2012). It may be that, as in other
populations, lifestyle, genetic and environmental factors play an important role in health or
disease at HA, rather than HA itself. This section will briefly discuss common health problems at
HA.
1.3.1 High altitude illness
Chronic mountain sickness (CMS) and high altitude pulmonary hypertension (HAPH) are, by
definition, seen in people in the HA environment, whether resident or visiting. Low birth weight
in newborn children is observed in most HA populations. This sub-section will briefly discuss
CMS, HAPH and low birth weight at HA.
CMS (sometimes known as ‘Monge's disease’) is typically diagnosed in long-term HA residents.
This disease is clinically characterized by a greater concentration of erythrocytes (blood
hemoglobin: ≥21 g/dL (decilitre) for men and ≥19 g/dL for women) and clinical symptoms
include dizziness, headache, insomnia, loss of appetite, breathlessness and/or palpitations,
cyanosis, and mental and cognitive impairment (León-Velarde et al., 2005). Usually the
prevalence of CMS is higher in men, smokers, older adults, and at higher levels of altitude
9
(León-Velarde, Villafuerte, & Richalet, 2010). Andean HA populations are particularly affected
with CMS (8% to 15%) while Tibetans have a far lower prevalence (around 1.2%), and it has not
been reported among Ethiopian highlanders (Beall, 2007; Beall et al., 2002).
HAPH is often termed a CMS of a vascular type. Chronic or short-term hypoxia may induce an
increased amount of smooth muscle cells in distal pulmonary arteries and arterioles, resulting in
increased pulmonary vascular resistance, pulmonary vasoconstriction and consequent pulmonary
HT (Ostadal & Kolar, 2007). Furthermore, these adaptations may lead to high altitude pulmonary
edema (HAPE) and consequent fatal events (Lankford & Swenson, 2014). HAPH is generally
considered to be present when mean pulmonary artery pressure exceeds 30 mmHg or systolic
pulmonary artery pressure is >50 mmHg (measured at the residential altitude). Clinical signs are
those of right heart failure such as dyspnoea, sleep disturbance or cyanosis (León-Velarde et al.,
2005). A large body of evidence shows increased levels of HAPH among HA Andeans but it is
uncommon in Tibetan HA dwellers (Stuber & Scherrer, 2010).
Low birth weight is another well-established effect of hypoxia at HA populations. From past
studies conducted over 40 years, estimates are that birth weight declines by mean of 100 g for
every 1000 m elevation of altitude (Moore et al., 1998). This is attributed to intra-uterine growth
retardation due to oxygen deficiency in the fetal placenta (Moore, Charles, & Julian, 2011) rather
than other risk factors like maternal age, prenatal care, or nutrition (Jensen & Moore, 1997). All
HA populations have reduced birth weight compared to LA populations. However, this
association is less prominent in populations with the longest ancestry at HA. For example, the
association is least in Tibetans, intermediate in Andean HA populations, but most pronounced in
populations with the shortest history of residence at HA, such as dwellers of the Rocky
Mountains North America, Ladakh-India, and Han-China (Moore, Armaza, Villena, & Vargas,
2002).
Higher levels of neonatal, infant and maternal mortality are also reported in some HA
populations, particularly in Peru and Bolivia (Gonzales, Tapia, & Carrillo, 2008; Pan American
Health Organization, 1994). A large study of 22,662 residents of Peru reported five times higher
odds for stillbirth rates at altitude of greater than 3000 m when compared to those at 150 m
(Gonzales et al., 2008). However, there is some inconsistency in this association (Miller et al.,
10
2007). Low birth weight at HA could also be due to other factors such as limited medical care,
infectious diseases, and lack of good maternal education.
Several studies report growth retardation in HA children. Growth stunting was reported to persist
in HA children in Peru between 1964 and 1999 (Pawson & Huicho, 2010), and in children of
Tibetan origin in Nepal (Pawson, 1977). Although intra-uterine growth retardation and
suboptimal nutrition in remote areas at HA may be relevant, increasing altitude is detrimental to
the growth of children even after accounting for related socio-economic factors (Dang, Yan, &
Yamamoto, 2008).
Taken together, these trends in HA-related diseases and morbidities generally show that HA
residents with more favourable patterns of adaptation have fewer consequences from
environmental hypoxia (Beall, 2007; Beall et al., 2002).
1.3.2 Other major diseases
Other important diseases related to HA-triggered body tissue hypoxemia and the HA
environment are chronic obstructive pulmonary disease (COPD), cancer, and renal-related
abnormalities.
The reported increased prevalence of COPD in hypoxic environmental conditions of HA is not
uniform across HA populations. The association between altitude and the prevalence of COPD
was positive in Colombia (Caballero et al., 2008) but negative in Latin American cities (Menezes
et al., 2005) and in Mexico (Laniado-Laborin, Rendón, & Bauerle, 2011). The vast majority of
the prevalence studies of COPD at HA are based on studies from South America. There is some
evidence of a positive association between COPD mortality and altitude (Cote, Stroup, Dwyer,
Horan, & Peterson, 1993; Ezzati et al., 2012). The tendency to use biomass fuel for household
energy among HA dwellers may precipitate COPD (Norboo, Yahya, Bruce, Heady, & Ball,
1991; Pearce, Aguilar-Villalobos, Rathbun, & Naeher, 2009). CMS may also contribute to
chronic respiratory illness because of decreased alveolar ventilation (León-Velarde et al., 2010).
The majority of epidemiological studies report lower cancer mortality and prevalence at HA.
Higher levels of vitamin D produced by higher ultraviolet radiation at HA is proposed to be one
mechanism providing protection from cancer (Hayes, 2010). This is biologically plausible
11
because vitamin D could prevent cancer by inhibiting cell growth and increasing cell
differentiation (van den Bemd, Pols, & van Leeuwen, 2000). Other adaptations, possibly related
to increased levels of blood hemoglobin at HA, may intensify the progression of specific
malignant tumours, including breast cancer (Bennett et al., 2008). However, large studies with
samples from the USA (Youk, Buchanich, Fryzek, Cunningham, & Marsh, 2012) and another
multi-national study (Burton, 1975) reported no particular association between cancer mortality
and HA. The occurrence of some cancer types are reported to be higher in some HA populations.
For example, the incidence and mortality from gastric cancer is associated with residence in HA
areas of Central and Andean South America (Torres et al., 2013), and the prevalence of
melanoma is also reported to be higher in mountainous regions of Spain (Aceituno-Madera,
Buendía-Eisman, Olmo, Jiménez-Moleón, & Serrano-Ortega, 2011). There is no published
evidence about cancer for the Himalayan region.
In summary, the existing evidence suggests that HA populations are not generally at greater risk
from cancer-related morbidity and mortality (Burtscher, 2014; Hayes, 2010), but rather than
providing direct protection, HA could be a surrogate marker for host genetic, bacterial, dietary,
and environmental factors that may increase the risk of some forms of cancer (Torres et al.,
2013).
A new clinical syndrome, high altitude renal syndrome (HARS), has been proposed as an entity
consequent on the combined effects of HA induced polycythemia, systemic HT, hyperuricemia
and microalbuminuria on kidney function (Arestegui et al., 2011). A marked increase in
hematocrit level and hypoxemia at HA seems to mediate adverse renal function through
mechanisms such as decreased renal plasma flow and consequent lower glomerular filtration rate
(Lozano & Monge, 1965), increased production of uric acid (Schoutsen, De Jong, Harmsen, De
Tombe, & Achterberg, 1983) and decreased urate clearance (Johnson et al., 2003). These
findings are supported by a large Tibetan study, which found a greater prevalence of
hyperuricemia, microalbuminuria, and proteinuria among HA residents compared to LA
residents of Tibet (W. Chen et al., 2011). Glomerular hypertrophy was also seen in HA children
(Naeye, 1965), which is likely to be related to the low birth weight at HA (Brenner, Garcia, &
Anderson, 1988).
12
1.4 Cardiovascular disease mortality and morbidity at high altitude
Hypobaric hypoxia at HA directly affects the cardiovascular system because of the decline in
arterial blood oxygen content and other physiological changes. A possible pathophysiological
link between CVD and HA has always intrigued researchers, although studies over more than
five decades have not resulted in any clear-cut resolution of benefits or risks to CVD health from
living at HA (Ostadal & Kolar, 2007).
Although the current pool of evidence is inconsistent as to the association between coronary
heart disease (CHD) mortality and morbidity rates at HA, a majority of studies report an
association between stroke and congenital heart disease at HA when compared to LA
populations. The relationship between CVD and HA was first reported in the 1960s when
Hurtado showed that residents living at an altitude of 4540 m in Peru had lower rates of
myocardial infarction (MI) and coronary thrombosis compared to those at sea level. Remarkably,
this report only recorded one case of MI at HA over a period of 30 years (Alberto Hurtado,
1960). Subsequently, an analysis of 300 autopsies carried out on deceased who had lived at 4375
m in Peru also did not find any case of MI or significant CHD (Ramos, Krüger, Muro, & Arias-
Stella, 1967). These Peruvian observations are consistent with a study at 4100 m in Milpo, which
reported a significantly lower prevalence of HT, angina and electrocardiogram (ECG)
abnormalities than at sea level (Ruiz, Figueroa, Horna, & Peñaloza, 1969). These earlier studies
have not provided information on the role of possible confounding factors that might also lead to
lower apparent rates of CHD.
Studies on some other HA populations also report lower CVD mortality and morbidity rates
compared to LA. A retrospective analysis of mortality data in counties of the USA suggest that
living at HA might have a protective effect on ischemic heart disease (IHD) (Ezzati et al., 2012).
However, the vast majority of this study’s data came from low to intermediate altitudes of lower
than 2500 m. Similarly, a hospital-based retrospective study in Saudi Arabia also suggested a
lower incidence and mortality of acute MI in HA regions compared to the rest of the country
(Ashouri et al., 1993).
The main proposed biologically plausible explanation for cardio-protection at HA is activation of
a transcriptor modulator, hypoxia inducible factor (HIF-1), which induces the expression of
13
multiple genes with cardioprotective properties (Semenza, 2006). Proposed mechanisms include
stimulating nitric oxide synthesis (Ding et al., 2005), boosting erythropoietin (Cai et al., 2003),
angiogenesis (Sasaki et al., 2002), increasing the efficiency of mitochondrial energy production
(Essop, 2007), and other anti-oxidant functions (Abdias Hurtado, Escudero, Pando, Sharma, &
Johnson, 2012). High levels of vitamin D due to an exponential increase in ultraviolet B (UVB)
light at HA (J. D. Anderson & Honigman, 2011), improvement in coronary vasculature through
increased number of branches and peripheral vessels (Arias‐Stelalnad & Topilsky, 1971),
increased levels of physical fitness and a low level of air pollution (Burtscher, 2014) have also
been suggested as cardio-protective factors. A 'healthy individuals effect' is an alternative
explanation for these findings from non-experimental studies of illness at HA because sick
people often migrate away from HA to LA (Regensteiner & Moore, 1985).
A number of studies also report higher CVD mortality and morbidity rates at HA. CVD related
complications in Bolivia were more frequent in grandparents living at high (equal to or greater
than 3000 m) and moderate (1500 m to 2999 m) altitude compared to LA counterparts (Virues-
Ortega et al., 2009). In a Yemeni study on acute coronary syndrome patients, HA (1500 m to
3500 m) patients were more likely to have a history of IHD, younger age, hyperlipidemia and
higher smoking rates (Al-Huthi, Raja'a, Al-Noami, & Rahman, 2006). A positive correlation
between CHD morbidity and altitude was also found in an epidemiological study of CHD in
provinces in China (D. Zhao, 1993). Higher hematocrit levels at HA were attributed for these
adverse outcomes in some HA populations (Al-Huthi et al., 2006; Al Tahan et al., 1998). A 34-
year follow up in the Framingham study demonstrated that a higher hematocrit level was
significantly associated with the incidence of CHD, MI, and stroke (Gagnon, Zhang, Brand, &
Kannel, 1994). Furthermore, a high prevalence of certain risk factors (for example, HT in
Tibetan HA dwellers (Mingji, Onakpoya, Perera, Ward, & Heneghan, 2015)) may contribute to
the adverse CVD related outcomes.
A preponderance of evidence suggests a greater risk of stroke and related morbidities in HA
populations. A Pakistani hospital-based study showed that the relative risk of stroke among
populations living at 4572 m was 10 times greater than for those living at 610 m (Niaz &
Nayyar, 2003). The age-adjusted incidence of stroke in Tibet was one of the highest in China at
450.4 per 100,000 population (G. Xu, Ma, Liu, & Hankey, 2013). Another study in the Tibetan
14
state of Ganzi using a representative sample of 7038 individuals reported the stroke morbidity
rate was high at 1923 per 100,000 population (H.-T. Zhang, Gao, Ye, Pang, & Long, 2015). A
very recent study estimated that age-standardized death rates from cerebrovascular diseases were
highest among Tibetan women and second-highest in Tibetan men when compared with the
populations of the other 32 provinces of China (Zhou et al., 2016). The rate of stroke was also
observed to be high among those working at HA. A study in an army population deployed at an
altitude of higher than 3000 m, with mean length of stay 10.2 months, reported 12.8 cases of
stroke per 1000 hospital admissions as opposed to just 1.05 per 1000 hospital admissions in
soldiers living at lower than 3000 m (S. K. Jha, Anand, Sharma, Kumar, & Adya, 2002). None of
these studies reported lower mortality and morbidity rates of stroke at HA. One study at an
altitude of greater than 3400 m in Peru reported stroke prevalence rates comparable to the world
population (Jaillard, Hommel, & Mazetti, 1995).
Both lifestyle and physiological changes due to hypoxia may contribute to a higher risk of stroke
at HA. Lifestyle factors such as diet and consequent HT and hyperlipidemia were suggested as
causal for higher stroke rates in Tibet (G. Xu et al., 2013; H.-T. Zhang et al., 2015), whereas
increased levels of polycythemia were implicated for other HA populations (Al Tahan et al.,
1998; S. K. Jha et al., 2002). A Saudi Arabian study reported that of all stroke cases thrombotic
stroke was 93.4% at an altitude of higher than 2000 m as opposed to 79.3% at an altitude lower
than 2000 m (Al Tahan et al., 1998). HA polycythemia may increase blood viscosity and
accelerate thrombosis (Fujimaki, Matsutani, Asai, Kohno, & Koike, 1986). Other factors such as
dehydration caused by hyperventilation, cold temperature and lack of thirst (Basnyat et al.,
2001); hypercoagulability due to marked increment in plasma fibrinogen levels (Singh &
Chohan, 1973); and platelet adhesiveness (S. C. Sharma, Vijayan, Suri, & Seth, 1977) may raise
the risk of thrombosis and resultant thrombotic stroke at HA. A systematic review suggests that
HA populations of the Himalayas have a higher cerebral blood flow than both Andean
populations and sea-level residents, but Andean populations have a lower cerebral blood flow
values compared to sea-level populations (Jansen & Basnyat, 2011). Therefore, it is likely that
Andeans and other populations who are less adapted to HA may have an increased risk of
thromboembolic stroke due to increased level of hematocrit and reduced availability of nitric
oxide (Jansen & Basnyat, 2011).
15
Large studies report an increased risk of congenital heart disease in children born at HA. Studies
comprising 32,578 (Jin et al., 2008), 288,066 (Q. H. Chen et al., 2009) and 5,790 children (J.-Y.
Zheng et al., 2013) all found an association between congenital heart disease and HA. However,
these studies have been carried out only in the Tibetan HA region and data for other HA resident
populations are unclear. Hospital-based data in La Paz (mean altitude 3650 m), Bolivia, showed
that 66% of all cardiac related surgery was for congenital heart disease, and of these patients
91.5% were resident at altitude above 3000 m (Ponce-Caballero, Loma-Rodriguez, Villegas, &
Laura, 1976). Lower oxygen tension and increased pulmonary vascular resistance at HA may
result in impairment of normal neonatal development (Miao, Zuberbuhler, & Zuberbuhler, 1988;
J.-Y. Zheng et al., 2013).
A large body of evidence suggests beneficial effects on CVD health in populations living at
intermediate levels of altitude (Baibas et al., 2005; Faeh, Gutzwiller, & Bopp, 2009; Faeh et al.,
2016; R. Gupta, Misra, Pais, Rastogi, & Gupta, 2006; Mahajan et al., 2004; Mortimer Jr,
Monson, & MacMahon, 1977; Sinnett & Whyte, 1973; Voors & Johnson, 1979). IHD and stroke
mortality was shown to be inversely and progressively related to altitude (259 m to 1960 m) in a
retrospective data analysis of 1.64 million people in Switzerland (Faeh et al., 2009). Further
analyses in Switzerland, encompassing 4.2 million people, reported that after accounting for all
other environmental factors IHD mortality reduced by a significant 24% at an altitude higher
than 1500 m compared to an altitude lower than 600 m (Faeh et al., 2016).
Taken together, the evidence is inconsistent, although majority report cardio-protection from
living at HA. The retrospective and hospital-based nature of these studies means other factors
may explain the apparent association between lower rates of CHD and living at HA. Evidence
for the increased risk of stroke and congenital heart disease at HA is more robust. Studies of
populations living at intermediate altitudes report better cardiovascular health at this level of
altitude. More studies are needed of populations living at HA taking account of different
ethnicities to improve understanding of the consequences of HA for cardiovascular health.
16
1.5 Life expectancy at high altitude in Nepal
The national health information system of Nepal is very rudimentary. Nepal is one of the 19% of
the countries that do not have an established system to record cause-specific mortality (World
Health Organization, 2014a). A vital registration system with sufficient information on causes of
death is not in place. However, information on life expectancy is available. The Central Bureau
of Statistics (CBS) reports that the mountain region of Nepal has the lowest life expectancy at
birth (66.98 years) compared to the hilly region (69.02 years) or low-land region (68.85 years)
(Central Bureau of Statistics, 2012). The proportion of people not expected to survive to age 40
years has also been estimated to be higher in the mountain region (10.62%) compared to the hilly
(7.11%) or low-land regions (7.44%) (Government of Nepal & United Nations Development
Programme, 2014). Research initiatives on CVD and related risk factors in Nepal are scarce and
the information that does exist is reviewed in Section 2.6.
17
1.6 Statement of the problem
The risks and benefits for cardiovascular health in an environment of chronic hypobaric hypoxia
induced by living at HA are uncertain. Increased angiogenesis and structural vascular changes
caused by HA may be helpful in reducing blood pressure (BP) and promoting cardio-metabolic
efficiency, but erythrocytosis (from chronically low inspired oxygen concentrations) and
pulmonary HT among those living at HA may constitute important cardiovascular risk factors
(Ostadal & Kolar, 2007; Stuber & Scherrer, 2010). The largest HA populations, Tibetans and
Andeans, have different distributions of key CVD risk factors; for example, higher systemic HT
in Tibetans (Mingji et al., 2015) but lower in Andeans (Makela, Barton, Schull, Weidman, &
Rothhammer, 1978), and higher pulmonary HT in Andeans but lower in Tibetans (Beall, 2007).
The differences in genetic, lifestyle and cultural factors among HA populations may all be
relevant to this variation.
In Nepal, almost 2 million people live permanently in mountainous areas, representing 7% of the
national population (Central Bureau of Statistics, 2012). A large proportion of the population of
the hilly districts are also resident at altitudes greater than 2500 m. According to earlier
estimates, around 35% of the total Nepalese population permanently live at higher than 2500 m
of elevation (Moore et al., 1998). Populations with Tibetan ancestry are the dominant HA
population in Nepal: for example, Sherpa, Thakali, Tibetan Gurung and Lama. They migrated
from the Eastern part of Tibet about 500 years ago (Eagle, 2000).
No study has yet reported CVD incidence and there is little published information on diabetes,
obesity, dyslipidemia and dietary risk in this group. A few studies have examined the prevalence
of HT, mainly in Sherpas.
Two large studies have reported the prevalence of HT in mountainous districts of Nepal and
compared it with that in populations living at moderate altitude in the hilly region and in the
lowest terrain of the low-land region. A national representative survey among those aged
between 18 and 65 years and including five mountainous districts showed that the prevalence of
HT in mountain districts was more than double (29.5%) of that in the hilly (14%) and low-land
(13.7%) regions (Koju et al., 2015). This study also noted that those living at an altitude of equal
to or greater than 2000 m had an adjusted odds ratio with 95% confidence interval (CI) of 1.3
18
(0.9 to 1.9) for being hypertensive compared to those living at below 2000 m. Also, living at
equal to or above 2000 m was reported to be associated with HT after adjustment for possible
confounding variables in this study. In contrast, the WHO STEPS survey conducted in 2013
documented a slightly lower prevalence of HT in mountainous regions (22.2%) than in the hill
areas (25.9%) or low-land areas (26.1%) (K. K. Aryal et al., 2015). It is likely that this
discrepancy is caused by the confounding effect of sampling different ethnic populations and the
consequent differential exposure to risk factors. In a study that compared BP and HT in
opportunity samples of male Sherpas older than 18 years living at HA with those who migrated
to a low-land area, the rate of HT was 25% in those living at between 3400 and 3900 m in the
Everest region and 21.7% in Sherpas who migrated to Kathmandu (Smith, 1999). Diastolic blood
pressure (DBP) was significantly higher in Sherpas currently living at HA. An earlier study
reported the opposite association: that Sherpas and Tibetans living at HA (above 2980 m) had a
lower systolic blood pressure (SBP) than those who were born at HA but later migrated to LA
(Kathmandu) (Weitz, 1982). A very low prevalence of HT (3.8%) at HA (above 2650 m) among
those aged over 14 years was also reported in the Humla district of Nepal (S. Shrestha, Shrestha,
Shrestha, & Bhattarai, 2012). A proposed mechanism for an association between altitude and BP
and HT is the tradition in Nepal for HA residents from Tibetan ancestry to consume large
amounts of salty butter tea (Smith, 1999).
Two studies have reported blood glucose levels at HA in Nepal and both found a lower
prevalence at HA than at LA. A national survey reported the prevalence of raised blood glucose
(fasting plasma glucose ≥126 mg/dL (≥7.0 mmol/L) or on medication) was 1.9% in mountainous
areas compared to 3.5% in hilly regions and 3.9% in low-land areas (K. K. Aryal et al., 2015).
Similarly, 14.3% of Sherpa population aged 30 to 70 years and living at altitudes equal to or
higher than 2900 m in the Everest region were shown to have impaired fasting glucose (IFG)
(100 to 125 mg/dL) (5.6 to <7 mmol/L) and 2 hours plasma glucose <200 mg/dL (<11.1
mmol/L) compared to 42.1% in Sherpa living in the Kathmandu valley (Sherpa, Supamai, &
Virasakdi, 2008). The adjusted odds ratio (95% CI) for IFG was 0.19 (0.08 to 0.44) for the
Everest region compared to Kathmandu.
Studies on the prevalence of obesity at different altitudes in Nepal report inconsistent results. A
recent national study among 13,369 women aged between 15 and 49 years reported that the
19
prevalence of overweight (body mass index [BMI] ≥25 kg/m2) in women from mountainous
regions (24.8%) was higher than in the hilly (18.7%) and low-land (6.3%) areas (S. Bhandari et
al., 2016). In another study among Tibetans in Nepal, those living at HA of equal to or higher
than 2900 m had a greater prevalence of central obesity (waist circumference [WC] >102 cm for
men and >88 cm for women) than those at 1200 m (57.1% versus 53.5%) (Sherpa, Stigum,
Chongsuvivatwong, Thelle, & Bjertness, 2010). A lower expenditure of calories in Tibetan HA
residents has been documented (Sherpa, Stigum, Chongsuvivatwong, Nafstad, & Bjertness,
2013), which transforms surplus calories into visceral fat. Another national survey reported a
markedly lower prevalence of overweight or obesity (BMI ≥25 kg/m2) in mountainous
populations (9%) compared to hilly (26.2%) and low-land (18.9%) residents (K. K. Aryal et al.,
2015).
One previous study investigated the lipid profile of HA residents in Nepal. The WHO STEPS
survey 2013 in populations 15 years and over reported that the proportion of elevated total
cholesterol (TC) was lowest in mountainous regions (14.1%) compared to 21.7% in hilly and
24.5% in low-land areas (K. K. Aryal et al., 2015). This study also reported a higher prevalence
of current smokers (mountainous 24.6%, hilly 19.9%, low-land 16.5%), hazardous drinkers
(mountainous 5.7%, hilly 3.1%, low-land 0.6%), but the least prevalence of low physical activity
(mountainous 0.5%, hilly 2.2%, low-land 4.8%). A low consumption of fruit is more prevalent in
mountainous regions. One study including 21,111 women of reproductive age from all ecological
regions of the country showed that 4% of participants from mountainous districts, 16% from
hilly districts, and 9.4% from low-land districts consumed fruit once a day (S. Bhandari et al.,
2016). Another nationally representative study also reported a low intake of fruit and vegetables
in mountainous regions (mountainous 99.3%, hilly 98.7%, low-land 0.6%) (K. K. Aryal et al.,
2015).
Dietary practices vary significantly between the two major ethnic populations living at HA in
Nepal – Tibetans and Khas-Aryas. Those from Tibetan origins (such as Sherpa and Thakali)
have culturally derived food practices of consuming large amounts of alcohol, salt, meat
products and oil (Smith, 1999; Stevens, 1996). However, during the field surveys this author has
observed that the Khas-Aryas at HA have gradually acquired Tibetan dietary practices,
particularly in consuming salty butter tea.
20
In summary, there is little robust data from population-based studies on CVD and related risk
factors among HA populations in Nepal. Such studies that do exist have inconsistent findings.
Differences in CVD-related risk in Nepal may depend as much on ethnicity (Tibetans versus
Khas-Aryas) as on altitude. More evidence on both ethnic populations is required to understand
the degree of CVD risk in HA populations of Nepal.
1.7 Significance of the study
This study is significant because:
First, it will be the first comprehensive survey of CVD and CVD risk factors in the population at
HA in Nepal, which in turn may lead to development of important strategies to reduce this risk.
Second, comparing the results of this study with results of studies in other HA populations will
supply information on the potential role of altitude itself and other key environmental factors
such as urban versus rural settings. Third, the comparison between Tibetan and non-Tibetan HA
populations will enable understanding of whether HA itself has a protective or harmful effect on
cardiovascular health or whether other factors such as ethnicity or lifestyle determine the risk.
21
1.8 Aims and objectives
Research Questions
This study investigates the following general research questions:
1. What is the prevalence of CHD in HA populations in Nepal?
2. What is the prevalence and distribution of key CVD risk factors among this group and do
these differ by altitude?
The detailed aims are:
1. To estimate the prevalence of CHD by interpreting resting ECGs, to identify any distinct
pattern of ECG abnormalities, and to estimate the association, if any, between changes consistent
with CHD and altitude.
2. To estimate the prevalence of cerebrovascular disease.
3. To estimate the distribution of blood pressure and prevalence of HT and to determine the
association, if any, between systolic and diastolic BP, and altitude.
4. To estimate the distribution of key CVD risk factors: lipid profile, glycated hemoglobin, body
mass index, waist and hip circumference, tobacco use, alcohol use, salt use, fruit and vegetable
consumption, and physical activity.
5. From this information, to determine the 10-year risk of fatal or non-fatal cardiovascular events
using the WHO and International Society of Hypertension (ISH) risk prediction chart.
6. To compare the estimates of CHD, BP, HT, CVD risk factors, and CVD risk at HA with
similar data from those living at LA.
22
2 Literature Review
The purpose of this chapter is to review and summarize the literature on cardiovascular disease
(CVD) and related risk factors in high altitude (HA) populations. Five sections present various
associations between CVD and risk factors and HA. Narrative reviews are presented for the
associations between: (i) obesity, (ii) tobacco use, (iii) alcohol intake, (iv) diet, and (v)
electrocardiogram (ECG) abnormalities; and altitude. There is a final section about CVD and risk
factors specifically in Nepal.
2.1 Obesity at high altitude
Overweight and obesity are important public health concerns affecting both developed and
developing countries. The World Health Organization (WHO) has considered it a global
epidemic (World Health Organization, 2000). According to a recent WHO report, 13% of the
world's adult population (men 11%, women 15%) were obese and 39% (men 38%, women 40%)
were overweight in 2014 (World Health Organization, 2015b). Estimates for developed countries
are that between 40% and 70% of the adult population are either overweight or obese (Ng et al.,
2014). A rapid rise in the prevalence of severe obesity (obesity III, body mass index (BMI) ≥40
kg/m2) is of particular concern; for example it is at 6.4% in the United States of America (USA)
(Ogden, Carroll, Kit, & Flegal, 2014).
Obesity increases the risk of CVD, particularly via associated risk factors such as diabetes,
hypertension (HT) and dyslipidemia (Solomon & Manson, 1997). Type II diabetes is particularly
associated with obesity. More than 80% cases of type II diabetes can be ascribed solely to
obesity (Napier, 2006). People with a BMI greater than or equal to 35 kg/m2 are 20 times more
likely to develop diabetes compared to individuals with a normal BMI during a 10-year period
(Field et al., 2001). The suggested mechanism of type II diabetes in most of those with obesity is
insulin resistance due to the elevated levels of serum fatty acids in the obese state (Boden, 2011;
Papaetis, Papakyriakou, & Panagiotou, 2015).
It may be that obesity should be treated like any other chronic disease regardless of metabolic
abnormalities (Hill & Wyatt, 2013). In a systematic review and meta-analysis of non-
experimental studies conducted between 1950 and 2013, the relative risk of all-cause mortality or
cardiovascular events was 1.24 (95% CI 1.02 to 1.55) in obese participants compared to the
23
metabolically healthy normal weight participants (Kramer, Zinman, & Retnakaran, 2013).
Obesity was a significant predictor of ischemic heart disease (IHD) in the Framingham study
data involving 5209 participants (Hubert, Feinleib, McNamara, & Castelli, 1983). The
INTERHEART study also showed that abdominal obesity could account for 20% of the
population-attributable risk of first myocardial infarction (MI) (Joshi et al., 2007). Obesity-
related comorbidities could be improved with weight loss of 5% to 10% (Padwal & Sharma,
2010). Although the net positive energy balance (overload less expenditure) is the most common
cause of obesity, the etiology is highly complex and encompasses factors (among others) such as
genetic, physiological, environmental and socio-economic (Napier, 2006; Wright & Aronne,
2012).
Obesity in HA populations
The preponderance of evidence suggests that HA populations generally have a lower BMI and
less general obesity compared to low altitude (LA) populations. However, the rates of central
obesity as defined by high waist circumference (WC) were actually higher in most of the HA
populations studied. In addition to the known risks for obesity such as lifestyle, dietary and
socio-economic factors, other environmental conditions at HA could influence obesity in native
populations. These include hypoxia, cold temperature-induced changes in energy balance and
metabolic rate, low birth weight, growth stunting, and a high level of vitamin D. However, the
role of these factors for obesity in HA populations has not been fully elucidated. This review will
discuss key findings on obesity-related studies in adult HA permanent residents, explain possible
causes and the possible mechanism of this relationship, and also briefly describe the effects on
obesity from short-term exposure to HA.
A large amount of evidence indicates an inverse association between BMI and altitude. In a
nationally representative study comparing American adults living at lower than 500 metre (m)
(n=322,681) and higher than or equal to 3000 m (n=236), LA residents had a greater risk for both
men and women for obesity: odds ratio (95% CI) 5.1 (2.7 to 9.5), for men, and 3.1 (1.6 to 9.3),
for women, after controlling for temperature, diet, urbanization, physical activity, smoking, and
demographic factors (Voss, Masuoka, Webber, Scher, & Atkinson, 2013). Another study
comparing Tibetan participants residing in Tibet and Nepal at three levels of altitude (1200 m,
2900 m, and 3700 m) found that a higher altitude level was significantly associated with lower
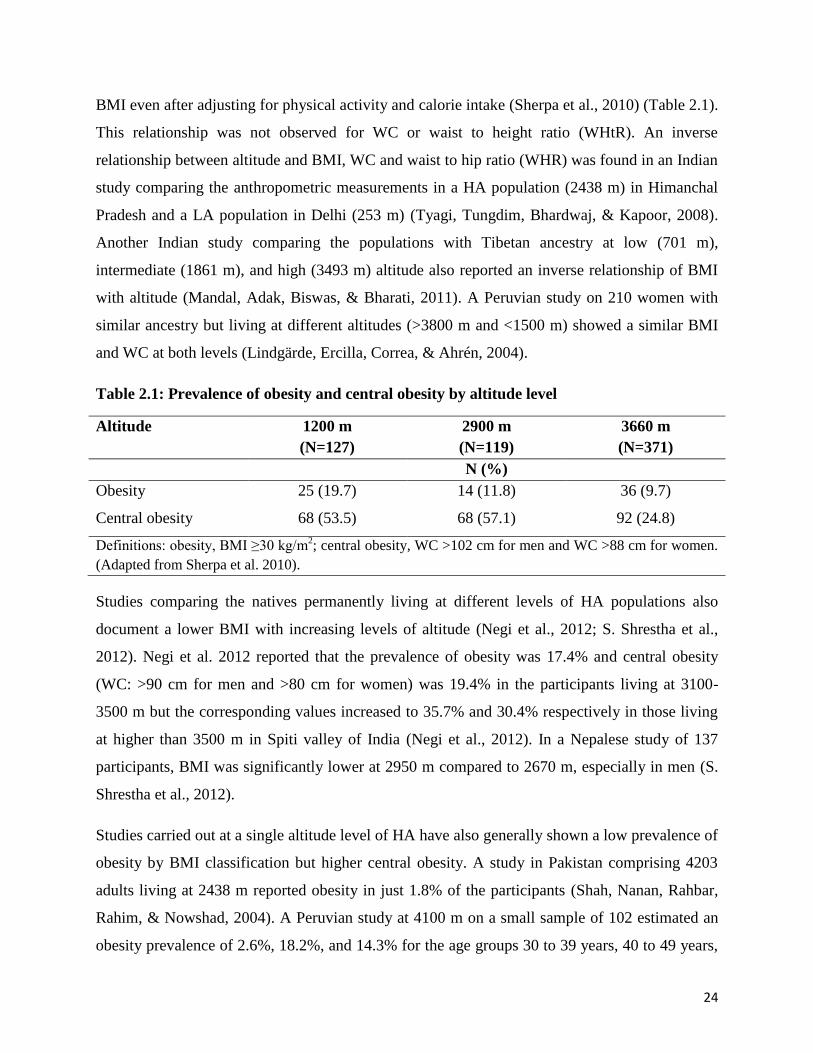
24
BMI even after adjusting for physical activity and calorie intake (Sherpa et al., 2010) (Table 2.1).
This relationship was not observed for WC or waist to height ratio (WHtR). An inverse
relationship between altitude and BMI, WC and waist to hip ratio (WHR) was found in an Indian
study comparing the anthropometric measurements in a HA population (2438 m) in Himanchal
Pradesh and a LA population in Delhi (253 m) (Tyagi, Tungdim, Bhardwaj, & Kapoor, 2008).
Another Indian study comparing the populations with Tibetan ancestry at low (701 m),
intermediate (1861 m), and high (3493 m) altitude also reported an inverse relationship of BMI
with altitude (Mandal, Adak, Biswas, & Bharati, 2011). A Peruvian study on 210 women with
similar ancestry but living at different altitudes (>3800 m and <1500 m) showed a similar BMI
and WC at both levels (Lindgärde, Ercilla, Correa, & Ahrén, 2004).
Table 2.1: Prevalence of obesity and central obesity by altitude level
Altitude 1200 m
(N=127)
2900 m
(N=119)
3660 m
(N=371)
N (%)
Obesity 25 (19.7) 14 (11.8) 36 (9.7)
Central obesity 68 (53.5) 68 (57.1) 92 (24.8)
Definitions: obesity, BMI ≥30 kg/m2; central obesity, WC >102 cm for men and WC >88 cm for women.
(Adapted from Sherpa et al. 2010).
Studies comparing the natives permanently living at different levels of HA populations also
document a lower BMI with increasing levels of altitude (Negi et al., 2012; S. Shrestha et al.,
2012). Negi et al. 2012 reported that the prevalence of obesity was 17.4% and central obesity
(WC: >90 cm for men and >80 cm for women) was 19.4% in the participants living at 3100-
3500 m but the corresponding values increased to 35.7% and 30.4% respectively in those living
at higher than 3500 m in Spiti valley of India (Negi et al., 2012). In a Nepalese study of 137
participants, BMI was significantly lower at 2950 m compared to 2670 m, especially in men (S.
Shrestha et al., 2012).
Studies carried out at a single altitude level of HA have also generally shown a low prevalence of
obesity by BMI classification but higher central obesity. A study in Pakistan comprising 4203
adults living at 2438 m reported obesity in just 1.8% of the participants (Shah, Nanan, Rahbar,
Rahim, & Nowshad, 2004). A Peruvian study at 4100 m on a small sample of 102 estimated an
obesity prevalence of 2.6%, 18.2%, and 14.3% for the age groups 30 to 39 years, 40 to 49 years,
25
and older than 50 years respectively (Mohanna, Baracco, & Seclén, 2006). The corresponding
prevalence for central obesity (WC: >102 cm for men and >88 cm for women) were 36.8%,
36.4%, and 47.6% respectively. A study on HA farmers and herdsmen at 3700 m in Tibet
reported the prevalence of central obesity (WC: ≥90 cm for men and ≥80 cm for women) in 46%
of the 692 participants aged 30 to 80 years (Sherpa et al., 2013). This prevalence was higher in
women than in men (64.3% versus 25%).
While the majority of the studies report lower BMI and general obesity at HA, studies conducted
in Saudi Arabia have unequivocally shown a higher BMI, obesity, and central obesity at HA
compared to LA populations. BMI levels were higher in both men and women at HA (3150 m,
sample size 437) compared to LA natives (500 m, sample size 468) in the Asir province of Saudi
Arabia (Khalid, 1995). This finding is corroborated by another study among 438 married and
non-pregnant women born and permanently living at 2800 m to 3150 m in the Abha region of
Saudi Arabia, which reported the prevalence of central obesity (WC: >88 cm) at 41.1% (Khalid,
2007). Participants at LA were physically more active than HA counterparts in both of the above
studies. Interestingly, Saudi Arabian school children and adolescents aged 6 to 15 years also had
significantly greater odds for being overweight and obese at HA compared to LA counterparts
(Khalid, 2008).
Possible explanations for lower BMI and higher central obesity in HA populations
Altered metabolic processes, low birth weight, and a greater concentration of circulating vitamin
D have all been proposed to contribute to lower mean BMI and rates of general obesity at HA.
Metabolic expenditure varies according to energy imbalance in either very hot or cold
temperatures (McAllister et al., 2009). To cope with a reduction of ambient temperature of 5C,
an increased annual calorie expenditure equivalent to 5.1 kg to 7.3 kg of adipose tissue is
required (Hansen, Gilman, & Odland, 2010). The catabolic effect of physiological responses to
cold temperature at HA may be responsible for lower body weight at HA.
Evidence suggests low birth weight at HA may reduce later deposition of subcutaneous tissue
(Galan et al., 2001) and lower BMI in adulthood (Sørensen et al., 1997). Higher levels of
circulating vitamin D because of increased exposure to ultraviolet radiation at HA (Holick, Chen,
Lu, & Sauter, 2007) may confer a benefit that lowers the obesity rates in HA populations.
26
Vitamin D is hypothesized to suppress inflammatory cytokines Tumor Necrosis Factor alpha
(TNF-alpha) and Interleukin-6 (IL-6) (Khoo et al., 2011; B. Li et al., 2013), which are elevated
in the obese state (Kahn, Hull, & Utzschneider, 2006). A recently published meta-analysis also
showed that obese people had 35% greater risk of vitamin D deficiency (Pereira‐Santos, Costa,
Assis, & Santos, 2015). In addition, there is also strong evidence that vitamin D may promote the
outcomes of weight loss interventions (Rosenblum, Castro, Moore, & Kaplan, 2012; Villareal et
al., 2011). It is thus plausible to argue that increased vitamin D levels may help prevent obesity
in HA residents.
The levels of leptin, an adipose tissue-derived hormone, increases in hypoxia and this hormone
reduces appetite and increases energy expenditure (Yingzhong, Droma, Rili, & Kubo, 2006).
However, there is little published literature about the leptin-altitude relationship in native HA
populations. It is possible that levels of leptin at HA decrease (Santos, 2000; Woolcott, Castillo,
Torres, Damas, & Florentini, 2002). Although hypoxia promotes leptin secretion, cold
temperature inhibits it (Sherpa et al., 2010) and ambient cold temperature may moderate the role
of hypoxia for leptin secretion during the long-term exposure.
Despite having lower mean BMI and rates of obesity, a higher prevalence of central obesity
(high WC) is observed in the majority of the studied HA samples compared to those seen in LA
samples. This finding has important health implications because CVD risk factors are more
prevalent in people with central adiposity than in those with fat in peripheral regions (National
Institute of Health, 1998). Although BMI has a high correlation with body fat, it does not provide
information on central fat deposition (Padwal & Sharma, 2010).
Possible causes of increased rates of central obesity may include physical inactivity, high alcohol
consumption, and social deprivation. In some studies, participants at HA were physically less
active than those living at LA and centrally obese participants were also less active (Khalid,
1995, 2007; Sherpa et al., 2013). A Tibetan study of residents at 3700 m found that only one-
fourth of the participants had energy expenditure of greater than 2000 kcal/week (Sherpa et al.,
2013), suggesting a low expenditure of calories. The surplus calories might have transformed to
fat and accumulated in the visceral area. Outdoors ambient temperature is usually cold at HA
and, particularly during the winter, people limit themselves to activities inside the house for
27
months. It has also been shown that elderly HA residents had lower basic activities of daily
living compared to LA elders (Matsubayashi et al., 2009).
Alcohol intake is very common in HA populations. In some HA populations, for example
Tibetans, alcohol drinking is a cultural practice. The positive association between heavy or binge
drinking and central obesity is reported in a number of studies (K. Lee, 2012; Wannamethee,
Shaper, & Whincup, 2005). A plausible mechanism for this relationship may be alcohol-induced
rise in appetite and consequent additive energy to that from other dietary sources (Yeomans,
2010).
Low socio-economic status or social deprivation has been linked to increased levels of
anthropometric measurements including WC and WHR. A European study showed increasing
rates of WC with increasing levels of socio-economic deprivation, particularly in women (R.
Chen & Tunstall-Pedoe, 2005). Other studies also reported lower physical activity among men
and women with lower socio-economic status (Ford et al., 1991). Because of limited
opportunities and access, HA populations are more likely to be in a lower socio-economic
stratum, which in turn may result in low levels of education and awareness about healthy
lifestyle.
Obesity in short-term exposure to HA
Appetite suppression and body weight loss are frequently observed during an HA sojourn
(Quintero, Milagro, Campion, & Martinez, 2010) and these are also components of chronic
mountain sickness (CMS) (León-Velarde et al., 2010). The possible reasons include changes in
leptin, glucagon-like peptide 1, protein synthesis, intestinal absorption and hypoxia-related genes
(Quintero et al., 2010). There is also substantial evidence that people with a higher BMI or
obesity lose more weight than people with normal BMI during short-term exposure to HA. For
example, obese persons working temporarily at 4000 m reached their normal BMI level after 3 to
5 months of HA exposure (Wu et al., 2007). Thus, working or trekking at HA might be an
effective strategy for losing body weight – except in those with other co-morbidities like CVD,
or sleep apnea (Kayser & Verges, 2013). However, more evidence is required to support a
therapeutic use of HA exposure for maintaining or reducing body weight.
28
Conclusion
Collectively, HA populations generally have lower mean BMI levels and reduced rates of
obesity. However, higher rates of central obesity may increase the risk of CVD, and metabolic
risk factors. The multi-factorial nature of obesity and lack of research preclude reaching definite
conclusions about the relationship between obesity and HA. However, it is conceivable that
hypoxia and cold temperature at HA affect energy balance and other obesity-related factors in
HA populations.
2.2 Tobacco use at high altitude
Tobacco consumption is one of the world’s biggest public health challenges. Tobacco causes the
deaths of 6 million people every year and around 80% of more than one billion smokers in the
world are from low and middle income countries (World Health Organization, 2015c). One
estimate is that half of tobacco smokers will die prematurely due to their tobacco use (Peto,
Boreham, & Lopez, 1996). Smoked tobacco accounts for about 65% to 85% of all tobacco
produced globally and it causes more disease than the other forms of tobacco (World Health
Organization, 1997). The prevalence of smoking is highest in Eastern Europe and Central,
Southern, and Eastern Asia where 50% of adults smoke (P. Jha, Mony, Moore, & Zatonski,
2010). In 2012, the age standardized prevalence of current smoking in WHO’s South-East Asia
region was around 33% for men and 3% for women who were aged 15 years or over (World
Health Organization, 2014b). The prevalence of smoking has reduced in developed countries in
recent years but it is increasing in developing nations (Pipe, 2010).
An estimated 1.6 million cardiovascular deaths in 2000 were attributed to smoking, accounting
for 11% (of these, men 17% and women 5%) of all CVD deaths of people aged 30 years or more
in the worldwide population (Ezzati, Henley, Thun, & Lopez, 2005). Among all CVD deaths
attributable to smoking, IHD comprised the largest proportion (54%) and was similar in
developed and developing countries (Ezzati et al., 2005). A prospective study of one million
participants in the USA reported a smoking-associated risk ratio (RR) of 2.5 (men) and 2.9
(women) for IHD, and 2.7 (men) and 3.4 (women) for cerebrovascular disease (Peto, Boreham,
Lopez, Thun, & Heath, 1992).
29
Cigarette smoking directly contributes to the development of IHD, chiefly by impairing nitric
oxide activity, increasing vascular inflammation, initiating and promoting deposition of
inflammatory materials in vessel walls, contributing to plaque rupture, and oxidizing lipoproteins
(Ambrose & Barua, 2004; Benowitz, 2003; Tonstad & Johnston, 2006). Smokeless tobacco users
are more likely to have raised blood pressure (BP) levels compared with smokers and non-
tobacco users (Bolinder & de Faire, 1998) due to the high sodium content and the presence of
two pharmacologically active ingredients: nicotine and licorice (Westman, 1995).
Smoking prevalence and practices at HA
Available literature suggests that HA populations have a lower prevalence of smoking compared
with those living at LA. Factors such as a culturally driven preference for alcohol intake rather
than tobacco products, lack of availability of tobacco products and low purchasing capacity may
be the reasons. Reports of smokeless tobacco use in HA are extremely rare and so this review is
mainly focused on smoked tobacco.
Studies on HA populations of Tibetan ethnicity have mostly reported a smoking prevalence
between zero and 15%. None of the 119 study participants in the age group of 30 to 70 years
from the Sherpa population living at 2900 m in Nepal were smokers or past smokers (Sherpa et
al., 2010). The prevalence of current smoking was 5.1% (of these, men 10.6%, women 1%) in a
study among 701 members of a HA population living at 4300 m in Tibet, which was well below
the national prevalence of China (X. Zhao et al., 2012). Another study among 692 farmers aged
30 to 80 years and living at 3700 m in Tibet reported the prevalence of smoking as 15.3% (of
these, men 33.1%, women 0.3%) (Sherpa et al., 2013). Two studies on HA populations with
Tibetan ancestry but living at higher than 3000 m in the Himanchal state of India showed a
prevalence of 15% for current smokers (Negi et al., 2012) and just 5.9% for current and past
tobacco consumers (Negi et al., 2014). A systematic review concluded that the low smoking
rates in Tibet accounted for its lowest crude mortality rate from lung cancer among all regions of
China (She, Yang, Hong, & Bai, 2013). Nonetheless, the prevalence of smoking has increased in
the urban HA Tibetan population; for example, the capital city of Lhasa (3660 m) has a rate of
24.3% (Sherpa et al., 2010). Also, the prevalence of smoking was 25% in the older Tibetan
population (≥60 years) living at greater than or equal to 3000 m in Qinghai, China; 43% and 25%
for Mongolian and Han elders respectively (Matsubayashi et al., 2009).
30
There have been very few reports on tobacco use and smoking trends in Andean HA populations.
In a study among 3246 participants aged 15 years or over in Peru (3380 m), 7.4% reported
smoking at least one cigarette per day (Jaillard et al., 1995). The prevalence of smoking was
similar, at 6.7%, among 506 participants (aged 35 to 75 years) living at 4100 m in Peru
(Gonzales & Tapia, 2013).
In contrast to the Tibetan and Andean populations, studies on other HA populations showed a
higher smoking prevalence. The prevalence of smokers was 43.7% in men and 5.5% in women
in a study of 4203 adults living at 2438 m in Pakistan (Shah, Arif, Delclos, Khan, & Khan,
2001). In this study participants who reported consuming wine were 3.5 times more likely to be
smokers. The odds ratio for smoking was 7.0 times higher in people aged 20 to 50 years living in
a mountainous area of Taiwan compared to those living at low altitude (H.-W. Chen, Chu, Chen,
& Yeh, 2014). In this study, a lack of tobacco control activities in mountainous areas was
implicated for the higher smoking rates. A study conducted in the Appalachian mountains of the
USA reported that adults generally showed a lesser degree of acceptance for adolescent tobacco
consumption than for alcohol use (Meyer, Toborg, Denham, & Mande, 2008).
Cultural norms and practices have an enormous influence on tobacco use in HA populations. For
example, traditionally smoked tobacco is less common in Tibetan HA populations. Instead, nose-
snuffing of powdered tobacco is customary cultural practice. This is also used as a remedy for
common cold and related illnesses. Chewing coca is a popular practice in the Andean HA
population as they believe it helps to combat the hard climatic conditions of HA (Hanna, 1974).
These factors may contribute to the comparatively lower rates of smoking in Tibetan and Andean
HA populations.
Effects of smoking at HA on sojourners and non-acclimatized populations
The current literature on sojourners and non-acclimatized populations at HA shows that although
smokers may have a decreased risk of acute mountain sickness (AMS) compared with non-
smokers, they may have impaired capacity to acclimatize at HA. A study on Han lowland
individuals temporarily working in Tibet reported a lower incidence of AMS in smokers when
compared to non-smokers, but they had an impaired capacity for long-term acclimatization
compared to non-smokers (Wu et al., 2012). In a prospective cohort study among 1326 French
31
sojourners, the odds for having AMS were significantly lower in smokers than in non-smokers
during their ascent to 4000 m (Richalet, Larmignat, Poitrine, Letournel, & Canouï-Poitrine,
2012). However, during prolonged stays at HA smokers generally have more cases of mountain
sickness. For example, a study among young Chinese male immigrants to Tibet showed a higher
prevalence of CMS in the smoking group compared to the non-smoking group (Pei et al., 2012),
and in Peru foreign workers who could not cope with work at 3200 m were all smokers
(Lindgärde & Liljekvist, 1984), suggesting that smoking behaviour may impair long-term
altitude acclimatization. Nonetheless, there are also studies showing no significant relationship
between the prevalence of AMS and smoking status (Gaillard, Dellasanta, Loutan, & Kayser,
2004; Schneider, Bernasch, Weymann, Holle, & Bartsch, 2002).
Hypoxia-induced cerebral vasodilation, which is impacted by the increased levels of nitric oxide,
is one of the main triggers of AMS headache. As nitric oxide levels go down in smokers, this
may protect them from headache (Wu et al., 2012). Reduced levels of nitric oxide along with the
effects of higher levels of nicotine and carbon monoxide in smokers may help to attenuate
breathing instabilities and decrease sleep disturbance at HA (Wu et al., 2012).
An increased risk of frostbite among smokers during a sojourn to HA has also been documented.
A retrospective study of frostbite cases over a 10-year period among mountaineers in Karakoram
Mountain Range in Pakistan reported that tobacco smoking was a contributing factor to
susceptibility to frostbite (Hashmi, Rashid, Haleem, Bokhari, & Hussain, 1998). A graded
relationship between smoking frequency and frostbite incidence was reported in LA population
as well (Ervasti et al., 2004).
Conclusion
In summary, available evidence suggests that the prevalence of smoking tobacco in the larger
HA populations, Tibetans and Andeans, is generally low, but other HA populations may have
higher smoking rates than LA residents. Cultural norms and practices have an important role in
tobacco use at HA. Among sojourners and non-acclimatized population at HA, smokers have a
decreased risk of AMS compared to non-smokers but have impaired capacity to acclimatize
during a prolonged stay.
32
2.3 Alcohol intake at high altitude
Globally, 3.3 million deaths annually, or 5.9% of all deaths, are attributed to the harmful use of
alcohol. A WHO report attributed these to alcohol-mediated CVD and diabetes (33.4%), cancers
(12.5%), and gastrointestinal diseases (16.2%) (World Health Organization, 2014c). Alcohol
consumption is causally implicated in more than 200 health conditions (Rehm et al., 2010).
Cardiomyopathy, atrial fibrillation, HT, and haemorrhagic stroke are identified as the main CVD
related risks from heavy alcohol consumption (World Health Organization, 2007b). The
biological mechanisms for these associations are unclear. It has been hypothesized that alcohol-
induced toxicity in myocardial cells, cardiac conduction interference, refractory period
shortening and increased sympathetic activity may be the possible reasons for alcoholic
cardiomyopathy (Klatsky, 2015; Marchi, Muniz, & Tirapelli, 2014).
The views on risks and benefits of alcohol consumption on CVD health are controversial. The
vast majority of epidemiological studies suggest that light to moderate alcohol consumption is
associated with reduced risk of CVD outcomes (Ronksley, Brien, Turner, Mukamal, & Ghali,
2011; Smyth et al., 2015). A recent large prospective study on 114,970 participants from 12
countries with different income regions showed that current drinking was significantly associated
with reduced MI, hazard ratio (95% CI) of 0.76 (0.63 to 0.93) (Smyth et al., 2015).
Approximately half of this benefit is suggested to be mediated by the increased level of high-
density lipoprotein-cholesterol (HDL) triggered by alcohol consumption (Rimm, Williams,
Fosher, Criqui, & Stampfer, 1999). Nonetheless, there is robust evidence that episodic heavy
drinking may raise the risk of IHD (Roerecke & Rehm, 2010), possibly due to an effect of
increased triglyceride (TG) levels (Klatsky, 2015).
Alcohol consumption trend at HA
High alcohol consumption is common in some HA populations, particularly those of Tibetan
origin. The trend has been inconsistent in other HA populations.
In an Indian study on 242 participants (aged ≥19 years) of Tibetan origin from the Lepcha
community living in the Sikkim Himalayas, 80.8% were currently drinking and 22.1% were
heavy drinkers, defined as consuming more than two standard drinks per day (Mukhopadhyay,
33
Mukhopadhyay, & Majumder, 1996). Among farmers and herdsmen at 3700 m in Tibet, the
prevalence of current drinking was 46.8% (Sherpa et al., 2013). The proportion of current
drinkers in this study was similar for men and women. A study among 119 Sherpas of Tibetan
origin living at 2900 m in the Everest region of Nepal found that 35.5% were drinking alcohol
more than five times a week (Sherpa et al., 2008). Another study comparing two HA populations
reported that 44.4% of Tibetans living at 3660 m and 56.3% of the Sherpas living at 2900 m
were drinking alcohol more than five times a week (Sherpa et al., 2010). In an Indian study
among 413 participants (age >20 years) of Tibetan ancestry living at 3100 m and 3900 m the
prevalence of current drinking was reported to be 32.4% (Negi et al., 2012). A Tibetan study
reported that of 701 herdsmen living at 4300 m and aged 40 years or older, 9.1% were drinking
alcohol at least once a week (X. Zhao et al., 2012). Studies on an older HA Tibetan population
aged greater than or equal to 60 years, however, reported a low prevalence of current drinking
status (16%) compared to HA-living Mongolian (24%) and Han (22%) counterparts
(Matsubayashi et al., 2009).
A tendency towards high alcohol consumption among HA populations with Tibetan origin is
associated with serious health consequences. Native Tibetans were found to have a higher
incidence of alcoholic cirrhosis than LA populations and 60.9% of all cirrhosis was attributed to
alcohol (G. Zhao & Li, 1989). A hospital-based study on acute first-ever stroke patients showed
that the prevalence of heavy drinking was significantly higher in Tibetans compared to those
from lowland areas (Fang et al., 2011). In a population-based study among 3171 participants in
Lhasa (Tibet), 16.2% (of those, men 31.6% and women 9.6%) had alcohol use disorder (Guo et
al., 2008). It has also been reported that alcohol drinking may exacerbate high altitude sickness
among indigenous Tibetans who frequently travel between high and low or to extreme HA (S. Li
et al., 2006).
Very few studies have reported data on alcohol consumption in other HA populations. A
Peruvian study on 3246 participants aged greater than or equal to 15 years and living at 3380 m
showed that 12.3% were heavy drinkers (consuming 120 to 300 g/week) (Jaillard et al., 1995).
More than one-third (34%) reported drinking alcohol at least once a week in a study among HA
miners in Argentina (Schinder & Ruder, 1989). A qualitative study at Nahuala (2467 m) in
Guatemala concluded that during festivals and holidays many drinkers, especially men, drink
34
until inebriation and the social environment encourages drinking (Kanteres, Lachenmeier, &
Rehm, 2009).
Possible reasons for high alcohol consumption in HA
Although little research is available from which to draw conclusions about a general pattern of
alcohol consumption in all HA populations, high consumption of alcohol has been consistently
reported in populations with Tibetan ancestry, regardless of their living situation. There may be
three strong reasons triggering alcohol consumption in HA: ancestral cultural habit, cold
temperature, and physical hardship.
Alcohol consumption is culturally embedded in some HA populations, mainly Tibetan and
Andean (Kanteres et al., 2009; Luobu, 2012; Meyer et al., 2008; X. Zhao et al., 2012). In these
populations, alcohol is consumed for hours and in large quantities during social and religious
functions (Kanteres et al., 2009; Mukhopadhyay et al., 1996). The use of alcohol by adolescents
is also socially tolerated by adults (Meyer et al., 2008), which further develops alcohol use as a
culturally and socially preferred norm. Alcohol is widely available in HA areas and brewed in
most of the homes from HA crops such as millet and barley. There is also a strong belief that
locally brewed alcohol has medicinal properties (Gorer, 1938).
HA is associated with cold temperatures and many HA populations believe that alcohol has
thermogenic effects and helps to keep a body warm. Although alcohol consumption in cold
weather has minor effects on core body temperature, it is well-established that perception of cold
and concomitant discomfort from cold decrease after alcohol intake (Graham & Baulk, 1980;
Martin, Diewold, & Cooper, 1977). The biological mechanism of this is unclear; however,
vasodilation of the blood vessels after alcohol intake and consequent warming of the skin
(Wasielewski & Holloway, 2001) or the direct effect of ethanol on the central nervous system
(Yoda et al., 2008) may play a role in reducing cold sensation.
Because of environmental and physical adversities, HA living generally implies difficult working
conditions and physical hardship. Previous reports suggest that these factors are strongly
associated with alcohol consumption (Littman, 1970; Schinder & Ruder, 1989).
35
Impact of alcohol on HA sojourns
Few studies have examined the impact of alcohol consumption on health during HA sojourns.
Alcohol consumption reduced acute ventilatory response in the initial stages of ascent to 3000 m
from 171 m in a randomized crossover trial (Roeggla, Roeggla, Roeggla, Binder, & Laggner,
1995). In a study among construction workers on the Qinghai-Tibetan highway, gastrointestinal
bleeding was higher among frequent drinkers compared to those drinking less (Wu, 2001).
Another study suggested that the combination of alcohol drinking and smoking may inhibit HA
long-term acclimatization but not AMS (Lindgärde & Liljekvist, 1984). Avoidance of alcohol
has also been suggested to HA travellers as a preventive measure for high altitude pulmonary
edema (HAPE) (Paralikar, 2012) and especially for cardiac patients aiming to go to HA
(Higgins, Tuttle, & Higgins, 2010).
There are also some reports that AMS incidence may not differ between drinking and non-
drinking HA sojourners (Honigman et al., 1993; Schneider et al., 2002), and alcohol intake may
not be associated with high-altitude headache, the most common symptom in HA sojourners
(Burtscher, Mairer, Wille, & Broessner, 2011).
Conclusion
Overall, some HA populations have a high rates of alcohol consumption, for example more than
one-third of the adult Tibetan populations. It may be due to the combination of cultural, social
and environmental factors. Hence, interventions through only health centers and educational
institutions may be not sufficient to change these trends. Culturally and religiously driven
preventive measures supported by appropriate government regulations should supplement these
efforts.
36
2.4 Dietary habits at high altitude
A healthy diet is protective for CVD, cancer, obesity and diabetes (World Health Organization,
2015a). Up to 30% of deaths from coronary heart disease (CHD) are attributable to unhealthy
diets (Lichtenstein et al., 2006). The WHO expert consultation on diet and prevention of chronic
disease recommends that daily dietary edible fat intake should not exceed 40 g, dietary
cholesterol less than 300 milligram (mg), salt consumption no more than 5 g, fruit and vegetables
around 400 gram (g) to 500 g and the sodium to potassium intake ratio be equal to or lesser than
1 (Joint WHO/FAO Expert Consultation on Diet & Nutrition and the Prevention of Chronic
Diseases, 2002).
The Global Burden of Disease study estimates that 1.65 million people die each year from
conditions related to the excessive consumption of sodium (more than 2 g per day) (Mozaffarian
et al., 2014). The INTERSALT study, which was conducted in 52 samples of population groups
across 32 countries, reported a positive association between BP and salt intake in adults aged
between 20 and 59 years (Elliott et al., 1996; Rose et al., 1988). One estimate is that reducing
dietary salt intake by 1.15 g per day would lead to a 16% reduction in CHD deaths, a 22%
reduction in stroke related deaths, and a marked 50% reduction in the number of people requiring
antihypertensive medications (M. R. Law, Frost, & Wald, 1991). There is a controversy about
the optimal amount of sodium intake, as several large and international prospective studies have
reported an increased risk of cardiovascular events in people consuming both high (>5 g/day)
and low amounts of sodium (<3 g/day), compared to those with moderate intake (3 g to 5 g/day)
(O'Donnell et al., 2014; O'Donnell et al., 2011).
It has been suggested that total fat intake should not exceed 30% of total energy consumed
(Grundy, 1997) and foods with high unsaturated fat (such as nuts, avocados, fish, olive, canola
oils) are preferable to saturated high-fat foods (such as animal products, butter, cheese, fatty
meats) (Reddy, 2010). The relationship between dietary fats and CVD may be due to atherogenic
effects of plasma lipids, but fats may also have direct effects on thrombosis, endothelial function
and inflammatory pathways (Ghafoorunissa, 1994; Kris-Etherton et al., 2001).
Existing evidence does not indicate any important association between carbohydrate intake and
CVD (National Heart Foundation of Australia, 2006). However, excessive dietary carbohydrate
37
may raise the CVD risk indirectly through overweight, obesity, and effects on lipids and blood
glucose (Reddy, 2010).
Dietary patterns at HA
HA encompasses difficult climatic and agronomic conditions resulting in very limited food
choice options. Potatoes, barley and buck-wheat are the staple foods in major HA communities
such as Tibetan and Andean communities (Berti et al., 2010; Stevens, 1996). In the Everest
region of Nepal, adult Sherpas consume more than one kilogram (kg) of tubers per day, of which
0.72 kg is potato, and more than 75% of crop land is dedicated to potato farming (Stevens,
1996). In the HA region of Ecuador more than two-thirds of daily food comprises potato and
maize (Oyarzun, Borja, Sherwood, & Parra, 2013) and in the Bolivian Andes potatoes and tubers
fulfill 54% of total dietary energy (Berti et al., 2010). In three large prospective studies in LA
areas in the USA, a higher intake of baked, boiled or mashed potatoes was positively associated
with an increased incidence of HT (Borgi, Rimm, Willett, & Forman, 2016). However, no
research has been published on the association between BP and potato consumption at HA. In
HA residents of both the Himalaya and Andes regions, fruit and vegetables are grown in small
quantities due to adverse agronomic conditions (Berti et al., 2010; Stevens, 1996). One report
states that Andes HA natives prioritize less nutritionally rich crops in terms of both production
and consumption (Oyarzun et al., 2013).
The most striking difference in dietary habits between two major HA populations, Tibetan and
Andean, is the amount of fat intake. Related literature unequivocally suggests that HA residents
of Tibetan origin generally consume a high amount of fat, whereas Andean HA populations have
a very low consumption. Tibetans consume an estimated 3 to 4 litres of yak butter tea daily (Cao
et al., 2003) and meat consumption is also very high (Smith, 1999; Sun, 1986). Yak herding is a
key subsistence activity in Tibetan cultural regions as the animals are used for both meat and
transportation purposes (Stevens, 1996). Nak (female yak) are also prized sources of butter,
cheese and meat. Butter is so popular in Tibet that formerly it was an acceptable currency for
hiring workers and it was also used to pay taxes (Stevens, 1996). In contrast, fat intake is low in
Andean HA regions. A systematic review of the nutritional adequacy of the diets in the Central
Andes range reported that fat intake comprises less than 20% of total calories and in some
settings less than 10% (Berti, Fallu, & Cruz Agudo, 2014). Although some Andean HA natives
38
rear animals like cows, pigs, chickens, and guinea pigs, they rarely consume them (Oyarzun et
al., 2013). An earlier report showed that about the half of the population in the Peruvian Andes
region suffered from calorie deficiency and available food was unable to meet the calorie needs
of the family (Ferroni, 1982).
Excessive consumption of salt is very common and embedded in Tibetan cultural dietary
practices. This is largely influenced by the daily use of salty yak butter tea (Smith, 1999; Sun,
1986). Tibetan adults consume nearly four to five times the WHO recommended amount of 5 g
of salt per day (Liu et al., 2001; Sun, 1986).
Consequences of poor diets in HA populations
Stunted growth is the predominant consequence of malnutrition problems observed in both
Tibetan and Andean HA populations. A study reported that the prevalence of stunting and
underweight in younger Tibetan children was 39% and 23.7% respectively (Dang, Yan,
Yamamoto, Wang, & Zeng, 2004). The prevalence of malnutrition, and especially stunting, is
higher in pre-school and school children in Tibet compared to the overall prevalence in China
(Harris et al., 2001; National working committee on children and women, 2001). Studies in
Andean regions also suggested stunting is a serious nutritional problem in children and
adolescents (Bassett, Gimenez, Romaguera, & Sammán, 2013; Cossio-Bolaños et al., 2015).
Other factors such as altitude (Dang et al., 2008) and poor socio-economic conditions (Leonard,
1989) may also contribute to child stunting at HA. Retarded growth, height, weight and BMI in
early life may lead to the development of CVD in later life (Barker, Osmond, Forsén, Kajantie,
& Eriksson, 2005; van Rooyen et al., 2005).
The high fat intake of Tibetan populations confers risk for CVD health. A worldwide
longitudinal modeling study comprising data from 124 countries over the period 1980 to 2009
showed that availability of meat and dairy products as a proportion of the diet was independently
and strongly associated with IHD mortality in adults (Green, Sutherland, Dangour, Shankar, &
Webb, 2016).
39
Conclusion
HA natives have dietary habits that are associated with poor nutrition, possibly contributing to
CVD risk. In addition to the limited food options because of the harsh weather and altitude, lack
of proper utilization of available nutritional options is also important. A high risk of CVD due to
the high intake of salt and a high-fat diet may be particularly relevant to HA populations of
Tibetan ancestry.
2.5 Electrocardiographic abnormalities at high altitude
The most common ECG abnormalities in HA populations are right axis deviation (RAD), right
bundle branch block (RBBB), and right ventricular hypertrophy (RVH). Research carried out on
ECG abnormalities in HA residents reports a right-ward shift of the QRS frontal plane axis
during both acute and chronic exposure to HA. RAD increased with increasing altitude levels in
a Bolivian study, with mean levels of deviation of: +39 at 400 m, +70 at 3800 m, and +104 at
4780 m (Raynaud, Valeix, Drouet, Escourrou, & Durand, 1981). Another study comparing mean
RAD among residents aged 13 to 20 years at different altitude levels reported +55 at sea level,
+67 at 1600 m, +83 at 3100 m, and +125 at 4500 m (Pryor, Weaver, & Blount, 1965). A
Peruvian study on children aged up to 14 years showed that RAD was frequently observed at
4540 m compared to their sea level counterparts (Peñaloza, Gamboa, Dyer, Echevarría, &
Marticorena, 1960).
RAD is also commonly reported during short-term exposure to HA and in studies conducted in
simulated HA chambers. For example, in a hypobaric chamber study, frontal plane QRS axis of
eight volunteers deviated right-ward from +55 at sea level to +107 at a barometric pressure
equivalent to that at 8848 m during the exposure of 40 days (Malconian et al., 1990). Another
hypobaric chamber study in India reported that 15% of the 200 LA residents, when exposed to
barometric pressure equivalent to 4500 m, showed a rise in RAD of between +20 and +30
during just 45 minutes of exposure (Akhtar, Bandopadhaya, Chatterjee, & Krishnamurti, 1978).
RAD increased by more than 10 compared to RAD at sea level for more than half of 202 Indian
soldiers deployed at 3600 m and 4200 m for around two years, but this change completely
reversed in the majority of them within a month of returning to sea level (Kapoor, 1984).
40
Studies report frequent occurrence of RVH and RBBB in HA residents. In a study of 74 men the
prevalence of RVH was 17% in Tibetans and 29% in Han natives living at 3658 m in Tibet
(Halperin, Sun, Zhuang, Droma, & Moore, 1998). In another study among 120 healthy men
living at 4540 m in Peru, the prevalence was 19.2% for RVH and 30.8% for RBBB (Rotta &
Lopez, 1959). However, an Indian study of 984 healthy Tibetan participants living at 2745 m
reported a prevalence of RVH of just 0.9% (Kaushal, DasGupta, Prashar, & Bhardwaj, 1995). A
similar phenomenon of right heart burden has also been reported during short-term exposure to
HA. For example, RSR pattern in ECG suggestive of RBBB was reported among 26% of 19
members of an American Medical Research Expedition to Mount Everest (Karliner, Sarnquist,
Graber, Peters, & West, 1985). A sign of right ventricular overload was observed in all 10
participants, usually residents at sea level, during their one-year stay at an altitude of 4540 m in
Peru (Peñaloza & Echevarría, 1957).
The main reason for right heart abnormalities during acute or chronic exposure to HA is likely to
be hypoxia-induced increases in pulmonary vascular resistance and pulmonary HT. Depending
on the levels of HA, pulmonary vascular resistance is reported to increase, perhaps by between
100% and 500% of baseline levels (Swenson, 2013). The magnitude and nature of the changes in
pulmonary vascular resistance and right heart abnormalities vary in different HA populations.
For example, pulmonary vascular resistance and pulmonary HT are well reported as being at a
higher level among HA dwellers such as Andeans or North Americans (Pryor et al., 1965; Rotta
& Lopez, 1959) but at a lower level in those with high degree of adaptation such as Tibetans
(Groves et al., 1993; M. Gupta, Rao, Anand, Banerjee, & Boparai, 1992). This may suggest that
natural selection of genetic traits providing protection from pulmonary vascular resistance might
have occurred for populations with longer generational history at HA, such as Tibetans.
41
2.6 Cardiovascular disease and risk factors in Nepal
Cardiovascular diseases are the most common non-communicable diseases (NCDs) in Nepal
(Vaidya, 2011). According to the WHO NCDs country profile 2011, CHD is the single most
common cause of premature deaths in Nepal, responsible for 14.2% of all deaths with an age-
standardized mortality rate of 152.6 per 100,000 population; stroke (age-standardized mortality
rate of 82.6 per 100,000) and HT (age-standardized mortality of 40.4 per 100,000) being the
third and fifth top causes of mortality respectively (World Health Organization, 2011). The
annual death rate per 100,000 from CVDs and diabetes combined was estimated to be 400.2 per
100,000 for men and 301.3 per 100,000 for women (World Health Organization, 2011). The
number of patients treated at the Shahid Gangalal National Heart Centre, the only government
heart specialty hospital in Nepal, doubled between 2001 and 2008 (Shahid Gangalal National
Heart Centre, 2008). A hospital-based cross-sectional study across 31 health institutions in Nepal
reported that 40% of the hospital admissions among patients aged 35 years or older were related
to CVD (Nepal Health Research Council, 2010). CVD is a substantial and growing public health
problem in Nepal.
There are few large-scale representative studies of CVD in Nepal. The first case of MI in Nepal
was documented in 1945 (Maskey, Sayami, & Pandey, 2003). A further 150 cases were
identified between 1960 and 1968; 81.3% were smokers, 28% were hypertensives, 25.4% had
hypercholesterolemia, and 14.3% were diabetics (Pandey, 1970). In 2003 an estimate based on
hospital data was that 5% of the adult population in Kathmandu had IHD (Maskey et al., 2003).
A population-based cross-sectional study of 1000 men aged 35 years or older using the WHO
Rose angina questionnaire and ECG assessments estimated the prevalence of CHD in this group
was 5.7% (Vaidya et al., 2009). The most significant risk factors identified in that study were
tobacco use and a history of HT. No literature has been published about stroke prevalence in
Nepal. Hospital audits of stroke cases report that ischemic stroke comprises around two-thirds of
all stroke cases, stroke appears more frequently in men, and smoking is likely to be the main
identifiable risk factor (Devkota, Thapa Magar, & Malla, 2006; Oli & Agrawal, 2001; A.
Shrestha, Shah, Adhikari, Sapkota, & Regmi, 2011). An analysis of hospital data of stroke cases
collected over five years reported that 15.3% of all stroke patients were below 45 years of age.
This suggests that age of stroke onset may be younger in Nepal than in developed nations
42
(Devkota et al., 2006). Rheumatic heart disease (RHD) was a major cause of cardiac-related
admissions, accounting for 22% cases in a specialist hospital (G. P. Bhandari, Angdembe,
Dhimal, Neupane, & Bhusal, 2014). The prevalence of RHD is estimated to be two per 1000
school children in Nepal (Regmi & Wyber, 2013).
Nepalese also have a poor knowledge of heart-related diseases, their symptoms and risk factors.
In a community-based study in two villages near Kathmandu, 60% of the respondents were not
aware of any symptoms of heart attack and just 29.7% knew HT was a major risk factor for CVD
(Vaidya, Aryal, & Krettek, 2013).
CVD risk factors in Nepal
HT: HT is the most studied risk factor of CVD in Nepal. A meta-analysis of population-based
HT studies with a sample size of greater than 1000 estimated that nearly one-third (29.7%) of the
adult Nepalese population had HT (SBP/DBP: ≥140/90 mmHg or were on treatment) (Neupane
et al., 2014). A repeat cross-sectional study in the same community showed that the prevalence
of HT increased three-fold over 25 years, from 6% in 1981 to 18% in 2006, using old WHO
criteria for HT (SBP/DBP: ≥160/95 mmHg) (Vaidya, Pathak, & Pandey, 2012). Increased intake
of salt and higher BMI were blamed for this rising trend. The growing prevalence of HT in Nepal
was also corroborated by nationally representative NCD risk factors surveys of the population
aged 15 years or older, which have noted the prevalence of HT increasing from 21.5% in 2007
(Ministry of Health and Population, Government of Nepal, Society for Local Integrated
Development Nepal (SOLID Nepal), & WHO, 2008) to 25.7% in 2013 (K. K. Aryal et al., 2014).
A huge unmet need for effective prevention and treatment of HT has been demonstrated by a
nationally representative study, which showed 90% of participants with elevated levels of BP
were not receiving any treatment (K. K. Aryal et al., 2014).
Obesity: Although population-based studies of overweight or obesity have been sparse in Nepal,
trend analysis clearly indicates the rapid escalation of prevalence in recent years. Nationally
representative studies noted that the prevalence of obesity (BMI ≥30 kg/m2) was 1.7% in 2007
(Ministry of Health and Population et al., 2008) but increased by more than double in 2013 to
4% (K. K. Aryal et al., 2014). The prevalence rates for overweight (BMI ≥25 kg/m2) tripled from
7.2% to 21.6% during this period. This is comparable to the nationally representative Nepal
43
demographic health surveys repeated after a 10-year interval, which documented that the
prevalence of overweight (BMI ≥25 kg/m2) among women aged between 15 and 49 years rose
from 6.4% in 2001 to 14% in 2011 after adjusting for age, parity and education (Kinnunen &
Neupane, 2014). A large study including 14,425 participants from the community-based
screening programmes in Eastern Nepal reported the prevalence of abdominal obesity at 34.7%
according to the International Diabetes Federation (IDF) criteria for South Asians (WC >90 cm
in men and >80 cm in women) (S. K. Sharma et al., 2011). The prevalence of overweight or
obesity in specific population groups was also reported to be high; for example, 25.9% in school
children from private schools studying in grades 1 to 6 (Koirala, Khatri, Khanal, & Amatya,
2015), 33.4% in civil servants (Simkhada, Poobalan, Simkhada, Amalraj, & Aucott, 2009), and
32.9% in men from the relatively well-off community (Vaidya et al., 2005). All of these studies
identified higher family income and sedentary lifestyle as the main causes for the rise in obesity.
Among Jhaukel-Duwakot Health Demographic Survey site participants, 43.3% had a low level
of physical activity in their daily lives, particularly those with obesity, HT or diabetes (Vaidya &
Krettek, 2014).
Almost all of these studies in Nepal followed the WHO guidelines on BMI classification (World
Health Organisation, 1995). However, in the recent years, ethnicity specific BMI cut-points have
been proposed for non-Caucasian populations. For example, BMI equal to or greater than 23
kg/m2 and 25 kg/m
2 have been recommended as cut-points for overweight and obesity
respectively for Asian Indian population (Misra et al., 2009). While considering these cut-points,
overweight and obesity rates of Nepalese populations in published studies could have been
significantly higher compared to commonly used WHO international classification.
Diabetes: IDF national estimates of diabetes prevalence for Nepal in the population aged
between 20 and 79 years were 1.6% in rural areas and 10.7% in urban areas (International
Diabetes Federation, 2015). Studies on type II diabetes in Nepal report the prevalence ranging
from 4.1% to 9.5% (Mishra, Neupane, Bhandari, Khanal, & Kallestrup, 2015). A meta-analysis
of diabetes studies in Nepal published between 2000 and 2014 with 30,218 subjects suggested
the pooled estimate of type II diabetes prevalence (95% CI) of 8.4% (6.2 to 10.5), and pre-
diabetes (impaired glucose tolerance) of 10.3% (6.1 to 14.4) (Gyawali et al., 2015). This study
also estimated the pooled prevalence (95% CI) of type II diabetes at 1% (0.7 to 1.3%) in rural
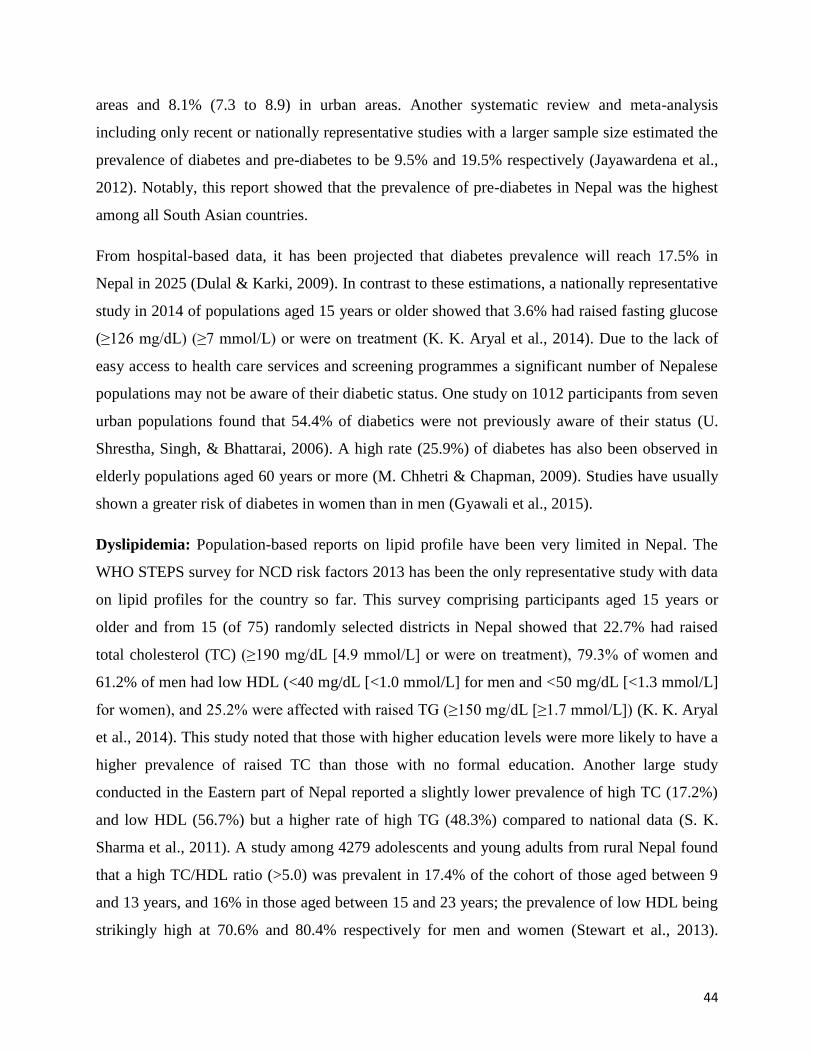
44
areas and 8.1% (7.3 to 8.9) in urban areas. Another systematic review and meta-analysis
including only recent or nationally representative studies with a larger sample size estimated the
prevalence of diabetes and pre-diabetes to be 9.5% and 19.5% respectively (Jayawardena et al.,
2012). Notably, this report showed that the prevalence of pre-diabetes in Nepal was the highest
among all South Asian countries.
From hospital-based data, it has been projected that diabetes prevalence will reach 17.5% in
Nepal in 2025 (Dulal & Karki, 2009). In contrast to these estimations, a nationally representative
study in 2014 of populations aged 15 years or older showed that 3.6% had raised fasting glucose
(≥126 mg/dL) (≥7 mmol/L) or were on treatment (K. K. Aryal et al., 2014). Due to the lack of
easy access to health care services and screening programmes a significant number of Nepalese
populations may not be aware of their diabetic status. One study on 1012 participants from seven
urban populations found that 54.4% of diabetics were not previously aware of their status (U.
Shrestha, Singh, & Bhattarai, 2006). A high rate (25.9%) of diabetes has also been observed in
elderly populations aged 60 years or more (M. Chhetri & Chapman, 2009). Studies have usually
shown a greater risk of diabetes in women than in men (Gyawali et al., 2015).
Dyslipidemia: Population-based reports on lipid profile have been very limited in Nepal. The
WHO STEPS survey for NCD risk factors 2013 has been the only representative study with data
on lipid profiles for the country so far. This survey comprising participants aged 15 years or
older and from 15 (of 75) randomly selected districts in Nepal showed that 22.7% had raised
total cholesterol (TC) (≥190 mg/dL [4.9 mmol/L] or were on treatment), 79.3% of women and
61.2% of men had low HDL (<40 mg/dL [<1.0 mmol/L] for men and <50 mg/dL [<1.3 mmol/L]
for women), and 25.2% were affected with raised TG (≥150 mg/dL [≥1.7 mmol/L]) (K. K. Aryal
et al., 2014). This study noted that those with higher education levels were more likely to have a
higher prevalence of raised TC than those with no formal education. Another large study
conducted in the Eastern part of Nepal reported a slightly lower prevalence of high TC (17.2%)
and low HDL (56.7%) but a higher rate of high TG (48.3%) compared to national data (S. K.
Sharma et al., 2011). A study among 4279 adolescents and young adults from rural Nepal found
that a high TC/HDL ratio (>5.0) was prevalent in 17.4% of the cohort of those aged between 9
and 13 years, and 16% in those aged between 15 and 23 years; the prevalence of low HDL being
strikingly high at 70.6% and 80.4% respectively for men and women (Stewart et al., 2013).
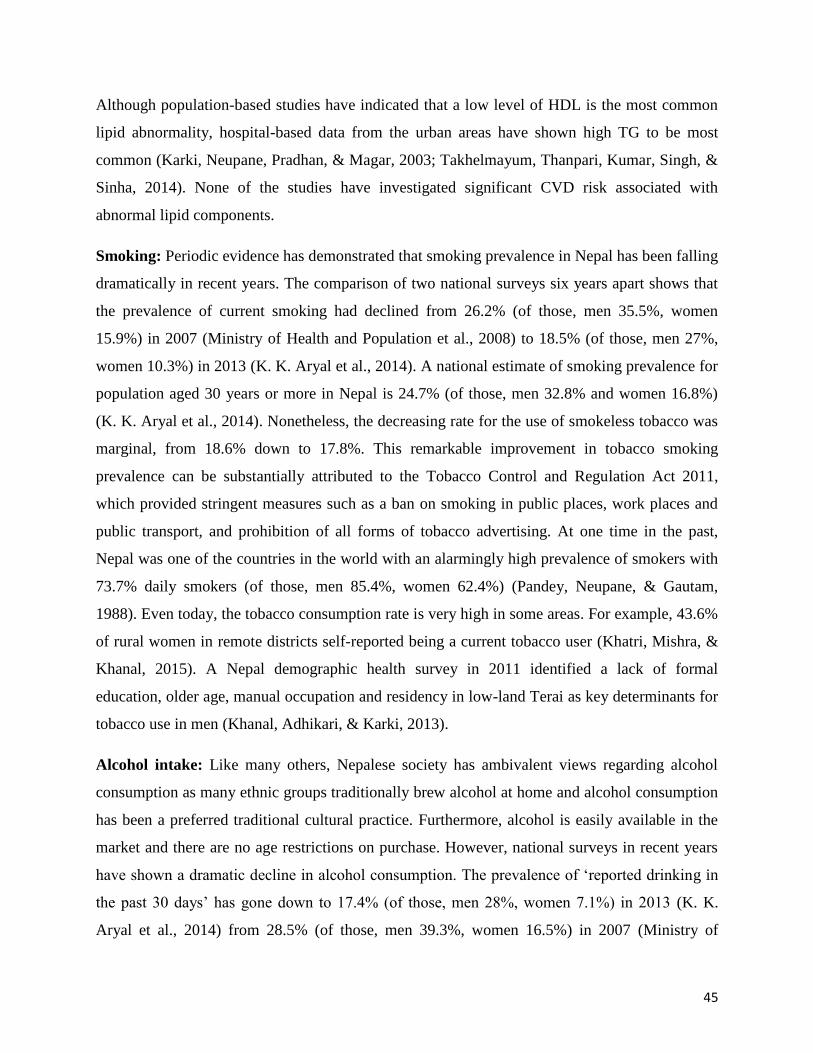
45
Although population-based studies have indicated that a low level of HDL is the most common
lipid abnormality, hospital-based data from the urban areas have shown high TG to be most
common (Karki, Neupane, Pradhan, & Magar, 2003; Takhelmayum, Thanpari, Kumar, Singh, &
Sinha, 2014). None of the studies have investigated significant CVD risk associated with
abnormal lipid components.
Smoking: Periodic evidence has demonstrated that smoking prevalence in Nepal has been falling
dramatically in recent years. The comparison of two national surveys six years apart shows that
the prevalence of current smoking had declined from 26.2% (of those, men 35.5%, women
15.9%) in 2007 (Ministry of Health and Population et al., 2008) to 18.5% (of those, men 27%,
women 10.3%) in 2013 (K. K. Aryal et al., 2014). A national estimate of smoking prevalence for
population aged 30 years or more in Nepal is 24.7% (of those, men 32.8% and women 16.8%)
(K. K. Aryal et al., 2014). Nonetheless, the decreasing rate for the use of smokeless tobacco was
marginal, from 18.6% down to 17.8%. This remarkable improvement in tobacco smoking
prevalence can be substantially attributed to the Tobacco Control and Regulation Act 2011,
which provided stringent measures such as a ban on smoking in public places, work places and
public transport, and prohibition of all forms of tobacco advertising. At one time in the past,
Nepal was one of the countries in the world with an alarmingly high prevalence of smokers with
73.7% daily smokers (of those, men 85.4%, women 62.4%) (Pandey, Neupane, & Gautam,
1988). Even today, the tobacco consumption rate is very high in some areas. For example, 43.6%
of rural women in remote districts self-reported being a current tobacco user (Khatri, Mishra, &
Khanal, 2015). A Nepal demographic health survey in 2011 identified a lack of formal
education, older age, manual occupation and residency in low-land Terai as key determinants for
tobacco use in men (Khanal, Adhikari, & Karki, 2013).
Alcohol intake: Like many others, Nepalese society has ambivalent views regarding alcohol
consumption as many ethnic groups traditionally brew alcohol at home and alcohol consumption
has been a preferred traditional cultural practice. Furthermore, alcohol is easily available in the
market and there are no age restrictions on purchase. However, national surveys in recent years
have shown a dramatic decline in alcohol consumption. The prevalence of ‘reported drinking in
the past 30 days’ has gone down to 17.4% (of those, men 28%, women 7.1%) in 2013 (K. K.
Aryal et al., 2014) from 28.5% (of those, men 39.3%, women 16.5%) in 2007 (Ministry of
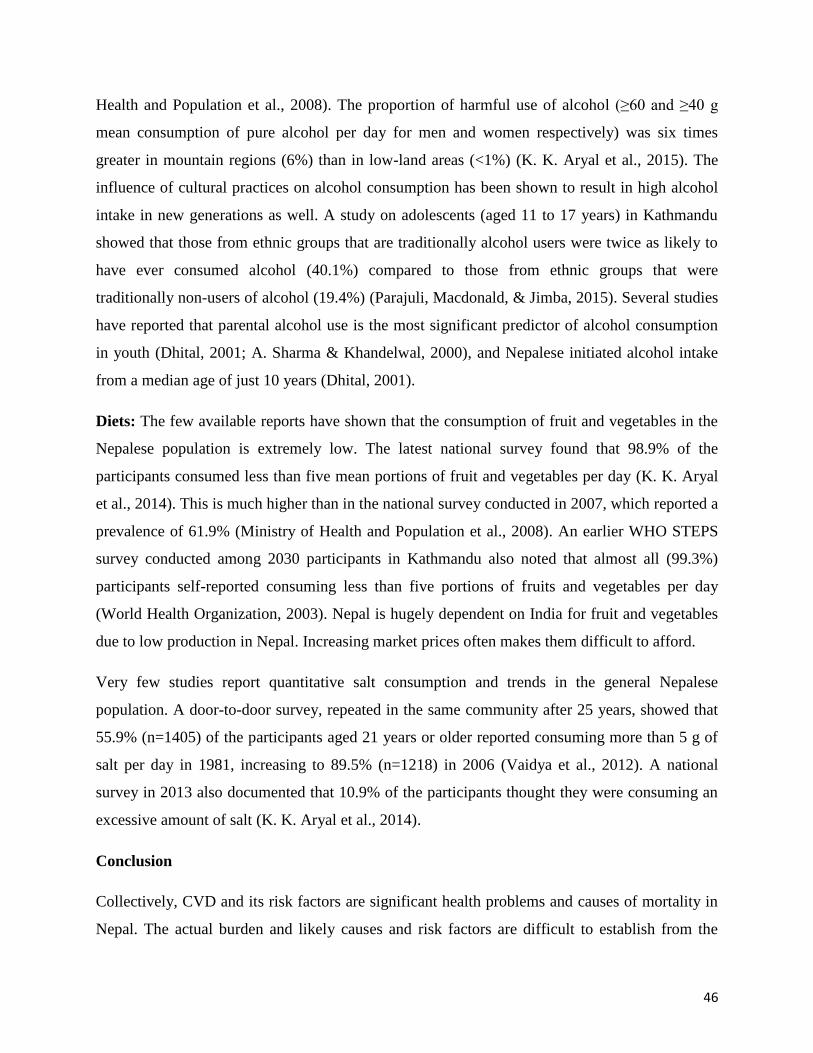
46
Health and Population et al., 2008). The proportion of harmful use of alcohol (≥60 and ≥40 g
mean consumption of pure alcohol per day for men and women respectively) was six times
greater in mountain regions (6%) than in low-land areas (<1%) (K. K. Aryal et al., 2015). The
influence of cultural practices on alcohol consumption has been shown to result in high alcohol
intake in new generations as well. A study on adolescents (aged 11 to 17 years) in Kathmandu
showed that those from ethnic groups that are traditionally alcohol users were twice as likely to
have ever consumed alcohol (40.1%) compared to those from ethnic groups that were
traditionally non-users of alcohol (19.4%) (Parajuli, Macdonald, & Jimba, 2015). Several studies
have reported that parental alcohol use is the most significant predictor of alcohol consumption
in youth (Dhital, 2001; A. Sharma & Khandelwal, 2000), and Nepalese initiated alcohol intake
from a median age of just 10 years (Dhital, 2001).
Diets: The few available reports have shown that the consumption of fruit and vegetables in the
Nepalese population is extremely low. The latest national survey found that 98.9% of the
participants consumed less than five mean portions of fruit and vegetables per day (K. K. Aryal
et al., 2014). This is much higher than in the national survey conducted in 2007, which reported a
prevalence of 61.9% (Ministry of Health and Population et al., 2008). An earlier WHO STEPS
survey conducted among 2030 participants in Kathmandu also noted that almost all (99.3%)
participants self-reported consuming less than five portions of fruits and vegetables per day
(World Health Organization, 2003). Nepal is hugely dependent on India for fruit and vegetables
due to low production in Nepal. Increasing market prices often makes them difficult to afford.
Very few studies report quantitative salt consumption and trends in the general Nepalese
population. A door-to-door survey, repeated in the same community after 25 years, showed that
55.9% (n=1405) of the participants aged 21 years or older reported consuming more than 5 g of
salt per day in 1981, increasing to 89.5% (n=1218) in 2006 (Vaidya et al., 2012). A national
survey in 2013 also documented that 10.9% of the participants thought they were consuming an
excessive amount of salt (K. K. Aryal et al., 2014).
Conclusion
Collectively, CVD and its risk factors are significant health problems and causes of mortality in
Nepal. The actual burden and likely causes and risk factors are difficult to establish from the
47
current literature. However, available evidence suggests that the rates of HT, obesity and
diabetes have been increasing over time and a significant proportion of the population has
undiagnosed disease and risk factors, and is unaware of its CVD health-related risk status. A low
level of HDL and low intake of fruit and vegetables may be particular features of CVD risk
factors in Nepal. Tobacco smoking has declined in Nepal recently, which is a positive factor for
CVD prevention. Although alcohol intake is also decreasing, customary practice and social
acceptance of drinking alcohol is a major challenge to healthy lifestyles in Nepal.
48
3 Systematic Literature Review
The purpose of this chapter is to systematically review and summarize the literature for the
associations between: (i) blood pressure (BP), (ii) blood glucose, and (iii) lipid profile; and
altitude. Meta-analyses of the association between BP and blood glucose and living at high
altitude (HA) are also shown. These variables were selected for systematic review and meta-
analysis because they are the key cardiovascular disease (CVD) risk factors that have direct
impact from hypobaric hypoxic conditions of HA.
3.1 Blood pressure and hypertension at high altitude
Hypertension (HT) is an important risk factor for adverse health outcomes such as stroke and
myocardial infarction (MI) and contributes globally to an estimated 9.4 million deaths and 7% of
disease burden annually (Lim et al., 2012). Depending on the definition used, HT affects
between 20% and 30% of the global population (Asia Pacific Cohort Studies Collaboration,
2003; Prospective Studies Collaboration, 2002). The world-wide prevalence of HT is likely to
rise with time, in part because of the ageing of the global population but also because of the
increasing prevalence of obesity. One estimate is that the current prevalence will increase from
26.4% currently to 29.2% by 2025 (Kearney et al., 2005). Regardless of any threshold,
increasing BP has a graded relationship with the risk of CVD. One estimate is that for each
increment of 20 mmHg in systolic blood pressure (SBP) or 10 mmHg in diastolic blood pressure
(DBP) the risk of CVD doubles across the entire range of BP from 115/75 mmHg to 185/115
mmHg, even in the absence of other risk factors (Prospective Studies Collaboration, 2002).
The effect of chronic hypoxic hypobaric conditions, induced by living at HA, on BP is uncertain
and may vary in different populations. Research on this relationship and other cardiopulmonary
changes at HA has been ongoing for more than 50 years (Ostadal & Kolar, 2007), without a
clear-cut resolution on whether the relationship between BP and HT and HA is causal, or a result
of coincident lifestyle factors. An inverse association between altitude and systemic BP may be
due to, separately or in combination with, structural changes in vasculature; and a number of
socio-cultural, biological, chemical and physical factors (León-Velarde et al., 1993; Ruiz &
Penaloza, 1977). However, the possible benefit from altitude related hypoxia on systemic BP
may diminish when genetic and lifestyle related risk factors become dominant, as seen in Tibetan
49
origin populations (Gesang et al., 2002; Mingji et al., 2015). An increased amount of smooth
muscle cells in the distal pulmonary arteries in those living at HA may directly increase
pulmonary BP (Arias-Stella, 1966). This may not be true for all HA residents, such as Tibetans
and Ethiopians, possibly because of the higher levels of exhaled nitric oxide compared with
Andeans or low altitude (LA) populations, suggesting different, possibly ancestry-based,
physiological responses to HA (Beall, 2007; Beall et al., 2001).
This section of the literature review is a systematic review and meta-analysis that aims to
estimate the association between BP and HT and altitude in adults permanently living at HA.
This has been published in a peer-reviewed journal.
Methods
This section comprises a systematic review and meta-analysis.
Study inclusion and exclusion criteria
Inclusion criteria for the systematic review were: studies of BP and/or HT in populations living
at an altitude of greater than or equal to 2400 metre (m), with a minimum sample size of 100
permanent residents, and in those aged 18 years or older. Only English language articles
available in the full text were included. Studies on patients, not at population level, and not
denoting the specific altitude level, were excluded. The search was completed on 1 December
2014.
Search and selection methods
A search was conducted in three major biomedical databases: PubMed, OvidSP (MedLine and
EMBASE) and Scopus. The search terms: ‘blood pressure’ or ‘hypertension’, were combined
with the words ‘altitude’ or ‘mountain’ or ‘himalaya’ or ‘highland’. These combinations were
also assessed along with the names of major populations at HA: ‘Tibetans’ and ‘Andeans’, and
the names of seven South American countries with HA areas – 'Bolivia', 'Chile', 'Colombia',
'Ecuador', 'Mexico', 'Peru', and 'Venezuela'. Studies were searched by title and/or abstract. In
addition, reference lists from identified articles were scrutinized to find relevant published
articles. The studies that published data on SBP and DBP or prevalence of HT were considered.
The flow diagram for the article selection process is shown in Figure 3.1.
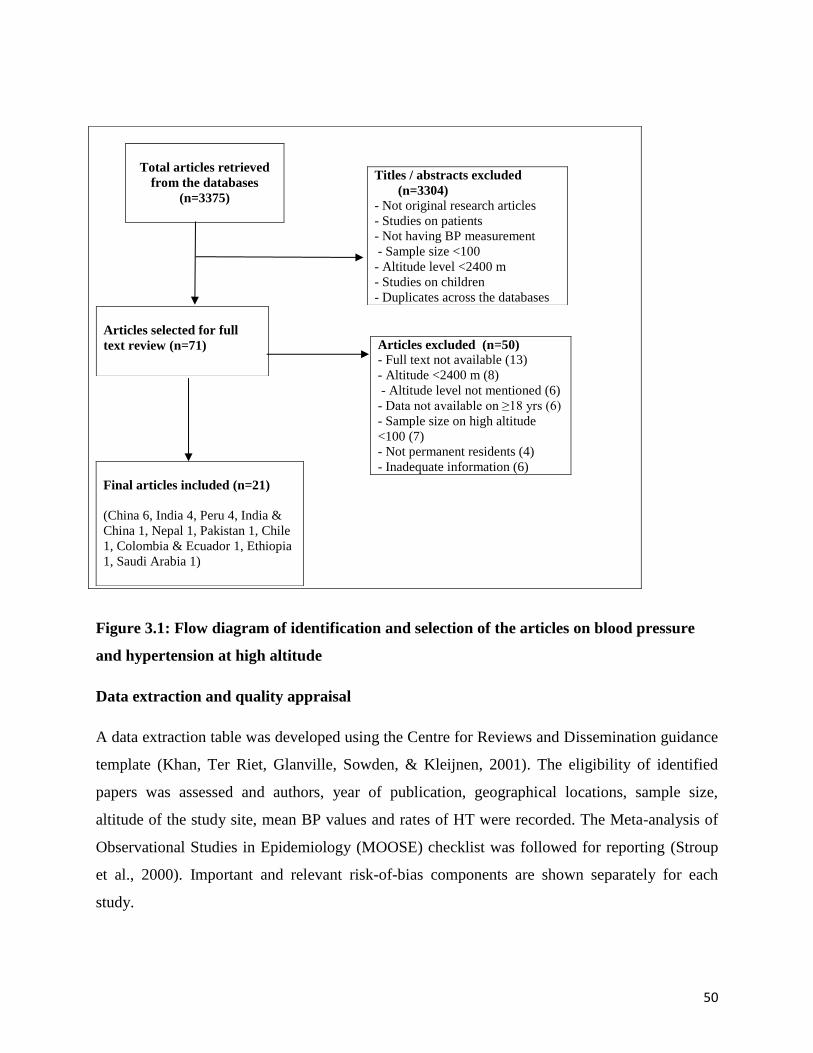
50
Figure 3.1: Flow diagram of identification and selection of the articles on blood pressure
and hypertension at high altitude
Data extraction and quality appraisal
A data extraction table was developed using the Centre for Reviews and Dissemination guidance
template (Khan, Ter Riet, Glanville, Sowden, & Kleijnen, 2001). The eligibility of identified
papers was assessed and authors, year of publication, geographical locations, sample size,
altitude of the study site, mean BP values and rates of HT were recorded. The Meta-analysis of
Observational Studies in Epidemiology (MOOSE) checklist was followed for reporting (Stroup
et al., 2000). Important and relevant risk-of-bias components are shown separately for each
study.
Titles / abstracts excluded
(n=3304)
- Not original research articles
- Studies on patients
- Not having BP measurement
- Sample size <100
- Altitude level <2400 m
- Studies on children
- Duplicates across the databases
Total articles retrieved
from the databases
(n=3375)
Articles selected for full
text review (n=71)
Articles excluded (n=50)
- Full text not available (13)
- Altitude <2400 m (8)
- Altitude level not mentioned (6)
- Data not available on ≥18 yrs (6)
- Sample size on high altitude
<100 (7)
- Not permanent residents (4)
- Inadequate information (6)
Final articles included (n=21)
(China 6, India 4, Peru 4, India &
China 1, Nepal 1, Pakistan 1, Chile
1, Colombia & Ecuador 1, Ethiopia
1, Saudi Arabia 1)
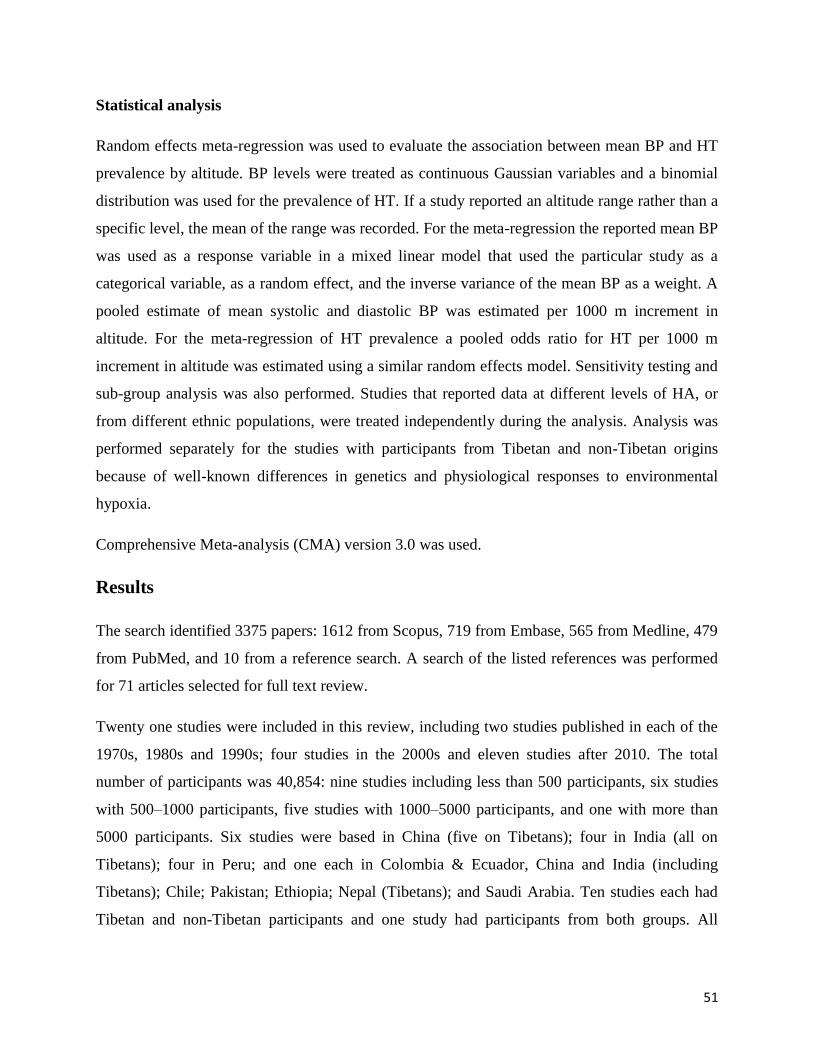
51
Statistical analysis
Random effects meta-regression was used to evaluate the association between mean BP and HT
prevalence by altitude. BP levels were treated as continuous Gaussian variables and a binomial
distribution was used for the prevalence of HT. If a study reported an altitude range rather than a
specific level, the mean of the range was recorded. For the meta-regression the reported mean BP
was used as a response variable in a mixed linear model that used the particular study as a
categorical variable, as a random effect, and the inverse variance of the mean BP as a weight. A
pooled estimate of mean systolic and diastolic BP was estimated per 1000 m increment in
altitude. For the meta-regression of HT prevalence a pooled odds ratio for HT per 1000 m
increment in altitude was estimated using a similar random effects model. Sensitivity testing and
sub-group analysis was also performed. Studies that reported data at different levels of HA, or
from different ethnic populations, were treated independently during the analysis. Analysis was
performed separately for the studies with participants from Tibetan and non-Tibetan origins
because of well-known differences in genetics and physiological responses to environmental
hypoxia.
Comprehensive Meta-analysis (CMA) version 3.0 was used.
Results
The search identified 3375 papers: 1612 from Scopus, 719 from Embase, 565 from Medline, 479
from PubMed, and 10 from a reference search. A search of the listed references was performed
for 71 articles selected for full text review.
Twenty one studies were included in this review, including two studies published in each of the
1970s, 1980s and 1990s; four studies in the 2000s and eleven studies after 2010. The total
number of participants was 40,854: nine studies including less than 500 participants, six studies
with 500–1000 participants, five studies with 1000–5000 participants, and one with more than
5000 participants. Six studies were based in China (five on Tibetans); four in India (all on
Tibetans); four in Peru; and one each in Colombia & Ecuador, China and India (including
Tibetans); Chile; Pakistan; Ethiopia; Nepal (Tibetans); and Saudi Arabia. Ten studies each had
Tibetan and non-Tibetan participants and one study had participants from both groups. All
52
studies were cross-sectional. The altitude level ranged from 2438 to 4300 m. The key features of
the selected studies are shown in Table 3.1.
Table 3.2 shows the risk of bias of each study, including sampling process, HT cut-points, BP
measuring devices, number of BP readings, and body position during BP measurements. Briefly,
participants were randomly selected in eleven studies, non-randomly in six studies, completely
surveyed in two studies, and the sampling process was unclear in two studies. Fourteen studies
reported the prevalence of HT, of which eleven used a cut-off point of greater than or equal to
140/90 mmHg, one considered a cut-point of greater than or equal to 130/85 mmHg, while two
older studies adopted the cut point of greater than or equal to 160/95 mmHg for HT. The
measurement device for BP was a standard mercury sphygmomanometer in ten studies, an
aneroid sphygmomanometer in one study, an automated device in five studies, and the BP
measuring device was unclear in five studies. Two readings of BP were taken and mean value
was considered in seven studies, three readings were taken in four studies, and the number of
readings was not mentioned in seven studies. In two studies, a second reading was only
considered if HT was observed in the first reading. One study repeatedly measured BP until
readings were stable within 2 to 3 mmHg. Body position during the BP measurements was sitting
in 14 studies, supine in one study, and unclear in six studies.
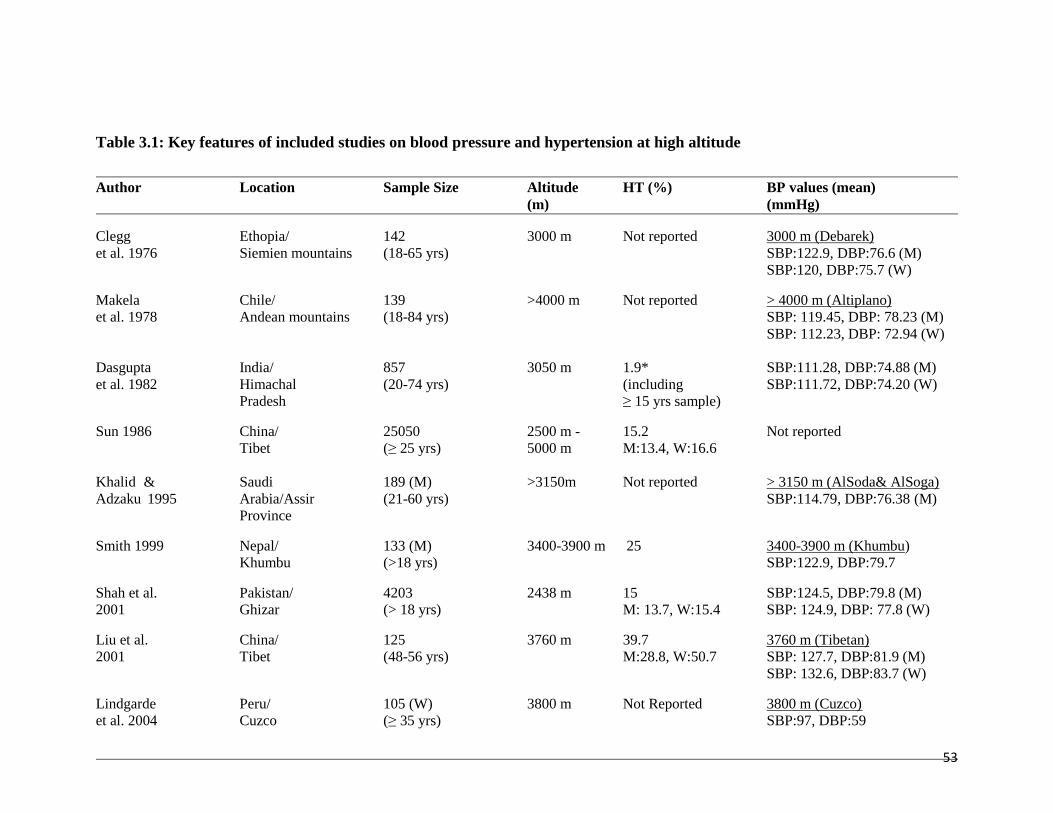
53
Author Location Sample Size Altitude HT (%) BP values (mean)
(m) (mmHg)
Clegg Ethopia/ 142 3000 m Not reported 3000 m (Debarek)
et al. 1976 Siemien mountains (18-65 yrs) SBP:122.9, DBP:76.6 (M)
SBP:120, DBP:75.7 (W)
Makela Chile/ 139 >4000 m Not reported > 4000 m (Altiplano)
et al. 1978 Andean mountains (18-84 yrs) SBP: 119.45, DBP: 78.23 (M)
SBP: 112.23, DBP: 72.94 (W)
Dasgupta India/ 857 3050 m 1.9* SBP:111.28, DBP:74.88 (M)
et al. 1982 Himachal (20-74 yrs) (including SBP:111.72, DBP:74.20 (W)
Pradesh ≥ 15 yrs sample)
Sun 1986 China/ 25050 2500 m - 15.2 Not reported
Tibet (≥ 25 yrs) 5000 m M:13.4, W:16.6
Khalid & Saudi 189 (M) >3150m Not reported > 3150 m (AlSoda& AlSoga)
Adzaku 1995 Arabia/Assir (21-60 yrs) SBP:114.79, DBP:76.38 (M)
Province
Smith 1999 Nepal/ 133 (M) 3400-3900 m 25 3400-3900 m (Khumbu)
Khumbu (>18 yrs) SBP:122.9, DBP:79.7
Shah et al. Pakistan/ 4203 2438 m 15 SBP:124.5, DBP:79.8 (M)
2001 Ghizar (> 18 yrs) M: 13.7, W:15.4 SBP: 124.9, DBP: 77.8 (W)
Liu et al. China/ 125 3760 m 39.7 3760 m (Tibetan)
2001 Tibet (48-56 yrs) M:28.8, W:50.7 SBP: 127.7, DBP:81.9 (M)
SBP: 132.6, DBP:83.7 (W)
Lindgarde Peru/ 105 (W) 3800 m Not Reported 3800 m (Cuzco)
et al. 2004 Cuzco (≥ 35 yrs) SBP:97, DBP:59
Table 3.1: Key features of included studies on blood pressure and hypertension at high altitude
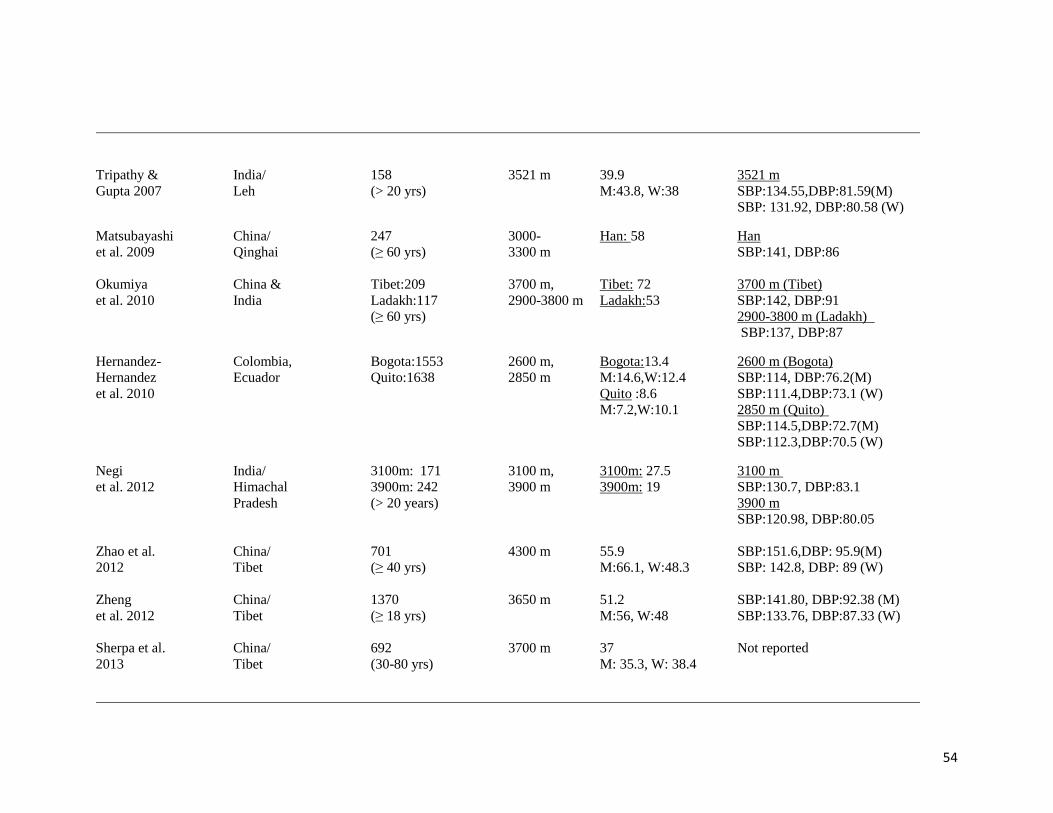
54
Tripathy & India/ 158 3521 m 39.9 3521 m
Gupta 2007 Leh (> 20 yrs) M:43.8, W:38 SBP:134.55,DBP:81.59(M)
SBP: 131.92, DBP:80.58 (W)
Matsubayashi China/ 247 3000- Han: 58 Han
et al. 2009 Qinghai (≥ 60 yrs) 3300 m SBP:141, DBP:86
Okumiya China & Tibet:209 3700 m, Tibet: 72 3700 m (Tibet)
et al. 2010 India Ladakh:117 2900-3800 m Ladakh:53 SBP:142, DBP:91
(≥ 60 yrs) 2900-3800 m (Ladakh)
SBP:137, DBP:87
Hernandez- Colombia, Bogota:1553 2600 m, Bogota:13.4 2600 m (Bogota)
Hernandez Ecuador Quito:1638 2850 m M:14.6,W:12.4 SBP:114, DBP:76.2(M)
et al. 2010 Quito :8.6 SBP:111.4,DBP:73.1 (W)
M:7.2,W:10.1 2850 m (Quito)
SBP:114.5,DBP:72.7(M)
SBP:112.3,DBP:70.5 (W)
Negi India/ 3100m: 171 3100 m, 3100m: 27.5 3100 m
et al. 2012 Himachal 3900m: 242 3900 m 3900m: 19 SBP:130.7, DBP:83.1
Pradesh (> 20 years) 3900 m
SBP:120.98, DBP:80.05
Zhao et al. China/ 701 4300 m 55.9 SBP:151.6,DBP: 95.9(M)
2012 Tibet (≥ 40 yrs) M:66.1, W:48.3 SBP: 142.8, DBP: 89 (W)
Zheng China/ 1370 3650 m 51.2 SBP:141.80, DBP:92.38 (M)
et al. 2012 Tibet (≥ 18 yrs) M:56, W:48 SBP:133.76, DBP:87.33 (W)
Sherpa et al. China/ 692 3700 m 37 Not reported
2013 Tibet (30-80 yrs) M: 35.3, W: 38.4
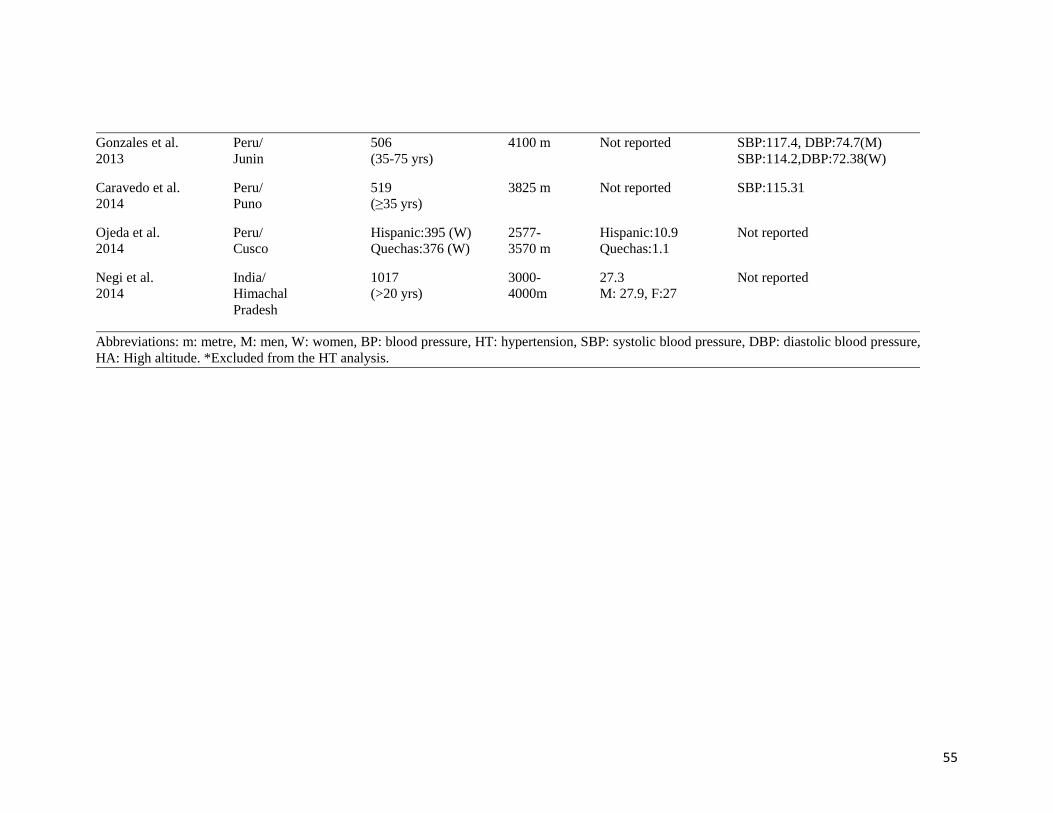
55
Gonzales et al. Peru/ 506 4100 m Not reported SBP:117.4, DBP:74.7(M)
2013 Junin (35-75 yrs) SBP:114.2,DBP:72.38(W)
Caravedo et al. Peru/ 519 3825 m Not reported SBP:115.31
2014 Puno (≥35 yrs)
Ojeda et al. Peru/ Hispanic:395 (W) 2577- Hispanic:10.9 Not reported
2014 Cusco Quechas:376 (W) 3570 m Quechas:1.1
Negi et al. India/ 1017 3000- 27.3 Not reported
2014 Himachal (>20 yrs) 4000m M: 27.9, F:27
Pradesh
Abbreviations: m: metre, M: men, W: women, BP: blood pressure, HT: hypertension, SBP: systolic blood pressure, DBP: diastolic blood pressure,
HA: High altitude. *Excluded from the HT analysis.
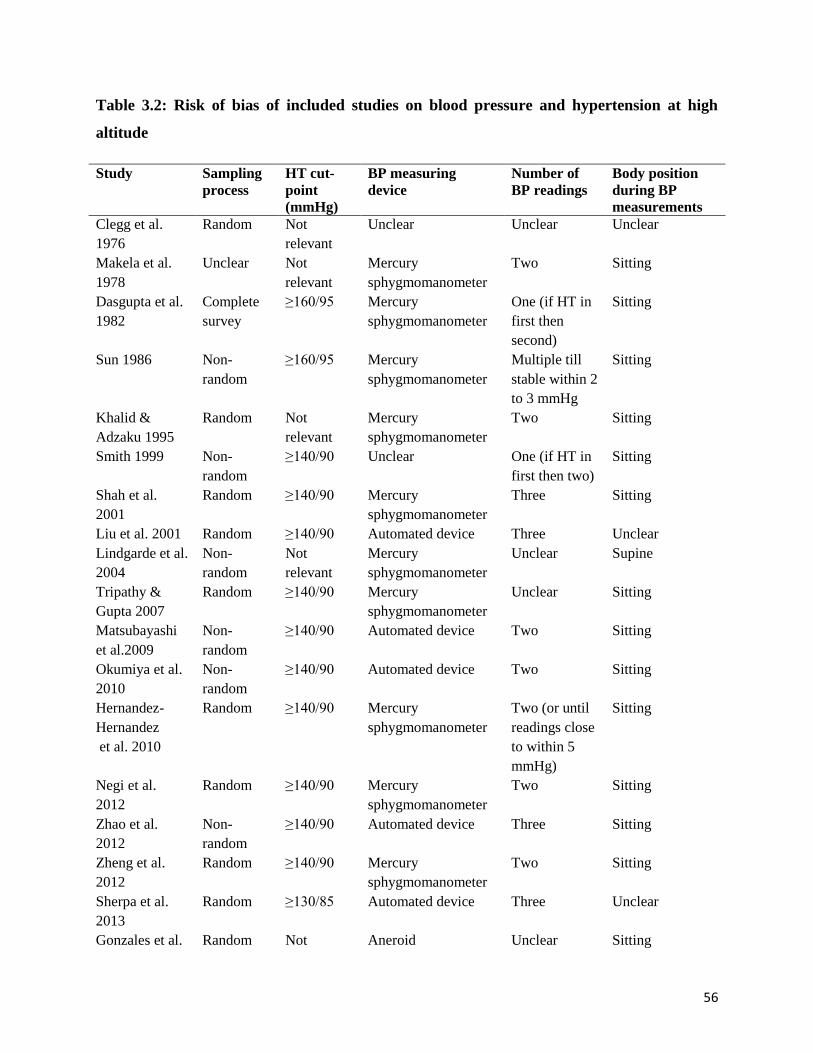
56
Table 3.2: Risk of bias of included studies on blood pressure and hypertension at high
altitude
Study Sampling
process
HT cut-
point
(mmHg)
BP measuring
device
Number of
BP readings
Body position
during BP
measurements
Clegg et al.
1976
Random Not
relevant
Unclear Unclear Unclear
Makela et al.
1978
Unclear Not
relevant
Mercury
sphygmomanometer
Two Sitting
Dasgupta et al.
1982
Complete
survey
≥160/95 Mercury
sphygmomanometer
One (if HT in
first then
second)
Sitting
Sun 1986 Non-
random
≥160/95 Mercury
sphygmomanometer
Multiple till
stable within 2
to 3 mmHg
Sitting
Khalid &
Adzaku 1995
Random Not
relevant
Mercury
sphygmomanometer
Two Sitting
Smith 1999 Non-
random
≥140/90 Unclear One (if HT in
first then two)
Sitting
Shah et al.
2001
Random ≥140/90 Mercury
sphygmomanometer
Three Sitting
Liu et al. 2001 Random ≥140/90 Automated device Three Unclear
Lindgarde et al.
2004
Non-
random
Not
relevant
Mercury
sphygmomanometer
Unclear Supine
Tripathy &
Gupta 2007
Random ≥140/90 Mercury
sphygmomanometer
Unclear Sitting
Matsubayashi
et al.2009
Non-
random
≥140/90 Automated device Two Sitting
Okumiya et al.
2010
Non-
random
≥140/90 Automated device Two Sitting
Hernandez-
Hernandez
et al. 2010
Random ≥140/90 Mercury
sphygmomanometer
Two (or until
readings close
to within 5
mmHg)
Sitting
Negi et al.
2012
Random ≥140/90 Mercury
sphygmomanometer
Two Sitting
Zhao et al.
2012
Non-
random
≥140/90 Automated device Three Sitting
Zheng et al.
2012
Random ≥140/90 Mercury
sphygmomanometer
Two Sitting
Sherpa et al.
2013
Random ≥130/85 Automated device Three Unclear
Gonzales et al. Random Not Aneroid Unclear Sitting
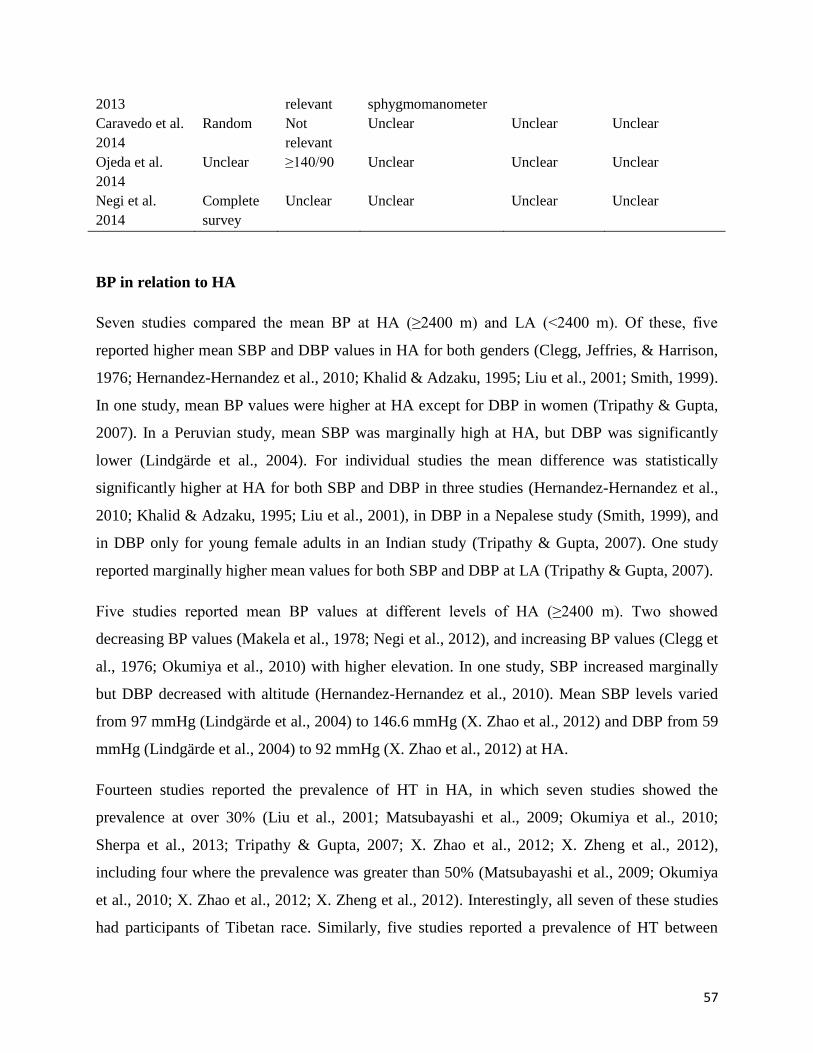
57
2013 relevant sphygmomanometer
Caravedo et al.
2014
Random Not
relevant
Unclear Unclear Unclear
Ojeda et al.
2014
Unclear ≥140/90 Unclear Unclear Unclear
Negi et al.
2014
Complete
survey
Unclear Unclear Unclear Unclear
BP in relation to HA
Seven studies compared the mean BP at HA (≥2400 m) and LA (<2400 m). Of these, five
reported higher mean SBP and DBP values in HA for both genders (Clegg, Jeffries, & Harrison,
1976; Hernandez-Hernandez et al., 2010; Khalid & Adzaku, 1995; Liu et al., 2001; Smith, 1999).
In one study, mean BP values were higher at HA except for DBP in women (Tripathy & Gupta,
2007). In a Peruvian study, mean SBP was marginally high at HA, but DBP was significantly
lower (Lindgärde et al., 2004). For individual studies the mean difference was statistically
significantly higher at HA for both SBP and DBP in three studies (Hernandez-Hernandez et al.,
2010; Khalid & Adzaku, 1995; Liu et al., 2001), in DBP in a Nepalese study (Smith, 1999), and
in DBP only for young female adults in an Indian study (Tripathy & Gupta, 2007). One study
reported marginally higher mean values for both SBP and DBP at LA (Tripathy & Gupta, 2007).
Five studies reported mean BP values at different levels of HA (≥2400 m). Two showed
decreasing BP values (Makela et al., 1978; Negi et al., 2012), and increasing BP values (Clegg et
al., 1976; Okumiya et al., 2010) with higher elevation. In one study, SBP increased marginally
but DBP decreased with altitude (Hernandez-Hernandez et al., 2010). Mean SBP levels varied
from 97 mmHg (Lindgärde et al., 2004) to 146.6 mmHg (X. Zhao et al., 2012) and DBP from 59
mmHg (Lindgärde et al., 2004) to 92 mmHg (X. Zhao et al., 2012) at HA.
Fourteen studies reported the prevalence of HT in HA, in which seven studies showed the
prevalence at over 30% (Liu et al., 2001; Matsubayashi et al., 2009; Okumiya et al., 2010;
Sherpa et al., 2013; Tripathy & Gupta, 2007; X. Zhao et al., 2012; X. Zheng et al., 2012),
including four where the prevalence was greater than 50% (Matsubayashi et al., 2009; Okumiya
et al., 2010; X. Zhao et al., 2012; X. Zheng et al., 2012). Interestingly, all seven of these studies
had participants of Tibetan race. Similarly, five studies reported a prevalence of HT between
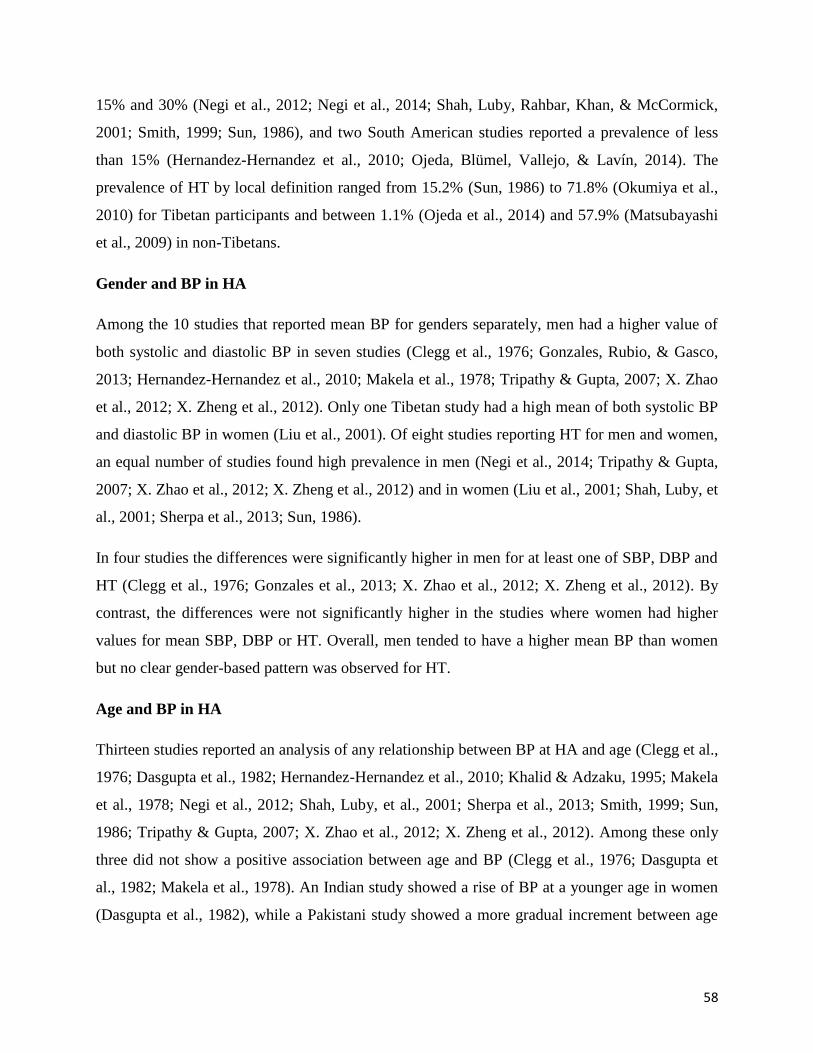
58
15% and 30% (Negi et al., 2012; Negi et al., 2014; Shah, Luby, Rahbar, Khan, & McCormick,
2001; Smith, 1999; Sun, 1986), and two South American studies reported a prevalence of less
than 15% (Hernandez-Hernandez et al., 2010; Ojeda, Blümel, Vallejo, & Lavín, 2014). The
prevalence of HT by local definition ranged from 15.2% (Sun, 1986) to 71.8% (Okumiya et al.,
2010) for Tibetan participants and between 1.1% (Ojeda et al., 2014) and 57.9% (Matsubayashi
et al., 2009) in non-Tibetans.
Gender and BP in HA
Among the 10 studies that reported mean BP for genders separately, men had a higher value of
both systolic and diastolic BP in seven studies (Clegg et al., 1976; Gonzales, Rubio, & Gasco,
2013; Hernandez-Hernandez et al., 2010; Makela et al., 1978; Tripathy & Gupta, 2007; X. Zhao
et al., 2012; X. Zheng et al., 2012). Only one Tibetan study had a high mean of both systolic BP
and diastolic BP in women (Liu et al., 2001). Of eight studies reporting HT for men and women,
an equal number of studies found high prevalence in men (Negi et al., 2014; Tripathy & Gupta,
2007; X. Zhao et al., 2012; X. Zheng et al., 2012) and in women (Liu et al., 2001; Shah, Luby, et
al., 2001; Sherpa et al., 2013; Sun, 1986).
In four studies the differences were significantly higher in men for at least one of SBP, DBP and
HT (Clegg et al., 1976; Gonzales et al., 2013; X. Zhao et al., 2012; X. Zheng et al., 2012). By
contrast, the differences were not significantly higher in the studies where women had higher
values for mean SBP, DBP or HT. Overall, men tended to have a higher mean BP than women
but no clear gender-based pattern was observed for HT.
Age and BP in HA
Thirteen studies reported an analysis of any relationship between BP at HA and age (Clegg et al.,
1976; Dasgupta et al., 1982; Hernandez-Hernandez et al., 2010; Khalid & Adzaku, 1995; Makela
et al., 1978; Negi et al., 2012; Shah, Luby, et al., 2001; Sherpa et al., 2013; Smith, 1999; Sun,
1986; Tripathy & Gupta, 2007; X. Zhao et al., 2012; X. Zheng et al., 2012). Among these only
three did not show a positive association between age and BP (Clegg et al., 1976; Dasgupta et
al., 1982; Makela et al., 1978). An Indian study showed a rise of BP at a younger age in women
(Dasgupta et al., 1982), while a Pakistani study showed a more gradual increment between age
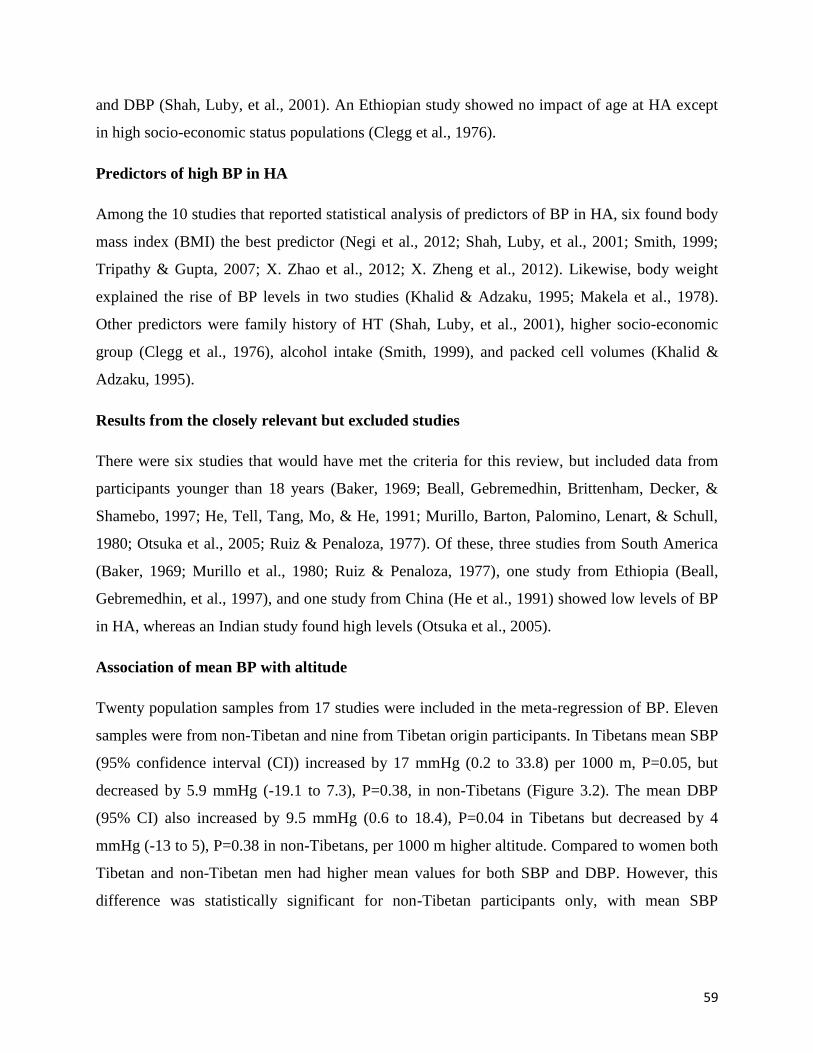
59
and DBP (Shah, Luby, et al., 2001). An Ethiopian study showed no impact of age at HA except
in high socio-economic status populations (Clegg et al., 1976).
Predictors of high BP in HA
Among the 10 studies that reported statistical analysis of predictors of BP in HA, six found body
mass index (BMI) the best predictor (Negi et al., 2012; Shah, Luby, et al., 2001; Smith, 1999;
Tripathy & Gupta, 2007; X. Zhao et al., 2012; X. Zheng et al., 2012). Likewise, body weight
explained the rise of BP levels in two studies (Khalid & Adzaku, 1995; Makela et al., 1978).
Other predictors were family history of HT (Shah, Luby, et al., 2001), higher socio-economic
group (Clegg et al., 1976), alcohol intake (Smith, 1999), and packed cell volumes (Khalid &
Adzaku, 1995).
Results from the closely relevant but excluded studies
There were six studies that would have met the criteria for this review, but included data from
participants younger than 18 years (Baker, 1969; Beall, Gebremedhin, Brittenham, Decker, &
Shamebo, 1997; He, Tell, Tang, Mo, & He, 1991; Murillo, Barton, Palomino, Lenart, & Schull,
1980; Otsuka et al., 2005; Ruiz & Penaloza, 1977). Of these, three studies from South America
(Baker, 1969; Murillo et al., 1980; Ruiz & Penaloza, 1977), one study from Ethiopia (Beall,
Gebremedhin, et al., 1997), and one study from China (He et al., 1991) showed low levels of BP
in HA, whereas an Indian study found high levels (Otsuka et al., 2005).
Association of mean BP with altitude
Twenty population samples from 17 studies were included in the meta-regression of BP. Eleven
samples were from non-Tibetan and nine from Tibetan origin participants. In Tibetans mean SBP
(95% confidence interval (CI)) increased by 17 mmHg (0.2 to 33.8) per 1000 m, P=0.05, but
decreased by 5.9 mmHg (-19.1 to 7.3), P=0.38, in non-Tibetans (Figure 3.2). The mean DBP
(95% CI) also increased by 9.5 mmHg (0.6 to 18.4), P=0.04 in Tibetans but decreased by 4
mmHg (-13 to 5), P=0.38 in non-Tibetans, per 1000 m higher altitude. Compared to women both
Tibetan and non-Tibetan men had higher mean values for both SBP and DBP. However, this
difference was statistically significant for non-Tibetan participants only, with mean SBP
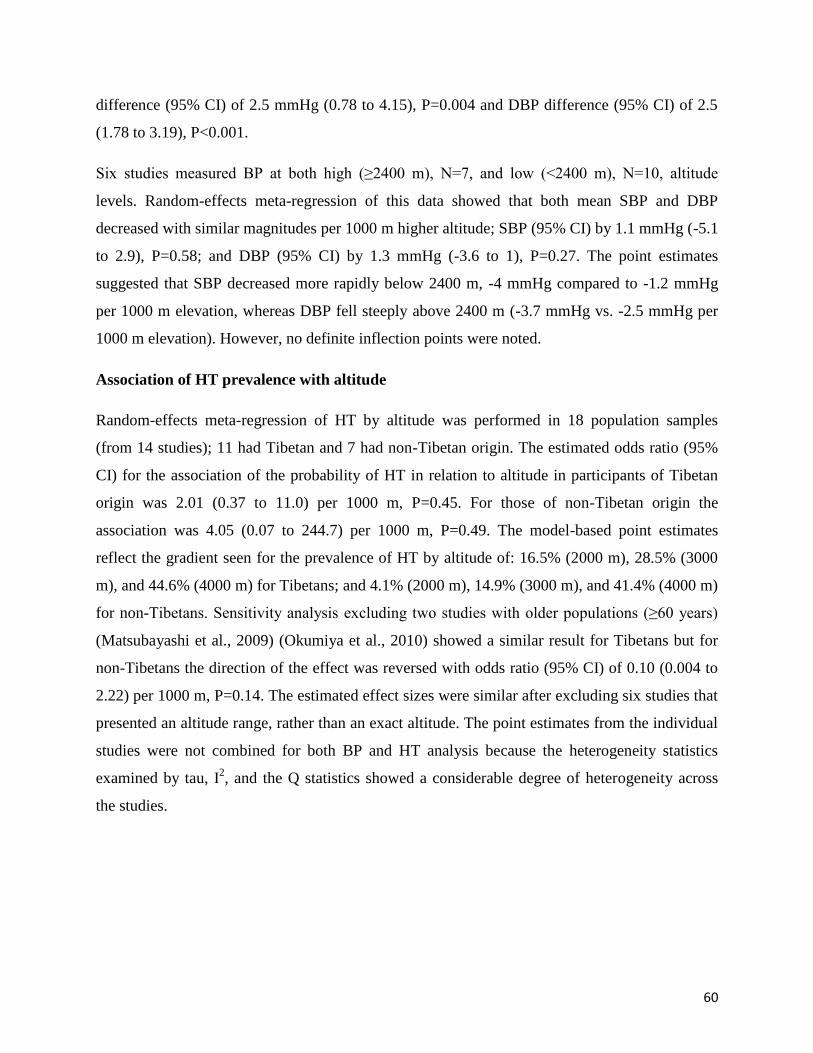
60
difference (95% CI) of 2.5 mmHg (0.78 to 4.15), P=0.004 and DBP difference (95% CI) of 2.5
(1.78 to 3.19), P<0.001.
Six studies measured BP at both high (≥2400 m), N=7, and low (<2400 m), N=10, altitude
levels. Random-effects meta-regression of this data showed that both mean SBP and DBP
decreased with similar magnitudes per 1000 m higher altitude; SBP (95% CI) by 1.1 mmHg (-5.1
to 2.9), P=0.58; and DBP (95% CI) by 1.3 mmHg (-3.6 to 1), P=0.27. The point estimates
suggested that SBP decreased more rapidly below 2400 m, -4 mmHg compared to -1.2 mmHg
per 1000 m elevation, whereas DBP fell steeply above 2400 m (-3.7 mmHg vs. -2.5 mmHg per
1000 m elevation). However, no definite inflection points were noted.
Association of HT prevalence with altitude
Random-effects meta-regression of HT by altitude was performed in 18 population samples
(from 14 studies); 11 had Tibetan and 7 had non-Tibetan origin. The estimated odds ratio (95%
CI) for the association of the probability of HT in relation to altitude in participants of Tibetan
origin was 2.01 (0.37 to 11.0) per 1000 m, P=0.45. For those of non-Tibetan origin the
association was 4.05 (0.07 to 244.7) per 1000 m, P=0.49. The model-based point estimates
reflect the gradient seen for the prevalence of HT by altitude of: 16.5% (2000 m), 28.5% (3000
m), and 44.6% (4000 m) for Tibetans; and 4.1% (2000 m), 14.9% (3000 m), and 41.4% (4000 m)
for non-Tibetans. Sensitivity analysis excluding two studies with older populations (≥60 years)
(Matsubayashi et al., 2009) (Okumiya et al., 2010) showed a similar result for Tibetans but for
non-Tibetans the direction of the effect was reversed with odds ratio (95% CI) of 0.10 (0.004 to
2.22) per 1000 m, P=0.14. The estimated effect sizes were similar after excluding six studies that
presented an altitude range, rather than an exact altitude. The point estimates from the individual
studies were not combined for both BP and HT analysis because the heterogeneity statistics
examined by tau, I2, and the Q statistics showed a considerable degree of heterogeneity across
the studies.
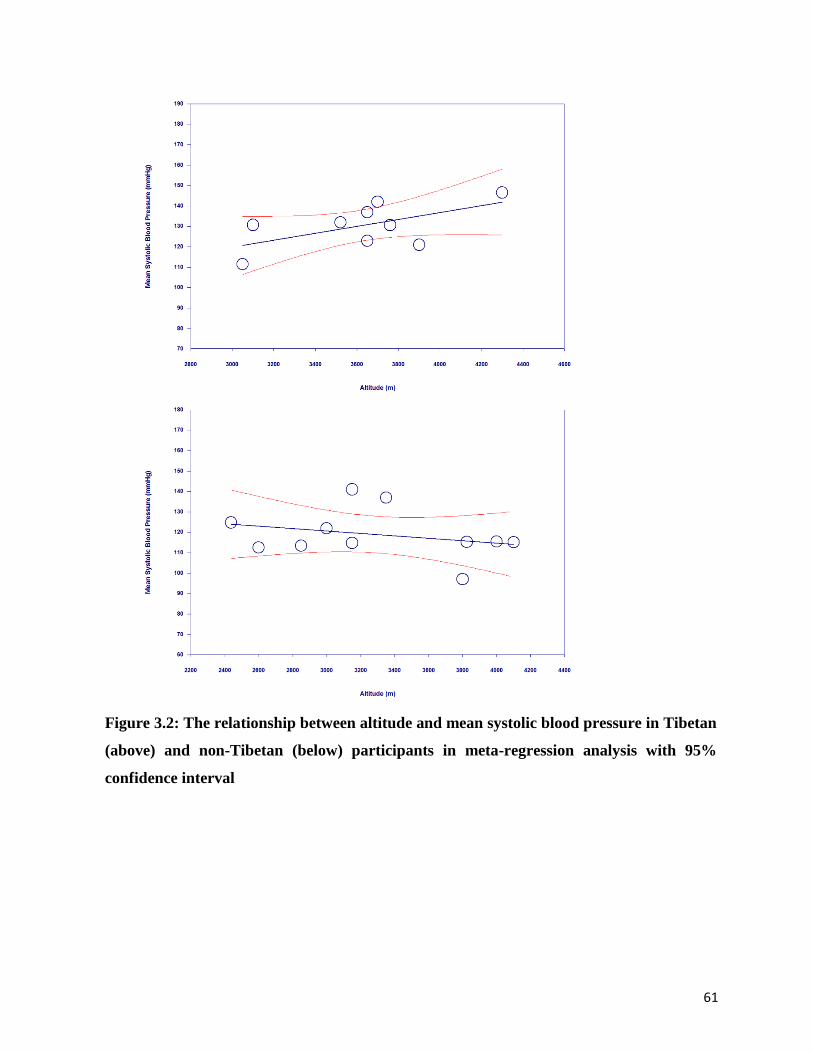
61
Figure 3.2: The relationship between altitude and mean systolic blood pressure in Tibetan
(above) and non-Tibetan (below) participants in meta-regression analysis with 95%
confidence interval
62
Discussion
This systematic review and meta-analysis of adult populations living at HA found weak evidence
of a positive association between SBP and DBP and altitude in participants of Tibetan origin. In
the analysis of non-Tibetan origin participants, both mean SBP and DBP tended to decrease with
elevation, but the associations were not statistically significant. For HT, both Tibetan and non-
Tibetan populations showed increasing prevalence with increasing altitudes. However,
sensitivity analysis by excluding two studies with older participants gave a point estimate
consistent with a reduction in HT prevalence in non-Tibetan participants. Model-based estimates
were that more than a quarter of the Tibetan origin populations and less than 15% of the non-
Tibetan origin populations had HT (by local definitions) at 3000 m. The estimated prevalence of
HT for Tibetan populations at 3000 m is consistent with the estimated global rate of HT in the
general population (Kearney et al., 2005). However, the prevalence is higher at higher altitudes;
e.g., 44.6% for Tibetans at 4000 m. The analysis showed the known association that men have a
higher value of SBP and DBP than women but the prevalence of HT was similar. BMI and body
weight were the best predictors of higher BP in HA residents.
Tibetan and non-Tibetan (mainly Andean) ancestry populations have different physiological
responses to environmental hypoxia and this may be because these populations have different
genetic variants and adaptive phenotypic consequences for HA (Huerta-Sánchez et al., 2013).
Physiological studies in Andean populations show a reduction of systemic BP under hypoxic
hypobaric conditions due to the relaxation of smooth muscles, increase in collateral circulation
and vascularization (León-Velarde et al., 1993; Ostadal & Kolar, 2007). Evidence from genetic
studies in Tibetans also suggests associations between the D allele of the angiotensin-converting
enzyme gene and HT, and higher frequency of the G allele in hypertensive Tibetans (Gesang et
al., 2002; Kumar et al., 2003). Usually, Tibetan HA populations have a higher level of hypoxic
ventilation response and blood oxygen saturation, better lung function, maximum cardiac output,
better sleep quality and lower levels of pulmonary vasoconstriction and hemoglobin
concentration compared with Andean HA populations (Wu & Kayser, 2006). Tibetans have also
longer generational history at HA and a lesser degree of genetic admixture than Andeans, which
could have advanced their degree of adaptation (Moore et al., 1998). The differences in the
relationships between BP and HT and altitude between Tibetan and non-Tibetan HA populations
63
in this systematic review and meta-analysis may also be related to lifestyle factors. The diet of
Tibetans traditionally consists of high levels of salt, a minimum 20 to 30 gram (g) per day
(Sehgal et al., 1968; Sun, 1986), which is five times more than the WHO recommendation.
Traditional food consumption also comprises high amounts of meat and fat, high alcohol
drinking, and low consumption of potassium, fruit and vegetables (Luobu, 2012; X. Zhao et al.,
2012). These factors are associated with increased BP levels and the prevalence of HT (Furberg,
Psaty, & Soliman, 2010). Lower mean BP in Andes HA population has also been suggested due
to low socio-cultural status, increased intake of minerals such as zinc, healthier diets, lesser
thickness of aorta and probable elasticity, and lower cardiac output (Ruiz & Penaloza, 1977).
Earlier studies report a low prevalence of risk factors for HT, such as obesity and smoking, in
Andean samples (Ruiz et al., 1969).
A recent systematic review estimates the prevalence of HT in HA populations of Tibet ranges
between 23% and 56% and that there is a 2% increment in the prevalence of HT for every 100 m
increment of altitude (Mingji et al., 2015). The same review suggests that rates of HT may be
increasing over time in some populations living at HA. For example, the prevalence of stage II
HT has increased by two to three times in Tibet between 1979 (Sun, 1986) and 2009 (X. Zhao et
al., 2012). This is consistent with the impact of lifestyle factors rather than genetic factors for
raised BP and HT.
Despite this latter suggestion, population origin, reflecting ancestry, rather than the country of
residence seems to be an important factor for BP variation in those living at HA. Populations
with Tibetan ancestry living at HA in China, India and Nepal, but following their traditional
cultural practices, have elevated BP (Matsubayashi et al., 2009; Okumiya et al., 2010; Sherpa et
al., 2013; Smith, 1999; Tripathy & Gupta, 2007; X. Zhao et al., 2012; X. Zheng et al., 2012).
One large Tibetan study of 25,000 adults reported stage II HT (≥160/95 mmHg) among 15% of
the participants (Sun, 1986). Studies based on populations from South America have identified a
low prevalence of HT and lower mean BP (Hernandez-Hernandez et al., 2010; Lindgärde et al.,
2004; Makela et al., 1978). In Nepal, highland residents of Tibetan origin had a HT prevalence of
25%, as opposed to just 3.7% in other HA population groups (S. Shrestha et al., 2012; Smith,
1999).
64
An environmental factor that may influence systemic BP is ambient temperature. A large British
study reported exposure to the colder climate, combined with poor housing quality, is associated
with diastolic HT (Mitchell, Blane, & Bartley, 2002). By contrast, hot and humid conditions may
cause vasodilation and lower BP (Ladell, 1964). Thus, BP could be related to both altitude and
the temperature at any particular altitude.
Obesity is an important risk factor for HT (Furberg et al., 2010). This was also found in the
studies identified in this systematic review. The mechanism by which obesity is linked with HT
is not properly understood. However, an increase in sympathetic activity, sodium retention,
insulin resistance, hyperleptinemia, and renal abnormalities are thought to be the likely
underlying pathways (Hall, 2000; Mark, Correia, Morgan, & et al., 1999). Among the studies
included in this review that compared BMI at high and low altitude levels, BMI was similar at
both levels in four studies (Khalid & Adzaku, 1995; Lindgärde et al., 2004; Negi et al., 2012;
Smith, 1999), lower in HA in one study (Hernandez-Hernandez et al., 2010), and no specific
trend was observed in one study (Okumiya et al., 2010).
Limitations of this review were that it was limited to published and electronically available
studies written in English. The 'grey literature' and in particular theses, conference papers and
government reports were not sought. Publication bias may be present, specifically with regards
to Chinese language papers and studies from Andean countries published in Spanish.
Implications for clinical practice, policy and research
The major implications of these findings for clinical practice, policy and research are that
clinicians and those concerned with public health should note an increased HT risk in HA
populations of Tibetan origin, whatever their current living situation. Culturally driven excessive
consumption of salt, alcohol and dietary fats may be the key reasons behind the increased levels
of BP among HA Tibetans. Thus, health education and lifestyle modification interventions may
be particularly important in this population. For example, strategies to reduce sodium and
increase potassium, e.g. with salt substitutes, might be appropriate (X. Zhao et al., 2014). In light
of the relatively poor availability of health care services at HA, it is recommended that health
policy planners consider strategies such as health camps to identify and treat individuals with
high risk of HT.
65
Conclusions and unanswered questions
This study presented the evidence of a positive association of BP and altitude in adult HA
populations of Tibetan origin. This could be due to the additive effects of hypoxia, lifestyle
habits (particularly diet), and genetic predisposition. Non-Tibetan HA populations were
generally found to have a low risk of raised BP. In both population groups, men were more likely
than women to have increased BP. Regions with HA countries, particularly South Asia, Central
Asia, and Africa, have insufficient epidemiological data on BP and other cardiovascular risk
factors in their HA residents. More population-specific prevalence studies are needed to estimate
the comprehensive risk of CVD in these regions.
66
3.2 Blood glucose levels and diabetes at high altitude
Diabetes mellitus (DM) is a key global public health problem. A recent estimate is that the global
age-standardized prevalence of DM has increased from 4.3% in 1980 to 9.0% in 2014 among
men, and from 5% to 7.9% among women (NCD Risk Factor Collaboration, 2016). During this
period the number of people living with DM has also increased four-fold, from 108 million to
432 million (NCD Risk Factor Collaboration, 2016). Another estimate reports that a large
proportion of those with DM remain undiagnosed and this is particularly so in low and middle
income countries (Beagley, Guariguata, Weil, & Motala, 2014). Blood glucose levels have a
continuous dose-response relationship with the risk of CVD (Meigs, Nathan, Wilson, Cupples, &
Singer, 1998). This incremental risk does not depend on a formal diagnosis of DM (Gerstein &
Punthakee, 2010), although those with DM themselves have a four-fold risk of CVD and develop
CVD approximately 15 years earlier than those without DM (Booth, Kapral, Fung, & Tu, 2006).
Permanently living at HA confers a metabolic adaptation of high glucose uptake (Holden et al.,
1995). However, changing diets and lifestyle factors for residents at HA may result in increased
mean blood glucose levels despite this metabolic adaptation (Sherpa et al., 2013).
This section comprises a systematic review and meta-analysis of the relationship between blood
glucose and residence at HA. Potential factors that influence blood glucose at HA and also blood
glucose responses to short-term exposure to HA will be discussed.
Methods
A search was conducted in three major biomedical databases: PubMed, OvidSP (Medline &
Embase) and Scopus. The MeSH terms ‘diabetes mellitus’ or ‘hyperglycemia’ with major
subheading 'epidemiology' were combined with words ‘altitude’, or ‘mountain’ or ‘himalaya’ or
‘highland’ or 'Tibetan' or 'Andean' in titles and/or abstracts. All relevant English language studies
published until the end of May 2016 were scrutinized. Inclusion criteria were the studies with
altitude level greater than or equal to 2400 m, sample size of greater than or equal to 100 and age
of participants 18 years or over. Studies conducted on patients and not at population level, and
among pregnant women were excluded.
Random-effects meta-regression was used to assess the relationship between each of fasting
plasma glucose (FPG) levels and DM prevalence by altitude. FPG was treated as a continuous
67
Gaussian variable and pooled estimate of mean FPG was estimated per 1000 m elevation. For
meta-regression, a mixed linear model was used with reported mean FPG as a response variable
that used the particular study as a random effect, and the inverse variance of the mean FPG as a
weight. For the meta-regression of DM prevalence a pooled odds ratio for DM per 1000 m
elevation in altitude was estimated using a similar random-effects model. If a study reported an
altitude range rather than a specific level, the mean of the range was recorded. Sensitivity testing
and sub-group analysis was also performed. Data at different levels of HA or from different
ethnic populations in a particular study were treated as an independent study during the analysis
if sample size was greater than or equal to 100, or otherwise excluded as per the eligibility
criteria. Population samples of those of Tibetan and non-Tibetan origin were analysed separately
because of the background of known differences in degree of adaptation and physiological
response against environmental hypoxia, for these different ancestry groups. Tibetans and
Andeans, the latter comprising the highest proportion among non-Tibetans, have the largest total
populations living at HA at the present time (Moore et al., 1998).
The measurement unit of blood glucose is mainly presented in mg/dL because the majority of the
studies included in this review report FPG using this scale of measurement. The conversion
factor from the International System of Unit (SI) is: 1 mmol/L=18 mg/dL.
Results
The search retrieved 262 papers; 84 from Scopus, 71 from PubMed, 61 from Medline and 46
from Embase. A reference search was performed for 39 articles selected for full text review. A
flow diagram for the selection of articles is presented in Figure 3.3.
Eleven studies met eligibility criteria and were included in this review. Of these, seven were
identified from a database search and four from a reference search. The selected studies were
published between 2004 and 2016. Two studies were published each in 2008 and 2012. The total
number of participants in included studies was 9884; five studies included fewer than 500
participants, two studies had 500 to 1000 participants and four studies had more than 1000
participants. Four studies were from China, three from Peru, and one each from Nepal, India,
China and India combined, and seven from Latin American countries. The altitude level ranged
from 2577 m to 4500 m. The risk of bias is presented in Table 3.3, which included consideration
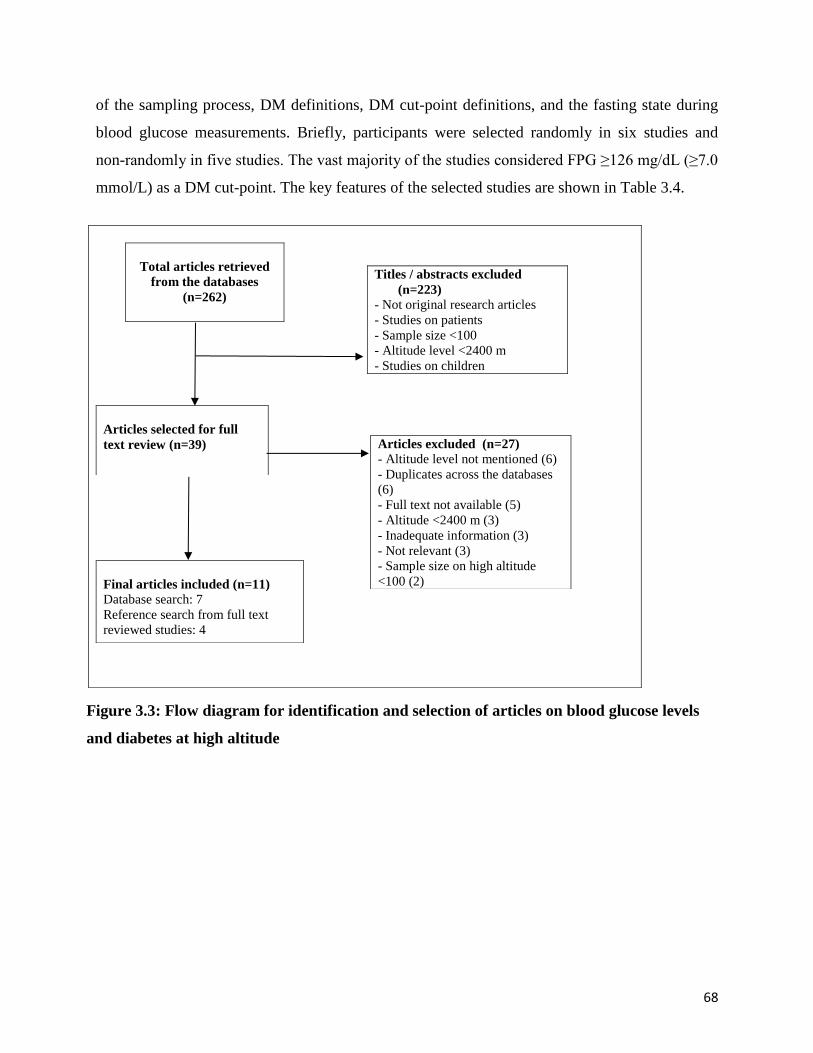
68
of the sampling process, DM definitions, DM cut-point definitions, and the fasting state during
blood glucose measurements. Briefly, participants were selected randomly in six studies and
non-randomly in five studies. The vast majority of the studies considered FPG ≥126 mg/dL (≥7.0
mmol/L) as a DM cut-point. The key features of the selected studies are shown in Table 3.4.
Figure 3.3: Flow diagram for identification and selection of articles on blood glucose levels
and diabetes at high altitude
Titles / abstracts excluded
(n=223)
- Not original research articles
- Studies on patients
- Sample size <100
- Altitude level <2400 m
- Studies on children
Total articles retrieved
from the databases
(n=262)
Articles selected for full
text review (n=39)
Articles excluded (n=27)
- Altitude level not mentioned (6)
- Duplicates across the databases
(6)
- Full text not available (5)
- Altitude <2400 m (3)
- Inadequate information (3)
- Not relevant (3)
- Sample size on high altitude
<100 (2)
Final articles included (n=11)
Database search: 7
Reference search from full text
reviewed studies: 4
69
Age and gender
Only two recent studies reported the age-related prevalence of DM at HA and both reported a
positive relationship between the prevalence of DM and older age (Okumiya et al., 2016; S. Xu
et al., 2015). Of three studies that reported prevalence of DM by gender, two reported a higher
prevalence in men than in women (Gonzales & Tapia, 2013; S. Xu et al., 2015). A Latin
American study showed higher prevalence in women in both HA samples (Schargrodsky et al.,
2008). Only one study reported mean FPG by gender, showing a higher mean FPG in women
compared to men (Gonzales & Tapia, 2013).
High and low altitude comparison
Two studies compared populations from HA (≥2400 m) and LA (<2400 m) for each DM and
FPG. Mean FPG was lower in HA samples than in LA samples in both studies (Lindgärde et al.,
2004; Sherpa et al., 2008). A Nepalese study found a higher prevalence of new DM cases in an
HA population (Sherpa et al., 2008) whereas a Latin American study comprising data from two
HA and five LA samples reported inconsistent results (Schargrodsky et al., 2008).
Association of DM prevalence and mean FPG with altitude
The prevalence of DM at HA was given in 16 population samples (from nine studies): nine with
samples of Tibetan origin and seven with samples of non-Tibetan origin. Random-effects meta-
regression estimated odds ratio (95% CI) for DM prevalence in Tibetan origin population of 1.49
(0.49 to 4.48) per 1000 m, P=0.49 (Figure 3.4). For non-Tibetan origin populations this
association was 0.82 (0.22 to 3.0) per 1000 m, P=0.80 (Figure 3.5). These point estimates
suggest the gradient for DM prevalence of 2.9% (2000 m), 3.8% (3000 m), and 6.5% (4000 m)
for a Tibetan population; and 5.7% (2000 m), 4.8% (3000 m), and 3.8% (4000 m) for a non-
Tibetan population. Sensitivity analysis by excluding population samples with older populations
(≥60 years) (Matsubayashi et al., 2009; Okumiya et al., 2010) yielded a similar result. There
were no significant changes in effect size when the populations samples specifying an altitude
range rather than an exact altitude were excluded (W. Chen et al., 2011; Okumiya et al., 2010; S.
Xu et al., 2015); odds ratio (95% CI) was 1.35 (0.13 to 13.46), P=0.79 for Tibetan origin
samples.
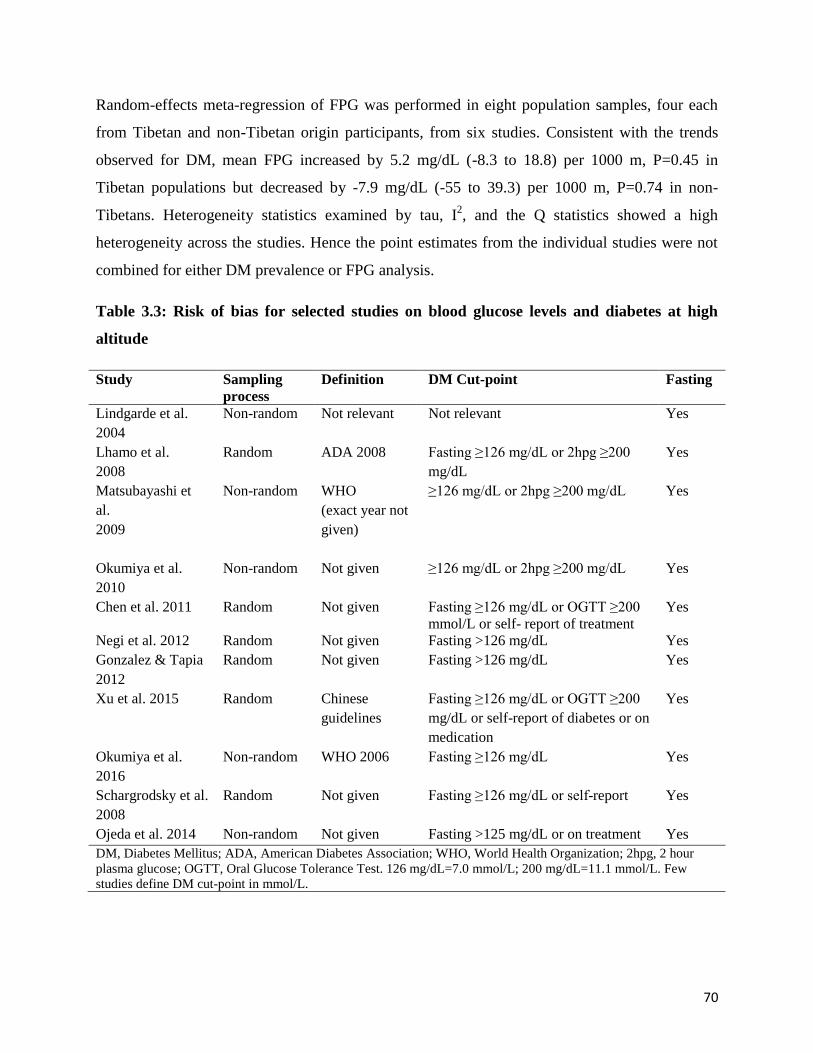
70
Random-effects meta-regression of FPG was performed in eight population samples, four each
from Tibetan and non-Tibetan origin participants, from six studies. Consistent with the trends
observed for DM, mean FPG increased by 5.2 mg/dL (-8.3 to 18.8) per 1000 m, P=0.45 in
Tibetan populations but decreased by -7.9 mg/dL (-55 to 39.3) per 1000 m, P=0.74 in non-
Tibetans. Heterogeneity statistics examined by tau, I2, and the Q statistics showed a high
heterogeneity across the studies. Hence the point estimates from the individual studies were not
combined for either DM prevalence or FPG analysis.
Table 3.3: Risk of bias for selected studies on blood glucose levels and diabetes at high
altitude
Study Sampling
process
Definition DM Cut-point Fasting
Lindgarde et al.
2004
Non-random Not relevant Not relevant Yes
Lhamo et al.
2008
Random ADA 2008
Fasting ≥126 mg/dL or 2hpg ≥200
mg/dL
Yes
Matsubayashi et
al.
2009
Non-random WHO
(exact year not
given)
≥126 mg/dL or 2hpg ≥200 mg/dL Yes
Okumiya et al.
2010
Non-random Not given ≥126 mg/dL or 2hpg ≥200 mg/dL Yes
Chen et al. 2011 Random Not given Fasting ≥126 mg/dL or OGTT ≥200
mmol/L or self- report of treatment
Yes
Negi et al. 2012 Random Not given Fasting >126 mg/dL Yes
Gonzalez & Tapia
2012
Random Not given Fasting >126 mg/dL Yes
Xu et al. 2015 Random Chinese
guidelines
Fasting ≥126 mg/dL or OGTT ≥200
mg/dL or self-report of diabetes or on
medication
Yes
Okumiya et al.
2016
Non-random WHO 2006 Fasting ≥126 mg/dL Yes
Schargrodsky et al.
2008
Random Not given Fasting ≥126 mg/dL or self-report Yes
Ojeda et al. 2014 Non-random Not given Fasting >125 mg/dL or on treatment Yes
DM, Diabetes Mellitus; ADA, American Diabetes Association; WHO, World Health Organization; 2hpg, 2 hour
plasma glucose; OGTT, Oral Glucose Tolerance Test. 126 mg/dL=7.0 mmol/L; 200 mg/dL=11.1 mmol/L. Few
studies define DM cut-point in mmol/L.
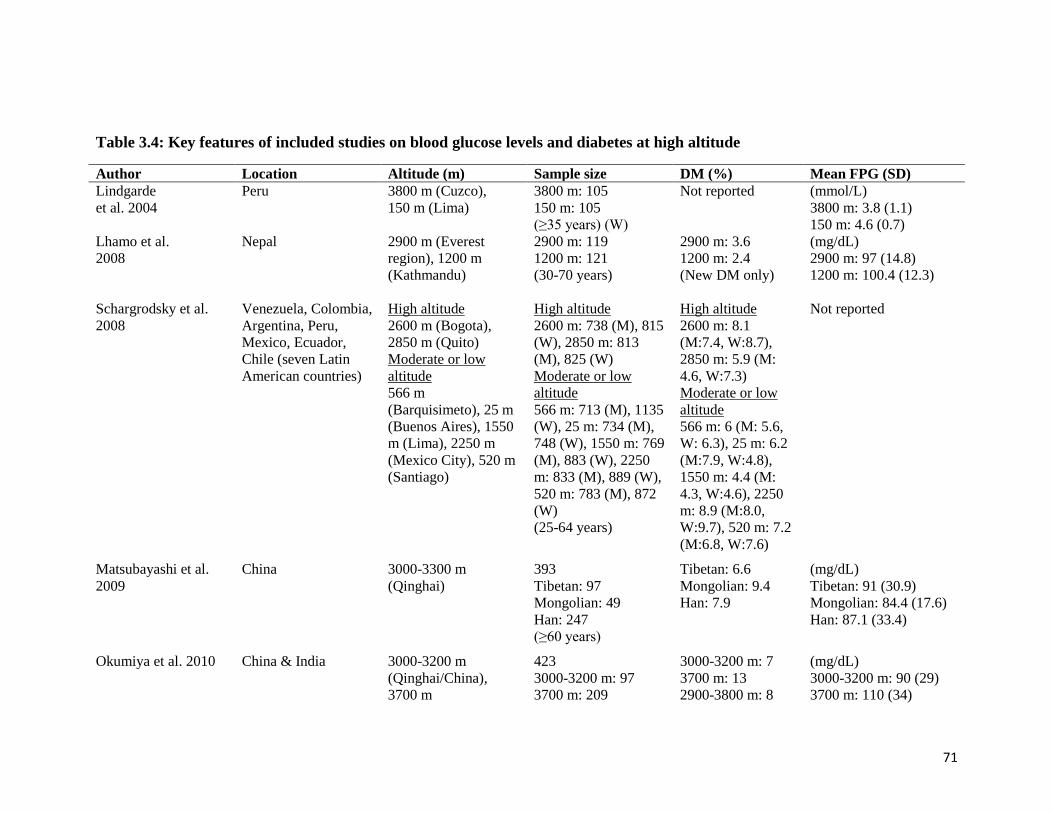
71
Table 3.4: Key features of included studies on blood glucose levels and diabetes at high altitude
Author Location Altitude (m) Sample size DM (%) Mean FPG (SD)
Lindgarde
et al. 2004
Peru 3800 m (Cuzco),
150 m (Lima)
3800 m: 105
150 m: 105
(≥35 years) (W)
Not reported (mmol/L)
3800 m: 3.8 (1.1)
150 m: 4.6 (0.7)
Lhamo et al.
2008
Nepal 2900 m (Everest
region), 1200 m
(Kathmandu)
2900 m: 119
1200 m: 121
(30-70 years)
2900 m: 3.6
1200 m: 2.4
(New DM only)
(mg/dL)
2900 m: 97 (14.8)
1200 m: 100.4 (12.3)
Schargrodsky et al.
2008
Venezuela, Colombia,
Argentina, Peru,
Mexico, Ecuador,
Chile (seven Latin
American countries)
High altitude
2600 m (Bogota),
2850 m (Quito)
Moderate or low
altitude
566 m
(Barquisimeto), 25 m
(Buenos Aires), 1550
m (Lima), 2250 m
(Mexico City), 520 m
(Santiago)
High altitude
2600 m: 738 (M), 815
(W), 2850 m: 813
(M), 825 (W)
Moderate or low
altitude
566 m: 713 (M), 1135
(W), 25 m: 734 (M),
748 (W), 1550 m: 769
(M), 883 (W), 2250
m: 833 (M), 889 (W),
520 m: 783 (M), 872
(W)
(25-64 years)
High altitude
2600 m: 8.1
(M:7.4, W:8.7),
2850 m: 5.9 (M:
4.6, W:7.3)
Moderate or low
altitude
566 m: 6 (M: 5.6,
W: 6.3), 25 m: 6.2
(M:7.9, W:4.8),
1550 m: 4.4 (M:
4.3, W:4.6), 2250
m: 8.9 (M:8.0,
W:9.7), 520 m: 7.2
(M:6.8, W:7.6)
Not reported
Matsubayashi et al.
2009
China 3000-3300 m
(Qinghai)
393
Tibetan: 97
Mongolian: 49
Han: 247
(≥60 years)
Tibetan: 6.6
Mongolian: 9.4
Han: 7.9
(mg/dL)
Tibetan: 91 (30.9)
Mongolian: 84.4 (17.6)
Han: 87.1 (33.4)
Okumiya et al. 2010 China & India 3000-3200 m
(Qinghai/China),
3700 m
423
3000-3200 m: 97
3700 m: 209
3000-3200 m: 7
3700 m: 13
2900-3800 m: 8
(mg/dL)
3000-3200 m: 90 (29)
3700 m: 110 (34)
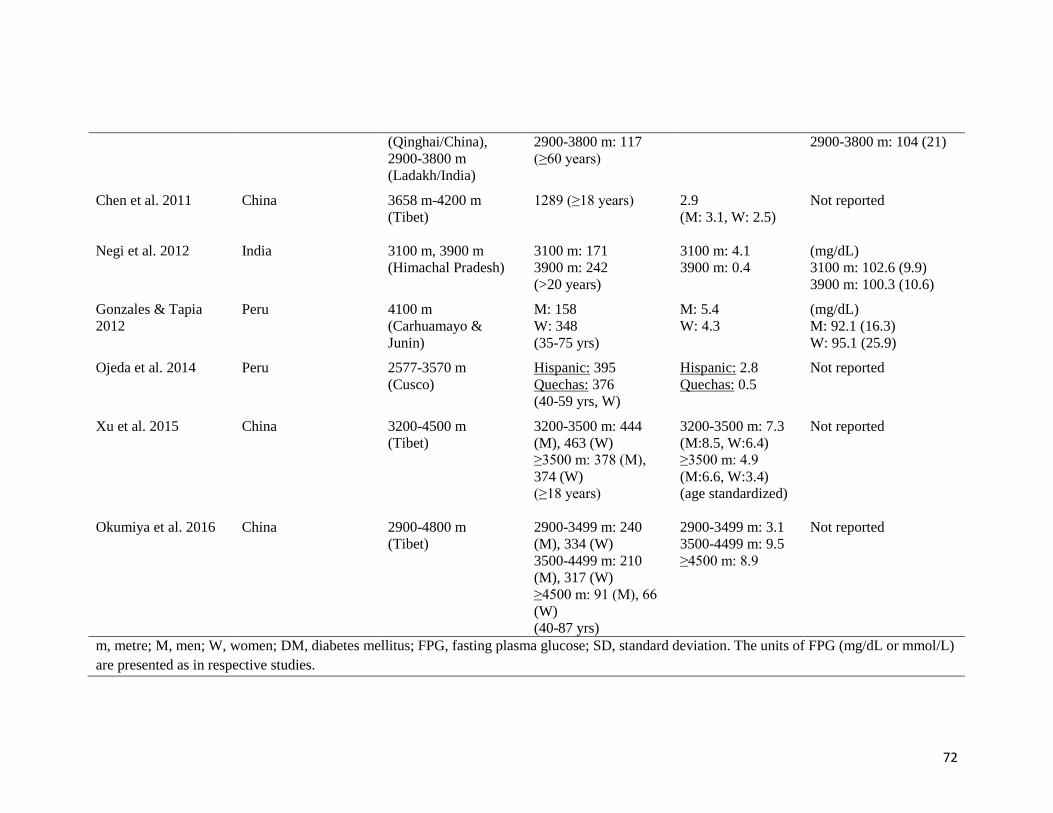
72
(Qinghai/China),
2900-3800 m
(Ladakh/India)
2900-3800 m: 117
(≥60 years)
2900-3800 m: 104 (21)
Chen et al. 2011 China 3658 m-4200 m
(Tibet)
1289 (≥18 years) 2.9
(M: 3.1, W: 2.5)
Not reported
Negi et al. 2012 India 3100 m, 3900 m
(Himachal Pradesh)
3100 m: 171
3900 m: 242
(>20 years)
3100 m: 4.1
3900 m: 0.4
(mg/dL)
3100 m: 102.6 (9.9)
3900 m: 100.3 (10.6)
Gonzales & Tapia
2012
Peru 4100 m
(Carhuamayo &
Junin)
M: 158
W: 348
(35-75 yrs)
M: 5.4
W: 4.3
(mg/dL)
M: 92.1 (16.3)
W: 95.1 (25.9)
Ojeda et al. 2014 Peru 2577-3570 m
(Cusco)
Hispanic: 395
Quechas: 376
(40-59 yrs, W)
Hispanic: 2.8
Quechas: 0.5
Not reported
Xu et al. 2015 China 3200-4500 m
(Tibet)
3200-3500 m: 444
(M), 463 (W)
≥3500 m: 378 (M),
374 (W)
(≥18 years)
3200-3500 m: 7.3
(M:8.5, W:6.4)
≥3500 m: 4.9
(M:6.6, W:3.4)
(age standardized)
Not reported
Okumiya et al. 2016 China 2900-4800 m
(Tibet)
2900-3499 m: 240
(M), 334 (W)
3500-4499 m: 210
(M), 317 (W)
≥4500 m: 91 (M), 66
(W)
(40-87 yrs)
2900-3499 m: 3.1
3500-4499 m: 9.5
≥4500 m: 8.9
Not reported
m, metre; M, men; W, women; DM, diabetes mellitus; FPG, fasting plasma glucose; SD, standard deviation. The units of FPG (mg/dL or mmol/L)
are presented as in respective studies.
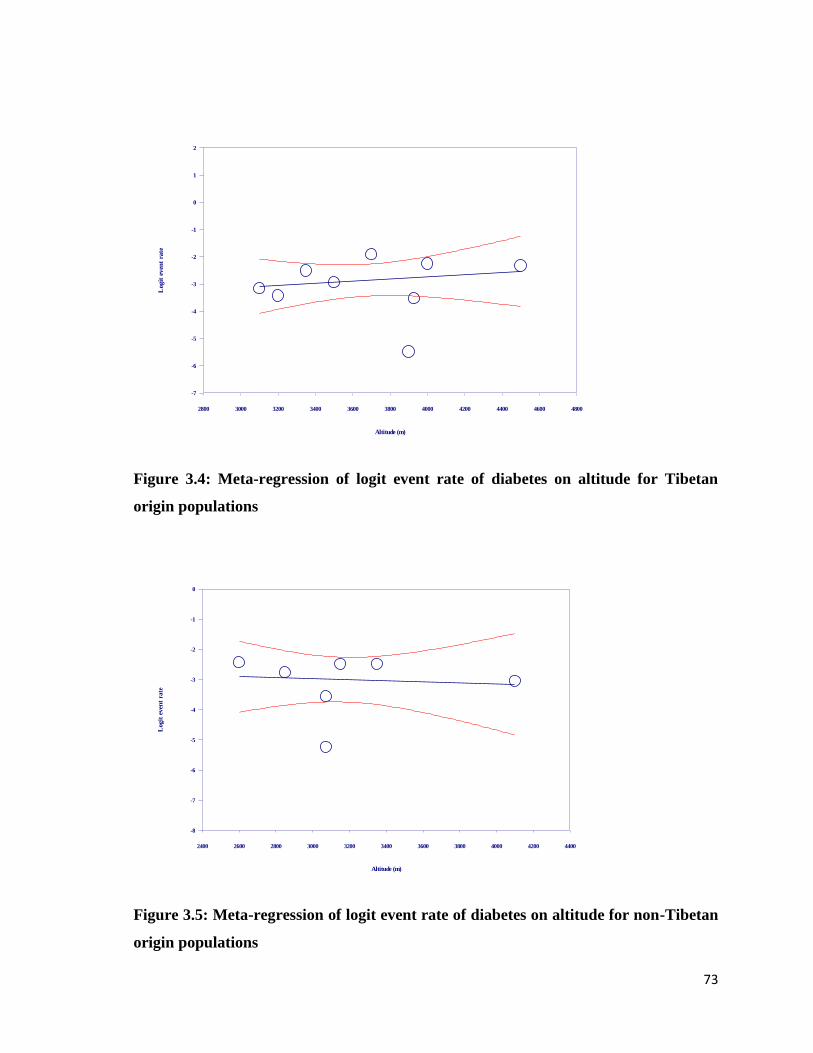
73
Figure 3.4: Meta-regression of logit event rate of diabetes on altitude for Tibetan
origin populations
Figure 3.5: Meta-regression of logit event rate of diabetes on altitude for non-Tibetan
origin populations
Altitude (m)
2800 3000 3200 3400 3600 3800 4000 4200 4400 4600 4800
Logit
even
t ra
te
2
1
0
-1
-2
-3
-4
-5
-6
-7
Altitude (m)
2400 2600 2800 3000 3200 3400 3600 3800 4000 4200 4400
Logit
even
t ra
te
0
-1
-2
-3
-4
-5
-6
-7
-8
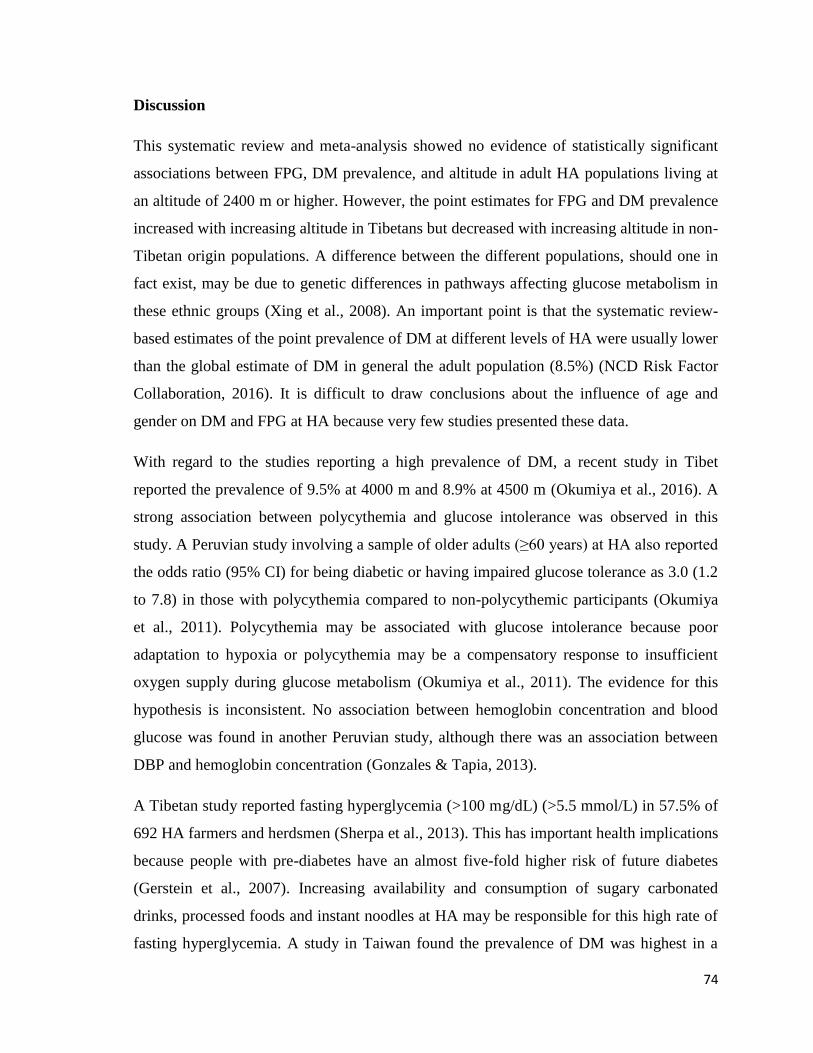
74
Discussion
This systematic review and meta-analysis showed no evidence of statistically significant
associations between FPG, DM prevalence, and altitude in adult HA populations living at
an altitude of 2400 m or higher. However, the point estimates for FPG and DM prevalence
increased with increasing altitude in Tibetans but decreased with increasing altitude in non-
Tibetan origin populations. A difference between the different populations, should one in
fact exist, may be due to genetic differences in pathways affecting glucose metabolism in
these ethnic groups (Xing et al., 2008). An important point is that the systematic review-
based estimates of the point prevalence of DM at different levels of HA were usually lower
than the global estimate of DM in general the adult population (8.5%) (NCD Risk Factor
Collaboration, 2016). It is difficult to draw conclusions about the influence of age and
gender on DM and FPG at HA because very few studies presented these data.
With regard to the studies reporting a high prevalence of DM, a recent study in Tibet
reported the prevalence of 9.5% at 4000 m and 8.9% at 4500 m (Okumiya et al., 2016). A
strong association between polycythemia and glucose intolerance was observed in this
study. A Peruvian study involving a sample of older adults (≥60 years) at HA also reported
the odds ratio (95% CI) for being diabetic or having impaired glucose tolerance as 3.0 (1.2
to 7.8) in those with polycythemia compared to non-polycythemic participants (Okumiya
et al., 2011). Polycythemia may be associated with glucose intolerance because poor
adaptation to hypoxia or polycythemia may be a compensatory response to insufficient
oxygen supply during glucose metabolism (Okumiya et al., 2011). The evidence for this
hypothesis is inconsistent. No association between hemoglobin concentration and blood
glucose was found in another Peruvian study, although there was an association between
DBP and hemoglobin concentration (Gonzales & Tapia, 2013).
A Tibetan study reported fasting hyperglycemia (>100 mg/dL) (>5.5 mmol/L) in 57.5% of
692 HA farmers and herdsmen (Sherpa et al., 2013). This has important health implications
because people with pre-diabetes have an almost five-fold higher risk of future diabetes
(Gerstein et al., 2007). Increasing availability and consumption of sugary carbonated
drinks, processed foods and instant noodles at HA may be responsible for this high rate of
fasting hyperglycemia. A study in Taiwan found the prevalence of DM was highest in a
75
mountainous region compared with the other regions surveyed (Pan, Yeh, Chang, Hwu, &
Ho, 2003). A Saudi Arabian study conducted in the Asir region at an altitude of 3150 m
showed that diabetes was one of the most common risk factors among 124 patients
admitted for diagnosed acute MI (Ashouri et al., 1993). A Swiss study of those under the
age of 20 years found twice as many diabetics in the mountain region compared to two
other geographical regions (Zuppinger, Teuscher, & Lüscher, 1975).
There are many potential reasons for lower DM and FPG in non-Tibetan (particularly
Andean) populations at HA. A sub-analysis of 29,806 Peruvian people living at greater
than or equal to 3000 m found that an inverse association between altitude and diabetes
was not statistically significant after adjusting for a number of potential confounding
variables: wealth index, age and sex. This suggests that lower socio-economic status may
be relevant to lower rates of diabetes at HA (Mori, Seclén, Rosas, & Arias, 2015). Several
types of glucose tolerance tests have also shown that HA residents had a more rapid
decline in glucose levels compared to LA residents for both an intravenous glucose
tolerance test (Picón-Reátegui, 1963) and an oral glucose tolerance test (Srivastava,
Kumria, Grover, Sridharan, & Malhotra, 1975). HA residents were also found to have
higher insulin sensitivity compared to LA residents (Lindgärde et al., 2004). Lower hepatic
glucagon sensitivity (Sutton & Garmendia, 1976) and higher glucose disposal in the
skeletal muscle (Woolcott, Ader, & Bergman, 2015) might also contribute to lower glucose
levels in HA dwellers. Colder ambient temperatures at HA may affect glucose metabolism
because carbohydrates are a key thermogenic fuel during shivering (Haman et al., 2005).
There is a broad consensus in the literature that acclimatization to HA results in an
increased preference for the use of glucose as a metabolic substrate. This is because using
glucose as a metabolic substrate has high oxygen efficiency. Glucose derives more
adenosine triphosphate (ATP) per unit of oxygen consumed compared with lipids when
oxidized (Braun, 2008; Roberts et al., 1996). A study in two aboriginal HA dwellers,
Andean Quechuas and Nepalese Sherpas, found that the preference for glucose as a
substrate in the heart correlated positively in these populations but negatively among LA
residents (Holden et al., 1995). Furthermore, that study reported that glucose metabolism in
myocardium was 25% to 50% more oxygen efficient than free fatty acids. There is also
76
evidence that intermittent hypoxia reduces hepatic glucose output by 50% in rats
(Freminet, Megas, & Puceat, 1990). Similar phenomena are plausible among human HA
residents.
Plants and crops produced and consumed in HA regions may possess anti-diabetic
properties. Some traditional plants are recommended by traditional healers as an integral
part of folk medicine practices. One study identified three plants found in the Eastern
Himalayan belt that have hypoglycemic properties (Mosihuzzaman et al., 1993). Some of
the 46 plants used by local people to treat diabetes in the Himalayan region of India also
had anti-diabetic effects in rodent models (Tag, Kalita, Dwivedi, Das, & Namsa, 2012). A
Chinese study showed that a bean (Vigna angularis) when grown at HA may have both
antioxidant and anti-diabetic properties (Yao, Cheng, Wang, Wang, & Ren, 2012). Another
Chinese study conducted at HA areas found hypoglycemic effects in a tea (Kucha), which
may be due to a reduction in disaccharidase activity (Xie et al., 2009). An Indian study in a
Himalayan region of Sikkim and Darjeeling reported that out of 37 species being used as
an anti-diabetic agent, 19% were included as hypoglycemic agents in the dictionary of
Indian Folk Medicine and Ethnobotany (D. Chhetri, Parajuli, & Subba, 2005). Serviceberry
plant, which has been used by the Blackfeet Indian tribe of the Rocky Mountains in
Montana, United States of America (USA), reduced post-prandial glycemic response (A. J.
Zhang, Rimando, Fish, Mentreddy, & Mathews, 2012). Buckwheat, one of the major crops
at HA, (Stevens, 1996), was shown to lower blood glucose levels in a hospital-based
experimental study in China (C. J. Lu, 1993). This benefit is mainly attributed to the
unique protein structure and amino acid composition of buckwheat (S.-Q. Li & Zhang,
2001).
Environmental and physiological factors are likely to be more important than genetic
factors in explaining blood glucose levels at HA. For instance, studies of Peruvian
(Lindgärde et al., 2004) and Nepalese (Sherpa et al., 2008) participants report comparisons
between populations of similar genetic background but residing at different altitudes. In
both studies, participants living at lower altitudes had a higher prevalence of increased
blood glucose levels. Related examples are findings from studies of genetically similar
American and Mexican Pima Indians with groups living at HA, in a Sonora mountain area,
77
who had lower fasting insulin levels compared to those of similar ethnicity living in a
lowland area of the USA, even after adjusting for age, sex, and obesity (Esparza-Romero et
al., 2010). Another study of migrants carried out in the Republic of Dagestan found that
when highlanders migrated to lower altitudes the prevalence of DM increased from its
original lower rate to the higher rate of the lowlander population (Abusuev, Khachurov, &
Akhmedkhanov, 1992).
In studies that also reported on obesity there was an expected increased prevalence of high
blood glucose levels at HA (Málaga, Zevallos-Palacios, Lazo, & Huayanay, 2010; Pan et
al., 2003). In a Nepalese HA study, waist circumference (WC) was a significant predictor
for impaired fasting glucose (IFG) (Sherpa et al., 2008). In common with international
recommendations (Mozaffarian, 2016), these findings suggest that nutritional interventions
of HA dwellers should target both obesity and diabetes.
Evidence for the effect of short-term exposure to HA on glucose metabolism
Many people are exposed to HA for short periods for work or recreational purposes. A
number of studies on short-term residents at HA, including both healthy people and those
with illness, report lower glucose concentrations with short-term exposure to HA.
A report of fasting blood glucose levels in seven Indian male lowlanders during their stay
at 4000 m found an initial increase in blood glucose that decreased gradually after 10
months and increased again on return to sea level (Srivastava et al., 1975). A Taiwanese
study found even a stay of only three days at HA (4000 m) improved glucose tolerance
(W.-C. Lee et al., 2003). The authors suggested that HA living conditions and activities
may serve as a potential natural remedy for diabetes.
Blood glucose levels tend to become lower among diabetic patients during short-term stays
at HA. A Saudi Arabian study found that HA living at 2400 m, but not at extreme altitude,
improved glycemic control in type II diabetic patients (Hessien, 2013). Some studies even
highlight the risk of hypoglycemia among type I diabetics under treatment during short-
term exposure to HA (Brubaker, 2005). Exposure to very HA (5000 m) may also affect
glycemic control in both type I and type II diabetic patients (de Mol et al., 2011).
78
Not all studies report a positive effect on glucose metabolism with increasing altitude
during HA sojourn. An Indian study of 25 men found no changes in glucose tolerance
during measurements at sea level, repeated tests after 10, 30, and 300 days at HA (3500
m), and again 14 days after a return to sea level (Brahmachari, Malhotra, Joseph, &
Krishnan, 1973). Some studies report that blood glucose concentrations increase rapidly on
arrival at HA and later gradually decrease toward sea level values (Sawhney, Malhotra, &
Singh, 1991; Williams, 1975). This could be due to the protective effects of HA on blood
glucose being overwhelmed by increased hepatic glycogenolysis and glucose release due to
the activation of the sympatho-adrenomedullary and adrenocortical system, or alternatively
due to the increment in the rate-limiting enzymes (pyruvate kinase and pyruvate
phosphotransferase) in glucose metabolism (Hance et al., 1980).
Conclusion
The evidence presented in this section suggests that long-term residence at HA usually has
a beneficial effect on glucose metabolism although this may vary by ethnicity. Although
the point estimates from meta-analysis were consistent with a positive association between
DM prevalence and FPG and HA in Tibetan origin populations, and with the opposite
association in non-Tibetan origin populations (mainly Andeans), the estimates of
association had wide confidence limits and were not statistically significant. These findings
should be interpreted with the following caveats: first, only studies published in the
English language were included. Thus, there may be a publication bias for papers
published in the local language of HA countries, mainly Chinese language papers from
China and Spanish language papers from Andean countries. Second, because of small
sample sizes included studies often had limited statistical power to detect important effects.
Environmental and physiological factors are likely to be more important than genetic
factors for maintaining normoglycemia at HA. However, as HA populations are changing
from traditional lifestyle and diet to other lifestyle habits a higher risk of elevated blood
glucose levels may result. Lifestyle factors may overwhelm protective effects induced by
physiological phenomena.
79
3.3 Lipid profile at high altitude
Dyslipidemia is a very powerful predictive factor for ischemic heart disease (IHD)
(Simons, 1986). HA living may alter lipid concentrations due to hypoxia (Garmendia,
Arroyo, & Muro, 1970; Roberts et al., 1996). This section will briefly outline the
relationship between individual components of lipid profile and CVD, and then review the
effects of HA living on lipid profile.
There is a positive association between IHD mortality and increasing total cholesterol (TC)
levels (Prospective Studies Collaboration, 2007). There is also a very strong association
between the risk of IHD and higher TC levels with no apparent lower threshold of risk (M.
Law, 2010). Among different components of the lipid profile an elevated level of low-
density lipo-protein (LDL) is particularly associated with increased IHD risk. The carrier
protein (apolipoprotein B) of LDL is highly atherogenic (Superko, 1996). There is an
inverse association between IHD risk and high-density lipo-protein (HDL) (Prospective
Studies Collaboration, 2007). The association between triglyceride (TG) and IHD is
uncertain. TG levels may be a conditional risk factor for IHD in those with low HDL,
central obesity or DM (Foody, 2006; Padwal & Sharma, 2010). Large studies have not
confirmed a strong positive association between lipid components and stroke mortality
(Prospective Studies Collaboration, 2007) and incident ischemic stroke (Willey et al.,
2009). However, strong positive relationships were found between incident cardiovascular
morbidity and mortality, and the TC to HDL ratio after adjustment for other risk factors
(Kappelle, Gansevoort, Hillege, Wolffenbuttel, & Dullaart, 2011).
Hypoxic and hypobaric conditions of HA alter the use of energy producing metabolic fuels
(Gonzales, 2001), which may secondarily affect lipid profiles. As discussed in the previous
section (3.2), hypoxia causes a preference for glucose utilization and decreases uptake of
free fatty acids because of oxygen-efficient adaptation (Holden et al., 1995; Roberts et al.,
1996). There could also be a physiological phenomenon of energy compensation in the
form of increased concentrations of lipids in hypoxemia (Garmendia et al., 1970). Hypoxia
alters hepatic lipid oxidation and can increase the levels of TG (Muratsubaki, Enomoto,
Ichijoh, & Yamamoto, 2003) and HDL (Meerson, Tverdokhlib, Nikonorov, Filippov, &
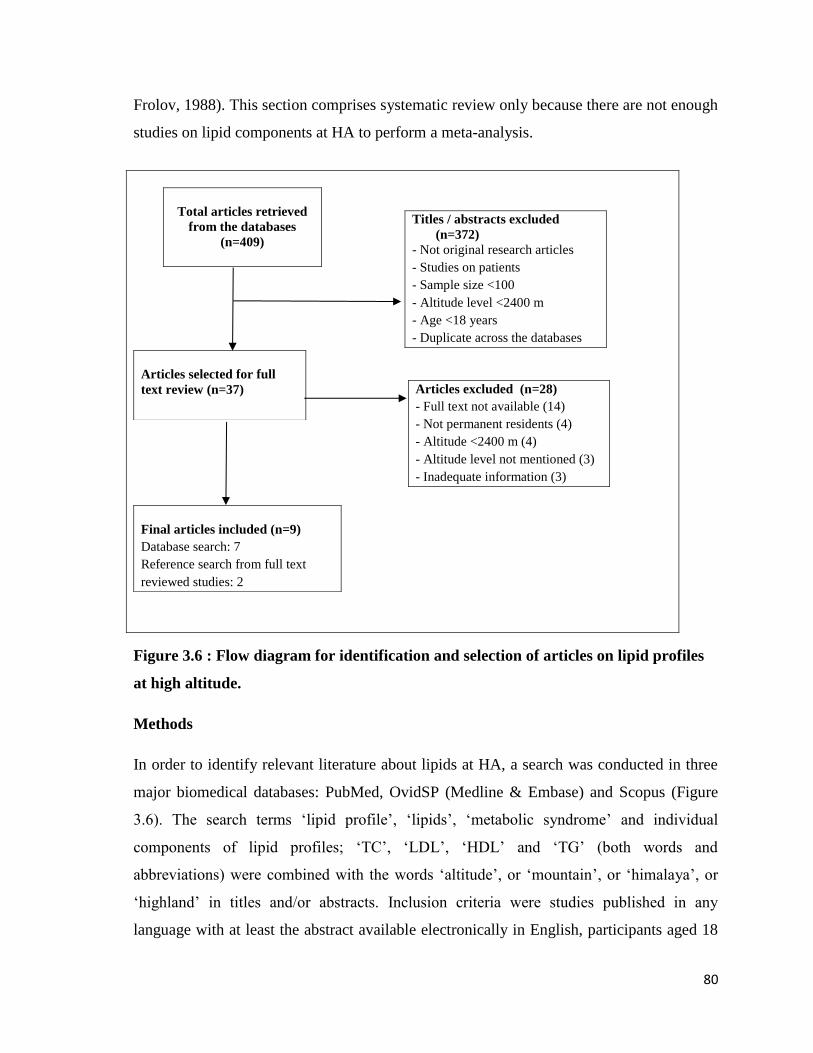
80
Frolov, 1988). This section comprises systematic review only because there are not enough
studies on lipid components at HA to perform a meta-analysis.
Figure 3.6 : Flow diagram for identification and selection of articles on lipid profiles
at high altitude.
Methods
In order to identify relevant literature about lipids at HA, a search was conducted in three
major biomedical databases: PubMed, OvidSP (Medline & Embase) and Scopus (Figure
3.6). The search terms ‘lipid profile’, ‘lipids’, ‘metabolic syndrome’ and individual
components of lipid profiles; ‘TC’, ‘LDL’, ‘HDL’ and ‘TG’ (both words and
abbreviations) were combined with the words ‘altitude’, or ‘mountain’, or ‘himalaya’, or
‘highland’ in titles and/or abstracts. Inclusion criteria were studies published in any
language with at least the abstract available electronically in English, participants aged 18
Titles / abstracts excluded
(n=372)
- Not original research articles
- Studies on patients
- Sample size <100
- Altitude level <2400 m
- Age <18 years
- Duplicate across the databases
Total articles retrieved
from the databases
(n=409)
Articles selected for full
text review (n=37)
Articles excluded (n=28)
- Full text not available (14)
- Not permanent residents (4)
- Altitude <2400 m (4)
- Altitude level not mentioned (3)
- Inadequate information (3)
Final articles included (n=9)
Database search: 7
Reference search from full text
reviewed studies: 2
81
years or older, and availability of data on prevalence or mean values of lipid components at
HA. Studies conducted on patients rather than at population level, and those not denoting
specific altitude levels were excluded. All relevant studies published until the end of
January 2014 were scrutinized.
The measurement units for lipid components are presented in mg/dL because the majority
of the included studies report it this way. The conversion factor from the SI unit is: 1
mmol/L=38.67 mg/dL for TC, LDL, and HDL; and 1 mmol/L=88.57 mg/dL for TG.
Results
A total of nine studies met the selection criteria. The key features of the selected studies are
summarized in Table 3.5. Five studies are from Peru, two from China (Tibet), and one each
is from Venezuela and Central Asia. Most studies are relatively small, less than 500
participants, and so have limited statistical power to examine confounding variables
influencing lipid profiles. Three of the studies had a sample size of less than 100, between
100 and 500, and between 500 and 700 respectively. The levels of altitude ranged from
3200 m to 4100 m. Three studies compared lipid levels between HA (≥2400 m) and LA
(<2400 m). Six studies provided data on prevalence and used the cut-points as per Adult
Treatment Panel III (ATP III) criteria (Grundy et al., 2002). However, one study used the
HDL cut-point of less than 40 mg/dL (<1.0 mmol/L) for both sexes (Gonzales & Tapia,
2013), and two used greater than or equal to 160 mg/dL (≥4.1 mmol/L) as a LDL cut-point
(Gonzales & Tapia, 2013; Sherpa et al., 2011).
The studies identified by the literature search variably identify higher (Baracco, Mohanna,
& Seclén, 2007; Gonzales & Tapia, 2013; Málaga et al., 2010; Mohanna et al., 2006;
Sherpa et al., 2011) and lower lipid levels in association with HA (Caceres Pilares, Rojas
Bravo, Caceres Espinoza, & Ortiz Martinez, 2004; De Mendoza et al., 1978; Fiori et al.,
2000; Sherpa et al., 2013). The studies reporting dyslipidemia in HA also had many
participants who were overweight or obese, or had central adiposity (Gonzales & Tapia,
2013; Málaga et al., 2010; Mohanna et al., 2006; Sherpa et al., 2011). It may be that in
these studies lifestyle and dietary patterns affected the lipid profile of HA residents.
82
Some studies report exceptionally high levels of some of the lipid components. A Peruvian
study of 74 adult permanent residents living at 3600 m reported low levels of HDL in
93.5% of women and 50% of men, and elevated level of TC in 40.6% including both sexes
(Málaga et al., 2010). Another Peruvian study of 506 participants aged between 35 and 75
years living at 4100 m altitude reported a high prevalence of TG: men 60.4% and women
66.8%; and low levels of HDL, men 66.9% and women 63.2% (Gonzales & Tapia, 2013).
This study also reported an association between higher hemoglobin levels and higher levels
of TC, LDL, TG and non-HDL levels. Other studies reported different and usually lower
levels of lipid profile components; however, levels of TG were elevated (Caceres Pilares et
al., 2004).
Six studies reported the prevalence of 'abnormal levels' or mean values of lipid components
by sex. The trend was observed for high mean values or prevalence of high TG and LDL in
men and low HDL values in women. An equal number of studies reported high and low
values of TC. Only three studies compared lipid values at low and high altitude. Distinctive
patterns of lipid components varying by altitude of residence were not seen, other than high
values of TG at HA.
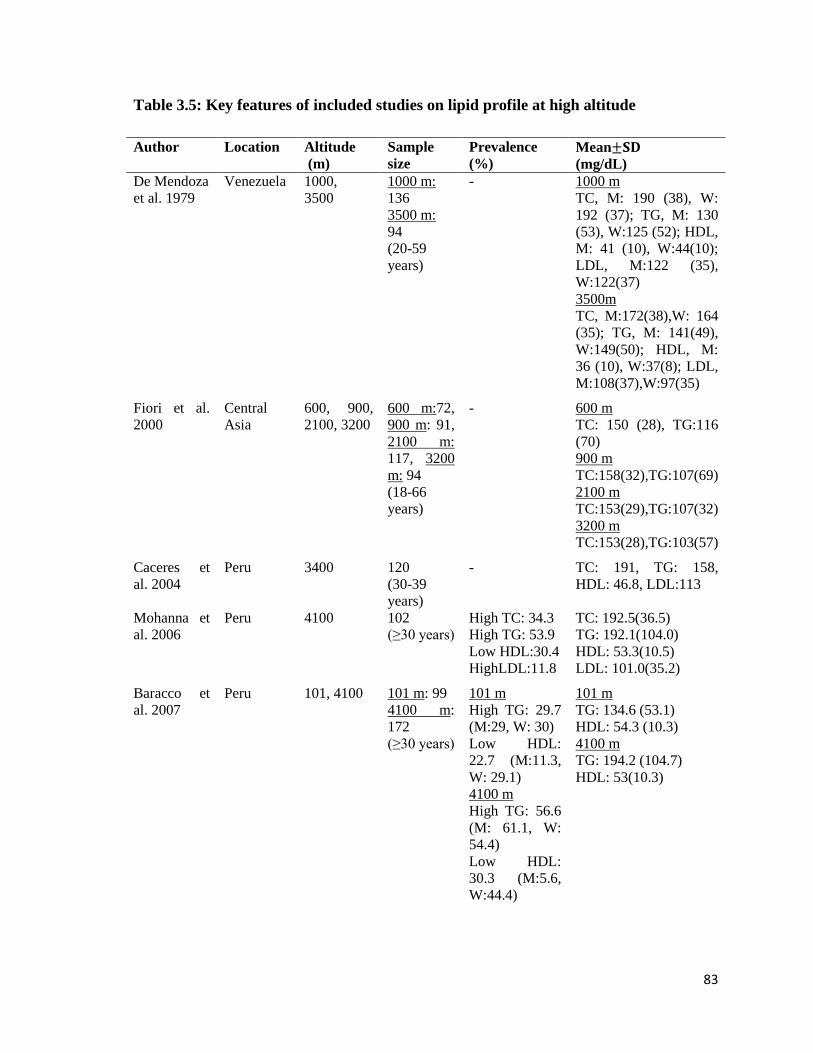
83
Table 3.5: Key features of included studies on lipid profile at high altitude
Author Location Altitude
(m)
Sample
size
Prevalence
(%)
Mean±𝐒𝐃
(mg/dL)
De Mendoza
et al. 1979
Venezuela 1000,
3500
1000 m:
136
3500 m:
94
(20-59
years)
- 1000 m
TC, M: 190 (38), W:
192 (37); TG, M: 130
(53), W:125 (52); HDL,
M: 41 (10), W:44(10);
LDL, M:122 (35),
W:122(37)
3500m
TC, M:172(38),W: 164
(35); TG, M: 141(49),
W:149(50); HDL, M:
36 (10), W:37(8); LDL,
M:108(37),W:97(35)
Fiori et al.
2000
Central
Asia
600, 900,
2100, 3200
600 m:72,
900 m: 91,
2100 m:
117, 3200
m: 94
(18-66
years)
- 600 m
TC: 150 (28), TG:116
(70)
900 m
TC:158(32),TG:107(69)
2100 m
TC:153(29),TG:107(32)
3200 m
TC:153(28),TG:103(57)
Caceres et
al. 2004
Peru 3400 120
(30-39
years)
- TC: 191, TG: 158,
HDL: 46.8, LDL:113
Mohanna et
al. 2006
Peru 4100 102
(≥30 years)
High TC: 34.3
High TG: 53.9
Low HDL:30.4
HighLDL:11.8
TC: 192.5(36.5)
TG: 192.1(104.0)
HDL: 53.3(10.5)
LDL: 101.0(35.2)
Baracco et
al. 2007
Peru 101, 4100 101 m: 99
4100 m:
172
(≥30 years)
101 m
High TG: 29.7
(M:29, W: 30)
Low HDL:
22.7 (M:11.3,
W: 29.1)
4100 m
High TG: 56.6
(M: 61.1, W:
54.4)
Low HDL:
30.3 (M:5.6,
W:44.4)
101 m
TG: 134.6 (53.1)
HDL: 54.3 (10.3)
4100 m
TG: 194.2 (104.7)
HDL: 53(10.3)
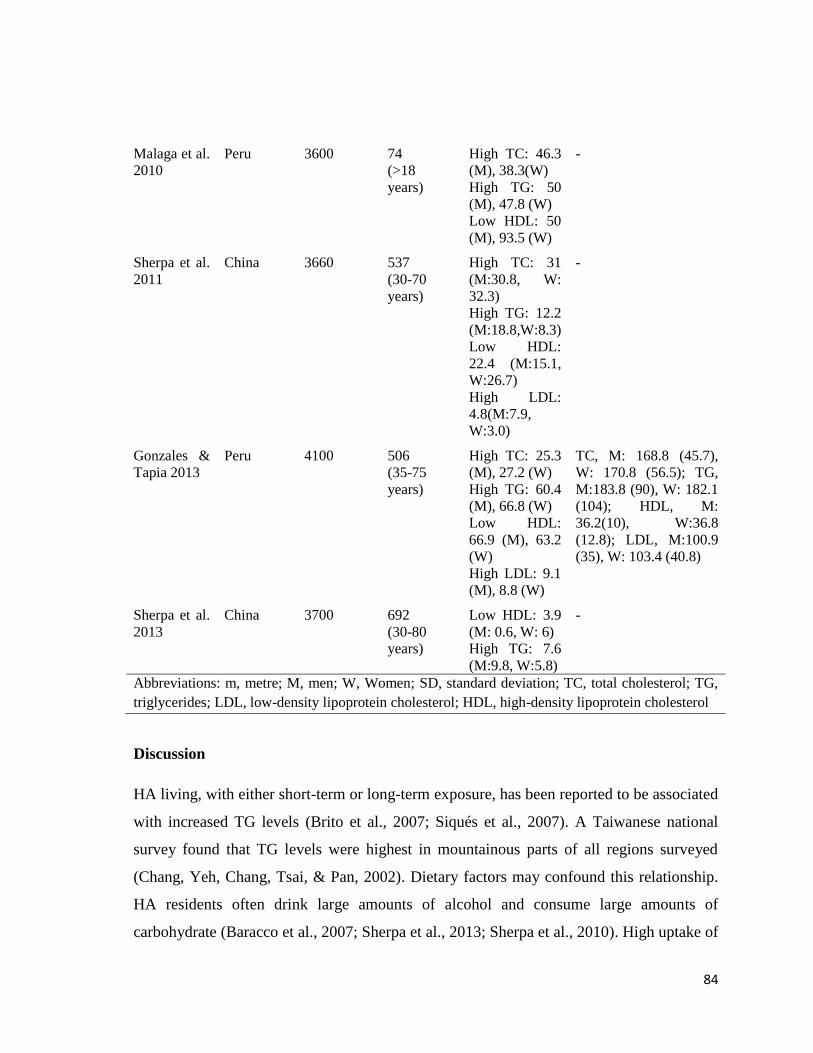
84
Discussion
HA living, with either short-term or long-term exposure, has been reported to be associated
with increased TG levels (Brito et al., 2007; Siqués et al., 2007). A Taiwanese national
survey found that TG levels were highest in mountainous parts of all regions surveyed
(Chang, Yeh, Chang, Tsai, & Pan, 2002). Dietary factors may confound this relationship.
HA residents often drink large amounts of alcohol and consume large amounts of
carbohydrate (Baracco et al., 2007; Sherpa et al., 2013; Sherpa et al., 2010). High uptake of
Malaga et al.
2010
Peru 3600 74
(>18
years)
High TC: 46.3
(M), 38.3(W)
High TG: 50
(M), 47.8 (W)
Low HDL: 50
(M), 93.5 (W)
-
Sherpa et al.
2011
China 3660 537
(30-70
years)
High TC: 31
(M:30.8, W:
32.3)
High TG: 12.2
(M:18.8,W:8.3)
Low HDL:
22.4 (M:15.1,
W:26.7)
High LDL:
4.8(M:7.9,
W:3.0)
-
Gonzales &
Tapia 2013
Peru 4100 506
(35-75
years)
High TC: 25.3
(M), 27.2 (W)
High TG: 60.4
(M), 66.8 (W)
Low HDL:
66.9 (M), 63.2
(W)
High LDL: 9.1
(M), 8.8 (W)
TC, M: 168.8 (45.7),
W: 170.8 (56.5); TG,
M:183.8 (90), W: 182.1
(104); HDL, M:
36.2(10), W:36.8
(12.8); LDL, M:100.9
(35), W: 103.4 (40.8)
Sherpa et al.
2013
China 3700 692
(30-80
years)
Low HDL: 3.9
(M: 0.6, W: 6)
High TG: 7.6
(M:9.8, W:5.8)
-
Abbreviations: m, metre; M, men; W, Women; SD, standard deviation; TC, total cholesterol; TG,
triglycerides; LDL, low-density lipoprotein cholesterol; HDL, high-density lipoprotein cholesterol
85
alcohol raises TG levels because of the increased secretion of its carrier protein (very low-
density lipoprotein (VLDL)), impaired lipolysis, and increased free fatty acid from adipose
tissue (Klop, do Rego, & Cabezas, 2013). Studies in France and Northern Ireland
(Ruidavets et al., 2010), and in Switzerland (Foerster et al., 2009) show an increase in TG
levels even in light drinkers, and the highest increment in heavy drinkers. Another study
reported that a high consumption of fat and alcohol synergistically raises plasma TG
(Barson et al., 2009). Alcohol intake increased the risk of hyperlipidemia by 2.4 fold in a
Chinese study among 1425 people living at a moderate altitude of 1500 m to 2500 m
(Deng, Luo, Huang, Shen, & Ma, 2012). Nonetheless, raised levels of TG were also
reported in 29% of 330 Argentinean children living at an altitude of 3750 m who were
unlikely to consume a significant amount of alcohol (Maccallini et al., 2012). TG levels
may also rise when dietary carbohydrate accounts for more than 55% of the total energy
(Parks, 2001). Carbohydrate-laden foods such as potatoes, barley and buckwheat are the
mainstay of HA dietary patterns (Baracco et al., 2007; Sinnett & Whyte, 1973; Stevens,
1996).
Ambient cold temperature may also confound the lipid profile relationship with HA. Cold
temperature is associated with catabolism of TG in both muscle and adipose tissue,
although it is not certain whether this affects plasma TG (Vallerand & Jacobs, 1990). The
concentration of HDL was lowest in the coldest months in a Wales study of 2036 men –
the Caerphilly prospective study (Eldwood et al., 1993).
No clear relationship between ethnicity and lipid profile at HA has been identified, unlike
the evidence identified for BP. In studies of Tibetans living at HA, high lipid values were
observed in urban Tibetans of Lhasa (Sherpa et al., 2011), compared to low values among
Tibetan farmers and herdsmen (Sherpa et al., 2013). In Peru, an older study among HA
residents reported a low prevalence of dyslipidemia (Caceres Pilares et al., 2004). Recent
studies from Peru consistently show high levels of lipids (Gonzales & Tapia, 2013; Luis
Enrique Macias Bustes, Cabrera Valentin, & Blas Posada, 2011; Málaga et al., 2010).
These examples suggest that acculturation with modernity and associated behavioural and
lifestyle factors could be more important than ethnicity in affecting lipid status in HA
86
people. Nevertheless, there is some evidence to show some role of ethnicity and genetic
variation on lipid profiles during short exposure to HA (Vats et al., 2013).
Lipid values at intermediate altitude and after short-term exposure to HA
In short-term exposure to HA, studies have used exposure times of between three weeks
and four years. No consistent patterns of changes to lipid profile in association with
altitude have been reported. Some studies report a decrease in TC and LDL values, and an
increase HDL values (Ferezou, Richalet, Coste, & Rathat, 1988; Tin'kov & Aksenov,
2002). Some studies report increased TC levels (S. K. Jha et al., 2002), and marked
increases in TG (Brito et al., 2007; Siqués et al., 2007). One study of nearly 20,000 young
male soldiers found no increase in TC with short-term living at HA (Ruhli et al., 2008).
In studies of the effects of intermediate altitude, between 1500 m and 2400 m, there is no
particular relationship between HA and lipid profiles. In a Chinese study conducted among
1415 participants at an altitude of 1500 m to 2500 m, hyperlipidemia was found in 49.3%,
hypercholesterolemia in 23.3% and hypertriglyceridemia in 34.1% (Deng et al., 2012). In
the Aymara adults of Northern Chile, who live at an altitude of greater than 2000 m, the
prevalence of serum hypercholesterolemia in men was 36.8% and in women 37.4%; low
HDL, men 26.3% and women 24.4%; and TC/HDL ratio greater than or equal to 5, men
28.2% and women 30.5%) (Santos, Pérez-Bravo, Carrasco, Calvillán, & Albala, 2001). A
study of 779 participants from Papua New Guinea living at altitudes of between 1828 and
2590 m, reported low mean TC values; however, hypertriglyceridemia was frequent in
both genders (Sinnett & Whyte, 1973).
Conclusion
There is insufficient robust literature to draw robust conclusions about the association
between lipid profiles and living at HA. Lifestyle factors rather than ethnicity or genetic
factors seem likely to be the main influences on lipid components. The most consistent
finding in the literature is that both short-term and long-term exposure to HA increase TG
levels.
87
4 Methodology
The study was a cross-sectional sample survey. This chapter discusses the geographical
area where the study was performed, the target population, sampling design, data collection
procedures, instruments, data processing and analysis, ethical considerations, and the
candidate’s role in this study.
4.1 Geographical study area
Nepal has 75 districts, 16 of which are part of a mountainous ecological region. Two
mountainous districts, Mustang and Humla, were sampled using a priori information on
their geography, altitude, population ethnicity, and feasibility of administering the study
procedures. Particular areas of these districts were selected primarily for altitude levels,
population density, and logistical support such as transportation and availability of
electricity. The selected study areas were Jomsom, 2800 metre (m), which is an urban
setting; Jharkot (3270 m), a rural setting; Muktinath (3620 m), another urban setting of the
Mustang district (Figure 4.1); and Simikot (2890 m) which is a rural setting of the Humla
district (Figure 4.2). Climate is 'cold temperate' at 2800 m in Mustang and at 2890 m in
Humla, and 'alpine' at 3270 m and 3620 m in Mustang. Life expectancy at birth is 64.15
years in Mustang and 65.04 years in Humla, both lower than the national figure of 68.8
years (Government of Nepal & United Nations Development Programme, 2014). Tourism
and its natural resources mean that Mustang people are relatively wealthy and the dominant
Thakali ethnic group has the highest human development index (HDI) score in Nepal
(Government of Nepal & United Nations Development Programme, 2014). In contrast,
Humla is a district with the lowest HDI score (Government of Nepal & United Nations
Development Programme, 2014) and it is the only district of Nepal without any road
access. Both districts border China and the Tibetan culture is influential in these districts.
The district health office records for 2013/2014 report that gastritis and urinary tract
infection (UTI) were the main health problems in both districts. Among cardiovascular
disease (CVD) related risk factors hypertension (HT) ranked eighth as a leading cause for
hospital visits in the Mustang district but no CVD risk factors were in the top 10 leading
causes for hospital visits in Humla.
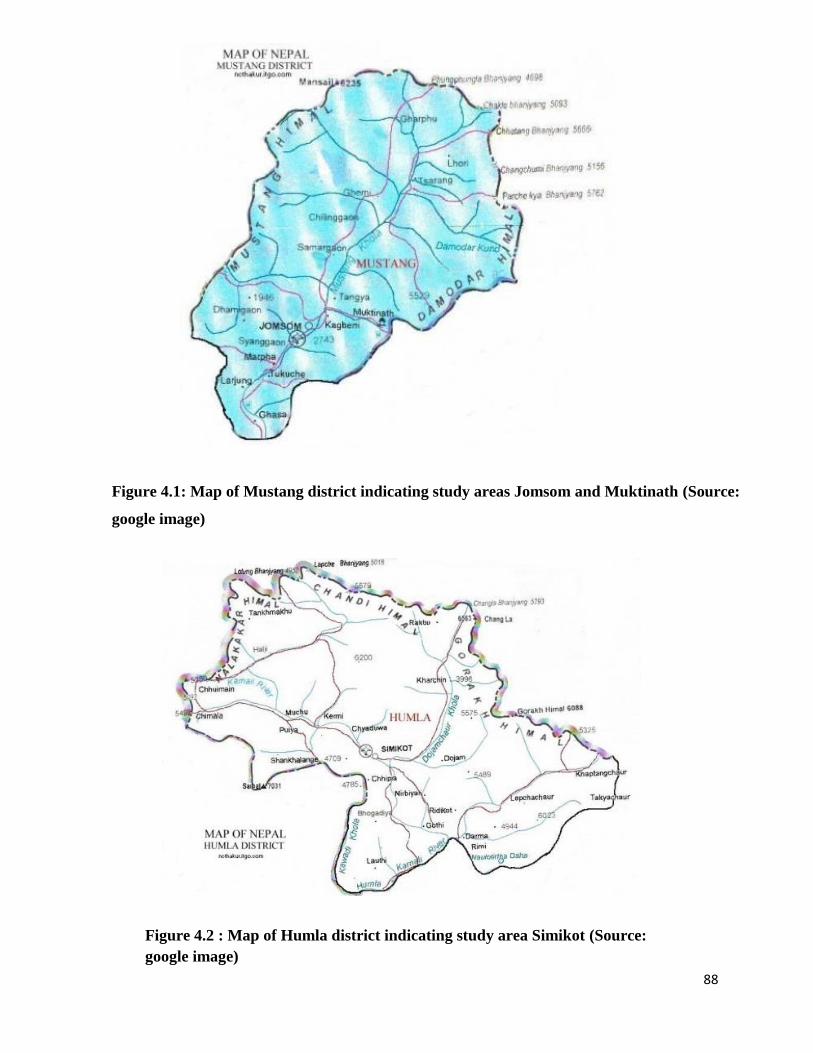
88
Figure 4.1: Map of Mustang district indicating study areas Jomsom and Muktinath (Source:
google image)
Figure 4.2 : Map of Humla district indicating study area Simikot (Source:
google image)
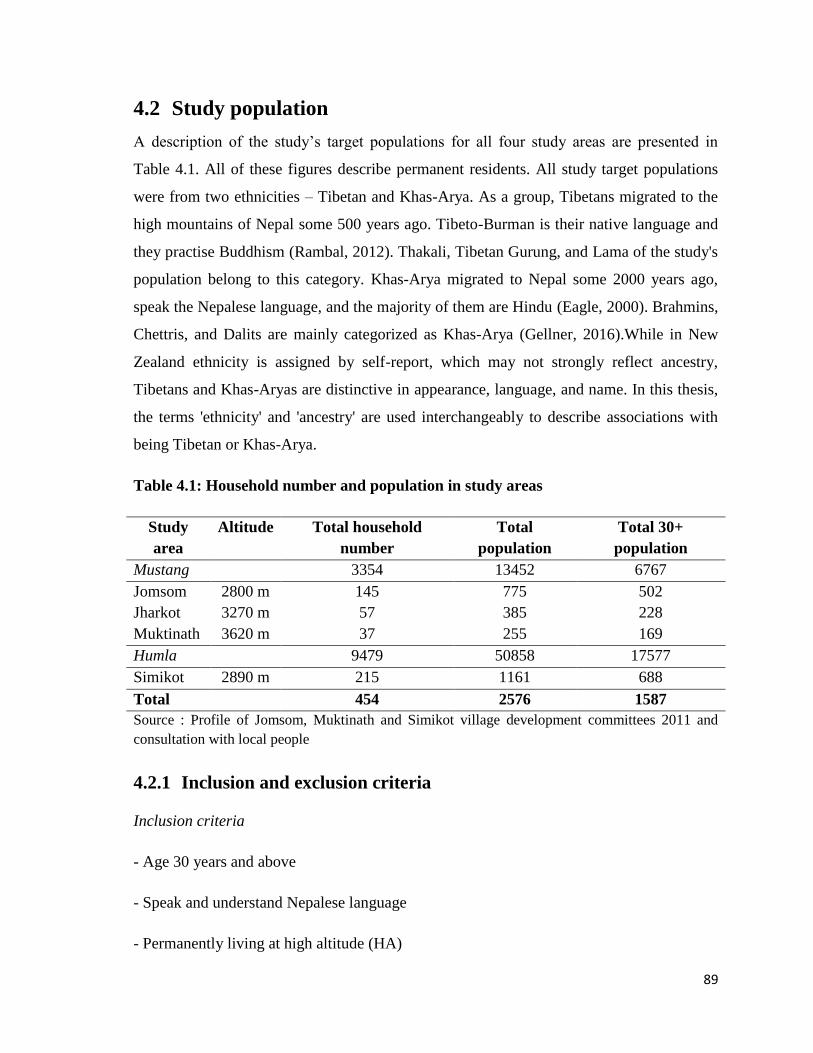
89
4.2 Study population
A description of the study’s target populations for all four study areas are presented in
Table 4.1. All of these figures describe permanent residents. All study target populations
were from two ethnicities – Tibetan and Khas-Arya. As a group, Tibetans migrated to the
high mountains of Nepal some 500 years ago. Tibeto-Burman is their native language and
they practise Buddhism (Rambal, 2012). Thakali, Tibetan Gurung, and Lama of the study's
population belong to this category. Khas-Arya migrated to Nepal some 2000 years ago,
speak the Nepalese language, and the majority of them are Hindu (Eagle, 2000). Brahmins,
Chettris, and Dalits are mainly categorized as Khas-Arya (Gellner, 2016).While in New
Zealand ethnicity is assigned by self-report, which may not strongly reflect ancestry,
Tibetans and Khas-Aryas are distinctive in appearance, language, and name. In this thesis,
the terms 'ethnicity' and 'ancestry' are used interchangeably to describe associations with
being Tibetan or Khas-Arya.
Table 4.1: Household number and population in study areas
Study
area
Altitude Total household
number
Total
population
Total 30+
population
Mustang 3354 13452 6767
Jomsom 2800 m 145 775 502
Jharkot 3270 m 57 385 228
Muktinath 3620 m 37 255 169
Humla 9479 50858 17577
Simikot 2890 m 215 1161 688
Total 454 2576 1587
Source : Profile of Jomsom, Muktinath and Simikot village development committees 2011 and
consultation with local people
4.2.1 Inclusion and exclusion criteria
Inclusion criteria
- Age 30 years and above
- Speak and understand Nepalese language
- Permanently living at high altitude (HA)
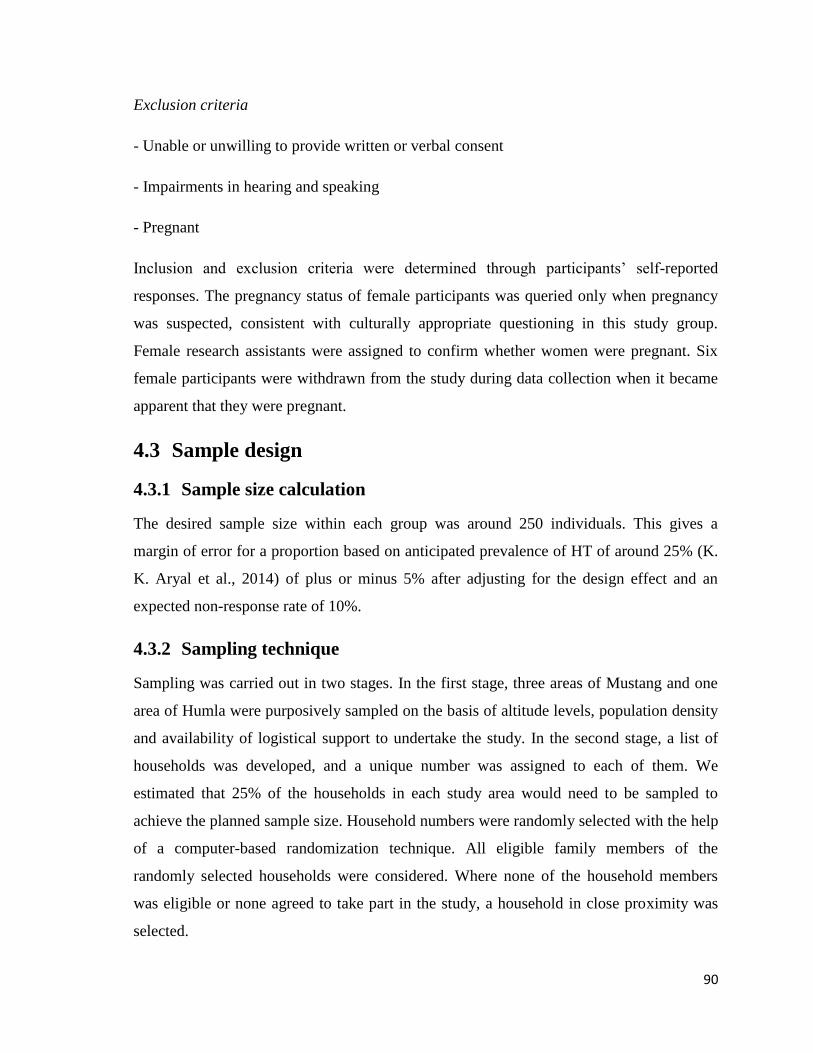
90
Exclusion criteria
- Unable or unwilling to provide written or verbal consent
- Impairments in hearing and speaking
- Pregnant
Inclusion and exclusion criteria were determined through participants’ self-reported
responses. The pregnancy status of female participants was queried only when pregnancy
was suspected, consistent with culturally appropriate questioning in this study group.
Female research assistants were assigned to confirm whether women were pregnant. Six
female participants were withdrawn from the study during data collection when it became
apparent that they were pregnant.
4.3 Sample design
4.3.1 Sample size calculation
The desired sample size within each group was around 250 individuals. This gives a
margin of error for a proportion based on anticipated prevalence of HT of around 25% (K.
K. Aryal et al., 2014) of plus or minus 5% after adjusting for the design effect and an
expected non-response rate of 10%.
4.3.2 Sampling technique
Sampling was carried out in two stages. In the first stage, three areas of Mustang and one
area of Humla were purposively sampled on the basis of altitude levels, population density
and availability of logistical support to undertake the study. In the second stage, a list of
households was developed, and a unique number was assigned to each of them. We
estimated that 25% of the households in each study area would need to be sampled to
achieve the planned sample size. Household numbers were randomly selected with the help
of a computer-based randomization technique. All eligible family members of the
randomly selected households were considered. Where none of the household members
was eligible or none agreed to take part in the study, a household in close proximity was
selected.
91
This sampling technique is a cluster sampling scheme by household; however, the analysis
treats the data as being from a simple random sampling scheme. This is because of the
absence of a robust sampling frame, low population size and very low population density
of the study areas.
4.4 Instruments
This study employed three main instruments to address the research questions:
i) World Health Organization (WHO) STEPS questionnaire for non-communicable disease
(NCD) risk factors
ii) Questionnaire for verifying stroke-free status (QVSFS)
iii) Electrocardiogram (ECG)
4.4.1 World Health Organization non-communicable disease risk factors
STEPS interview questionnaire
Cardiovascular risk-related sections of the WHO NCD risk factors STEPS questionnaire
version 2.2 were used. The Nepal Health Research Council (NHRC) has already translated
it into Nepalese language, validated through a pilot study in a community, and approved by
expert meetings (K. K. Aryal et al., 2014). This questionnaire has three sections. The first
section has questions on socio-demographic and lifestyle factors, a second section consists
of blood pressure and anthropometric (height, weight, waist, hip) measurements, and the
third section contains measurements of blood glucose and lipids.
Demographic and socio-economic information
This initial section included questions related to age, sex, ethnicity, education, occupation,
household income, and marital status. The ethnicity question further asked whether
participants were from Tibetan ancestry. Altitude-related questions (origin of birth,
duration at HA) were also included.
92
Tobacco use
Questions on both smoking and non-smoking forms of tobacco use were included.
Questions were related to current (in the last 30 days) and past tobacco use. Duration of
smoking was also noted among current smokers by asking what age they started smoking.
In Nepal, the most common types of smoked tobacco are manufactured cigarettes, bidis
(unprocessed tobacco wrapped in leaves), and pipes (locally called hookah, tamakhu).
Among non-smoked types, commercially or non-commercially manufactured chewing
items from tobacco leaves locally known as khaini, surti, gutkha, zarda, paan are the most
popular. Nose-snuffing of ground tobacco leaf (locally called Nas) is also common in
mountain areas of Nepal, and especially among those from Tibetan culture.
Alcohol consumption
Alcohol consumption-related questions were about current, past and ‘ever drinking’ status,
frequency of drinking, and the number of standard drink units (SDU) consumed in the past
30 days. Current drinkers were defined as those drinking alcohol in the past 30 days. A
hazardous drinker was defined as weekly consumption of ≥21 and ≥14 SDUs of alcohol for
men and women respectively (Piccinelli et al., 1997).
SDU of alcohol was calculated by the formula:
Amount of drink (litre)(l) × percent of volume of alcohol (%) × density of ethanol at room
temperature (0.789) (Health Promotion Agency New Zealand, 2015).
A glass with 90 millilitre (mL) volume was a popular size in the study areas. The few
participants who consumed alcohol in different-sized glasses were asked to estimate the
volume with reference to a 90 mL glass. Traditionally home-made and locally brewed
alcoholic beverages were popular in the study areas, mainly jaad (made of rice), chang
(also made of rice but using a different method), and raksi (made of rice, millet or barley).
The percentage of volume of alcohol was determined as 12% for jaad and chang, 25% for
raksi (Pradhan et al., 2012), and 5.5% for beer and 40% for vodka as labelled.
93
Fruit and vegetables, salt and oil consumption
Participants were asked to estimate how many days they consumed fruit or vegetables in a
typical week and the mean consumption of fruit or vegetables portions on those days. One
portion of fruit and vegetables was defined as 80 gram (g) as per the WHO
recommendation (World Health Organization : Joint WHO/FAO expert consultation, 2003)
– for example, an apple, a banana, 10 grapes, or one panyu (tablespoon) of vegetables.
The amount of salt and oil consumption was determined by asking how much participants
estimated their household consumed in a month, and this amount was divided by the
number of family members currently sharing the kitchen for the main meal. Salt was
usually available in one kilogram (kg) packets and oil in a 500 mL packet.
Physical activity
Physical activity was classified into vigorous and moderate levels. Vigorous physical
activity was defined as any activity, such as carrying heavy loads, lifting heavy weights,
digging or ploughing fields etc., causing a significant rise in breathing and heart rate for at
least 10 minutes. Moderate physical activity was defined as continuous involvement in an
activity for at least 30 minutes that caused a slight increment in breathing or heart rate,
such as brisk walking, cleaning, washing clothes by hand, gardening, and any domestic
chores. Participants were asked on average time they spent in vigorous and moderate
physical activity per day in a typical week. Participants who were involved in a vigorous
physical activity only at particular times in a year, such as during crop harvesting or other
agriculture-related work were also considered.
The physical activity-related questions also included mean walking and sedentary time per
day. Sedentary time was defined as behaviours such as reading a book, watching
television, or sitting with friends.
History of CVD, HT, diabetes and high cholesterol
Information on personal and family history of CVD was collected. A family member was
defined as being first-degree blood relations (parents, siblings, or children). Participants
94
were also asked if they currently or previously had HT, diabetes and high cholesterol, or if
they were currently on treatment for these.
Anthropometric measurements
Among anthropometric components, height, weight, waist and hip were measured. Weight
was measured by a portable digital weighing scale (Seca, Germany) placed on a hard, flat
surface. Weight was measured without shoes, heavy clothing and mobile phone, and
participants were asked to empty their pockets. Participants were asked to stand steadily on
the machine with their head facing forward and weight evenly distributed between both
feet. Weight was recorded to the nearest 0.5 kg in accordance with the Frankfurt Plane
technique (Cogill, 2003).
Height was measured by a portable standard stature scale. Participants were asked to take
off their shoes, head caps and head ornaments. They were asked to stand with head looking
forward, legs straight and heels together, arms to the side and shoulders relaxed. The
research team members ensured that heels, buttocks, scapulae and the back of the head
were against the wall. The participants and the research team member faced each other
while measuring the participants’ height. The participants were asked to inhale deeply and
hold their breath while standing in an erect position. A ruler was lowered to the
participant’s highest point with enough pressure for the participant to feel their hair
compressed and height was noted to the nearest 0.5 centimeter (cm) as per the Frankfurt
Plane technique (Cogill, 2003). The classification of body mass index (BMI) was based on
WHO established guidelines (World Health Organization, 1995); ≥30 kg/m2: obese, ≥25
kg/m2: overweight, 18.5 to 24.9 kg/m
2: normal, <18.5 kg/m
2: underweight.
Waist and hip were measured with soft fabric tapes as per WHO recommendation (World
Health Organization, 1995). A room was partitioned off with a curtain to ensure privacy.
Waist circumference was measured at the end of normal expiration at a level of midway
between the lowest rib and the superior border of the iliac crest. Participants were asked to
roll up their inner garments above the waist, loosen tight garments around the waist,
including belts, and empty their pockets. Hip circumference was measured at the level of
95
most protrusion. Participants were asked to roll down their lower garments, except for
underwear.
Both waist and hip circumferences were measured with the participants' feet fairly close
together, around 12 cm to 15 cm apart. Two members of the study team were assigned; one
person measured the tape at eye level with one finger between tape and participant’s body
and the second person checked that the tape was horizontal around the body with no folds
anywhere. For cultural reasons only female research assistants measured the waists and
hips of female participants.
High waist circumference (WC) was defined as >90 cm (men) and >80 cm (women) using
International Diabetes Federation (IDF) criteria for South Asian populations (Alberti,
Zimmet, & Shaw, 2006). High waist to hip ratio (WHR) was defined as ≥0.90 (men) and
≥0.85 (women) according to the WHO recommendation (World Health Organization,
2008).
Blood pressure
BP was measured by oscillometric method using an automatic blood pressure measuring
device (Omron HEM-7221). The recommended operating ambient pressure conditions of
this machine are from 700 to 1060 hectopascals. This is the atmospheric pressure at around
3000 m, which was further verified with the manufacturer (Rudi Fernandez, personal
communication, JA Davey Pty Ltd, 3rd October, 2016). Moreover, Omron BP monitoring
machines have also passed the validation criteria at 3650 m as proposed by the European
Society of Hypertension International Protocol Revision 2010 (ESH-IP2) (Cho, Tian, Lan,
Zhao, & Yan, 2013). Three readings were recorded from left arm of each participant in
sitting position with at least 10 minutes elapsing in between. The first measurement was
taken a minimum of 10 minutes after the questionnaire was administered. If the readings
differed by more than 10 units, a fourth measurement was taken and the lowest three were
considered for mean calculation.
BP (systolic/diastolic) was classified as normal (<120/80 mmHg), pre-HT (120–39/80–89
mmHg), HT (≥140/90 mmHg), Stage I HT (140–159/90–99 mmHg), and Stage II HT
96
(≥160/100 mmHg) according to the seventh report of the Joint National Committee on
prevention, detection, evaluation, and treatment of high BP (Chobanian et al., 2003).
Blood glucose and lipids
Glycated hemoglobin (HbA1c) and lipid profiles were measured using a Cobas b 101
device (Roche Diagnostics). Cobas b 101 uses immunoassay method for HbA1c and
enzymatic method for lipid profile measurements (Cobas b 101 system : operator's manual
software version 1.0). This device is validated for use at up to 3200 m and thus participants
at 3620 m were requested to come down to the measurement facility set up at 3270 m. A
small amount of capillary whole blood was taken by single finger-prick and processed by
the device, which provided results for both HbA1c and lipids within 15 minutes. Single use
only disposable lancets (Accu-Chek safe-T-Pro-Plus, Roche Diagnostics) were used for
finger-prick. This lancet has 1.3 mm, 1.8 mm and 2.3 mm depth settings. Third or fourth
finger of the non-dominant hand was selected for finger-prick. Firstly, the selected finger
was massaged from the base to the tip to ennsure good blood flow. The lancing area (top
side of the finger) was cleaned with an alcohol swab and dried with a tissue. The first drop
of blood was wiped away and the finger was again massaged gently until a second large
drop of blood formed.
A quality control check of this device was performed after every 100 participants, using the
manufacturer’s operating guidelines.
HbA1c was classified as diabetes (≥48 mmol/mol) and pre-diabetes (≥39 to 47 mmol/mol)
according to the guidelines of the American Diabetes Association (American Diabetes
Association, 2016). The National Cholesterol Education Program (NCEP), Adult
Treatment Panel III (ATP III) guidelines were used to classify lipid profile; high total
cholesterol (TC) (≥5.2 mmol/L), high triglyceride (TG) (≥1.7 mmol/L), high low-density
lipoprotein-cholesterol (LDL) (≥3.4 mmol/L), low high-density lipoprotein-cholesterol
(HDL) (<1.3 mmol/L for women, <1.0 mmol/L for men), and high non-HDL (≥4.1
mmol/L) (Grundy et al., 2002). High TC to HDL cholesterol was defined as the ratio ≥5.0.
97
CVD risk prediction
Estimated 10-year risks of fatal or non-fatal cardiovascular events (myocardial infarction
(MI) or stroke) were calculated using the validated risk prediction chart designed by WHO
and the International Society of Hypertension (ISH) for the WHO region of South-East
Asia, sub-region D (Mendis et al., 2007). The risk categories were defined as low (less than
10%), moderate (equal to or greater than 10% and lower than 20%), high (equal to or
greater than 20% and lower than 30%), and very high (equal to or greater than 30%)
(World Health Organization, 2007a). This risk prediction chart follows the total
cardiovascular risk assessment approach and requires six components: presence or absence
of diabetes, gender, smoker or non-smoker, age, systolic blood pressure (SBP), and TC.
4.4.2 Questionnaire for Verifying Stroke-Free Status
The QVSFS was administered to estimate prevalence of cerebrovascular disease – stroke
or transient ischemic attack (TIA) (Jones, Williams, & Meschia, 2001). This questionnaire
was chosen because it has high face validity and was developed by the American Heart
Association. Efforts are also underway to use it in low-and middle-income countries where
people have a low literacy level and very limited knowledge of stroke and its symptoms
(Sarfo et al., 2016). The questionnaire consists of eight structured questions related to the
history of stroke or TIA as confirmed by a medical doctor, and positive symptoms of
stroke (sudden weakness and numbness on one side of the body, sudden loss in one or both
eyes or one-half vision, sudden loss of ability to understand and express verbally or in
writing).
Questions were modified for the local context and culture. Content validity was assessed
by discussion with clinical members of Shahid Gangalal National Heart Hospital, Nepal.
The accuracy of the English–Nepalese translation was checked by back-translation. Face
validity was tested by piloting the questionnaire during the training session for the local
research assistants.
4.4.3 Electrocardiography recordings
The 12-lead ECG was recorded using a portable Edan SE-600 instrument. Participants
were asked to remove clothing from the chest area, lie flat with face up, arms at sides and
98
legs uncrossed. Oily, sweaty, or clammy skin was wiped with alcohol swabs. Electrodes
were placed on the chest in accordance with standard practice and connected with colour-
coded leads. Artefacts due to alternating current (AC) interference was a particular
problem, which was solved by using only the battery back up of the instrument. Qualified
female nurses recorded the ECG results and other team members assisted when required.
The prevalence of coronary heart disease (CHD) was defined as the presence of
pathological Q waves in the ECG or self-report of personal history of CHD (previous event
of MI or chest pain from heart disease (angina)). Left ventricular hypertrophy (LVH) was
assessed using the commonly used Sokolow-Lyon (Sokolow & Lyon, 1949) and the
stricter definition of Romhilt and Estes (Romhilt & Estes, 1968). After review by a
cardiologist using standard widely accepted criteria, ECG recordings were categorized as
definitely abnormal, for example showing evidence of previous MI; borderline, non-
specific T-wave flattening/inversion or one or more features suggesting possible LVH that
did not fully meet accepted criteria defined by the published definitions we used; or
normal. If there was a consistent QRS vector in the bipolar leads (I, II, III, aVR, aVL, aVF)
then axis could be assessed. QRS axis was otherwise determined using the conventional
frontal plane system with the leftward-pointing horizontal axis ascribed an axis of 0o,
positive axes the following in a clockwise direction and negative values anticlockwise. Left
axis deviation was determined if the QRS axis was lower than -30° and right axis deviation
was determined if the QRS axis was greater than +90°.
4.5 Data collection procedures
4.5.1 Training and standardization of research personnel
The Student Investigator (SI) and Research Assistants (RAs) were trained and standardized
regarding data collection measurements. RAs were public health graduates, nurses with
previous research experience, and local community health workers.
Training sessions were organized for three days with three hours of sessions each day. On
the first day, the SI provided orientation on the aims and protocol of the study, contents of
the questionnaires, and ethical considerations. RAs practiced the full-length questionnaire.
On the second day, they were provided with blood pressure and anthropometric
99
measurement training. Finally, they were oriented on the operation of the Cobas b 101
instrument for HbA1c and lipid profile, and ECG.
The SI was earlier provided training on the use of the Cobas b 101 instrument by
manufacturer staff members (Roche Diagnostics NZ). He also got ECG-related training
from a cardiac physiologist and a biomedical technician at Wellington Regional Hospital,
New Zealand.
4.5.2 Data collection techniques
The research team held a consultation meeting with local community leaders and apprised
them of the aims of the study. The community leaders were asked to disseminate
information about the study through their channels. Local RAs also informed the
communities about the study. Administering the questionnaires and BP measurements were
carried out at the selected participants’ homes. Practically, it was not feasible to undertake
blood sample testing, ECG recordings and bio-physical measurements in individual houses
so a local community hall was used as the measurement facility. Participants were asked to
come for these measurements at a time suitable for them.
Blood samples were processed separately in a disc for blood lipids and HbA1c. After use
all discs and ECG electrodes were stored in a closed container and deposited in the clinical
waste bins of the local health facility. Finally, they were disposed of according to the
current Safe Operational Procedure (SOP) for blood disposal in the clinical setting of
Nepal.
Data was collected from June to August (summer) 2014 in the Mustang district and March
to May (spring) 2015 in the Humla district. The ambient temperature was between 25 and
31 degrees Celsius in Mustang and around 15 degrees Celsius in Humla on most of the
study days.
The non-response rate was 18/521 (3.4%). The most common reason for non-participation
was unwillingness to provide a blood sample due to the cultural belief that it would make
you sick.
100
4.6 Data processing and statistical methods
The data from questionnaires, and the bio-physical and bio-chemical measurements were
captured on a single form. Data was entered into a spreadsheet programme after the field
level data was collected. The SI double-checked the accuracy of the data and then exported
it into the statistical package.
Data was analyzed in three stages. In the first stage, descriptive statistics were generated
using mean, standard deviation, frequency and percentages. The Clopper-Pearson method
was used to estimate an exact confidence interval for a single proportion. All results are
presented for each level of altitude. In the second stage, analysis of variance (ANOVA)
and analysis of covariance (ANCOVA) models for the relationship between SBP, diastolic
blood pressure (DBP) and altitude are shown. In the third stage, logistic regression was
used to estimate the association between an abnormal (or borderline abnormal) ECG and
altitude in univariate and multivariate models. Relevant parametric and non-parametric
tests of quantitative and categorical data, and the odds ratios (OR) for the comparisons of
the groups are shown as appropriate. Altitude was treated as a continuous variable in the
multivariate models. The strength of the associations is described as strong, moderate, and
weak at the significance level of P <0.01, P=0.01 to 0.05, and P=0.06 to 0.10 respectively.
Assumptions for the statistical analysis of ANOVA and ANCOVA models were examined.
Normality assumptions were examined by inspecting standardized residual plots. Linearity
and homoscedasticity assumptions were examined by inspecting studentized residuals
versus predicted value plots. Outliers were reviewed by inspection of leverage versus
residuals squared plots. Particular data points were reviewed carefully if more than 5% of
the cases had a standardized residual value of greater than 2. Sensitivity analysis tests were
also performed by examining changes in regression parameters with or without outliers.
For logistic regression models, assumption of linearity between logarithm of odds of
abnormal (or borderline abnormal) ECG and explanatory variables were examined by
LOWESS plot.
STATA version 12 was used for statistical analysis.
101
4.7 Ethical considerations
This study was approved by the ethical review board of the Nepal Health Research Council
(NHRC) and the University of Otago Human Ethics Committee. Information sheets and
consent forms were provided in Nepalese language. The participants were informed that
they could ask questions at any stage, had the right to withdraw at any point without giving
any reason, and their decision on whether or not to participate would not have any
consequences whatsoever. A written consent was sought where possible. In cases where
participants were not literate, witnessed oral consent was given.
There was no significant risk involved with this research, although the finger-prick blood
taking process can be painful for some people. Participants were informed of this risk.
Privacy of information was maintained. Temporarily stored paper or electronic data was
partially de-identified with reference to participants by using a numerical code known only
to the SI and kept securely in the University of Otago, Wellington, New Zealand.
The preliminary findings of the study were presented at the District Health Office of
Mustang district and among local community health workers in the Humla district.
4.8 Candidate’s role in the study
The candidate was involved in the design, development of the proposal, the ethical
approval process, field level data collection, data entry, statistical analysis and report
writing with the help of his supervisors.
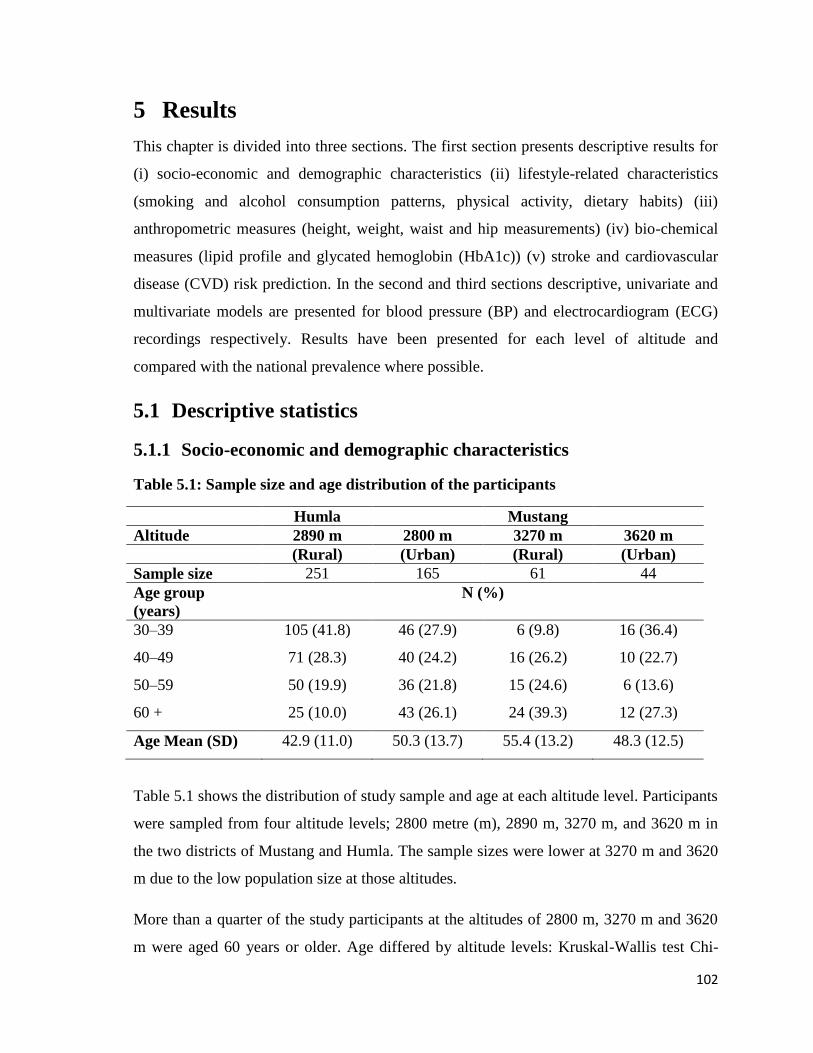
102
5 Results
This chapter is divided into three sections. The first section presents descriptive results for
(i) socio-economic and demographic characteristics (ii) lifestyle-related characteristics
(smoking and alcohol consumption patterns, physical activity, dietary habits) (iii)
anthropometric measures (height, weight, waist and hip measurements) (iv) bio-chemical
measures (lipid profile and glycated hemoglobin (HbA1c)) (v) stroke and cardiovascular
disease (CVD) risk prediction. In the second and third sections descriptive, univariate and
multivariate models are presented for blood pressure (BP) and electrocardiogram (ECG)
recordings respectively. Results have been presented for each level of altitude and
compared with the national prevalence where possible.
5.1 Descriptive statistics
5.1.1 Socio-economic and demographic characteristics
Table 5.1: Sample size and age distribution of the participants
Humla Mustang
Altitude 2890 m 2800 m 3270 m 3620 m
(Rural) (Urban) (Rural) (Urban)
Sample size 251 165 61 44
Age group
(years)
N (%)
30–39 105 (41.8) 46 (27.9) 6 (9.8) 16 (36.4)
40–49 71 (28.3) 40 (24.2) 16 (26.2) 10 (22.7)
50–59 50 (19.9) 36 (21.8) 15 (24.6) 6 (13.6)
60 + 25 (10.0) 43 (26.1) 24 (39.3) 12 (27.3)
Age Mean (SD) 42.9 (11.0) 50.3 (13.7) 55.4 (13.2) 48.3 (12.5)
Table 5.1 shows the distribution of study sample and age at each altitude level. Participants
were sampled from four altitude levels; 2800 metre (m), 2890 m, 3270 m, and 3620 m in
the two districts of Mustang and Humla. The sample sizes were lower at 3270 m and 3620
m due to the low population size at those altitudes.
More than a quarter of the study participants at the altitudes of 2800 m, 3270 m and 3620
m were aged 60 years or older. Age differed by altitude levels: Kruskal-Wallis test Chi-
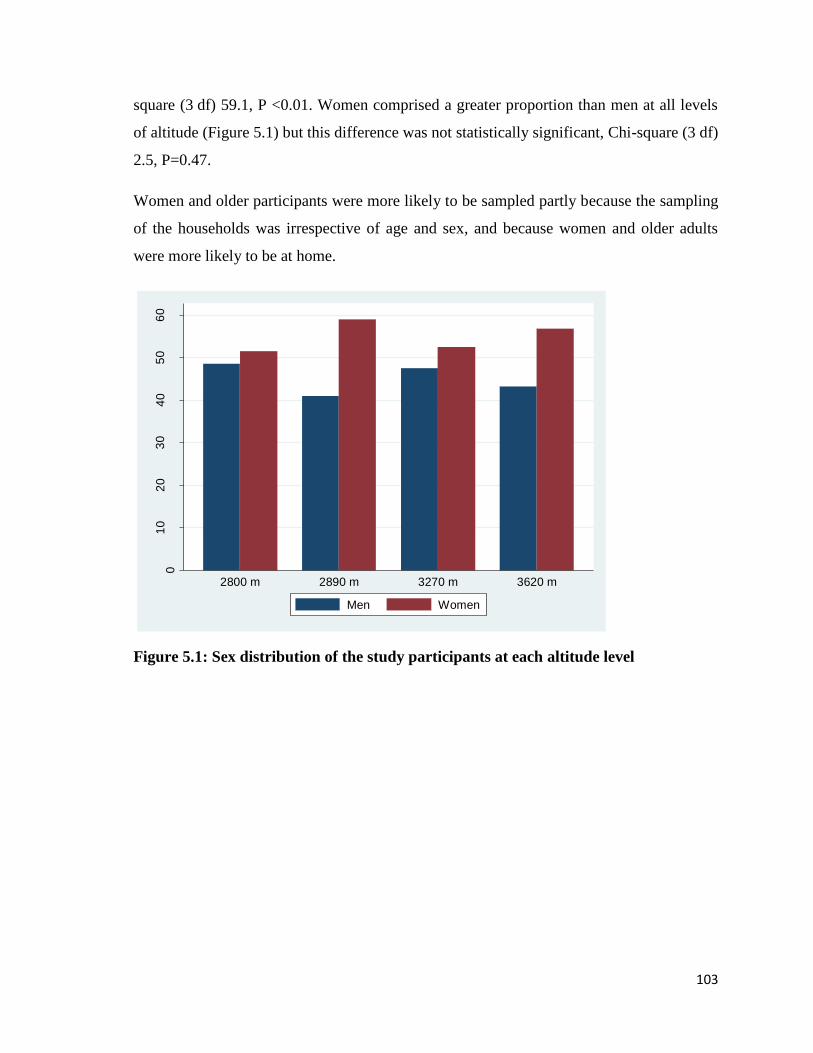
103
square (3 df) 59.1, P <0.01. Women comprised a greater proportion than men at all levels
of altitude (Figure 5.1) but this difference was not statistically significant, Chi-square (3 df)
2.5, P=0.47.
Women and older participants were more likely to be sampled partly because the sampling
of the households was irrespective of age and sex, and because women and older adults
were more likely to be at home.
Figure 5.1: Sex distribution of the study participants at each altitude level
01
02
03
04
05
06
0
Pro
po
rtio
n (
%)
2800 m 2890 m 3270 m 3620 m
Men Women
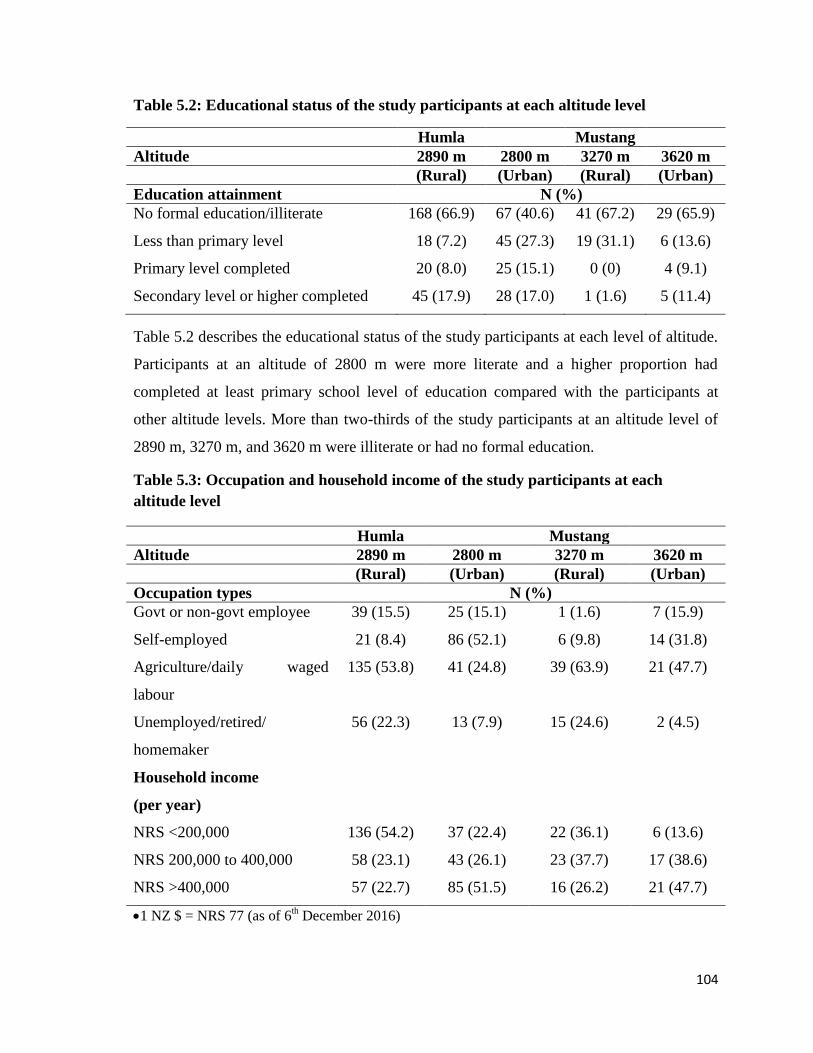
104
Table 5.2: Educational status of the study participants at each altitude level
Humla Mustang
Altitude 2890 m 2800 m 3270 m 3620 m
(Rural) (Urban) (Rural) (Urban)
Education attainment N (%)
No formal education/illiterate 168 (66.9) 67 (40.6) 41 (67.2) 29 (65.9)
Less than primary level 18 (7.2) 45 (27.3) 19 (31.1) 6 (13.6)
Primary level completed 20 (8.0) 25 (15.1) 0 (0) 4 (9.1)
Secondary level or higher completed 45 (17.9) 28 (17.0) 1 (1.6) 5 (11.4)
Table 5.2 describes the educational status of the study participants at each level of altitude.
Participants at an altitude of 2800 m were more literate and a higher proportion had
completed at least primary school level of education compared with the participants at
other altitude levels. More than two-thirds of the study participants at an altitude level of
2890 m, 3270 m, and 3620 m were illiterate or had no formal education.
Table 5.3: Occupation and household income of the study participants at each
altitude level
Humla Mustang
Altitude 2890 m 2800 m 3270 m 3620 m
(Rural) (Urban) (Rural) (Urban)
Occupation types N (%)
Govt or non-govt employee 39 (15.5) 25 (15.1) 1 (1.6) 7 (15.9)
Self-employed 21 (8.4) 86 (52.1) 6 (9.8) 14 (31.8)
Agriculture/daily waged
labour
135 (53.8) 41 (24.8) 39 (63.9) 21 (47.7)
Unemployed/retired/
homemaker
56 (22.3) 13 (7.9) 15 (24.6) 2 (4.5)
Household income
(per year)
NRS <200,000 136 (54.2) 37 (22.4) 22 (36.1) 6 (13.6)
NRS 200,000 to 400,000 58 (23.1) 43 (26.1) 23 (37.7) 17 (38.6)
NRS >400,000 57 (22.7) 85 (51.5) 16 (26.2) 21 (47.7)
1 NZ $ = NRS 77 (as of 6th December 2016)
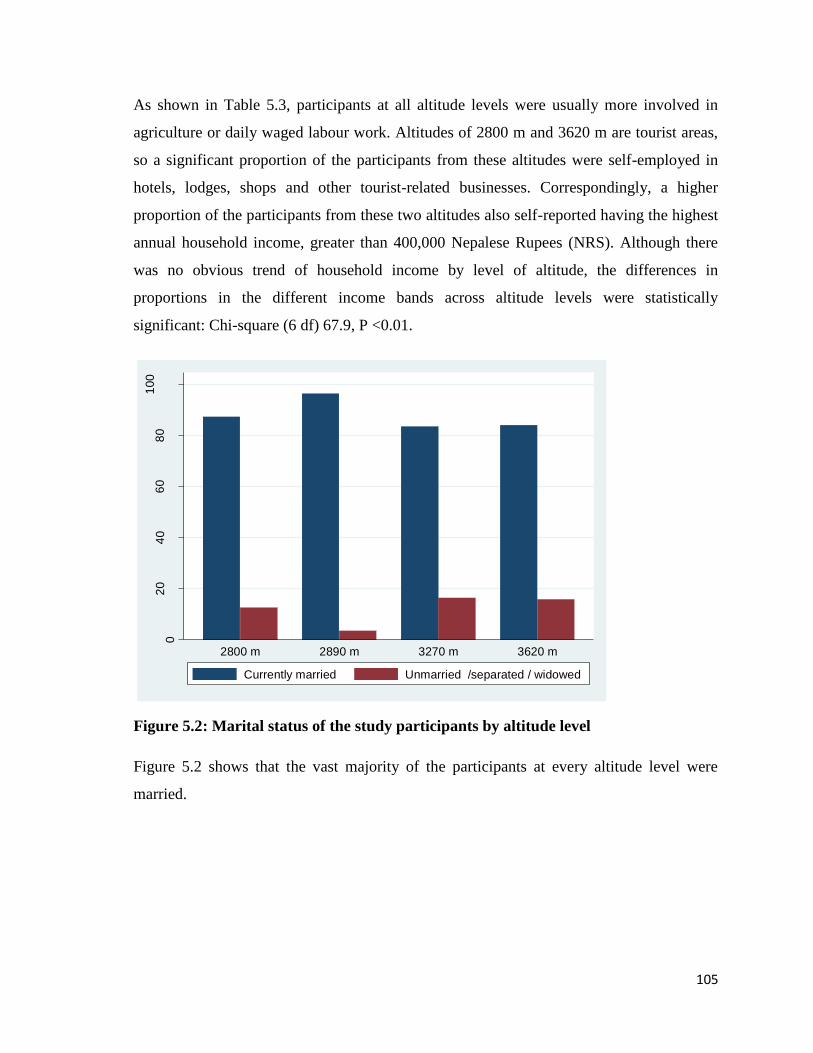
105
As shown in Table 5.3, participants at all altitude levels were usually more involved in
agriculture or daily waged labour work. Altitudes of 2800 m and 3620 m are tourist areas,
so a significant proportion of the participants from these altitudes were self-employed in
hotels, lodges, shops and other tourist-related businesses. Correspondingly, a higher
proportion of the participants from these two altitudes also self-reported having the highest
annual household income, greater than 400,000 Nepalese Rupees (NRS). Although there
was no obvious trend of household income by level of altitude, the differences in
proportions in the different income bands across altitude levels were statistically
significant: Chi-square (6 df) 67.9, P <0.01.
Figure 5.2: Marital status of the study participants by altitude level
Figure 5.2 shows that the vast majority of the participants at every altitude level were
married.
02
04
06
08
01
00
Pro
po
rtio
n (
%)
2800 m 2890 m 3270 m 3620 m
Currently married Unmarried /separated / widowed
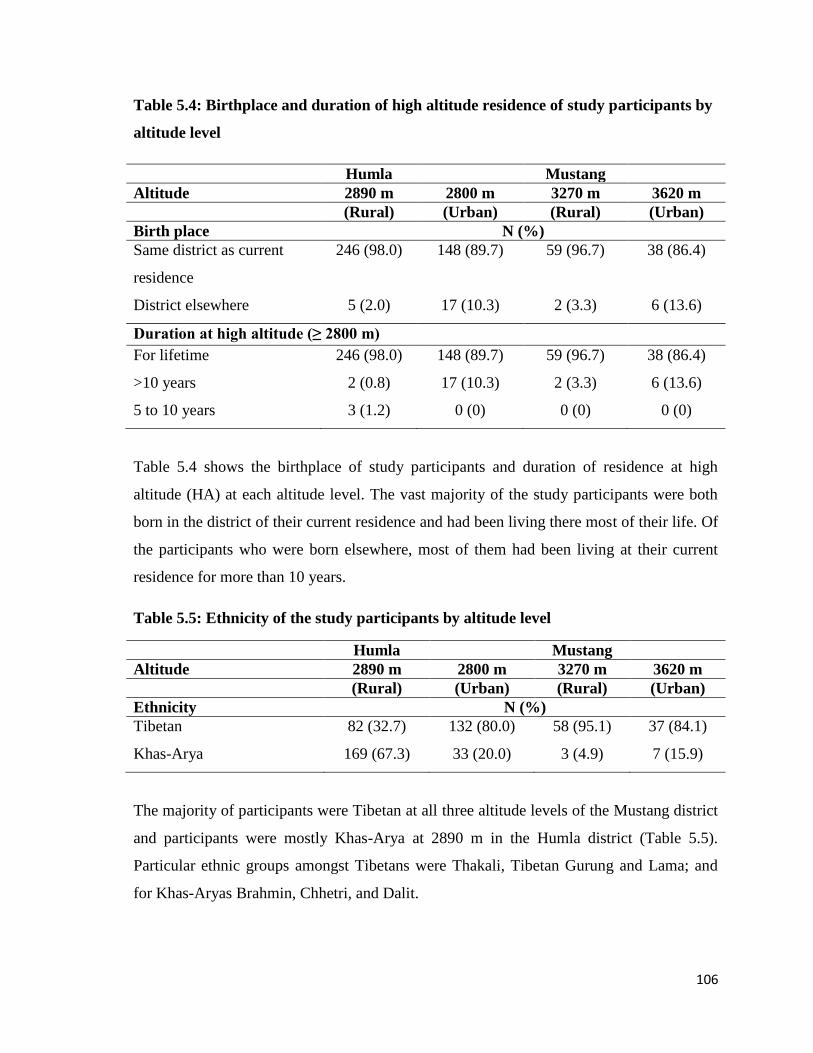
106
Table 5.4: Birthplace and duration of high altitude residence of study participants by
altitude level
Humla Mustang
Altitude 2890 m 2800 m 3270 m 3620 m
(Rural) (Urban) (Rural) (Urban)
Birth place N (%)
Same district as current
residence
246 (98.0) 148 (89.7) 59 (96.7) 38 (86.4)
District elsewhere 5 (2.0) 17 (10.3) 2 (3.3) 6 (13.6)
Duration at high altitude (≥ 2800 m)
For lifetime 246 (98.0) 148 (89.7) 59 (96.7) 38 (86.4)
>10 years 2 (0.8) 17 (10.3) 2 (3.3) 6 (13.6)
5 to 10 years 3 (1.2) 0 (0) 0 (0) 0 (0)
Table 5.4 shows the birthplace of study participants and duration of residence at high
altitude (HA) at each altitude level. The vast majority of the study participants were both
born in the district of their current residence and had been living there most of their life. Of
the participants who were born elsewhere, most of them had been living at their current
residence for more than 10 years.
Table 5.5: Ethnicity of the study participants by altitude level
Humla Mustang
Altitude 2890 m 2800 m 3270 m 3620 m
(Rural) (Urban) (Rural) (Urban)
Ethnicity N (%)
Tibetan 82 (32.7) 132 (80.0) 58 (95.1) 37 (84.1)
Khas-Arya 169 (67.3) 33 (20.0) 3 (4.9) 7 (15.9)
The majority of participants were Tibetan at all three altitude levels of the Mustang district
and participants were mostly Khas-Arya at 2890 m in the Humla district (Table 5.5).
Particular ethnic groups amongst Tibetans were Thakali, Tibetan Gurung and Lama; and
for Khas-Aryas Brahmin, Chhetri, and Dalit.
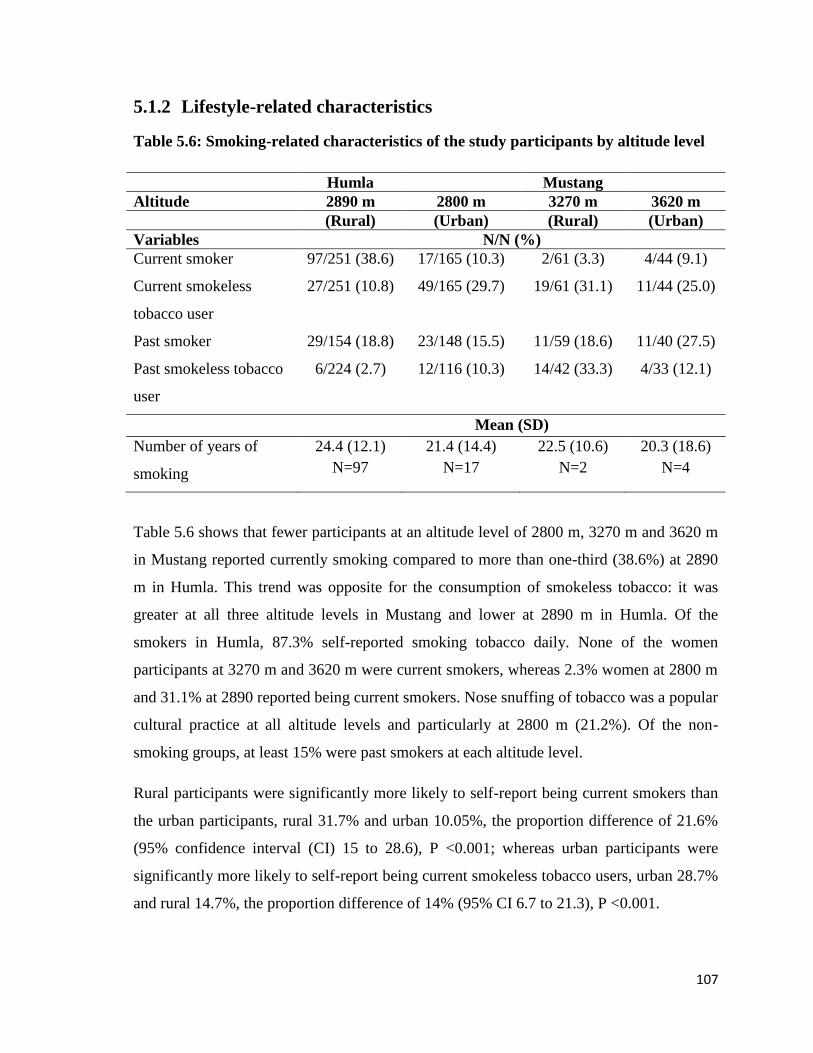
107
5.1.2 Lifestyle-related characteristics
Table 5.6: Smoking-related characteristics of the study participants by altitude level
Humla Mustang
Altitude 2890 m 2800 m 3270 m 3620 m
(Rural) (Urban) (Rural) (Urban)
Variables N/N (%)
Current smoker 97/251 (38.6) 17/165 (10.3) 2/61 (3.3) 4/44 (9.1)
Current smokeless
tobacco user
27/251 (10.8) 49/165 (29.7) 19/61 (31.1) 11/44 (25.0)
Past smoker 29/154 (18.8) 23/148 (15.5) 11/59 (18.6) 11/40 (27.5)
Past smokeless tobacco
user
6/224 (2.7) 12/116 (10.3) 14/42 (33.3) 4/33 (12.1)
Mean (SD)
Number of years of
smoking
24.4 (12.1)
N=97
21.4 (14.4)
N=17
22.5 (10.6)
N=2
20.3 (18.6)
N=4
Table 5.6 shows that fewer participants at an altitude level of 2800 m, 3270 m and 3620 m
in Mustang reported currently smoking compared to more than one-third (38.6%) at 2890
m in Humla. This trend was opposite for the consumption of smokeless tobacco: it was
greater at all three altitude levels in Mustang and lower at 2890 m in Humla. Of the
smokers in Humla, 87.3% self-reported smoking tobacco daily. None of the women
participants at 3270 m and 3620 m were current smokers, whereas 2.3% women at 2800 m
and 31.1% at 2890 reported being current smokers. Nose snuffing of tobacco was a popular
cultural practice at all altitude levels and particularly at 2800 m (21.2%). Of the non-
smoking groups, at least 15% were past smokers at each altitude level.
Rural participants were significantly more likely to self-report being current smokers than
the urban participants, rural 31.7% and urban 10.05%, the proportion difference of 21.6%
(95% confidence interval (CI) 15 to 28.6), P <0.001; whereas urban participants were
significantly more likely to self-report being current smokeless tobacco users, urban 28.7%
and rural 14.7%, the proportion difference of 14% (95% CI 6.7 to 21.3), P <0.001.
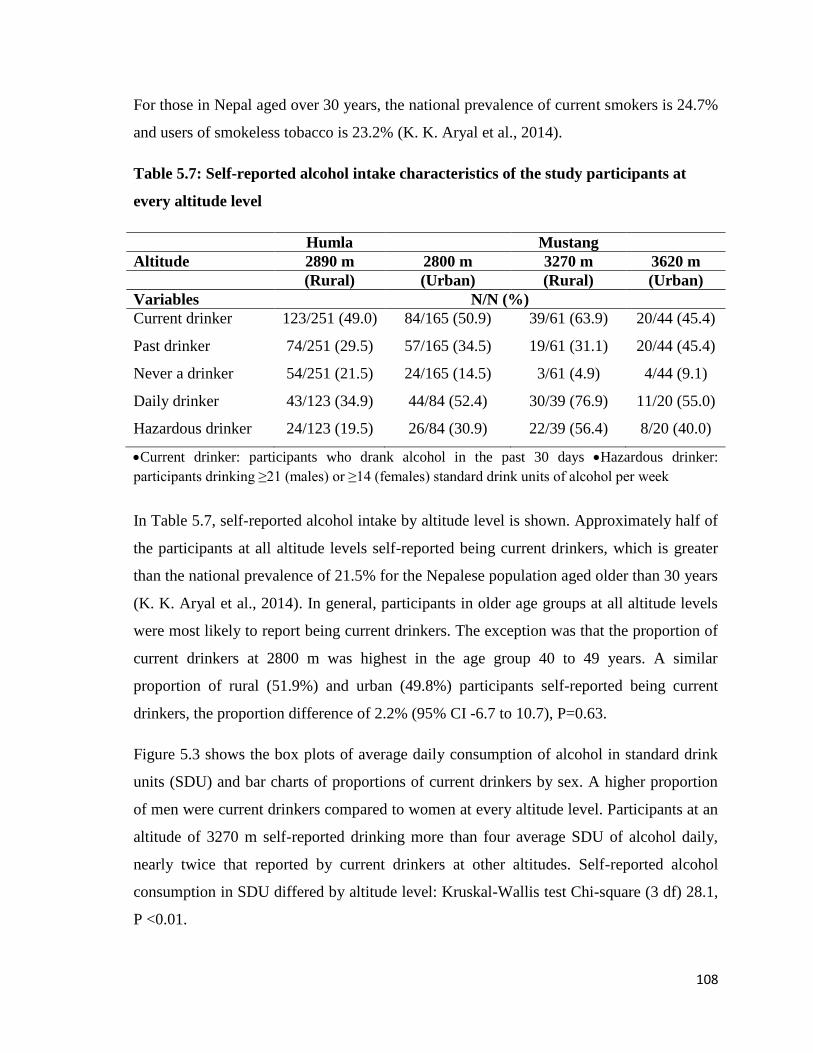
108
For those in Nepal aged over 30 years, the national prevalence of current smokers is 24.7%
and users of smokeless tobacco is 23.2% (K. K. Aryal et al., 2014).
Table 5.7: Self-reported alcohol intake characteristics of the study participants at
every altitude level
Humla Mustang
Altitude 2890 m 2800 m 3270 m 3620 m
(Rural) (Urban) (Rural) (Urban)
Variables N/N (%)
Current drinker 123/251 (49.0) 84/165 (50.9) 39/61 (63.9) 20/44 (45.4)
Past drinker 74/251 (29.5) 57/165 (34.5) 19/61 (31.1) 20/44 (45.4)
Never a drinker 54/251 (21.5) 24/165 (14.5) 3/61 (4.9) 4/44 (9.1)
Daily drinker 43/123 (34.9) 44/84 (52.4) 30/39 (76.9) 11/20 (55.0)
Hazardous drinker 24/123 (19.5) 26/84 (30.9) 22/39 (56.4) 8/20 (40.0)
Current drinker: participants who drank alcohol in the past 30 days Hazardous drinker:
participants drinking ≥21 (males) or ≥14 (females) standard drink units of alcohol per week
In Table 5.7, self-reported alcohol intake by altitude level is shown. Approximately half of
the participants at all altitude levels self-reported being current drinkers, which is greater
than the national prevalence of 21.5% for the Nepalese population aged older than 30 years
(K. K. Aryal et al., 2014). In general, participants in older age groups at all altitude levels
were most likely to report being current drinkers. The exception was that the proportion of
current drinkers at 2800 m was highest in the age group 40 to 49 years. A similar
proportion of rural (51.9%) and urban (49.8%) participants self-reported being current
drinkers, the proportion difference of 2.2% (95% CI -6.7 to 10.7), P=0.63.
Figure 5.3 shows the box plots of average daily consumption of alcohol in standard drink
units (SDU) and bar charts of proportions of current drinkers by sex. A higher proportion
of men were current drinkers compared to women at every altitude level. Participants at an
altitude of 3270 m self-reported drinking more than four average SDU of alcohol daily,
nearly twice that reported by current drinkers at other altitudes. Self-reported alcohol
consumption in SDU differed by altitude level: Kruskal-Wallis test Chi-square (3 df) 28.1,
P <0.01.
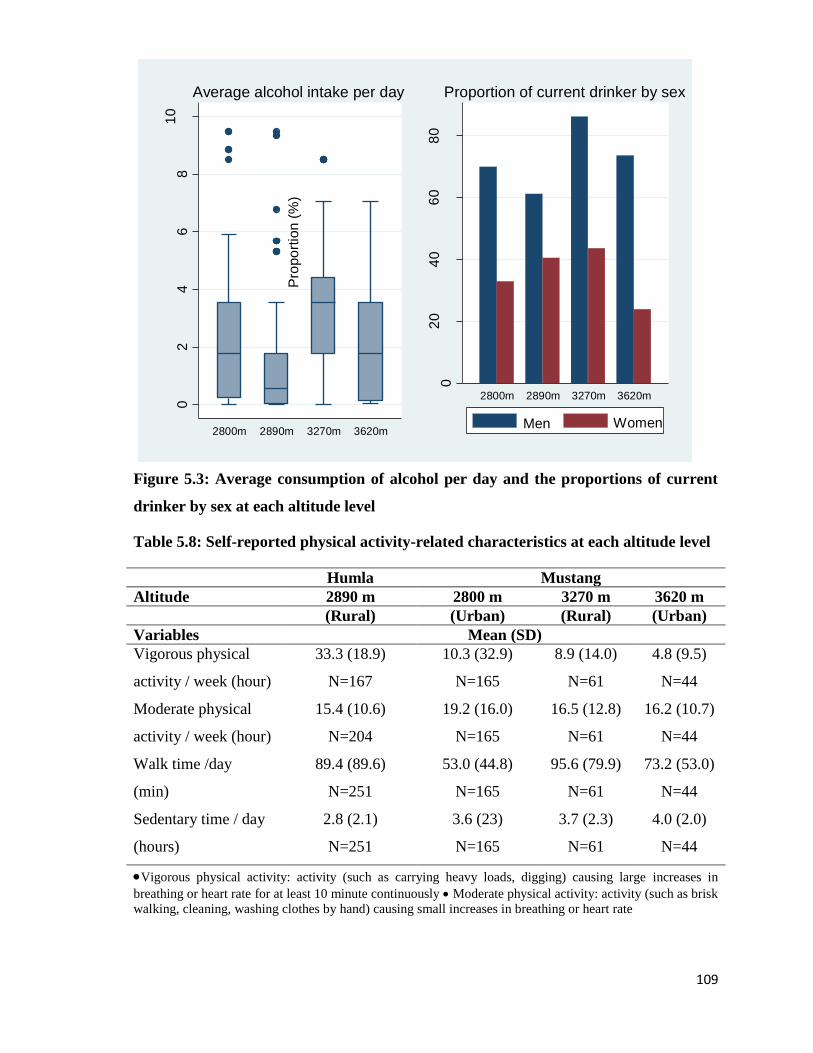
109
Figure 5.3: Average consumption of alcohol per day and the proportions of current
drinker by sex at each altitude level
Table 5.8: Self-reported physical activity-related characteristics at each altitude level
Humla Mustang
Altitude 2890 m 2800 m 3270 m 3620 m
(Rural) (Urban) (Rural) (Urban)
Variables Mean (SD)
Vigorous physical
activity / week (hour)
33.3 (18.9)
N=167
10.3 (32.9)
N=165
8.9 (14.0)
N=61
4.8 (9.5)
N=44
Moderate physical
activity / week (hour)
15.4 (10.6)
N=204
19.2 (16.0)
N=165
16.5 (12.8)
N=61
16.2 (10.7)
N=44
Walk time /day
(min)
89.4 (89.6)
N=251
53.0 (44.8)
N=165
95.6 (79.9)
N=61
73.2 (53.0)
N=44
Sedentary time / day
(hours)
2.8 (2.1)
N=251
3.6 (23)
N=165
3.7 (2.3)
N=61
4.0 (2.0)
N=44
Vigorous physical activity: activity (such as carrying heavy loads, digging) causing large increases in
breathing or heart rate for at least 10 minute continuously Moderate physical activity: activity (such as brisk
walking, cleaning, washing clothes by hand) causing small increases in breathing or heart rate
02
46
81
0
Sta
nda
rd d
rink u
nit o
f alc
oh
ol
2800m 2890m 3270m 3620m
Average alcohol intake per day
02
04
06
08
0
Pro
po
rtio
n (
%)
2800m 2890m 3270m 3620m
Proportion of current drinker by sex
Men Women
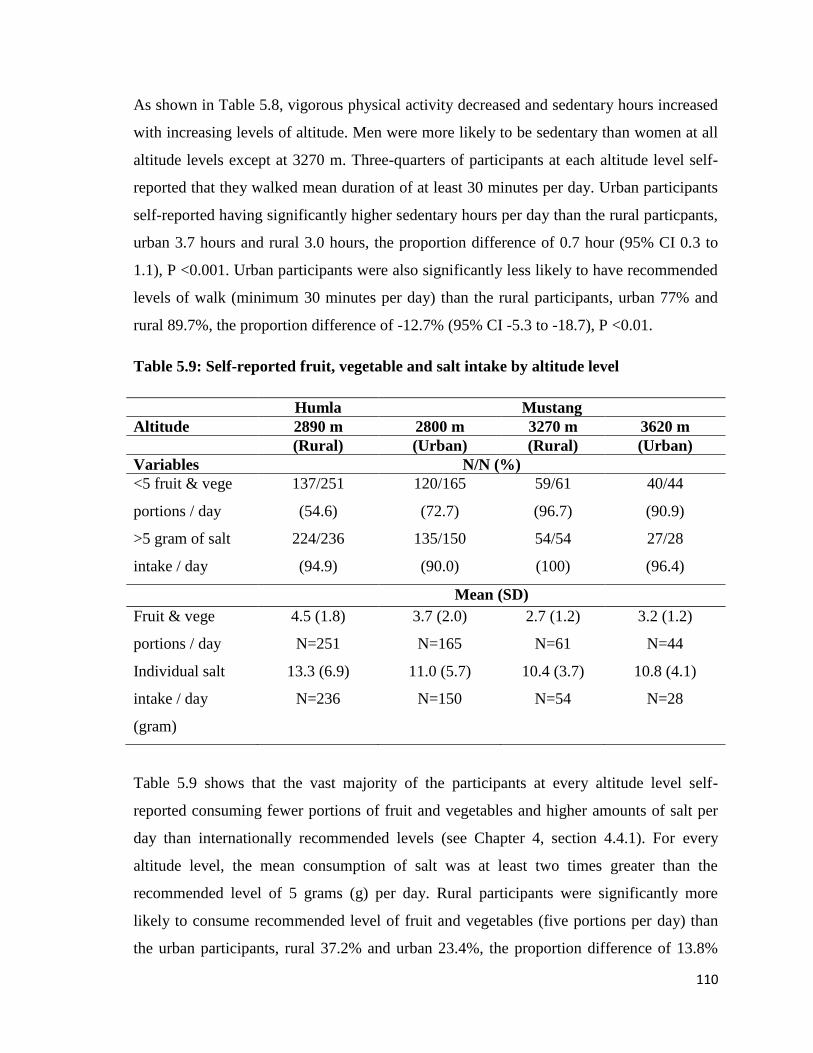
110
As shown in Table 5.8, vigorous physical activity decreased and sedentary hours increased
with increasing levels of altitude. Men were more likely to be sedentary than women at all
altitude levels except at 3270 m. Three-quarters of participants at each altitude level self-
reported that they walked mean duration of at least 30 minutes per day. Urban participants
self-reported having significantly higher sedentary hours per day than the rural particpants,
urban 3.7 hours and rural 3.0 hours, the proportion difference of 0.7 hour (95% CI 0.3 to
1.1), P <0.001. Urban participants were also significantly less likely to have recommended
levels of walk (minimum 30 minutes per day) than the rural participants, urban 77% and
rural 89.7%, the proportion difference of -12.7% (95% CI -5.3 to -18.7), P <0.01.
Table 5.9: Self-reported fruit, vegetable and salt intake by altitude level
Humla Mustang
Altitude 2890 m 2800 m 3270 m 3620 m
(Rural) (Urban) (Rural) (Urban)
Variables N/N (%)
<5 fruit & vege
portions / day
137/251
(54.6)
120/165
(72.7)
59/61
(96.7)
40/44
(90.9)
>5 gram of salt
intake / day
224/236
(94.9)
135/150
(90.0)
54/54
(100)
27/28
(96.4)
Mean (SD)
Fruit & vege
portions / day
4.5 (1.8)
N=251
3.7 (2.0)
N=165
2.7 (1.2)
N=61
3.2 (1.2)
N=44
Individual salt
intake / day
(gram)
13.3 (6.9)
N=236
11.0 (5.7)
N=150
10.4 (3.7)
N=54
10.8 (4.1)
N=28
Table 5.9 shows that the vast majority of the participants at every altitude level self-
reported consuming fewer portions of fruit and vegetables and higher amounts of salt per
day than internationally recommended levels (see Chapter 4, section 4.4.1). For every
altitude level, the mean consumption of salt was at least two times greater than the
recommended level of 5 grams (g) per day. Rural participants were significantly more
likely to consume recommended level of fruit and vegetables (five portions per day) than
the urban participants, rural 37.2% and urban 23.4%, the proportion difference of 13.8%
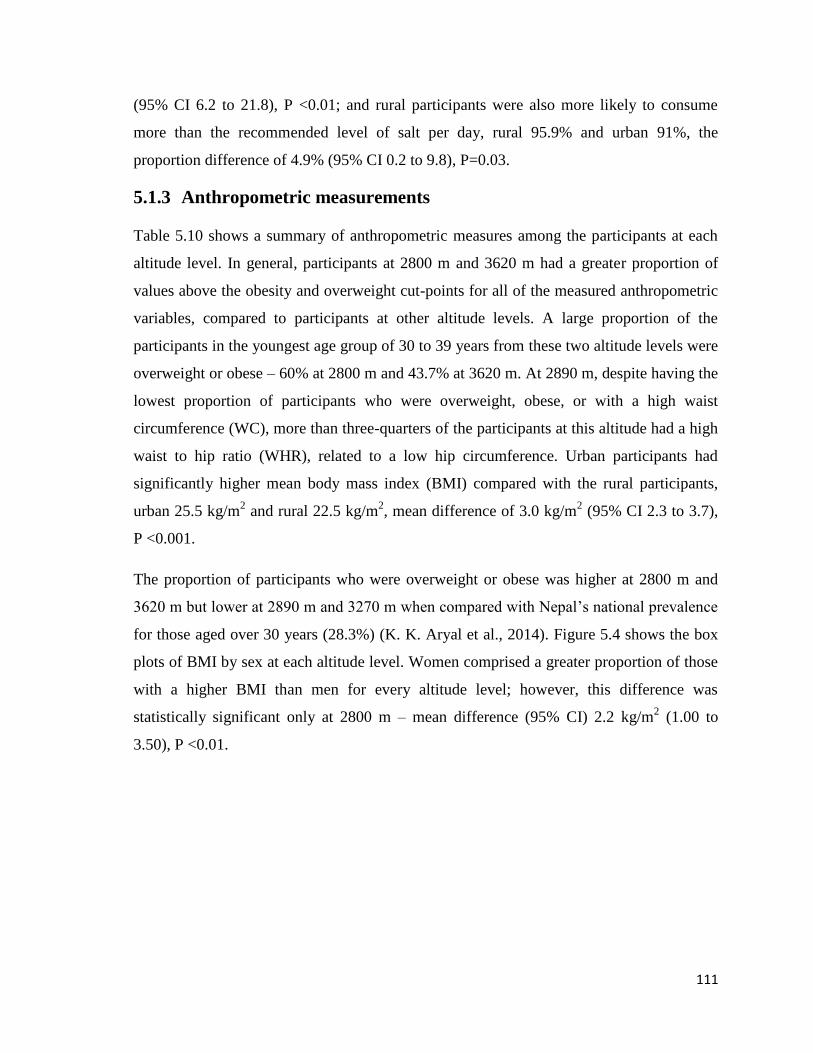
111
(95% CI 6.2 to 21.8), P <0.01; and rural participants were also more likely to consume
more than the recommended level of salt per day, rural 95.9% and urban 91%, the
proportion difference of 4.9% (95% CI 0.2 to 9.8), P=0.03.
5.1.3 Anthropometric measurements
Table 5.10 shows a summary of anthropometric measures among the participants at each
altitude level. In general, participants at 2800 m and 3620 m had a greater proportion of
values above the obesity and overweight cut-points for all of the measured anthropometric
variables, compared to participants at other altitude levels. A large proportion of the
participants in the youngest age group of 30 to 39 years from these two altitude levels were
overweight or obese – 60% at 2800 m and 43.7% at 3620 m. At 2890 m, despite having the
lowest proportion of participants who were overweight, obese, or with a high waist
circumference (WC), more than three-quarters of the participants at this altitude had a high
waist to hip ratio (WHR), related to a low hip circumference. Urban participants had
significantly higher mean body mass index (BMI) compared with the rural participants,
urban 25.5 kg/m2 and rural 22.5 kg/m
2, mean difference of 3.0 kg/m
2 (95% CI 2.3 to 3.7),
P <0.001.
The proportion of participants who were overweight or obese was higher at 2800 m and
3620 m but lower at 2890 m and 3270 m when compared with Nepal’s national prevalence
for those aged over 30 years (28.3%) (K. K. Aryal et al., 2014). Figure 5.4 shows the box
plots of BMI by sex at each altitude level. Women comprised a greater proportion of those
with a higher BMI than men for every altitude level; however, this difference was
statistically significant only at 2800 m – mean difference (95% CI) 2.2 kg/m2 (1.00 to
3.50), P <0.01.
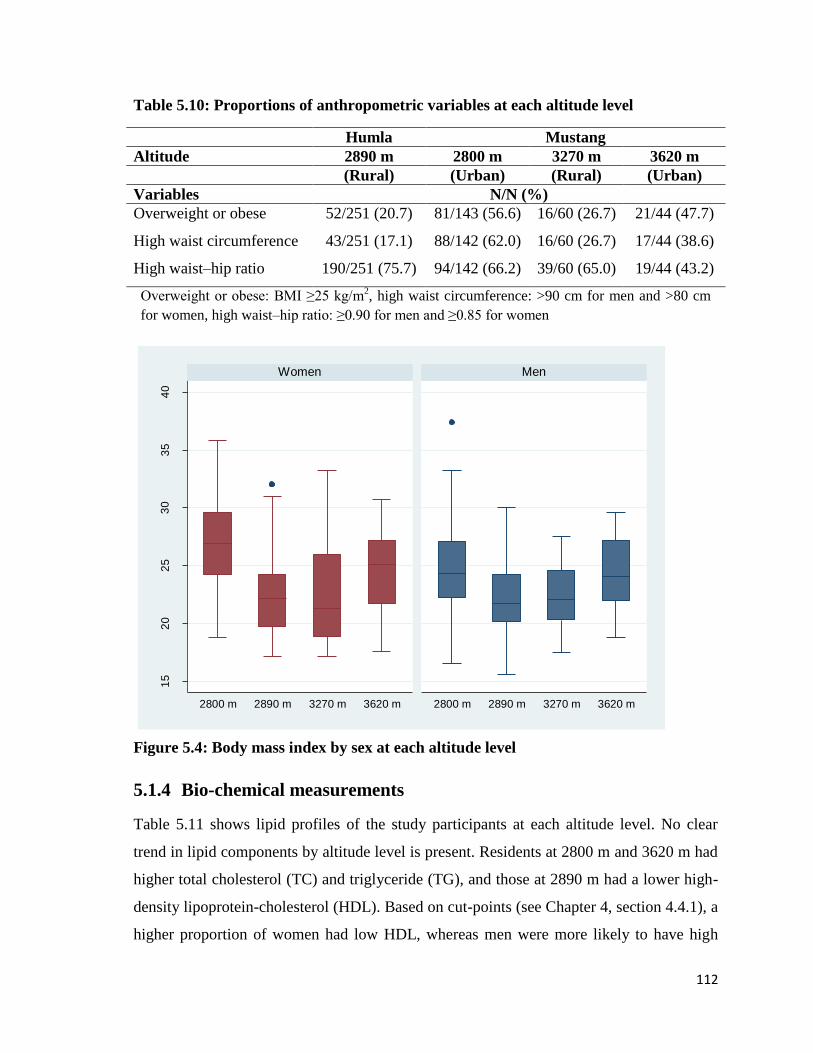
112
Table 5.10: Proportions of anthropometric variables at each altitude level
Humla Mustang
Altitude 2890 m 2800 m 3270 m 3620 m
(Rural) (Urban) (Rural) (Urban)
Variables N/N (%)
Overweight or obese 52/251 (20.7) 81/143 (56.6) 16/60 (26.7) 21/44 (47.7)
High waist circumference 43/251 (17.1) 88/142 (62.0) 16/60 (26.7) 17/44 (38.6)
High waist–hip ratio 190/251 (75.7) 94/142 (66.2) 39/60 (65.0) 19/44 (43.2)
Overweight or obese: BMI ≥25 kg/m2, high waist circumference: >90 cm for men and >80 cm
for women, high waist–hip ratio: ≥0.90 for men and ≥0.85 for women
Figure 5.4: Body mass index by sex at each altitude level
5.1.4 Bio-chemical measurements
Table 5.11 shows lipid profiles of the study participants at each altitude level. No clear
trend in lipid components by altitude level is present. Residents at 2800 m and 3620 m had
higher total cholesterol (TC) and triglyceride (TG), and those at 2890 m had a lower high-
density lipoprotein-cholesterol (HDL). Based on cut-points (see Chapter 4, section 4.4.1), a
higher proportion of women had low HDL, whereas men were more likely to have high
15
20
25
30
35
40
2800 m 2890 m 3270 m 3620 m 2800 m 2890 m 3270 m 3620 m
Women Men
Bo
dy m
ass in
de
x (
kg/m
2)
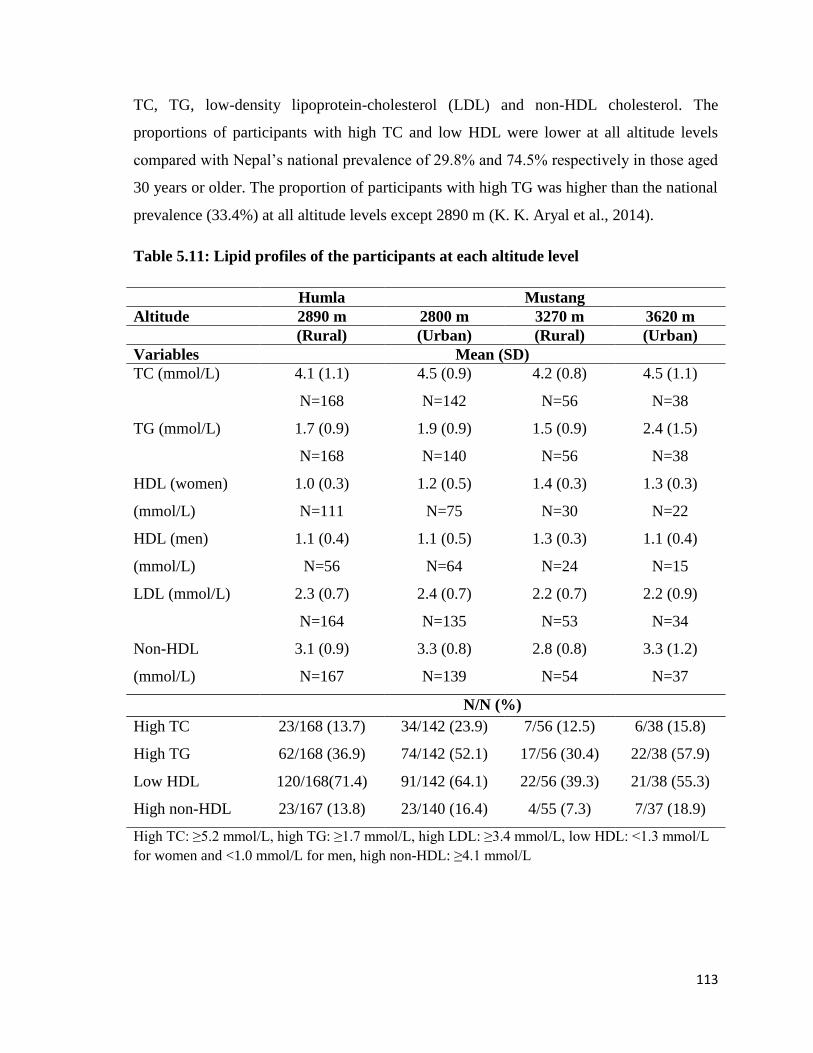
113
TC, TG, low-density lipoprotein-cholesterol (LDL) and non-HDL cholesterol. The
proportions of participants with high TC and low HDL were lower at all altitude levels
compared with Nepal’s national prevalence of 29.8% and 74.5% respectively in those aged
30 years or older. The proportion of participants with high TG was higher than the national
prevalence (33.4%) at all altitude levels except 2890 m (K. K. Aryal et al., 2014).
Table 5.11: Lipid profiles of the participants at each altitude level
Humla Mustang
Altitude 2890 m 2800 m 3270 m 3620 m
(Rural) (Urban) (Rural) (Urban)
Variables Mean (SD)
TC (mmol/L) 4.1 (1.1)
N=168
4.5 (0.9)
N=142
4.2 (0.8)
N=56
4.5 (1.1)
N=38
TG (mmol/L) 1.7 (0.9)
N=168
1.9 (0.9)
N=140
1.5 (0.9)
N=56
2.4 (1.5)
N=38
HDL (women)
(mmol/L)
1.0 (0.3)
N=111
1.2 (0.5)
N=75
1.4 (0.3)
N=30
1.3 (0.3)
N=22
HDL (men)
(mmol/L)
1.1 (0.4)
N=56
1.1 (0.5)
N=64
1.3 (0.3)
N=24
1.1 (0.4)
N=15
LDL (mmol/L) 2.3 (0.7)
N=164
2.4 (0.7)
N=135
2.2 (0.7)
N=53
2.2 (0.9)
N=34
Non-HDL
(mmol/L)
3.1 (0.9)
N=167
3.3 (0.8)
N=139
2.8 (0.8)
N=54
3.3 (1.2)
N=37
N/N (%)
High TC 23/168 (13.7) 34/142 (23.9) 7/56 (12.5) 6/38 (15.8)
High TG 62/168 (36.9) 74/142 (52.1) 17/56 (30.4) 22/38 (57.9)
Low HDL 120/168(71.4) 91/142 (64.1) 22/56 (39.3) 21/38 (55.3)
High non-HDL 23/167 (13.8) 23/140 (16.4) 4/55 (7.3) 7/37 (18.9)
High TC: ≥5.2 mmol/L, high TG: ≥1.7 mmol/L, high LDL: ≥3.4 mmol/L, low HDL: <1.3 mmol/L
for women and <1.0 mmol/L for men, high non-HDL: ≥4.1 mmol/L
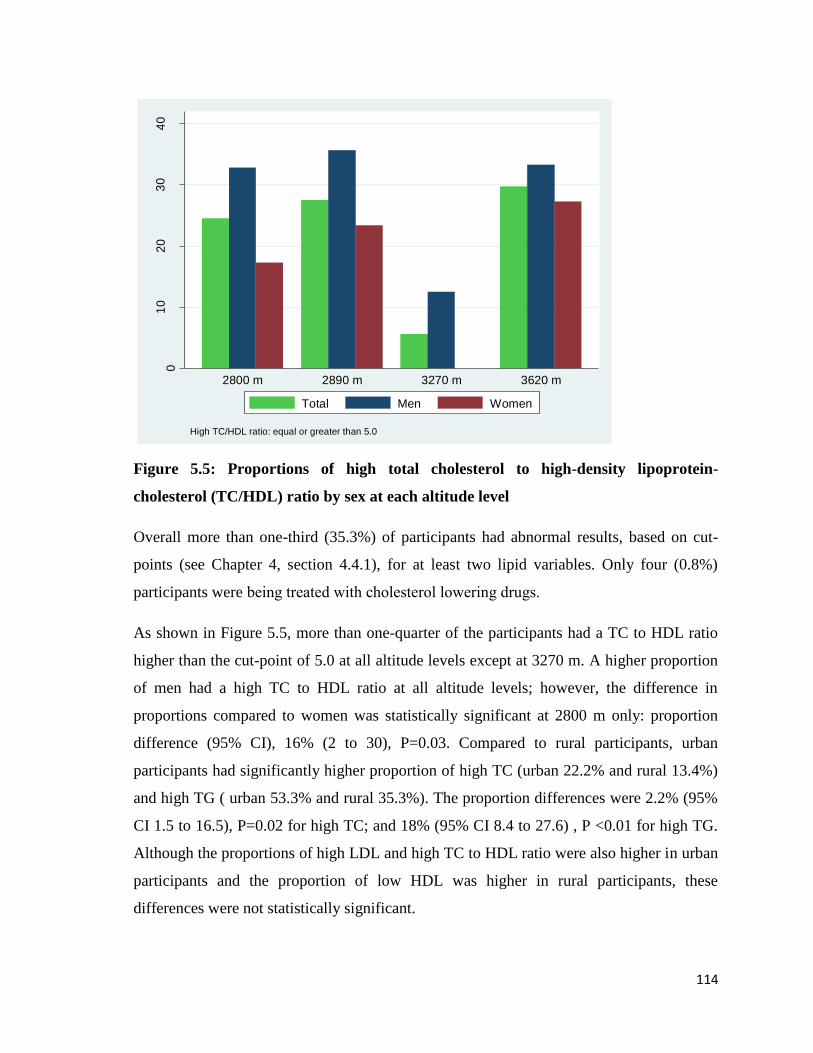
114
Figure 5.5: Proportions of high total cholesterol to high-density lipoprotein-
cholesterol (TC/HDL) ratio by sex at each altitude level
Overall more than one-third (35.3%) of participants had abnormal results, based on cut-
points (see Chapter 4, section 4.4.1), for at least two lipid variables. Only four (0.8%)
participants were being treated with cholesterol lowering drugs.
As shown in Figure 5.5, more than one-quarter of the participants had a TC to HDL ratio
higher than the cut-point of 5.0 at all altitude levels except at 3270 m. A higher proportion
of men had a high TC to HDL ratio at all altitude levels; however, the difference in
proportions compared to women was statistically significant at 2800 m only: proportion
difference (95% CI), 16% (2 to 30), P=0.03. Compared to rural participants, urban
participants had significantly higher proportion of high TC (urban 22.2% and rural 13.4%)
and high TG ( urban 53.3% and rural 35.3%). The proportion differences were 2.2% (95%
CI 1.5 to 16.5), P=0.02 for high TC; and 18% (95% CI 8.4 to 27.6) , P <0.01 for high TG.
Although the proportions of high LDL and high TC to HDL ratio were also higher in urban
participants and the proportion of low HDL was higher in rural participants, these
differences were not statistically significant.
01
02
03
04
0
Pro
po
rtio
n (
%)
2800 m 2890 m 3270 m 3620 m
High TC/HDL ratio: equal or greater than 5.0
Total Men Women
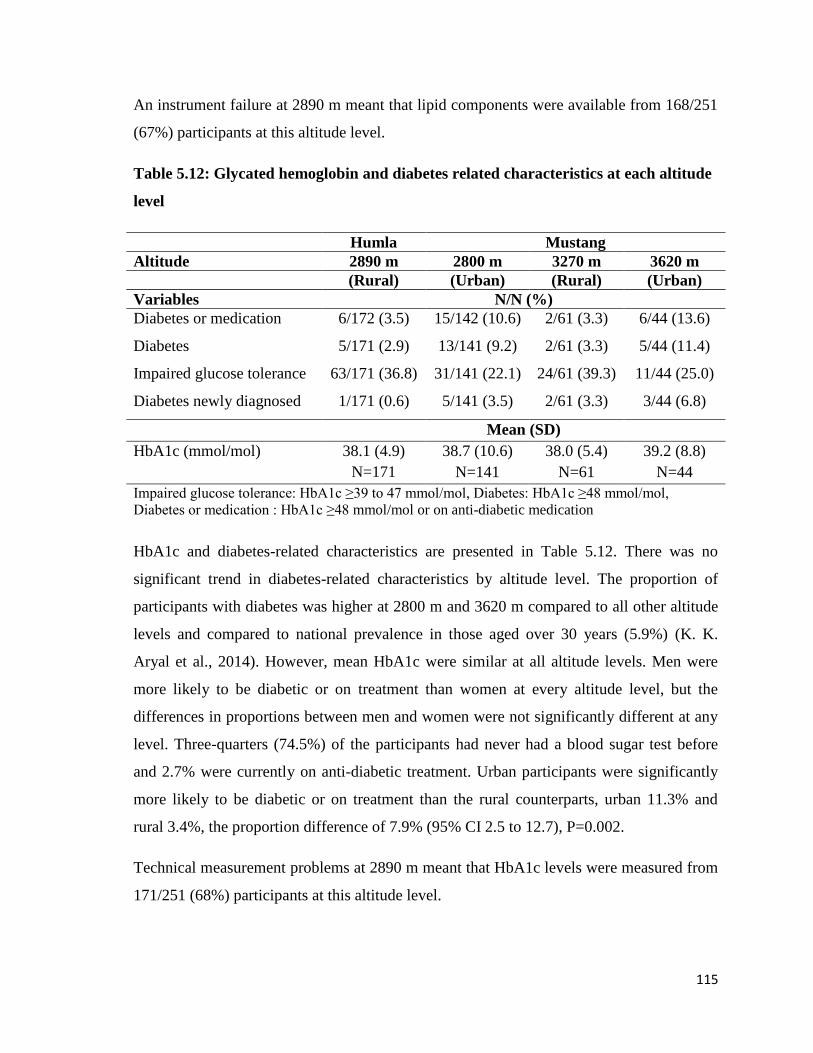
115
An instrument failure at 2890 m meant that lipid components were available from 168/251
(67%) participants at this altitude level.
Table 5.12: Glycated hemoglobin and diabetes related characteristics at each altitude
level
Humla Mustang
Altitude 2890 m 2800 m 3270 m 3620 m
(Rural) (Urban) (Rural) (Urban)
Variables N/N (%)
Diabetes or medication 6/172 (3.5) 15/142 (10.6) 2/61 (3.3) 6/44 (13.6)
Diabetes 5/171 (2.9) 13/141 (9.2) 2/61 (3.3) 5/44 (11.4)
Impaired glucose tolerance 63/171 (36.8) 31/141 (22.1) 24/61 (39.3) 11/44 (25.0)
Diabetes newly diagnosed 1/171 (0.6) 5/141 (3.5) 2/61 (3.3) 3/44 (6.8)
Mean (SD)
HbA1c (mmol/mol) 38.1 (4.9)
N=171
38.7 (10.6)
N=141
38.0 (5.4)
N=61
39.2 (8.8)
N=44
Impaired glucose tolerance: HbA1c ≥39 to 47 mmol/mol, Diabetes: HbA1c ≥48 mmol/mol,
Diabetes or medication : HbA1c ≥48 mmol/mol or on anti-diabetic medication
HbA1c and diabetes-related characteristics are presented in Table 5.12. There was no
significant trend in diabetes-related characteristics by altitude level. The proportion of
participants with diabetes was higher at 2800 m and 3620 m compared to all other altitude
levels and compared to national prevalence in those aged over 30 years (5.9%) (K. K.
Aryal et al., 2014). However, mean HbA1c were similar at all altitude levels. Men were
more likely to be diabetic or on treatment than women at every altitude level, but the
differences in proportions between men and women were not significantly different at any
level. Three-quarters (74.5%) of the participants had never had a blood sugar test before
and 2.7% were currently on anti-diabetic treatment. Urban participants were significantly
more likely to be diabetic or on treatment than the rural counterparts, urban 11.3% and
rural 3.4%, the proportion difference of 7.9% (95% CI 2.5 to 12.7), P=0.002.
Technical measurement problems at 2890 m meant that HbA1c levels were measured from
171/251 (68%) participants at this altitude level.
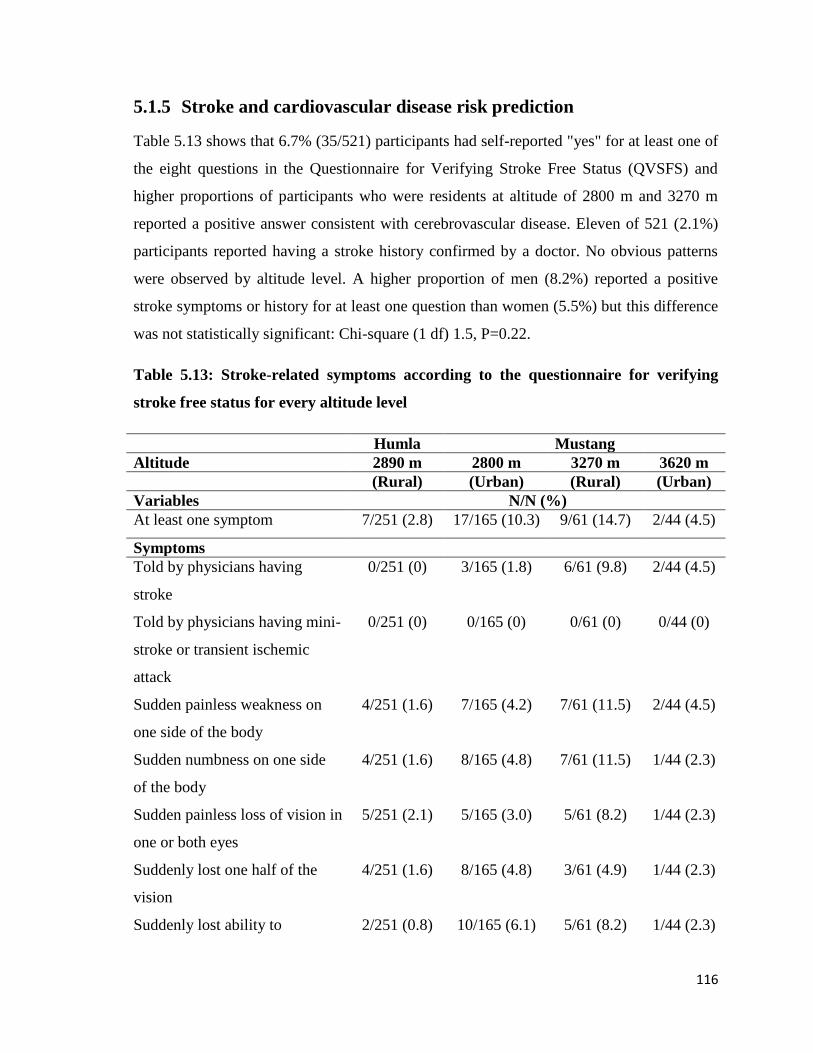
116
5.1.5 Stroke and cardiovascular disease risk prediction
Table 5.13 shows that 6.7% (35/521) participants had self-reported "yes" for at least one of
the eight questions in the Questionnaire for Verifying Stroke Free Status (QVSFS) and
higher proportions of participants who were residents at altitude of 2800 m and 3270 m
reported a positive answer consistent with cerebrovascular disease. Eleven of 521 (2.1%)
participants reported having a stroke history confirmed by a doctor. No obvious patterns
were observed by altitude level. A higher proportion of men (8.2%) reported a positive
stroke symptoms or history for at least one question than women (5.5%) but this difference
was not statistically significant: Chi-square (1 df) 1.5, P=0.22.
Table 5.13: Stroke-related symptoms according to the questionnaire for verifying
stroke free status for every altitude level
Humla Mustang
Altitude 2890 m 2800 m 3270 m 3620 m
(Rural) (Urban) (Rural) (Urban)
Variables N/N (%)
At least one symptom 7/251 (2.8) 17/165 (10.3) 9/61 (14.7) 2/44 (4.5)
Symptoms
Told by physicians having
stroke
0/251 (0) 3/165 (1.8) 6/61 (9.8) 2/44 (4.5)
Told by physicians having mini-
stroke or transient ischemic
attack
0/251 (0) 0/165 (0) 0/61 (0) 0/44 (0)
Sudden painless weakness on
one side of the body
4/251 (1.6) 7/165 (4.2) 7/61 (11.5) 2/44 (4.5)
Sudden numbness on one side
of the body
4/251 (1.6) 8/165 (4.8) 7/61 (11.5) 1/44 (2.3)
Sudden painless loss of vision in
one or both eyes
5/251 (2.1) 5/165 (3.0) 5/61 (8.2) 1/44 (2.3)
Suddenly lost one half of the
vision
4/251 (1.6) 8/165 (4.8) 3/61 (4.9) 1/44 (2.3)
Suddenly lost ability to 2/251 (0.8) 10/165 (6.1) 5/61 (8.2) 1/44 (2.3)
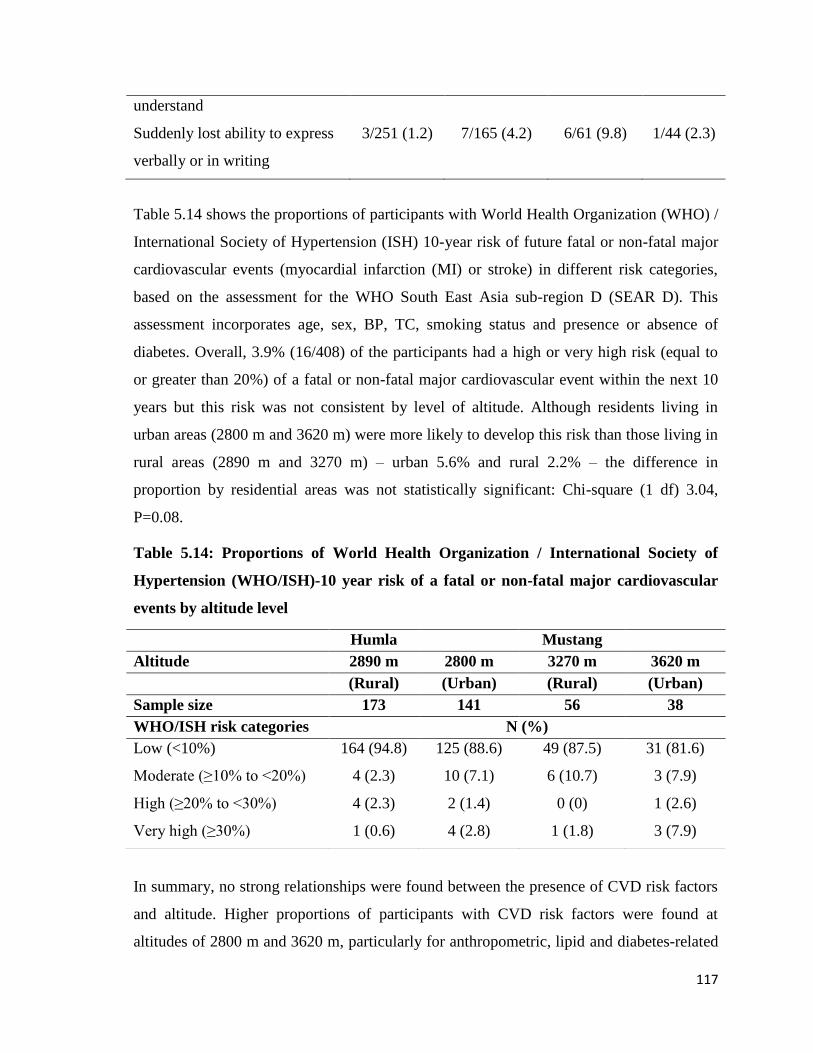
117
understand
Suddenly lost ability to express
verbally or in writing
3/251 (1.2) 7/165 (4.2) 6/61 (9.8) 1/44 (2.3)
Table 5.14 shows the proportions of participants with World Health Organization (WHO) /
International Society of Hypertension (ISH) 10-year risk of future fatal or non-fatal major
cardiovascular events (myocardial infarction (MI) or stroke) in different risk categories,
based on the assessment for the WHO South East Asia sub-region D (SEAR D). This
assessment incorporates age, sex, BP, TC, smoking status and presence or absence of
diabetes. Overall, 3.9% (16/408) of the participants had a high or very high risk (equal to
or greater than 20%) of a fatal or non-fatal major cardiovascular event within the next 10
years but this risk was not consistent by level of altitude. Although residents living in
urban areas (2800 m and 3620 m) were more likely to develop this risk than those living in
rural areas (2890 m and 3270 m) – urban 5.6% and rural 2.2% – the difference in
proportion by residential areas was not statistically significant: Chi-square (1 df) 3.04,
P=0.08.
Table 5.14: Proportions of World Health Organization / International Society of
Hypertension (WHO/ISH)-10 year risk of a fatal or non-fatal major cardiovascular
events by altitude level
In summary, no strong relationships were found between the presence of CVD risk factors
and altitude. Higher proportions of participants with CVD risk factors were found at
altitudes of 2800 m and 3620 m, particularly for anthropometric, lipid and diabetes-related
Humla Mustang
Altitude 2890 m 2800 m 3270 m 3620 m
(Rural) (Urban) (Rural) (Urban)
Sample size 173 141 56 38
WHO/ISH risk categories N (%)
Low (<10%) 164 (94.8) 125 (88.6) 49 (87.5) 31 (81.6)
Moderate (≥10% to <20%) 4 (2.3) 10 (7.1) 6 (10.7) 3 (7.9)
High (≥20% to <30%) 4 (2.3) 2 (1.4) 0 (0) 1 (2.6)
Very high (≥30%) 1 (0.6) 4 (2.8) 1 (1.8) 3 (7.9)
118
characteristics. Men were more likely to have CVD-related risk factors than women.
Alcohol drinking was very common at all levels of altitude and more than twice as high as
the national prevalence in Nepal.
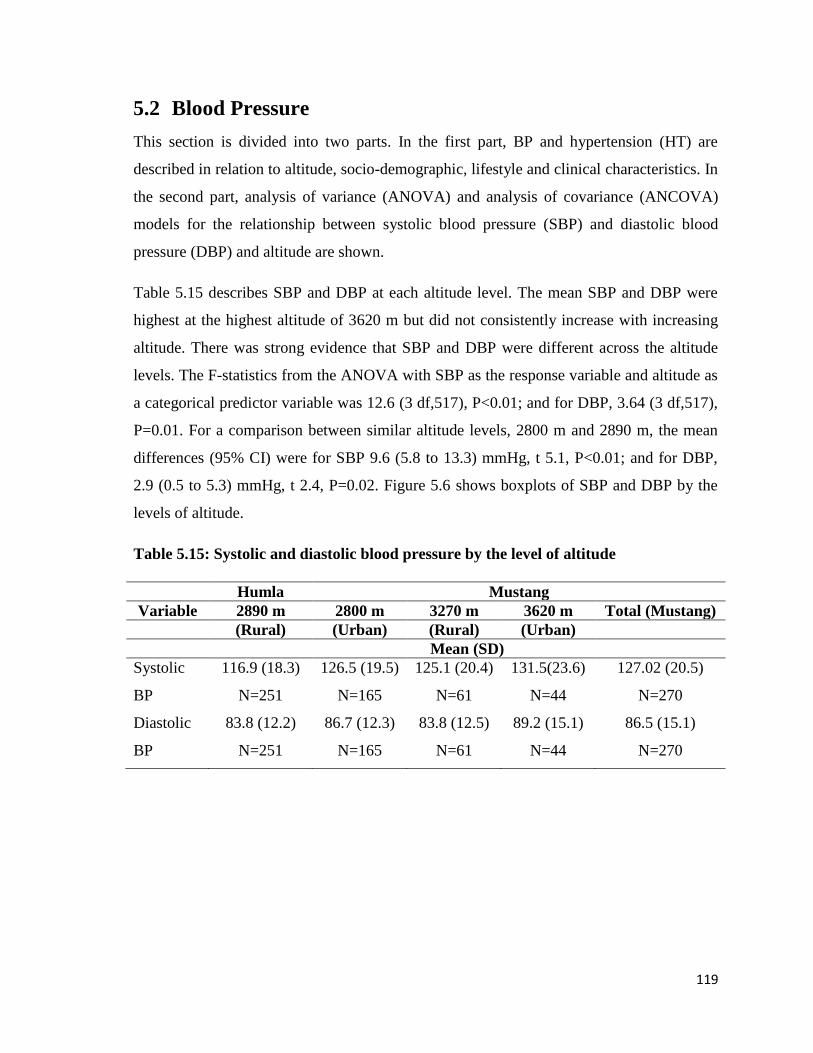
119
5.2 Blood Pressure
This section is divided into two parts. In the first part, BP and hypertension (HT) are
described in relation to altitude, socio-demographic, lifestyle and clinical characteristics. In
the second part, analysis of variance (ANOVA) and analysis of covariance (ANCOVA)
models for the relationship between systolic blood pressure (SBP) and diastolic blood
pressure (DBP) and altitude are shown.
Table 5.15 describes SBP and DBP at each altitude level. The mean SBP and DBP were
highest at the highest altitude of 3620 m but did not consistently increase with increasing
altitude. There was strong evidence that SBP and DBP were different across the altitude
levels. The F-statistics from the ANOVA with SBP as the response variable and altitude as
a categorical predictor variable was 12.6 (3 df,517), P<0.01; and for DBP, 3.64 (3 df,517),
P=0.01. For a comparison between similar altitude levels, 2800 m and 2890 m, the mean
differences (95% CI) were for SBP 9.6 (5.8 to 13.3) mmHg, t 5.1, P<0.01; and for DBP,
2.9 (0.5 to 5.3) mmHg, t 2.4, P=0.02. Figure 5.6 shows boxplots of SBP and DBP by the
levels of altitude.
Table 5.15: Systolic and diastolic blood pressure by the level of altitude
Humla Mustang
Variable 2890 m 2800 m 3270 m 3620 m Total (Mustang)
(Rural) (Urban) (Rural) (Urban)
Mean (SD)
Systolic
BP
116.9 (18.3)
N=251
126.5 (19.5)
N=165
125.1 (20.4)
N=61
131.5(23.6)
N=44
127.02 (20.5)
N=270
Diastolic
BP
83.8 (12.2)
N=251
86.7 (12.3)
N=165
83.8 (12.5)
N=61
89.2 (15.1)
N=44
86.5 (15.1)
N=270
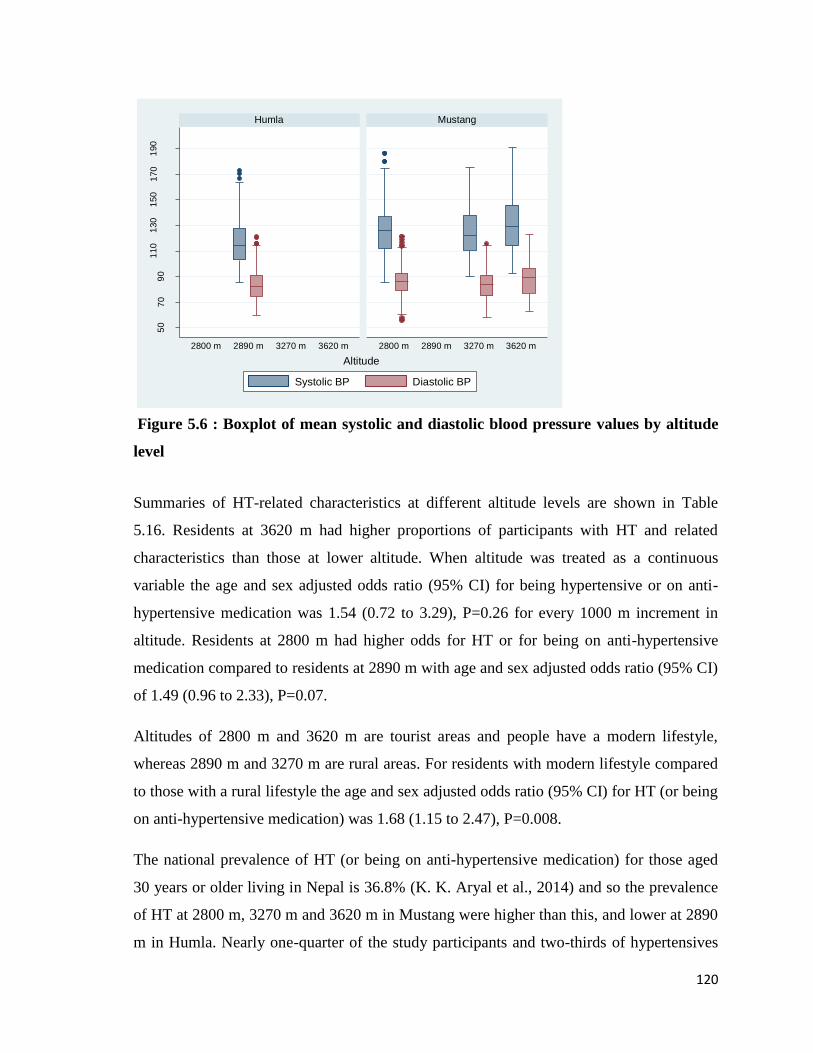
120
Figure 5.6 : Boxplot of mean systolic and diastolic blood pressure values by altitude
level
Summaries of HT-related characteristics at different altitude levels are shown in Table
5.16. Residents at 3620 m had higher proportions of participants with HT and related
characteristics than those at lower altitude. When altitude was treated as a continuous
variable the age and sex adjusted odds ratio (95% CI) for being hypertensive or on anti-
hypertensive medication was 1.54 (0.72 to 3.29), P=0.26 for every 1000 m increment in
altitude. Residents at 2800 m had higher odds for HT or for being on anti-hypertensive
medication compared to residents at 2890 m with age and sex adjusted odds ratio (95% CI)
of 1.49 (0.96 to 2.33), P=0.07.
Altitudes of 2800 m and 3620 m are tourist areas and people have a modern lifestyle,
whereas 2890 m and 3270 m are rural areas. For residents with modern lifestyle compared
to those with a rural lifestyle the age and sex adjusted odds ratio (95% CI) for HT (or being
on anti-hypertensive medication) was 1.68 (1.15 to 2.47), P=0.008.
The national prevalence of HT (or being on anti-hypertensive medication) for those aged
30 years or older living in Nepal is 36.8% (K. K. Aryal et al., 2014) and so the prevalence
of HT at 2800 m, 3270 m and 3620 m in Mustang were higher than this, and lower at 2890
m in Humla. Nearly one-quarter of the study participants and two-thirds of hypertensives
50
70
90
110
130
150
170
190
2800 m 2890 m 3270 m 3620 m 2800 m 2890 m 3270 m 3620 m
Humla Mustang
Systolic BP Diastolic BP
(mm
Hg)
Altitude
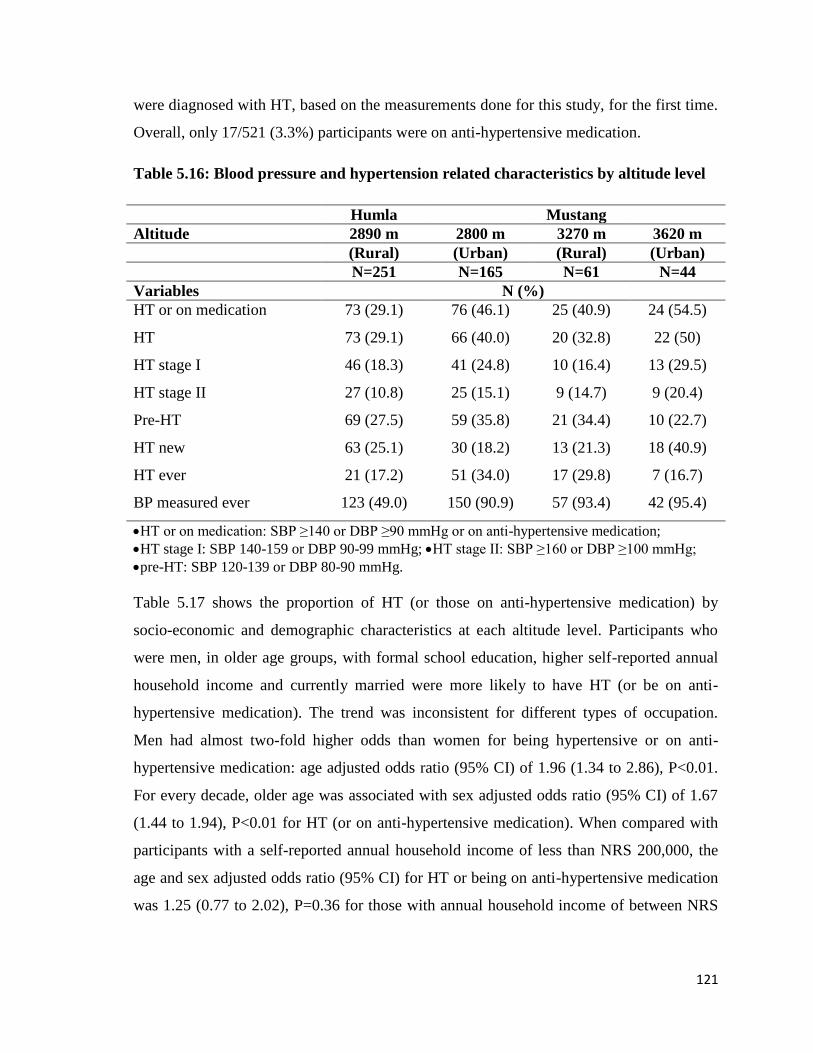
121
were diagnosed with HT, based on the measurements done for this study, for the first time.
Overall, only 17/521 (3.3%) participants were on anti-hypertensive medication.
Table 5.16: Blood pressure and hypertension related characteristics by altitude level
Humla Mustang
Altitude 2890 m 2800 m 3270 m 3620 m
(Rural) (Urban) (Rural) (Urban)
N=251 N=165 N=61 N=44
Variables N (%)
HT or on medication 73 (29.1) 76 (46.1) 25 (40.9) 24 (54.5)
HT 73 (29.1) 66 (40.0) 20 (32.8) 22 (50)
HT stage I 46 (18.3) 41 (24.8) 10 (16.4) 13 (29.5)
HT stage II 27 (10.8) 25 (15.1) 9 (14.7) 9 (20.4)
Pre-HT 69 (27.5) 59 (35.8) 21 (34.4) 10 (22.7)
HT new 63 (25.1) 30 (18.2) 13 (21.3) 18 (40.9)
HT ever 21 (17.2) 51 (34.0) 17 (29.8) 7 (16.7)
BP measured ever 123 (49.0) 150 (90.9) 57 (93.4) 42 (95.4)
HT or on medication: SBP ≥140 or DBP ≥90 mmHg or on anti-hypertensive medication;
HT stage I: SBP 140-159 or DBP 90-99 mmHg; HT stage II: SBP ≥160 or DBP ≥100 mmHg;
pre-HT: SBP 120-139 or DBP 80-90 mmHg.
Table 5.17 shows the proportion of HT (or those on anti-hypertensive medication) by
socio-economic and demographic characteristics at each altitude level. Participants who
were men, in older age groups, with formal school education, higher self-reported annual
household income and currently married were more likely to have HT (or be on anti-
hypertensive medication). The trend was inconsistent for different types of occupation.
Men had almost two-fold higher odds than women for being hypertensive or on anti-
hypertensive medication: age adjusted odds ratio (95% CI) of 1.96 (1.34 to 2.86), P<0.01.
For every decade, older age was associated with sex adjusted odds ratio (95% CI) of 1.67
(1.44 to 1.94), P<0.01 for HT (or on anti-hypertensive medication). When compared with
participants with a self-reported annual household income of less than NRS 200,000, the
age and sex adjusted odds ratio (95% CI) for HT or being on anti-hypertensive medication
was 1.25 (0.77 to 2.02), P=0.36 for those with annual household income of between NRS
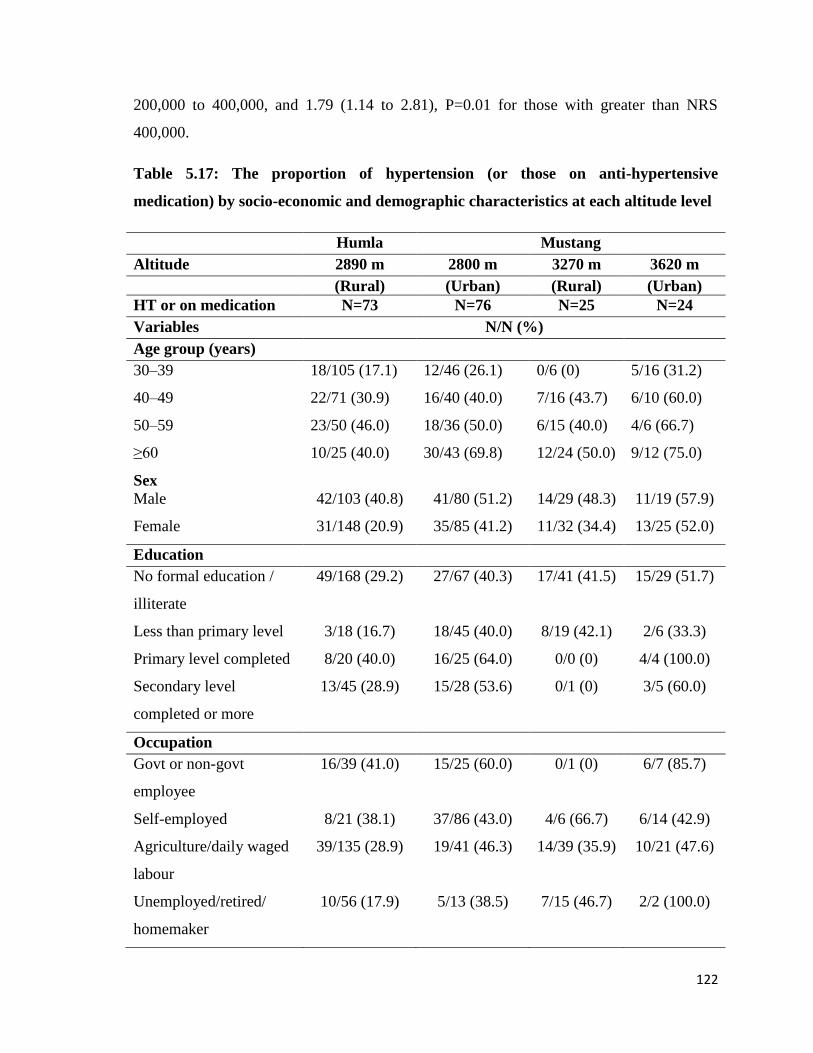
122
200,000 to 400,000, and 1.79 (1.14 to 2.81), P=0.01 for those with greater than NRS
400,000.
Table 5.17: The proportion of hypertension (or those on anti-hypertensive
medication) by socio-economic and demographic characteristics at each altitude level
Humla Mustang
Altitude 2890 m 2800 m 3270 m 3620 m
(Rural) (Urban) (Rural) (Urban)
HT or on medication N=73 N=76 N=25 N=24
Variables N/N (%)
Age group (years)
30–39 18/105 (17.1) 12/46 (26.1) 0/6 (0) 5/16 (31.2)
40–49 22/71 (30.9) 16/40 (40.0) 7/16 (43.7) 6/10 (60.0)
50–59 23/50 (46.0) 18/36 (50.0) 6/15 (40.0) 4/6 (66.7)
≥60 10/25 (40.0) 30/43 (69.8) 12/24 (50.0) 9/12 (75.0)
Sex
Male 42/103 (40.8) 41/80 (51.2) 14/29 (48.3) 11/19 (57.9)
Female 31/148 (20.9) 35/85 (41.2) 11/32 (34.4) 13/25 (52.0)
Education
No formal education /
illiterate
49/168 (29.2) 27/67 (40.3) 17/41 (41.5) 15/29 (51.7)
Less than primary level 3/18 (16.7) 18/45 (40.0) 8/19 (42.1) 2/6 (33.3)
Primary level completed 8/20 (40.0) 16/25 (64.0) 0/0 (0) 4/4 (100.0)
Secondary level
completed or more
13/45 (28.9) 15/28 (53.6) 0/1 (0) 3/5 (60.0)
Occupation
Govt or non-govt
employee
16/39 (41.0) 15/25 (60.0) 0/1 (0) 6/7 (85.7)
Self-employed 8/21 (38.1) 37/86 (43.0) 4/6 (66.7) 6/14 (42.9)
Agriculture/daily waged
labour
39/135 (28.9) 19/41 (46.3) 14/39 (35.9) 10/21 (47.6)
Unemployed/retired/
homemaker
10/56 (17.9) 5/13 (38.5) 7/15 (46.7) 2/2 (100.0)
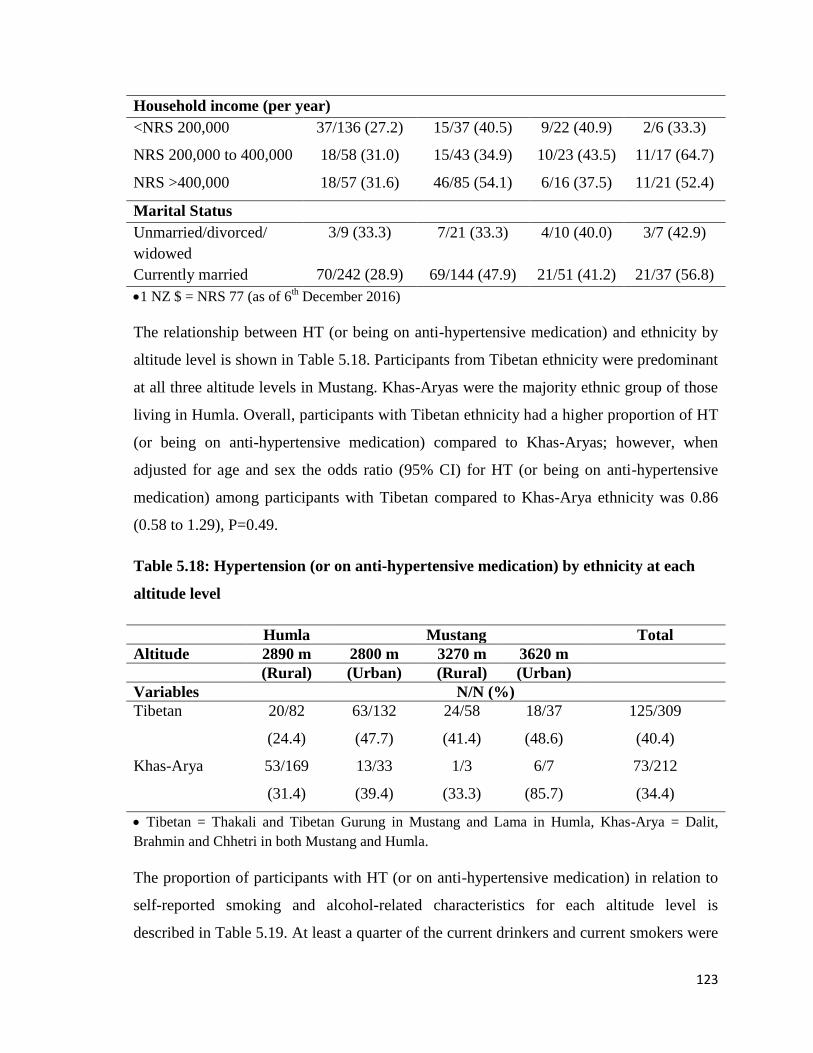
123
Household income (per year)
<NRS 200,000 37/136 (27.2) 15/37 (40.5) 9/22 (40.9) 2/6 (33.3)
NRS 200,000 to 400,000 18/58 (31.0) 15/43 (34.9) 10/23 (43.5) 11/17 (64.7)
NRS >400,000 18/57 (31.6) 46/85 (54.1) 6/16 (37.5) 11/21 (52.4)
Marital Status
Unmarried/divorced/
widowed
3/9 (33.3) 7/21 (33.3) 4/10 (40.0) 3/7 (42.9)
Currently married 70/242 (28.9) 69/144 (47.9) 21/51 (41.2) 21/37 (56.8)
1 NZ $ = NRS 77 (as of 6th December 2016)
The relationship between HT (or being on anti-hypertensive medication) and ethnicity by
altitude level is shown in Table 5.18. Participants from Tibetan ethnicity were predominant
at all three altitude levels in Mustang. Khas-Aryas were the majority ethnic group of those
living in Humla. Overall, participants with Tibetan ethnicity had a higher proportion of HT
(or being on anti-hypertensive medication) compared to Khas-Aryas; however, when
adjusted for age and sex the odds ratio (95% CI) for HT (or being on anti-hypertensive
medication) among participants with Tibetan compared to Khas-Arya ethnicity was 0.86
(0.58 to 1.29), P=0.49.
Table 5.18: Hypertension (or on anti-hypertensive medication) by ethnicity at each
altitude level
Humla Mustang Total
Altitude 2890 m 2800 m 3270 m 3620 m
(Rural) (Urban) (Rural) (Urban)
Variables N/N (%)
Tibetan 20/82
(24.4)
63/132
(47.7)
24/58
(41.4)
18/37
(48.6)
125/309
(40.4)
Khas-Arya 53/169
(31.4)
13/33
(39.4)
1/3
(33.3)
6/7
(85.7)
73/212
(34.4)
Tibetan = Thakali and Tibetan Gurung in Mustang and Lama in Humla, Khas-Arya = Dalit,
Brahmin and Chhetri in both Mustang and Humla.
The proportion of participants with HT (or on anti-hypertensive medication) in relation to
self-reported smoking and alcohol-related characteristics for each altitude level is
described in Table 5.19. At least a quarter of the current drinkers and current smokers were
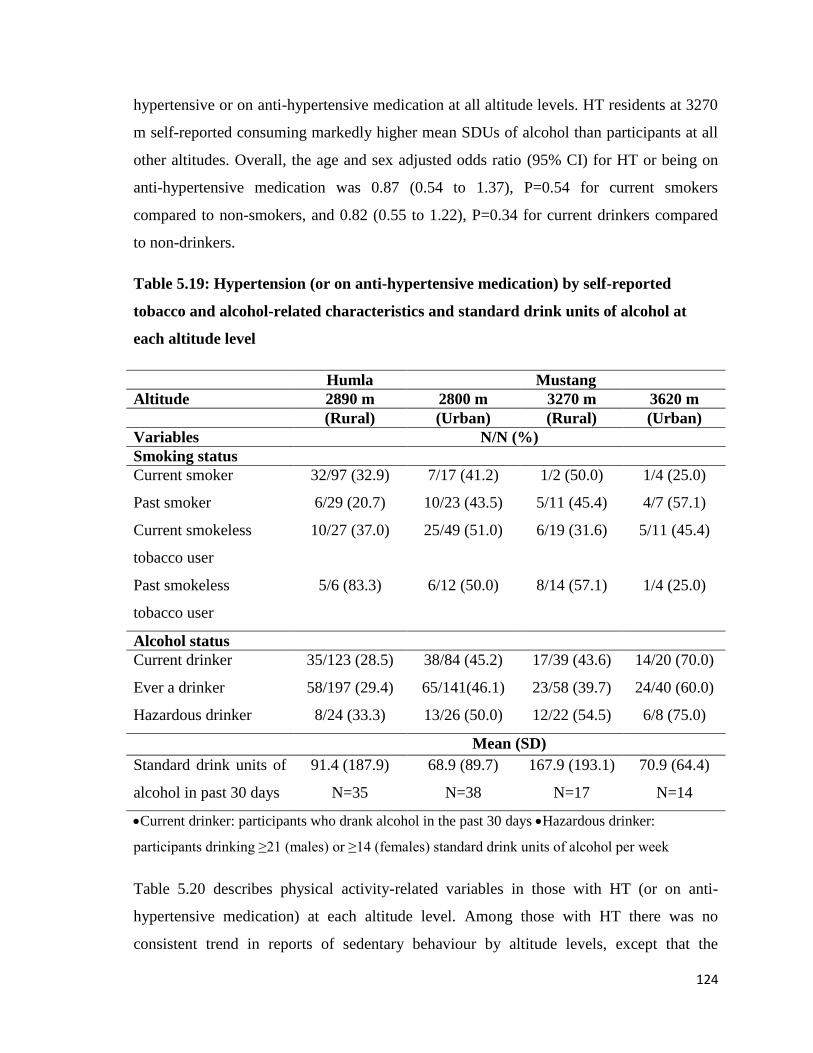
124
hypertensive or on anti-hypertensive medication at all altitude levels. HT residents at 3270
m self-reported consuming markedly higher mean SDUs of alcohol than participants at all
other altitudes. Overall, the age and sex adjusted odds ratio (95% CI) for HT or being on
anti-hypertensive medication was 0.87 (0.54 to 1.37), P=0.54 for current smokers
compared to non-smokers, and 0.82 (0.55 to 1.22), P=0.34 for current drinkers compared
to non-drinkers.
Table 5.19: Hypertension (or on anti-hypertensive medication) by self-reported
tobacco and alcohol-related characteristics and standard drink units of alcohol at
each altitude level
Humla Mustang
Altitude 2890 m 2800 m 3270 m 3620 m
(Rural) (Urban) (Rural) (Urban)
Variables N/N (%)
Smoking status
Current smoker 32/97 (32.9) 7/17 (41.2) 1/2 (50.0) 1/4 (25.0)
Past smoker 6/29 (20.7) 10/23 (43.5) 5/11 (45.4) 4/7 (57.1)
Current smokeless
tobacco user
10/27 (37.0) 25/49 (51.0) 6/19 (31.6) 5/11 (45.4)
Past smokeless
tobacco user
5/6 (83.3) 6/12 (50.0) 8/14 (57.1) 1/4 (25.0)
Alcohol status
Current drinker 35/123 (28.5) 38/84 (45.2) 17/39 (43.6) 14/20 (70.0)
Ever a drinker 58/197 (29.4) 65/141(46.1) 23/58 (39.7) 24/40 (60.0)
Hazardous drinker 8/24 (33.3) 13/26 (50.0) 12/22 (54.5) 6/8 (75.0)
Mean (SD)
Standard drink units of
alcohol in past 30 days
91.4 (187.9)
N=35
68.9 (89.7)
N=38
167.9 (193.1)
N=17
70.9 (64.4)
N=14
Current drinker: participants who drank alcohol in the past 30 days Hazardous drinker:
participants drinking ≥21 (males) or ≥14 (females) standard drink units of alcohol per week
Table 5.20 describes physical activity-related variables in those with HT (or on anti-
hypertensive medication) at each altitude level. Among those with HT there was no
consistent trend in reports of sedentary behaviour by altitude levels, except that the
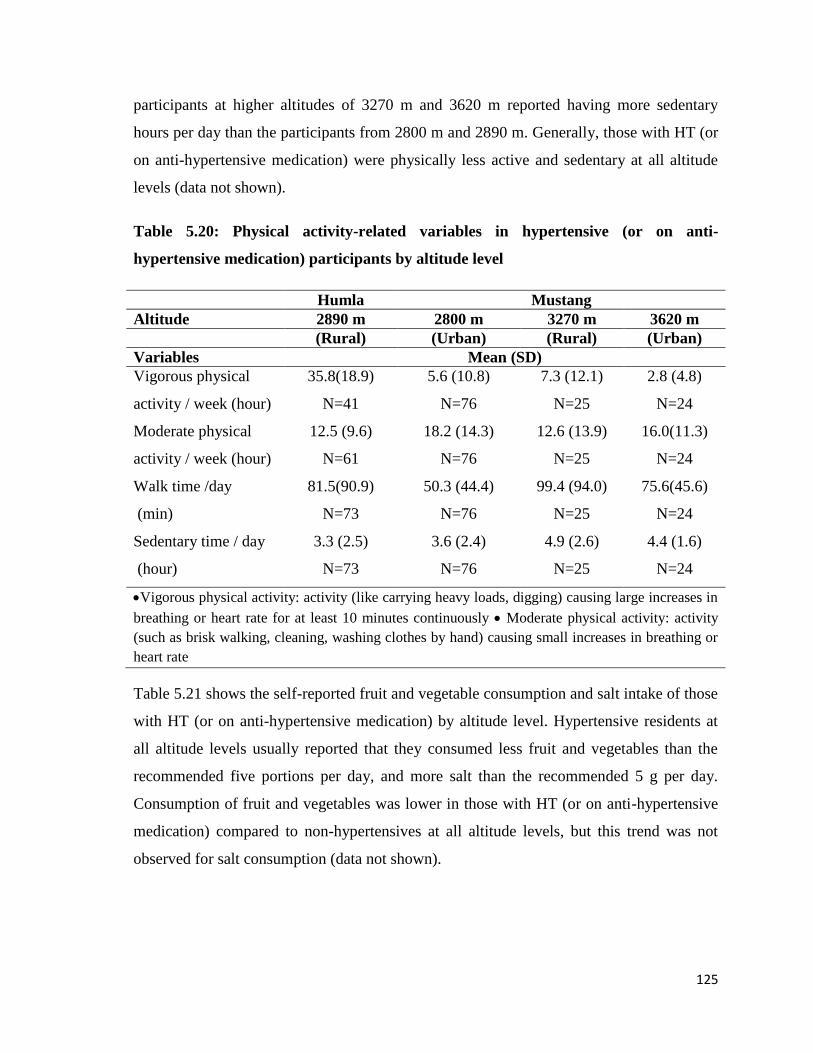
125
participants at higher altitudes of 3270 m and 3620 m reported having more sedentary
hours per day than the participants from 2800 m and 2890 m. Generally, those with HT (or
on anti-hypertensive medication) were physically less active and sedentary at all altitude
levels (data not shown).
Table 5.20: Physical activity-related variables in hypertensive (or on anti-
hypertensive medication) participants by altitude level
Humla Mustang
Altitude 2890 m 2800 m 3270 m 3620 m
(Rural) (Urban) (Rural) (Urban)
Variables Mean (SD)
Vigorous physical
activity / week (hour)
35.8(18.9)
N=41
5.6 (10.8)
N=76
7.3 (12.1)
N=25
2.8 (4.8)
N=24
Moderate physical
activity / week (hour)
12.5 (9.6)
N=61
18.2 (14.3)
N=76
12.6 (13.9)
N=25
16.0(11.3)
N=24
Walk time /day
(min)
81.5(90.9)
N=73
50.3 (44.4)
N=76
99.4 (94.0)
N=25
75.6(45.6)
N=24
Sedentary time / day
(hour)
3.3 (2.5)
N=73
3.6 (2.4)
N=76
4.9 (2.6)
N=25
4.4 (1.6)
N=24
Vigorous physical activity: activity (like carrying heavy loads, digging) causing large increases in
breathing or heart rate for at least 10 minutes continuously Moderate physical activity: activity
(such as brisk walking, cleaning, washing clothes by hand) causing small increases in breathing or
heart rate
Table 5.21 shows the self-reported fruit and vegetable consumption and salt intake of those
with HT (or on anti-hypertensive medication) by altitude level. Hypertensive residents at
all altitude levels usually reported that they consumed less fruit and vegetables than the
recommended five portions per day, and more salt than the recommended 5 g per day.
Consumption of fruit and vegetables was lower in those with HT (or on anti-hypertensive
medication) compared to non-hypertensives at all altitude levels, but this trend was not
observed for salt consumption (data not shown).
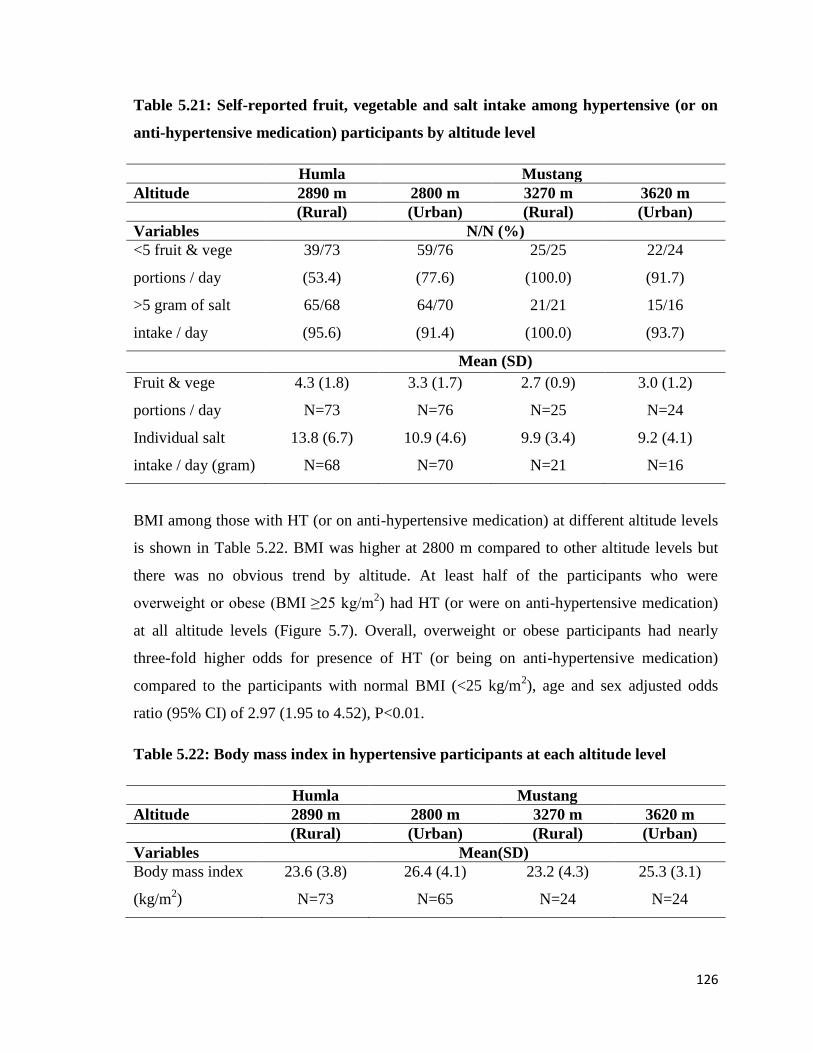
126
Table 5.21: Self-reported fruit, vegetable and salt intake among hypertensive (or on
anti-hypertensive medication) participants by altitude level
Humla Mustang
Altitude 2890 m 2800 m 3270 m 3620 m
(Rural) (Urban) (Rural) (Urban)
Variables N/N (%)
<5 fruit & vege
portions / day
39/73
(53.4)
59/76
(77.6)
25/25
(100.0)
22/24
(91.7)
>5 gram of salt
intake / day
65/68
(95.6)
64/70
(91.4)
21/21
(100.0)
15/16
(93.7)
Mean (SD)
Fruit & vege
portions / day
4.3 (1.8)
N=73
3.3 (1.7)
N=76
2.7 (0.9)
N=25
3.0 (1.2)
N=24
Individual salt
intake / day (gram)
13.8 (6.7)
N=68
10.9 (4.6)
N=70
9.9 (3.4)
N=21
9.2 (4.1)
N=16
BMI among those with HT (or on anti-hypertensive medication) at different altitude levels
is shown in Table 5.22. BMI was higher at 2800 m compared to other altitude levels but
there was no obvious trend by altitude. At least half of the participants who were
overweight or obese (BMI ≥25 kg/m2) had HT (or were on anti-hypertensive medication)
at all altitude levels (Figure 5.7). Overall, overweight or obese participants had nearly
three-fold higher odds for presence of HT (or being on anti-hypertensive medication)
compared to the participants with normal BMI (<25 kg/m2), age and sex adjusted odds
ratio (95% CI) of 2.97 (1.95 to 4.52), P<0.01.
Table 5.22: Body mass index in hypertensive participants at each altitude level
Humla Mustang
Altitude 2890 m 2800 m 3270 m 3620 m
(Rural) (Urban) (Rural) (Urban)
Variables Mean(SD)
Body mass index
(kg/m2)
23.6 (3.8)
N=73
26.4 (4.1)
N=65
23.2 (4.3)
N=24
25.3 (3.1)
N=24
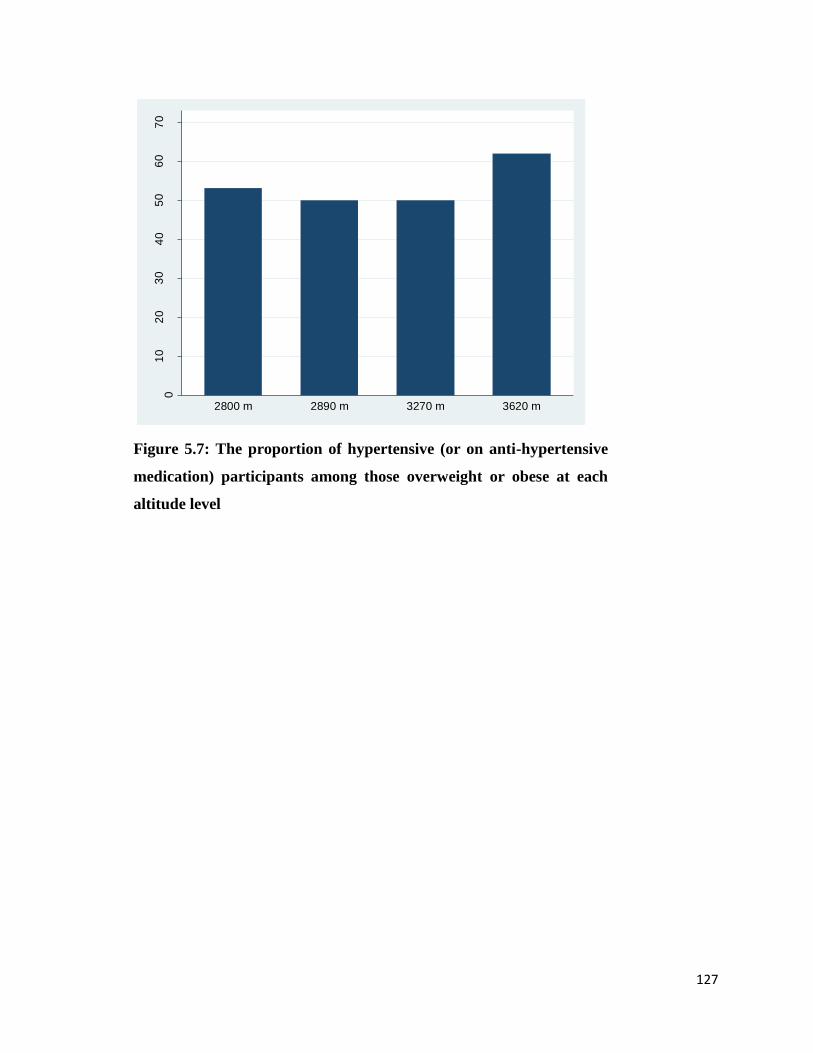
127
Figure 5.7: The proportion of hypertensive (or on anti-hypertensive
medication) participants among those overweight or obese at each
altitude level
01
02
03
04
05
06
07
0
Pro
po
rtio
n (
%)
2800 m 2890 m 3270 m 3620 m
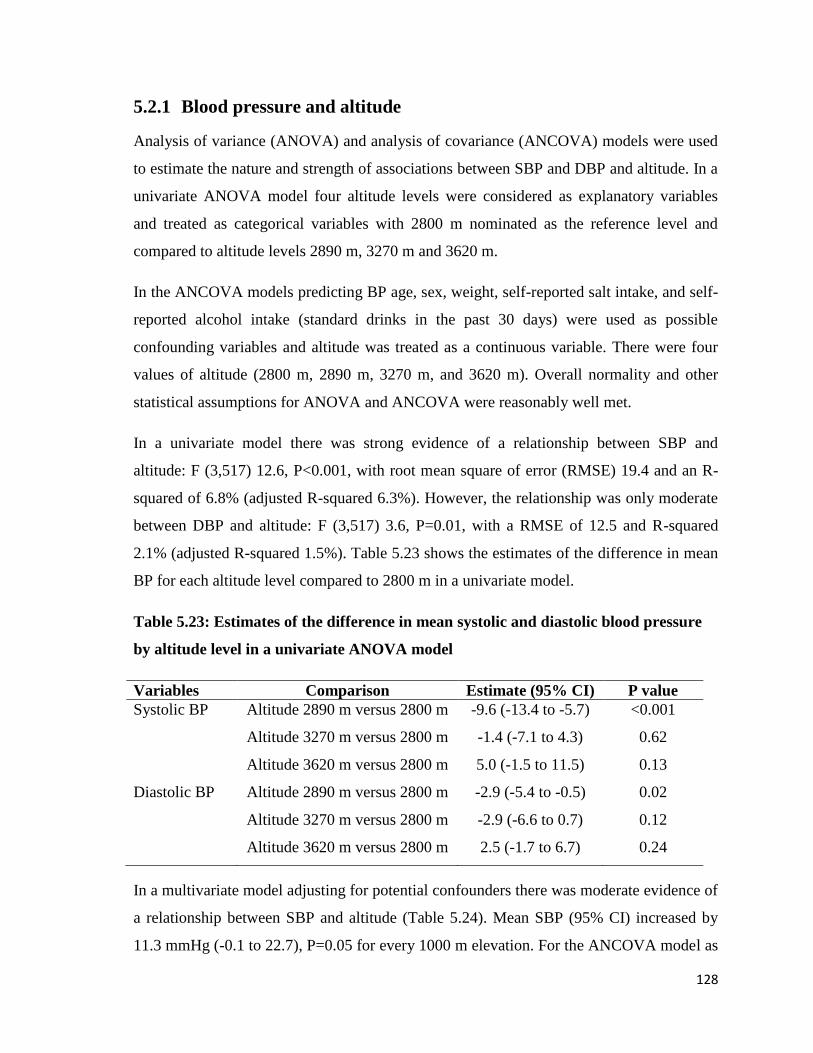
128
5.2.1 Blood pressure and altitude
Analysis of variance (ANOVA) and analysis of covariance (ANCOVA) models were used
to estimate the nature and strength of associations between SBP and DBP and altitude. In a
univariate ANOVA model four altitude levels were considered as explanatory variables
and treated as categorical variables with 2800 m nominated as the reference level and
compared to altitude levels 2890 m, 3270 m and 3620 m.
In the ANCOVA models predicting BP age, sex, weight, self-reported salt intake, and self-
reported alcohol intake (standard drinks in the past 30 days) were used as possible
confounding variables and altitude was treated as a continuous variable. There were four
values of altitude (2800 m, 2890 m, 3270 m, and 3620 m). Overall normality and other
statistical assumptions for ANOVA and ANCOVA were reasonably well met.
In a univariate model there was strong evidence of a relationship between SBP and
altitude: F (3,517) 12.6, P<0.001, with root mean square of error (RMSE) 19.4 and an R-
squared of 6.8% (adjusted R-squared 6.3%). However, the relationship was only moderate
between DBP and altitude: F (3,517) 3.6, P=0.01, with a RMSE of 12.5 and R-squared
2.1% (adjusted R-squared 1.5%). Table 5.23 shows the estimates of the difference in mean
BP for each altitude level compared to 2800 m in a univariate model.
Table 5.23: Estimates of the difference in mean systolic and diastolic blood pressure
by altitude level in a univariate ANOVA model
Variables Comparison Estimate (95% CI) P value
Systolic BP Altitude 2890 m versus 2800 m -9.6 (-13.4 to -5.7) <0.001
Altitude 3270 m versus 2800 m -1.4 (-7.1 to 4.3) 0.62
Altitude 3620 m versus 2800 m 5.0 (-1.5 to 11.5) 0.13
Diastolic BP Altitude 2890 m versus 2800 m -2.9 (-5.4 to -0.5) 0.02
Altitude 3270 m versus 2800 m -2.9 (-6.6 to 0.7) 0.12
Altitude 3620 m versus 2800 m 2.5 (-1.7 to 6.7) 0.24
In a multivariate model adjusting for potential confounders there was moderate evidence of
a relationship between SBP and altitude (Table 5.24). Mean SBP (95% CI) increased by
11.3 mmHg (-0.1 to 22.7), P=0.05 for every 1000 m elevation. For the ANCOVA model as
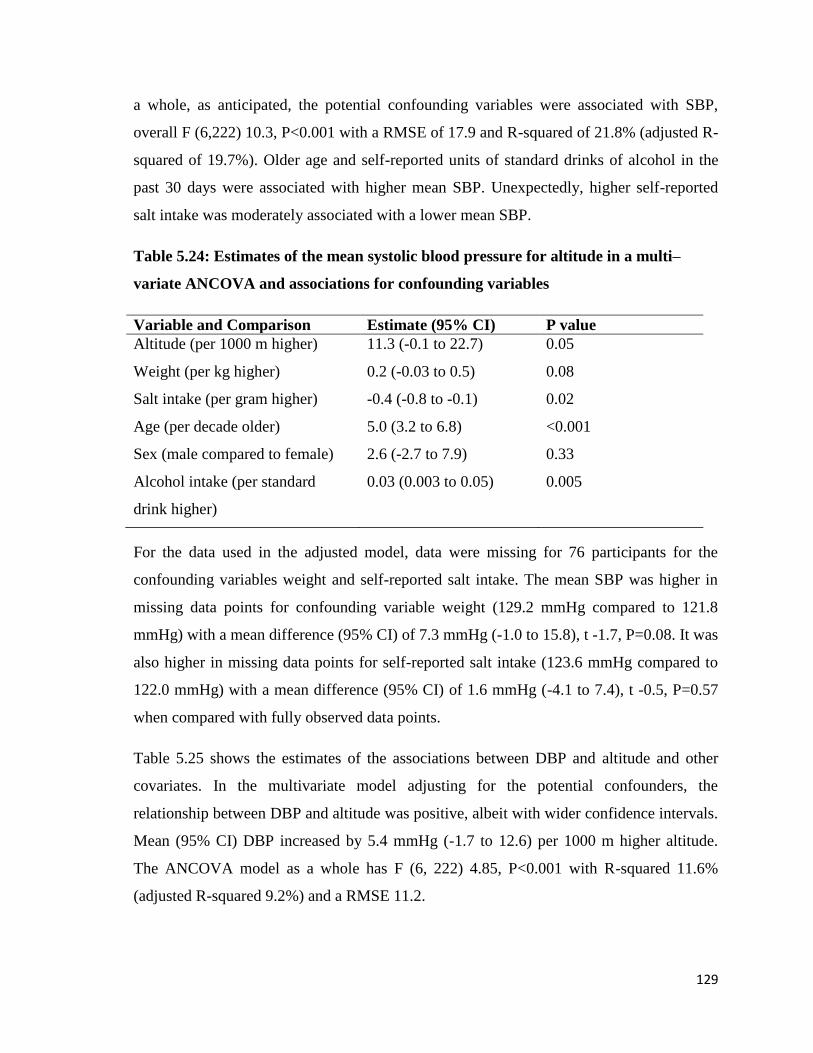
129
a whole, as anticipated, the potential confounding variables were associated with SBP,
overall F (6,222) 10.3, P<0.001 with a RMSE of 17.9 and R-squared of 21.8% (adjusted R-
squared of 19.7%). Older age and self-reported units of standard drinks of alcohol in the
past 30 days were associated with higher mean SBP. Unexpectedly, higher self-reported
salt intake was moderately associated with a lower mean SBP.
Table 5.24: Estimates of the mean systolic blood pressure for altitude in a multi–
variate ANCOVA and associations for confounding variables
Variable and Comparison Estimate (95% CI) P value
Altitude (per 1000 m higher) 11.3 (-0.1 to 22.7) 0.05
Weight (per kg higher) 0.2 (-0.03 to 0.5) 0.08
Salt intake (per gram higher) -0.4 (-0.8 to -0.1) 0.02
Age (per decade older) 5.0 (3.2 to 6.8) <0.001
Sex (male compared to female) 2.6 (-2.7 to 7.9) 0.33
Alcohol intake (per standard
drink higher)
0.03 (0.003 to 0.05) 0.005
For the data used in the adjusted model, data were missing for 76 participants for the
confounding variables weight and self-reported salt intake. The mean SBP was higher in
missing data points for confounding variable weight (129.2 mmHg compared to 121.8
mmHg) with a mean difference (95% CI) of 7.3 mmHg (-1.0 to 15.8), t -1.7, P=0.08. It was
also higher in missing data points for self-reported salt intake (123.6 mmHg compared to
122.0 mmHg) with a mean difference (95% CI) of 1.6 mmHg (-4.1 to 7.4), t -0.5, P=0.57
when compared with fully observed data points.
Table 5.25 shows the estimates of the associations between DBP and altitude and other
covariates. In the multivariate model adjusting for the potential confounders, the
relationship between DBP and altitude was positive, albeit with wider confidence intervals.
Mean (95% CI) DBP increased by 5.4 mmHg (-1.7 to 12.6) per 1000 m higher altitude.
The ANCOVA model as a whole has F (6, 222) 4.85, P<0.001 with R-squared 11.6%
(adjusted R-squared 9.2%) and a RMSE 11.2.
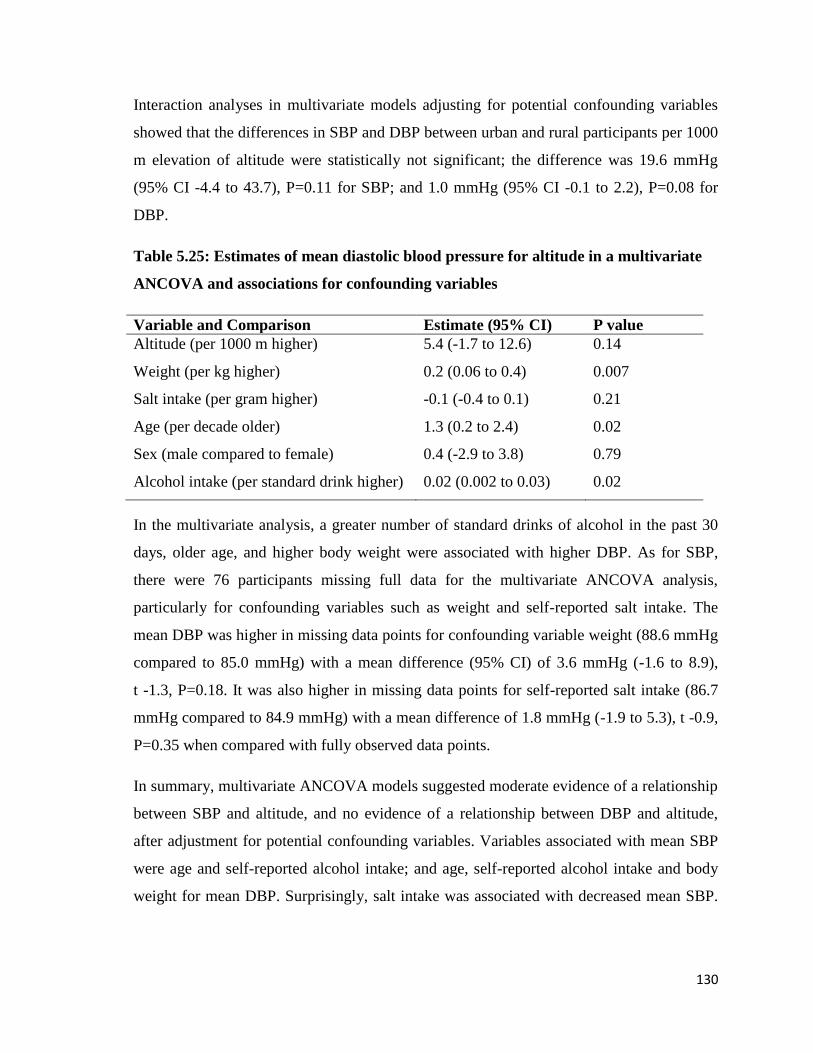
130
Interaction analyses in multivariate models adjusting for potential confounding variables
showed that the differences in SBP and DBP between urban and rural participants per 1000
m elevation of altitude were statistically not significant; the difference was 19.6 mmHg
(95% CI -4.4 to 43.7), P=0.11 for SBP; and 1.0 mmHg (95% CI -0.1 to 2.2), P=0.08 for
DBP.
Table 5.25: Estimates of mean diastolic blood pressure for altitude in a multivariate
ANCOVA and associations for confounding variables
Variable and Comparison Estimate (95% CI) P value
Altitude (per 1000 m higher) 5.4 (-1.7 to 12.6) 0.14
Weight (per kg higher) 0.2 (0.06 to 0.4) 0.007
Salt intake (per gram higher) -0.1 (-0.4 to 0.1) 0.21
Age (per decade older) 1.3 (0.2 to 2.4) 0.02
Sex (male compared to female) 0.4 (-2.9 to 3.8) 0.79
Alcohol intake (per standard drink higher) 0.02 (0.002 to 0.03) 0.02
In the multivariate analysis, a greater number of standard drinks of alcohol in the past 30
days, older age, and higher body weight were associated with higher DBP. As for SBP,
there were 76 participants missing full data for the multivariate ANCOVA analysis,
particularly for confounding variables such as weight and self-reported salt intake. The
mean DBP was higher in missing data points for confounding variable weight (88.6 mmHg
compared to 85.0 mmHg) with a mean difference (95% CI) of 3.6 mmHg (-1.6 to 8.9),
t -1.3, P=0.18. It was also higher in missing data points for self-reported salt intake (86.7
mmHg compared to 84.9 mmHg) with a mean difference of 1.8 mmHg (-1.9 to 5.3), t -0.9,
P=0.35 when compared with fully observed data points.
In summary, multivariate ANCOVA models suggested moderate evidence of a relationship
between SBP and altitude, and no evidence of a relationship between DBP and altitude,
after adjustment for potential confounding variables. Variables associated with mean SBP
were age and self-reported alcohol intake; and age, self-reported alcohol intake and body
weight for mean DBP. Surprisingly, salt intake was associated with decreased mean SBP.
131
Nearly one-quarter of the study participants and two-thirds of hypertensives were
diagnosed with HT for the first time.
The prevalence of HT (or being on anti-hypertensive medication) was higher at each
altitude level, except at 2890 m, when compared with the national prevalence in Nepal.
Overall, HA residents who were men, older, with high household income, living a modern
lifestyle, and who were overweight or obese were significantly more likely to be
hypertensive after adjusting for the potential confounders. Ethnicity categorised as Tibetan
or Khas-Arya was not associated with HT (or being on anti-hypertensive medication).
132
5.3 Electrocardiography recordings
This section describes ECG recordings taken at each level of altitude. As described in
detail in the methods section (Chapter 4, section 4.4.3), ECG recordings were reviewed by
a cardiologist and categorized as abnormal, borderline or normal. ECG reports are
described in these categories in relation to socio-demographic, lifestyle, and clinical
characteristics. Logistic regression was used to estimate the association between an
abnormal (or borderline abnormal) ECG and altitude in univariate and multivariate models.
5.3.1 Electrocardiographic analysis
Arrhythmias: Three participants had isolated ectopic beats on their 12-lead ECGs: one
atrial, one junctional and one ventricular. Four participants had clear evidence of pre-
excitation of the ventricles (Wolff-Parkinson-White syndrome). Four participants showed
prolonged AV (atrioventricular) nodal conduction (first degree AV block) with PR
intervals varying between 205 msec and 286 msec (normal up to 200 msec). One
participant had left bundle branch block (LBBB) and six had right bundle branch block
(RBBB) (three each complete and incomplete). Two participants, a man and a woman, had
prolonged QT intervals: 470 msec and 490 msec.
Morphological abnormalities: Two participants had tall peaked P waves, suggesting right
atrial hypertrophy. Three participants showed extreme axis deviation (arm lead electrode
positions all verified as correct) with QRS axes between +185o and +237
o suggesting
possible congenital abnormalities and/or pulmonary hypertension. Twenty-six other
participants showed right axis deviation (RAD), with QRS axes between 92o and 143
o, of
which two had right ventricular hypertrophy (RVH). Four others had left axis deviation
(LAD), with QRS axes between -34o and -85
o. No participant had Q waves to suggest past
Q-wave MI. Thirteen had inverted T waves outside the accepted normal leads (III, aVR,
V1); nine of these were of doubtful significance as they were in the antero-septal
precordial leads V1to V4. Two had inverted T waves in inferior leads (II, III and aVF) and
two in aVL alone. Seventeen participants met Sokolow-Lyon criteria for left ventricular
hypertrophy (LVH), with the largest S in V1 or V2 plus the largest R in V5 or V6 greater
than 3.5mV, but only one of these met the stricter definition of Romhilt and Estes (six
points); three others were borderline (four points). Two additional participants had down-
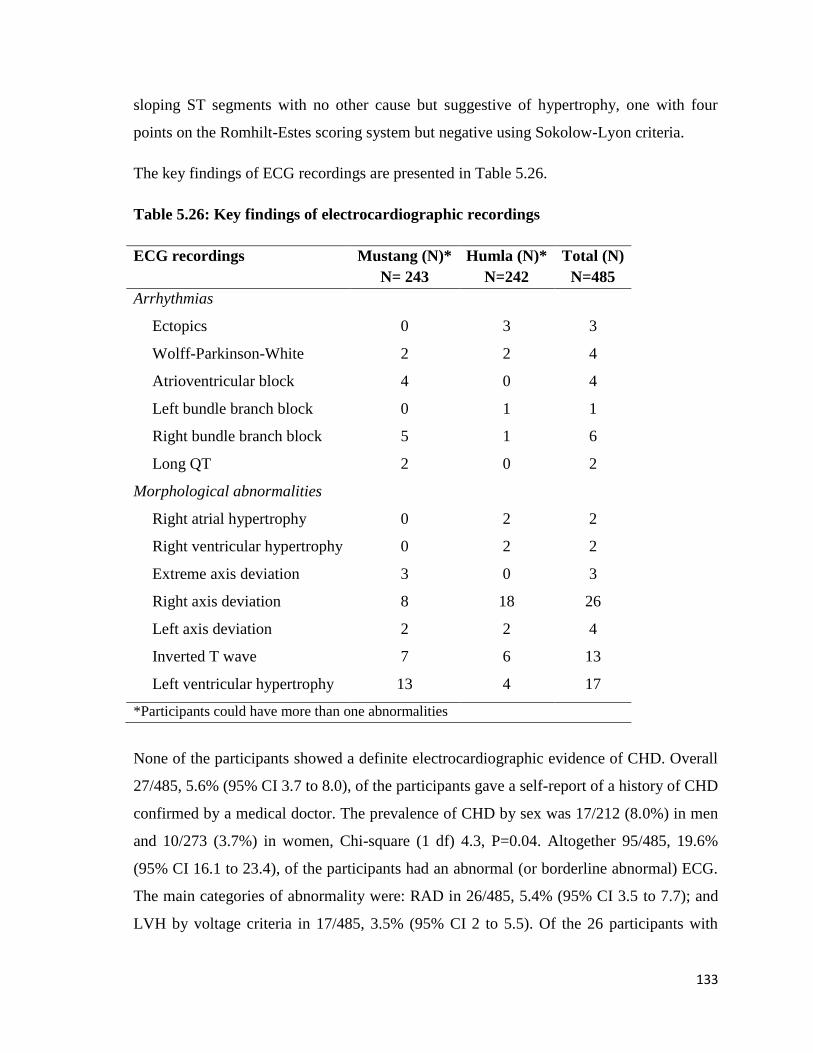
133
sloping ST segments with no other cause but suggestive of hypertrophy, one with four
points on the Romhilt-Estes scoring system but negative using Sokolow-Lyon criteria.
The key findings of ECG recordings are presented in Table 5.26.
Table 5.26: Key findings of electrocardiographic recordings
ECG recordings Mustang (N)*
N= 243
Humla (N)*
N=242
Total (N)
N=485
Arrhythmias
Ectopics 0 3 3
Wolff-Parkinson-White 2 2 4
Atrioventricular block 4 0 4
Left bundle branch block 0 1 1
Right bundle branch block 5 1 6
Long QT 2 0 2
Morphological abnormalities
Right atrial hypertrophy 0 2 2
Right ventricular hypertrophy 0 2 2
Extreme axis deviation 3 0 3
Right axis deviation
Left axis deviation
8
2
18
2
26
4
Inverted T wave 7 6 13
Left ventricular hypertrophy 13 4 17
*Participants could have more than one abnormalities
None of the participants showed a definite electrocardiographic evidence of CHD. Overall
27/485, 5.6% (95% CI 3.7 to 8.0), of the participants gave a self-report of a history of CHD
confirmed by a medical doctor. The prevalence of CHD by sex was 17/212 (8.0%) in men
and 10/273 (3.7%) in women, Chi-square (1 df) 4.3, P=0.04. Altogether 95/485, 19.6%
(95% CI 16.1 to 23.4), of the participants had an abnormal (or borderline abnormal) ECG.
The main categories of abnormality were: RAD in 26/485, 5.4% (95% CI 3.5 to 7.7); and
LVH by voltage criteria in 17/485, 3.5% (95% CI 2 to 5.5). Of the 26 participants with
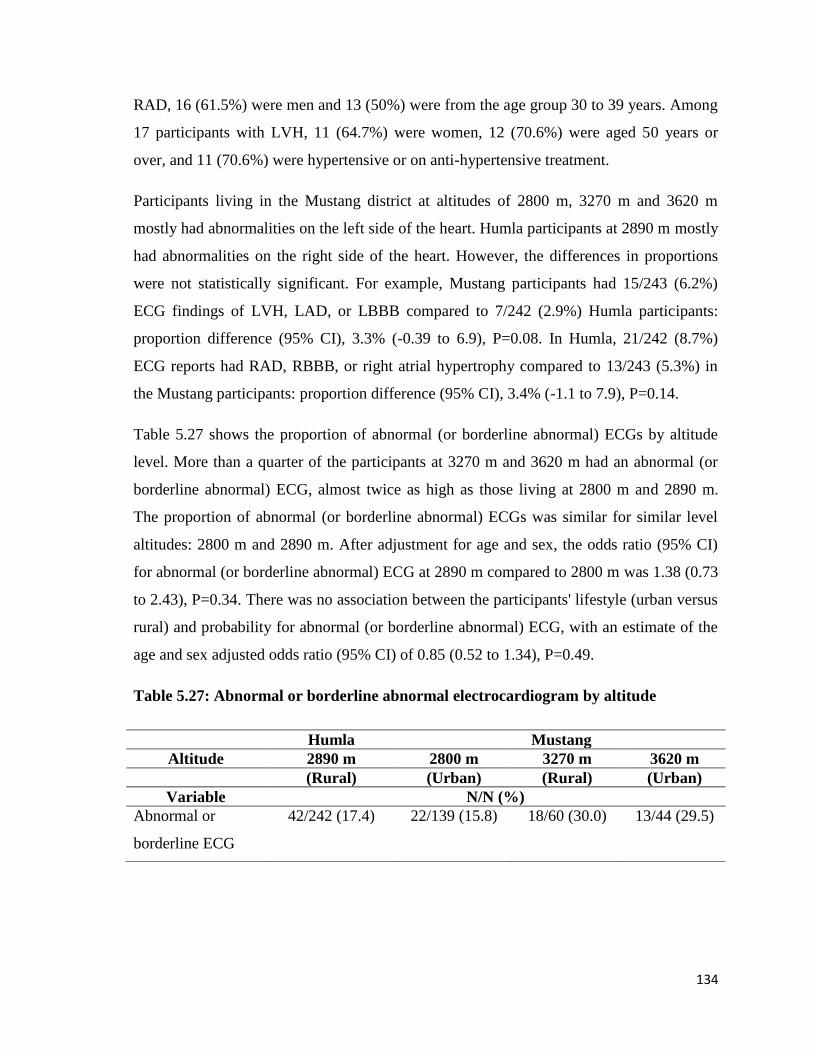
134
RAD, 16 (61.5%) were men and 13 (50%) were from the age group 30 to 39 years. Among
17 participants with LVH, 11 (64.7%) were women, 12 (70.6%) were aged 50 years or
over, and 11 (70.6%) were hypertensive or on anti-hypertensive treatment.
Participants living in the Mustang district at altitudes of 2800 m, 3270 m and 3620 m
mostly had abnormalities on the left side of the heart. Humla participants at 2890 m mostly
had abnormalities on the right side of the heart. However, the differences in proportions
were not statistically significant. For example, Mustang participants had 15/243 (6.2%)
ECG findings of LVH, LAD, or LBBB compared to 7/242 (2.9%) Humla participants:
proportion difference (95% CI), 3.3% (-0.39 to 6.9), P=0.08. In Humla, 21/242 (8.7%)
ECG reports had RAD, RBBB, or right atrial hypertrophy compared to 13/243 (5.3%) in
the Mustang participants: proportion difference (95% CI), 3.4% (-1.1 to 7.9), P=0.14.
Table 5.27 shows the proportion of abnormal (or borderline abnormal) ECGs by altitude
level. More than a quarter of the participants at 3270 m and 3620 m had an abnormal (or
borderline abnormal) ECG, almost twice as high as those living at 2800 m and 2890 m.
The proportion of abnormal (or borderline abnormal) ECGs was similar for similar level
altitudes: 2800 m and 2890 m. After adjustment for age and sex, the odds ratio (95% CI)
for abnormal (or borderline abnormal) ECG at 2890 m compared to 2800 m was 1.38 (0.73
to 2.43), P=0.34. There was no association between the participants' lifestyle (urban versus
rural) and probability for abnormal (or borderline abnormal) ECG, with an estimate of the
age and sex adjusted odds ratio (95% CI) of 0.85 (0.52 to 1.34), P=0.49.
Table 5.27: Abnormal or borderline abnormal electrocardiogram by altitude
Humla Mustang
Altitude 2890 m 2800 m 3270 m 3620 m
(Rural) (Urban) (Rural) (Urban)
Variable N/N (%)
Abnormal or
borderline ECG
42/242 (17.4) 22/139 (15.8) 18/60 (30.0) 13/44 (29.5)
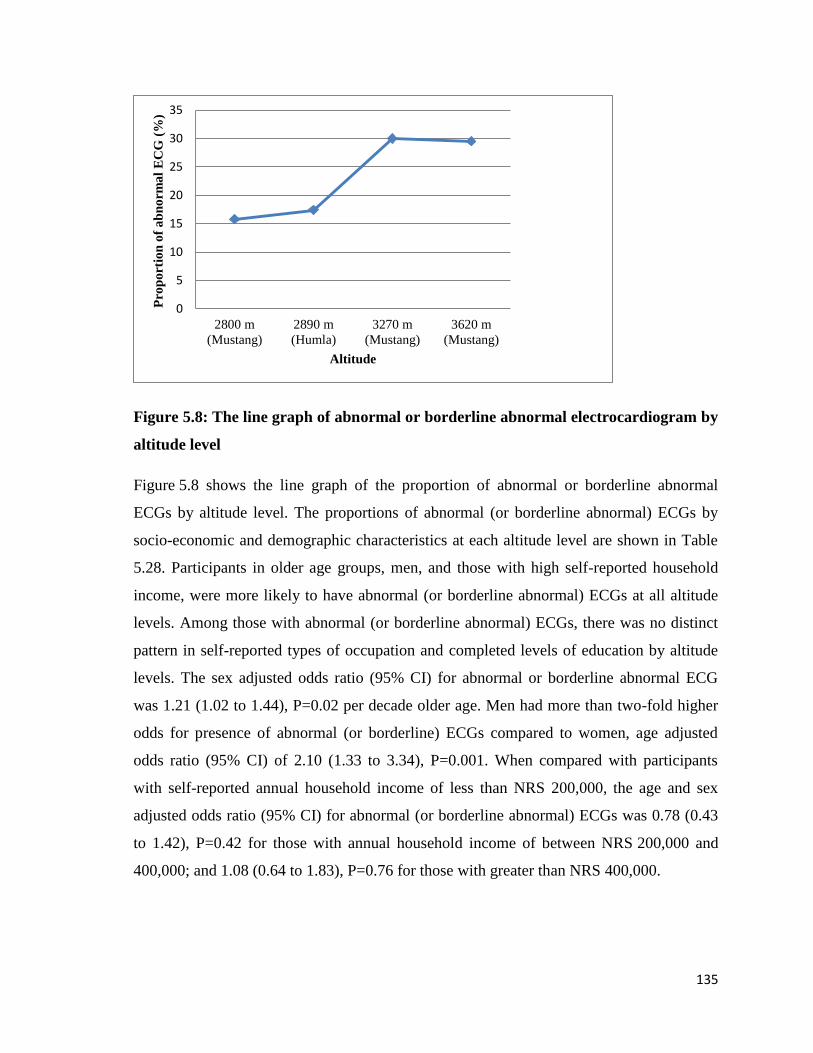
135
Figure 5.8: The line graph of abnormal or borderline abnormal electrocardiogram by
altitude level
Figure 5.8 shows the line graph of the proportion of abnormal or borderline abnormal
ECGs by altitude level. The proportions of abnormal (or borderline abnormal) ECGs by
socio-economic and demographic characteristics at each altitude level are shown in Table
5.28. Participants in older age groups, men, and those with high self-reported household
income, were more likely to have abnormal (or borderline abnormal) ECGs at all altitude
levels. Among those with abnormal (or borderline abnormal) ECGs, there was no distinct
pattern in self-reported types of occupation and completed levels of education by altitude
levels. The sex adjusted odds ratio (95% CI) for abnormal or borderline abnormal ECG
was 1.21 (1.02 to 1.44), P=0.02 per decade older age. Men had more than two-fold higher
odds for presence of abnormal (or borderline) ECGs compared to women, age adjusted
odds ratio (95% CI) of 2.10 (1.33 to 3.34), P=0.001. When compared with participants
with self-reported annual household income of less than NRS 200,000, the age and sex
adjusted odds ratio (95% CI) for abnormal (or borderline abnormal) ECGs was 0.78 (0.43
to 1.42), P=0.42 for those with annual household income of between NRS 200,000 and
400,000; and 1.08 (0.64 to 1.83), P=0.76 for those with greater than NRS 400,000.
0
5
10
15
20
25
30
35
2800 m
(Mustang)
2890 m
(Humla)
3270 m
(Mustang)
3620 m
(Mustang)
Pro
po
rtio
n o
f a
bn
orm
al
EC
G (
%)
Altitude
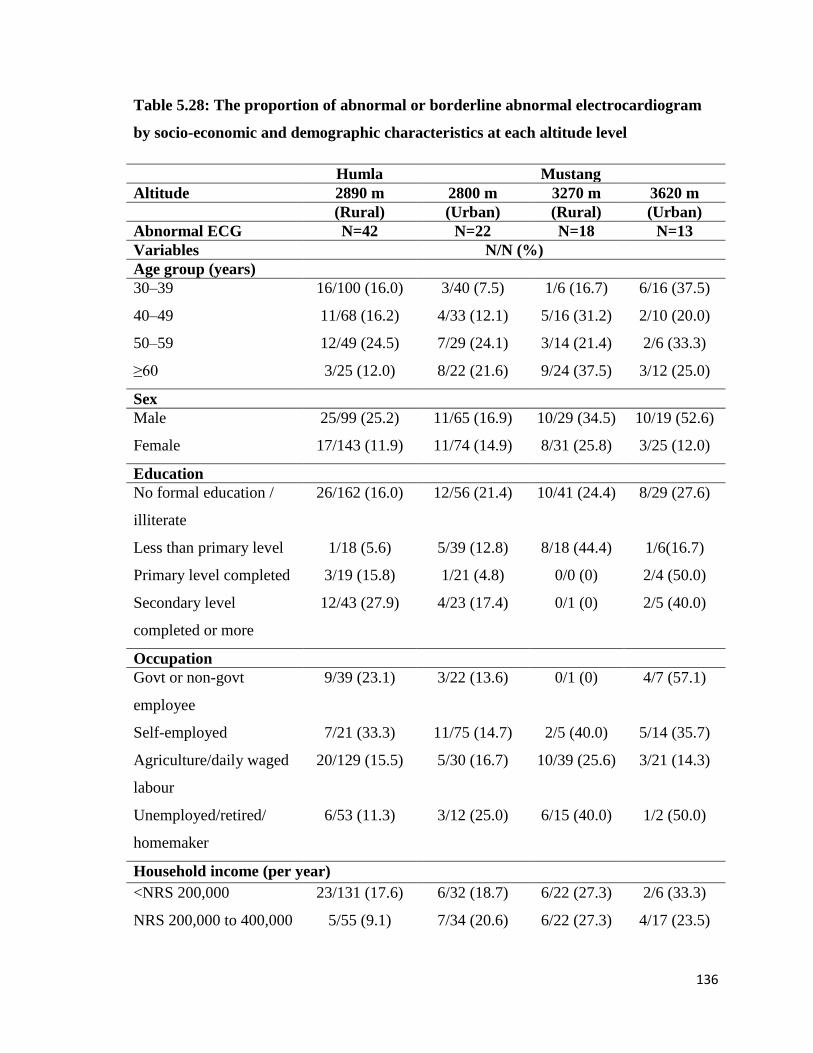
136
Table 5.28: The proportion of abnormal or borderline abnormal electrocardiogram
by socio-economic and demographic characteristics at each altitude level
Humla Mustang
Altitude 2890 m 2800 m 3270 m 3620 m
(Rural) (Urban) (Rural) (Urban)
Abnormal ECG N=42 N=22 N=18 N=13
Variables N/N (%)
Age group (years)
30–39 16/100 (16.0) 3/40 (7.5) 1/6 (16.7) 6/16 (37.5)
40–49 11/68 (16.2) 4/33 (12.1) 5/16 (31.2) 2/10 (20.0)
50–59 12/49 (24.5) 7/29 (24.1) 3/14 (21.4) 2/6 (33.3)
≥60 3/25 (12.0) 8/22 (21.6) 9/24 (37.5) 3/12 (25.0)
Sex
Male 25/99 (25.2) 11/65 (16.9) 10/29 (34.5) 10/19 (52.6)
Female 17/143 (11.9) 11/74 (14.9) 8/31 (25.8) 3/25 (12.0)
Education
No formal education /
illiterate
26/162 (16.0) 12/56 (21.4) 10/41 (24.4) 8/29 (27.6)
Less than primary level 1/18 (5.6) 5/39 (12.8) 8/18 (44.4) 1/6(16.7)
Primary level completed 3/19 (15.8) 1/21 (4.8) 0/0 (0) 2/4 (50.0)
Secondary level
completed or more
12/43 (27.9) 4/23 (17.4) 0/1 (0) 2/5 (40.0)
Occupation
Govt or non-govt
employee
9/39 (23.1) 3/22 (13.6) 0/1 (0) 4/7 (57.1)
Self-employed 7/21 (33.3) 11/75 (14.7) 2/5 (40.0) 5/14 (35.7)
Agriculture/daily waged
labour
20/129 (15.5) 5/30 (16.7) 10/39 (25.6) 3/21 (14.3)
Unemployed/retired/
homemaker
6/53 (11.3) 3/12 (25.0) 6/15 (40.0) 1/2 (50.0)
Household income (per year)
<NRS 200,000 23/131 (17.6) 6/32 (18.7) 6/22 (27.3) 2/6 (33.3)
NRS 200,000 to 400,000 5/55 (9.1) 7/34 (20.6) 6/22 (27.3) 4/17 (23.5)
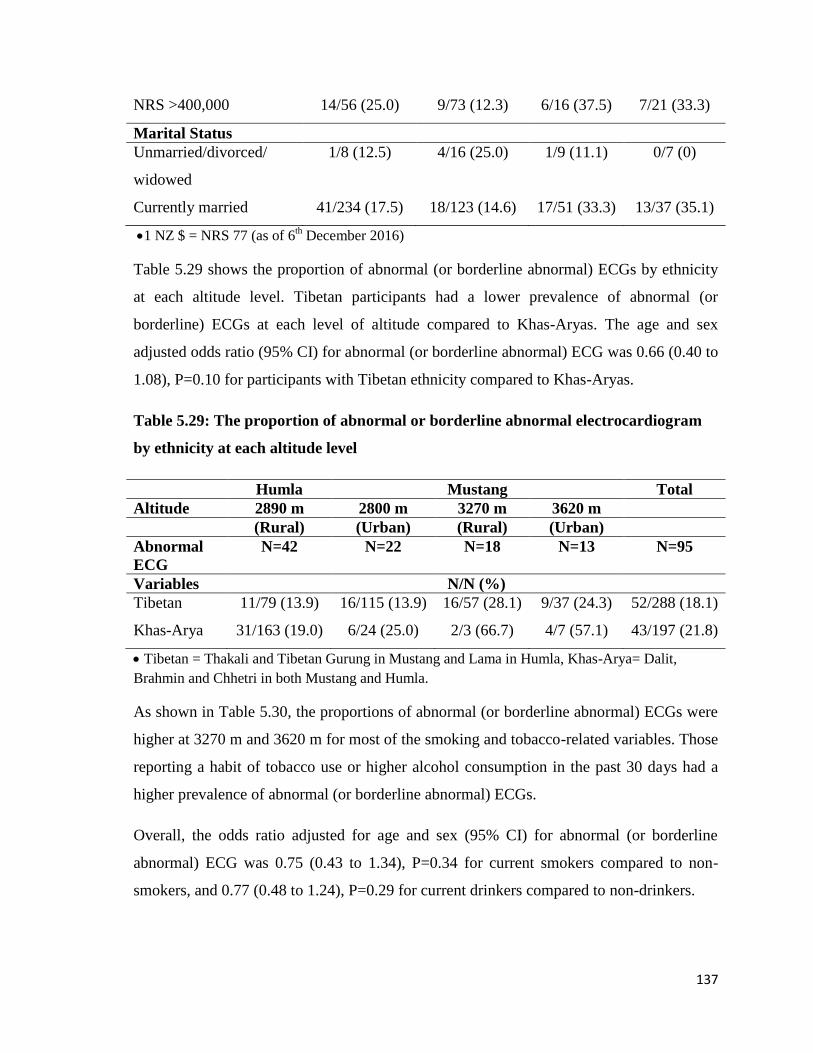
137
NRS >400,000 14/56 (25.0) 9/73 (12.3) 6/16 (37.5) 7/21 (33.3)
Marital Status
Unmarried/divorced/
widowed
1/8 (12.5) 4/16 (25.0) 1/9 (11.1) 0/7 (0)
Currently married 41/234 (17.5) 18/123 (14.6) 17/51 (33.3) 13/37 (35.1)
1 NZ $ = NRS 77 (as of 6th December 2016)
Table 5.29 shows the proportion of abnormal (or borderline abnormal) ECGs by ethnicity
at each altitude level. Tibetan participants had a lower prevalence of abnormal (or
borderline) ECGs at each level of altitude compared to Khas-Aryas. The age and sex
adjusted odds ratio (95% CI) for abnormal (or borderline abnormal) ECG was 0.66 (0.40 to
1.08), P=0.10 for participants with Tibetan ethnicity compared to Khas-Aryas.
Table 5.29: The proportion of abnormal or borderline abnormal electrocardiogram
by ethnicity at each altitude level
Humla Mustang Total
Altitude 2890 m 2800 m 3270 m 3620 m
(Rural) (Urban) (Rural) (Urban)
Abnormal
ECG
N=42 N=22 N=18 N=13 N=95
Variables N/N (%)
Tibetan 11/79 (13.9) 16/115 (13.9) 16/57 (28.1) 9/37 (24.3) 52/288 (18.1)
Khas-Arya 31/163 (19.0) 6/24 (25.0) 2/3 (66.7) 4/7 (57.1) 43/197 (21.8)
Tibetan = Thakali and Tibetan Gurung in Mustang and Lama in Humla, Khas-Arya= Dalit,
Brahmin and Chhetri in both Mustang and Humla.
As shown in Table 5.30, the proportions of abnormal (or borderline abnormal) ECGs were
higher at 3270 m and 3620 m for most of the smoking and tobacco-related variables. Those
reporting a habit of tobacco use or higher alcohol consumption in the past 30 days had a
higher prevalence of abnormal (or borderline abnormal) ECGs.
Overall, the odds ratio adjusted for age and sex (95% CI) for abnormal (or borderline
abnormal) ECG was 0.75 (0.43 to 1.34), P=0.34 for current smokers compared to non-
smokers, and 0.77 (0.48 to 1.24), P=0.29 for current drinkers compared to non-drinkers.
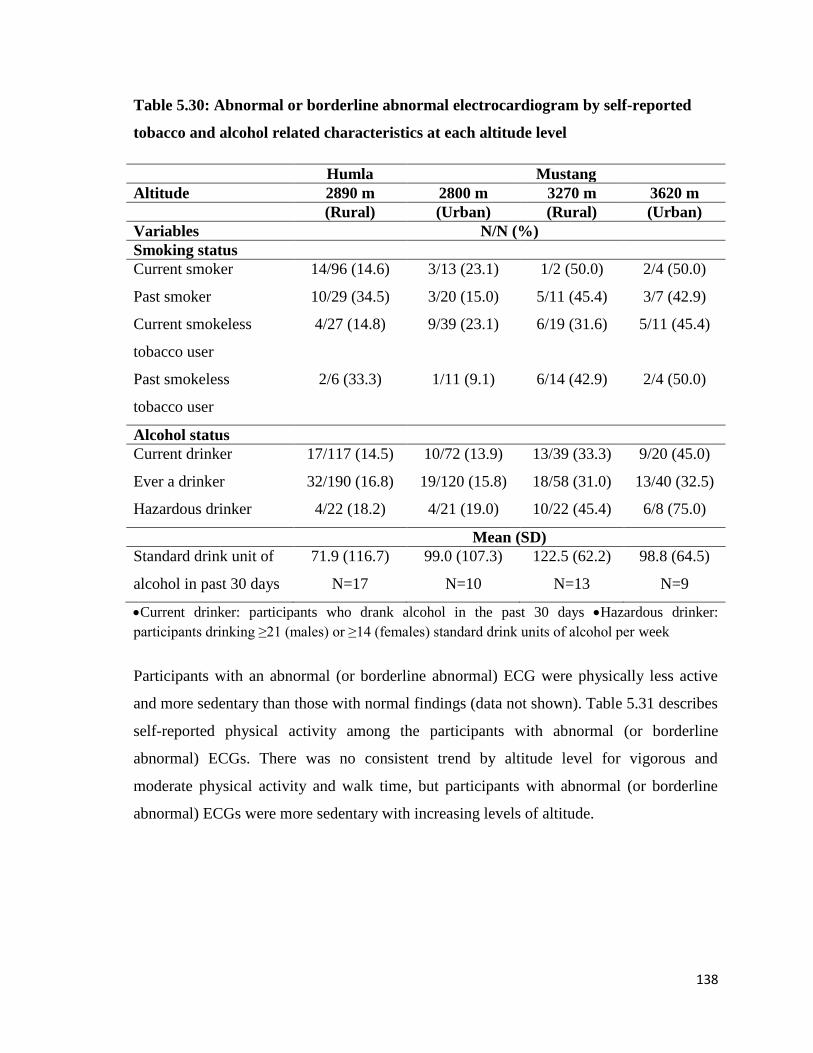
138
Table 5.30: Abnormal or borderline abnormal electrocardiogram by self-reported
tobacco and alcohol related characteristics at each altitude level
Humla Mustang
Altitude 2890 m 2800 m 3270 m 3620 m
(Rural) (Urban) (Rural) (Urban)
Variables N/N (%)
Smoking status
Current smoker 14/96 (14.6) 3/13 (23.1) 1/2 (50.0) 2/4 (50.0)
Past smoker 10/29 (34.5) 3/20 (15.0) 5/11 (45.4) 3/7 (42.9)
Current smokeless
tobacco user
4/27 (14.8) 9/39 (23.1) 6/19 (31.6) 5/11 (45.4)
Past smokeless
tobacco user
2/6 (33.3) 1/11 (9.1) 6/14 (42.9) 2/4 (50.0)
Alcohol status
Current drinker 17/117 (14.5) 10/72 (13.9) 13/39 (33.3) 9/20 (45.0)
Ever a drinker 32/190 (16.8) 19/120 (15.8) 18/58 (31.0) 13/40 (32.5)
Hazardous drinker 4/22 (18.2) 4/21 (19.0) 10/22 (45.4) 6/8 (75.0)
Mean (SD)
Standard drink unit of
alcohol in past 30 days
71.9 (116.7)
N=17
99.0 (107.3)
N=10
122.5 (62.2)
N=13
98.8 (64.5)
N=9
Current drinker: participants who drank alcohol in the past 30 days Hazardous drinker:
participants drinking ≥21 (males) or ≥14 (females) standard drink units of alcohol per week
Participants with an abnormal (or borderline abnormal) ECG were physically less active
and more sedentary than those with normal findings (data not shown). Table 5.31 describes
self-reported physical activity among the participants with abnormal (or borderline
abnormal) ECGs. There was no consistent trend by altitude level for vigorous and
moderate physical activity and walk time, but participants with abnormal (or borderline
abnormal) ECGs were more sedentary with increasing levels of altitude.
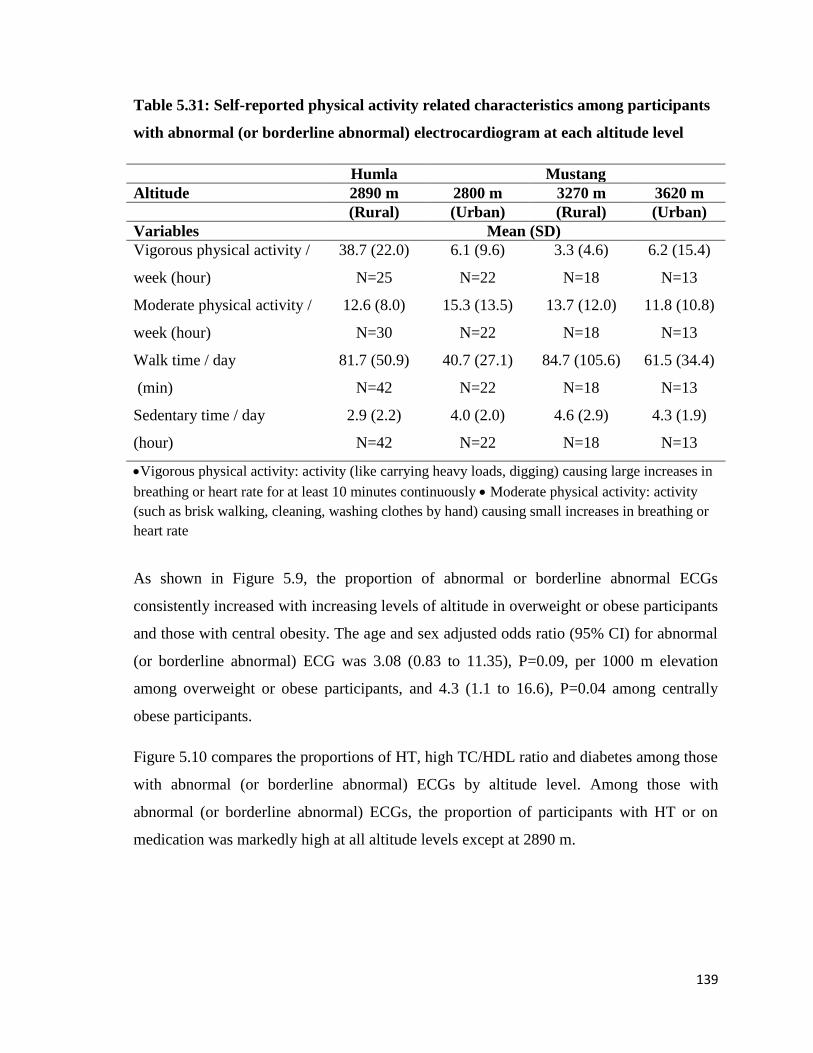
139
Table 5.31: Self-reported physical activity related characteristics among participants
with abnormal (or borderline abnormal) electrocardiogram at each altitude level
Humla Mustang
Altitude 2890 m 2800 m 3270 m 3620 m
(Rural) (Urban) (Rural) (Urban)
Variables Mean (SD)
Vigorous physical activity /
week (hour)
38.7 (22.0)
N=25
6.1 (9.6)
N=22
3.3 (4.6)
N=18
6.2 (15.4)
N=13
Moderate physical activity /
week (hour)
12.6 (8.0)
N=30
15.3 (13.5)
N=22
13.7 (12.0)
N=18
11.8 (10.8)
N=13
Walk time / day
(min)
81.7 (50.9)
N=42
40.7 (27.1)
N=22
84.7 (105.6)
N=18
61.5 (34.4)
N=13
Sedentary time / day
(hour)
2.9 (2.2)
N=42
4.0 (2.0)
N=22
4.6 (2.9)
N=18
4.3 (1.9)
N=13
Vigorous physical activity: activity (like carrying heavy loads, digging) causing large increases in
breathing or heart rate for at least 10 minutes continuously Moderate physical activity: activity
(such as brisk walking, cleaning, washing clothes by hand) causing small increases in breathing or
heart rate
As shown in Figure 5.9, the proportion of abnormal or borderline abnormal ECGs
consistently increased with increasing levels of altitude in overweight or obese participants
and those with central obesity. The age and sex adjusted odds ratio (95% CI) for abnormal
(or borderline abnormal) ECG was 3.08 (0.83 to 11.35), P=0.09, per 1000 m elevation
among overweight or obese participants, and 4.3 (1.1 to 16.6), P=0.04 among centrally
obese participants.
Figure 5.10 compares the proportions of HT, high TC/HDL ratio and diabetes among those
with abnormal (or borderline abnormal) ECGs by altitude level. Among those with
abnormal (or borderline abnormal) ECGs, the proportion of participants with HT or on
medication was markedly high at all altitude levels except at 2890 m.
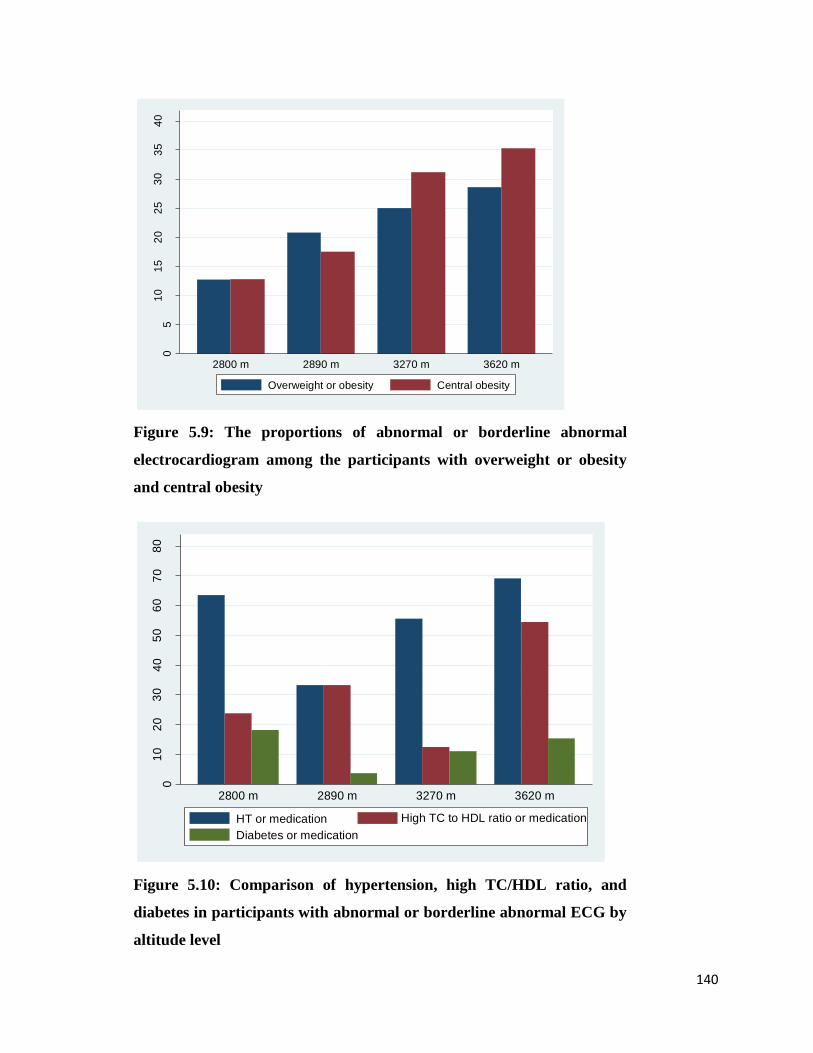
140
Figure 5.9: The proportions of abnormal or borderline abnormal
electrocardiogram among the participants with overweight or obesity
and central obesity
Figure 5.10: Comparison of hypertension, high TC/HDL ratio, and
diabetes in participants with abnormal or borderline abnormal ECG by
altitude level
05
10
15
20
25
30
35
40
Pro
po
rtio
n (
%)
2800 m 2890 m 3270 m 3620 m
Overweight or obesity Central obesity
01
02
03
04
05
06
07
08
0
Pro
po
rtio
n (
%)
2800 m 2890 m 3270 m 3620 m
HT or medication High TC to HDL ratio or medication
Diabetes or medication
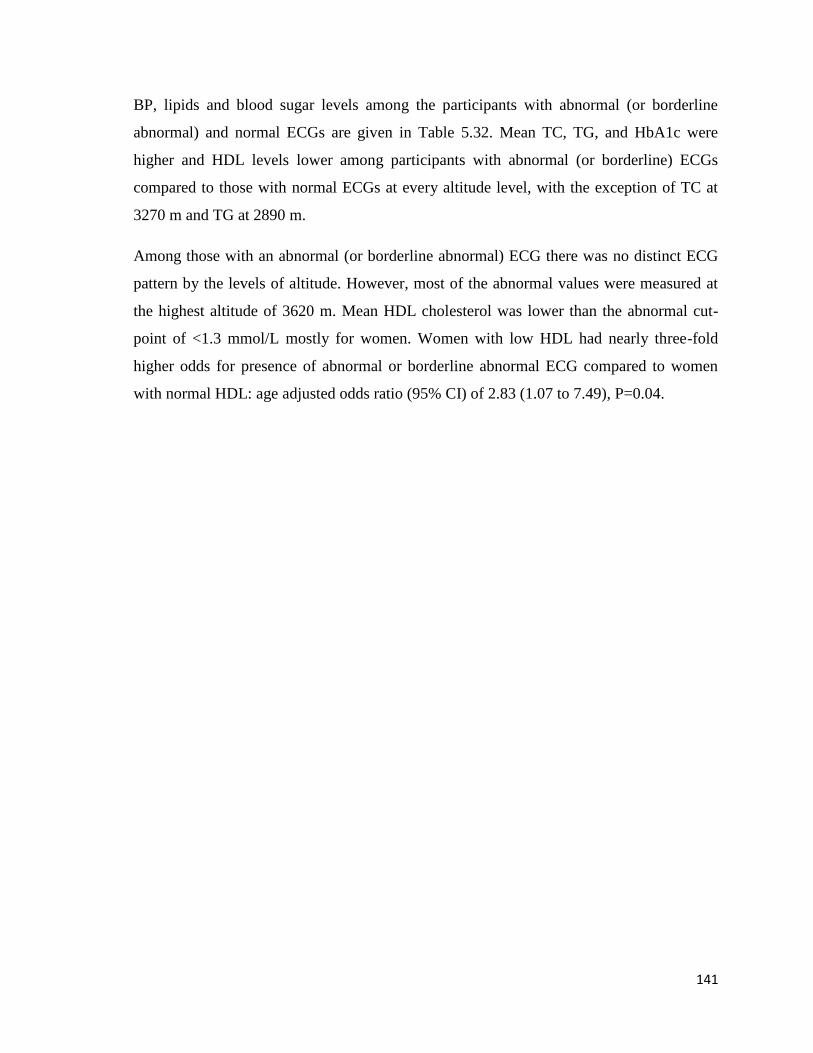
141
BP, lipids and blood sugar levels among the participants with abnormal (or borderline
abnormal) and normal ECGs are given in Table 5.32. Mean TC, TG, and HbA1c were
higher and HDL levels lower among participants with abnormal (or borderline) ECGs
compared to those with normal ECGs at every altitude level, with the exception of TC at
3270 m and TG at 2890 m.
Among those with an abnormal (or borderline abnormal) ECG there was no distinct ECG
pattern by the levels of altitude. However, most of the abnormal values were measured at
the highest altitude of 3620 m. Mean HDL cholesterol was lower than the abnormal cut-
point of <1.3 mmol/L mostly for women. Women with low HDL had nearly three-fold
higher odds for presence of abnormal or borderline abnormal ECG compared to women
with normal HDL: age adjusted odds ratio (95% CI) of 2.83 (1.07 to 7.49), P=0.04.
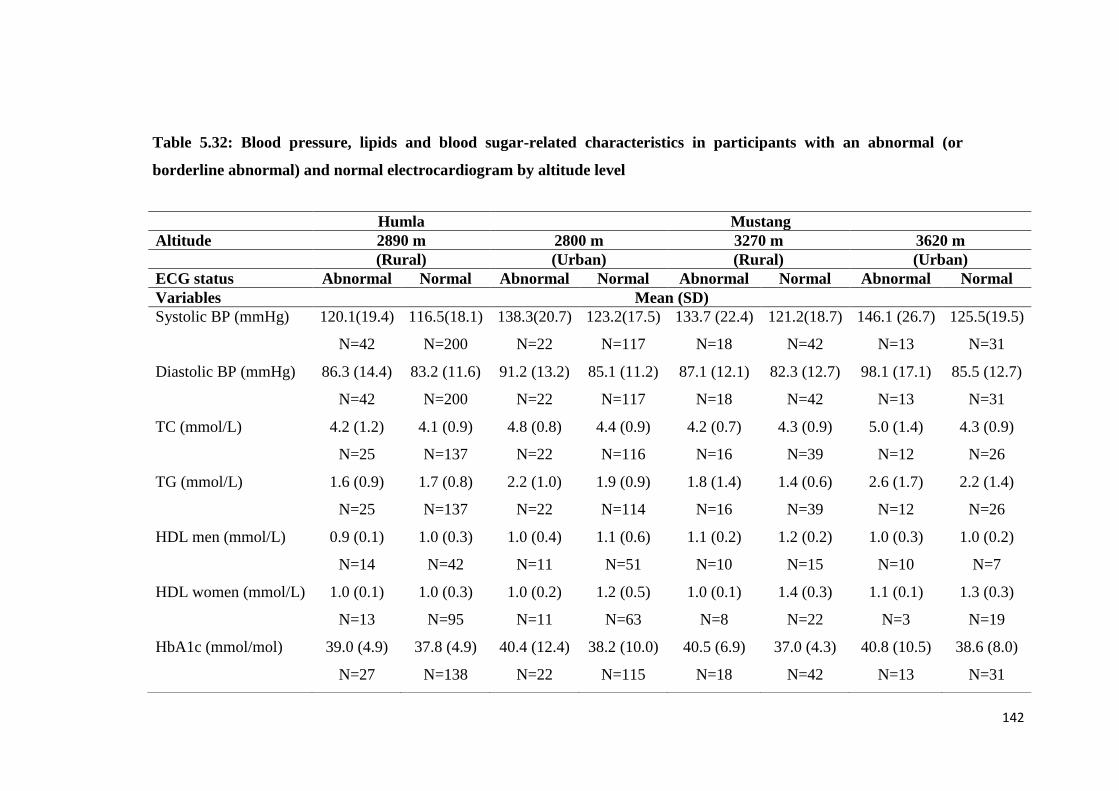
142
Table 5.32: Blood pressure, lipids and blood sugar-related characteristics in participants with an abnormal (or
borderline abnormal) and normal electrocardiogram by altitude level
Humla Mustang
Altitude 2890 m 2800 m 3270 m 3620 m
(Rural) (Urban) (Rural) (Urban)
ECG status Abnormal Normal Abnormal Normal Abnormal Normal Abnormal Normal
Variables Mean (SD)
Systolic BP (mmHg) 120.1(19.4)
N=42
116.5(18.1)
N=200
138.3(20.7)
N=22
123.2(17.5)
N=117
133.7 (22.4)
N=18
121.2(18.7)
N=42
146.1 (26.7)
N=13
125.5(19.5)
N=31
Diastolic BP (mmHg) 86.3 (14.4)
N=42
83.2 (11.6)
N=200
91.2 (13.2)
N=22
85.1 (11.2)
N=117
87.1 (12.1)
N=18
82.3 (12.7)
N=42
98.1 (17.1)
N=13
85.5 (12.7)
N=31
TC (mmol/L) 4.2 (1.2)
N=25
4.1 (0.9)
N=137
4.8 (0.8)
N=22
4.4 (0.9)
N=116
4.2 (0.7)
N=16
4.3 (0.9)
N=39
5.0 (1.4)
N=12
4.3 (0.9)
N=26
TG (mmol/L) 1.6 (0.9)
N=25
1.7 (0.8)
N=137
2.2 (1.0)
N=22
1.9 (0.9)
N=114
1.8 (1.4)
N=16
1.4 (0.6)
N=39
2.6 (1.7)
N=12
2.2 (1.4)
N=26
HDL men (mmol/L) 0.9 (0.1)
N=14
1.0 (0.3)
N=42
1.0 (0.4)
N=11
1.1 (0.6)
N=51
1.1 (0.2)
N=10
1.2 (0.2)
N=15
1.0 (0.3)
N=10
1.0 (0.2)
N=7
HDL women (mmol/L) 1.0 (0.1)
N=13
1.0 (0.3)
N=95
1.0 (0.2)
N=11
1.2 (0.5)
N=63
1.0 (0.1)
N=8
1.4 (0.3)
N=22
1.1 (0.1)
N=3
1.3 (0.3)
N=19
HbA1c (mmol/mol) 39.0 (4.9)
N=27
37.8 (4.9)
N=138
40.4 (12.4)
N=22
38.2 (10.0)
N=115
40.5 (6.9)
N=18
37.0 (4.3)
N=42
40.8 (10.5)
N=13
38.6 (8.0)
N=31
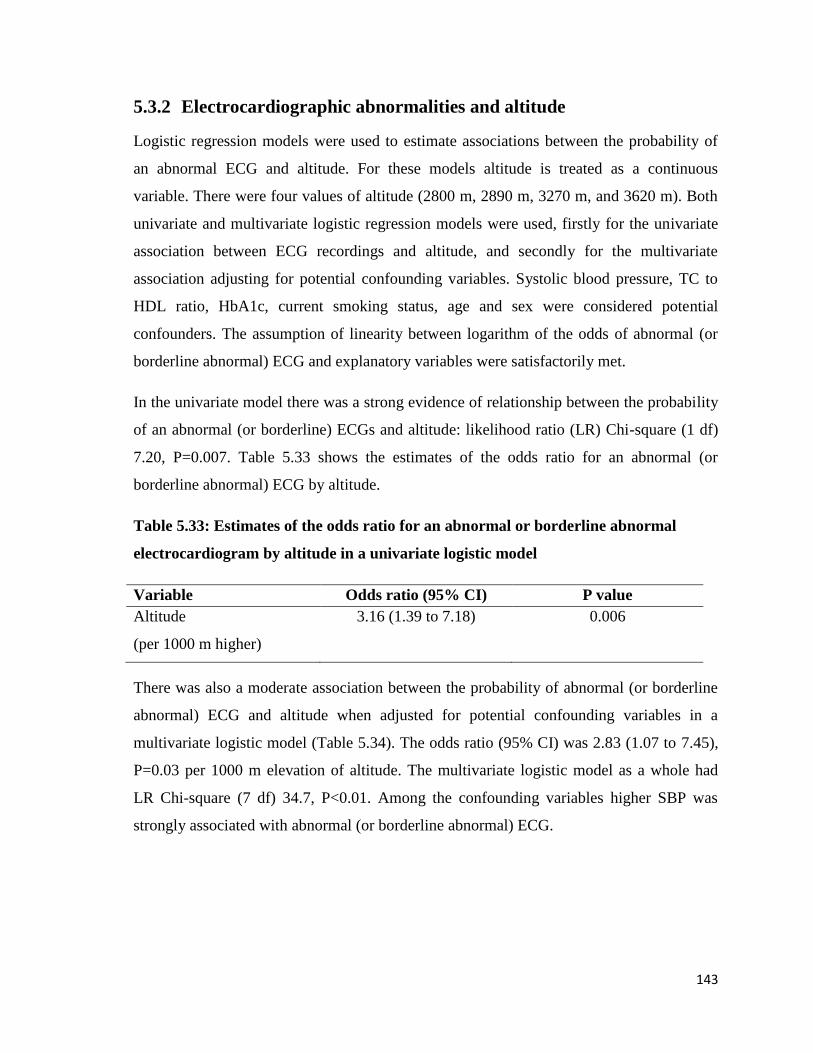
143
5.3.2 Electrocardiographic abnormalities and altitude
Logistic regression models were used to estimate associations between the probability of
an abnormal ECG and altitude. For these models altitude is treated as a continuous
variable. There were four values of altitude (2800 m, 2890 m, 3270 m, and 3620 m). Both
univariate and multivariate logistic regression models were used, firstly for the univariate
association between ECG recordings and altitude, and secondly for the multivariate
association adjusting for potential confounding variables. Systolic blood pressure, TC to
HDL ratio, HbA1c, current smoking status, age and sex were considered potential
confounders. The assumption of linearity between logarithm of the odds of abnormal (or
borderline abnormal) ECG and explanatory variables were satisfactorily met.
In the univariate model there was a strong evidence of relationship between the probability
of an abnormal (or borderline) ECGs and altitude: likelihood ratio (LR) Chi-square (1 df)
7.20, P=0.007. Table 5.33 shows the estimates of the odds ratio for an abnormal (or
borderline abnormal) ECG by altitude.
Table 5.33: Estimates of the odds ratio for an abnormal or borderline abnormal
electrocardiogram by altitude in a univariate logistic model
Variable Odds ratio (95% CI) P value
Altitude
(per 1000 m higher)
3.16 (1.39 to 7.18) 0.006
There was also a moderate association between the probability of abnormal (or borderline
abnormal) ECG and altitude when adjusted for potential confounding variables in a
multivariate logistic model (Table 5.34). The odds ratio (95% CI) was 2.83 (1.07 to 7.45),
P=0.03 per 1000 m elevation of altitude. The multivariate logistic model as a whole had
LR Chi-square (7 df) 34.7, P<0.01. Among the confounding variables higher SBP was
strongly associated with abnormal (or borderline abnormal) ECG.
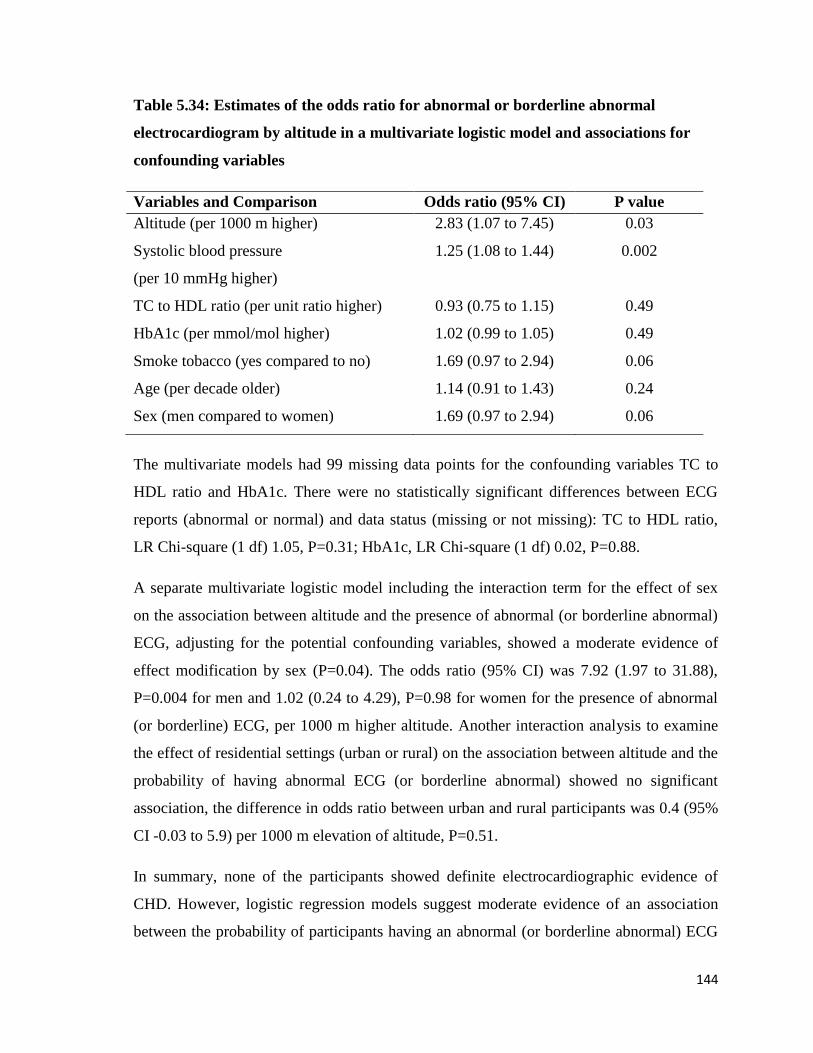
144
Table 5.34: Estimates of the odds ratio for abnormal or borderline abnormal
electrocardiogram by altitude in a multivariate logistic model and associations for
confounding variables
Variables and Comparison Odds ratio (95% CI) P value
Altitude (per 1000 m higher) 2.83 (1.07 to 7.45) 0.03
Systolic blood pressure
(per 10 mmHg higher)
1.25 (1.08 to 1.44) 0.002
TC to HDL ratio (per unit ratio higher) 0.93 (0.75 to 1.15) 0.49
HbA1c (per mmol/mol higher) 1.02 (0.99 to 1.05) 0.49
Smoke tobacco (yes compared to no) 1.69 (0.97 to 2.94) 0.06
Age (per decade older) 1.14 (0.91 to 1.43) 0.24
Sex (men compared to women) 1.69 (0.97 to 2.94) 0.06
The multivariate models had 99 missing data points for the confounding variables TC to
HDL ratio and HbA1c. There were no statistically significant differences between ECG
reports (abnormal or normal) and data status (missing or not missing): TC to HDL ratio,
LR Chi-square (1 df) 1.05, P=0.31; HbA1c, LR Chi-square (1 df) 0.02, P=0.88.
A separate multivariate logistic model including the interaction term for the effect of sex
on the association between altitude and the presence of abnormal (or borderline abnormal)
ECG, adjusting for the potential confounding variables, showed a moderate evidence of
effect modification by sex (P=0.04). The odds ratio (95% CI) was 7.92 (1.97 to 31.88),
P=0.004 for men and 1.02 (0.24 to 4.29), P=0.98 for women for the presence of abnormal
(or borderline) ECG, per 1000 m higher altitude. Another interaction analysis to examine
the effect of residential settings (urban or rural) on the association between altitude and the
probability of having abnormal ECG (or borderline abnormal) showed no significant
association, the difference in odds ratio between urban and rural participants was 0.4 (95%
CI -0.03 to 5.9) per 1000 m elevation of altitude, P=0.51.
In summary, none of the participants showed definite electrocardiographic evidence of
CHD. However, logistic regression models suggest moderate evidence of an association
between the probability of participants having an abnormal (or borderline abnormal) ECG
145
and altitude. This association was particularly strong for men. Higher SBP was
significantly associated with the presence of abnormal or borderline abnormal ECG.
The proportion of abnormal (or borderline abnormal) ECGs was almost twice as high at
altitudes of 3270 m and 3620 m compared to 2800 m and 2890 m. RAD and LVH were the
most common types of ECG abnormality. The proportion of participants with an abnormal
(or borderline abnormal) ECG increased with increasing altitudes for participants who
were overweight, obese, or had central obesity. Participants with an abnormal (or
borderline abnormal) ECG were significantly more likely to be sedentary with increasing
altitudes.
There was no statistically significant relationship between the types of lifestyle (urban or
rural) and ethnicity (Tibetan or Khas-Arya) and the probability of having an abnormal (or
borderline abnormal) ECG. Low HDL was associated with an abnormal (or borderline
abnormal) ECG among women.
146
6 Discussion
This chapter first discusses the limitations of the present study and then concentrates on
three key topic areas of this thesis i) cardiovascular disease (CVD) ii) blood pressure (BP),
and iii) other CVD risk factors (lipid profile, diabetes and tobacco use). Where possible the
results within these topic areas are compared with similar data from other high altitude
(HA) areas of Nepal and other HA areas of the world, and with low altitude (LA) areas of
Nepal and South Asia. Each section describes the main results in context, new findings,
strengths and weaknesses, and areas for future research. Finally, overall conclusions are
presented.
6.1 General limitations
A number of limitations relevant to the interpretation of the results are common across the
three topic areas. These are: confounding and effect modification, lack of robust local
administrative health datasets, the sampling process, reliance on self-report in an area of
poor health literacy, that other literature uses cut-points for estimation of prevalence and
incidence, and the cross-sectional design.
An important aspect of this thesis is whether there is a relationship between CVD, BP,
and/or or other CVD risk factors, and increasing altitude of usual residence. Multiple
potential confounding and effect modification factors could explain an apparent
relationship between the three topic areas and altitude. These include ancestry, cultural-
related lifestyle practices, socio-economic status, and residential settings (rural versus
urban). As discussed in the literature review section, there are known differences in
physiological responses to HA hypoxia and lifestyle practices (mainly the intake of dietary
salt and alcohol, and use of tobacco) between those HA populations with Tibetan ancestry
and other populations with a shorter history of living at HA, for example Khas-Aryas. The
socio-economic status of the participants varied between different sampled areas included
in the present study. Participants living in urban areas (2800 metre (m) and 3620 m) were
relatively well off, but those in rural areas (2890 m and 3270 m) were poor. These
differences are accounted for where relevant data were available, but clearly the potential
147
inter-relationships between altitude of residence, ethnicity, socio-economic, and cultural
factors are complex.
A lack of robust local administrative data sets means that key data that are usually
available in more developed and wealthier countries, such as robust death certification,
health surveys, accessible electronic or paper-based clinical records, and academic
publications on important health conditions are not available for remote regions of Nepal.
Therefore, it is difficult to triangulate the findings from the data gathered from this current
study's pragmatic cross-sectional survey design with other forms of information. This
means that any biases resulting from personal recollections of those surveyed, that is, recall
bias, and the results of simple physical examination and testing, are difficult to assess.
The sampling process for this study had to be adapted to suit the available sampling frames
and the logistical challenges of administering the research procedures in rural Nepal. As
described in the methodology section, the sampling technique used was convenience-based
cluster sampling. Although this technique meant that some observations may have been
correlated within sampling units it was not feasible to weight this appropriately because of
an absence of detailed knowledge of sampling frame factors such as socio-economic status,
combined with the problem of sparsely populated areas. Furthermore, the study areas
comprised both urban and rural settings, diverse ethnic populations and varying lifestyle
practices, making it difficulties to use proper conventional weighting schemes in the
analysis phase. The analysis strategy chosen assumed a simple random sample and this
meant that the precision of estimates of associations might be too narrow. Due to the
moderate sample size, there might be the possibility of type II error meaning that not
rejecting the null associations when it should be.
The present study relied on participants 'self-report' to gather information about personal
and family history of CVD and its risk factors, current and past medication, socio-
demography, and lifestyle practices. The population surveyed had generally low health
literacy based on a low level of overall education. At least 40% of participants at all
altitude levels were illiterate or had no formal education. In addition, the self-reporting
process could have led to various manifestations of information bias such as recall bias and
social-desirability bias. This implies that there may be systematic discrepancies between
148
self-report and actual behaviour, particularly for lifestyle practices such as smoking and
alcohol intake due to under-reporting, which might also confound or bias the identified
associations.
The literature review showed one limitation of the existing literature: that most
publications defined CVD risk factors using dichotomous cut-off values, despite many
CVD risk factors having a graded continuous relationship with actual risk. In order to
compare the results of the current study with existing literature, these specific thresholds
needed to be used, meaning an inevitable risk of loss of information, especially where
values are closer to thresholds, and there are some discrepancies in threshold values
between studies.
The cross-sectional design of the study also has other limitations with reference to
inference about causality. One of these limitations is the uncertainty, already alluded to
above with respect to recall bias, about when things occurred in relation to current reports.
Odds ratios in the cross-sectional studies could be biased away from true measure of effect
if prevalence is high. This could be relevant to the hypertension (HT) related odds ratios in
this thesis. Another limitation is that individuals who could potentially have been part of
the sampling frame may have moved away from the area or died after developing the
conditions that were of interest, meaning that the sampling frame may only have contacted
healthy individuals. This poses the risk of 'healthy survivor bias' or 'healthy individual
effect' because, in the absence of quality health care, people with CVD, myocardial
infarction (MI), or stroke might have moved to LA for treatment or died, so reported
prevalence might not reflect true incidence. On the other hand, it is also likely that healthy
young populations of study areas may have internally migrated to city areas or emigrated
to other countries for job, education or for other reasons. Thus, this 'migration effect' could
have missed eligible young and healthy individuals in the survey.
149
6.2 Cardiovascular disease
Main results in context
In the present study, none of the participants showed definite electrocardiographic
evidence of coronary heart disease (CHD) as indicated by pathological Q wave infarction.
However, 5.6% of the participants self-reported a personal history of CHD. Although few
population-based studies have been done on CHD in HA populations living at 2500 m or
more worldwide, the majority of available reports suggest a low incidence of MI in people
living at HA (Ashouri et al., 1993; Alberto Hurtado, 1960; Ramos et al., 1967). These were
all hospital-based studies, carried out and published a few decades ago. Nonetheless, this
finding is consistent with a recent systematic analysis of the burden of disease in Chinese
provinces reporting that the age-standardized mortality rate from CHD in men in Tibet,
mean altitude of 4500 m above sea level, was significantly lower compared with those
living at lower altitudes, although this difference was not seen in women (Zhou et al.,
2016). Various biological (Cai et al., 2003; Ding et al., 2005; Essop, 2007; Sasaki et al.,
2002; Semenza, 2006) and environmental-related (J. D. Anderson & Honigman, 2011;
Burtscher, 2014) plausible explanations have been suggested for potential cardio-
protection from living at HA.
The finding of a low prevalence of CHD in the present study, defined by the presence of
pathological Q waves or self-report of a medical history of CHD, is similar to reports of
CHD based on electrocardiogram (ECG) recordings or documented personal history at LA
in Nepal of 5.7% (Vaidya et al., 2009). A systematic review of global studies of CHD
prevalence (ECG recordings or documented personal history) in adults estimated the
prevalence of CHD in Asia was 5.8%, between 5.6% and 5.9% in rural China, between
1.4% to 4.6% in rural areas of India, 3.4% in rural areas of Bangladesh, and 5.1% in urban
Pakistan (Zhu, Wang, Zhu, Zhou, & Wang, 2015).
Caution should be taken when considering the CHD prevalence of the present study
because it is based on self-report of personal history alone, as no participants had any
objective evidence of CHD such as pathological Q waves on an ECG. Validity of the self-
report of a medical history is questionable in both developed (Kehoe, Wu, Leske, &
150
Chylack, 1994) and developing (Vellakkal et al., 2013) countries. One study reported that
for CHD the sensitivity of the self-report was low at 57% (Kehoe et al., 1994). In the
context of the present study, there is an additional risk of inaccurate recall of personal
history of CHD due to the poor literacy of the participants.
6.2.1 Major electrocardiographic abnormalities and patterns
In the present study, right axis deviation (RAD) was the most common ECG abnormality.
This is a possible early indication of pulmonary HT or right ventricular hypertrophy
(RVH). A large body of evidence also suggests RAD is the most common feature of HA
residents, particularly among Andeans. A review reports that RAD could be up to four
times higher in HA residents compared to sea-level residents (Windsor, Rodway, &
Montgomery, 2010). A number of studies have reported a positive association between
RAD and pulmonary artery pressure (Raynaud et al., 1981; Windsor et al., 2010). In the
present study, pulmonary artery pressure was not measured; however, the prevalence of
RAD was significantly higher in Humla participants (Khas-Aryas) compared to Mustang
participants (Tibetan ancestry). Other studies also report higher prevalence of RAD in
Andeans compared to Tibetan population samples (Jackson, 1975). Tibetan HA residents
are known to be genetically adapted to the hypoxic pulmonary vasoconstriction (M. Gupta
et al., 1992). In addition, morphological differences between these populations may be
relevant to this difference, for example, the shorter stature of Tibetans compared to Khas-
Aryas.
The present study identified that abnormal (or borderline abnormal) ECG recordings
occurred on the left side of the heart amongst Tibetan-dominant areas (Mustang district),
and on the right side among the Khas-Arya dominant area (Humla district). The ECG
abnormalities suggesting right heart abnormalities may reflect increased pulmonary
vascular resistance. Right-sided ECG abnormalities have previously been reported to occur
more frequently among HA residents where the populations are likely to be less well
adapted to hypoxia, such as Andeans or North Americans (Pryor et al., 1965; Rotta &
Lopez, 1959), but with a lower prevalence in those with a high degree of adaptation, such
as Tibetans (Groves et al., 1993). This phenomenon could apply to the findings of the
present study. As discussed in the introduction chapter, contrasting cardiopulmonary
151
responses to HA exposure have been reported among the largest HA populations: Tibetans,
Andeans and Aymaras (Abdias Hurtado et al., 2012).
The prevalence of some ECG abnormalities in the present study was lower than in other
studies of HA natives. For example, HA studies with ECG recordings frequently report a
high prevalence of RVH and right bundle branch block (RBBB) in both Tibetan (Halperin
et al., 1998) and Andean (Rotta & Lopez, 1959) HA populations. These occurred
infrequently in the present study, with a prevalence of 0.4% for RVH and 1.2% for RBBB.
However, this is similar to the findings of an Indian study of Tibetan-related participants
(Kaushal et al., 1995). Studies reporting higher prevalence of RVH and RBBB were
carried out at higher altitude levels than the present study. These higher altitudes may
cause a greater decline in inspired oxygen level, leading to significant rise in pulmonary
vascular resistance and resulting in greater strain on the right side of the heart.
A review of the English language literature in this thesis (Chapter 2, section 2.5) about the
prevalence of ECG abnormalities identified no studies reporting an association of ECG
abnormalities with altitude at different levels above 2500 m. Thus, it is difficult to compare
the present study's finding of a moderate association between abnormal (or borderline
abnormal) ECG and altitude with other studies. One study comparing RAD at different
levels of HA in participants with a variety of ethnic backgrounds reported increasing
deviation of frontal plane QRS with increasing levels of altitude (Raynaud et al., 1981).
6.2.2 Predictors of an abnormal (or borderline abnormal)
electrocardiogram
In the present study, higher systolic blood pressure (SBP) was strongly associated with an
increased probability of an abnormal (or borderline abnormal) ECG. There is a well-
documented association between SBP and CVD (Banach et al., 2014; Lim et al., 2012;
Prospective Studies Collaboration, 2002) so this association is unsurprising in the present
study. High BP can also lead to left ventricular hypertrophy (LVH), which produces
changes in the ECG that overlap with those caused by CHD. Among those with an
abnormal (or borderline abnormal) ECG in the present study at least 50% at three altitude
levels had HT or were on treatment for HT.
152
In the present study, there was a strong evidence of an association between altitude and the
probability of having an abnormal (or borderline) ECG in men but not in women after
controlling for confounding factors such as SBP, smoking tobacco, total cholesterol (TC)
to high-density lipoprotein-cholesterol (HDL) ratio, glycated hemoglobin (HbA1c), and
age. HA men may also have more of some other confounding factors that were not
measured in the present study.
6.2.3 Other important observations
Consistent with well-established evidence of the association between obesity and CVD
(Hubert et al., 1983; Kramer et al., 2013), in the present study obese and centrally obese
participants were significantly more likely to have an abnormal (or borderline abnormal)
ECG compared to those whose body mass index (BMI) and waist circumference (WC)
were in the normal range. Furthermore, the proportion of abnormal (or borderline
abnormal) ECGs in obese and centrally obese participants consistently increased with
increasing altitude levels. Living at HA may exacerbate lifestyle-related risk such as high
alcohol intake and sedentary behaviour due to cold temperatures and physical hardship
(Littman, 1970; Schinder & Ruder, 1989).
6.2.4 Cerebrovascular disease
The present study found a positive stroke history, or stroke symptoms by positive self-
report for at least one criterion of the Questionnaire for Verifying Stroke Free Status
(QVSFS), among 6.7% of the participants. The QVSFS was chosen to investigate stroke-
related risk because it is a widely accepted validated tool and is appropriate in settings like
the present study where neuroimaging facilities are not available. In the present study 2.1%
of participants self-reported that a physician had previously diagnosed them as having had
a stroke. This is significantly higher than reported in most other studies carried out in LA
residents using QVSFS (Fitzpatrick et al., 2012) or other prevalence estimates in South
Asia (Dhamija & Dhamija, 1998). No previous studies carried out in HA populations have
reported using the QVSFS. However, the high prevalence of self-reported stroke is
consistent with past studies in Tibetans that have identified a disproportionately higher
prevalence of HT and stroke compared to LA residents (G. Xu et al., 2013; Zhou et al.,
2016). A significant proportion of the present study's participants had Tibetan ancestry
153
and/or follow similar lifestyle and cultural practices as Tibetans. The apparently high
prevalence of self-reported history of stroke may be related to the high prevalence of HT,
which is a potent risk factor for all types of stroke (O'Donnell et al., 2010).
Accuracy of self-reported medical history of stroke is contestable even in developed
countries (Cristina, Williams, Parkinson, Sibbritt, & Byles, 2016). With the poor literacy
rate of the participants in the present study and possible lack of capability to understand the
complex nature of stroke, misclassification and recall biases are possible.
Although a positive history of stroke was relatively high in the present study compared to
most available studies at LA, the prevalence of positive stroke symptoms was lower than in
LA studies using QVSFS (Farah et al., 2015; Fitzpatrick et al., 2012; V. J. Howard et al.,
2006) or another stroke questionnaire (Toole et al., 1996). One possible reason may be the
lower minimum age for participation in the present study (30 years or over), which in other
studies was usually 40 years or over.
6.2.5 New findings
This is the first study to report the prevalence of CHD (based on ECG or self-report) and
history of stroke or suggestive symptoms in HA residents of Nepal. While the prevalence
of CHD in the present study was comparable to that of LA residents in Nepal, South Asia
or China, the prevalence of a stroke history was higher than in most of the available studies
in LA populations.
6.2.6 Strengths and weaknesses
The present study estimates prevalence of CHD (based on ECG or self-report) and a
history of stroke and stroke symptoms in HA areas of Nepal where ECG and neuroimaging
facilities are not routinely available. The use of ECG is a well-validated method of
assessing the prevalence of CHD at a population level because of the strong prognostic
value of major ECG findings on CVD and CHD mortality (De Bacquer, De Backer,
Kornitzer, & Blackburn, 1998). This is also the first study in Nepal that administered the
QVSFS. This may encourage other researchers to use that instrument for population-based
screening and for clinicians working in rural settings to identify patients with the risk of
stroke. Self-report of one or more positive symptoms from the QVSFS was significantly
154
associated with the hazard ratio of 1.36 (95% confidence interval (CI) 1.08 to 1.72) for
future incidence of stroke (Kleindorfer et al., 2011).
Very few population-based studies have been done on CVD prevalence in HA (≥2500 m)
areas worldwide and in LA areas in Nepal in particular with which to compare data in the
present study. We could not measure pulmonary artery pressure either directly or indirectly
(e.g., by echocardiography) or hematocrit level, which could also explain the findings
about the prevalence of CHD and stroke. All ECG reports were examined by one
cardiologist, which may introduce bias, although interpretation was standard. Study
participants were exposed to in-door air pollution to some extent, for example by using
solid biomass fuels for cooking or heating purpose. Although improved cook-stoves
(which significantly minimize in-door air pollution) is common in the study areas, they still
use wood or coal inside the house for heating purpose. We could not assess the impact of
in-door air pollution on CVD. In-door air pollution may increase the risk of pulmonary HT,
right heart failure (Bloomfield et al., 2012) and can trigger CVD related mortality and non-
fatal events (Brook et al., 2010). Stroke-like symptoms may arise from other conditions,
for example migraine, seizure, cataract, and further examinations to rule out any other
possibilities were not possible. In addition, the QVSFS has been reported to have high
sensitivity but a moderate level of specificity (Jones et al., 2001). One possible
confounding factor of 'healthy individual effect' as discussed in the general limitations
section above (6.1) may be underestimating the reported prevalence of CHD and history
and symptoms of stroke.
6.2.7 Areas for future research
The findings of the present study indicate a relatively higher risk of stroke at HA but CHD
prevalence appears comparable to that in LA areas. A greater risk of stroke and related
morbidities at HA is reported in several studies, particularly in Tibetan-related populations
(G. Xu et al., 2013; H.-T. Zhang et al., 2015). However, such evidence for HA residents of
other ethnicities is sparse, for example in the Andeans of South America, Amharics of
Ethiopia, and Khas-Aryas of Nepal. Although the majority of past published work has
findings consistent with a protective effect on CHD from permanent living at HA, there are
few studies on comparable populations living at HA and LA. More research on the
155
relationship between HA, ethnicity and CVD may clarify relationships and potential for
interventions.
6.3 Blood pressure
Main results in context
The present study found a moderate association between SBP and altitude. Although point
estimate for the association between diastolic blood pressure (DBP) with increasing
altitude levels was consistent with a positive association, confidence interval for the
estimate of association was wide. This study did not identify any association between HT
(or use of anti-hypertensive medication) and ethnicity; however, those with Tibetan
ancestry had a higher prevalence than Khas-Aryas. In multivariate models older age,
increased body weight, and increased self-reported alcohol intake amount were associated
with increased SBP and DBP. This study found an unexpected and inverse association
between self-reported salt intake and SBP after adjusting for potential confounding
variables.
A systematic review and meta-analysis developed from this thesis (Chapter 3, section 3.1)
and published in a peer-reviewed journal reported a weak association between SBP, DBP
and altitude in populations of Tibetan origin but in non-Tibetan populations both SBP and
DBP tended to decrease with residence at higher altitude, although there were wide
confidence intervals (N. Aryal, Weatherall, Bhatta, & Mann, 2016). Another systematic
review including studies conducted in Tibet reported a 2% increment in the prevalence of
HT for every 100 m increment in altitude (Mingji et al., 2015). These findings are
consistent with findings in the present study where, although participants were from both
Tibetan and Khas-Arya ethnicities, the geographical location of the study districts border
on the Tibetan side of China and Khas-Aryas have consequently acquired Tibetan lifestyle
practices, mainly drinking tea made with salty butter and high amounts of alcohol. This
may well contribute to the association between SBP and altitude regardless of ethnicity.
Nonetheless, the association between altitude and BP was found even after controlling for
alcohol and salt intake, which may indicate that the HA environment itself is an additional
156
independent factor in determining the high prevalence of HT although there may also be an
underlying genetic risk (Gesang et al., 2002; Kumar et al., 2003).
Although the present study's finding of multivariate adjusted associations between BP and
age, alcohol intake, and body weight is consistent with past research the inverse
relationship between self-reported daily salt consumption and SBP is not (Elliott et al.,
1996; Rose et al., 1988). High consumption of salt as a traditional dietary habit has been
identified as one of the key factors for high BP in HA Tibetan populations (Sehgal et al.,
1968; Sun, 1986). In addition, a randomized controlled trial of a low-sodium/high-
potassium salt substitute showed a dramatic decline in BP among Tibetan HA populations
(X. Zhao et al., 2014). The method used in the present study of self-report to calculate salt
consumption may not have been an accurate reflection of actual salt consumption.
Participants were asked about the mean amount of salt consumed by their family in a
month, which was then divided by the number of family members sharing the kitchen for
the main meal to estimate individual salt intake. This could have systematically led to
underestimation of salt intake in those with the highest salt intake.
The prevalence of HT (or those on anti-hypertensive medication) in participants in the
present study is higher than in other studies carried out in HA populations in Nepal using a
similar definition (Koju et al., 2015; S. Shrestha et al., 2012; Smith, 1999). Two possible
explanations for this difference are the different ages of the study samples and a cohort
effect. The minimum age to participate in the present study was 30 years, whereas other
studies usually included participants from the age of 18 years or over. HT may be
increasing in prevalence with the passage of time for reasons other than ethnicity or
altitude. However, in the present study, the prevalence of HT (or those on anti-
hypertensive medication) in the Mustang district (Tibetans), is close to that reported in HA
studies carried out on Tibetans living in Tibet or in India (Tripathy & Gupta, 2007; X.
Zhao et al., 2012; X. Zheng et al., 2012). In the present study the prevalence of HT (or
being on anti-hypertensive medication) in Mustang was higher than the national prevalence
for the population aged 30 years or over (36.8%) (K. K. Aryal et al., 2014), but was lower
in the Humla district with its dominant Khas-Arya population.
157
In the present study the prevalence of raised BP was high, but actual diagnosis and
treatment of HT was very poor. Nearly two-thirds of participants who had raised BP were
diagnosed with HT for the first time during the study. This highlights a huge unmet need
for HT identification and management in these study areas. Only 3.3% of the study
participants were on anti-hypertensive medication. This is substantially fewer compared to
other HA settings where the prevalence of treatment is reported to be between 24.3% (X.
Zheng et al., 2012) and 59.1% (Sherpa et al., 2013) in other parts of Tibet. A combination
of factors such as lack of education and awareness and poor access to health care services
in HA settings may contribute to this situation of undiagnosed and untreated HT.
6.3.1 New findings
This is the first study to report the relationship between BP and altitude at four different
altitude levels above or equal to 2500 m. The present study also found that the non-Tibetan
HA population of study areas has acquired Tibetan lifestyle habits (mainly high
consumption of salty butter tea and alcohol), which may increase the risk of HT in the
future.
6.3.2 Strengths and weaknesses
The main strength of the present study for the relationship between BP and HA is that
information was collected at different altitude levels and from ethnically diverse samples.
In an attempt to minimise BP measurement bias, recordings were carried out three times
for each participant, a minimum of 10 minutes apart and the mean was used as the final
reported BP. Also, if readings differed by more than 10 units, a fourth reading was taken
and the lowest three readings were considered as the final mean. An electronic aneroid
sphygmomanometer (Omron HEM-7221) well validated to operate at HA was used.
Weaknesses include that possible factors associated with BP were measured by self-report
for alcohol intake, smoking status, salt intake, and current treatment for HT. Under-
reporting of alcohol use in population surveys is very common because of such factors as
social-desirability bias (Davis, Thake, & Vilhena, 2010) and recall bias (Stockwell et al.,
2004). Similarly, there is good evidence that dietary salt intake by self-report is under-
estimated compared to when using more objective measures (De Keyzer et al., 2015). Also,
158
in the present study information on the amount of salt consumed during home cooking was
requested and other sources such as salt included in processed foods was not taken into
account. Although home cooking contributes to around two-thirds of total dietary salt in
Asian settings (C. A. Anderson et al., 2010), the given estimates could be still under-
reported. As mentioned above (6.2.6), study participants were likely to get exposed with
in-door pollution and there is increasing evidence that chronic exposure to in-door air
pollution is associated with higher BP (M.-S. Lee et al., 2012; Painschab et al., 2013). The
present study could not examine this relationship.
6.3.3 Areas for future research
There is very limited research about BP among the non-Tibetan HA populations in Nepal.
More data and analysis of these populations will help to better understand the HA and BP
relationship. Comparisons of HA populations with homogeneous counterparts who later
migrated to LA may also provide important insights into this relationship. The established
association between salt intake and BP in general and known evidence of high intake of
salt by some HA populations warrants further investigation. In HA settings of Nepal, no
studies have collected information on salt intake by measuring urinary sodium excretion
levels, which would yield the most definitive data. Recent findings suggest that a single
fasting urine test with some correction (using the Kawasaki formula) is a valid method of
measuring sodium excretion at a population level (Han et al., 2015). This could be a simple
and reliable method to adopt in HA settings. Also, low-sodium/high-potassium salt
substitute intervention, which was proved to be effective in reducing BP in other HA
settings (X. Zhao et al., 2014), could also be tested in HA populations of Nepal. Finally,
more exploration is required into the reasons behind the extremely high proportion of
undiagnosed and untreated hypertensive populations in HA areas of Nepal.
159
6.4 Other cardiovascular disease risk factors
This section discusses the results of three key Framingham risk factors for CVD: lipid
profile, diabetes, and tobacco use; and risk prediction for major cardiovascular events. Of
other Framingham risk factors, BP has been discussed above and age has been discussed
throughout the chapter.
6.4.1 Lipid Profile
Main results in context
In the present study, the prevalence of high TC and low HDL are lower, but the prevalence
of raised triglyceride (TG) is higher when compared with the national prevalence in Nepal
for the population aged greater than or equal to 30 years (K. K. Aryal et al., 2014). There
were no consistent trends in lipid components in relation to altitude and ethnicity. In other
studies of lipids in HA settings, TC and TG are usually lower than the present study, and
HDL higher.
In particular, other HA studies report markedly higher prevalence of high TC (≥200 mg/dL
or ≥5.2 mmol/L) compared to the present study (Málaga et al., 2010; Mohanna et al., 2006;
Sherpa et al., 2011). Only one study in Nepal reported TC in a HA setting and identified a
prevalence of high TC of 14.1% in study participants aged 15 years or older living in
mountainous areas (K. K. Aryal et al., 2015). This is consistent with the present study's
overall prevalence of elevated TC of 17.3%. The expectation was that the prevalence of TC
would be high in those with Tibetan ancestry because of traditional diets with large
amounts of oil, butter and meat products (Stevens, 1996). There is strong evidence that
plasma TC level is highly genetically dependent and heritability is estimated to be around
40% to 60% (Y. Lu et al., 2010). This may partly explain the reason for the relatively low
prevalence of a high TC in the present study compared to other most HA studies.
The present study's high TC prevalence is slightly lower compared to the studies carried
out in LA areas of other South Asian countries using similar definitions (Guptha et al.,
2014; Kinra et al., 2010). This may be because of the hypoxia and cold temperature-
induced increments in plasma catecholamines (Moncloa, Gómez, & Hurtado, 1965) and
subsequent metabolic effects on lipolysis (Okuda, Yanagi, & Fujii, 1966). The present
160
study also identified a higher prevalence of a high TG level compared with other LA
populations. This is likely to be related to high consumption of alcohol and carbohydrates
(Klop et al., 2013; Parks, 2001). In addition, alteration in hepatic lipid oxidation in hypoxia
induced by HA may also increase TG levels (Muratsubaki et al., 2003).
In the present study more than half of the men and two-thirds of women had low HDL.
This finding, despite being higher than the results from other HA settings (Baracco et al.,
2007; Mohanna et al., 2006; Sherpa et al., 2011; Sherpa et al., 2013), is lower than the
national prevalence in Nepal for the population aged 30 years or over (K. K. Aryal et al.,
2014) and closer to the studies conducted in LA areas of South Asia (N. Aryal & Wasti).
Nearly half of the participants in the present study were current drinkers of alcohol and
studies report a positive association between alcohol intake and HDL (Sung, Kim, &
Reaven, 2007; Wakabayashi & Araki, 2010). The apparently low HDL in the present study
compared to that in Nepal may be confounded by alcohol intake. There is also strong
evidence of low HDL in South Asians (Karthikeyan et al., 2009; L. Zhang et al., 2010).
Factors such as a low level of physical activity, low consumption of fruit and vegetables,
other dietary habits (Joshi et al., 2007), and genetic predisposition (Dodani, Dong, Zhu, &
George, 2008) are possible contributory factors to the high prevalence of low HDL in
South Asian populations.
Although most of the South American HA studies report a slightly higher prevalence of
high TG and lower prevalence of low HDL compared to the present study (Baracco et al.,
2007; Gonzales & Tapia, 2013; Málaga et al., 2010; Mohanna et al., 2006), Tibetan studies
show a markedly lower prevalence of high TG and low HDL (Sherpa et al., 2011; Sherpa
et al., 2013). The known ethnic differences in lipid components (Anand et al., 2000;
Chandalia, Mohan, Adams-Huet, Deepa, & Abate, 2008) may be the reason for the
differences seen in different HA populations.
Urban dwellers (2800 m and 3620 m) have higher levels of TC and TG compared to rural
dwellers (2890 m and 3270 m) even in similar ethnic populations. This suggests lifestyle
practices are more important in determining lipid component levels than altitude and
ethnicity. Previous studies in Tibet also indicate desirable patterns of plasma lipid
161
components in rural residents (Sherpa et al., 2013) compared to the urban population
(Sherpa et al., 2011).
6.4.1.1 New findings
This is the first study to report the prevalence of abnormal lipid components of Nepalese
people living at different levels of HA. Just one previous study reported TC levels in
mountainous regions but without specifying particular altitudes (K. K. Aryal et al., 2015).
The present study found a low prevalence of high TC at HA compared to other reports both
at HA and in South Asian LA populations.
6.4.1.2 Strengths and weaknesses
The main strength of this study with respect to lipid profile measurement was the use of a
robust measurement system at HA. Quality control testing, as per the manufacturing
company’s instructions, was carried out. An instrument failure at 2890 m reduced the
sample size and precision of mean measurements in this group. This survey used non-
fasting blood samples for determination of a lipid profile. Fasting is not routinely
recommended for lipid profile test. However, evidence shows a minor increase in TG
levels after habitual meal, although clinically not significant (Nordestgaard et al., 2016).
The present study might have over-reported TG levels in some participants with lipid
profile measurements after meal.
6.4.1.3 Areas for future research
A low prevalence of raised TC levels in the present study compared to other HA areas
warrants further research in other HA populations in Nepal. More data are needed from
diverse ethnic groups. The major HA populations of Nepal are of Tibetan ancestry with
traditional dietary habits of consuming high amounts of oil, butter, cheese, and meat
products and these may raise TC levels. Detail information on use of these dietary
components may help to assess this relationship. This study has also corroborated previous
reports of high TG levels in HA population. Further research could focus on effective
intervention to reduce TG levels and concomitant metabolic risk in HA populations.
Little research has been published on the specific impact of HA on lipid components. For
example, an association has been reported between vitamin D levels and favourable lipid
162
profiles (Challoumas, 2014). HA populations have a high level of vitamin D because of
high ultraviolet B (UVB) light exposure (J. D. Anderson & Honigman, 2011). Some
studies also report a positive association between hemoglobin and lipid components at HA
(Gonzales & Tapia, 2013) and LA (Kawamoto et al., 2011). Since some HA populations,
particularly those with a short ancestral history of living at HA, have high hemoglobin
levels, this relationship may be worth assessing further to explore whether hemoglobin
level per se is the determinant of abnormal lipid components in HA population.
163
6.4.2 Diabetes
Main results in context
There was no consistent pattern of blood glucose levels or prevalence of diabetes in
relation to altitude and ethnicity in the present study. However, the prevalence of diabetes
was higher in urban areas (2800 m and 3620 m) than in rural areas (2890 m and 3270 m).
The prevalence of pre-diabetes was high in rural areas. Diabetes was more likely in men
than in women but this difference was not statistically significant at any altitude level.
In the present study the prevalence of diabetes was 3.3% (3270 m) and 3.5% (2890 m) in
rural settings, and 10.6% (2800 m) and 13.6% (3620 m) in urban settings. This is higher
than past estimates for the Nepalese population, particularly those in rural areas (Gyawali
et al., 2015; International Diabetes Federation, 2015), and also higher than that reported in
mountainous regions of Nepal (K. K. Aryal et al., 2015). Although differences in
definitions and the inclusion of only participants aged 30 years or over may partly explain
the difference when compared with other estimates, the increasing risk of diabetes in HA
populations in the present study was unsurprisingly accompanied by a higher rate of pre-
diabetes. The prevalence of pre-diabetes was higher than the national estimate of 10.3%
(Gyawali et al., 2015) at all altitude levels in the present study, particularly so in rural
settings (2890 m and 3270 m) where at least one-third of the participants were pre-
diabetics.
There may be both physiological and environmental reasons for the high prevalence of
diabetes and pre-diabetes in rural populations in the present study compared to the national
estimates for rural populations in Nepal. While moderate drinking has been found to have
protective effects on blood glucose levels, evidence is strong on the relationship between
heavy drinking and the risk of diabetes (Baliunas et al., 2009; A. A. Howard, Arnsten, &
Gourevitch, 2004). A significant proportion of rural dwellers in the present study were
hazardous drinkers (men drinking ≥21 standard drinking unit (SDU) and women drinking
≥14 SDU of alcohol per week); for example, 56.4% participants at 3270 m were hazardous
drinkers. This may account for the very high prevalence of pre-diabetes in rural dwellers in
the present study.
164
The present study's findings on diabetes prevalence in urban HA areas (2800 m and 3620
m) is higher than the reports from other urban HA settings (W. Chen et al., 2011; López de
Guimaraes, Chiriboga García, Gonzáles Crisóstomo, & Vega Mejía, 2007; Okumiya et al.,
2016; Schargrodsky et al., 2008). However, there is significant variability in the prevalence
of diabetes in other rural HA settings (Málaga et al., 2010; Negi et al., 2012; Ojeda et al.,
2014; Okumiya et al., 2016). The higher prevalence of diabetes in the urban HA areas in
the present study compared to other HA settings may be due to high economic status and
obesity. Urban areas studied are popular tourist destinations, for both religious and
adventure travelling, and local people are mostly self-employed, mainly in shops and
hospitality-related jobs. Thakali is the particular dominant Tibetan-related ethnic group in
these areas and this group has the highest human development index (HDI) in Nepal
(Government of Nepal & United Nations Development Programme, 2014). A positive
association between income level and risk of diabetes is well established in the South
Asian setting (Deepa, Anjana, Manjula, Narayan, & Mohan, 2011). In the present study
urban participants had a considerably higher prevalence of overweight or obesity, 56.6% at
2800 m and 47.7% at 3620 m. Obesity is the most significant risk associated with type 2
diabetes (Field et al., 2001), which is mediated by insulin resistance (Boden & Chen,
1995). One study in Eastern Nepal reported higher BMI, urban residency, and high socio-
economic status as the risk factors for diabetes (Mehta et al., 2011), which seems to apply
in the present study as well.
The finding of a higher prevalence of diabetes in men compared to women is similar to
most studies carried out in other HA settings (W. Chen et al., 2011; Gonzales & Tapia,
2013; S. Xu et al., 2015). This trend is observed worldwide as well. According to a recent
estimate, in 2014, the prevalence of diabetes in men was 9% compared to 7.9% in women
(NCD Risk Factor Collaboration, 2016). Although the prominent risk factor of obesity is
more prevalent in women than in men globally, differences in biology, culture, nutritional
uptake, lifestyle habits and environmental factors are likely to contribute to the higher risk
of diabetes in men (Kautzky-Willer, Harreiter, & Pacini, 2016).
In the present study 44% of diabetics were newly diagnosed, which is close to the global
rate of 46.5% for undiagnosed diabetes in adults (International Diabetes Federation, 2015).
165
However, this prevalence of undiagnosed diabetes is far lower than the International
Diabetes Federation (IDF) estimates of 62.1% in both urban and rural areas of Nepal
(International Diabetes Federation, 2015). This may be partly due to the easily available
self-monitoring blood glucose testing devices and purchasing capacity of study
participants, particularly those located in urban areas.
6.4.2.1 New findings
This is the first study in Nepal to report the prevalence of diabetes in HA areas of Nepal at
specified levels of altitude. One previous study reported on diabetes prevalence in
mountainous regions without mentioning the altitude levels (K. K. Aryal et al., 2015) and it
is likely that it included study areas located at less than 2500 m.
Although the existing literature from HA populations has usually reported a lower
prevalence of diabetes compared to the general population, this study is one of the very
few which has found a higher prevalence in HA urban populations.
6.4.2.2 Strengths and weaknesses
The present study measured HbA1c levels using technology that is validated to perform
well at HA. Quality control guidelines were strictly followed to ensure accuracy. Lipid
profiles and HbA1c were measured using the same instrument and as mentioned in the
lipid profile section, the machine had technical problems at 2890 m, which may minimize
the precision of estimates for this group because of the reduced sample size.
6.4.2.3 Areas for future research
More evidence on the risk of diabetes and its risk factors among different ethnic HA
populations in Nepal and at different levels of altitude may lead to appropriate health
interventions. Particularly, future research should prioritize the role of alcohol and other
lifestyle habits play in diabetes risk in Nepalese HA populations. This is equally important
in HA residents of other countries. Recently some evidence has emerged of a strong
association between polycythemia and glucose intolerance (Okumiya et al., 2016). Some
HA populations, particularly those who are ancestrally less adapted to HA environments,
tend to have high levels of erythrocytes or hemoglobin (Beall, 2007). The present study did
166
not measure these and exploring these relationships may contribute to the current small
amount of evidence on hemoglobin-blood glucose association in HA populations.
6.4.3 Tobacco use
The present study found that the patterns of tobacco use varied with ethnicity rather than
with altitude and residential settings (urban or rural). Compared with the national
prevalence, the Mustang district with predominantly Tibetan populations (2800 m, 3270 m,
and 3620 m) had a significantly lower prevalence of current smokers. The prevalence was
higher in the Humla district (2890 m) where the majority were of Khas-Arya ethnicity.
This pattern was reversed for current smokeless tobacco users. Men were more likely to be
both smokers and smokeless tobacco users.
In the present study, between 3.3% and 10.3% of the participants self-reported being
current smokers in three different altitudes of Tibetan-dominant Mustang but this rate was
markedly higher (38.6%) in Khas-Aryas who dominated in the Humla district. A low
prevalence of current smokers among Tibetan-related populations in the present study
compared to nationally (K. K. Aryal et al., 2014) and South East Asia region (World
Health Organization, 2014b) may be attributed to the influence of cultural norms and
practices. Unlike alcohol use, the preference for smoking is lower in traditional Tibetan
culture. This tendency has also been observed among residents of the Appalachian
Mountains in the US (Meyer et al., 2008). Other studies carried out in Tibetan (Sherpa et
al., 2013; Sherpa et al., 2010) and Andean HA populations (Gonzales & Tapia, 2013;
Jaillard et al., 1995) also report a low prevalence of smoking.
There was a much higher rate of current smoking among dominant Khas-Arya populations
in Humla in both genders than nationally (K. K. Aryal et al., 2014) and regionally (World
Health Organization, 2014b). In this population at 2890 m, 49.5% men and 31.1% women
self-reported current smoking with the vast majority being daily smokers. The main reason
for this high prevalence may be the familial and societal acceptance of tobacco smoking as
most of them recalled being inspired to smoke by senior family members or peers. In
addition, locally made and cheaply available bidis (unprocessed tobacco wrapped in
leaves) are also popular in villages. A high rate of smoking has been reported in a few
167
other South Asian HA populations as well (Shah, Arif, et al., 2001). Lack of tobacco
control initiatives and poor awareness levels of smoking related risks could also be reasons
for higher rates of tobacco smoking in the Nepalese rural population. One recent study
among women in a LA rural area of Nepal reported a 43.6% prevalence of being a current
smoker (Khatri et al., 2015).
Cultural influences on tobacco use are reflected in the prevalence of the use of smokeless
tobacco as well. While smoked tobacco is not preferred behaviour in Tibetan culture, use
of smokeless tobacco is very common. Nose-snuffing of ground tobacco leaves is the most
popular form of smokeless tobacco use in traditional Tibetan practice. Other common
forms of smokeless tobacco are commercially or non-commercially manufactured chewing
tobacco. In the present study, between 25% and 31.1% of participants from the Tibetan-
dominant Mustang district self-reported being current smokeless tobacco users, whereas
the rate was just 10.9% for Khas-Aryas who dominate in the Humla district. The
prevalence of current users of smokeless tobacco in Mustang (Tibetans) was slightly higher
than the national prevalence of 23.2% (men 39.1% and women 7.7%) for the age group 30
years or over (K. K. Aryal et al., 2014).
The present study found a high prevalence of current smoking or use of smokeless tobacco
in men compared to women. Globally, smoking prevalence is at least five times higher in
men (37%) than in women (7%) (World Health Organization, 2014b). However, in the
present study this difference was much wider in the Tibetan-related populations of
Mustang but smaller in Khas-Aryas in Humla. It is rare to find tobacco smoking among
Tibetan women. However, Tibetan men, being more exposed to the outer world, show a
greater tendency to smoke. Among Tibetan-related populations in the present study, none
of the women at 3270 m and 3620 m self-reported current smoking and the rate was 2.3%
at 2800 m. About one-third of female participants in Humla were current smokers. A very
low prevalence of smoking in Tibetan women, as in the present study, has been reported in
several other HA studies (Sherpa et al., 2013; X. Zhao et al., 2012).
6.4.3.1 New findings
This study reports that half of the men and one-third of the women in the Humla
population at 2890 m were current smokers. This is the highest documented prevalence of
168
current smokers in HA populations. This study also found that tobacco use did not
correlate with levels of HA.
6.4.3.2 Strengths and weaknesses
The main strength of this study regarding tobacco use is that other related information was
collected from those who self-reported being a current smoker or used smokeless tobacco.
For example, for current smokers, data was gathered on the age of starting smoking, years
of smoking, number of cigarettes smoked per day, and any previous attempts to stop
smoking. This helped to confirm self-reported smoking behaviour. However, it was
difficult to confirm whether the past smokers and past smokeless tobacco users really had
stopped using tobacco or whether use had recurred. This is important to note because a
number of participants self-reported having recently quit using tobacco. A growing bias
against the social desirability of smoking may have led to underestimates of current
tobacco use. The prevalence of nose-snuffing of ground tobacco leaves in Tibetan-related
participants should be interpreted cautiously because only a few participants reported using
it daily. Most reported using it while suffering from the common cold or during social
gatherings.
6.4.3.3 Areas for future research
The present study shows that while Tibetan-related HA populations have a cultural bias
against smoking tobacco, other HA residents may have exceptionally high rates. More
information is required on tobacco use of HA populations in Nepal, particularly in Khas-
Aryas. There is no reliable information on determinants or triggers of tobacco use in
Nepal’s HA populations. It is important to examine this because HA populations are
different from LA residents in many ways; for example, environmental and working
conditions are different. The government of Nepal introduced a stringent Tobacco Control
Act in 2011 but there is no evidence on how effective it is in remote HA settings. Future
research on its impact in HA areas and barriers to successful enforcement may significantly
help health policy planners in Nepal.
169
6.4.4 Risk prediction for major cardiovascular events
In the present study, 3.9% of the participants were estimated to have a high risk
(probability equal to or greater than 20%) of fatal or non-fatal cardiovascular events (MI or
stroke) within the next 10 years according to the World Health Organization (WHO) and
International Society of Hypertension (ISH) risk prediction chart for South-East Asia sub-
region D. The reported prevalence of CHD in the present study is in line with this. This is
also similar to the report from the WHO-led study in a LA area of Nepal using the same
risk prediction chart, which estimated the probability of high risk of future major
cardiovascular events in 3.3% of the population aged 40 years or older (Mendis et al.,
2011).
170
6.5 Overall conclusion
The sample of HA residents in the present study had a similar prevalence of CHD and
future risk of major CVD events but a higher prevalence of a history of stroke, compared to
the LA populations. Men were more likely than women to have a raised risk of abnormal
ECG and lipid components, HT, diabetes, and being a smoker. The only exception was the
prevalence of low HDL, which was higher in women.
Cardiovascular risk profiles of HA populations may depend on altitude, ethnicity, cultural
lifestyle practices, and residential setting (urban or rural). Altitude per se could be an
important additional risk factor because of the relationship between HA levels and higher
SBP, and increased prevalence of an abnormal (or borderline abnormal) ECG. Differences
in ECG abnormality patterns in Tibetan and Khas-Arya populations may reflect different
ancestry-related physiological responses to the low oxygen environment and the varying
patterns of CVD-related risk in HA populations. Other important findings are: HT
particularly in Tibetan-related populations, high current smoking rates in Khas-Aryas, and
a high prevalence of pre-diabetes in all study samples. This indicates that ethnicity
associated lifestyle practices are likely to be an important determinant of CVD health for
HA residents and that HA populations are passing through a phase of epidemiological
transition from lower to higher risk for CVD.
To conclude, despite having a similar risk of CHD as the LA populations, some CVD risk
factors (particularly HT) and consequent risk of stroke may be higher in specific HA
populations. The main factors that should be considered for assessment and management of
cardiovascular risk in HA populations are altitude, ethnicity and associated cultural
lifestyle practices (such as salt and alcohol intake, smoking habit), and residential settings
(mainly differences in physical activity and fruit and vegetable consumption between urban
and rural participants).
171
7 References
Abusuev, S., Khachurov, D., & Akhmedkhanov, A. (1992). Epidemiologic aspects of diabetes
mellitus in Dagestan. Problemy Endokrinologii, 39(1), 21-24.
Aceituno-Madera, P., Buendía-Eisman, A., Olmo, F., Jiménez-Moleón, J., & Serrano-Ortega, S.
(2011). Melanoma, altitud y radiación UVB (Melanoma, altitude, and UV-B radiation).
Actas Dermo-Sifiliograficas, 102(3), 199-205.
Akhtar, M., Bandopadhaya, P., Chatterjee, P., & Krishnamurti, S. (1978). Electrocardiographic
changes under moderate hypoxia. Indian Heart Journal, 31(6), 353-358.
Al-Huthi, M. A., Raja'a, Y. A., Al-Noami, M., & Rahman, A. R. A. (2006). Prevalence of coronary
risk factors, clinical presentation, and complications in acute coronary syndrome patients
living at high vs low altitudes in Yemen. Medscape General Medicine, 8(4), 28.
Al Tahan, A., Buchur, J., El Khwsky, F., Ogunniyi, A., Al-Rajeh, S., Larbi, E., . . . Bamgboye, E.
(1998). Risk factors of stroke at high and low altitude areas in Saudi Arabia. Archives of
Medical Research, 29(2), 173-177.
Alberti, G., Zimmet, P., & Shaw, J. (2006). Metabolic syndrome—a new world‐wide definition. A
consensus statement from the international diabetes federation. Diabetic Medicine, 23(5),
469-480.
Ambrose, J. A., & Barua, R. S. (2004). The pathophysiology of cigarette smoking and
cardiovascular disease : an update. Journal of the American College of Cardiology, 43(10),
1731-1737.
American Diabetes Association. (2016). Classification and diagnosis of diabetes. Diabetes Care,
39(Supplement 1), S13-S22.
Anand, S. S., Yusuf, S., Vuksan, V., Devanesen, S., Teo, K. K., Montague, P. A., . . . Gerstein, H.
(2000). Differences in risk factors, atherosclerosis, and cardiovascular disease between
ethnic groups in Canada: the Study of Health Assessment and Risk in Ethnic groups
(SHARE). The Lancet, 356(9226), 279-284.
Anderson, C. A., Appel, L. J., Okuda, N., Brown, I. J., Chan, Q., Zhao, L., . . . Curb, J. D. (2010).
Dietary sources of sodium in China, Japan, the United Kingdom, and the United States,
women and men aged 40 to 59 years: the INTERMAP study. Journal of the American
Dietetic Association, 110(5), 736-745.
Anderson, J. D., & Honigman, B. (2011). The effect of altitude-induced hypoxia on heart disease:
do acute, intermittent, and chronic exposures provide cardioprotection? High Altitude
Medicine & Biology, 12(1), 45-55.
Arestegui, A. H., Fuquay, R., Sirota, J., Swenson, E. R., Schoene, R. B., Jefferson, J. A., . . .
Johnson, R. J. (2011). High altitude renal syndrome (HARS). Journal of the American
Society of Nephrology, 22(11), 1963-1968.
Arias-Stella, J. (1966). Morphological patterns : mechanism of pulmonary arterial hypertension
Life at high altitudes (pp. 9-12). Washington DC: Pan American Health Organisation.
Arias‐Stelalnad, J., & Topilsky, M. (1971). Anatomy of the coronary circulation at high altitude.
Paper presented at the Ciba Foundation Symposium-High Altitude Physiology: Cardiac
and Respiratory Aspects.
172
Aryal, K. K., Mehata, S., Neupane, S., Vaidya, A., Dhimal, M., Dhakal, P., . . . Paulin, F. H.
(2015). The burden and determinants of non communicable diseases risk factors in Nepal:
findings from a nationwide STEPS survey. PloS One, 10(8), e0134834.
Aryal, K. K., Neupane, S., Mehata, S., Vaidya, A., Singh, S., Paulin, F., . . . Lohani, G. R. (2014).
Non communicable diseases risk factors: STEPS Survey Nepal 2013. Kathmandu, Nepal:
Nepal Health Research Council.
Aryal, N., & Wasti, S. P. (2016). The prevalence of metabolic syndrome in South Asia: a
systematic review. International Journal of Diabetes in Developing Countries, 36(3), 255-
262.
Aryal, N., Weatherall, M., Bhatta, Y. K. D., & Mann, S. (2016). Blood pressure and hypertension
in adults permanently living at high altitude : a systematic review and meta-analysis. High
Altitude Medicine & Biology, 17(3), 185-193.
Ashouri, K., Ahmed, M., Kardash, M., Sharif, A., Abdalsattar, M., & al Ghozeim, A. (1993). Acute
myocardial infarction at high altitude: the experience in Asir Region, southern Saudi
Arabia. Ethnicity and Disease, 4(1), 82-86.
Asia Pacific Cohort Studies Collaboration. (2003). Blood pressure and cardiovascular disease in the
Asia Pacific region. Journal of Hypertension, 21, 707-716.
Baibas, N., Trichopoulou, A., Voridis, E., & Trichopoulos, D. (2005). Residence in mountainous
compared with lowland areas in relation to total and coronary mortality. A study in rural
Greece. Journal of Epidemiology and Community Health, 59(4), 274-278.
Baker, P. T. (1969). Human adaptation to high altitude. Science, 163(3872), 1149-1156.
Baliunas, D. O., Taylor, B. J., Irving, H., Roerecke, M., Patra, J., Mohapatra, S., & Rehm, J.
(2009). Alcohol as a risk factor for type 2 diabetes : a systematic review and meta-analysis.
Diabetes Care, 32(11), 2123-2132.
Banach, M., Bromfield, S., Howard, G., Howard, V. J., Zanchetti, A., Aronow, W. S., . . . Muntner,
P. (2014). Association of systolic blood pressure levels with cardiovascular events and all-
cause mortality among older adults taking antihypertensive medication. International
Journal of Cardiology, 176(1), 219-226.
Baracco, R., Mohanna, S., & Seclén, S. (2007). A comparison of the prevalence of metabolic
syndrome and its components in high and low altitude populations in Peru. Metabolic
Syndrome and Related Disorders, 5(1), 55-62.
Barker, D. J., Osmond, C., Forsén, T. J., Kajantie, E., & Eriksson, J. G. (2005). Trajectories of
growth among children who have coronary events as adults. New England Journal of
Medicine, 353(17), 1802-1809.
Barson, J. R., Karatayev, O., Chang, G.-Q., Johnson, D. F., Bocarsly, M. E., Hoebel, B. G., &
Leibowitz, S. F. (2009). Positive relationship between dietary fat, ethanol intake,
triglycerides, and hypothalamic peptides: counteraction by lipid-lowering drugs. Alcohol,
43(6), 433-441.
Basnyat, B., Ogilvie, R., White, A., O’Brien, B., Hackett, P., & Roach, R. (2001). High-altitude
illness. New England Journal of Medicine, 345(17), 1279-1271.
Bassett, M., Gimenez, M., Romaguera, D., & Sammán, N. (2013). Nutritional status and food
intake of populations from high altitude regions of the Northwest of Argentia. Archivos
Latinoamericanos de Nutrición, 63(2), 114-124.
173
Beagley, J., Guariguata, L., Weil, C., & Motala, A. A. (2014). Global estimates of undiagnosed
diabetes in adults. Diabetes Research and Clinical Practice, 103(2), 150-160.
Beall, C. M. (2007). Two routes to functional adaptation: Tibetan and Andean high-altitude natives.
Proceedings of the National Academy of Sciences of the United States of America,
104(Suppl 1), 8655-8660.
Beall, C. M., Cavalleri, G. L., Deng, L., Elston, R. C., Gao, Y., Knight, J., . . . McCormack, M.
(2010). Natural selection on EPAS1 (HIF2α) associated with low hemoglobin
concentration in Tibetan highlanders. Proceedings of the National Academy of Sciences of
the United States of America, 107(25), 11459-11464.
Beall, C. M., Decker, M. J., Brittenham, G. M., Kushner, I., Gebremedhin, A., & Strohl, K. P.
(2002). An Ethiopian pattern of human adaptation to high-altitude hypoxia. Proceedings of
the National Academy of Sciences of the United States of America, 99(26), 17215-17218.
Beall, C. M., Gebremedhin, A., Brittenham, G. M., Decker, M. J., & Shamebo, M. (1997). Blood
pressure variation among Ethiopians on the Simien Plateau. Annals of Human Biology,
24(4), 333-342.
Beall, C. M., Laskowski, D., Strohl, K. P., Soria, R., Villena, M., Vargas, E., . . . Erzurum, S. C.
(2001). Pulmonary nitric oxide in mountain dwellers. Nature, 414(6862), 411-412.
Beall, C. M., Strohl, K. P., Blangero, J., Williams-Blangero, S., Almasy, L. A., Decker, M. J., . . .
Villena, M. (1997). Ventilation and hypoxic ventilatory response of Tibetan and Aymara
high altitude natives. American Journal of Physical Anthropology, 104(4), 427-447.
Bennett, C. L., Silver, S. M., Djulbegovic, B., Samaras, A. T., Blau, C. A., Gleason, K. J., . . .
McKoy, J. M. (2008). Venous thromboembolism and mortality associated with
recombinant erythropoietin and darbepoetin administration for the treatment of cancer-
associated anemia. Journal of the American Medical Association, 299(8), 914-924.
Benowitz, N. L. (2003). Cigarette smoking and cardiovascular disease: pathophysiology and
implications for treatment. Progress in Cardiovascular Diseases, 46(1), 91-111.
Bert, P. (1878). La pression barométrique: recherches de physiologie expérimentale: Masson.
Berti, P. R., Fallu, C., & Cruz Agudo, Y. (2014). A systematic review of the nutritional adequacy
of the diet in the Central Andes. Revista Panamericana de Salud Publica, 36(5), 314-323.
Berti, P. R., Jones, A. D., Cruz, Y., Larrea, S., Borja, R., & Sherwood, S. (2010). Assessment and
characterization of the diet of an isolated population in the Bolivian Andes. American
Journal of Human Biology, 22(6), 741-749.
Bhandari, G. P., Angdembe, M. R., Dhimal, M., Neupane, S., & Bhusal, C. (2014). State of non-
communicable diseases in Nepal. BMC Public Health, 14(23). doi:10.1186/1471-2458-14-
23
Bhandari, S., Sayami, J. T., Thapa, P., Sayami, M., Kandel, B. P., & Banjara, M. R. (2016). Dietary
intake patterns and nutritional status of women of reproductive age in Nepal: findings from
a health survey. Archives of Public Health, 74(2). doi:10.1186/s13690-016-0114-3
Bigham, A. W., Mao, X., Mei, R., Brutsaert, T., Wilson, M. J., Julian, C. G., . . . Shriver, M. D.
(2009). Identifying positive selection candidate loci for high-altitude adaptation in Andean
populations. Human Genomics, 4(2), 79-90.
Bloomfield, G. S., Lagat, D. K., Akwanalo, O. C., Carter, E. J., Lugogo, N., Vedanthan, R., . . .
Sherman, C. B. (2012). Conditions that predispose to pulmonary hypertension and right
174
heart failure in persons exposed to household air pollution in LMIC. Global Heart, 7(3),
249-259.
Boden, G. (2011). Obesity, insulin resistance and free fatty acids. Current Opinion in
Endocrinology, Diabetes, and Obesity, 18(2), 139-143.
Boden, G., & Chen, X. (1995). Effects of fat on glucose uptake and utilization in patients with non-
insulin-dependent diabetes. Journal of Clinical Investigation, 96(3), 1261-1268.
Bolinder, G., & de Faire, U. (1998). Ambulatory 24-h blood pressure monitoring in healthy,
middle-aged smokeless tobacco users, smokers, and nontobacco users. American Journal
of Hypertension, 11(10), 1153-1163.
Booth, G. L., Kapral, M. K., Fung, K., & Tu, J. V. (2006). Relation between age and cardiovascular
disease in men and women with diabetes compared with non-diabetic people: a population-
based retrospective cohort study. The Lancet, 368(9529), 29-36.
Borgi, L., Rimm, E. B., Willett, W. C., & Forman, J. P. (2016). Potato intake and incidence of
hypertension: results from three prospective US cohort studies. The British Medical
Journal, 353, i2351.
Brahmachari, H. D., Malhotra, M. S., Joseph, S., & Krishnan, U. R. (1973). Glucose tolerance at
high altitude in man. Indian Journal of Medical Research, 61(3), 411-415.
Braun, B. (2008). Effects of high altitude on substrate use and metabolic economy: cause and
effect? Medicine and Science in Sports and Exercise, 40(8), 1495-1500.
Brenner, B. M., Garcia, D. L., & Anderson, S. (1988). Glomeruli and blood pressure less of one,
more the other? American Journal of Hypertension, 1(4), 335-347.
Brito, J., Siqués, P., Leon-Velarde, F., De La Cruz, J. J., López, V., & Herruzo, R. (2007). Chronic
intermittent hypoxia at high altitude exposure for over 12 years: assessment of
hematological, cardiovascular, and renal effects. High Altitude Medicine & Biology, 8(3),
236-244.
Brook, R. D., Rajagopalan, S., Pope, C. A., 3rd, Brook, J. R., Bhatnagar, A., Diez-Roux, A. V., . . .
Kaufman, J. D. (2010). Particulate matter air pollution and cardiovascular disease: An
update to the scientific statement from the American Heart Association. Circulation,
121(21), 2331-2378.
Brubaker, P. L. (2005). Adventure travel and type 1 diabetes: the complicating effects of high
altitude. Diabetes Care, 28(10), 2563-2572.
Burton, A. C. (1975). Cancer and altitude. Does intracellular pH regulate cell division? European
Journal of Cancer (1965), 11(5), 365-371.
Burtscher, M. (2014). Effects of living at higher altitudes on mortality: a narrative review. Aging
and Disease, 5(4), 274-280.
Burtscher, M., Mairer, K., Wille, M., & Broessner, G. (2011). Risk factors for high-altitude
headache in mountaineers. Cephalalgia, 31(6), 706-711.
Caballero, A., Torres-Duque, C. A., Jaramillo, C., Bolívar, F., Sanabria, F., Osorio, P., . . .
Maldonado, D. (2008). Prevalence of COPD in five Colombian cities situated at low,
medium, and high altitude (PREPOCOL study). Chest, 133(2), 343-349.
Caceres Pilares, J., Rojas Bravo, M. L., Caceres Espinoza, L., & Ortiz Martinez, J. d. C. (2004).
Total cholesterol and it´ s fractions in adults of 30 to 39 years, according to gender and
sub-groups of age. Situa, 13(2), 12-19.
175
Cai, Z., Manalo, D. J., Wei, G., Rodriguez, E. R., Fox-Talbot, K., Lu, H., . . . Semenza, G. L.
(2003). Hearts from rodents exposed to intermittent hypoxia or erythropoietin are protected
against ischemia-reperfusion injury. Circulation, 108(1), 79-85.
Cao, J., Zhao, Y., Liu, J., Xirao, R., Danzeng, S., Daji, D., & Yan, Y. (2003). Brick tea fluoride as a
main source of adult fluorosis. Food and Chemical Toxicology, 41(4), 535-542.
Central Bureau of Statistics. (2012). Nepal in Figures. Kathmandu, Nepal: Government of Nepal,
National Planning Commission Secretariat.
Challoumas, D. (2014). Vitamin D supplementation and lipid profile: what does the best available
evidence show? Atherosclerosis, 235(1), 130-139.
Chandalia, M., Mohan, V., Adams-Huet, B., Deepa, R., & Abate, N. (2008). Ethnic difference in
sex gap in high-density lipoprotein cholesterol between Asian Indians and Whites. Journal
of Investigative Medicine, 56(3), 574-580.
Chang, H.-Y., Yeh, W.-T., Chang, Y.-H., Tsai, K.-S., & Pan, W.-H. (2002). Prevalence of
dyslipidemia and mean blood lipid values in Taiwan: results from the Nutrition and Health
Survey in Taiwan (NAHSIT, 1993-1996). Chinese Journal of Physiology, 45(4), 187-198.
Chen, H.-W., Chu, N.-F., Chen, H.-H., & Yeh, M.-L. (2014). The smoking behaviors of indigenous
Taiwanese: individual and family/community factors of influence. Journal of Nursing
Research, 22(1), 12-19.
Chen, Q. H., Liu, F. Y., Wang, X. Q., Qi, G. R., Liu, P. F., Jin, X. H., . . . Qi, S. G. (2009). A cross-
sectional study of congenital heart disease among children aged from 4 to 18 years at
different altitudes in Qinghai province, China. Zhonghua liu xing bing xue za zhi=
Zhonghua liuxingbingxue zazhi, 30(12), 1248-1251.
Chen, R., & Tunstall-Pedoe, H. (2005). Socioeconomic deprivation and waist circumference in
men and women: The Scottish MONICA surveys 1989–1995. European Journal of
Epidemiology, 20(2), 141-147.
Chen, W., Liu, Q., Wang, H., Chen, W., Johnson, R. J., Dong, X., . . . Luo, N. (2011). Prevalence
and risk factors of chronic kidney disease: a population study in the Tibetan population.
Nephrology Dialysis Transplantation, 26(5), 1592-1599.
Chhetri, D., Parajuli, P., & Subba, G. (2005). Antidiabetic plants used by Sikkim and Darjeeling
Himalayan tribes, India. Journal of Ethnopharmacology, 99(2), 199-202.
Chhetri, M., & Chapman, R. (2009). Prevalence and determinants of diabetes among the elderly
population in the Kathmandu Valley of Nepal. Nepal Medical College Journal, 11(1), 34-
38.
Cho, K., Tian, M., Lan, Y., Zhao, X., & Yan, L. L. (2013). Validation of the Omron HEM-7201
upper arm blood pressure monitor, for self-measurement in a high-altitude environment,
according to the European Society of Hypertension International Protocol revision 2010.
Journal of Human Hypertension, 27(8), 487-491.
Chobanian, A. V., Bakris, G. L., Black, H. R., Cushman, W. C., Green, L. A., Izzo, J. L., . . .
Wright, J. T. (2003). Seventh report of the joint national committee on prevention,
detection, evaluation, and treatment of high blood pressure. Hypertension, 42(6), 1206-
1252.
Clegg, E., Jeffries, D., & Harrison, G. A. (1976). Determinants of blood pressure at high and low
altitudes in Ethiopia. Proceedings of the Royal Society of London-Biological Sciences,
194(1114), 63-82.
176
Cogill, B. (2003). Anthropometric indicators measurement guide. Washington DC: Food and
Nutrition Technical Assistance Project, Academy for Educational Development.
Cossio-Bolaños, M., Campos, R. G., Andruske, C. L., Flores, A. V., Luarte-Rocha, C., Olivares, P.
R., . . . de Arruda, M. (2015). Physical growth, biological age, and nutritional transitions of
adolescents living at moderate altitudes in Peru. International Journal of Environmental
Research and Public Health, 12(10), 12082-12094.
Cote, T. R., Stroup, D. F., Dwyer, D. M., Horan, J. M., & Peterson, D. E. (1993). Chronic
obstructive pulmonary disease mortality; a role for altitude. Chest, 103(4), 1194-1197.
Cristina, T. J. N., Williams, J. A. S., Parkinson, L., Sibbritt, D. W., & Byles, J. E. (2016).
Identification of diabetes, heart disease, hypertension and stroke in mid‐and older‐aged
women: comparing self‐report and administrative hospital data records. Geriatrics &
Gerontology International, 16(1), 95-102.
Dang, S., Yan, H., & Yamamoto, S. (2008). High altitude and early childhood growth retardation:
new evidence from Tibet. European Journal of Clinical Nutrition, 62(3), 342-348.
Dang, S., Yan, H., Yamamoto, S., Wang, X., & Zeng, L. (2004). Poor nutritional status of younger
Tibetan children living at high altitudes. European Journal of Clinical Nutrition, 58(6),
938-946.
Dasgupta, D., Prasher, B., Vaidya, N., Ahluwalia, S., Sharma, P., Puri, D., & Mehrotra, A. (1982).
Blood pressure in a community at high altitude (3000m) at Pooh (North India). Journal of
Epidemiology and Community Health, 36(4), 251-255.
Davis, C. G., Thake, J., & Vilhena, N. (2010). Social desirability biases in self-reported alcohol
consumption and harms. Addictive Behaviors, 35(4), 302-311.
De Bacquer, D., De Backer, G., Kornitzer, M., & Blackburn, H. (1998). Prognostic value of ECG
findings for total, cardiovascular disease, and coronary heart disease death in men and
women. Heart, 80(6), 570-577.
De Keyzer, W., Dofková, M., Lillegaard, I. T. L., De Maeyer, M., Andersen, L. F., Ruprich, J., . . .
Huybrechts, I. (2015). Reporting accuracy of population dietary sodium intake using
duplicate 24 h dietary recalls and a salt questionnaire. British Journal of Nutrition, 113(3),
488-497.
De Mendoza, S., Nucete, H., Ineichen, E., Salazar, E., Zerpa, A., & Glueck, C. (1978). Lipids and
lipoproteins in subjects at 1,000 and 3,500 meter altitudes. Archives of Environmental
Health, 34(5), 308-311.
de Mol, P., de Vries, S. T., de Koning, E. J., Gans, R. O., Tack, C. J., & Bilo, H. J. (2011).
Increased insulin requirements during exercise at very high altitude in type 1 diabetes.
Diabetes Care, 34(3), 591-595.
Deepa, M., Anjana, R. M., Manjula, D., Narayan, K. M. V., & Mohan, V. (2011). Convergence of
prevalence rates of diabetes and cardiometabolic risk factors in middle and low income
groups in urban India: 10-Year follow-up of the chennai urban population study. Journal of
Diabetes Science and Technology, 5(4), 918-927.
Deng, B., Luo, T., Huang, Y., Shen, T., & Ma, J. (2012). Prevalence and determinants of
hyperlipidemia in moderate altitude areas of the Yunnan-Kweichow plateau in
Southwestern China. High Altitude Medicine & Biology, 13(1), 13-21.
177
Devkota, K. C., Thapa Magar, S. B., & Malla, S. (2006). Retrospective analysis of stroke and its
risk factors at Nepal Medical College Teaching Hospital. Nepal Medical College Journal,
8(4), 269-275.
Dhamija, R., & Dhamija, S. (1998). Prevalence of stroke in rural community-an overview of Indian
experience. The Journal of the Association of Physicians of India, 46(4), 351-354.
Dhital, R. (2001). Alcohol and young people in Nepal. The Globe, 4, 21-25.
Ding, H.-l., Zhu, H.-f., Dong, J.-w., Zhu, W.-z., Yang, W.-w., Yang, H.-t., & Zhou, Z.-n. (2005).
Inducible nitric oxide synthase contributes to intermittent hypoxia against
ischemia/reperfusion injury. Acta Pharmacologica Sinica, 26(3), 315-322.
Dodani, S., Dong, Y., Zhu, H., & George, V. (2008). Can novel Apo AI polymorphisms be
responsible for low HDL in South Asian immigrants? Indian Journal of Human Genetics,
14(1), 9-15.
Dulal, R. K., & Karki, S. (2009). Disease management programme for diabetes mellitus in Nepal.
Journal of Nepal Medical Association, 48(176), 1261-1270.
Eagle, S. (2000). The language situation in Nepal. In R. B. Baldauf & R. B. Kaplan (Eds.),
Language Planning in Nepal, Taiwan, and Sweden (Vol. 20). Clevedon, UK: Multilingual
Matters Ltd.
Eldwood, P., Beswick, A., O'Brien, J. R., Renaud, S., Fifield, R., Limb, E., & Bainton, D. (1993).
Temperature and risk factors for ischaemic heart disease in the Caerphilly prospective
study. British Heart Journal, 70(6), 520-523.
Elliott, P., Stamler, J., Nichols, R., Dyer, A. R., Stamler, R., Kesteloot, H., & Marmot, M. (1996).
Intersalt revisited: further analyses of 24 hour sodium excretion and blood pressure within
and across populations. The British Medical Journal, 312(7041), 1249-1253.
Ervasti, O., Juopperi, K., Kettunen, P., Remes, J., Rintamäki, H., Latvala, J., . . . Hassi, J. (2004).
The occurrence of frostbite and its risk factors in young men. International Journal of
Circumpolar Health, 63(1), 71-80.
Esparza-Romero, J., Valencia, M. E., Martinez, M. E., Ravussin, E., Schulz, L. O., & Bennett, P.
H. (2010). Differences in insulin resistance in Mexican and US Pima Indians with normal
glucose tolerance. Journal of Clinical Endocrinology and Metabolism, 95(11), E358-E362.
Essop, M. F. (2007). Cardiac metabolic adaptations in response to chronic hypoxia. Journal of
Physiology, 584(3), 715-726.
Ezzati, M., Henley, S. J., Thun, M. J., & Lopez, A. D. (2005). Role of smoking in global and
regional cardiovascular mortality. Circulation, 112(4), 489-497.
Ezzati, M., Horwitz, M. E., Thomas, D. S., Friedman, A. B., Roach, R., Clark, T., . . . Honigman,
B. (2012). Altitude, life expectancy and mortality from ischaemic heart disease, stroke,
COPD and cancers: national population-based analysis of US counties. Journal of
Epidemiology and Community Health, 66(7), e17-e17.
Faeh, D., Gutzwiller, F., & Bopp, M. (2009). Lower mortality from coronary heart disease and
stroke at higher altitudes in Switzerland. Circulation, 120(6), 495-501.
Faeh, D., Moser, A., Panczak, R., Bopp, M., Röösli, M., Spoerri, A., . . . Künzli, N. (2016).
Independent at heart: persistent association of altitude with ischaemic heart disease
mortality after consideration of climate, topography and built environment. Journal of
Epidemiology and Community Health. doi:10.1136/jech-2015-206210
178
Fang, J., Zhuo-Ga, C., Zhao, Y., Kong, F., Si, Y., Liu, M., & Zhou, D. (2011). Characteristics of
stroke in Tibet Autonomous Region in China: a hospital-based study of acute stroke.
European Neurology, 66(3), 151-158.
Farah, R., Zeidan, R. K., Chahine, M. N., Asmar, R., Chahine, R., Salameh, P., & Hosseini, H.
(2015). Prevalence of stroke symptoms among stroke‐free residents: first national data
from Lebanon. International Journal of Stroke, 10(A100), 83-88.
Ferezou, J., Richalet, J., Coste, T., & Rathat, C. (1988). Changes in plasma lipids and lipoprotein
cholesterol during a high altitude mountaineering expedition (4800 m). European Journal
of Applied Physiology and Occupational Physiology, 57(6), 740-745.
Ferroni, M. A. (1982). Food habits and the apparent nature and extent of dietary nutritional
deficiencies in the Peruvian Andes. Archivos Latinoamericanos de Nutrición, 32(4), 850-
866.
Field, A. E., Coakley, E. H., Must, A., Spadano, J. L., Laird, N., Dietz, W. H., . . . Colditz, G. A.
(2001). Impact of overweight on the risk of developing common chronic diseases during a
10-year period. Archives of Internal Medicine, 161(13), 1581-1586.
Fiori, G., Facchini, F., Pettener, D., Rimondi, A., Battistini, N., & Bedogni, G. (2000).
Relationships between blood pressure, anthropometric characteristics and blood lipids in
high-and low-altitude populations from Central Asia. Annals of Human Biology, 27(1), 19-
28.
Fitzpatrick, A. L., Van Ngo, Q., Ly, K. A., Ton, T. G., Longstreth, W., Vo, T. T., . . . Tirschwell,
D. L. (2012). Symptoms and risk factors for stroke in a community-based observational
sample in Viet Nam. Journal of Epidemiology and Global Health, 2(3), 155-163.
Foerster, M., Marques-Vidal, P., Gmel, G., Daeppen, J.-B., Cornuz, J., Hayoz, D., . . .
Vollenweider, P. (2009). Alcohol drinking and cardiovascular risk in a population with
high mean alcohol consumption. American Journal of Cardiology, 103(3), 361-368.
Foody, J. M. (2006). Low-density lipoprotein cholesterol and coronary artery disease: clinical
evidence and clinical implications. In J. M. Foody (Ed.), Preventive cardiology : Insights
into the prevention and treatment of cardiovascular disease (Second ed., pp. 49-79).
Totowa, New Jersey: Humana Press Inc.
Ford, E. S., Merritt, R. K., Heath, G. W., Powell, K. E., Washburn, R. A., Kriska, A., & Haile, G.
(1991). Physical activity behaviors in lower and higher socioeconomic status populations.
American Journal of Epidemiology, 133(12), 1246-1256.
Freminet, A., Megas, P., & Puceat, M. (1990). Depressed gluconeogenesis and ureogenesis in
isolated hepatocytes after intermittent hypoxia in rats. International Journal of
Biochemistry, 22(11), 1307-1313.
Fujimaki, T., Matsutani, M., Asai, A., Kohno, T., & Koike, M. (1986). Cerebral venous thrombosis
due to high-altitude polycythemia: case report. Journal of Neurosurgery, 64(1), 148-150.
Furberg, C. D., Psaty, B. M., & Soliman, E. Z. (2010). Blood pressure and cardiovascular disease.
In S. Yusuf, J. A. Cairns, A. J. Camm, E. L. Fallen, & B. J. Gersh (Eds.), Evidence-based
Cardiology (3rd ed., pp. 165-178). Chichester, U.K.: Wiley-Blackwell Publishing.
Gagnon, D. R., Zhang, T.-J., Brand, F. N., & Kannel, W. B. (1994). Hematocrit and the risk of
cardiovascular disease—the Framingham study: a 34-year follow-up. American Heart
Journal, 127(3), 674-682.
179
Gaillard, S., Dellasanta, P., Loutan, L., & Kayser, B. (2004). Awareness, prevalence, medication
use, and risk factors of acute mountain sickness in tourists trekking around the Annapurnas
in Nepal: a 12-year follow-up. High Altitude Medicine & Biology, 5(4), 410-419.
Galan, H. L., Rigano, S., Radaelli, T., Cetin, I., Bozzo, M., Chyu, J., . . . Ferrazzi, E. (2001).
Reduction of subcutaneous mass, but not lean mass, in normal fetuses in Denver, Colorado.
American Journal of Obstetrics and Gynecology, 185(4), 839-844.
Garmendia, F., Arroyo, J., & Muro, M. (1970). Glicemia del nativo normal de altura. Archivos del
Instituto de Biología Andina, 3, 209-216.
Gellner, D. N. (2016). The idea of Nepal. Kathmandu: Social Science Baha.
Gerstein, H. C., & Punthakee, Z. (2010). Dysglycemia and the risk of cardiovascular events. In S.
Yusuf, J. A. Cairns, A. J. Camm, E. L. Fallen, & B. J. Gersh (Eds.), Evidence-based
Cardiology (3rd ed., pp. 179-189): Blackwell Publishing.
Gerstein, H. C., Santaguida, P., Raina, P., Morrison, K. M., Balion, C., Hunt, D., . . . Booker, L.
(2007). Annual incidence and relative risk of diabetes in people with various categories of
dysglycemia: a systematic overview and meta-analysis of prospective studies. Diabetes
Research and Clinical Practice, 78(3), 305-312.
Gesang, L., Liu, G., Cen, W., Qiu, C., Zhuoma, C., Zhuang, L., . . . Chan, Y. (2002). Angiotensin-
converting enzyme gene polymorphism and its association with essential hypertension in a
Tibetan population. Hypertension Research, 25(3), 481-485.
Ghafoorunissa. (1994). Dietary lipids and heart disease - the Indian context. National Medical
Journal of India, 7, 270-275.
Gilbert, D. L. (1983a). The first documented description of mountain sickness: the Andean or
Pariacaca story. Respiration Physiology, 52(3), 327-347.
Gilbert, D. L. (1983b). The first documented report of mountain sickness: the China or Headache
Mountain story. Respiration Physiology, 52(3), 315-326.
Gonzales, G. F. (2001). Metabolismo en las grandes alturas. Acta Andina, 9(1-2), 31-42.
Gonzales, G. F., Rubio, J., & Gasco, M. (2013). Chronic mountain sickness score was related with
health status score but not with hemoglobin levels at high altitudes. Respiratory Physiology
& Neurobiology, 188(2), 152-160.
Gonzales, G. F., & Tapia, V. (2013). Association of high altitude-induced hypoxemia to lipid
profile and glycemia in men and women living at 4100m in the Peruvian Central Andes.
Endocrinología y Nutrición (English Edition), 60(2), 79-86.
Gonzales, G. F., Tapia, V., & Carrillo, C. E. (2008). Stillbirth rates in Peruvian populations at high
altitude. International Journal of Gynecology & Obstetrics, 100(3), 221-227.
Gorer, G. (1938). Himalayan village: an account of The Lepchas of Sikkim. London, England:
Michael Joseph.
Government of Nepal & United Nations Development Programme. (2014). Nepal human
development report 2014 : beyond geography, unlocking human potential. Retrieved from
Kathmandu, Nepal: http://hdr.undp.org/sites/default/files/nepal_nhdr_2014-final.pdf
Graham, T., & Baulk, K. (1980). Effect of alcohol ingestion on man's thermoregulatory responses
during cold water immersion. Aviation, Space, and Environmental Medicine, 51(2), 155-
159.
180
Green, R., Sutherland, J., Dangour, A. D., Shankar, B., & Webb, P. (2016). Global dietary quality,
undernutrition and non-communicable disease: a longitudinal modelling study. BMJ Open,
6(1), e009331.
Groves, B. M., Droma, T., Sutton, J. R., McCullough, R. G., McCullough, R. E., Zhuang, J., . . .
Moore, L. G. (1993). Minimal hypoxic pulmonary hypertension in normal Tibetans at
3,658 m. Journal of Applied Physiology, 74(1), 312-318.
Grundy, S. M. (1997). What is the desirable ratio of saturated, polyunsaturated, and
monounsaturated fatty acids in the diet? The American Journal of Clinical Nutrition, 66(4),
988S-990S.
Grundy, S. M., Becker, D., Clark, L., Cooper, R., Denke, M., Howard, J., . . . McBride, P. (2002).
Detection, evaluation, and treatment of high blood cholesterol in adults (Adult Treatment
Panel III). Circulation, 106(25), 3143-3421.
Guo, W., Lanzi, G., Luobu, O., Ma, X., Zhen, P., Ji, Y., . . . Zhuoma, B. (2008). An
epidemiological survey of alcohol use disorders in a Tibetan population. Psychiatry
Research, 159(1), 56-66.
Gupta, M., Rao, K., Anand, I., Banerjee, A., & Boparai, M. (1992). Lack of smooth muscle in the
small pulmonary arteries of the native Ladakhi. American Review of Respiratory Disease,
145, 1201-1204.
Gupta, R., Misra, A., Pais, P., Rastogi, P., & Gupta, V. (2006). Correlation of regional
cardiovascular disease mortality in India with lifestyle and nutritional factors. International
Journal of Cardiology, 108(3), 291-300.
Guptha, S., Gupta, R., Deedwania, P., Bhansali, A., Maheshwari, A., Gupta, A., . . . Achari, V.
(2014). Cholesterol lipoproteins and prevalence of dyslipidemias in urban Asian Indians: a
cross sectional study. Indian Heart Journal, 66(3), 280-288.
Gyawali, B., Sharma, R., Neupane, D., Mishra, S. R., van Teijlingen, E., & Kallestrup, P. (2015).
Prevalence of type 2 diabetes in Nepal: a systematic review and meta-analysis from 2000
to 2014. Global health action, 8(1), 29088. doi:10.3402/gha.v8.29088.
Hall, J. E. (2000). Pathophysiology of obesity hypertension. Current Hypertension Reports, 2, 139-
147.
Halperin, B. D., Sun, S., Zhuang, J., Droma, T., & Moore, L. G. (1998). ECG observations in
Tibetan and Han residents of Lhasa. Journal of Electrocardiology, 31(3), 237-243.
Haman, F., Péronnet, F., Kenny, G. P., Massicotte, D., Lavoie, C., & Weber, J. M. (2005).
Partitioning oxidative fuels during cold exposure in humans: muscle glycogen becomes
dominant as shivering intensifies. The Journal of Physiology, 566(1), 247-256.
Han, W., Sun, N., Chen, Y., Wang, H., Xi, Y., & Ma, Z. (2015). Validation of the spot urine in
evaluating 24-hour sodium excretion in Chinese hypertension patients. American Journal
of Hypertension, 28, 1368-1375.
Hanaoka, M., Droma, Y., Basnyat, B., Ito, M., Kobayashi, N., Katsuyama, Y., . . . Ota, M. (2012).
Genetic variants in EPAS1 contribute to adaptation to high-altitude hypoxia in Sherpas.
PloS One, 7(12), e50566. doi:10.1371/journal.pone.0050566
Hance, A., Robin, E., Simon, L., Alexander, S., Herzenberg, L., & Theodore, J. (1980). Regulation
of glycolytic enzyme activity during chronic hypoxia by changes in rate-limiting enzyme
content. Use of monoclonal antibodies to quantitate changes in pyruvate kinase content.
Journal of Clinical Investigation, 66(6), 1258-1264.
181
Hanna, J. M. (1974). Coca leaf use in southern Peru: some biosocial aspects. American
Anthropologist, 76(2), 281-296.
Hansen, J. C., Gilman, A. P., & Odland, J. Ø. (2010). Is thermogenesis a significant causal factor in
preventing the “globesity” epidemic? Medical Hypotheses, 75(2), 250-256.
Harris, N. S., Crawford, P. B., Yangzom, Y., Pinzo, L., Gyaltsen, P., & Hudes, M. (2001).
Nutritional and health status of Tibetan children living at high altitudes. New England
Journal of Medicine, 344(5), 341-347.
Hashmi, M., Rashid, M., Haleem, A., Bokhari, S., & Hussain, T. (1998). Frostbite: epidemiology at
high altitude in the Karakoram mountains. Annals of the Royal College of Surgeons of
England, 80(2), 91-95.
Hayes, D. P. (2010). Cancer protection related to solar ultraviolet radiation, altitude and vitamin D.
Medical Hypotheses, 75(4), 378-382.
He, J., Tell, G. S., Tang, Y. C., Mo, P. S., & He, G. Q. (1991). Effect of migration on blood
pressure: The Yi people study. Epidemiology, 2(2), 88-97.
Health Promotion Agency New Zealand. (2015). What's a standard drink ? Retrieved from
http://alcohol.org.nz/help-advice/standard-drinks/whats-a-standard-drink
Hernandez-Hernandez, R., Silva, H., Velasco, M., Pellegrini, F., Macchia, A., Escobedo, J., . . .
Pramparo, P. (2010). Hypertension in seven Latin American cities: The cardiovascular risk
factor multiple evaluation in Latin America (CARMELA) study. Journal of Hypertension,
28(1), 24-34.
Hessien, M. (2013). Improved glycemic control in moderate altitude type II diabetic residents. High
Altitude Medicine & Biology, 14(1), 27-30.
Higgins, J. P., Tuttle, T., & Higgins, J. A. (2010). Altitude and the heart: is going high safe for your
cardiac patient? American Heart Journal, 159(1), 25-32.
Hill, J. O., & Wyatt, H. R. (2013). The myth of healthy obesity. Annals of Internal Medicine,
159(11), 789-790.
Holden, J., Stone, C., Clark, C., Brown, W., Nickles, R., Stanley, C., & Hochachka, P. (1995).
Enhanced cardiac metabolism of plasma glucose in high-altitude natives: adaptation
against chronic hypoxia. Journal of Applied Physiology, 79(1), 222-228.
Holick, M. F., Chen, T. C., Lu, Z., & Sauter, E. (2007). Vitamin D and skin physiology: A D‐lightful story. Journal of Bone and Mineral Research, 22(S2), V28-V33.
Honigman, B., Theis, M. K., Koziol-McLain, J., Roach, R., Yip, R., Houston, C., & Moore, L. G.
(1993). Acute mountain sickness in a general tourist population at moderate altitudes.
Annals of Internal Medicine, 118(8), 587-592.
Howard, A. A., Arnsten, J. H., & Gourevitch, M. N. (2004). Effect of alcohol consumption on
diabetes mellitus: a systematic review. Annals of Internal Medicine, 140(3), 211-219.
Howard, V. J., McClure, L. A., Meschia, J. F., Pulley, L., Orr, S. C., & Friday, G. H. (2006). High
prevalence of stroke symptoms among persons without a diagnosis of stroke or transient
ischemic attack in a general population: the REasons for Geographic And Racial
Differences in Stroke (REGARDS) study. Archives of Internal Medicine, 166(18), 1952-
1958.
182
Hubert, H. B., Feinleib, M., McNamara, P. M., & Castelli, W. P. (1983). Obesity as an independent
risk factor for cardiovascular disease: a 26-year follow-up of participants in the
Framingham Heart Study. Circulation, 67(5), 968-977.
Huerta-Sánchez, E., DeGiorgio, M., Pagani, L., Tarekegn, A., Ekong, R., Antao, T., . . . Robbins, P.
A. (2013). Genetic signatures reveal high-altitude adaptation in a set of Ethiopian
populations. Molecular Biology and Evolution, 30(8), 1877-1888.
Huicho, L., Trelles, M., Gonzales, F., Mendoza, W., & Miranda, J. (2009). Mortality profiles in a
country facing epidemiological transition: an analysis of registered data. BMC Public
Health, 9(47). doi:10.1186/1471-2458-9-47
Hurtado, A. (1960). Some clinical aspects of life at high altitudes. Annals of Internal Medicine,
53(2), 247-258.
Hurtado, A., Escudero, E., Pando, J., Sharma, S., & Johnson, R. J. (2012). Cardiovascular and renal
effects of chronic exposure to high altitude. Nephrology, Dialysis, Transplantation,
27(suppl 4), iv11-iv16.
International Diabetes Federation. (2015). IDF Diabetes Atlas (7th Edition). Retrieved 28th
September, 2016, from International Diabetes Federation http://www.diabetesatlas.org/key-
messages.html
Jackson, F. (1975). Hypoxia and the heart. Paper presented at the Mountain Medicine and
Physiology. Proceedings of a Symposium sponsored by the Alpine Club.
Jaillard, A. S., Hommel, M., & Mazetti, P. (1995). Prevalence of stroke at high altitude (3380 m) in
Cuzco, a town of Peru: a population-based study. Stroke, 26(4), 562-568.
Jansen, G. F., & Basnyat, B. (2011). Brain blood flow in Andean and Himalayan high-altitude
populations: evidence of different traits for the same environmental constraint. Journal of
Cerebral Blood Flow and Metabolism, 31(2), 706-714.
Jayawardena, R., Ranasinghe, P., Byrne, N. M., Soares, M. J., Katulanda, P., & Hills, A. P. (2012).
Prevalence and trends of the diabetes epidemic in South Asia: a systematic review and
meta-analysis. BMC Public Health, 12(380). doi:10.1186/1471-2458-12-380
Jensen, G. M., & Moore, L. G. (1997). The effect of high altitude and other risk factors on
birthweight: independent or interactive effects? American Journal of Public Health, 87(6),
1003-1007.
Jha, P., Mony, P., Moore, J., & Zatonski, W. (2010). Avoidance of worldwide vascular deaths and
total deaths from smoking. In S. Yusuf, J. A. Cairns, A. J. Camm, E. L. Fallen, & B. J.
Gersh (Eds.), Evidence-based Cardiology (3rd ed., pp. 111-124): Blackwell Publishing.
Jha, S. K., Anand, A. C., Sharma, V., Kumar, N., & Adya, C. M. (2002). Stroke at high altitude:
Indian experience. High Altitude Medicine & Biology, 3(1), 21-27.
Jin, X., Chen, Q., Tong, Y., Zhu, C., Qu, Y., Zhao, G., & Cai, J. (2008). Study on the epidemiology
of congenital heart disease in Tibetan ethnic children aged from 4 to 18 living at different
altitudes in Qinghai province. Zhonghua liu xing bing xue za zhi= Zhonghua
liuxingbingxue zazhi, 29(4), 317-320.
Johnson, R. J., Kang, D.-H., Feig, D., Kivlighn, S., Kanellis, J., Watanabe, S., . . . Mazzali, M.
(2003). Is there a pathogenetic role for uric acid in hypertension and cardiovascular and
renal disease? Hypertension, 41(6), 1183-1190.
Joint WHO/FAO Expert Consultation on Diet, & Nutrition and the Prevention of Chronic Diseases.
(2002). Diet, nutrition and the prevention of chronic diseases (916). Retrieved from
183
Geneva, Switzerland:
http://www.who.int/dietphysicalactivity/publications/trs916/download/en/
Jones, W. J., Williams, L. S., & Meschia, J. F. (2001). Validating the Questionnaire for Verifying
Stroke-Free Status (QVSFS) by neurological history and examination. Stroke, 32(10),
2232-2236.
Joshi, P., Islam, S., Pais, P., Reddy, S., Dorairaj, P., Kazmi, K., . . . Yusuf, S. (2007). Risk factors
for early myocardial infarction in South Asians compared with individuals in other
countries. Journal of the American Medical Association, 297(3), 286-294.
Jourdanet, D. (1875). Influence de la Pression de l'Air sur la Vie de l'Homme. Climats d'Altitude et
Climats de Montagne: Masson.
Kahn, S. E., Hull, R. L., & Utzschneider, K. M. (2006). Mechanisms linking obesity to insulin
resistance and type 2 diabetes. Nature, 444(7121), 840-846.
Kanteres, F., Lachenmeier, D. W., & Rehm, J. (2009). Alcohol in Mayan Guatemala: consumption,
distribution, production and composition of cuxa. Addiction, 104(5), 752-759.
Kapoor, S. C. (1984). Changes in electrocardiogram among temporary residents at high altitude.
Defence Science Journal, 34(4), 389-395.
Kappelle, P., Gansevoort, R., Hillege, J., Wolffenbuttel, B., & Dullaart, R. (2011). Apolipoprotein
B/A‐I and total cholesterol/high‐density lipoprotein cholesterol ratios both predict
cardiovascular events in the general population independently of nonlipid risk factors,
albuminuria and C‐reactive protein. Journal of Internal Medicine, 269(2), 232-242.
Karki, D. B., Neupane, A., Pradhan, B., & Magar, A. (2003). Lipid levels in Nepalese population.
Kathmandu University Medical Journal, 2(4), 349-353.
Karliner, J. S., Sarnquist, F. F., Graber, D. J., Peters, R. M., & West, J. B. (1985). The
electrocardiogram at extreme altitude: experience on Mt. Everest. American Heart Journal,
109(3), 505-513.
Karthikeyan, G., Teo, K. K., Islam, S., McQueen, M. J., Pais, P., Wang, X., . . . Pandey, M. (2009).
Lipid profile, plasma apolipoproteins, and risk of a first myocardial infarction among
Asians: an analysis from the INTERHEART Study. Journal of the American College of
Cardiology, 53(3), 244-253.
Kaushal, S., DasGupta, D., Prashar, B., & Bhardwaj, A. (1995). Electrocardiographic
manifestations of healthy residents of a tribal Himalayan village. Journal of the Association
of Physicians of India, 43(1), 15-16.
Kautzky-Willer, A., Harreiter, J., & Pacini, G. (2016). Sex and gender differences in risk,
pathophysiology and complications of type 2 diabetes mellitus. Endocrine Reviews, 37(3),
278-316.
Kawamoto, R., Tabara, Y., Kohara, K., Miki, T., Kusunoki, T., Takayama, S., & Abe, M. (2011).
Hemoglobin is associated with serum high molecular weight adiponectin in Japanese
community-dwelling persons. Journal of Atherosclerosis and Thrombosis, 18(3), 182-189.
Kayser, B., & Verges, S. (2013). Hypoxia, energy balance and obesity: from pathophysiological
mechanisms to new treatment strategies. Obesity Reviews, 14(7), 579-592.
Kearney, P. M., Whelton, M., Reynolds, K., Muntner, P., Whelton, P. K., & He, J. (2005). Global
burden of hypertension: analysis of worldwide data. The Lancet, 365(9455), 217-223.
184
Kehoe, R., Wu, S.-Y., Leske, M. C., & Chylack, L. T. (1994). Comparing self-reported and
physician-reported medical history. American Journal of Epidemiology, 139(8), 813-818.
Khalid, M. E. (1995). Anthropometric comparison between high-and low-altitude Saudi Arabians.
Annals of Human Biology, 22(5), 459-465.
Khalid, M. E. (2007). The prevalence of abdominal obesity and its associated risk factors in
married, non-pregnant women born and living in high altitude, southwestern, Saudi Arabia.
Saudi Medical Journal, 28(12), 1875-1880.
Khalid, M. E. (2008). Is high-altitude environment a risk factor for childhood overweight and
obesity in Saudi Arabia? Wilderness and Environmental Medicine, 19(3), 157-163.
Khalid, M. E., & Adzaku, F. K. (1995). The effect of altitude on blood pressure in the Assir
Province of Saudi Arabia. Wilderness and Environmental Medicine, 6(4), 401-406.
Khan, K. S., Ter Riet, G., Glanville, J., Sowden, A. J., & Kleijnen, J. (2001). Undertaking
systematic reviews of research on effectiveness: CRD's guidance for carrying out or
commissioning reviews (4). Retrieved from York (UK): https://www.york.ac.uk/media/crd/
Systematic_Reviews.pdf
Khanal, V., Adhikari, M., & Karki, S. (2013). Social determinants of tobacco consumption among
Nepalese men: findings from Nepal Demographic and Health Survey 2011. Harm
Reduction Journal, 10(40). doi:10.1186/1477-7517-10-40
Khatri, R. B., Mishra, S. R., & Khanal, V. (2015). Tobacco use among rural Nepalese women:
cross-sectional community based study. Indian Journal of Cancer, 52(4), 699-704.
Khoo, A.-L., Chai, L. Y., Koenen, H. J., Kullberg, B.-J., Joosten, I., van der Ven, A. J., & Netea,
M. G. (2011). 1, 25-dihydroxyvitamin D3 modulates cytokine production induced by
Candida albicans: impact of seasonal variation of immune responses. Journal of Infectious
Diseases, 203(1), 122-130.
Kinnunen, T. I., & Neupane, S. (2014). Prevalence of overweight among women of childbearing
age in Nepal: trends from 2001 to 2011 and associations with socio-demographic factors.
Maternal and Child Health Journal, 18(8), 1846-1853.
Kinra, S., Bowen, L. J., Lyngdoh, T., Prabhakaran, D., Reddy, K. S., Ramakrishnan, L., . . .
Kurpad, A. V. (2010). Sociodemographic patterning of non-communicable disease risk
factors in rural India: a cross sectional study. The British Medical Journal, 341:c4974.
doi:http://dx.doi.org/10.1136/bmj.c4974
Klatsky, A. (2015). Alcohol and cardiovascular diseases: where do we stand today? Journal of
Internal Medicine, 278(3), 238-250.
Kleindorfer, D., Judd, S., Howard, V. J., McClure, L., Safford, M. M., Cushman, M., . . . Howard,
G. (2011). Self-reported stroke symptoms without a prior diagnosis of stroke or transient
ischemic attack: a powerful new risk factor for stroke. Stroke, 42(11), 3122-3126.
Klop, B., do Rego, A. T., & Cabezas, M. C. (2013). Alcohol and plasma triglycerides. Current
Opinion in Lipidology, 24(4), 321-326.
Koirala, M., Khatri, R., Khanal, V., & Amatya, A. (2015). Prevalence and factors associated with
childhood overweight/obesity of private school children in Nepal. Obesity Research &
Clinical Practice, 9(3), 220-227.
Koju, R., Manandhar, K., Risal, A., Steiner, T. J., Holen, A., & Linde, M. (2015). Undertreated
hypertension and its implications for public health in Nepal: nationwide population-based
survey. Kathmandu University Medical Journal, 13(1), 3-7.
185
Kramer, C. K., Zinman, B., & Retnakaran, R. (2013). Are metabolically healthy overweight and
obesity benign conditions? A systematic review and meta-analysis. Annals of Internal
Medicine, 159(11), 758-769.
Kris-Etherton, P., Daniels, S. R., Eckel, R. H., Engler, M., Howard, B. V., Krauss, R. M., . . .
Stampfer, M. (2001). Summary of the scientific conference on dietary fatty acids and
cardiovascular health conference: summary from the nutrition committee of the American
Heart Association. Circulation, 103(7), 1034-1039.
Kumar, R., Pasha, M. Q., Khan, A. P., Gupta, V., Grover, S., Norboo, T., . . . Brahamchari, S.
(2003). Association of high-altitude systemic hypertension with the deletion allele-of the
angiotensin-converting enzyme (ACE) gene. International Journal of Biometeorology,
48(1), 10-14.
Ladell, W. (1964). Terrestrial animals in humid heat: man. In D. Dill, E. Adolph, & C. Wilber
(Eds.), Handbook of physiology, section 4, Adaptation to the environment (pp. 625-659).
Washington, DC: American Physiological Society.
Laniado-Laborin, R., Rendón, A., & Bauerle, O. (2011). Chronic obstructive pulmonary disease
case finding in Mexico in an at-risk population. International Journal of Tuberculosis and
Lung Disease, 15(6), 818-823.
Lankford, H. V., & Swenson, E. R. (2014). Dilated hearts at high altitude: words from on high.
High Altitude Medicine & Biology, 15(4), 511-519.
Law, M. (2010). Lipids and cardiovascular disease. In S. Yusuf, J. A. Cairns, A. J. Camm, E. L.
Fallen, & B. J. Gersh (Eds.), Evidence-based Cardiology (3rd ed., pp. 138-146): Blackwell
Publishing.
Law, M. R., Frost, C. D., & Wald, N. J. (1991). By how much does dietary salt reduction lower
blood pressure? III-Analysis of data from trials of salt reduction. The British Medical
Journal, 302(6780), 819-824.
Lee, K. (2012). Gender-specific relationships between alcohol drinking patterns and metabolic
syndrome: the Korea National Health and Nutrition Examination Survey 2008. Public
Health Nutrition, 15(10), 1917-1924.
Lee, M.-S., Hang, J.-q., Zhang, F.-y., Dai, H.-l., Su, L., & Christiani, D. C. (2012). In-home solid
fuel use and cardiovascular disease: a cross-sectional analysis of the Shanghai Putuo study.
Environmental Health, 11(1), 18.
Lee, W.-C., Chen, J.-J., Ho, H.-Y., Hou, C.-W., Liang, M.-P., Shen, Y.-W., & Kuo, C.-H. (2003).
Short-term altitude mountain living improves glycemic control. High Altitude Medicine &
Biology, 4(1), 81-91.
León-Velarde, F., Maggiorini, M., Reeves, J. T., Aldashev, A., Asmus, I., Bernardi, L., . . . Moore,
L. G. (2005). Consensus statement on chronic and subacute high altitude diseases. High
Altitude Medicine & Biology, 6(2), 147-157.
León-Velarde, F., Sanchez, J., Bigard, A. X., Brunet, A., Lesty, C., & C., M.-C. (1993). High
altitude tissue adaptation in Andean coots: capillarity, fibre area, fibre type and enzymatic
activities of skeletal muscle. Journal of Comparative Physiology B, 163(1), 52-58.
León-Velarde, F., Villafuerte, F. C., & Richalet, J.-P. (2010). Chronic mountain sickness and the
heart. Progress in Cardiovascular Diseases, 52(6), 540-549.
Leonard, W. R. (1989). Nutritional determinants of high‐altitude growth in Nunoa, Peru. American
Journal of Physical Anthropology, 80(3), 341-352.
186
Li, B., Baylink, D. J., Deb, C., Zannetti, C., Rajaallah, F., Xing, W., . . . Qin, X. (2013). 1, 25-
Dihydroxyvitamin D3 suppresses TLR8 expression and TLR8-mediated inflammatory
responses in monocytes in vitro and experimental autoimmune encephalomyelitis in vivo.
PloS One, 8(3), e58808. doi:10.1371/journal.pone.0058808
Li, S.-Q., & Zhang, Q. H. (2001). Advances in the development of functional foods from
buckwheat. Critical Reviews in Food Science and Nutrition, 41(6), 451-464.
Li, S., Zheng, B., Wang, H., Zheng, J., Cai, Z., Long, R., . . . Peng, H. (2006). The clinical
characteristics of acute severe high-altitude diseases in indigenous Tibetans. Chinese
Journal of Tuberculosis and Respiratory Diseases, 29(12), 835-836.
Lichtenstein, A. H., Appel, L. J., Brands, M., Carnethon, M., Daniels, S., Franch, H. A., . . .
Howard, B. (2006). Diet and lifestyle recommendations revision 2006: a scientific
statement from the American Heart Association nutrition committee. Circulation, 114(1),
82-96.
Lim, S. S., Vos, T., Flaxman, A. D., Danaei, G., Shibuya, K., Adair-Rohani, H., . . . Memish, Z. A.
(2012). A comparative risk assessment of burden of disease and injury attributable to 67
risk factors and risk factor clusters in 21 regions, 1990-2010: a systematic analysis for the
Global Burden of Disease Study 2010. The Lancet, 380(9859), 2224-2260.
Lindgärde, F., Ercilla, M. B., Correa, L. R., & Ahrén, B. (2004). Body adiposity, insulin, and leptin
in subgroups of Peruvian Amerindians. High Altitude Medicine & Biology, 5(1), 27-31.
Lindgärde, F., & Liljekvist, R. (1984). Failure of long‐term acclimatization in smokers moving to
high altitude. Acta Medica Scandinavica, 216(3), 317-322.
Littman, G. (1970). Alcoholism, illness, and social pathology among American Indians in
transition. American Journal of Public Health and the Nations Health, 60(9), 1769-1787.
Liu, L., Ding, Y., Huang, Z., He, B., Sun, S., Zhao, G., . . . Ikeda, K. (2001). Ethnic and
environmental differences in various markers of dietary intake and blood pressure among
Chinese Han and three other minority peoples of China: results from the WHO
Cardiovascular Diseases and Alimentary Comparison (CARDIAC) Study. Hypertension
Research, 24(3), 315-322.
López de Guimaraes, D., Chiriboga García, M. R., Gonzáles Crisóstomo, G. P., & Vega Mejía, V.
C. (2007). Prevalencia de algunos factores de riesgo cardiovascular en dos poblaciones de
Huaraz (3 100 m sobre el nivel del mar). Acta Médica Peruana, 24(1), 18-21.
Lossio, J. (2006). Life at high-altitudes: Medical historical debates (Andean region, 1890-1960).
(PhD), University of Manchester, U.K.
Lozano, R., & Monge, C. (1965). Renal function in high-altitude natives and in natives with
chronic mountain sickness. Journal of Applied Physiology, 20(5), 1026-1027.
Lu, C. J. (1993). Experimental report of Fagopyrum tartaricum on lowering the blood sugar level
and lipid level. Journal of Food Science (Chinese), 3, 45-46.
Lu, Y., Feskens, E. J. M., Boer, J. M. A., Imholz, S., Verschuren, W. M. M., Wijmenga, C., . . .
Dollé, M. E. T. (2010). Exploring genetic determinants of plasma total cholesterol levels
and their predictive value in a longitudinal study. Atherosclerosis, 213(1), 200-205.
Luis Enrique Macias Bustes, L. E., Cabrera Valentin, J. L., & Blas Posada, M. V. (2011, April).
Hypertension, smoking, diabetes and hypercholesterolemia in altitude. Paper presented at
the European Journal of Cardiovascular Prevention and Rehabilitation.
187
Luobu, G. (2012). The dynamic balance between adaptation and lesions of the cardiovascular
system in Tibetans living at high altitude. In S. Sanders & F. Ming (Eds.), Advances in high
altitude medicine and hypoxic physiology in China (pp. 33-34). Washington, D.C.: The
American Association for the Advancement of Science.
Maccallini, G., Aranda, C., Molinari, C., Colque, G., Biancardi, D., Figueroa, M., . . . Oneto, A.
(2012). High rates of dyslipidaemia among indigenous argentinean children living at high
altitudes. International Journal of Clinical Practice, 66(10), 1015-1015.
Mahajan, S., Kashyap, R., Sood, B., Jaret, P., Mokta, J., Kaushik, N., & Prashar, B. (2004). Stroke
at moderate altitude. Journal of Association of Physicians of India, 52, 699-702.
Makela, M., Barton, S. A., Schull, W. J., Weidman, W., & Rothhammer, F. (1978). The
multinational Andean genetic and health program—IV. Altitude and the blood pressure of
the Aymara. Journal of Chronic Diseases, 31(9), 587-603.
Málaga, G., Zevallos-Palacios, C., Lazo, M. d. l. Á., & Huayanay, C. (2010). High frequency of
dyslipidemia and impaired fasting glycemia in a high altitude Peruvian population. Revista
Peruana de Medicina Experimental y Salud Publica, 27(4), 557-561.
Malconian, M., Hultgren, H., Nitta, M., Anholm, J., Houston, C., & Fails, H. (1990). The sleep
electrocardiogram at extreme altitudes (Operation Everest II). American Journal of
Cardiology, 65(15), 1014-1020.
Mandal, C., Adak, D., Biswas, S., & Bharati, P. (2011). A study on BMI among the Bhotia of
Uttaranchal, India. Asian Pacific Journal of Tropical Disease, 1(1), 55-58.
Marchi, K. C., Muniz, J. J., & Tirapelli, C. R. (2014). Hypertension and chronic ethanol
consumption: What do we know after a century of study. World Journal of Cardiology,
6(5), 283-294.
Mark, A. L., Correia, M., Morgan, D. A., & et al. (1999). State-of-the-art-lecture: obesity induced
hypertension: new concepts from emerging biology of obesity. Hypertension, 33, 537-541.
Martin, S., Diewold, R., & Cooper, K. (1977). Alcohol, respiration, skin and body temperature
during cold water immersion. Journal of Applied Physiology, 43(2), 211-215.
Maskey, A., Sayami, A., & Pandey, M. (2003). Coronary artery disease: an emerging epidemic in
Nepal. Journal of Nepal Medical Association, 42(146), 122-124.
Matsubayashi, K., Kimura, Y., Sakamoto, R., Wada, T., Ishimoto, Y., Hirosaki, M., . . . Kosaka, Y.
(2009). Comprehensive geriatric assessment of elderly highlanders in Qinghai, China :
activities of daily living, quality of life and metabolic syndrome. Geriatrics & Gerontology
International, 9(4), 333-341.
McAllister, E. J., Dhurandhar, N. V., Keith, S. W., Aronne, L. J., Barger, J., Baskin, M., . . .
Eisenmann, J. C. (2009). Ten putative contributors to the obesity epidemic. Critical
Reviews in Food Science and Nutrition, 49(10), 868-913.
Meerson, F., Tverdokhlib, V., Nikonorov, A., Filippov, V., & Frolov, B. (1988). The role of
suppression of cholesterol 7-hydroxylase activity of the liver in the development of
atherogenic stress-induced dyslipoproteinemia. Kardiologiia, 28(9), 85-87.
Mehta, K. D., Karki, P., Lamsal, M., Paudel, I. S., Majhi, S., Das, B. K. L., . . . Baral, N. (2011).
Hyperglycemia, glucose intolerance, hypertension and socioeconomic position in eastern
Nepal. Southeast Asian Journal of Tropical Medicine and Public Health, 42(1), 197-207.
188
Meigs, J. B., Nathan, D. M., Wilson, P. W., Cupples, L. A., & Singer, D. E. (1998). Metabolic risk
factors worsen continuously across the spectrum of nondiabetic glucose tolerance: the
Framingham Offspring Study. Annals of Internal Medicine, 128(7), 524-533.
Mendis, S., Lindholm, L. H., Anderson, S. G., Alwan, A., Koju, R., Onwubere, B. J. C., . . .
Heagerty, A. (2011). Total cardiovascular risk approach to improve efficiency of
cardiovascular prevention in resource constrain settings. Journal of Clinical Epidemiology,
64(12), 1451-1462.
Mendis, S., Lindholm, L. H., Mancia, G., Whitworth, J., Alderman, M., Lim, S., & Heagerty, T.
(2007). World Health Organization (WHO) and International Society of Hypertension
(ISH) risk prediction charts: assessment of cardiovascular risk for prevention and control of
cardiovascular disease in low and middle-income countries. Journal of Hypertension,
25(8), 1578-1582.
Menezes, A. M. B., Perez-Padilla, R., Jardim, J. B., Muiño, A., Lopez, M. V., Valdivia, G., . . .
Victora, C. G. (2005). Chronic obstructive pulmonary disease in five Latin American cities
(the PLATINO study): a prevalence study. The Lancet, 366(9500), 1875-1881.
Meyer, M. G., Toborg, M. A., Denham, S. A., & Mande, M. J. (2008). Cultural perspectives
concerning adolescent use of tobacco and alcohol in the Appalachian mountain region.
Journal of Rural Health, 24(1), 67-74.
Miao, C.-Y., Zuberbuhler, J. S., & Zuberbuhler, J. R. (1988). Prevalence of congenital cardiac
anomalies at high altitude. Journal of the American College of Cardiology, 12(1), 224-228.
Miller, S., Tudor, C., Nyima, Thorsten, V. R., Sonam, Droyoung, . . . Varner, M. W. (2007).
Maternal and neonatal outcomes of hospital vaginal deliveries in Tibet. International
Journal of Gynecology and Obstetrics, 98(3), 217-221.
Mingji, C., Onakpoya, I. J., Perera, R., Ward, A. M., & Heneghan, C. J. (2015). Relationship
between altitude and the prevalence of hypertension in Tibet: a systematic review. Heart.
doi:10.1136/heartjnl-2014-307158
Ministry of Health and Population, Government of Nepal, Society for Local Integrated
Development Nepal (SOLID Nepal), & WHO. (2008). WHO STEPS Surveillance: Non
communicable disease risk factors survey. Retrieved from Kathmandu, Nepal:
http://www.who.int/chp/steps/Nepal_2007_STEPS_Report.pdf
Mishra, S. R., Neupane, D., Bhandari, P. M., Khanal, V., & Kallestrup, P. (2015). Burgeoning
burden of non-communicable diseases in Nepal: a scoping review. Globalization and
Health, 11(32). doi:10.1186/s12992-015-0119-7
Misra, A., Chowbey, P., Makkar, B., Vikram, N., Wasir, J., Chadha, D., . . . Gulati, S. (2009).
Consensus statement for diagnosis of obesity, abdominal obesity and the metabolic
syndrome for Asian Indians and recommendations for physical activity, medical and
surgical management. The Journal of the Association of Physicians of India, 57, 163-170.
Mitchell, R., Blane, D., & Bartley, M. (2002). Elevated risk of high blood pressure: climate and the
inverse housing law. International Journal of Epidemiology, 31(4), 831-838.
Mohanna, S., Baracco, R., & Seclén, S. (2006). Lipid profile, waist circumference, and body mass
index in a high altitude population. High Altitude Medicine & Biology, 7(3), 245-255.
Moncloa, F., Gómez, M., & Hurtado, A. (1965). Plasma catecholamines at high altitudes. Journal
of Applied Physiology, 20(6), 1329-1331.
189
Moore, L. G., Armaza, V. F., Villena, M., & Vargas, E. (2002). Comparative aspects of high-
altitude adaptation in human populations. In S. Lahiri, N. R. Prabhakar, & R. E. Forster
(Eds.), Oxygen sensing: molecule to man (pp. 45-62): Springer.
Moore, L. G., Charles, S. M., & Julian, C. G. (2011). Humans at high altitude: hypoxia and fetal
growth. Respiratory Physiology & Neurobiology, 178(1), 181-190.
Moore, L. G., Niermeyer, S., & Zamudio, S. (1998). Human adaptation to high altitude: regional
and life‐cycle perspectives. American Journal of Physical Anthropology, 107(S27), 25-64.
Mori, L. M., Seclén, S., Rosas, A., & Arias, A. (2015). Perú lower diabetes prevalence above
3,000 m of altitude in Peru can be explained by wealth index, age and sex distribution:
analysis of the Peruvian Demographic and Health Survey. Paper presented at the 8th
World Congress on Prevention of Diabetes and its Complications. , Cartagena, Columbia.
Mortimer Jr, E. A., Monson, R. R., & MacMahon, B. (1977). Reduction in mortality from coronary
heart disease in men residing at high altitude. New England Journal of Medicine, 296(11),
581-585.
Mosihuzzaman, M., Nahar, N., Ali, L., Rokeya, B., Khan, A., & Nandi, R. (1993). Hypoglycemic
effects of three plants from eastern Himalayan belt. Diabetes Research, 26(3), 127-138.
Mozaffarian, D. (2016). Dietary and policy priorities for cardiovascular disease, diabetes, and
obesity: a comprehensive review. Circulation, 133(2), 187-225.
Mozaffarian, D., Fahimi, S., Singh, G. M., Micha, R., Khatibzadeh, S., Engell, R. E., . . . Powles, J.
(2014). Global sodium consumption and death from cardiovascular causes. New England
Journal of Medicine, 371(7), 624-634.
Mukhopadhyay, B., Mukhopadhyay, S., & Majumder, P. P. (1996). Blood pressure profile of
Lepchas of the Sikkim Himalayas: epidemiological study. Human Biology, 68(1), 131-145.
Muratsubaki, H., Enomoto, K., Ichijoh, Y., & Yamamoto, Y. (2003). Hypertriglyceridemia
associated with decreased post-heparin plasma hepatic triglyceride lipase activity in
hypoxic rats. Archives of Physiology and Biochemistry, 111(5), 449-454.
Murillo, F., Barton, S. A., Palomino, H., Lenart, V., & Schull, W. J. (1980). The Aymara of
Western Bolivia: health and disease. Bulletin of the Pan American Health Organization,
14(1), 52-64.
Naeye, R. L. (1965). Children at high altitude: pulmonary and renal abnormalities. Circulation
Research, 16(1), 33-38.
Napier, K. (2006). Obesity and coronary artery disease. In J. M. Foody (Ed.), Preventive
cardiology: insights into the prevention and treatment of cardiovascular disease (Second
ed., pp. 161-178). Totowa, New Jersey: Humana Press Inc.
National Heart Foundation of Australia. (2006). Position statement: carbohydrates, dietary fibre,
glycaemic index/load and cardiovascular disease. Retrieved from
www.heartfoundation.com.au
National Institute of Health. (1998). NIH Clinical Guidelines on the identification, evaluation, and
treatment of overweight and obesity in adults: the evidence report (NIH publication no. :
98-4083). Retrieved from http://www.nhlbi.nih.gov/guidelines/obesity/ob_gdlns.pdf
National working committee on children and women. (2001). Report of the People’s of China on
the Development of Children in the 1990s.
190
NCD Risk Factor Collaboration. (2016). Worldwide trends in diabetes since 1980: a pooled
analysis of 751 population-based studies with 4.4 million participants. The Lancet,
387(10027), 1513-1530.
Negi, P. C., Bhardwaj, R., Kandoria, A., Asotra, S., Ganju, N., Marwaha, R., . . . Kanwar, A.
(2012). Epidemiological study of hypertension in natives of Spiti Valley in Himalayas and
impact of hypobaric hypoxemia; a cross-sectional study. Journal of the Association of
Physicians of India, 60, 21-25.
Negi, P. C., Marwaha, R., Asotra, S., Kandoria, A., Ganju, N., Sharma, R., . . . Bhardwaj, R.
(2014). Prevalence of high altitude pulmonary hypertension among the natives of Spiti
Valley - a high altitude region in Himachal Pradesh, India. High Altitude Medicine &
Biology, 15(4), 504-510.
Nepal Health Research Council. (2010). Prevalence of non-communicable diseases in Nepal :
Hospital based study. Retrieved from Kathmandu, Nepal:
http://nhrc.org.np:8080/nhrc/handle/123456789/70
Neupane, D., McLachlan, C. S., Sharma, R., Gyawali, B., Khanal, V., Mishra, S. R., . . . Kallestrup,
P. (2014). Prevalence of hypertension in member countries of South Asian Association for
Regional Cooperation (SAARC): systematic review and meta-analysis. Medicine, 93(13),
e74. doi:10.1097/MD.0000000000000074
Ng, M., Fleming, T., Robinson, M., Thomson, B., Graetz, N., Margono, C., . . . Abera, S. F. (2014).
Global, regional, and national prevalence of overweight and obesity in children and adults
during 1980–2013: a systematic analysis for the Global Burden of Disease Study 2013. The
Lancet, 384(9945), 766-781.
Niaz, A., & Nayyar, S. (2003). Cerebrovascular stroke at high altitude. Journal of the College of
Physicians and Surgeons Pakistan, 13(8), 446-448.
Niermeyer, S., Zamudio, S., & Moore, L. G. (2001). The people. In T. Hornbein & R. Schoene
(Eds.), High altitude: an exploration of human adaptation (pp. 43-100). New York: CRC
Press.
Norboo, T., Yahya, M., Bruce, N., Heady, J., & Ball, K. (1991). Domestic pollution and respiratory
illness in a Himalayan village. International Journal of Epidemiology, 20(3), 749-757.
Nordestgaard, B. G., Langsted, A., Mora, S., Kolovou, G., Baum, H., Bruckert, E., . . . Borén, J.
(2016). Fasting is not routinely required for determination of a lipid profile: clinical and
laboratory implications including flagging at desirable concentration cut-points—a joint
consensus statement from the European Atherosclerosis Society and European Federation
of Clinical Chemistry and Laboratory Medicine. European Heart Journal, ehw152.
O'Donnell, M., Mente, A., Rangarajan, S., McQueen, M. J., Wang, X., Liu, L., . . . Devanath, A.
(2014). Urinary sodium and potassium excretion, mortality, and cardiovascular events.
New England Journal of Medicine, 371(7), 612-623.
O'Donnell, M., Xavier, D., Liu, L., Zhang, H., Chin, S. L., Rao-Melacini, P., . . . McQueen, M. J.
(2010). Risk factors for ischaemic and intracerebral haemorrhagic stroke in 22 countries
(the INTERSTROKE study): a case-control study. The Lancet, 376(9735), 112-123.
O'Donnell, M., Yusuf, S., Mente, A., Gao, P., Mann, J. F., Teo, K., . . . Dans, A. (2011). Urinary
sodium and potassium excretion and risk of cardiovascular events. Journal of the American
Medical Association, 306(20), 2229-2238.
191
Ogden, C. L., Carroll, M. D., Kit, B. K., & Flegal, K. M. (2014). Prevalence of childhood and adult
obesity in the United States, 2011-2012. Journal of the American Medical Association,
311(8), 806-814.
Ojeda, E., Blümel, J. E., Vallejo, M. S., & Lavín, P. (2014). Climacteric symptoms in Quechua and
Mestizo women from the Andean region of Cusco, Peru: effects of altitude and ethnicity.
Maturitas, 77(4), 356-360.
Okuda, H., Yanagi, I., & Fujii, S. (1966). The mechanism of in vitro stimulation of lipolysis by
adrenaline. The Journal of Biochemistry, 59(5), 438-442.
Okumiya, K., Fukutomi, E., Kimura, Y., Ishimoto, Y., Chen, W. l., Ishikawa, M., . . . Otsuka, K.
(2011). Strong association between polycythemia and glucose intolerance in older adults
living at high altitudes in the Andes. Journal of the American Geriatrics Society, 59(10),
1971-1973.
Okumiya, K., Sakamoto, R., Ishimoto, Y., Kimura, Y., Fukutomi, E., Ishikawa, M., . . . Kato, E.
(2016). Glucose intolerance associated with hypoxia in people living at high altitudes in the
Tibetan highland. BMJ Open, 6(2), e009728. doi:10.1136/bmjopen-2015-009728
Okumiya, K., Sakamoto, R., Kimura, Y., Ishimoto, Y., Wada, T., Ishine, M., . . . Ge, R. L. (2010).
Diabetes mellitus and hypertension in elderly highlanders in Asia. Journal of the American
Geriatrics Society, 58(6), 1193-1195.
Oli, K. K., & Agrawal, J. P. (2001). Critical review of stroke. Journal of Institute of Medicine, 23,
68-71.
Ostadal, B., & Kolar, F. (2007). Cardiac adaptation to chronic high-altitude hypoxia: beneficial and
adverse effects. Respiratory Physiology & Neurobiology, 158(2), 224-236.
Otsuka, K., Norboo, T., Otsuka, Y., Higuchi, H., Hayajiri, M., Narushima, C., . . . Wada, T. (2005).
Effect of aging on blood pressure in Leh, Ladakh, a high-altitude (3524 m) community, by
comparison with a Japanese town. Biomedicine and Pharmacotherapy, 59, S54-S57.
Oyarzun, P. J., Borja, R. M., Sherwood, S., & Parra, V. (2013). Making sense of agrobiodiversity,
diet, and intensification of smallholder family farming in the highland Andes of Ecuador.
Ecology of Food and Nutrition, 52(6), 515-541.
Padwal, R. S., & Sharma, A. M. (2010). Obesity. In S. Yusuf, J. A. Cairns, A. J. Camm, E. L.
Fallen, & B. J. Gersh (Eds.), Evidence-based Cardiology (3rd ed., pp. 221-234): Blackwell
Publishing.
Painschab, M. S., Davila-Roman, V. G., Gilman, R. H., Vasquez-Villar, A. D., Pollard, S. L., Wise,
R. A., . . . Casas, J. P. (2013). Chronic exposure to biomass fuel is associated with
increased carotid artery intima-media thickness and a higher prevalence of atherosclerotic
plaque. Heart, 99(14), 984-991.
Pan American Health Organization. (1994). Health conditions in the Americas. Scientific
publication 549. Washington DC: Pan American Health Organization.
Pan, W. H., Yeh, W. T., Chang, H. Y., Hwu, C. M., & Ho, L. T. (2003). Prevalence and awareness
of diabetes and mean fasting glucose by age, sex, and region: results from the Nutrition and
Health Survey in Taiwan, 1993–1996. Diabetic Medicine, 20(3), 182-185.
Pandey, M. R. (1970). Myocardial infarction in Nepal. Indian Heart Journal, 22, 73-82.
Pandey, M. R., Neupane, R. P., & Gautam, A. (1988). Epidemiological study of tobacco smoking
behaviour among adults in a rural community of the hill region of Nepal with special
reference to attitude and beliefs. International Journal of Epidemiology, 17(3), 535-541.
192
Papaetis, G. S., Papakyriakou, P., & Panagiotou, T. N. (2015). Central obesity, type 2 diabetes and
insulin: exploring a pathway full of thorns. Archives of Medical Science, 11(3), 463-482.
Parajuli, V. J., Macdonald, S., & Jimba, M. (2015). Social–contextual factors associated with
alcohol use among adolescents of traditional alcohol user and nonuser ethnic groups of
Nepal. Journal of Ethnicity in Substance Abuse, 14(2), 151-165.
Paralikar, S. J. (2012). High altitude pulmonary edema-clinical features, pathophysiology,
prevention and treatment. Indian Journal of Occupational and Environmental Medicine,
16(2), 59-62.
Parks, E. J. (2001). Effect of dietary carbohydrate on triglyceride metabolism in humans. Journal of
Nutrition, 131(10), 2772S-2774S.
Pawson, I. G. (1977). Growth characteristics of populations of Tibetan origin in Nepal. American
Journal of Physical Anthropology, 47(3), 473-482.
Pawson, I. G., & Huicho, L. (2010). Persistence of growth stunting in a Peruvian high altitude
community, 1964–1999. American Journal of Human Biology, 22(3), 367-374.
Pawson, I. G., & Jest, C. (1978). The high-altitude areas of the world and their cultures. In P. T.
Baker (Ed.), The biology of high-altitude peoples (pp. 17-45). London, New York,
Melbourne: Cambridge University Press.
Pearce, J. L., Aguilar-Villalobos, M., Rathbun, S. L., & Naeher, L. P. (2009). Residential exposures
to PM 2.5 and CO in Cusco, a high-altitude city in the Peruvian Andes: a pilot study.
Archives of Environmental & Occupational Health, 64(4), 278-282.
Pei, T., Li, X., Tao, F., Xu, H., You, H., Zhou, L., . . . Gao, Y. (2012). Burden of disease resulting
from chronic mountain sickness among young Chinese male immigrants in Tibet. BMC
Public Health, 12(401). doi:10.1186/1471-2458-12-401
Peñaloza, D., & Arias-Stella, J. (2007). The heart and pulmonary circulation at high altitudes
healthy highlanders and chronic mountain sickness. Circulation, 115(9), 1132-1146.
Peñaloza, D., & Echevarría, M. (1957). Electrocardiographic observations on ten subjects at sea
level and during one year of residence at high altitudes. American Heart Journal, 54(6),
811-822.
Peñaloza, D., Gamboa, R., Dyer, J., Echevarría, M., & Marticorena, E. (1960). The influence of
high altitudes on the electrical activity of the heart. I. Electrocardiographic and
vectocardiographic observations in the newborn, infants, and children. American Heart
Journal, 59(1), 111-128.
Pereira‐Santos, M., Costa, P., Assis, A., & Santos, D. (2015). Obesity and vitamin D deficiency: a
systematic review and meta‐analysis. Obesity Reviews, 16(4), 341-349.
Peto, R., Boreham, J., & Lopez, A. D. (1996). Mortality from smoking in developed countries:
Oxford University Press.
Peto, R., Boreham, J., Lopez, A. D., Thun, M., & Heath, C. (1992). Mortality from tobacco in
developed countries: indirect estimation from national vital statistics. The Lancet,
339(8804), 1268-1278.
Piccinelli, M., Tessari, E., Bortolomasi, M., Piasere, O., Semenzin, M., Garzotto, N., & Tansella,
M. (1997). Efficacy of the alcohol use disorders identification test as a screening tool for
hazardous alcohol intake and related disorders in primary care: a validity study. The British
Medical Journal, 314(7078), 420-425.
193
Picón-Reátegui, E. (1963). Intravenous glucose tolerance test at sea level and at high altitudes.
Journal of Clinical Endocrinology and Metabolism, 23(12), 1256-1261.
Pipe, A. (2010). Tobacco and cardiovascular disease : achieving smoking cessation in cardiac
patients. In S. Yusuf, J. A. Cairns, A. J. Camm, E. L. Fallen, & B. J. Gersh (Eds.),
Evidence-based Cardiology (3rd ed., pp. 125-137): Blackwell Publishing.
Ponce-Caballero, G., Loma-Rodriguez, F., Villegas, P., & Laura, G. (1976). Persistencia del
conducto arterial hipertenso en la altura. Anthropologie des Populations Andines. INSERM,
63, 333-344.
Pradhan, B., Chappuis, F., Baral, D., Karki, P., Rijal, S., Hadengue, A., & Gache, P. (2012). The
alcohol use disorders identification test (AUDIT): validation of a Nepali version for the
detection of alcohol use disorders and hazardous drinking in medical settings. Substance
Abuse Treatment, Prevention, and Policy, 7, 42. doi:10.1186/1747-597X-7-42
Prospective Studies Collaboration. (2002). Age-specific relevance of usual blood pressure to
vascular mortality: a meta-analysis of individual data for one million adults in 61
prospective studies. The Lancet, 360(9349), 1903-1913.
Prospective Studies Collaboration. (2007). Blood cholesterol and vascular mortality by age, sex and
blood pressure: a meta analysis of individual data from 61 prospective studies with 55000
vascular deaths. The Lancet, 370(9602), 1829-1839.
Pryor, R., Weaver, W. F., & Blount, S. G. (1965). Electrocardiographic observation of 493
residents living at high altitude (10,150 feet). American Journal of Cardiology, 16(4), 494-
499.
Quintero, P., Milagro, F., Campion, J., & Martinez, J. (2010). Impact of oxygen availability on
body weight management. Medical Hypotheses, 74(5), 901-907.
Rambal, C. (2012). Tibetan pride of place : or, why Nepal's Bhotiyas are not an ethnic group. In D.
N. Gellner, J. Pfaff-Czarnecka, & J. Whelpton (Eds.), Nationalism and ethnicity in a Hindu
Kingdom : the politics of culture in contemporary Nepal (pp. 379-414). New York: Taylor
and Francis.
Ramos, A., Krüger, H., Muro, M., & Arias-Stella, J. (1967). Pathology of natives of high altitudes.
Study of the causes of death in 300 autopsies. Boletin de la Oficina Sanitaria
Panamericana. Pan American Sanitary Bureau, 62(6), 496-502.
Raynaud, J., Valeix, P., Drouet, L., Escourrou, P., & Durand, J. (1981). Electrocardiographic
observations in high altitude residents of Nepal and Bolivia. International Journal of
Biometeorology, 25(3), 205-217.
Reddy, K. S. (2010). Diet and cardiovascular disease. In S. Yusuf, J. A. Cairns, A. J. Camm, E. L.
Fallen, & B. J. Gersh (Eds.), Evidence-based cardiology (3rd ed., pp. 304-327): Blackwell
Publishing.
Regensteiner, J. G., & Moore, L. G. (1985). Migration of the elderly from high altitudes in
Colorado. Journal of the American Medical Association, 253(21), 3124-3128.
Regmi, P. R., & Wyber, R. (2013). Prevention of rheumatic fever and heart disease: Nepalese
experience. Global Heart, 8(3), 247-252.
Rehm, J., Baliunas, D., Borges, G. L., Graham, K., Irving, H., Kehoe, T., . . . Poznyak, V. (2010).
The relation between different dimensions of alcohol consumption and burden of disease:
an overview. Addiction, 105(5), 817-843.
194
Richalet, J.-P., Larmignat, P., Poitrine, E., Letournel, M., & Canouï-Poitrine, F. (2012).
Physiological risk factors for severe high-altitude illness: a prospective cohort study.
American Journal of Respiratory and Critical Care Medicine, 185(2), 192-198.
Rimm, E. B., Williams, P., Fosher, K., Criqui, M., & Stampfer, M. J. (1999). Moderate alcohol
intake and lower risk of coronary heart disease: meta-analysis of effects on lipids and
haemostatic factors. The British Medical Journal, 319(7224), 1523-1528.
Roberts, A., Butterfield, G., Cymerman, A., Reeves, J., Wolfel, E., & Brooks, G. (1996).
Acclimatization to 4,300-m altitude decreases reliance on fat as a substrate. Journal of
Applied Physiology, 81(4), 1762-1771.
Roeggla, G., Roeggla, H., Roeggla, M., Binder, M., & Laggner, A. N. (1995). Effect of alcohol on
acute ventilatory adaptation to mild hypoxia at moderate altitude. Annals of Internal
Medicine, 122(12), 925-927.
Roerecke, M., & Rehm, J. (2010). Irregular heavy drinking occasions and risk of ischemic heart
disease: a systematic review and meta-analysis. American Journal of Epidemiology,
171(6), 633-644.
Romhilt, D. W., & Estes, E. H. (1968). A point-score system for the ECG diagnosis of left
ventricular hypertrophy. American Heart Journal, 75(6), 752-758.
Ronksley, P. E., Brien, S. E., Turner, B. J., Mukamal, K. J., & Ghali, W. A. (2011). Association of
alcohol consumption with selected cardiovascular disease outcomes: a systematic review
and meta-analysis. The British Medical Journal, 342, d671. doi:10.1136/bmj.d671
Rose, G., Stamler, J., Stamler, R., Elliott, P., Marmot, M., Pyorala, K., . . . Sans, S. (1988).
Intersalt: An international study of electrolyte excretion and blood pressure. Results for 24
hour urinary sodium and potassium excretion. The British Medical Journal, 297(6644),
319-328.
Rosenblum, J. L., Castro, V. M., Moore, C. E., & Kaplan, L. M. (2012). Calcium and vitamin D
supplementation is associated with decreased abdominal visceral adipose tissue in
overweight and obese adults. The American Journal of Clinical Nutrition, 95(1), 101-108.
Rotta, A., & Lopez, A. (1959). Electrocardiographic patterns in man at high altitudes. Circulation,
19(5), 719-728.
Rudolph, G. (1992). In memory of Paul Bert (1833-1886) and the development of high altitude
physiology in Switzerland. Gesnerus, 50, 79-95.
Ruhli, F. J., Henneberg, M., Schaer, D. J., Imhof, A., Schleiffenbaum, B., & Woitek, U. (2008).
Determinants of inter-individual cholesterol level variation in an unbiased young male
sample. Swiss Medical Weekly, 138(19-20), 286-291.
Ruidavets, J.-B., Ducimetière, P., Evans, A., Montaye, M., Haas, B., Bingham, A., . . . Kee, F.
(2010). Patterns of alcohol consumption and ischaemic heart disease in culturally divergent
countries: the Prospective Epidemiological Study of Myocardial Infarction (PRIME). The
British Medical Journal, 341, c6077. doi:http://dx.doi.org/10.1136/bmj.c6077
Ruiz, L., Figueroa, M., Horna, C., & Peñaloza, D. (1969). Occurrence of arterial hypertension and
ischemic heart disease in high altitudes. Archivos del Instituto de Cardiología de México,
39(4), 476-489.
Ruiz, L., & Penaloza, D. (1977). Altitude and hypertension. Mayo Clinic Proceedings, 52(7), 442-
445.
195
Santos, J. L. (2000). Plasma leptin and insulin levels in Aymara natives from Chile. Annals of
Human Biology, 27(3), 271-279.
Santos, J. L., Pérez-Bravo, F., Carrasco, E., Calvillán, M., & Albala, C. (2001). Low prevalence of
type 2 diabetes despite a high average body mass index in the Aymara natives from Chile.
Nutrition, 17(4), 305-309.
Sarfo, F. S., Gebregziabher, M., Ovbiagele, B., Akinyemi, R., Owolabi, L., Obiako, R., . . .
Melikam, S. (2016). Validation of the 8-item questionnaire for verifying stroke free status
with and without pictograms in three West African languages. eNeurologicalSci, 3, 75-79.
Sasaki, H., Fukuda, S., Otani, H., Zhu, L., Yamaura, G., Engelman, R. M., . . . Maulik, N. (2002).
Hypoxic preconditioning triggers myocardial angiogenesis: a novel approach to enhance
contractile functional reserve in rat with myocardial infarction. Journal of Molecular and
Cellular Cardiology, 34(3), 335-348.
Sawhney, R., Malhotra, A., & Singh, T. (1991). Glucoregulatory hormones in man at high altitude.
European Journal of Applied Physiology and Occupational Physiology, 62(4), 286-291.
Schargrodsky, H., Hernández-Hernández, R., Champagne, B. M., Silva, H., Vinueza, R., Ayçaguer,
L. C. S., . . . Pellegrini, F. (2008). CARMELA: assessment of cardiovascular risk in seven
Latin American cities. The American Journal of Medicine, 121(1), 58-65.
Schinder, E., & Ruder, A. (1989). Epidemiology of coca and alcohol use among high‐altitude
miners in argentina. American Journal of Industrial Medicine, 15(5), 579-587.
Schneider, M., Bernasch, D., Weymann, J., Holle, R., & Bartsch, P. (2002). Acute mountain
sickness: influence of susceptibility, preexposure, and ascent rate. Medicine and Science in
Sports and Exercise, 34(12), 1886-1891.
Schoutsen, B., De Jong, J. W., Harmsen, E., De Tombe, P. P., & Achterberg, P. W. (1983).
Myocardial xanthine oxidase/dehydrogenase. Biochimica et Biophysica Acta (BBA)-
Molecular Cell Research, 762(4), 519-524.
Sehgal, A., Krishan, I., Malhotra, R., & Gupta, H. (1968). Observations on the blood pressure of
Tibetans. Circulation, 37(1), 36-44.
Semenza, G. L. (2006). Regulation of physiological responses to continuous and intermittent
hypoxia by hypoxia‐inducible factor 1. Experimental Physiology, 91(5), 803-806.
Shah, S. M. A., Arif, A. A., Delclos, G. L., Khan, A. R., & Khan, A. (2001). Prevalence and
correlates of smoking on the roof of the world. Tobacco Control, 10, e1.
doi:10.1136/tc.10.1.e1
Shah, S. M. A., Luby, S., Rahbar, M., Khan, A. W., & McCormick, J. B. (2001). Hypertension and
its determinants among adults in high mountain villages of the Northern Areas of Pakistan.
Journal of Human Hypertension, 15(2), 107-112.
Shah, S. M. A., Nanan, D., Rahbar, M. H., Rahim, M., & Nowshad, G. (2004). Assessing obesity
and overweight in a high mountain Pakistani population. Tropical Medicine and
International Health, 9(4), 526-532.
Shahid Gangalal National Heart Centre. (2008). Annual report 2008. Kathmandu, Nepal.
Sharma, A., & Khandelwal, S. (2000). Women with alcohol‐related problems in Nepal. Addiction,
95(7), 1105-1106.
Sharma, S. C., Vijayan, G. P., Suri, M. L., & Seth, H. N. (1977). Platelet adhesiveness in young
patients with ischaemic stroke. Journal of Clinical Pathology, 30(7), 649-652.
196
Sharma, S. K., Ghimire, A., Radhakrishnan, J., Thapa, L., Shrestha, N. R., Paudel, N., . . . Brodie,
D. (2011). Prevalence of hypertension, obesity, diabetes, and metabolic syndrome in Nepal.
International Journal of Hypertension, 2011. doi:10.4061/2011/821971
She, J., Yang, P., Hong, Q., & Bai, C. (2013). Lung cancer in China: challenges and interventions.
Chest, 143(4), 1117-1126.
Sherpa, L. Y., Stigum, H., Chongsuvivatwong, V., Luobu, O., Thelle, D. S., Nafstad, P., &
Bjertness, E. (2011). Lipid profile and its association with risk factors for coronary heart
disease in the highlanders of Lhasa, Tibet. High Altitude Medicine & Biology, 12(1), 57-63.
Sherpa, L. Y., Stigum, H., Chongsuvivatwong, V., Nafstad, P., & Bjertness, E. (2013). Prevalence
of metabolic syndrome and common metabolic components in high altitude farmers and
herdsmen at 3700 m in Tibet. High Altitude Medicine & Biology, 14(1), 37-44.
Sherpa, L. Y., Stigum, H., Chongsuvivatwong, V., Thelle, D. S., & Bjertness, E. (2010). Obesity in
Tibetans aged 30–70 living at different altitudes under the north and south faces of Mt.
Everest. International Journal of Environmental Research and Public Health, 7(4), 1670-
1680.
Sherpa, L. Y., Supamai, S., & Virasakdi, C. (2008). Impaired glucose regulation in a Sherpa
indigenous population living in the Everest region of Nepal and in Kathmandu Valley.
High Altitude Medicine & Biology, 9(3), 217-222.
Shrestha, A., Shah, D., Adhikari, S. K. K., Sapkota, S., & Regmi, P. (2011). Retrospective analysis
of Stroke and its risk factors at Bir Hospital. Post-Graduate Medical Journal of NAMS,
11(2), 28-30.
Shrestha, S., Shrestha, A., Shrestha, S., & Bhattarai, D. (2012). Blood Pressure in Inhabitants of
High Altitude of Western Nepal. Journal of Nepal Medical Association, 52(188), 154-158.
Shrestha, U., Singh, D., & Bhattarai, M. (2006). The prevalence of hypertension and diabetes
defined by fasting and 2‐h plasma glucose criteria in urban Nepal. Diabetic Medicine,
23(10), 1130-1135.
Simkhada, P., Poobalan, A., Simkhada, P. P., Amalraj, R., & Aucott, L. (2009). Knowledge,
attitude, and prevalence of overweight and obesity among civil servants in Nepal. Asia-
Pacific Journal of Public Health, 23, 507-517.
Simons, L. A. (1986). Interrelations of lipids and lipoproteins with coronary artery disease
mortality in 19 countries. American Journal of Cardiology, 57(14), G5-G10.
Singh, I., & Chohan, I. (1973). Reversal of abnormal fibrinolytic activity, blood coagulation factors
and platelet function in high-altitude pulmonary oedema with frusemide. International
Journal of Biometeorology, 17(1), 73-81.
Sinnett, P., & Whyte, H. (1973). Epidemiological studies in a total highland population, Tukisenta,
New Guinea: cardiovascular disease and relevant clinical, electrocardiographic,
radiological and biochemical findings. Journal of Chronic Diseases, 26(5), 265-290.
Siqués, P., Brito, J., Leon-Velarde, F., Barrios, L., De La Cruz, J. J., López, V., & Herruzo, R.
(2007). Hematological and lipid profile changes in sea-level natives after exposure to 3550-
m altitude for 8 months. High Altitude Medicine & Biology, 8(4), 286-295.
Smith, C. (1999). Blood pressures of Sherpa men in modernizing Nepal. American Journal of
Human Biology, 11(4), 469-479.
197
Smyth, A., Teo, K. K., Rangarajan, S., O'Donnell, M., Zhang, X., Rana, P., . . . Yusuf, S. (2015).
Alcohol consumption and cardiovascular disease, cancer, injury, admission to hospital, and
mortality: a prospective cohort study. The Lancet, 386(10007), 1945-1954.
Sokolow, M., & Lyon, T. P. (1949). The ventricular complex in left ventricular hypertrophy as
obtained by unipolar precordial and limb leads. American Heart Journal, 37(2), 161-186.
Solomon, C. G., & Manson, J. (1997). Obesity and mortality: a review of the epidemiologic data.
The American Journal of Clinical Nutrition, 66(4), 1044S-1050S.
Sørensen, H. T., Sabroe, S., Rothman, K. J., Gillman, M., Fischer, P., & Sørensen, T. I. (1997).
Relation between weight and length at birth and body mass index in young adulthood:
cohort study. The British Medical Journal, 315(7116), 1137.
Srivastava, K. K., Kumria, M. M., Grover, S. K., Sridharan, K., & Malhotra, M. S. (1975). Glucose
tolerance of lowlanders during prolonged stay at high altitude and among high altitude
natives. Aviation Space and Environmental Medicine, 46(2), 144-146.
Stevens, S. F. (1996). Claiming the high ground: Sherpas, subsistence, and environmental change
in the highest Himalaya: Motilal Banarsidass Publisher.
Stewart, C. P., Christian, P., Wu, L. S., LeClerq, S. C., Khatry, S. K., & West Jr, K. P. (2013).
Prevalence and risk factors of elevated blood pressure, overweight, and dyslipidemia in
adolescent and young adults in rural Nepal. Metabolic Syndrome and Related Disorders,
11(5), 319-328.
Stockwell, T., Donath, S., Cooper‐Stanbury, M., Chikritzhs, T., Catalano, P., & Mateo, C. (2004).
Under‐reporting of alcohol consumption in household surveys: a comparison of quantity–
frequency, graduated–frequency and recent recall. Addiction, 99(8), 1024-1033.
Stroup, D. F., Berlin, J. A., Morton, S. C., Olkin, I., Williamson, G. D., Rennie, D., . . . Thacker, S.
B. (2000). Meta-analysis of observational studies in epidemiology: a proposal for
reporting. Journal of the American Medical Association, 283(15), 2008-2012.
Stuber, T., & Scherrer, U. (2010). Circulatory adaptation to long-term high altitude exposure in
aymaras and Caucasians. Progress in Cardiovascular Diseases, 52(6), 534-539.
Sullivan, K. M., Mei, Z., Grummer‐Strawn, L., & Parvanta, I. (2008). Haemoglobin adjustments to
define anaemia. Tropical Medicine and International Health, 13(10), 1267-1271.
Sun, S. (1986). Epidemiology of hypertension on the Tibetan Plateau. Human Biology, 58(4), 507-
515.
Sung, K.-C., Kim, S. H., & Reaven, G. M. (2007). Relationship among alcohol, body weight, and
cardiovascular risk factors in 27,030 Korean men. Diabetes Care, 30(10), 2690-2694.
Superko, H. R. (1996). What can we learn about dense low density lipoprotein and lipoprotein
particles from clinical trials? Current Opinion in Lipidology, 7(6), 363-368.
Sutton, J., & Garmendia, F. (1976). Hormonal variation during physical exertion at high altitude.
Archivos de Biología Andina, 7(2), 83-93.
Swenson, E. R. (2013). Hypoxic pulmonary vasoconstriction. High Altitude Medicine & Biology,
14(2), 101-110.
Tag, H., Kalita, P., Dwivedi, P., Das, A., & Namsa, N. D. (2012). Herbal medicines used in the
treatment of diabetes mellitus in Arunachal Himalaya, northeast, India. Journal of
Ethnopharmacology, 141(3), 786-795.
198
Takhelmayum, R., Thanpari, C., Kumar, S., Singh, A., & Sinha, J. (2014). Lipid profile of
population of central region of Nepal. Mymensingh Medical Journal, 23(3), 552-557.
Tin'kov, A. N., & Aksenov, V. A. (2002). Effects of intermittent hypobaric hypoxia on blood lipid
concentrations in male coronary heart disease patients. High Altitude Medicine & Biology,
3(3), 277-282.
Tonstad, S., & Johnston, J. A. (2006). Cardiovascular risks associated with smoking: a review for
clinicians. European Journal of Cardiovascular Prevention and Rehabilitation, 13(4), 507-
514.
Toole, J. F., Lefkowitz, D. S., Chambless, L. E., Wijnberg, L., Paton, C. C., & Heiss, G. (1996).
Self-reported transient ischemic attack and stroke symptoms: methods and baseline
prevalence: the ARIC Study, 1987–1989. American Journal of Epidemiology, 144(9), 849-
856.
Torres, J., Correa, P., Ferreccio, C., Hernandez-Suarez, G., Herrero, R., Cavazza-Porro, M., . . .
Morgan, D. (2013). Gastric cancer incidence and mortality is associated with altitude in the
mountainous regions of Pacific Latin America. Cancer Causes and Control, 24(2), 249-
256.
Tripathy, V., & Gupta, R. (2007). Blood pressure variation among Tibetans at different altitudes.
Annals of Human Biology, 34(4), 470-483.
Tyagi, R., Tungdim, M. G., Bhardwaj, S., & Kapoor, S. (2008). Age, altitude and gender
differences in body dimensions. Anthropologischer Anzeiger, 66, 419-434.
Vaidya, A. (2011). Tackling cardiovascular health and disease in Nepal: epidemiology, strategies
and implementation. Heart Asia, 3(1), 87-91.
Vaidya, A., Aryal, U. R., & Krettek, A. (2013). Cardiovascular health knowledge, attitude and
practice/behaviour in an urbanising community of Nepal: a population-based cross-
sectional study from Jhaukhel-Duwakot Health Demographic Surveillance Site. BMJ Open,
3(10), e002976. doi:10.1136/bmjopen-2013-002976
Vaidya, A., & Krettek, A. (2014). Physical activity level and its sociodemographic correlates in a
peri-urban Nepalese population: a cross-sectional study from the Jhaukhel-Duwakot health
demographic surveillance site. International Journal of Behavioral Nutrition and Physical
Activity, 11, 39. doi:10.1186/1479-5868-11-39
Vaidya, A., Pathak, R. P., & Pandey, M. R. (2012). Prevalence of hypertension in Nepalese
community triples in 25 years: a repeat cross-sectional study in rural Kathmandu. Indian
Heart Journal, 64(2), 128-131.
Vaidya, A., Pokharel, P. K., Nagesh, S., Karki, P., Kumar, S., & Majhi, S. (2005). Association of
obesity and physical activity in adult males of Dharan, Nepal. Kathmandu University
Medical Journal, 4(2), 192-197.
Vaidya, A., Pokharel, P. K., Nagesh, S., Karki, P., Kumar, S., & Majhi, S. (2009). Prevalence of
coronary heart disease in the urban adult males of eastern Nepal: a population-based
analytical cross-sectional study. Indian Heart Journal, 61(4), 341-347.
Vallerand, A., & Jacobs, I. (1990). Influence of cold exposure on plasma triglyceride clearance in
humans. Metabolism: Clinical and Experimental, 39(11), 1211-1218.
van den Bemd, G.-J., Pols, H. A., & van Leeuwen, J. P. (2000). Anti-tumor effects of 1, 25-
dihydroxyvitamin D3 and vitamin D analogs. Current Pharmaceutical Design, 6(7), 717-
732.
199
van Rooyen, J. M., Kruger, H. S., Huisman, H. W., Schutte, A. E., Malan, N. T., & Schutte, R.
(2005). Early cardiovascular changes in 10 to 15 year old stunted children: the transition
and health during urbanization in South Africa in children study. Nutrition, 21(7), 808-814.
Vats, P., Ray, K., Majumadar, D., Joseph, D. A., Bayen, S., Akunov, A., . . . Singh, S. B. (2013).
Changes in cardiovascular functions, lipid profile, and body composition at high altitude in
two different ethnic groups. High Altitude Medicine & Biology, 14(1), 45-52.
Vellakkal, S., Subramanian, S., Millett, C., Basu, S., Stuckler, D., & Ebrahim, S. (2013).
Socioeconomic inequalities in non-communicable diseases prevalence in India: disparities
between self-reported diagnoses and standardized measures. PloS One, 8(7), e68219.
doi:0.1371/journal.pone.0068219
Villareal, D. T., Chode, S., Parimi, N., Sinacore, D. R., Hilton, T., Armamento-Villareal, R., . . .
Shah, K. (2011). Weight loss, exercise, or both and physical function in obese older adults.
New England Journal of Medicine, 364(13), 1218-1229.
Virues-Ortega, J., Hogan, A. M., Baya-Botti, A., Kirkham, F. J., Baldeweg, T., Mahillo-Fernandez,
I., . . . Bucks, R. S. (2009). Survival and mortality in older adults living at high altitude in
Bolivia: a preliminary report. Journal of the American Geriatrics Society, 57(10), 1955-
1956.
Voors, A. W., & Johnson, W. D. (1979). Altitude and arteriosclerotic heart disease mortality in
white residents of 99 of the 100 largest cities in the United States. Journal of Chronic
Diseases, 32(1), 157-162.
Voss, J. D., Masuoka, P., Webber, B. J., Scher, A. I., & Atkinson, R. L. (2013). Association of
elevation, urbanization and ambient temperature with obesity prevalence in the United
States. International Journal of Obesity, 37(10), 1407-1412.
Wakabayashi, I., & Araki, Y. (2010). Influences of gender and age on relationships between
alcohol drinking and atherosclerotic risk factors. Alcoholism: Clinical and Experimental
Research, 34(s1), S54-S60.
Wannamethee, S., Shaper, A., & Whincup, P. (2005). Alcohol and adiposity: effects of quantity
and type of drink and time relation with meals. International Journal of Obesity, 29(12),
1436-1444.
Wasielewski, J. A., & Holloway, F. A. (2001). Alcohol’s interactions with circadian rhythms.
Alcohol Research & Health, 25, 94-100.
Weitz, C. A. (1982). Blood pressure at rest and during exercise among Sherpas and Tibetan
migrants in Nepal. Social Science and Medicine, 16(2), 223-231.
West, J. B. (2002). Highest permanent human habitation. High Altitude Medicine & Biology, 3(4),
401-407.
West, J. B. (2003a). Acclimatization to high altitude: truths and misconceptions. High Altitude
Medicine & Biology, 4(4), 401-402.
West, J. B. (2003b). Improving oxygenation at high altitude: acclimatization and O2 enrichment.
High Altitude Medicine & Biology, 4(3), 389-398.
West, J. B. (2011). Exciting times in the study of permanent residents of high altitude. High
Altitude Medicine & Biology, 12(1), 1-1.
Westman, E. C. (1995). Does smokeless tobacco cause hypertension? Southern Medical Journal,
88(7), 716-720.
200
Willey, J. Z., Xu, Q., Boden-Albala, B., Paik, M. C., Moon, Y. P., Sacco, R. L., & Elkind, M. S.
(2009). Lipid profile components and risk of ischemic stroke: the Northern Manhattan
Study (NOMAS). Archives of Neurology, 66(11), 1400-1406.
Williams, E. (1975). Mountaineering and the endocrine system. In C. Clarke, M. Ward, & E.
Williams (Eds.), Mountain medicine and physiology (pp. 38): Alpine Club, London.
Windsor, J. S., Rodway, G. W., & Montgomery, H. E. (2010). A review of electrocardiography in
the high altitude environment. High Altitude Medicine & Biology, 11(1), 51-60.
Woolcott, O. O., Ader, M., & Bergman, R. N. (2015). Glucose homeostasis during short-term and
prolonged exposure to high altitudes. Endocrine Reviews, 36(2), 149-173.
Woolcott, O. O., Castillo, O. A., Torres, J., Damas, L., & Florentini, E. (2002). Serum leptin levels
in dwellers from high altitude lands. High Altitude Medicine & Biology, 3(2), 245-246.
World Health Organisation. (1995). Physical status: the use and interpretation of anthropometry.
Report of a WHO expert committee. Retrieved from Geneva, Switzerland:
World Health Organization. (1995). Physical status: the use of and interpretation of
anthropometry, report of a WHO expert committee. Retrieved from Geneva, Switzerland:
http://apps.who.int/iris/handle/10665/37003
World Health Organization. (1997). Tobacco or health : A global status report. Retrieved from
Geneva, Switzerland: http://apps.who.int/iris/handle/10665/41922
World Health Organization. (2000). Obesity: preventing and managing the global epidemic (894).
Retrieved from Geneva, Switzerland: http://www.who.int/nutrition/publications/
obesity/WHO_TRS_894/en/
World Health Organization. (2003). Research report on NCD risk factors surveillance in Nepal,
2003. Retrieved from Kathmandu, Nepal: http://nhrc.org.np:8080/nhrc/handle/
123456789/524
World Health Organization. (2007a). Prevention of cardiovascular disease: pocket guidelines for
assessment and management of cardiovascular risk. Retrieved from Geneva, Switzerland:
http://www.who.int/cardiovascular_diseases/guidelines/Pocket_GL_information/en/
World Health Organization. (2007b). WHO expert committee on problems related to alcohol
consumption, (0512-3054). Retrieved from Geneva, Switzerland: http://www.who.int/
substance_abuse/expert_committee_alcohol/en/
World Health Organization. (2008). Waist circumference and waist-hip ratio, report of a WHO
expert consultation. Retrieved from Geneva, Switzerland: http://apps.who.int/iris/
bitstream/10665/44583/1/9789241501491_eng.pdf
World Health Organization. (2011). Non-communicable diseases country profiles 2011. Retrieved
from Geneva, Switzerland: http://www.who.int/nmh/publications/ncd_profiles2011/en/
World Health Organization. (2014a). Assessing national capacity for the prevention and control of
noncommunicable diseases. Report of the 2013 global survey. Retrieved from Geneva,
Switzerland: http://www.who.int/chp/ncd_capacity/en/
World Health Organization. (2014b). Global status report of noncommunicable disease 2014.
Retrieved from Geneva, Switzerland: http://www.who.int/nmh/publications/ncd-status-
report-2014/en/
201
World Health Organization. (2014c). Global status report on alcohol and health 2014. Retrieved
from Geneva, Switzerland: http://www.who.int/substance_abuse/publications/
global_alcohol_report/en/
World Health Organization. (2015a). Healthy diet. Retrieved from Geneva, Switzerland:
http://www.who.int/mediacentre/factsheets/fs394/en/
World Health Organization. (2015b). Obesity and overweight (311). Retrieved from Geneva,
Switzerland: http://www.who.int/mediacentre/factsheets/fs311/en/
World Health Organization. (2015c). Tobacco (339). Retrieved from Geneva, Switzerland:
http://www.who.int/mediacentre/factsheets/fs339/en/
World Health Organization : Joint WHO/FAO expert consultation. (2003). Diet, nutrition and the
prevention of chronic diseases. Retrieved from Geneva, Switzerland:
http://health.euroafrica.org/books/dietnutritionwho.pdf
Wright, S. M., & Aronne, L. J. (2012). Causes of obesity. Abdominal Imaging, 37(5), 730-732.
Wu, T.-Y. (2001). Take note of altitude gastrointestinal bleeding Newsletter of International
Society of Mountain Medicine (Vol. 10, pp. 9-11).
Wu, T.-Y., Ding, S.-Q., Liu, J.-L., Jia, J.-H., Chai, Z.-C., Dai, R.-C., . . . Kayser, B. (2012).
Smoking, acute mountain sickness and altitude acclimatisation: a cohort study. Thorax,
67(10), 914-919.
Wu, T.-Y., Ding, S. Q., Liu, J. L., Yu, M. T., Jia, J. H., Chai, Z. C., . . . Pan, L. (2007). Who should
not go high: chronic disease and work at altitude during construction of the Qinghai-Tibet
railroad. High Altitude Medicine & Biology, 8(2), 88-107.
Wu, T.-Y., & Kayser, B. (2006). High altitude adaptation in Tibetans. High Altitude Medicine &
Biology, 7(3), 193-208.
Xie, G., He, R.-R., Feng, X., Yan, T., Lan, F., Wu, M.-Z., & Kurihara, H. (2009). The
hypoglycemic effects of Camellia assamica var. kucha extract. Bioscience, Biotechnology,
and Biochemistry, 74(2), 405-407.
Xing, G., Qualls, C., Huicho, L., River-Ch, M., Stobdan, T., Slessarev, M., . . . Norboo, A. (2008).
Adaptation and mal-adaptation to ambient hypoxia; Andean, Ethiopian and Himalayan
patterns. PloS One, 3(6), e2342. doi:10.1371/journal.pone.0002342
Xu, G., Ma, M., Liu, X., & Hankey, G. J. (2013). Is there a stroke belt in China and why? Stroke,
44(7), 1775-1783.
Xu, S., Jiayong, Z., Li, B., Zhu, H., Chang, H., Shi, W., . . . Wang, J. (2015). Prevalence and
clustering of cardiovascular disease risk factors among Tibetan adults in China: a
population-based study. PloS One, 10(6), e0129966. doi:10.1371/journal.pone.0129966
Yang, J., He, Z., Zhai, H., Yan, Z., Zhang, H., & Qin, F. (1987). A study of the pulmonary artery
pressure in healthy people living at lowland and high altitude under exercise. Chinese
Journal of Cardiovascular Diseases, 15, 39-41.
Yao, Y., Cheng, X., Wang, S., Wang, L., & Ren, G. (2012). Influence of altitudinal variation on the
antioxidant and antidiabetic potential of Azuki bean (Vigna angularis). International
Journal of Food Sciences and Nutrition, 63(1), 117-124.
Yeomans, M. R. (2010). Alcohol, appetite and energy balance: is alcohol intake a risk factor for
obesity? Physiology and Behavior, 100(1), 82-89.
202
Yingzhong, Y., Droma, Y., Rili, G., & Kubo, K. (2006). Regulation of body weight by leptin, with
special reference to hypoxia-induced regulation. Internal Medicine, 45(16), 941-946.
Yoda, T., Crawshaw, L. I., Saito, K., Nakamura, M., Nagashima, K., & Kanosue, K. (2008).
Effects of alcohol on autonomic responses and thermal sensation during cold exposure in
humans. Alcohol, 42(3), 207-212.
Youk, A. O., Buchanich, J. M., Fryzek, J., Cunningham, M., & Marsh, G. M. (2012). An ecological
study of cancer mortality rates in high altitude counties of the United States. High Altitude
Medicine and Biology, 13(2), 98-104.
Zhang, A. J., Rimando, A. M., Fish, W., Mentreddy, S. R., & Mathews, S. T. (2012). Serviceberry
[Amelanchier alnifolia (Nutt.) Nutt. ex. M. Roem (Rosaceae)] leaf extract inhibits
mammalian α-glucosidase activity and suppresses postprandial glycemic response in a
mouse model of diet-induced obesity and hyperglycemia. Journal of Ethnopharmacology,
143(2), 481-487.
Zhang, H.-T., Gao, L., Ye, Y., Pang, Y., & Long, G. (2015). Association between local
population's lifestyle and the morbidity of cerebral stroke in Ganzi Tibetan state: a cross-
sectional study. Chinese Journal of Evidence-based Medicine, 15(1), 4-7.
Zhang, L., Qiao, Q., Tuomilehto, J., Janus, E. D., Lam, T. H., Ramachandran, A., . . . Nakagami, T.
(2010). Distinct ethnic differences in lipid profiles across glucose categories. The Journal
of Clinical Endocrinology & Metabolism, 95(4), 1793-1801.
Zhao, D. (1993). The epidemiology of coronary heart disease (CHD) in 16 provinces of China.
Multi-province Cooperative Group of Cardiovascular Disease Surveillance (MONICA
Project). Zhonghua Liu Xing Bing Xue Za Zhi, 14(1), 10-13.
Zhao, G., & Li, L. (1989). Analysis of the etiology and clinical characteristics of Tibetan cirrhosis
in Tibet. Chinese Journal of Internal Medicine, 28(9), 529-531, 571-522.
Zhao, X., Li, S., Ba, S., He, F., Li, N., Ke, L., . . . Zhou, Y. (2012). Prevalence, awareness,
treatment, and control of hypertension among herdsmen living at 4,300 m in Tibet.
American Journal of Hypertension, 25(5), 583-589.
Zhao, X., Yin, X., Li, X., Yan, L. L., Lam, C. T., Li, S., . . . Luobu, G. (2014). Using a low-sodium,
high-potassium salt substitute to reduce blood pressure among Tibetans with high blood
pressure: a patient-blinded randomized controlled trial. PloS One, 9(10), e110131.
doi:10.1371/journal.pone.0110131
Zheng, J.-Y., Tian, H.-T., Zhu, Z.-M., Li, B., Han, L., Jiang, S.-L., . . . Zhao, Z. (2013). Prevalence
of symptomatic congenital heart disease in Tibetan school children. American Journal of
Cardiology, 112(9), 1468-1470.
Zheng, X., Yao, D.-K., Zhuo-Ma, C.-R., Tang, J., Wang, T.-R., Zhang, H.-H., & Wang, L.-X.
(2012). Prevalence, self-awareness, treatment, and control of hypertension in Lhasa, Tibet.
Clinical and Experimental Hypertension, 34(5), 328-333.
Zhou, M., Wang, H., Zhu, J., Chen, W., Wang, L., Liu, S., . . . Yin, P. (2016). Cause-specific
mortality for 240 causes in China during 1990–2013: a systematic subnational analysis for
the Global Burden of Disease Study 2013. The Lancet, 387(10015), 251-272.
Zhu, K.-F., Wang, Y.-M., Zhu, J.-Z., Zhou, Q.-Y., & Wang, N.-F. (2015). National prevalence of
coronary heart disease and its relationship with human development index: a systematic
review. European Journal of Preventive Cardiology. doi:10.1177/2047487315587402
203
Zuppinger, K., Teuscher, A., & Lüscher, R. (1975). Frequency of juvenile diabetes mellitus in the
Canton Bern (Switzerland). Schweizerische medizinische Wochenschrift, 105(38), 1218-
1223.
204
Appendices
Appendix A: Modified WHO NCD STEPS Questionnaire
Appendix B: Questionnaire for Verifying Stroke Free Status
Appendix C: Participant Information Sheet
Appendix D: Participant Consent form
205
Appendix A: Modified WHO NCD STEPS Questionnaire
WHO STEPS Instrument (Core and Expanded)
The WHO STEPwise approach to noncommunicable disease risk factor surveillance (STEPS)
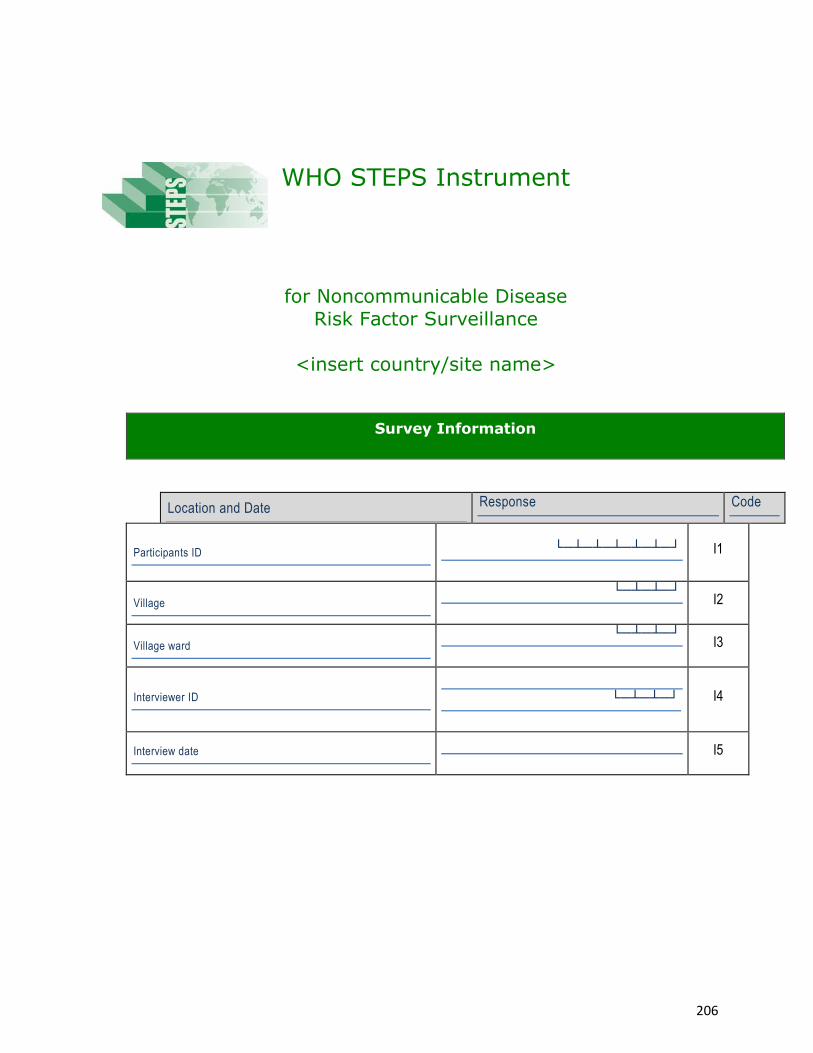
206
WHO STEPS Instrument
for Noncommunicable Disease
Risk Factor Surveillance
<insert country/site name>
Survey Information
Location and Date Response Code
Participants ID
└─┴─┴─┴─┴─┴─┘ I1
Village └─┴─┴─┘
I2
Village ward └─┴─┴─┘
I3
Interviewer ID
└─┴─┴─┘ I4
Interview date
I5
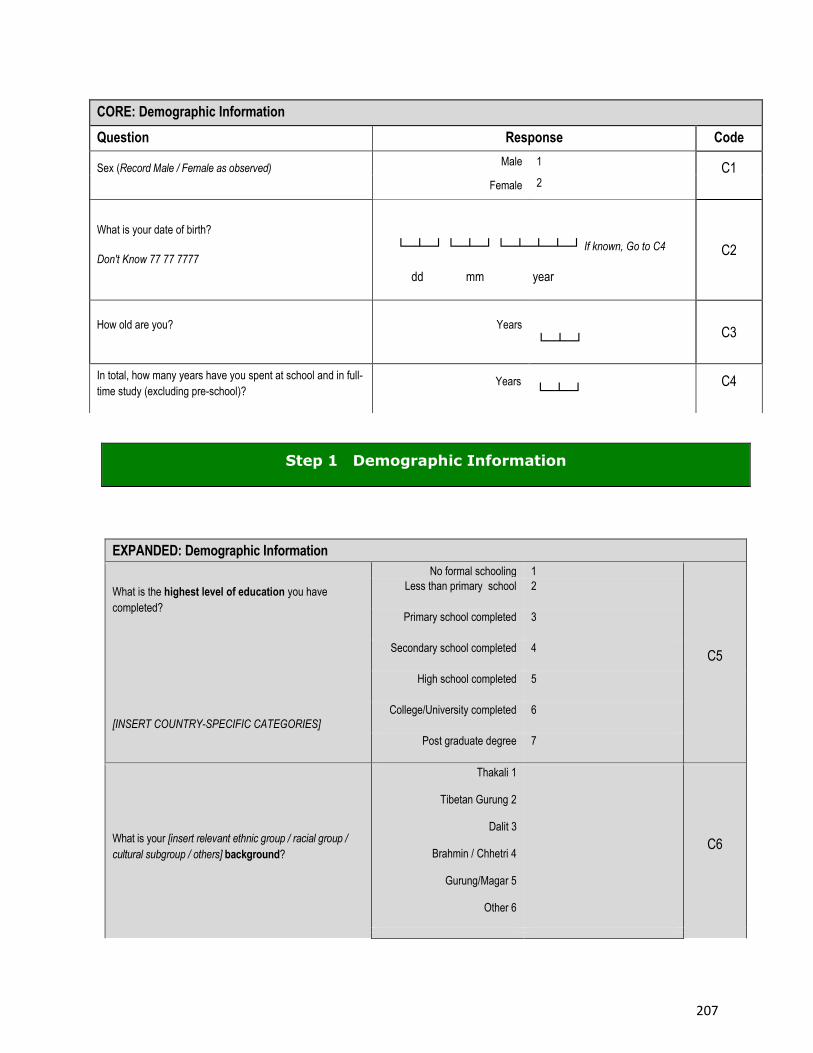
207
Step 1 Demographic Information
EXPANDED: Demographic Information
What is the highest level of education you have
completed?
[INSERT COUNTRY-SPECIFIC CATEGORIES]
No formal schooling 1
C5
Less than primary school 2
Primary school completed 3
Secondary school completed 4
High school completed 5
College/University completed 6
Post graduate degree 7
What is your [insert relevant ethnic group / racial group /
cultural subgroup / others] background?
Thakali 1
Tibetan Gurung 2
Dalit 3
Brahmin / Chhetri 4
Gurung/Magar 5
Other 6
C6
CORE: Demographic Information
Question Response Code
Sex (Record Male / Female as observed) Male 1
C1 Female 2
What is your date of birth?
Don't Know 77 77 7777
└─┴─┘ └─┴─┘ └─┴─┴─┴─┘ If known, Go to C4
dd mm year
C2
How old are you? Years
└─┴─┘ C3
In total, how many years have you spent at school and in full-
time study (excluding pre-school)? Years
└─┴─┘ C4
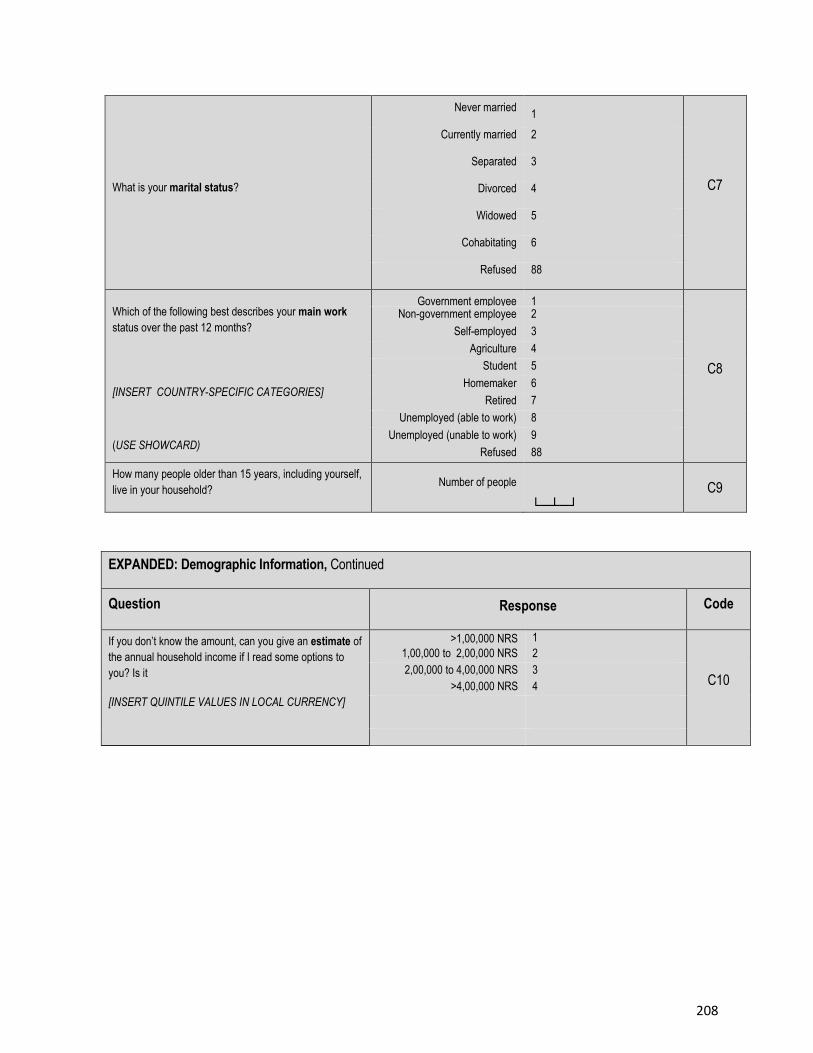
208
What is your marital status?
Never married 1
C7
Currently married 2
Separated 3
Divorced 4
Widowed 5
Cohabitating 6
Refused 88
Which of the following best describes your main work
status over the past 12 months?
[INSERT COUNTRY-SPECIFIC CATEGORIES]
(USE SHOWCARD)
Government employee 1
C8
Non-government employee 2
Self-employed 3
Agriculture 4
Student 5
Homemaker 6
Retired 7
Unemployed (able to work) 8
Unemployed (unable to work) 9
Refused 88
How many people older than 15 years, including yourself,
live in your household? Number of people
└─┴─┘
C9
EXPANDED: Demographic Information, Continued
Question Response Code
If you don’t know the amount, can you give an estimate of
the annual household income if I read some options to
you? Is it
[INSERT QUINTILE VALUES IN LOCAL CURRENCY]
(READ OPTIONS)
>1,00,000 NRS 1
C10
1,00,000 to 2,00,000 NRS 2
2,00,000 to 4,00,000 NRS 3
>4,00,000 NRS 4
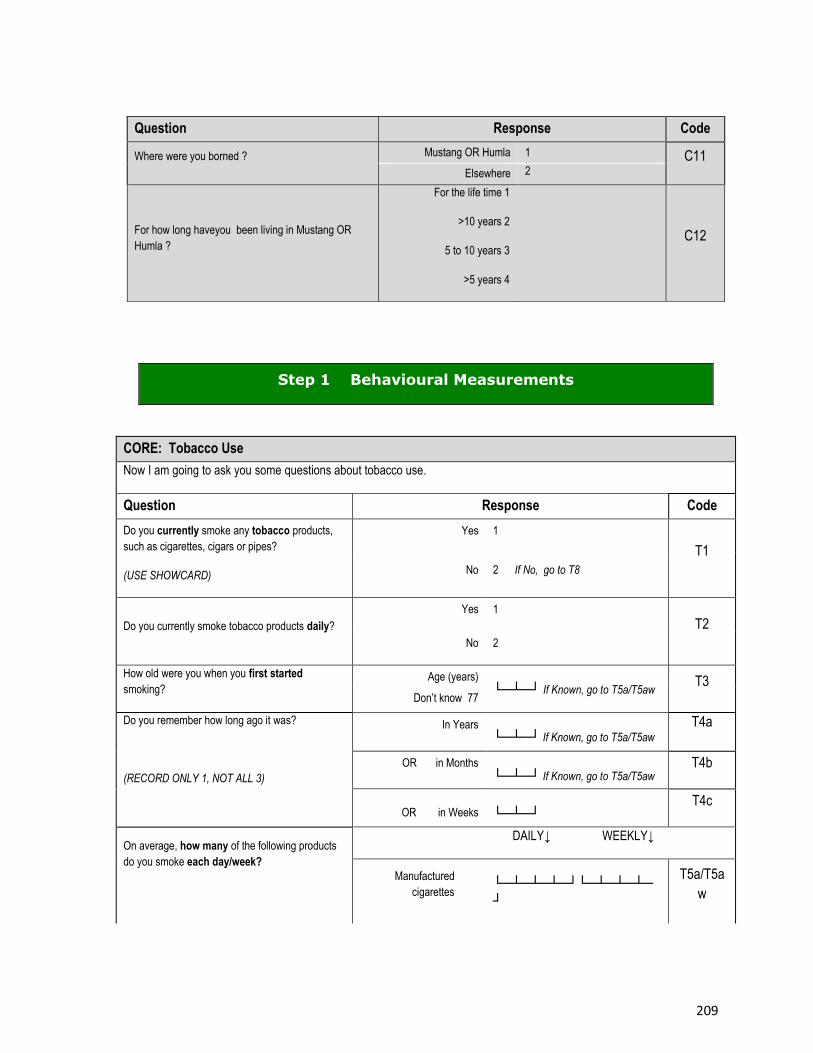
209
CORE: Tobacco Use
Now I am going to ask you some questions about tobacco use.
Question Response Code
Do you currently smoke any tobacco products,
such as cigarettes, cigars or pipes?
(USE SHOWCARD)
Yes 1
T1
No 2 If No, go to T8
Do you currently smoke tobacco products daily?
Yes 1
T2
No 2
How old were you when you first started
smoking? Age (years)
└─┴─┘ If Known, go to T5a/T5aw T3
Don’t know 77
Do you remember how long ago it was?
(RECORD ONLY 1, NOT ALL 3)
Don’t know 77
In Years └─┴─┘ If Known, go to T5a/T5aw
T4a
OR in Months
└─┴─┘ If Known, go to T5a/T5aw T4b
OR in Weeks └─┴─┘ T4c
On average, how many of the following products
do you smoke each day/week?
DAILY↓ WEEKLY↓
Manufactured
cigarettes └─┴─┴─┴─┘└─┴─┴─┴─
┘
T5a/T5a
w
Question Response Code
Where were you borned ? Mustang OR Humla 1 C11 Elsewhere 2
For how long haveyou been living in Mustang OR
Humla ?
For the life time 1
>10 years 2
5 to 10 years 3
>5 years 4
C12
Step 1 Behavioural Measurements
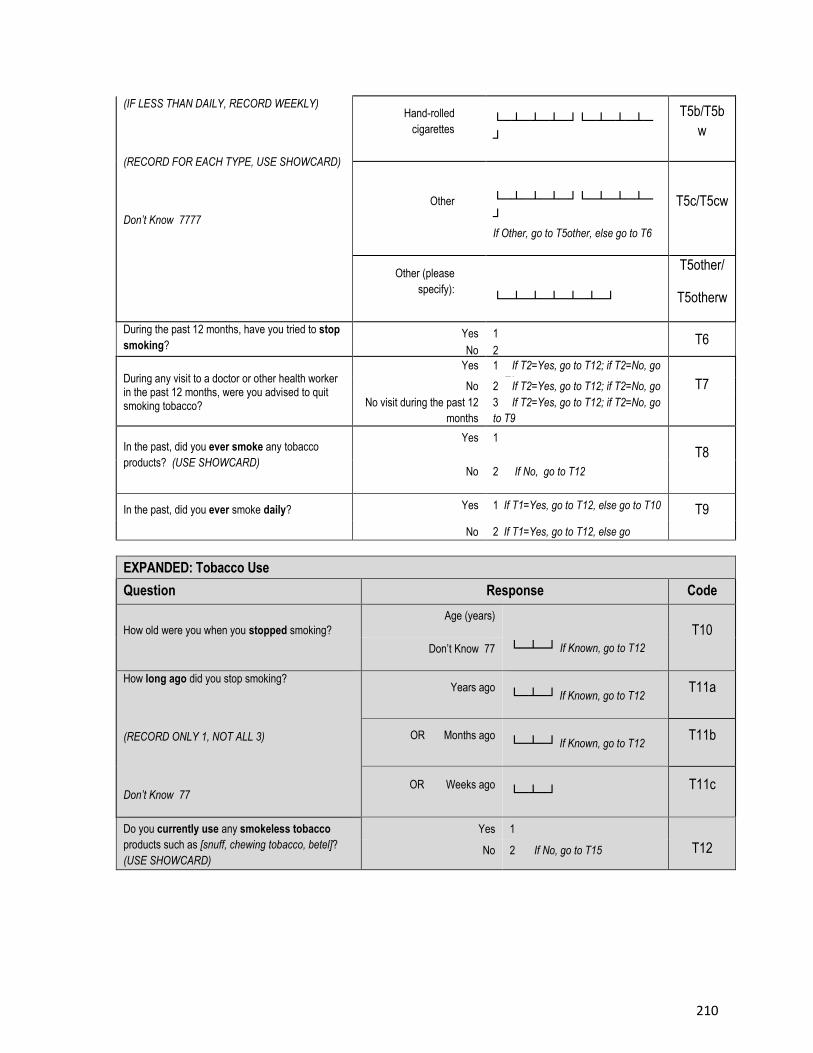
210
(IF LESS THAN DAILY, RECORD WEEKLY)
(RECORD FOR EACH TYPE, USE SHOWCARD)
Don’t Know 7777
Hand-rolled
cigarettes └─┴─┴─┴─┘└─┴─┴─┴─
┘
T5b/T5b
w
Other
└─┴─┴─┴─┘└─┴─┴─┴─
┘
If Other, go to T5other, else go to T6
T5c/T5cw
Other (please
specify): └─┴─┴─┴─┴─┴─┘
T5other/
T5otherw
During the past 12 months, have you tried to stop
smoking? Yes 1 T6 No 2
During any visit to a doctor or other health worker in the past 12 months, were you advised to quit smoking tobacco?
Yes 1 If T2=Yes, go to T12; if T2=No, go
to T9 T7 No 2 If T2=Yes, go to T12; if T2=No, go
to T9 No visit during the past 12
months
3 If T2=Yes, go to T12; if T2=No, go
to T9
In the past, did you ever smoke any tobacco
products? (USE SHOWCARD)
Yes 1
T8
No 2 If No, go to T12
In the past, did you ever smoke daily? Yes 1 If T1=Yes, go to T12, else go to T10 T9
No 2 If T1=Yes, go to T12, else go
to T10
EXPANDED: Tobacco Use
Question Response Code
How old were you when you stopped smoking?
Age (years)
└─┴─┘ If Known, go to T12
T10
Don’t Know 77
How long ago did you stop smoking?
(RECORD ONLY 1, NOT ALL 3)
Don’t Know 77
Years ago └─┴─┘ If Known, go to T12
T11a
OR Months ago └─┴─┘ If Known, go to T12
T11b
OR Weeks ago └─┴─┘
T11c
Do you currently use any smokeless tobacco
products such as [snuff, chewing tobacco, betel]?
(USE SHOWCARD)
Yes 1
T12 No 2 If No, go to T15
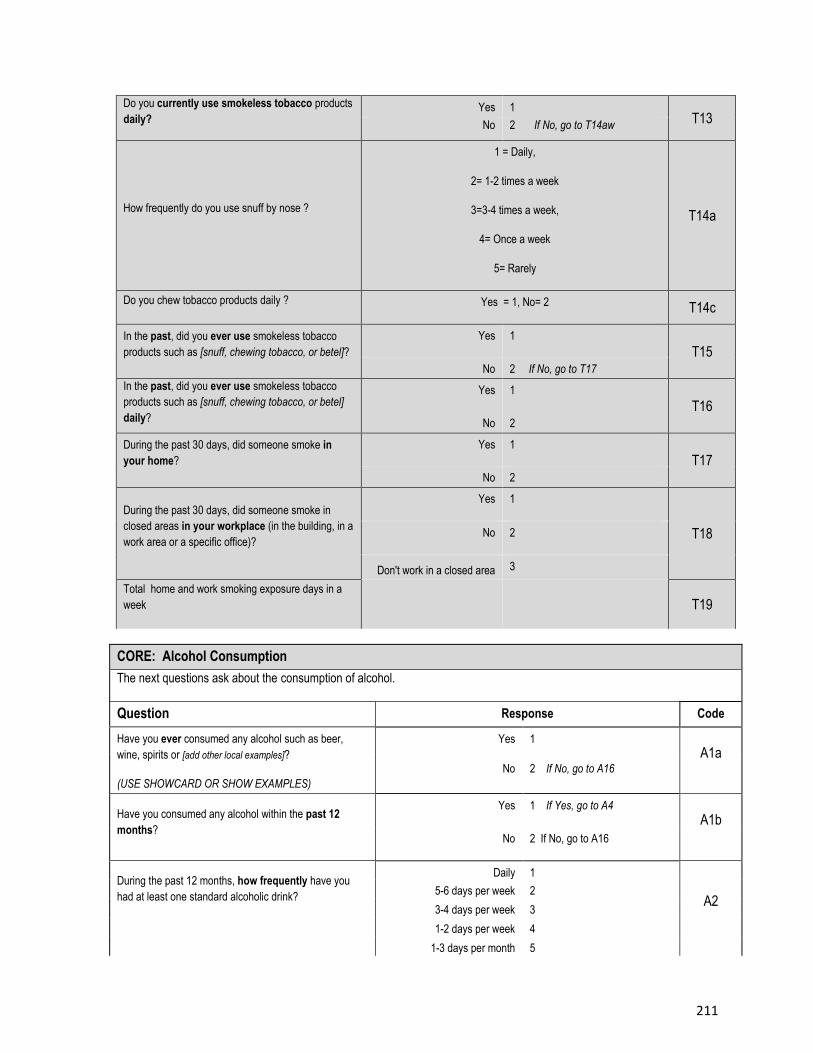
211
Do you currently use smokeless tobacco products
daily? Yes 1
T13 No 2 If No, go to T14aw
How frequently do you use snuff by nose ?
1 = Daily,
2= 1-2 times a week
3=3-4 times a week,
4= Once a week
5= Rarely
T14a
Do you chew tobacco products daily ? Yes = 1, No= 2 T14c
In the past, did you ever use smokeless tobacco
products such as [snuff, chewing tobacco, or betel]?
Yes 1
T15
No 2 If No, go to T17
In the past, did you ever use smokeless tobacco
products such as [snuff, chewing tobacco, or betel]
daily?
Yes 1
T16
No 2
During the past 30 days, did someone smoke in
your home?
Yes 1
T17
No 2
During the past 30 days, did someone smoke in
closed areas in your workplace (in the building, in a
work area or a specific office)?
Yes 1
T18 No 2
Don't work in a closed area 3
Total home and work smoking exposure days in a
week T19
CORE: Alcohol Consumption
The next questions ask about the consumption of alcohol.
Question Response Code
Have you ever consumed any alcohol such as beer,
wine, spirits or [add other local examples]?
(USE SHOWCARD OR SHOW EXAMPLES)
Yes 1
A1a No 2 If No, go to A16
Have you consumed any alcohol within the past 12
months?
Yes 1 If Yes, go to A4
A1b
No 2 If No, go to A16
During the past 12 months, how frequently have you
had at least one standard alcoholic drink?
Daily 1
A2 5-6 days per week 2
3-4 days per week 3
1-2 days per week 4
1-3 days per month 5
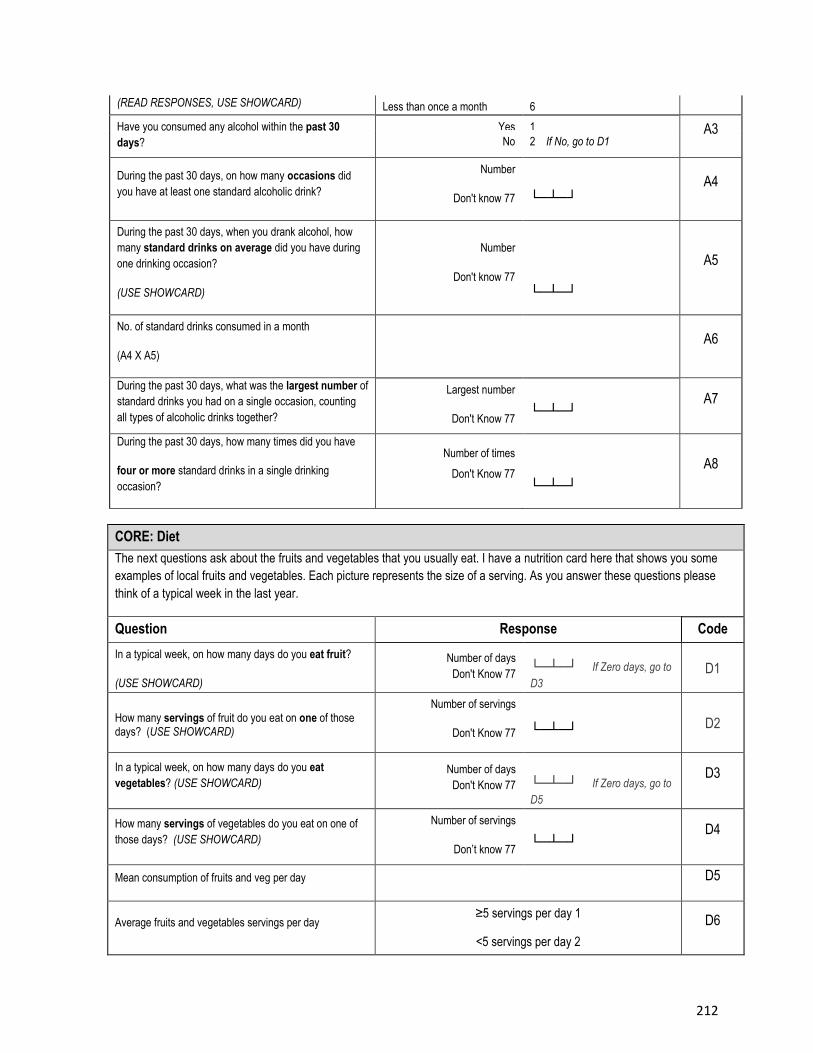
212
(READ RESPONSES, USE SHOWCARD) Less than once a month 6
Have you consumed any alcohol within the past 30
days?
Yes 1 A3 No 2 If No, go to D1
During the past 30 days, on how many occasions did
you have at least one standard alcoholic drink?
Number
Don't know 77 └─┴─┘
A4
During the past 30 days, when you drank alcohol, how
many standard drinks on average did you have during
one drinking occasion?
(USE SHOWCARD)
Number
Don't know 77
└─┴─┘
A5
No. of standard drinks consumed in a month
(A4 X A5)
A6
During the past 30 days, what was the largest number of
standard drinks you had on a single occasion, counting
all types of alcoholic drinks together?
Largest number
Don't Know 77 └─┴─┘
A7
During the past 30 days, how many times did you have
four or more standard drinks in a single drinking
occasion?
Number of times
Don't Know 77 └─┴─┘
A8
CORE: Diet
The next questions ask about the fruits and vegetables that you usually eat. I have a nutrition card here that shows you some
examples of local fruits and vegetables. Each picture represents the size of a serving. As you answer these questions please
think of a typical week in the last year.
Question Response Code
In a typical week, on how many days do you eat fruit?
(USE SHOWCARD)
Number of days
Don't Know 77 └─┴─┘ If Zero days, go to
D3
D1
How many servings of fruit do you eat on one of those days? (USE SHOWCARD)
Number of servings
Don't Know 77 └─┴─┘ D2
In a typical week, on how many days do you eat
vegetables? (USE SHOWCARD) Number of days
Don't Know 77 └─┴─┘ If Zero days, go to
D5
D3
How many servings of vegetables do you eat on one of
those days? (USE SHOWCARD)
Number of servings
Don’t know 77 └─┴─┘
D4
Mean consumption of fruits and veg per day D5
Average fruits and vegetables servings per day ≥5 servings per day 1
<5 servings per day 2
< 5 servings per day 2
D6
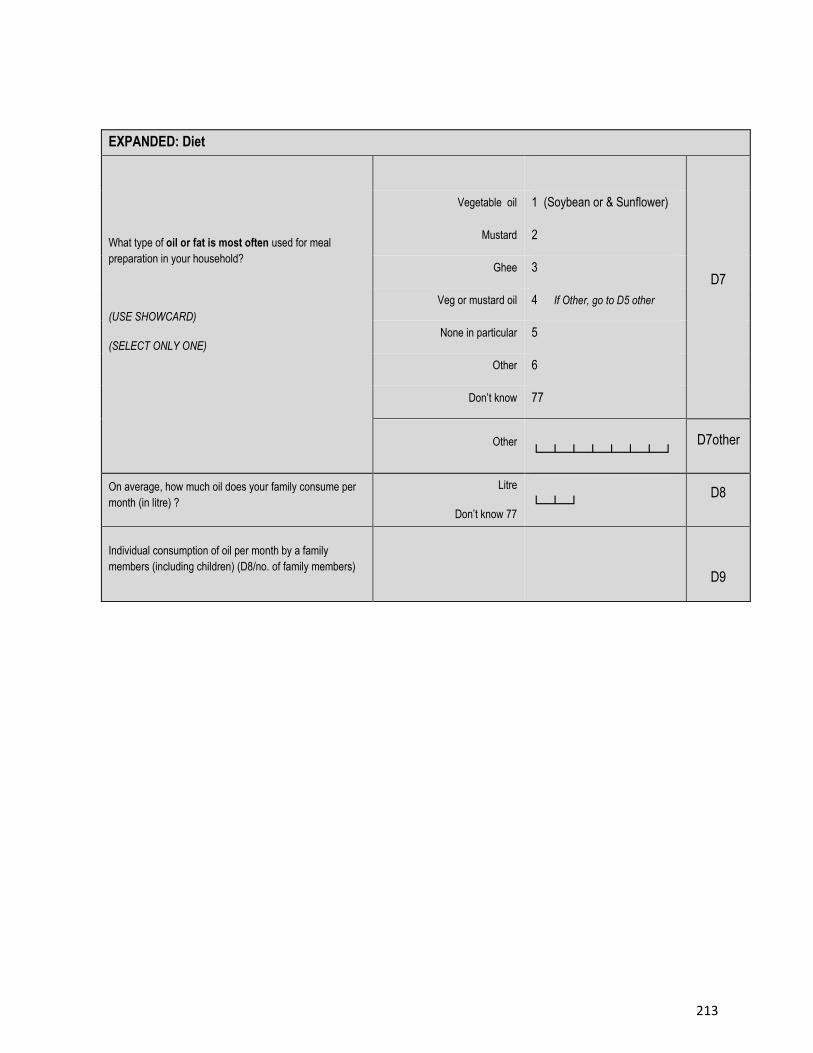
213
EXPANDED: Diet
What type of oil or fat is most often used for meal
preparation in your household?
(USE SHOWCARD)
(SELECT ONLY ONE)
D7
Vegetable oil 1 (Soybean or & Sunflower)
Mustard 2
Ghee 3
Veg or mustard oil 4 If Other, go to D5 other
None in particular 5
Other 6
Don’t know 77
Other
└─┴─┴─┴─┴─┴─┴─┘ D7other
On average, how much oil does your family consume per
month (in litre) ?
Litre
Don’t know 77 └─┴─┘
D8
Individual consumption of oil per month by a family
members (including children) (D8/no. of family members)
D9
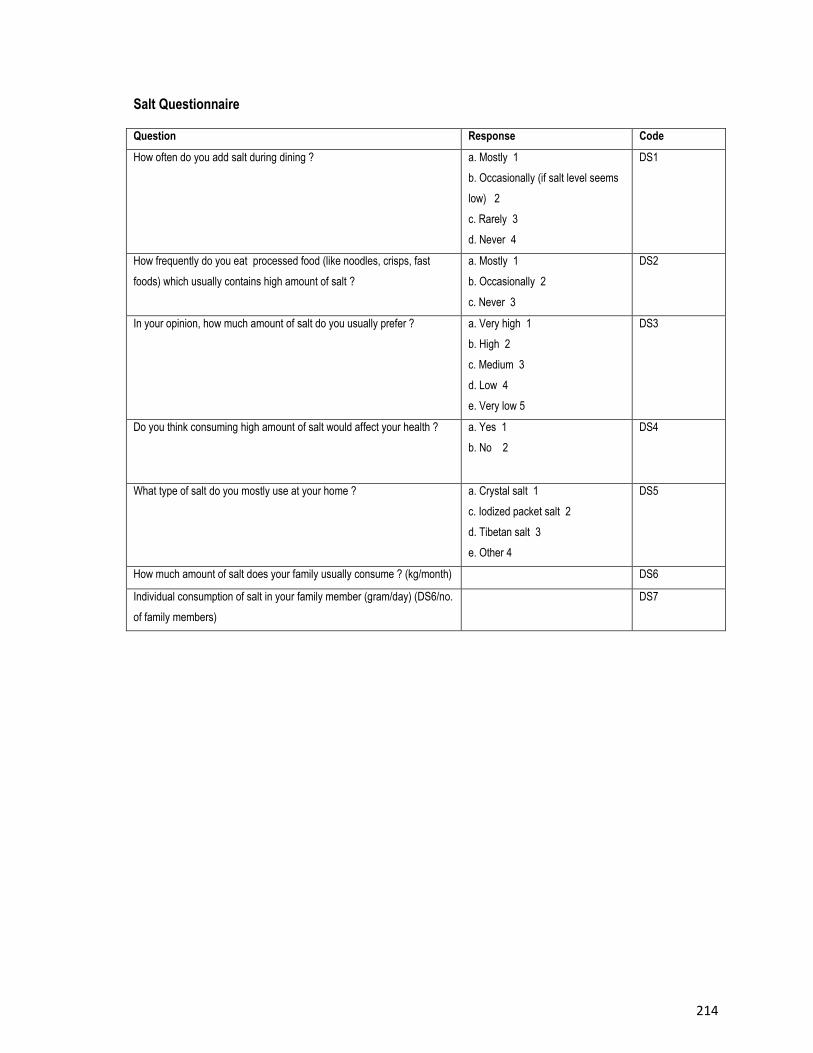
214
Salt Questionnaire
Question Response Code
How often do you add salt during dining ? a. Mostly 1
b. Occasionally (if salt level seems
low) 2
c. Rarely 3
d. Never 4
DS1
How frequently do you eat processed food (like noodles, crisps, fast
foods) which usually contains high amount of salt ?
a. Mostly 1
b. Occasionally 2
c. Never 3
DS2
In your opinion, how much amount of salt do you usually prefer ? a. Very high 1
b. High 2
c. Medium 3
d. Low 4
e. Very low 5
DS3
Do you think consuming high amount of salt would affect your health ? a. Yes 1
b. No 2
DS4
What type of salt do you mostly use at your home ? a. Crystal salt 1
c. Iodized packet salt 2
d. Tibetan salt 3
e. Other 4
DS5
How much amount of salt does your family usually consume ? (kg/month) DS6
Individual consumption of salt in your family member (gram/day) (DS6/no.
of family members)
DS7
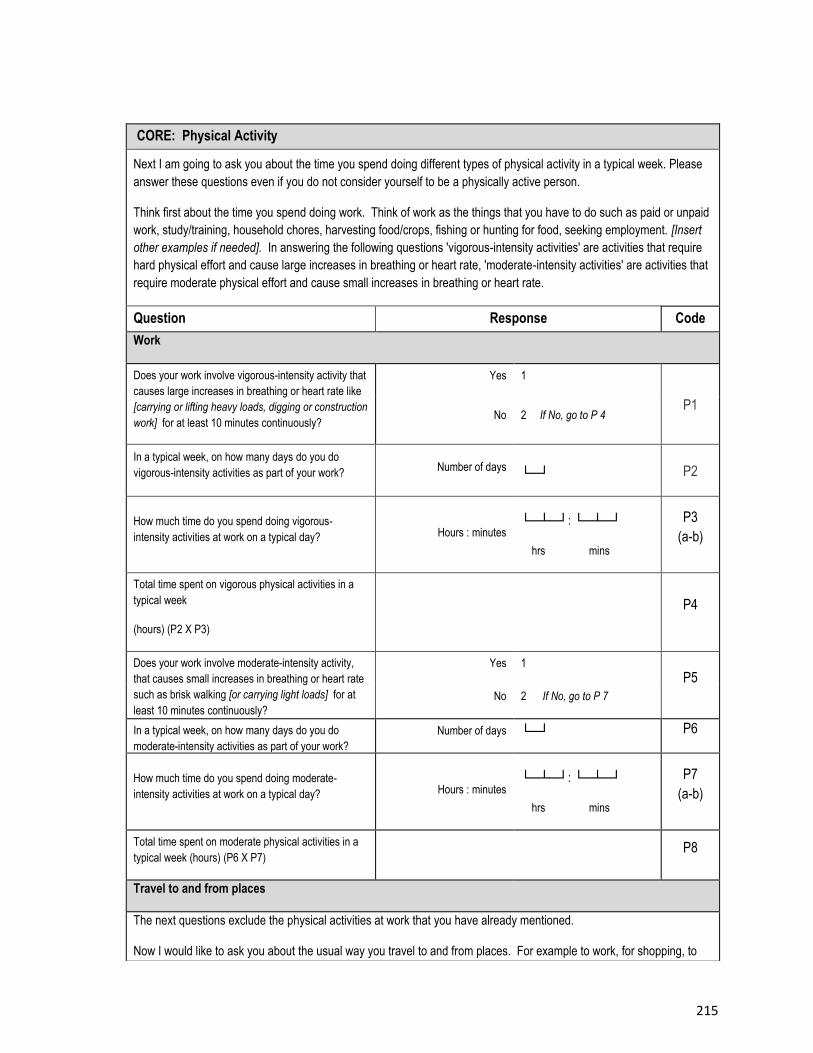
215
CORE: Physical Activity
Next I am going to ask you about the time you spend doing different types of physical activity in a typical week. Please
answer these questions even if you do not consider yourself to be a physically active person.
Think first about the time you spend doing work. Think of work as the things that you have to do such as paid or unpaid
work, study/training, household chores, harvesting food/crops, fishing or hunting for food, seeking employment. [Insert
other examples if needed]. In answering the following questions 'vigorous-intensity activities' are activities that require
hard physical effort and cause large increases in breathing or heart rate, 'moderate-intensity activities' are activities that
require moderate physical effort and cause small increases in breathing or heart rate.
Question Response Code
Work
Does your work involve vigorous-intensity activity that
causes large increases in breathing or heart rate like
[carrying or lifting heavy loads, digging or construction
work] for at least 10 minutes continuously?
[INSERT EXAMPLES] (USE SHOWCARD)
Yes 1
P1 No 2 If No, go to P 4
In a typical week, on how many days do you do
vigorous-intensity activities as part of your work? Number of days
└─┘ P2
How much time do you spend doing vigorous-
intensity activities at work on a typical day? Hours : minutes └─┴─┘: └─┴─┘
hrs mins
P3
(a-b)
Total time spent on vigorous physical activities in a
typical week
(hours) (P2 X P3)
P4
Does your work involve moderate-intensity activity,
that causes small increases in breathing or heart rate
such as brisk walking [or carrying light loads] for at
least 10 minutes continuously?
[INSERT EXAMPLES] (USE SHOWCARD)
Yes 1
P5
No 2 If No, go to P 7
In a typical week, on how many days do you do
moderate-intensity activities as part of your work?
Number of days └─┘ P6
How much time do you spend doing moderate-
intensity activities at work on a typical day? Hours : minutes └─┴─┘: └─┴─┘
hrs mins
P7
(a-b)
Total time spent on moderate physical activities in a
typical week (hours) (P6 X P7) P8
Travel to and from places
The next questions exclude the physical activities at work that you have already mentioned.
Now I would like to ask you about the usual way you travel to and from places. For example to work, for shopping, to
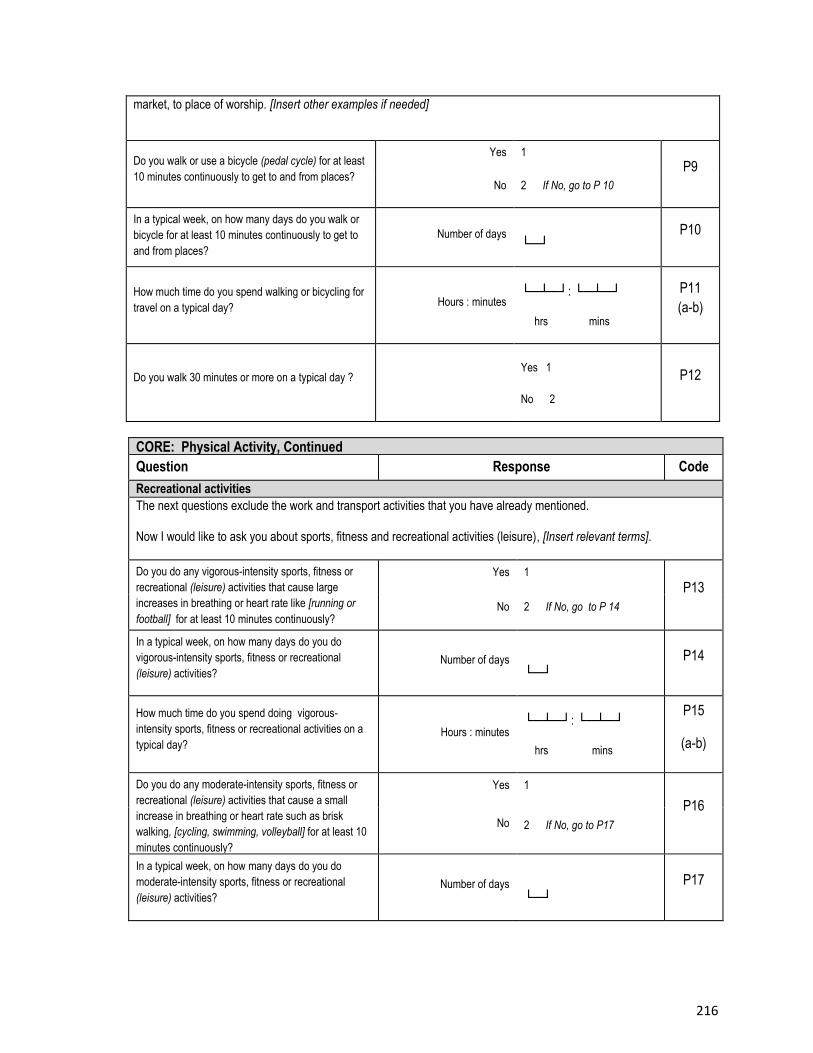
216
CORE: Physical Activity, Continued
Question Response Code
Recreational activities
The next questions exclude the work and transport activities that you have already mentioned.
Now I would like to ask you about sports, fitness and recreational activities (leisure), [Insert relevant terms].
Do you do any vigorous-intensity sports, fitness or
recreational (leisure) activities that cause large
increases in breathing or heart rate like [running or
football] for at least 10 minutes continuously?
[INSERT EXAMPLES] (USE SHOWCARD)
Yes 1
P13
No 2 If No, go to P 14
In a typical week, on how many days do you do
vigorous-intensity sports, fitness or recreational
(leisure) activities? Number of days
└─┘
P14
How much time do you spend doing vigorous-
intensity sports, fitness or recreational activities on a
typical day? Hours : minutes
└─┴─┘: └─┴─┘
hrs mins
P15
(a-b)
Do you do any moderate-intensity sports, fitness or
recreational (leisure) activities that cause a small
increase in breathing or heart rate such as brisk
walking, [cycling, swimming, volleyball] for at least 10
minutes continuously?
[INSERT EXAMPLES] (USE SHOWCARD)
Yes 1
P16 No 2 If No, go to P17
In a typical week, on how many days do you do
moderate-intensity sports, fitness or recreational
(leisure) activities? Number of days
└─┘
P17
market, to place of worship. [Insert other examples if needed]
Do you walk or use a bicycle (pedal cycle) for at least
10 minutes continuously to get to and from places?
Yes 1
P9
No 2 If No, go to P 10
In a typical week, on how many days do you walk or
bicycle for at least 10 minutes continuously to get to
and from places?
Number of days └─┘
P10
How much time do you spend walking or bicycling for
travel on a typical day? Hours : minutes
└─┴─┘: └─┴─┘
hrs mins
P11
(a-b)
Do you walk 30 minutes or more on a typical day ? Yes 1
No 2
P12
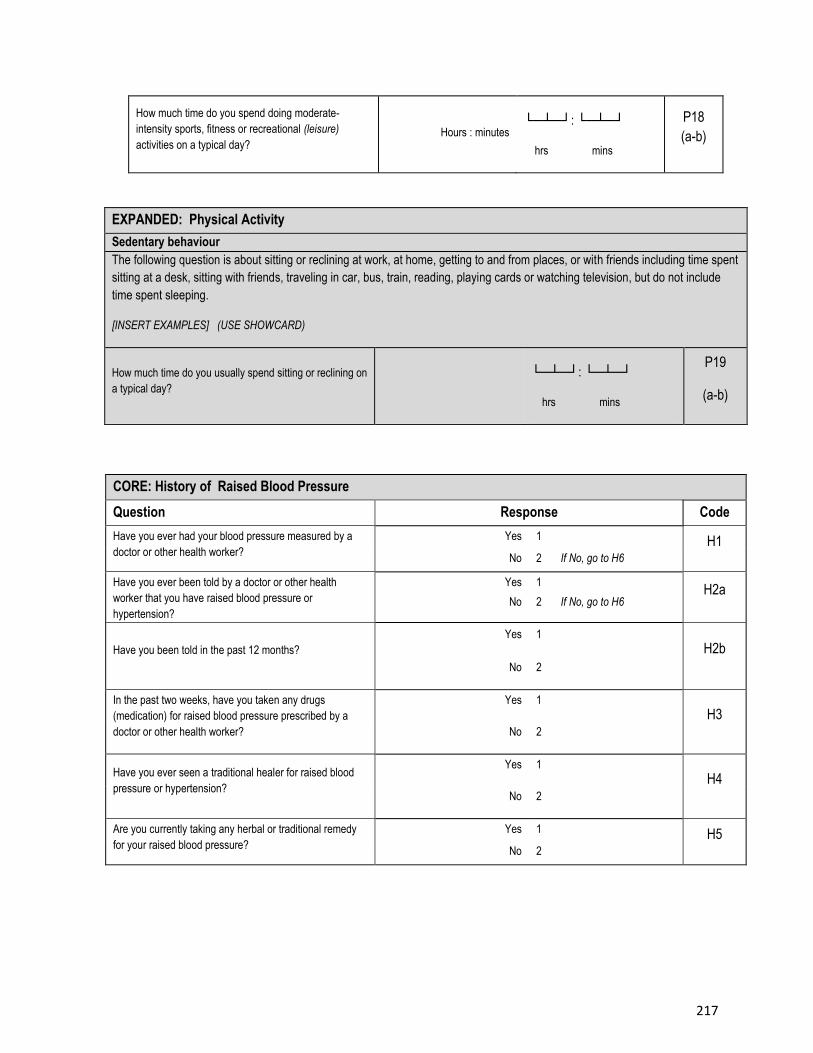
217
How much time do you spend doing moderate-
intensity sports, fitness or recreational (leisure)
activities on a typical day? Hours : minutes
└─┴─┘: └─┴─┘
hrs mins
P18
(a-b)
EXPANDED: Physical Activity
Sedentary behaviour
The following question is about sitting or reclining at work, at home, getting to and from places, or with friends including time spent
sitting at a desk, sitting with friends, traveling in car, bus, train, reading, playing cards or watching television, but do not include
time spent sleeping.
[INSERT EXAMPLES] (USE SHOWCARD)
How much time do you usually spend sitting or reclining on
a typical day? └─┴─┘: └─┴─┘
hrs mins
P19
(a-b)
CORE: History of Raised Blood Pressure
Question Response Code
Have you ever had your blood pressure measured by a
doctor or other health worker?
Yes 1 H1 No 2 If No, go to H6
Have you ever been told by a doctor or other health
worker that you have raised blood pressure or
hypertension?
Yes 1 H2a
No 2 If No, go to H6
Have you been told in the past 12 months?
Yes 1
H2b
No 2
In the past two weeks, have you taken any drugs
(medication) for raised blood pressure prescribed by a
doctor or other health worker?
Yes 1
H3
No 2
Have you ever seen a traditional healer for raised blood
pressure or hypertension?
Yes 1
H4
No 2
Are you currently taking any herbal or traditional remedy
for your raised blood pressure?
Yes 1 H5
No 2
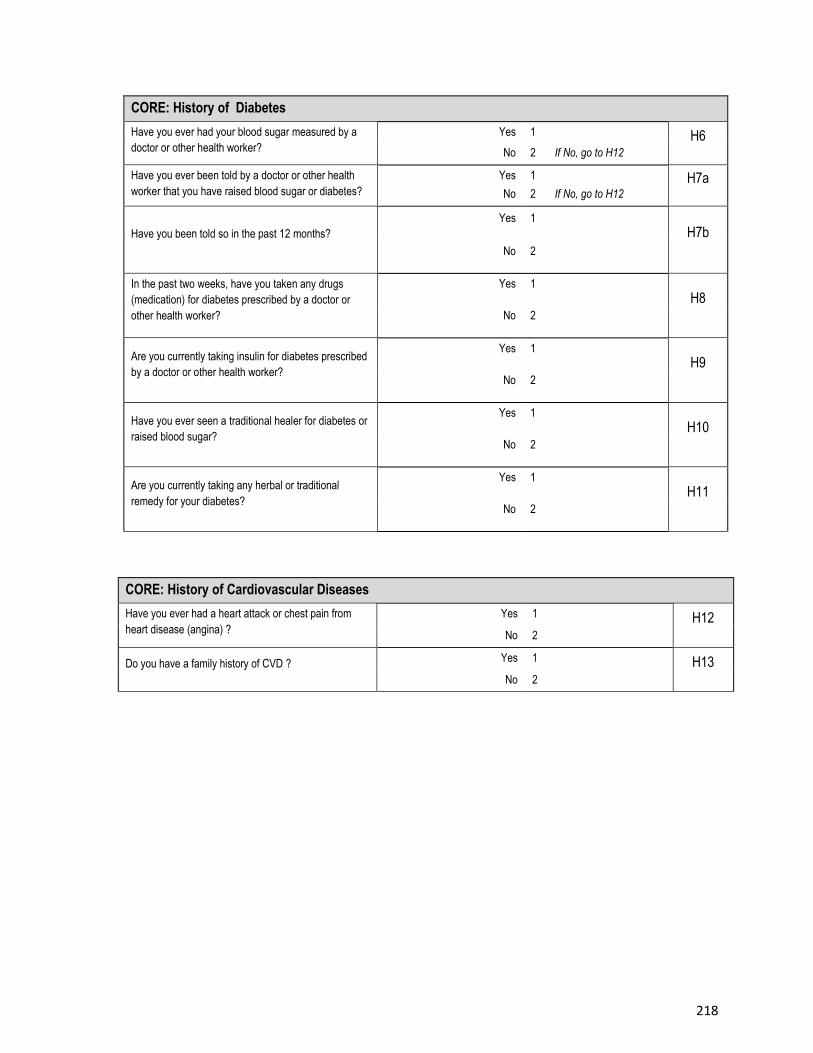
218
CORE: History of Diabetes
Have you ever had your blood sugar measured by a
doctor or other health worker?
Yes 1 H6 No 2 If No, go to H12
Have you ever been told by a doctor or other health
worker that you have raised blood sugar or diabetes?
Yes 1 H7a No 2 If No, go to H12
Have you been told so in the past 12 months?
Yes 1
H7b
No 2
In the past two weeks, have you taken any drugs
(medication) for diabetes prescribed by a doctor or
other health worker?
Yes 1
H8
No 2
Are you currently taking insulin for diabetes prescribed
by a doctor or other health worker?
Yes 1
H9
No 2
Have you ever seen a traditional healer for diabetes or
raised blood sugar?
Yes 1
H10
No 2
Are you currently taking any herbal or traditional
remedy for your diabetes?
Yes 1
H11
No 2
CORE: History of Cardiovascular Diseases
Have you ever had a heart attack or chest pain from
heart disease (angina) ?
Yes 1 H12 No 2
Do you have a family history of CVD ? Yes 1 H13 No 2
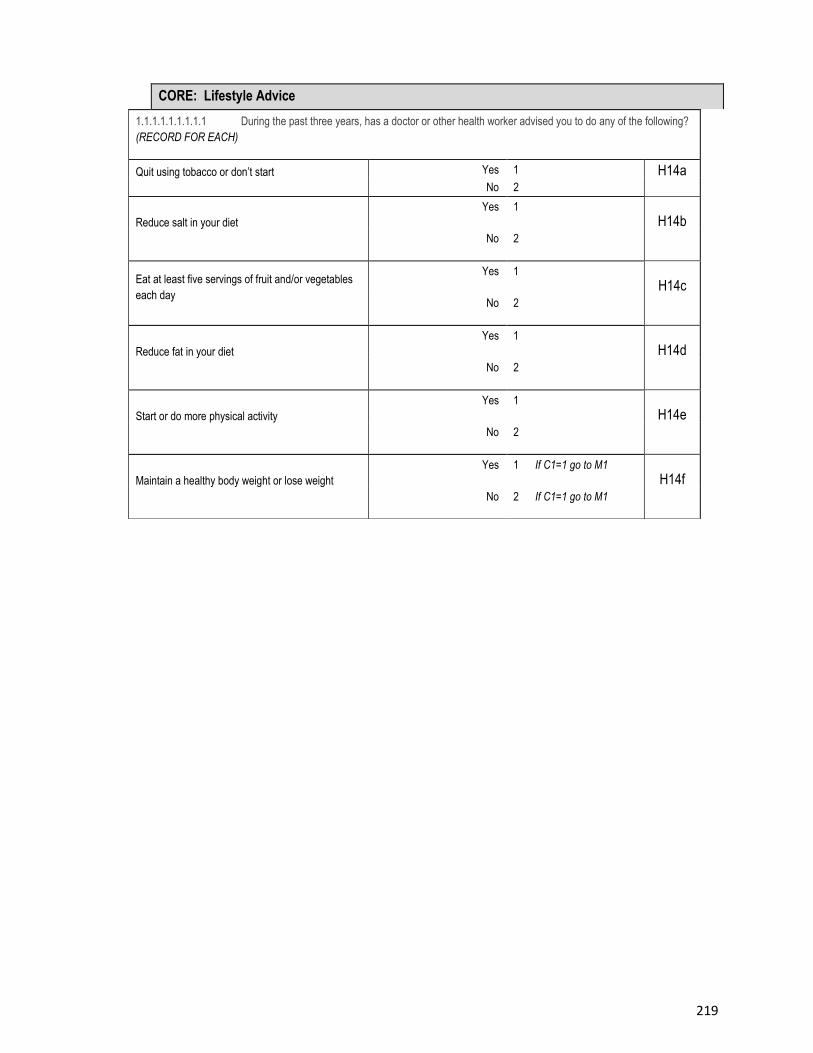
219
CORE: Lifestyle Advice
1.1.1.1.1.1.1.1.1 During the past three years, has a doctor or other health worker advised you to do any of the following?
(RECORD FOR EACH)
Quit using tobacco or don’t start Yes 1 H14a No 2
Reduce salt in your diet
Yes 1
H14b No 2
Eat at least five servings of fruit and/or vegetables
each day
Yes 1
H14c
No 2
Reduce fat in your diet
Yes 1
H14d
No 2
Start or do more physical activity
Yes 1
H14e
No 2
Maintain a healthy body weight or lose weight
Yes 1 If C1=1 go to M1
H14f No 2 If C1=1 go to M1
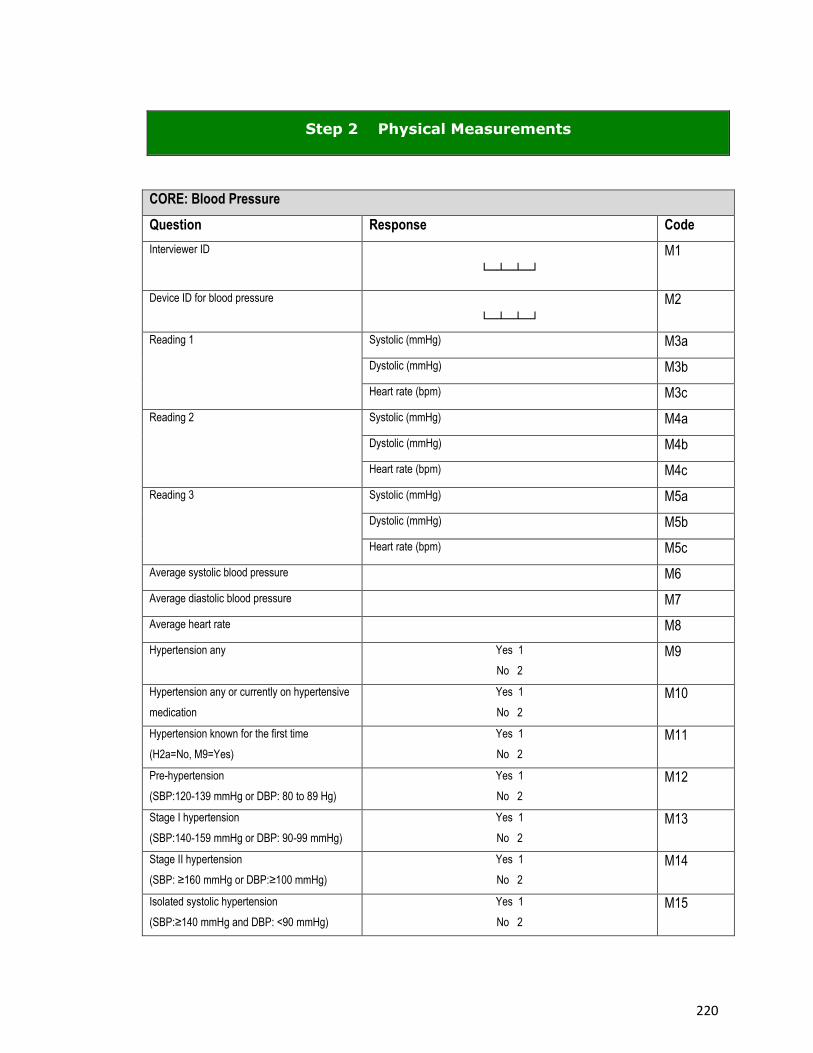
220
Step 2 Physical Measurements
CORE: Blood Pressure
Question Response Code
Interviewer ID
└─┴─┴─┘
M1
Device ID for blood pressure
└─┴─┴─┘
M2
Reading 1 Systolic (mmHg) M3a
Dystolic (mmHg) M3b
Heart rate (bpm) M3c
Reading 2 Systolic (mmHg) M4a
Dystolic (mmHg) M4b
Heart rate (bpm) M4c
Reading 3 Systolic (mmHg) M5a
Dystolic (mmHg) M5b
Heart rate (bpm) M5c
Average systolic blood pressure M6
Average diastolic blood pressure M7
Average heart rate M8
Hypertension any Yes 1
No 2
M9
Hypertension any or currently on hypertensive
medication
Yes 1
No 2
M10
Hypertension known for the first time
(H2a=No, M9=Yes)
Yes 1
No 2
M11
Pre-hypertension
(SBP:120-139 mmHg or DBP: 80 to 89 Hg)
Yes 1
No 2
M12
Stage I hypertension
(SBP:140-159 mmHg or DBP: 90-99 mmHg)
Yes 1
No 2
M13
Stage II hypertension
(SBP: ≥160 mmHg or DBP:≥100 mmHg)
Yes 1
No 2
M14
Isolated systolic hypertension
(SBP:≥140 mmHg and DBP: <90 mmHg)
Yes 1
No 2
M15
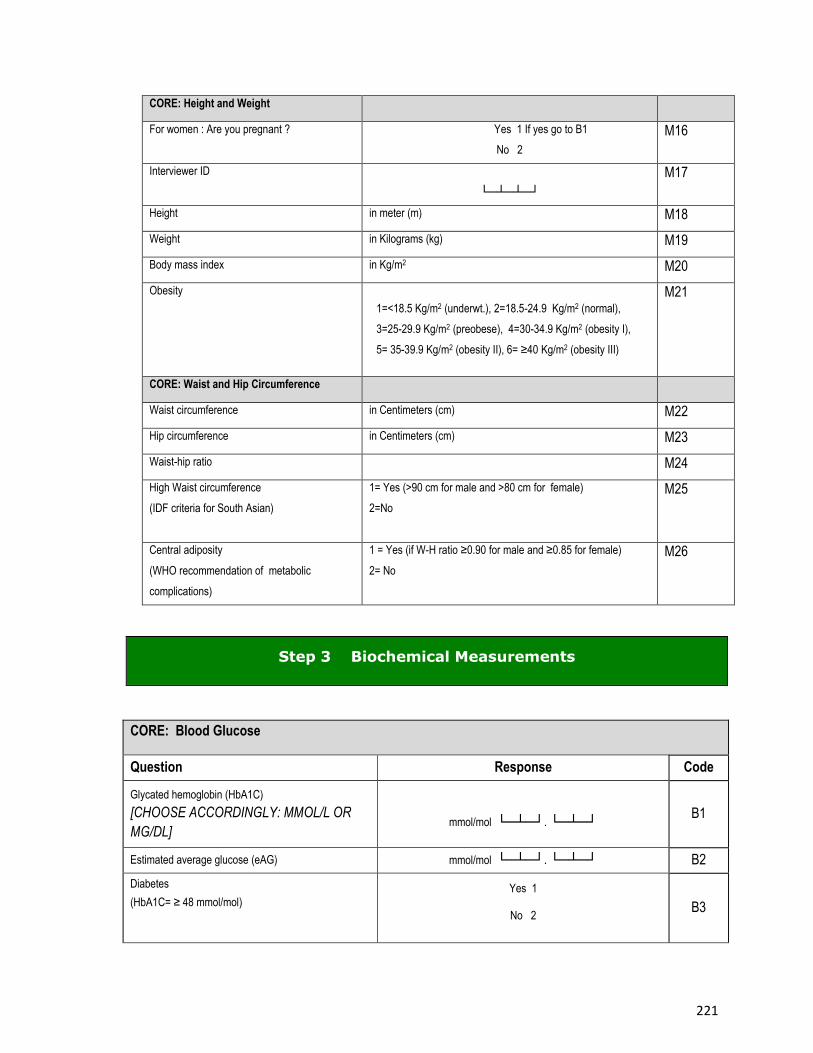
221
CORE: Height and Weight
For women : Are you pregnant ? Yes 1 If yes go to B1
No 2
M16
Interviewer ID
└─┴─┴─┘
M17
Height in meter (m) M18
Weight in Kilograms (kg) M19
Body mass index in Kg/m2 M20
Obesity 1=<18.5 Kg/m2 (underwt.), 2=18.5-24.9 Kg/m2 (normal),
3=25-29.9 Kg/m2 (preobese), 4=30-34.9 Kg/m2 (obesity I),
5= 35-39.9 Kg/m2 (obesity II), 6= ≥40 Kg/m2 (obesity III)
M21
CORE: Waist and Hip Circumference
Waist circumference in Centimeters (cm) M22
Hip circumference in Centimeters (cm) M23
Waist-hip ratio M24
High Waist circumference
(IDF criteria for South Asian)
1= Yes (>90 cm for male and >80 cm for female)
2=No
M25
Central adiposity
(WHO recommendation of metabolic
complications)
1 = Yes (if W-H ratio ≥0.90 for male and ≥0.85 for female)
2= No
M26
Step 3 Biochemical Measurements
CORE: Blood Glucose
Question Response Code
Glycated hemoglobin (HbA1C)
[CHOOSE ACCORDINGLY: MMOL/L OR
MG/DL]
mmol/mol └─┴─┘. └─┴─┘ B1
Estimated average glucose (eAG) mmol/mol └─┴─┘. └─┴─┘ B2
Diabetes
(HbA1C= ≥ 48 mmol/mol)
Yes 1
No 2 B3
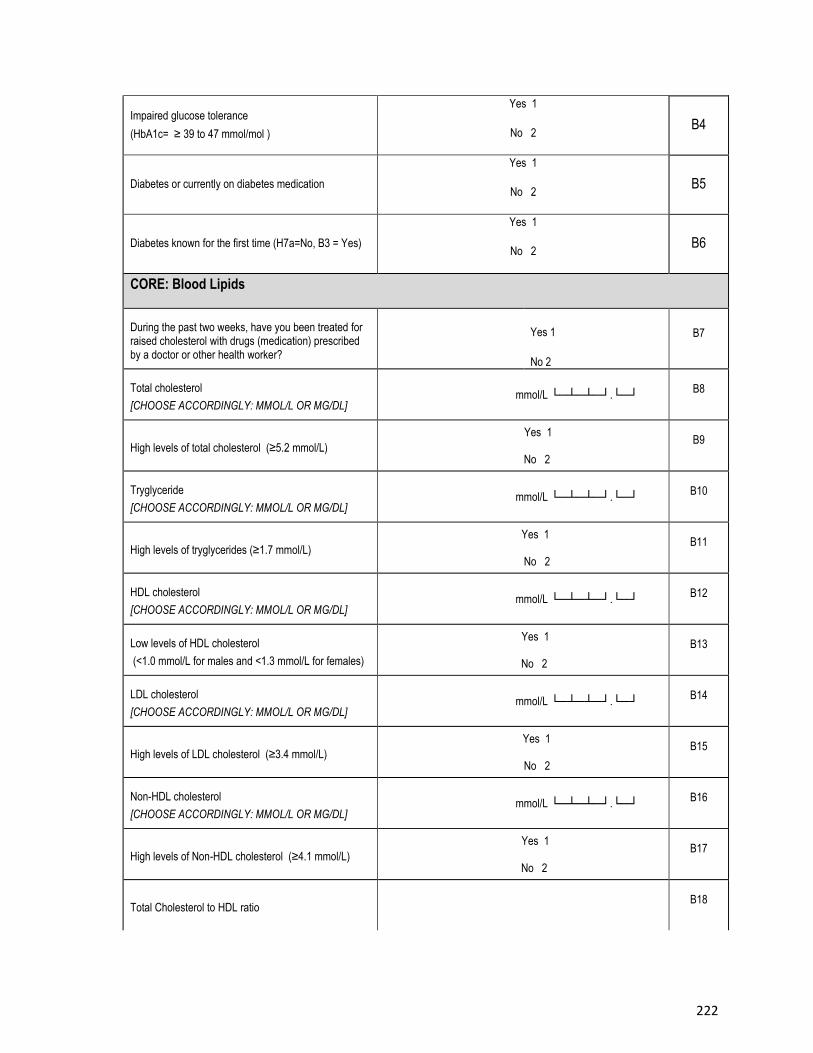
222
Impaired glucose tolerance
(HbA1c= ≥ 39 to 47 mmol/mol )
Yes 1
No 2 B4
Diabetes or currently on diabetes medication
Yes 1
No 2 B5
Diabetes known for the first time (H7a=No, B3 = Yes)
Yes 1
No 2 B6
CORE: Blood Lipids
During the past two weeks, have you been treated for raised cholesterol with drugs (medication) prescribed by a doctor or other health worker?
Yes 1
No 2
B7
Total cholesterol
[CHOOSE ACCORDINGLY: MMOL/L OR MG/DL] mmol/L └─┴─┴─┘.└─┘
B8
High levels of total cholesterol (≥5.2 mmol/L)
Yes 1
No 2
B9
Tryglyceride
[CHOOSE ACCORDINGLY: MMOL/L OR MG/DL] mmol/L └─┴─┴─┘.└─┘
B10
High levels of tryglycerides (≥1.7 mmol/L)
Yes 1
No 2
B11
HDL cholesterol
[CHOOSE ACCORDINGLY: MMOL/L OR MG/DL] mmol/L └─┴─┴─┘.└─┘
B12
Low levels of HDL cholesterol
(<1.0 mmol/L for males and <1.3 mmol/L for females)
Yes 1
No 2
B13
LDL cholesterol
[CHOOSE ACCORDINGLY: MMOL/L OR MG/DL] mmol/L └─┴─┴─┘.└─┘
B14
High levels of LDL cholesterol (≥3.4 mmol/L)
Yes 1
No 2
B15
Non-HDL cholesterol
[CHOOSE ACCORDINGLY: MMOL/L OR MG/DL] mmol/L └─┴─┴─┘.└─┘
B16
High levels of Non-HDL cholesterol (≥4.1 mmol/L)
Yes 1
No 2
B17
Total Cholesterol to HDL ratio B18
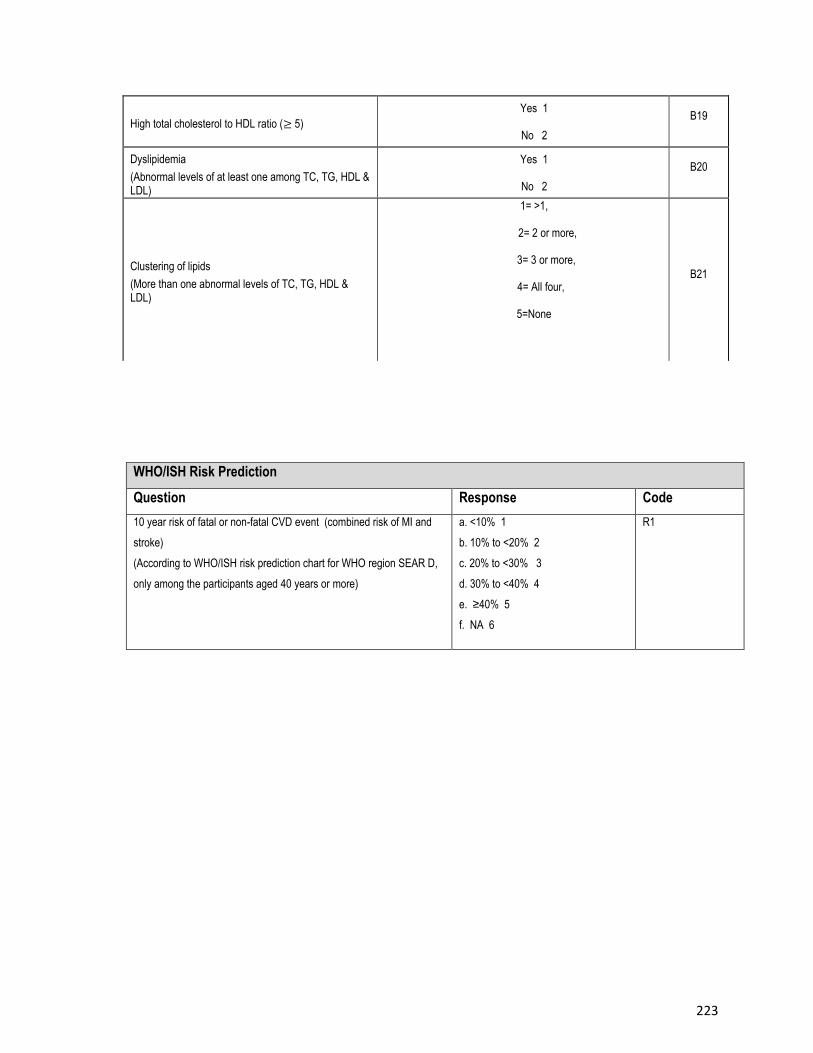
223
High total cholesterol to HDL ratio (≥ 5)
Yes 1
No 2
B19
Dyslipidemia
(Abnormal levels of at least one among TC, TG, HDL & LDL)
Yes 1
No 2
B20
Clustering of lipids
(More than one abnormal levels of TC, TG, HDL & LDL)
1= >1,
2= 2 or more,
3= 3 or more,
4= All four,
5=None
B21
WHO/ISH Risk Prediction
Question Response Code
10 year risk of fatal or non-fatal CVD event (combined risk of MI and
stroke)
(According to WHO/ISH risk prediction chart for WHO region SEAR D,
only among the participants aged 40 years or more)
a. <10% 1
b. 10% to <20% 2
c. 20% to <30% 3
d. 30% to <40% 4
e. ≥40% 5
f. NA 6
R1
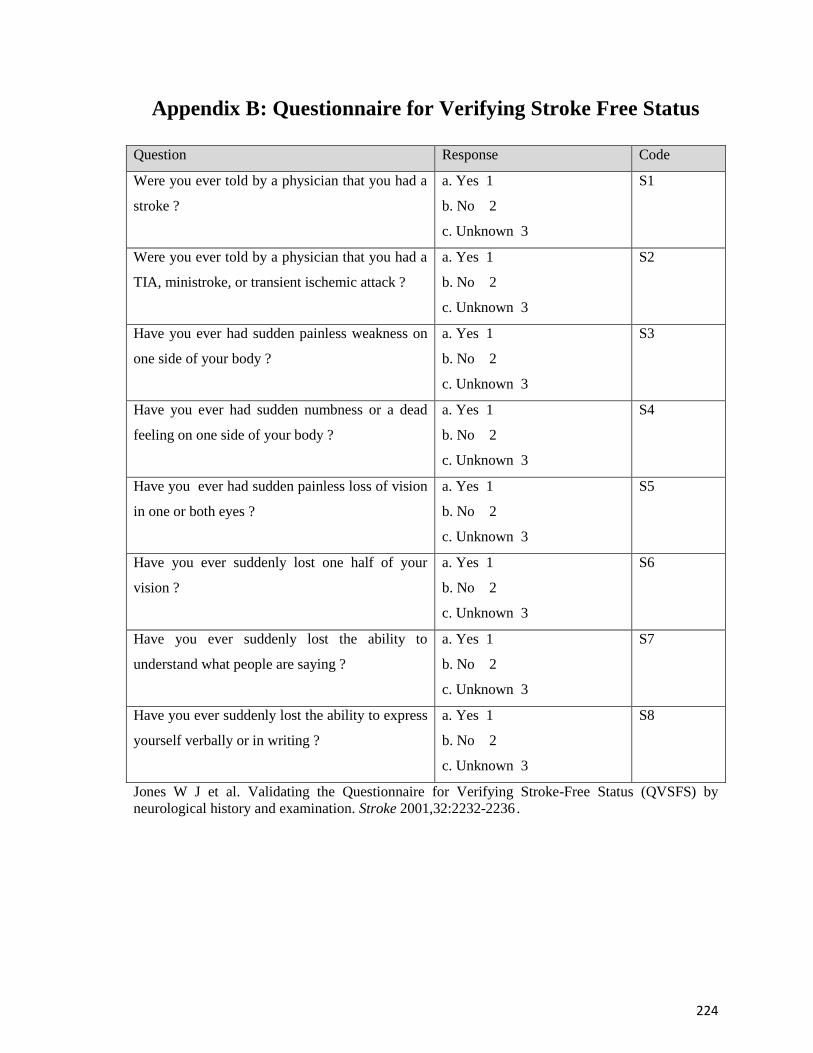
224
Appendix B: Questionnaire for Verifying Stroke Free Status
Question Response Code
Were you ever told by a physician that you had a
stroke ?
a. Yes 1
b. No 2
c. Unknown 3
S1
Were you ever told by a physician that you had a
TIA, ministroke, or transient ischemic attack ?
a. Yes 1
b. No 2
c. Unknown 3
S2
Have you ever had sudden painless weakness on
one side of your body ?
a. Yes 1
b. No 2
c. Unknown 3
S3
Have you ever had sudden numbness or a dead
feeling on one side of your body ?
a. Yes 1
b. No 2
c. Unknown 3
S4
Have you ever had sudden painless loss of vision
in one or both eyes ?
a. Yes 1
b. No 2
c. Unknown 3
S5
Have you ever suddenly lost one half of your
vision ?
a. Yes 1
b. No 2
c. Unknown 3
S6
Have you ever suddenly lost the ability to
understand what people are saying ?
a. Yes 1
b. No 2
c. Unknown 3
S7
Have you ever suddenly lost the ability to express
yourself verbally or in writing ?
a. Yes 1
b. No 2
c. Unknown 3
S8
Jones W J et al. Validating the Questionnaire for Verifying Stroke-Free Status (QVSFS) by
neurological history and examination. Stroke 2001,32:2232-2236 .
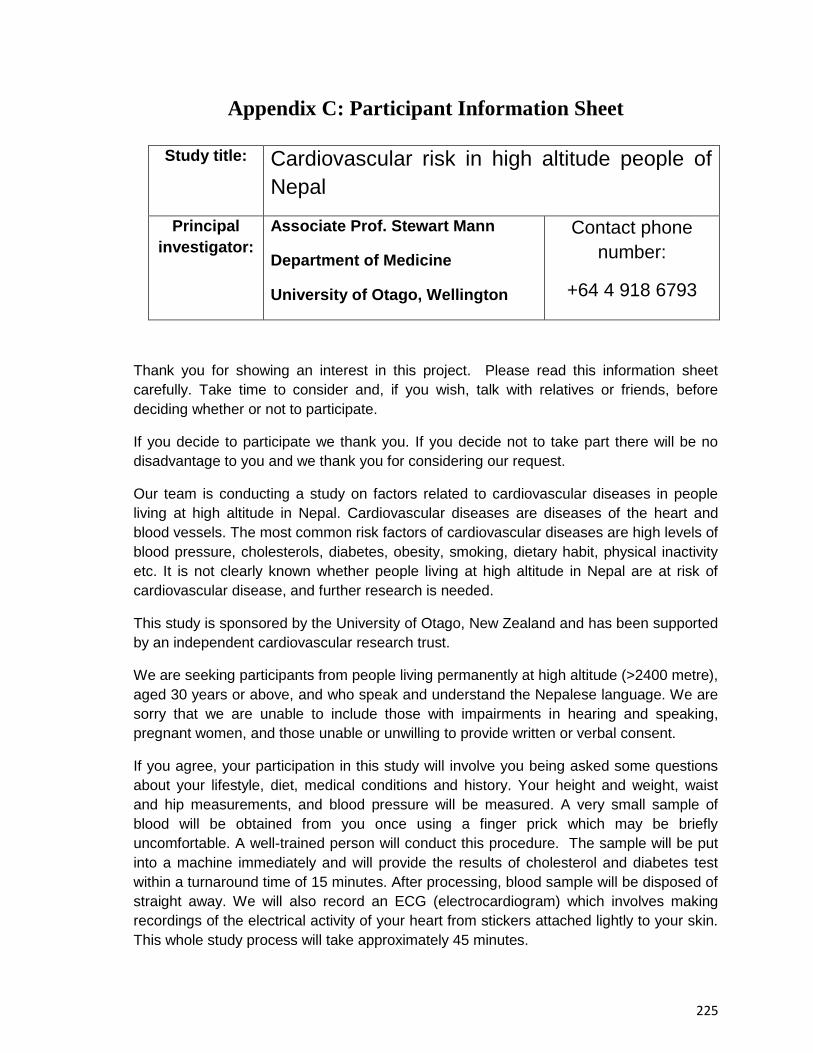
225
Appendix C: Participant Information Sheet
Study title: Cardiovascular risk in high altitude people of
Nepal
Principal
investigator:
Associate Prof. Stewart Mann
Department of Medicine
University of Otago, Wellington
Contact phone
number:
+64 4 918 6793
Thank you for showing an interest in this project. Please read this information sheet
carefully. Take time to consider and, if you wish, talk with relatives or friends, before
deciding whether or not to participate.
If you decide to participate we thank you. If you decide not to take part there will be no
disadvantage to you and we thank you for considering our request.
Our team is conducting a study on factors related to cardiovascular diseases in people
living at high altitude in Nepal. Cardiovascular diseases are diseases of the heart and
blood vessels. The most common risk factors of cardiovascular diseases are high levels of
blood pressure, cholesterols, diabetes, obesity, smoking, dietary habit, physical inactivity
etc. It is not clearly known whether people living at high altitude in Nepal are at risk of
cardiovascular disease, and further research is needed.
This study is sponsored by the University of Otago, New Zealand and has been supported
by an independent cardiovascular research trust.
We are seeking participants from people living permanently at high altitude (>2400 metre),
aged 30 years or above, and who speak and understand the Nepalese language. We are
sorry that we are unable to include those with impairments in hearing and speaking,
pregnant women, and those unable or unwilling to provide written or verbal consent.
If you agree, your participation in this study will involve you being asked some questions
about your lifestyle, diet, medical conditions and history. Your height and weight, waist
and hip measurements, and blood pressure will be measured. A very small sample of
blood will be obtained from you once using a finger prick which may be briefly
uncomfortable. A well-trained person will conduct this procedure. The sample will be put
into a machine immediately and will provide the results of cholesterol and diabetes test
within a turnaround time of 15 minutes. After processing, blood sample will be disposed of
straight away. We will also record an ECG (electrocardiogram) which involves making
recordings of the electrical activity of your heart from stickers attached lightly to your skin.
This whole study process will take approximately 45 minutes.

226
It would be greatly appreciated if you could take part in this study. Your participation in this
study is entirely voluntary and your responses will be kept strictly confidential and
anonymous. You will not be paid any money to be part of this study, nor be asked to pay
any money to take part. Your decision on whether or not to participate in this study will
have no consequences for your future healthcare. If you agree to participate, you have the
right to withdraw from this study at any point without giving any reasons. You will be
requested to provide consent by signing a form with signature or thumb print or by giving
witnessed oral consent.
Any questions?
If you have any questions now or in the future, please feel free to contact either:
Name Nirmal Aryal
Position Student Investigator
Department Medicine, University of Otago
Contact phone number:
(To be confirmed)
Name Stewart Mann
Position Principal Investigator
Department Medicine, University of Otago
Contact phone number:
+64 4 918 6793
Name ....................................
Position Research Assistant
Department
Contact phone number:
………………………………
This study has been approved by the University of Otago Human Ethics Committee
(Health). If you have any concerns about the ethical conduct of the research you may
contact the Committee through the Human Ethics Committee Administrator (phone +64 3
479 8256 or email [email protected]). Any issues you raise will be treated in
confidence and investigated and you will be informed of the outcome.
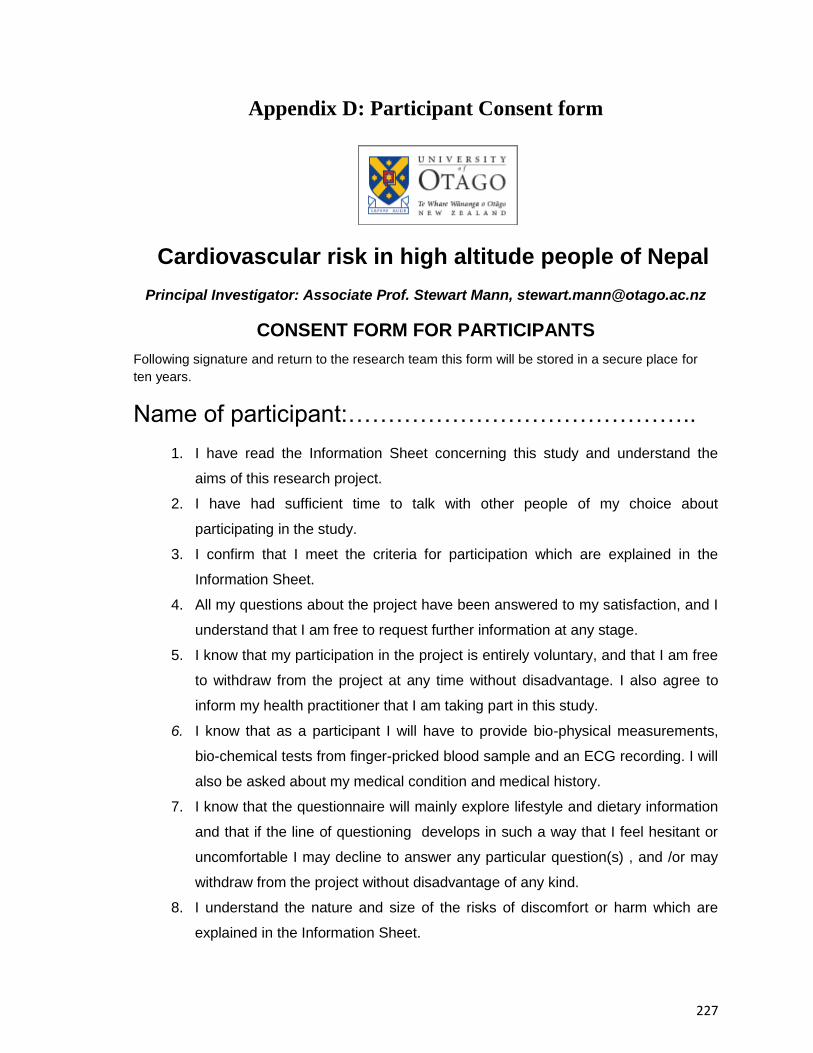
227
Appendix D: Participant Consent form
Cardiovascular risk in high altitude people of Nepal
Principal Investigator: Associate Prof. Stewart Mann, [email protected]
CONSENT FORM FOR PARTICIPANTS
Following signature and return to the research team this form will be stored in a secure place for
ten years.
Name of participant:……………………………………..
1. I have read the Information Sheet concerning this study and understand the
aims of this research project.
2. I have had sufficient time to talk with other people of my choice about
participating in the study.
3. I confirm that I meet the criteria for participation which are explained in the
Information Sheet.
4. All my questions about the project have been answered to my satisfaction, and I
understand that I am free to request further information at any stage.
5. I know that my participation in the project is entirely voluntary, and that I am free
to withdraw from the project at any time without disadvantage. I also agree to
inform my health practitioner that I am taking part in this study.
6. I know that as a participant I will have to provide bio-physical measurements,
bio-chemical tests from finger-pricked blood sample and an ECG recording. I will
also be asked about my medical condition and medical history.
7. I know that the questionnaire will mainly explore lifestyle and dietary information
and that if the line of questioning develops in such a way that I feel hesitant or
uncomfortable I may decline to answer any particular question(s) , and /or may
withdraw from the project without disadvantage of any kind.
8. I understand the nature and size of the risks of discomfort or harm which are
explained in the Information Sheet.

228
9. I know that when the project is completed all personal identifying information will
be removed from the paper records and electronic files which represent the data
from the project, and that these will be placed in secure storage and kept for at
least ten years.
10. I understand that the results of the project may be published and be available in
the University of Otago Library. I agree that any personal identifying information
will remain confidential between myself and the researchers during the study. It
will not appear in any spoken or written report of the study. However, I may
agree for my named results being provided to my preferred health care provider.
11. I know that there is no remuneration offered for this study, and that no
commercial use will be made of the data.
12. I understand that the blood samples will be disposed by the study team
immediately after testing using the standard procedure.
Signature or thumb print of
participant:
Date:
Signature or thumb print and name
of witness:
Date:
Or verbal agreement to participate but unable to provide signature or thumb print
I wish / do not wish (delete one) for my results to be provided to my usual health
provider ………………………………..(name of provider)
Signature / thumb print …………………………
For the study researcher or independent witness: The above statement has
been read to and understood by the participants. He / She has verbally agreed to
each of the above statements and has agreed to participate in this study.
Name: ……………………… Signature: ……………….....
Date:…………………………