
Endurance and Strength Training in Coronary Artery Disease ...
Upload
khangminh22Category
view
2download
0
energies
Article
Aerial Surveillance with Low-Altitude Long-EnduranceTethered Multirotor UAVs Using Photovoltaic PowerManagement System
Sunghun Jung 1 , Yonghyeon Jo 2 and Young-Joon Kim 3,*1 Department of Electric Vehicle Engineering, Dongshin University, Jeollanam-do 58245, Korea;
[email protected] Department of Energy Mechanical Facility, Dongshin University, Jeollanam-do 58245, Korea;
[email protected] Department of Electronic Engineering, Gachon University, Gyeonggi-do 13120, Korea* Correspondence: [email protected]
Received: 28 January 2019; Accepted: 29 March 2019; Published: 6 April 2019�����������������
Abstract: For a continuous surveillance mission using a swarm of multiple tethered low-altitudelong-endurance (LALE) multirotor-type unmanned aerial vehicles (UAVs), we developed a 500 Wclass photovoltaic power management system (PPMS) which monitors voltage and current flows ofphotovoltaic (PV) panels, battery pack, and UAV and controls power flows to support UAV flightoperation. In contract to a fixed-wing UAV, a tethered multirotor UAV can generate continuouslyvarying closed-circuit television (CCTV) like ground map images by stitching incoming imagesthough the operation range is limited. With an indoor flight experiment, we demonstrated theusefulness of the PPMS and proved operation integrity. According to the results, a total of sixmultirotor UAVs were required to continuously perform a surveillance mission for 5 h 46 min from11:04 to 16:50.
Keywords: low-altitude long-endurance (LALE); photovoltaic power management system (PPMS);unmanned aerial vehicle (UAV)
1. Introduction
Technologies related with low-altitude long-endurance (LALE), medium-altitude long-endurance(MALE), and high-altitude long-endurance (HALE) unmanned aerial vehicles (UAVs) have recentlybecome crucial due to various desires, including, in particular, internet coverage extension to remoteareas having no mobile network coverage [1].
In general, LALE, MALE, and HALE UAVs fly up to 3000 m, between 3000 and 9000 m, and over9000 m, separately, and flight time exponentially increases as operation altitude increases. HALE UAVs,for instance, are designed to fly, in theory, indefinitely without any energy source from outside asidefrom solar power or fuel-cell based on a hydrogen generator. Although MALE and HALE UAVs haveadvantages in the sense of flight time and energy efficiency, the size of wingspan is too large to safelyoperate in an urban area, and the runway is indispensable. Thus, despite the limited flight time, lightand small LALE UAVs, instead, are more preferable to safely and freely use in civilian areas complyingwith legal regulations.
Research related to UAV energy efficiency optimization is summarized in Reference [2].According to Reference [2], research trends to optimize UAV energy efficiency can be categorizedinto mainly three: (1) Mission waypoint optimization (MWO), (2) hybrid–electric propulsion systems(HEPS), and (3) effective power management systems (EPMS). Among these, the present paperparticularly focuses on HEPS.
Energies 2019, 12, 1323; doi:10.3390/en12071323 www.mdpi.com/journal/energies
Energies 2019, 12, 1323 2 of 14
There have been several research level attempts to develop a small LALE UAV based on a HEPSusing a fuel cell (FC), solar cell, and battery pack. Gang and et al. developed a 380 W class LALE HEPSUAV based on a power-switching technique to control power flows from two sources using solid-staterelays [3]. Lee and et al. developed a 200 W class LALE HEPS UAV using an active power managementsystem (PMS), in which the active PMS limits boundaries of each energy source to maintain a targetstate of charge (SOC) of the battery pack [4]. Stroman and et al. developed a 1200 W class LALE HEPSUAV which particularly adopts soaring and optimal path planning techniques to extend the flightrange [5]. Chen and et al. developed a 500 W class LALE HEPS UAV design and proved the systemvalidity using MATLAB/Simulink based simulation [6].
There is also a research branch developing only a solar cell based LALE UAV. Shiau and et al.developed a 60 W class electric propulsion system only using a solar cell and also developed threemain systems, including maximum power point tracking (MPPT), a battery management system(BMS), and a power conversion system [7,8].
Both methods, using the combination of a FC, solar cell, and battery pack or using the combinationof solar cell and battery pack, require using a power management system (PMS) to control powerflows. Belvedere and et al. developed an experimental real-time operable PMS and tested it usinga photovoltaic (PV) module emulator and a load emulator [9]. According to the results, the PMSsuccessfully maintained the SOC of a battery pack to be around 50% and the voltage of a battery pack tobe between predefined Vmin
batt,nom and Vmaxbatt,nom. However, Belvedere and et al. used constant set values
for both the PV module emulator and load emulator and so, we cannot determine whether the PMSwill behave well, even in a dynamically changing environment. In addition, load C-rates used in twotest cases were less than 1 C, and this is not adequate for the multirotor UAV application which usesdozens of C-rates. Kranjec and et al. developed a PMS to control power flows between PV modules,a battery pack, and a brushless direct current (DC) machine, but they only passively controlled bymanaging the duty cycle of a transistor attached near the PV modules rather than controlling all powersources [10].
Most of the abovementioned studies tried to build a fixed-wing type LALE UAV which usesstationary alternating current (AC) loads and requires a long runway and a large area to operate.From this perspective, we designed the tethered multirotor-type LALE UAV swarming system for,ultimately, the continuous aerial surveillance without any single human intervention using pure solarenergy. Compared to the fixed-wing UAV, the multirotor-type UAV results in much higher magnitudeand fluctuation of current and voltage, and the handling technique of this dynamic energy flow is veryimportant to develop the long-endurance multirotor-type UAV.
A swarm of small multirotor-type LALE UAVs could generate continuously varying closed-circuittelevision (CCTV) like ground map images by stitching incoming images to the existing ground mapimage. Although the operation range is limited, a tethered multirotor-type LALE UAV could hover forseveral hours in the air and perform a continuous surveillance mission for the specific area.
The flow of this paper is as follows. In Section 2, the overall concept of the aerial surveillancemission is described. In Section 3, equations for the SOC-based flight time estimation are derived.In Section 4, equation derivation for choosing the optimum number of UAVs is performed. In Section 5,the concept and specification of the photovoltaic power management system (PPMS) are explained.In Section 6, the current patterns of both PV panels and UAV achieved from the outdoor experimentare presented. In Section 7, the indoor charge–discharge experiment setup and results using profilesobtained from the previous section are explained. Finally, Section 8 contains the conclusion of thispaper and future works.
2. Aerial Surveillance
If we assume that the UAV carries a camera having the α angle of field of view (FOV), it couldmonitor the area calculated by:
R = h tanα
2, (1)
Energies 2019, 12, 1323 3 of 14
where h is the altitude of the UAV (m) and R is the radius of the monitored area (m).Our purpose here is to continuously observe the area of interest using multiple UAVs flying above
the h altitude, so we assume that more than two homogeneous UAVs are available for the mission.We decided to operate multiple UAVs rather than increasing the amount of battery pack capacity, sincethe continuous operation of UAV might lead to failures of the motor, bearing, etc. Monitoring thebattery pack SOC of each UAV is necessary for the success of the continuous surveillance mission.Monitoring the state of power (SOP) and state of health (SOH) is excluded since those are out of range.
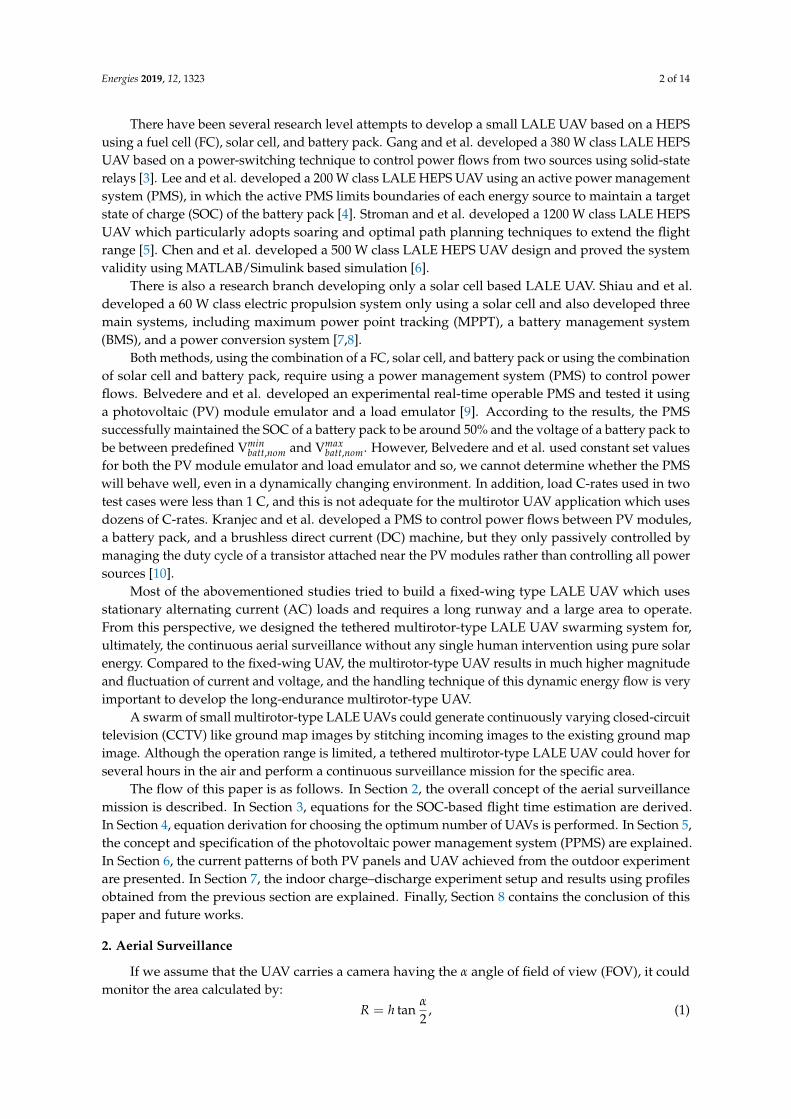
Overall, the conceptual diagram of the aerial surveillance operation is shown in Figure 1.Multiple UAVs are used for the continuous surveillance mission. Each UAV is powered from the PPMS,which controls powers from two sources, including PV panels and a battery pack. Only one UAVhovers at the preassigned altitude at a time to minimize the total energy consumption. While one UAVhovers, the other UAVs are charged during the daytime (Figure 1a). When the UAV1 consumes most ofits battery pack energy, it lands on the ground and the UAV2 takes off (Figure 1b). While UAV2 hoversfor the surveillance mission, the UAV1 keeps charging the battery pack for the next takeoff flight(Figure 1c,d). During the night, all UAVs stay on the ground, since there is no sunlight. When the sunrises at dawn, all UAVs are charged and start the surveillance mission again.
Energies 2019, 12, x FOR PEER REVIEW 3 of 14
𝑅 = ℎ tan 𝛼2 , (1)
where ℎ is the altitude of the UAV (m) and 𝑅 is the radius of the monitored area (m). Our purpose here is to continuously observe the area of interest using multiple UAVs flying
above the ℎ altitude, so we assume that more than two homogeneous UAVs are available for the mission. We decided to operate multiple UAVs rather than increasing the amount of battery pack capacity, since the continuous operation of UAV might lead to failures of the motor, bearing, etc. Monitoring the battery pack SOC of each UAV is necessary for the success of the continuous surveillance mission. Monitoring the state of power (SOP) and state of health (SOH) is excluded since those are out of range.
Overall, the conceptual diagram of the aerial surveillance operation is shown in Figure 1. Multiple UAVs are used for the continuous surveillance mission. Each UAV is powered from the PPMS, which controls powers from two sources, including PV panels and a battery pack. Only one UAV hovers at the preassigned altitude at a time to minimize the total energy consumption. While one UAV hovers, the other UAVs are charged during the daytime (Figure 1a). When the UAV1 consumes most of its battery pack energy, it lands on the ground and the UAV2 takes off (Figure 1b). While UAV2 hovers for the surveillance mission, the UAV1 keeps charging the battery pack for the next takeoff flight (Figure 1c,d). During the night, all UAVs stay on the ground, since there is no sunlight. When the sun rises at dawn, all UAVs are charged and start the surveillance mission again.
(a) (b)
(c) (d)
Figure 1. Step-by-step scenario of the aerial surveillance operation: (a) Step 1, (b) step 2, (c) step 3, and (d) step 4. Figure 1. Step-by-step scenario of the aerial surveillance operation: (a) Step 1, (b) step 2, (c) step 3,and (d) step 4.
Energies 2019, 12, 1323 4 of 14
3. SOC and Flight Time Estimation
Detailed information regarding the method of SOC calculation can be found in Reference [11];therefore, it is excluded from this paper. With the SOC value calculated from Reference [11], we candraw a trace of SOC by calculating:
csoc = 100− rdis,takeo f f tdis,takeo f f − rdis,hovertdis,hover − rdis,landtdis,land + rchtch, (2)
where csoc is the current SOC (%), rdis,takeo f f is the discharging rate during the takeoff flight operation(%/s), rdis,hover is the discharging rate during the hovering flight operation (%/s), rdis,land is thedischarging rate during the landing flight operation (%/s), rch is the charging rate during the batterypack charging operation (%/s), tdis,takeo f f is the time taken during the takeoff flight operation (s),tdis,hover is the time taken during the hovering flight operation (s), tdis,land is the time taken during thelanding flight operation (s), and tch is the time is taken during the battery pack charging operation (s).Here, the discharging rate, r, can be calculated as r = dz
dt , where z is the SOC (%).Since takeoff and landing operations take a relatively short time and require much less energy
compared to the hovering operation, we could simplify Equation (2) as:
csoc = 100− rdis,hovertdis,hover + rchtch. (3)
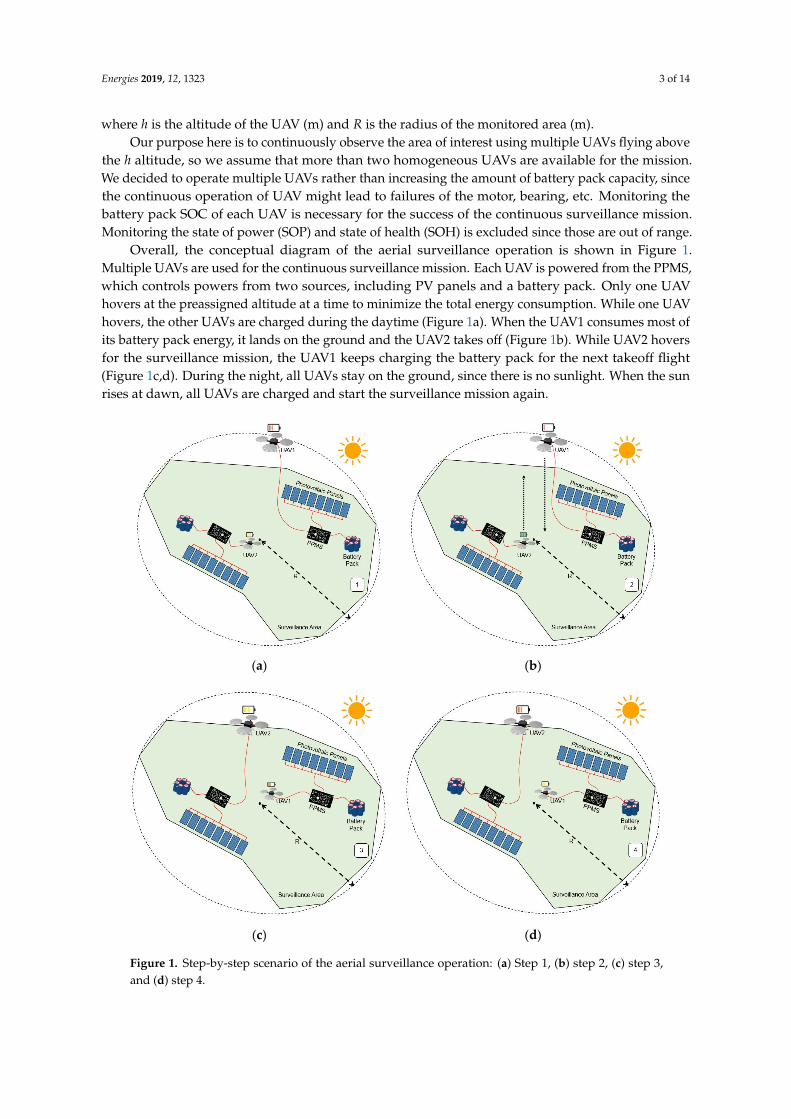
Here, we can calculate rdis,hover and rch by dividing the SOC–time curve into three sections andcalculating the slope of each section as shown in Figure 2.
Energies 2019, 12, x FOR PEER REVIEW 4 of 14
3. SOC and Flight Time Estimation
Detailed information regarding the method of SOC calculation can be found in Reference [11]; therefore, it is excluded from this paper. With the SOC value calculated from Reference [11], we can draw a trace of SOC by calculating: 𝑐 = 100 − 𝑟 , 𝑡 , − 𝑟 , 𝑡 , − 𝑟 , 𝑡 , + 𝑟 𝑡 , (2)
where 𝑐 is the current SOC (%), 𝑟 , is the discharging rate during the takeoff flight operation (%/s), 𝑟 , is the discharging rate during the hovering flight operation (%/s), 𝑟 , is the discharging rate during the landing flight operation (%/s), 𝑟 is the charging rate during the battery pack charging operation (%/s), 𝑡 , is the time taken during the takeoff flight operation (s), 𝑡 , is the time taken during the hovering flight operation (s), 𝑡 , is the time taken during the landing flight operation (s), and 𝑡 is the time is taken during the battery pack charging operation (s). Here, the discharging rate, 𝑟, can be calculated as 𝑟 = , where 𝑧 is the SOC (%).
Since takeoff and landing operations take a relatively short time and require much less energy compared to the hovering operation, we could simplify Equation (2) as: 𝑐 = 100 − 𝑟 , 𝑡 , + 𝑟 𝑡 . (3)
Here, we can calculate 𝑟 , and 𝑟 by dividing the SOC–time curve into three sections and calculating the slope of each section as shown in Figure 2.
(a) (b)
Figure 2. State of charge (SOC)–time curve obtained using a 3.3 Ah 4S1P Li-Po battery pack using a 1 C charging and discharging current pattern: (a) Charging curve and (b) discharging curve.
4. UAV Number Optimization
To optimize the minimum number of required UAVs for the continuous surveillance mission, we set two assumptions: (1) Homogeneous multirotor-type UAVs are used, and (2) the UAV could perform surveillance mission only when it hovers.
To calculate the minimum number of required UAVs to continuously monitor the surveillance area, we need to solve: minimize 𝑚 subject to 𝑡𝑡 , + 1 ≤ 𝑚, for 𝑖 = 2, 3, ⋯ , 𝑛
(4)
where 𝑚 is the number of UAVs (ea) and 𝑛 is the chronological order of flight performed during a day (h). The order of flight during a day matters since the charging and discharging rate varies depends on the 𝑛.
Figure 2. State of charge (SOC)–time curve obtained using a 3.3 Ah 4S1P Li-Po battery pack using a 1 Ccharging and discharging current pattern: (a) Charging curve and (b) discharging curve.
4. UAV Number Optimization
To optimize the minimum number of required UAVs for the continuous surveillance mission,we set two assumptions: (1) Homogeneous multirotor-type UAVs are used, and (2) the UAV couldperform surveillance mission only when it hovers.
To calculate the minimum number of required UAVs to continuously monitor the surveillancearea, we need to solve:
minimize m
subject to⌈
tich
ti−1dis,hover
+ 1⌉≤ m,
for i = {2, 3, · · · , n}
(4)
where m is the number of UAVs (ea) and n is the chronological order of flight performed during a day (h).The order of flight during a day matters since the charging and discharging rate varies depends on the n.
Energies 2019, 12, 1323 5 of 14
5. PPMS
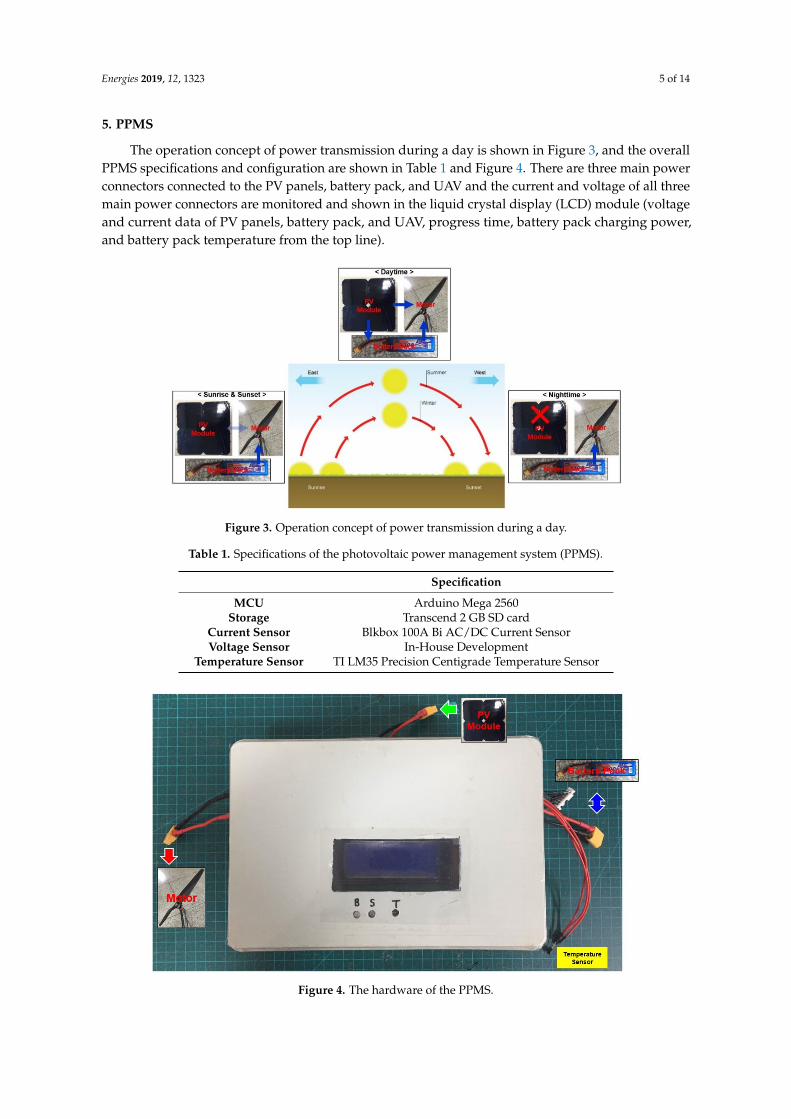
The operation concept of power transmission during a day is shown in Figure 3, and the overallPPMS specifications and configuration are shown in Table 1 and Figure 4. There are three main powerconnectors connected to the PV panels, battery pack, and UAV and the current and voltage of all threemain power connectors are monitored and shown in the liquid crystal display (LCD) module (voltageand current data of PV panels, battery pack, and UAV, progress time, battery pack charging power,and battery pack temperature from the top line).
Energies 2019, 12, x FOR PEER REVIEW 5 of 14
5. PPMS
The operation concept of power transmission during a day is shown in Figure 3, and the overall PPMS specifications and configuration are shown in Table 1 and Figure 4. There are three main power connectors connected to the PV panels, battery pack, and UAV and the current and voltage of all three main power connectors are monitored and shown in the liquid crystal display (LCD) module (voltage and current data of PV panels, battery pack, and UAV, progress time, battery pack charging power, and battery pack temperature from the top line).
Figure 3. Operation concept of power transmission during a day.
Table 1. Specifications of the photovoltaic power management system (PPMS).
Specification MCU Arduino Mega 2560
Storage Transcend 2 GB SD card Current Sensor Blkbox 100A Bi AC/DC Current Sensor Voltage Sensor In-House Development
Temperature Sensor TI LM35 Precision Centigrade Temperature Sensor
Figure 4. The hardware of the PPMS.
A conceptual diagram of the PPMS is shown in Figure 5. Four metal-oxide-semiconductor field-effect transistors (MOSFETs) labeled as a solar switch, battery switch, battery drone switch, and drone
Figure 3. Operation concept of power transmission during a day.
Table 1. Specifications of the photovoltaic power management system (PPMS).
Specification
MCU Arduino Mega 2560Storage Transcend 2 GB SD card
Current Sensor Blkbox 100A Bi AC/DC Current SensorVoltage Sensor In-House Development
Temperature Sensor TI LM35 Precision Centigrade Temperature Sensor
Energies 2019, 12, x FOR PEER REVIEW 5 of 14
5. PPMS
The operation concept of power transmission during a day is shown in Figure 3, and the overall PPMS specifications and configuration are shown in Table 1 and Figure 4. There are three main power connectors connected to the PV panels, battery pack, and UAV and the current and voltage of all three main power connectors are monitored and shown in the liquid crystal display (LCD) module (voltage and current data of PV panels, battery pack, and UAV, progress time, battery pack charging power, and battery pack temperature from the top line).
Figure 3. Operation concept of power transmission during a day.
Table 1. Specifications of the photovoltaic power management system (PPMS).
Specification MCU Arduino Mega 2560
Storage Transcend 2 GB SD card Current Sensor Blkbox 100A Bi AC/DC Current Sensor Voltage Sensor In-House Development
Temperature Sensor TI LM35 Precision Centigrade Temperature Sensor
Figure 4. The hardware of the PPMS.
A conceptual diagram of the PPMS is shown in Figure 5. Four metal-oxide-semiconductor field-effect transistors (MOSFETs) labeled as a solar switch, battery switch, battery drone switch, and drone
Figure 4. The hardware of the PPMS.
Energies 2019, 12, 1323 6 of 14
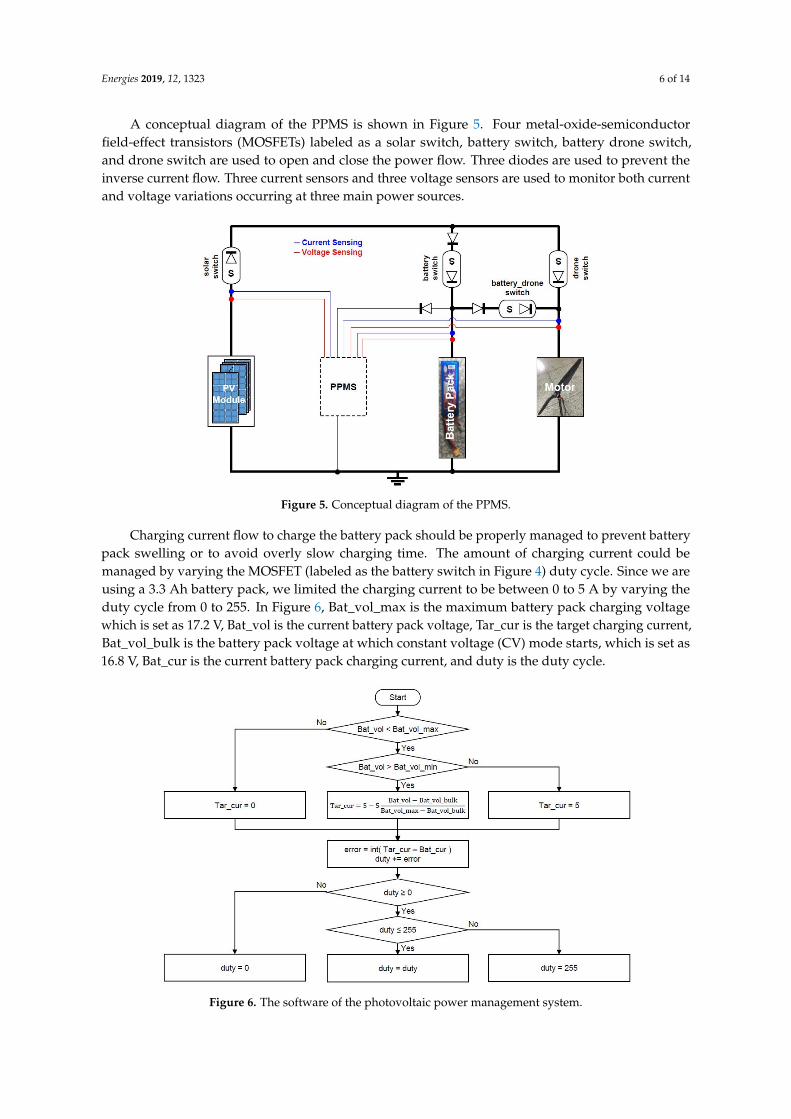
A conceptual diagram of the PPMS is shown in Figure 5. Four metal-oxide-semiconductorfield-effect transistors (MOSFETs) labeled as a solar switch, battery switch, battery drone switch,and drone switch are used to open and close the power flow. Three diodes are used to prevent theinverse current flow. Three current sensors and three voltage sensors are used to monitor both currentand voltage variations occurring at three main power sources.
Energies 2019, 12, x FOR PEER REVIEW 6 of 14
switch are used to open and close the power flow. Three diodes are used to prevent the inverse current flow. Three current sensors and three voltage sensors are used to monitor both current and voltage variations occurring at three main power sources.
Figure 5. Conceptual diagram of the PPMS.
Charging current flow to charge the battery pack should be properly managed to prevent battery pack swelling or to avoid overly slow charging time. The amount of charging current could be managed by varying the MOSFET (labeled as the battery switch in Figure 4) duty cycle. Since we are using a 3.3 Ah battery pack, we limited the charging current to be between 0 to 5 A by varying the duty cycle from 0 to 255. In Figure 6, Bat_vol_max is the maximum battery pack charging voltage which is set as 17.2 V, Bat_vol is the current battery pack voltage, Tar_cur is the target charging current, Bat_vol_bulk is the battery pack voltage at which constant voltage (CV) mode starts, which is set as 16.8 V, Bat_cur is the current battery pack charging current, and duty is the duty cycle.
Figure 6. The software of the photovoltaic power management system.
6. Current Profiles of PV Panels and UAV
The current profiles of the PV panels and UAVs were obtained (Figure 7) by performing outdoor experiments at the Dongshin University schoolyard on 11 January 2019 for 10 h from 08:00 to 18:00
Figure 5. Conceptual diagram of the PPMS.
Charging current flow to charge the battery pack should be properly managed to prevent batterypack swelling or to avoid overly slow charging time. The amount of charging current could bemanaged by varying the MOSFET (labeled as the battery switch in Figure 4) duty cycle. Since we areusing a 3.3 Ah battery pack, we limited the charging current to be between 0 to 5 A by varying theduty cycle from 0 to 255. In Figure 6, Bat_vol_max is the maximum battery pack charging voltagewhich is set as 17.2 V, Bat_vol is the current battery pack voltage, Tar_cur is the target charging current,Bat_vol_bulk is the battery pack voltage at which constant voltage (CV) mode starts, which is set as16.8 V, Bat_cur is the current battery pack charging current, and duty is the duty cycle.
Energies 2019, 12, x FOR PEER REVIEW 6 of 14
switch are used to open and close the power flow. Three diodes are used to prevent the inverse current flow. Three current sensors and three voltage sensors are used to monitor both current and voltage variations occurring at three main power sources.
Figure 5. Conceptual diagram of the PPMS.
Charging current flow to charge the battery pack should be properly managed to prevent battery pack swelling or to avoid overly slow charging time. The amount of charging current could be managed by varying the MOSFET (labeled as the battery switch in Figure 4) duty cycle. Since we are using a 3.3 Ah battery pack, we limited the charging current to be between 0 to 5 A by varying the duty cycle from 0 to 255. In Figure 6, Bat_vol_max is the maximum battery pack charging voltage which is set as 17.2 V, Bat_vol is the current battery pack voltage, Tar_cur is the target charging current, Bat_vol_bulk is the battery pack voltage at which constant voltage (CV) mode starts, which is set as 16.8 V, Bat_cur is the current battery pack charging current, and duty is the duty cycle.
Figure 6. The software of the photovoltaic power management system.
6. Current Profiles of PV Panels and UAV
The current profiles of the PV panels and UAVs were obtained (Figure 7) by performing outdoor experiments at the Dongshin University schoolyard on 11 January 2019 for 10 h from 08:00 to 18:00
Figure 6. The software of the photovoltaic power management system.

Energies 2019, 12, 1323 7 of 14
6. Current Profiles of PV Panels and UAV
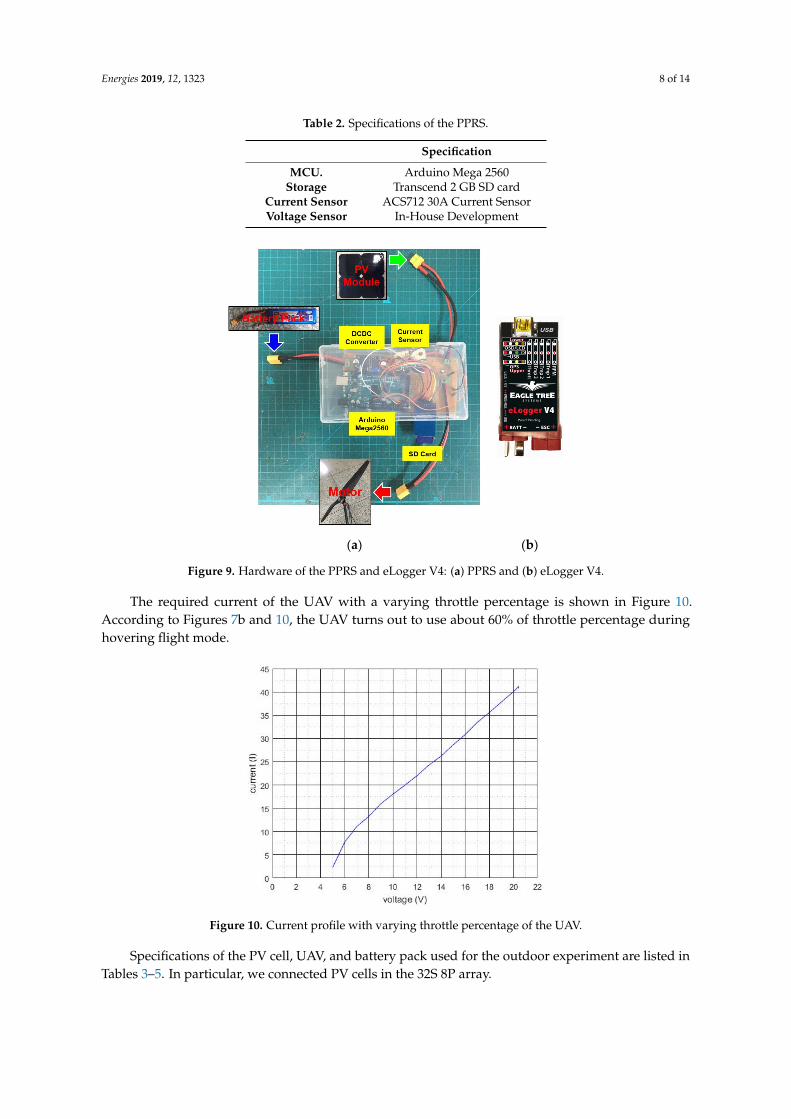
The current profiles of the PV panels and UAVs were obtained (Figure 7) by performing outdoorexperiments at the Dongshin University schoolyard on 11 January 2019 for 10 h from 08:00 to 18:00(Figure 8). The current profile of PV panels was obtained using a PV power recording system (PPRS)as shown in Table 2 and Figure 9a. To monitor the current profile of UAV, the eLogger V4 module wasused as shown in Figure 9b.
Energies 2019, 12, x FOR PEER REVIEW 7 of 14
(Figure 8). The current profile of PV panels was obtained using a PV power recording system (PPRS) as shown in Table 2 and Figure 9a. To monitor the current profile of UAV, the eLogger V4 module was used as shown in Figure 9b.
(a) (b)
Figure 7. Current profile of PV panels and unmanned UAVs: (a) PV panels and (b) UAVs.
(a)
(b)
Figure 8. Outdoor experiments of PV panels and UAVs: (a) PV panels and (b) UAVs.
Figure 7. Current profile of PV panels and unmanned UAVs: (a) PV panels and (b) UAVs.
Energies 2019, 12, x FOR PEER REVIEW 7 of 14
(Figure 8). The current profile of PV panels was obtained using a PV power recording system (PPRS) as shown in Table 2 and Figure 9a. To monitor the current profile of UAV, the eLogger V4 module was used as shown in Figure 9b.
(a) (b)
Figure 7. Current profile of PV panels and unmanned UAVs: (a) PV panels and (b) UAVs.
(a)
(b)
Figure 8. Outdoor experiments of PV panels and UAVs: (a) PV panels and (b) UAVs. Figure 8. Outdoor experiments of PV panels and UAVs: (a) PV panels and (b) UAVs.
Energies 2019, 12, 1323 8 of 14
Table 2. Specifications of the PPRS.
Specification
MCU. Arduino Mega 2560Storage Transcend 2 GB SD card
Current Sensor ACS712 30A Current SensorVoltage Sensor In-House Development
Energies 2019, 12, x FOR PEER REVIEW 8 of 14
Table 2. Specifications of the PPRS.
Specification MCU. Arduino Mega 2560
Storage Transcend 2 GB SD card Current Sensor ACS712 30A Current Sensor Voltage Sensor In-House Development
(a) (b)
Figure 9. Hardware of the PPRS and eLogger V4: (a) PPRS and (b) eLogger V4.
The required current of the UAV with a varying throttle percentage is shown in Figure 10. According to Figures 7b and 10, the UAV turns out to use about 60% of throttle percentage during hovering flight mode.
Figure 10. Current profile with varying throttle percentage of the UAV.
Specifications of the PV cell, UAV, and battery pack used for the outdoor experiment are listed in Tables 3–5. In particular, we connected PV cells in the 32S 8P array.
Table 3. Specifications of the PV cell.
Figure 9. Hardware of the PPRS and eLogger V4: (a) PPRS and (b) eLogger V4.
The required current of the UAV with a varying throttle percentage is shown in Figure 10.According to Figures 7b and 10, the UAV turns out to use about 60% of throttle percentage duringhovering flight mode.
Energies 2019, 12, x FOR PEER REVIEW 8 of 14
Table 2. Specifications of the PPRS.
Specification MCU. Arduino Mega 2560
Storage Transcend 2 GB SD card Current Sensor ACS712 30A Current Sensor Voltage Sensor In-House Development
(a) (b)
Figure 9. Hardware of the PPRS and eLogger V4: (a) PPRS and (b) eLogger V4.
The required current of the UAV with a varying throttle percentage is shown in Figure 10. According to Figures 7b and 10, the UAV turns out to use about 60% of throttle percentage during hovering flight mode.
Figure 10. Current profile with varying throttle percentage of the UAV.
Specifications of the PV cell, UAV, and battery pack used for the outdoor experiment are listed in Tables 3–5. In particular, we connected PV cells in the 32S 8P array.
Table 3. Specifications of the PV cell.
Figure 10. Current profile with varying throttle percentage of the UAV.
Specifications of the PV cell, UAV, and battery pack used for the outdoor experiment are listed inTables 3–5. In particular, we connected PV cells in the 32S 8P array.

Energies 2019, 12, 1323 9 of 14
Table 3. Specifications of the PV cell.
Item Specification
Max Voltage 0.55 VMax Current 5.8 AMax Power 3.19 WEfficiency 20.8%
Size 125 mm × 125 mmWeight 6 g
Table 4. Specifications of the UAV.
Item Specification
Diagonal Wheelbase 1150 mmDimension 1660 mm × 1660 mm × 565 mm
Weight (w/o battery) 2.26 kg
Table 5. Specifications of the battery pack.
Item Specification
Rated Capacity 3300 m/AhNominal Voltage 14.8 V
Configuration 4S1PWeight 340 g
7. Indoor Charge-Discharge Experiment
7.1. Experiment Setup
Conceptual diagrams of the indoor charge–discharge experiment and the overall experimentsetup are shown in Figures 11 and 12. Here, DC power supply supplies power by simulating thecurrent profile of the PV panels as shown in Figure 7a. Electronic load discharges by simulatingthe current profile of the UAV as shown in Figure 7b. In particular, we extracted only the hoveringdischarging part from Figure 7b and continuously repeated the hovering discharging current pattern.
Energies 2019, 12, x FOR PEER REVIEW 9 of 14
Item Specification Max Voltage 0.55 V Max Current 5.8 A Max Power 3.19 W Efficiency 20.8%
Size 125 mm × 125 mm Weight 6 g
Table 4. Specifications of the UAV.
Item Specification Diagonal Wheelbase 1150 mm
Dimension 1660 mm × 1660 mm × 565 mm Weight (w/o battery) 2.26 kg
Table 5. Specifications of the battery pack.
Item Specification Rated Capacity 3300 m/Ah
Nominal Voltage 14.8 V Configuration 4S1P
Weight 340 g
7. Indoor Charge-Discharge Experiment
7.1. Experiment Setup
Conceptual diagrams of the indoor charge–discharge experiment and the overall experiment setup are shown in Figures 11 and 12. Here, DC power supply supplies power by simulating the current profile of the PV panels as shown in Figure 7a. Electronic load discharges by simulating the current profile of the UAV as shown in Figure 7b. In particular, we extracted only the hovering discharging part from Figure 7b and continuously repeated the hovering discharging current pattern.
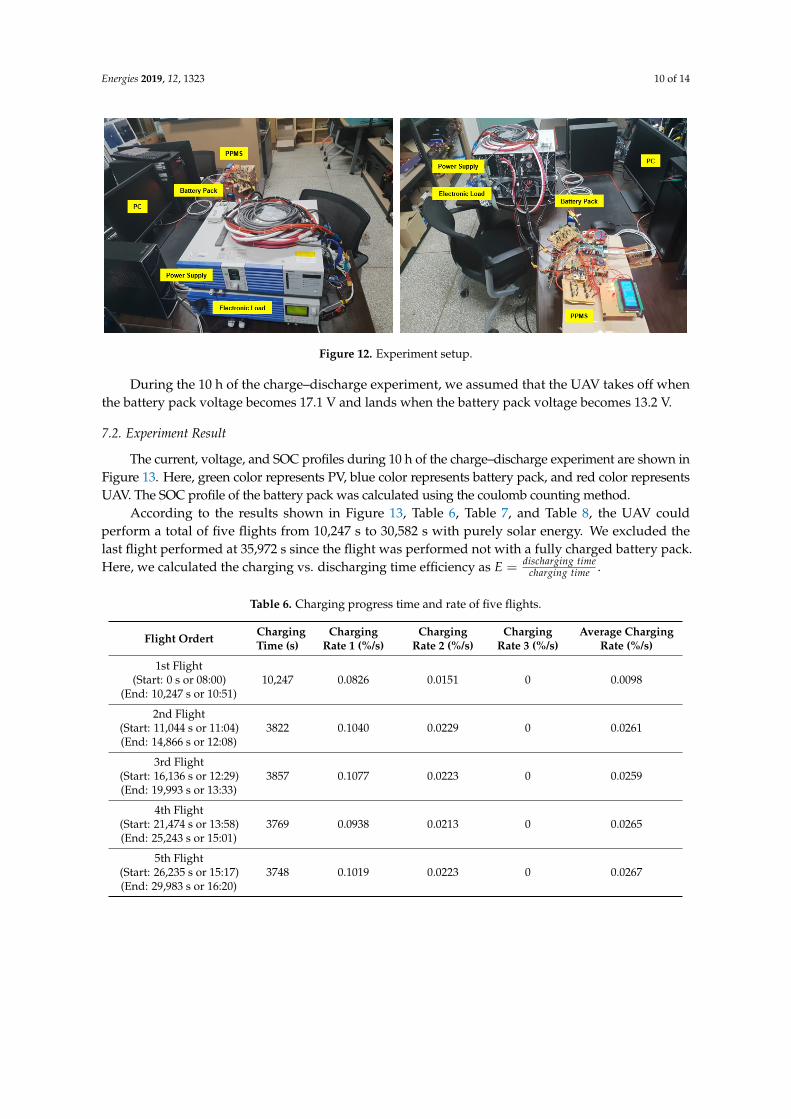
During the 10 h of the charge–discharge experiment, we assumed that the UAV takes off when the battery pack voltage becomes 17.1 V and lands when the battery pack voltage becomes 13.2 V.
Figure 11. Conceptual diagram of the experiment. Figure 11. Conceptual diagram of the experiment.
Energies 2019, 12, 1323 10 of 14
Energies 2019, 12, x FOR PEER REVIEW 10 of 14
Figure 12. Experiment setup.
7.2. Experiment Result
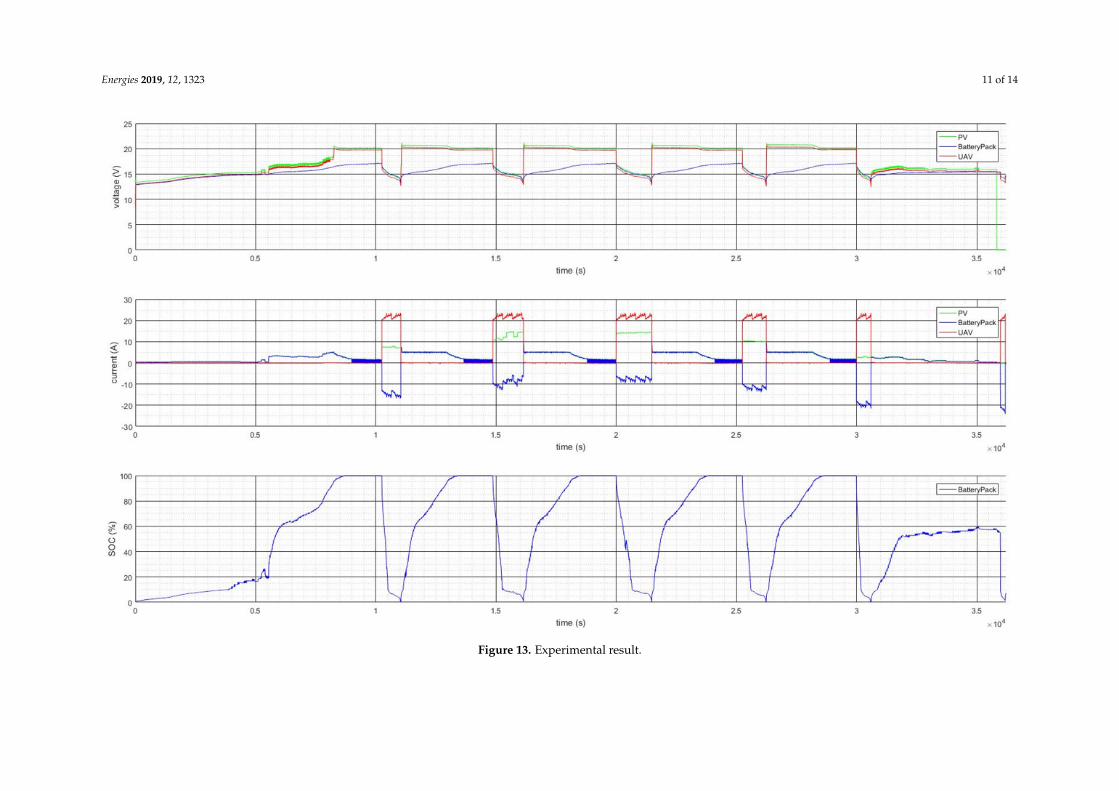
The current, voltage, and SOC profiles during 10 h of the charge–discharge experiment are shown in Figure 13. Here, green color represents PV, blue color represents battery pack, and red color represents UAV. The SOC profile of the battery pack was calculated using the coulomb counting method.
According to the results shown in Figure 13, Table 6, Table 7, and Table 8, the UAV could perform a total of five flights from 10,247 s to 30,582 s with purely solar energy. We excluded the last flight performed at 35,972 s since the flight was performed not with a fully charged battery pack. Here, we calculated the charging vs. discharging time efficiency as 𝐸 = .
Table 6. Charging progress time and rate of five flights.
Flight Ordert Charging Time (s)
Charging Rate 1 (%/s)
Charging Rate 2 (%/s)
Charging Rate 3 (%/s)
Average Charging Rate (%/s)
1st Flight (Start: 0 s or 08:00)
(End: 10,247 s or 10:51) 10,247 0.0826 0.0151 0 0.0098
2nd Flight (Start: 11,044 s or 11:04) (End: 14,866 s or 12:08)
3822 0.1040 0.0229 0 0.0261
3rd Flight (Start: 16,136 s or 12:29) (End: 19,993 s or 13:33)
3857 0.1077 0.0223 0 0.0259
4th Flight (Start: 21,474 s or 13:58) (End: 25,243 s or 15:01)
3769 0.0938 0.0213 0 0.0265
5th Flight (Start: 26,235 s or 15:17) (End: 29,983 s or 16:20)
3748 0.1019 0.0223 0 0.0267
Figure 12. Experiment setup.
During the 10 h of the charge–discharge experiment, we assumed that the UAV takes off whenthe battery pack voltage becomes 17.1 V and lands when the battery pack voltage becomes 13.2 V.
7.2. Experiment Result
The current, voltage, and SOC profiles during 10 h of the charge–discharge experiment are shown inFigure 13. Here, green color represents PV, blue color represents battery pack, and red color representsUAV. The SOC profile of the battery pack was calculated using the coulomb counting method.
According to the results shown in Figure 13, Table 6, Table 7, and Table 8, the UAV couldperform a total of five flights from 10,247 s to 30,582 s with purely solar energy. We excluded thelast flight performed at 35,972 s since the flight was performed not with a fully charged battery pack.Here, we calculated the charging vs. discharging time efficiency as E = discharging time
charging time .
Table 6. Charging progress time and rate of five flights.
Flight Ordert ChargingTime (s)
ChargingRate 1 (%/s)
ChargingRate 2 (%/s)
ChargingRate 3 (%/s)
Average ChargingRate (%/s)
1st Flight(Start: 0 s or 08:00)
(End: 10,247 s or 10:51)10,247 0.0826 0.0151 0 0.0098
2nd Flight(Start: 11,044 s or 11:04)(End: 14,866 s or 12:08)
3822 0.1040 0.0229 0 0.0261
3rd Flight(Start: 16,136 s or 12:29)(End: 19,993 s or 13:33)
3857 0.1077 0.0223 0 0.0259
4th Flight(Start: 21,474 s or 13:58)(End: 25,243 s or 15:01)
3769 0.0938 0.0213 0 0.0265
5th Flight(Start: 26,235 s or 15:17)(End: 29,983 s or 16:20)
3748 0.1019 0.0223 0 0.0267
Energies 2019, 12, 1323 11 of 14Energies 2019, 12, x FOR PEER REVIEW 11 of 14
Figure 13. Experimental result. Figure 13. Experimental result.
Energies 2019, 12, 1323 12 of 14
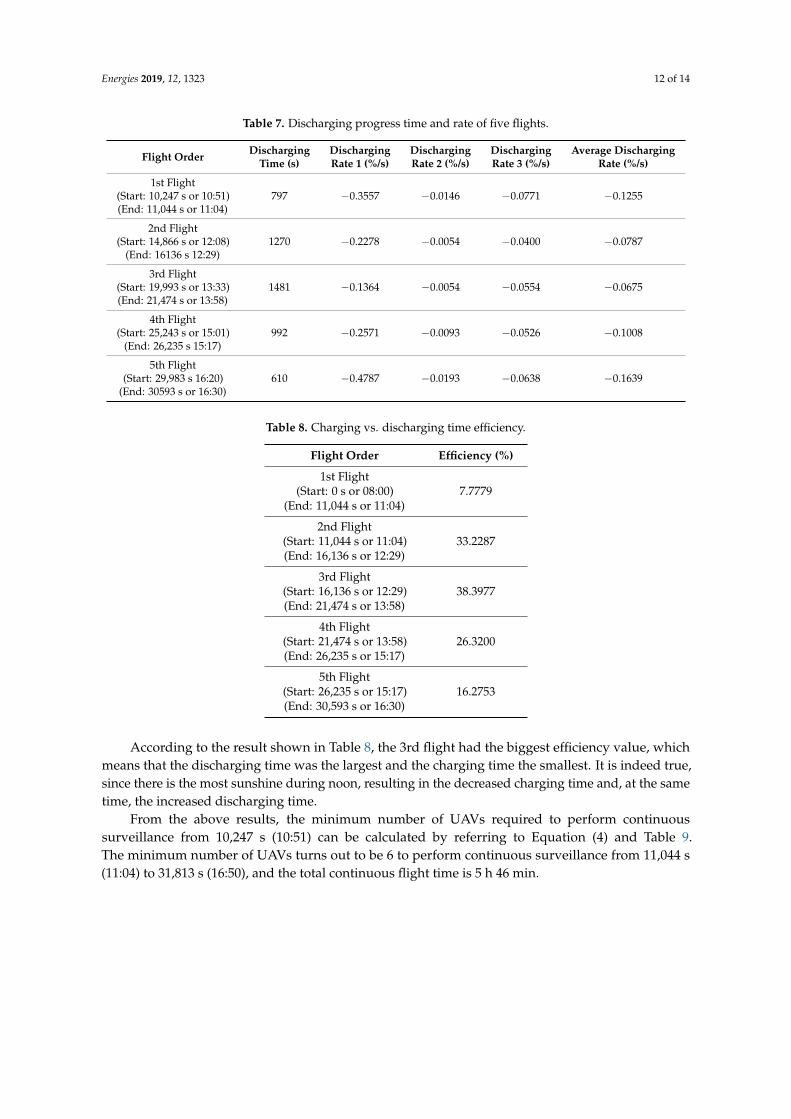
Table 7. Discharging progress time and rate of five flights.
Flight Order DischargingTime (s)
DischargingRate 1 (%/s)
DischargingRate 2 (%/s)
DischargingRate 3 (%/s)
Average DischargingRate (%/s)
1st Flight(Start: 10,247 s or 10:51)(End: 11,044 s or 11:04)
797 −0.3557 −0.0146 −0.0771 −0.1255
2nd Flight(Start: 14,866 s or 12:08)
(End: 16136 s 12:29)1270 −0.2278 −0.0054 −0.0400 −0.0787
3rd Flight(Start: 19,993 s or 13:33)(End: 21,474 s or 13:58)
1481 −0.1364 −0.0054 −0.0554 −0.0675
4th Flight(Start: 25,243 s or 15:01)
(End: 26,235 s 15:17)992 −0.2571 −0.0093 −0.0526 −0.1008
5th Flight(Start: 29,983 s 16:20)
(End: 30593 s or 16:30)610 −0.4787 −0.0193 −0.0638 −0.1639
Table 8. Charging vs. discharging time efficiency.
Flight Order Efficiency (%)
1st Flight(Start: 0 s or 08:00)
(End: 11,044 s or 11:04)7.7779
2nd Flight(Start: 11,044 s or 11:04)(End: 16,136 s or 12:29)
33.2287
3rd Flight(Start: 16,136 s or 12:29)(End: 21,474 s or 13:58)
38.3977
4th Flight(Start: 21,474 s or 13:58)(End: 26,235 s or 15:17)
26.3200
5th Flight(Start: 26,235 s or 15:17)(End: 30,593 s or 16:30)
16.2753
According to the result shown in Table 8, the 3rd flight had the biggest efficiency value, whichmeans that the discharging time was the largest and the charging time the smallest. It is indeed true,since there is the most sunshine during noon, resulting in the decreased charging time and, at the sametime, the increased discharging time.
From the above results, the minimum number of UAVs required to perform continuoussurveillance from 10,247 s (10:51) can be calculated by referring to Equation (4) and Table 9.The minimum number of UAVs turns out to be 6 to perform continuous surveillance from 11,044 s(11:04) to 31,813 s (16:50), and the total continuous flight time is 5 h 46 min.
Energies 2019, 12, 1323 13 of 14
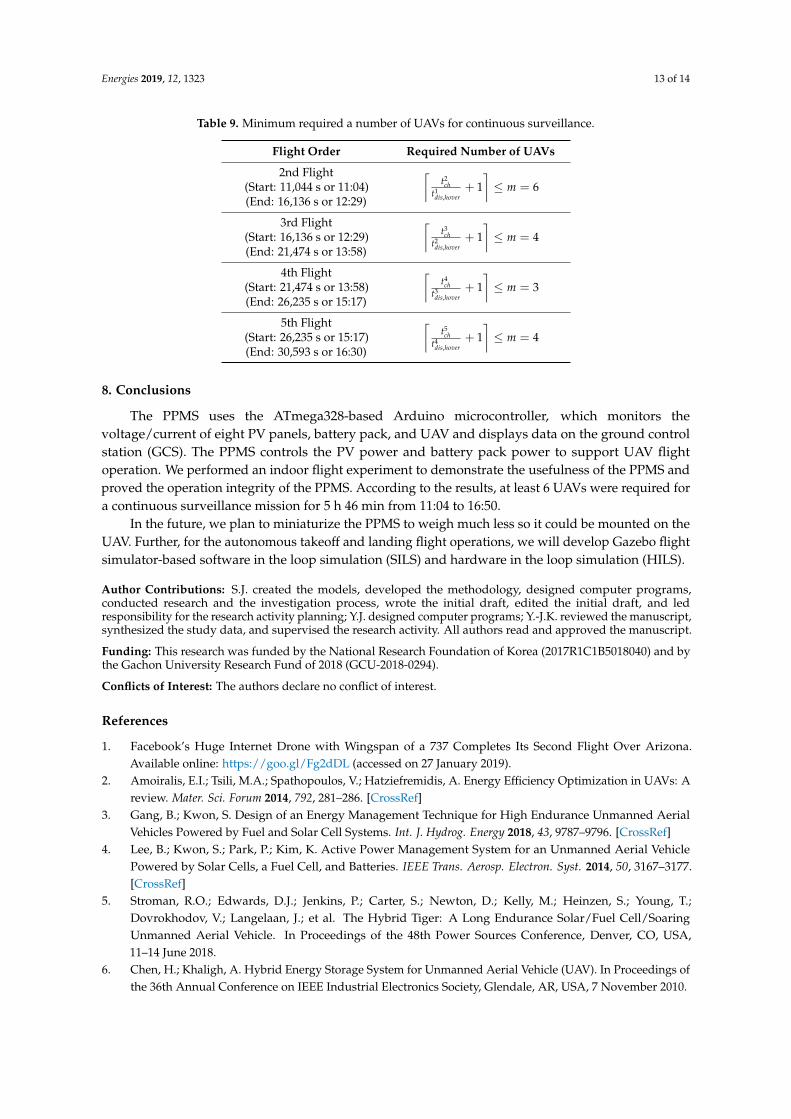
Table 9. Minimum required a number of UAVs for continuous surveillance.
Flight Order Required Number of UAVs
2nd Flight(Start: 11,044 s or 11:04)(End: 16,136 s or 12:29)
⌈t2ch
t1dis,hover
+ 1⌉≤ m = 6
3rd Flight(Start: 16,136 s or 12:29)(End: 21,474 s or 13:58)
⌈t3ch
t2dis,hover
+ 1⌉≤ m = 4
4th Flight(Start: 21,474 s or 13:58)(End: 26,235 s or 15:17)
⌈t4ch
t3dis,hover
+ 1⌉≤ m = 3
5th Flight(Start: 26,235 s or 15:17)(End: 30,593 s or 16:30)
⌈t5ch
t4dis,hover
+ 1⌉≤ m = 4
8. Conclusions
The PPMS uses the ATmega328-based Arduino microcontroller, which monitors thevoltage/current of eight PV panels, battery pack, and UAV and displays data on the ground controlstation (GCS). The PPMS controls the PV power and battery pack power to support UAV flightoperation. We performed an indoor flight experiment to demonstrate the usefulness of the PPMS andproved the operation integrity of the PPMS. According to the results, at least 6 UAVs were required fora continuous surveillance mission for 5 h 46 min from 11:04 to 16:50.
In the future, we plan to miniaturize the PPMS to weigh much less so it could be mounted on theUAV. Further, for the autonomous takeoff and landing flight operations, we will develop Gazebo flightsimulator-based software in the loop simulation (SILS) and hardware in the loop simulation (HILS).
Author Contributions: S.J. created the models, developed the methodology, designed computer programs,conducted research and the investigation process, wrote the initial draft, edited the initial draft, and ledresponsibility for the research activity planning; Y.J. designed computer programs; Y.-J.K. reviewed the manuscript,synthesized the study data, and supervised the research activity. All authors read and approved the manuscript.
Funding: This research was funded by the National Research Foundation of Korea (2017R1C1B5018040) and bythe Gachon University Research Fund of 2018 (GCU-2018-0294).
Conflicts of Interest: The authors declare no conflict of interest.
References
1. Facebook’s Huge Internet Drone with Wingspan of a 737 Completes Its Second Flight Over Arizona.Available online: https://goo.gl/Fg2dDL (accessed on 27 January 2019).
2. Amoiralis, E.I.; Tsili, M.A.; Spathopoulos, V.; Hatziefremidis, A. Energy Efficiency Optimization in UAVs: Areview. Mater. Sci. Forum 2014, 792, 281–286. [CrossRef]
3. Gang, B.; Kwon, S. Design of an Energy Management Technique for High Endurance Unmanned AerialVehicles Powered by Fuel and Solar Cell Systems. Int. J. Hydrog. Energy 2018, 43, 9787–9796. [CrossRef]
4. Lee, B.; Kwon, S.; Park, P.; Kim, K. Active Power Management System for an Unmanned Aerial VehiclePowered by Solar Cells, a Fuel Cell, and Batteries. IEEE Trans. Aerosp. Electron. Syst. 2014, 50, 3167–3177.[CrossRef]
5. Stroman, R.O.; Edwards, D.J.; Jenkins, P.; Carter, S.; Newton, D.; Kelly, M.; Heinzen, S.; Young, T.;Dovrokhodov, V.; Langelaan, J.; et al. The Hybrid Tiger: A Long Endurance Solar/Fuel Cell/SoaringUnmanned Aerial Vehicle. In Proceedings of the 48th Power Sources Conference, Denver, CO, USA,11–14 June 2018.
6. Chen, H.; Khaligh, A. Hybrid Energy Storage System for Unmanned Aerial Vehicle (UAV). In Proceedings ofthe 36th Annual Conference on IEEE Industrial Electronics Society, Glendale, AR, USA, 7 November 2010.

Energies 2019, 12, 1323 14 of 14
7. Shiau, J.K.; Ma, D.M. Development of an Experimental Solar-Powered Unmanned Aerial Vehicle. J. Chin.Inst. Eng. 2015, 38, 1–13. [CrossRef]
8. Shiau, J.K.; Ma, D.M.; Yang, P.Y.; Wang, G.F.; Gong, J.H. Design of a Solar Power Management System for anExperimental UAV. IEEE Trans. Aerosp. Electron. Syst. 2009, 45, 1350–1360. [CrossRef]
9. Belvedere, B.; Bianchi, M.; Borghetti, A.; Nucci, C.A.; Paolone, M.; Peretto, A. A Microcontroller-Based PowerManagement System for Standalone Microgrids with Hybrid Power Supply. IEEE Trans. Sustain. Energy2012, 3, 422–431. [CrossRef]
10. Kranjec, B.; Sladic, S.; Giernacki, W.; Bulic, N. PV System Design and Flight Efficiency Considerations forFixed-Wing Radio-Controlled Aircraft—A Case Study. Energies 2018, 11, 2648. [CrossRef]
11. Jung, S.; Jeong, H. Extended Kalman Filter-Based State of Charge and State of Power Estimation Algorithmfor Unmanned Aerial Vehicle Li-Po Battery Pack. Energies 2017, 10, 1237. [CrossRef]
© 2019 by the authors. Licensee MDPI, Basel, Switzerland. This article is an open accessarticle distributed under the terms and conditions of the Creative Commons Attribution(CC BY) license (http://creativecommons.org/licenses/by/4.0/).
Copyright © 2022 FDOKUMEN