The evolution of field deployable fnir spectroscopy from bench to clinical settings
Upload
khangminh22Category
view
1download
0
High Endurance Rapidly Deployable Collaborative UAS
(HERD-CU)
Critical Design Document
September 28, 2021
1

Nomenclature
CONOPS Concept of Operations
FMC Fully Mission Capable
GTOW Gross Take Off Weight
MSL Mean Sea Level
MTOW Maximum Take Off Weight
RFP Request for Proposal
UAS Unmanned Aerial System- includes ground systems, launch systems, and any UAV(s) required toprovide required overwatch duration.
UAV Unmanned Aerial Vehicle - a single aircraft.
Contents
1 General Information 71.1 Project Customer . . . . . . . . . . . . . . . . . . . . . . . . . . . . . . . . . . . . . . . . . . . 71.2 Team Members . . . . . . . . . . . . . . . . . . . . . . . . . . . . . . . . . . . . . . . . . . . . 7
2 Project Description 72.1 Project Purpose . . . . . . . . . . . . . . . . . . . . . . . . . . . . . . . . . . . . . . . . . . . 72.2 Previous Work . . . . . . . . . . . . . . . . . . . . . . . . . . . . . . . . . . . . . . . . . . . . 8
2.2.1 Existing Market . . . . . . . . . . . . . . . . . . . . . . . . . . . . . . . . . . . . . . . 82.2.2 Low Reynolds Number Aerodynamics . . . . . . . . . . . . . . . . . . . . . . . . . . . 92.2.3 Propulsion Efficiency . . . . . . . . . . . . . . . . . . . . . . . . . . . . . . . . . . . . . 92.2.4 Lightweight Composites . . . . . . . . . . . . . . . . . . . . . . . . . . . . . . . . . . . 102.2.5 Advanced Concepts . . . . . . . . . . . . . . . . . . . . . . . . . . . . . . . . . . . . . 10
2.3 Specific Objectives . . . . . . . . . . . . . . . . . . . . . . . . . . . . . . . . . . . . . . . . . . 112.4 Concept of Operations (CONOPS) . . . . . . . . . . . . . . . . . . . . . . . . . . . . . . . . . 132.5 Functional Block Diagram . . . . . . . . . . . . . . . . . . . . . . . . . . . . . . . . . . . . . . 142.6 Functional Requirements . . . . . . . . . . . . . . . . . . . . . . . . . . . . . . . . . . . . . . . 15
3 Design Requirements 16
4 Key Design Requirements - A Note 18
5 Level 1 Trade Study 195.1 Aircraft Type . . . . . . . . . . . . . . . . . . . . . . . . . . . . . . . . . . . . . . . . . . . . . 19
5.1.1 Fixed-Wing . . . . . . . . . . . . . . . . . . . . . . . . . . . . . . . . . . . . . . . . . . 195.1.2 Rotary . . . . . . . . . . . . . . . . . . . . . . . . . . . . . . . . . . . . . . . . . . . . . 195.1.3 Hybrid . . . . . . . . . . . . . . . . . . . . . . . . . . . . . . . . . . . . . . . . . . . . . 205.1.4 Dirigible/Lighter-than-Air . . . . . . . . . . . . . . . . . . . . . . . . . . . . . . . . . . 21
5.2 Level 1 Trade Study Criteria and Results . . . . . . . . . . . . . . . . . . . . . . . . . . . . . 225.2.1 Aircraft Type Criteria Assignment . . . . . . . . . . . . . . . . . . . . . . . . . . . . . 225.2.2 Aircraft Type Scale Assignment . . . . . . . . . . . . . . . . . . . . . . . . . . . . . . . 235.2.3 Aircraft Type Trade Study Results . . . . . . . . . . . . . . . . . . . . . . . . . . . . . 23
2

6 Level 2 Trade Study 246.1 Airframe Type . . . . . . . . . . . . . . . . . . . . . . . . . . . . . . . . . . . . . . . . . . . . 24
6.1.1 Conventional Fixed-Wing . . . . . . . . . . . . . . . . . . . . . . . . . . . . . . . . . . 246.1.2 Flying Wing . . . . . . . . . . . . . . . . . . . . . . . . . . . . . . . . . . . . . . . . . 24
6.2 Level 2 Trade Study Criteria and Results . . . . . . . . . . . . . . . . . . . . . . . . . . . . . 256.2.1 Airframe Criteria and Scale Assignment . . . . . . . . . . . . . . . . . . . . . . . . . . 266.2.2 Airframe Trade Study Results . . . . . . . . . . . . . . . . . . . . . . . . . . . . . . . . 26
7 Level 3 Trade Studies 277.1 Wing Mounting Configuration . . . . . . . . . . . . . . . . . . . . . . . . . . . . . . . . . . . . 27
7.1.1 High Mounted Wings . . . . . . . . . . . . . . . . . . . . . . . . . . . . . . . . . . . . 277.1.2 Low/Mid Mounted Wings . . . . . . . . . . . . . . . . . . . . . . . . . . . . . . . . . . 287.1.3 Wing Mounting Configuration - Trade Study Criteria and Results . . . . . . . . . . . 287.1.4 Wing Mounting Configuration Criteria . . . . . . . . . . . . . . . . . . . . . . . . . . . 287.1.5 Wing Mounting Configuration Scale . . . . . . . . . . . . . . . . . . . . . . . . . . . . 297.1.6 Wing Mount Configuration Trade Study . . . . . . . . . . . . . . . . . . . . . . . . . . 29
7.2 Wing Design . . . . . . . . . . . . . . . . . . . . . . . . . . . . . . . . . . . . . . . . . . . . . 297.2.1 Aspect Ratio . . . . . . . . . . . . . . . . . . . . . . . . . . . . . . . . . . . . . . . . . 307.2.2 Wing Taper Ratio . . . . . . . . . . . . . . . . . . . . . . . . . . . . . . . . . . . . . . 317.2.3 Wing Sweep . . . . . . . . . . . . . . . . . . . . . . . . . . . . . . . . . . . . . . . . . . 327.2.4 Wing Geometry . . . . . . . . . . . . . . . . . . . . . . . . . . . . . . . . . . . . . . . 337.2.5 Dihedral and Anhedral Angle . . . . . . . . . . . . . . . . . . . . . . . . . . . . . . . . 347.2.6 Wing Design - Trade Study Criteria and Results . . . . . . . . . . . . . . . . . . . . . 35
7.3 Fuselage Profile . . . . . . . . . . . . . . . . . . . . . . . . . . . . . . . . . . . . . . . . . . . . 377.3.1 Rounded/Symmetrical . . . . . . . . . . . . . . . . . . . . . . . . . . . . . . . . . . . . 387.3.2 Variable/Tapered . . . . . . . . . . . . . . . . . . . . . . . . . . . . . . . . . . . . . . . 387.3.3 Fuselage Profile - Trade Study Criteria and Results . . . . . . . . . . . . . . . . . . . . 387.3.4 Fuselage Criteria . . . . . . . . . . . . . . . . . . . . . . . . . . . . . . . . . . . . . . . 397.3.5 Fuselage Scale Factor . . . . . . . . . . . . . . . . . . . . . . . . . . . . . . . . . . . . 397.3.6 Fuselage Trade Study Results . . . . . . . . . . . . . . . . . . . . . . . . . . . . . . . . 39
7.4 Propulsion System . . . . . . . . . . . . . . . . . . . . . . . . . . . . . . . . . . . . . . . . . . 397.4.1 Electric . . . . . . . . . . . . . . . . . . . . . . . . . . . . . . . . . . . . . . . . . . . . 407.4.2 Gasoline . . . . . . . . . . . . . . . . . . . . . . . . . . . . . . . . . . . . . . . . . . . . 407.4.3 Hybrid . . . . . . . . . . . . . . . . . . . . . . . . . . . . . . . . . . . . . . . . . . . . . 407.4.4 Propulsion System - Trade Study Criteria and Results . . . . . . . . . . . . . . . . . . 41
7.5 Launch System . . . . . . . . . . . . . . . . . . . . . . . . . . . . . . . . . . . . . . . . . . . . 427.5.1 Hand Launch . . . . . . . . . . . . . . . . . . . . . . . . . . . . . . . . . . . . . . . . . 427.5.2 Takeoff Runway . . . . . . . . . . . . . . . . . . . . . . . . . . . . . . . . . . . . . . . 437.5.3 Catapult . . . . . . . . . . . . . . . . . . . . . . . . . . . . . . . . . . . . . . . . . . . 437.5.4 Vertical Takeoff . . . . . . . . . . . . . . . . . . . . . . . . . . . . . . . . . . . . . . . . 447.5.5 Balloon . . . . . . . . . . . . . . . . . . . . . . . . . . . . . . . . . . . . . . . . . . . . 457.5.6 Launch System - Trade Study Criteria and Results . . . . . . . . . . . . . . . . . . . . 46
7.6 Tail Configuration . . . . . . . . . . . . . . . . . . . . . . . . . . . . . . . . . . . . . . . . . . 477.6.1 Conventional . . . . . . . . . . . . . . . . . . . . . . . . . . . . . . . . . . . . . . . . . 477.6.2 T-Tail . . . . . . . . . . . . . . . . . . . . . . . . . . . . . . . . . . . . . . . . . . . . . 487.6.3 Cruciform . . . . . . . . . . . . . . . . . . . . . . . . . . . . . . . . . . . . . . . . . . . 487.6.4 V-Tail . . . . . . . . . . . . . . . . . . . . . . . . . . . . . . . . . . . . . . . . . . . . . 497.6.5 Inverted V-tail . . . . . . . . . . . . . . . . . . . . . . . . . . . . . . . . . . . . . . . . 497.6.6 Twin Tail . . . . . . . . . . . . . . . . . . . . . . . . . . . . . . . . . . . . . . . . . . . 507.6.7 Boom Mounted . . . . . . . . . . . . . . . . . . . . . . . . . . . . . . . . . . . . . . . . 507.6.8 Tail Configuration - Trade Study Criteria and Results . . . . . . . . . . . . . . . . . . 50
7.7 Materials . . . . . . . . . . . . . . . . . . . . . . . . . . . . . . . . . . . . . . . . . . . . . . . 527.7.1 Wood . . . . . . . . . . . . . . . . . . . . . . . . . . . . . . . . . . . . . . . . . . . . . 527.7.2 Composites . . . . . . . . . . . . . . . . . . . . . . . . . . . . . . . . . . . . . . . . . . 53
3
7.7.3 EPP Expanded Polystyrene (Foam) . . . . . . . . . . . . . . . . . . . . . . . . . . . . 537.7.4 EPS Expanded Polystyrene (Foam) . . . . . . . . . . . . . . . . . . . . . . . . . . . . . 547.7.5 Metal . . . . . . . . . . . . . . . . . . . . . . . . . . . . . . . . . . . . . . . . . . . . . 547.7.6 Plastic . . . . . . . . . . . . . . . . . . . . . . . . . . . . . . . . . . . . . . . . . . . . . 54
7.8 Materials - Trade Study Criteria and Results . . . . . . . . . . . . . . . . . . . . . . . . . . . 557.9 Structures . . . . . . . . . . . . . . . . . . . . . . . . . . . . . . . . . . . . . . . . . . . . . . . 56
7.9.1 Monocoque . . . . . . . . . . . . . . . . . . . . . . . . . . . . . . . . . . . . . . . . . . 567.9.2 Rib and Spar . . . . . . . . . . . . . . . . . . . . . . . . . . . . . . . . . . . . . . . . . 577.9.3 Solid . . . . . . . . . . . . . . . . . . . . . . . . . . . . . . . . . . . . . . . . . . . . . . 577.9.4 Flat Plate . . . . . . . . . . . . . . . . . . . . . . . . . . . . . . . . . . . . . . . . . . . 577.9.5 Tubes and Rods . . . . . . . . . . . . . . . . . . . . . . . . . . . . . . . . . . . . . . . 587.9.6 External Bracing . . . . . . . . . . . . . . . . . . . . . . . . . . . . . . . . . . . . . . . 58
7.10 Structures - Trade Study Criteria and Results . . . . . . . . . . . . . . . . . . . . . . . . . . . 59
8 Selection of Baseline Design 608.1 Aircraft Type . . . . . . . . . . . . . . . . . . . . . . . . . . . . . . . . . . . . . . . . . . . . . 608.2 Airframe Selection . . . . . . . . . . . . . . . . . . . . . . . . . . . . . . . . . . . . . . . . . . 618.3 Tail Configuration . . . . . . . . . . . . . . . . . . . . . . . . . . . . . . . . . . . . . . . . . . 618.4 Wing Mounting . . . . . . . . . . . . . . . . . . . . . . . . . . . . . . . . . . . . . . . . . . . . 618.5 Wing Design . . . . . . . . . . . . . . . . . . . . . . . . . . . . . . . . . . . . . . . . . . . . . 618.6 Fuselage Profile . . . . . . . . . . . . . . . . . . . . . . . . . . . . . . . . . . . . . . . . . . . . 628.7 Propulsion System . . . . . . . . . . . . . . . . . . . . . . . . . . . . . . . . . . . . . . . . . . 628.8 Launch System . . . . . . . . . . . . . . . . . . . . . . . . . . . . . . . . . . . . . . . . . . . . 628.9 Materials and Structures . . . . . . . . . . . . . . . . . . . . . . . . . . . . . . . . . . . . . . . 62
8.9.1 Fuselage . . . . . . . . . . . . . . . . . . . . . . . . . . . . . . . . . . . . . . . . . . . . 628.9.2 Main Wing . . . . . . . . . . . . . . . . . . . . . . . . . . . . . . . . . . . . . . . . . . 628.9.3 Wing Extensions and Winglets . . . . . . . . . . . . . . . . . . . . . . . . . . . . . . . 628.9.4 Empennage . . . . . . . . . . . . . . . . . . . . . . . . . . . . . . . . . . . . . . . . . . 638.9.5 Tail Control Surfaces . . . . . . . . . . . . . . . . . . . . . . . . . . . . . . . . . . . . . 63
9 Acknowledgments 64
10 Appendix 6810.1 Appendix A - UAV Market Supplemental Analysis . . . . . . . . . . . . . . . . . . . . . . . . 6810.2 Appendix B - Aircraft Case Studies . . . . . . . . . . . . . . . . . . . . . . . . . . . . . . . . . 74
10.2.1 Hybrid UAV Case Study Information . . . . . . . . . . . . . . . . . . . . . . . . . . . 74
List of Figures
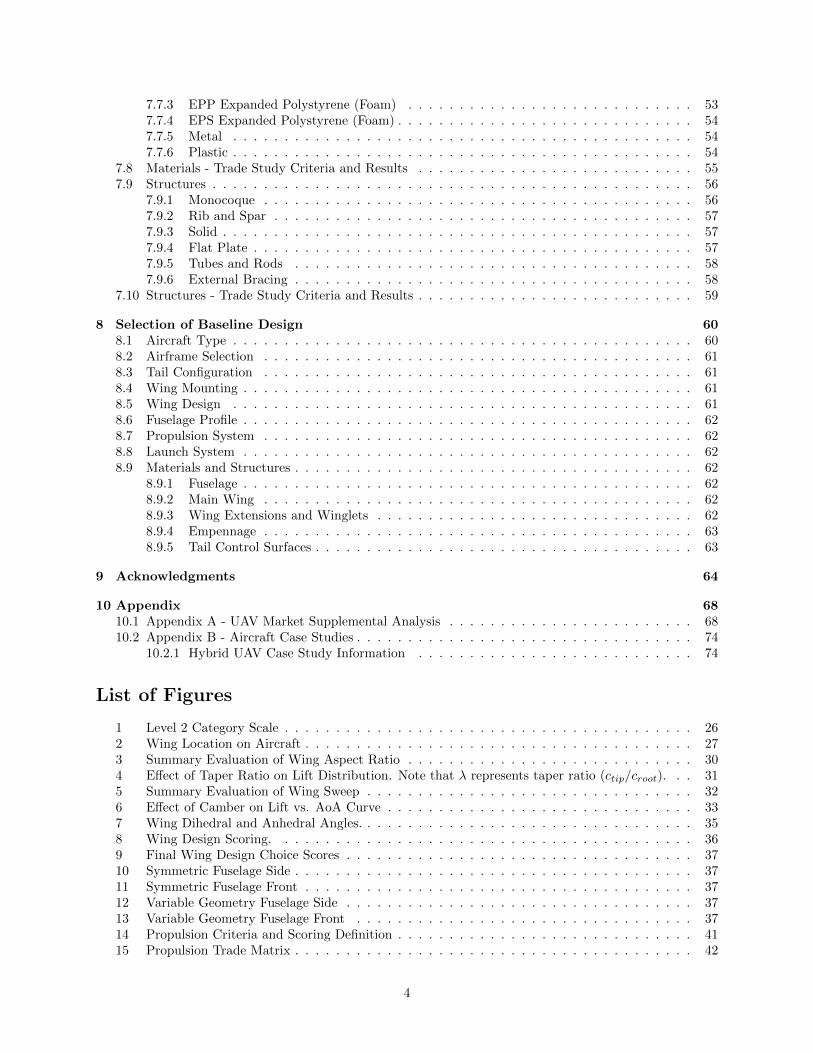
1 Level 2 Category Scale . . . . . . . . . . . . . . . . . . . . . . . . . . . . . . . . . . . . . . . . 262 Wing Location on Aircraft . . . . . . . . . . . . . . . . . . . . . . . . . . . . . . . . . . . . . . 273 Summary Evaluation of Wing Aspect Ratio . . . . . . . . . . . . . . . . . . . . . . . . . . . . 304 Effect of Taper Ratio on Lift Distribution. Note that λ represents taper ratio (ctip/croot). . . 315 Summary Evaluation of Wing Sweep . . . . . . . . . . . . . . . . . . . . . . . . . . . . . . . . 326 Effect of Camber on Lift vs. AoA Curve . . . . . . . . . . . . . . . . . . . . . . . . . . . . . . 337 Wing Dihedral and Anhedral Angles. . . . . . . . . . . . . . . . . . . . . . . . . . . . . . . . . 358 Wing Design Scoring. . . . . . . . . . . . . . . . . . . . . . . . . . . . . . . . . . . . . . . . . 369 Final Wing Design Choice Scores . . . . . . . . . . . . . . . . . . . . . . . . . . . . . . . . . . 3710 Symmetric Fuselage Side . . . . . . . . . . . . . . . . . . . . . . . . . . . . . . . . . . . . . . . 3711 Symmetric Fuselage Front . . . . . . . . . . . . . . . . . . . . . . . . . . . . . . . . . . . . . . 3712 Variable Geometry Fuselage Side . . . . . . . . . . . . . . . . . . . . . . . . . . . . . . . . . . 3713 Variable Geometry Fuselage Front . . . . . . . . . . . . . . . . . . . . . . . . . . . . . . . . . 3714 Propulsion Criteria and Scoring Definition . . . . . . . . . . . . . . . . . . . . . . . . . . . . . 4115 Propulsion Trade Matrix . . . . . . . . . . . . . . . . . . . . . . . . . . . . . . . . . . . . . . . 42
4

16 A standard catapult design from Aeronautics Group’s Orbiter 2 UAV [26] . . . . . . . . . . . 4417 Tail Configurations . . . . . . . . . . . . . . . . . . . . . . . . . . . . . . . . . . . . . . . . . . 4718 Materials Criterion . . . . . . . . . . . . . . . . . . . . . . . . . . . . . . . . . . . . . . . . . . 5619 Comparisons of MTOW and Wingspan between conventional and flying wing UAVs . . . . . 6920 Comparisons of Endurance and Payload Weight between conventional and flying wing UAVs 6921 Comparisons of Total UAS weight (required to achieve 12 hours of continuous overwatch) and
payload/MTOW ratio between conventional and flying wing UAVs . . . . . . . . . . . . . . . 7022 Comparison of Endurance and Wingspan trends across the market . . . . . . . . . . . . . . . 7123 Comparison of Wingspan and MTOW trends across the market . . . . . . . . . . . . . . . . . 7124 Comparison of Endurance based on engine type and launch system . . . . . . . . . . . . . . . 7225 Visualization of MTOW by vehicle weight vs payload weight . . . . . . . . . . . . . . . . . . 7226 Market Performance Values . . . . . . . . . . . . . . . . . . . . . . . . . . . . . . . . . . . . . 73
List of Tables
1 Customer Information . . . . . . . . . . . . . . . . . . . . . . . . . . . . . . . . . . . . . . . . 72 Team Information . . . . . . . . . . . . . . . . . . . . . . . . . . . . . . . . . . . . . . . . . . 73 Functional Requirement 1 Design Requirements . . . . . . . . . . . . . . . . . . . . . . . . . . 164 Functional Requirement 2 Design Requirements . . . . . . . . . . . . . . . . . . . . . . . . . . 165 Functional Requirement 3 Design Requirements . . . . . . . . . . . . . . . . . . . . . . . . . . 166 Functional Requirement 4 Design Requirements . . . . . . . . . . . . . . . . . . . . . . . . . . 177 Functional Requirement 5 Design Requirements . . . . . . . . . . . . . . . . . . . . . . . . . . 178 Functional Requirement 6 Design Requirements . . . . . . . . . . . . . . . . . . . . . . . . . . 179 Functional Requirement 7 Design Requirements . . . . . . . . . . . . . . . . . . . . . . . . . . 1810 Functional Requirement 8 Design Requirements . . . . . . . . . . . . . . . . . . . . . . . . . . 1811 Functional Requirement 9 Design Requirement . . . . . . . . . . . . . . . . . . . . . . . . . . 1812 Fixed-Wing UAV Pros and Cons . . . . . . . . . . . . . . . . . . . . . . . . . . . . . . . . . . 1913 Helicopter Pros and Cons . . . . . . . . . . . . . . . . . . . . . . . . . . . . . . . . . . . . . . 2014 Multirotor Pros and Cons . . . . . . . . . . . . . . . . . . . . . . . . . . . . . . . . . . . . . . 2015 Hybrid UAVs Pros and Cons . . . . . . . . . . . . . . . . . . . . . . . . . . . . . . . . . . . . 2116 Lighter-than-Air-Vehicle Pros and Cons . . . . . . . . . . . . . . . . . . . . . . . . . . . . . . 2217 Aircraft Platform Trade Study Criteria and Weighting . . . . . . . . . . . . . . . . . . . . . . 2218 Level 1 Trade Points and Scales . . . . . . . . . . . . . . . . . . . . . . . . . . . . . . . . . . . 2319 Level 1 Platform Trade Study Results . . . . . . . . . . . . . . . . . . . . . . . . . . . . . . . 2320 Conventional Fixed Wings Pros and Cons . . . . . . . . . . . . . . . . . . . . . . . . . . . . . 2421 Flying Wing Pros and Cons . . . . . . . . . . . . . . . . . . . . . . . . . . . . . . . . . . . . . 2522 Level 2 Trade Study Criteria and Descriptions . . . . . . . . . . . . . . . . . . . . . . . . . . . 2523 Airframe Trade Study Results . . . . . . . . . . . . . . . . . . . . . . . . . . . . . . . . . . . . 2624 High Mounted Wings Pros and Cons . . . . . . . . . . . . . . . . . . . . . . . . . . . . . . . . 2825 Low/Mid Mounted Wing Pros and Cons . . . . . . . . . . . . . . . . . . . . . . . . . . . . . . 2826 Wing Mount Configuration Criteria . . . . . . . . . . . . . . . . . . . . . . . . . . . . . . . . 2927 Wing Mounting Configuration Scale . . . . . . . . . . . . . . . . . . . . . . . . . . . . . . . . 2928 Wing Mount Trade Study . . . . . . . . . . . . . . . . . . . . . . . . . . . . . . . . . . . . . . 2929 High Aspect Ratio . . . . . . . . . . . . . . . . . . . . . . . . . . . . . . . . . . . . . . . . . . 3030 Low Aspect Ratio . . . . . . . . . . . . . . . . . . . . . . . . . . . . . . . . . . . . . . . . . . 3131 Taper Ratio Pros and Cons . . . . . . . . . . . . . . . . . . . . . . . . . . . . . . . . . . . . . 3232 Large Wing Sweep . . . . . . . . . . . . . . . . . . . . . . . . . . . . . . . . . . . . . . . . . . 3233 Small Wing Sweep . . . . . . . . . . . . . . . . . . . . . . . . . . . . . . . . . . . . . . . . . . 3334 Cambered Wing . . . . . . . . . . . . . . . . . . . . . . . . . . . . . . . . . . . . . . . . . . . 3435 Dihedral Wing Angle . . . . . . . . . . . . . . . . . . . . . . . . . . . . . . . . . . . . . . . . . 3536 Anhedral Wing Angle . . . . . . . . . . . . . . . . . . . . . . . . . . . . . . . . . . . . . . . . 3537 Symmetric Fuselage Pros and Cons . . . . . . . . . . . . . . . . . . . . . . . . . . . . . . . . . 3838 Variable/Tapered Fuselage Pros and Cons . . . . . . . . . . . . . . . . . . . . . . . . . . . . . 38
5
39 Fuselage Criteria . . . . . . . . . . . . . . . . . . . . . . . . . . . . . . . . . . . . . . . . . . . 3940 Fuselage Scale Factor . . . . . . . . . . . . . . . . . . . . . . . . . . . . . . . . . . . . . . . . . 3941 Fuselage Trade Study Results . . . . . . . . . . . . . . . . . . . . . . . . . . . . . . . . . . . . 3942 Electric Propulsion Pros and Cons . . . . . . . . . . . . . . . . . . . . . . . . . . . . . . . . . 4043 Gasoline Propulsion Pros and Cons . . . . . . . . . . . . . . . . . . . . . . . . . . . . . . . . . 4044 Hybrid Propulsion Pros and Cons . . . . . . . . . . . . . . . . . . . . . . . . . . . . . . . . . . 4145 Hand Launch Pros and Cons . . . . . . . . . . . . . . . . . . . . . . . . . . . . . . . . . . . . 4346 Takeoff Runway Pros and Cons . . . . . . . . . . . . . . . . . . . . . . . . . . . . . . . . . . . 4347 Catapult Pros and Cons . . . . . . . . . . . . . . . . . . . . . . . . . . . . . . . . . . . . . . . 4448 Vertical Launch System Pros and Cons . . . . . . . . . . . . . . . . . . . . . . . . . . . . . . . 4549 Balloon Launch Pros and Cons . . . . . . . . . . . . . . . . . . . . . . . . . . . . . . . . . . . 4550 Launch System Trade Study Setup and Descriptions . . . . . . . . . . . . . . . . . . . . . . . 4651 Launch System Trade Evaluations . . . . . . . . . . . . . . . . . . . . . . . . . . . . . . . . . 4652 Conventional Tail Pros and Cons . . . . . . . . . . . . . . . . . . . . . . . . . . . . . . . . . . 4853 T-Tail Pros and Cons . . . . . . . . . . . . . . . . . . . . . . . . . . . . . . . . . . . . . . . . 4854 Cruciform Tail Pros and Cons . . . . . . . . . . . . . . . . . . . . . . . . . . . . . . . . . . . . 4955 V-Tail Pros and Cons . . . . . . . . . . . . . . . . . . . . . . . . . . . . . . . . . . . . . . . . 4956 Inverted V-Tail Pros and Cons . . . . . . . . . . . . . . . . . . . . . . . . . . . . . . . . . . . 4957 Twin Tail Pros and Cons . . . . . . . . . . . . . . . . . . . . . . . . . . . . . . . . . . . . . . 5058 Boom Tail Pros and Cons . . . . . . . . . . . . . . . . . . . . . . . . . . . . . . . . . . . . . . 5059 Tail Trade Weighting . . . . . . . . . . . . . . . . . . . . . . . . . . . . . . . . . . . . . . . . . 5160 Tail Trade Scale . . . . . . . . . . . . . . . . . . . . . . . . . . . . . . . . . . . . . . . . . . . 5161 Tail Trade Matrix . . . . . . . . . . . . . . . . . . . . . . . . . . . . . . . . . . . . . . . . . . 5262 Balsa Wood Pros and Cons . . . . . . . . . . . . . . . . . . . . . . . . . . . . . . . . . . . . . 5263 Bass Wood Pros and Cons . . . . . . . . . . . . . . . . . . . . . . . . . . . . . . . . . . . . . . 5264 Carbon Fiber Pros and Cons . . . . . . . . . . . . . . . . . . . . . . . . . . . . . . . . . . . . 5365 Wonderflex Thermoplastic Pros and Cons . . . . . . . . . . . . . . . . . . . . . . . . . . . . . 5366 EPP Pros and Cons . . . . . . . . . . . . . . . . . . . . . . . . . . . . . . . . . . . . . . . . . 5367 EPS Pros and Cons . . . . . . . . . . . . . . . . . . . . . . . . . . . . . . . . . . . . . . . . . 5468 Metals Pros and Cons . . . . . . . . . . . . . . . . . . . . . . . . . . . . . . . . . . . . . . . . 5469 PLA Pros and Cons . . . . . . . . . . . . . . . . . . . . . . . . . . . . . . . . . . . . . . . . . 5470 ABS Pros and Cons . . . . . . . . . . . . . . . . . . . . . . . . . . . . . . . . . . . . . . . . . 5571 Materials Trade Study Criteria . . . . . . . . . . . . . . . . . . . . . . . . . . . . . . . . . . . 5572 Material Trade Matrix . . . . . . . . . . . . . . . . . . . . . . . . . . . . . . . . . . . . . . . . 5673 Monocoque Pros and Cons . . . . . . . . . . . . . . . . . . . . . . . . . . . . . . . . . . . . . . 5774 Rib and Spar Pros and Cons . . . . . . . . . . . . . . . . . . . . . . . . . . . . . . . . . . . . 5775 Solid Foam Pros and Cons . . . . . . . . . . . . . . . . . . . . . . . . . . . . . . . . . . . . . . 5776 Flat Plate Pros and Cons . . . . . . . . . . . . . . . . . . . . . . . . . . . . . . . . . . . . . . 5877 Tube and Rods Pros and Cons . . . . . . . . . . . . . . . . . . . . . . . . . . . . . . . . . . . 5878 Externally Braced Pros and Cons . . . . . . . . . . . . . . . . . . . . . . . . . . . . . . . . . . 5879 Structure Trade Study and Criteria Descriptions . . . . . . . . . . . . . . . . . . . . . . . . . 5980 Structure Criteria Weighting . . . . . . . . . . . . . . . . . . . . . . . . . . . . . . . . . . . . 5981 Structure Trade Study Results . . . . . . . . . . . . . . . . . . . . . . . . . . . . . . . . . . . 6082 A Market Analysis of performance values on a variety of fixed-wing small UAVs. . . . . . . . 6883 A Market Analysis of design factors on a variety of fixed-wing small UAVs. . . . . . . . . . . 68
6

1 General Information
1.1 Project Customer
Table 1: Customer Information
Professor John MahADDRESS: 3775 Discovery Dr, Boulder CO 80303Email: [email protected]: (303) 735-4900
1.2 Team Members
Table 2: Team Information
Selmo AlmeidaEmail: [email protected]: 520-425-7798
Nicholas BoenderEmail: [email protected]: 720-360-7402
Anthony DannaEmail: [email protected]: 936-465-6898
Ethan FleerEmail: [email protected]: 303-257-4107
Collin KasunicEmail: [email protected]: 303-889-9368
John OliverEmail: [email protected]: 828-707-8583
Jason PeloquinEmail: [email protected]: 785-317-2505
Vyacheslav RychenkoEmail: [email protected]: 720-220-2901
Patrick TippensEmail: [email protected]: 847-641-0509
Zachary VanlangendonckEmail: [email protected]: 813-751-5078
Dante VigilEmail: [email protected]: 970-231-2250
Christian WilliamsEmail: [email protected]: 217-371-6615
2 Project Description
2.1 Project Purpose
The purpose of Phase 1 of the High Endurance Rapidly Deployable Collaborative UAS (HERD-CU) isto develop a hardware proof of concept for a high endurance, human-portable, rapidly deployable unmannedaerial vehicle capable of supporting mission profiles that demand agility, low cost, high persistence, andbroad coverage capability. Potential missions may include, but are not limited to:
• Ad Hoc Emergency Management Observation, Command, Control, and Communications
– HERD-CU aims to develop an easily deployable mesh network of small UAVs to develop an ad hocairborne infrastructure to support the management of large scale emergency responses to eventssuch as hurricanes, earthquake’s or other man-made or natural disasters.
• Persistent Broad Area Search and Rescue in Austere Environments
– HERD-CU aims to develop a low-cost, user-friendly UAS that is capable of combining broad areacoverage for search and rescue with a communications relay to conduct and coordinate effectiveoperations in austere environments such as mountains, deserts and oceans.
7

• Persistent Broad Area Earth and Atmospheric Observation and Survey
– HERD-CU aims to develop a low-cost, persistent, broad area UAS platform to enable sustainedobservation, measurement, or surveys of broad areas in advancement of Earth and atmosphericobservation and research.
• Persistent Broad Area Combat Overwatch
– HERD-CU aims to develop broad area intelligence, surveillance, and reconnaissance capable UASwith the persistence to aid military units in developing larger situational awareness of the closebattlespace environment with improved endurance and observation field of view compared toexisting UAVs.
2.2 Previous Work
2.2.1 Existing Market
Small scale UAS overwatch capabilities exist such as the RQ-11b RAVEN, which has a military specificfocus. The RAVEN is a small, fixed-wing aircraft featuring a wingspan of 4.5 ft., a GTOW of 4.2 lbs andprovides an endurance of 60-90 minutes [1]. The RAVEN provides a high resolution, day/night cameraand also has infrared capabilities, which are used for real time feedback to operators on the ground. Theeffectiveness of this platform has been brought into question due to its limited endurance, a required 17lb. portable ground station, a required 2-operator specialty trained team, difficulty of launch, fixed payloadcapabilities, and a price tag of 174,000 USD per UAV [1]. The HERD-CU project aims to fix and exceedmany of the limitations displayed by the RAVEN by providing a low cost, single operator portable andrapidly deployable multi-role platform, featuring high endurance and simplicity of use.
Other larger scale UAV systems, like Boeing’s ScanEagle, have a significantly larger presence and weight.The ScanEagle has a 10.2 ft. wingspan, a 5.5 ft. length, a GTOW of 48.5 lbs., is powered by gasoline orheavy fuels (JP-5 or JP-8), and has an endurance of over 24 hours [5]. The ScanEagle is a reconnaissanceaircraft, capable of flying in extreme conditions while providing infrared imagery on a gyro-stabilized turret.The ScanEagle is also launched off of a mobile catapult launcher, and can be retrieved using a net systemwithout the use of a runway [4]. This UAV proves that unmanned flight for over 12 hours is possible, butwith a price tag of over 3.2 million USD, a wingspan of over 10 feet, and a GTOW of 48.5 pounds, it istoo large and much too expensive to be carried by one person and maintained by our target market. TheHERD-CU team recognizes the capability of using a gas powered UAV system (similar to the ScanEagle),and aims to provide a platform with similar endurance capability while achieving a low overall profile andcost.
Drones, such as quadrotors, provide a second approach to providing overwatch capability to operatorson the ground. Oklahoma State University is exploring quadrotor UAS systems to monitor their “patch”burning program. Patch burning occurs when the agricultural sector intentionally sets fire to their fields tocontrol tree growth and stimulate seed dispersal. This quad UAS is used to monitor the controlled fires’ burnpattern to mitigate accidental overburning. The use of quadrotors creates several disadvantages includinglimited endurance. The endurance of most rotor aircraft platforms is limited to 30 minutes before the systemmust be retrieved and batteries replaced [2]. Quadrotors have no aerodynamic efficiency and maximization ofsystem endurance is directly linked to battery capacity, which contributes to the overall weight an operatormust carry into the field. Additionally, the cost of drones with payload capabilities range from 10,000 to300,000 USD, making them a less attractive option when units will likely be lost during operations [3].Additionally, many twin gimbal drones weigh in at around 20 lbs [3] before auxiliary battery packs, placingconsiderable strain on operators during field deployment of the UAS. HERD-CU aims to create a lightweightmodular platform, which can easily be carried by a single operator and limits the need for constant UASservicing and communication/data blackouts during battery swaps.
2.2.1.1 Existing Market Numerical Analysis
To further the aforementioned research and attempt to quantify the current market, a compendium ofsmall fixed-wing UAVs was composed. A fixed wing aircraft analysis was performed explicitly due to their
8

prevalence in the high endurance UAV space. Each vehicle was determined to be single-man portable andfixed-wing. From there, the performance and design characteristics were tabulated and graphs were madeto help visualize trends in the data. This helped us to quantify a bevy of design decisions and created abenchmark for all other design options to be contrasted against. A full supplemental market analysis isprovided in the appendix but only highlights are mentioned here. After analysis of over 30 high enduranceUAV types several trends emerged which are listed below.
• Current man portable UAV endurance ranges between 2 and 6 hours
• UAV endurance is directly correlated to propulsion system choice
• A linear relationship exists between endurance and wingspan
• MTOW is directly related to propulsion system
• Single man portable UAS systems range between 15-35lbs
• Gas powered UAVs typically require a launch system
• Payload as a percentage of MTOW ranges between 15% and 40% and is impacted by propulsion system
The following references were used to put this data set together. [24, 25, 26, 27, 28, 29, 30, 31, 32, 33,34, 35, 36, 37, 38, 39, 40, 41, 42, 43, 44, 45, 46, 47]
2.2.2 Low Reynolds Number Aerodynamics
Academic dissertations of the aerodynamics for ultra-low Reynolds number flight provide key insightson efforts for best optimizing the system’s drag polar and overall aircraft endurance. In ultra-low Reynoldsnumber flight, studies by Dr. Kunz [9] provide aerodynamic phenomena which occur along airfoils duringlow Reynolds flight and the subsequent increase in viscous effects and boundary layer formations. Theseeffects are observed around Reynolds numbers of approximately 2000, resulting in delayed flow separation onthe trailing edge until higher angles of attack, greater achievable coefficients of lift, and increased operationalangle of attack ranges over conventional Reynolds numbers. This is due to lower Reynolds numbers producinglaminar flow. However, operating at ultra-low Reynolds numbers causes increased flow separation at zero-lift angles, increase in viscous effects, increase in total drag, and greatly diminished lift to drag ratios usingconventional Reynolds number airfoil designs. This is primarily due to the effective diminishing effects ofcamber, which when operating at low Reynolds numbers, creates an increased reduction in performance asairfoil thickness increases. Overall, Dr. Kunz theorized that an improvement in aerodynamic performancesmay be had with ultra-low Reynolds numbers provided that non-conventional airfoil designs be used to takeadvantage of the increased flow mechanics, extended separation of flow at higher angles of attack, and flightoperations at increased, steady-state lift coefficients.
2.2.3 Propulsion Efficiency
The performance of a propeller-driven aircraft is dependent upon both the structural properties of thepropeller and its design. Material selection is critical in order to ensure the propeller is able to withstand thehigh-tensile stresses during operation. Small Business Innovation Research Topic Number: N20A-T006 [13]sought to study the performance effects of different propeller designs dependent on material strength, density,and total weight. Designers of high-performance propellers use propeller-unique stress analysis packages thatcompute peak stress and fatigue endurance together with blade cross-section geometric properties requiredfor structural analysis. Stresses are evaluated in terms of bending (thrust and drag), centrifugal (inertia), andtorsional (acceleration) components. Low-strength material propellers must have a greater cross sectionalarea to achieve the same stress requirements as a lower cross section propeller made with high strengthmaterial. For greater endurance, it is desirable to have a thin propeller. Existing blades for small UnmannedAerial Systems (UAS) drones are approximately 16%-30% efficient in their conversion of rotational blademovement into thrust. With careful design and the use of advanced high-strength, high-modulus materials,this efficiency can be increased to greater than 80%. For example, this can improve existing 30-minute flight
9

duration to greater than 2 hours. If applied to small, tactical, fuel powered UAVs, such as ScanEagle orShadow, this efficiency increase will improve the distance traveled on a gallon of fuel for every 100 miles togreater than 150 miles. The HERD-CU team will ensure that adequate time and resources are implementedinto propeller selection as propulsive efficiency directly impacts overall mission success, particularly highendurance requirements.
2.2.4 Lightweight Composites
Research into lightweight composite materials has advanced greatly in recent history. Advanced com-posite materials can lead to a weight reduction from typical aerospace metals in the 20%-50% range, withthe low-end of this range being aluminum. Moreover, composites offer up to a 20% strength-to-weight ratioimprovement, high impact resistance, high damage tolerance, and corrosion prevention. Nonetheless, thereare several drawbacks of utilizing composite materials. They bring higher cost, non-visible impact damagewhich can raise costs by requiring non-destructive inspections and increased complexity of repairs. Com-posites also require isolation to prevent incidental galvanization of adjacent aluminum components. Withhigh endurance being a key component of the HERD-CU project, the use of composites to reduce weight isthe most attractive aspect of switching from traditional aerospace metals. However, it may not be withinbudgetary constraints, nor desired material properties to utilize composites for the entire vehicle. Yet, usingcomposites for various components where applicable is within reason and shall be considered during thestructural design phase. [11]
2.2.5 Advanced Concepts
Fish bone active camber (FBAC) airfoils have become a relatively new phenomenon in fixed-wing aircraft.These dynamic airfoils are biologically inspired from the anatomy of fish and can change shape in flight,altering the camber of the airfoil. FBAC systems typically consist of a pre-tensioned elastomeric matrixcomposite skin, and a pair of tendons coupled to a spooling pulley as the driving mechanism. Varioustension levels placed upon the airfoil tendon by the pulley create a change of airfoil shape, correlating tochanges in aerodynamic properties. Wind tunnel results of FBAC airfoils have produced results of 20-25%less drag versus conventional airfoils when angles of attack range between 5-10°. FBAC airfoils also producehigher L/D ratios in comparison to their conventional counterparts, making the exploration of an FBACsystem worthwhile to this project due to aircraft endurance being directly related to L/D Max. A tradestudy will be critical to determining if the 20-25% aerodynamic efficiency gains produced from FBAC airfoilsversus static airfoils are large enough to counteract the added complexity and weight byproducts FBACtechnologies produce [7].
10

2.3 Specific Objectives
• Endurance
– Level 1: UAV maintains 1 hour of continuous overwatch.
– Level 2: UAV maintains 3 hours of continuous overwatch.
– Level 3: UAV maintains 4 hours of continuous overwatch.
• Flight Ceiling
– Level 1: UAV shall be capable of operating at a minimum altitude of 5,700 ft. MSL.
– Level 2: UAV shall be capable of operating at an altitude up to 7,500 ft. MSL.
– Level 3: UAV shall be capable of operating at an altitude up to 10,000 ft. MSL.
• Payload
– Level 1: UAV shall be able to sustain a payload weight of up to 10% of the MTOW of the aircraftand volume of TBR cubic feet.
– Level 2: UAV shall be able to sustain a payload weight of up to 15% of the MTOW of the aircraftand volume of TBR cubic feet.
– Level 3: UAV shall be able to sustain a payload weight of up to 20% of the MTOW of the aircraftand volume of TBR cubic feet.
• Structural
– Level 1: UAV shall be capable of SLUF with no wind and level 1 payload.
– Level 2: UAV shall be capable of withstanding discrete wind gust loads for sharp-edged verticalgusts of 30ft/s and level 2 payload
– Level 3: UAV shall be capable of withstanding discrete wind gust loads for sharp-edged verticalgusts of 30ft/s and level 3 payload
• Avionics
– Level 1: UAV shall maintain a minimum of 100% operational capabilities at room temperature.
– Level 2: UAV shall maintain a minimum of 80% operational capabilities in a temperature rangebetween 32 and 90◦F and brief exposure to moisture/precipitation.
– Level 3: UAV shall maintain a minimum of 80% operational capabilities in a temperature rangebetween -20 to 110◦F and moderate exposure to moisture/precipitation.
• Launch
Note: All Launch levels of success are to be recorded from the point of release of the aircraft.
– Level 1: UAV shall be able to takeoff in an open clearing with a 100 ft. radius from launch andclear a 10 ft. obstacle (measured from the ground) at the end of launch radius.
– Level 2: UAV shall be able to takeoff in an open clearing with a 75 ft. radius and clear a 15 ft.obstacle (measured from the ground) at the end of launch radius.
– Level 3: UAV shall be able to takeoff in an open clearing with a 50 ft. radius and clear a 20 ft.obstacle (measured from the ground) at the end of launch radius.
11

• Portability
Note: All Portability levels of success are to be measured in its shortest state. If any pieces of theaircraft can be folded, removed, or shortened for transport, they shall be measured in that transportstate.
– Level 1: UAS shall be less than 5 feet in the longest linear dimension with a weight less than 50lbs.
– Level 2: UAS shall be less than 4 feet in the longest linear dimension with a weight less than 25lbs.
– Level 3: UAS shall be less than 3 feet in the longest linear dimension with a weight less than 15lbs.
• Stability
– Level 1: The UAV demonstrates positive static stability under no lateral winds.
– Level 2: The UAV demonstrates positive static stability and the control authority to stabilize ina 15ft/s lateral wind condition.
– Level 3: The UAV demonstrates positive static stability and the control authority to stabilize ina 20ft/s lateral wind condition.
• Reusability
– Level 1: UAV capable of making multiple flights with minimal damage occurring to major com-ponents upon landing.
– Level 2: UAV capable of making multiple flights with damage being limited to small, consumable/replaceable components upon landing (I.E. propellers, stabilizers) .
– Level 3: UAV capable of making multiple flights with no component damage.
• FAA Compliance
– Level 1: Refer to Level 3 success.
– Level 2: Refer to Level 3 success.
– Level 3: UAS shall adhere to FAA 14 CFR Part 107, SMALL UNMANNED AIRCRAFT SYS-TEMS, contingent on waivers.
• Cost
– Level 1: UAV, launch system and recovery system costs no more than 5,000 USD.
– Level 2: UAV, launch system and recovery system costs no more than 4,500 USD.
– Level 3: UAV, launch system and recovery system costs no more than 4,000 USD.
12
2.4 Concept of Operations (CONOPS)
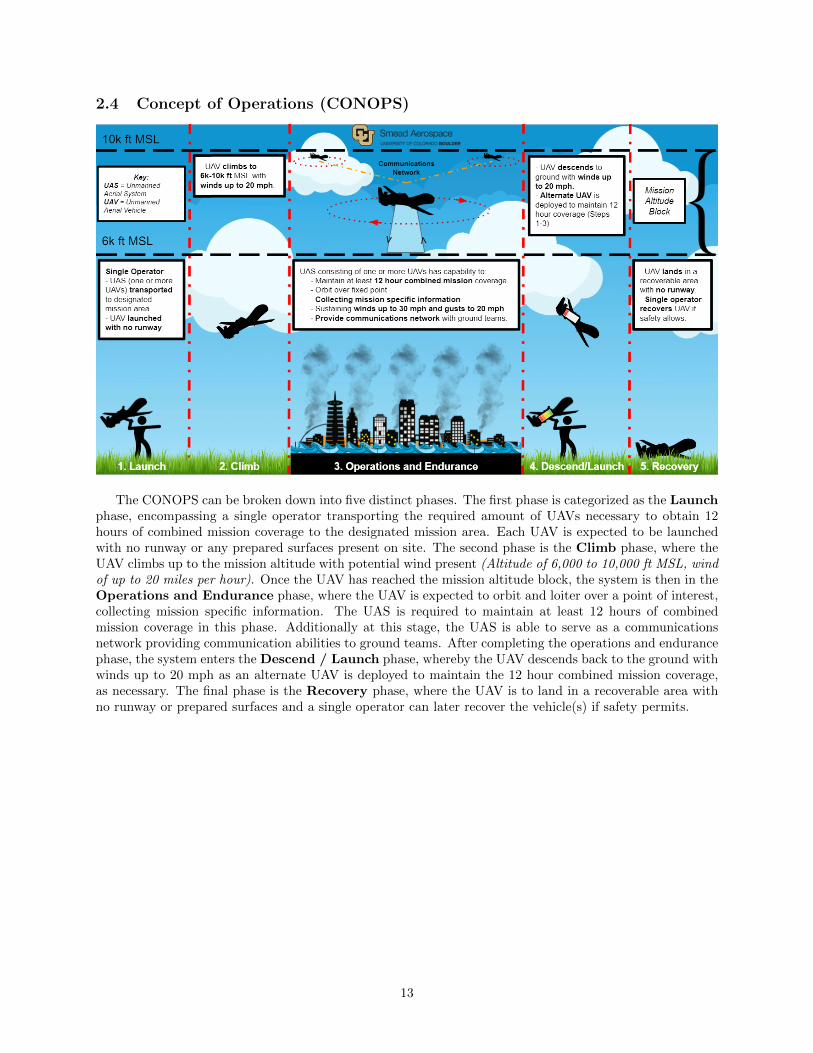
The CONOPS can be broken down into five distinct phases. The first phase is categorized as the Launchphase, encompassing a single operator transporting the required amount of UAVs necessary to obtain 12hours of combined mission coverage to the designated mission area. Each UAV is expected to be launchedwith no runway or any prepared surfaces present on site. The second phase is the Climb phase, where theUAV climbs up to the mission altitude with potential wind present (Altitude of 6,000 to 10,000 ft MSL, windof up to 20 miles per hour). Once the UAV has reached the mission altitude block, the system is then in theOperations and Endurance phase, where the UAV is expected to orbit and loiter over a point of interest,collecting mission specific information. The UAS is required to maintain at least 12 hours of combinedmission coverage in this phase. Additionally at this stage, the UAS is able to serve as a communicationsnetwork providing communication abilities to ground teams. After completing the operations and endurancephase, the system enters the Descend / Launch phase, whereby the UAV descends back to the ground withwinds up to 20 mph as an alternate UAV is deployed to maintain the 12 hour combined mission coverage,as necessary. The final phase is the Recovery phase, where the UAV is to land in a recoverable area withno runway or prepared surfaces and a single operator can later recover the vehicle(s) if safety permits.
13

2.5 Functional Block Diagram
KEY:Solid Arrows = Physical ConnectionsDashed Arrows = Connections via wireless method (Bluetooth, radio, etc)Yellow Arrows = Power Supply connections, highlighted in yellow to illustrate subsystem complexity
and importanceThe functional block diagram (FBD) is separated into three distinct systems including the ground control
system, the UAV system, and the communications network. In the ground control system, ground teamoperators utilize a control interface to interact with the UAV system. Using this interface, operators areable to obtain telemetry reading and a video feed from the airborne UAV system to assist them in theactive mission. Through this same controller, ground operators are able to reprogram the route, or area ofloiter, and use the drones as a mesh aerial communications network. This controller utilizes a combinationof receivers and transmitter to communicate with the UAV system.
On board the UAV system, there is a complementary set of transmitters and receivers that are used tocommunicate with the control interface. In addition to these components, a flight controller takes inputfrom the on-board telemetry transmitter and the RC transmitter implemented in the control interface. Theflight controller gives input to the servos responsible for the control surfaces (aileron, flaps, elevator andrudder) along with the motors driving the propellers. The flight controller processes the information in itsautopilot system which computes the flight optimization characteristics which are then implemented in theUAV system to help maximize endurance in the mission specified area. The autopilot and flight optimizationsystem are not the responsibility of HERD-CU Phase 1A, but are instead the focus of the Phase 1B team.
The final system in the FBD is the communications network, which helps serve as a mesh grid composed ofa number of additional UAV systems. The inclusion of this system allows the ground teams to communicatewith each other through a series of airborne UAVs connected through the communication receivers andtransmitters in each individual UAV system. This function was included separately of the UAV system inthe FBD, as the UAV can function without this system depending on the need of the operators and themission. The communications network component is present on each UAV, but may not be used for everymission and is not required to operate.
14
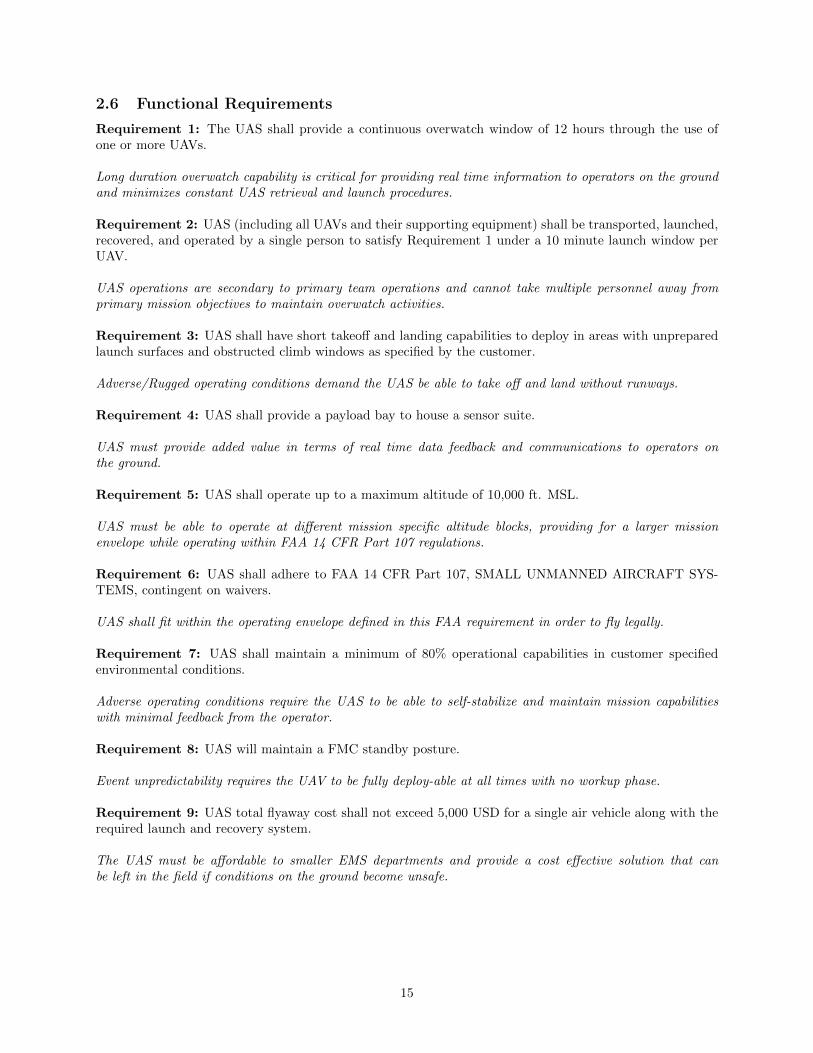
2.6 Functional Requirements
Requirement 1: The UAS shall provide a continuous overwatch window of 12 hours through the use ofone or more UAVs.
Long duration overwatch capability is critical for providing real time information to operators on the groundand minimizes constant UAS retrieval and launch procedures.
Requirement 2: UAS (including all UAVs and their supporting equipment) shall be transported, launched,recovered, and operated by a single person to satisfy Requirement 1 under a 10 minute launch window perUAV.
UAS operations are secondary to primary team operations and cannot take multiple personnel away fromprimary mission objectives to maintain overwatch activities.
Requirement 3: UAS shall have short takeoff and landing capabilities to deploy in areas with unpreparedlaunch surfaces and obstructed climb windows as specified by the customer.
Adverse/Rugged operating conditions demand the UAS be able to take off and land without runways.
Requirement 4: UAS shall provide a payload bay to house a sensor suite.
UAS must provide added value in terms of real time data feedback and communications to operators onthe ground.
Requirement 5: UAS shall operate up to a maximum altitude of 10,000 ft. MSL.
UAS must be able to operate at different mission specific altitude blocks, providing for a larger missionenvelope while operating within FAA 14 CFR Part 107 regulations.
Requirement 6: UAS shall adhere to FAA 14 CFR Part 107, SMALL UNMANNED AIRCRAFT SYS-TEMS, contingent on waivers.
UAS shall fit within the operating envelope defined in this FAA requirement in order to fly legally.
Requirement 7: UAS shall maintain a minimum of 80% operational capabilities in customer specifiedenvironmental conditions.
Adverse operating conditions require the UAS to be able to self-stabilize and maintain mission capabilitieswith minimal feedback from the operator.
Requirement 8: UAS will maintain a FMC standby posture.
Event unpredictability requires the UAV to be fully deploy-able at all times with no workup phase.
Requirement 9: UAS total flyaway cost shall not exceed 5,000 USD for a single air vehicle along with therequired launch and recovery system.
The UAS must be affordable to smaller EMS departments and provide a cost effective solution that canbe left in the field if conditions on the ground become unsafe.
15
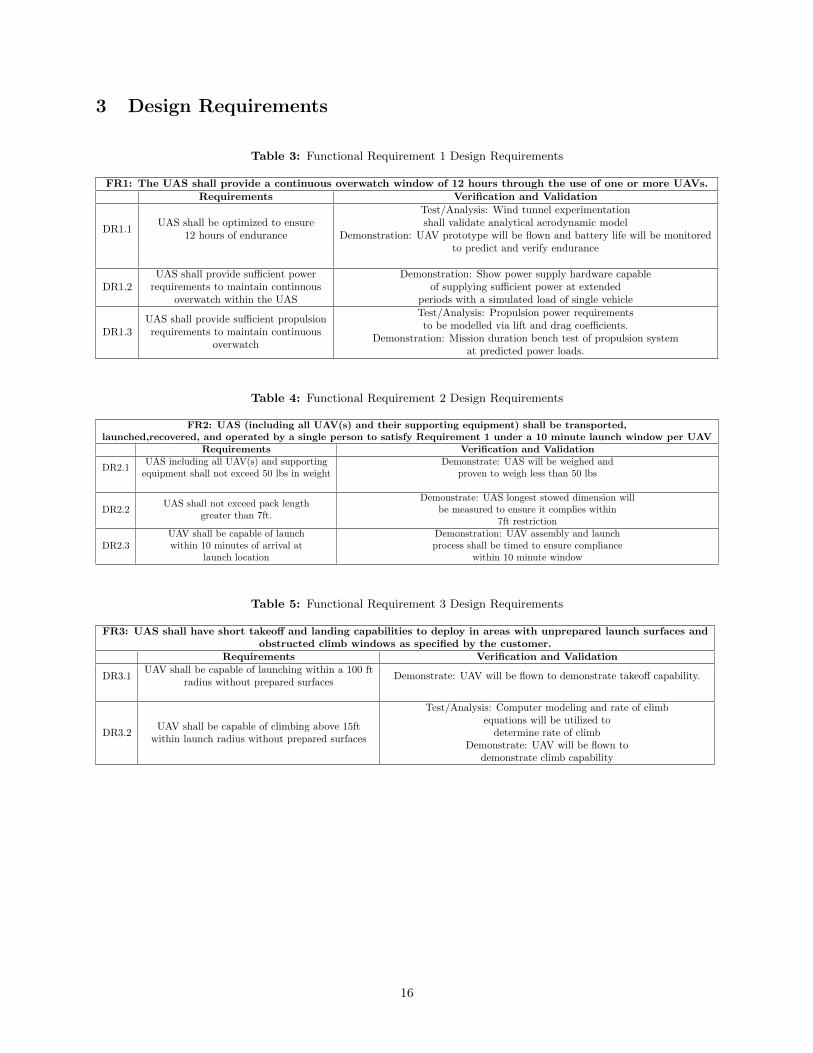
3 Design Requirements
Table 3: Functional Requirement 1 Design Requirements
FR1: The UAS shall provide a continuous overwatch window of 12 hours through the use of one or more UAVs.Requirements Verification and Validation
DR1.1UAS shall be optimized to ensure
12 hours of endurance
Test/Analysis: Wind tunnel experimentationshall validate analytical aerodynamic model
Demonstration: UAV prototype will be flown and battery life will be monitoredto predict and verify endurance
DR1.2UAS shall provide sufficient power
requirements to maintain continuousoverwatch within the UAS
Demonstration: Show power supply hardware capableof supplying sufficient power at extended
periods with a simulated load of single vehicle
DR1.3UAS shall provide sufficient propulsionrequirements to maintain continuous
overwatch
Test/Analysis: Propulsion power requirementsto be modelled via lift and drag coefficients.
Demonstration: Mission duration bench test of propulsion systemat predicted power loads.
Table 4: Functional Requirement 2 Design Requirements
FR2: UAS (including all UAV(s) and their supporting equipment) shall be transported,launched,recovered, and operated by a single person to satisfy Requirement 1 under a 10 minute launch window per UAV
Requirements Verification and Validation
DR2.1UAS including all UAV(s) and supporting
equipment shall not exceed 50 lbs in weightDemonstrate: UAS will be weighed and
proven to weigh less than 50 lbs
DR2.2UAS shall not exceed pack length
greater than 7ft.
Demonstrate: UAS longest stowed dimension willbe measured to ensure it complies within
7ft restriction
DR2.3UAV shall be capable of launchwithin 10 minutes of arrival at
launch location
Demonstration: UAV assembly and launchprocess shall be timed to ensure compliance
within 10 minute window
Table 5: Functional Requirement 3 Design Requirements
FR3: UAS shall have short takeoff and landing capabilities to deploy in areas with unprepared launch surfaces andobstructed climb windows as specified by the customer.
Requirements Verification and Validation
DR3.1UAV shall be capable of launching within a 100 ft
radius without prepared surfacesDemonstrate: UAV will be flown to demonstrate takeoff capability.
DR3.2UAV shall be capable of climbing above 15ft
within launch radius without prepared surfaces
Test/Analysis: Computer modeling and rate of climbequations will be utilized to
determine rate of climbDemonstrate: UAV will be flown to
demonstrate climb capability
16

Table 6: Functional Requirement 4 Design Requirements
FR4: UAS shall provide a payload bay to house a sensor suiteRequirements Verification and Validation
DR4.1UAV(s) shall provide a modular payload
bay
Demonstration: Mock payloads shall interactwith payload bay interface through structural mountsand electrical connections to prove secure mounting
and adequate support.
DR4.2Aircraft control and stability shall account for
payload presenceTest/Analysis: Validate aircraft dynamic modes.
Demonstration: UAV shall be flown with dummy payload
DR4.3Aircraft propulsion system shall be able to support
flight with payload weight
Test/Analysis: Static test stand firing of propulsionsystem shall validate thrust
capabilities to support variable payload
Table 7: Functional Requirement 5 Design Requirements
FR5: UAS shall operate up to a maximum altitude of 10,000 ft. MSLRequirements Verification and Validation
DR5.1UAV shall have aerodynamic capability to
operate up to maximum altitude of10,000 ft. MSL
Test/Analyze: Experimental data fromwind tunnel shall validate aerodynamic model for
max altitude operations
DR5.2UAV shall have propulsion capability to
operate up to a maximum altitude of10,000 ft.MSL
Test/Analysis: Experimental data fromstatic test stand will validate propulsion systems
ability to operate at altitude
DR5.3UAV shall be able to maintain control ability
at maximum altitude of 10,000 ft MSL
Test/Analysis: Experimental data from wind tunnelconcerning control surfaces will validate aircraftdynamic model in maximum altitude operation
Table 8: Functional Requirement 6 Design Requirements
FR 6: UAS shall adhere to FAA 14 CFR Part 107, SMALL UNMANNED AIRCRAFT SYSTEMS,contingent on waivers
Requirements Verification and Validation
DR6.1UAV shall operate under night and day conditions,
specified by FAA 14 CRF Part 107.29regulations contingent on users acquisition of waiver
Demonstrate: Observation of lights at 3mile distance shall be preformed
DR6.2UAV shall not exceed 87 kts (100 mph) as per
FAA 14 CRF Part 107.51Demonstrate: Throttling of propulsion systemto limit thrust output and aircraft’s velocity
17

Table 9: Functional Requirement 7 Design Requirements
FR 7: UAS shall maintain a minimum of 80% operational capabilities incustomer specified environmental conditions
Requirements Verification and Validation
DR7.1UAV(s) shall be capable of withstanding
operations within rain and snow conditionsDemonstrate: System will be exposed to
water/mist to validate waterproof/resistant capabilities
DR7.2UAV(s) shall be capable of operation within
a temperature range from-20 to 110 degrees Fahrenheit
Demonstrate: UAV or components will be exposed to specified temperaturesto validate robustness
DR7.3UAV(s) shall be capable of withstandingsharp-edge vertical wind gusts up 30 ft/s
throughout flight envelope
Test/Analysis: Using experimental data fromshear testing, analytical structural model integrity
will be verified
DR7.4UAV(s) shall be capable of withstandingwind gusts of 20 mph at surface duringlaunch and 30 mph at cruise altitude
Test/Analysis: Using experimental data fromshear testing, analytical structural model will
be verifiedDemonstrate: UAV will be exposed to various wind conditions
up to 30 mph generated by fans while fixed to a test stand
Table 10: Functional Requirement 8 Design Requirements
FR8: UAS will maintain a FMC standby postureRequirements Verification and Validation
DR8.1 UAS shall be maintainableDemonstrate: Complete field disassemblyand instruction manual shall be provided
that does not require specialty tools or techniques
DR8.2UAV(s) shall maintain full endurance capability
when in storageDemonstrate: Replacement / refueling of power source
possible without specialty training or tools
Table 11: Functional Requirement 9 Design Requirement
FR9: UAS total flyaway cost shall not exceed 5,000 USD for a single air vehicle along with the requiredlaunch and recovery system.
Requirements Verification and Validation
DR9.1 UAS shall cost no more than 5000 USDDetailed expense report will be produced
to verify budget compliance
4 Key Design Requirements - A Note
Due to the clean sheet nature of this project, Key Design Requirements required for the selection ofbaseline design fall across 3 different trade studies. First, the Level 1 Trade Study will compare differentair vehicles. The Level 2 Trade Study will narrow the chosen air vehicle to a defined airframe with uniquecharacteristics. The Level 3 Trade Study will begin looking at different subsystem solutions for the chosenairframe, and trade studies will be conducted for each subsystem. Pros and Cons of each solution investigatedat all three levels will be included, and each section will conclude with the results of each trade study.
18
5 Level 1 Trade Study
The Level 1 Trade Study determined which aircraft types produced the portability and endurance requiredby the customer. The solution space was comprised of a broad scope of air vehicles ranging from fixed-wingaircraft, Hybrid VTOL aircraft, Lighter-than-Air aircraft and rotary aircraft. To effectively analyze theaircraft space, the HERD-CU team was divided into sub teams to analyze each of the following aircrafttypes listed above. The research and analysis provided by each sub team was presented to the team as awhole to provide every member with a functional knowledge of each potential aircraft solution. During theLevel 1 Trade Study, each team member voted on each category outlined in Section 5.2 and a compositescore was generated with the winner determining the initial aircraft type.
5.1 Aircraft Type
5.1.1 Fixed-Wing
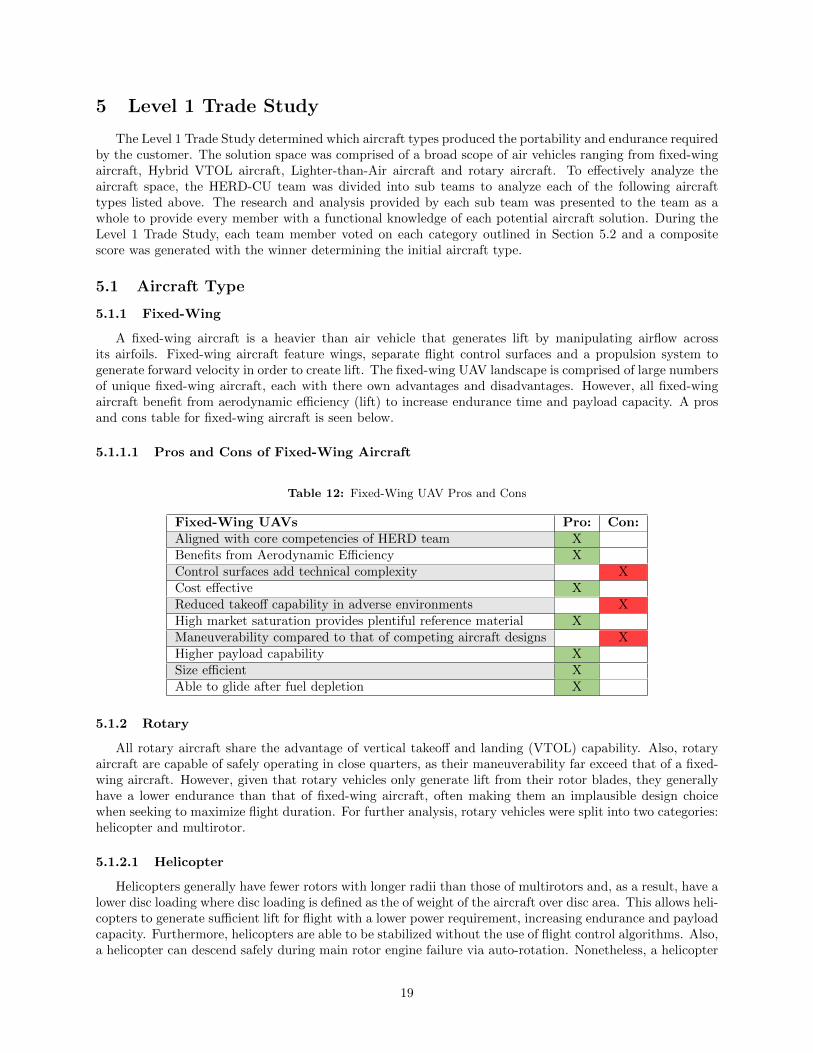
A fixed-wing aircraft is a heavier than air vehicle that generates lift by manipulating airflow acrossits airfoils. Fixed-wing aircraft feature wings, separate flight control surfaces and a propulsion system togenerate forward velocity in order to create lift. The fixed-wing UAV landscape is comprised of large numbersof unique fixed-wing aircraft, each with there own advantages and disadvantages. However, all fixed-wingaircraft benefit from aerodynamic efficiency (lift) to increase endurance time and payload capacity. A prosand cons table for fixed-wing aircraft is seen below.
5.1.1.1 Pros and Cons of Fixed-Wing Aircraft
Table 12: Fixed-Wing UAV Pros and Cons
Fixed-Wing UAVs Pro: Con:Aligned with core competencies of HERD team XBenefits from Aerodynamic Efficiency XControl surfaces add technical complexity XCost effective XReduced takeoff capability in adverse environments XHigh market saturation provides plentiful reference material XManeuverability compared to that of competing aircraft designs XHigher payload capability XSize efficient XAble to glide after fuel depletion X
5.1.2 Rotary
All rotary aircraft share the advantage of vertical takeoff and landing (VTOL) capability. Also, rotaryaircraft are capable of safely operating in close quarters, as their maneuverability far exceed that of a fixed-wing aircraft. However, given that rotary vehicles only generate lift from their rotor blades, they generallyhave a lower endurance than that of fixed-wing aircraft, often making them an implausible design choicewhen seeking to maximize flight duration. For further analysis, rotary vehicles were split into two categories:helicopter and multirotor.
5.1.2.1 Helicopter
Helicopters generally have fewer rotors with longer radii than those of multirotors and, as a result, have alower disc loading where disc loading is defined as the of weight of the aircraft over disc area. This allows heli-copters to generate sufficient lift for flight with a lower power requirement, increasing endurance and payloadcapacity. Furthermore, helicopters are able to be stabilized without the use of flight control algorithms. Also,a helicopter can descend safely during main rotor engine failure via auto-rotation. Nonetheless, a helicopter
19
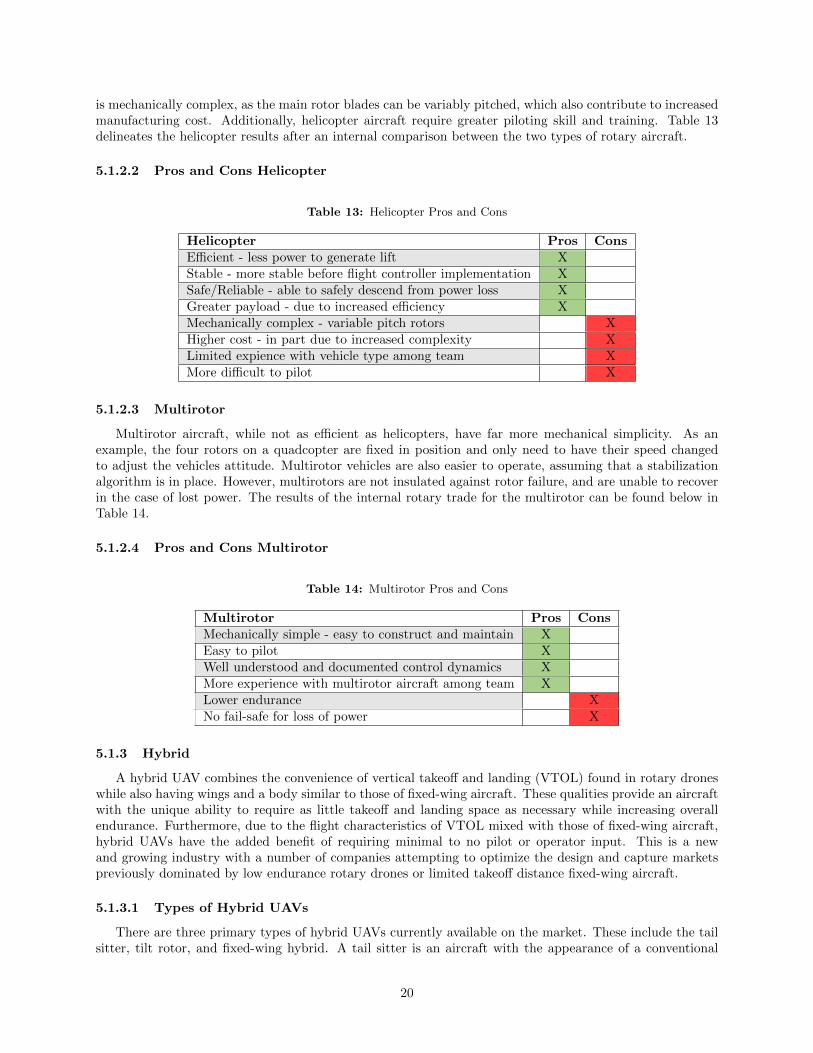
is mechanically complex, as the main rotor blades can be variably pitched, which also contribute to increasedmanufacturing cost. Additionally, helicopter aircraft require greater piloting skill and training. Table 13delineates the helicopter results after an internal comparison between the two types of rotary aircraft.
5.1.2.2 Pros and Cons Helicopter
Table 13: Helicopter Pros and Cons
Helicopter Pros ConsEfficient - less power to generate lift XStable - more stable before flight controller implementation XSafe/Reliable - able to safely descend from power loss XGreater payload - due to increased efficiency XMechanically complex - variable pitch rotors XHigher cost - in part due to increased complexity XLimited expience with vehicle type among team XMore difficult to pilot X
5.1.2.3 Multirotor
Multirotor aircraft, while not as efficient as helicopters, have far more mechanical simplicity. As anexample, the four rotors on a quadcopter are fixed in position and only need to have their speed changedto adjust the vehicles attitude. Multirotor vehicles are also easier to operate, assuming that a stabilizationalgorithm is in place. However, multirotors are not insulated against rotor failure, and are unable to recoverin the case of lost power. The results of the internal rotary trade for the multirotor can be found below inTable 14.
5.1.2.4 Pros and Cons Multirotor
Table 14: Multirotor Pros and Cons
Multirotor Pros ConsMechanically simple - easy to construct and maintain XEasy to pilot XWell understood and documented control dynamics XMore experience with multirotor aircraft among team XLower endurance XNo fail-safe for loss of power X
5.1.3 Hybrid
A hybrid UAV combines the convenience of vertical takeoff and landing (VTOL) found in rotary droneswhile also having wings and a body similar to those of fixed-wing aircraft. These qualities provide an aircraftwith the unique ability to require as little takeoff and landing space as necessary while increasing overallendurance. Furthermore, due to the flight characteristics of VTOL mixed with those of fixed-wing aircraft,hybrid UAVs have the added benefit of requiring minimal to no pilot or operator input. This is a newand growing industry with a number of companies attempting to optimize the design and capture marketspreviously dominated by low endurance rotary drones or limited takeoff distance fixed-wing aircraft.
5.1.3.1 Types of Hybrid UAVs
There are three primary types of hybrid UAVs currently available on the market. These include the tailsitter, tilt rotor, and fixed-wing hybrid. A tail sitter is an aircraft with the appearance of a conventional
20

aircraft with the exception of the tail sitting on the ground. This type of aircraft rests in a launch posi-tion similar to that of a rocket where, once reaching the optimal altitude, the aircraft pitches itself into aconventional aircraft flight pattern.
Tilt rotor UAVs are aircraft where the rotors, and in some cases the whole wing, can swivel the thrustvector from parallel with the ground to pointing normal to the ground. This provides tilt rotor UAVs withthe unique flight characteristic of having vertical takeoff and landing (VTOL) while also given them theability to fly like a conventional aircraft.
The final type of hybrid UAV is a known as fixed-wing hybrid. This design utilizes rotary units either byintegrating them directly into the aircraft body/fuselage or through other attachment mechanisms. Whatsets the fixed-wing hybrid apart is that only one mode of flight can be operational at a time and the aircraftis required to switch between them. More specifically, the aircraft must power either the VTOL rotary unitsor the fixed-wing propellers separately during specific parts of flight such as takeoff and landing or whilemaintaining flight. A pros and cons table for Hybrid UAVs is seen below.
5.1.3.2 Pros and Cons of Hybrid UAVs
Table 15: Hybrid UAVs Pros and Cons
Hybrid UAVs Pro: Con:Launchable in harsher, more restrictive terrain XBenefits from Aerodynamic Efficiency XEasy to Launch and Recover XAdditional Weight XTechnically complex XRoom for exploration and growth in market XLess resources available due to low market saturation XAdditional control law needed for VTOL XUnfamiliar to HERD team, no experience with Hybrid UAVs XAble to glide after fuel depletion X
Note - Case Studies of Hybrid UAVs: The information seen in the table above is derived fromcase studies and other market research on Hybrid UAVs. For more information summarizing case studies onHybrid UAVs, see Appendix B, Section 10.2.1.
5.1.4 Dirigible/Lighter-than-Air
Dirigibles and lighter than air vehicles rely on the buoyancy of lighter-than-air gasses (like helium) asthe primary lifting force. These vehicles are typically blimps, dirigibles, or balloons. Blimps and dirigiblesuse control surfaces and some form of propulsion system to change their orientation, while balloons have nocontrol system and are susceptible to movement by the wind and by thermal columns. This design spacewas initially investigated due to the high endurance of these air vehicles.
5.1.4.1 Previous History
One major study was referenced frequently when researching a viable lighter-than-air vehicle design. Astudy on nano-blimp endurance was conducted at the University of Bologna, Italy [19] with the goal ofmaximizing blimp endurance through motor duty-cycling and the addition of a top mounted solar panel.The nano-blimp that was created had an endurance of 25 hours while duty-cycling the lifting motor, anda 100+ hour endurance with the solar panel addition [19]. These endurance figures are also from lettingthe nano-blimp hover indoors in a well lit room. These are attractive numbers to solve the challenge of airvehicle endurance, but came with significant drawbacks. A pros and cons table for Lighter-than-Air vehiclesis seen below.
21

5.1.4.2 Pros and Cons of Lighter-than-Air Vehicles
Table 16: Lighter-than-Air-Vehicle Pros and Cons
Lighter-Than-Air Aircraft Pro: Con:High Endurance XSimple Construction XSimple Control Law (Lack of Many AerodynamicControl Surfaces)
X
Massive Size for reasonable Payload(est. payload 1 kg, Balloon Diameter ≈ 22.75m2,volume ≈ 9.1m3 , scaled from [16])
X
Foldable when deflated XInflation capabilities limited to one person(9 mˆ3 Helium canisters weight upwards of 50kg)
X
Increased endurance with Solar Panel XSolar Panel endurance only increased whenweather is good on a clear day
X
Helium shortage causes high prices and high demand XDifficult to control in wind due to low effective mass X
5.2 Level 1 Trade Study Criteria and Results
Customer meetings and an analysis of the provided RFP provided categories for Level 1 Trade Studyranking criteria. Each category was assigned a weight which was directly proportional to the design require-ments outlined in the RFP by the customer. An additional category of feasibility was also introduced toensure the final design could be built with the teams core competencies and project timeline. The Level1 weighted categories and their scoring criteria are shown below in Tables 17 and 18, with the results ofthe Level 1 Trade Matrix shown in Table 19. A brief explanation of the Level 1 criteria is also included inSection 5.2.1.
5.2.1 Aircraft Type Criteria Assignment
Table 17: Aircraft Platform Trade Study Criteria and Weighting
Categories Weight (%) DescriptionEndurance 30% Projected endurance of airframe in hours, conducted through market analysisProbability of Success 20% Composite team opinion on the feasibility of completing a working prototype in 12 weeksLaunch/Recovery 20% Estimated takeoff and landing radius for each platformBudget 15% Binary category determining if the UAS can be completed within budgetPortability 15% Estimated total UAS weight to provide a continous 12 hour overwatch
The client RFP and meetings provided a rubric for criteria suited to appropriately rank the different airvehicle options outlined in Section 5.1. These criterion are explained below.
Endurance, 30%: The clients highest priority is developing a platform which can provide a continuous12 hour overwatch with one or multiple UAVs. Endurance is the highest weighted category as a result.
Launch/Recovery, 20%: The projects secondary goals are to create a platform that is also portablewith short takeoff and landing characteristics. The Launch/Recovery category was assigned a weight of 20%to insure each down selected platform had the capability to takeoff in under a 100 ft radius in obstructedareas as outlined by the client.
Portability, 15%: Portability is counteractive to aircraft endurance and launch/recovery, which wereprimary requests from the client. It is weighted as 15% as a result.
22
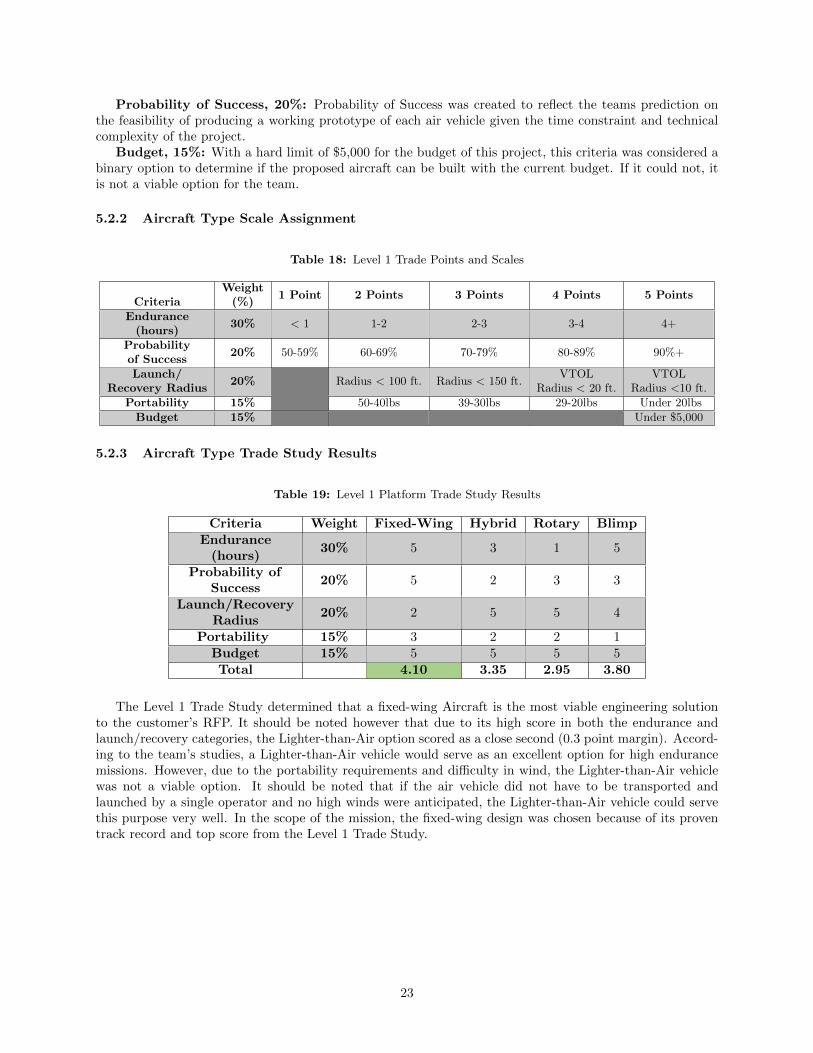
Probability of Success, 20%: Probability of Success was created to reflect the teams prediction onthe feasibility of producing a working prototype of each air vehicle given the time constraint and technicalcomplexity of the project.
Budget, 15%: With a hard limit of $5,000 for the budget of this project, this criteria was considered abinary option to determine if the proposed aircraft can be built with the current budget. If it could not, itis not a viable option for the team.
5.2.2 Aircraft Type Scale Assignment
Table 18: Level 1 Trade Points and Scales
CriteriaWeight
(%)1 Point 2 Points 3 Points 4 Points 5 Points
Endurance(hours)
30% < 1 1-2 2-3 3-4 4+
Probabilityof Success
20% 50-59% 60-69% 70-79% 80-89% 90%+
Launch/Recovery Radius
20% Radius < 100 ft. Radius < 150 ft.VTOL
Radius < 20 ft.VTOL
Radius <10 ft.Portability 15% 50-40lbs 39-30lbs 29-20lbs Under 20lbs
Budget 15% Under $5,000
5.2.3 Aircraft Type Trade Study Results
Table 19: Level 1 Platform Trade Study Results
Criteria Weight Fixed-Wing Hybrid Rotary BlimpEndurance
(hours)30% 5 3 1 5
Probability ofSuccess
20% 5 2 3 3
Launch/RecoveryRadius
20% 2 5 5 4
Portability 15% 3 2 2 1Budget 15% 5 5 5 5Total 4.10 3.35 2.95 3.80
The Level 1 Trade Study determined that a fixed-wing Aircraft is the most viable engineering solutionto the customer’s RFP. It should be noted however that due to its high score in both the endurance andlaunch/recovery categories, the Lighter-than-Air option scored as a close second (0.3 point margin). Accord-ing to the team’s studies, a Lighter-than-Air vehicle would serve as an excellent option for high endurancemissions. However, due to the portability requirements and difficulty in wind, the Lighter-than-Air vehiclewas not a viable option. It should be noted that if the air vehicle did not have to be transported andlaunched by a single operator and no high winds were anticipated, the Lighter-than-Air vehicle could servethis purpose very well. In the scope of the mission, the fixed-wing design was chosen because of its proventrack record and top score from the Level 1 Trade Study.
23
6 Level 2 Trade Study
6.1 Airframe Type
With initial trades concluding in favor of a fixed-wing aircraft, the second level of trades involved downselecting between the two dominant types of vehicles within the fixed-wing domain: conventional and flyingwing. Note that aircraft that may be designated as blended wing body or lifting body designs are not directlyconsidered here. Such designs can be thought to have properties of both conventional fixed-wing aircraftand flying wing aircraft. Here, the purpose was to compare the properties and design considerations of whatwould be considered a pure conventional fixed-wing aircraft and flying wing aircraft.
6.1.1 Conventional Fixed-Wing
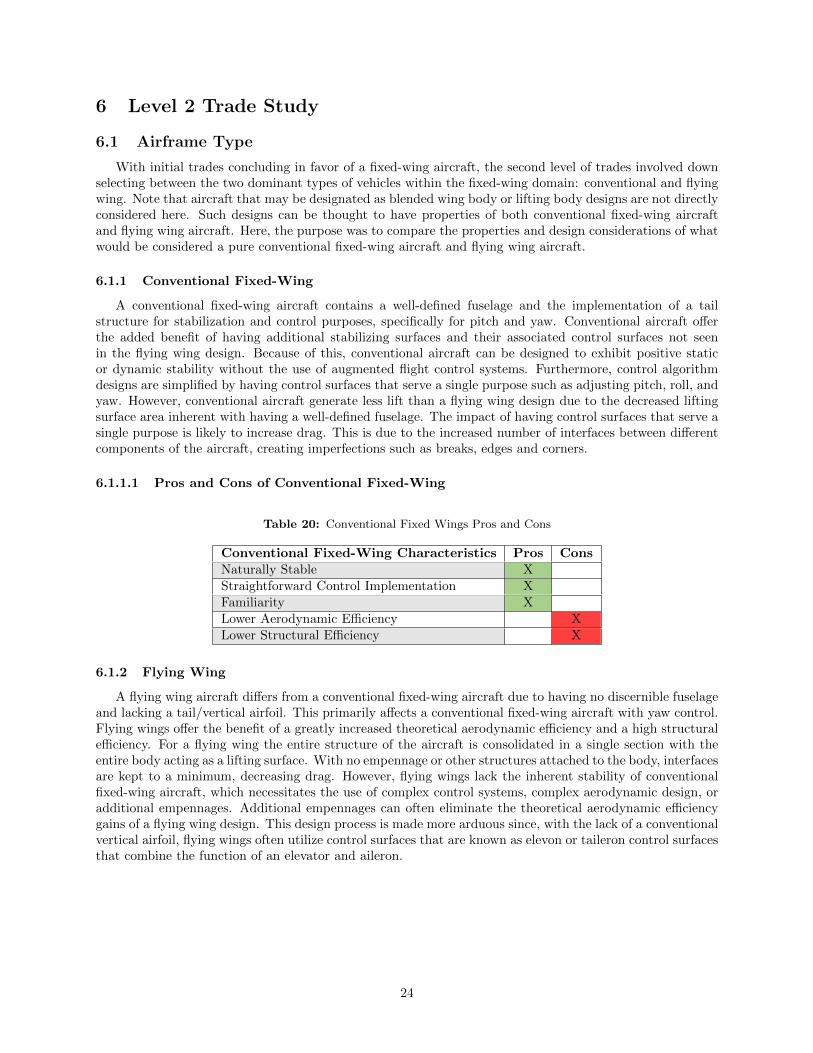
A conventional fixed-wing aircraft contains a well-defined fuselage and the implementation of a tailstructure for stabilization and control purposes, specifically for pitch and yaw. Conventional aircraft offerthe added benefit of having additional stabilizing surfaces and their associated control surfaces not seenin the flying wing design. Because of this, conventional aircraft can be designed to exhibit positive staticor dynamic stability without the use of augmented flight control systems. Furthermore, control algorithmdesigns are simplified by having control surfaces that serve a single purpose such as adjusting pitch, roll, andyaw. However, conventional aircraft generate less lift than a flying wing design due to the decreased liftingsurface area inherent with having a well-defined fuselage. The impact of having control surfaces that serve asingle purpose is likely to increase drag. This is due to the increased number of interfaces between differentcomponents of the aircraft, creating imperfections such as breaks, edges and corners.
6.1.1.1 Pros and Cons of Conventional Fixed-Wing
Table 20: Conventional Fixed Wings Pros and Cons
Conventional Fixed-Wing Characteristics Pros ConsNaturally Stable XStraightforward Control Implementation XFamiliarity XLower Aerodynamic Efficiency XLower Structural Efficiency X
6.1.2 Flying Wing
A flying wing aircraft differs from a conventional fixed-wing aircraft due to having no discernible fuselageand lacking a tail/vertical airfoil. This primarily affects a conventional fixed-wing aircraft with yaw control.Flying wings offer the benefit of a greatly increased theoretical aerodynamic efficiency and a high structuralefficiency. For a flying wing the entire structure of the aircraft is consolidated in a single section with theentire body acting as a lifting surface. With no empennage or other structures attached to the body, interfacesare kept to a minimum, decreasing drag. However, flying wings lack the inherent stability of conventionalfixed-wing aircraft, which necessitates the use of complex control systems, complex aerodynamic design, oradditional empennages. Additional empennages can often eliminate the theoretical aerodynamic efficiencygains of a flying wing design. This design process is made more arduous since, with the lack of a conventionalvertical airfoil, flying wings often utilize control surfaces that are known as elevon or taileron control surfacesthat combine the function of an elevator and aileron.
24
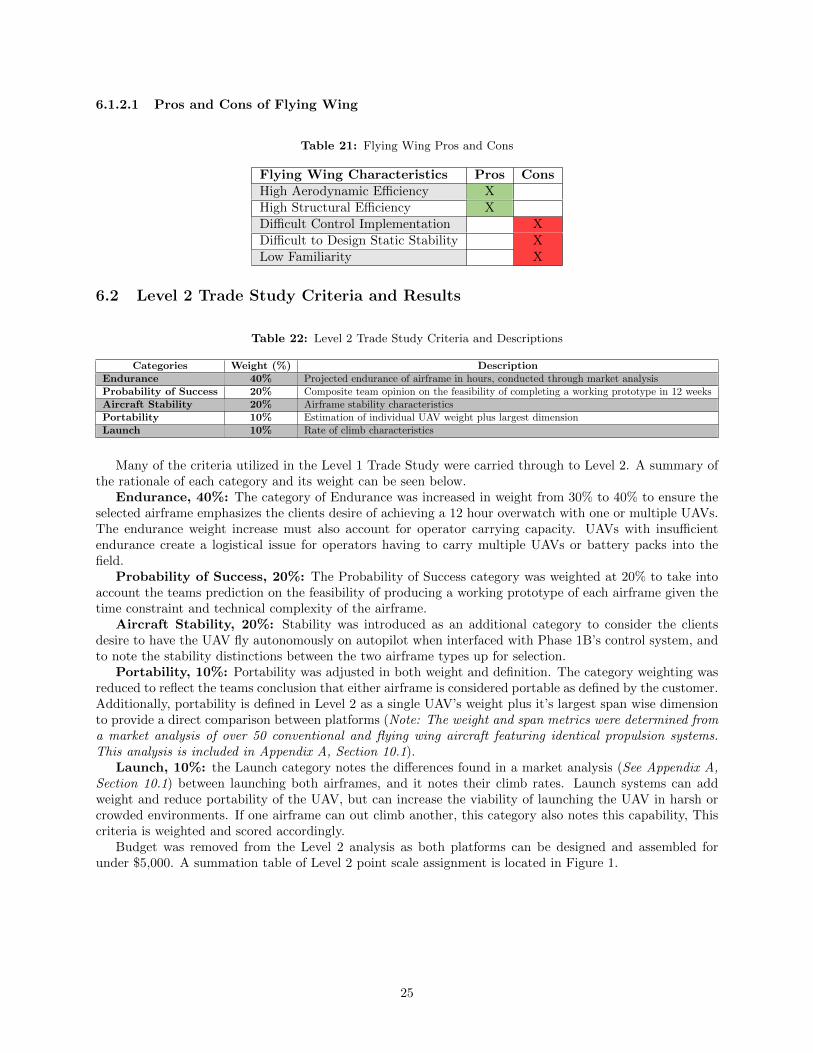
6.1.2.1 Pros and Cons of Flying Wing
Table 21: Flying Wing Pros and Cons
Flying Wing Characteristics Pros ConsHigh Aerodynamic Efficiency XHigh Structural Efficiency XDifficult Control Implementation XDifficult to Design Static Stability XLow Familiarity X
6.2 Level 2 Trade Study Criteria and Results
Table 22: Level 2 Trade Study Criteria and Descriptions
Categories Weight (%) DescriptionEndurance 40% Projected endurance of airframe in hours, conducted through market analysisProbability of Success 20% Composite team opinion on the feasibility of completing a working prototype in 12 weeksAircraft Stability 20% Airframe stability characteristicsPortability 10% Estimation of individual UAV weight plus largest dimensionLaunch 10% Rate of climb characteristics
Many of the criteria utilized in the Level 1 Trade Study were carried through to Level 2. A summary ofthe rationale of each category and its weight can be seen below.
Endurance, 40%: The category of Endurance was increased in weight from 30% to 40% to ensure theselected airframe emphasizes the clients desire of achieving a 12 hour overwatch with one or multiple UAVs.The endurance weight increase must also account for operator carrying capacity. UAVs with insufficientendurance create a logistical issue for operators having to carry multiple UAVs or battery packs into thefield.
Probability of Success, 20%: The Probability of Success category was weighted at 20% to take intoaccount the teams prediction on the feasibility of producing a working prototype of each airframe given thetime constraint and technical complexity of the airframe.
Aircraft Stability, 20%: Stability was introduced as an additional category to consider the clientsdesire to have the UAV fly autonomously on autopilot when interfaced with Phase 1B’s control system, andto note the stability distinctions between the two airframe types up for selection.
Portability, 10%: Portability was adjusted in both weight and definition. The category weighting wasreduced to reflect the teams conclusion that either airframe is considered portable as defined by the customer.Additionally, portability is defined in Level 2 as a single UAV’s weight plus it’s largest span wise dimensionto provide a direct comparison between platforms (Note: The weight and span metrics were determined froma market analysis of over 50 conventional and flying wing aircraft featuring identical propulsion systems.This analysis is included in Appendix A, Section 10.1).
Launch, 10%: the Launch category notes the differences found in a market analysis (See Appendix A,Section 10.1) between launching both airframes, and it notes their climb rates. Launch systems can addweight and reduce portability of the UAV, but can increase the viability of launching the UAV in harsh orcrowded environments. If one airframe can out climb another, this category also notes this capability, Thiscriteria is weighted and scored accordingly.
Budget was removed from the Level 2 analysis as both platforms can be designed and assembled forunder $5,000. A summation table of Level 2 point scale assignment is located in Figure 1.
25

6.2.1 Airframe Criteria and Scale Assignment
Figure 1: Level 2 Category Scale
6.2.2 Airframe Trade Study Results
Table 23: Airframe Trade Study Results
Categories Weight (%) Conventional Flying WingEndurance 40% 3 5Probability of Success 20% 4 3Stability 20% 5 2Portability 10% 4 4Launch 10% 3 3Total 3.70 3.50
The results of the Level 2 Trade Study show that a conventional fixed-wing airframe is the most viableoption. Although it has a lower average endurance than a flying wing, a conventional fixed-wing airframehas a higher probability of success and natural stability. These factors make it a more feasible option thana flying wing airframe.
26
7 Level 3 Trade Studies
With the selection of a conventional fixed-wing airframe, Level 3 Trade Studies can be conducted. Thesetrade studies will narrow down the subsystems of the airframe, providing the Key Design Requirementsnecessary for the selection of a baseline design.
7.1 Wing Mounting Configuration
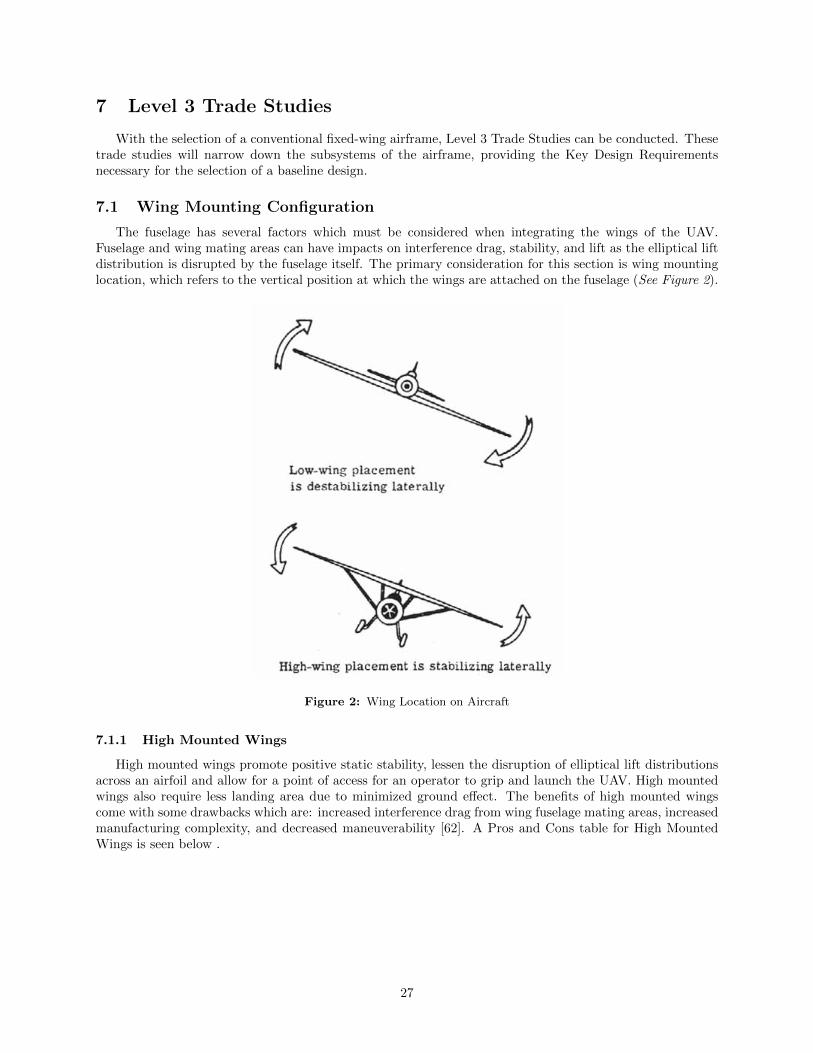
The fuselage has several factors which must be considered when integrating the wings of the UAV.Fuselage and wing mating areas can have impacts on interference drag, stability, and lift as the elliptical liftdistribution is disrupted by the fuselage itself. The primary consideration for this section is wing mountinglocation, which refers to the vertical position at which the wings are attached on the fuselage (See Figure 2).
Figure 2: Wing Location on Aircraft
7.1.1 High Mounted Wings
High mounted wings promote positive static stability, lessen the disruption of elliptical lift distributionsacross an airfoil and allow for a point of access for an operator to grip and launch the UAV. High mountedwings also require less landing area due to minimized ground effect. The benefits of high mounted wingscome with some drawbacks which are: increased interference drag from wing fuselage mating areas, increasedmanufacturing complexity, and decreased maneuverability [62]. A Pros and Cons table for High MountedWings is seen below .
27

Table 24: High Mounted Wings Pros and Cons
High Mounted Wing Characteristics Pros ConsIncreased roll stability XLocation facilitates launch/throw grip XHigh center of lift XDecreased ground effect upon landing XDecreased maneuverability XHigher interference drag XCreates mounting complexity X
7.1.2 Low/Mid Mounted Wings
Low to mid mounted wing configurations were aggregated due to their similar characteristics. Low/Midmounted wings facilitate maneuverability and decreased interference drag. The drawbacks of the Low/Mid-wing configuration are larger landing distances due to ground effect and decreased grip access for singleoperator launches. One distinction between mid and low mounted wings is mounting. The mid-wing config-uration features ease of mounting by placing the wing in the center of the fuselage, eliminating the need fora harness and mitigating structural failures which may occur due to loads being applied to the edges of thefuselage. A Pros and Cons table for Low/Mid Mounted Wings is seen below [62].
Table 25: Low/Mid Mounted Wing Pros and Cons
Low/Mid Mounted Wing Characteristics Pros ConsIncreased maneuverability XLocation reduces launch/throw grip XIncreased ground effect XLower interference drag XCreates mounting complexity (Low-Wing) XReduces mounting complexity (Mid-Wing) X
7.1.3 Wing Mounting Configuration - Trade Study Criteria and Results
Using the information given above, the HERD-CU team compiled a list of weighted criteria and scoredeach airframe design based on these criteria. The criterion, their weights and their scoring categories areshown below.
7.1.4 Wing Mounting Configuration Criteria
The table below outlines the scoring criteria for aircraft wing placement. Stability received the highestweight of 30% due to the system being required to fly autonomously when interfaced with HERD-CU’s Phase1B control system. Operator grip area was considered the second most critical component at 25% as wingplacement can hinder the users ability to grip and throw the aircraft upon launch. Maneuverability wasassigned a weight of 20% to accommodate the consideration of the aircraft potentially having to navigatearound trees and brush upon takeoff and landing. A weight of 15% was assigned to ground effect impactingshort takeoff and landing distances. Ground effect is non existent upon takeoff as the system will likely bethrown, however, upon landing ground effect may be prevalent upon landing, increasing the area needed tosafely decommission the UAV.
28

Table 26: Wing Mount Configuration Criteria
CategoryWeight
(%)Description
Stability 30% Quantifies the impact wing placement has on aircraft stabilityOperator Grip Area 25% Does the wing mounting area impact operability?Maneuverability 20% Quantifies the impact of wing placement on aircraft maneuverabilityGround Effect 15% Quantifies the impact of ground effect during landingMounting Complexity 10% Does wing type increase manufacturing complexity
7.1.5 Wing Mounting Configuration Scale
Table 27: Wing Mounting Configuration Scale
CategoryWeight
(%)1 Point 2 Points 3 Points
Stability 30% Decreases aircraft stability No impact on aircraft stability Increases aircraft stabilityOperator Grip Area 25% Decreases aircraft grip area No impact on grip area Provides unobstructed grip areaManeuverability 20% Decreases maneuverability No impact on maneuverability Increases maneuverabilityGround Effect 15% Increases ground effect No impact on ground effect Decreases ground effect
Mounting Complexity 10%Increases mounting complexity,
wing harness must be madeNo impact on mounting complexity
Simplifies mounting complexity,wings snap into center of the fuselage
7.1.6 Wing Mount Configuration Trade Study
The trade study below shows the benefits of a high-wing for this specific application. The primarydrivers of the high mounted wing being selected were increased stability and operator grip area, both arevital components to this UAS operating successfully.
Table 28: Wing Mount Trade Study
CategoryWeight
(%)High Mounted Wing Low/Mid Mounted Wing
Stability 30% 0.9 0.3Operator Grip Area 25% 0.75 0.25Maneuverability 20% 1.0 0.6Ground Effect 15% 0.45 0.15Mounting Complexity 10% 0.10 0.3Total 3.2 1.6
7.2 Wing Design
When analyzing different wing designs, many options are available. Depending on flight behavior andperformance characteristics, different wing designs offer different solutions to optimize certain parametersduring flight. Such design considerations include: aspect ratio (AR), wing sweep, wing geometry, as wellas wing dihedral and anhedral. Each of the aforementioned elements play a key role in flight behavioraffecting aircraft stability, maximum range and endurance (loiter ability), and launch readiness. Definingthe requirements of a given aircraft can produce aircrafts of various shapes and sizes. Specifically, whenlooking at the differences in flight behaviors between fighter jets and glider aircraft each has a specific set offlight characteristics that need to be satisfied in the design stage.
In the case of the fighter jets, the ability to maneuver and performance requirements are weighed heavilyin fighter aircraft design. Such flight requirements demand a very specific design for an aircraft (wings onfighter jets have low aspect ratios, thin symmetric (uncambered) wings, and trapezoidal, delta or sweptbackwings). A more applicable market comparison to the goals of the CU HERD project would be a glideraircraft. Glider aircraft often have high aspect ratios, cambered airfoils, high endurance, little to no dihedral
29
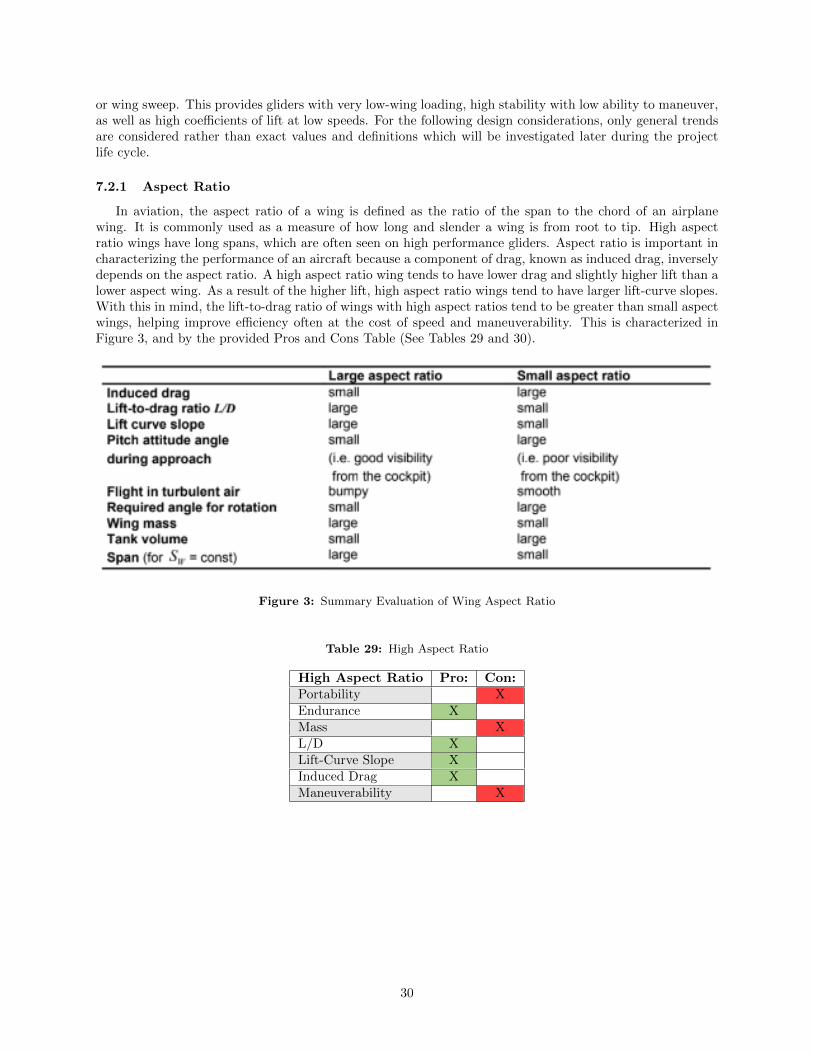
or wing sweep. This provides gliders with very low-wing loading, high stability with low ability to maneuver,as well as high coefficients of lift at low speeds. For the following design considerations, only general trendsare considered rather than exact values and definitions which will be investigated later during the projectlife cycle.
7.2.1 Aspect Ratio
In aviation, the aspect ratio of a wing is defined as the ratio of the span to the chord of an airplanewing. It is commonly used as a measure of how long and slender a wing is from root to tip. High aspectratio wings have long spans, which are often seen on high performance gliders. Aspect ratio is important incharacterizing the performance of an aircraft because a component of drag, known as induced drag, inverselydepends on the aspect ratio. A high aspect ratio wing tends to have lower drag and slightly higher lift than alower aspect wing. As a result of the higher lift, high aspect ratio wings tend to have larger lift-curve slopes.With this in mind, the lift-to-drag ratio of wings with high aspect ratios tend to be greater than small aspectwings, helping improve efficiency often at the cost of speed and maneuverability. This is characterized inFigure 3, and by the provided Pros and Cons Table (See Tables 29 and 30).
Figure 3: Summary Evaluation of Wing Aspect Ratio
Table 29: High Aspect Ratio
High Aspect Ratio Pro: Con:Portability XEndurance XMass XL/D XLift-Curve Slope XInduced Drag XManeuverability X
30
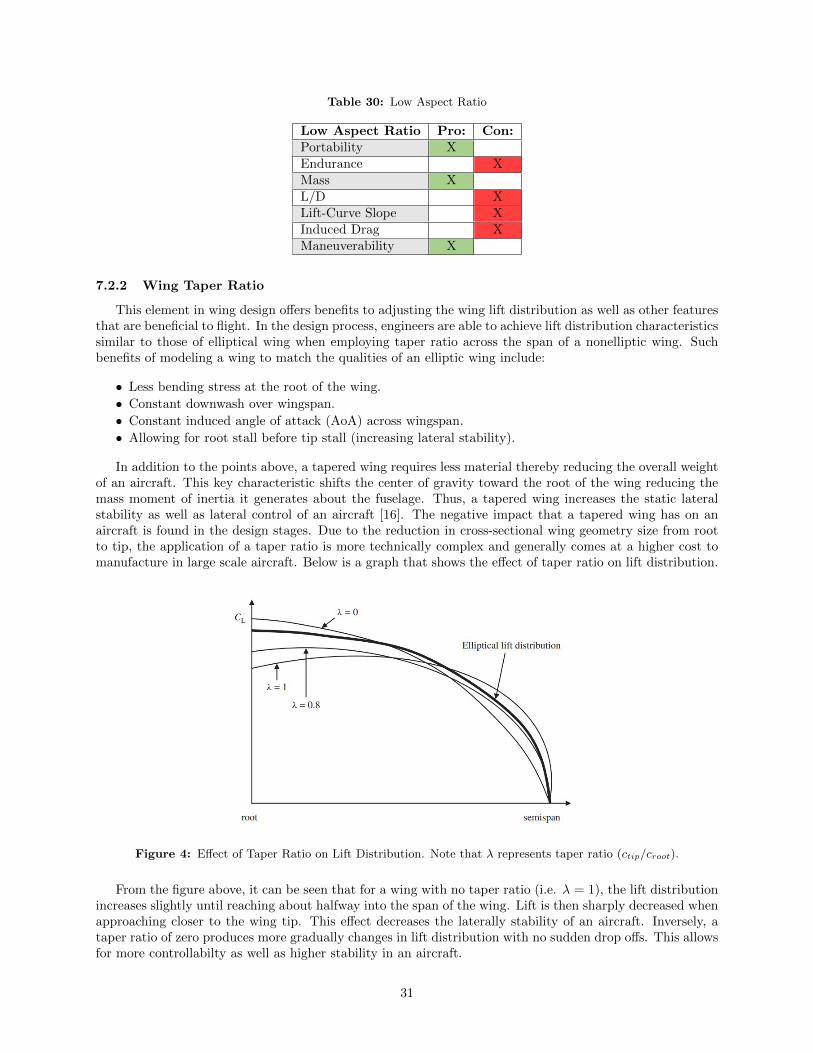
Table 30: Low Aspect Ratio
Low Aspect Ratio Pro: Con:Portability XEndurance XMass XL/D XLift-Curve Slope XInduced Drag XManeuverability X
7.2.2 Wing Taper Ratio
This element in wing design offers benefits to adjusting the wing lift distribution as well as other featuresthat are beneficial to flight. In the design process, engineers are able to achieve lift distribution characteristicssimilar to those of elliptical wing when employing taper ratio across the span of a nonelliptic wing. Suchbenefits of modeling a wing to match the qualities of an elliptic wing include:
• Less bending stress at the root of the wing.
• Constant downwash over wingspan.
• Constant induced angle of attack (AoA) across wingspan.
• Allowing for root stall before tip stall (increasing lateral stability).
In addition to the points above, a tapered wing requires less material thereby reducing the overall weightof an aircraft. This key characteristic shifts the center of gravity toward the root of the wing reducing themass moment of inertia it generates about the fuselage. Thus, a tapered wing increases the static lateralstability as well as lateral control of an aircraft [16]. The negative impact that a tapered wing has on anaircraft is found in the design stages. Due to the reduction in cross-sectional wing geometry size from rootto tip, the application of a taper ratio is more technically complex and generally comes at a higher cost tomanufacture in large scale aircraft. Below is a graph that shows the effect of taper ratio on lift distribution.
Figure 4: Effect of Taper Ratio on Lift Distribution. Note that λ represents taper ratio (ctip/croot).
From the figure above, it can be seen that for a wing with no taper ratio (i.e. λ = 1), the lift distributionincreases slightly until reaching about halfway into the span of the wing. Lift is then sharply decreased whenapproaching closer to the wing tip. This effect decreases the laterally stability of an aircraft. Inversely, ataper ratio of zero produces more gradually changes in lift distribution with no sudden drop offs. This allowsfor more controllabilty as well as higher stability in an aircraft.
31

Table 31: Taper Ratio Pros and Cons
Taper Ratio Pro: Con:Mass XComplexity XStability XDurability XLift X
7.2.3 Wing Sweep
Wing sweep is often used to distinguish and characterize wing designs. A swept wing is defined as a wingthat angles either backward or, in rare cases, forward from its root rather than straight out of the fuselageof the aircraft. In the case of small UAVs, wing sweep might not play as large of a factor in performance asit does with modern jet liners or fighter aircraft. In transonic flight, a swept wing exhibits a higher CriticalMach Number compared to a straight-wing design of similar chord and camber. This results in the delay ofthe onset of wave drag which marks the principal advantage of wing sweep [15]. Furthermore, swept wingswith large sweep angles are characterized by a small maximum lift coefficient and a small lift-curve slope incontrast to swept wings with small sweep angles, which have a larger maximum lift coefficient and lift-curveslope associated with them. Hence, swept wings are often optimized for high speed flight which might notbe achievable or desired with high endurance UAVs. Additional distinctions between the two variations canbe seen below in Figure 5.
Figure 5: Summary Evaluation of Wing Sweep
From the details mentioned above, the purpose of employing wing sweep is to improve wing aerodynamics ator above transonic speeds, adjust the center of gravity of an aircraft, improve static lateral stability and/oradjust longitudinal and directional stability [16]. A Pros and Cons table for Large and Small Wing Sweepis seen in Tables 32 and 33.
Table 32: Large Wing Sweep
Large Wing Sweep Pro: Con:Lift-Slope Curve XMass XLateral Stability XManuevarability XCritical Mach Number XOptimized for High Speed X
32
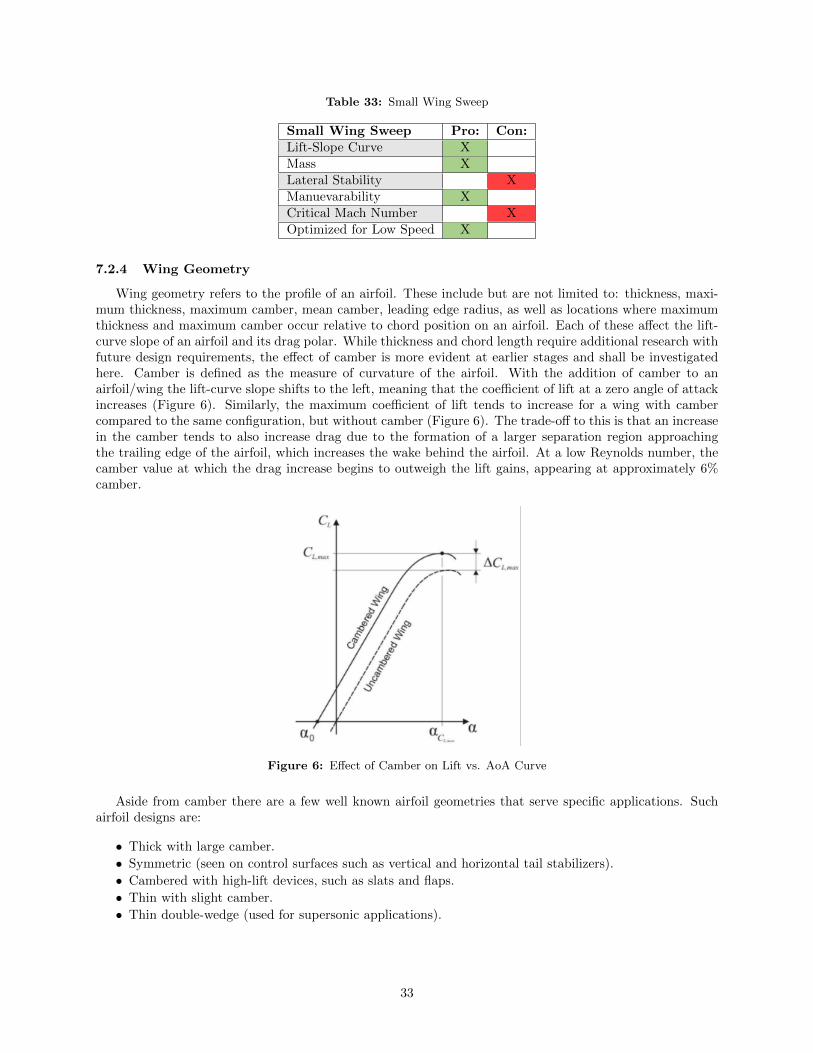
Table 33: Small Wing Sweep
Small Wing Sweep Pro: Con:Lift-Slope Curve XMass XLateral Stability XManuevarability XCritical Mach Number XOptimized for Low Speed X
7.2.4 Wing Geometry
Wing geometry refers to the profile of an airfoil. These include but are not limited to: thickness, maxi-mum thickness, maximum camber, mean camber, leading edge radius, as well as locations where maximumthickness and maximum camber occur relative to chord position on an airfoil. Each of these affect the lift-curve slope of an airfoil and its drag polar. While thickness and chord length require additional research withfuture design requirements, the effect of camber is more evident at earlier stages and shall be investigatedhere. Camber is defined as the measure of curvature of the airfoil. With the addition of camber to anairfoil/wing the lift-curve slope shifts to the left, meaning that the coefficient of lift at a zero angle of attackincreases (Figure 6). Similarly, the maximum coefficient of lift tends to increase for a wing with cambercompared to the same configuration, but without camber (Figure 6). The trade-off to this is that an increasein the camber tends to also increase drag due to the formation of a larger separation region approachingthe trailing edge of the airfoil, which increases the wake behind the airfoil. At a low Reynolds number, thecamber value at which the drag increase begins to outweigh the lift gains, appearing at approximately 6%camber.
Figure 6: Effect of Camber on Lift vs. AoA Curve
Aside from camber there are a few well known airfoil geometries that serve specific applications. Suchairfoil designs are:
• Thick with large camber.
• Symmetric (seen on control surfaces such as vertical and horizontal tail stabilizers).
• Cambered with high-lift devices, such as slats and flaps.
• Thin with slight camber.
• Thin double-wedge (used for supersonic applications).
33

Each of the items above have their advantages and disadvantages. This is most apparent when comparinga cambered airfoil with high-lift devices to the double-wedge airfoil. The cambered airfoil relies on its geom-etry and takeoff velocity to achieve flight and is made to optimize flight characteristics such as endurance.This is the opposite to that of the double-wedge airfoil. The double-wedge airfoil requires very high veloci-ties as well as thrust vectoring to maintain flight, which demands additional control surfaces and algorithmsfor stability while increase range at the cost of endurance. Thus, to create an aircraft with a particularset of flight requirements, airfoil geometries as well a performance parameters must be explored when toappropriately choose the correct airfoil/wing geometry. Such considerations in wing geometry include theaforementioned airfoil qualities as well as wing twist.
Wing twist can be separated into two categories: (1) geometric twist and (2) aerodynamic twist. Bothof these create a variable lift-curve slope which can be analyzed when looking at the variability of the airfoilgeometry at any given span-wise position. Geometric twist refers to the physical twisting of the wing,providing a wingtip incidence that is different from that of the root of the wing. Furthermore, aerodynamictwist is change in airfoil shape between the root and tip of a wing. Geometric twist is usually applied to aidin the prevention of stalling where one portion of the wing may be on the verge of stalling (such as the root)maintaining lift towards the tip of the wing. This gives pilots and controllers the ability to correct flight andsave the aircraft. Aerodynamic twist changes the overall lift-curve slope throughout the span of the wing bymeans of utilizing two separate airfoil shapes, providing variable lift coefficients. Thus, wing twist is used toavoid tip stall before root stall and modifying lift distribution to match that of an elliptical one.
Table 34: Cambered Wing
Cambered Wing Pro: Con:Lift at Lower AoA XMaximum Coefficient of Lift XIncrease in Drag X
7.2.5 Dihedral and Anhedral Angle
The dihedral angle of a wing refers to the upward angle relative to the horizontal position of the wingsand the anhedral angle similarly refers to the downward angle deviation from a straight-wing design as seenin Figure 7. The main differentiation in the two designs is that wing dihedral affects the rolls stabilityderivative of an airplane as it causes the lift on the right and left semispans to respond differently to sideslip.Wings with positive dihedral sideslip produce an increase in angle of attack (AoA) in the windward semispanand a decrease in AoA on the leaside semispan. In turn, this produces a laterally stable roll mode for anaircraft as wing dihedral naturally causes the aircraft to respond with a reduction to its roll rate. [17]
On the other hand, anhedral behaves in the opposite manner. This wing angle increases the roll rate ofthe aircraft which results in greater roll performance but is laterally destabilizing. Anhedral wings are oftenused on smaller aircraft like fighter planes to make them more maneuverable or on very large cargo aircraft,which are deemed too stable and hence too hard to maneuver. A limitation of implementing dihedral is thatthe wings don’t produce as much vertical lift as a straight-wing aircraft. Instead, there is a vertical andhorizontal components associated with lift generated by the wings, which means that at steady, level andunaccelerated flight, not all of the resultant force is used to lift the aircraft.
Additionally, when considering the application of dihedral and anhedral wing angles, placement of thewing relative to the fuselage must be considered. High-wings offer very positive lateral stability whereasanhedral wing angles give aircraft more roll controllability. This comes at not cost to the operationalcharacteristics of the aircraft. Such examples can be found on cargo aircraft with high-wings strictly forcargo ease of access while having anhedral angles to aid in maneuverability. Furthermore, ”high-wing aircrafthave an inherent dihedral effect while low-wing aircraft tend to be deficient in their inherent dihedral effect.”[16] More specifically, a high-wing aircraft requires little to no dihedral to give it lateral stability whereaslow-wing aircraft require larger dihedral angles to provide them with the increase in roll stability. Inversely,to reduce stability at the cost of increasing roll performance, anhedral angles can be given to wings.
34
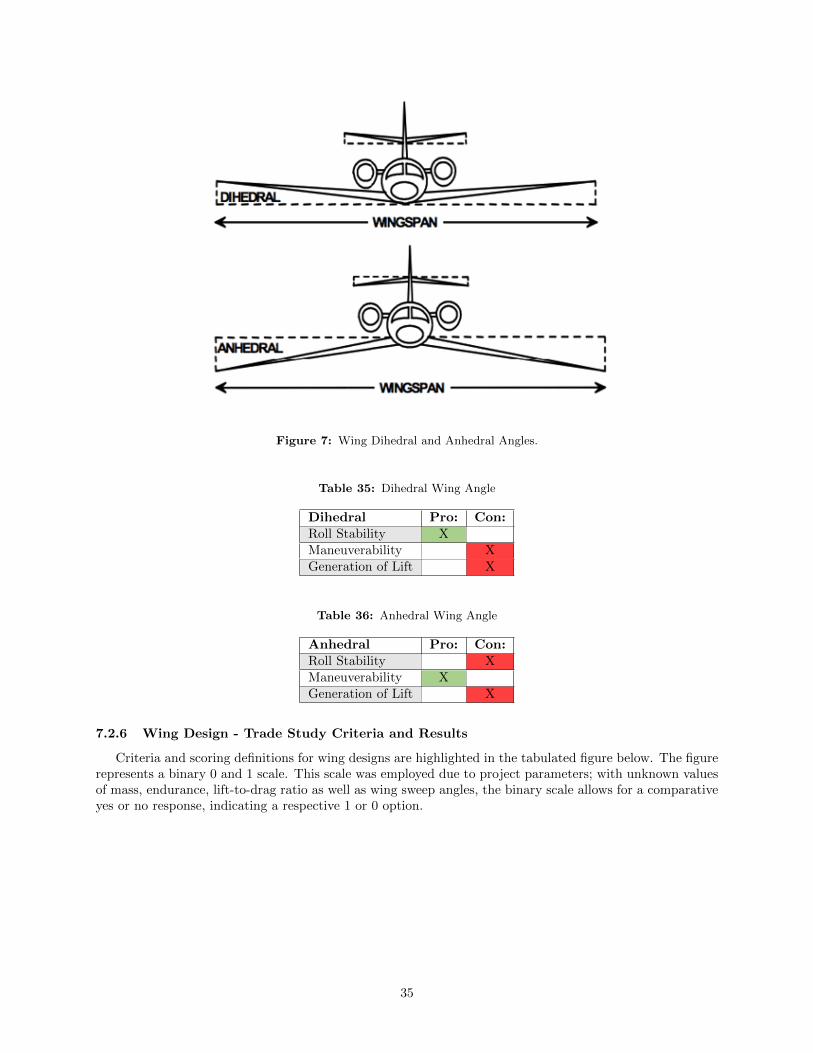
Figure 7: Wing Dihedral and Anhedral Angles.
Table 35: Dihedral Wing Angle
Dihedral Pro: Con:Roll Stability XManeuverability XGeneration of Lift X
Table 36: Anhedral Wing Angle
Anhedral Pro: Con:Roll Stability XManeuverability XGeneration of Lift X
7.2.6 Wing Design - Trade Study Criteria and Results
Criteria and scoring definitions for wing designs are highlighted in the tabulated figure below. The figurerepresents a binary 0 and 1 scale. This scale was employed due to project parameters; with unknown valuesof mass, endurance, lift-to-drag ratio as well as wing sweep angles, the binary scale allows for a comparativeyes or no response, indicating a respective 1 or 0 option.
35

Figure 8: Wing Design Scoring.
The rationale behind the wing design weights shown above in Figure 8 emphasizes the importance inendurance and lift-to-drag ratio. With a weight of 25% each, these two areas are weighed higher than theother four areas due to their importance to the HERD-CU project outcomes. The purpose of the HERD-CUproject was to create a clean-sheet UAV design that prioritizes endurance and increased aircraft loiteringcapabilities. These are achievable through an increased lift-to-drag ratio which has a direct correlation toendurance. With this in mind, these two categrories were assigned equal weight and held more influence inthe decision making process than the other categories examined in the trade study.
Next, stability was assigned a weight of 15% due to the HERD-CU team requirement of maintainingflight with little active input from flight control surfaces as a means of preserving on-board power. Byminimizing the power usage through an inherently stable design, HERD-CU hopes to extend the enduranceof the UAV.Additionally, in the event of power loss, the a stable aircraft is more likely to return to theground safely whereas an unstable aircraft would plummet with little to nothing on-board being salvageable.This weight allows HERD-CU to accomplish the re-usability aspect of the UAV through the emphasis onstability. Similar to the stability categorey, complexity is assigned a 15% weight and is a measure of designfeasibility due to complexity. If the design is too complex to be built, it is unlikely to be a viable solutionwithin the HERD-CU project timeline. Thus, its importance represented by scoring its weight higher thanthe last two categories: mass and maneuverability.
The final two categories of mass and maneuverability are each weighed at the lowest value of 10% dueto specifications outlined in the Request for Proposal (RFP) document for the HERD-CU team as well asmaterial options available on the market. The additional mass that comes with the implementation of theunique design features outlined above is not as large as it would be with larger scale UAVs and hence carriesweight in the decision making process. Because material can be changed and certain wing design consider-ations can be employed over others, mass can be reduced when the objective of mass reduction is soughtafter. This can be done with little to no difficulties at the small UAV scale. Additionally, maneuverability isless important of a requirement for an aircraft with the sole purpose of increasing loiter time and hence itsendurance. It should be stated that maneuverability is important for adverse weather events, which is whyit is near but not as large as the weight for the stability catergory of the aircraft.
36
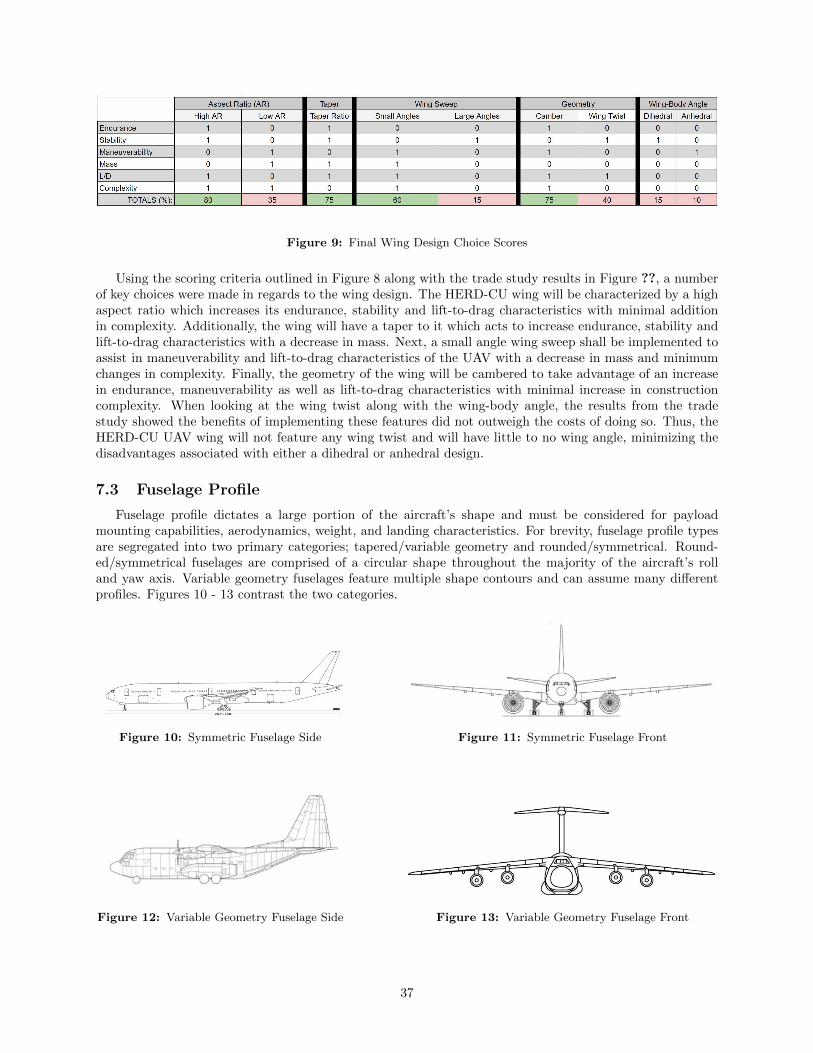
Figure 9: Final Wing Design Choice Scores
Using the scoring criteria outlined in Figure 8 along with the trade study results in Figure ??, a numberof key choices were made in regards to the wing design. The HERD-CU wing will be characterized by a highaspect ratio which increases its endurance, stability and lift-to-drag characteristics with minimal additionin complexity. Additionally, the wing will have a taper to it which acts to increase endurance, stability andlift-to-drag characteristics with a decrease in mass. Next, a small angle wing sweep shall be implemented toassist in maneuverability and lift-to-drag characteristics of the UAV with a decrease in mass and minimumchanges in complexity. Finally, the geometry of the wing will be cambered to take advantage of an increasein endurance, maneuverability as well as lift-to-drag characteristics with minimal increase in constructioncomplexity. When looking at the wing twist along with the wing-body angle, the results from the tradestudy showed the benefits of implementing these features did not outweigh the costs of doing so. Thus, theHERD-CU UAV wing will not feature any wing twist and will have little to no wing angle, minimizing thedisadvantages associated with either a dihedral or anhedral design.
7.3 Fuselage Profile
Fuselage profile dictates a large portion of the aircraft’s shape and must be considered for payloadmounting capabilities, aerodynamics, weight, and landing characteristics. For brevity, fuselage profile typesare segregated into two primary categories; tapered/variable geometry and rounded/symmetrical. Round-ed/symmetrical fuselages are comprised of a circular shape throughout the majority of the aircraft’s rolland yaw axis. Variable geometry fuselages feature multiple shape contours and can assume many differentprofiles. Figures 10 - 13 contrast the two categories.
Figure 10: Symmetric Fuselage Side Figure 11: Symmetric Fuselage Front
Figure 12: Variable Geometry Fuselage Side Figure 13: Variable Geometry Fuselage Front
37
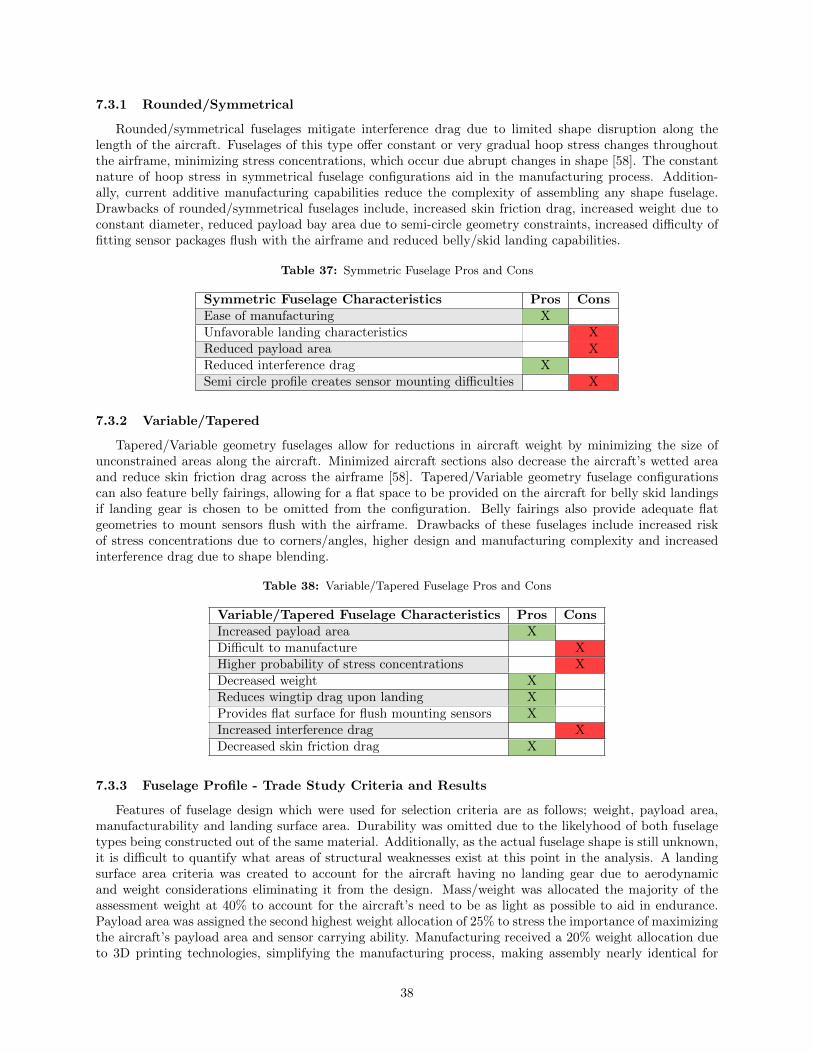
7.3.1 Rounded/Symmetrical
Rounded/symmetrical fuselages mitigate interference drag due to limited shape disruption along thelength of the aircraft. Fuselages of this type offer constant or very gradual hoop stress changes throughoutthe airframe, minimizing stress concentrations, which occur due abrupt changes in shape [58]. The constantnature of hoop stress in symmetrical fuselage configurations aid in the manufacturing process. Addition-ally, current additive manufacturing capabilities reduce the complexity of assembling any shape fuselage.Drawbacks of rounded/symmetrical fuselages include, increased skin friction drag, increased weight due toconstant diameter, reduced payload bay area due to semi-circle geometry constraints, increased difficulty offitting sensor packages flush with the airframe and reduced belly/skid landing capabilities.
Table 37: Symmetric Fuselage Pros and Cons
Symmetric Fuselage Characteristics Pros ConsEase of manufacturing XUnfavorable landing characteristics XReduced payload area XReduced interference drag XSemi circle profile creates sensor mounting difficulties X
7.3.2 Variable/Tapered
Tapered/Variable geometry fuselages allow for reductions in aircraft weight by minimizing the size ofunconstrained areas along the aircraft. Minimized aircraft sections also decrease the aircraft’s wetted areaand reduce skin friction drag across the airframe [58]. Tapered/Variable geometry fuselage configurationscan also feature belly fairings, allowing for a flat space to be provided on the aircraft for belly skid landingsif landing gear is chosen to be omitted from the configuration. Belly fairings also provide adequate flatgeometries to mount sensors flush with the airframe. Drawbacks of these fuselages include increased riskof stress concentrations due to corners/angles, higher design and manufacturing complexity and increasedinterference drag due to shape blending.
Table 38: Variable/Tapered Fuselage Pros and Cons
Variable/Tapered Fuselage Characteristics Pros ConsIncreased payload area XDifficult to manufacture XHigher probability of stress concentrations XDecreased weight XReduces wingtip drag upon landing XProvides flat surface for flush mounting sensors XIncreased interference drag XDecreased skin friction drag X
7.3.3 Fuselage Profile - Trade Study Criteria and Results
Features of fuselage design which were used for selection criteria are as follows; weight, payload area,manufacturability and landing surface area. Durability was omitted due to the likelyhood of both fuselagetypes being constructed out of the same material. Additionally, as the actual fuselage shape is still unknown,it is difficult to quantify what areas of structural weaknesses exist at this point in the analysis. A landingsurface area criteria was created to account for the aircraft having no landing gear due to aerodynamicand weight considerations eliminating it from the design. Mass/weight was allocated the majority of theassessment weight at 40% to account for the aircraft’s need to be as light as possible to aid in endurance.Payload area was assigned the second highest weight allocation of 25% to stress the importance of maximizingthe aircraft’s payload area and sensor carrying ability. Manufacturing received a 20% weight allocation dueto 3D printing technologies, simplifying the manufacturing process, making assembly nearly identical for
38

either type fuselage. Landing surface area was assigned a weight of 15% to account for the plane’s ability toperform a belly landing due to the lack of landing gear.
7.3.4 Fuselage Criteria
Table 39: Fuselage Criteria
CriteriaWeight
(%)Description
Weight 40% Assessment of fuselage weightMaximized Payload Area 25% Allowance for optimized payload areaManufacturability 20% Manufacturing complexityLanding Area 15% Does fuselage provide adequate landing surface area?
7.3.5 Fuselage Scale Factor
Table 40: Fuselage Scale Factor
CriteriaWeight
(%)1 Point 2 Points 3 Points
Weight 40% Fuselage configuration increases weight Fuselage configuration has no imact on weight Fuselage configuration decreases weight
Maximized Payload Area 25%Fuselage configurationdecreases payload area
Fuselage configurationhas no impact on payload area
Fuselage configurationincreases payload area
Manufacturability 20%Fuselage configuration creates
manufacturing complexityFuselage configuration
has no impact on manufacturing complexityFuselage configuration
simplifies manufacturing complexity
Landing Surface Area 15%Fuselage configuration doesnot facilitate belly landing,
generates wingtip to ground interaction
Fuselage configurationfacilitates belly landing,
mitigates wingtip to ground interaction
7.3.6 Fuselage Trade Study Results
Table 41: Fuselage Trade Study Results
CategoryWeight
(%)Symmetrical Variable/Tapered
Weight 40% 0.40 1.2Maximized Payload Area 25% 0.25 0.75Manufacturability 20% 0.40 0.40Landing Area 15% 0.15 0.45Total 1.2 2.8
As indicated by the table above, a variable fuselage design offers significant advantages over a symmetricconfiguration. Additionally, 3D printing technologies eliminate the majority of the complexities which arisefrom variable/tapered fuselages. Weight minimization and maximized payload area were the primary driversfor a variable fuselage down selection.
7.4 Propulsion System
The propulsion system of the aircraft is a major design component that heavily influences the overallendurance, design and complexity of the entire system. More technically complicated systems will drive theteam to contribute more time to the power plant of the UAV rather than vehicle design or aerodynamicoptimization, but may increase the overall endurance of the aircraft. Many design options were considered,and a summary of each system and their pros and cons are included below.
39
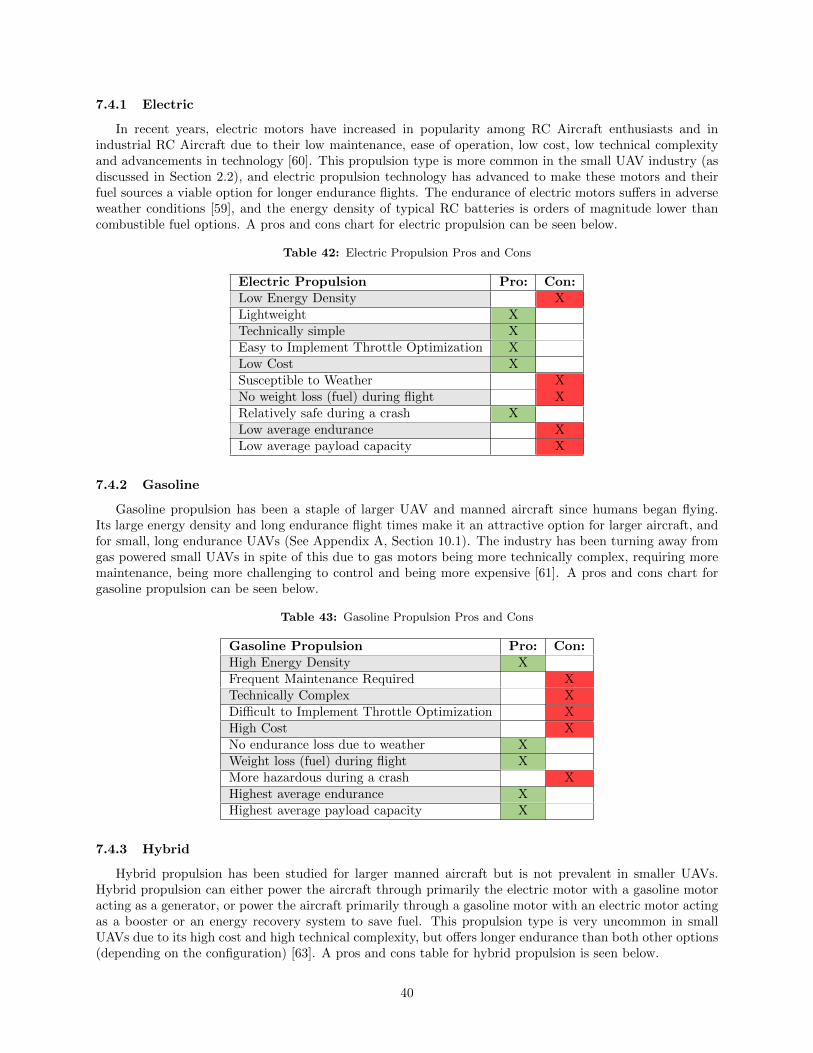
7.4.1 Electric
In recent years, electric motors have increased in popularity among RC Aircraft enthusiasts and inindustrial RC Aircraft due to their low maintenance, ease of operation, low cost, low technical complexityand advancements in technology [60]. This propulsion type is more common in the small UAV industry (asdiscussed in Section 2.2), and electric propulsion technology has advanced to make these motors and theirfuel sources a viable option for longer endurance flights. The endurance of electric motors suffers in adverseweather conditions [59], and the energy density of typical RC batteries is orders of magnitude lower thancombustible fuel options. A pros and cons chart for electric propulsion can be seen below.
Table 42: Electric Propulsion Pros and Cons
Electric Propulsion Pro: Con:Low Energy Density XLightweight XTechnically simple XEasy to Implement Throttle Optimization XLow Cost XSusceptible to Weather XNo weight loss (fuel) during flight XRelatively safe during a crash XLow average endurance XLow average payload capacity X
7.4.2 Gasoline
Gasoline propulsion has been a staple of larger UAV and manned aircraft since humans began flying.Its large energy density and long endurance flight times make it an attractive option for larger aircraft, andfor small, long endurance UAVs (See Appendix A, Section 10.1). The industry has been turning away fromgas powered small UAVs in spite of this due to gas motors being more technically complex, requiring moremaintenance, being more challenging to control and being more expensive [61]. A pros and cons chart forgasoline propulsion can be seen below.
Table 43: Gasoline Propulsion Pros and Cons
Gasoline Propulsion Pro: Con:High Energy Density XFrequent Maintenance Required XTechnically Complex XDifficult to Implement Throttle Optimization XHigh Cost XNo endurance loss due to weather XWeight loss (fuel) during flight XMore hazardous during a crash XHighest average endurance XHighest average payload capacity X
7.4.3 Hybrid
Hybrid propulsion has been studied for larger manned aircraft but is not prevalent in smaller UAVs.Hybrid propulsion can either power the aircraft through primarily the electric motor with a gasoline motoracting as a generator, or power the aircraft primarily through a gasoline motor with an electric motor actingas a booster or an energy recovery system to save fuel. This propulsion type is very uncommon in smallUAVs due to its high cost and high technical complexity, but offers longer endurance than both other options(depending on the configuration) [63]. A pros and cons table for hybrid propulsion is seen below.
40

Table 44: Hybrid Propulsion Pros and Cons
Hybrid Propulsion Pro: Con:High Energy Density XFrequent Maintenance Required XVery Technically Complex XPotential Challenge toImplement Throttle Optimization
X X
Highest Cost XPotential endurance loss due to weather X XPartial weight loss (fuel) during flight X XMost hazardous during a crash XHigh average endurance XHigh average payload capacity X
As seen above, the hybrid Pros and Cons table has both pros and cons listed for many categories. Thisis due to the nature of the hybrid propulsion system. If constructed correctly, it may suffer or benefit fromthe market categories (throttle implementation), or it may not be a pro or a con (weight loss, can either beviewed as a pro or a con). This also highlights the technical complexity of this propulsion system.
7.4.4 Propulsion System - Trade Study Criteria and Results
The criteria and scoring definition for the Propulsion subsystem is seen in Figure 14 below, and a briefexplanation of why these criteria were chosen is also included below. Figure 15 shows the final results of thePropulsion Trade Study.
Figure 14: Propulsion Criteria and Scoring Definition
Endurance, 25%: The primary goal of our UAS is high endurance. In the face of added complexity,high endurance is the driver for this project and is weighted accordingly.
Feasibility, 25%: Just as important as endurance. If the team does not have the skill set to build thesystem, and the customer does not have the skill set to maintain the system, it’s not a reasonable designchoice.
Cost, 15%: A GO / NO GO criteria. If the propulsion system is not in budget, it is no longer an option.While the possibility of external funding exists, the project budget is $5,000.
41
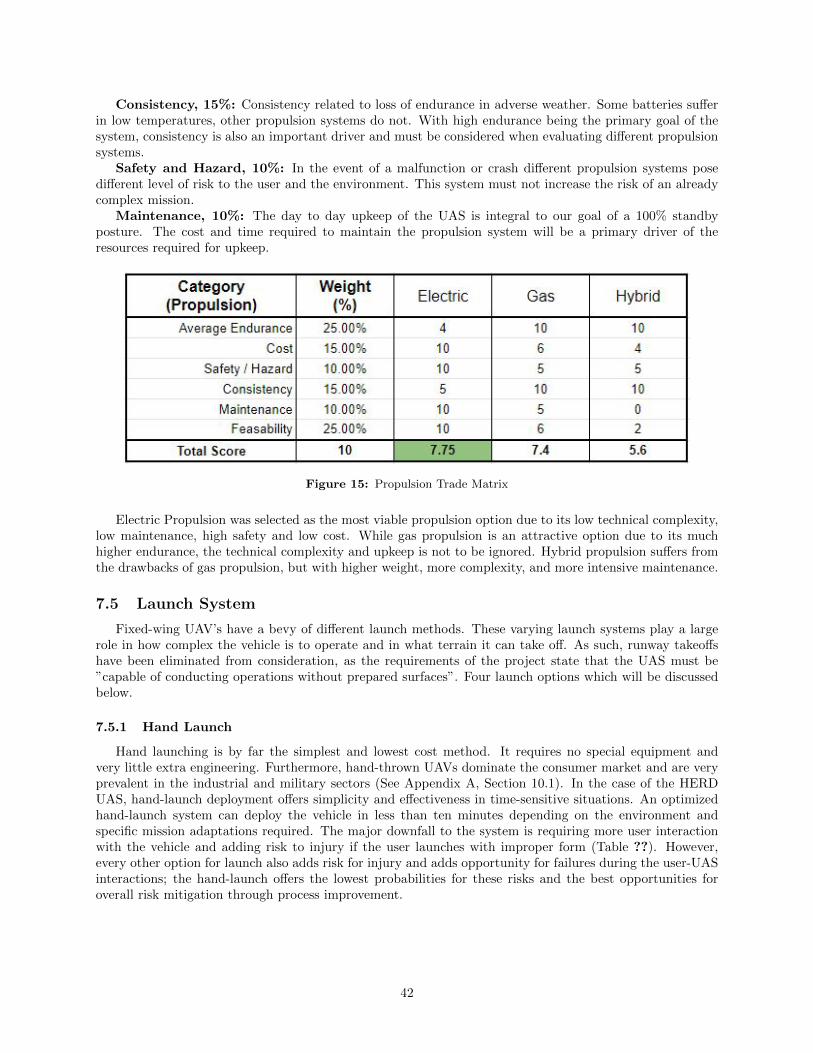
Consistency, 15%: Consistency related to loss of endurance in adverse weather. Some batteries sufferin low temperatures, other propulsion systems do not. With high endurance being the primary goal of thesystem, consistency is also an important driver and must be considered when evaluating different propulsionsystems.
Safety and Hazard, 10%: In the event of a malfunction or crash different propulsion systems posedifferent level of risk to the user and the environment. This system must not increase the risk of an alreadycomplex mission.
Maintenance, 10%: The day to day upkeep of the UAS is integral to our goal of a 100% standbyposture. The cost and time required to maintain the propulsion system will be a primary driver of theresources required for upkeep.
Figure 15: Propulsion Trade Matrix
Electric Propulsion was selected as the most viable propulsion option due to its low technical complexity,low maintenance, high safety and low cost. While gas propulsion is an attractive option due to its muchhigher endurance, the technical complexity and upkeep is not to be ignored. Hybrid propulsion suffers fromthe drawbacks of gas propulsion, but with higher weight, more complexity, and more intensive maintenance.
7.5 Launch System
Fixed-wing UAV’s have a bevy of different launch methods. These varying launch systems play a largerole in how complex the vehicle is to operate and in what terrain it can take off. As such, runway takeoffshave been eliminated from consideration, as the requirements of the project state that the UAS must be”capable of conducting operations without prepared surfaces”. Four launch options which will be discussedbelow.
7.5.1 Hand Launch
Hand launching is by far the simplest and lowest cost method. It requires no special equipment andvery little extra engineering. Furthermore, hand-thrown UAVs dominate the consumer market and are veryprevalent in the industrial and military sectors (See Appendix A, Section 10.1). In the case of the HERDUAS, hand-launch deployment offers simplicity and effectiveness in time-sensitive situations. An optimizedhand-launch system can deploy the vehicle in less than ten minutes depending on the environment andspecific mission adaptations required. The major downfall to the system is requiring more user interactionwith the vehicle and adding risk to injury if the user launches with improper form (Table ??). However,every other option for launch also adds risk for injury and adds opportunity for failures during the user-UASinteractions; the hand-launch offers the lowest probabilities for these risks and the best opportunities foroverall risk mitigation through process improvement.
42
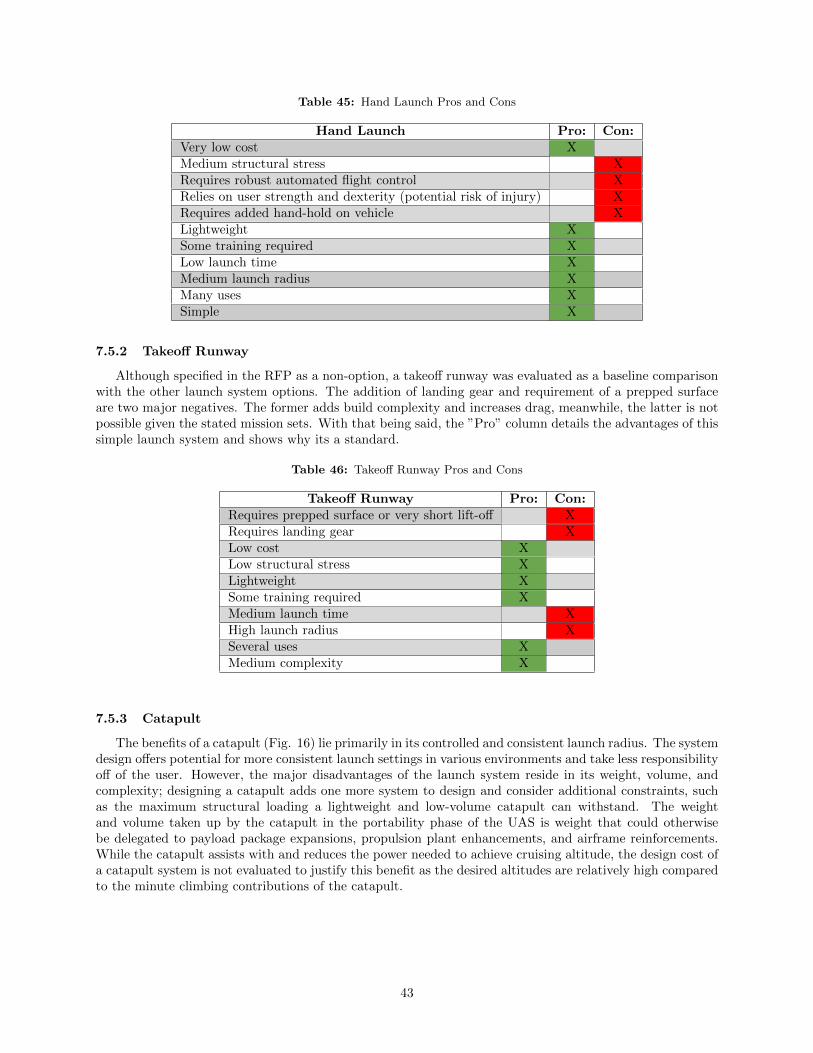
Table 45: Hand Launch Pros and Cons
Hand Launch Pro: Con:Very low cost XMedium structural stress XRequires robust automated flight control XRelies on user strength and dexterity (potential risk of injury) XRequires added hand-hold on vehicle XLightweight XSome training required XLow launch time XMedium launch radius XMany uses XSimple X
7.5.2 Takeoff Runway
Although specified in the RFP as a non-option, a takeoff runway was evaluated as a baseline comparisonwith the other launch system options. The addition of landing gear and requirement of a prepped surfaceare two major negatives. The former adds build complexity and increases drag, meanwhile, the latter is notpossible given the stated mission sets. With that being said, the ”Pro” column details the advantages of thissimple launch system and shows why its a standard.
Table 46: Takeoff Runway Pros and Cons
Takeoff Runway Pro: Con:Requires prepped surface or very short lift-off XRequires landing gear XLow cost XLow structural stress XLightweight XSome training required XMedium launch time XHigh launch radius XSeveral uses XMedium complexity X
7.5.3 Catapult
The benefits of a catapult (Fig. 16) lie primarily in its controlled and consistent launch radius. The systemdesign offers potential for more consistent launch settings in various environments and take less responsibilityoff of the user. However, the major disadvantages of the launch system reside in its weight, volume, andcomplexity; designing a catapult adds one more system to design and consider additional constraints, suchas the maximum structural loading a lightweight and low-volume catapult can withstand. The weightand volume taken up by the catapult in the portability phase of the UAS is weight that could otherwisebe delegated to payload package expansions, propulsion plant enhancements, and airframe reinforcements.While the catapult assists with and reduces the power needed to achieve cruising altitude, the design cost ofa catapult system is not evaluated to justify this benefit as the desired altitudes are relatively high comparedto the minute climbing contributions of the catapult.
43

Figure 16: A standard catapult design from Aeronautics Group’s Orbiter 2 UAV [26]
Table 47: Catapult Pros and Cons
Catapult Pro: Con:Heavy (In regards to weight that could be used for other primary systems) XRequires interface with vehicle XSome training required XHigh structural stress XMedium cost XMedium launch time XSaves power in climb XMedium-low launch radius XSeveral uses XMedium Complexity XLittle to no physical dexterity/conditioning required by user X
7.5.4 Vertical Takeoff
The concept of a vertical takeoff system came about as a means to overcome the 100ft launch radiusconstraint. However, there is a significant number of trade-offs; while this launch system can deploy in almostany environment, it adds significant complexity, excess weight, and is ostensibly a second vehicle which wouldneed to be designed. VTOL systems also add complexity to autonomous control systems: the HERD 1Bteam must design control systems for two aircraft platforms with the addition of a VTOL system. Giventhese conclusions, the costs of this system significantly outweigh the benefits (Tables 48 and 51) primarilyin regards to weight, cost, and pushing beyond the skillsets of the design team under given time constraints.
44
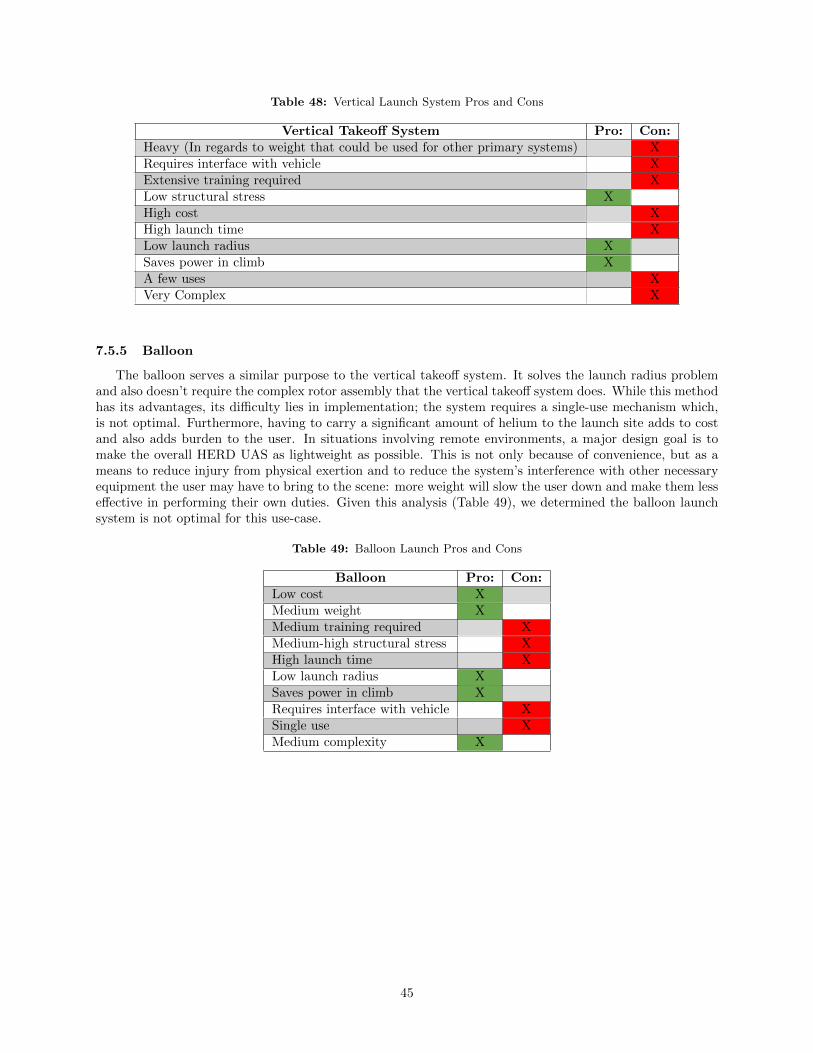
Table 48: Vertical Launch System Pros and Cons
Vertical Takeoff System Pro: Con:Heavy (In regards to weight that could be used for other primary systems) XRequires interface with vehicle XExtensive training required XLow structural stress XHigh cost XHigh launch time XLow launch radius XSaves power in climb XA few uses XVery Complex X
7.5.5 Balloon
The balloon serves a similar purpose to the vertical takeoff system. It solves the launch radius problemand also doesn’t require the complex rotor assembly that the vertical takeoff system does. While this methodhas its advantages, its difficulty lies in implementation; the system requires a single-use mechanism which,is not optimal. Furthermore, having to carry a significant amount of helium to the launch site adds to costand also adds burden to the user. In situations involving remote environments, a major design goal is tomake the overall HERD UAS as lightweight as possible. This is not only because of convenience, but as ameans to reduce injury from physical exertion and to reduce the system’s interference with other necessaryequipment the user may have to bring to the scene: more weight will slow the user down and make them lesseffective in performing their own duties. Given this analysis (Table 49), we determined the balloon launchsystem is not optimal for this use-case.
Table 49: Balloon Launch Pros and Cons
Balloon Pro: Con:Low cost XMedium weight XMedium training required XMedium-high structural stress XHigh launch time XLow launch radius XSaves power in climb XRequires interface with vehicle XSingle use XMedium complexity X
45

7.5.6 Launch System - Trade Study Criteria and Results
Table 50: Launch System Trade Study Setup and Descriptions
Criteria Level 1 Level 2 Level 3 Level 4 Level 5Takeoff Radius(17.5%, 3.5pt. incriments)
Takeoff on prepped surface Takeoff in large clearing Takeoff in small clearingTakeoff in forestwith minimal clearing
Vertical Takeoff
Reuseability(17.5%, 3.5pt. incriments)
Single use 2-3 Uses Several uses 10 or more uses Entirely resueable
Price(12.5%, 2.5pt. incriments)
Less than 50% of budget Less than 25% of budget Less than 10% of budget Less than 5% of budget Less than 1% of budget
Structural Load(12.5%, 2.5pt. incriments)
More than 3 G’s More than 2 G’s More than 1 G Less than 1 G Virtually no load
Interface(10%, 2pt. incriments)
Vehicle designed aroundinterface with launch system
Launch system dictatessignificant vehicle design
Launch system interfacerequires some design work
Minimal and simple interface None
Weight10%, 2pt. incriments)
30lbs or more Less than 20lbs Less than 10lbs Less than 5lbs Less than 1lb
Feasibility(10%, 2pt. incriments)
Requires 6 or more weeksto design and build
Requires 4 or moreweeks to design and build
Requires 2 or more weeksto design and build
Requires 1 or moreweeks to design and build
Simple to implement
User Complexity(10%, 2pt. incriments)
Significant training required Training required Some training required Minimal training required No training required
The most important decision-making factors for choosing a launch system in the scope of this designprocess are the takeoff radius, reuseability, price, and weight (Table 50). Achieving a takeoff radius of lessthan or equal to 100ft is a challenge not only unique to non-urban launching environment such as mountains,forests, and wetlands, but is a challenge also unique to urban environments immediately following naturaldisasters and other phenomena that may compromise a sufficient runway. Reusability poses a significantfactor in deciding the launch system because there is little value in a system that has to be carried, employed,and discarded with every use. The structural load and weight of the overall system launch system areinterrelated in that a system that can deploy a heavier aircraft may be able to reduce the probability ofuser-error, but if it still accounts for a significant portion of the weight that a user would have to carry to aremote location, then there are drawbacks to this system including but not limited to physical exertion bythe user and reducing allowable weight for other components such as the sensor package.
When comparing currently implemented launch systems and their quantifiable data with the skillsetsand available resources of the design team, the hand launch is the most optimal launch system for the longendurance UAS (Table 51). The takeoff runway poses an optimal option when available but its score carriesthat caveat with it. While the catapult is the best hybrid between a takeoff-radius-sensitive launch systemwith minimal user-error opportunities and that of a launch system with less weight and cost constraints, itstill reduces the available design freedoms and weight availability for a sensor package and other componentsin the overall portability analysis.
Table 51: Launch System Trade Evaluations
Criteria Hand Launch Takeoff Catapult Vertical Takeoff System BalloonTakeoff Radius(17.5%, 3.5pt. incriments)
7 3.5 14 17.5 17.5
Reuseability(17.5%, 3.5pt. incriments)
17.5 10.5 14 14 3.5
Price(12.5%, 2.5pt. incriments)
12.5 10 7.5 2.5 7.5
Structural Load(12.5%, 2.5pt. incriments)
10 12.5 5 10 10
Interface(10%, 2pt. incriments)
8 8 4 2 6
Weight(10%, 2pt. incriments)
10 8 4 2 6
Feasibility(10%, 2pt. incriments)
8 4 4 2 4
User Complexity(10%, 2pt. incriments)
8 6 4 2 8
Total Score 81 62.5 56.5 52 62.5
46

7.6 Tail Configuration
In order to successfully complete its mission, the UAV must be able to withstand vertical and horizontalwind gusts during its climb and loiter. To enable such success, considerations of the aircraft’s empennagemust be taken such that inherent stability and resistance to deviations produced by possible operationconditions. Moreover, the tail must be durable enough to withstand impacts to promote both reusabilityand the feasibility of landing on an unprepared surface.
Figure 17: Tail Configurations
7.6.1 Conventional
Conventional tail designs feature vertical stabilizer protruding from the aft of the aircraft with the hori-zontal stabilizer located at the base normal to the fuselage. This design is the most common within industry,establishing a long standing heritage while occupying about 70% of all aircraft [50]. The popularity of thisdesign stems from its low weight cost and simplistic construction, offering the least complex trim mechanicswhile still accommodating larger vertical tail designs if required. However, these simplistic characteristicslead to multiple unwanted consequences. Due to the close proximity to the horizontal stabilizer, turbulentflow across the vertical stabilizer results in poor inherent spin dynamics. Downwash from the aircraft’s wingcauses reduced efficiency of the horizontal stabilizer due to its inline location along the fuselage. The locationof the horizontal stabilizer also results in no support for engines in the rear of the aircraft, thus creatingunnecessary restrictions on the overall design. From a durability standpoint, the horizontal stabilizers of aconventional tail could impact during landing on uneven terrain. Also, in the case of a belly-landing giventheir low mounted positions. To aid reliability of the vehicle, the horizontal stabilizer surfaces may need tobe protected against direct impact given the operating environment and recovery method.
47
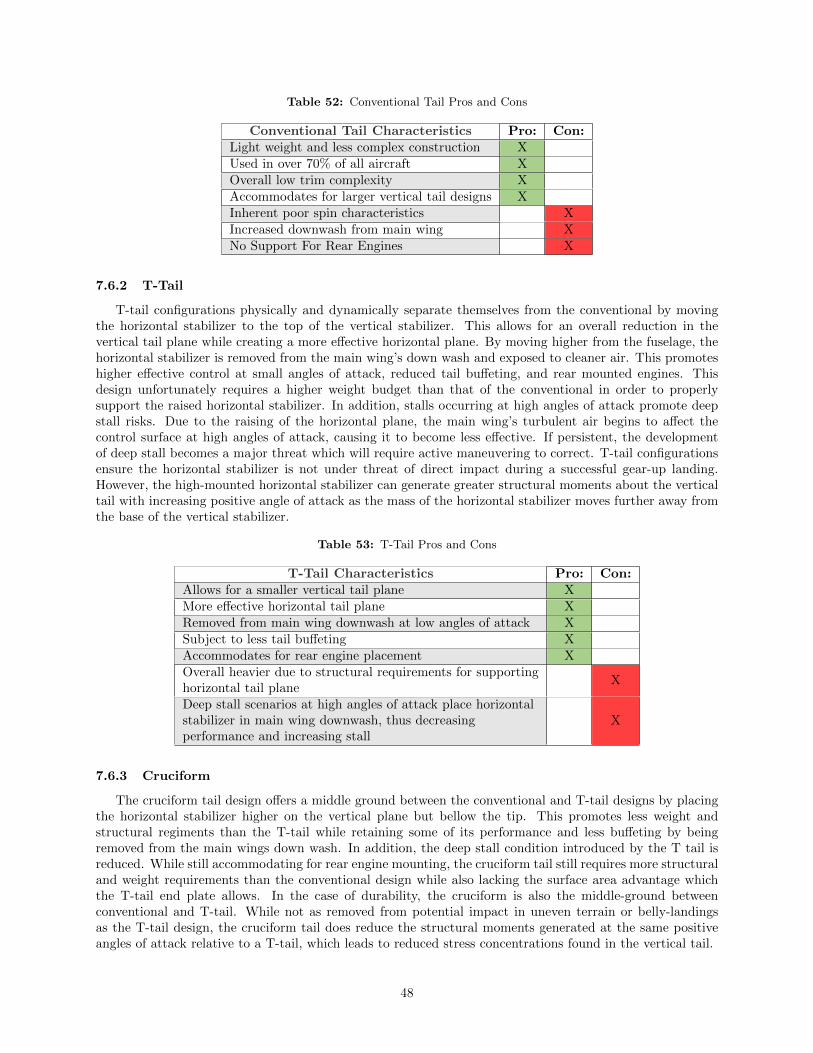
Table 52: Conventional Tail Pros and Cons
Conventional Tail Characteristics Pro: Con:Light weight and less complex construction XUsed in over 70% of all aircraft XOverall low trim complexity XAccommodates for larger vertical tail designs XInherent poor spin characteristics XIncreased downwash from main wing XNo Support For Rear Engines X
7.6.2 T-Tail
T-tail configurations physically and dynamically separate themselves from the conventional by movingthe horizontal stabilizer to the top of the vertical stabilizer. This allows for an overall reduction in thevertical tail plane while creating a more effective horizontal plane. By moving higher from the fuselage, thehorizontal stabilizer is removed from the main wing’s down wash and exposed to cleaner air. This promoteshigher effective control at small angles of attack, reduced tail buffeting, and rear mounted engines. Thisdesign unfortunately requires a higher weight budget than that of the conventional in order to properlysupport the raised horizontal stabilizer. In addition, stalls occurring at high angles of attack promote deepstall risks. Due to the raising of the horizontal plane, the main wing’s turbulent air begins to affect thecontrol surface at high angles of attack, causing it to become less effective. If persistent, the developmentof deep stall becomes a major threat which will require active maneuvering to correct. T-tail configurationsensure the horizontal stabilizer is not under threat of direct impact during a successful gear-up landing.However, the high-mounted horizontal stabilizer can generate greater structural moments about the verticaltail with increasing positive angle of attack as the mass of the horizontal stabilizer moves further away fromthe base of the vertical stabilizer.
Table 53: T-Tail Pros and Cons
T-Tail Characteristics Pro: Con:Allows for a smaller vertical tail plane XMore effective horizontal tail plane XRemoved from main wing downwash at low angles of attack XSubject to less tail buffeting XAccommodates for rear engine placement XOverall heavier due to structural requirements for supportinghorizontal tail plane
X
Deep stall scenarios at high angles of attack place horizontalstabilizer in main wing downwash, thus decreasingperformance and increasing stall
X
7.6.3 Cruciform
The cruciform tail design offers a middle ground between the conventional and T-tail designs by placingthe horizontal stabilizer higher on the vertical plane but bellow the tip. This promotes less weight andstructural regiments than the T-tail while retaining some of its performance and less buffeting by beingremoved from the main wings down wash. In addition, the deep stall condition introduced by the T tail isreduced. While still accommodating for rear engine mounting, the cruciform tail still requires more structuraland weight requirements than the conventional design while also lacking the surface area advantage whichthe T-tail end plate allows. In the case of durability, the cruciform is also the middle-ground betweenconventional and T-tail. While not as removed from potential impact in uneven terrain or belly-landingsas the T-tail design, the cruciform tail does reduce the structural moments generated at the same positiveangles of attack relative to a T-tail, which leads to reduced stress concentrations found in the vertical tail.
48

Table 54: Cruciform Tail Pros and Cons
Cruciform Tail Characteristics Pro: Con:Lighter than T-Tail XMore effective horizontal tail plane XRemoved from main wing downwash at low angles of attack XSubject to less tail buffeting XEnables rear engine placement XHeavier than conventional tail XNo surface area advantage due to end plate effect X
7.6.4 V-Tail
The V-tail configuration offers a stark design deviation from the conventional, T-tail, and cruciformconfigurations. This configuration opts for two angled fins which control both horizontal and vertical stabilityfrom its inherited geometry. This allows for smaller tail areas than the previous configurations. In theory,these surfaces act as a more space efficient alternative to their conventional counterparts, however in practicethe areas must be increased which diminish the gained efficiency. The use of the geometric angling causes thecontrol scheme for the aircraft to greatly increase in complexity, requiring both control surfaces to articulatein order to achieve a singular maneuver such as roll or yaw. In addition, the systems equivalent to a rudderdeflection causes an unintended roll moment against the desired motion. For a reusable design, the V-tail ismostly protected in the case of a belly-landing or recovery in uneven terrain. The reduced tail area can helpprevent excessive force concentrations and allow for a potentially lighter structure.
Table 55: V-Tail Pros and Cons
V-Tail Characteristics Pro: Con:Smaller tail area than those with conventional vertical and tail planes XMore efficient in theory as it acts for both horizontal and vertical tailplanes XComplicated mechanics for elevator and rudder movements. Both controlsurfaces require movement to achieve one maneuver.
X
”Rudder” deflections causes roll moment against desired turn X
7.6.5 Inverted V-tail
In the same vein as the V-tail, the inverted V-tail replaces the conventional horizontal and verticalstabilizers with two angled planes. Retaining the reduced tail area and more space efficiency, this variationimproves upon that of its upright counterpart by producing a roll moment in favor of of the systems equivalentto a rudder deflection. However, this system inherits the V-tail’s control complexity. A low mounted invertedV-tail would require to function as skids in the absence of a landing device and would likely be impactedlanding on an uneven surface. Dependent on the mounting configuration, these areas would need to be wellguarded against the forces generated in collisions, potentially adding more weight to the structure whencompared with that of a V-tail. However, if the inverted V-tail design were to extend from the lowest pointof the fuselage and connect above the fuselage, the impact concerns are far less.
Table 56: Inverted V-Tail Pros and Cons
Inverted V-Tail Characteristics Pro: Con:Smaller tail area than those with conventional vertical and tail planes XMore efficent in theory as it acts for both horizontail and vertical tailplanes X”Rudder” deflections create roll moment with desired turn XComplicated mechanics for elevator and rudder movements. Both controlsurfaces require movement to achieve one maneuver
X
49

7.6.6 Twin Tail
Twin tail configurations retain the conventional separation of vertical and horizontal stabilizers, but offeran additional vertical plane. This accommodates larger vertical tail requirements. Due to the introductionof two vertical planes, a larger horizontal plane is also present, allowing for high angle of attack operationas the flow from aircraft’s fuselage has less an effect on the surface. These additions increase the weightand structural requirements as a trade off. From a durability perspective, the twin tail is virtually the sameas the conventional tail. Horizontal tail structures are still in danger of impacting the ground during abelly-landing.
Table 57: Twin Tail Pros and Cons
Twin Tail Characteristics Pro: Con:Accomadates for lager tail requirements XCovered less by fueselage in high angles of attack, allowing them to operatebetter in such conditions
X
Heavier than conventional tail designs X
7.6.7 Boom Mounted
The boom mounted configuration is the T-tail equivalent of the twin tail. Retaining the accommodationfor larger tail requirements as well as the increased operation at higher angles of attack, the boom mountedconfiguration improves upon the design by removing the horizontal lifting surface from the fuselage intoclean air above. Unlike the T-tail, no stall characteristics are worsened by this design due to the increasedhorizontal stabilizer’s size. However, the increase in size and structural requirements necessary to supportthe lifting of the horizontal plane makes this configuration the heaviest of all considered configurations.Depending on the positioning of the boom mounted tail and the pitch angle of the aircraft during landing,the bottom surface of the vertical tails may need to act as a skid during a belly-landing. Furthermore, basedon how far the boom tail is extended past the fuselage, the vertical stabilizers could be susceptible to impactswhen landing in rough topography.
Table 58: Boom Tail Pros and Cons
Boom Mounted Tail Characteristics Pro: Con:Accomadates for lager tail requirements XCovered less by fueselage in high angles of attack, allowing them to operatebetter in such conditions
X
Removed from the downwash of the main wing XHeaviest of all considered tail desings X
7.6.8 Tail Configuration - Trade Study Criteria and Results
In order to conduct a trade study centered around aircraft empennage designs, a standardized criteria andweight system becomes critical to generate a universal system of assessment. In doing such, four categorieswhere derived from project requirements to drive the trade study: stability, weight, maneuverability, andmounting complexity. These traits are derived from FR 6 and which pertain to overall vehicle stability andperformance in varying operational environments and wind gust perturbations. Thus, a heavy emphasis onoverall aircraft stability is placed in order to satisfy the aforementioned requirements. A minor driving factoraddressed by these requirements manifests in aircraft maneuverability. While important for the aircraft tomaneuver, the overall requirements place less of an emphasis over stability. In addition, FR 1 and 9 dictatean overall reduced weight budget be applied to the structure to increase the endurance capabilities whilealso reducing overall cost, therefore implementing a significant demand on weight effects on performanceHowever, due to the role in which empennage’s play in overall vehicle control, the weight of such design isout weighted when compared to the functionality it provides to overall stability. The tail section will also besusceptible to harsh landing conditions. Thus, to retain durability requirements, the tail configuration ability
50

to endure such conditions becomes prominent. Finally, the overall complexity involved with developing andmounting the tail configuration plays a factor into the timeline of this project. While not as pertinent asstability or weight, the configurations natural integration plays an important role in allowing for a systemto be developed, thus occupying the final criteria position.
Table 59: Tail Trade Weighting
Criteria Weight Rationale
Stability 40%
FR 1 and 6 require the UAV to remainstable during flight to enhance endurance
capability and adaptability to environmentalconditions such as sharp wind gusts.
Regardless of configuration, some formof control surface must be implemented tocreate static and dynamic stability for the
vehicle to complete its mission.
Weight 30%
In order to satisfy FR 1 and 9, a weightconscious tail configuration is importantto extend endurance and reduce overall
costs.
Maneuverability 10%
The UAV’s ability to maneuver directlyimpacts the systems mission capability
and FR 1. The amount of maneuverabilityplays an important role to maintaincourse and take actions to extend
endurance.
Durability 10%
UAV’s ability to withstand verticaland lateral wind gusts as well as landing
requirements defined in FR 3 providea great need for increased tail durability
Mounting Complexity 10%
The ability for the tail section to becompatible with the UAV fueselage
can greatly impact the timescaleof the project as well as the overall
performance of the design.Total 100%
Table 60: Tail Trade Scale
Criteria Level 1 Level 2 Level 3
Stability (45%)
Configuration displays poor naturalstability towards deviations
Inherent problematic dynamic responsessuch as deep stall, poor cutch roll
characteristics, and high phugoid responsesRequires active control augmentation to
operate
Configuration displays moderate natural stabilitytowards deviations
Little inherited poor dynamic responsesRequires little to no active control augmentation
Configuration displays favorable natural stabilitytowards deviations
Minor inherited poor dynamic responsesNo active control augmentation required
Weight (35%)High weight budget required nearing 10%
of overall weightModerate weight budget required, leading to 7%
of overall weightNo invasive weight budget required, leading to <5% of
overall weightManeuverability (10%) Significant poor natural maneuverability Limited natural maneuverability Inherent maneuverability
Durability (10%)Configuration will require care in landing operations
or require maintenance after 1-3 flightsConfiguration will require limited care in landing operations
or require maintenance after 4∼9 flightsConfiguration will require little to no care in landing operations
or maintenance after >9 fights
Mounting Complexity (10%)
Requires significant integration effort andplanning
Restrictive in fuselage design and interfacingsurface
Requires more complex mechanism to actuatehorizontal control surfaces such as elevators
Integration requires some effort and planningLimited impact on fuselage design
Some complex integration mechanics for horizontalcontrol surface articulation
Natural integration requires little effort and planningNo Impact on fuselage design
Straightforward integration of horizontal control surfacemechanisms
51

Table 61: Tail Trade Matrix
Criteria Conventional T-Tail Cruciform V-Tail Inverted V-Tail Twin Tail Boom Mounted TailStability 2 2 2 1 2 3 3Weight 3 1 2 2 2 1 1Maneuverabilty 2 2 2 3 3 2 2Durability 3 2 2 3 1 2 2Mounting Complexity 3 1 2 3 2 2 1Total Scoring 2.5 1.6 2 1.9 2 2.1 2
Using the above trade matrix, the study identifies a conventional tail configuration shall be the mostoptimal choice.
7.7 Materials
There is a wide variety of materials to chose from in lightweight aircraft design, all of which have somefavorable characteristics and some drawbacks. Establishing a preliminary list of eligible materials was basedlargely on previous works for lightweight UAVs and RC fixed-wing aircraft. It is desirable to the customerthat the material selection be made with an emphasis on ease of fabrication, ease of repair, strength anddurability, weight, and cost. The material chosen for the aircraft will have a great impact on the flightcharacteristics of the aircraft as well as influence design of the structure of the aircraft. After thoroughinvestigation of feasible materials, the following material types were chosen for investigation : wood, plastic,foam, and composite. It has been proven by previous works that an RC plane can be constructed of anyof these materials however a trade is study is done in order to establish the best option to meet customerrequirements.
7.7.1 Wood
The two main types of wood used on small aircraft are balsa and bass. Balsa is lightweight and verysmooth however it is very brittle. Balsa wood also absorbs water and would require a top sheet or coverin order to insure the material properties are not changed when exposed to water. Bass wood on the otherhand is typically stronger and heavier than balsa. Bass is also water resistant which is favorable over balsa.Both wood materials investigated are easy to fabricate and can be cut and sanded with simple tools.
Table 62: Balsa Wood Pros and Cons
Balsa Wood Pro: Con:Durability and Impact Resistance XLightweight XEasy to work with XWater Resistance XDifficult to repair XResist torsional and axial loads XSmooth(aerodynamic) X
Table 63: Bass Wood Pros and Cons
Bass Wood Pro: Con:Durability and Impact Resistance XLightweight XEasy to work with XWater Resistance XDifficult to repair XResist torsional and axial loads XSmooth(aerodynamic) X
52

7.7.2 Composites
The most common composite investigated is carbon fiber which has a very high strength to weightratio which is desirable to meet the mission requirements. They are lighter and significantly stronger thanplastic when crashed, but not indestructible. Carbon fiber is a popular material for parts of aircraft thatmust be very strong such as the propeller. One draw-back to composites is their cost and difficulty tomanufacture. Similar to metal or plastics, carbon fiber has the benefit of being water resistant and materialproperties will not change when exposed to water. Another composite investigated is called WonderflexThermoplastic. The heat activated composite material, which contains its own adhesive, is often referredto as the Celastic replacement product and similar in properties to Worbla. This pliable, scrim-reinforcedextruded composite has a smooth surface on one side that can be molded or formed once it’s been heated.Wonderflex thermoplastic is strong and flexible, yet is still lightweight. It can be molded into varyingshapes and thicknesses and can be reheated and reapplied if needed for repairs or modifications. Moreover,Wonderflex can be adhered to most porous materials like paper, wood, fabric, and foams, which would makeit useful as a top-layer of a small aircraft.
Table 64: Carbon Fiber Pros and Cons
Carbon Fiber Pro: Con:Strong and rigid XLightweight XHarder to work with XWater resistance XDifficult to repair XExpensive X
Table 65: Wonderflex Thermoplastic Pros and Cons
Wonderflex Thermoplastic Composite Pro: Con:Strong and rigid XLightweight XEase of Fabrication XWater resistance XEase of repair X
7.7.3 EPP Expanded Polystyrene (Foam)
EPP is popular for building small airplanes because it is light, strong, and moderately flexible makingit a very resilient material. EPP is a highly versatile closed-cell bead foam that provides a unique range ofproperties, including outstanding energy absorption, multiple impact resistance, thermal insulation, buoy-ancy, water and chemical resistance, and exceptionally high strength to weight ratio. When EPP is torn, thetwo halves match up perfectly and can be re-glued with an almost invisible repair. Models built out of EPPfoam are extremely durable and can take up a lot of abuse as the foam bends without breaking. Althougheasy to cut especially with a hot-wire cutter, EPP is difficult to sand down.
Table 66: EPP Pros and Cons
EPP Expanded Polystyrene Pro: Con:Durability XLightweight XDifficult to work with XWater resistance XEase of repair XFlammable X
53

7.7.4 EPS Expanded Polystyrene (Foam)
Expanded Polystyrene insulation is a lightweight, rigid, closed cell insulation. EPS is available in severalcompressive strengths to withstand load and back-fill forces. This closed-cell structure provides minimalwater absorption
Table 67: EPS Pros and Cons
EPS Expanded Polystyrene Pro: Con:Not very durable XLightweight XEasy to work with XWater resistance XEase of repair XCracks easily X
7.7.5 Metal
Metal materials are favorable due to their high strength properties however weight can become prob-lematic. Metals can also be more difficult to mold and manufacture specific parts when compared to woodor plastic. Metals are water resistant and due to their material properties do not change when exposed tomoisture.
Table 68: Metals Pros and Cons
Metals Pro: Con:Durability XHeavy XDifficult to work with XSmooth surface for favorable aerodynamics XEase of repair/adjustment XWater resistant X
7.7.6 Plastic
Plastic materials are commonly used in small, lightweight aircraft design as they provide a high strengthto weight ratio which is favorable for efficient flight. Plastic parts also have the advantage of being ableto be 3D printed which allows for rapid prototyping and customization. Plastics are also water resistantwhich is favorable in the scope of the mission. The two plastics investigated are Polylactic acid(PLA)and Acrylonitrile butadiene styrene(ABS), both of which are thermoplastic 3D printing materials. PLA isstronger and stiffer than ABS, which is weaker and less rigid. ABS is lighter than PLA which is an importantfactor in the study. ABS is best suited for applications where strength, ductility, machinability and thermalstability are required.
Table 69: PLA Pros and Cons
PLA Pro: Con:Durability XLightweight XEase of Fabrication XWater Resistant XEase of repair capability X
54

Table 70: ABS Pros and Cons
ABS Pro: Con:Durability XLightweight XEase of Fabrication XWater Resistant XEase of repair capability X
7.8 Materials - Trade Study Criteria and Results
Table 71: Materials Trade Study Criteria
Criteria Weight Rationale
Weight/Density 25%
In regards to efficient flight, it is mission criticalthat the aircraft be as light as possible in orderto save fuel and prolong the maximum mission
flight time. For this reason, material weight is of extreme importancein selecting materials.
Ease of Fabrication 25%
When it comes time to build the aircraft, mission successwill depend on whether or not the team can
fabricate the design exactly. By choosinga material that is easy to
fabricate with, the design can be better actualized.
Durability 25%
It is mission critical that the airplane beable to withstand a range of environmental conditions
and survive hard landings.For this reason, it is desirable that the material selected be strong and durable.
”Durable” as referred to here could either mean that the materialis resistant to structure changes from applied loads or that the material is able
to flex and change shape slightly in orderto dissipate applied forces and remain a sound assembled structure.
Water Resistance 12.5%
Because the aircraft will provide sustained operationin the outdoors, it is likely that rain and moisture will be present.
The material selection must account for moisturein order to protect the on-board electronics.
Additionally, it is unfavorable to use a material that will change inload performance when exposed to moisture.
Ease of Repair 12.5%
Part of the customer-supplied mission aspectsis that the aircraft must be able to ”land” in a dense forest-like
environment which means that it is likely the airplane will sustain some damage.Due to the nature of the mission, it is desirable that the
airplane be easily repaired for rapid redeployment if damage is indeed sustained.Not every material initially investigated would be equal in regards
to ease of repair so this criteria was chosen when down-selecting the aircraft material.Total 100%
55
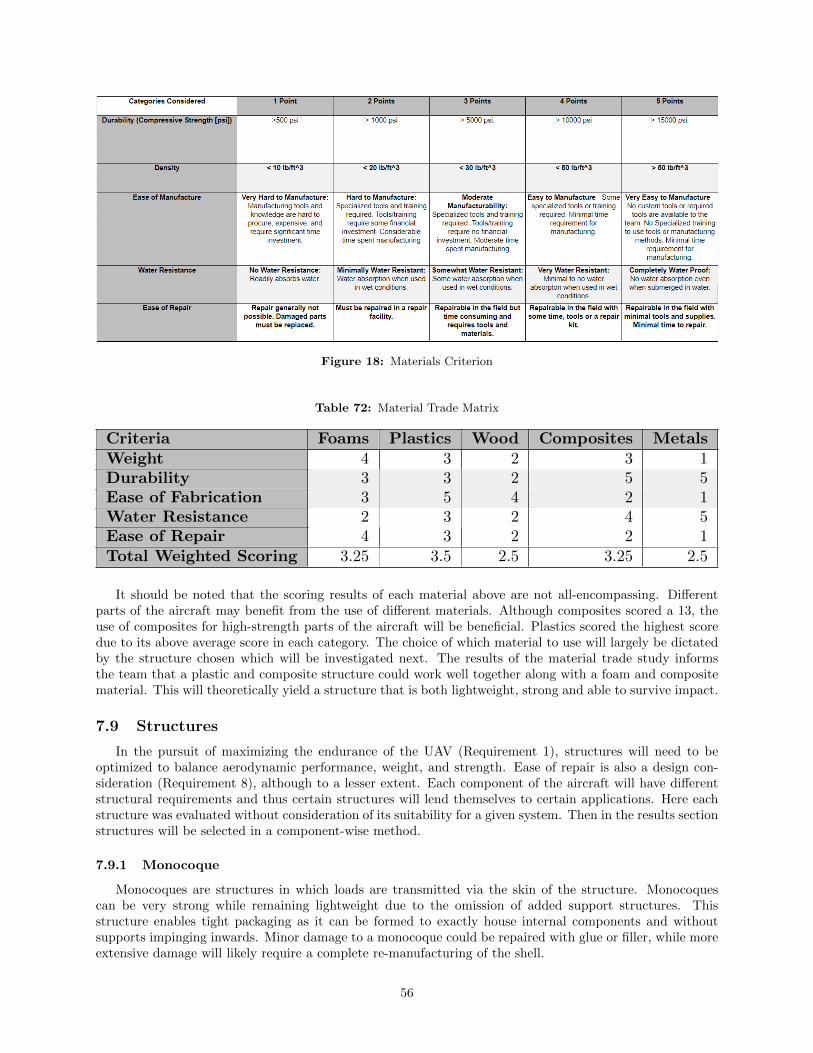
Figure 18: Materials Criterion
Table 72: Material Trade Matrix
Criteria Foams Plastics Wood Composites MetalsWeight 4 3 2 3 1Durability 3 3 2 5 5Ease of Fabrication 3 5 4 2 1Water Resistance 2 3 2 4 5Ease of Repair 4 3 2 2 1Total Weighted Scoring 3.25 3.5 2.5 3.25 2.5
It should be noted that the scoring results of each material above are not all-encompassing. Differentparts of the aircraft may benefit from the use of different materials. Although composites scored a 13, theuse of composites for high-strength parts of the aircraft will be beneficial. Plastics scored the highest scoredue to its above average score in each category. The choice of which material to use will largely be dictatedby the structure chosen which will be investigated next. The results of the material trade study informsthe team that a plastic and composite structure could work well together along with a foam and compositematerial. This will theoretically yield a structure that is both lightweight, strong and able to survive impact.
7.9 Structures
In the pursuit of maximizing the endurance of the UAV (Requirement 1), structures will need to beoptimized to balance aerodynamic performance, weight, and strength. Ease of repair is also a design con-sideration (Requirement 8), although to a lesser extent. Each component of the aircraft will have differentstructural requirements and thus certain structures will lend themselves to certain applications. Here eachstructure was evaluated without consideration of its suitability for a given system. Then in the results sectionstructures will be selected in a component-wise method.
7.9.1 Monocoque
Monocoques are structures in which loads are transmitted via the skin of the structure. Monocoquescan be very strong while remaining lightweight due to the omission of added support structures. Thisstructure enables tight packaging as it can be formed to exactly house internal components and withoutsupports impinging inwards. Minor damage to a monocoque could be repaired with glue or filler, while moreextensive damage will likely require a complete re-manufacturing of the shell.
56

Table 73: Monocoque Pros and Cons
Monocoque Pro: Con:Able to optimize geometry for mass and aero efficiency XLightweight XLower Manufacturing complexity XNot Modular: Changes/Repairs require complete re-manufacturing X
7.9.2 Rib and Spar
Rib and spar structures combine an internal framework with a load bearing skin. In an aircraft wing theribs run longitudinally and give the airfoil its shape, while the spars run laterally and tie the ribs to eachother and to the fuselage. This structure can also facilitate compact packaging of internals but the internalstructures will limit or impinge upon the internal volumes. The addition of the ribs and spars will increasethe strength of the wing while also increasing the weight. Repairs for this structure are similar to that of amonocoque, but the modular nature of this design may allow for repair in cases where a monocoque wouldhave to be replaced.
Table 74: Rib and Spar Pros and Cons
Rib and Spar Pro: Con:House electronics and controls internally XEnables complex geometries XHeavy compared to monocoque XComplex construction and assembly X
7.9.3 Solid
Most materials are much too dense to allow for solid body constructions in an aircraft. Foam is oneexception where its low density allows for solid structures and so here ”solid” will imply a solid bodyconstructed of foam. Solid foam structures are very common in hobbyist aircraft due to their light weight,ease of manufacture and repair, high availability and low cost. For a commercial and industrial applicationsfoam lacks the ruggedness and durability required to maintain mission capabilities through multiple flights.This material could be a viable option for prototyping, or small, non-load bearing surfaces that are not likelyto contact the ground on landing.
Table 75: Solid Foam Pros and Cons
Solid (Foam Only) Pro: Con:Very easy to manufacture XVery Lightweight XSusceptible to abrasions and deformations XLacks Strength XHarder to house components internally X
7.9.4 Flat Plate
Flat plates are quasi-2D structures that do not have any support structures. They are very easy tomanufacture, lightweight and easy to model aerodynamically. Even at the low Reynolds numbers expectedin small UAV flight, flat plates exhibit lower L/D ratios and are thus less efficient than an aerofoil. For smallcontrol surfaces such as vertical and horizontal stabilizers a flat plate may offer a worthwhile trade-off ofperformance vs complexity.
57

Table 76: Flat Plate Pros and Cons
Flat Plate Pro: Con:Very low complexity XVery lightweight XVery simple to produce XLess efficient aerodynamics XLow strength X
7.9.5 Tubes and Rods
Tubes and rods refers to pre-manufactured composite structures used for an aircraft fuselage and also todowels used as spars in the wings or to connect the fuselage to the tail. Rods and tubes offer low complexityfor structural modeling, and are available off the shelf. They can be strong and lightweight depending onthe materials used. When used as a fuselage a cylinder is inefficient for packaging electronics, and also doesnot generate any appreciable lift.
Table 77: Tube and Rods Pros and Cons
Rods and Tubes Pro: Con:Low complexity XAvailable off-the-shelf XStrong XLightweight XDoes not generate lift XPoor packaging if used for fuselage X
7.9.6 External Bracing
External braces are often used to support wing loads and run from the wing to the fuselage. They cancome in the form of cables, solid struts, or a combination of both. These structures increase strength, andreduce structural complexity for analysis at the expense of complexity in manufacturing, aerodynamic drag,and mass.
Table 78: Externally Braced Pros and Cons
Externally Braced (Wires, Struts, Semi-Cantilever) Pro: Con:High strength XSimplifies structural analysis XIncreased drag XIncreased manufacturing complexity X
58
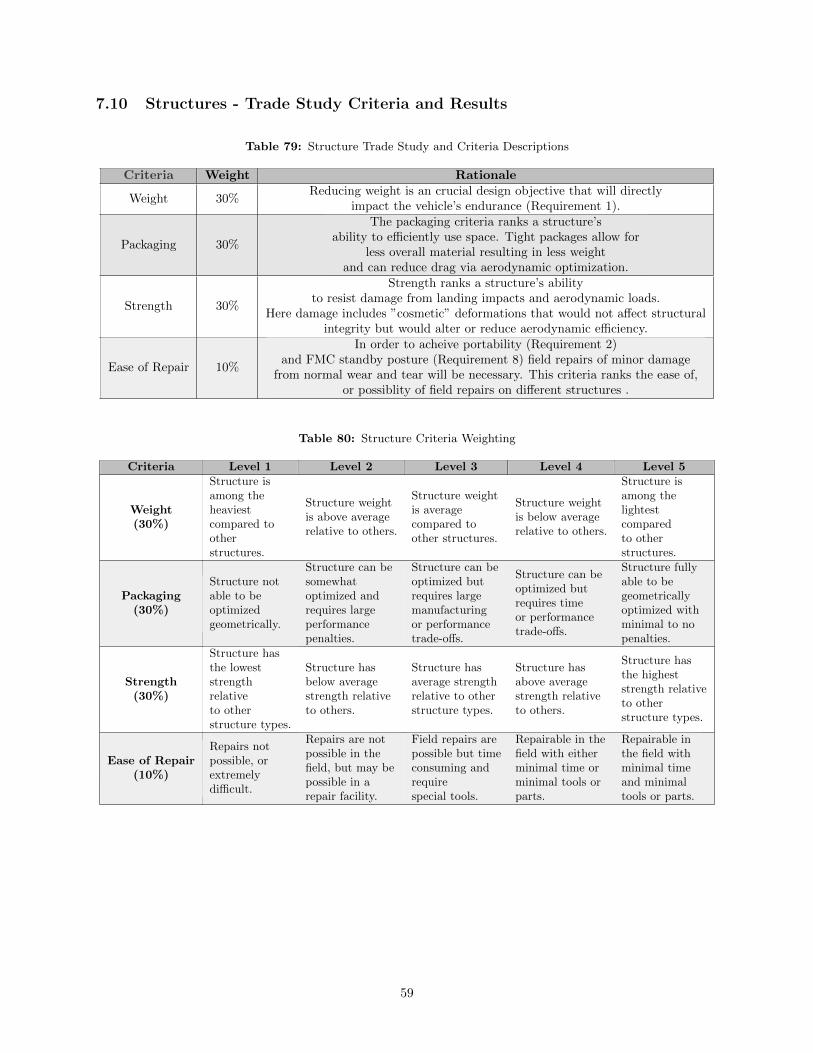
7.10 Structures - Trade Study Criteria and Results
Table 79: Structure Trade Study and Criteria Descriptions
Criteria Weight Rationale
Weight 30%Reducing weight is an crucial design objective that will directly
impact the vehicle’s endurance (Requirement 1).
Packaging 30%
The packaging criteria ranks a structure’sability to efficiently use space. Tight packages allow for
less overall material resulting in less weightand can reduce drag via aerodynamic optimization.
Strength 30%
Strength ranks a structure’s abilityto resist damage from landing impacts and aerodynamic loads.
Here damage includes ”cosmetic” deformations that would not affect structuralintegrity but would alter or reduce aerodynamic efficiency.
Ease of Repair 10%
In order to acheive portability (Requirement 2)and FMC standby posture (Requirement 8) field repairs of minor damage
from normal wear and tear will be necessary. This criteria ranks the ease of,or possiblity of field repairs on different structures .
Table 80: Structure Criteria Weighting
Criteria Level 1 Level 2 Level 3 Level 4 Level 5
Weight(30%)
Structure isamong theheaviestcompared tootherstructures.
Structure weightis above averagerelative to others.
Structure weightis averagecompared toother structures.
Structure weightis below averagerelative to others.
Structure isamong thelightestcomparedto otherstructures.
Packaging(30%)
Structure notable to beoptimizedgeometrically.
Structure can besomewhatoptimized andrequires largeperformancepenalties.
Structure can beoptimized butrequires largemanufacturingor performancetrade-offs.
Structure can beoptimized butrequires timeor performancetrade-offs.
Structure fullyable to begeometricallyoptimized withminimal to nopenalties.
Strength(30%)
Structure hasthe loweststrengthrelativeto otherstructure types.
Structure hasbelow averagestrength relativeto others.
Structure hasaverage strengthrelative to otherstructure types.
Structure hasabove averagestrength relativeto others.
Structure hasthe higheststrength relativeto otherstructure types.
Ease of Repair(10%)
Repairs notpossible, orextremelydifficult.
Repairs are notpossible in thefield, but may bepossible in arepair facility.
Field repairs arepossible but timeconsuming andrequirespecial tools.
Repairable in thefield with eitherminimal time orminimal tools orparts.
Repairable inthe field withminimal timeand minimaltools or parts.
59

Table 81: Structure Trade Study Results
Criteria MonocoqueRib&
SparSolid Flat Plate
Tubes&
Rods
ExternalBraces
Weight(30%)
3 2 4 5 4 1
Packaging(30%)
5 4 3 1 2 1
Strength(30%)
4 5 3 1 4 5
Ease ofRepair(10%)
4 4 5 3 4 2
Totals 4 3.7 3.5 2.4 3.4 2.3
The results of the structures trade study can be seen in Table 80 above. The monocoque is the clearfavorite due to its high strength and low weight. On this vehicle the monocoque will likely be used for themain fuselage. This will allow for a light, strong, and efficient means for tying the aircraft together andhousing the avionics, battery, and payload.
The second best performing structure is rib and spar which is a little stronger but also heavier. Thisstructure will likely be chosen as the wing structure to give the aircraft strength and also allow for variablegeometry wings. If the team decides to go with a conventional wing and control surfaces then a monocoquestructure might be chosen to reduce weight.
Solid foam structures came in as the next best structure due to packaging and strength being slightlylower. Major structures will likely not use foam, but it is possible that it could be a good option for tailcomponents or control surface so long as the loads remain relatively low. Similarly, flat plates could be agood option in these cases because there are no packaging concerns and strength is less of an issue.
Tubes and rods rank average but are obviously not options for aerodynamic surfaces. While a hollowtube could make a simple, strong fuselage, packaging the components inside of it likely rule it out versus acustom monocoque or rib and spar design. Thin strong composite rods are a very viable option for wingspars and also in connecting the tail of the aircraft to the main body.
Finally, external braces scored very low because they add complexity to manufacturing, add weight tothe vehicle, and also increase drag on the vehicle. They would only be used in such a case where the internalstructure of the wing was deemed insufficient to support the loads.
8 Selection of Baseline Design
The baseline design for this UAV will be a conventional fixed wing airframe with a conventional taildesign. The wings shall be high mounted, have a high AR, and feature small sweep, a cambered airfoil,wing taper and no wing-body angle. The fuselage of this aircraft will be a variable geometry fuselage. Thepropulsion system shall be an electric propulsion system using electric batteries as fuel cells. The launchsystem for this UAV will likely be hand launch, but more determination about the necessary launch systemwill be made as the design progresses. The materials and structure for the aircraft vary for each subsystem,and are described in greater detail below. A summary of the trade study review process for each key designelement is also included below.
8.1 Aircraft Type
The aircraft type is the result of the Level 1 Trade Study, with a fixed wing aircraft being the most viableoption for this UAV. This determination was reviewed by the HERD CU Team after presentations abouteach aircraft type were shown to the entire team (See Section 5.2). As enthusiastic as the team was aboutdifferent possibilities of other air vehicles, the fixed wing aircraft proved to be the most efficient and most
60
realistic option at meeting the design requirements laid out in Section 3. Primarily, wind design requirementsand endurance requirements specified by the customer eliminated the VTOL, Rotary and Lighter-than-Airoptions. Although the Lighter-than-Air vehicle had extremely high endurance, the possibility of meeting thedesign requirements related to wind performance and portability were deemed unachievable by the HERDCU team and by the Level 1 Trade Study.
8.2 Airframe Selection
The airframe selection is the Result of the Level 2 Trade Study, with a conventional fixed wing configura-tion being the most viable option for this UAV. This determination came after a significant market analysisof these two airframes in current UAVs (see Section 2.2.1.1), which led to the informed results seen in theLevel 2 Trade Study. The flying wing airframe demonstrated higher endurance and has more attractive over-all lifting capability than conventional fixed wing airframes, but the sensitive stability, difficult constructionand overall technical complexity associated with flying wing airframes led to a lower overall score in theLevel 2 Trade. The Level 2 Trade criteria was revised by the HERD CU team through a ’Red Teaming’effort to make the trade study more objective and to cater the trade to the Design Requirements in Section3. Overall, the consensus of the team and of the Level 2 Trade study is that the conventional fixed wingaircraft is the most viable option for this UAV.
8.3 Tail Configuration
Based on the results of the level 3 trade study, a conventional tail deign will be implemented for the UAV.This choice was a consequence of the resulting empennage trade matrix in which all tail configurations werecompared based upon the advantages and disadvantages of each, outlined in section 7.6. The conventionaltail generally offers desirable weight, as the vertical tail does not have to support the horizontal stabilizers.Because of this, the vertical and horizontal tails can be lighter to promote the overall goal of endurance.Moreover, conventional tail designs offer relatively uncoupled yaw and pitch control and requires the leastamount of mounting complexity. While a belly-landing on uneven terrain was identified as a potentialdanger to the horizontal stabilizer surfaces, the reduction in weight stemming from low-mounted horizontaltail surfaces allows for those surfaces to be better protected against impacts as required.
8.4 Wing Mounting
A high mounted wing is the most viable option for this UAV due to its inherent stability characteristicsand high placement providing increased operator grip area during launch. A high mounted wing design willalso minimize wingtip drag upon landing when paired with a fuselage, which features a belly fairing for skidlandings.
8.5 Wing Design
With the selection criteria outlined in Level 3 Trades - Wing Design, Section 7.2, a final wingdesign was determined. To give the aircraft high endurance, increased stability, and better maneuverability,all the while decreasing mass, the following four wing design criteria were selected: aspect ratio (AR), taperratio, wing sweep and wing geometry. In regards to AR, a large AR will affect the planform area of thewing, creating a long, slender surface area that inherently increases aircraft stability as well as its lift-to-dragratio. In addition, wing taper will be applied from the root of the wing to the tip. This will enhance aircraftperformance and model the wing’s lift distribution to closer match that of an elliptic wing (benefits of ellipticwing lift distribution can be seen in 7.2.2 - Wing Taper Ratio). Furthermore, a small wing sweep anglewill be applied to the wing, aiding in maneuverability and further increasing the wing lift-to-drag ratio withnegligible loss to overall lift. Lastly, the geometry will have camber to aid the flight characteristics of lift-to-drag ratio, endurance, and maneuverability. Outside of these design choices, further design considerationswere explored, but did not meet the HERD-CU project requirements, following a full analysis of the designtrade space.
61

8.6 Fuselage Profile
A variable geometry fuselage is the most viable option for this UAV, primarily due to the benefits of areduced profile correlating to less required build material and reduced weight. New manufacturing techniquessuch as 3D printing allow for a complex shape to easily be formed allowing engineers to maximize the UAV’saerodynamics and structural rigidity without adding complexity in regards to assembly. The tapered fuselagealso offers the additional benefits of allowing the fuselage to conform to the payload bay, batteries, and motor,minimizing unused space on board . Varying the fuselage geometry of the UAV also allows for a flat bottomto be implemented into the design to create a wide surface landing area during belly landings, helping tominimize wingtip drag upon landing, increasing the durability of the unit.
8.7 Propulsion System
Electric propulsion is the most viable option for this UAV. After the Trade was conducted, any subjectivescoring was reviewed by the team, and the trade was run again after categories were made to be moreobjective. Gasoline power is an attractive option for this UAV due to its extremely high energy density, andoverall higher endurance. However, due to its high complexity, high maintenance intervals and higher cost,electric propulsion won the trade. It will demand less integration time by the HERD CU team, will allow foreasier throttle optimization through electronic control, and will allow more technical focus on aerodynamicefficiency for the highest possible endurance.
8.8 Launch System
A hand launch will be the most effective means of takeoff for this UAV. With low cost, low complexityand ease of use, it is significantly better than other available options. This determination was made basedon a market analysis against takeoff runs, catapults, VTOL systems and balloons.
8.9 Materials and Structures
Each aircraft component has different requirements for strength, weight and aerodynamics and thusstructures and materials will be determined at the component level.
8.9.1 Fuselage
To minimize weight in one of the larger components of the aircraft a monocoque design should be usedfor the fuselage. This will allow for all necessary components to be housed in a compact and aerodynamicmanner. Due to the likelihood of complex geometry, such as compound curves, the fuselage will lend itselfto 3D printed plastics to simplify manufacturing. The monocoque may end up blending with a rib and spardesign if structural analysis reveal weaknesses in the geometry.
8.9.2 Main Wing
The main wing will be constructed in a rib and spar method to increase the strength of the wings whilealso allowing for complex geometries and internally housed electronics. The spars will be of either wood,3D printed plastic, or a composite rod depending on actual structural loads to be determined later in thedesign. The wing skin will likely be a thermoplastic because it can easily be formed around the necessarycurves and will allow control surfaces to flex.
8.9.3 Wing Extensions and Winglets
Since wing loads are highest near the root of the wing, lighter structures should be considered for thewing tips and any winglets. This will depend on the computed loads, but a monocoque or solid foam designcould be possible.
62

8.9.4 Empennage
In order to maintain the center of gravity in front of the center of pressure it will be desirable to housethe payload and electronics as far forward as possible. Thus, the empennage need not have any internalvolume except to house wires running to the tail control surfaces. Based on these requirements, a thin hollowcomposite rod will be the lightest and strongest method of connecting the tail of the aircraft with the mainfuselage.
8.9.5 Tail Control Surfaces
If an aerodynamic analysis predicts that flat plates can achieve the required control authority withoutundue aerodynamic drag then they should be selected for their low weight and low complexity. In thisinstance, composites could add significant durability without much difficulty in manufacturing because ofthe 2D geometries. Otherwise, solid foam or thinly 3d printed plastic surfaces would likely offer the bestcombination of manufacturability, low weight, and can be made more durable via coatings or wraps.
63

9 Acknowledgments
References
[1] “Rq-11b raven,” Military.com Available: https://www.military.com/equipment/rq-11b-raven.
[2] “Up in smoke - Oklahoma State University,” Up in Smoke — Oklahoma State UniversityAvailable: https://news.okstate.edu/magazines/agriculture/cowboy-journal/articles/2021/
up-in-smoke.html.
[3] Drone types: Multi-rotor vs Fixed-Wing vs single ROTOR vs Hybrid VTOL,” AUAV Available: https://www.auav.com.au/articles/drone-types/
[4] “ScanEagle – Mini-UAV (Unmanned Aerial Vehicle).” Naval Technology, www.naval-technology.com/projects/scaneagle-uav/
[5] https://www.boeing.com/farnborough2014/pdf/BDS/ScanEagle
[6] “Unmanned Aircraft Systems (UAS).” Faa.gov, 10 Sept. 2019, www.faa.gov/uas/
[7] Woods, B. K. S., Bilgen, O., and Friswell, M. I., “Wind tunnel testing of the fish bone active cambermorphing concept,” Journal of Intelligent Material Systems and Structures, vol. 25, 2014, pp. 772–785
[8] Online materials information resource. MatWeb. (n.d.). Retrieved September 27, 2021, fromhttp://www.matweb.com/
[9] James, M. (n.d.). Find out what materials rc airplanes are made out of. LiveAbout. Retrieved September27, 2021, from https://www.liveabout.com/materials-rc-airplanes-made-out-of-2862947
[10] Group, T. M. (2019, March 8). Lightweighting in aerospace compo-nent and system design. Tech Briefs. Retrieved September 27, 2021, fromhttps://www.techbriefs.com/component/content/article/tb/pub/features/articles/33914
[11] Fleer, Ethan L, and Fritz Koch. “Boulder Rural Fire.” 7 Sept. 2021.
[12] Kunz, Peter J. Aerodynamics and Design for Ultra-Low Reynolds Number Flight, StanfordUniversity, Ann Arbor, 2003. ProQuest, https://colorado.idm.oclc.org/login?url=https:
//www.proquest.com/dissertations-theses/aerodynamics-design-ultra-low-reynolds-number/
docview/305303471/se-2?accountid=14503.
[13] High Efficiency Propeller for Small Unmanned X System Small Business Innovation Research N20A-T006
[14] Mrazova, Maria Advanced Composite Materials of the Future in Aerospace Indus-try, The Air Transport Department, 2013. https://pdfs.semanticscholar.org/8541/
6c75d82bdb253c296f6aea15b9b394b949f3.pdf
[15] ”Wing Sweep.” - SKYbrary Wiki - SKYbrary Aviation Safety, 2 Aug. 2017, 10:15, www.skybrary.aero/index.php/Wing_Sweep
[16] Sadraey, Mohamed H. Aircraft Design a System Engineering Approach. Wiley, 2013.
[17] Phillips, W. F. “Analytical Solution for Wing Dihedral Effect.” Journal of Aircraft, vol. 39, no. 3, 2002,pp. 514–516., doi:10.2514/2.2960.
[18] Cutler, Collin. “How Dihedral Keeps Your Wings Level.” Online Flight Training Coursesand CFI Tools, Boldmethod, 5 May 2015, www.boldmethod.com/learn-to-fly/aerodynamics/
dihedral-keeping-your-wings-level/.
64

[19] ”Self-Sustainability in Nano Unmanned Aerial Vehicles:A Blimp Case Study” Available:https://www.researchgate.net/publication/317394151_Self-Sustainability_in_Nano_
Unmanned_Aerial_Vehicles_A_Blimp_Case_Study
[20] Winslow, Justin, et al. “Basic Understanding of Airfoil Characteristics at Low Reynolds Numbers(104–105).” Journal of Aircraft, vol. 55, no. 3, 2018, pp. 1050–1061., https://doi.org/10.2514/1.c034415.
[21] Pedro Vianahttps://www.aeroflap.com.br/equipeEngenharia Aerospacial - Editor de foto e vıdeo -Fotografo - Aeroflap, et al. “Tipos De Asa e Sua Aerodinamica – Diedro.” AEROFLAP, 4 Dec. 2016,https://www.aeroflap.com.br/ tiposdesasa diedro/.
[22] “f145.” NASA, NASA, https://history.nasa.gov/SP-367/f145.htm.
[23] Talay, Theodore A. “INTRODUCTION TO THE AERODYNAMICS OF FLIGHT [NASA SP-367].”NASA History Division, Nov. 2006, https://practicalaero.com/wp-content/uploads/2010/04/NASA-SP-367.pdf.
[24] Technologie, Eos. “Strix 400 – Mini UAV.” Eos Technologie, https://www.eos-technologie.com/en/mini-UAV-Strix-400.htm.
[25] “Supercam S250.” SUPERCAM, https://en.supercam.aero/catalog/supercam-s250.
[26] “Orbiter 2.” Aeronautics Ltd., https://aeronautics-sys.com/home-page/page-systems/page-systems-orbiter-2-mini-uas/.
[27] Santos, Carlos. “Giving Wingsto Technology.” Harpia Tech - Remotely Piloted Aircraft Systems - RPAS— UAS — UAV, http://www.harpia-tech.com/.
[28] Aerofoundry. “Aerofoundry Unmanned Aerial SYSTEM, Watupa, REMOTE, SENS-ING, SURVEILLANCE, ISR.” Aerofoundry Unmanned System - Watupa UAS,https://www.aerofoundry.com/aerofoundry.com/watupa.htm.
[29] “Atyges FV1 - PROFESSIONAL Drones ATyges ®.” ATyges,https://atyges.es/en/tienda/product/atyges-fv1-2/.
[30] Hirrus L UAS, Autonomous Flight Technologies.
[31] Technologie, Eos. “Strix 300 – MINI UAV.” Eos Technologie, https://www.eos-technologie.com/en/mini-UAV-Strix-300.htm.
[32] “IA-17 Fixed Wings UAV: Ids INGEGNERIA DEI Sistemi S.p.A.” IDS Ingegneria Dei Sistemi, 5 Aug.2019, https://www.idscorporation.com/pf/ia-17/.
[33] “Rover MK I.” INTEGRATED DYNAMICS, http://idaerospace.com/rover-mk-i/.
[34] “Horus FT-100 Unmanned Aerial Vehicle (UAV).” Army Technology, 22 Sept. 2021, https://www.army-technology.com/projects/horus-ft-100-unmanned-aerial-vehicle-uav/.
[35] “Rover Xs.” INTEGRATED DYNAMICS, http://idaerospace.com/rover-xs/.
[36] “The E384 Mapping Drone.” Event 38 Unmanned Systems, https://event38.com/fixed-wing/e384-mapping-drone/?v=0a10a0b3e53b.
[37] “UAS Products.” Products — Applewhite Aero, https://www.applewhiteaero.com/products.html.
[38] “Agri Owl 200.” UAS Europe, http://www.uas-europe.se/index.php/products/unmanned-aircraft-s/agri-owl-200.
[39] “SKYROBOT fx20.” Robot Aviation, 7 July 2021, https://robotaviation.com/products/skyrobot-fx20/.
65

[40] “Solaris.” INTEGRATED DYNAMICS, http://idaerospace.com/solaris/.
[41] “Unmanned Aerial System ZALA 421-165, Uas.” Zala, https://zala-aero.com/en/production/bvs/zala-421-16e5/.
[42] “Falk.” Maritime Robotics, https://www.maritimerobotics.com/falk.
[43] “OGASSA OGS42.” UAVision Aeronautics, https://www.uavision.com/ogassa-ogs42.
[44] “UAV Factory: Penguin C UAS.” UAV Factory — Penguin C UAS,https://uavfactory.com/en/penguin-c-uas.
[45] “Avartek Ar-3000 RPAS.” Avartek, http://avartek.fi/?page id=27.
[46] “Explorer.” INTEGRATED DYNAMICS, http://idaerospace.com/explorer/.
[47] “UAS: TEKEVER ar3.” TEKEVER, https://uas.tekever.com/AR3/.
[48] ”Preliminary tailplane design.” Synthesis of Subsonic Airplane Design, 1982, https://doi.org/10.
1007/978-94-017-3202-4_9
[49] ”A new approach in aircraft vertical tailplane design.” AIDAA, 2013, https://www.researchgate.
net/publication/261676034_A_new_approach_in_aircraft_vertical_tailplane_design
[50] ”Empennage General Design.” HAW Hamburg, https://www.fzt.haw-hamburg.de/pers/Scholz/
HOOU/AircraftDesign_9_EmpennageGeneralDesign.pdf
[51] ”Tail Design.” Daniel Webster College, http://www.aero.us.es/adesign/Slides/Extra/Stability/Design_Tail/Chapter%206.%20Tail%20Design.pdf
[52] NOVAerial. “Novaerial’s Helicopter Drones: Better than Multicopters?” New Atlas, 19 Dec. 2016,https://newatlas.com/novaerial-procyon-800e-helicopter-drone/47013/.
[53] “Disc Loading and Hover Efficiency.” Krossblade Aerospace Systems, https://www.krossblade.com/disc-loading-and-hover-efficiency.
[54] Gatti, Mauro, et al. “Maximum Endurance for Battery-Powered Rotary-Wing Aircraft.” AerospaceScience and Technology, vol. 45, 2015, pp. 174–179., https://doi.org/10.1016/j.ast.2015.05.009.
[55] Gatti, Mauro, et al. “Maximum Endurance for Battery-Powered Rotary-Wing Aircraft.” AerospaceScience and Technology, vol. 45, 2015, pp. 174–179., https://doi.org/10.1016/j.ast.2015.05.009.Megson, T.H.G. “Structural Components of Aircraft.” Aircraft Structures for Engineering Students, 2017,pp. 397–417., https://doi.org/10.1016/b978-0-08-100914-7.00012-8.
[56] “Preliminary Weight Study Comparing Multi-Rib and Multi-Spar Wing Box Configurations UsingSpandset.” 2020, https://doi.org/10.2514/6.2021-0922.vid.
[57] Stanford, Bret, and Peter D. Dunning. “Optimal Topology of Aircraft Rib and Spar Structures underAeroelastic Loads.” 10th AIAA Multidisciplinary Design Optimization Conference, 2014, https://doi.org/10.2514/6.2014-0633.
[58] Gudmundsson and Snorri. Chapter 12. The Anatomy of the Fuselage, 2014,https://www.researchgate.net/publication/279946349_Chapter_12_The_Anatomy_of_the_Fuselage
[59] Turner. ”Lithium battery performance in cold temperatures”, 2009 https://optibike.com/
lithium-battery-performance-in-cold-temperatures/
[60] Carpender. ”Gas (IC) vs. electric (EP) RC flying”, 2002 https://www.rc-airplane-world.com/
gas-vs-electric-rc-flying.html
[61] ”How To - Maintaining and Storing Your Traxxas Nitro Model” https://traxxas.com/support/
How-Maintaining-and-Storing-Your-Traxxas-Nitro-Model
66

[62] I Fly America, Inc. “The Wing’s The Thing.” Wing Design, https://iflyamerica.org/safety_wing_design.asp.
[63] C. Friedrich, et al. “Hybrid Power in Light Aircraft: Design Considerations and Experiences ofFirst Flight.” University of Cambridge, University of Cambridge, www.aerosociety.com/media/5962/
3-hybrid-power-in-light-aircraft.pdf.
67

10 Appendix
10.1 Appendix A - UAV Market Supplemental Analysis
Tables 82 and 83 below were compiled to create a broad overview of the current fixed wing solutionsavailable to customers in the current market.
Name Endurance (hr) Weight (lbs) Payload Weight (lbs) MTOW (lbs) Payload/MTOW Ratio MTOW/Endurance Ratio lbs/hrStrix 400 6 12.1 5.5 17.6 31.25% 2.933333333Supercam S250 3 20.9 3.3 24.2 13.64% 8.066666667Orbiter 2 4 19.4 3.3 22.7 14.54% 5.675Vigilant 1 4.4 2.2 6.6 33.33% 6.6AeroFoundry Watupa 5 10.60 2.60 13.20 19.70% 2.64ATYGES FV1 3 11 4.4 15.4 28.57% 5.133333333Hirrus L 3 17.60 2.20 19.80 11.11% 6.6Hobbyist Example 10.75 8.5 1 9.5 10.53% 0.8837209302Strix 300 4 8.8 2.2 11 20.00% 2.75IA-17 5 55.1 5.5 60.6 9.08% 12.12ID Aerospace Rover Mk1 1 5.50 4.50 10.00 45.00% 10FT-100 2 15.4 6.6 22 30.00% 11ID Aerospace Rover Mk2 XS 1 7.70 6.60 14.30 46.15% 14.3E384 1.67 5.60 2.20 7.80 28.21% 4.670658683Milo UAS 3 14.00 5.00 19.00 26.32% 6.333333333Agri Owl 200 3 8.35 5.95 14.30 41.61% 4.766666667Skyrobot FX-20 4 22.10 6.60 28.70 23.00% 7.175ID Aerospace Solaris 24 19.80 13.30 33.10 40.18% 1.379166667ZALA 421-165 HD 6 54.00 11.00 65.00 16.92% 10.83333333Falk UAS 10 39.70 15.40 55.10 27.95% 5.51H24 Cruzer 24 37.5 17.6 55.1 31.94% 2.295833333OGASSA OGS42 6 83.8 11 94.8 11.60% 15.8Penguin C 20 39 11.7 50.7 23.08% 2.535AR-3000 12 21 16.5 37.5 44.00% 3.125ID Aerospace Explorer 6 19.80 24.20 44.00 55.00% 7.333333333Tekever AR3 16 41.90 8.80 50.70 17.36% 3.16875Average 6.7368 22.47 7.61 29.09 27.31% 6.418375185
Table 82: A Market Analysis of performance values on a variety of fixed-wing small UAVs.
Name Body Type Motor Placement Propulsion Wing Angle Stabilizer Launch System Wingspan (ft)Strix 400 Conventional Front Electric Polyhedral Rear T Hand Launch 13.9Supercam S250 Flying Wing Front Electric Standard Double Vertical I Elastic Catapult 8.37Orbiter 2 Flying Wing Rear Electric Standard Vertical Wingtip Pneumatic catapult 9.84Vigilant Flying Wing Rear Electric Standard Vertical Mid-wing Hand Launch 6.56AeroFoundry Watupa Conventional Vertical Outrigger Electric Standard Single Rear I Hand Launch 6.23ATYGES FV1 Flying Wing Rear Electric Standard N/A Hand LaunchHirrus L Flying Wing Rear Electric Standard N/A Catapult 10.83Hobbyist Example Electric N/A Hand LaunchStrix 300 Conventional Front Electric Dihedral Rear Inverse T Hand Launch 9.81IA-17 Flying Wing Rear Electric Standard Inverse Wigtip Catapult 9.19ID Aerospace Rover Mk1 Conventional Vertical Outrigger Electric Standard Rear T Hand Launch 4.65FT-100 Conventional Front Electric Dihedral Rear Inverse T Hand Launch 8.86ID Aerospace Rover Mk2 XS Conventional Vertical Outrigger Electric Standard Rear T Hand Launch 9.3E384 Conventional Mid Electric Standard Rear T Hand Launch 6.23Milo UAS Conventional Front Electric Standard Rear Inverse T Catapult 10.92Agri Owl 200 Conventional Mid Electric Dihedral Rear Inverse T Hand Launch 6.59Skyrobot FX-20 Flying Wing Rear Electric Standard N/A Pneumatic catapult 10.37ID Aerospace Solaris Conventional 1 Front, 2 under wing Electric Polyhedral Rear Inverse T Hand Launch 19.68ZALA 421-165 HD Flying Wing Rear Electric Standard N/A Pneumatic catapult 17.39Falk UAS Conventional Rear Piston Dihedral Rear Inverse U Catapult 10.5H24 Cruzer Conventional Mid Piston Standard Rear H Take off run 9.84OGASSA OGS42 Conventional Mid Piston Standard Rear Inverse V Runway (150m) 13.78Penguin C Conventional Mid Piston Standard Rear Inverse V Catapult 10.8AR-3000 Conventional Front Piston Standard Rear Inverse T Catapult 9.84ID Aerospace Explorer Conventional Mid Piston Standard Rear V Take off run 14.5Tekever AR3 Conventional Rear Piston Standard Rear U Catapult 11.48
Avg. Wingspan (ft) 10.39416667
Table 83: A Market Analysis of design factors on a variety of fixed-wing small UAVs.
Figures 19,20, and 21 below were created to provide insight into the current weight and endurancemetrics featured in the high endurance UAV market today. Figure 19 highlights the distinction betweenconventional fixed wing aircraft and flying wings and the impact motor or engine choice has on MTOW.Figure 20 and Figure 21 contrast endurance vs. payload weight and payload weight as a percentage ofMTOW, respectively. As indicated by Figure 19, MTOW ranges between 15 and 35lbs depending on powersource. Figure 20 displays the impact of power source on aircraft endurance. Gasoline powered conventional
68

fixed wing aircraft produce similar results to flying wing aircraft with combustion power plants, however,electric power sources tend to promote significantly higher endurance in a flying wing platform. Expectedendurance time for the desired application by the customer will range between 2 to 6 hours on average.Figure 21 analyzes payload as a percentage of MTOW to provide insight into the carrying capabilities ofUAVs in the current market.
Figure 19: Comparisons of MTOW and Wingspan between conventional and flying wing UAVs
Figure 20: Comparisons of Endurance and Payload Weight between conventional and flying wing UAVs
69
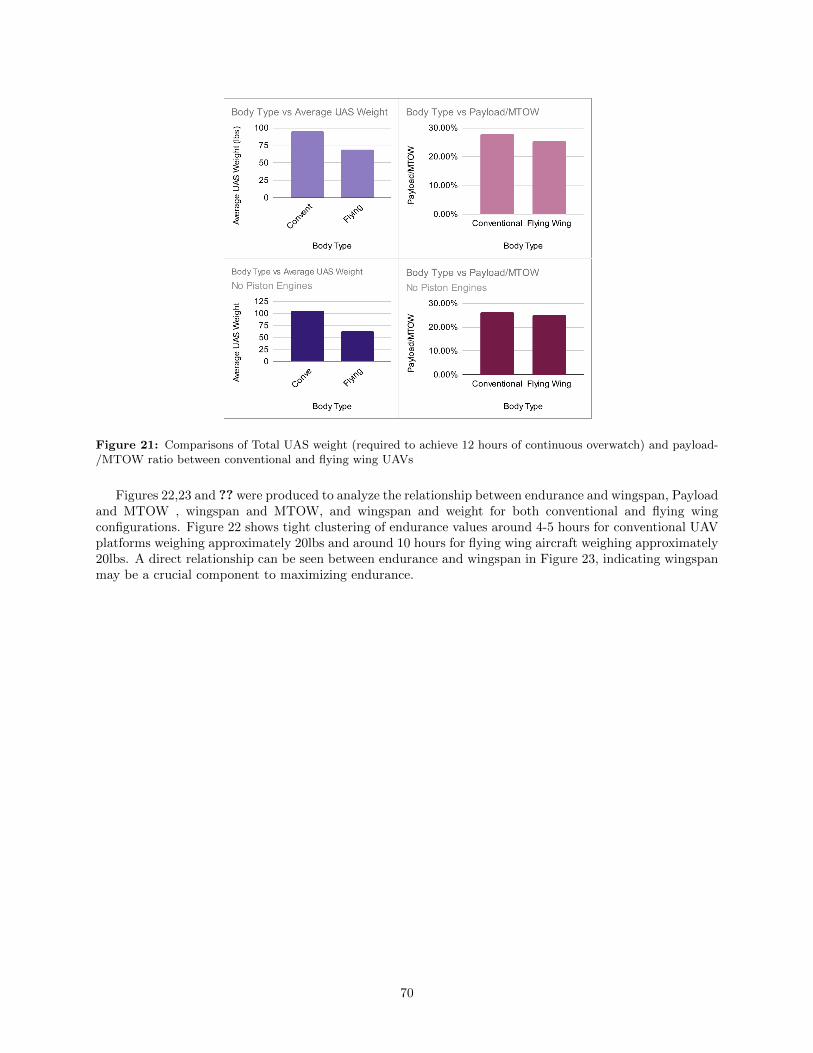
Figure 21: Comparisons of Total UAS weight (required to achieve 12 hours of continuous overwatch) and payload-/MTOW ratio between conventional and flying wing UAVs
Figures 22,23 and ?? were produced to analyze the relationship between endurance and wingspan, Payloadand MTOW , wingspan and MTOW, and wingspan and weight for both conventional and flying wingconfigurations. Figure 22 shows tight clustering of endurance values around 4-5 hours for conventional UAVplatforms weighing approximately 20lbs and around 10 hours for flying wing aircraft weighing approximately20lbs. A direct relationship can be seen between endurance and wingspan in Figure 23, indicating wingspanmay be a crucial component to maximizing endurance.
70

Figure 22: Comparison of Endurance and Wingspan trends across the market
Figure 23: Comparison of Wingspan and MTOW trends across the market
Other factors assumed to be contributing to aircraft endurance other than aircraft type were also analyzed.Figure 24 below shows the average UAV endurance broken out by propulsion system and launch mode. Thehighest endurance UAV’s in the market today feature gas propulsion systems and are typically launched bycatapult system due to their increased weight.
71

Figure 24: Comparison of Endurance based on engine type and launch system
The ability to carry sufficient payload is a critical component to the UAV’s operational success and willneed to be considered in Level 1 trade studies. Figure 25 is a current market analysis of high endurance fixedwing aircraft available to consumers today. As indicated from Figure 25, payload carrying capability variessignificantly between UAVs, primarily from differences in the aircraft’s propulsion sources. High enduranceUAVs tend to carry payloads between 15% and 40% of MTOW with some outliers.
Figure 25: Visualization of MTOW by vehicle weight vs payload weight
Lastly, a summarized performance value index was created. The color coding goes from red to green forpoor to good performance within each metric. An algorithm was developed to weigh wingspan, MTOW,and endurance to show which vehicle best fit our mission constraints. Said algorithm is detailed in the tablebelow.
72

Figure 26: Market Performance Values
73
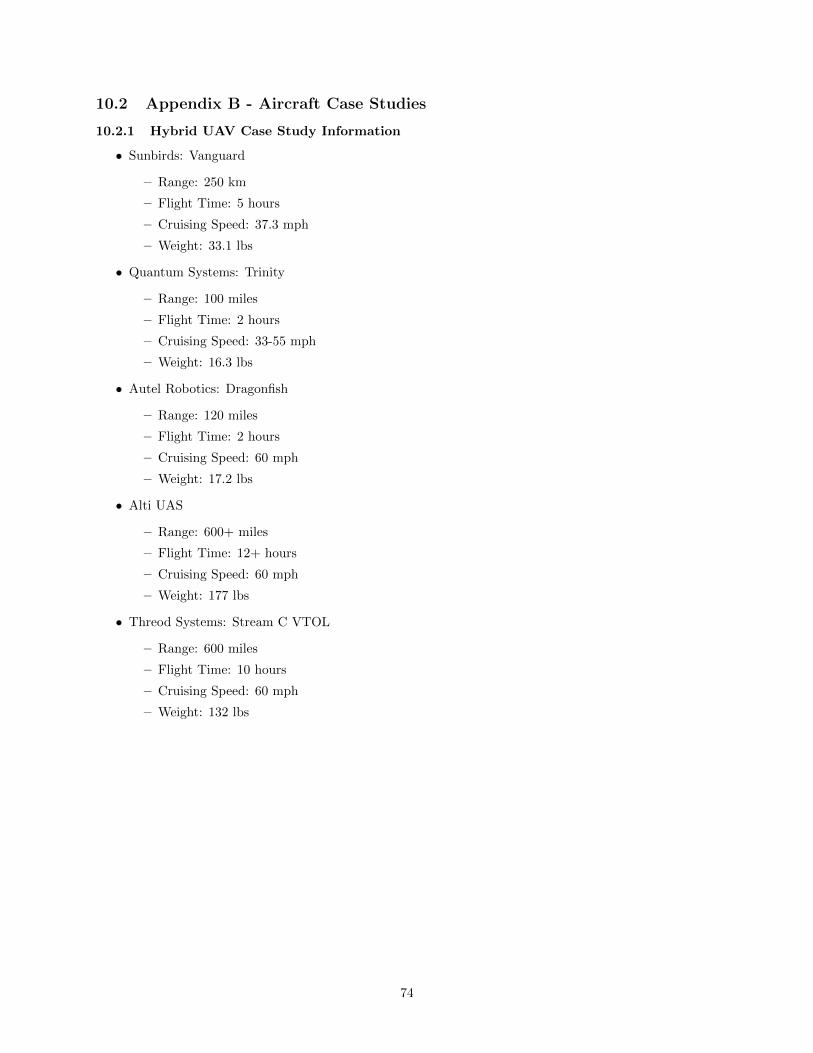
10.2 Appendix B - Aircraft Case Studies
10.2.1 Hybrid UAV Case Study Information
• Sunbirds: Vanguard
– Range: 250 km
– Flight Time: 5 hours
– Cruising Speed: 37.3 mph
– Weight: 33.1 lbs
• Quantum Systems: Trinity
– Range: 100 miles
– Flight Time: 2 hours
– Cruising Speed: 33-55 mph
– Weight: 16.3 lbs
• Autel Robotics: Dragonfish
– Range: 120 miles
– Flight Time: 2 hours
– Cruising Speed: 60 mph
– Weight: 17.2 lbs
• Alti UAS
– Range: 600+ miles
– Flight Time: 12+ hours
– Cruising Speed: 60 mph
– Weight: 177 lbs
• Threod Systems: Stream C VTOL
– Range: 600 miles
– Flight Time: 10 hours
– Cruising Speed: 60 mph
– Weight: 132 lbs
74
Copyright © 2022 FDOKUMEN