Flower and Fruit Availability along a Forest Restoration Gradient

Biogeochemical patterns in a river networkalong a land use gradient
Norbert Kamjunke & Olaf Büttner & Christoph G. Jäger & Hanna Marcus &
Wolf von Tümpling & Susanne Halbedel & Helge Norf & Mario Brauns &
Martina Baborowski & Romy Wild & Dietrich Borchardt & Markus Weitere
Received: 1 August 2012 /Accepted: 10 May 2013 /Published online: 19 June 2013# Springer Science+Business Media Dordrecht 2013
Abstract The Bode catchment (Germany) showsstrong land use gradients from forested parts of theNational Park (23 % of total land cover) to agricultural(70 %) and urbanised areas (7 %). It is part of theTerrestrial Environmental Observatories of the GermanHelmholtz association. We performed a biogeochemicalanalysis of the entire river network. Surface water wassampled at 21 headwaters and at ten downstream sites,before (in early spring) and during the growing season(in late summer). Many parameters showed lower con-centrations in headwaters than in downstream reaches,among them nutrients (ammonium, nitrate and phospho-rus), dissolved copper and seston dry mass. Nitrate and
phosphorus concentrations were positively related to theproportion of agricultural area within the catchment.Punctual anthropogenic loads affected some parameterssuch as chloride and arsenic. Chlorophyll a concentra-tion and total phosphorus in surface waters were posi-tively related. The concentration of dissolved organiccarbon (DOC) was higher in summer than in spring,whereas the molecular size of DOC was lower in sum-mer. The specific UV absorption at 254 nm, indicatingthe content of humic substances, was higher in headwa-ters than in downstream reaches and was positivelyrelated to the proportion of forest within the catchment.CO2 oversaturation of the water was higher downstreamcompared with headwaters and was higher in summerthan in spring. It was correlated negatively with oxygensaturation and positively with DOC concentration butnegatively with DOC quality (molecular size and humiccontent). A principle component analysis clearly sepa-rated the effects of site (44 %) and season (15 %),demonstrating the strong effect of land use on biogeo-chemical parameters.
Keywords TERENO . Land use . Nutrients . Heavymetals . DOC . Bode
Introduction
Streams and rivers represent a link between terrestrialenvironments and the oceans. The degree and type of
Environ Monit Assess (2013) 185:9221–9236DOI 10.1007/s10661-013-3247-7
Electronic supplementary material The online version of thisarticle (doi:10.1007/s10661-013-3247-7) contains supplementarymaterial, which is available to authorized users.
N. Kamjunke (*) :H. Marcus :W. von Tümpling :H. Norf :M. Brauns :M. Baborowski :R. Wild :M. WeitereDepartment of River Ecology, Helmholtz-Centre forEnvironmental Research UFZ,Brückstraße 3a, 39114 Magdeburg, Germanye-mail: [email protected]
O. Büttner : C. G. Jäger :H. Norf :D. BorchardtDepartment of Aquatic Ecosystem Analysis,Helmholtz-Centre for Environmental Research UFZ,Brückstraße 3a, 39114 Magdeburg, Germany
S. HalbedelDepartment of Lake Research, Helmholtz-Centre forEnvironmental Research UFZ,Brückstraße 3a, 39114 Magdeburg, Germany

land use within river catchments affects hydrology,biogeochemical parameters, cycling of matter, andmetabolism in these waters. Agriculture alters the loadof carbon and nutrients in such waters more than forestcatchment areas do, and urbanised areas may act assources of toxic substances such as heavy metals.Fluvial networks transport, transform, or store twobillion tons of terrestrial carbon per year (Battin et al.2008); 40 % of terrestrial carbon entering freshwatersystems is respired there and 60 % is exported to theocean (Cole et al. 2007). There are shifts in allochtho-nous input and autochthonous production in streamsalong an agricultural land-use gradient since nutrientsfrom land use promote autochthonous production(Hagen et al. 2010). Dissolved organic matter(DOM) in agricultural streams was shown to be morelabile and thus more accessible for microbes thanDOM in wetland streams which support low microbialactivity (Williams et al. 2010).
The importance of fluvial networks for matter fluxescan only be quantified by spatially extensive studies.The development of long-term observation and moni-toring systems for achieving a better understanding offreshwater systems is an important challenge for futureyears. For this reason, the German Helmholtz associa-tion established an earth observation network calledTerrestrial Environmental Observatories (TERENO;Zacharias et al. 2011). Its goal is large-scale observationof the effects of climate and land use changes on region-al hydrologic cycles. The HarzMountains with the BodeCatchment is one out of four TERENO regions inGermany.
The aim of the present study was the biogeochemicalcharacterisation of the catchment and themapping of theriver network. This facilitates the choice of suitable sitesfor long-term biological monitoring, exposition of mo-bile experimental mesocosms (Norf et al. 2011) and forfurther process studies. Effective monitoring must bebased on a detailed knowledge of the study area suchas those provided by the present work. The study isbased on the analysis of nutrients, carbon componentsand heavy metals as well as on the identification ofanthropogenic sources. The first goal was to analyselongitudinal biogeochemical gradients from headwatersto the downstream sites along the gradient of land use.The second goal was to detect the effect of biologicalactivity on the measured parameters and whether or notthere are seasonal differences. For these purposes, weinvestigated several parameters in surface waters and
sediments before and during the growing season in earlyspring and late summer, respectively, with the intent ofgaining a better understanding of the hierarchy of driv-ing factors.
Materials and methods
Study site, hydrological and weather conditions
The Harz Mountains in Germany (maximum altitude1,142 m and total area, 2,000 km2) is a region of formerore mining, with soils of enriched metal content (e.g.arsenic, lead, cadmium, copper and zinc) which may betransported into the rivers during flood events (Ernst etal. 2009). The land use in the Bode catchment shows aclear gradient with different proportions of forested andsemi-natural areas (23 % of total area), agricultural areas(70 %) and urbanised areas (7%) (Fig. 1; CORINE data,EEA 2012). Sampling was performed at 31 sites withinthe Bode catchment in the Harz Mountains (Fig. 1;Table 1). Twenty-one of them were situated at altitudesof >420 m a.s.l. and were categorised as headwaterswhereas ten sites at <350 m a.s.l. were categorised asdownstream sites (see Table 1 for altitude). Land usecharacteristics of sampling sites were analysed using theprogram Arc Hydro (Maidment 2002) incorporated inArcGIS 10.0 (ESRI 2010, Environmental SystemsResearch Institute, Redlands, CA). Land use/coverof sub-catchments was calculated based on 2005colour infrared (CIR) digital aerial photograph data,which is of higher resolution than CORINE data(Nagel 2007). Land use in headwater areas wasdominated by forest and semi-natural areas, althougha high proportion of agricultural area was found insome cases (Fig. 2). In contrast, agriculture dominatedthe land use at many downstream sites. The riversHassel and Rappbode are impounded (Rappbodereservoir).
Winter sampling, i.e. before the growing season,was performed on 1st and 2nd March 2011. On these2 days, daily sunshine was 6–8 h, rain was 0 mm, andthe maximum daily temperature was 3–5 °C (weatherstation Wernigerode, WetterOnline.de 2012; see Fig 1).There had been no rainfall for 1 week before sampling,and discharge was decreasing at all sites (Fig. 3).Summer sampling, i.e. during the growing season, wasperformed on 6th and 7th September 2011, when dailysunshine was 4–7 h, daily rain was 1–5 mm, and
9222 Environ Monit Assess (2013) 185:9221–9236

maximum daily temperature was 13.5–16.5 °C (weatherstation Wernigerode). It had rained more intensively2 days before sampling, resulting in a slightly in-creased discharge (Fig. 3). Measurements were carriedout in two environmental habitats of the rivers, i.e.the surface water (focus) and sediments (see Table 2for an overview).
Field measurements and sample collection
Standard methods were applied for surface water andsediment samplings, sample preparations and analytics.Conductivity, turbidity, chlorophyll a, oxygen contentand temperature of surface waters were measured withmultiparameter probes (YSI 6600-V2; see Table 2).Surface water samples were taken with a bailedpolypropylene sampler from the running waveaccording to the DIN 38401-15 (2010). For analysesof dissolved parameters, different filtrations wereconducted following the respective norms (see be-low). All filtered and unfiltered water samples werestored in bottles and vials as described in the stan-dard EPA methods (Clescerl et al. 1995). Sedimentsfrom a ca. 1 m2 surface layer (ca. 0–0.5 cm depth)were collected with a plastic shovel as grab samplesaccording to DIN 38414-11 (1987) and stored inNALGENE plastic boxes until analysed. Restrictionsregarding representative sampling as described inTruckenbrodt and Einax (1995) were considered. Allsamples were stored in cooling boxes at ca. 8 °C imme-diately after sampling.
Water and sediment sample analysis
Sodium (Na+), potassium (K2+), calcium (Ca2+), mag-nesium (Mg2+) and chloride (Cl−) were analysed usingion chromatography as described in DIN EN ISO14911 (1999) and DIN EN ISO 10304-1 (2009).Nitrite (NO2
−), nitrate (NO3−) and silicon (Si) were
photometrically determined using the segmented flowtechnique DIN EN ISO 13395 (1996). Total (TP) andreactive phosphorous (SRP) were measured using theammonium molybdate spectrometric method (DIN ENISO 6878 2004). Inorganic, OC and total carbon con-centrations in the filtered and unfiltered original watersamples were analysed based on high-temperature ox-idation using NDIR detection (DIN EN 1484 1997).Dissolved heavy metals and arsenic were analysedafter filtration onto 0.45 μm syringe filter. The con-centration of the elements aluminium (Al), iron (Fe),manganese (Mn) and zinc (Zn) were determined usingICP-OES (DIN EN ISO 11885 2007). All other ele-ments were measured by ICP-MS (DIN EN ISO17294-2 2003). To estimate particulate dry weightand ash weight, filters were heated for 2 h at 105 °Cand 4 h at 500 °C, respectively, and weighed again.
Freeze-dried sediments were sieved in order to use thesize fraction at <63 μm for sediment analyses. Aftermicrowave-assisted digestion (DIN 38414-7 2001), theaqua regia soluble fractions of Al, Fe, Mn and Zn weredetermined using ICP-OES (DIN EN ISO 11885 2007).All other elements were measured using ICP-MS (DINEN ISO 17294-2 2003). C and N determinations were
Fig. 1 Sampling sites andland use in the Bode catch-ment. Site numbers 2, 4 and14 are not visible; they arehidden by the symbols ofnumbers 3, 5 and 15
Environ Monit Assess (2013) 185:9221–9236 9223

performed with high-temperature combustion (ElementarVario EL cube, Elementar Analysensysteme GmbH,Hanau, Germany). Phosphorous content was deter-mined following DIN 38414-12 (1986).
Extended carbon analysis
Water samples were transferred into acid-rinsed andcombusted brown glass bottles and kept cool until
further analyses. For dissolved organic carbon (DOC)analysis and the detection of the spectral absorption ofcoloured dissolved organic matter (CDOM), all watersamples were filtered through glass fibre filters(Whatman GF/F). Measurements of both parameterswere carried out within 24 h after sampling.
DOC concentrations were measured by high tem-perature combustion (DIMATOC 2000, DimatecAnalysentechnik GmbH, Essen, Germany). The
Table 1 Location and altitude of sampling sites
No. Water N E A (m) Location
1 Kalte Bode 51.77026 10.64522 643 Upstream Schierke (reference upstream STP)
2 Kalte Bode 51.74214 10.72593 480 Upstream Mandelholz reservoir (downstream STP Elend)
3 Wormke 51.74325 10.72629 462 Upstream Mandelholz reservoir (reference upstream STP)
4 Kalte Bode 51.74147 10.76645 429 Königshütte and upstream inlet Warme Bode
5 Warme Bode 51.73916 10.76656 434 Downstream Königshütte and upstream inlet Kalte Bode
6 Spielbach 51.73431 10.67596 534 Upstream road bridge L1353
7 Warme Bode 51.72219 10.76550 445 Between Gr. Allerbach and Spielbach (fish ponds)
8 Gr. Allerbach 51.71464 10.73590 476 Forest between Tanne and Königshütte
9 Warme Bode 51.69650 10.69231 491 Upstream Sorge
10 Warme Bode 51.69956 10.67175 489 Downstream inlet Brunnebach
11 Brunnebach 51.70089 10.61671 554 Downstream Braunlage
12 Warme Bode 51.73853 10.61169 595 Upstream Braunlage (reference upstream STP)
13 Rappbode 51.66534 10.71065 530 Upstream Benekenstein
14 Rappbode 51.68143 10.77916 469 Upstream Trautenstein
15 Dammbach 51.68103 10.77997 466 Upstream inlet Warme Bode
16 Rappbode 51.69296 10.79079 448 Upstream inlet reservoir
17 Hassel 51.63923 10.88493 521 Downstream spring and railway station Birkenmoor
18 Hassel 51.68110 10.87545 461 Upstream Hasselfelde
19 Bremke 51.73490 10.63642 563 Near Braunlage and upstream inlet Warme Bode
20 Hassel 51.69761 10.84275 448 Upstream inlet reservoir
31 Zillierbach 51.77855 10.74101 504 Northeastern Drei-Annen
21 Bode 51.73640 10.91753 320 Wendefurth
22 Bode 51.85928 11.23334 115 Upstream inlet Selke
23 Selke 51.63035 11.09648 348 Silberhütte (monitoring station)
24 Selke 51.69128 11.28391 213 Meisdorf (monitoring station)
25 Selke 51.83896 11.27007 108 Hausneindorf (monitoring station)
26 Bode 51.93181 11.20196 89 Upstream Gröningen
27 Bode 51.89553 11.52833 66 Athensleben (monitoring station)
28 Bode 51.86027 11.63260 67 Staßfurt STP
29 Bode 51.83190 11.76619 57 Nienburg
30 Bode 52.00542 11.31930 76 Hadmersleben (monitoring station)
Site numbers 1–20 and 31 are classified as headwaters (altitudes, >420 m a.s.l.), site numbers 21–30 are classified as downstream sites(altitudes, <350 m a.s.l.)
A altitude, STP sewage treatment plant
9224 Environ Monit Assess (2013) 185:9221–9236

absorption by CDOM was measured from 200 to700 nm using a Hach Lange DR 5000 spectrophoto-meter and a 1-cm quartz cuvette. Deionised water wasused as a blank for all samples. The absorption co-efficients were calculated by multiplying the opticaldensity by 2.303/cuvette path length. Following
parameters describing CDOM were computed fromthese data: (1) The absorption at 375 nm (A375),which is an indicator of CDOM concentration(Stedmon et al. 2006); (2) the SUVA254, which cor-relates with per cent CDOM aromaticity. This param-eter was calculated from the specific UVabsorbance at
Fig. 2 Proportion of different land uses at headwater and downstream sampling sites based on the relevant sub-catchments. The areasof subcatchments are given in Table S1 in the ESM
Fig. 3 Dynamics of discharge at selected sampling points. Dotted lines indicate the two samplings on 1st and 2nd March and on 6thand 7th September 2011
Environ Monit Assess (2013) 185:9221–9236 9225

254 nm divided by DOC concentrations (Weishaar etal. 2003); and (3) the ratio of spectral slopes (SR) fromthe natural log of absorption data from two differentwavelength spectra (275–295 nm/350–400 nm). SR isnegatively correlated to molecular weight and is thusan indicator for microbial DOC availability since bac-terial growth is higher on small substrates (Wetzel etal. 1995, Kamjunke et al. 2005).
Concentrations of dissolved CO2 were measuredwith the headspace equilibrium technique (Kling et al.1991, Hope et al. 2004): surface water was collectedwith a 60 ml plastic syringe from approximately 10 cmbelow the stream water surface and equilibrated withheadspace of ambient air by shaking vigorously for1 min beneath the water surface. Samples of the ambientair, (which were used for equilibration) and equilibratedheadspace gases were collected in 12 ml vacuumedcrimp vials and refrigerated until analysis. Samples werecollected and analysed in triplicate. Since the solubilityof CO2 is highly temperature und partial-pressure de-pendent, the local atmospheric pressure and temperaturein both the streams and the air nearby were measured inthe field. Analyses of CO2 were carried out within oneor two days after sample collection in the laboratory byflame ionisation gas chromatography (SRI 8610C; SRIInstruments, Torrance, CA). For background correctionof the vacuumed vials, nitrogen was injected intosample-free, vacuumed crimp vials, which were thenstored and analysed together with the samples. Henry’sLaw and stream water temperatures were used to calcu-late the Henry’s law constant (Kh), which was then usedwith the gas concentration in the equilibrated headspacesamples, as well as the gas and water volumes equili-brated to determine ambient partial pressures (pCO2)and concentrations of CO2 in the water (Hope et al.2001). Excess partial pressure of CO2 (EqCO2) was
calculated by dividing the pCO2 determined for waterby pCO2 of the ambient air (Dyson et al. 2011).
Data analysis
All data were separated in four groups: (1) Marchheadwater, (2) March downstream, (3) Septemberheadwater and (4) September downstream. For allparameters (Table 2), basic statistics and simple statis-tical tests (Mann–Whitney U test) were performed todescribe the range and the distribution and to detectsignificant differences between the four groups. Allcomparisons were made between seasonal groups andbetween spatial groups of sample sites. The p values inthe figures are considered statistically significant at p<0.025 since two tests were applied for each data set(Bonferroni correction for multiple testing). Verticalbars between boxplots (Figs. 4 and 7) indicate whichgroups were compared statistically. The spatial distri-bution of the measured concentration is presented forselected parameters (the complete overview is given inthe Electronic Supporting Material (ESM)). For thispurpose, the concentration of a parameter wasnormalised by the maximum concentration so thatthe concentrations in the plot are proportional in sizeregarding this parameter.
A principal component analysis (PCA) was used toextract the major components and their associated envi-ronmental variables which are responsible for the dif-ferences between headwater and downstream sites. PCAis a multivariate statistical technique that reduces thenumber of variables by finding new components thatare linear combinations of the initial variables (Legendreand Legendre 1998). The resulting so-called principalcomponents have to account for as much of the varianceof the original data as possible. Prior to analysis, we first
Table 2 Survey of sampledparameters
Surface water was sampled inMarch and September; sedi-ments (last line) were sampled inMarch
Parameter group Parameters
Basic parameters pH, alkalinity, KB8.2
YSI probe Conductivity, turbidity, chlorophyll a, oxygen and temperature
Ions Ca2+, K+, Mg2+, Na+, Cl− and SO42−
Nutrients NH4+, NO2
−, NO3−, SRP, TP and dissolved Si
Carbon TIC, pCO2, EqCO2, DOC, A375, SUVA254, slope ratio and POC
Dissolved metals Al, As, Cd, Co, Cr, Cu, Fe, Mn, Ni, Pb and Zn
Suspended solids Dry weight and ash-free dry weight
Sediments TP, PN, POC; Al, As, Cu, Fe, Mn and Pb
9226 Environ Monit Assess (2013) 185:9221–9236

conducted a Pearson correlation analysis to identifyenvironmental variables which were highly correlated
with each other (r>0.9). This was done to avoid multi-collinearity which is known to affect the outcome and
Fig. 4 Concentrations of dissolved nutrients in the surfacewater: a ammonium, b nitrate, and c soluble reactive phospho-rus (SRP); of dissolved metals in the surface water: e copper andf iron; and of suspended matter in the surface water: g dry massand h chlorophyll a in March and September 2011 at headwaters
and downstream sites. Boxplot displays median, quartiles, andoutliers. Grey horizontal bars with p values represent the com-parison of the respective medians. Significant differences be-tween groups (Mann–Whitney U test) are drawn in bold and areindicated by an asterisk
Environ Monit Assess (2013) 185:9221–9236 9227
interpretation of a PCA (Jolliffe 2002). Three out of 41parameters listed in Table 2 could be excluded due toautocorrelation: A375 (correlated with DOC), POC andash-free dry weight of the seston (correlated with sestondry weight). Furthermore, we applied z-standardisationto the variables to account for differences in units. AVarimax rotation of the extracted factors was performed,minimising the number of variables that have high load-ings on each factor to simplify the interpretation of theindividual factors. The loadings are the values describ-ing the strength of correlation between a variable and afactor. For the sake of clarity, variables having an abso-lute load of greater than 0.65 were considered for furtherevaluation. PCA analysis was conducted using Statisticasoftware (Version 10, Stat Soft Inc., Tulsa, OK).
Results
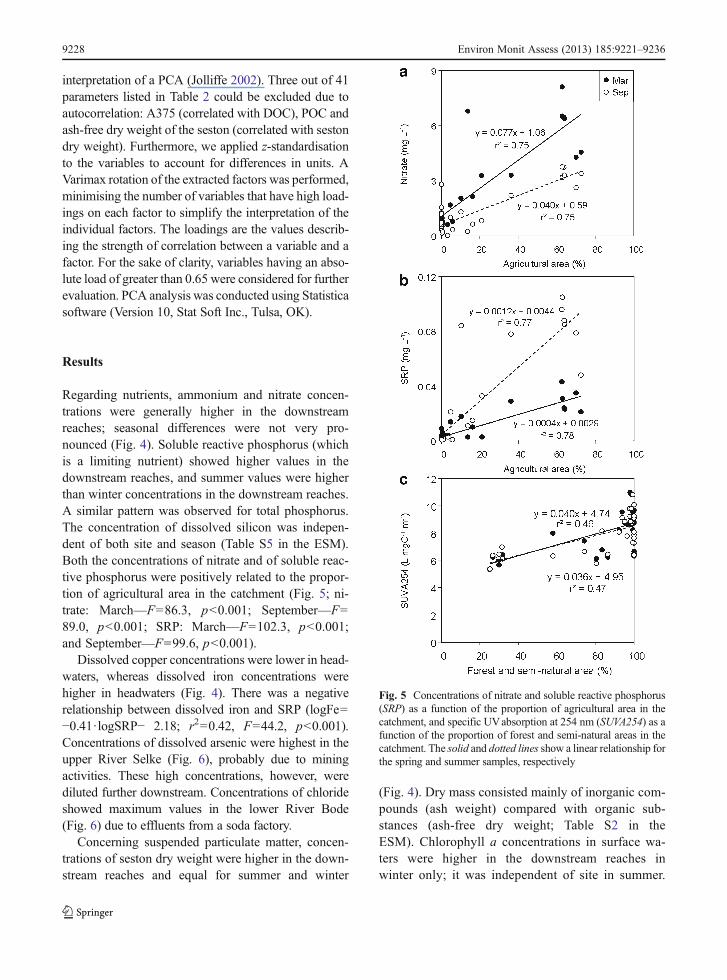
Regarding nutrients, ammonium and nitrate concen-trations were generally higher in the downstreamreaches; seasonal differences were not very pro-nounced (Fig. 4). Soluble reactive phosphorus (whichis a limiting nutrient) showed higher values in thedownstream reaches, and summer values were higherthan winter concentrations in the downstream reaches.A similar pattern was observed for total phosphorus.The concentration of dissolved silicon was indepen-dent of both site and season (Table S5 in the ESM).Both the concentrations of nitrate and of soluble reac-tive phosphorus were positively related to the propor-tion of agricultural area in the catchment (Fig. 5; ni-trate: March—F=86.3, p<0.001; September—F=89.0, p<0.001; SRP: March—F=102.3, p<0.001;and September—F=99.6, p<0.001).
Dissolved copper concentrations were lower in head-waters, whereas dissolved iron concentrations werehigher in headwaters (Fig. 4). There was a negativerelationship between dissolved iron and SRP (logFe=−0.41·logSRP− 2.18; r2=0.42, F=44.2, p<0.001).Concentrations of dissolved arsenic were highest in theupper River Selke (Fig. 6), probably due to miningactivities. These high concentrations, however, werediluted further downstream. Concentrations of chlorideshowed maximum values in the lower River Bode(Fig. 6) due to effluents from a soda factory.
Concerning suspended particulate matter, concen-trations of seston dry weight were higher in the down-stream reaches and equal for summer and winter
(Fig. 4). Dry mass consisted mainly of inorganic com-pounds (ash weight) compared with organic sub-stances (ash-free dry weight; Table S2 in theESM). Chlorophyll a concentrations in surface wa-ters were higher in the downstream reaches inwinter only; it was independent of site in summer.
Fig. 5 Concentrations of nitrate and soluble reactive phosphorus(SRP) as a function of the proportion of agricultural area in thecatchment, and specific UVabsorption at 254 nm (SUVA254) as afunction of the proportion of forest and semi-natural areas in thecatchment. The solid and dotted lines show a linear relationship forthe spring and summer samples, respectively
9228 Environ Monit Assess (2013) 185:9221–9236

Chlorophyll a concentration and TP were positive-ly correlated (logChl=0.43· logTP+1.21; r2=0.45,F=49.1, p<0.001).
Alkalinity (Ks, 4.3) of surface water was lower inheadwaters than in downstream reaches (Fig. 7). Therewas no seasonal difference in the downstream reaches
Fig. 6 Spatial distribution of two selected elements in the surfacewater: a dissolved chloride and b dissolved arsenic in March, andof two selected elements in the sediments: c aluminium and d
arsenic in March. The concentrations are plotted with dots; theirsizes are proportional to the concentrations
Environ Monit Assess (2013) 185:9221–9236 9229

but an increase from March to September in the head-water. Similar patterns were found for TIC. The
concentration of CO2 was also higher in the downstreamreaches. Consequently, the exchange coefficient between
Fig. 7 Boxplots of various parameters of inorganic carbon inthe surface water: a alkalinity, b total inorganic carbon (TIC), cpCO2, and d exchange coefficient of CO2 (EqCO2), and oforganic carbon in the surface water: e dissolved organic carbon(DOC), f specific UV absorption at 254 nm (SUVA254), g sloperatio of absorption spectra, and h absorption at 375 nm (A375)
in March and September 2011 at headwaters and downstreamsites. Grey horizontal bars with p values represent the compar-ison of the respective medians. Significant differences betweengroups (Mann–Whitney U test) are drawn in bold and areindicated by an asterisk
9230 Environ Monit Assess (2013) 185:9221–9236

water and the atmosphere was higher there, too. Inaddition, the exchange coefficient was higher inSeptember than in March. Circum-neutral pH valueswere higher in the downstream reaches in winter butshowed no differences in summer (Table S2 in the ESM).
Concerning DOC, the absorption at 375 nm as ameasure for DOM was not different between sitesin March but higher in the headwaters inSeptember (Fig. 7) and generally higher in summerthan in winter. In accordance, a similar pattern wasfound for DOC concentrations. Specific UV ab-sorption was higher in headwaters than in down-stream reaches indicating a higher aromatic contentbut did not differ between the seasons. SUVA254was positively related to the proportion of forest inthe catchment in March (F=25.1, p<0.001) andSeptember (F=25.8, p<0.001; Fig. 5c). Values ofslope ratio did not differ between sites and werehigher in summer (few compounds, lower molecu-lar weight). EqCO2 was positively related to DOCconcentration (F=29.4, p<0.001) and slope ratio(F=16.6, p<0.001) but negatively to SUVA254(F=27.2, p<0.001; Fig. 8).
The content of POC in headwater sedimentswas higher than in downstream sediments, whereasthe content of total phosphorus and particulatenitrogen did not differ between sites (Table S8 inthe ESM). Concentrations of heavy metals typical-ly found in soils, e.g. aluminium (Al; Fig. 6c) iron(Fe), and Mn were nearly equal across the sam-pling sites (Table S8 in the ESM). In contrast,hotspots of pollution were found for anthropogen-ically derived trace metals such as As (Fig. 6d),Cu and Pb. Maximum values were detected at thesampling site Silberhütte in the upper River Selke,a center of former mining.
The PCA of surface water data revealed that thefirst two factors explain 59 % of the variance of thedata set (Fig. 9). Data of different sites and seasonswere clearly separated; the one data point of down-stream sites situated close to the headwater data pointsbelonged to site ID 21 downstream of the reservoiroutlet. The first factor reflected the classification ofsites, whereas the second factor was related to season-ality. Parameters correlated with factor 1 (r>0.65)were ions (K+, Ca2+, Mg2+, Na+, Cl− and SO4
2−) andconductivity, inorganic carbon (TIC and pCO2) andbuffer capacity (alkalinity, KB8.2), nutrients (NH4
−,NO3
−, NO2−, TP and SRP) and suspended matter
(dry weight and turbidity; Table 3). Furthermore,EqCO2 was positively correlated whereas SUVA254was negatively correlated with factor 1. Factor 2 wasdominated by the positive correlation of organic car-bon (DOC, slope ratio) and EqCO2 whereas pH andoxygen concentration showed a negative correlation.Mn was the only relevant parameter of factor 3 (notshown, r=0.69) and As of factor 5 (r=0.67); tenparameters did not show values of r at >0.65.
Fig. 8 Logarithm of the exchange coefficient of CO2 as afunction of the logarithm of DOC concentration, the logarithmof slope ratio SR (measure for reciprocal of molecular size ofDOC), and the specific UV absorption SUVA254 (measure forhumic content) in March and September 2011 at headwaters anddownstream sites
Environ Monit Assess (2013) 185:9221–9236 9231

Discussion
The principal component analysis clearly separatedthe data regarding sites and seasons. Since factor 1explained 44 % of the total variance and factor 2 only15 %, the spatial effect seemed to be more importantthan the temporal one. Factor 1 mainly correlated withthe land use gradient, with parameter values (exceptSUVA254) usually increasing along the longitudinalgradient from the unimpaired headwaters located inthe Harz National Park to downstream reaches affect-ed mostly by agriculture (cf. Fig. 1). Similar indicatorsof land use have been reported for shallow streamssampled in the mid-Atlantic region of the USA(Herlihy et al. 1998). In their study chloride, majorcations (Ca2+, Mg2+, Na+ and K+), alkalinity and nu-trients (both N and P) correlated best with land use inthe watershed. However, our analyses also revealedadditional factors that were influenced by anthropo-genic impact but were more related to point sources(Fig. 6). Compounds like copper were probably re-leased from water pipes in buildings and rooftops fromurbanised areas. The source of arsenic is likely to berelated to former mining activity in the catchment areaof the River Selke, and a large proportion of thechloride from a soda factory in the city of Staßfurt.
The maximum concentrations of dissolved heavymetals in the Bode catchment were higher than intributaries of River Gironde (Masson et al. 2006) andsimilar or higher than in River Saale downstreamRiver Bode (Baborowski and Bozau 2006; Table 4).
Values of dissolved arsenic were higher in the Bodethan in River Saale. The maximum concentrations ofheavy metals in sediments were above the regionalgeogenic background values of the River Saale(Zerling et al. 2003) and higher than in tributaries ofRiver Gironde (Masson et al. 2006) but lower than inthe mining-affected River Mulde after a severe floodin 2002 (Klemm et al. 2005). The concentrations ofarsenic were also lower in the Bode catchment than inRiver Mulde. Overall, the concentrations of heavymetals and arsenic in surface waters and sedimentsrepresent a suitable indicator for historical land usewith respect to previous ore mining.
Table 3 Factor loadings of environmental variables of theprincipal component analysis
Factor 1 Factor 2
K+ 0.97 −0.14Ca2+ 0.92 −0.08Conductivity 0.91 −0.06Alkalinity 0.90 −0.28TIC 0.90 −0.29Mg2+ 0.90 −0.34Na+ 0.89 −0.04Suspended matter (dry weight) 0.85 −0.10Cl- 0.84 0.01
SO42- 0.82 −0.38
KB8.2 0.82 0.28
Total phosphorus 0.82 0.00
Ni 0.81 0.15
NH4+ 0.80 −0.16
NO2− 0.78 0.13
Turbidity 0.78 0.07
pCO2 0.74 0.33
SRP 0.72 −0.03NO3
− 0.66 −0.46EqCO2 0.66 0.65
SUVA254 −0.65 0.21
Slope ratio 0.16 0.82
DOC 0.26 0.79
Fe −0.25 0.76
DO concentration −0.41 −0.68pH 0.15 −0.72Cumulative explained variance (%) 44.2 59.4
Variables are displayed if their absolute value of loading is>0.65
Fig. 9 Ordination plot of the principal component analysis.Environmental variables have been excluded for simplicity(see Table 3). Factor 1 represents the spatial influence and factor2 can be interpreted as seasonal factor
9232 Environ Monit Assess (2013) 185:9221–9236

The River Bode catchment showed a significantincrease of most nutrients along the longitudinal gra-dient. Agriculture was a particularly important nutrientsource (Fig. 5), as it is the predominating form of landuse in this catchment. In 12 out of 16 European catch-ments, agriculture has been reported to be the domi-nating P source, with point sources dominating the Psupply in the other four catchments (Kronvang et al.2007). But this is also true on a more local scale: theanalyses of 177 sites in Ontario showed a positivecorrelation between the amount of cropland in thewatershed and mean annual TP and TN concentrations(Chambers et al. 2008). Such site-specific impact fromagriculture can also be seen in our data: in contrast tothe usual form of land use in the headwater areas(forests and semi-natural areas), the River Hassel ishighly influenced by agriculture (sites 17, 18 and 20;Fig. 1). Consequently, the nutrient concentration wasconsiderably higher at these sites than at most otherupstream sites.
Human activity not only alters the supply of nutrientsbut also the relative ratio of nutrients within systems,and as a consequence, the limiting factor of ecosystems(Elser et al. 2009). Recently, three different methods forestimating whether or not aquatic ecosystems are mainlylimited by phosphorus or nitrogen have been published(Bergström 2010; Keck and Lepori 2012). Using thesethree methods to analyse our data shows that all siteswere clearly limited by phosphorus in winter; the patternwas less clear in summer. The measurement which moststrongly indicated that phosphorus is the limiting factor(mass ratio of dissolved inorganic nitrogen to totalphosphorus, cf. Bergström 2010) predicted a limitationof phosphorus (ratio, <3.4) at all sites except one (site14) for which a co-limitation (ratio, 1.5–3.4) was
predicted. The intermediate measurement (molar ratioof dissolved inorganic nitrogen to soluble reactive phos-phorus, cf. Keck and Lepori 2012) predicted a limitationby phosphorus (ratio, >100) at 22 sites and co-limitation(ratio, 1–100) at nine sites. The measurement whichmost strongly pointed at nitrogen as the limiting factor(mass ratio of total nitrogen to total phosphorus, cf.Bergström 2010) predicted nitrogen limitation (ratio,<19) at three sites (sites 14, 24 and 26), co-limitation(ratio, 19–41) at 13 sites and phosphorus limitation(ratio, >41) at 15 mainly unimpaired sites.
The possible predominating limitation by phospho-rus in the River Bode catchment is also shown in thestrong correlation between TP and chlorophyll a. Inour study, we saw an increase of logChl with logTPwith a slope of 0.43. Correlations between chlorophylla and TP have also been reported from other datasetsin running waters. Chambers et al. (2008) observed apositive correlation between logChl and logTP with aslope of 0.325; Van Nieuwenhuyse and Jones (1996)observed a positive, saturating correlation with thehighest slope of 0.22 at TP=50 μg P l−1 and a mini-mum slope of 0.08 at TP=1,030 μg P l−1. The highslope in the present study supports the estimationsregarding nutrient ratios and emphasises the impor-tance of phosphorus as the limiting nutrient in theBode catchment.
Chlorophyll a concentrations recorded during ourstudy were generally below the values required for agood ecological status of running surface waters(Mischke et al. 2011). Lowest chlorophyll a concen-trations were recorded in headwaters in March 2011,indicating a generally low importance of suspendedalgae in headwater streams during spring. In contrast,chlorophyll a was significantly higher in downstream
Table 4 Comparison of selected metal concentrations in surface water (in microgrammes per litre) and sediments (in milligrammes perkilogramme) measured in the present study and in other catchments
Water As Cu Mn Pb Reference
River Bode (DE) 0.3–20.7 0.3–3.4 7–341 0.5–2.7 Present study
River Saale (DE) <0.5–1.7 2.8–4.0 10–80 <0.5–1.4 Baborowski and Bozau (2006)
Gironde tributaries (FR) – 0.4–1.8 – 0.04–1.9 Masson et al. (2006)
Sediment
River Bode (DE) 4–259 8–222 516–2,770 41–3,120 Present study
River Saale (DE) (geogenic background) – 40 581 20 Zerling et al. (2003)
Gironde tributaries (FR) – 15–88 – 21–270 Masson et al. (2006)
River Mulde (DE) 146–8,360 78–963 – 129–14,440 Klemm et al. (2005)
Environ Monit Assess (2013) 185:9221–9236 9233

reaches, probably not only because of increasing nu-trient concentrations but also due to the discharge oflake water from the Rappbode Reservoir to down-stream reaches of the River Bode. This fact supportsprevious reports that lakes or reservoirs can contributeto the development of phytoplankton in small lowlandrivers (Yang et al. 1997).
The exchange coefficient of CO2 between water andair is a measure of oversaturation. EqCO2 was lower inthe headwaters than in the downstream reaches and waslower in March than in September at the same sites, i.e.we observed increasing values with increasing temper-ature and the further the water progressed downstream.The typical CO2 supersaturation in streams may becaused either by inflow of supersaturated groundwateror by decomposing organic matter (Jones et al. 2003). Inthe Bode catchment, however, the average pCO2 inheadwaters was lower than at downstream sites(Fig. 7) with one exception (River Hassel, Table S6 inthe ESM). Furthermore, pCO2 was not affected by pHwhich was circum neutral (overall range, 6.6–8.1), andconsequently, there was no correlation between EqCO2
and pH (r2=0.01, F=0.8, p=0.38). Instead, pCO2 wassimilar in September and March at the same sites, al-though gas solubility decreased at higher temperatures,resulting in increasing EqCO2. Thus, decomposition oforganic matter by microbial respiration may be oneexplanation for the higher EqCO2. Although we didnot determine real metabolic rates, EqCO2 may thus beregarded as an indicator for microbial respiration in therivers. This is supported by a strong negative correlationbetween oxygen saturation and EqCO2 (EqCO2=-0.26·O2+27.7; r2=0.60, F=91.2, p<0.001). Respirationrates were reported to be positively related to tempera-ture (Hunt et al. 2012), which might explain higheroversaturation in late summer. EqCO2 correlated posi-tively with the quantity of substrate (DOC concentra-tion) but negatively with DOC quality (molecular sizeand humic content). This is in contrast to results of Elliset al. (2012), who found no correlation between whole-column respiration and neither DOC concentration norany size fraction of DOC in Amazon rivers. However,other researches have detected a negative correlationbetween bacterial metabolism and SUVA (humic sub-stance content) and a positive correlation between suchmetabolism and the reciprocal of molecule size of DOCin lake sediments (Gudasz et al. 2012). This is in agree-ment with our findings regarding EqCO2 (as a likelymeasure for metabolism).
Summarising the specific results for the Bodecatchment, we observed some indicator parameterscharacterising different land use: dissolved copperfor urbanised areas, aluminium in the sediments forsoil erosion, carbon parameters for biological metab-olism, and dissolved arsenic for point sources of pre-vious mining activities. Only the consideration of allparameters enables a comprehensive assessment of thecatchment. We now have a basis for the optimisationof monitoring strategies and are able to reduce thenumber of parameters in future studies. Overall, ourstudy considered a large range of biogeochemical pa-rameters over a total stream network in the Bodecatchment at times of both low (March) and highbiological activity (September). Such a comprehensivedata set makes it possible to trace relevant sources ofchemicals as well as relevant biological processesalong the river network. The results demonstrate theeffect of both recent and historical land use on bio-chemical parameters and enable us to choose suitablesampling sites for future process studies within theTERENO observatory.
In conclusion, we have shown clear effects ofland use on the biogeochemical properties of ariver network. We found positive relationships be-tween nutrient concentrations and the proportion ofagriculture in the catchment and between the aro-matic content of DOC and the proportion of forest.Furthermore, CO2 oversaturation of the water asan indicator of microbial respiration correlatedpositively with DOC concentration but negativelywith DOC quality (molecular size and humic con-tent). Future investigations might focus on a de-tailed analysis of metabolic processes, chemicalDOC properties, and stoichiometric aspects of mi-crobial DOC utilisation.
Acknowledgements We thank many colleagues for help dur-ing field sampling: S. Bauth, M. Cebula, T. David, H. Goreczka,M. Herzog, A. Hoff, U. Kiewel, B. Kuehn, K. Lerche, M.Mages, M. Schäffer and C. Völkner. In addition, many techni-cians and students contributed to subsequent analyses in thelaboratory: H. Goreczka, A. Hoff, C. Hoffmeister, B. Keller,K. Lerche, U. Link, I. Locker, Y. Rosenlöcher, E. Ruschak,I. Siebert, K. Städtke, M. Tibke and M. Wengler. The re-search was supported by TERENO. SH and RW were finan-cially supported by the German Research Foundation (AN777/2-1 and BR 4358/1-1, respectively). Furthermore, wewould like to thank the reviewers for helpful commentsimproving the manuscript, as well as Frederic Bartlett forcorrecting the English.
9234 Environ Monit Assess (2013) 185:9221–9236

References
Baborowski, M., & Bozau, E. (2006). Impact of former miningactivities on the uranium distribution in the River Saale(Germany). Applied Geochemistry, 21, 1073–1082.
Battin, T. J., Kaplan, L. A., Findlay, S., Hopkinson, C. S., Marti, E.,Packman, A. I., et al. (2008). Biophysical controls on organiccarbon fluxes in fluvial networks. Nature Geoscience, 1, 95–100.
Bergström, A.-K. (2010). The use of TN:TP and DIN:TP ratiosas indicators for phytoplankton nutrient limitation in oligo-trophic lakes affected by N deposition. Aquatic Sciences,72, 277–281.
Chambers, P. A., Vis, C., Brua, R. B., Guy, M., Culp, J. M., &Benoy, G. A. (2008). Eutrophication of agriculturalstreams: defining nutrient concentrations to protect ecolog-ical condition. Water Science and Technology, 58, 2203.
Clescerl, L. S., Greenberg, A. E., & Eaton, A. D. (1995).Standard methods for the examination of water and waste-water (19th ed.). Washington, DC: The Library ofCongress, APHA.
Cole, J. J., Prairie, Y. T., Caraco, N. F., McDowell, W. H.,Tranvik, L., Striegl, R. G., et al. (2007). Plumbing theglobal carbon cycle: integrating inland waters into theterrestrial carbon budget. Ecosystems, 10, 171–184.
DIN EN 1484 (1997) Water analysis - Guidelines for the deter-mination of total organic carbon (TOC) and dissolvedorganic carbon (DOC); German version. Beuth, Berlin.
DIN 38401-15 (2010) German standard methods for the exam-ination of water, waste water and sludge—general infor-mation (group A)—part 15: sampling from running waters(A 15). Beuth, Berlin.
DIN 38414-11 (1987) German standard methods for the exam-ination of water, waste water and sludge; sludge and sed-iments (group S); sampling of sediments (S 11). Beuth,Berlin.
DIN 38414-12 (1986) German standard methods for the exam-ination of water, waste water and sludge; sludge and sed-iments (group S); determination of phosphorus in sludgesand sediments (S 12). Beuth, Berlin.
DIN 38414-7 (2001) German standard methods for the exami-nation of water, waste water and sludge; sludge and sedi-ments (group S); digestion using aqua regia for subsequentdetermination of the acid-soluble portion of metals (S7).Beuth, Berlin
DIN EN ISO 10304-1 (2009) Water quality—determination ofdissolved anions by liquid chromatography of ions—part1: determination of bromide, chloride, fluoride, nitrate,nitrite, phosphate and sulphate, Beuth, Berlin
DIN EN ISO 11885 (2007) Water quality—determination ofselected elements by inductively coupled plasma opticalemission spectrometry (ICP-OES). Beuth, Berlin.
DIN EN ISO 13395 (1996) Water quality—determination ofnitrite nitrogen and nitrate nitrogen and the sum of bothby flow analysis (CFA and FIA) and spectrometric detec-tion. Beuth, Berlin.
DIN EN ISO 14911 (1999) Water quality—determination ofdissolved Li+, Na+, NH4+, K+, Mn2+, Ca2+, Mg2+, Sr2+ andBa2+ using ion chromatography—method for water andwaste water. Beuth, Berlin.
DIN EN ISO 17294-2 (2003) Water quality—application ofinductively coupled plasma mass spectrometry (ICP-MS)—part 2: determination of 62 elements. Beuth, Berlin.
DIN EN ISO 6878 (2004) Water quality—determination ofphosphorus—ammonium molybdate spectrometric method.Beuth, Berlin
Dyson, K. E., Billet, M. F., Dinsmore, K. J., Harvey, F.,Thomson, A. M., Piirainen, S., et al. (2011). Release ofaquatic carbon from two peatland catchments in E. Finlandduring the spring snowmelt period. Biogeochemistry, 103,125–142.
EEA (2012) CORINE Land Cover. European Environment Agency.Available from http://www.eea.europa.eu/publications/COR0-landcover/page001.html. Accessed April 2012.
Ellis, E. E., Richey, J. E., Aufdenkampe, A. K., Krusche, A. V.,Quay, P. D., Salimon, C., et al. (2012). Factors controllingwater-column respiration in rivers of the central and south-western Amazon Basin. Limnology and Oceanography, 57,527–540.
Elser, J., Andersen, T., Baron, J., Bergström, A., Jansson, M.,Kyle, M., et al. (2009). Shifts in lake N:P stoichiometryand nutrient limitation driven by atmospheric nitrogendeposition. Science, 326, 835–837.
Ernst, W. H. O., Knolle, F., Kratz, S., & Schnug, E. (2009).Aspects of ecotoxicology of heavy metals in the Harzregion – a guided excursion (in German). Journal fürKulturpflanzen, 61, 225–246.
Gudasz, C., Bastviken, D., Premke, K., Steger, K., & Tranvik,L. J. (2012). Constrained microbial processing of alloch-thonous organic carbon in boreal lake sediments.Limnology and Oceanography, 57, 163–175.
Hagen, E. M., McTammany, M. E., Webster, J. R., & Benfield,E. F. (2010). Shifts in allochthonous input and autochtho-nous production in streams along an agricultural land-usegradient. Hydrobiologia, 655, 61–77.
Herlihy, A. T., Stoddard, J. L., & Johnson, C. B. (1998). Therelationship between stream chemistry and watershed landcover data in the mid-Atlantic region, U.S. Water, Air, andSoil Pollution, 105, 377–386.
Hope, D., Palmer, S. M., Billett, M. F., & Dawson, J. J. C.(2001). Carbon dioxide and methane evasion from a tem-perate peatland stream. Limnology and Oceanography, 46,847–857.
Hope, D., Palmer, S. M., Billett, M. F., & Dawson, J. J. C.(2004). Variations in dissolved CO2 and CH4 in a first-order stream and catchment: an investigation of soil–stream linkages. Hydrological Processes, 18, 3255–3275.
Hunt, R. J., Jardine, T. D., Hamilton, S. K., & Bunn, S. E.(2012). Temporal and spatial variation in ecosystem me-tabolism and food web carbon transfer in a wet-dry tropicalriver. Freshwater Biology, 57, 435–450.
Jolliffe, I. T. (2002). Principal component analysis (2nd ed.).New York: Springer.
Jones, J. B., Stanley, E. H., & Mulholland, P. J. (2003). Long-term decline in carbon dioxide supersaturation in riversacross the contiguous United States. GeophysicalResearch Letters, 30, 1495–1498.
Kamjunke, N., Tittel, J., Krumbeck, H., Beulker, C., &Poerschmann, J. (2005). High heterotrophic bacterial pro-duction in acidic, iron-rich mining lakes. MicrobialEcology, 49, 425–433.
Environ Monit Assess (2013) 185:9221–9236 9235

Keck, F., & Lepori, F. (2012). Can we predict nutrient limitationin streams and rivers? Freshwater Biology, 57, 1410–1421.
Klemm, W., Greif, A., Broekaert, J. A. C., Siemens, V., Junge,F. W., van der Veen, A., et al. (2005). A study on arsenicand the heavy metals in the Mulde river system. ActaHydrochimica et Hydrobiologica, 33, 475–491.
Kling, G. W., Kipphut, W., & Miller, M. C. (1991). Arctic lakesand streams as gas conduits to the atmosphere: implicationsfor Tundra carbon budgets. Science, 251, 298–301.
Kronvang, B., Vagstad, N., Behrendt, H., Bøgestrand, J., & Larsen,S. E. (2007). Phosphorus losses at the catchment scale withinEurope: an overview. Soil Use andManagement, 23, 104–116.
Legendre, P., & Legendre, L. (1998). Numerical Ecology.Elsevier, Amsterdam: Second English Edition.
Maidment, D. R. (2002). Arc Hydro: GIS for water resources.Redlands, CA: ESRI Press.
Masson, M., Blanc, G., & Schäfer, J. (2006). Geochemical signalsand source contributions to heavy metal (Cd, Zn, Pb, Cu)fluxes into the Gironde Estuary via its major tributaries.Science of the Total Environment, 370, 133–146.
Mischke, U., Venohr, M., & Behrendt, H. (2011). Using phyto-plankton to assess the trophic status of German rivers.Archiv für Hydrobiologie, 96, 578–598.
Nagel, H. (2007). Zweite landesweite Color-Infrarot-Luftbild-gestützte Biotoptypen-und Nutzungstypenkartierung imBundesland Sachsen-Anhalt. In J. Strobl, T. Blaschke, &G. Griesebner (Eds.), Angewandte Geoinformatik (pp.488–494). Heidelberg: Wichmann (in German).
Norf, H., Borchardt, D.,Weitere, M. (2011) (in press).MOBICOS:Eine modulare Laboreinheit für limnologische Experimentemit Freilandbezug. AnnualMeeting of the German Society ofLimnology, Extended Abstracts.
Stedmon, C. A., Markager, S., Sondergaard, M., Vang, T.,Laubel, A., Borch, N. H., et al. (2006). Dissolved organicmatter (DOM) export to a temperate estuary: seasonalvariations and implications of land use. Estuaries andCoasts, 29, 388–400.
Truckenbrodt, D., & Einax, J. W. (1995). Sampling representa-tivity and homogenity of river sediments. Fresenius'Journal of Analytical Chemistry, 5, 437–443.
Van Nieuwenhuyse, E. E., & Jones, J. R. (1996). Phosphoruschlorophyll relationship in temperate streams and its vari-ation with stream catchment area. Canadian Journal ofFisheries and Aquatic Sciences, 53, 99–105.
Weishaar, J. L., Aiken, G. R., Bergamaschi, B. A., Fram, M. S.,Fujii, R., & Mopper, K. (2003). Evaluation of specificultraviolet absorbance as an indicator of the chemical com-position and reactivity of dissolved organic carbon.Environmental Science and Technology, 37, 4702–4708.
WetterOnline.de (2012). Available from http://www.wetteronline.de/cgi-bin/regframe?3&PRG=klimavar&ART=MAX&CONT=dldl&WMO=10454&LANG=de&BKM=Sachsen-Anhalt/Wernigerode. Accessed February 2012
Wetzel, R. G., Hatcher, P. G., & Bianchi, T. S. (1995). Naturalphotolysis by ultraviolet irradiance of recalcitrantdissolved organic matter to simple substrates for rapidbacterial metabolism. Limnology and Oceanography, 40,1369–1380.
Williams, C. J., Yamashita, Y., Wilson, H.-F., Jaffe, R., &Xenopoulos, M. A. (2010). Unraveling the role of landuse and microbial activity in shaping dissolved organicmatter characteristics in stream ecosystems. Limnologyand Oceanography, 55, 1159–1171.
Yang, J. R., Basu, B. K., Hamilton, P. B., & Pick, F. R. (1997). Thedevelopment of a true riverine phytoplankton assemblagealong a lake-fed lowland river. Archiv für Hydrobiologie,140, 243–260.
Zacharias, S., Bogena, H., Samaniego, L., Mauder, M., Fuß, R.,Pütz, T., et al. (2011). A network of terrestrial environmentalobservatories in Germany. Vadose Zone Journal, 10, 955–973.
Zerling, L., Hanisch, C., Junge, F. W., & Müller, A. (2003).Heavy metals in Saale sediments—changes in the contam-ination since 1991. Acta Hydrochimica et Hydrobiologica,31(4–5), 368–377.
9236 Environ Monit Assess (2013) 185:9221–9236
Copyright © 2022 FDOKUMEN