Vertical distribution of the soil microbiota along a successional gradient in a glacier forefield
18
Vertical distribution of the soil microbiota along a successional gradient in a glacier forefield THOMAS RIME,* MARTIN HARTMANN,* † IVANO BRUNNER,* FRANCO WIDMER, † JOSEF ZEYER ‡ and BEAT FREY* *Forest Soils and Biogeochemistry, Swiss Federal Research Institute WSL, 8903 Birmensdorf, Switzerland, †Molecular Ecology, Institute for Sustainability Sciences, Agroscope, 8046 Z€ urich, Switzerland, ‡Institute of Biogeochemistry and Pollutant Dynamics, Federal Institute of Technology (ETH Z€ urich), 8092 Z€ urich, Switzerland Abstract Spatial patterns of microbial communities have been extensively surveyed in well- developed soils, but few studies investigated the vertical distribution of micro-organ- isms in newly developed soils after glacier retreat. We used 454-pyrosequencing to assess whether bacterial and fungal community structures differed between stages of soil development (SSD) characterized by an increasing vegetation cover from barren (vegetation cover: 0%/age: 10 years), sparsely vegetated (13%/60 years), transient (60%/ 80 years) to vegetated (95%/110 years) and depths (surface, 5 and 20 cm) along the Damma glacier forefield (Switzerland). The SSD significantly influenced the bacterial and fungal communities. Based on indicator species analyses, metabolically versatile bacteria (e.g. Geobacter) and psychrophilic yeasts (e.g. Mrakia) characterized the barren soils. Vegetated soils with higher C, N and root biomass consisted of bacteria able to degrade complex organic compounds (e.g. Candidatus Solibacter), lignocellulolytic Ascomycota (e.g. Geoglossum) and ectomycorrhizal Basidiomycota (e.g. Laccaria). Soil depth only influenced bacterial and fungal communities in barren and sparsely vege- tated soils. These changes were partly due to more silt and higher soil moisture in the surface. In both soil ages, the surface was characterized by OTUs affiliated to Phormi- dium and Sphingobacteriales. In lower depths, however, bacterial and fungal communi- ties differed between SSD. Lower depths of sparsely vegetated soils consisted of OTUs affiliated to Acidobacteria and Geoglossum, whereas depths of barren soils were characterized by OTUs related to Gemmatimonadetes. Overall, plant establishment drives the soil microbiota along the successional gradient but does not influence the vertical distribution of microbiota in recently deglaciated soils. Keywords: 454-pyrosequencing, DNA metabarcoding, glacier retreat, indicator species analysis, soil formation, vertical distribution Received 18 May 2014; revision received 16 December 2014; accepted 17 December 2014 Introduction Spatial structuring of soil microbial communities and the corresponding occurrence of microbially driven pro- cesses have received increasing attention (Ettema & Wardle 2002). Most microbial processes in soil vary with depth (Watanabe et al. 2010; Marhan et al. 2011; Stursov a et al. 2012) and are directly linked to changes in microbial biomass, activity and diversity (Ekelund et al. 2001; Hansel et al. 2008). For example, Stursov a et al. (2012) showed that shifts in microbial community structures with depth in forest soils affected decomposi- tion processes, which might in turn influence soil car- bon dynamics. Changes in microbial processes mainly result from differences in nutrient availability, organic C, moisture regime and O 2 concentration (Hartmann et al. 2010a, b; Will et al. 2010; Eilers et al. 2012). Despite the importance of spatial organization in soil microbial communities, there is limited knowledge Correspondence: Beat Frey, Fax: 0041 44 739 22 15; E-mail: [email protected] © 2014 John Wiley & Sons Ltd Molecular Ecology (2015) 24, 1091–1108 doi: 10.1111/mec.13051
Transcript of Vertical distribution of the soil microbiota along a successional gradient in a glacier forefield
Vertical distribution of the soil microbiota along asuccessional gradient in a glacier forefield
THOMAS RIME,* MARTIN HARTMANN,*† IVANO BRUNNER,* FRANCO WIDMER,†JOSEF ZEYER‡ and BEAT FREY*
*Forest Soils and Biogeochemistry, Swiss Federal Research Institute WSL, 8903 Birmensdorf, Switzerland, †Molecular Ecology,
Institute for Sustainability Sciences, Agroscope, 8046 Z€urich, Switzerland, ‡Institute of Biogeochemistry and Pollutant
Dynamics, Federal Institute of Technology (ETH Z€urich), 8092 Z€urich, Switzerland
Abstract
Spatial patterns of microbial communities have been extensively surveyed in well-
developed soils, but few studies investigated the vertical distribution of micro-organ-
isms in newly developed soils after glacier retreat. We used 454-pyrosequencing to
assess whether bacterial and fungal community structures differed between stages of
soil development (SSD) characterized by an increasing vegetation cover from barren
(vegetation cover: 0%/age: 10 years), sparsely vegetated (13%/60 years), transient (60%/
80 years) to vegetated (95%/110 years) and depths (surface, 5 and 20 cm) along the
Damma glacier forefield (Switzerland). The SSD significantly influenced the bacterial
and fungal communities. Based on indicator species analyses, metabolically versatile
bacteria (e.g. Geobacter) and psychrophilic yeasts (e.g. Mrakia) characterized the barren
soils. Vegetated soils with higher C, N and root biomass consisted of bacteria able to
degrade complex organic compounds (e.g. Candidatus Solibacter), lignocellulolytic
Ascomycota (e.g. Geoglossum) and ectomycorrhizal Basidiomycota (e.g. Laccaria). Soildepth only influenced bacterial and fungal communities in barren and sparsely vege-
tated soils. These changes were partly due to more silt and higher soil moisture in the
surface. In both soil ages, the surface was characterized by OTUs affiliated to Phormi-dium and Sphingobacteriales. In lower depths, however, bacterial and fungal communi-
ties differed between SSD. Lower depths of sparsely vegetated soils consisted of
OTUs affiliated to Acidobacteria and Geoglossum, whereas depths of barren soils were
characterized by OTUs related to Gemmatimonadetes. Overall, plant establishment
drives the soil microbiota along the successional gradient but does not influence the
vertical distribution of microbiota in recently deglaciated soils.
Keywords: 454-pyrosequencing, DNA metabarcoding, glacier retreat, indicator species analysis,
soil formation, vertical distribution
Received 18 May 2014; revision received 16 December 2014; accepted 17 December 2014
Introduction
Spatial structuring of soil microbial communities and
the corresponding occurrence of microbially driven pro-
cesses have received increasing attention (Ettema &
Wardle 2002). Most microbial processes in soil vary
with depth (Watanabe et al. 2010; Marhan et al. 2011;�Stursov�a et al. 2012) and are directly linked to changes
in microbial biomass, activity and diversity (Ekelund
et al. 2001; Hansel et al. 2008). For example, �Stursov�a
et al. (2012) showed that shifts in microbial community
structures with depth in forest soils affected decomposi-
tion processes, which might in turn influence soil car-
bon dynamics. Changes in microbial processes mainly
result from differences in nutrient availability, organic
C, moisture regime and O2 concentration (Hartmann
et al. 2010a, b; Will et al. 2010; Eilers et al. 2012).
Despite the importance of spatial organization in soil
microbial communities, there is limited knowledgeCorrespondence: Beat Frey, Fax: 0041 44 739 22 15;
E-mail: [email protected]
© 2014 John Wiley & Sons Ltd
Molecular Ecology (2015) 24, 1091–1108 doi: 10.1111/mec.13051
about the vertical distribution of micro-organisms in
developing soils (<150 years), in particular after retreat
of Alpine glaciers. The few studies that have addressed
the vertical distribution of microbial communities in
developing soils took place in either polar (Sch€utte et al.
2009) or Antarctic glacier forefields (Bajerski & Wagner
2013) and were of limited resolution due to the use of
genetic profiling. Soils formed after the retreat of Alpine
glaciers have been extensively used to study the physi-
cal, chemical and biological dynamics of initial soil
development (Bernasconi et al. 2011; Schmidt et al. 2012;
Guelland et al. 2013). The continuum of stages of soil
development (SSD) formed after glacier retreat repre-
sents an ideal framework to study trajectories of micro-
bial succession (Schmidt et al. 2014). Shifts in microbial
communities along soil chronosequences have often
been reported as a consequence of increasing C and
nutrient availability, plant colonization and associated
changes in pH (Ohtonen et al. 1999; Blaalid et al. 2012;
Knelman et al. 2012). Nemergut et al. (2007) reported an
increase in a-diversity and a change in b-diversity (Beta-
proteobacteria to Alphaproteobacteria) in top soil (0–5 cm)
during soil development. Similarly, Knelman et al.
(2012) reported an enrichment in Alphaproteobacteria and
Acidobacteria in top soil due to lower pH associated with
plant colonization after glacier retreat. Zumsteg et al.
(2012) and Jumpponen (2003) found a shift from Asc-
omycota to Basidiomycota, particularly due to an increase
in ectomycorrhizas, with the establishment of plants
during soil development. Further, Brown & Jumpponen
(2014) showed that bacterial succession was more influ-
enced by plant establishment than fungal communities
during soil formation. This study further posited that
bacterial communities in barren soils were driven by
stochastic colonization and converged during soil devel-
opment, indicating that establishment of vegetation
might drive more deterministic processes in bacterial
communities. These investigations have, however, only
focused on microbial communities living in the top soil
(0–5 cm) and neglected the distribution of micro-organ-
isms at different depths of a developing soil. The inves-
tigation of the vertical distribution of microbial
communities during soil development might give addi-
tional insight about establishment of microbial commu-
nities in terrestrial ecosystems. Soils in initial
ecosystems feature unique environmental conditions
that might influence microbial community structures
along the depth profile. The surface of barren soils at
higher altitude is exposed to high UV radiation, large
moisture and temperature fluctuations and higher
atmospheric deposition, such as wind-blown plant deb-
ris and arthropods (Schmidt et al. 2008; Zumsteg et al.
2011; Jumpponen et al. 2012; Mladenov et al. 2012),
while lower strata of newly deglaciated soils are pro-
tected from solar radiation, show more constant micro-
climatic conditions and receive less atmospheric input
of organic matter. The surface of vegetated soils
receives organic matter as plant litter, whereas lower
strata are directly influenced by root exudates of colo-
nizing plants and weathered bedrock material (Knel-
man et al. 2012).
Our study used high-throughput barcoded 454-py-
rosequencing (Margulies et al. 2005) of amplicons from
the bacterial small-subunit ribosomal RNA (16S rRNA)
gene and the fungal ribosomal internal transcribed
spacer (ITS) to determine both bacterial and fungal lin-
eages associated with specific soil habitats (different
stages of soil development (SSD): 10, 60, 80 and
110 years, and depths: surface, 5 and 20 cm) in a Swiss
glacier forefield. We specifically addressed the follow-
ing questions. (i) Do bacterial and fungal communities
differ with SSD and depth in a developing ecosystem?
(ii) Which bacterial and fungal taxa are characteristic of
the different SSD and depth? and (iii) Are shifts in bac-
terial and fungal community structures correlated with
changes in environmental conditions?
Materials and methods
Site description
The Damma glacier forefield is located in the Central
Alps of Switzerland (N46°380, E8°280) between 1900 and
2100 m.a.s.l. The glacier front has been retreating at an
approximate rate of 10 m per year (Zumsteg et al.
2012). The climate is typical for a high alpine environ-
ment with a short growing season between June and
September. The annual mean precipitation reaches
2300 mm, and the annual mean temperature has been
estimated around 2.2 °C with high daily and seasonal
fluctuations (�4 °C to 8 °C across the seasons). The
bedrock material is mainly composed of coarse-grained
metamorphic granite along the forefield (Bernasconi
2008). The soil texture ranges from coarse sand in the
youngest sites to more loamy sand in vegetated soils.
Four sites were sampled based on the locations of the
interdisciplinary BigLink project (Bernasconi et al. 2011).
These sites have been deglaciated for 10, 60, 80 and
110 years resulting in vegetation cover of 0%, 13%, 60%
and 95% of the surface, respectively. The 10-year-old
soils are located between the glacier terminus and the
1992 moraine and consist of barren sandy rock mainly
colonized by mosses and lichens (Fig. 1a). The 60- and
80-year-old soils are located between the 1992 and 1928
moraines, 250 and 500 m away from the glacier termi-
nus, respectively, and their vegetations mainly consist
of grass (e.g. Agrostis gigantea and Festuca rubra) and
shrubs (Salix spp.). The 110-year-old soils are located
© 2014 John Wiley & Sons Ltd
1092 T. RIME ET AL.
after the 1928 moraine, that is 720 m away from the gla-
cier terminus, and are characterized by shrubs (e.g. Rho-
dodendron ferrugineum and Salix spp.) and grass (e.g.
Festuca rubra and Agrostis gigantea).
Sampling procedure
Soils were sampled in three parallel transects, constitut-
ing the replication units, at the defined SSD. One of the
replicates was taken at the BigLink reference site, and
the other two replicates were taken 30 m on both sides
of the reference site (Fig. 1a). For the 10-year-old soils,
however, the distance between the centre replicate and
each side replicate was reduced to 20 m due to the
smaller investigation area (Fig. 1a). Each replicate con-
sisted of four pooled subsamples within a 1-m2 area.
Due to the absence of defined soil horizons, we sam-
pled three soil depths, that is the 0- to 1-cm (surface,
referred to 0 cm in tables and figures), 4- to 6-cm (mid-
dle, referred to 5 cm) and 18- to 20-cm (deepest,
referred to 20 cm) soil layers, by digging a soil profile
with an ethanol-cleaned spade at each subsampling site.
It was not possible to dig beyond this depth due to the
presence of granitic rocks. To avoid mixing of the dif-
ferent depths, the deepest soil layer was sampled first,
followed by the middle and the top layers. Approxi-
mately 100 g soil was collected in individual plastic
bags and kept cold during transportation to the labora-
tory. Same amounts of subsamples were sieved (2 mm)
and pooled after the fine roots were removed. Overall,
our sampling approach resulted in 36 independent sam-
ples (three transects 9 four SSD 9 three depths). Por-
tions of the soil samples were stored at �20 °C(biological analyses) or 4 °C (physico-chemical analyses)
until further processing.
Soil characteristics
Soil texture was determined by the hydrometer tech-
nique according to Gee & Bauder (1986). The water-
holding capacity (WHC) was determined according to
Schimel & Gulledge (1999). Soil samples were dried
overnight at 105 °C to measure their gravimetric water
content (SM). Around 2 g of well-homogenized soil
was milled with a Teflon ball mill, and around 40 mg
of soil was subsequently weighed in tin caps for mea-
surement of the total carbon (TC) and nitrogen (TN)
contents with a CHN analyser (Shimadzu, Tokyo,
Japan). Dried soil was extracted with milliQ water
(1:10 m/v) in 250-mL PE bottles placed in an overhead
shaker overnight at room temperature and filtered
through folded paper filters (0790 1/2 Whatman paper
filter, Whatman Inc., CA, USA). The pH was measured
0%
10%
20%
30%
40%
50%
60%
70%
80%
90%
100% OthersUnclassifiedGammaproteobacteriaDeltaproteobacteriaBetaproteobacteriaAlphaproteobacteriaPlanctomycetesGemmatimonadetesCyanobacteriaChloroflexiBacteroidetesActinobacteriaAcidobacteria
0%
10%
20%
30%
40%
50%
60%
70%
80%
90%
100%
OthersUnclassifiedZygomycotaGlomeromycotaBasidiomycotaAscomycota
Rel
ativ
e ab
unda
nce
of b
acte
rial t
axa
(%)
Rel
ativ
e ab
unda
nce
of fu
ngal
taxa
(%)
B SV T V All SSD
(b)
(a)
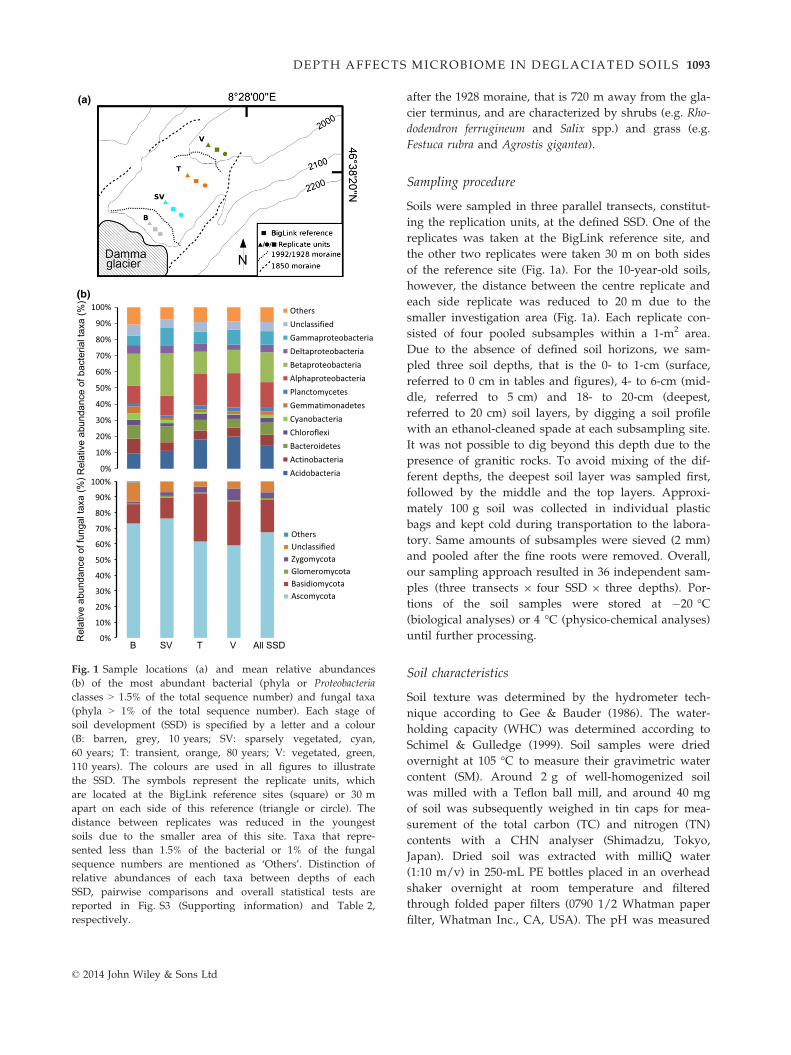
Fig. 1 Sample locations (a) and mean relative abundances
(b) of the most abundant bacterial (phyla or Proteobacteria
classes > 1.5% of the total sequence number) and fungal taxa
(phyla > 1% of the total sequence number). Each stage of
soil development (SSD) is specified by a letter and a colour
(B: barren, grey, 10 years; SV: sparsely vegetated, cyan,
60 years; T: transient, orange, 80 years; V: vegetated, green,
110 years). The colours are used in all figures to illustrate
the SSD. The symbols represent the replicate units, which
are located at the BigLink reference sites (square) or 30 m
apart on each side of this reference (triangle or circle). The
distance between replicates was reduced in the youngest
soils due to the smaller area of this site. Taxa that repre-
sented less than 1.5% of the bacterial or 1% of the fungal
sequence numbers are mentioned as ‘Others’. Distinction of
relative abundances of each taxa between depths of each
SSD, pairwise comparisons and overall statistical tests are
reported in Fig. S3 (Supporting information) and Table 2,
respectively.
© 2014 John Wiley & Sons Ltd
DEPTH AFFECTS MICROBIOME IN DEGLACIATED SOILS 1093
in each sample using a glass electrode linked to a pH
meter (FEP20-FiveEasy Plus, Mettler-Toledo GmbH,
Switzerland). The concentrations of dissolved organic
carbon (DOC) and nitrogen (DON) were measured with
a TOC-V analyzer (Shimadzu, Tokyo, Japan). The anion
(SO2�4 , PO3�
4 , NO�3 and NO�
2 ) content was measured by
ion chromatography with an IC:DX-120 chromatograph
(Dionex Corp., CA, USA). The concentrations of ammo-
nium (NHþ4 ) were determined photometrically with a
FIAS 300 (Perkin-Elmer, MA, USA). The cation (Al3+,
Ca2+, Fe2+, K+, Mg2+, Mn2+, Na+ and Zn2+) content was
measured by inductive plasma atomic spectrometry
with an Optima 3000 (Perkin-Elmer). The cation
exchange capacity (CEC) was calculated as the sum of
the measured cations (mmolc/kg). The base saturation
was defined as the sum of Ca2+, Mg2+, K+ and Na+ con-
centrations divided by the CEC (%). Roots and moss rhi-
zoids were collected during sieving and dried overnight
at 60 °C to measure the root biomass in depths of each
SSD.
Bacterial activity and fungal biomass
The bacterial activity and fungal biomass were mea-
sured at Lund University with the 3H-leucine incorpo-
ration method (B�a�ath 1994) as modified by B�a�ath et al.
(2001) and by extracting ergosterol (B�a�ath 2001). As
samples were kept frozen during transportation, they
were thawed at room temperature 24 h before mea-
surement start. Both assays were conducted at room
temperature. Compared to the original protocols, the
amount of soil was increased to c. 5 g fresh soil for3H-leucine incorporation and 2 g for ergosterol extrac-
tion instead of 1 g and the incubation time after the
addition of 3H-leucine was extended to 3 h instead of
2 h.
DNA extraction, PCRs and pyrosequencing of taggedamplicons
Total DNA for metabarcoding analyses was extracted
from c. 1 g soil with the UltraClean Soil DNA extraction
kit (MoBio, Carlsbad, CA, USA) according to manufac-
turer instructions. The obtained DNA was quantified by
PicoGreen (Invitrogen, Carlsbad, CA, USA) and stored
at �20 °C. DNA was adjusted to 10 ng DNA/lL in
H2O and pretreated with 1 lg BSA/mL (BSA concentra-
tion in sample: 10 mg/mL) at 95 °C for 5 min to bind
PCR-inhibiting substances. Region V1–V3 of the bacte-
rial 16S rRNA gene (16SV1–V3) and the fungal ITS-2
region were amplified using the barcoded primer pairs
27f/519r (Amann et al. 1995) and ITS3/ITS4 (White
et al. 1990), respectively. The primer and multiplex-tag
(MID) sequences are provided in Table S1 (Supporting
information). PCR amplification was performed with
20 ng soil DNA and the HotStar Taq amplification kit
(Qiagen, Hilden, Germany) in a final volume of 50 lLper samples (16SV1–V3: 15 min at 95 °C/30 cycles: 40 s
at 94 °C, 40 s at 60 °C, 1 min at 72 °C/10 min at 72 °C;ITS-2: 15 min at 95 °C/40 cycles: 40 s at 94 °C, 40 s at
58 °C, 1 min at 72 °C/10 min at 72 °C). For each sam-
ple, targets were amplified in triplicate reactions and
subsequently pooled prior to purification and quantifi-
cation. Amplicons with different barcoded primers were
finally pooled in equimolar concentrations and sent for
pyrosequencing to the Genome Quebec Innovation Cen-
ter, Montreal, Canada. The PCR products were unidi-
rectionally sequenced from primers 27f and ITS4 with
the GS-FLX Titanium technology (Roche 454 Life Sci-
ences, Brandford, CT, USA).
Sequence analyses
Quality control of bacterial and fungal reads was per-
formed according to Hartmann et al. (2014). Reads con-
taining more than two mismatches to the target
specific primers or more than one mismatch to the
barcode were removed. In parallel, reads with flow-
grams smaller than 360 were discarded, while reads
with more than 720 flows were trimmed to 720 flows
(Quince et al. 2011). The PyroNoise algorithm imple-
mented in MOTHUR v.1.28 (Schloss et al. 2009) was
then applied to remove erroneous reads due to homo-
polymeric signal misinterpretation (Quince et al. 2009).
Primer and barcode sequences were trimmed off. Sub-
sequently, the V1–V2 region of the bacterial 16S ribo-
somal sequence and the fungal ITS-2 region were
extracted with V-Xtractor (Hartmann et al. 2010b) and
Fungal ITS Extractor (Nilsson et al. 2010), respectively.
In this step, we verified the basic authenticity of the
sequences and extracted a phylogenetically comparable
segment of the targeted region (e.g. region V1–V2 of
the bacterial 16S rRNA). This accounts for the limited
read length provided by the GS-FLX Titanium technol-
ogy, which prevents the sequencing of the whole tar-
geted region (e.g. region V1–V3 of the bacterial 16S
rRNA). Based on hidden Markov models, conservative
sequences framing the targeted segments were kept to
reduce the formation of spurious OTUs during cluster-
ing. The number of single base errors due to PCR
amplification was reduced using the SeqNoise algo-
rithm (Quince et al. 2011) implemented in MOTHUR.
Most chimeric sequences were identified and removed
using UCHIME (Edgar et al. 2011) in MOTHUR. The
processed sequences were subsequently clustered in
operational taxonomic units (OTU) defined at 97%
similarity using CROP (Hao et al. 2011). Taxonomic
assignments were obtained using MOTHUR by
© 2014 John Wiley & Sons Ltd
1094 T. RIME ET AL.
querying the bacterial and fungal reads against the
GREENGENES (DeSantis et al. 2006) and UNITE (Aba-
renkov et al. 2010) reference databases, respectively,
using a na€ıve Bayesian classifier (Wang et al. 2007)
with a minimum bootstrap support of 60%. The con-
sensus taxonomy was determined with MOTHUR as
the taxonomic path represented at least 80% of the
sequences within an OTU.
Quantitative real-time PCR
Relative abundances of bacterial 16S rRNA gene and
fungal ITS rRNA copies were determined by quantita-
tive real-time PCR (qPCR) on an ABI7500 Fast Real-
Time PCR system (Applied Biosystems, Foster City,
CA, USA) with the same primers and cycling conditions
as used for the pyrosequencing approach. Additionally,
we quantified the relative abundances of cyanobacterial
16S rRNA gene copies according to Frey et al. (2013).
qPCR were performed using 2.5 ng DNA in a total vol-
ume of 25 lL containing 0.5 lM of each primer, 0.2 mg/
mL BSA and 12.5 lL of QuantiTect SYBR Green PCR
master mix (Qiagen, Hirlen, Germany). Three standard
curves per target region (correlations ≥0.997) were
obtained using tenfold serial dilutions (10�1 to 10�9
copies) of plasmids generated from cloned targets (Frey
et al. 2011).
Statistical analyses
Indices of a-diversity, that is the local diversity (Whit-
taker 1960), observed richness (Sobs) and Shannon
diversity (H0), were estimated for total bacteria and
fungi as well as their most abundant taxa (phyla and
classes from the Proteobacteria >1.5% for the bacteria
and phyla >1% for the fungi) based on OTU abundance
matrices rarefied to the lowest sequence numbers (4640
for bacteria and 5038 for fungi). Changes in abiotic and
biological variables, a-diversity indices, Good’s cover-
age (Good 1953) and the relative abundances of the
most abundant taxa were assessed by conducting a
two-way analysis of variance (ANOVA, SSD and depth as
categorical factors, where the factor ‘depth’ was nested
in ‘SSD’) in R v.2.15.0 (R Development Core Team
2012). Differences were considered significant at
P < 0.05 unless mentioned otherwise. Normality of the
residual distribution and variance homoscedasticity
were examined to ensure validity of the test. If these
conditions were not fulfilled, the data were log-trans-
formed. For significant omnibus tests, Tukey’s honestly
significant difference post hoc tests were conducted in
R with the HSD.test function implemented in the agrico-
lae package (De Mendiburu 2012) to identify differences
between SSD and within depths of each individual
SSD. The influence of environmental variables on bacte-
rial activity, fungal biomass, abundances of ribosomal
markers and a-diversity indices was assessed by calcu-
lating Pearson’s correlation values and assessing their
significance in R using the cor.test function imple-
mented in the stats package (R Development Core
Team 2012).
Rare OTUs, that is single- and doubleton OTUs, were
kept for multivariate analyses, unless mentioned other-
wise, because they only marginally influence these
analyses (Gobet et al. 2010). Standardization of the OTU
abundance matrices was carried out by dividing the
number of sequences of each OTU by the total number
of sequences in each sample. Bray–Curtis distance
matrices were generated based on the standardized and
square-root-transformed data of the sequence abun-
dances. The overall variability in bacterial and fungal
community structures was examined with principal
coordinate analyses (PCO). Significant differences in
community structure among SSD and depths, that is
changes in b-diversity, were assessed using the PERMA-
NOVA routine (Anderson 2001) implemented in the soft-
ware Primer6+ (Clarke & Gorley 2006) with 9999
permutations. Pairwise tests among individual groups
were adjusted using the Holm method (Holm 1979).
The DistLM procedure (McArdle & Anderson 2001) was
performed in Primer6+ to identify environmental vari-
ables that are best predicting differences in microbial
community structures using the adjusted R2 selection
criterion with the ‘forward’ procedure. The variables
selected were subsequently used to build a constrained
ordination plot using a distance-based redundancy
analysis (db-RDA) (Legendre & Anderson 1999). The
goodness of fit of the constraining models was exam-
ined by calculating the Procrustes sum of squares (m12)
(Peres-Neto & Jackson 2001) between the PCO and db-
RDA ordination scores with the procrustes function as
implemented in the vegan package in R. The results of
these analyses were investigated in parallel to infer dif-
ferences between microbial community structures with
SSD, depth and changes in environmental variables.
Indicator species analysis was performed using the mul-
tipatt function implemented in the indicspecies package
in R with 99 999 permutations and allowing combina-
tions between habitats (De C�aceres et al. 2010) to iden-
tify OTUs, leading to the changes in multivariate
patterns. For this analysis, single- and doubleton OTUs
were removed because they contain little indicator
information. Multiple testing corrections of P-values
were performed in R using the fdrtool function imple-
mented in the fdrtool package (Strimmer 2008) with a
false discovery rate of 10% (q < 0.1). All graphs were
generated with R using the vegan (Oksanen et al. 2012)
and ggplot2 packages (Wickham 2009).
© 2014 John Wiley & Sons Ltd
DEPTH AFFECTS MICROBIOME IN DEGLACIATED SOILS 1095
Results
Community compositions
We obtained 244 867 bacterial 16S rRNA (6686 � 550
per sample) and 255 249 fungal ITS-2 curated sequences
(7057 � 576 per sample). Clustering of the sequences
resulted in a total of 6819 bacterial (1051 � 30 per sam-
ple) and 2390 fungal OTUs (246 � 10 per sample). The
classification success of bacterial and fungal sequences
decreased at lower taxonomic level (Fig. S1, Supporting
information). The bacterial communities were character-
ized by nine dominant phyla (>1.5% of the total number
of sequences) and 27 less abundant phyla (referred as
‘Others’ in Fig. 1b and Fig. S1a, Supporting informa-
tion) representing 85% and 11% of the sequence num-
ber, respectively, while 4% of the sequences was
unclassified at the phylum level. Among the Proteobacte-
ria, Betaproteobacteria were the most abundant class (18%
of the sequence number) followed by Alphaproteobacteria
(16%), Gammaproteobacteria (8%) and Deltaproteobacteria
(5%). The fungal communities consisted of four domi-
nant phyla (>1% of the total number of sequences) and
two less abundant phyla (referred as ‘Others’ in Fig. 1b
and Fig. S1b, Supporting information) constituting 94%
and 1% of the sequence number, respectively, whereas
5% of the sequences were not classified at the phylum
level. A detailed description of the data set as well as
the taxonomic path and the abundances of each OTU
(Damma_Depth_OTU_data.zip) are accessible from the
Dryad Digital Repository (DOI: 10.5061/dryad.gp302).
Effect of stage of soil development
Bacterial and fungal observed richness (Sobs) and Shan-
non diversity (H0) were significantly influenced by SSD
(Table 1). Observed richness (Sobs) of Acidobacteria, Chlo-
roflexi, Cyanobacteria, Alphaproteobacteria, Deltaproteobacte-
ria and of all fungal phyla changed with SSD. Shannon
diversity (H0) of most phyla or classes except for Acido-
bacteria, Bacteroidetes, Cyanobacteria, Gemmatimonadetes,
Planctomycetes and Basidiomycota significantly varied
with SSD (Fig. S2, Supporting information). Stage of soil
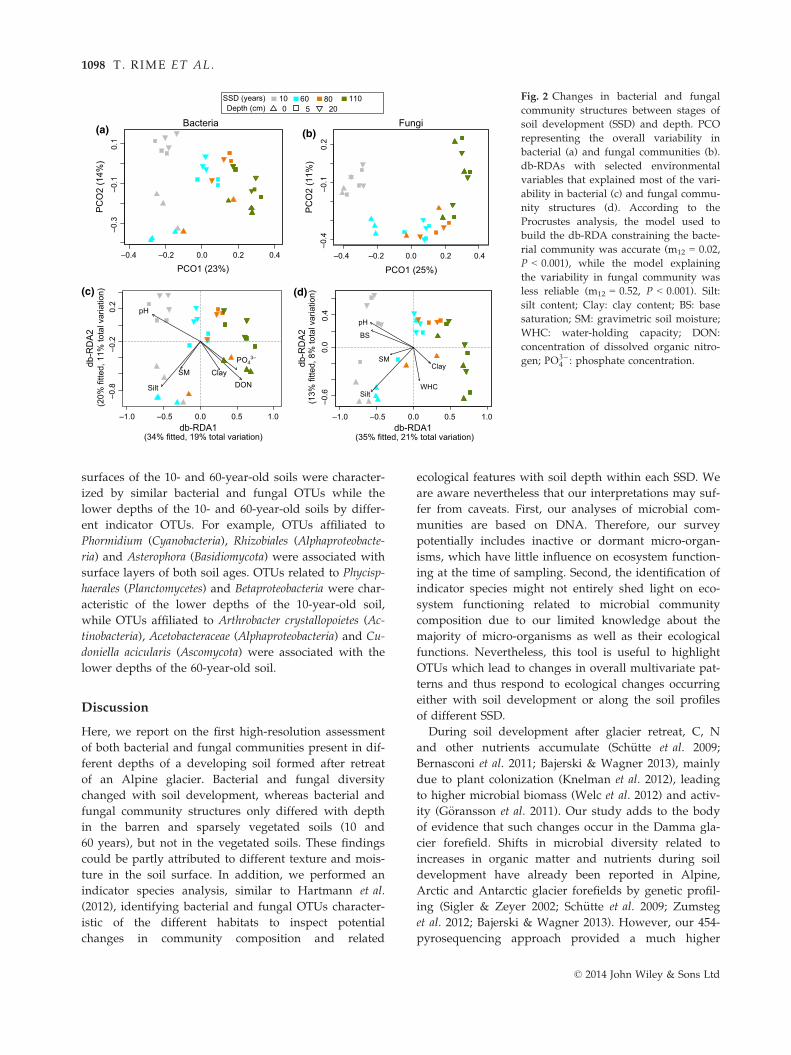
development (SSD) also influenced the b-diversity of
bacteria and fungi (Fig. 2a,b, Table 2 and Table S2, Sup-
porting information). Relative abundances of the most
abundant bacterial and fungal taxa except for Bacteroide-
tes, Deltaproteobacteria and Ascomycota significantly
varied between SSDs (Table 2, Fig. S3, Supporting infor-
mation). Relative abundances of Acidobacteria, Actinobac-
teria, Alphaproteobacteria, Basidiomycota and Zygomycota
increased, while those of Cyanobacteria and Gemmatimo-
nadetes decreased with SSD. The main abiotic factors
explaining the changes in total bacterial and fungal
community structures were pH and clay (Fig. 2c,d,
Tables 3 and Table S3, Supporting information). DON
and PO3�4 also contributed to the shift in bacterial com-
munity structure with SSD, while water-holding capac-
ity (WHC) and base saturation (BS) contributed to the
changes in fungal community structure. The model
used to build the db-RDA constraining the variability of
the fungal community was, however, less reliable
(m12 = 0.52) than that used to constrain the variability
of the bacterial community (m12 = 0.02). The selected
abiotic factors explained 30% and 29% of the variability
in the bacterial and fungal community structure, respec-
tively. These abiotic factors as well as bacterial and fun-
gal rRNA gene copy numbers, 3H-leucine incorporation
rates and ergosterol significantly varied with soil age
(Table 4). Clay, BS, WHC, DON, PO3�4 , total bacterial
16S, cyanobacterial 16S and ITS rRNA gene copy num-
bers, 3H-leucine incorporation rates and ergosterol
increased, while pH decreased with SSD (Fig. S4,
Table S4, Supporting information). 3H-leucine incorpo-
ration rates, ergosterol and most of the a-diversity indi-
ces negatively correlated with pH, while they positively
correlated with WHC, DOC and root biomass (Table S5,
Supporting information).
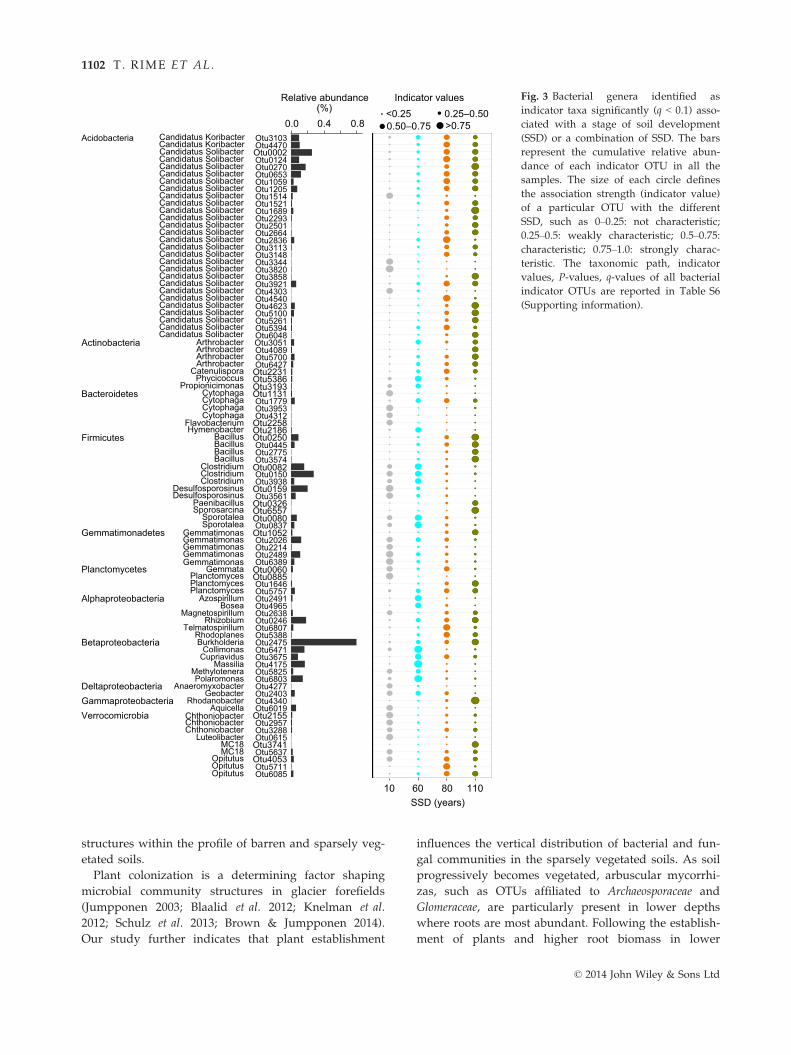
Indicator species analysis revealed 518 bacterial and
263 fungal OTUs significantly (q < 0.1) associated with
a specific SSD or a combination of SSD (Table S6, Sup-
porting information). Eighty-eight bacterial (Fig. 3) and
83 fungal OTUs (Fig. 4) were classified at the genus
level. Bacterial and fungal genera significantly associ-
ated with the barren (10 years) and sparsely vegetated
(60 years) soils were similar but differed from the indi-
cator taxa characteristic of the vegetated (80 and
110 years) soils.
Effect of soil depth and its interaction with stage ofsoil development
Soil depth significantly influenced bacterial and fungal
Sobs and H0 (Table 1). Observed richness (Sobs) of all
taxa except for Bacteroidetes, Deltaproteobacteria and
Zygomycota and H0 of Acidobacteria, Bacteroidetes, Chloro-flexi, Planctomycetes, Alphaproteobacteria, Gammaproteobac-
teria and Ascomycota were significantly influenced by
soil depth (Table 1, Fig. S2, Supporting information).
Soil depth also significantly changed the b-diversity of
bacteria, fungi and their most abundant taxa in the bar-
ren (10 years) and sparsely vegetated (60 years) soils,
but not in the vegetated soils (80 and 110 years)
(Fig. 2a,b, Tables 2 and Table S7, Supporting informa-
tion). Except for Acidobacteria, Betaproteobacteria and Del-
taproteobacteria, the relative abundances of all bacterial
taxa changed with soil depth, while only the relative
abundance of Glomeromycota varied with depth among
© 2014 John Wiley & Sons Ltd
1096 T. RIME ET AL.
the fungal phyla (Table 2). The relative abundance of
Glomeromycota was highest in the lower depths of the
sparsely vegetated soils, while the relative abundances
of Alphaproteobacteria and Zygomycota were highest in
the surface of the 110-year-old soils (Fig. S3, Supporting
information). The main abiotic factors influencing the
changes in total bacterial and fungal community struc-
tures in the 10- and 60-year-old soils were silt and soil
moisture (SM) (Fig. 2c,d, Tables 3 and Table S3, Sup-
porting information). These abiotic factors as well as
bacterial 16S rRNA gene and fungal ITS rRNA gene
copy numbers, 3H-leucine incorporation rates and
ergosterol were significantly influenced by soil depth
(Table 4). 3H-leucine incorporation rates, ergosterol and
root biomass were highest in the 110-year-old soil
surface, while silt was highest in the 60-year-old soil
surface (Fig. S4, Table S4, Supporting information).
Indicator species analysis revealed 30 bacterial and 20
fungal OTUs significantly (q < 0.1) associated with
depths of the 10- and 60-year-old soils (Table S8, Sup-
porting information). Only three bacterial and seven
fungal OTUs were classified at the genus level; there-
fore, bacterial and fungal OTUs assigned at different
taxonomic levels are also reported in Fig. 5. The
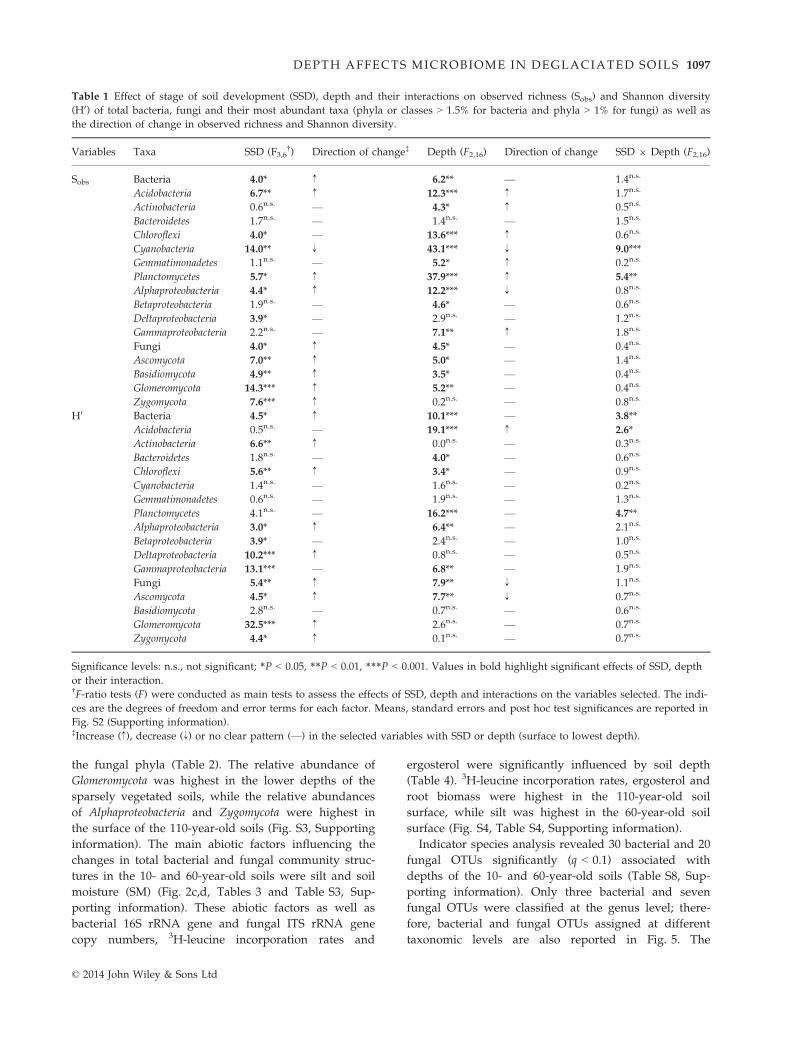
Table 1 Effect of stage of soil development (SSD), depth and their interactions on observed richness (Sobs) and Shannon diversity
(H0) of total bacteria, fungi and their most abundant taxa (phyla or classes > 1.5% for bacteria and phyla > 1% for fungi) as well as
the direction of change in observed richness and Shannon diversity.
Variables Taxa SSD (F3,6†) Direction of change‡ Depth (F2,16) Direction of change SSD 9 Depth (F2,16)
Sobs Bacteria 4.0* ↑ 6.2** — 1.4n.s.
Acidobacteria 6.7** ↑ 12.3*** ↑ 1.7n.s.
Actinobacteria 0.6n.s. — 4.3* ↑ 0.5n.s.
Bacteroidetes 1.7n.s. — 1.4n.s. — 1.5n.s.
Chloroflexi 4.0* — 13.6*** ↑ 0.6n.s.
Cyanobacteria 14.0** ↓ 43.1*** ↓ 9.0***
Gemmatimonadetes 1.1n.s. — 5.2* ↑ 0.2n.s.
Planctomycetes 5.7* ↑ 37.9*** ↑ 5.4**
Alphaproteobacteria 4.4* ↑ 12.2*** ↓ 0.8n.s.
Betaproteobacteria 1.9n.s. — 4.6* — 0.6n.s.
Deltaproteobacteria 3.9* — 2.9n.s. — 1.2n.s.
Gammaproteobacteria 2.2n.s. — 7.1** ↑ 1.8n.s.
Fungi 4.0* ↑ 4.5* — 0.4n.s.
Ascomycota 7.0** ↑ 5.0* — 1.4n.s.
Basidiomycota 4.9** ↑ 3.5* — 0.4n.s.
Glomeromycota 14.3*** ↑ 5.2** — 0.4n.s.
Zygomycota 7.6*** ↑ 0.2n.s. — 0.8n.s.
H0 Bacteria 4.5* ↑ 10.1*** — 3.8**
Acidobacteria 0.5n.s. — 19.1*** ↑ 2.6*
Actinobacteria 6.6** ↑ 0.0n.s. — 0.3n.s.
Bacteroidetes 1.8n.s. — 4.0* — 0.6n.s.
Chloroflexi 5.6** ↑ 3.4* — 0.9n.s.
Cyanobacteria 1.4n.s. — 1.6n.s. — 0.2n.s.
Gemmatimonadetes 0.6n.s. — 1.9n.s. — 1.3n.s.
Planctomycetes 4.1n.s. — 16.2*** — 4.7**
Alphaproteobacteria 3.0* ↑ 6.4** — 2.1n.s.
Betaproteobacteria 3.9* — 2.4n.s. — 1.0n.s.
Deltaproteobacteria 10.2*** ↑ 0.8n.s. — 0.5n.s.
Gammaproteobacteria 13.1*** — 6.8** — 1.9n.s.
Fungi 5.4** ↑ 7.9** ↓ 1.1n.s.
Ascomycota 4.5* ↑ 7.7** ↓ 0.7n.s.
Basidiomycota 2.8n.s. — 0.7n.s. — 0.6n.s.
Glomeromycota 32.5*** ↑ 2.6n.s. — 0.7n.s.
Zygomycota 4.4* ↑ 0.1n.s. — 0.7n.s.
Significance levels: n.s., not significant; *P < 0.05, **P < 0.01, ***P < 0.001. Values in bold highlight significant effects of SSD, depth
or their interaction.†F-ratio tests (F) were conducted as main tests to assess the effects of SSD, depth and interactions on the variables selected. The indi-
ces are the degrees of freedom and error terms for each factor. Means, standard errors and post hoc test significances are reported in
Fig. S2 (Supporting information).‡Increase (↑), decrease (↓) or no clear pattern (—) in the selected variables with SSD or depth (surface to lowest depth).
© 2014 John Wiley & Sons Ltd
DEPTH AFFECTS MICROBIOME IN DEGLACIATED SOILS 1097
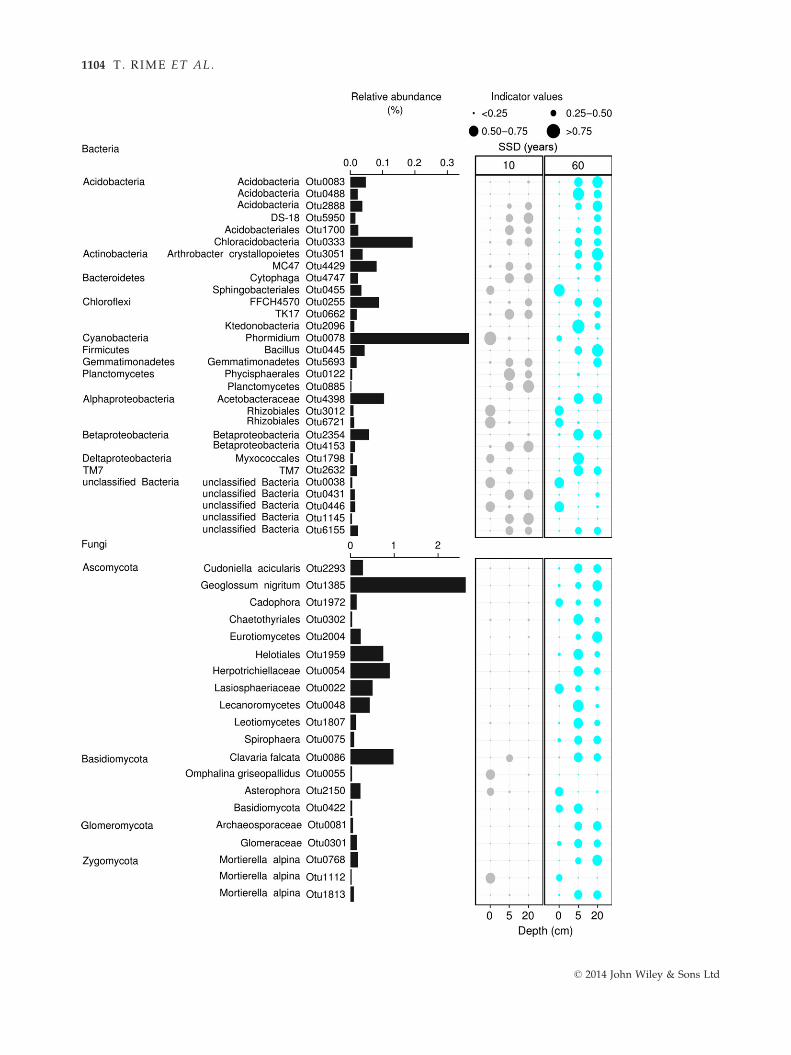
surfaces of the 10- and 60-year-old soils were character-
ized by similar bacterial and fungal OTUs while the
lower depths of the 10- and 60-year-old soils by differ-
ent indicator OTUs. For example, OTUs affiliated to
Phormidium (Cyanobacteria), Rhizobiales (Alphaproteobacte-
ria) and Asterophora (Basidiomycota) were associated with
surface layers of both soil ages. OTUs related to Phycisp-
haerales (Planctomycetes) and Betaproteobacteria were char-
acteristic of the lower depths of the 10-year-old soil,
while OTUs affiliated to Arthrobacter crystallopoietes (Ac-
tinobacteria), Acetobacteraceae (Alphaproteobacteria) and Cu-
doniella acicularis (Ascomycota) were associated with the
lower depths of the 60-year-old soil.
Discussion
Here, we report on the first high-resolution assessment
of both bacterial and fungal communities present in dif-
ferent depths of a developing soil formed after retreat
of an Alpine glacier. Bacterial and fungal diversity
changed with soil development, whereas bacterial and
fungal community structures only differed with depth
in the barren and sparsely vegetated soils (10 and
60 years), but not in the vegetated soils. These findings
could be partly attributed to different texture and mois-
ture in the soil surface. In addition, we performed an
indicator species analysis, similar to Hartmann et al.
(2012), identifying bacterial and fungal OTUs character-
istic of the different habitats to inspect potential
changes in community composition and related
ecological features with soil depth within each SSD. We
are aware nevertheless that our interpretations may suf-
fer from caveats. First, our analyses of microbial com-
munities are based on DNA. Therefore, our survey
potentially includes inactive or dormant micro-organ-
isms, which have little influence on ecosystem function-
ing at the time of sampling. Second, the identification of
indicator species might not entirely shed light on eco-
system functioning related to microbial community
composition due to our limited knowledge about the
majority of micro-organisms as well as their ecological
functions. Nevertheless, this tool is useful to highlight
OTUs which lead to changes in overall multivariate pat-
terns and thus respond to ecological changes occurring
either with soil development or along the soil profiles
of different SSD.
During soil development after glacier retreat, C, N
and other nutrients accumulate (Sch€utte et al. 2009;
Bernasconi et al. 2011; Bajerski & Wagner 2013), mainly
due to plant colonization (Knelman et al. 2012), leading
to higher microbial biomass (Welc et al. 2012) and activ-
ity (G€oransson et al. 2011). Our study adds to the body
of evidence that such changes occur in the Damma gla-
cier forefield. Shifts in microbial diversity related to
increases in organic matter and nutrients during soil
development have already been reported in Alpine,
Arctic and Antarctic glacier forefields by genetic profil-
ing (Sigler & Zeyer 2002; Sch€utte et al. 2009; Zumsteg
et al. 2012; Bajerski & Wagner 2013). However, our 454-
pyrosequencing approach provided a much higher
PCO1 (23%)
PC
O2
(14%
)–0
.3–0
.10.
1–0
.8–0
.20.
2
PC
O2
(11%
)–0
.4–0
.10.
2
(a)
010 60 80 110
5 20
(b)
–0.4 –0.2 0.20.0 0.4
–1.0 –0.5 0.50.0 1.0
PCO1 (25%)–0.4 –0.2 0.20.0 0.4
Depth (cm)
db-RDA1(34% fitted, 19% total variation)
–1.0 –0.5 0.50.0 1.0db-RDA1
(35% fitted, 21% total variation)
db-R
DA
2(2
0% fi
tted,
11%
tota
l var
iatio
n)
–0.6
0.0
0.4
db-R
DA
2(1
3% fi
tted,
8%
tota
l var
iatio
n)
SMClay
WHCSilt
BS
pHpH
Silt
SMDON
ClayPO4
3–
(c)
Bacteria Fungi
(d)
SSD (years) Fig. 2 Changes in bacterial and fungal
community structures between stages of
soil development (SSD) and depth. PCO
representing the overall variability in
bacterial (a) and fungal communities (b).
db-RDAs with selected environmental
variables that explained most of the vari-
ability in bacterial (c) and fungal commu-
nity structures (d). According to the
Procrustes analysis, the model used to
build the db-RDA constraining the bacte-
rial community was accurate (m12 = 0.02,
P < 0.001), while the model explaining
the variability in fungal community was
less reliable (m12 = 0.52, P < 0.001). Silt:
silt content; Clay: clay content; BS: base
saturation; SM: gravimetric soil moisture;
WHC: water-holding capacity; DON:
concentration of dissolved organic nitro-
gen; PO3�4 : phosphate concentration.
© 2014 John Wiley & Sons Ltd
1098 T. RIME ET AL.
coverage of the bacterial and fungal diversities present
in the different SSD leading to a robust assessment of
a-diversity and high-resolution description of the com-
munity composition. For example, ectomycorrhizal
fungi, such as Cortinarius (Favre 1960), Laccaria (Jump-
ponen 2003) and Hygrocybe (Seitzman et al. 2011), were
characteristic of the vegetated (80 and 110 years) soils.
These fungi might contribute to plant growth by pro-
viding plant-available nutrient sources. As plants grow,
they provide in turn environmental conditions benefi-
cial to bacterial taxa involved in the degradation of
complex organic compounds (e.g. Arthrobacter, Candida-
tus Solibacter and Sporosarcina) (Haichar et al. 2008; Uroz
et al. 2014) as well as fungal plant pathogens (e.g. Asco-
chyta and Cadophora) and lignocellulolytic saprophytes
(e.g. Coniochaeta and Geoglossum) that are able to
degrade more recalcitrant organic material (Lopez et al.
2007). In contrast, the barren (10 years) and sparsely
vegetated (60 years) soils were characterized by spore-
forming and metabolically versatile bacterial genera
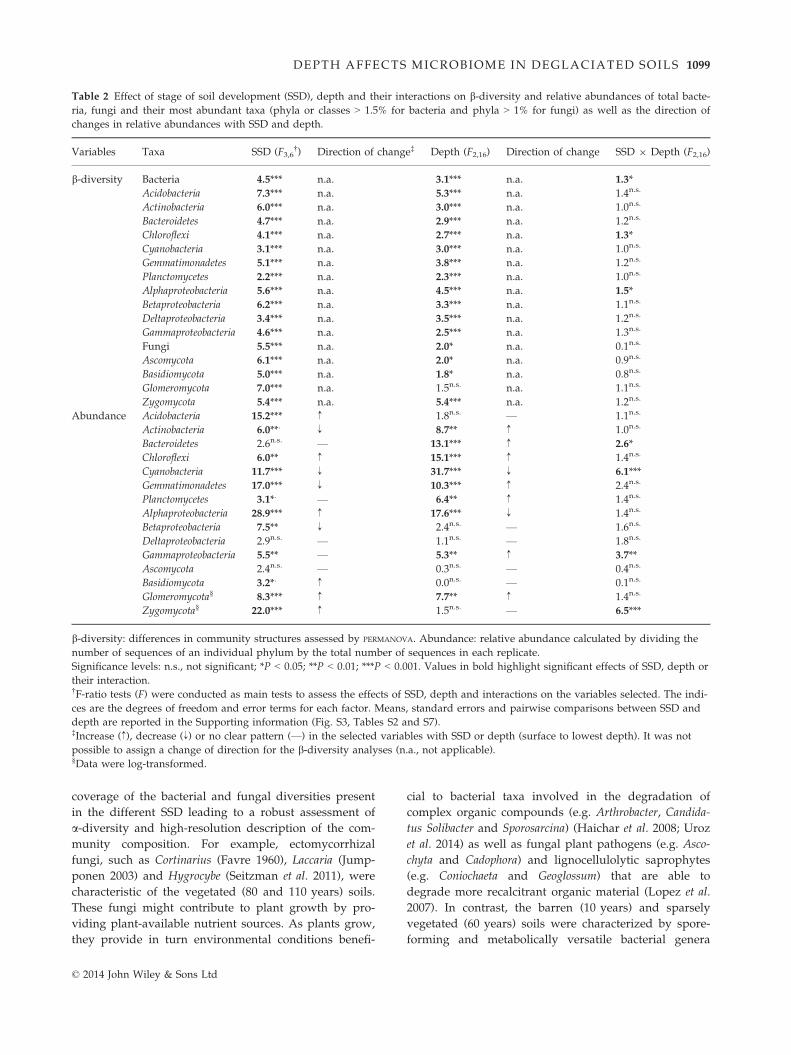
Table 2 Effect of stage of soil development (SSD), depth and their interactions on b-diversity and relative abundances of total bacte-
ria, fungi and their most abundant taxa (phyla or classes > 1.5% for bacteria and phyla > 1% for fungi) as well as the direction of
changes in relative abundances with SSD and depth.
Variables Taxa SSD (F3,6†) Direction of change‡ Depth (F2,16) Direction of change SSD 9 Depth (F2,16)
b-diversity Bacteria 4.5*** n.a. 3.1*** n.a. 1.3*
Acidobacteria 7.3*** n.a. 5.3*** n.a. 1.4n.s.
Actinobacteria 6.0*** n.a. 3.0*** n.a. 1.0n.s.
Bacteroidetes 4.7*** n.a. 2.9*** n.a. 1.2n.s.
Chloroflexi 4.1*** n.a. 2.7*** n.a. 1.3*
Cyanobacteria 3.1*** n.a. 3.0*** n.a. 1.0n.s.
Gemmatimonadetes 5.1*** n.a. 3.8*** n.a. 1.2n.s.
Planctomycetes 2.2*** n.a. 2.3*** n.a. 1.0n.s.
Alphaproteobacteria 5.6*** n.a. 4.5*** n.a. 1.5*
Betaproteobacteria 6.2*** n.a. 3.3*** n.a. 1.1n.s.
Deltaproteobacteria 3.4*** n.a. 3.5*** n.a. 1.2n.s.
Gammaproteobacteria 4.6*** n.a. 2.5*** n.a. 1.3n.s.
Fungi 5.5*** n.a. 2.0* n.a. 0.1n.s.
Ascomycota 6.1*** n.a. 2.0* n.a. 0.9n.s.
Basidiomycota 5.0*** n.a. 1.8* n.a. 0.8n.s.
Glomeromycota 7.0*** n.a. 1.5n.s. n.a. 1.1n.s.
Zygomycota 5.4*** n.a. 5.4*** n.a. 1.2n.s.
Abundance Acidobacteria 15.2*** ↑ 1.8n.s. — 1.1n.s.
Actinobacteria 6.0**. ↓ 8.7** ↑ 1.0n.s.
Bacteroidetes 2.6n.s. — 13.1*** ↑ 2.6*
Chloroflexi 6.0** ↑ 15.1*** ↑ 1.4n.s.
Cyanobacteria 11.7*** ↓ 31.7*** ↓ 6.1***
Gemmatimonadetes 17.0*** ↓ 10.3*** ↑ 2.4n.s.
Planctomycetes 3.1*. — 6.4** ↑ 1.4n.s.
Alphaproteobacteria 28.9*** ↑ 17.6*** ↓ 1.4n.s.
Betaproteobacteria 7.5** ↓ 2.4n.s. — 1.6n.s.
Deltaproteobacteria 2.9n.s. — 1.1n.s. — 1.8n.s.
Gammaproteobacteria 5.5** — 5.3** ↑ 3.7**
Ascomycota 2.4n.s. — 0.3n.s. — 0.4n.s.
Basidiomycota 3.2*. ↑ 0.0n.s. — 0.1n.s.
Glomeromycota§ 8.3*** ↑ 7.7** ↑ 1.4n.s.
Zygomycota§ 22.0*** ↑ 1.5n.s. — 6.5***
b-diversity: differences in community structures assessed by PERMANOVA. Abundance: relative abundance calculated by dividing the
number of sequences of an individual phylum by the total number of sequences in each replicate.
Significance levels: n.s., not significant; *P < 0.05; **P < 0.01; ***P < 0.001. Values in bold highlight significant effects of SSD, depth or
their interaction.†F-ratio tests (F) were conducted as main tests to assess the effects of SSD, depth and interactions on the variables selected. The indi-
ces are the degrees of freedom and error terms for each factor. Means, standard errors and pairwise comparisons between SSD and
depth are reported in the Supporting information (Fig. S3, Tables S2 and S7).‡Increase (↑), decrease (↓) or no clear pattern (—) in the selected variables with SSD or depth (surface to lowest depth). It was not
possible to assign a change of direction for the b-diversity analyses (n.a., not applicable).§Data were log-transformed.
© 2014 John Wiley & Sons Ltd
DEPTH AFFECTS MICROBIOME IN DEGLACIATED SOILS 1099
known to grow anaerobically, such as Clostridium,
Desulfosporosinus, Sporotalea, Anaeromyxobacter and
Geobacter (Hartmann et al. 2014). The presence of such
micro-organisms indicates that oxygen depletion occurs
in these soils due to water table fluctuations during
snow and glacier ice melting (Magnusson & Kobierska
2014). We also found psychrophilic yeasts, such as
Cryptococcus, Leucosporidium and Mrakia (Buzzini et al.
2012), characterizing these SSD. These micro-organisms
can cope with low temperatures, which are common
near the glacier terminus; psychrophilic yeasts might
therefore be favoured in these habitats.
Our study investigated in particular the changes in
microbial communities with depth during early SSDs
(<110 years). As for studies conducted in grassland and
forest soils (e.g. �Snajdr et al. 2008; Will et al. 2010),
bacterial activity and fungal biomass decreased with
depth at all SSD and with C depletion. Bacterial a-diversity did not consistently decrease with soil depth
and was not correlated with reduction in soil C. On the
other hand, fungal a-diversity was highest in the soil
surface of the vegetated soils and was positively corre-
lated with increasing DOC and root biomass. The
absence of trend in bacterial a-diversity with soil depth
might result from high variability in microclimatic con-
ditions occurring in Alpine soils (Lazzaro et al. 2012)
and diverse resources of organic matter (Schurig et al.
2013), creating a high diversity of ecological niches. In
contrast, our study suggests that changes in fungal a-diversity with depth of developing soils (<110 years)
might be mainly influenced by plant establishment and
subsequent C accumulation.
In forest and grassland soils, shifts in community struc-
tures were usually related to decrease in C with depth
(Will et al. 2010; Baldrian et al. 2011). On the contrary,
here, bacterial and fungal b-diversities did not change in
vegetated soils with depth although soil C decreased.
Micro-organisms present in the Damma glacier forefield
must thrive under C limitation due to seasonal fluctua-
tions (Lazzaro et al. 2012). Thus, variation in soil C with
depth does not constitute a determining factor structuring
the bacterial and fungal communities in relatively young
soils (<110 years) formed after glacier retreat.
Surprisingly, we observed shifts in bacterial and fun-
gal b-diversities between depths in the barren (10 years)
and sparsely vegetated (60 years) soils. These changes
could be partly attributed to changes in soil moisture
and texture, particularly silt, with depth. Zumsteg et al.
(2013) already reported that bacterial and fungal com-
munities present in barren soils were drastically
affected by fluctuations in soil moisture. Extreme drying
events occur in barren soils due to high temperature
and solar radiations (Zumsteg et al. 2011). Fluctuations
in soil moisture might affect carbon and nutrient avail-
ability, which influences in turn the microbial commu-
nity structure and activity (Brockett et al. 2012; Zumsteg
et al. 2013). In addition, we observed a decrease in silt
with depth of the barren soils, which could also influ-
ence microbial communities by modifying soil moisture
and nutrient availability (Lauber et al. 2008). Although
we could not clearly identify the main environmental
driver structuring the microbial communities with
depth of the barren soils, our study suggests that
changes in soil moisture and texture affect bacterial and
fungal community structures in barren and sparsely
vegetated soils.
Our indicator species analysis allowed us to identify
characteristic OTUs associated with a particular depth
and thus leading to changes in observed multivariate
patterns. For example, an OTU affiliated to the
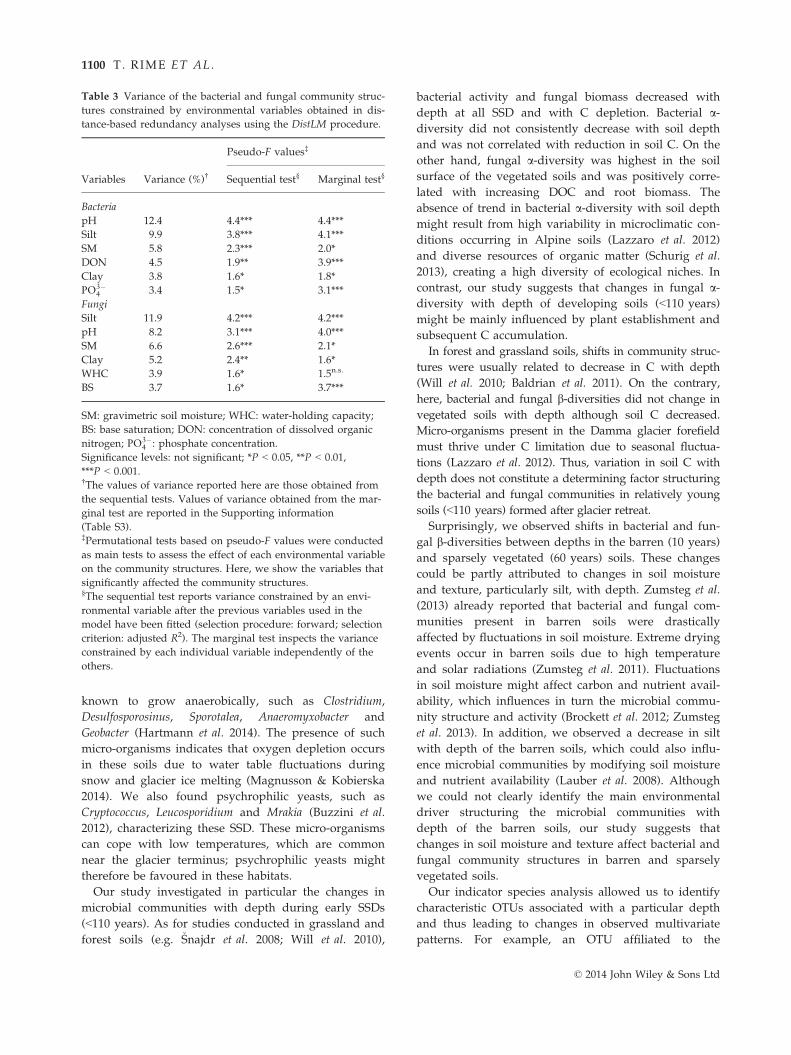
Table 3 Variance of the bacterial and fungal community struc-
tures constrained by environmental variables obtained in dis-
tance-based redundancy analyses using the DistLM procedure.
Variables Variance (%)†
Pseudo-F values‡
Sequential test§ Marginal test§
Bacteria
pH 12.4 4.4*** 4.4***
Silt 9.9 3.8*** 4.1***
SM 5.8 2.3*** 2.0*
DON 4.5 1.9** 3.9***
Clay 3.8 1.6* 1.8*
PO3�4 3.4 1.5* 3.1***
Fungi
Silt 11.9 4.2*** 4.2***
pH 8.2 3.1*** 4.0***
SM 6.6 2.6*** 2.1*
Clay 5.2 2.4** 1.6*
WHC 3.9 1.6* 1.5n.s.
BS 3.7 1.6* 3.7***
SM: gravimetric soil moisture; WHC: water-holding capacity;
BS: base saturation; DON: concentration of dissolved organic
nitrogen; PO3�4 : phosphate concentration.
Significance levels: not significant; *P < 0.05, **P < 0.01,
***P < 0.001.†The values of variance reported here are those obtained from
the sequential tests. Values of variance obtained from the mar-
ginal test are reported in the Supporting information
(Table S3).‡Permutational tests based on pseudo-F values were conducted
as main tests to assess the effect of each environmental variable
on the community structures. Here, we show the variables that
significantly affected the community structures.§The sequential test reports variance constrained by an envi-
ronmental variable after the previous variables used in the
model have been fitted (selection procedure: forward; selection
criterion: adjusted R2). The marginal test inspects the variance
constrained by each individual variable independently of the
others.
© 2014 John Wiley & Sons Ltd
1100 T. RIME ET AL.
Gemmatimonadetes was associated with the lower (5 and
20 cm) depths of the barren soils. In addition, this phy-
lum was particularly abundant in these depths (up to
8%, Fig. S3, Supporting information). Representatives of
this phylum were also found in glacier forefields
(Zumsteg et al. 2012; Bajerski & Wagner 2013), alpine
and arid environments (DeBruyn & Nixon 2011) as well
as agricultural soils (Chaudhry et al. 2012). Zeng et al.
(2014) recently isolated a photoheterotrophic representa-
tive of this phylum from a freshwater lake, suggesting
that this phylum has broad physiological potentials.
Their widespread distribution and their various metab-
olism types suggest that they can colonize different
environments under various climatic conditions. How-
ever, their ecological functions are hardly known
because they have been rarely cultivated (Zhang 2003;
DeBruyn et al. 2013; Zeng et al. 2014). Our indicator spe-
cies analysis also revealed a mucilaginous Cyanobacte-
rium affiliated to the genus Phormidium in the soil
surface. Phormidium isolates retain water in soil and
produce pigments and sheath protecting them against
high UV exposure (Janatkov�a et al. 2013). High UV radi-
ation also puts high selective pressure on microbial
communities in unvegetated environments, such as gla-
cier forefields (Frey et al. 2013), rocks (Sigler et al. 2003)
and desert soil crusts (Garcia-Pichel et al. 2003), which
leads to the selection of UV-resistant micro-organisms,
such as Cyanobacteria (Freeman et al. 2009). In our study,
cyanobacterial a-diversity and abundance were highest
in the surface of the barren soils and decreased with
soil depth. The analysis of both our environmental vari-
ables and bacterial indicator OTUs therefore suggests
that fluctuations in water regime and high UV radiation
at the soil surface influence the microbial community
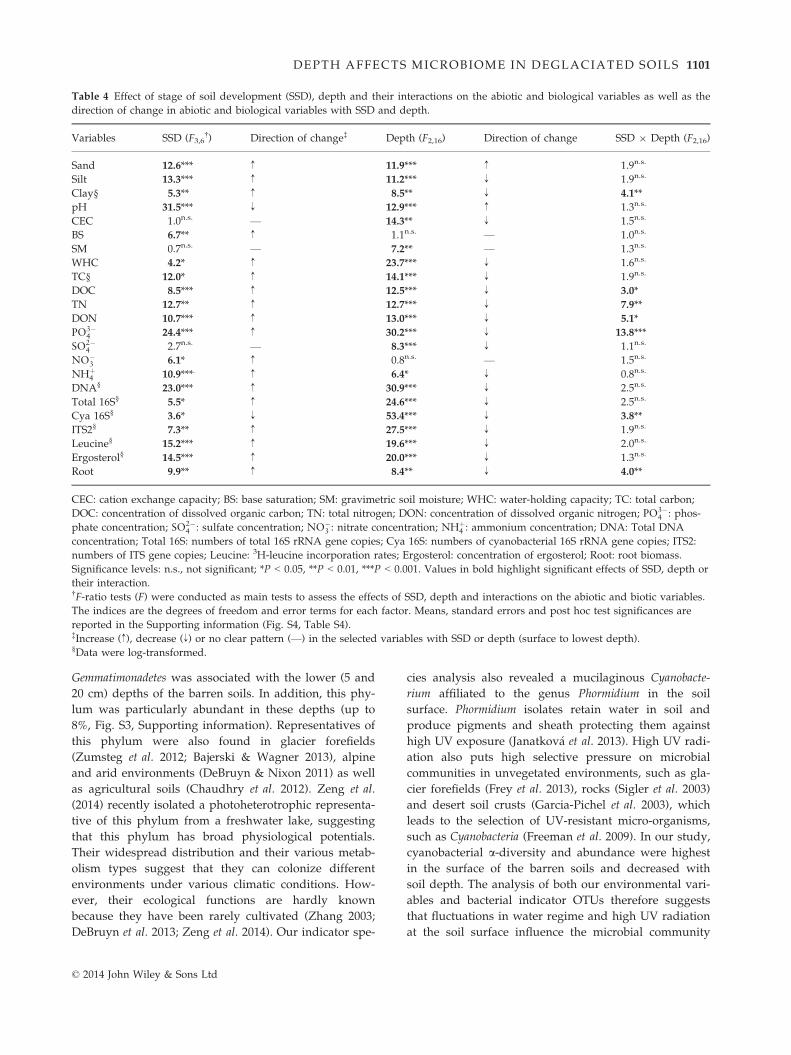
Table 4 Effect of stage of soil development (SSD), depth and their interactions on the abiotic and biological variables as well as the
direction of change in abiotic and biological variables with SSD and depth.
Variables SSD (F3,6†) Direction of change‡ Depth (F2,16) Direction of change SSD 9 Depth (F2,16)
Sand 12.6*** ↑ 11.9*** ↑ 1.9n.s.
Silt 13.3*** ↑ 11.2*** ↓ 1.9n.s.
Clay§ 5.3** ↑ 8.5** ↓ 4.1**
pH 31.5*** ↓ 12.9*** ↑ 1.3n.s.
CEC 1.0n.s. — 14.3** ↓ 1.5n.s.
BS 6.7** ↑ 1.1n.s. — 1.0n.s.
SM 0.7n.s. — 7.2** — 1.3n.s.
WHC 4.2* ↑ 23.7*** ↓ 1.6n.s.
TC§ 12.0* ↑ 14.1*** ↓ 1.9n.s.
DOC 8.5*** ↑ 12.5*** ↓ 3.0*
TN 12.7** ↑ 12.7*** ↓ 7.9**
DON 10.7*** ↑ 13.0*** ↓ 5.1*
PO3�4 24.4*** ↑ 30.2*** ↓ 13.8***
SO2�4 2.7n.s. — 8.3*** ↓ 1.1n.s.
NO�3 6.1* ↑ 0.8n.s. — 1.5n.s.
NHþ4 10.9***. ↑ 6.4* ↓ 0.8n.s.
DNA§ 23.0*** ↑ 30.9*** ↓ 2.5n.s.
Total 16S§ 5.5* ↑ 24.6*** ↓ 2.5n.s.
Cya 16S§ 3.6* ↓ 53.4*** ↓ 3.8**
ITS2§ 7.3** ↑ 27.5*** ↓ 1.9n.s.
Leucine§ 15.2*** ↑ 19.6*** ↓ 2.0n.s.
Ergosterol§ 14.5*** ↑ 20.0*** ↓ 1.3n.s.
Root 9.9** ↑ 8.4** ↓ 4.0**
CEC: cation exchange capacity; BS: base saturation; SM: gravimetric soil moisture; WHC: water-holding capacity; TC: total carbon;
DOC: concentration of dissolved organic carbon; TN: total nitrogen; DON: concentration of dissolved organic nitrogen; PO3�4 : phos-
phate concentration; SO2�4 : sulfate concentration; NO�
3 : nitrate concentration; NHþ4 : ammonium concentration; DNA: Total DNA
concentration; Total 16S: numbers of total 16S rRNA gene copies; Cya 16S: numbers of cyanobacterial 16S rRNA gene copies; ITS2:
numbers of ITS gene copies; Leucine: 3H-leucine incorporation rates; Ergosterol: concentration of ergosterol; Root: root biomass.
Significance levels: n.s., not significant; *P < 0.05, **P < 0.01, ***P < 0.001. Values in bold highlight significant effects of SSD, depth or
their interaction.†F-ratio tests (F) were conducted as main tests to assess the effects of SSD, depth and interactions on the abiotic and biotic variables.
The indices are the degrees of freedom and error terms for each factor. Means, standard errors and post hoc test significances are
reported in the Supporting information (Fig. S4, Table S4).‡Increase (↑), decrease (↓) or no clear pattern (—) in the selected variables with SSD or depth (surface to lowest depth).§Data were log-transformed.
© 2014 John Wiley & Sons Ltd
DEPTH AFFECTS MICROBIOME IN DEGLACIATED SOILS 1101
structures within the profile of barren and sparsely veg-
etated soils.
Plant colonization is a determining factor shaping
microbial community structures in glacier forefields
(Jumpponen 2003; Blaalid et al. 2012; Knelman et al.
2012; Schulz et al. 2013; Brown & Jumpponen 2014).
Our study further indicates that plant establishment
influences the vertical distribution of bacterial and fun-
gal communities in the sparsely vegetated soils. As soil
progressively becomes vegetated, arbuscular mycorrhi-
zas, such as OTUs affiliated to Archaeosporaceae and
Glomeraceae, are particularly present in lower depths
where roots are most abundant. Following the establish-
ment of plants and higher root biomass in lower
Otu3103Otu4470
Otu0124Otu0270Otu0653Otu1059Otu1205Otu1514Otu1521Otu1689Otu2293Otu2501Otu2664Otu2836Otu3113Otu3148Otu3344Otu3820Otu3858Otu3921Otu4303Otu4540Otu4623Otu5100Otu5261Otu5394Otu6048
Otu4089Otu5700Otu6427
Otu1779Otu3953Otu4312
Otu0445Otu2775Otu3574
Otu0150Otu3938
Otu3561
Otu0837
Otu2026Otu2214Otu2489Otu6389
Otu1646Otu5757
Azospirillum Otu2491Bosea Otu4965
Magnetospirillum Otu2638Rhizobium Otu0246
Telmatospirillum Otu6807Rhodoplanes Otu5388Burkholderia Otu2475
Collimonas Otu6471Cupriavidus Otu3675
Massilia Otu4175Methylotenera Otu5825Polaromonas Otu6803
Otu2957Otu3288
Anaeromyxobacter Otu4277Geobacter Otu2403
Rhodanobacter Otu4340Aquicella Otu6019
Luteolibacter Otu0615
Otu5637
Otu5711Otu6085
Acidobacteria
Actinobacteria
Bacteroidetes
Firmicutes
Gemmatimonadetes
Planctomycetes
Alphaproteobacteria
Betaproteobacteria
DeltaproteobacteriaGammaproteobacteriaVerrocomicrobia
Candidatus KoribacterCandidatus Koribacter
Otu0002Candidatus SolibacterCandidatus SolibacterCandidatus SolibacterCandidatus SolibacterCandidatus SolibacterCandidatus SolibacterCandidatus SolibacterCandidatus SolibacterCandidatus SolibacterCandidatus SolibacterCandidatus SolibacterCandidatus SolibacterCandidatus SolibacterCandidatus SolibacterCandidatus Solibacter
Candidatus SolibacterCandidatus Solibacter
Candidatus Solibacter
Candidatus Solibacter
Candidatus SolibacterCandidatus SolibacterCandidatus SolibacterCandidatus Solibacter
Candidatus Solibacter
Candidatus SolibacterCandidatus Solibacter
Otu3051ArthrobacterArthrobacterArthrobacterArthrobacter
Catenulispora Otu2231Phycicoccus Otu5386
CytophagaOtu3193Otu1131
Propionicimonas
CytophagaCytophagaCytophaga
Flavobacterium Otu2258Hymenobacter Otu2186
Bacillus Otu0250BacillusBacillusBacillus
Otu0082ClostridiumClostridiumClostridium
DesulfosporosinusDesulfosporosinus
Otu0159Paenibacillus Otu0326Sporosarcina Otu6557
Sporotalea Otu0080Sporotalea
Gemmatimonas Otu1052GemmatimonasGemmatimonasGemmatimonasGemmatimonas
Gemmata Otu0060Planctomyces
Relative abundance(%)
SSD (years)10 60 80 110
0.0 0.4 0.8
Indicator values<0.250.50–0.75
0.25–0.50>0.75
Otu0885PlanctomycesPlanctomyces
Chthoniobacter Otu2155ChthoniobacterChthoniobacter
Otu3741MC18MC18
Otu4053OpitutusOpitutusOpitutus
Fig. 3 Bacterial genera identified as
indicator taxa significantly (q < 0.1) asso-
ciated with a stage of soil development
(SSD) or a combination of SSD. The bars
represent the cumulative relative abun-
dance of each indicator OTU in all the
samples. The size of each circle defines
the association strength (indicator value)
of a particular OTU with the different
SSD, such as 0–0.25: not characteristic;
0.25–0.5: weakly characteristic; 0.5–0.75:characteristic; 0.75–1.0: strongly charac-
teristic. The taxonomic path, indicator
values, P-values, q-values of all bacterial
indicator OTUs are reported in Table S6
(Supporting information).
© 2014 John Wiley & Sons Ltd
1102 T. RIME ET AL.
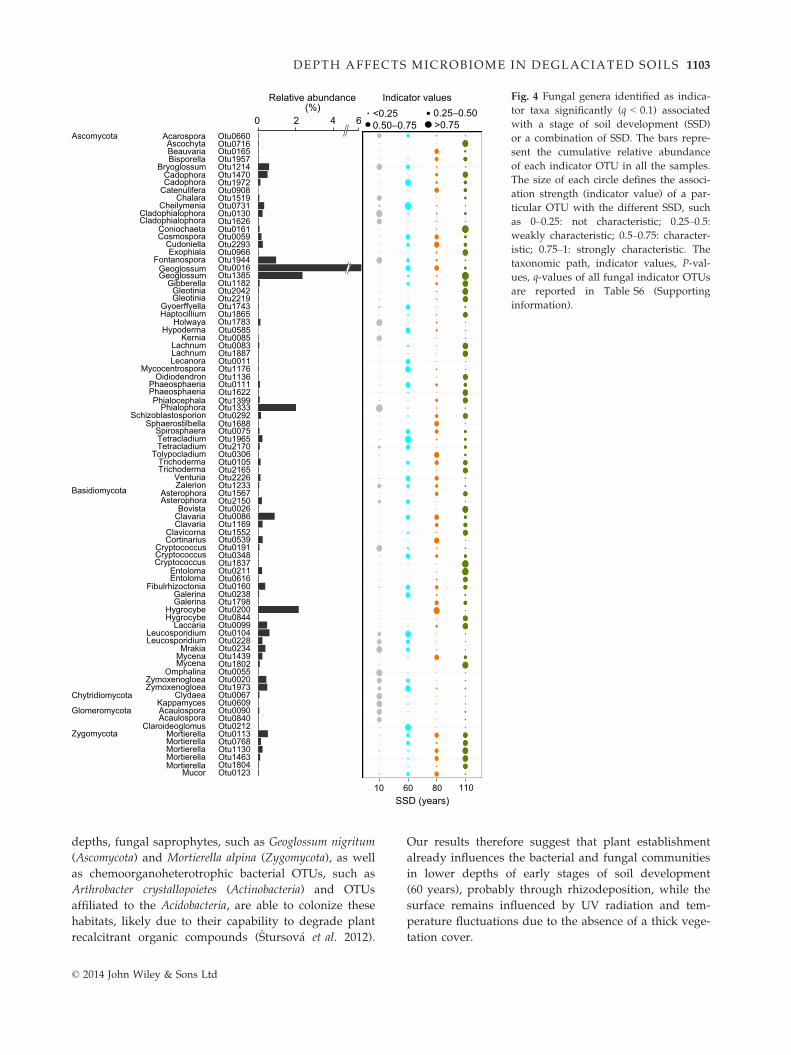
depths, fungal saprophytes, such as Geoglossum nigritum
(Ascomycota) and Mortierella alpina (Zygomycota), as well
as chemoorganoheterotrophic bacterial OTUs, such as
Arthrobacter crystallopoietes (Actinobacteria) and OTUs
affiliated to the Acidobacteria, are able to colonize these
habitats, likely due to their capability to degrade plant
recalcitrant organic compounds (�Stursov�a et al. 2012).
Our results therefore suggest that plant establishment
already influences the bacterial and fungal communities
in lower depths of early stages of soil development
(60 years), probably through rhizodeposition, while the
surface remains influenced by UV radiation and tem-
perature fluctuations due to the absence of a thick vege-
tation cover.
Otu0165Otu1957Otu1214
AscochytaBeauvariaBisporella
Bryoglossum
CatenuliferaChalara
CheilymeniaCladophialophora
ConiochaetaCosmospora
CudoniellaExophiala
FontanosporaGeoglossum
Gleotinia
GyoerffyellaHaptocillium
HypodermaKernia
Lachnum
LecanoraMycocentrospora
OidiodendronPhaeosphaeria
PhialocephalaPhialophora
SchizoblastosporionSphaerostilbella
SpirosphaeraTetracladium
TolypocladiumTrichoderma
VenturiaZalerion
Asterophora
BovistaClavaria
ClavicornaCortinarius
Cryptococcus
Entoloma
FibulrhizoctoniaGalerina
Hygrocybe
LaccariaLeucosporidium
MrakiaMycena
OmphalinaZymoxenogloea
ClydaeaKappamycesAcaulospora
ClaroideoglomusMortierella
Mucor
Acarospora Otu0660Otu0716
Otu1470Otu1972Otu0908Otu1519Otu0731Otu0130Otu1626Otu0161Otu0059Otu2293Otu0966Otu1944
Otu1385Otu1182Otu2042Otu2219Otu1743Otu1865Otu1783Otu0585Otu0085Otu0083Otu1887Otu0011Otu1176Otu1136Otu0111Otu1622Otu1399Otu1333Otu0292Otu1688Otu0075Otu1965Otu2170Otu0306Otu0105Otu2165Otu2226Otu1233Otu1567Otu2150Otu0026Otu0086Otu1169Otu1552Otu0539Otu0191Otu0348Otu1837Otu0211Otu0616Otu0160Otu0238Otu1798Otu0200Otu0844Otu0099Otu0104Otu0228Otu0234Otu1439Otu1802Otu0055Otu0020Otu1973Otu0067Otu0609Otu0090Otu0840Otu0212Otu0113Otu0768Otu1130Otu1463Otu1804Otu0123
Holwaya
Gibberella
Otu0016
Ascomycota
Relative abundance(%)
0 2 4 6<0.25 0.25–0.500.50–0.75 >0.75
Indicator values
SSD (years)10 60 80 110
Basidiomycota
Chytridiomycota
Glomeromycota
Zygomycota
CadophoraCadophora
Cladophialophora
Geoglossum
Gleotinia
Lachnum
Phaeosphaeria
Tetracladium
Trichoderma
Asterophora
Clavaria
CryptococcusCryptococcus
Entoloma
Galerina
Hygrocybe
Leucosporidium
Mycena
Zymoxenogloea
Acaulospora
MortierellaMortierellaMortierellaMortierella
Fig. 4 Fungal genera identified as indica-
tor taxa significantly (q < 0.1) associated
with a stage of soil development (SSD)
or a combination of SSD. The bars repre-
sent the cumulative relative abundance
of each indicator OTU in all the samples.
The size of each circle defines the associ-
ation strength (indicator value) of a par-
ticular OTU with the different SSD, such
as 0–0.25: not characteristic; 0.25–0.5:weakly characteristic; 0.5–0.75: character-istic; 0.75–1: strongly characteristic. The
taxonomic path, indicator values, P-val-
ues, q-values of all fungal indicator OTUs
are reported in Table S6 (Supporting
information).
© 2014 John Wiley & Sons Ltd
DEPTH AFFECTS MICROBIOME IN DEGLACIATED SOILS 1103
© 2014 John Wiley & Sons Ltd
1104 T. RIME ET AL.
In conclusion, our study corroborates findings from
numerous studies that have shown microbial succession
during soil development in glacier forefields. However,
our approach combining high-throughput sequencing
and the identification of indicator species revealed that
bacterial and fungal community structures differed
along the profiles of barren and sparsely vegetated soils
due to differences in soil texture, fluctuations in water
regime and high UV exposure at the soil surface. As soil
becomes vegetated, bacterial and fungal communities in
lower depths shift towards plant-related micro-organ-
isms. In the later stages of soil ecosystems, the bacterial
and fungal communities did not differ between depths.
Soil C, usually thought as a determining factor structur-
ing microbial communities with depth, had a minor
influence on bacterial and fungal diversities but was cor-
related to the increasing microbial biomass and activity
in surface during soil development. With the disintegra-
tion of ice biomes worldwide, the comprehension of soil
formation processes in both time and space is of extreme
importance. In that respect, our study unravelled only
part of the vertical stratification of micro-organisms dur-
ing soil development and should therefore encourage
further investigations.
Acknowledgements
This study was funded by the Swiss National Science Foun-
dation (SNSF) under the Grant number: 31003A-138321. The
authors gratefully thank Dr. E. B�a�ath, who hosted TR during
his visit at Lund University to measure 3H-leucine incorpora-
tion rates and ergosterol. We also thank the Central Labora-
tory, Roger K€ochli, Noureddine Hajjar and Beat Stierli (Swiss
Federal Research Institute WSL) for the soil analyses and
help in the laboratory. We also wish to acknowledge the
Genetic Diversity Centre (GDC) of the ETH Zurich and the
contribution of scientists at the McGill University and
G�enome Qu�ebec Innovation Center, Montr�eal, Canada, for
the 454-pyrosequencing.
References
Abarenkov K, Nilsson R, Larsson K et al. (2010) The UNITE
database for molecular identification of fungi–recentupdates and future perspectives. New Phytologist, 186, 281–285.
Amann R, Ludwig W, Schleifer K (1995) Phylogenetic identifi-
cation and in situ detection of individual microbial cells
without cultivation. Microbiological Reviews, 59, 143–196.Anderson MJ (2001) A new method for non-parametric multi-
variate analysis of variance. Austral Ecology, 26, 32–46.
B�a�ath E (1994) Measurement of protein synthesis by soil bacte-
rial assemblages with the leucine incorporation technique.
Biology and Fertility of Soils, 17, 147–153.B�a�ath E (2001) Estimation of fungal growth rates in soil using
14C-acetate incorporation into ergosterol. Soil Biology and Bio-
chemistry, 33, 2011–2018.B�a�ath E, Pettersson M, S€oderberd KH (2001) Adaptation of a
rapid and economical microcentrifugation method to mea-
sure thymidine and leucine incorporation by soil bacteria.
Soil Biology and Biochemistry, 33, 1571–1574.Bajerski F, Wagner D (2013) Bacterial succession in Antarctic
soils of two glacier forefields on Larsemann Hills, East Ant-
arctica. FEMS Microbiology Ecology, 85, 128–145.Baldrian P, Kolar�ık M, �Stursov�a M (2011) Active and total
microbial communities in forest soil are largely different and
highly stratified during decomposition. The ISME Journal, 6,
248–258.Bernasconi SM (2008) Weathering, soil formation and initial
ecosystem evolution on a glacier forefield: a case study from
the Damma Glacier, Switzerland. Mineralogical Magazine, 72,
19–22.Bernasconi SM, Bauder A, Boudron B et al. (2011) Chemical
and biological gradients along the Damma glacier soil chron-
osequence, Switzerland. Vadose Zone Journal, 10, 867–883.Blaalid R, Carlsen T, Kumar S et al. (2012) Changes in the root-
associated fungal communities along a primary succession
gradient analysed by 454 pyrosequencing. Molecular Ecology,
21, 1897–1908.Brockett BFT, Prescott CE, Grayston SJ (2012) Soil moisture is
the major factor influencing microbial community structure
and enzyme activities across seven biogeoclimatic zones in
western Canada. Soil Biology and Biochemistry, 44, 9–20.Brown SP, Jumpponen A (2014) Contrasting primary succes-
sional trajectories of fungi and bacteria in retreating glacier
soils. Molecular Ecology, 23, 481–497.Buzzini P, Branda E, Goretti M, Turchetti B (2012) Psychro-
philic yeasts from worldwide glacial habitats: diversity,
adaptation strategies and biotechnological potential. FEMS
Microbiology Ecology, 82, 217–241.Chaudhry V, Rehman A, Mishra A, Chauhan PS, Nautiyal CS
(2012) Changes in bacterial community structure of agricul-
tural land due to long-term organic and chemical amend-
ments. Microbial Ecology, 64, 450–460.Clarke KR, Gorley RN (2006) PRIMER v6: User Manual/Tutorial.
PRIMER-E, Plymouth.
De C�aceres M, Legendre P, Moretti M (2010) Improving indica-
tor species analysis by combining groups of sites. Oikos, 119,
1674–1684.De Mendiburu F (2012) Agricolae: Statistical Procedures for Agri-
cultural Research. R package version 1.1-6.
DeBruyn J, Nixon L (2011) Global biogeography and quantita-
tive seasonal dynamics of Gemmatimonadetes in soil. Applied
and Environmental Microbiology, 77, 6295–6300.DeBruyn JM, Fawaz MN, Peacock AD et al. (2013) Gemmati-
rosa kalamazoonesis gen. nov., sp. nov., a member of the
Fig. 5 Bacterial and fungal OTUs identified as indicator taxa significantly (q < 0.1) associated with the soil depths of the 10- and 60-
year-old soils. The bars represent the cumulative relative abundance of each indicator OTU in all the samples. The size of each circle
defines the association strength (indicator value) of a particular OTU with the different soil depths, such as 0–0.25: not characteristic;0.25–0.5: weakly characteristic; 0.5–0.75: characteristic; 0.75–1: strongly characteristic. The taxonomic path, indicator values, P-values
and q-values of all bacterial and fungal indicator OTUs are reported in Table S8 (Supporting information).
© 2014 John Wiley & Sons Ltd
DEPTH AFFECTS MICROBIOME IN DEGLACIATED SOILS 1105
rarely-cultivated bacterial phylum Gemmatimonadetes. The
Journal of General and Applied Microbiology, 59, 305–312.DeSantis TZ, Hugenholtz P, Larsen N et al. (2006) Greengenes,
a chimera-checked 16S rRNA gene database and workbench
compatible with ARB. Applied and Environmental Microbiology,
72, 5069–5072.Edgar R, Haas B, Clemente J, Quince C, Knight R (2011) UCHI-
ME improves sensitivity and speed of chimera detection. Bio-
informatics, 27, 2194–2200.Eilers KG, Debenport S, Anderson S, Fierer N (2012) Digging
deeper to find unique microbial communities: the strong
effect of depth on the structure of bacterial and archaeal
communities in soil. Soil Biology and Biochemistry, 50, 58–65.Ekelund F, R�unn R, Christensen S (2001) Distribution with
depth of protozoa, bacteria and fungi in soil profiles from
three Danish forest sites. Soil Biology and Biochemistry, 33,
475–481.Ettema C, Wardle D (2002) Spatial soil ecology. Trends in Ecol-
ogy & Evolution, 17, 177–183.Favre J (1960) Catalogue descriptif des champignons sup�erieurs
de la zone subalpine du Parc national Suisse. Ergebnisse der
wissenschaftlichen Untersuchungen des schweizerischen National-
parks, 6, 323–610.Freeman KR, Pescador MY, Reed SC et al. (2009) Soil CO2 flux
and photoautotrophic community composition in high-eleva-
tion, “barren” soil. Environmental Microbiology, 11, 674–686.Frey B, Niklaus PA, Kremer J, L€uscher P, Zimmermann S
(2011) Heavy-machinery traffic impacts methane emissions
as well as methanogen abundance and community structure
in oxic forest soils. Applied and Environmental Microbiology,
77, 6060–6068.Frey B, B€uhler L, Schmutz S, Zumsteg A, Furrer G (2013)
Molecular characterization of phototrophic microorganisms
in the forefield of a receding glacier in the Swiss Alps. Envi-
ronmental Research Letters, 8, 015033.
Garcia-Pichel F, Johnson SL, Youngkin D, Belnap J (2003)
Small-scale vertical distribution of bacterial biomass and
diversity in biological soil crusts from arid lands in the Colo-
rado Plateau. Microbial Ecology, 46, 312–321.Gee G, Bauder J (1986) Part 1. Physical and mineralogical
methods. In: Methods of Soil Analysis (ed. Klute A), pp. 383–411. American Society of Agronomy, Madison, Wisconsin.
Gobet A, Quince C, Ramette A (2010) Multivariate Cutoff Level
Analysis (MultiCoLA) of large community data sets. Nucleic
Acids Research, 38, e155.
Good I (1953) The population frequencies of species and the
estimation of population parameters. Biometrika, 40, 237–264.G€oransson H, Olde Venterink H, B�a�ath E (2011) Soil bacterial
growth and nutrient limitation along a chronosequence from
a glacier forefield. Soil Biology and Biochemistry, 43, 1333–1340.
Guelland K, Hagedorn F, Smittenberg RH et al. (2013) Evolu-
tion of carbon fluxes during initial soil formation along the
forefield of Damma glacier, Switzerland. Biogeochemistry, 113,
545–561.Haichar FEZ, Marol C, Berge O et al. (2008) Plant host habitat
and root exudates shape soil bacterial community structure.
The ISME Journal, 2, 1221–1230.Hansel CM, Fendorf S, Jardine PM, Francis CA (2008) Changes
in bacterial and archaeal community structure and functional
diversity along a geochemically variable soil profile. Applied
and Environmental Microbiology, 74, 1620–1633.Hao X, Jiang R, Chen T (2011) Clustering 16S rRNA for OTU
prediction: a method of unsupervised Bayesian clustering.
Bioinformatics, 27, 611–618.Hartmann AA, Buchmann N, Niklaus PA (2010a) A study of
soil methane sink regulation in two grasslands exposed to
drought and N fertilization. Plant and Soil, 342, 265–275.Hartmann M, Howes CG, Abarenkov K, Mohn WW, Nilsson
RH (2010b) V-Xtractor: an open-source, high-throughput
software tool to identify and extract hypervariable regions of
small subunit (16S/18S) ribosomal RNA gene sequences.
Journal of Microbiological Methods, 83, 250–253.Hartmann M, Howes CG, VanInsberghe D et al. (2012) Signifi-
cant and persistent impact of timber harvesting on soil
microbial communities in Northern coniferous forests. The
ISME Journal, 6, 2199–2218.Hartmann M, Niklaus PA, Zimmermann S et al. (2014) Resis-
tance and resilience of the forest soil microbiome to logging-
associated compaction. The ISME Journal, 8, 226–244.Holm S (1979) A simple sequentially rejective multiple test pro-
cedure. Scandinavian Journal of Statistics, 6, 65–70.Janatkov�a K, Reh�akov�a K, Dole�zal J et al. (2013) Community
structure of soil phototrophs along environmental gradients
in arid Himalaya. Environmental Microbiology, 15, 2505–2516.Jumpponen A (2003) Soil fungal community assembly in a pri-
mary successional glacier forefront ecosystem as inferred
from rDNA sequence analyses. New Phytologist, 158, 569–578.
Jumpponen A, Brown SP, Trappe JM, Cazares E, Str€ommer R
(2012) Twenty years of research on fungus-microbe-plant
interactions on Lyman Glacier forefront – lessons learned
and questions yet unanswered. Fungal Ecology, 5, 430–442.Knelman JE, Legg TM, O’Neill SP et al. (2012) Bacterial com-
munity structure and function change in association with
colonizer plants during early primary succession in a glacier
forefield. Soil Biology and Biochemistry, 46, 172–180.Lauber CL, Strickland MS, Bradford MA, Fierer N (2008) The
influence of soil properties on the structure of bacterial and
fungal communities across land-use types. Soil Biology and
Biochemistry, 40, 2407–2415.Lazzaro A, Brankatschk R, Zeyer J (2012) Seasonal dynamics of
nutrients and bacterial communities in unvegetated alpine
glacier forefields. Applied Soil Ecology, 53, 10–22.Legendre P, Anderson M (1999) Distance-based redundancy
analysis: testing multispecies responses in multifactorial eco-
logical experiments. Ecological Monographs, 69, 1–24.Lopez MJ, Vargas-Garc�ıa MDC, Su�arez-Estrella F et al. (2007)
Lignocellulose-degrading enzymes produced by the ascomy-
cete Coniochaeta ligniaria and related species: application for
a lignocellulosic substrate treatment. Enzyme and Microbial
Technology, 40, 794–800.Magnusson J, Kobierska F (2014) Melt water driven stream and
groundwater stage fluctuations on a glacier forefield (Dam-
magletscher, Switzerland). Hydrological Processes, 28, 823–836.Margulies M, Egholm M, Altman W et al. (2005) Genome
sequencing in microfabricated high-density picolitre reactors.
Nature, 437, 376–380.Marhan S, Philippot L, Bru D et al. (2011) Abundance and
activity of nitrate reducers in an arable soil are more affected
© 2014 John Wiley & Sons Ltd
1106 T. RIME ET AL.
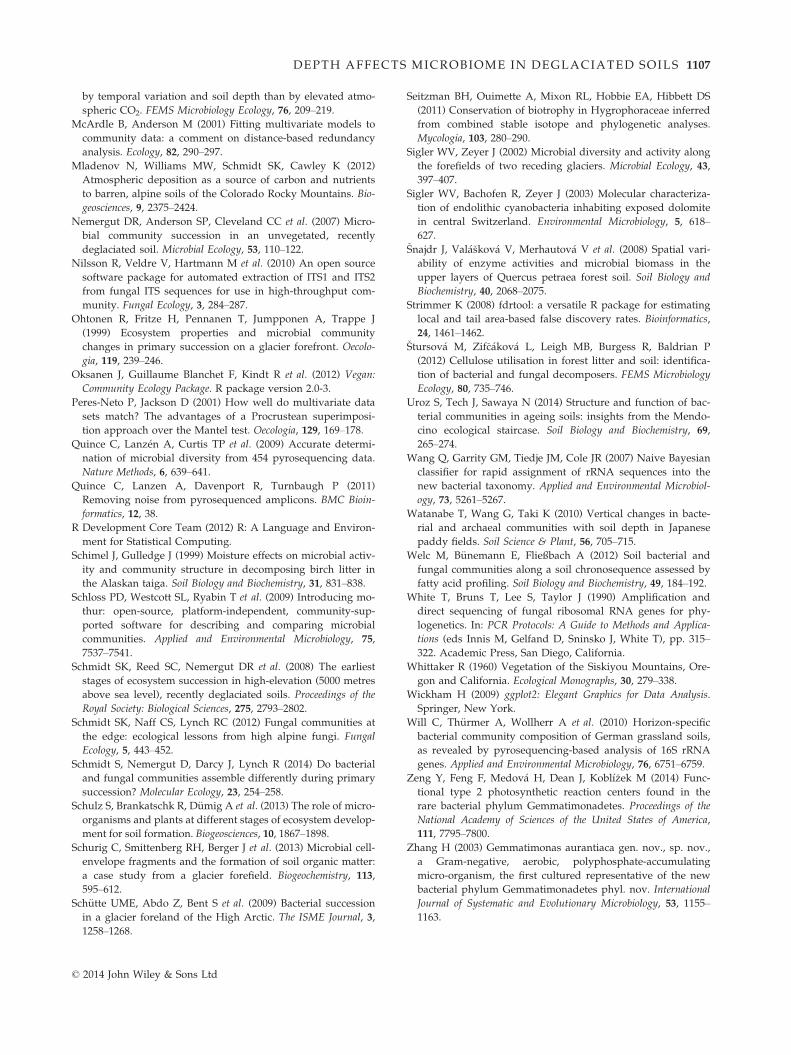
by temporal variation and soil depth than by elevated atmo-
spheric CO2. FEMS Microbiology Ecology, 76, 209–219.McArdle B, Anderson M (2001) Fitting multivariate models to
community data: a comment on distance-based redundancy
analysis. Ecology, 82, 290–297.Mladenov N, Williams MW, Schmidt SK, Cawley K (2012)
Atmospheric deposition as a source of carbon and nutrients
to barren, alpine soils of the Colorado Rocky Mountains. Bio-
geosciences, 9, 2375–2424.Nemergut DR, Anderson SP, Cleveland CC et al. (2007) Micro-
bial community succession in an unvegetated, recently
deglaciated soil. Microbial Ecology, 53, 110–122.Nilsson R, Veldre V, Hartmann M et al. (2010) An open source
software package for automated extraction of ITS1 and ITS2
from fungal ITS sequences for use in high-throughput com-
munity. Fungal Ecology, 3, 284–287.Ohtonen R, Fritze H, Pennanen T, Jumpponen A, Trappe J
(1999) Ecosystem properties and microbial community
changes in primary succession on a glacier forefront. Oecolo-
gia, 119, 239–246.Oksanen J, Guillaume Blanchet F, Kindt R et al. (2012) Vegan:
Community Ecology Package. R package version 2.0-3.
Peres-Neto P, Jackson D (2001) How well do multivariate data
sets match? The advantages of a Procrustean superimposi-
tion approach over the Mantel test. Oecologia, 129, 169–178.Quince C, Lanz�en A, Curtis TP et al. (2009) Accurate determi-
nation of microbial diversity from 454 pyrosequencing data.
Nature Methods, 6, 639–641.Quince C, Lanzen A, Davenport R, Turnbaugh P (2011)
Removing noise from pyrosequenced amplicons. BMC Bioin-
formatics, 12, 38.
R Development Core Team (2012) R: A Language and Environ-
ment for Statistical Computing.
Schimel J, Gulledge J (1999) Moisture effects on microbial activ-
ity and community structure in decomposing birch litter in
the Alaskan taiga. Soil Biology and Biochemistry, 31, 831–838.Schloss PD, Westcott SL, Ryabin T et al. (2009) Introducing mo-
thur: open-source, platform-independent, community-sup-
ported software for describing and comparing microbial
communities. Applied and Environmental Microbiology, 75,
7537–7541.Schmidt SK, Reed SC, Nemergut DR et al. (2008) The earliest
stages of ecosystem succession in high-elevation (5000 metres
above sea level), recently deglaciated soils. Proceedings of the
Royal Society: Biological Sciences, 275, 2793–2802.Schmidt SK, Naff CS, Lynch RC (2012) Fungal communities at
the edge: ecological lessons from high alpine fungi. Fungal
Ecology, 5, 443–452.Schmidt S, Nemergut D, Darcy J, Lynch R (2014) Do bacterial
and fungal communities assemble differently during primary
succession? Molecular Ecology, 23, 254–258.Schulz S, Brankatschk R, D€umig A et al. (2013) The role of micro-
organisms and plants at different stages of ecosystem develop-
ment for soil formation. Biogeosciences, 10, 1867–1898.Schurig C, Smittenberg RH, Berger J et al. (2013) Microbial cell-
envelope fragments and the formation of soil organic matter:
a case study from a glacier forefield. Biogeochemistry, 113,
595–612.Sch€utte UME, Abdo Z, Bent S et al. (2009) Bacterial succession
in a glacier foreland of the High Arctic. The ISME Journal, 3,
1258–1268.
Seitzman BH, Ouimette A, Mixon RL, Hobbie EA, Hibbett DS
(2011) Conservation of biotrophy in Hygrophoraceae inferred
from combined stable isotope and phylogenetic analyses.
Mycologia, 103, 280–290.Sigler WV, Zeyer J (2002) Microbial diversity and activity along
the forefields of two receding glaciers. Microbial Ecology, 43,
397–407.Sigler WV, Bachofen R, Zeyer J (2003) Molecular characteriza-
tion of endolithic cyanobacteria inhabiting exposed dolomite
in central Switzerland. Environmental Microbiology, 5, 618–627.
�Snajdr J, Val�a�skov�a V, Merhautov�a V et al. (2008) Spatial vari-
ability of enzyme activities and microbial biomass in the
upper layers of Quercus petraea forest soil. Soil Biology and
Biochemistry, 40, 2068–2075.Strimmer K (2008) fdrtool: a versatile R package for estimating
local and tail area-based false discovery rates. Bioinformatics,
24, 1461–1462.�Stursov�a M, Zif�c�akov�a L, Leigh MB, Burgess R, Baldrian P
(2012) Cellulose utilisation in forest litter and soil: identifica-
tion of bacterial and fungal decomposers. FEMS Microbiology
Ecology, 80, 735–746.Uroz S, Tech J, Sawaya N (2014) Structure and function of bac-
terial communities in ageing soils: insights from the Mendo-
cino ecological staircase. Soil Biology and Biochemistry, 69,
265–274.Wang Q, Garrity GM, Tiedje JM, Cole JR (2007) Naive Bayesian
classifier for rapid assignment of rRNA sequences into the
new bacterial taxonomy. Applied and Environmental Microbiol-
ogy, 73, 5261–5267.Watanabe T, Wang G, Taki K (2010) Vertical changes in bacte-
rial and archaeal communities with soil depth in Japanese
paddy fields. Soil Science & Plant, 56, 705–715.Welc M, B€unemann E, Fließbach A (2012) Soil bacterial and
fungal communities along a soil chronosequence assessed by
fatty acid profiling. Soil Biology and Biochemistry, 49, 184–192.White T, Bruns T, Lee S, Taylor J (1990) Amplification and
direct sequencing of fungal ribosomal RNA genes for phy-
logenetics. In: PCR Protocols: A Guide to Methods and Applica-
tions (eds Innis M, Gelfand D, Sninsko J, White T), pp. 315–322. Academic Press, San Diego, California.
Whittaker R (1960) Vegetation of the Siskiyou Mountains, Ore-
gon and California. Ecological Monographs, 30, 279–338.Wickham H (2009) ggplot2: Elegant Graphics for Data Analysis.
Springer, New York.
Will C, Th€urmer A, Wollherr A et al. (2010) Horizon-specific
bacterial community composition of German grassland soils,
as revealed by pyrosequencing-based analysis of 16S rRNA
genes. Applied and Environmental Microbiology, 76, 6751–6759.Zeng Y, Feng F, Medov�a H, Dean J, Kobl�ı�zek M (2014) Func-
tional type 2 photosynthetic reaction centers found in the
rare bacterial phylum Gemmatimonadetes. Proceedings of the
National Academy of Sciences of the United States of America,
111, 7795–7800.Zhang H (2003) Gemmatimonas aurantiaca gen. nov., sp. nov.,
a Gram-negative, aerobic, polyphosphate-accumulating
micro-organism, the first cultured representative of the new
bacterial phylum Gemmatimonadetes phyl. nov. International
Journal of Systematic and Evolutionary Microbiology, 53, 1155–1163.
© 2014 John Wiley & Sons Ltd
DEPTH AFFECTS MICROBIOME IN DEGLACIATED SOILS 1107
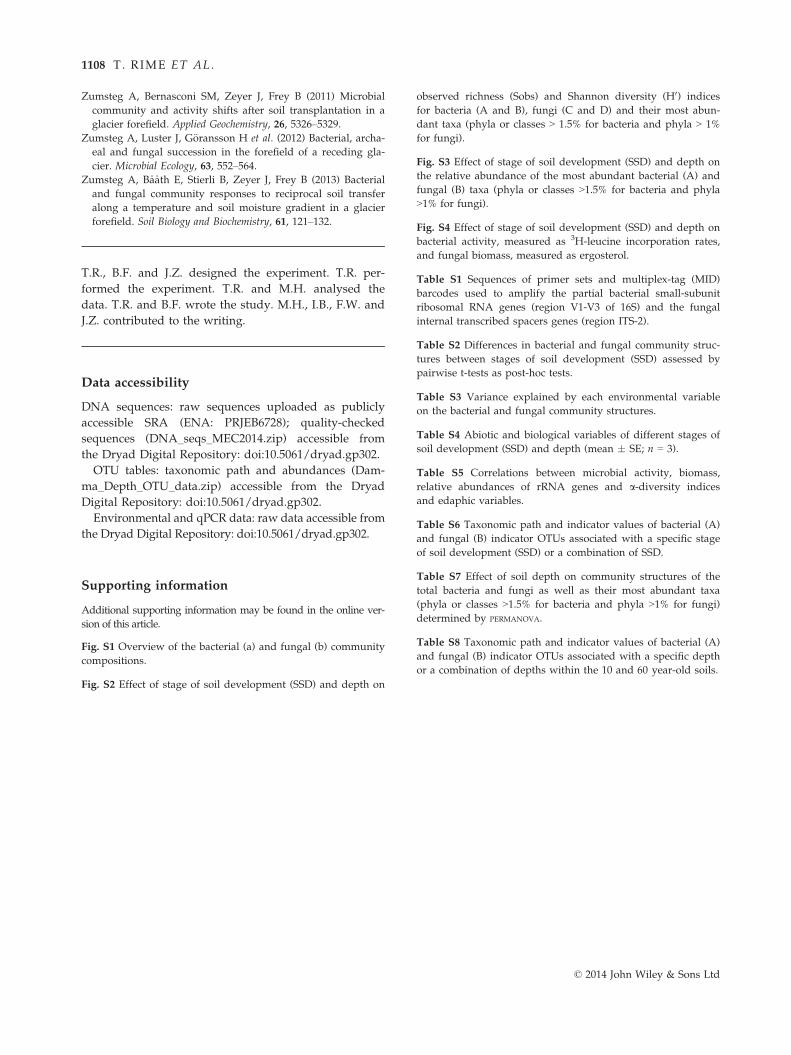
Zumsteg A, Bernasconi SM, Zeyer J, Frey B (2011) Microbial
community and activity shifts after soil transplantation in a
glacier forefield. Applied Geochemistry, 26, 5326–5329.Zumsteg A, Luster J, G€oransson H et al. (2012) Bacterial, archa-
eal and fungal succession in the forefield of a receding gla-
cier. Microbial Ecology, 63, 552–564.Zumsteg A, B�a�ath E, Stierli B, Zeyer J, Frey B (2013) Bacterial
and fungal community responses to reciprocal soil transfer
along a temperature and soil moisture gradient in a glacier
forefield. Soil Biology and Biochemistry, 61, 121–132.
T.R., B.F. and J.Z. designed the experiment. T.R. per-
formed the experiment. T.R. and M.H. analysed the
data. T.R. and B.F. wrote the study. M.H., I.B., F.W. and
J.Z. contributed to the writing.
Data accessibility
DNA sequences: raw sequences uploaded as publicly
accessible SRA (ENA: PRJEB6728); quality-checked
sequences (DNA_seqs_MEC2014.zip) accessible from
the Dryad Digital Repository: doi:10.5061/dryad.gp302.
OTU tables: taxonomic path and abundances (Dam-
ma_Depth_OTU_data.zip) accessible from the Dryad
Digital Repository: doi:10.5061/dryad.gp302.
Environmental and qPCR data: raw data accessible from
the Dryad Digital Repository: doi:10.5061/dryad.gp302.
Supporting information
Additional supporting information may be found in the online ver-
sion of this article.
Fig. S1 Overview of the bacterial (a) and fungal (b) community
compositions.
Fig. S2 Effect of stage of soil development (SSD) and depth on
observed richness (Sobs) and Shannon diversity (H0) indices
for bacteria (A and B), fungi (C and D) and their most abun-
dant taxa (phyla or classes > 1.5% for bacteria and phyla > 1%
for fungi).
Fig. S3 Effect of stage of soil development (SSD) and depth on
the relative abundance of the most abundant bacterial (A) and
fungal (B) taxa (phyla or classes >1.5% for bacteria and phyla
>1% for fungi).
Fig. S4 Effect of stage of soil development (SSD) and depth on
bacterial activity, measured as 3H-leucine incorporation rates,
and fungal biomass, measured as ergosterol.
Table S1 Sequences of primer sets and multiplex-tag (MID)
barcodes used to amplify the partial bacterial small-subunit
ribosomal RNA genes (region V1-V3 of 16S) and the fungal
internal transcribed spacers genes (region ITS-2).
Table S2 Differences in bacterial and fungal community struc-
tures between stages of soil development (SSD) assessed by
pairwise t-tests as post-hoc tests.
Table S3 Variance explained by each environmental variable
on the bacterial and fungal community structures.
Table S4 Abiotic and biological variables of different stages of
soil development (SSD) and depth (mean � SE; n = 3).
Table S5 Correlations between microbial activity, biomass,
relative abundances of rRNA genes and a-diversity indices
and edaphic variables.
Table S6 Taxonomic path and indicator values of bacterial (A)
and fungal (B) indicator OTUs associated with a specific stage
of soil development (SSD) or a combination of SSD.
Table S7 Effect of soil depth on community structures of the
total bacteria and fungi as well as their most abundant taxa
(phyla or classes >1.5% for bacteria and phyla >1% for fungi)
determined by PERMANOVA.
Table S8 Taxonomic path and indicator values of bacterial (A)
and fungal (B) indicator OTUs associated with a specific depth
or a combination of depths within the 10 and 60 year-old soils.
© 2014 John Wiley & Sons Ltd
1108 T. RIME ET AL.