Glacier recession and water resources in Peru’s Cordillera Blanca
17
Glacier recession and water resources in Peru’s Cordillera Blanca Michel BARAER, 1 Bryan G. MARK, 2 Jeffrey M. McKENZIE, 1 Thomas CONDOM, 3 Jeffrey BURY, 4 Kyung-In HUH, 2 Cesar PORTOCARRERO, 5 Jesu ´s GO ´ MEZ, 5 Sarah RATHAY 1 1 Department of Earth and Planetary Sciences, McGill University, Montre ´al, Quebec, Canada E-mail: [email protected] 2 Department of Geography, The Ohio State University, Columbus, OH, USA 3 Institut de Recherche pour le De ´veloppement (IRD), Miraflores, Peru 4 Department of Environmental Studies, University of California, Santa Cruz, CA, USA 5 Unidad de Glaciologı ´a y Recursos Hı ´dricos, Autoridad Nacional del Agua (ANA), Distrito de Independencia, Huaraz, Peru ABSTRACT. The tropical glaciers of the Cordillera Blanca, Peru, are rapidly retreating, resulting in complex impacts on the hydrology of the upper Rı ´o Santa watershed. The effect of this retreat on water resources is evaluated by analyzing historical and recent time series of daily discharge at nine measurement points. Using the Mann–Kendall nonparametric statistical test, the significance of trends in three hydrograph parameters was studied. Results are interpreted using synthetic time series generated from a hydrologic model that calculates hydrographs based on glacier retreat sequences. The results suggest that seven of the nine study watersheds have probably crossed a critical transition point, and now exhibit decreasing dry-season discharge. Our results suggest also that once the glaciers completely melt, annual discharge will be lower than present by 2–30% depending on the watershed. The retreat influence on discharge will be more pronounced during the dry season than at other periods of the year. At La Balsa, which measures discharge from the upper Rı ´o Santa, the glacier retreat could lead to a decrease in dry-season average discharge of 30%. 1. INTRODUCTION The retreat of mountain glaciers in response to ongoing climate change is expected to have a major impact on alpine environments globally (Huss and others, 2010). Many studies predict detrimental societal, ecological and econom- ic impacts due to glacier retreat-related hydrological changes (Braun and others, 2000; Jansson and others, 2003; Hannah and others, 2007; Vergara and others, 2007; Brown and others, 2010; Kistin and others, 2010; Uehlinger and others, 2010). In the Cordillera Blanca, Peru, coupled natural–human studies have shown that, in the context of an increasing regional population, the vulner- ability of Andean society is tied directly to water availability (Mark and others, 2010; Bury and others, 2011). However, evaluating the influence of meltwater runoff on large river basin flows in different environments remains a major scientific challenge (Milner and others, 2009; Kaser and others, 2010). This challenge is often amplified by logistical difficulties in gathering long-term, reliable measurements like those faced in high-elevation tropical environments (Hofer and others, 2010). In conditions of continuous retreat, glaciers generate a transitory increase in runoff as they lose mass (Mark and McKenzie, 2007). This increase is limited in time as the amount of frozen water stored in the glaciers decreases (Mark and others, 2005). As a consequence, the reduction in ice volume will yield a significant increase in annual runoff for only a few decades, followed by a decrease in runoff (Huss and others, 2008). This trend will be even more pronounced during the season of low flow, a period of the year when the relative contribution of glacier meltwater is at its maximum (Stahl and Moore, 2006; Nolin and others, 2010). Year-to- year variability of runoff from a glacierized mountain basin is moderated by the interaction of temperature and precipitation (Collins and Taylor, 1990). This buffering effect is greatest in basins that have moderate glacier cover, while variation in runoff is greatest in heavily glacierized and unglacierized watersheds. For example, Hagg and Braun (2005) suggest that the minimum year-to-year variations are found where the percentage of glacierized area is 20–50%. Glaciers, which are vulnerable to predicted future warming, buffer stream discharge from highly seasonal precipitation (Bradley and others, 2006; Vuille and others, 2008a). Kaser and others (2003) describe the response of Cordillera Blanca glaciers to recent climatic fluctuations in a comprehensive analysis of glacier mass balances based on discharge and precipitation data. The use of historical hydrologic observations for predictive modeling has not always led to consistent conclusions about the future contribution of glacial meltwater to streamflow. For ex- ample, Juen and others (2007) and Vuille and others (2008b) showed that reduced glacier size leads to decreased volume of glacier melt. This decrease is compensated by an increase in direct runoff. Thus, the mean annual total runoff remains almost unchanged, but the seasonality is considerably amplified. On the other hand, other studies suggest that water supply will peak after several decades of continually increasing as a result of net glacier loss, followed by a sudden decrease (Pouyaud and others, 2005). In this context, accurate predictions of both societal adaptive capacity and water resource availability require sustained measurements and more quantitative assessments of glacier retreat impacts at the watershed scale. The objective of the present study is to evaluate the influence of recent and ongoing glacier recession on the hydrological regime for different watersheds of the Cordil- lera Blanca. In particular, it aims to evaluate the impact of glacial retreat on changes to historical trends in watershed Journal of Glaciology, Vol. 58, No. 207, 2012 doi: 10.3189/2012JoG11J186 134
-
Upload
independent -
Category
Documents
-
view
0 -
download
0
Transcript of Glacier recession and water resources in Peru’s Cordillera Blanca
Glacier recession and water resources in Perursquos Cordillera Blanca
Michel BARAER1 Bryan G MARK2 Jeffrey M McKENZIE1 Thomas CONDOM3
Jeffrey BURY4 Kyung-In HUH2 Cesar PORTOCARRERO5 Jesus GOMEZ5
Sarah RATHAY1
1Department of Earth and Planetary Sciences McGill University Montreal Quebec CanadaE-mail michelbaraermailmcgillca
2Department of Geography The Ohio State University Columbus OH USA3Institut de Recherche pour le Developpement (IRD) Miraflores Peru
4Department of Environmental Studies University of California Santa Cruz CA USA5Unidad de Glaciologıa y Recursos Hıdricos Autoridad Nacional del Agua (ANA) Distrito de Independencia Huaraz Peru
ABSTRACT The tropical glaciers of the Cordillera Blanca Peru are rapidly retreating resulting incomplex impacts on the hydrology of the upper Rıo Santa watershed The effect of this retreat on waterresources is evaluated by analyzing historical and recent time series of daily discharge at ninemeasurement points Using the MannndashKendall nonparametric statistical test the significance of trendsin three hydrograph parameters was studied Results are interpreted using synthetic time seriesgenerated from a hydrologic model that calculates hydrographs based on glacier retreat sequences Theresults suggest that seven of the nine study watersheds have probably crossed a critical transition pointand now exhibit decreasing dry-season discharge Our results suggest also that once the glacierscompletely melt annual discharge will be lower than present by 2ndash30 depending on the watershedThe retreat influence on discharge will be more pronounced during the dry season than at other periodsof the year At La Balsa which measures discharge from the upper Rıo Santa the glacier retreat couldlead to a decrease in dry-season average discharge of 30
1 INTRODUCTIONThe retreat of mountain glaciers in response to ongoingclimate change is expected to have a major impact on alpineenvironments globally (Huss and others 2010) Manystudies predict detrimental societal ecological and econom-ic impacts due to glacier retreat-related hydrologicalchanges (Braun and others 2000 Jansson and others2003 Hannah and others 2007 Vergara and others2007 Brown and others 2010 Kistin and others 2010Uehlinger and others 2010) In the Cordillera Blanca Perucoupled naturalndashhuman studies have shown that in thecontext of an increasing regional population the vulner-ability of Andean society is tied directly to water availability(Mark and others 2010 Bury and others 2011) Howeverevaluating the influence of meltwater runoff on large riverbasin flows in different environments remains a majorscientific challenge (Milner and others 2009 Kaser andothers 2010) This challenge is often amplified by logisticaldifficulties in gathering long-term reliable measurementslike those faced in high-elevation tropical environments(Hofer and others 2010)
In conditions of continuous retreat glaciers generate atransitory increase in runoff as they lose mass (Mark andMcKenzie 2007) This increase is limited in time as theamount of frozen water stored in the glaciers decreases (Markand others 2005) As a consequence the reduction in icevolume will yield a significant increase in annual runoff foronly a few decades followed by a decrease in runoff (Hussand others 2008) This trend will be even more pronouncedduring the season of low flow a period of the year when therelative contribution of glacier meltwater is at its maximum(Stahl and Moore 2006 Nolin and others 2010) Year-to-year variability of runoff from a glacierized mountain basinis moderated by the interaction of temperature and
precipitation (Collins and Taylor 1990) This buffering effectis greatest in basins that have moderate glacier cover whilevariation in runoff is greatest in heavily glacierized andunglacierized watersheds For example Hagg and Braun(2005) suggest that the minimum year-to-year variations arefound where the percentage of glacierized area is 20ndash50
Glaciers which are vulnerable to predicted futurewarming buffer stream discharge from highly seasonalprecipitation (Bradley and others 2006 Vuille and others2008a) Kaser and others (2003) describe the response ofCordillera Blanca glaciers to recent climatic fluctuations in acomprehensive analysis of glacier mass balances based ondischarge and precipitation data The use of historicalhydrologic observations for predictive modeling has notalways led to consistent conclusions about the futurecontribution of glacial meltwater to streamflow For ex-ample Juen and others (2007) and Vuille and others (2008b)showed that reduced glacier size leads to decreased volumeof glacier melt This decrease is compensated by an increasein direct runoff Thus the mean annual total runoff remainsalmost unchanged but the seasonality is considerablyamplified On the other hand other studies suggest thatwater supply will peak after several decades of continuallyincreasing as a result of net glacier loss followed by asudden decrease (Pouyaud and others 2005)
In this context accurate predictions of both societaladaptive capacity and water resource availability requiresustained measurements and more quantitative assessmentsof glacier retreat impacts at the watershed scale
The objective of the present study is to evaluate theinfluence of recent and ongoing glacier recession on thehydrological regime for different watersheds of the Cordil-lera Blanca In particular it aims to evaluate the impact ofglacial retreat on changes to historical trends in watershed
Journal of Glaciology Vol 58 No 207 2012 doi 1031892012JoG11J186134
discharge characteristics To reach these objectives weapply the MannndashKendall method in analyzing trends in dailyaverage historical discharge records from nine glacierizedwatersheds We present a new water-balance model thatsynthesizes hydrographs for different basin parameters andglacier retreat scenarios This model validated to trends inthe historical field data allows us to refine the theoreticalcurves of glacier retreat influence on hydrological regimesand to anticipate how these regimes will continue to changein the future
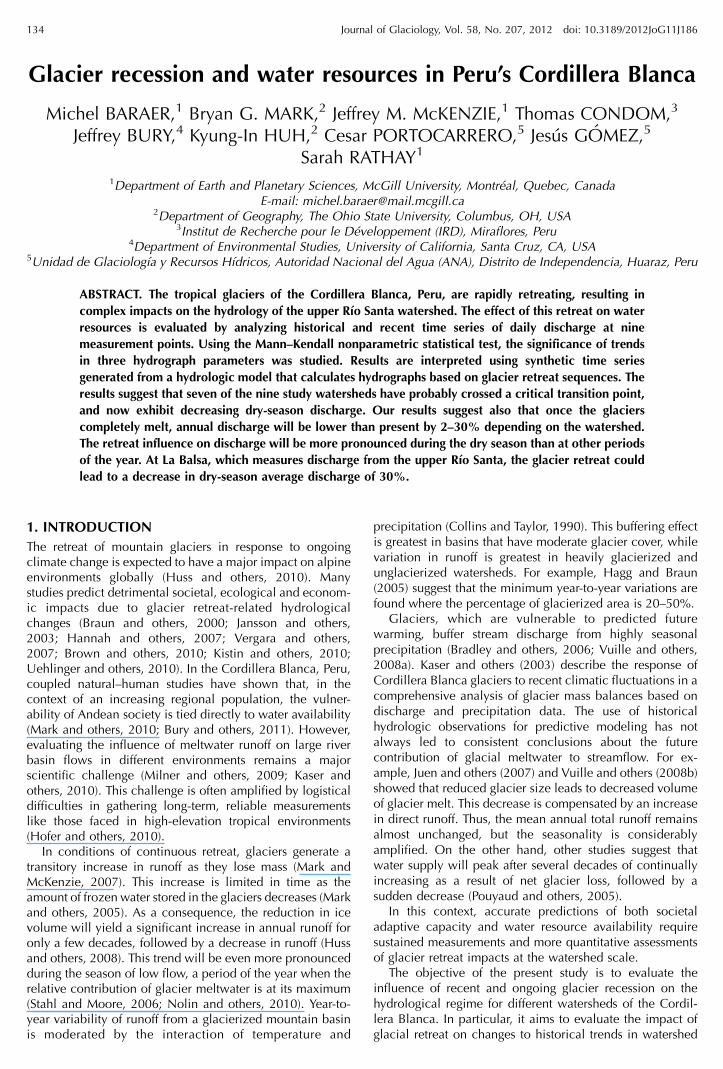
2 STUDY SITEThe upper Rıo Santa watershed in northern Peru capturesrunoff from the Cordillera Negra to the west with a dryclimate and no glaciers (Mark and McKenzie 2007 Suarezand others 2008) and the Cordillera Blanca to the eastwhich receives more precipitation and is Earthrsquos mostglacierized tropical mountain range The glacier coverageof the Cordillera Blanca has declined from 800ndash850 km2 in1930 to slightly less than 600 km2 at the end of the 20thcentury (Georges 2004) The majority of glaciers terminatein watersheds that are drained by the Rıo Santa to the PacificOcean (Fig 1) In the Rıo Santa meltwater provides 10ndash20of the total annual discharge and may exceed 40 in thedry season (Mark and Seltzer 2003) The region has a strongprecipitation seasonality which is typical of the outer tropicswhere more than 80 of precipitation falls between
October and April and the austral winter receives almostno precipitation In addition the average annual airtemperature is less variable than daily temperature Glacialablation occurs continually through the year althoughsublimation reduces the melt rate during the dry season tosome extent Accumulation on the other hand occursmainly during the wet season and only on the higher-elevation portions of the glaciers (Kaser and others 2003)
The Canon del Pato 50MW hydroelectric generation plantlocated at Huallanca on the Rıo Santa defines the outflow of a5000 km2 watershed that captures runoff from the majority ofthe glacierized valleys of the Cordillera Blanca Starting whenthe dam was put into operation the watershedrsquos streamflowhas been carefully monitored As a result many of theglacierized Santa tributaries were equippedwith stream stageand precipitation gauges starting in the 1950s Regrettablythe long-standing gauge network fell into disrepair at the endof the 20th century in the midst of reforms that privatizedhydroelectric generation (Carey 2010) By the beginning ofthe 21st century only three of the stream stage stations ndash LaBalsa (situated just upstream of the power plant) Paron andLlanganuco ndash remained in operation or had been reactivatedafter an interruption of several years
3 METHODOLOGY
31 Data acquisition and screeningIn 2008 Ohio State University McGill University theFrench Institut de Recherche pour le Developpement (IRD)and the Peruvian glaciology unit of the Autoridad Nacionaldel Agua (ANA) launched a joint project to improve thestream-gauging station network throughout the CordilleraBlanca Of a total of 13 stations put into operation in 2008and 2009 five were at historical network measurementpoints (Fig 1) Chancos La Recreta Pachacoto Querocochaand Miraflores (the latter not used in this study)
The stations presented in this study are equipped with twoSolinst 3001 Levelogger series pressure transducers Onetransducer is placed into the water at a depth that ensuresconstant immersion and a second transducer is placedabove the maximum water level to measure atmosphericpressure The water level is calculated by subtracting theatmospheric pressure from the total pressure measured bythe submerged transducer Both sensors record the pressureat synchronous 15min intervals and for the purpose of thisstudy records are averaged to daily values Water levels areconverted to discharges using standard hydrological tech-niques (Dingman 2002)
In addition to the new discharge data we analyzed theoriginal historical discharge dataset which begins in 1952and includes time series for 17 stations A quality-controlanalysis of the time series was used to prevent interpretationerrors Suspect drops peaks or plateaus disqualified portionsof a stationrsquos record Missing data and interruptions in recordswere evaluated for possible interpolation in order to avoidthe losses of valuable data which arise from the outrightrejection of years with gaps At the same time the followingrules were developed to prevent filling data gaps inappro-priately (1) gaps of less than 7 days were systematically filledusing linear interpolation between the two points delimitingthe gap (2) for gaps greater than 7 days a decision was madecase by case with linear or polynomial interpolation appliedwhere there was no risk of corrupting the time series
Fig 1 The Cordillera Blanca and locations of the precipitationmeasurement stations (circles) and discharge measurement stations
Baraer and others Glacier recession and water resources in Perursquos Cordillera Blanca 135
(3) years that had remaining gaps were systematicallyrejected and (4) time series for which more than 12 yearswere rejected were not considered for the study Of the 17stations only 9 were found suitable for the trend analysisbased on these criteria About 6000 (less than 5) of the132000 daily discharge values were derived from inter-polation (Table 1) A total of 66 years of data were rejecteddue to potentially insufficient data quality Despite the effortsand major discarding made during the data screening itremains possible that the interpolation could have affectedthe quality of the datasets This risk characteristic ofhistorical data research has to be considered wheninterpreting the study results though by following our strictcriterion these problems should be minimized
In the historical dataset Paron represents a special caseBeginning in the mid-1980s after several years of civilengineering work the level of Lake Paron was regulated by adrainage tunnel Therefore even though the discharge at thelake outlet continued to be monitored it was inappropriateto use these records for the purpose of the present study
Precipitation records originally included time series for36 measurement points with the oldest starting in the late1940s and the most recent ending in the early 2000s As theoriginal data quality differed from location to location agroup of seven measurement points was selected for areconstituted time series for 1954ndash99 (Pouyaud and others2005) In the present study we make use of these seven timeseries (Paron Llanganuco Chancos Huaraz QuerocochaPachacoto and La Recreta) to study precipitation trends forthe Cordillera Blanca region (Fig 1)
32 Trend analysisThe impact of glacier retreat on medium to large watershedsincludes changes in annual discharge dry-season dischargeand flow variability (eg Braun and others 2000 Janssonand others 2003 Barnett and others 2005 Hagg andBraun 2005 Stahl and Moore 2006 Collins 2008 Mooreand others 2009) Therefore when there is sustained glacierretreat it should be possible to quantify the influence ofglacier retreat on watershed hydrology by identifying trendsin these discharge characteristics
In the present study three discharge characteristics wereused to quantify change in (1) the mean annual dischargeQ (2) the dry-season discharge and (3) the yearly
coefficient of variation in daily discharge Cv As the timingof the dry season may vary slightly from one year to anotherwe used two values for dry-season discharge the dry-seasonaverage Qd and the lowest 10-consecutive-day average fora given year Qmin Qd was computed by averaging dailydischarge from July and August the lowest discharge monthsat La Balsa
The MannndashKendall test (Mann 1945) a nonparametricdistribution-free method was used to identify significanttrends in Q Qd Qmin and Cv time series and to differentiatebetween significant evolution of annual parameters andrandom variations This test was used in numerous hydro-logical studies (eg Hirsch and Slack 1984 Marengo 1995Kundzewicz and others 2005 Xu and others 2010) andwasjustified by its high efficiency even with non-normalincomplete time series (Yue and Pilon 2004) The sign ofthe standard normal statistic (eg Xu and others 2010)indicates the slope of the trend A positive slope denotes anincrease with time whereas a negative slope indicates adecrease The tested significance levels are 0001 001005 and 01
MannndashKendall tests were performed on all historical timeseries that were found acceptable through the quality controldescribed above The new discharge measurements wereconsidered in the trend analysis where the number of yearsbetween the end of the historical record and the stationrehabilitation time was considered as not liable to bias thetrend analysis As a consequence for datasets that presentmore than 50 of years with missing data over the 1989ndash2009 period the recent measurements are given forinformation only and are not integrated into the historicaltime series used for the trend analysis This criterionalthough not 100 selective was used to ensure the trendanalysis quality while keeping time series as long as possibleIf significant bias were to still arise from these minor temporalgaps it would be detected at the model validation stage (seeSection 44 below)
MannndashKendall tests were applied at two levels At the firstlevel the overall time-series trend was evaluated byconsidering the complete period of the accepted recordsFor stations that had a change in the trend a linear trendcharacterization would have misrepresented the true rate ofparameter change with time Therefore trends on subsets ofthe complete time-series segments were analyzed Possible
Table 1 A description of discharge measurement points drainage basins the discharge time series and the interpolations made lsquoNumber ofyears availablersquo is the number of years with recorded data that were screened for quality control The number in parentheses where shownis the number of these years of data from the new rehabilitated stations
Station Stream Watershed area Period ofrecord
Number ofyears available
Number ofyears selected
Number ofyears with
interpolations
Linearinterpolation
Polynomialinterpolation
km2
Chancos Marcara 221 1953ndash2009 48 (1) 40 22 20 46Colcas Colcas 237 1954ndash99 46 37 15 15 42La Balsa Rıo Santa 4768 1954ndash2008 55 50 21 113 32La Recreta Rıo Santa 297 1952ndash2009 48 (2) 41 10 0 14Llanganuco Llanganuco 85 1954ndash2009 55 (1) 44 31 14 74Los Cedros Los Cedros 114 1952ndash99 48 41 16 11 39Pachacoto Pachacoto 194 1953ndash2009 46 (2) 41 22 04 24Paron Paron 49 1953ndash2009 43 30 13 10 32Querococha Querococha 62 1953ndash2009 47 (1) 43 19 08 30
Baraer and others Glacier recession and water resources in Perursquos Cordillera Blanca136
minima or maxima in the complete time series wereidentified where the derivative of the quadratic regressionequation (for the different parameters of interest) was zero Asecond level of MannndashKendall linear trend analysis was thenapplied to sub-periods corresponding to the time before andafter the year of trend change The same procedure wasapplied to yearly precipitation amounts
33 Trend interpretation modelWe related detected measured trends to changes in glacialhydrological influence by using a simple model of waterbalance This model generates synthetic hydrographs fromthe watershed area the glacierized surfaces and the annualrate of loss of ice area The glacierized coverage of awatershed is a critical parameter that generates disparitiesamong basins in hydrological response to glacial retreat(Birsan and others 2005 Lambrecht and Mayer 2009Alford and Armstrong 2010 Koboltschnig and Schoner2010 Viviroli and others 2010) However the percentage ofglacier area alone is often insufficient to describe glacialinfluence on stream discharge for a given watershed Themelt component of basin discharge is primarily dependenton the energy balance of snow and ice with differentcharacteristics such as hypsometry orientation or density(Ohmura 2001) These factors vary from basin to basincreating differences in hydrological response to glacierretreat Here we account for these variations by using theannual rate of ice area loss
The following water balance equation is used with yearlyaverage values for studied watersheds
Q frac14 S thorn PPthornGWin GWout ET eth1THORNwhere Q is the streamrsquos outflow S is the change in waterstorage over the same period PP is the yearly volume ofprecipitation entering the watershed ET is basin-wideevapotranspiration and GWin and GWout are the ground-water fluxes entering and leaving the watersheds respect-ively Considering that all watersheds studied are situated inmountainous environments we hypothesize that the netwatershed groundwater exchange GWin ndashGWout is verysmall compared to the other components of the waterbalance and can be ignored The evapotranspiration termincludes evaporation from rivers and lakes (ETrl) evaporationfrom bare soil vegetative surfaces (ETngl) and sublimationfrom ice and snow surfaces (Sub) (adapted from Dingman2002) Substituting Eqn (1) then becomes
Q frac14 S thorn PP ETrl ETngl Sub eth2THORNFor time series that are several decades long we considerthat the change of water storage is only dependent on glaciervolume changes with other storage variations balancingover decadal time periods S is therefore assumed to beequivalent to the annual change in glacier volume expressedin water equivalent To account for the amount ofsublimated volume as a factor the PP term is split intoprecipitation that falls on a glacierized area and that whichreaches the ground in non-glacierized areas
Q frac14 Vgl thorn ppAgl dmelt thorn AT Agl
pp etngl ETrl
eth3THORNwhere Vgl is the interannual change in glacier volumeexpressed in water equivalent pp and etngl are the averagedepth of precipitation received and the non-glacierizedevapotranspiration per unit area respectively dmelt is the
fraction of annually ablated ice (or snow or firn) that is notlost by sublimation and Agl and AT are the glacierized areasand total watershed areas respectively
To simplify Eqn (3) we introduce a factor that relatesVgl to the glacierized area Agl Assuming is constant overtime we can consider
frac14 Vgl
Agl2 frac14
Vgl0
Agl02 eth4THORN
where Vgl0 and Agl0 are the initial ice volume and glacierarea respectively
The annual rate of ice area loss is the interannualchange in glacial areaAgl divided by the glacial area Aglof the previous year In a time-series context applyingsimple algebra to this definition for a given year n makes itpossible to relate n to Agln
2 and the glacierized area
Agln to the initial glacier cover Agl0as follows
Agln2
frac14 1 neth THORN2 1
h iAgln1
2
Agln frac14 Agl0
Ynifrac142
1 ieth THORN
8gtgtltgtgt eth5THORN
Combining Eqns (3ndash5) leads to the following expression ofthe annual discharge for a given year n
Qn frac14
dmelt
Agl0
2Yn1ifrac141
1ieth THORN2 1neth THORN21h i
thorn ppnAgl0
Ynifrac142
1ieth THORN
thorn ppn etngl
AT Agl0
Ynifrac142
1 ieth THORN
ETrl
eth6THORNWith Eqn (6) it is possible to estimate the annual averagedischarge using data on precipitation and glacial retreat aswell as the watershed and initial glacierized surfaces Thisassumes that the evapotranspiration terms ETrl and ETngland the sublimation factor (1 ndash dmelt) do not vary signifi-cantly during the study period
When focusing on the dry season a distinction is madebetween fast flow and slow flow for the non-glacierized areaof the watershed Fast flow is defined here as the portion ofprecipitation that reaches the watershed outlet within a fewdays of falling and assumes no loss due to evapotranspira-tion Slow flow is defined as water released from thewatershed over a time-span longer than a few days and isassumed to be mainly groundwater-based Considering thatthe Cordillera Blanca receives almost no precipitationbetween June and September it is assumed that the fast-flow component for the dry season is negligible The dry-season slow-flow discharge qngl accounts for the waterreleased from groundwater minus the specific evapo-transpiration ETngl from non-glacierized areas
Focusing on the dry season requires accounting for theseasonality of the glacier melt rates During the dry seasonthe specific humidity is low and the vertical water-vaporpressure gradient over the glacier surface is generallypositive downward making conditions favorable for sublim-ation to occur and decreasing the amount of energyavailable for total ablation (Winkler and others 2009) Weintroduce defined as the fraction of annual ablation thatoccurs during July and August and use d 0melt instead of dmelt
Baraer and others Glacier recession and water resources in Perursquos Cordillera Blanca 137
to adapt Eqn (6) for dry-season discharge
Qdnfrac14
d 0melt
Agl0
2Yn1ifrac141
1ieth THORN2 1neth THORN21h i
thorn ppnAgl0
Ynifrac142
1ieth THORN
thorn qngl AT Agl0
Ynifrac142
1 ieth THORN
ETrl
eth7THORNAgain it is possible to estimate the average discharge of thedry season using precipitation and the rate of glacial retreattime series as well as the watershed and initial glacierizedsurfaces This assumes that ETrl qngl and the sublimationfactor (1 ndash dmelt) do not vary significantly over the studyperiod
The yearly coefficient of variation of discharge Cv is
Cv frac14
Qfrac14
ffiffiffiffiffiffiffiffiffiffiffiffiffiffiffiffiffiffiffiffiffiffiffiffiffiffiffiffiffiffiffiffiffiffiffiffiffiffiffiffiffiffiffiffiffiffiffiffiffiffiffiffiffiffiffiffiffiffi2Qmelt
thorn 2Qslow
thorn 2Qfast
thorn cov
qQmelt thornQslow thornQfasteth THORN eth8THORN
where Qmelt Qslow and Qfast are the melt slow-flow andfast-flow components of the yearly average dischargerespectively Qmelt Qslow and Qfast are the melt slow-flowand fast-flow standard deviations and cov describes the sumof flow-types pairs covariance If we consider the individualcoefficient of variation for the three flow components asbeing constant over the years the equation is
Cv frac14ffiffiffiffiffiffiffiffiffiffiffiffiffiffiffiffiffiffiffiffiffiffiffiffiffiffiffiffiffiffiffiffiffiffiffiffiffiffiffiffiffiffiffiffiffiffiffiffiffiffiffiffiffiffiffiffiffiffiffiffiffiffiffiffiffiffiffiffiffiffiffiffiffiffiffiffiffiffiffiffiffiffiffiffiffiffiffiffiffiffiffiffiffiffiffiffiffiffiffiffiffiffiffiffiffiffiffiffiCvmeltQmelteth THORN2thorn CvslowQsloweth THORN2thorn CvfastQfasteth THORN2thornP
cov
eth9THORNBased on Eqns (6) (7) and (9) the model generates annualaverage discharge dry-season discharge and dischargecoefficient of variation for periods greater than 10 yearsDue to the diverse assumptions made in the model design itis expected that the trends in modeled parameters as well asthe final (for Agl = 0) versus initial discharge ratios will bemost accurately reproduced
34 Assessing influence of precipitation on dischargetrendsEqns (1ndash6) indicate it is possible to estimate the annualaverage discharge using only precipitation and glacialretreat data if we assume that the evaporation- and sublim-ation-related terms do not vary significantly during the studyperiod This means that characterizing the impact of glacierretreat on discharge first requires characterizing the influ-ence of precipitation
A correlation study between the seven precipitation timeseries at Paron Llanganuco Chancos Huaraz QuerocochaPachacoto and La Recreta (Pouyaud and others 2005) wasused to assess the spatial homogeneity of precipitationacross the region A trend analysis (described earlier) wasalso performed on each time series and the results of bothanalyses were used to further explore the regional variabilityand possible regional patterns of yearly precipitation valuesWe then statistically compared discharge parameters fromall studied watersheds to regional precipitation recordsWhen a lsquominimal correlationrsquo (R202 and p-value 01)was not obtained between Q Qd Qmin or Cv and the yearlyamount of precipitation of the closest measurement points itwas considered that discharge variability cannot be ex-plained by precipitation changes For all cases where a
minimal correlation was detected a new trend analysis wasperformed with the precipitation time series using the sametime periods as the corresponding discharge parameter Incases where significant trends of similar sign (ie positive ornegative) were detected both in precipitation records and indischarge parameter values the discharge parameter trendwas excluded from the result interpretation
In addition to avoid identifying trends related to tem-porary climatic phenomena that could arise from shorteningtime series the discharge dataset was screened for general-ized common patterns in measurements If such a case wasdetected corresponding datasets were similarly excluded
35 Estimation of glacier coverageThe published data on glacierized areas by watershed that weconsidered cover different time periods (1) 1963ndash70 and1997 (Mark and Seltzer 2003) (2) 1990ndash91 (Kaser andothers 2003) (3) 1930 1970 and 1990 (Georges 2004)and (4) 1948 1962 and 1973 (for Yanamarey glacier only)(Hastenrath and Ames 1995) Combining these publisheddata required occasional adjustments to ensure consistentdefinitions of watershed areas There are only minor differ-ences in watershed areas between the first two studies so thecalculation of watershed glacial cover was consideredcomparable for publications 1 and 2 However the extensivedataset in Georges (2004) features a format that presentsglacierized areas by mountain group rather than by water-shed To accurately compare formats we first evaluated theproportion of glaciers in themountain groups of publication 3that drain into the watersheds of publications 1 and 2 andweighted the published glacierized areas accordingly toderive watershed-based glacier coverage for the same years1930 1970 and 1990 The same procedure was applied forthe computation of the Querococha watershed glacierizedarea with publication 4 Overlaps between studies were usedto fine-tune the weighted average factors
Advanced Spaceborne Thermal Emission and ReflectionRadiometer (ASTER) satellite imagery was used for recentestimates of glacier area Despite the lower resolution ofASTER imagery compared to other sources it has providedan important multitemporal data product to map glacierchanges as part of the Global Land Ice Measurements fromSpace (GLIMS) project and the Cordillera Blanca has beenfeatured as a specific case example of the GLIMSapplication (Racoviteanu and others 2008 Raup andothers 2008) We selected images from 2001ndash03 and2009ndash10 with available images that spanned the entiremountain range This necessitated compilations of multipleimages to obtain cloud-free coverage For each time periodwe computed the amount of glacierized coverage bydigitizing glacier boundaries with GIS software The lowertermini were used to evaluate changes in area Delimitingedges between individual glaciers at the upper regions ofwatersheds is inherently uncertain given the steep terrainuniform surface reflectance and limited image resolutionBut because our objective was to compute relative changesin glacierized area aggregated by watershed we did notneed to distinguish between individual glaciers We did notapply ASTER resolution (15m panchromatic) to defineindividual glaciers but rather the changes in total glaciercoverage between periods We calculated the watershedareas using 1 100 000 digitized contours and lakes andrivers from Instituto Geografico Nacional Peru The glacier-ized area of each watershed was calculated based on the
Baraer and others Glacier recession and water resources in Perursquos Cordillera Blanca138
method and recommendations formulated by Racoviteanuand others (2009)
The resulting glacier coverage data were used to computethe annual rate of ice loss for each studied watershedLinear extrapolations were used between the discrete yearsof published or estimated glacierized areas to estimate theannual values required for the model The glacier coveragedata are used to generate synthetic datasets for modelcalibration and were limited to the years matching thoseused for the discharge data trend analysis
36 Model parameterization and validationThe initial parameterization of the model was based onpublished parameter values (Table 2) When directlyapplicable parameters were not available specific par-ameters were developed to estimate them such as the factor that relates the watershed glacierized area Agl to itsvolume Vgl (see Eqn (4)) We used the glacier volumendashareapower relationship (Bahr 1997 Bahr and others 1997) todetermine the relationship between the volume of a singleglacier and its surface area in the Cordillera Blanca Astropical glaciers are generally thinner than alpine glaciersdue to their relatively high inclination (Kaser and Ost-maston 2002) the scaling factor of the power equation wascomputed based on published local volumes and areas Weused published glacier volumes or mass balances for glacierssituated in the tropical Andes in Bolivia (Ramirez and others2001 Rabatel and others 2006 Soruco and others 2009)and in Peru (Hastenrath and Ames 1995 Ames andHastenrath 1996) Using the scaling exponent of 1375suggested by Bahr (1997) the best nonlinear regressionresult (R2 = 094 root-mean-square error = 0008 km) wasobtained with a scaling factor of 004088 (Fig 2)
While valid for individual glaciers the resulting powerrelationship is not directly applicable to the model whichrequires watershed glacierized area For watersheds with anarea of less than 1 km2 the ice volume estimation wouldremain valid but it would be overestimated for largerglacierized areas that are usually a combination of severalindividual glaciers To establish a relation between
individual glaciers and watershed glacierized area thick-nesses we used a simplified version (using three bins) of theareandashfrequency distribution of the 485 glaciers of theCordillera Blanca that was established by Racoviteanu andothers (2008) We calculated the initial watershed glacier-ized volumesVgl0 as follows
Vgl0 frac14 Agl02 frac14
X3ifrac141
niVui eth10THORN
where i is the repartition bin number ni is the number ofglaciers for bin i and Vui is the corresponding glacier
Table 2 Initial parameters for the hydrological model The lsquoRangersquo column indicates the parameter range used for the model application todifferent watersheds No range means that the parameter is constant regardless of watershed
Parameter Description Unit Value Range Source Comment
dmelt Portion of yearly ablated ice notsublimated
ndash 082 Winkler and others (2009) After adjustment to dry-seasondefinition
d 0melt Portion of dry-season ablated ice notsublimated
ndash 074 Winkler and others (2009) After adjustment to dry-seasondefinition
etngl Non-glacierized area-specificevapotranspiration
mmandash1 640 300ndash640 Kalthoff and others (2006) ndash
ETrl Evaporation from rivers and lakes m3 dndash1 5000 0ndash50000 Baraer and others (2009a) Value given for the Querocochalake only
Dry-season part of annual ablation ndash 014 Kaser and Georges (1999) Approximation based onqualitative descriptions
qngl Net slow-flow dry-season specificdischarge
mmandash1 200 120ndash200 Baraer and others (2009b) Watershed-dependent
Cvmelt Melt component coefficient ofvariation
ndash 04 Baraer and others (2007) Calculated from hydrographseparation
Cvslow Slow-flow coefficient of variation ndash 05 ndash Deduced from sensitivity analysisrealized with Eqn (9)
Cvfast Fast-flow coefficient of variation ndash 13 Baraer and others (2009a) ndashcov Sum of covariances ndash 0 ndash Based on calibration
Fig 2 Ice volume versus glacier area for tropical glaciers of theAndes Black dots represent measured values from Hastenrath andothers (1995) Ames and Hastenrath (1996) Ramirez and others(2001) Rabatel and others (2006) and Soruco and others (2009) Theblue line plots the Bahr and others (1997) equation with slopeadjusted to fit the measured values The dashed portion of the blueline corresponds to the projection of the trend outside the regressionrange The red curve represents the ice volume evaluated for theglacierized area of a watershed rather than for a single glacier
Baraer and others Glacier recession and water resources in Perursquos Cordillera Blanca 139
volume area of the bin compiled from Racoviteanu andother (2008) The factor is determined from a watershedrsquosinitial conditions using Eqn (10) and remains constant duringthe simulation The relation between Vgl0and Agl0 that resultsfrom the Eqn (10) is plotted in Figure 2
The initial values of other parameters and the sourcesused to estimate them are given in Table 2 A limited numberof initial parameters (Table 2) were adjusted to obtain thebest possible fit between projected and measured variablesat the study watersheds The modelrsquos ability to reproducetrends was assessed by comparing model output to theMannndashKendall results of the measured discharge dataEvaluating the modelrsquos ability to situate the final (Qend)versus the initial (Q0) discharges ratio was not achievabledirectly as none of the observed discharge time series coversthe complete disappearance of the glaciers Therefore weused the streamrsquos yearly discharge in the last year of the timeseries Qn instead of Qend The error associated with Qn Q0
ratio estimation was therefore considered greater than thoserelated to Qend Q0
37 Model sensitivity to glacier retreat scenariosOnce calibrated the model was used for a sensitivityanalysis to determine how the key model parameters affectthe simulated trend of discharge-related parameters underdifferent scenarios of glacier retreat Annual precipitationwas kept constant across the entire simulation period basedon results of the precipitation trend analysis shown below
A lsquomedianrsquo scenario was defined based on a quasi-exponential increase of n and on studied watershedcharacteristics Sensitivity analysis was done by comparingthis median simulation (scenario a) with five lsquovariantrsquoscenario outputs (bndashf Table 3) each differing from themedian scenario in one parameter only Because of thenumerous ways in which n can vary with n two variants ofthe n function were tested scenario e had a continuousglacial retreat scenario (linear) while scenario f involvedmore complexity (an oscillating function with periodicnegative recession phases and a positive average in theperiod studied) Simulations were run until the glacier areaapproached zero and the yearly average discharge stabilized
The median scenario was also used to explore the notionof phases of glacier retreat as a function of watershed param-eters a useful prognostic used in other studies (eg Collins2008 Milner and others 2009 Moore and others 2009)Four different phases were defined on the basis of significanttrend changes that occur in model outputs while the glaciercoverage decreases This classification was subsequentlyused to categorize the nine different studied watersheds
38 Potential future hydrologic impacts of glacierretreatTo determine how glacier retreat will affect future hydro-logical regimes the model was run in a lsquorapid-retreatsimulationrsquo with a hypothetical extreme rate of glacierretreat The rapid-retreat initial conditions are comparable tothose of our study watersheds in 2009 as opposed todecades ago The lsquomedianrsquo retreat scenario (scenario aTable 3) was used as a starting point and more than 2000 Q0
values were calculated based on combinations of per-centage of initial glacierized area cover Agl0and annual rateof ice area loss 0 Agl0 ranged from 01 to 50 0 from 0to 004 and watershed area was constant at 200 km2 Foreach of the initial condition combinations the annual rate ofice area loss was increased by 1 of glacier area per yearuntil the glacier was completely melted which was almost50 times faster than the average increase observed at thenine studied watersheds between 1930 and 2009 Thishypothetical retreat would generate a meltwater release anda subsequent discharge increase for at least the firstsimulation year regardless of the initial condition Themagnitude and duration of this simulated increase reflectedthe capacity of glaciers to further increase the watershedflows To evaluate this capacity
RQthorn a dimensionless
parameter that represents the amount by which theperturbed discharge Qi exceeds initial discharge Q0 wasused and was computed as followsZ
Qthorn frac14X Qi Q0eth THORN
Q0for years i where Qi gt Q0 eth11THORN
Simultaneously the impact on the watershed annualdischarge of a glacier completely melting was evaluated bycomputing QendQ0 the final versus initial mean annualdischarges ratio This ratio provides a direct indication ofhow much the annual discharge will decrease once theglacier disappears compared with that calculated based oninitial conditions
In addition to annual discharges the rapid-retreatsimulations were used to compute
RQthorn and Qend Q0 for
dry-season dischargeWe estimated the
RQthorn and Qend Q0 values for the
studied watershed by comparing watershed Agl and valuescalculated for 2009 with the rapid-retreat simulation resultsThis method of interpretation of simulated results made itpossible to qualitatively describe potential future hydrologicimpacts of glacier retreat on the studied watersheds
4 RESULTS AND DISCUSSION41 Changes in glacierized areaThe studied watersheds have a wide range of percentglacierized area (Table 4) With 39 in 2009 Paron is themost highly glacierized watershed while La Recreta is theleast glacierized with 1 the same year From 1930 to 2009the percent glacierized area within every watershed de-creased This is confirmed by the period values (the annualrate of ice area loss from 1930 to 2009 Table 4) which areall positive for the period studied The La Balsa watershedwhich drains the entire upper Rıo Santa has an average of061andash1 area loss which is the median for the nine studiedwatersheds The Llanganuco and Querococha watershedsexhibit the fastest glacial area reduction with an averageloss of 1andash1 and 11andash1 respectively Los Cedros has the
Table 3 Parameter values and formulas used in the sensitivityanalysis scenarios The lsquoMedianrsquo scenario (a) is the referencescenario Other letters in parentheses (bndashf) refer to the parameterchanged for a given scenario
Parameter Agl0 AT 0 n with n 2 1 2 200f g km2
lsquoMedianrsquoscenario (a)
25 200 0 n frac14 n1 thorn 35 106n
Variants50 (b) 1000 (c) 0005 (d) n frac14 0 thorn 000024n etheTHORN
n frac14 0 thorn sin n11 099
=30 ethfTHORN
Baraer and others Glacier recession and water resources in Perursquos Cordillera Blanca140
lowest period with an average loss of 038andash1 Except forColcas Los Cedros and Paron there is a clear acceleration inglacierized area reduction across the studied watershedsover the past two decades The average value for theperiod 1990ndash2009 was double that for 1930ndash2009 atChancos La Recreta Pachacoto and Querococha indicat-ing a probable exponential rate of depletion La Balsa valuesconfirm this acceleration The 1990ndash2009 annual percent-age glacier area loss reaches 081 which is roughly 30greater than was measured during the 1930ndash2009 period
The recession-rate results provide an internally consistentcomparison of changes over time Our protocol to generate time series invokes a level of uncertainty estimated at around
5 based upon our inclusion of historical estimates ofglacierized areas from different sources and comprisingdifferent interpretations of glacier areas by different methods(Table 4) Despite these unavoidable limitations the gener-ated time series was considered to be adequate for thepurpose of this study because the model simulationsgenerated from these time series are used to compute trendanalyses only and the results obtained from these simulationsare compared to observed discharges for model validation
42 Trends in discharge parametersThe dry-season average discharge time series are used toillustrate how the studied watersheds evolve hydrologically
Table 4 Glacierized percentage of watershed areas Years in italics are derived from publications (Kaser and others 2003 Mark and Seltzer2003 Georges 2004) The others (2002 and 2009) were computed using ASTER satellite imagery The specific acquisition dates for selectedASTER images were 1 August 2001 25 May 2002 17 June 2002 13 July 2003 28 May 2009 11 June 2009 13 July 2009 29 July 20097 August 2009 and 29 May 2010 The historical values for Querococha are from Hastenrath and Ames (1995) and cover slightly differenttime periods indicated in parentheses period and 90ndash09 represent the average rate of ice area loss for the periods 1930ndash2009 and1990ndash2009 respectively
Watershed 1930 1970 1990 1997 2002 2009 period 90ndash09
Chancos 311 25 24 22 222 195 00059 00108Colcas 244 193 175 18 19 174 00043 00003La Balsa 117 9 84 8 81 72 00061 00081La Recreta 16 15 14 11 1 00058 00161Llanganuco 555 426 34 308 251 001 00158Los Cedros 25 21 19 18 19 185 00038 00014Pachacoto 14 12 10 8 71 69 00089 00193Paron 72 55 47 52 44 387 00078 00064Querococha 46 (1948) 39 (1973) 37 3 28 2 0011 00248
41 (1962)
Fig 3 Dry-season average discharge calculated from daily data (solid blue line) Linear and quadratic regression lines (curves) calculatedfrom datasets are drawn in black dashed lines and full black curves respectively
Baraer and others Glacier recession and water resources in Perursquos Cordillera Blanca 141
over time (Fig 3) Overall the data show a dominantdecrease in dry-season average discharge during the studyperiod An increase in dry-season average is observed withthe Paron dataset a particularity that could be related to thelength of the study period for this watershed No trend isdetected in the Llanganuco dry season throughout the studyperiod There is a decrease in dry-season stream dischargebetween the 1950s and 1990s for the seven other water-sheds This regionally dominant pattern is also observed inthe La Balsa time series which has lost more than 10 of itsaverage dry-season discharge in little more than half acentury This decrease cannot be attributed fully to thechange in glacial cover as other factors (eg changes in landuse agricultural practices or population density) also mighthave affected regional river discharge regimes Howeverhigh-elevation watersheds like Querococha or Pachacotowhere there is low human impact also present an overalldry-season discharge decrease suggesting that the change inglacial cover explains at least partly the observed dry-season discharge decrease at La Balsa Four of the watershedsfeature a local maximum in polynomial regression curvesand four a minimum No maximum or minimum is detectedat Llanganuco The timing of minima or maxima inpolynomial regression curves varies from 1958 for Paron to1994 for La Balsa These differences in curve profiles suggestthat it is unlikely that trends related to short interannualclimatic phenomena would be detected by the MannndashKendall test
For MannndashKendall tests with significance values of 01 orlower the random origin of trends can be excluded allowingfurther refinement of the trend analyses (Table 5) With theexception of Paron all significant discharge trends indicate adecrease in discharge throughout the total period andorduring the second sub-period On no occasion were contra-dicting indications observed between Q Qd and Qmin AtChancos Los Cedros and Querococha the decrease indischarge was preceded by an increase in at least one of thethree discharge parameters This phase ended much earlier(around 1962) at Los Cedros than at the two other locations(1980 and 1975 respectively) On five occasions Cvpresented significant trends At La Balsa and La Recretathe results indicate an increase in variability with time eitherfor the full period of record or at least for one of the sub-periods The only watersheds where significant decreases inyearly discharge variability were detected are Paron (acrossthe full time series) and Colcas (in the first sub-period) Theresults show that an increase in discharge is systematicallyassociated with a decrease in variability and vice versa
For the precipitation records the trend analysis shows amore heterogeneous situation Of the seven time series westudied three exhibit a negative trend and four a positivetrend during the 1954ndash99 period Chancos and Huaraz bothhave positive statistically significant trends The samedisparity is observed for trends analyzed using sub-periodsthree (one significant) of the seven time series show anegative trend during the first sub-period and two (onesignificant) during the second sub-period Years of minimumor maximum values differ widely between measurementlocations These results suggest the absence of a clearregion-wide trend in precipitation over the study period Thisspatial disparity is confirmed by the correlation studyperformed on the seven precipitation datasets (Table 6)Significant R2 vary from only 009 between Paron andChancos to 054 between Pachacoto and La Recreta Most
of the R2 values are around 03 corresponding to a low levelof linear correlation These results are in line with previouslypublished studies that describe unclear trends in regionalprecipitation data or in projections (Urrutia and Vuille2009 Chevallier and others 2010) Vuille and others(2008a) also describe the lack of a clear trend in precipi-tation for the Cordillera Blanca area They report a differ-ence in tendency between regions situated south (a possibledecrease) and north (a possible increase) of about 118 SSituated between 88380 S and 108020 S the Cordillera Blancalies near the boundary of these two regions Therefore sinceusing a single precipitation time series to represent aregional tendency is not possible time series from the threenearest measurement points are used for comparison to eachwatershedrsquos discharge parameters
43 Precipitation influence on discharge trendsResults of the correlation study between precipitationrecords and discharge parameters are reported in Table 7First we note that the degree of influence (number andmagnitude of detected lsquominimal correlationsrsquo) varies fromwatershed to watershed Broadly the watersheds thatpresent the lowest relative glacierized areas (Table 4) havedischarge parameters more correlated to annual precipi-tation The degree of influence of precipitation on dischargeparameter variation also differs from parameter to parameterWith only one exception (Qd at La Recreta) Qd and Qmin donot correlate or correlate weakly with the precipitationCorrelation with Q and Cv is more established but stillweak as less than 50 of the calculated R2 values do notreach the minimal correlation level and 75 of those that doare below 05 As a general pattern the influence ofprecipitation on discharge parameter variations is small(Table 7) and mainly affects the less glacierized watershedsBased on this correlation study trends in all studieddischarge parameters at Colcas and Paron are consideredto be free of the influence of precipitation while at the otherwatersheds only Qd and Qmin are independent of precipi-tation (Qmin only at La Recreta)
The lack of a regional trend in yearly precipitationamounts as well as the weak level of correlation that existsbetween discharge parameters and yearly precipitationmakes it difficult to justify using a precipitation trend toforce the model We therefore fix watershed-specific yearlyprecipitation values in all model simulations
44 Model validationModeled discharge trends were compared with measureddischarge trends by counting how often a significant trenddetected in measured discharge was reproduced by themodel The results in Table 8 are reported as the percentageof times that both trends were similar for both linear andquadratic regressions Of the 37 significant trends detectedusing the MannndashKendall test 36 were correctly reproducedby the model for an overall match value of 97 Despite theuncertainty related to the glacierized area evaluation andthe hydro-climatic datasets the model reproduced the trendof the four different parameters used in the study verysatisfactorily The model performance in estimating theQendQ0 ratios is poorer than in reproducing trends but itsmean absolute error less than 017 is acceptable for thepurpose of the study Evaluating the Qn Q0 ratios correctly isnot explicitly required as the simpler Qend Q0 ratio only isused This validation step did not highlight any deviation
Baraer and others Glacier recession and water resources in Perursquos Cordillera Blanca142
Table 5 Results of MannndashKendall trend analysis The lsquorsquo columns describe the level of significance of the reported trends Statisticallysignificant trends are in bold
Station Parameter Linear regression Quadratic regression
Year of min(max)
Sub-period 1 Sub-period 2
Period Slope Slope Slope
Chancos Q 1954ndash96 0028 1980 0073 01 ndash0134 005Qd 1954ndash96 ndash0007 1971 0025 ndash0029Qmin 1954ndash96 ndash0003 1974 0028 ndash0065 005Cv 1954ndash96 0002 ndash
Colcas Q 1956ndash97 ndash0011 1972 ndash0003 ndash0073 005Qd 1956ndash97 ndash0004 1977 001 ndash0032Qmin 1956ndash97 ndash0011 1971 ndash001 ndash0032 005Cv 1956ndash97 0001 1959 ndash0052 01 0001
La Balsa Q 1954ndash2008 0007 1975 0188 0449Qd 1954ndash2008 ndash0065 01 1994 ndash0163 001 ndash0406 005Qmin 1954ndash2008 ndash004 1992 ndash0148 005 ndash0298Cv 1954ndash2008 0003 005 1970 ndash0013 0006 005
La Recreta Q 1954ndash95 ndash0028 01 ndashQd 1954ndash95 ndash0005 005 1980 ndash0014 001 ndash0014 001Qmin 1954ndash95 ndash0004 001 1984 ndash0007 001 ndash0011 01Cv 1954ndash95 0001 1976 001 01 ndash0004
Llanganuco Q 1954ndash2009 0003 1988 0019 001 ndash002 01Qd 1954ndash2009 0 ndashQmin 1954ndash2009 0 ndashCv 1954ndash2009 ndash0001 ndash
Los Cedros Q 1954ndash99 ndash0006 1970 004 ndash0009Qd 1954ndash99 ndash0006 1979 ndash0017 0037Qmin 1954ndash99 ndash0013 001 1962 015 005 ndash0018 0001Cv 1954ndash99 0001 1956 0001
Pachacoto Q 1954ndash96 ndash0015 1962 0149 005 ndash0021Qd 1954ndash96 ndash0001 1971 0006 ndash0012Qmin 1954ndash96 0001 1972 0018 ndash0014Cv 1954ndash96 0 1976 ndash001 0007
Paron Q 1954ndash83 0023 001 1962 0019 0046 0001Qd 1954ndash83 0025 0001 1958 01 0029 0001Qmin 1954ndash83 0024 0001 1958 0111 0029 0001Cv 1954ndash83 ndash0006 0001 ndash
Querococha Q 1953ndash95 0002 1975 0018 005 ndash0012Qd 1953ndash95 ndash0001 1974 0006 ndash0009 001Qmin 1953ndash95 0 1975 0008 001 ndash001 001Cv 1953ndash95 0001 1972 ndash0004 0003
Precipitation Paron 1954ndash99 ndash2729 1981 ndash10163 01 2800Llanganuco 1954ndash99 0580 1969 19800 2187Chancos 1954ndash99 2386 01 ndash 2386Huaraz 1954ndash99 6305 001 1990 7818 001 30450 01
Querococha 1954ndash99 0878 1978 12226 005 ndash16392 005Pachacoto 1954ndash99 ndash1066 1988 ndash0495 ndash9529
Table 6 Coefficient of determination (R2) and statistical significance (p-value) calculated for the seven precipitation time series R2 valuesappear below the oblique line p-values above R2 values equal to or over 02 associated with a p-value under 01 are in bold
R2p-value Paron Llanganuco Chancos Huaraz Querococha Pachacoto La Recreta
Paron 00163 00438 00142 00434 00001 00001Llanganuco 013 00001 00019 00013 00001 00001Chancos 009 030 00001 0 00001 00001Huaraz 013 020 029 0 0 0Querococha 009 022 038 051 0 00001Pachacoto 031 030 031 035 040 0La Recreta 030 029 032 037 029 054
Baraer and others Glacier recession and water resources in Perursquos Cordillera Blanca 143
that would characterize dataset bias related to gaps in thehistorical data This supports the assumption made earlierthat these gaps did not generate mis-estimation of the trends
45 Model simulationsTo test the model sensitivity six synthetic sets of time serieswere generated The median scenario (Fig 4a) visually
conforms to the expected hydrologic progression (seecitations in section 3) While the glacier area is continuallydecreasing both the annual average discharge and the dry-season discharge experience a period of increase followedby a period of decrease and then a period of stabilizationbelow the initial levels The ending dry-season discharge isapproximately 50 lower than at the beginning while the
Table 7 Coefficients of determination (R2) and their associated statistical significance (p-value) calculated between the precipitation recordsfrom the three closest measurement points and the discharge parameters of each gauging station R2 values equal to or over 02 associatedwith a p-value above 01 are in bold
Station Precipitationmeasurement point
Q Qd Qmin Cv
R2 p-value R2 p-value R2 p-value R2 p-value
Chancos Llanganuco 000 09491 001 0661 001 05929 006 01417Chancos 010 00589 000 09826 000 08997 007 01199Huaraz 015 00183 000 08897 002 03476 017 00106
Colcas Paron 002 04537 004 02788 003 02895 022 0005Llanganuco 000 0751 001 04965 004 02447 019 00082Chancos 006 01547 004 02678 000 08953 000 09736
La Balsa Chancos 024 0001 001 06441 000 07952 018 00068Huaraz 032 210ndash4 000 09639 000 09126 033 10ndash4
Querococha 009 00584 000 07185 001 05549 008 00748La Recreta Querococha 039 0 013 00261 002 0347 017 00091
Pachacoto 061 0 039 0 013 00263 015 00131La Recreta 067 0 037 0 013 00219 005 01547
Llanganuco Paron 005 02007 003 03251 001 05263 013 00238Llanganuco 001 04672 003 03265 008 00871 033 210ndash4Chancos 011 00397 001 05515 000 07421 011 00414
Los Cedros Paron 003 02572 000 07115 000 08282 007 00967Llanganuco 033 10ndash4 007 00981 002 0341 023 0002Chancos 019 0005 005 01857 000 09562 045 0
Pachacoto Querococha 032 210ndash4 002 04479 001 05795 010 00528Pachacoto 051 0 002 0346 003 03189 023 0002La Recreta 055 0 003 03048 003 02737 016 00131
Paron Paron 017 00287 016 00378 019 00216 010 01018Llanganuco 004 03303 012 00738 013 00592 017 00272Chancos 010 01051 005 02697 004 03013 003 03557
Querococha Huaraz 040 0 004 02344 017 00075 013 00217Querococha 068 0 004 02301 013 00199 026 710ndash4Pachacoto 049 0 002 03719 000 07775 023 0002
Table 8 Model performance evaluation The lsquoLinear trendsrsquo and lsquoQuad trendsrsquo columns provide a comparison of the number of observed(Obs) significant trends in the time series and the number of matching trends in the modeled results (Mod) for linear and quadraticregressions respectively The lsquoQn Q0rsquo column shows the error calculation components for the Qn Q0 ratios
Station Linear trends Quad trends QnQ0
Obs Mod Obs Mod Obs Mod Error
Chancos 0 3 3 122 097 ndash025Colcas 0 3 3 088 089 001La Balsa 2 2 4 4 106 093 ndash013La Recreta 3 3 5 5 066 100 034Llanganuco 0 2 2 105 091 ndash014Los Cedros 1 1 2 2 094 099 005Pachacoto 0 1 1 084 101 017Paron 4 3 3 3 142 105 ndash038Querococha 0 4 4 106 101 ndash005
match=90 match=100 MAE 017match overall = 97
The linear negative trend in the coefficient of variability of discharge for the Paron dataset was incorrectly replicatedMean absolute error
Baraer and others Glacier recession and water resources in Perursquos Cordillera Blanca144
ending annual average discharge declines by no more than10 of its initial level The maximum dry-season dischargeoccurs approximately 10 years before the maximum annualaverage discharge The period of increasing discharge isshorter than the decreasing and stabilization periodscombined In contrast to what was observed for averagedischarge the coefficient of variation first decreased slightlyfor more than 50 years and then increased rapidly until itstabilized at a value that is approximately 50 higher
When the same simulation is run with a higher initialglacierized area (Fig 4b) we see an important change in theamplitude of the output parametersrsquo variation The variationtempo remains similar to that obtained using scenario a butall the minima are lower and the maximum is higher withscenario b This is visually evident in the case of thecoefficient of variation whose final value is approximately150 that of scenario a The difference in scenario c (Fig 4c)is less pronounced Although a change in amplitude isobserved it is minor if we consider that the watershed area isfive times that of scenario a Starting with an initial annualglacier area loss of 05 instead of 0 (Fig 4d) leads to a muchgreater difference None of the discharge values shows aperiod of increase while the coefficient of variation increasescontinuously End values are different from those achievedwith scenario a as mean annual and dry-season dischargesend lower while the coefficient of variation is higher
Changing the annual rate of glacier area loss to a linearfunction (Fig 4e) does not affect the end values For thiscase the rate of change is affected with maximumdischarge values (minimum for Cv) occurring earlier thanin scenario a These extreme values are of slightly higheramplitude as well Similarly the last tested scenario (Fig 4f)
preserves the end values computed with scenarios a c and ebut amplifies the intermediate fluctuation The amplifica-tion which is caused by an extreme glacier area loss appliedto the first 30 years of the simulation is the largest observedamong the six datasets The strong model response to thefirst n increase wave is not replicated in the second andthird waves Peaks in the discharge average and coefficientof variation are of low amplitude in the second wave and notdetectable in the third
Overall the sensitivity analysis shows that the watershedarea has the least effect on the simulations It supports thehypothesis that not only is Agl0 critical to determining howglaciers influence a watershedrsquos hydrology but also that the rate of glacier area loss is critical Regardless ofscenario the complete disappearance of glaciers alwaysled to a decrease in annual discharge an even greaterdecrease in dry-season discharge and an increase invariability The sequence of a single increase followed by adecrease in discharge is for continuous retreat scenariosWith a fluctuating glacier area (scenario f) local minima andmaxima are simulated but the hydrological response de-creases and approaches zero as the glacier area decreases
We used the lsquomedianrsquo scenario which is based on a quasi-exponential increase of n and on the studied watershedsrsquocharacteristics to depict typical hydrological impact phases(Fig 5) The evolution of hydrological parameters under thelsquomedianrsquo glacier retreat scenario enables us to distinguishfour impact phases Phase one the early stages of deglaci-ation is characterized by a smooth increase in dry-seasonand yearly average discharge due to a smooth initialdeglaciation and ends when the coefficient of variationreaches its minimum In phase two the increase in annual
Fig 4 Results of sensitivity analysis simulation The thick black lines and the blue lines are the mean annual and dry-season dischargerespectively the yellow dashed line is the annual discharge coefficient of variation the red dotted line is the glacierized area and the greendash-dotted line is the applied annual rate of glacier area loss All parameters are given relative to year zero values (a) presents the lsquoMedianrsquoscenario output while the other five graphs are variants described in Table 3 (b) Agl0 increase (c) AT increase (d) 0 increase (e) linear nincrease and (f) oscillating n
Baraer and others Glacier recession and water resources in Perursquos Cordillera Blanca 145
average discharge slows until it reaches its maximum whilethe dry-season discharge increases and then declines and thecoefficient of variation begins to increase Phase three startsfrom the maximum average annual discharge and covers thepronounced decline in discharges and the correspondingincrease in the coefficient of variation Phase four includesthe end of the glacier influence on outflows when changes in
discharges are progressively less pronounced asymptoticallyreaching a non-glacierized basin state
This four-phase sequence is based on a continuouslyincreasing rate of ice area loss As observed in thesensitivity analysis deviations from this path may changethe phase sequence However the probability of thisoccurring decreases as we move away from highly glacier-ized conditions Returning to a phase two from a late phasethree or a phase four would necessitate either extremelyhigh rates of deglaciation or a new long-term glacialexpansion The likelihood of this happening is notsupported by recent climate change projections (Urrutiaand Vuille 2009)
Each watershed is interpreted individually by comparingthe significant trends in measured discharge to thedefinition of the impact phase (Table 9) This interpretationapplies to the final year of observations used in the trendanalysis Significant trends in discharge parameters thatshow possible influence from precipitation data (three intotal) are excluded from the phase allocation exercise(described above in Section 34) Results from the phasedetermination suggest that seven of the nine studiedwatersheds are in impact phase three One watershed LaRecreta shows characteristics of phase four and another
Fig 5 lsquoTypicalrsquo glacier retreat hydrological impact phases(delimited and labelled in red) The thick black line and the blueline represent the mean annual and dry-season discharge respect-ively and the yellow dashed line corresponds to the annualdischarge coefficient of variation As the phases are conceptualaxes are kept unit-free
Table 9 Trends associated with the lsquotypicalrsquo glacier retreat model compared to measured trends The symbols used for trend description arelsquo+rsquo for an increase lsquondashrsquo for a decrease lsquo+ndashrsquo for an increase followed by a decrease and lsquondash0rsquo for a decrease followed by parameterstabilization The lsquoPhasesrsquo rows summarize phase definitions Reproduced watershed data are indicated for statistically significant trendsonly (Table 5) In case of trends that were split by quadratic regression the year separating the two sub-periods is given in parenthesesTrends excluded from the phase allocation due to possible precipitation influence are in gray The cause of rejection is presented in thelsquoPossible precipitation influencersquo column The watershed names are followed by the year to which the interpretation statement applies
Q Qd Qmin Cv Possible precipitationinfluence
Phases No
Phases 1 + + + ndash2 + gt+ndash +ndash +3 ndash ndash ndash +4 ndash0 ndash0 ndash0 +0
Chancos 1996 linear 2 until 1980 thenphase 3quad1 + (1980)
quad2 ndash (1980) ndash (1974)Colcas 1996 linear 1 until 1959 and 3
from 1972quad1 ndash (1959)quad2 ndash (1972) ndash (1971)
La Balsa 2008 linear ndash + Cv Huaraz 3 from 1970quad1 ndash (1994) ndash (1992)quad2 ndash (1994) + (1970)
La Recreta 1995 linear ndash ndash ndash 3 and possibly 4 from1982quad1 ndash (1980) ndash (1984) + (1976) Qd La Recreta
quad2 ndash (1980) ndash (1984)Llanganuco 2009 linear 2 until 1988 then 3
quad1 + (1988)quad2 ndash (1988)
Los Cedros 1999 linear ndash 3 since 1962quad1 + (1962)quad2 ndash (1962)
Pachacoto 1996 linear Possibly 3 since 1962quad1 + (1962)quad2
Paron 1983 linear + + + ndash 1quad1quad2 + (1962) + (1958) + (1958)
Querococha 1995 linear 2 until 1976 then 3quad1 + (1975) + (1975) Q Querocochaquad2 ndash (1976) ndash (1976)
Baraer and others Glacier recession and water resources in Perursquos Cordillera Blanca146
Paron is still in phase one at the end of the studieddischarge time series With an overall linear regression-based decrease in dry-season discharge La Balsa exhibitswatershed characteristics of phase three A transition fromphase two possibly occurred around 1970 the year inwhich the increase in Cv becomes significant based on thequadratic regression-based analysis although this possi-bility is not confirmed by other parameters The fact that onthe second sub-period an increase in Cv is measured inparallel to the dry-season discharge reduction is anindication that glacial factors are at least partially the causefor the measured decrease in discharge
None of the 38 measured significant trends used in thisstudy contradicted each other in phase allocation confirm-ing the modelrsquos ability to simulate the impact of long-termglacier retreat on regional stream discharge trends
46 Glaciersrsquo potential to further influencehydrological regimesThe rapid-retreat simulation results relate
RQthorn andQend Q0
values to initial Agl0and 0 conditions (Fig 6)RQthorn values
are relative as the highest values represent a high potentialfor generating further increase in discharge and the lowestvalues a low potential
RQthorn values vary from 0 to 18 The
lowest values (0ndash1) represent an almost negligible capacityof a glacierized area to generate a significant flow increaseeven under the extreme retreat rates used in this set ofsimulations In contrast the highest values characterizewatersheds where discharge parameters are highly sensitiveto changes in glacier retreat path QendQ0 values vary from01 to 1 The lowest values obtained for the dry season
represent drastic stream discharge reductions while valuesabove 09 will have a low impact on water resources
The results show the critical role of 0 in a glacierizedwatershedrsquos response to glacial retreat especially for glacialcover greater than 5 A watershed that has a 25glacierized area for example shows annual
RQthorn values
that range from almost 0 to 10 depending on the value of 0and is even more pronounced when only the dry season isconsidered The same situation is observed with the QendQ0
ratio where changes in 0 can decrease the projected loss indischarge once the glacier is melted by more than 40
We estimate the studied watershedsrsquoRQthorn and Qend Q0
values by comparing their characteristics to the rapid-retreatscenarios (Fig 6) With the lowest
RQthorn values La Recretarsquos
and Querococharsquos discharge should not experience aglacierized area-loss-related measurable increase in annualor dry-season discharge Once the glaciers have completelydisappeared the discharge at La Recreta should remainalmost unchanged compared to the present level whileQuerococha should exhibit a slight dry-season decline
Future glacier influence should be slightly greater forPachacoto even if there is a low probability of an increase inmelt-related average discharge The main difference be-tween Querococha and Pachacoto is in their dry-seasonQendQ0 ratios which are about 08 and 06 respectively
In the long term Paron is the watershed that shouldexperience the most drastic glacier retreat impact Not onlydo its glaciers present the highest potential to generateretreat-related discharge increases at yearly and dry-seasonlevels but with the complete disappearance of glaciers thedry-season discharge could decline to less than 40 of its
Fig 6 Variations ofRQthorn (top graphs) and QendQ0 (bottom graphs) for the rapid-retreat simulations as a function of percentage of
glacierized area and the annual rate of ice area loss Colors represent values ofRQthorn (indicator of the glacierrsquos capacity to further increase
the watershed flows) and of QendQ0 (starting and ending simulated discharge ratio) Full year simulations appear on the left and dry-seasonsimulations are reported at the right All parameters are dimensionless
Baraer and others Glacier recession and water resources in Perursquos Cordillera Blanca 147
present level Yearly discharge averages would also de-crease but to about 70 of their present level
Colcas and Los Cedros have almost the same glacierizedarea percentage and annual rates of ice area loss These twowatersheds have
RQthorn values that are among the highest
although their QendQ0 ratios are close to the average Thesecharacteristics suggest that the potential for an increase indischarge is among the highest but that the drop in flowsafter the glaciers have receded will be less drastic than forChancos or Llanganuco the latter being predicted todecrease by more than 60 compared with the actualdry-season regime Plots of La Balsa
RQthorn values and Qend
Q0 ratios vary between extremes When a full year isconsidered the potential to further increase discharge due toglacier retreat acceleration is very low Similarly the QendQ0 ratio remains high around 09 for the full year averageThe dry-season situation is different as the
RQthorn value for La
Balsa is average while the QendQ0 ratio is approximately07 A loss of 30 of the dry-season discharge at that stationwould not be without consequences especially whenconsidering that on some occasions the Rıo Santa almostdries up before it reaches the Pacific Ocean
5 CONCLUSIONGlaciers are major components of the hydrological system inmany tropical Andean watersheds making their ongoingretreat a threat to water resources Predicting the exactconsequences of glacial retreat is difficult due to thecomplexity and scales of the processes involved OurASTER-based measurements of recent glacier changesindicate that glacier recession is accelerating in the RıoSanta upper watershed with the overall glacierized areadecreasing annually by 081 between 1990 and 2009
To assess past and present influences of glaciers on streamdischarge we reanalyzed historical and modern dischargedata from the Cordillera Blanca Using a combination ofregression and trend analyses we found statistically signifi-cant indications that these systems have crossed a criticalthreshold and now exhibit decreasing annual and dry-season discharge La Balsa station which measures dis-charge from the upper Rıo Santa is undergoing a decline indry-season flow that probably began during the 1970s Theweak correlation that exists between the discharge par-ameters and precipitation supports the hypothesis that thesetrends are driven by the glacier retreat measured during thesame period
The link between glacial retreat and water resources isanalyzed by the use of a simple water balance model Itsimulates how glacier retreat can influence the annual anddry-season discharge as well as the annual dischargevariability and reveals four impact phases of the resultinghydrological changes Examining historical records andfitting them to these phases suggests a declining contributionof meltwater to the studied watershed outflows At somewatersheds like Querococha La Recreta Pachacoto and LaBalsa the decline in discharge is likely not reversible Thedecrease in the dry-season discharge should thereforecontinue for many decades as the watersheds enter anasymptotic decrease phase prior to the glaciersrsquo completeloss of influence on hydrologic regimes Once the glaciersare completely melted the discharge will likely be lowerthan today In particular dry-season discharge may decrease
more than 60 from present for Paron and Llanganuco AtLa Balsa dry-season average discharge should decline to70 of current levels
The model sensitivity analysis confirms that the initialglacierized area is a major driver of glacier influence onhydrology It also shows that unlike the total watershedarea annual rate of ice area loss is as important as the initialglacierized area
Although the upper Rıo Santa watershed still has andshould maintain abundant water resources when annualtotal discharge is considered the dry-season situation isclearly different A decline in dry-season surface wateravailability has probably already begun and should con-tinue Considering the vulnerability of the local populationto climate change and declining water resources (Bury andother 2011) our results can represent a future socialecological and economic concern
Despite the overall consistency of the results of thepresent research it must be recognized that they maypossibly be influenced by uncertainty related to datainterpolation and glacierized area estimation The methodwe used is promising and could potentially be applied toother regions of the world However the findings that resultfrom its application to the Cordillera Blanca need to beconfirmed by other means In addition the methodrsquosaccuracy should be further tested through future studies
ACKNOWLEDGEMENTSWe are grateful for the historical discharge informationprovided by Abel Rodriguez and Duke Energy Peru and forthe funding provided by the US National Science Founda-tion (BCS-0752175) The Ohio State Universityrsquos ClimateWater and Carbon Program and McGill University Wethank Robert Carver for insightful comments
REFERENCESAlford D and Armstrong R (2010) The role of glaciers in stream flow
from the Nepal Himalaya Cryos Discuss 4(2) 469ndash494Ames A and Hastenrath S (1996) Diagnosing the imbalance of
Glaciar Santa Rosa Cordillera Raura Peru J Glaciol 42(141)212ndash218
Bahr DB (1997) Global distributions of glacier properties astochastic scaling paradigm Water Resour Res 33(7)1669ndash1679
Bahr DB Meier MF and Peckham SD (1997) The physical basis ofglacier volumendasharea scaling J Geophys Res 102(B9)20 355ndash20 362
BaraerMMcKenzie JMMark BG and Palmer S (2007) An integratedhydrochemical and hydrological approach to modeling runoff inglacier-fed basins Cordillera Blanca Peru In Glaciers in Water-shed and Global Hydrology International Commission for Snowand Ice Hydrology Workshop 27ndash31 August 2007 ObergurglAustria [Abstract]
Baraer M McKenzie JM Mark BG Bury J and Knox S (2009a)Characterizing contributions of glacier melt and groundwaterduring the dry season in a poorly gauged catchment of theCordillera Blanca (Peru) Adv Geosci 22 41ndash49
Baraer M McKenzie JM Mark BG and Knox S (2009b) Nature andvariability of water resources in the Rio Santa upper watershedPeru [Abstr H74A-01] In AGUndashCGU Joint Assembly 24ndash27 May 2009 Toronto Ontario Canada American GeophysicalUnion Washington DC (httpadsabsharvardeduabs2009AGUSMH74A01B)
Baraer and others Glacier recession and water resources in Perursquos Cordillera Blanca148
Barnett TP Adam JC and Lettenmaier DP (2005) Potential impactsof a warming climate on water availability in snow-dominatedregions Nature 438(7066) 303ndash309
Birsan M-V Molnar P Burlando P and Pfaundler M (2005)Streamflow trends in Switzerland J Hydrol 314(1ndash4) 312ndash329
Bradley RS Vuille M Diaz HF and Vergara W (2006) Threats towater supply in the tropical Andes Science 312(5781)1755ndash1756
Braun LN Weber M and Schulz M (2000) Consequences of climatechange for runoff from Alpine regions Ann Glaciol 31 19ndash25
Brown LE Milner AM and Hannah DM (2010) Predicting riverecosystem response to glacial meltwater dynamics a case studyof quantitative water sourcing and glaciality index approachesAquat Sci 72(3) 325ndash334
Bury JT and 7 others (2011) Glacier recession and humanvulnerability in the Yanamarey watershed of the CordilleraBlanca Peru Climatic Change 105(1ndash2) 179ndash206
Chevallier P Pouyaud B Suarez W and Condom T (2010) Climatechange threats to environment in the tropical Andes glaciers andwater resources Reg Environ Change 11 Suppl 1 179ndash187
Collins DN (2008) Climatic warming glacier recession and runofffrom Alpine basins after the Little Ice Age maximum AnnGlaciol 48 119ndash124
Collins DN and Taylor DP (1990) Variability of runoff frompartially-glacierised alpine basins IAHS Publ 193 (Symposiumat Lausanne 1990 ndash Hydrology in Mountainous Regions IHydrological Measurements the Water Cycle) 365ndash372
Dingman SL (2002) Physical hydrology 2nd edn Waveland PressLong Grove IL
Georges C (2004) 20th century glacier fluctuations in the tropicalCordillera Blanca Peru Arct Antarct Alp Res 36(1) 100ndash107
Hagg W and Braun L (2005) The influence of glacier retreat onwater yield from high mountain areas comparison of Alps andcentral Asia In De Jong C Ranzi R and Collins D eds Climateand hydrology in mountain areas Wiley Chichester 263ndash275
Hannah DM Sadler JP and Wood PJ (2007) Hydroecology andecohydrology a potential route forward Hydrol Process21(24) 3385ndash3390
Hastenrath S and Ames A (1995) Diagnosing the imbalance ofYanamarey Glacier in the Cordillera Blanca of Peru J GeophysRes 100(D3) 5105ndash5112
Hirsch RM and Slack JR (1984) A nonparametric trend test forseasonal data with serial dependenceWater Resour Res 20(6)727ndash732
Hofer M Molg T Marzeion B and Kaser G (2010) Empiricalndashstatistical downscaling of reanalysis data to high-resolution airtemperature and specific humidity above a glacier surface(Cordillera Blanca Peru) J Geophys Res 115(D12) D12120(doi 1010292009JD01255)
Huss M Farinotti D Bauder A and Funk M (2008) Modelling runofffrom highly glacierized alpine drainage basins in a changingclimate Hydrol Process 22(19) 3888ndash3902
Huss M Jouvet G Farinotti D and Bauder A (2010) Future high-mountain hydrology a new parameterization of glacier retreatHydrol Earth Syst Sci 14(5) 815ndash829
Jansson P Hock R and Schneider T (2003) The concept of glacierstorage a review J Hydrol 282(1ndash4) 116ndash129
Juen I Kaser G and Georges C (2007) Modelling observed andfuture runoff from a glacierized tropical catchment (CordilleraBlanca Peru) Global Planet Change 59(1ndash4) 37ndash48
Kalthoff N and 6 others (2006) The energy balance evapo-transpiration and nocturnal dew deposition of an arid valley inthe Andes J Arid Environ 65(3) 420ndash443
Kaser G and Georges C (1999) On the mass balance of low latitudeglaciers with particular consideration of the Peruvian CordilleraBlanca Geogr Ann 81A(4) 643ndash651
Kaser G and Osmaston H (2002) Tropical glaciers CambridgeUniversity Press Cambridge
Kaser G Juen I Georges C Gomez J and Tamayo W (2003) Theimpact of glaciers on the runoff and the reconstruction of mass
balance history from hydrological data in the tropical CordilleraBlanca Peru J Hydrol 282(1ndash4) 130ndash144
Kaser G Grosshauser M and Marzeion B (2010) Contributionpotential of glaciers to water availability in different climateregimes Proc Natl Acad Sci USA (PNAS) 107(47)20 223ndash20 227
Kistin EJ Fogarty J Pokrasso RS McCally M and McCornick PG(2010) Climate change water resources and child health ArchDisease Childh 95(7) 545ndash549
Koboltschnig GR and Schoner W (2010) The relevance of glaciermelt in the water cycle of the Alps an example from AustriaHydrol Earth Syst Sci Discuss 7(3) 2897ndash2913
Kundzewicz ZW and 6 others (2005) Trend detection in river flowseries 1 Annual maximum flow Hydrol Sci J 50(5) 797ndash810
Lambrecht A and Mayer C (2009) Temporal variability of the non-steady contribution from glaciers to water discharge in westernAustria J Hydrol 376(3ndash4) 353ndash361
Mann HB (1945) Nonparametric tests against trend Econometrica13(3) 245ndash259
Marengo JA (1995) Variations and change in South Americanstreamflow Climatic Change 31(1) 99ndash117
Mark BG and McKenzie JM (2007) Tracing increasing tropicalAndean glacier melt with stable isotopes in water Environ SciTechnol 41(20) 6955ndash6960
Mark BG and Seltzer GO (2003) Tropical glacier meltwatercontribution to stream discharge a case study in the CordilleraBlanca Peru J Glaciol 49(165) 271ndash282
Mark BG McKenzie JM and Gomez J (2005) Hydrochemicalevaluation of changing glacier meltwater contribution to streamdischarge Callejon de Huaylas Peru Hydrol Sci J 50(6)975ndash987
Mark BG Bury J McKenzie JM French A and Baraer M (2010)Climate change and tropical Andean glacier recessionevaluating hydrologic changes and livelihood vulnerability inthe Cordillera Blanca Peru Ann Assoc Am Geogr 100(4)794ndash805
Milner AM Brown LE and Hannah DM (2009) Hydroecologicalresponse of river systems to shrinking glaciers Hydrol Process23(1) 62ndash77
Moore RD and 7 others (2009) Glacier change in western NorthAmerica influences on hydrology geomorphic hazards andwater quality Hydrol Process 23(1) 42ndash61
Nolin AW Phillippe J Jefferson A and Lewis SL (2010) Present-dayand future contributions of glacier runoff to summertime flows ina Pacific Northwest watershed implications for water resourcesWater Resour Res 46(12) W12509 (doi 1010292009WR008968)
Ohmura A (2001) Physical basis for the temperature-based melt-index method J Appl Meteorol 40(4) 753ndash761
Pouyard B and 6 others (2005) On the future of the water resourcesfrom glacier melting in the Cordillera Blanca Peru Hydrol SciJ 50(6) 999ndash1022
Rabatel A Machaca A Francou B and Jomelli V (2006) Glacierrecession on Cerro Charquini (168 S) Bolivia since the max-imum of the Little Ice Age (17th century) J Glaciol 52(176)110ndash118
Racoviteanu AE Arnaud Y Williams MW and Ordonez J (2008)Decadal changes in glacier parameters in the Cordillera BlancaPeru derived from remote sensing J Glaciol 54(186) 499ndash510
Racoviteanu AE Paul F Raup B Khalsa SJS and Armstrong R (2009)Challenges and recommendations in mapping of glacier par-ameters from space results of the 2008 Global Land IceMeasurements from Space (GLIMS) workshop Boulder Color-ado USA Ann Glaciol 50(53) 53ndash69
Ramırez E and 8 others (2001) Small glaciers disappearing in thetropical Andes a case-study in Bolivia Glaciar Chacaltaya(168 S) J Glaciol 47(157) 187ndash194
Raup BH Khalsa SJS Armstrong R Helm C and Dyurgerov M(2008) GLIMS progress in mapping the worldrsquos glaciers InLacoste H and Ouwehand L eds IGARSS rsquo07 International
Baraer and others Glacier recession and water resources in Perursquos Cordillera Blanca 149
Geoscience and Remote Sensing Symposium 23ndash27 July 2007Barcelona Spain Proceedings Institute of Electrical andElectronics Engineers Piscataway NJ 3991ndash3993
Soruco A and 9 others (2009) Mass balance of Glaciar ZongoBolivia between 1956 and 2006 using glaciological hydro-logical and geodetic methods Ann Glaciol 50(50) 1ndash8
Stahl K and Moore D (2006) Influence of watershed glaciercoverage on summer streamflow in British Columbia CanadaWater Resour Res 42(6) W06201 (doi 1010292006WR005022)
Suarez W Chevallier P Pouyaud B and Lopez P (2008) Modellingthe water balance in the glacierized Paron Lake basin (WhiteCordillera Peru) Hydrol Sci J 53(1) 266ndash277
Uehlinger U Robinson CT Hieber M and Zah R (2010) Thephysico-chemical habitat template for periphyton in alpineglacial streams under a changing climate Hydrobiologia657(1) 107ndash121
Urrutia R and Vuille M (2009) Climate change projections for thetropical Andes using a regional climate model temperature andprecipitation simulations for the end of the 21st centuryJ Geophys Res 114(D2) D02108 (doi 1010292008JD011021)
Vergara W and 7 others (2007) Economic impacts of rapid glacierretreat in the Andes Eos 88(25) 261
Viviroli D and 14 others (2010) Climate change and mountainwater resources overview and recommendations for researchmanagement and politics Hydrol Earth Syst Sci 7(3)2829ndash2895
Vuille M and 6 others (2008a) Climate change and tropicalAndean glaciers past present and future Earth-Sci Rev89(3ndash4) 79ndash96
Vuille M Kaser G and Juen I (2008b) Glacier mass balancevariability in the Cordillera Blanca Peru and its relationshipwith climate and the large-scale circulation Global PlanetChange 62(1ndash2) 14ndash18
Winkler M Juen I Molg T Wagnon P Gomez J and Kaser G (2009)Measured and modelled sublimation on the tropical GlaciarArtesonraju Peru Cryosphere 3(1) 21ndash30
Xu Z Liu Z Fu G and Chen Y (2010) Trends of major hydroclimaticvariables in the Tarim River basin during the past 50 yearsJ Arid Environ 74(2) 256ndash267
Yue S and Pilon P (2004) A comparison of the power of the t testMannndashKendall and bootstrap tests for trend detection HydrolSci J 49(1) 21ndash37
MS received 2 September 2011 and accepted in revised form 28 November 2011
Baraer and others Glacier recession and water resources in Perursquos Cordillera Blanca150
discharge characteristics To reach these objectives weapply the MannndashKendall method in analyzing trends in dailyaverage historical discharge records from nine glacierizedwatersheds We present a new water-balance model thatsynthesizes hydrographs for different basin parameters andglacier retreat scenarios This model validated to trends inthe historical field data allows us to refine the theoreticalcurves of glacier retreat influence on hydrological regimesand to anticipate how these regimes will continue to changein the future
2 STUDY SITEThe upper Rıo Santa watershed in northern Peru capturesrunoff from the Cordillera Negra to the west with a dryclimate and no glaciers (Mark and McKenzie 2007 Suarezand others 2008) and the Cordillera Blanca to the eastwhich receives more precipitation and is Earthrsquos mostglacierized tropical mountain range The glacier coverageof the Cordillera Blanca has declined from 800ndash850 km2 in1930 to slightly less than 600 km2 at the end of the 20thcentury (Georges 2004) The majority of glaciers terminatein watersheds that are drained by the Rıo Santa to the PacificOcean (Fig 1) In the Rıo Santa meltwater provides 10ndash20of the total annual discharge and may exceed 40 in thedry season (Mark and Seltzer 2003) The region has a strongprecipitation seasonality which is typical of the outer tropicswhere more than 80 of precipitation falls between
October and April and the austral winter receives almostno precipitation In addition the average annual airtemperature is less variable than daily temperature Glacialablation occurs continually through the year althoughsublimation reduces the melt rate during the dry season tosome extent Accumulation on the other hand occursmainly during the wet season and only on the higher-elevation portions of the glaciers (Kaser and others 2003)
The Canon del Pato 50MW hydroelectric generation plantlocated at Huallanca on the Rıo Santa defines the outflow of a5000 km2 watershed that captures runoff from the majority ofthe glacierized valleys of the Cordillera Blanca Starting whenthe dam was put into operation the watershedrsquos streamflowhas been carefully monitored As a result many of theglacierized Santa tributaries were equippedwith stream stageand precipitation gauges starting in the 1950s Regrettablythe long-standing gauge network fell into disrepair at the endof the 20th century in the midst of reforms that privatizedhydroelectric generation (Carey 2010) By the beginning ofthe 21st century only three of the stream stage stations ndash LaBalsa (situated just upstream of the power plant) Paron andLlanganuco ndash remained in operation or had been reactivatedafter an interruption of several years
3 METHODOLOGY
31 Data acquisition and screeningIn 2008 Ohio State University McGill University theFrench Institut de Recherche pour le Developpement (IRD)and the Peruvian glaciology unit of the Autoridad Nacionaldel Agua (ANA) launched a joint project to improve thestream-gauging station network throughout the CordilleraBlanca Of a total of 13 stations put into operation in 2008and 2009 five were at historical network measurementpoints (Fig 1) Chancos La Recreta Pachacoto Querocochaand Miraflores (the latter not used in this study)
The stations presented in this study are equipped with twoSolinst 3001 Levelogger series pressure transducers Onetransducer is placed into the water at a depth that ensuresconstant immersion and a second transducer is placedabove the maximum water level to measure atmosphericpressure The water level is calculated by subtracting theatmospheric pressure from the total pressure measured bythe submerged transducer Both sensors record the pressureat synchronous 15min intervals and for the purpose of thisstudy records are averaged to daily values Water levels areconverted to discharges using standard hydrological tech-niques (Dingman 2002)
In addition to the new discharge data we analyzed theoriginal historical discharge dataset which begins in 1952and includes time series for 17 stations A quality-controlanalysis of the time series was used to prevent interpretationerrors Suspect drops peaks or plateaus disqualified portionsof a stationrsquos record Missing data and interruptions in recordswere evaluated for possible interpolation in order to avoidthe losses of valuable data which arise from the outrightrejection of years with gaps At the same time the followingrules were developed to prevent filling data gaps inappro-priately (1) gaps of less than 7 days were systematically filledusing linear interpolation between the two points delimitingthe gap (2) for gaps greater than 7 days a decision was madecase by case with linear or polynomial interpolation appliedwhere there was no risk of corrupting the time series
Fig 1 The Cordillera Blanca and locations of the precipitationmeasurement stations (circles) and discharge measurement stations
Baraer and others Glacier recession and water resources in Perursquos Cordillera Blanca 135
(3) years that had remaining gaps were systematicallyrejected and (4) time series for which more than 12 yearswere rejected were not considered for the study Of the 17stations only 9 were found suitable for the trend analysisbased on these criteria About 6000 (less than 5) of the132000 daily discharge values were derived from inter-polation (Table 1) A total of 66 years of data were rejecteddue to potentially insufficient data quality Despite the effortsand major discarding made during the data screening itremains possible that the interpolation could have affectedthe quality of the datasets This risk characteristic ofhistorical data research has to be considered wheninterpreting the study results though by following our strictcriterion these problems should be minimized
In the historical dataset Paron represents a special caseBeginning in the mid-1980s after several years of civilengineering work the level of Lake Paron was regulated by adrainage tunnel Therefore even though the discharge at thelake outlet continued to be monitored it was inappropriateto use these records for the purpose of the present study
Precipitation records originally included time series for36 measurement points with the oldest starting in the late1940s and the most recent ending in the early 2000s As theoriginal data quality differed from location to location agroup of seven measurement points was selected for areconstituted time series for 1954ndash99 (Pouyaud and others2005) In the present study we make use of these seven timeseries (Paron Llanganuco Chancos Huaraz QuerocochaPachacoto and La Recreta) to study precipitation trends forthe Cordillera Blanca region (Fig 1)
32 Trend analysisThe impact of glacier retreat on medium to large watershedsincludes changes in annual discharge dry-season dischargeand flow variability (eg Braun and others 2000 Janssonand others 2003 Barnett and others 2005 Hagg andBraun 2005 Stahl and Moore 2006 Collins 2008 Mooreand others 2009) Therefore when there is sustained glacierretreat it should be possible to quantify the influence ofglacier retreat on watershed hydrology by identifying trendsin these discharge characteristics
In the present study three discharge characteristics wereused to quantify change in (1) the mean annual dischargeQ (2) the dry-season discharge and (3) the yearly
coefficient of variation in daily discharge Cv As the timingof the dry season may vary slightly from one year to anotherwe used two values for dry-season discharge the dry-seasonaverage Qd and the lowest 10-consecutive-day average fora given year Qmin Qd was computed by averaging dailydischarge from July and August the lowest discharge monthsat La Balsa
The MannndashKendall test (Mann 1945) a nonparametricdistribution-free method was used to identify significanttrends in Q Qd Qmin and Cv time series and to differentiatebetween significant evolution of annual parameters andrandom variations This test was used in numerous hydro-logical studies (eg Hirsch and Slack 1984 Marengo 1995Kundzewicz and others 2005 Xu and others 2010) andwasjustified by its high efficiency even with non-normalincomplete time series (Yue and Pilon 2004) The sign ofthe standard normal statistic (eg Xu and others 2010)indicates the slope of the trend A positive slope denotes anincrease with time whereas a negative slope indicates adecrease The tested significance levels are 0001 001005 and 01
MannndashKendall tests were performed on all historical timeseries that were found acceptable through the quality controldescribed above The new discharge measurements wereconsidered in the trend analysis where the number of yearsbetween the end of the historical record and the stationrehabilitation time was considered as not liable to bias thetrend analysis As a consequence for datasets that presentmore than 50 of years with missing data over the 1989ndash2009 period the recent measurements are given forinformation only and are not integrated into the historicaltime series used for the trend analysis This criterionalthough not 100 selective was used to ensure the trendanalysis quality while keeping time series as long as possibleIf significant bias were to still arise from these minor temporalgaps it would be detected at the model validation stage (seeSection 44 below)
MannndashKendall tests were applied at two levels At the firstlevel the overall time-series trend was evaluated byconsidering the complete period of the accepted recordsFor stations that had a change in the trend a linear trendcharacterization would have misrepresented the true rate ofparameter change with time Therefore trends on subsets ofthe complete time-series segments were analyzed Possible
Table 1 A description of discharge measurement points drainage basins the discharge time series and the interpolations made lsquoNumber ofyears availablersquo is the number of years with recorded data that were screened for quality control The number in parentheses where shownis the number of these years of data from the new rehabilitated stations
Station Stream Watershed area Period ofrecord
Number ofyears available
Number ofyears selected
Number ofyears with
interpolations
Linearinterpolation
Polynomialinterpolation
km2
Chancos Marcara 221 1953ndash2009 48 (1) 40 22 20 46Colcas Colcas 237 1954ndash99 46 37 15 15 42La Balsa Rıo Santa 4768 1954ndash2008 55 50 21 113 32La Recreta Rıo Santa 297 1952ndash2009 48 (2) 41 10 0 14Llanganuco Llanganuco 85 1954ndash2009 55 (1) 44 31 14 74Los Cedros Los Cedros 114 1952ndash99 48 41 16 11 39Pachacoto Pachacoto 194 1953ndash2009 46 (2) 41 22 04 24Paron Paron 49 1953ndash2009 43 30 13 10 32Querococha Querococha 62 1953ndash2009 47 (1) 43 19 08 30
Baraer and others Glacier recession and water resources in Perursquos Cordillera Blanca136
minima or maxima in the complete time series wereidentified where the derivative of the quadratic regressionequation (for the different parameters of interest) was zero Asecond level of MannndashKendall linear trend analysis was thenapplied to sub-periods corresponding to the time before andafter the year of trend change The same procedure wasapplied to yearly precipitation amounts
33 Trend interpretation modelWe related detected measured trends to changes in glacialhydrological influence by using a simple model of waterbalance This model generates synthetic hydrographs fromthe watershed area the glacierized surfaces and the annualrate of loss of ice area The glacierized coverage of awatershed is a critical parameter that generates disparitiesamong basins in hydrological response to glacial retreat(Birsan and others 2005 Lambrecht and Mayer 2009Alford and Armstrong 2010 Koboltschnig and Schoner2010 Viviroli and others 2010) However the percentage ofglacier area alone is often insufficient to describe glacialinfluence on stream discharge for a given watershed Themelt component of basin discharge is primarily dependenton the energy balance of snow and ice with differentcharacteristics such as hypsometry orientation or density(Ohmura 2001) These factors vary from basin to basincreating differences in hydrological response to glacierretreat Here we account for these variations by using theannual rate of ice area loss
The following water balance equation is used with yearlyaverage values for studied watersheds
Q frac14 S thorn PPthornGWin GWout ET eth1THORNwhere Q is the streamrsquos outflow S is the change in waterstorage over the same period PP is the yearly volume ofprecipitation entering the watershed ET is basin-wideevapotranspiration and GWin and GWout are the ground-water fluxes entering and leaving the watersheds respect-ively Considering that all watersheds studied are situated inmountainous environments we hypothesize that the netwatershed groundwater exchange GWin ndashGWout is verysmall compared to the other components of the waterbalance and can be ignored The evapotranspiration termincludes evaporation from rivers and lakes (ETrl) evaporationfrom bare soil vegetative surfaces (ETngl) and sublimationfrom ice and snow surfaces (Sub) (adapted from Dingman2002) Substituting Eqn (1) then becomes
Q frac14 S thorn PP ETrl ETngl Sub eth2THORNFor time series that are several decades long we considerthat the change of water storage is only dependent on glaciervolume changes with other storage variations balancingover decadal time periods S is therefore assumed to beequivalent to the annual change in glacier volume expressedin water equivalent To account for the amount ofsublimated volume as a factor the PP term is split intoprecipitation that falls on a glacierized area and that whichreaches the ground in non-glacierized areas
Q frac14 Vgl thorn ppAgl dmelt thorn AT Agl
pp etngl ETrl
eth3THORNwhere Vgl is the interannual change in glacier volumeexpressed in water equivalent pp and etngl are the averagedepth of precipitation received and the non-glacierizedevapotranspiration per unit area respectively dmelt is the
fraction of annually ablated ice (or snow or firn) that is notlost by sublimation and Agl and AT are the glacierized areasand total watershed areas respectively
To simplify Eqn (3) we introduce a factor that relatesVgl to the glacierized area Agl Assuming is constant overtime we can consider
frac14 Vgl
Agl2 frac14
Vgl0
Agl02 eth4THORN
where Vgl0 and Agl0 are the initial ice volume and glacierarea respectively
The annual rate of ice area loss is the interannualchange in glacial areaAgl divided by the glacial area Aglof the previous year In a time-series context applyingsimple algebra to this definition for a given year n makes itpossible to relate n to Agln
2 and the glacierized area
Agln to the initial glacier cover Agl0as follows
Agln2
frac14 1 neth THORN2 1
h iAgln1
2
Agln frac14 Agl0
Ynifrac142
1 ieth THORN
8gtgtltgtgt eth5THORN
Combining Eqns (3ndash5) leads to the following expression ofthe annual discharge for a given year n
Qn frac14
dmelt
Agl0
2Yn1ifrac141
1ieth THORN2 1neth THORN21h i
thorn ppnAgl0
Ynifrac142
1ieth THORN
thorn ppn etngl
AT Agl0
Ynifrac142
1 ieth THORN
ETrl
eth6THORNWith Eqn (6) it is possible to estimate the annual averagedischarge using data on precipitation and glacial retreat aswell as the watershed and initial glacierized surfaces Thisassumes that the evapotranspiration terms ETrl and ETngland the sublimation factor (1 ndash dmelt) do not vary signifi-cantly during the study period
When focusing on the dry season a distinction is madebetween fast flow and slow flow for the non-glacierized areaof the watershed Fast flow is defined here as the portion ofprecipitation that reaches the watershed outlet within a fewdays of falling and assumes no loss due to evapotranspira-tion Slow flow is defined as water released from thewatershed over a time-span longer than a few days and isassumed to be mainly groundwater-based Considering thatthe Cordillera Blanca receives almost no precipitationbetween June and September it is assumed that the fast-flow component for the dry season is negligible The dry-season slow-flow discharge qngl accounts for the waterreleased from groundwater minus the specific evapo-transpiration ETngl from non-glacierized areas
Focusing on the dry season requires accounting for theseasonality of the glacier melt rates During the dry seasonthe specific humidity is low and the vertical water-vaporpressure gradient over the glacier surface is generallypositive downward making conditions favorable for sublim-ation to occur and decreasing the amount of energyavailable for total ablation (Winkler and others 2009) Weintroduce defined as the fraction of annual ablation thatoccurs during July and August and use d 0melt instead of dmelt
Baraer and others Glacier recession and water resources in Perursquos Cordillera Blanca 137
to adapt Eqn (6) for dry-season discharge
Qdnfrac14
d 0melt
Agl0
2Yn1ifrac141
1ieth THORN2 1neth THORN21h i
thorn ppnAgl0
Ynifrac142
1ieth THORN
thorn qngl AT Agl0
Ynifrac142
1 ieth THORN
ETrl
eth7THORNAgain it is possible to estimate the average discharge of thedry season using precipitation and the rate of glacial retreattime series as well as the watershed and initial glacierizedsurfaces This assumes that ETrl qngl and the sublimationfactor (1 ndash dmelt) do not vary significantly over the studyperiod
The yearly coefficient of variation of discharge Cv is
Cv frac14
Qfrac14
ffiffiffiffiffiffiffiffiffiffiffiffiffiffiffiffiffiffiffiffiffiffiffiffiffiffiffiffiffiffiffiffiffiffiffiffiffiffiffiffiffiffiffiffiffiffiffiffiffiffiffiffiffiffiffiffiffiffi2Qmelt
thorn 2Qslow
thorn 2Qfast
thorn cov
qQmelt thornQslow thornQfasteth THORN eth8THORN
where Qmelt Qslow and Qfast are the melt slow-flow andfast-flow components of the yearly average dischargerespectively Qmelt Qslow and Qfast are the melt slow-flowand fast-flow standard deviations and cov describes the sumof flow-types pairs covariance If we consider the individualcoefficient of variation for the three flow components asbeing constant over the years the equation is
Cv frac14ffiffiffiffiffiffiffiffiffiffiffiffiffiffiffiffiffiffiffiffiffiffiffiffiffiffiffiffiffiffiffiffiffiffiffiffiffiffiffiffiffiffiffiffiffiffiffiffiffiffiffiffiffiffiffiffiffiffiffiffiffiffiffiffiffiffiffiffiffiffiffiffiffiffiffiffiffiffiffiffiffiffiffiffiffiffiffiffiffiffiffiffiffiffiffiffiffiffiffiffiffiffiffiffiffiffiffiffiCvmeltQmelteth THORN2thorn CvslowQsloweth THORN2thorn CvfastQfasteth THORN2thornP
cov
eth9THORNBased on Eqns (6) (7) and (9) the model generates annualaverage discharge dry-season discharge and dischargecoefficient of variation for periods greater than 10 yearsDue to the diverse assumptions made in the model design itis expected that the trends in modeled parameters as well asthe final (for Agl = 0) versus initial discharge ratios will bemost accurately reproduced
34 Assessing influence of precipitation on dischargetrendsEqns (1ndash6) indicate it is possible to estimate the annualaverage discharge using only precipitation and glacialretreat data if we assume that the evaporation- and sublim-ation-related terms do not vary significantly during the studyperiod This means that characterizing the impact of glacierretreat on discharge first requires characterizing the influ-ence of precipitation
A correlation study between the seven precipitation timeseries at Paron Llanganuco Chancos Huaraz QuerocochaPachacoto and La Recreta (Pouyaud and others 2005) wasused to assess the spatial homogeneity of precipitationacross the region A trend analysis (described earlier) wasalso performed on each time series and the results of bothanalyses were used to further explore the regional variabilityand possible regional patterns of yearly precipitation valuesWe then statistically compared discharge parameters fromall studied watersheds to regional precipitation recordsWhen a lsquominimal correlationrsquo (R202 and p-value 01)was not obtained between Q Qd Qmin or Cv and the yearlyamount of precipitation of the closest measurement points itwas considered that discharge variability cannot be ex-plained by precipitation changes For all cases where a
minimal correlation was detected a new trend analysis wasperformed with the precipitation time series using the sametime periods as the corresponding discharge parameter Incases where significant trends of similar sign (ie positive ornegative) were detected both in precipitation records and indischarge parameter values the discharge parameter trendwas excluded from the result interpretation
In addition to avoid identifying trends related to tem-porary climatic phenomena that could arise from shorteningtime series the discharge dataset was screened for general-ized common patterns in measurements If such a case wasdetected corresponding datasets were similarly excluded
35 Estimation of glacier coverageThe published data on glacierized areas by watershed that weconsidered cover different time periods (1) 1963ndash70 and1997 (Mark and Seltzer 2003) (2) 1990ndash91 (Kaser andothers 2003) (3) 1930 1970 and 1990 (Georges 2004)and (4) 1948 1962 and 1973 (for Yanamarey glacier only)(Hastenrath and Ames 1995) Combining these publisheddata required occasional adjustments to ensure consistentdefinitions of watershed areas There are only minor differ-ences in watershed areas between the first two studies so thecalculation of watershed glacial cover was consideredcomparable for publications 1 and 2 However the extensivedataset in Georges (2004) features a format that presentsglacierized areas by mountain group rather than by water-shed To accurately compare formats we first evaluated theproportion of glaciers in themountain groups of publication 3that drain into the watersheds of publications 1 and 2 andweighted the published glacierized areas accordingly toderive watershed-based glacier coverage for the same years1930 1970 and 1990 The same procedure was applied forthe computation of the Querococha watershed glacierizedarea with publication 4 Overlaps between studies were usedto fine-tune the weighted average factors
Advanced Spaceborne Thermal Emission and ReflectionRadiometer (ASTER) satellite imagery was used for recentestimates of glacier area Despite the lower resolution ofASTER imagery compared to other sources it has providedan important multitemporal data product to map glacierchanges as part of the Global Land Ice Measurements fromSpace (GLIMS) project and the Cordillera Blanca has beenfeatured as a specific case example of the GLIMSapplication (Racoviteanu and others 2008 Raup andothers 2008) We selected images from 2001ndash03 and2009ndash10 with available images that spanned the entiremountain range This necessitated compilations of multipleimages to obtain cloud-free coverage For each time periodwe computed the amount of glacierized coverage bydigitizing glacier boundaries with GIS software The lowertermini were used to evaluate changes in area Delimitingedges between individual glaciers at the upper regions ofwatersheds is inherently uncertain given the steep terrainuniform surface reflectance and limited image resolutionBut because our objective was to compute relative changesin glacierized area aggregated by watershed we did notneed to distinguish between individual glaciers We did notapply ASTER resolution (15m panchromatic) to defineindividual glaciers but rather the changes in total glaciercoverage between periods We calculated the watershedareas using 1 100 000 digitized contours and lakes andrivers from Instituto Geografico Nacional Peru The glacier-ized area of each watershed was calculated based on the
Baraer and others Glacier recession and water resources in Perursquos Cordillera Blanca138
method and recommendations formulated by Racoviteanuand others (2009)
The resulting glacier coverage data were used to computethe annual rate of ice loss for each studied watershedLinear extrapolations were used between the discrete yearsof published or estimated glacierized areas to estimate theannual values required for the model The glacier coveragedata are used to generate synthetic datasets for modelcalibration and were limited to the years matching thoseused for the discharge data trend analysis
36 Model parameterization and validationThe initial parameterization of the model was based onpublished parameter values (Table 2) When directlyapplicable parameters were not available specific par-ameters were developed to estimate them such as the factor that relates the watershed glacierized area Agl to itsvolume Vgl (see Eqn (4)) We used the glacier volumendashareapower relationship (Bahr 1997 Bahr and others 1997) todetermine the relationship between the volume of a singleglacier and its surface area in the Cordillera Blanca Astropical glaciers are generally thinner than alpine glaciersdue to their relatively high inclination (Kaser and Ost-maston 2002) the scaling factor of the power equation wascomputed based on published local volumes and areas Weused published glacier volumes or mass balances for glacierssituated in the tropical Andes in Bolivia (Ramirez and others2001 Rabatel and others 2006 Soruco and others 2009)and in Peru (Hastenrath and Ames 1995 Ames andHastenrath 1996) Using the scaling exponent of 1375suggested by Bahr (1997) the best nonlinear regressionresult (R2 = 094 root-mean-square error = 0008 km) wasobtained with a scaling factor of 004088 (Fig 2)
While valid for individual glaciers the resulting powerrelationship is not directly applicable to the model whichrequires watershed glacierized area For watersheds with anarea of less than 1 km2 the ice volume estimation wouldremain valid but it would be overestimated for largerglacierized areas that are usually a combination of severalindividual glaciers To establish a relation between
individual glaciers and watershed glacierized area thick-nesses we used a simplified version (using three bins) of theareandashfrequency distribution of the 485 glaciers of theCordillera Blanca that was established by Racoviteanu andothers (2008) We calculated the initial watershed glacier-ized volumesVgl0 as follows
Vgl0 frac14 Agl02 frac14
X3ifrac141
niVui eth10THORN
where i is the repartition bin number ni is the number ofglaciers for bin i and Vui is the corresponding glacier
Table 2 Initial parameters for the hydrological model The lsquoRangersquo column indicates the parameter range used for the model application todifferent watersheds No range means that the parameter is constant regardless of watershed
Parameter Description Unit Value Range Source Comment
dmelt Portion of yearly ablated ice notsublimated
ndash 082 Winkler and others (2009) After adjustment to dry-seasondefinition
d 0melt Portion of dry-season ablated ice notsublimated
ndash 074 Winkler and others (2009) After adjustment to dry-seasondefinition
etngl Non-glacierized area-specificevapotranspiration
mmandash1 640 300ndash640 Kalthoff and others (2006) ndash
ETrl Evaporation from rivers and lakes m3 dndash1 5000 0ndash50000 Baraer and others (2009a) Value given for the Querocochalake only
Dry-season part of annual ablation ndash 014 Kaser and Georges (1999) Approximation based onqualitative descriptions
qngl Net slow-flow dry-season specificdischarge
mmandash1 200 120ndash200 Baraer and others (2009b) Watershed-dependent
Cvmelt Melt component coefficient ofvariation
ndash 04 Baraer and others (2007) Calculated from hydrographseparation
Cvslow Slow-flow coefficient of variation ndash 05 ndash Deduced from sensitivity analysisrealized with Eqn (9)
Cvfast Fast-flow coefficient of variation ndash 13 Baraer and others (2009a) ndashcov Sum of covariances ndash 0 ndash Based on calibration
Fig 2 Ice volume versus glacier area for tropical glaciers of theAndes Black dots represent measured values from Hastenrath andothers (1995) Ames and Hastenrath (1996) Ramirez and others(2001) Rabatel and others (2006) and Soruco and others (2009) Theblue line plots the Bahr and others (1997) equation with slopeadjusted to fit the measured values The dashed portion of the blueline corresponds to the projection of the trend outside the regressionrange The red curve represents the ice volume evaluated for theglacierized area of a watershed rather than for a single glacier
Baraer and others Glacier recession and water resources in Perursquos Cordillera Blanca 139
volume area of the bin compiled from Racoviteanu andother (2008) The factor is determined from a watershedrsquosinitial conditions using Eqn (10) and remains constant duringthe simulation The relation between Vgl0and Agl0 that resultsfrom the Eqn (10) is plotted in Figure 2
The initial values of other parameters and the sourcesused to estimate them are given in Table 2 A limited numberof initial parameters (Table 2) were adjusted to obtain thebest possible fit between projected and measured variablesat the study watersheds The modelrsquos ability to reproducetrends was assessed by comparing model output to theMannndashKendall results of the measured discharge dataEvaluating the modelrsquos ability to situate the final (Qend)versus the initial (Q0) discharges ratio was not achievabledirectly as none of the observed discharge time series coversthe complete disappearance of the glaciers Therefore weused the streamrsquos yearly discharge in the last year of the timeseries Qn instead of Qend The error associated with Qn Q0
ratio estimation was therefore considered greater than thoserelated to Qend Q0
37 Model sensitivity to glacier retreat scenariosOnce calibrated the model was used for a sensitivityanalysis to determine how the key model parameters affectthe simulated trend of discharge-related parameters underdifferent scenarios of glacier retreat Annual precipitationwas kept constant across the entire simulation period basedon results of the precipitation trend analysis shown below
A lsquomedianrsquo scenario was defined based on a quasi-exponential increase of n and on studied watershedcharacteristics Sensitivity analysis was done by comparingthis median simulation (scenario a) with five lsquovariantrsquoscenario outputs (bndashf Table 3) each differing from themedian scenario in one parameter only Because of thenumerous ways in which n can vary with n two variants ofthe n function were tested scenario e had a continuousglacial retreat scenario (linear) while scenario f involvedmore complexity (an oscillating function with periodicnegative recession phases and a positive average in theperiod studied) Simulations were run until the glacier areaapproached zero and the yearly average discharge stabilized
The median scenario was also used to explore the notionof phases of glacier retreat as a function of watershed param-eters a useful prognostic used in other studies (eg Collins2008 Milner and others 2009 Moore and others 2009)Four different phases were defined on the basis of significanttrend changes that occur in model outputs while the glaciercoverage decreases This classification was subsequentlyused to categorize the nine different studied watersheds
38 Potential future hydrologic impacts of glacierretreatTo determine how glacier retreat will affect future hydro-logical regimes the model was run in a lsquorapid-retreatsimulationrsquo with a hypothetical extreme rate of glacierretreat The rapid-retreat initial conditions are comparable tothose of our study watersheds in 2009 as opposed todecades ago The lsquomedianrsquo retreat scenario (scenario aTable 3) was used as a starting point and more than 2000 Q0
values were calculated based on combinations of per-centage of initial glacierized area cover Agl0and annual rateof ice area loss 0 Agl0 ranged from 01 to 50 0 from 0to 004 and watershed area was constant at 200 km2 Foreach of the initial condition combinations the annual rate ofice area loss was increased by 1 of glacier area per yearuntil the glacier was completely melted which was almost50 times faster than the average increase observed at thenine studied watersheds between 1930 and 2009 Thishypothetical retreat would generate a meltwater release anda subsequent discharge increase for at least the firstsimulation year regardless of the initial condition Themagnitude and duration of this simulated increase reflectedthe capacity of glaciers to further increase the watershedflows To evaluate this capacity
RQthorn a dimensionless
parameter that represents the amount by which theperturbed discharge Qi exceeds initial discharge Q0 wasused and was computed as followsZ
Qthorn frac14X Qi Q0eth THORN
Q0for years i where Qi gt Q0 eth11THORN
Simultaneously the impact on the watershed annualdischarge of a glacier completely melting was evaluated bycomputing QendQ0 the final versus initial mean annualdischarges ratio This ratio provides a direct indication ofhow much the annual discharge will decrease once theglacier disappears compared with that calculated based oninitial conditions
In addition to annual discharges the rapid-retreatsimulations were used to compute
RQthorn and Qend Q0 for
dry-season dischargeWe estimated the
RQthorn and Qend Q0 values for the
studied watershed by comparing watershed Agl and valuescalculated for 2009 with the rapid-retreat simulation resultsThis method of interpretation of simulated results made itpossible to qualitatively describe potential future hydrologicimpacts of glacier retreat on the studied watersheds
4 RESULTS AND DISCUSSION41 Changes in glacierized areaThe studied watersheds have a wide range of percentglacierized area (Table 4) With 39 in 2009 Paron is themost highly glacierized watershed while La Recreta is theleast glacierized with 1 the same year From 1930 to 2009the percent glacierized area within every watershed de-creased This is confirmed by the period values (the annualrate of ice area loss from 1930 to 2009 Table 4) which areall positive for the period studied The La Balsa watershedwhich drains the entire upper Rıo Santa has an average of061andash1 area loss which is the median for the nine studiedwatersheds The Llanganuco and Querococha watershedsexhibit the fastest glacial area reduction with an averageloss of 1andash1 and 11andash1 respectively Los Cedros has the
Table 3 Parameter values and formulas used in the sensitivityanalysis scenarios The lsquoMedianrsquo scenario (a) is the referencescenario Other letters in parentheses (bndashf) refer to the parameterchanged for a given scenario
Parameter Agl0 AT 0 n with n 2 1 2 200f g km2
lsquoMedianrsquoscenario (a)
25 200 0 n frac14 n1 thorn 35 106n
Variants50 (b) 1000 (c) 0005 (d) n frac14 0 thorn 000024n etheTHORN
n frac14 0 thorn sin n11 099
=30 ethfTHORN
Baraer and others Glacier recession and water resources in Perursquos Cordillera Blanca140
lowest period with an average loss of 038andash1 Except forColcas Los Cedros and Paron there is a clear acceleration inglacierized area reduction across the studied watershedsover the past two decades The average value for theperiod 1990ndash2009 was double that for 1930ndash2009 atChancos La Recreta Pachacoto and Querococha indicat-ing a probable exponential rate of depletion La Balsa valuesconfirm this acceleration The 1990ndash2009 annual percent-age glacier area loss reaches 081 which is roughly 30greater than was measured during the 1930ndash2009 period
The recession-rate results provide an internally consistentcomparison of changes over time Our protocol to generate time series invokes a level of uncertainty estimated at around
5 based upon our inclusion of historical estimates ofglacierized areas from different sources and comprisingdifferent interpretations of glacier areas by different methods(Table 4) Despite these unavoidable limitations the gener-ated time series was considered to be adequate for thepurpose of this study because the model simulationsgenerated from these time series are used to compute trendanalyses only and the results obtained from these simulationsare compared to observed discharges for model validation
42 Trends in discharge parametersThe dry-season average discharge time series are used toillustrate how the studied watersheds evolve hydrologically
Table 4 Glacierized percentage of watershed areas Years in italics are derived from publications (Kaser and others 2003 Mark and Seltzer2003 Georges 2004) The others (2002 and 2009) were computed using ASTER satellite imagery The specific acquisition dates for selectedASTER images were 1 August 2001 25 May 2002 17 June 2002 13 July 2003 28 May 2009 11 June 2009 13 July 2009 29 July 20097 August 2009 and 29 May 2010 The historical values for Querococha are from Hastenrath and Ames (1995) and cover slightly differenttime periods indicated in parentheses period and 90ndash09 represent the average rate of ice area loss for the periods 1930ndash2009 and1990ndash2009 respectively
Watershed 1930 1970 1990 1997 2002 2009 period 90ndash09
Chancos 311 25 24 22 222 195 00059 00108Colcas 244 193 175 18 19 174 00043 00003La Balsa 117 9 84 8 81 72 00061 00081La Recreta 16 15 14 11 1 00058 00161Llanganuco 555 426 34 308 251 001 00158Los Cedros 25 21 19 18 19 185 00038 00014Pachacoto 14 12 10 8 71 69 00089 00193Paron 72 55 47 52 44 387 00078 00064Querococha 46 (1948) 39 (1973) 37 3 28 2 0011 00248
41 (1962)
Fig 3 Dry-season average discharge calculated from daily data (solid blue line) Linear and quadratic regression lines (curves) calculatedfrom datasets are drawn in black dashed lines and full black curves respectively
Baraer and others Glacier recession and water resources in Perursquos Cordillera Blanca 141
over time (Fig 3) Overall the data show a dominantdecrease in dry-season average discharge during the studyperiod An increase in dry-season average is observed withthe Paron dataset a particularity that could be related to thelength of the study period for this watershed No trend isdetected in the Llanganuco dry season throughout the studyperiod There is a decrease in dry-season stream dischargebetween the 1950s and 1990s for the seven other water-sheds This regionally dominant pattern is also observed inthe La Balsa time series which has lost more than 10 of itsaverage dry-season discharge in little more than half acentury This decrease cannot be attributed fully to thechange in glacial cover as other factors (eg changes in landuse agricultural practices or population density) also mighthave affected regional river discharge regimes Howeverhigh-elevation watersheds like Querococha or Pachacotowhere there is low human impact also present an overalldry-season discharge decrease suggesting that the change inglacial cover explains at least partly the observed dry-season discharge decrease at La Balsa Four of the watershedsfeature a local maximum in polynomial regression curvesand four a minimum No maximum or minimum is detectedat Llanganuco The timing of minima or maxima inpolynomial regression curves varies from 1958 for Paron to1994 for La Balsa These differences in curve profiles suggestthat it is unlikely that trends related to short interannualclimatic phenomena would be detected by the MannndashKendall test
For MannndashKendall tests with significance values of 01 orlower the random origin of trends can be excluded allowingfurther refinement of the trend analyses (Table 5) With theexception of Paron all significant discharge trends indicate adecrease in discharge throughout the total period andorduring the second sub-period On no occasion were contra-dicting indications observed between Q Qd and Qmin AtChancos Los Cedros and Querococha the decrease indischarge was preceded by an increase in at least one of thethree discharge parameters This phase ended much earlier(around 1962) at Los Cedros than at the two other locations(1980 and 1975 respectively) On five occasions Cvpresented significant trends At La Balsa and La Recretathe results indicate an increase in variability with time eitherfor the full period of record or at least for one of the sub-periods The only watersheds where significant decreases inyearly discharge variability were detected are Paron (acrossthe full time series) and Colcas (in the first sub-period) Theresults show that an increase in discharge is systematicallyassociated with a decrease in variability and vice versa
For the precipitation records the trend analysis shows amore heterogeneous situation Of the seven time series westudied three exhibit a negative trend and four a positivetrend during the 1954ndash99 period Chancos and Huaraz bothhave positive statistically significant trends The samedisparity is observed for trends analyzed using sub-periodsthree (one significant) of the seven time series show anegative trend during the first sub-period and two (onesignificant) during the second sub-period Years of minimumor maximum values differ widely between measurementlocations These results suggest the absence of a clearregion-wide trend in precipitation over the study period Thisspatial disparity is confirmed by the correlation studyperformed on the seven precipitation datasets (Table 6)Significant R2 vary from only 009 between Paron andChancos to 054 between Pachacoto and La Recreta Most
of the R2 values are around 03 corresponding to a low levelof linear correlation These results are in line with previouslypublished studies that describe unclear trends in regionalprecipitation data or in projections (Urrutia and Vuille2009 Chevallier and others 2010) Vuille and others(2008a) also describe the lack of a clear trend in precipi-tation for the Cordillera Blanca area They report a differ-ence in tendency between regions situated south (a possibledecrease) and north (a possible increase) of about 118 SSituated between 88380 S and 108020 S the Cordillera Blancalies near the boundary of these two regions Therefore sinceusing a single precipitation time series to represent aregional tendency is not possible time series from the threenearest measurement points are used for comparison to eachwatershedrsquos discharge parameters
43 Precipitation influence on discharge trendsResults of the correlation study between precipitationrecords and discharge parameters are reported in Table 7First we note that the degree of influence (number andmagnitude of detected lsquominimal correlationsrsquo) varies fromwatershed to watershed Broadly the watersheds thatpresent the lowest relative glacierized areas (Table 4) havedischarge parameters more correlated to annual precipi-tation The degree of influence of precipitation on dischargeparameter variation also differs from parameter to parameterWith only one exception (Qd at La Recreta) Qd and Qmin donot correlate or correlate weakly with the precipitationCorrelation with Q and Cv is more established but stillweak as less than 50 of the calculated R2 values do notreach the minimal correlation level and 75 of those that doare below 05 As a general pattern the influence ofprecipitation on discharge parameter variations is small(Table 7) and mainly affects the less glacierized watershedsBased on this correlation study trends in all studieddischarge parameters at Colcas and Paron are consideredto be free of the influence of precipitation while at the otherwatersheds only Qd and Qmin are independent of precipi-tation (Qmin only at La Recreta)
The lack of a regional trend in yearly precipitationamounts as well as the weak level of correlation that existsbetween discharge parameters and yearly precipitationmakes it difficult to justify using a precipitation trend toforce the model We therefore fix watershed-specific yearlyprecipitation values in all model simulations
44 Model validationModeled discharge trends were compared with measureddischarge trends by counting how often a significant trenddetected in measured discharge was reproduced by themodel The results in Table 8 are reported as the percentageof times that both trends were similar for both linear andquadratic regressions Of the 37 significant trends detectedusing the MannndashKendall test 36 were correctly reproducedby the model for an overall match value of 97 Despite theuncertainty related to the glacierized area evaluation andthe hydro-climatic datasets the model reproduced the trendof the four different parameters used in the study verysatisfactorily The model performance in estimating theQendQ0 ratios is poorer than in reproducing trends but itsmean absolute error less than 017 is acceptable for thepurpose of the study Evaluating the Qn Q0 ratios correctly isnot explicitly required as the simpler Qend Q0 ratio only isused This validation step did not highlight any deviation
Baraer and others Glacier recession and water resources in Perursquos Cordillera Blanca142
Table 5 Results of MannndashKendall trend analysis The lsquorsquo columns describe the level of significance of the reported trends Statisticallysignificant trends are in bold
Station Parameter Linear regression Quadratic regression
Year of min(max)
Sub-period 1 Sub-period 2
Period Slope Slope Slope
Chancos Q 1954ndash96 0028 1980 0073 01 ndash0134 005Qd 1954ndash96 ndash0007 1971 0025 ndash0029Qmin 1954ndash96 ndash0003 1974 0028 ndash0065 005Cv 1954ndash96 0002 ndash
Colcas Q 1956ndash97 ndash0011 1972 ndash0003 ndash0073 005Qd 1956ndash97 ndash0004 1977 001 ndash0032Qmin 1956ndash97 ndash0011 1971 ndash001 ndash0032 005Cv 1956ndash97 0001 1959 ndash0052 01 0001
La Balsa Q 1954ndash2008 0007 1975 0188 0449Qd 1954ndash2008 ndash0065 01 1994 ndash0163 001 ndash0406 005Qmin 1954ndash2008 ndash004 1992 ndash0148 005 ndash0298Cv 1954ndash2008 0003 005 1970 ndash0013 0006 005
La Recreta Q 1954ndash95 ndash0028 01 ndashQd 1954ndash95 ndash0005 005 1980 ndash0014 001 ndash0014 001Qmin 1954ndash95 ndash0004 001 1984 ndash0007 001 ndash0011 01Cv 1954ndash95 0001 1976 001 01 ndash0004
Llanganuco Q 1954ndash2009 0003 1988 0019 001 ndash002 01Qd 1954ndash2009 0 ndashQmin 1954ndash2009 0 ndashCv 1954ndash2009 ndash0001 ndash
Los Cedros Q 1954ndash99 ndash0006 1970 004 ndash0009Qd 1954ndash99 ndash0006 1979 ndash0017 0037Qmin 1954ndash99 ndash0013 001 1962 015 005 ndash0018 0001Cv 1954ndash99 0001 1956 0001
Pachacoto Q 1954ndash96 ndash0015 1962 0149 005 ndash0021Qd 1954ndash96 ndash0001 1971 0006 ndash0012Qmin 1954ndash96 0001 1972 0018 ndash0014Cv 1954ndash96 0 1976 ndash001 0007
Paron Q 1954ndash83 0023 001 1962 0019 0046 0001Qd 1954ndash83 0025 0001 1958 01 0029 0001Qmin 1954ndash83 0024 0001 1958 0111 0029 0001Cv 1954ndash83 ndash0006 0001 ndash
Querococha Q 1953ndash95 0002 1975 0018 005 ndash0012Qd 1953ndash95 ndash0001 1974 0006 ndash0009 001Qmin 1953ndash95 0 1975 0008 001 ndash001 001Cv 1953ndash95 0001 1972 ndash0004 0003
Precipitation Paron 1954ndash99 ndash2729 1981 ndash10163 01 2800Llanganuco 1954ndash99 0580 1969 19800 2187Chancos 1954ndash99 2386 01 ndash 2386Huaraz 1954ndash99 6305 001 1990 7818 001 30450 01
Querococha 1954ndash99 0878 1978 12226 005 ndash16392 005Pachacoto 1954ndash99 ndash1066 1988 ndash0495 ndash9529
Table 6 Coefficient of determination (R2) and statistical significance (p-value) calculated for the seven precipitation time series R2 valuesappear below the oblique line p-values above R2 values equal to or over 02 associated with a p-value under 01 are in bold
R2p-value Paron Llanganuco Chancos Huaraz Querococha Pachacoto La Recreta
Paron 00163 00438 00142 00434 00001 00001Llanganuco 013 00001 00019 00013 00001 00001Chancos 009 030 00001 0 00001 00001Huaraz 013 020 029 0 0 0Querococha 009 022 038 051 0 00001Pachacoto 031 030 031 035 040 0La Recreta 030 029 032 037 029 054
Baraer and others Glacier recession and water resources in Perursquos Cordillera Blanca 143
that would characterize dataset bias related to gaps in thehistorical data This supports the assumption made earlierthat these gaps did not generate mis-estimation of the trends
45 Model simulationsTo test the model sensitivity six synthetic sets of time serieswere generated The median scenario (Fig 4a) visually
conforms to the expected hydrologic progression (seecitations in section 3) While the glacier area is continuallydecreasing both the annual average discharge and the dry-season discharge experience a period of increase followedby a period of decrease and then a period of stabilizationbelow the initial levels The ending dry-season discharge isapproximately 50 lower than at the beginning while the
Table 7 Coefficients of determination (R2) and their associated statistical significance (p-value) calculated between the precipitation recordsfrom the three closest measurement points and the discharge parameters of each gauging station R2 values equal to or over 02 associatedwith a p-value above 01 are in bold
Station Precipitationmeasurement point
Q Qd Qmin Cv
R2 p-value R2 p-value R2 p-value R2 p-value
Chancos Llanganuco 000 09491 001 0661 001 05929 006 01417Chancos 010 00589 000 09826 000 08997 007 01199Huaraz 015 00183 000 08897 002 03476 017 00106
Colcas Paron 002 04537 004 02788 003 02895 022 0005Llanganuco 000 0751 001 04965 004 02447 019 00082Chancos 006 01547 004 02678 000 08953 000 09736
La Balsa Chancos 024 0001 001 06441 000 07952 018 00068Huaraz 032 210ndash4 000 09639 000 09126 033 10ndash4
Querococha 009 00584 000 07185 001 05549 008 00748La Recreta Querococha 039 0 013 00261 002 0347 017 00091
Pachacoto 061 0 039 0 013 00263 015 00131La Recreta 067 0 037 0 013 00219 005 01547
Llanganuco Paron 005 02007 003 03251 001 05263 013 00238Llanganuco 001 04672 003 03265 008 00871 033 210ndash4Chancos 011 00397 001 05515 000 07421 011 00414
Los Cedros Paron 003 02572 000 07115 000 08282 007 00967Llanganuco 033 10ndash4 007 00981 002 0341 023 0002Chancos 019 0005 005 01857 000 09562 045 0
Pachacoto Querococha 032 210ndash4 002 04479 001 05795 010 00528Pachacoto 051 0 002 0346 003 03189 023 0002La Recreta 055 0 003 03048 003 02737 016 00131
Paron Paron 017 00287 016 00378 019 00216 010 01018Llanganuco 004 03303 012 00738 013 00592 017 00272Chancos 010 01051 005 02697 004 03013 003 03557
Querococha Huaraz 040 0 004 02344 017 00075 013 00217Querococha 068 0 004 02301 013 00199 026 710ndash4Pachacoto 049 0 002 03719 000 07775 023 0002
Table 8 Model performance evaluation The lsquoLinear trendsrsquo and lsquoQuad trendsrsquo columns provide a comparison of the number of observed(Obs) significant trends in the time series and the number of matching trends in the modeled results (Mod) for linear and quadraticregressions respectively The lsquoQn Q0rsquo column shows the error calculation components for the Qn Q0 ratios
Station Linear trends Quad trends QnQ0
Obs Mod Obs Mod Obs Mod Error
Chancos 0 3 3 122 097 ndash025Colcas 0 3 3 088 089 001La Balsa 2 2 4 4 106 093 ndash013La Recreta 3 3 5 5 066 100 034Llanganuco 0 2 2 105 091 ndash014Los Cedros 1 1 2 2 094 099 005Pachacoto 0 1 1 084 101 017Paron 4 3 3 3 142 105 ndash038Querococha 0 4 4 106 101 ndash005
match=90 match=100 MAE 017match overall = 97
The linear negative trend in the coefficient of variability of discharge for the Paron dataset was incorrectly replicatedMean absolute error
Baraer and others Glacier recession and water resources in Perursquos Cordillera Blanca144
ending annual average discharge declines by no more than10 of its initial level The maximum dry-season dischargeoccurs approximately 10 years before the maximum annualaverage discharge The period of increasing discharge isshorter than the decreasing and stabilization periodscombined In contrast to what was observed for averagedischarge the coefficient of variation first decreased slightlyfor more than 50 years and then increased rapidly until itstabilized at a value that is approximately 50 higher
When the same simulation is run with a higher initialglacierized area (Fig 4b) we see an important change in theamplitude of the output parametersrsquo variation The variationtempo remains similar to that obtained using scenario a butall the minima are lower and the maximum is higher withscenario b This is visually evident in the case of thecoefficient of variation whose final value is approximately150 that of scenario a The difference in scenario c (Fig 4c)is less pronounced Although a change in amplitude isobserved it is minor if we consider that the watershed area isfive times that of scenario a Starting with an initial annualglacier area loss of 05 instead of 0 (Fig 4d) leads to a muchgreater difference None of the discharge values shows aperiod of increase while the coefficient of variation increasescontinuously End values are different from those achievedwith scenario a as mean annual and dry-season dischargesend lower while the coefficient of variation is higher
Changing the annual rate of glacier area loss to a linearfunction (Fig 4e) does not affect the end values For thiscase the rate of change is affected with maximumdischarge values (minimum for Cv) occurring earlier thanin scenario a These extreme values are of slightly higheramplitude as well Similarly the last tested scenario (Fig 4f)
preserves the end values computed with scenarios a c and ebut amplifies the intermediate fluctuation The amplifica-tion which is caused by an extreme glacier area loss appliedto the first 30 years of the simulation is the largest observedamong the six datasets The strong model response to thefirst n increase wave is not replicated in the second andthird waves Peaks in the discharge average and coefficientof variation are of low amplitude in the second wave and notdetectable in the third
Overall the sensitivity analysis shows that the watershedarea has the least effect on the simulations It supports thehypothesis that not only is Agl0 critical to determining howglaciers influence a watershedrsquos hydrology but also that the rate of glacier area loss is critical Regardless ofscenario the complete disappearance of glaciers alwaysled to a decrease in annual discharge an even greaterdecrease in dry-season discharge and an increase invariability The sequence of a single increase followed by adecrease in discharge is for continuous retreat scenariosWith a fluctuating glacier area (scenario f) local minima andmaxima are simulated but the hydrological response de-creases and approaches zero as the glacier area decreases
We used the lsquomedianrsquo scenario which is based on a quasi-exponential increase of n and on the studied watershedsrsquocharacteristics to depict typical hydrological impact phases(Fig 5) The evolution of hydrological parameters under thelsquomedianrsquo glacier retreat scenario enables us to distinguishfour impact phases Phase one the early stages of deglaci-ation is characterized by a smooth increase in dry-seasonand yearly average discharge due to a smooth initialdeglaciation and ends when the coefficient of variationreaches its minimum In phase two the increase in annual
Fig 4 Results of sensitivity analysis simulation The thick black lines and the blue lines are the mean annual and dry-season dischargerespectively the yellow dashed line is the annual discharge coefficient of variation the red dotted line is the glacierized area and the greendash-dotted line is the applied annual rate of glacier area loss All parameters are given relative to year zero values (a) presents the lsquoMedianrsquoscenario output while the other five graphs are variants described in Table 3 (b) Agl0 increase (c) AT increase (d) 0 increase (e) linear nincrease and (f) oscillating n
Baraer and others Glacier recession and water resources in Perursquos Cordillera Blanca 145
average discharge slows until it reaches its maximum whilethe dry-season discharge increases and then declines and thecoefficient of variation begins to increase Phase three startsfrom the maximum average annual discharge and covers thepronounced decline in discharges and the correspondingincrease in the coefficient of variation Phase four includesthe end of the glacier influence on outflows when changes in
discharges are progressively less pronounced asymptoticallyreaching a non-glacierized basin state
This four-phase sequence is based on a continuouslyincreasing rate of ice area loss As observed in thesensitivity analysis deviations from this path may changethe phase sequence However the probability of thisoccurring decreases as we move away from highly glacier-ized conditions Returning to a phase two from a late phasethree or a phase four would necessitate either extremelyhigh rates of deglaciation or a new long-term glacialexpansion The likelihood of this happening is notsupported by recent climate change projections (Urrutiaand Vuille 2009)
Each watershed is interpreted individually by comparingthe significant trends in measured discharge to thedefinition of the impact phase (Table 9) This interpretationapplies to the final year of observations used in the trendanalysis Significant trends in discharge parameters thatshow possible influence from precipitation data (three intotal) are excluded from the phase allocation exercise(described above in Section 34) Results from the phasedetermination suggest that seven of the nine studiedwatersheds are in impact phase three One watershed LaRecreta shows characteristics of phase four and another
Fig 5 lsquoTypicalrsquo glacier retreat hydrological impact phases(delimited and labelled in red) The thick black line and the blueline represent the mean annual and dry-season discharge respect-ively and the yellow dashed line corresponds to the annualdischarge coefficient of variation As the phases are conceptualaxes are kept unit-free
Table 9 Trends associated with the lsquotypicalrsquo glacier retreat model compared to measured trends The symbols used for trend description arelsquo+rsquo for an increase lsquondashrsquo for a decrease lsquo+ndashrsquo for an increase followed by a decrease and lsquondash0rsquo for a decrease followed by parameterstabilization The lsquoPhasesrsquo rows summarize phase definitions Reproduced watershed data are indicated for statistically significant trendsonly (Table 5) In case of trends that were split by quadratic regression the year separating the two sub-periods is given in parenthesesTrends excluded from the phase allocation due to possible precipitation influence are in gray The cause of rejection is presented in thelsquoPossible precipitation influencersquo column The watershed names are followed by the year to which the interpretation statement applies
Q Qd Qmin Cv Possible precipitationinfluence
Phases No
Phases 1 + + + ndash2 + gt+ndash +ndash +3 ndash ndash ndash +4 ndash0 ndash0 ndash0 +0
Chancos 1996 linear 2 until 1980 thenphase 3quad1 + (1980)
quad2 ndash (1980) ndash (1974)Colcas 1996 linear 1 until 1959 and 3
from 1972quad1 ndash (1959)quad2 ndash (1972) ndash (1971)
La Balsa 2008 linear ndash + Cv Huaraz 3 from 1970quad1 ndash (1994) ndash (1992)quad2 ndash (1994) + (1970)
La Recreta 1995 linear ndash ndash ndash 3 and possibly 4 from1982quad1 ndash (1980) ndash (1984) + (1976) Qd La Recreta
quad2 ndash (1980) ndash (1984)Llanganuco 2009 linear 2 until 1988 then 3
quad1 + (1988)quad2 ndash (1988)
Los Cedros 1999 linear ndash 3 since 1962quad1 + (1962)quad2 ndash (1962)
Pachacoto 1996 linear Possibly 3 since 1962quad1 + (1962)quad2
Paron 1983 linear + + + ndash 1quad1quad2 + (1962) + (1958) + (1958)
Querococha 1995 linear 2 until 1976 then 3quad1 + (1975) + (1975) Q Querocochaquad2 ndash (1976) ndash (1976)
Baraer and others Glacier recession and water resources in Perursquos Cordillera Blanca146
Paron is still in phase one at the end of the studieddischarge time series With an overall linear regression-based decrease in dry-season discharge La Balsa exhibitswatershed characteristics of phase three A transition fromphase two possibly occurred around 1970 the year inwhich the increase in Cv becomes significant based on thequadratic regression-based analysis although this possi-bility is not confirmed by other parameters The fact that onthe second sub-period an increase in Cv is measured inparallel to the dry-season discharge reduction is anindication that glacial factors are at least partially the causefor the measured decrease in discharge
None of the 38 measured significant trends used in thisstudy contradicted each other in phase allocation confirm-ing the modelrsquos ability to simulate the impact of long-termglacier retreat on regional stream discharge trends
46 Glaciersrsquo potential to further influencehydrological regimesThe rapid-retreat simulation results relate
RQthorn andQend Q0
values to initial Agl0and 0 conditions (Fig 6)RQthorn values
are relative as the highest values represent a high potentialfor generating further increase in discharge and the lowestvalues a low potential
RQthorn values vary from 0 to 18 The
lowest values (0ndash1) represent an almost negligible capacityof a glacierized area to generate a significant flow increaseeven under the extreme retreat rates used in this set ofsimulations In contrast the highest values characterizewatersheds where discharge parameters are highly sensitiveto changes in glacier retreat path QendQ0 values vary from01 to 1 The lowest values obtained for the dry season
represent drastic stream discharge reductions while valuesabove 09 will have a low impact on water resources
The results show the critical role of 0 in a glacierizedwatershedrsquos response to glacial retreat especially for glacialcover greater than 5 A watershed that has a 25glacierized area for example shows annual
RQthorn values
that range from almost 0 to 10 depending on the value of 0and is even more pronounced when only the dry season isconsidered The same situation is observed with the QendQ0
ratio where changes in 0 can decrease the projected loss indischarge once the glacier is melted by more than 40
We estimate the studied watershedsrsquoRQthorn and Qend Q0
values by comparing their characteristics to the rapid-retreatscenarios (Fig 6) With the lowest
RQthorn values La Recretarsquos
and Querococharsquos discharge should not experience aglacierized area-loss-related measurable increase in annualor dry-season discharge Once the glaciers have completelydisappeared the discharge at La Recreta should remainalmost unchanged compared to the present level whileQuerococha should exhibit a slight dry-season decline
Future glacier influence should be slightly greater forPachacoto even if there is a low probability of an increase inmelt-related average discharge The main difference be-tween Querococha and Pachacoto is in their dry-seasonQendQ0 ratios which are about 08 and 06 respectively
In the long term Paron is the watershed that shouldexperience the most drastic glacier retreat impact Not onlydo its glaciers present the highest potential to generateretreat-related discharge increases at yearly and dry-seasonlevels but with the complete disappearance of glaciers thedry-season discharge could decline to less than 40 of its
Fig 6 Variations ofRQthorn (top graphs) and QendQ0 (bottom graphs) for the rapid-retreat simulations as a function of percentage of
glacierized area and the annual rate of ice area loss Colors represent values ofRQthorn (indicator of the glacierrsquos capacity to further increase
the watershed flows) and of QendQ0 (starting and ending simulated discharge ratio) Full year simulations appear on the left and dry-seasonsimulations are reported at the right All parameters are dimensionless
Baraer and others Glacier recession and water resources in Perursquos Cordillera Blanca 147
present level Yearly discharge averages would also de-crease but to about 70 of their present level
Colcas and Los Cedros have almost the same glacierizedarea percentage and annual rates of ice area loss These twowatersheds have
RQthorn values that are among the highest
although their QendQ0 ratios are close to the average Thesecharacteristics suggest that the potential for an increase indischarge is among the highest but that the drop in flowsafter the glaciers have receded will be less drastic than forChancos or Llanganuco the latter being predicted todecrease by more than 60 compared with the actualdry-season regime Plots of La Balsa
RQthorn values and Qend
Q0 ratios vary between extremes When a full year isconsidered the potential to further increase discharge due toglacier retreat acceleration is very low Similarly the QendQ0 ratio remains high around 09 for the full year averageThe dry-season situation is different as the
RQthorn value for La
Balsa is average while the QendQ0 ratio is approximately07 A loss of 30 of the dry-season discharge at that stationwould not be without consequences especially whenconsidering that on some occasions the Rıo Santa almostdries up before it reaches the Pacific Ocean
5 CONCLUSIONGlaciers are major components of the hydrological system inmany tropical Andean watersheds making their ongoingretreat a threat to water resources Predicting the exactconsequences of glacial retreat is difficult due to thecomplexity and scales of the processes involved OurASTER-based measurements of recent glacier changesindicate that glacier recession is accelerating in the RıoSanta upper watershed with the overall glacierized areadecreasing annually by 081 between 1990 and 2009
To assess past and present influences of glaciers on streamdischarge we reanalyzed historical and modern dischargedata from the Cordillera Blanca Using a combination ofregression and trend analyses we found statistically signifi-cant indications that these systems have crossed a criticalthreshold and now exhibit decreasing annual and dry-season discharge La Balsa station which measures dis-charge from the upper Rıo Santa is undergoing a decline indry-season flow that probably began during the 1970s Theweak correlation that exists between the discharge par-ameters and precipitation supports the hypothesis that thesetrends are driven by the glacier retreat measured during thesame period
The link between glacial retreat and water resources isanalyzed by the use of a simple water balance model Itsimulates how glacier retreat can influence the annual anddry-season discharge as well as the annual dischargevariability and reveals four impact phases of the resultinghydrological changes Examining historical records andfitting them to these phases suggests a declining contributionof meltwater to the studied watershed outflows At somewatersheds like Querococha La Recreta Pachacoto and LaBalsa the decline in discharge is likely not reversible Thedecrease in the dry-season discharge should thereforecontinue for many decades as the watersheds enter anasymptotic decrease phase prior to the glaciersrsquo completeloss of influence on hydrologic regimes Once the glaciersare completely melted the discharge will likely be lowerthan today In particular dry-season discharge may decrease
more than 60 from present for Paron and Llanganuco AtLa Balsa dry-season average discharge should decline to70 of current levels
The model sensitivity analysis confirms that the initialglacierized area is a major driver of glacier influence onhydrology It also shows that unlike the total watershedarea annual rate of ice area loss is as important as the initialglacierized area
Although the upper Rıo Santa watershed still has andshould maintain abundant water resources when annualtotal discharge is considered the dry-season situation isclearly different A decline in dry-season surface wateravailability has probably already begun and should con-tinue Considering the vulnerability of the local populationto climate change and declining water resources (Bury andother 2011) our results can represent a future socialecological and economic concern
Despite the overall consistency of the results of thepresent research it must be recognized that they maypossibly be influenced by uncertainty related to datainterpolation and glacierized area estimation The methodwe used is promising and could potentially be applied toother regions of the world However the findings that resultfrom its application to the Cordillera Blanca need to beconfirmed by other means In addition the methodrsquosaccuracy should be further tested through future studies
ACKNOWLEDGEMENTSWe are grateful for the historical discharge informationprovided by Abel Rodriguez and Duke Energy Peru and forthe funding provided by the US National Science Founda-tion (BCS-0752175) The Ohio State Universityrsquos ClimateWater and Carbon Program and McGill University Wethank Robert Carver for insightful comments
REFERENCESAlford D and Armstrong R (2010) The role of glaciers in stream flow
from the Nepal Himalaya Cryos Discuss 4(2) 469ndash494Ames A and Hastenrath S (1996) Diagnosing the imbalance of
Glaciar Santa Rosa Cordillera Raura Peru J Glaciol 42(141)212ndash218
Bahr DB (1997) Global distributions of glacier properties astochastic scaling paradigm Water Resour Res 33(7)1669ndash1679
Bahr DB Meier MF and Peckham SD (1997) The physical basis ofglacier volumendasharea scaling J Geophys Res 102(B9)20 355ndash20 362
BaraerMMcKenzie JMMark BG and Palmer S (2007) An integratedhydrochemical and hydrological approach to modeling runoff inglacier-fed basins Cordillera Blanca Peru In Glaciers in Water-shed and Global Hydrology International Commission for Snowand Ice Hydrology Workshop 27ndash31 August 2007 ObergurglAustria [Abstract]
Baraer M McKenzie JM Mark BG Bury J and Knox S (2009a)Characterizing contributions of glacier melt and groundwaterduring the dry season in a poorly gauged catchment of theCordillera Blanca (Peru) Adv Geosci 22 41ndash49
Baraer M McKenzie JM Mark BG and Knox S (2009b) Nature andvariability of water resources in the Rio Santa upper watershedPeru [Abstr H74A-01] In AGUndashCGU Joint Assembly 24ndash27 May 2009 Toronto Ontario Canada American GeophysicalUnion Washington DC (httpadsabsharvardeduabs2009AGUSMH74A01B)
Baraer and others Glacier recession and water resources in Perursquos Cordillera Blanca148
Barnett TP Adam JC and Lettenmaier DP (2005) Potential impactsof a warming climate on water availability in snow-dominatedregions Nature 438(7066) 303ndash309
Birsan M-V Molnar P Burlando P and Pfaundler M (2005)Streamflow trends in Switzerland J Hydrol 314(1ndash4) 312ndash329
Bradley RS Vuille M Diaz HF and Vergara W (2006) Threats towater supply in the tropical Andes Science 312(5781)1755ndash1756
Braun LN Weber M and Schulz M (2000) Consequences of climatechange for runoff from Alpine regions Ann Glaciol 31 19ndash25
Brown LE Milner AM and Hannah DM (2010) Predicting riverecosystem response to glacial meltwater dynamics a case studyof quantitative water sourcing and glaciality index approachesAquat Sci 72(3) 325ndash334
Bury JT and 7 others (2011) Glacier recession and humanvulnerability in the Yanamarey watershed of the CordilleraBlanca Peru Climatic Change 105(1ndash2) 179ndash206
Chevallier P Pouyaud B Suarez W and Condom T (2010) Climatechange threats to environment in the tropical Andes glaciers andwater resources Reg Environ Change 11 Suppl 1 179ndash187
Collins DN (2008) Climatic warming glacier recession and runofffrom Alpine basins after the Little Ice Age maximum AnnGlaciol 48 119ndash124
Collins DN and Taylor DP (1990) Variability of runoff frompartially-glacierised alpine basins IAHS Publ 193 (Symposiumat Lausanne 1990 ndash Hydrology in Mountainous Regions IHydrological Measurements the Water Cycle) 365ndash372
Dingman SL (2002) Physical hydrology 2nd edn Waveland PressLong Grove IL
Georges C (2004) 20th century glacier fluctuations in the tropicalCordillera Blanca Peru Arct Antarct Alp Res 36(1) 100ndash107
Hagg W and Braun L (2005) The influence of glacier retreat onwater yield from high mountain areas comparison of Alps andcentral Asia In De Jong C Ranzi R and Collins D eds Climateand hydrology in mountain areas Wiley Chichester 263ndash275
Hannah DM Sadler JP and Wood PJ (2007) Hydroecology andecohydrology a potential route forward Hydrol Process21(24) 3385ndash3390
Hastenrath S and Ames A (1995) Diagnosing the imbalance ofYanamarey Glacier in the Cordillera Blanca of Peru J GeophysRes 100(D3) 5105ndash5112
Hirsch RM and Slack JR (1984) A nonparametric trend test forseasonal data with serial dependenceWater Resour Res 20(6)727ndash732
Hofer M Molg T Marzeion B and Kaser G (2010) Empiricalndashstatistical downscaling of reanalysis data to high-resolution airtemperature and specific humidity above a glacier surface(Cordillera Blanca Peru) J Geophys Res 115(D12) D12120(doi 1010292009JD01255)
Huss M Farinotti D Bauder A and Funk M (2008) Modelling runofffrom highly glacierized alpine drainage basins in a changingclimate Hydrol Process 22(19) 3888ndash3902
Huss M Jouvet G Farinotti D and Bauder A (2010) Future high-mountain hydrology a new parameterization of glacier retreatHydrol Earth Syst Sci 14(5) 815ndash829
Jansson P Hock R and Schneider T (2003) The concept of glacierstorage a review J Hydrol 282(1ndash4) 116ndash129
Juen I Kaser G and Georges C (2007) Modelling observed andfuture runoff from a glacierized tropical catchment (CordilleraBlanca Peru) Global Planet Change 59(1ndash4) 37ndash48
Kalthoff N and 6 others (2006) The energy balance evapo-transpiration and nocturnal dew deposition of an arid valley inthe Andes J Arid Environ 65(3) 420ndash443
Kaser G and Georges C (1999) On the mass balance of low latitudeglaciers with particular consideration of the Peruvian CordilleraBlanca Geogr Ann 81A(4) 643ndash651
Kaser G and Osmaston H (2002) Tropical glaciers CambridgeUniversity Press Cambridge
Kaser G Juen I Georges C Gomez J and Tamayo W (2003) Theimpact of glaciers on the runoff and the reconstruction of mass
balance history from hydrological data in the tropical CordilleraBlanca Peru J Hydrol 282(1ndash4) 130ndash144
Kaser G Grosshauser M and Marzeion B (2010) Contributionpotential of glaciers to water availability in different climateregimes Proc Natl Acad Sci USA (PNAS) 107(47)20 223ndash20 227
Kistin EJ Fogarty J Pokrasso RS McCally M and McCornick PG(2010) Climate change water resources and child health ArchDisease Childh 95(7) 545ndash549
Koboltschnig GR and Schoner W (2010) The relevance of glaciermelt in the water cycle of the Alps an example from AustriaHydrol Earth Syst Sci Discuss 7(3) 2897ndash2913
Kundzewicz ZW and 6 others (2005) Trend detection in river flowseries 1 Annual maximum flow Hydrol Sci J 50(5) 797ndash810
Lambrecht A and Mayer C (2009) Temporal variability of the non-steady contribution from glaciers to water discharge in westernAustria J Hydrol 376(3ndash4) 353ndash361
Mann HB (1945) Nonparametric tests against trend Econometrica13(3) 245ndash259
Marengo JA (1995) Variations and change in South Americanstreamflow Climatic Change 31(1) 99ndash117
Mark BG and McKenzie JM (2007) Tracing increasing tropicalAndean glacier melt with stable isotopes in water Environ SciTechnol 41(20) 6955ndash6960
Mark BG and Seltzer GO (2003) Tropical glacier meltwatercontribution to stream discharge a case study in the CordilleraBlanca Peru J Glaciol 49(165) 271ndash282
Mark BG McKenzie JM and Gomez J (2005) Hydrochemicalevaluation of changing glacier meltwater contribution to streamdischarge Callejon de Huaylas Peru Hydrol Sci J 50(6)975ndash987
Mark BG Bury J McKenzie JM French A and Baraer M (2010)Climate change and tropical Andean glacier recessionevaluating hydrologic changes and livelihood vulnerability inthe Cordillera Blanca Peru Ann Assoc Am Geogr 100(4)794ndash805
Milner AM Brown LE and Hannah DM (2009) Hydroecologicalresponse of river systems to shrinking glaciers Hydrol Process23(1) 62ndash77
Moore RD and 7 others (2009) Glacier change in western NorthAmerica influences on hydrology geomorphic hazards andwater quality Hydrol Process 23(1) 42ndash61
Nolin AW Phillippe J Jefferson A and Lewis SL (2010) Present-dayand future contributions of glacier runoff to summertime flows ina Pacific Northwest watershed implications for water resourcesWater Resour Res 46(12) W12509 (doi 1010292009WR008968)
Ohmura A (2001) Physical basis for the temperature-based melt-index method J Appl Meteorol 40(4) 753ndash761
Pouyard B and 6 others (2005) On the future of the water resourcesfrom glacier melting in the Cordillera Blanca Peru Hydrol SciJ 50(6) 999ndash1022
Rabatel A Machaca A Francou B and Jomelli V (2006) Glacierrecession on Cerro Charquini (168 S) Bolivia since the max-imum of the Little Ice Age (17th century) J Glaciol 52(176)110ndash118
Racoviteanu AE Arnaud Y Williams MW and Ordonez J (2008)Decadal changes in glacier parameters in the Cordillera BlancaPeru derived from remote sensing J Glaciol 54(186) 499ndash510
Racoviteanu AE Paul F Raup B Khalsa SJS and Armstrong R (2009)Challenges and recommendations in mapping of glacier par-ameters from space results of the 2008 Global Land IceMeasurements from Space (GLIMS) workshop Boulder Color-ado USA Ann Glaciol 50(53) 53ndash69
Ramırez E and 8 others (2001) Small glaciers disappearing in thetropical Andes a case-study in Bolivia Glaciar Chacaltaya(168 S) J Glaciol 47(157) 187ndash194
Raup BH Khalsa SJS Armstrong R Helm C and Dyurgerov M(2008) GLIMS progress in mapping the worldrsquos glaciers InLacoste H and Ouwehand L eds IGARSS rsquo07 International
Baraer and others Glacier recession and water resources in Perursquos Cordillera Blanca 149
Geoscience and Remote Sensing Symposium 23ndash27 July 2007Barcelona Spain Proceedings Institute of Electrical andElectronics Engineers Piscataway NJ 3991ndash3993
Soruco A and 9 others (2009) Mass balance of Glaciar ZongoBolivia between 1956 and 2006 using glaciological hydro-logical and geodetic methods Ann Glaciol 50(50) 1ndash8
Stahl K and Moore D (2006) Influence of watershed glaciercoverage on summer streamflow in British Columbia CanadaWater Resour Res 42(6) W06201 (doi 1010292006WR005022)
Suarez W Chevallier P Pouyaud B and Lopez P (2008) Modellingthe water balance in the glacierized Paron Lake basin (WhiteCordillera Peru) Hydrol Sci J 53(1) 266ndash277
Uehlinger U Robinson CT Hieber M and Zah R (2010) Thephysico-chemical habitat template for periphyton in alpineglacial streams under a changing climate Hydrobiologia657(1) 107ndash121
Urrutia R and Vuille M (2009) Climate change projections for thetropical Andes using a regional climate model temperature andprecipitation simulations for the end of the 21st centuryJ Geophys Res 114(D2) D02108 (doi 1010292008JD011021)
Vergara W and 7 others (2007) Economic impacts of rapid glacierretreat in the Andes Eos 88(25) 261
Viviroli D and 14 others (2010) Climate change and mountainwater resources overview and recommendations for researchmanagement and politics Hydrol Earth Syst Sci 7(3)2829ndash2895
Vuille M and 6 others (2008a) Climate change and tropicalAndean glaciers past present and future Earth-Sci Rev89(3ndash4) 79ndash96
Vuille M Kaser G and Juen I (2008b) Glacier mass balancevariability in the Cordillera Blanca Peru and its relationshipwith climate and the large-scale circulation Global PlanetChange 62(1ndash2) 14ndash18
Winkler M Juen I Molg T Wagnon P Gomez J and Kaser G (2009)Measured and modelled sublimation on the tropical GlaciarArtesonraju Peru Cryosphere 3(1) 21ndash30
Xu Z Liu Z Fu G and Chen Y (2010) Trends of major hydroclimaticvariables in the Tarim River basin during the past 50 yearsJ Arid Environ 74(2) 256ndash267
Yue S and Pilon P (2004) A comparison of the power of the t testMannndashKendall and bootstrap tests for trend detection HydrolSci J 49(1) 21ndash37
MS received 2 September 2011 and accepted in revised form 28 November 2011
Baraer and others Glacier recession and water resources in Perursquos Cordillera Blanca150
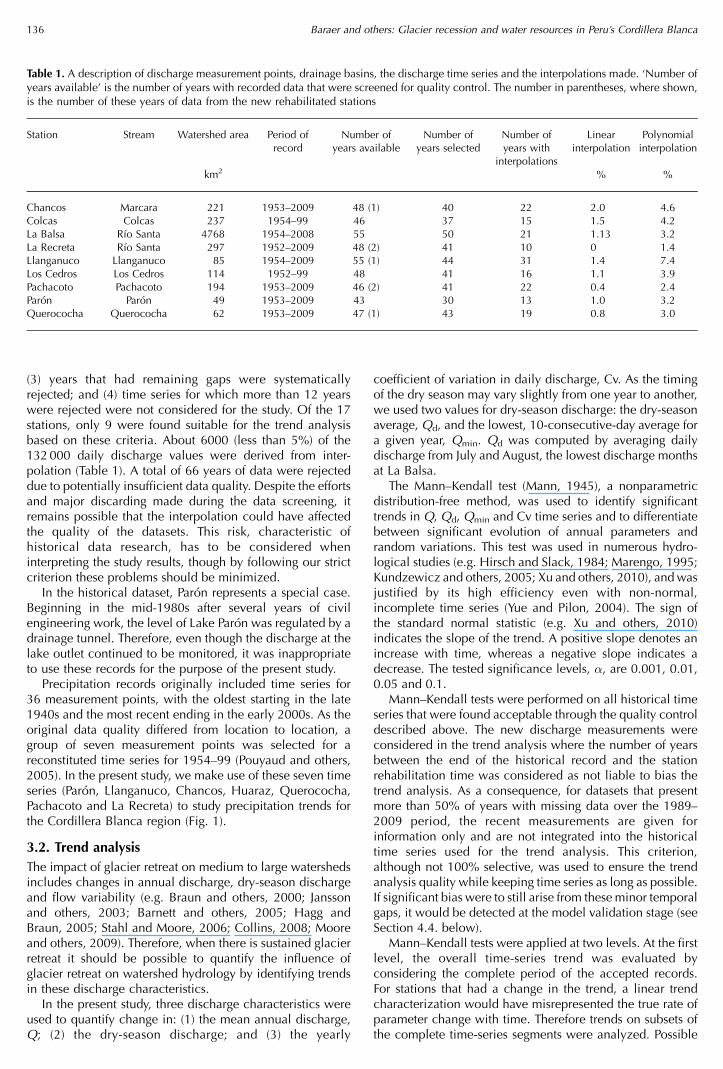
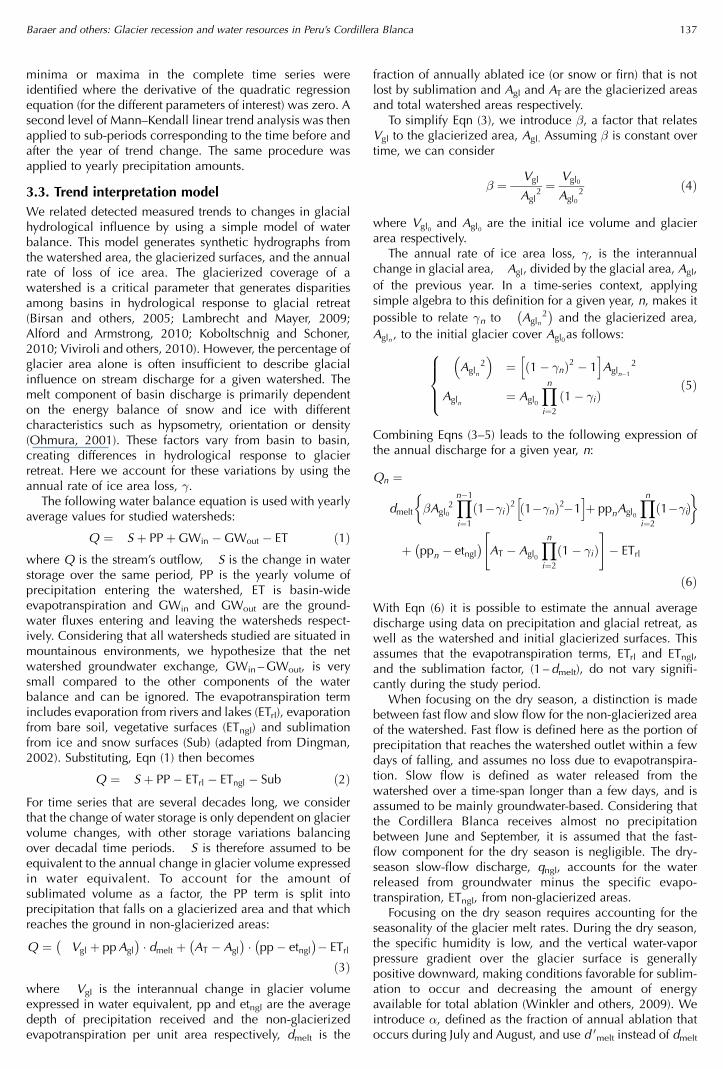
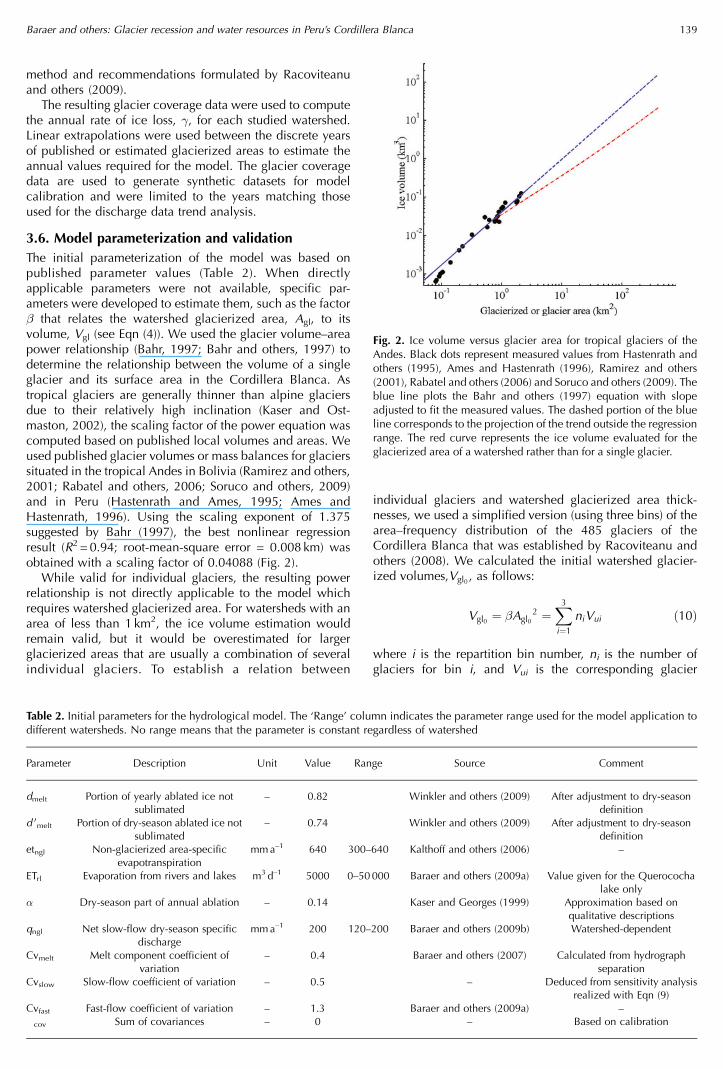
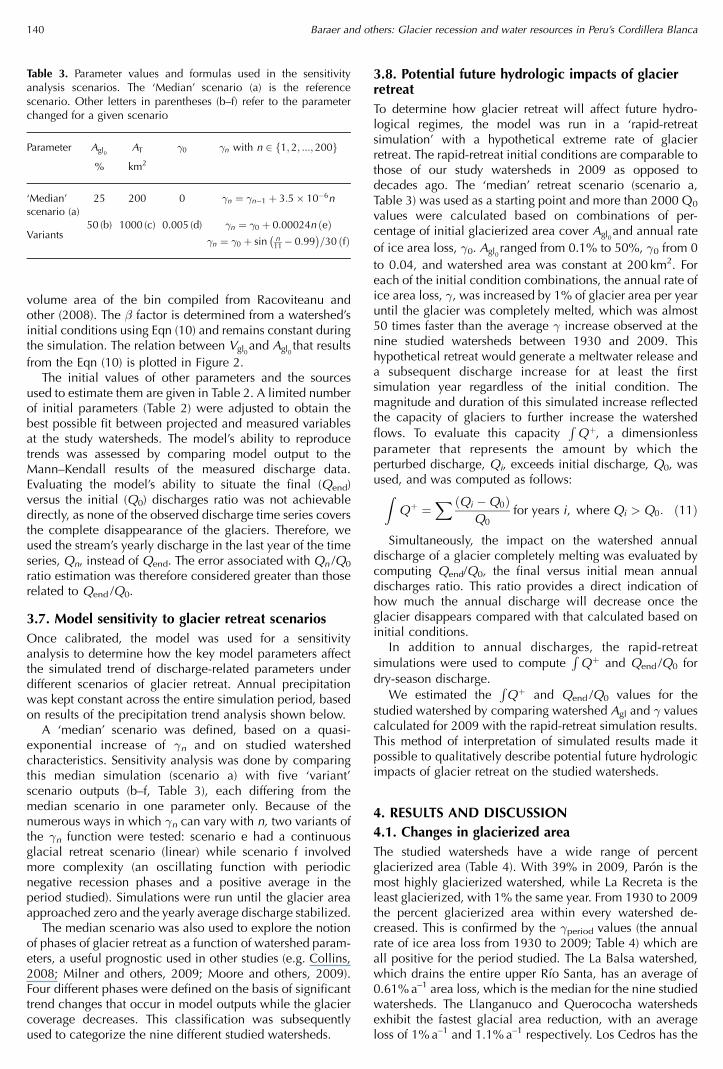
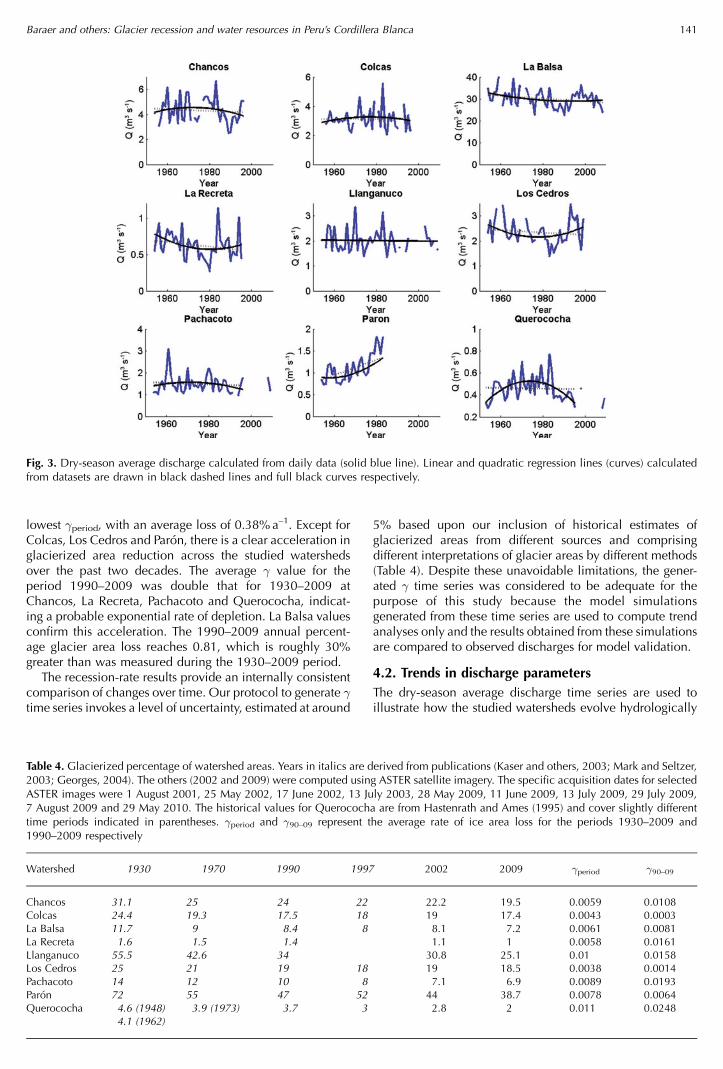
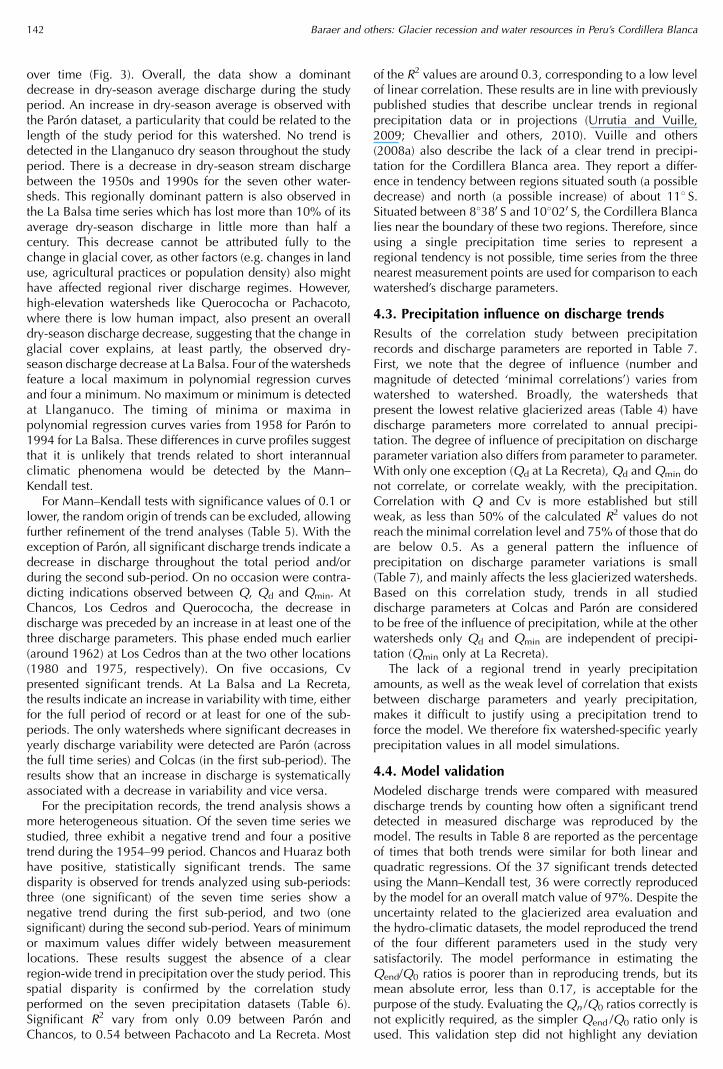
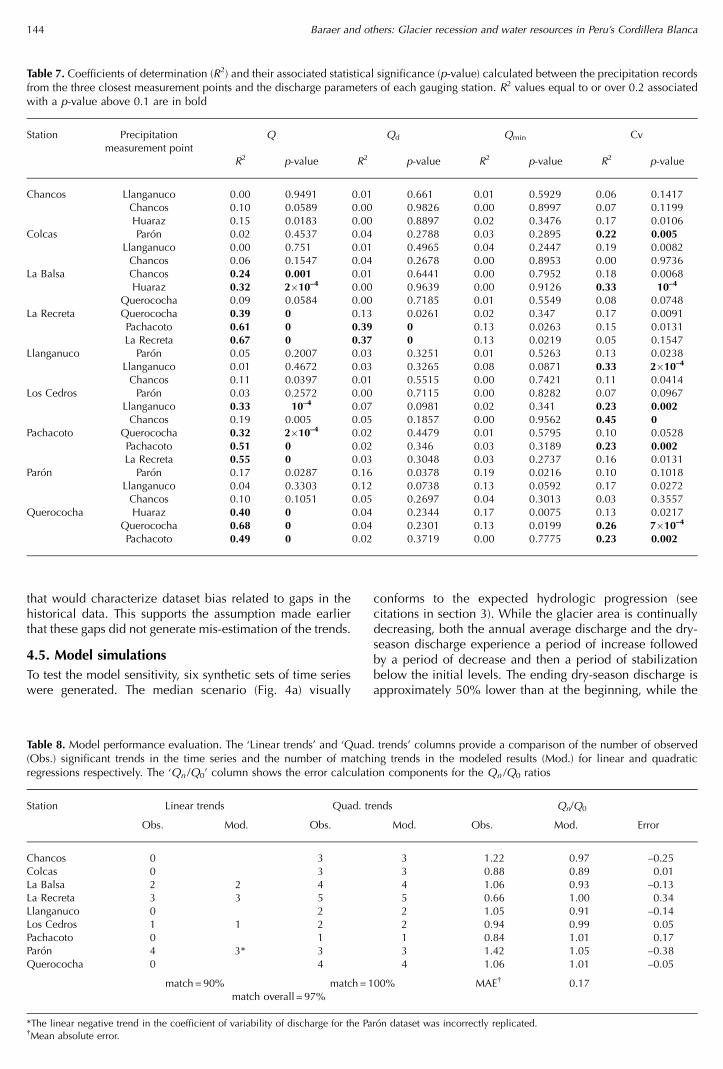
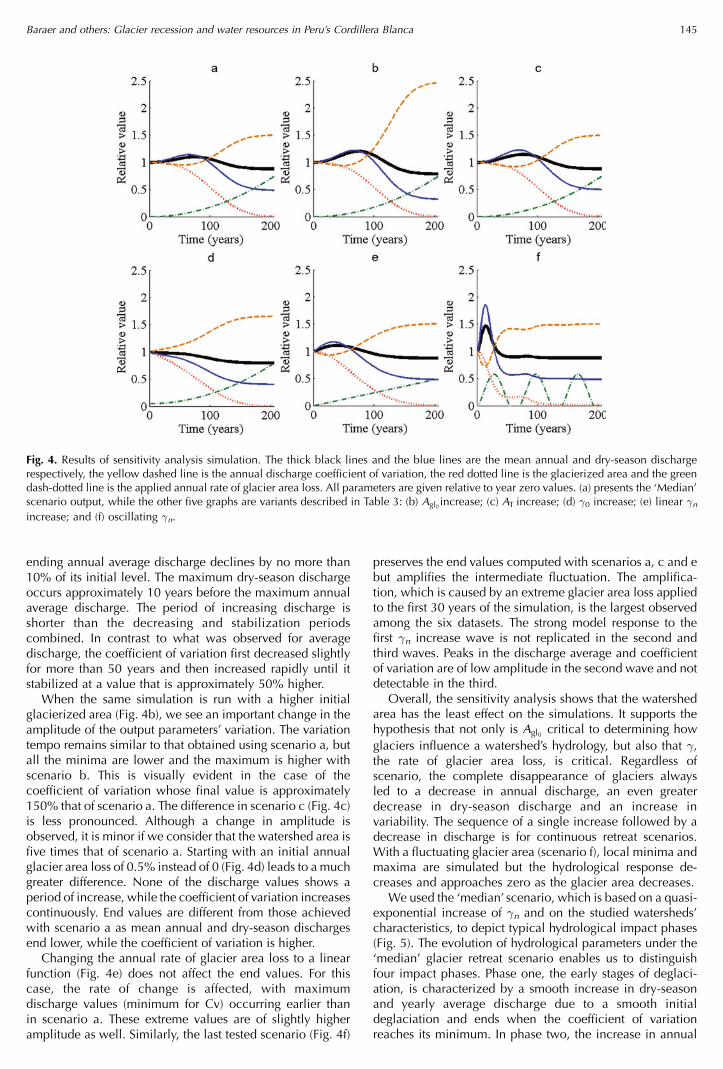
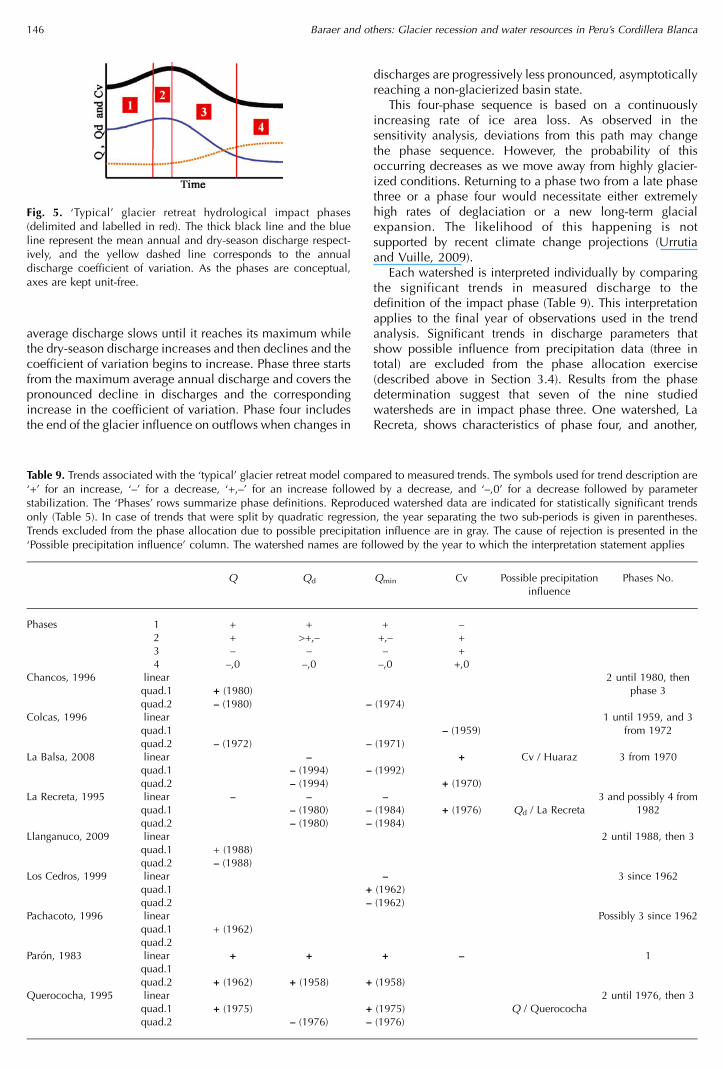
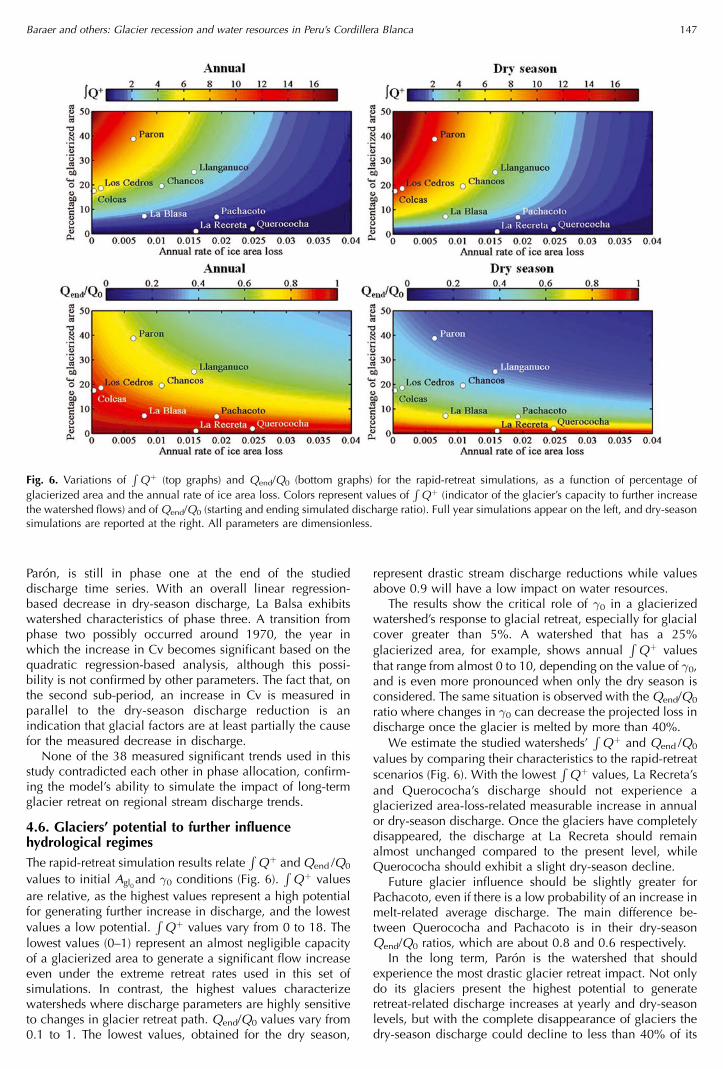