The Global Development Agenda after the Great Recession of ...
83
Government of Republic of Korea The Global Development Agenda after the Great Recession of 2008-2009 Employment Policy Department Revisiting the Seoul Development Consensus Government of Republic of Korea The Global Development Agenda after the Great Recession of 2008-2009 Employment Policy Department Revisiting the Seoul Development Consensus Papers and Proceedings of a Conference ILO, Geneva, 21 November 2011
-
Upload
khangminh22 -
Category
Documents
-
view
0 -
download
0
Transcript of The Global Development Agenda after the Great Recession of ...

Governmentof Republic of Korea
The Global Development Agenda after the Great Recession of 2008-2009
Employment Policy Department
Revisiting the Seoul Development Consensus
Governmentof Republic of Korea
The Global Development Agenda after the Great Recession of 2008-2009
Employment Policy Department
Revisiting the Seoul Development Consensus
Papers and Proceedings of a ConferenceILO, Geneva, 21 November 2011
9 789221 256076
ISBN 978-92-2-125607-6


The Global Development Agendaafter the Great Recession of2008-2009:Revisiting the SeoulDevelopment Consensus
Papers and Proceedings of a Conference
Employment Policy Department
21 November 2011
International Labour Office - Geneva
Copyright © International Labour Organization 2012First published 2012
Publications of the International Labour Office enjoy copyright under Protocol 2 of the Universal CopyrightConvention. Nevertheless, short excerpts from them may be reproduced without authorization, on conditionthat the source is indicated. For rights of reproduction or translation, application should be made to ILOPublications (Rights and Permissions), International Labour Office, CH-1211 Geneva 22, Switzerland, or byemail: [email protected]. The International Labour Office welcomes such applications.
Libraries, institutions and other users registered with reproduction rights organizations may make copies inaccordance with the licences issued to them for this purpose. Visit www.ifrro.org to find the reproduction rightsorganization in your country.
The Global Development Agenda after the Great Recession of 2008-2009: Revisiting the Seoul DevelopmentConsensus, Geneva, 2012.
ISBN: 978-92-2-125607-6 (print)978-92-2-125608-3 (web pdf)
ILO Cataloguing in Publication Data
The designations employed in ILO publications, which are in conformity with United Nations practice, and thepresentation of material therein do not imply the expression of any opinion whatsoever on the part of theInternational Labour Office concerning the legal status of any country, area or territory or of its authorities, orconcerning the delimitation of its frontiers.
The responsibility for opinions expressed in signed articles, studies and other contributions rests solely withtheir authors, and publication does not constitute an endorsement by the International Labour Office of theopinions expressed in them.
Reference to names of firms and commercial products and processes does not imply their endorsement by theInternational Labour Office, and any failure to mention a particular firm, commercial product or process is nota sign of disapproval.
ILO publications and electronic products can be obtained through major booksellers or ILO local offices inmany countries, or direct from ILO Publications, International Labour Office, CH-1211 Geneva 22,Switzerland. Catalogues or lists of new publications are available free of charge from the above address, or byemail: [email protected]
Visit our web site: www.ilo.org/publns
Design and production: International Training Centre of the ILO, Turin Printed in Italy

Table of Contents
Acknowledgements..................................................................................v
Introduction...........................................................................................1Programme - Employment Policy Department One-Day Knowledge Sharing Conference........2
Opening Remarks .................................................................................................8
1.Keynote Speech................................................................................11G20 Development Governance, 1999-2011:Involvement, Innovation, Institutionalization, ImpactJohn Kirton........................................................................................................12
Introduction.......................................................................................................12
The G20’s creation and innovation ........................................................................12
The G20 Summit’s rising development performance, 2008-10 ..................................15
Seoul Development Consensus and beyond.............................................................17
Conclusion.........................................................................................................19
2.Session 1: Revisiting the Seoul Development Consensus..........................23Revisiting the Seoul Development Consensus:Rationale, Current Status and Future ProspectsJai-Joon Hur ......................................................................................................24
Introduction.......................................................................................................24
Discussion of development agendas before the Seoul Development Consensus .............25
Shaping of the Seoul Development Consensus.........................................................27
Content of the Seoul Development Consensus .........................................................31
Current status and future prospects .......................................................................35
References ........................................................................................................37
3.Session 2: Job Creation and Global Development....................................39The Service RevolutionEjaz Ghani.........................................................................................................40
Introduction.......................................................................................................40
The Global Development Agenda after the Great Recession of 2008-2009: Revisiting the Seoul Development Consensus iii

Comparing China’s and India’s growth patterns........................................................40
Can the services sector contribute to growth? ..........................................................43
Role of service-led growth in poverty reduction and job creation .................................45
Are service jobs good jobs? ..................................................................................46
Can service-led growth be sustained? .....................................................................49
References ........................................................................................................51
Promotion of Non-traditional Agricultural Exports and their Employment Consequences:Case of the Cut Flower Industry in EthiopiaYukichi Mano.....................................................................................................52
Abstract ............................................................................................................52
Introduction.......................................................................................................52
Hypotheses........................................................................................................53
The cut flower industry in Ethiopia ........................................................................55
Data and descriptive analyses ...............................................................................56
Estimation strategy .............................................................................................59
Estimation results...............................................................................................60
Conclusion.........................................................................................................62
References ........................................................................................................63
4. Proceedings .....................................................................................65Session 1: Revisiting the Seoul Development Consensus...........................................66
Seoul Development Consensus: Rationale, Current Status and Future Prospects ...........66
Questions and comments on the morning session ....................................................66
Session 2: Job Creation and Global Development.....................................................68
The Role of the Services Sector as a Major Vehicle for Job Creation ............................68
Questions and comments on the role of the services sectoras a major vehicle for job creation .........................................................................68
Meeting the Job Creation Challenge in Africa ..........................................................69
Questions and comments on meeting the job creation challenge in Africa....................71
Promotion of Non-traditional Agricultural Exports and their EmploymentConsequences: Case of the Cut Flower Industry in Ethiopia .......................................72
Questions and comments on the promotion ofnon-traditional agricultural exports and their employment consequences:Case of the cut flower industry in Ethiopia ..............................................................72
iv The Global Development Agenda after the Great Recession of 2008-2009: Revisiting the Seoul Development Consensus

Acknowledgements
This publication is the outcome of theEmployment Policy Department’s One-DayKnowledge Sharing Conference entitled “TheGlobal Development Agenda after the GreatRecession of 2008-2009: Revisiting the SeoulDevelopment Consensus”. The conference andthis volume would not have been possiblewithout the dedication and commitment of allcontributors.
We are grateful to the Government of theRepublic of Korea for its continuous support tothe ILO through the ILO-Korea PartnershipProgramme. The Employment PolicyDepartment was able to host this conferencesuccessfully with the Korean Government’sfinancial support. We would like to express ourdeepest gratitude to Sang-ki Park, theAmbassador of the Permanent Mission of theRepublic of Korea, for his participation in theconference and his contribution, along with hisopening remarks. Furthermore, we thankJong-Cheol Kim, Labour Attaché of thePermanent Mission of the Republic of Korea, forhis dedication to the success of the conference bypromoting the event among member countries.
We would like to thank José ManuelSalazar-Xirinachs, Executive Director of the ILO’sEmployment Sector, for his commitment to theconference and excellent chairmanship of theopening session. We express our sincereappreciation to Azita Berar Awad, Director of theEmployment Policy Department (EMP/POLICY),for her support to the whole preparation process aswell as to the event itself, including her openingremarks.
This publication has benefited enormously fromILO colleagues who have provided comments andfeedback on various sessions, including SangheonLee, David Kucera, Lawrence Egulu and FrédéricLapeyre. We also thank Mariangels Fortuny andMakiko Matsumoto for their superb chairmanshipof each session of the conference. Finally, weappreciate the contribution of all our colleagues inthe Employment Policy Department, along with theadministrative assistance of the departmentalsecretariat, especially Jane Bang.
Wang Kim
HyeJin Lee
Iyanatul Islam
The Global Development Agenda after the Great Recession of 2008-2009: Revisiting the Seoul Development Consensus v


Introduction
The Employment Policy Department’s One-DayKnowledge Sharing Conference took place on 21November 2011 at ILO headquarters in Geneva. Itsgoal was to provide a forum for distinguished externalexperts to share their knowledge on the evolution of theglobal development agenda after the great recession of2008-2009. In addition, by revisiting the framework ofthe Seoul Development Consensus, the conferencesought to assess whether it should and could beimplemented with greater vigour in the currenteconomic context of the G20 countries. It was alsoa great opportunity to discuss how to build a newdevelopment framework by sharing different countrycase studies. Approximately 60 ILO representatives andexternal experts conducted spirited discussions in thecourse of two interrelated but distinct sessions.
The first session of the conference revisited theSeoul Development Consensus (SDC) that was
unveiled by G20 members in the Republic ofKorea in 2010. It also reviewed the rationalebehind the SDC, explored its current status,reflected on future prospects and invited a morecritical examination by asking experts to assesswhether another “development consensus” wasreally needed. The afternoon session was devotedto the theme of ‘job creation and development,’ atheme that is at the core of ILO’s mandate as wellas of the SDC. The speakers explored pathways tojob creation that went beyond the customaryfocus on manufacturing as a vehicle for rapiddevelopment and job creation. Case studies fromAfrica were used to enrich the proceedings. Theproceedings and the knowledge generated duringthe conference are summarized in this report.Although there were five presentations, fourpapers are reproduced in this volume as the fifthpaper was not available for circulation.
The Global Development Agenda after the Great Recession of 2008-2009: Revisiting the Seoul Development Consensus 1

Employment Policy Department One-Day Knowledge Sharing Conference
Programme
Welcome and Opening
Chair: José Manuel Salazar-Xirinachs, Executive Director, Employment Sector, ILO
� Opening Remarks
� Azita Berar Awad, Director, Employment Policy Department, ILO
� Sang-ki Park, Ambassador, Permanent Mission of the Republic of Korea
� Keynote Speech
� John Kirton, Director, G8 Research Group, University of Toronto
Coffee Break
Session 1: Revisiting the Seoul Development Consensus
Chair: Mariangels Fortuny, Employment Policy Department, ILO
� Seoul Development Consensus: Rationale, Current Status and Future Prospects
� Jai-Joon Hur, Senior Research Fellow, Korea Labour Institute
Discussant: Sangheon Lee, Labour Protection Department, ILO
Lunch
2 The Global Development Agenda after the Great Recession of 2008-2009: Revisiting the Seoul Development Consensus

Session 2: Job Creation and Global Development
Chair: Makiko Matsumoto, Employment Policy Department, ILO
� The Role of the Services Sector as a Major Vehicle for Job Creation
� Ejaz Ghani, Senior Economic Advisor, World Bank
Discussant: David Kucera, Policy Integration Department, ILO
� Meeting the Job Creation Challenge in Africa
� Paul Cook, Engagement Manager, McKinsey and Company
Discussant: Lawrence Egulu, Policy Integration Department, ILO
Coffee Break
� Job Creation and Growth in the Ethiopian Cut Flowers Industry
� Yukichi Mano, Assistant Professor, National Graduate Institute for Policy Studies, Japan
Discussant: Frédéric Lapeyre, Employment Policy Department, ILO
Cocktail Reception
The Global Development Agenda after the Great Recession of 2008-2009: Revisiting the Seoul Development Consensus 3

4 The Global Development Agenda after the Great Recession of 2008-2009: Revisiting the Seoul Development Consensus
The Employment Policy Department’s Knowledge Sharing Conference on 21 November 2011 at the ILO, Geneva

The Global Development Agenda after the Great Recession of 2008-2009: Revisiting the Seoul Development Consensus 5

6 The Global Development Agenda after the Great Recession of 2008-2009: Revisiting the Seoul Development Consensus
Sang-ki Park, Ambassador of the Permanent Mission of the Republic of Koreadelivers his opening remarks in the conference.

The Global Development Agenda after the Great Recession of 2008-2009: Revisiting the Seoul Development Consensus 7
José Manuel Salazar-Xirinachs, Executive Director of the Employment Sector in the ILO welcomes all the participants aswell as distinguished speakers during the opening session.(From the Left) Sang-ki Park, José Manuel Salazar-Xirinachs, Azita Berar Awad, Director, Employment Policy Department,ILO and John Kirton, Director, G8 Research Group, University of Toronto.
Employment challenges in Africa, one of main themes in the conference is discussed during the second session.

Opening Remarks
José Manuel Salazar-Xirinachs (ExecutiveDirector, Employment Sector, ILO) said thatparticipants in the Conference would have theopportunity to discuss the global developmentagenda by revisiting the Seoul DevelopmentConsensus, which was especially appropriate giventhe fragile financial situation that has been hauntingEurope and the rest of the world since 2008. Hestressed the common concerns regarding the lack ofjobs, the persistence of policy uncertainty, theperceived injustice and unfairness of the currenteconomic system and emphasized the significanceof knowledge sharing with ILO colleagues andprofessionals from the World Bank, Think Tanks,the private sector and the Korean Government.
Azita Berar Awad (Director, EMP/POLICY,ILO) introduced two critical political aspects of thepolicy research that the Employment PolicyDepartment was conducting with support from theKorean Government. First of all, the Department’sresearch was specifically designed to provide policyadvice on employment. One of its major themeswas youth employment, in particular aschool-to-work transition survey that made researchfindings available to the five pilot countries. Thiswas becoming more and more important, especiallyin the global crisis affecting youth employment.Secondly, the policy research served to assess theimpact of public and private investment foremployment generation. She emphasized howimportant it was to focus on the current contextfacing the next generation, in terms of employmentpolicy and the macroeconomic framework, and on anew policy paradigm. In conclusion, Mrs BerarAwad noted that the current phase of the projectmade it possible to rethink development policy, andthe Conference was intended to facilitate theplanning of development strategies, particularlyfrom the standpoint of the Seoul DevelopmentConsensus. She concluded her opening remarks by
thanking the Korean Government for helpingenrich the Department’s analytical work on policyadvice at the county level.
Sang-ki Park (Ambassador, PermanentMission of the Republic of Korea) emphasizedthat the one-day knowledge sharing conference wasa timely occasion to discuss the global developmentagenda as the effect of the financial crisis was stilllingering. Ambassador Park opened his remarks bydescribing his country’s contribution todevelopment cooperation with the globalcommunity through the unique perspective of theRepublic of Korea. Recognized as the firstDevelopment Assistance Committee (DAC) donorcountry to have emerged from the ranks of the leastdeveloped nations, the Korean Governmentattached great importance to developmentcooperation in its national agenda and was fullycommitted to its pledge to triple the budget of itsOfficial Development Assistance (ODA) to 3billion USD over the next five years. Furthermore,Korea wanted its contribution to the world to makethe best possible use of the unique developmentexperience of a recipient-turned-donor country, aswell as to play a bridging role between developingand developed countries.
As chair of the G20 Seoul Summit in 2010,Korea successfully made development a centraltheme in the G20’s agenda with the adoption ofthe Seoul Development Consensus and itsMulti-Year Action Plan. Against that backdrop,the current Government under the leadership ofPresident Lee was taking the right path towards amore aggressive and action-oriented globaldiplomacy, with development cooperation as acentral feature and priority of Korea’s foreignpolicy. In addition, as host to the FourthHigh-Level Forum on Aid Effectiveness inPusan, which was another major international
8 The Global Development Agenda after the Great Recession of 2008-2009: Revisiting the Seoul Development Consensus

development event, Korea was looking forwardto inspiring discussions on topics ranging from“How to deliver aid effectively” to “How aid canmake a substantive development impact” onsuch areas as poverty reduction, growth andfinancial stability.
Mr Park expressed his appreciation of the ILO’scontribution to global development and to theattainment of “universal and lasting peace basedon social justice” by improving workingconditions and creating more decent jobs aroundthe world. He emphasized that the purpose of theConference was to explore possible avenues toenhance the effectiveness and efficiency ofdevelopment cooperation, as well as to draw onthe ILO’s knowledge and apply it to the SeoulDevelopment Consensus in key aspects – job
creation, human resource development, andknowledge sharing, three of the nine pillars thatthe Seoul Summit’s Multi-Year Action Plan onDevelopment identified as critical to ensuringinclusive and sustainable growth in developingcountries.
Mr Park concluded that the ILO’s decent jobsinitiative should be used proactively to promotesustainable development in developed as well asin developing countries. By sharing the role of theservices sector in job creation and the specificissues facing the African region as well as thegeneral framework of the G20 DevelopmentAgenda, the Conference would explore avenuesof desirable sustainable development throughemployment.
The Global Development Agenda after the Great Recession of 2008-2009: Revisiting the Seoul Development Consensus 9


1. KEYNOTE SPEECH

G20 Development Governance,1999-2011: Involvement, Innovation,Institutionalization, Impact
John Kirton, Director, G8 Research Group, University of Toronto
Introduction
The G20, once conceived as a finance andeconomic forum, has been increasingly involved ininternational development. Development is quicklymoving into a higher priority position, has beeninstitutionalized and is being integrated into theG20’s current focus on promoting strong, sustainedand balanced growth. Its impact, while very limitedso far, thus promises to increase in the years ahead.
This study traces the G20’s increasing involvement,integration, institutionalization and impact ondevelopment from 1999 to 2011. It finds that therehas been a general trend towards an increasedinvolvement and integration in andinstitutionalization of development. This wasaugmented dramatically by the Seoul Summit inNovember 2010. These trends should continue,with G20 development governance promising tohave its first major impact on the globaldevelopment agenda when Mexico hosts theseventh G20 summit in June 2012, with sustainabledevelopment and green growth as its prioritythemes.
The G20’s creation andinnovation
The G20’s creation, 1999
The Group of Twenty was created as an annualgathering of the finance ministers and central bankgovernors of the world’s systemically significantcountries, in response to the Asian-turned-globalfinancial crisis of 1997 to 1998. It brought togetheras equals the established countries of the Group ofEight — Canada, France, Germany, Italy, Japan,Russia, United Kingdom, United States — and theemerging countries – Argentina, Brazil, China,India, Indonesia, Republic of Korea, Mexico, SaudiArabia, South Africa, Turkey – as well as Australiaand the European Union. The managing director ofthe International Monetary Fund (IMF) and thePresident of the World Bank also attended. Theequality between the two Bretton Woods bodiesensured that development would have a place inG20 governance from the start.
The first three meetings, chaired by Paul Martin,Canada’s Minister of Finance, took place in Berlin inDecember 1999, Montreal in October 2000 andOttawa in October 2001. From then on the chairrotated, usually alternating between emerging andadvanced members, with ministerial meetings beingheld in India in 2002, Mexico in 2003, Germany in2004, China in 2005, Australia in 2006, South Africain 2007 and Brazil in 2008. This move towardsequality in hosting helped maintain a focus on thetheme of development.
12 The Global Development Agenda after the Great Recession of 2008-2009: Revisiting the Seoul Development Consensus

The G20’s development mission,1999-2001
Since the start, the G20 dealt with development inan expanding, largely ratchet-like way. At Berlin itdefined its mission as promoting “sustainable worldeconomic growth that benefits all.” At Montreal, itmore directly declared its desire to reduce poverty,help Heavily Indebted Poor Countries (HIPCs) andimprove the effectiveness of Official DevelopmentAssistance (ODA). At Ottawa in 2001, it supportedthe newly launched Doha Development Agenda atthe World Trade Organization (WTO), reaffirmedsupport for poverty reduction and the needs of thepoorest, and stressed the value of equity in theworld.
The expanding development agenda,1999-2008
Over its first decade, the G20 gradually increased itsinvolvement in development. Whilemacroeconomic stability and financial regulationremained the dominant issues, developmentassumed a greater place and became incorporatedinto more areas of the agenda. When economicgrowth was strong, when there were no significantshocks to the international system, and when anemerging country hosted the G20, attention todevelopment rose.
At Berlin in 1999, the G20 supported continuedtrade liberalization in order to bring about“broad-based benefits to the global economy.” AtMontreal in 2000, members discussed the benefitsof globalization for achieving “sustained andbroad-based improvements in living standards,which included providing developing countrieswith better access to advanced markets for theirexports. Economic integration was declared to be apowerful force for reducing poverty and spurringeconomic growth, in order to improve theeconomies of HIPCs. The first mention of ODAcame with a call for bilateral donors to improvetheir aid effectiveness. At Ottawa in 2001, despite
the preoccupation with the 2001 terrorist attackson the United States, the G20 welcomed theWTO’s Doha Development Agenda, expressed adesire to reduce the effects of the economicslowdown on developing countries andreaffirmed economic integration as a force forpoverty reduction.
In 2002, when India became the first emergingeconomy to host the G20, about 75 per cent of thecommuniqué’s ten paragraphs dealt withdevelopment. Poverty reduction and the needs ofdeveloping countries were related to the need forstrong institutions, a favourable investment climate,transparency, infrastructure investment and humandevelopment. A section of the communiqué,entitled “Globalization, trade and development,discussed the Millennium Development Goals(MDGs) for the first time.
The 2003 meeting in Mexico introduced theprinciple of promoting growth of a more“balanced” nature between the developed anddeveloping world. It reaffirmed the importance ofinternational trade for development, connectedtrade with the fulfilment of the MDGcommitments, and urged debt relief for poorcountries.
At Berlin in 2004, the G20 reaffirmed support forthe MDGs, welcomed the role of the World Bankand the IMF’s mechanisms for financingdevelopment, and supported reviving thealreadystalled Doha negotiations. A section entitled“Empowering the people and reducing poverty”discussed education, access to finance and socialsafety nets.
In China in 2005 the G20’s involvement, integration
and innovation in development soared. It released
its first document specifically devoted to
development. The theme of the summit included
“balanced” growth, as the G20 members noted
their concern over low growth and increasing
poverty in some developing countries despite the
overall expansion of the world economy. Support
The Global Development Agenda after the Great Recession of 2008-2009: Revisiting the Seoul Development Consensus 13
1. KEYNOTE SPEECH
for Doha, trade liberalization and the MDGs again
appeared.
The meeting expansively expressed support for theWorld Bank and IMF’s work in helping poorcountries deal with commodity shocks and high oilprices. It connected its reform agenda todevelopment more explicitly. For the first time, itfocused on reform of the international financialinstitutions (IFIs), including a call for updating thequota system, and elaborated on the link betweensuch reform and effectiveness. It laid out a clear andrenewed role for the World Bank in internationaldevelopment.
In the lengthy G20 Statement on GlobalDevelopment Issues, members agreed that “theG20 should play an active role in addressing criticaldevelopment issues.” The document discussedfamiliar issues in greater detail, referring to theimportance of country-led and country-specificdevelopment approaches, the mobilization ofdevelopment resources —welcoming efforts toreach the goal of 0.7 per cent of gross nationalproduct as ODA — and innovative financingmechanisms.
In Australia in 2006 the G20 showed that itsdevelopment agenda was here to stay. It endorsedbroad-based economic growth for povertyreduction, the Doha negotiations and IMF reform,but it focused less on development than in previousyears. It also built on the 2005 Statement to supportgreater aid effectiveness and debt relief, with allmembers pledging support for the new ParisDeclaration on Aid Effectiveness of theOrganisation for Economic Co-operation andDevelopment (OECD). Climate change was notedfor the first time.
The 2007 meeting in South Africa called for“balanced and sustainable growth” and endorsedthe Doha negotiations, IFI reform and the MDGs.It linked the economy with climate change.
In Brazil in 2008, the G20 began by supportingpoverty reduction, social inclusion and globalgrowth. It innovatively emphasized the need tominimize the impact of the new global financialcrisis on emerging and low-income countries andcalled for a restoration of credit and capital flows todeveloping countries. It defined a role for theMultilateral Development Banks (MDBs).Members also stressed the importance of reducingthe impact of commodity price volatility,maintaining aid flows and sustaining infrastructureinvestment through the MDBs and IFI reform.Doha was noted too.
Decisional commitments ondevelopment: China as champion
During the G20’s first decade, the number of itsspecific development commitments increased. Therewere none in 1999, four in 2000, one each in 2001,2002 and 2003, and none in 2004. In China in 2005,there was a sharp spike to a new high of eightcommitments on development, mostly associatedwith trade. But there were only two in 2006, one in2007 and one in 2008. China alone was the G20’s realaction-oriented development champion, if in a largelytrade-liberalizing and private-sector-partnership way.
The G20’s impact on the global developmentagenda remained modest. The G20 largely added itsweight to ideas and initiatives that had begunelsewhere. Yet bringing these initiatives to aconsensus among the most influential establishedand emerging powers, and among their financeministers rather than their development andplanning ministers, was an important achievementindeed.
14 The Global Development Agenda after the Great Recession of 2008-2009: Revisiting the Seoul Development Consensus

The G20 Summit’s risingdevelopment performance, 2008-10
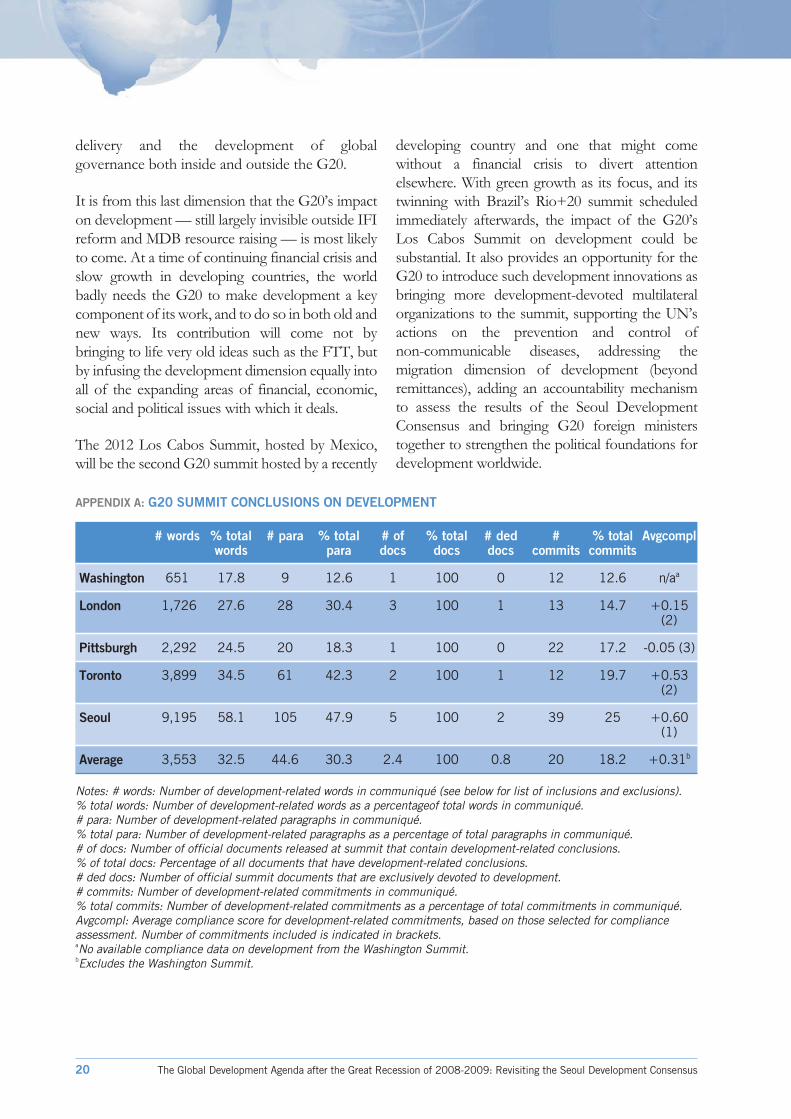
Once the G20 started meeting at the leaders’ level,G20 attention to development rose steadily from2008 to 2010 (APPENDIX A). A significant number ofdistributional principles were affirmed (APPENDIX B).Development commitments consistently increasedand their delivery became relatively strong(APPENDIX A). The G20 relationship with otherinternational development institutions was low butspiked at the fifth summit in Seoul in November2010 (APPENDIX C).
Washington, November 2008: Openmarkets for poverty reduction
The first G20 summit in Washington in November2008, hosted by United States President GeorgeBush, had only a peripheral interest in development.The predominant focus on financial issues meantthat the G20 devoted to development the smallestamount of absolute and relative attention in thecommuniqué in the history of all the G20 summits.Washington did, however, affirm the importance ofgood governance, accountability, transparency and abroad range of social and equity concernsreminiscent of the Montreal Consensus of 2000. Itdeclared: “Our work will be guided by a shared beliefthat market principles, open trade and investmentregimes, and effectively regulated financial marketsfoster the dynamism, innovation, andentrepreneurship that are essential for economicgrowth, employment and poverty reduction.” As inChina in 2005, open trade and new markets,investment and entrepreneurship were theinstruments identified to get poverty reduced.
London, April 2009: Stimulus and IFIreform for development
At the second G20 summit in London in April2009, British Prime Minister and host GordonBrown brought development to the centre stage.
The agenda still focused heavily on financialregulation and supervision and macroeconomicstimulus, but it extended to development-relatedareas such as expanded access to credit, climateadaptation and IFI reform.
The emerging economies, backed by developmentorganizations and the United Nations, used the G20to push for a large stimulus package targeted ondevelopment and to ensure that the poorest of thepoor did not suffer unduly from the financial crisis.A letter from United NationsSecurity-General BanKi-moon to Brown encouraged the G20 to lead ondevelopment, suggesting a development-orientedstimulus package of $1 trillion. The London Summitdid indeed mobilize $1.1 trillion in new money forglobal stimulus overall. Developing countries werepotentially major beneficiaries of this massive newfunding awarded to the IMF, MDBs and otherinstitutions. The World Bank received $100 billionof the total. The passage on accelerated IFI reformcontained a promise to make sure that developingcountries got better treatment from globalinstitutions and a better position in the globaleconomic balance of power. The G20 thus soughtto advance the global architecture in the interests ofdevelopment, moving from simply mobilizing moremoney for aid and poverty reduction throughtraditional instruments to making structural changesthat would reorient the centres of globalinstitutional power in finance and economiestowards low-income countries.
London did less on other development fronts. TheUnited Kingdom worked to include climate changein a development context, spurred byCommonwealth members from Africa who pointedto climate change control as their most pressingconcern. However, resistance from emergingeconomies and others, which saw the G20 as aninappropriate forum to advance climategovernance, meant that this initiative did not go veryfar. In similar fashion, the day before the summit,Brown and Australian Prime Minister Kevin Ruddcalled for stronger ethics in the global economy andfor meeting the needs of the poor by reaching the
The Global Development Agenda after the Great Recession of 2008-2009: Revisiting the Seoul Development Consensus 15
1. KEYNOTE SPEECH
MDGs. The MDGs, however, received only oneline in the communiqué. Aid commitments weresimilarly brief.
Deliberation and decision making on developmentshot up dramatically relative to the WashingtonSummit. However, compliance with London’scommitments on the MDGs, ODA and climateadaptation was poor. Within the G20, most of theG7 members did well in delivering their MDG andODA commitments. But overall most complied littlewith their commitment on voluntarily increasingresources for social protection. More IFI reform wasrequired before it could be considered a success.
London’s surge in development performance wasdriven first by the fear that economic devastationwould destroy the gains made in development anddemocracy over the past two decades. There was asense that the fates of the developed and developingworlds were intricately connected, and that failure inone would mean failure in the other. A second keycause was the personal commitment of Brown toglobal poverty reduction and his determination ashost to embed development in various aspects ofthe G20 agenda. Brown maintained the core agendaof the Washington Summit — financial regulation,macroeconomic management, IFI reform, tradeand investment liberalization, and development —but reorganized priorities within them. He addedfinancial and social inclusion as a key agenda item toadvance development in important ways.
Pittsburgh, September 2009
At Pittsburgh in September 2009, with US PresidentBarack Obama now in the chair, overall progress ondevelopment stalled slightly, but momentum on IFIreform and MDB resources was sustained.Developing countries looked to the G20 tocomplete its “unfinished business” in promotingdevelopment in a fair and inclusive way, a call thatsaw modest success. Although Pittsburgh did notscrap London’s development advances, it did notdrive them forward in any significant way.
IFI reform took centre stage. Consensus on IMFquota reform was slow to achieve and contentious,with initial proposals rejected by Brazil and otheremerging economies as not going far enough. Theeager emerging economies confronted the reluctantEuropeans, with the US mediating and encouragingthe Europeans to accept greater reform. In the end,the communiqué stipulated a 5 per cent shift inquota share. Numerous commitments also weremade to replenish MDB resources and to reformthe World Bank further.
Other areas of development saw modest success.The much acclaimed Framework for Strong,Sustainable and Balanced Growth vaguely promisedto pursue economic growth that narroweddevelopment imbalances and promoted povertyreduction. The launch of a G20 SME FinanceChallenge for Small and Medium-sized Enterprises(SMEs) and a G20 Financial Inclusion ExpertsGroup could contribute to development, but howwas not specified. The G20 also pledged increasedaid transparency. It reiterated its London promiseson improving progress towards the MDGs andincreased ODA.
At Pittsburgh the absolute number of wordsdevoted to development increased, but thepercentage of development words decreased. Thenumber of development commitments increasedsignificantly, due largely to those on IFI reform.However the G20’s delivery of these commitmentswas dismal. Delivery appeared promising at first,beginning with Canada’s pre-summitannouncement of a $2.6 billion callable capitalcontribution to the African Development Bank.Compliance with the commitments on IFI reformand MDB replenishment was positive. Butcompliance with the pledges on ODA, the MDGs,aid effectiveness and aid transparency was in thenegative range. Pittsburgh was thus left with a lowrecord of compliance with developmentcommitments.
16 The Global Development Agenda after the Great Recession of 2008-2009: Revisiting the Seoul Development Consensus
Seoul Development Consensusand beyond
Toronto, June 2010: Conception of theSeoul Development Consensus
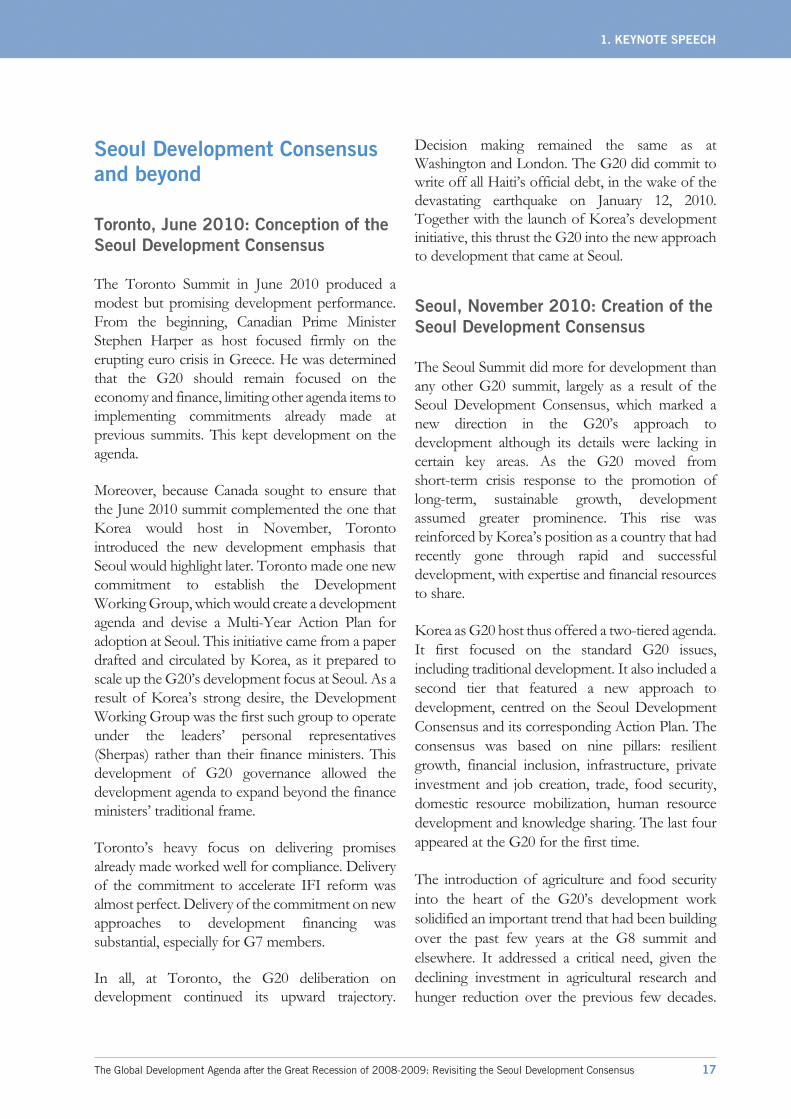
The Toronto Summit in June 2010 produced amodest but promising development performance.From the beginning, Canadian Prime MinisterStephen Harper as host focused firmly on theerupting euro crisis in Greece. He was determinedthat the G20 should remain focused on theeconomy and finance, limiting other agenda items toimplementing commitments already made atprevious summits. This kept development on theagenda.
Moreover, because Canada sought to ensure thatthe June 2010 summit complemented the one thatKorea would host in November, Torontointroduced the new development emphasis thatSeoul would highlight later. Toronto made one newcommitment to establish the DevelopmentWorking Group, which would create a developmentagenda and devise a Multi-Year Action Plan foradoption at Seoul. This initiative came from a paperdrafted and circulated by Korea, as it prepared toscale up the G20’s development focus at Seoul. As aresult of Korea’s strong desire, the DevelopmentWorking Group was the first such group to operateunder the leaders’ personal representatives(Sherpas) rather than their finance ministers. Thisdevelopment of G20 governance allowed thedevelopment agenda to expand beyond the financeministers’ traditional frame.
Toronto’s heavy focus on delivering promisesalready made worked well for compliance. Deliveryof the commitment to accelerate IFI reform wasalmost perfect. Delivery of the commitment on newapproaches to development financing wassubstantial, especially for G7 members.
In all, at Toronto, the G20 deliberation ondevelopment continued its upward trajectory.
Decision making remained the same as atWashington and London. The G20 did commit towrite off all Haiti’s official debt, in the wake of thedevastating earthquake on January 12, 2010.Together with the launch of Korea’s developmentinitiative, this thrust the G20 into the new approachto development that came at Seoul.
Seoul, November 2010: Creation of theSeoul Development Consensus
The Seoul Summit did more for development thanany other G20 summit, largely as a result of theSeoul Development Consensus, which marked anew direction in the G20’s approach todevelopment although its details were lacking incertain key areas. As the G20 moved fromshort-term crisis response to the promotion oflong-term, sustainable growth, developmentassumed greater prominence. This rise wasreinforced by Korea’s position as a country that hadrecently gone through rapid and successfuldevelopment, with expertise and financial resourcesto share.
Korea as G20 host thus offered a two-tiered agenda.
It first focused on the standard G20 issues,
including traditional development. It also included a
second tier that featured a new approach to
development, centred on the Seoul Development
Consensus and its corresponding Action Plan. The
consensus was based on nine pillars: resilient
growth, financial inclusion, infrastructure, private
investment and job creation, trade, food security,
domestic resource mobilization, human resource
development and knowledge sharing. The last four
appeared at the G20 for the first time.
The introduction of agriculture and food security
into the heart of the G20’s development work
solidified an important trend that had been building
over the past few years at the G8 summit and
elsewhere. It addressed a critical need, given the
declining investment in agricultural research and
hunger reduction over the previous few decades.
The Global Development Agenda after the Great Recession of 2008-2009: Revisiting the Seoul Development Consensus 17
1. KEYNOTE SPEECH

The consensus also repudiated some of the most
contentious, market-oriented development
strategies of the recent past, focusing more on
inclusive growth and strong human capital
development. Seoul also agreed that sometimes, in
certain circumstances, capital controls in
non-advanced countries may be acceptable. This
solidified a major shift in development thinking
towards a country-led approach with greater
policy-making flexibility. The Seoul Summit thus
strongly supported egalitarian, country-specific
development principles through the Action Plan.
The shortcomings of the SeoulDevelopment Consensus
Some criticized the new plan on the grounds that therewas little new, especially as the neoliberal approach ofthe Washington Consensus had already long sincebeen abandoned. Others suggested that the SeoulDevelopment Consensus focused too much onphysical capital rather than on social capital and, in thatsense, did not break enough from the developmentmodels of the past. Moreover, despite efforts byObama and others, the G20 failed to mobilize newfinancial resources for the fulfilment of the SeoulDevelopment Consensus. The Consensus also failedto respond adequately to civil society’s call for greateraccountability in G20 action on development, puttingin place no new mechanisms for follow-up fromprevious years and neglecting to provide greaterrepresentation of low-income countries or of civilsociety itself. The Seoul Development Consensus alsomissed a major opportunity to incorporate sustainabledevelopment and green growth into mainstreamdevelopment policy. Although Korean President LeeMyung-bak was vocal in his promotion of hiscountry’s green growth policies, the communiqué leftgreen growth as a discrete issue area, failing to linklong-term sustainability, food security, climate changeand development.
The impact of the Seoul Summit
Seoul was the most productive and innovativedevelopment G20 summit to date. Deliberation ondevelopment more than doubled. Seoul referred tofewer democratic norms than other summits, but tosignificantly more distributional norms. Decisionmaking more than tripled, due to the SeoulDevelopment Consensus and Action Plan, IFIreform and the reiteration of past summitcommitments. Delivery of the one commitment ondelivering ODA was complied with at a level of 80per cent, a score significantly higher than for allother ODA commitments assessed thus far. Seoulcreated more development-related linkages withoutside organizations than any other summit by far,suggesting that it sought to coordinate an array oforganizations for better policy coherence andcooperation, a major strength of the G20 approach.Seoul was thus the most important G20 summit fordevelopment yet. As emerging economiescontinued to gain economic strength, this focus waslikely to continue.
This high development performance was largelydriven by Korean leadership. Lee was determinedfrom very early on to make his new developmentconsensus the major accomplishment of thesummit. This would contribute to improveddevelopment efforts throughout the G20 and thewider world. Korea was in the unique position ofhaving recently switched from aid recipient to aiddonor. It thus had great ambition to channel itsrecent successes into a new model that captured thestrengths of the Korean approach.
Throughout the G20 more broadly, the desire to acton development was also higher than before. Withthe 2008 financial crisis fading further from memory,but desires to promote strong, stable growth stillstrong, advanced and emerging economies alikecould see the sense of focusing on development.Moreover, the issues of food and commodity pricevolatility were increasingly receiving public attention,as statistics emerged that more and more people wereexperiencing hunger and malnutrition, constituting a
18 The Global Development Agenda after the Great Recession of 2008-2009: Revisiting the Seoul Development Consensus

backslide on the MDG to halve world hunger by2015. Thus, Seoul innovatively produced the SeoulDevelopment Consensus, IMF voice and votereform, financial safety nets, a new agenda onfinancial regulation for developing countries and, inone phrase, a call for the prevention and control ofnon-communicable diseases.
Cannes, November 2011
For the sixth G20 summit, in Cannes on November3-4, 2011, France as host planned to givedevelopment a prominent place. It sought to buildon the Seoul Development Consensus, advancefood security and push for a controversial FinancialTransaction Tax (FTT) to fund development andenvironmental aid commitments.
France had first announced this innovativefinancing mechanism at the Toronto Summit. It wasreceived well by much of civil society butencountered significant resistance from variousG20 members, including Canada and the UnitedStates. At Cannes, the FTT initiative receivedsupport from Germany, empathy from Argentina,Brazil andSouth Africa but opposition fromAustralia, Canada, Japan,the United Kingdom andthe United States. It failed. Other recommendationscontained in Innovation with impact: Financing 21st
century development, the report submitted by Bill Gatesto the G20 at Cannes, had greater appeal.
France’s development plans for Cannes highlightedinfrastructure and food security. On infrastructure,France planned to build on the High-Level Panelfor Infrastructure Investment created at Seoul toidentify projects to bring together financing fromboth the public and the private sectors. It would alsocontinue to involve the MDBs in this initiative.Small advances were made here.
On food security, France focused on securingcommitments for increased agriculture productionand more responsible agricultural investment, inorder to counter both food scarcity and price
volatility. The first ever meeting of G20 agriculturalministers, held in June 2011, provided a firm planfor the leaders to endorse.
On trade, the Cannes Summit implicitly recognizedthat the long-overdue, decade-long DohaDevelopment Agenda would never get done. TheG20 shifted to a short-term goal of opening members’markets up to the poorest countries in the world.
On the Seoul Development Consensus itself, therewere modest advances. They came particularly on thepillars of infrastructure and food security. Cannes’sgreatest potential impact came from the developmentof G20 governance, with the first meeting of G20agricultural ministers and the first meeting of G20development ministers (together with financeministers) being held in September. Cannes alsoidentified the future hosting of the G20 summits,giving its developed and emerging members equalplace. Cannes also continued the tradition, begun atToronto, of inviting two developing countries fromAfrica as part of its five guests. In all, theseinstitutional building blocks were importantadvances, at a summit where the developmentagenda was overshadowed by yet another eruptingfinancial crisis, this one directly affecting thedeveloped G7 imperial power serving as host.
Conclusion
This analysis shows that the G20, at both theministerial and the leaders’ levels, has had anincreasing involvement with, and made innovativeinitiatives in, the development sphere. It hasincreasingly addressed standard developmentissues such as ODA, expanded the developmentlevel with other instruments and issue areas such astrade and, at Seoul in 2010, introduced the newconcept of domestic financial regulation for thepoor. This growing development effort,cumulative but not continuous, is seen across allmajor dimensions of G20 governance:deliberation, direction setting, decision making,
The Global Development Agenda after the Great Recession of 2008-2009: Revisiting the Seoul Development Consensus 19
1. KEYNOTE SPEECH
delivery and the development of globalgovernance both inside and outside the G20.
It is from this last dimension that the G20’s impacton development — still largely invisible outside IFIreform and MDB resource raising — is most likelyto come. At a time of continuing financial crisis andslow growth in developing countries, the worldbadly needs the G20 to make development a keycomponent of its work, and to do so in both old andnew ways. Its contribution will come not bybringing to life very old ideas such as the FTT, butby infusing the development dimension equally intoall of the expanding areas of financial, economic,social and political issues with which it deals.
The 2012 Los Cabos Summit, hosted by Mexico,will be the second G20 summit hosted by a recently
developing country and one that might comewithout a financial crisis to divert attentionelsewhere. With green growth as its focus, and itstwinning with Brazil’s Rio+20 summit scheduledimmediately afterwards, the impact of the G20’sLos Cabos Summit on development could besubstantial. It also provides an opportunity for theG20 to introduce such development innovations asbringing more development-devoted multilateralorganizations to the summit, supporting the UN’sactions on the prevention and control ofnon-communicable diseases, addressing themigration dimension of development (beyondremittances), adding an accountability mechanismto assess the results of the Seoul DevelopmentConsensus and bringing G20 foreign ministerstogether to strengthen the political foundations fordevelopment worldwide.
20 The Global Development Agenda after the Great Recession of 2008-2009: Revisiting the Seoul Development Consensus
APPENDIX A: G20 SUMMIT CONCLUSIONS ON DEVELOPMENT
# words % totalwords
# para % totalpara
# ofdocs
% totaldocs
# deddocs
#commits
% totalcommits
Avgcompl
Washington 651 17.8 9 12.6 1 100 0 12 12.6 n/aa
London 1,726 27.6 28 30.4 3 100 1 13 14.7 +0.15(2)
Pittsburgh 2,292 24.5 20 18.3 1 100 0 22 17.2 -0.05 (3)
Toronto 3,899 34.5 61 42.3 2 100 1 12 19.7 +0.53(2)
Seoul 9,195 58.1 105 47.9 5 100 2 39 25 +0.60(1)
Average 3,553 32.5 44.6 30.3 2.4 100 0.8 20 18.2 +0.31b
Notes: # words: Number of development-related words in communiqué (see below for list of inclusions and exclusions).% total words: Number of development-related words as a percentageof total words in communiqué.# para: Number of development-related paragraphs in communiqué.% total para: Number of development-related paragraphs as a percentage of total paragraphs in communiqué.# of docs: Number of official documents released at summit that contain development-related conclusions.% of total docs: Percentage of all documents that have development-related conclusions.# ded docs: Number of official summit documents that are exclusively devoted to development.# commits: Number of development-related commitments in communiqué.% total commits: Number of development-related commitments as a percentage of total commitments in communiqué.Avgcompl: Average compliance score for development-related commitments, based on those selected for complianceassessment. Number of commitments included is indicated in brackets.aNo available compliance data on development from the Washington Summit.bExcludes the Washington Summit.

The Global Development Agenda after the Great Recession of 2008-2009: Revisiting the Seoul Development Consensus 21
1. KEYNOTE SPEECH
APPENDIX B: G20 DEVELOPMENT DIRECTION SETTINGDemocratic norms affirmed
Value 2008Washington
2009London
2009Pittsburgh
2010Toronto
2010Seoul
Average
Transparency
International mobility of ideas 1 0.2
Access to ideas in all countries
Good governance
Accountable internationalinstitutions
2 2 3 2 1.8
Surveillance/monitoring
Rule of law
Supporting NEPAD
Information/knowledge exchange
Accountability
Creditors’ rights
Openness
Multi-stakeholder consultation
Total 2 2 3 2 1 2
Type spread
NEPAD = New Partnership for Africa’s Development.
Distributional norms affirmed
Value 2008Washington
2009London
2009Pittsburgh
2010Toronto
2010Seoul
Average
Growth benefiting all 2 2 3 1.4
Attacking income inequalities
Reduce/fight poverty 2 1 9 2.4
Needs of low-income countries 1 0.2
World’s poorest and mostvulnerable
1 1 1 3 1.2
Equity and well-being for allpeoples
Sound domestic social policies

22 The Global Development Agenda after the Great Recession of 2008-2009: Revisiting the Seoul Development Consensus
APPENDIX C: G20 DEVELOPMENT DIRECTION SETTING
WorldBank
IMF WTO OECD ILO MDBs/RDBs
UN/UNbodies
FAO Summittotal
Creationof newbodies
Washington 0 0
London 2 1 3 0
Pittsburgh 5 1 6 2
Toronto 1 1 2 1
Seoul 10 3 4 5 3 6 14 3 48 2
Average 3.2 1 0.8 1 0.6 1.6 3 0.6 11.8 1
Notes:FAO = Food and Agriculture Organization;ILO = International Labour Organization;IMF = International Monetary Fund;MDBs = multilateral development banks;OECD = Organisation for Economic Co-operation and Development;RDBs = regional development banks;WTO = World Trade Organization.
Value 2008Washington
2009London
2009Pittsburgh
2010Toronto
2010Seoul
Average
Socially effective response to crisis 2 1 1 0.8
Millennium Development Goals 2 2 0.8
Equitable global economy
Fairness
Broadly shared 2 2 0.8
Reducing development gaps 9 2 2 2.6
Country-led solutions 1 2 4 1.4
Total 2 5 17 11 24 11.8
Type spread 2 2 6 7 7 4.8

2. SESSION 1
Revisiting the SeoulDevelopment Consensus

24 The Global Development Agenda after the Great Recession of 2008-2009: Revisiting the Seoul Development Consensus
Revisiting the Seoul DevelopmentConsensus: Rationale, Current Statusand Future Prospects
Jai-Joon Hur, Senior Research Fellow, Korea Labour Institute
Introduction
Due to the efforts of the international community,there has been an overall improvement in theachievement of the MDGs (MillenniumDevelopment Goals). However, theimplementation rate has not been fast enough forthese goals to be realistically achieved by the year2015. In addition, the outcome discrepancy hasvaried depending on the goal, the region, and thecountry. In Asia, especially due to China's andIndia's rapid economic growth, some success hasbeen accomplished, but in the sub-Saharan Africanregion indicators point to little if any progresstowards the achievement of the MDGs. In somecases, the situation has even worsened.Furthermore, since 2008 the food, energy andfinancial crises have served as obstacles toprogress. According to the World Bank and othersources, the prospects of achieving the MDGs by2015seem poor.
The core agenda of the G20 Summit in Pittsburgh,held from 24 to 25 September 2009, was aimed atovercoming the financial crisis. At that time, it wasexpected that this would also be the main issuediscussed at the G20 Summit in Toronto.However, since the financial crisis was thought tohave passed by the time of the G20 Seoul Summit,the chances were growing with the globaleconomic recovery that the Seoul Summit wouldadopt new agendas for shared prosperity in the
future. The G20 Seoul Summit had to providemomentum for the G20 to consolidate its status asthe premier forum for international economiccooperation.
Under these circumstances, supporting theeconomic growth of the developing countriesthrough capacity building was an issue of growingimportance that the G20 would find it necessary toelaborate on. The G20 countries, which hadprimarily discussed macro-economic policycoordination and global finance problems untilthen, came to discuss the global economicdevelopment agenda in a systematic manner fromthe time of the Seoul Summit. Afterwards, the G20began to hold discussions between both memberand non-member countries, which helped toenhance further the legitimacy and effectiveness ofthe G20 itself.
This paper aims to present the rationale, currentstatus and future prospects of the SeoulDevelopment Consensus. Following theintroductory Section I, Section II examinesdiscussions of development agendas before theSeoul Development Consensus was reached inNovember 2010. Section III reviews how theSeoul Development Consensus was shaped.Section IV summarizes the contents of the SeoulDevelopment Consensus which is nowwell-known. Section V discusses elements ofevaluation and future prospects.

Discussion of developmentagendas before the SeoulDevelopment Consensus
Millennium Development Goals
Before the Seoul Development Consensus wasreached within the G20, the development agendawas dealt with in three main forums: developmentaid had been discussed at the G8 Summit, socialdevelopment initiatives such as health educationhad been investigated at the United Nations, and aideffectiveness had been discussed in the OECD,mainly by European donor countries.
Development efforts in the internationalcommunity aimed at reducing the development gapand poverty have been focused on the MDGs. In2000, world leaders gathered at the United NationsMillennium Summit and agreed to work towards theachievement of eight Millennium DevelopmentGoals known as MDGs to promote socialdevelopment by 2015. The eight goals focused onreducing extreme poverty by up to 50 per cent,achieving universal primary education, reducingchild mortality, etc (TABLE 1). In order to achievethe MDGs by the deadline, and with the G7 takingon the main responsibility for implementing thegoals, the donor countries made an effort to expandthe scale of Official Development Assistance(ODA).
Development agenda in the G8
Even before the G20 emerged as the premier forumfor international economic cooperation, thedevelopment agenda was a core subject discussed atthe G8 Summit. In particular, the G7 helddiscussions on ways to support the MDGs agendaand increase ODA funds. In the 2005 G8 Summitheld at Gleneagles, the G7 countries pledged toincrease ODA funds to 0.7 per cent of GDP by2010. In 2009, the G8 Summit agreed to raise $20
billion within three years to improve foodproductivity in developing countries.
However, discussions within the G8 tended to bemore concerned about the scale of funds thanconcentrated on the means by which to promotethe development agenda. This exposed donorcountries to the continuing criticism fromdeveloping countries and development NGOs thatthe donor countries had not kept their promise toraise funds for the development agenda. On theother hand, the donor countries started toinvestigate ways of enhancing aid effectiveness.
Development agenda in the G20 beforethe Seoul Summit
Meanwhile, the G20, which was destined by birth tocope with the global financial crisis, wasconcentrating inevitably on the financial issue ratherthan discussing the development agenda. The G20had discussed how to secure financial sources ofMultilateral Development Banks (MDBs), theestablishment of the Global Agriculture and FoodSecurity Programme (GAFSP) and the problem offinancial inclusion.
When the financial turmoil calmed down and theglobal economy showed more or less stability,there was a realization within the G20 of the needto discuss the means by which to support thedeveloping countries that had been mostnegatively impacted in the economic crisis.According to the World Food Programme (WFP),one-sixth of the world's population, or about onebillion people, faced hunger in 2009. The WorldBank estimated that an additional 64 millionpeople would be living in extreme poverty by theend of 2010. This increase has been attributed tothe after-effects of the 2008 food crisis as well as tothe financial crisis, which made the situation worseand had a negative impact on the purchasingpower of low-income workers in developingcountries.
The Global Development Agenda after the Great Recession of 2008-2009: Revisiting the Seoul Development Consensus 25
2. SESSION 1 – REVISITING THE SEOUL DEVELOPMENT CONSENSUS

To meet these challenges and deal with relatedissues, the Pittsburgh Summit Document stated thereason for and the importance of reducing the
development gap and emphasized the mission ofMDBs. The importance of development wasre-stated in the Framework, which summarizes the
26 The Global Development Agenda after the Great Recession of 2008-2009: Revisiting the Seoul Development Consensus
TABLE 1. EIGHT MILLENNIUM DEVELOPMENT GOALS AND KEY INDICATORS
Goals Key indicators
End poverty and hunger • Halve, between 1990 and 2015, the proportion of people whoseincome is less than $1 a day
• Achieve full and productive employment and decent work for all,including women and young people
• Halve, between 1990 and 2015, the proportion of people who sufferfrom hunger
Achieve universal primaryeducation
• Ensure that children everywhere will be able to complete a full courseof primary schooling
Promote gender equality • Eliminate gender disparity in primary and secondary education,preferably by 2005, and in all levels of education no later than 2015
Reduce child mortality • Reduce by two thirds, between 1990 and 2015, the under-fivemortality rate
Improve maternal health • Reduce by three quarters the maternal mortality ratio
• Achieve universal access to reproductive health
Combat HIV/AIDS and otherdiseases
• Have halted by 2015 and begun to reverse the spread of HIV/AIDS
• Achieve, by 2010, universal access to treatment for HIV/AIDS for allthose who need it
• Have halted by 2015 and begun to reverse the incidence of malariaand other major diseases
Ensure environmentalsustainability
• Integrate the principles of sustainable development into countrypolicies and programs and reverse the loss of environmental resources
• Reduce biodiversity loss, achieving, by 2010, a significant reduction inthe rate of loss
• Halve, by 2015, the proportion of the population without sustainableaccess to safe drinking water and basic sanitation
• By 2020, have achieved a significant improvement in the lives of atleast 100 million slum dwellers
Develop a global partnership fordevelopment
• Develop further an open, rule-based, predictable, non-discriminatorytrading and financial system
• Address the special needs of least developed countries
• Address the special needs of landlocked developing countries andsmall island developing States
• Deal comprehensively with the debt problems of developing countries
• In cooperation with pharmaceutical companies, provide access toaffordable essential drugs in developing countries
• In cooperation with the private sector, make available the benefits ofnew technologies, especially information and communications
Source: http://www.un.org/millenniumgoals/bkgd.shtml

policy coordination of member countries to achieverebalancing in the world economy.
Meanwhile, when the recession in those countriesthat had been leading the world economy seemed tobe protracted over a long period of time, increasingspotlight was directed to how to find “new driversof aggregate demand and more enduring sources ofglobal growth.” In particular, there were growingvoices that the world economy could achieverebalancing through the development not only ofthose emerging countries such as China, Brazil andIndonesia which had been showing high growthrates but also of other developing countries.
Shaping of the SeoulDevelopment Consensus
Korea's initiative to make thedevelopment issue an item on the G20agendas
In the January 2010 World Economic Forum held inDavos, President Lee Myung-bak expressed the ideaof including the issue of development in the G20Summit agenda. In his speech, he emphasized that,by removing macro-economic imbalances and thedevelopment gap, all members of the internationalcommunity should share in the benefits of prosperityto achieve sustainable growth of the world economy.In other words, the development agenda was not aseparate agenda but was in line with the goals of theG20, namely, the Framework for Strong andSustainable Economic Growth. This opened thedoor and built the base for the development agendato be discussed at the G20 Summit.
In addition, President Lee Myung-bak said thatKorea, which has risen from developing countrystatus to a member of OECD, would assist inbridging the gap between developing, emerging anddeveloped countries with its developmentexperience. He emphasized that adding a
development agenda to support growth throughcapacity building of developing countries in one ofthe FIGURE 1. Korea’s three-step approach beforereaching the Seoul Development ConsensusG20agendas would not only help developing countriesbut also enhance the legitimacy of the G20.
The Korean Government started to give shape tothe ideas presented at the Davos Forum. Theoutput had (i) to fit within the framework of theG20 goals (Framework for Strong, Sustainable andBalanced Growth), (ii) to contribute effectively toreducing the development gap and achievingdevelopment goals such as the MDGs, and (iii) todifferentiate yet complement existing developmentefforts, avoiding duplication.
The Korean Government set an interim goal untilthe G20 Seoul Summit (FIGURE 1), which includedwithin the agenda of the G20 Toronto Summitsome agenda items related to Korea’s initiative, forexample organizing a development working group.In the process of preparing for the G20 SeoulSummit following the G20 Summit in Toronto, theKorean Government sought to obtain the consentof member countries on what the practicaloutcomes of the G20 agenda would be. Throughthis external discussion with other membercountries, a development agenda started to bearticulated.
Naturally, there were concerns about the G20dealing with development issues because the G8,UN, OECD and other international organizationshad been elaborating on development agendas andcontributing in their own areas. Being acutely awareof this fact, the Korean Government carefullysuggested that the G20 should avoid overlappingwith development efforts elaborated in otherorganizations and focus on economic growthamong all other development agendas. In addition,the Korean Government paid attention to the factthat the MDGs deadline of 2015 was approachingand the achievement of MDGs was emerging as anurgent issue. In setting development agendas, theKorean approach was that the G20’s development
The Global Development Agenda after the Great Recession of 2008-2009: Revisiting the Seoul Development Consensus 27
2. SESSION 1 – REVISITING THE SEOUL DEVELOPMENT CONSENSUS

agenda could contribute effectively to theachievement of MDGs as well as obtain overallsupport from the international community.
Agenda mining and the process ofmaking development agenda one of theG20 agendas
The direction of the development agenda wasdecided in early 2010, but its contents were notspecified and were waiting for additionaldiscussion. Because the areas and items in thedevelopment agenda were very extensive, it wasnecessary for the Korean Government to take intoconsideration the possibility that visible outcomescould not be achieved and that the G20 would losesome credibility if an excessive commitment on theprovision of financial resources was made. In fact,the aftermath of the economic crisis had created anatmosphere which made it difficult to broachfinancial issues.
Initially, therefore, the Korean Governmentdecided to adopt a two-track approach. The basicconcept of Track 1 was for the G20 to propose aproper development paradigm as a part of theFramework mandate. On the other hand, Track 2was aimed at choosing specialized areas among awiderange of development agendas to be dealt withby the G20 and presenting specific projects. Thefinal goal was to link Tracks 1 and 2. However,taken into account the variable consensus amongmember countries, a minimum goal was set(FIGURE 2). Meanwhile, the Summit PreparatoryCommittee held numerous advisory councilmeetings with national and international experts toidentify the specific agenda for development.During this process, each expert presented the mostnecessary development projects for developingcountries. For example, duty-free and quota-freegoods from Low-Income Countries (LICs) supportfor the African agricultural revolution, the sharingof development experiences such as Korea’s NewVillage Movement and energy network projects in
28 The Global Development Agenda after the Great Recession of 2008-2009: Revisiting the Seoul Development Consensus
FIGURE 1. KOREA’S THREE-STEP APPROACH BEFORE REACHING THE SEOUL DEVELOPMENTCONSENSUS

Africa were proposed. Many constructivesuggestions were put forward, but each needed tobe reviewed in various dimensions, such as theirrealistic feasibility, in consultation with eachmember country and taking into considerationresource issues. It was agreed that these matterswould be carefully discussed after the G20 Summitin Toronto.
In addition, three approaches were adopted to formand promote a consensus at the initiative of Koreaand the G20 regarding the developmentagenda. First, the importance of the G20development agenda was highlighted and thedirection of policy was reviewed at the SeoulDevelopment Conference (June and October).Second, active consultation was conducted on thedirection of the G20 development agenda withmember countries such as the United Kingdom, theUnited States and China via closer bilateral channelswith those countries. Third, in order to obtainextensive support from non-G20 countries aboutthe development agenda in the G20 Seoul Summit,the Korean Government made efforts via outreach
activities with regional organizations such as theAfrican Union (AU).
Since January 2010, the development agendaproposed by Korea has received positive feedbackin several Sherpa meetings. Not surprisingly, therewere countries that were reluctant to adopt thedevelopment agenda. This passive feedbackemerged from concerns about the possibility thatthe discussion about the development agendawould result in aid issues, while many countries weregoing through financial difficulties due to theeconomic crisis.
Korea addressed these concerns by maintaining thatthe proposal for the development agenda wasdifferent from the existing discussions on aid. It wasemphasized that it was reasonable to find newdriving engines of aggregate demand and globalgrowth from an increase in the consumption of themiddle-income class in emerging countries andinvestment inunderdeveloped countries because theEuropean Union and the United States, whichhadled the world economy, were suffering from a
The Global Development Agenda after the Great Recession of 2008-2009: Revisiting the Seoul Development Consensus 29
2. SESSION 1 – REVISITING THE SEOUL DEVELOPMENT CONSENSUS
FIGURE 2. THE TWO-TRACK APPROACH TO SHAPING THE DEVELOPMENT AGENDA AT THE SEOULSUMMIT
Source: Ministry of Foreign Affairs and Trade (2011)

recession and it was expected to take a considerableamount of time before they would be able to play are-boosting role.
Before the Sherpa meeting in May 2010, Koreacirculated an issue paper to G20 membercountries. The main idea therein was that thedevelopment agenda was essential for theachievement of enduring growth and arebalancing of the global economy beyond thediscussion on aid to reduce poverty in LICs(BOX 1). Korea outlined the direction of thedevelopment agenda for the G20 Summit inSeoul in this paper, taking into consideration whataspect was supplementary to the existingdevelopment agenda, how it would speed up theachievement of the MDGs, and what itsrelationship was to the G20 Framework.
The paper proposed the establishment of adevelopment working group for further discussionof the development agenda. Since most of the targetcountries were non-members, the paper alsosuggested that the RDBs be invited to participate ina development working group so that their voicescould be heard.
The member countries agreed to these suggestions.The development agenda was regarded as essentialfor achieving the policy goals of the G20, whichwere aimed at the sustained and balanced growthof the world economy, through the discovery ofnew drivers of consumption and the creation ofinvestment opportunities in developing countries.As a result, in the Sherpa meeting in May 2010, theG20 member countries agreed to discuss thedevelopment agenda intensively at the G20 SeoulSummit and to organize a development workinggroup before the Summit.
Adoption of the idea of a multi-yearaction plan and activity of theDevelopment Working Group
Korea suggested its plan to the Sherpa meeting heldprior to the G20 Toronto Summit. The followingagreement was reached:
i. to focus on sustainable economic growththrough capacity building in developingcountries
30 The Global Development Agenda after the Great Recession of 2008-2009: Revisiting the Seoul Development Consensus
• Promoting the development agenda in the G20, which focuses on the economic growth of developingcountries
• An emphasis on minimizing overlap with existing agendas such as raising funds for development (G8),enhancing the effectiveness of aid (OECD) and promoting social development (United Nations).
• Need to work within the goals of the G20 Framework: strong, sustainable, and balanced growth.
• Identifying obstacles to economic growth in developing countries and implementing feasible policies ineach area to raise their growth potential
• Extending capacity was linked directly to several key areas of growth, (infrastructure, human resourcedevelopment, investment, trade, etc.)
• Organizinga development working group to promote the practical outcomes of development in theagenda of the G20 Summit in Seoul
• International organizationssuch as the World Bank and the United Nations participate as a technicalsupport group (TSG) to strengthen expertise in discussing the development agenda.
• Request participation of Regional Development Banks in the TSG to widen representation
Source: Ministry of Foreign Affairs and Trade (2011)
BOX 1. KOREA’S G20 DEVELOPMENT ISSUE PAPER
ii. to organize a development working groupwhose main mission would be to choose aMulti-Year Action Plan to provide visibleoutcomes at the Seoul Summit and to followupthe outcomes of the Seoul Summit and thedevelopment agenda
The idea of a Multi-Year Action Plan, whichconstituted progress compared to the suggestions inthe issue paper circulated in May, stemmed from theagreement on financial regulations in the G20Summit in Washington. Under the Multi-YearAction Plan, implementation plans were listedaccording to short and long-term goals. The idea ofthe Multi-Year Action Plan was thought to beappropriate for discussion of the developmentagenda, which usually covers a wide scope of issueswith medium- and long-term goals.
Development working group meetings were held inSeoul twice. The outcomes were to identify thefollowing nine “key pillars” asthe main areas of thedevelopment agenda to be promoted:
� infrastructure
� private investment and job creation
� human resource development
� trade
� financial inclusion
� growth with resilience
� food security
� domestic resource mobilization
� knowledge sharing
To promote a Multi-Year Action Plan, membercountries and international organizations wereasked to submit proposals. Proposals frominternational organizations were referred to themember countries. The number of action planproposals was over one hundred. Thedevelopment Framework and Multi-Year ActionPlan were drafted at the second meeting of thedevelopment working group held in Seoul fromSeptember 30 to October 1, immediately beforethe G20 Seoul Summit.
Content of the SeoulDevelopment Consensus
Outcome documents on thedevelopment agenda of the G20Summit in Seoul
The outcome documents of the G20 Seoul Summitconsist of four components: the Seoul SummitLeaders’ Declaration, the Seoul Summit Document,the Seoul Development Consensus on SharedGrowth and the Multi-Year Action Plan onDevelopment (FIGURE 3). The Seoul SummitLeaders’ Declaration includes the substance of thedevelopment agenda and the Seoul SummitDocument incorporates the consensus reached.
Under the title “Seoul Development Consensus forShared Growth”, the development frameworkspecifies (i) the reasons behind processing thedevelopment agenda, and (ii) the six developmentprinciples and nine key pillars identified, whereaction and reform are most critical to ensureinclusive and sustainable economic growth withresilience in developing countries. The Multi-YearAction Plan on Development sets out the concreteactions and outcomes to be delivered and developedover the medium term.
The Seoul Development Consensus onShared Growth
The Seoul Summit agreed on the Seoul DevelopmentConsensus on Shared Growth, which emphasizes theenhanced role of developing countries as thepotential drivers of enduring sources of globalgrowth. The SDC on Shared Growth integrates thedirection of the G20 development agenda and sixdevelopment principles (BOX 2). It is considered tohave provided the framework of the developmentagenda for G20 summits.
In the process of Korea's economic development,economic growth worked as a sustainable remedy to
The Global Development Agenda after the Great Recession of 2008-2009: Revisiting the Seoul Development Consensus 31
2. SESSION 1 – REVISITING THE SEOUL DEVELOPMENT CONSENSUS
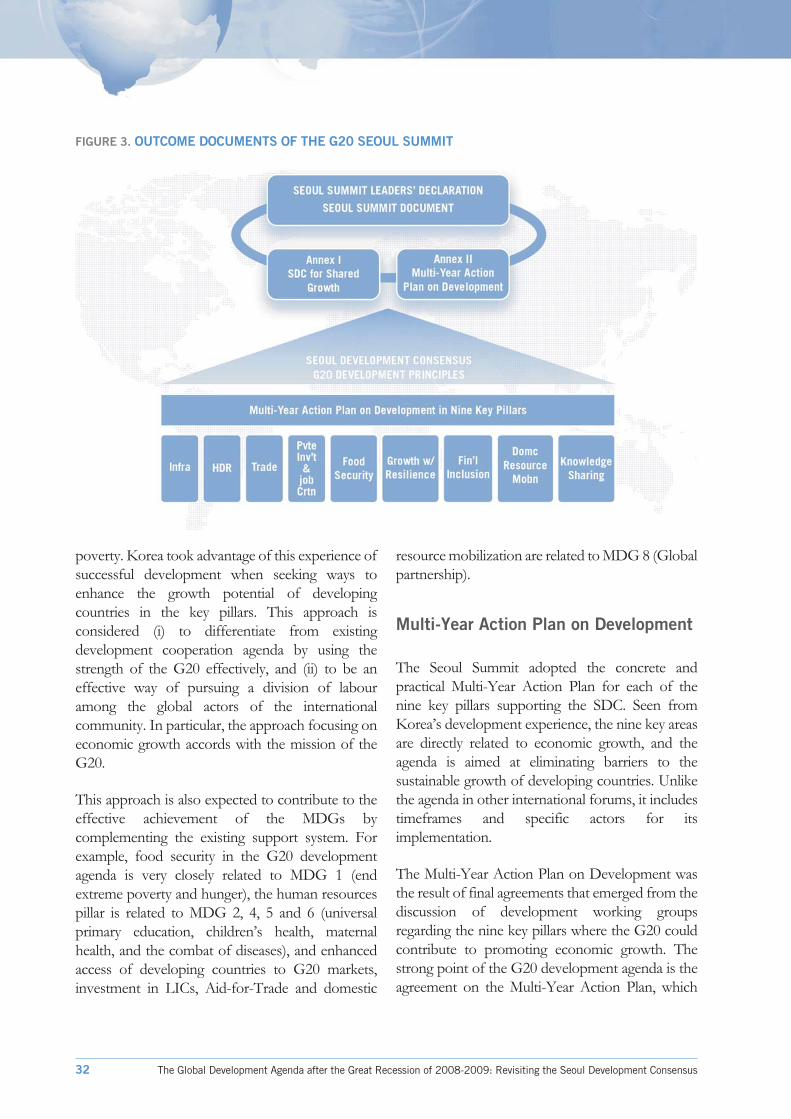
poverty. Korea took advantage of this experience ofsuccessful development when seeking ways toenhance the growth potential of developingcountries in the key pillars. This approach isconsidered (i) to differentiate from existingdevelopment cooperation agenda by using thestrength of the G20 effectively, and (ii) to be aneffective way of pursuing a division of labouramong the global actors of the internationalcommunity. In particular, the approach focusing oneconomic growth accords with the mission of theG20.
This approach is also expected to contribute to theeffective achievement of the MDGs bycomplementing the existing support system. Forexample, food security in the G20 developmentagenda is very closely related to MDG 1 (endextreme poverty and hunger), the human resourcespillar is related to MDG 2, 4, 5 and 6 (universalprimary education, children’s health, maternalhealth, and the combat of diseases), and enhancedaccess of developing countries to G20 markets,investment in LICs, Aid-for-Trade and domestic
resource mobilization are related to MDG 8 (Globalpartnership).
Multi-Year Action Plan on Development
The Seoul Summit adopted the concrete andpractical Multi-Year Action Plan for each of thenine key pillars supporting the SDC. Seen fromKorea’s development experience, the nine key areasare directly related to economic growth, and theagenda is aimed at eliminating barriers to thesustainable growth of developing countries. Unlikethe agenda in other international forums, it includestimeframes and specific actors for itsimplementation.
The Multi-Year Action Plan on Development wasthe result of final agreements that emerged from thediscussion of development working groupsregarding the nine key pillars where the G20 couldcontribute to promoting economic growth. Thestrong point of the G20 development agenda is theagreement on the Multi-Year Action Plan, which
32 The Global Development Agenda after the Great Recession of 2008-2009: Revisiting the Seoul Development Consensus
FIGURE 3. OUTCOME DOCUMENTS OF THE G20 SEOUL SUMMIT
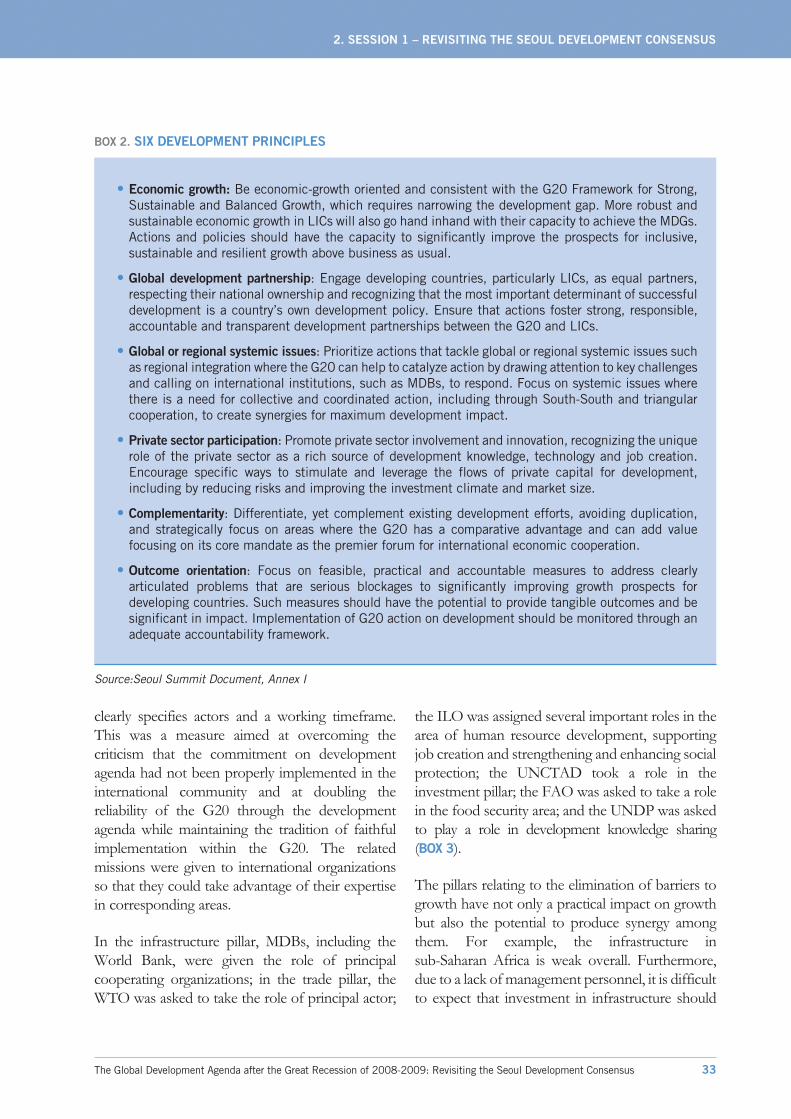
clearly specifies actors and a working timeframe.This was a measure aimed at overcoming thecriticism that the commitment on developmentagenda had not been properly implemented in theinternational community and at doubling thereliability of the G20 through the developmentagenda while maintaining the tradition of faithfulimplementation within the G20. The relatedmissions were given to international organizationsso that they could take advantage of their expertisein corresponding areas.
In the infrastructure pillar, MDBs, including theWorld Bank, were given the role of principalcooperating organizations; in the trade pillar, theWTO was asked to take the role of principal actor;
the ILO was assigned several important roles in thearea of human resource development, supportingjob creation and strengthening and enhancing socialprotection; the UNCTAD took a role in theinvestment pillar; the FAO was asked to take a rolein the food security area; and the UNDP was askedto play a role in development knowledge sharing(BOX 3).
The pillars relating to the elimination of barriers togrowth have not only a practical impact on growthbut also the potential to produce synergy amongthem. For example, the infrastructure insub-Saharan Africa is weak overall. Furthermore,due to a lack of management personnel, it is difficultto expect that investment in infrastructure should
The Global Development Agenda after the Great Recession of 2008-2009: Revisiting the Seoul Development Consensus 33
2. SESSION 1 – REVISITING THE SEOUL DEVELOPMENT CONSENSUS
• Economic growth: Be economic-growth oriented and consistent with the G20 Framework for Strong,Sustainable and Balanced Growth, which requires narrowing the development gap. More robust andsustainable economic growth in LICs will also go hand inhand with their capacity to achieve the MDGs.Actions and policies should have the capacity to significantly improve the prospects for inclusive,sustainable and resilient growth above business as usual.
• Global development partnership: Engage developing countries, particularly LICs, as equal partners,respecting their national ownership and recognizing that the most important determinant of successfuldevelopment is a country’s own development policy. Ensure that actions foster strong, responsible,accountable and transparent development partnerships between the G20 and LICs.
• Global or regional systemic issues: Prioritize actions that tackle global or regional systemic issues suchas regional integration where the G20 can help to catalyze action by drawing attention to key challengesand calling on international institutions, such as MDBs, to respond. Focus on systemic issues wherethere is a need for collective and coordinated action, including through South-South and triangularcooperation, to create synergies for maximum development impact.
• Private sector participation: Promote private sector involvement and innovation, recognizing the uniquerole of the private sector as a rich source of development knowledge, technology and job creation.Encourage specific ways to stimulate and leverage the flows of private capital for development,including by reducing risks and improving the investment climate and market size.
• Complementarity: Differentiate, yet complement existing development efforts, avoiding duplication,and strategically focus on areas where the G20 has a comparative advantage and can add valuefocusing on its core mandate as the premier forum for international economic cooperation.
• Outcome orientation: Focus on feasible, practical and accountable measures to address clearlyarticulated problems that are serious blockages to significantly improving growth prospects fordeveloping countries. Such measures should have the potential to provide tangible outcomes and besignificant in impact. Implementation of G20 action on development should be monitored through anadequate accountability framework.
Source:Seoul Summit Document, Annex I
BOX 2. SIX DEVELOPMENT PRINCIPLES

make an effective contribution to sustainablegrowth. Therefore, investment in infrastructure andhuman resource development should be madesimultaneously for the region to achieve sustainablegrowth effectively. The G20 development agendaprovides a systematic framework that is useful indealing with these types of issues through theMulti-Year Action Plan.
Elements of valuation
There has been an increasing trend in the G20towardsits involvement in development issues.However, the extent of this involvement has notbeen as dramatic as that made as a result of the 2010Seoul Summit. The SDC signifies remarkable
progress in the history of the G20’s involvement indevelopment, nourished by Korea’s developmentexperience and its role as a bridge between thedeveloped and emerging countries as well asprevious G20 discussions. This moved the G20agenda from a short-term response to a pendingcrisis to the issue of long-term sustainable growth bybuilding the capacity of developing countries, whichcan be new driving engines of global aggregatedemand. It is the first consensus within the G20 toarticulate a development agenda within itsframework, recognizing LICs as partners andpotential engines of growth, and is expected to be asa turning point in the dominant discourse ofinternational development agendas which havebeen centred on MDGs.
34 The Global Development Agenda after the Great Recession of 2008-2009: Revisiting the Seoul Development Consensus
• Infrastructure: develop comprehensive infrastructure action plans (WB and RDBs; June-November 2011)and establish a G20 High-Level Panel for infrastructure investment (G20; November 2011)
• HRD: create internally comparable skills indicators (WB, ILO, OECD and UNESCO; June 2012) andenhance national employable skills strategies (MDBs, ILO, OECD and UNESCO; 2012)
• Trade: enhance trade capacity and access to markets (G20; 2011 and beyond; February, June,July 2011)
• Private investment and job creation: support responsible value-adding private investment and jobcreation (G20, UNCTAD, UNDP, ILO, ILP, OECD and MDBs; June, November 2011; Summer, June2012)
• Food security: enhance policy coherence and coordination, mitigate risk of price volatility and enhanceprotection for the most vulnerable (G20, FAO, IFAD, WFP, WTO, UNCTAD, CFS, OECD, IMF and WB;March, June 2011; Medium-term)
• Growth with resilience: support developing countries to strengthen and enhance social protectionprogrammes and facilitate the flow of international remittances (UNDP, MDBs, Global RemittanceWorking Group; June, November 2011)
• Financial inclusion: establish global partnership for financial inclusion; SME finance challenge andfinance framework for financial inclusion; implement the action plan for financial inclusion (G20;November 2011)
• Domestic resource mobilization: support development of more effective tax systems and support workto prevent erosion of domestic tax revenues (OECD, UN, IMF, WB, Inter-American Center for TaxAdministration, African Tax Administration and Global Forum; June 2011; Medium-term)
• Knowledge sharing: enhance effectiveness and reach of knowledge sharing (TT-SSC, UNDP, June 2011)
Source: Seoul Summit Document, Annex II.Note: The actors and timeframe are in parenthesis.
BOX 3. MULTI-YEAR ACTION PLAN ON DEVELOPMENT

The SDC differentiated itself from existingdevelopment agendas by focusing on the achievementof economic growth by building the capacity of LICsthrough a strengthening of their growth potential andnurturing their ability to help themselves. It alsoemphasized the importance of a country-specificapproach that took into consideration developingcountries’ own conditions and circumstances inaddressing development strategies (a “one-size-does-not-fit-all” approach). Human resourcedevelopment and knowledge sharing are of specialimportance in the nine key pillars.
The SDC suggested an implementation mechanismas well as a new direction and principle for reducingthe development gap. It will follow up on the ninekey pillars by specifying the actors and timeframe soas to identify bottlenecks and draw up solutions. Inaddition, it pursued close cooperation withinternational development organizations to establishpartnerships between emerging donors (Brazil,China, and India) and the OECD’s DAC countriesas well as implement action plans. It differentiatedyet complemented existing development effortssuch as those made by the United Nations (socialdevelopment), the G8 (financial resource fordevelopment) and the OECD (aid effectiveness).
Insofar as the initial goals of development agendaare aimed at achieving a global rebalancing andMDGs, the implementation of the Multi-YearAction Plan in nine key areas will have a positiveimpact on the world economy. The sustainableeconomic growth of developing countries willcontribute to boosting aggregate demand via anincrease in consumption and investment. In thissense, the G20 development agenda focuses onmacroscopic, long-term goals such as building thecapacity of developing countries rather than ondiscussion about aid to cope urgentlywith extremepoverty. Therefore, its effects will be moresustainable and comprehensive and eventuallycontribute to the rebalancing of the world economyin the medium and long term.
Current status and futureprospects
The G20’s involvement in development issueschanged dramatically in the 2010 Seoul Summit.Judging from the process which gave shape to theSDC since the preparation of the G20 TorontoSummit, it is certain that the SDC has been a widelyaccepted consensus. In effect, when Koreaconceived the goal in two tracks, it was not evidentthat the G20 consensus would adopt the final goalof linking Track 1 and Track 2. However, the SDCadopted not only a development paradigm as part ofthe G20 Framework mandate but also specificprojects to accomplish the proposed paradigm.Some visible results were achieved directly duringthe consensus building: duty-free and quota-freemarket access for LDC (least developed country)products, Aid for Trade, etc.
There is other evidence that the SDC differentiatedfrom traditional development paradigm andreceived wide support. When the SDC emphasizedendured growth through capacity building anddenied a “one-size-fits-all” approach and thenecessity of considering each developing countries’own condition and circumstances, leaders ofdeveloping countries let out rousing cheers, to theextent that it was common for African leaders tostate “the Seoul Consensus is an AfricanConsensus” during the G20 Summit in Seoul.
There remains another important questionregarding the SDC. Is the SDC a sufficient andviable framework for the world economy? Somefind shortfalls in the SDC and criticize it for thefollowing reasons: (i) too much emphasis is put oninfrastructure and private-sector-led growth in theSDC, with little attention to social development; (ii)little attention is paid to procuring financialresources to accomplish the SDC; and (iii) the SDCfailed to incorporate green growth into thedevelopment agenda.
The Global Development Agenda after the Great Recession of 2008-2009: Revisiting the Seoul Development Consensus 35
2. SESSION 1 – REVISITING THE SEOUL DEVELOPMENT CONSENSUS

In the 2000s, the development agenda in theinternational community aimed at reducing thedevelopment gap and poverty has focused on theMDGs, which emphasizes social development. TheSDC paradigm was influenced by the developmentexperience of Korea. In the process of Korea'seconomic development, economic growth workedas a sustainable remedy to poverty. Korea tookadvantage of this experience in identifying thenine key pillars. The SDC had the missionof differentiating yet complementing existingdevelopment efforts while avoiding duplication.Therefore, to be complementary with the MDGs,which have from time to time been said to be biasedtowards human development without appropriateattention being paid to trade and infrastructure, itwas natural not to emphasize social developmentagain.
When the development agenda proposed by Koreareceived positive feedback in several Sherpameetings, there were other minority opinions whichcaused hesitation in adopting the developmentagenda. This hesitation emerged from concerns thatthe discussion about the development agendawould mainly result in the issue of aid or the amountof financial resources, while many countries weregoing through financial difficulties due to theeconomic crisis. Korea addressed these concerns bydefining the proposal for the development agendadifferently from the existing discussions on aid,while emphasizing that it was necessary to find newdriving engines of aggregate demand and globalgrowth to achieve global rebalancing because theEuropean Union and the United States weresuffering from a recession.
It is an established consensus among the G20countries that new sources of funding need to befound to address their development needs.Therefore, it is an area where efforts should bemade in the coming G20 summits. For this reason,the leaders in the G20 Summit in Cannes inNovember 2011 discussed a set of options for
innovative financing, such as Advance MarketCommitments, Diaspora Bonds, a taxation regimefor bunker fuels, tobacco taxes and a range ofdifferent financial taxes, including a financialtransaction tax. Some member countries haveimplemented or are prepared to explore some ofthese options.
When the world economy was going throughinstability because of the global financial shock in2008 and 2009, many leaders including PresidentLee Myung-bak and US President Barack Obamaproposed the promotion of green growth policies asan effective policy direction to overcome the crisis.However, on the whole, whether green growthpolicies have to be explicitly incorporated in thedevelopment agenda for developing countries forthe time remain controversial. If a consensus can bebuilt on green growth and incorporated into theG20 development agenda in one of the coming G20summits, this will lead to a historic agenda whichwill outdo the SDC.
Some have advanced the criticism that the SDCcreated no new follow-up mechanism. However,the criticism does not seem relevant. The SDC didnot just propose a paradigm as a part of the G20Framework mandate but adopted specific projectsto accomplish it. In addition, it specified actors and atimeframe. The G20, through its DevelopmentWorking Group, will continue to monitor theMulti-Year Action Plan. A High-Level DevelopmentWorking Group meeting was held in Paris on 18-20September of this year to lead the implementationof the SDC and Multi-Year Action Plan. Synergywill be pursued continuously through a linkage ofthe G20 Development Agenda with the High-LevelForum on Aid Effectiveness. Major internationalorganizations, having been involved in setting thedevelopment agenda, have been asked to participatein the implementation of the initiatives of the G20summits. In addition, the SDC will be furtherelaborated and practical action programmes will beadded and implemented.
36 The Global Development Agenda after the Great Recession of 2008-2009: Revisiting the Seoul Development Consensus
References
Dervis, K., 2009. “Developing economies can help cureglobal imbalances, Financial Times, December 20, athttp://www.ft.com/cms/s/0/1e2af6aa-ed8e-11de-ba12-00144feab49a.html
Dervis, K., Gertz, G., Chandy L., 2010. Institutional
development: How the G-20 may help the world's poor, TheBrookings Institution.
Kragelund P., 2010. The potential role of non-traditional
donors' aid in Africa. International Centre for Tradeand Sustainable Development Issue Paper No. 11.
Handley, G., Killick, T., 2009. “Beyond thenumbers: Combating the crisis in poor countriesrequires more than just cash”. A Development Charter
for the G-20.
MDGs at http://www.un.org/millenniumgoals/
Ministry of Foreign Affairs and Trade, 2011. WhitePaper on the G20 Seoul Summit (in Korean).
OECD 2005/2008, The Paris Declaration on AidEffectiveness and the Accra Agenda for Action, athttp://www.oecd.org/document/19/0,3746,en_2649_3236398_43554003_1_1_1_1,00.html
The Cannes Action Plan for Growth and Jobs,November 4, 201, athttp://www.g20.org/pub_communiques.aspx
The G20 Cannes Summit Final Declaration,November 4, 201, athttp://www.g20.org/pub_communiques.aspx
The G20 Seoul Summit Declaration, November11-12, 2010, athttp://www.g20.org/pub_communiques.aspx
The Seoul Summit Document, Annexes,November 11-12, 2010, athttp://www.g20.org/pub_communiques.aspx
The G20 Toronto Summit Declaration, June 26-27,2010, athttp://www.g20.org/pub_communiques.aspx
UN, 2011.The Millennium Development Goals Report
2011, New York.
UNDP, 2010.What will it take to achieve the MDGs? An
international assessment, New York.
The Global Development Agenda after the Great Recession of 2008-2009: Revisiting the Seoul Development Consensus 37
2. SESSION 1 – REVISITING THE SEOUL DEVELOPMENT CONSENSUS


3. SESSION 2
Job Creation and GlobalDevelopment
The service revolutionEjaz Ghani, Senior Economic Advisor, World Bank

The Service Revolution
Ejaz Ghani, Senior Economic Advisor, World Bank
Introduction
China and India are the two fastest-growingeconomies in the world. However, their growthpatterns are dramatically different. FIGURE 1compares the share of service value added in GDPin China, India and OECD countries. The share ofthe services sector in India is much bigger than inChina, after controlling for their stage ofdevelopment. China has a large manufacturingsector, and it has a global reputation for exportingmanufactured goods. India has a smallmanufacturing sector but a large services sector, andit has acquired global recognition for exportingservices.
The difference in their growth patterns is so strikingthat it raises big questions in development
economics. Can the services sector be as dynamic asthe manufacturing sector? Can service-led growthcontribute to job creation and poverty reduction?Can the latecomers to development take advantageof the globalization of services?
Comparing China’s and India’sgrowth patterns
TABLE 1 reports the results of cross-country growthregressions for a large group of countries. In 1991,India’s share of the services sector in GDP was 5percentage points above the global norm, aftercontrolling for its stage of development and itsnon-linearity in development. The United States’
40 The Global Development Agenda after the Great Recession of 2008-2009: Revisiting the Seoul Development Consensus
FIGURE 1. COMPARING THE CONTRIBUTION OF THE MANUFACTURING AND SERVICES SECTORS TOGDP IN CHINA AND INDIA, 2005
Source: The service revolution in South Asia (Ghani and Kharas, 2010).

relative share of services was 9 percentage pointsabove the norm. However, China was a negativeoutlier. Its share of the services sector in GDP was 6percentage points lower than the global norm. By2005, India had become an even bigger outlier onservices compared to the global norm. The size ofits services sector was 6 percentage points above theglobal norm. China, on the other hand, became aneven bigger negative outlier. Its relative share ofservice was nearly 8 percentage points below theglobal norm. So services have continued to be amore important sector for India, but not soimportant for China, controlling for other factors.
What about the manufacturing sector? In 1991China was a huge positive outlier in manufacturingcompared to the norm worldwide. Itsmanufacturing share in GDP was a whopping 18
percentage points above the global norm,controlling for other factors. India’s share wasmerely 3 percentage points above the norm. Thecoefficient for the US was not significantly differentfrom zero. In 2005 China’s share of manufacturingin GDP was even higher, at 19 percentage pointsabove the global norm. India’s and the US’s relativeshare of manufacturing in GDP had not changedmuch.
Are China’s and India’s export patterns alsodifferent? TABLE 2 shows cross-country regressionresults for the share of total service export in totalexports of goods and services, and the share ofmodern service exports (IT and IT-enabled serviceexports) in total exports. In 1982 the share of serviceexports in total exports for China and India was notsignificantly different from the global norm. Only
The Global Development Agenda after the Great Recession of 2008-2009: Revisiting the Seoul Development Consensus 41
3. SESSION 2 – JOB CREATION AND GLOBAL DEVELOPMENT
TABLE 1. CHINA, INDIA AND THE UNITED STATES IN CROSS SECTION: SHARE OF MANUFACTURINGAND SERVICES SECTORS IN GDP
Share of the services sector Share of the manufacturing sector
1991 2005 1991 2005
Log GDP per capita 11.58 26.28 33.79*** 18.89***
(12.82) (12.00) (10.53) (7.00)
Log GDP per capita² 0.17 -1.95 -4.56*** -2.41**
(1.94) (1.77) (1.60) (1.03)
India indicator 4.83*** 6.09*** 2.96** 3.01***
(1.53) (1.66) (1.27) (0.76)
China indicator -5.8* -7.92 18.35*** 18.26***
(3.37) (4.35) (3.31) (1.57)
US indicator 8.91** 12.29*** 1.66 1.12
(3.82) (4.88) (3.19) (2.18)
Control for size YES YES YES YES
Observations 158 161 136 155
Notes: Robust standard errors are reported in parenthesis.*** represents significance at 1 per cent, ** at 5 per cent, and * at 10 per cent.Country size is measured by area in square kilometres.

the US had a significant positive coefficient. Its relativeshare of service exports was 20 percentage pointsabove the global norm. In 2006 India was a significantand large positive outlier. Its share of service exportsin total exports was nearly 21 percentage pointsgreater than the norm. China’s coefficient was notsignificantly different from zero.
Services can be divided into two broad categories,modern services and traditional services. Modernservices are linked to information communicationtechnology (ICT). They can be unbundled andsplintered in a value chain just like goods. Becausethey are disembodied, they can be electronicallytransported internationally through satellite andtelecom networks. The number of services that canbe transported digitally is constantly expanding:processing insurance claims, call centres, desktop
publishing, remote management and maintenanceof IT networks, compiling audits, completing taxreturns, transcribing medical records, healthrecords, and financial research and analysis.
The other broad category of services is traditionalservices, which are less ICT-intensive and requireface-to-face interaction. These include transport,trade, hotel, restaurant, beauty shops, barbers,education, health and other government andcommunity services. It is modern services that aredeveloping rapidly thanks to the 3Ts (Ghani, 2010):growing tradability, more sophisticated technology(including specialization, scale economies andoff-shoring) and reduced transport costs.
A good measure of modern impersonal serviceexports is IT and IT-enabled services.
42 The Global Development Agenda after the Great Recession of 2008-2009: Revisiting the Seoul Development Consensus
TABLE 2. CHINA, INDIA AND THE UNITED STATES IN CROSS SECTION: SHARE OF TOTAL SERVICEEXPORTS AND MODERN SERVICE EXPORTS (COMPUTER AND INFORMATION SERVICE EXPORTS) INTOTAL EXPORTS OF GOODS AND SERVICES
Share of service exports in total exports Share of computer and informationservices in total export
1982 2006 2000 2006
Log GDP per capita -4.3 2.39 -2.01** -3.17*
(28.90) (27.30) (1.12) (1.90)
Log GDP per capita² 0.36 0.06 0.37** 0.53*
(4.20) (3.97) (0.19) (0.32)
India indicator 2.8 20.97*** 7.96*** 14.7***
(4.47) (3.60) (0.08) (0.14)
China indicator 4.1 15.6 .32 .59*
(7.90) (10.03) (0.23) (0.35)
US indicator 20.16*** 31.4*** -.46 -.74
(1.60) (10.50) (0.34) (0.55)
Control for size YES YES YES YES
Observations 109 125 137 116
Notes: Robust standard errors are reported in parenthesis.*** represents significance at 1 per cent, ** at 5 per cent, and * at 10 per cent.Country size is measured by area in square kilometres.
Cross-country data for IT exports is available from2000 onwardsonly. TABLE 2 shows that India stoodout as a significant and positive outlier when wecompare its share of IT and IT-enabled exports intotal exports of goods and services with the rest ofthe world, and control for real GDP per capita andnon-linearity in development. India’s share wasnearly 8 percentage points above the norm aftercontrolling for other factors. The relative share ofmodern services in total exports for China was notsignificantly different from the norm. A distinctivefeature of India is that it is emerging as a majorexporter of modern impersonal services, which isgrowing much faster than traditional personalservice exports, and service exports from India inturn are growing much faster than goods exportsfrom China.
It is not that China is not competitive in any serviceexport. Indeed, they are doing much better thanIndian firms in traditional services, which are closelyassociated with the manufacturing sector.Traditional services like transport, logistics and tradehave grown more rapidly in China than in India.India’s traditional services have not grown as fast. Itis modern services, which can be transportedthrough the Internet (auditing, accounting, financialand health services) that have grown rapidly inIndia. Modern services have grown more rapidly inIndia despite its small manufacturing base. Growthin modern services is not tied to the growth of themanufacturing sector.
Can the services sectorcontribute to growth?
Services have long been the main source ofgrowth in rich countries. Now they are also themain source of growth in poor countries. Serviceshave become a larger share of GDP in poorcountries and productivity growth in servicesexceeds that of industry in most poor countries.
This is largely explained by the rapid developmentof modern, commercial services: businessprocessing, finance, insurance, communications.The productivity growthof modern services, inturn, is driven by the 3T’s: tradability, technologyand transportability.
For more than 200 years, it was argued that theeconomic development, growth and structuraltransformation of agriculture were best achieved bydeveloping a labour-intensive manufacturing sector.Expansion of the services sector was seen as givingrise to stagnant growth. Services were considered asmenial, low-skilled, low-wage, low-productivitysectors, with low innovation, low learning and lowspillover effect. Today, services can be among themost dynamic sectors in an economy, even in poorcountries.
More than 75 per cent of the global economy is nowaccounted for by services (45per cent in developingeconomies). Services are the fastest growing sectorin global trade. The share of developing countries inworld service exports increased from 14 per cent in1990 to 21 per in 2008. The average growth ofservice exports from poor countries has exceededthat of rich countries during the last two decades.Their service exports are growing faster than goodsexports. In brief, the globalization of service hasenabled developing countries to tap into services asa source of growth.
It is perhaps not surprising that services areexpanding rapidly in upper middle incomedeveloping countries. Their economies increasinglyresemble those of rich countries where serviceshave long dominated economic growth. This note,however, focuses on the contribution of services topoor countries, defined as the low income and lowermiddle income countries in the World Bankclassification in 2009. Low income countries have aper capita income of US$ $995 or less and lowermiddle income countries have a per capita incomein the range of $996 - $3,945.
The Global Development Agenda after the Great Recession of 2008-2009: Revisiting the Seoul Development Consensus 43
3. SESSION 2 – JOB CREATION AND GLOBAL DEVELOPMENT

FIGURE 2 shows the composition of services andindustry to GDP growth in the last thirty years forrich and poor countries. In both cases, thecontribution of services to total growth is higherthan industry’s contribution. In poor countries,services (and industry) have contributed more togrowth than in rich countries.
FIGURE 3 shows that the rise in services’contribution to growth is linked to a rise inproductivity growth in the sector. The figure showsthat labour productivity growth in rich countries hasbeen higher in services than in industry for the lastthirty years, and that it remains positive. Thatimplies that the global technology frontier for
44 The Global Development Agenda after the Great Recession of 2008-2009: Revisiting the Seoul Development Consensus
FIGURE 3. COMPARING LABOURPRODUCTIVITY ACROSS SECTORS
Source: Author’s calculation from World Development Indicators, World Bank.Note: Labourproductivity is calculated as the sectoralvalue added per employee. The line shown is the best-fit quadratic function.
FIGURE 2. SOURCES OF GROWTH IN RICH AND POOR COUNTRIES
Source: Author’s calculation from World Development Indicators, World Bank.

services is still shifting out, while that for industryhas stagnated. At the same time, productivitygrowth in poor countries in services is acceleratingand appears to have outstripped productivitygrowth in industry. In 58 out of 94 countries forwhich we have data, productivity growth in servicesexceeded that in industry.
India’s growth pattern in the 21st century isremarkable because it contradicts a seeminglyiron law of development. This law—which is nowconventional wisdom—says that industrializationis the only route to rapid economic developmentfor developing countries. It goes further to saythat as a result of globalization the pace ofdevelopment can be explosive. But the potentialfor explosive growth is distinctive tomanufacturing only (UNIDO 2009). This is nolonger the case.
Role of service-led growth inpoverty reduction and job creation
We find that growth in the services sector is morecorrelated with poverty reduction than growth inagriculture for a sample of 50 developing countries.Visually, we can plot the change in poverty between1990 and 2005 against the growth of services(FIGURE 4). The negatively sloped line indicates thestrong association between services output growthand poverty reduction for our sample of developingcountries. Service output growth is a big contributorto poverty reduction in India.
These results are confirmed when we examine theimpact of sectoral growth patterns on povertyreduction within India, using a panel of Indian statedata from 1994 to 2005. Our results show that the
The Global Development Agenda after the Great Recession of 2008-2009: Revisiting the Seoul Development Consensus 45
3. SESSION 2 – JOB CREATION AND GLOBAL DEVELOPMENT
FIGURE 4. CHANGE IN POVERTY AND GROWTH IN SERVICE OUTPUT, 1990-2005
Source: World Bank, World Development Indicators.Note: Change in poverty (1991-2205) after controlling for initial level of poverty and for growth in agricultural,manufacturing and service output.

trend growth in the services sector among Indianstates is associated with a decline in the trend of theheadcount poverty rate of almost 1.5 points duringthe sample period. In fact, the services sector is theonly sector showing a statistically significantassociation with poverty reduction. Similar resultsare found when differentiating between rural andurban poverty. Service sector growth is stronglyassociated with a reduction in both urban and ruralpoverty rates. Some states like Andhra Pradesh,Kerala and Tamil Nadu have experienced asignificant decrease in urban poverty that isassociated with an increase in their share of theservices sector (FIGURE 5).
Services contribute to poverty reduction via twochannels. Directly, they provide the largest source ofnew job growth. Indirectly, they provide the incomethat, when spent, drives further demand for goodsand services and for jobs to produce them. FIGURE 6shows that the services sector in India has had thefastest growth in the number of jobs created inrecent years. In addition to direct job creation, someestimates suggest that the indirect effect of agrowing services sector can be larger than the directeffect. For instance, India’s IT industry association
NASSCOM estimates that, for every job created inthe IT sector, four additional jobs are created in therest of the economy due to high levels ofconsumption by professionals employed in thissector.
Are service jobs good jobs?
Wage growth in India has been higher in theservices sector than in manufacturing andagriculture in recent years. While manufacturingwages fell in the early 2000s in both rural andurban areas despite rapid economic growth,services sector wages in utilities, trade, transportand even rural finance improved. In fact, in manysectors rural wages may have increased faster thanin urban areas, possibly reflecting the risingrural-urban migration that is taking place in India.It is this internal rural-urban migration and linksbetween rural and urban labour markets that allowthe modern impersonal services sector in India tocontribute to overall poverty reduction, eventhough modern services are concentrated in urbanareas.
46 The Global Development Agenda after the Great Recession of 2008-2009: Revisiting the Seoul Development Consensus
FIGURE 5. CHANGE IN POVERTY AND IN SERVICES OUTPUT AT THE STATE LEVEL IN INDIA, 1994-2005
Source: The service revolution, Chapter 1, Ghani (2010).
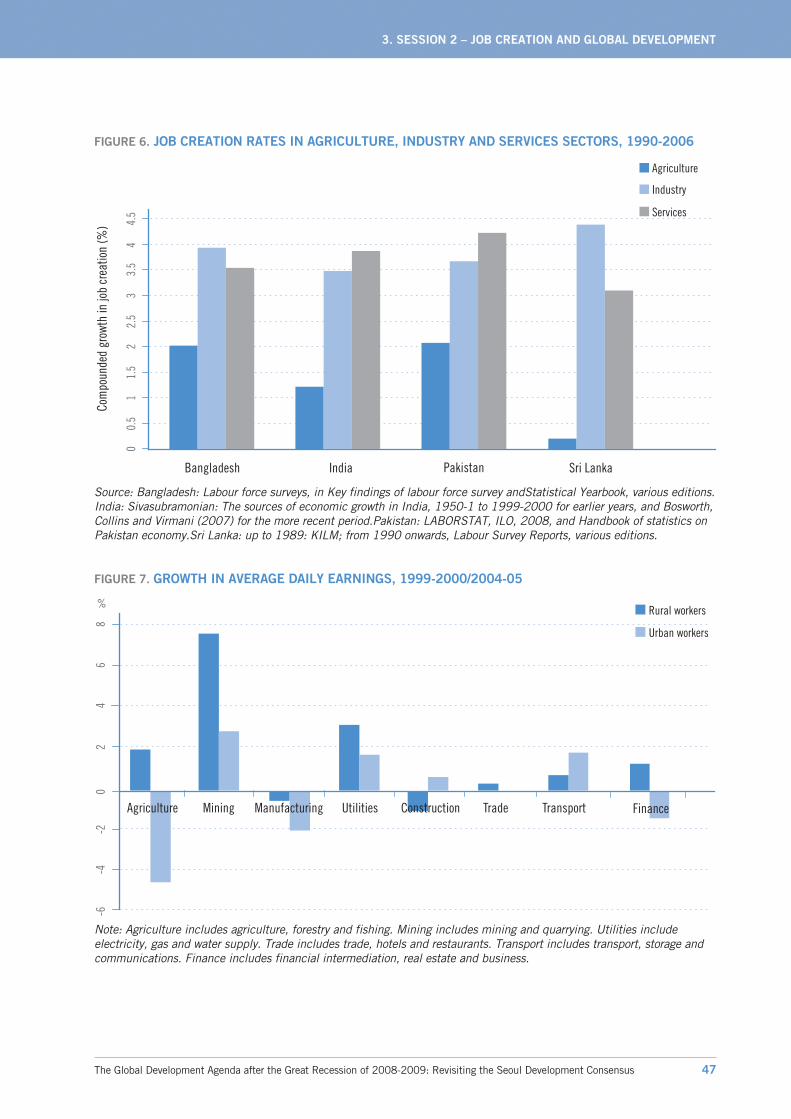
The Global Development Agenda after the Great Recession of 2008-2009: Revisiting the Seoul Development Consensus 47
3. SESSION 2 – JOB CREATION AND GLOBAL DEVELOPMENT
FIGURE 6. JOB CREATION RATES IN AGRICULTURE, INDUSTRY AND SERVICES SECTORS, 1990-2006
Source: Bangladesh: Labour force surveys, in Key findings of labour force survey andStatistical Yearbook, various editions.India: Sivasubramonian: The sources of economic growth in India, 1950-1 to 1999-2000 for earlier years, and Bosworth,Collins and Virmani (2007) for the more recent period.Pakistan: LABORSTAT, ILO, 2008, and Handbook of statistics onPakistan economy.Sri Lanka: up to 1989: KILM; from 1990 onwards, Labour Survey Reports, various editions.
FIGURE 7. GROWTH IN AVERAGE DAILY EARNINGS, 1999-2000/2004-05
Note: Agriculture includes agriculture, forestry and fishing. Mining includes mining and quarrying. Utilities includeelectricity, gas and water supply. Trade includes trade, hotels and restaurants. Transport includes transport, storage andcommunications. Finance includes financial intermediation, real estate and business.

Is the services sector more productive in India thanin China, and the manufacturing sector moreproductive in China than in India? FIGURE 8compares service labour productivity and industrylabour productivity for a large sample of countries,after controlling for initial GDP per capita and GDPgrowth. India is way above the line, showing muchhigher labour productivity in the services sectorthe inindustry. By contrast, China shows much higherlabour productivity in industry than in services.
There are two tipping points that are driving labourproductivity growth rates in services. First, low-incomecountries that have the benefit of low wage rates, scaleeconomies and knowledge spillovers, such as India, arecatching up with the global production possibilityfrontier in services. (In essence, the services sector inIndia has behaved like the manufacturing sector inChina.) Second, high-income countries such asSingapore, Sweden, the United Kingdom, and theUnited States are pushing the global productionpossibility frontier in services through innovation.
Currently South Asia suffers from one of thelowest female labour force participation rates inthe world. Only around one-third of all womenof working age in India, Pakistan and Sri Lankaare actually working or looking for work.Internationally, countries with high employmentin services tend to have the highest participationof women in the labour market (FIGURE 9). Thedevelopment of service industries, therefore,brings new workers into the labour force,making the contribution to aggregate growtheven larger.1
The employment of women has a special role inpoverty reduction. Incomes of households wherewomen have jobs are significantly higher. Higherhousehold incomes and an enhanced economicstatus for women in turn reduce the number ofchildren per household, raise levels of education andhealth care for those children and increasehousehold savings and the ability to accumulateassets that generate additional income.
48 The Global Development Agenda after the Great Recession of 2008-2009: Revisiting the Seoul Development Consensus
FIGURE 8. LABOUR PRODUCTIVITY GROWTH IN THE SERVICES AND MANUFACTURING SECTORS,1991-2005
Note: The vertical axis is labour productivity growth in services after controlling for initial income per capita and GDPgrowth whereas the horizontal axis is industrial labour productivity growth controlled for initial income per capita and GDPgrowth, for the time period 1991-2005. The line represents linear regression.
1 In this, services play a similar role to that oflabour-intensive manufacturing exports in East Asia. There, assembly jobs in garments and electronics assembly have beenlargely filled by women moving out of low-productivity self-employment on family farms.

Can service-led growth besustained?
Yes, because the current globalization of services isjust the tip of the iceberg (Blinder, 2006). Servicesconstitute the largest sector in the world, accountingfor more than 70 per cent of global output. Theservice revolution has altered the characteristics ofservices, which can now be produced and exportedat low cost (Bhagwati, 1984). The old idea ofservices being non-transportable, non-tradable, andnon-scalable no longer holds for a host of modernimpersonal services that are moved across bordersvia the Internet, digitized and stored electronically,and scaled into giant global businesses. Developingcountries can sustain a service-led growth as there isa huge room for catch-up and convergence.
Technological change in ICT has progressed at adizzying pace. The range of business processes thatcan be digitized and traded globally is constantlyexpanding: processing insurance claims, desktoppublishing, remote management and maintenance
of IT networks, compiling audits, completing taxreturns, transcribing medical records, financialresearch and analysis. The list of possible activities isalmost endless.
Can poor countries take advantage of this trend?The answer appears to be yes. India has been apioneer, but many other poor countries are findingit easier to generate productivity growth in servicesthan in industry. This does not happenautomatically. Although the same set of generalnon-distortionary policies is as important formodern services as for goods, specific strategies forservices matter.
Modern services need a strong telecommunicationsbackbone. Use of the Internet, personal computersand telephone lines are all independently significantin service exports (Lennon, 2006). So is moreadvanced secondary and higher education.Promoting Foreign Direct Investment (FDI)selectively in telecom sectors is now an activecomponent of industrial policy in many developingcountries (Alfaro and Charlton, 2007).
The Global Development Agenda after the Great Recession of 2008-2009: Revisiting the Seoul Development Consensus 49
3. SESSION 2 – JOB CREATION AND GLOBAL DEVELOPMENT
FIGURE 9. FEMALE EMPLOYMENT GOES HAND IN HAND WITH INCREASED SERVICE EMPLOYMENT
Source: The service revolution (Ghani, 2010)

Globalization of services provides manyopportunities for late-developing countries to findniches beyond manufacturing where they can besuccessful. Taking advantage of these opportunitiesrequires a government that takes steps energeticallyto accelerate growth in services through a variety ofpolicies (Bhagwati, 2004). Services may provide theeasiest and fastest route out of poverty for manypoor countries.
India’s development experience offers hope tolate-comers to development. The marginalization ofAfrica during a period when China and other EastAsian countries grew rapidly led some to wonder iflatecomers were doomed to failure. Manyconsidered the bottom billion to be trapped inpoverty (Collier, 2007). The process of globalizationin the late 20th century led to a strong divergence ofincomes between those who industrialized andbroke into global markets and a “bottom billion” ofpeople in some 60 countries where incomes
stagnated for 20 years. It seemed as if the “bottombillion” would have to wait their turn fordevelopment, until the giant industrializers likeChina became rich and uncompetitive inlabour-intensive manufacturing.
The promise of the services revolution is thatcountries do not need to wait to get started withrapid development. There is a new boat thatdevelopment latecomers can take. The globalizationof services provides alternative opportunities fordeveloping countries to find niches beyondmanufacturing where they can specialize, scale upand achieve explosive growth, just like theindustrializers. The core of the argument is that, asthe services produced and traded across the worldexpand with globalization, the possibilities for allcountries to develop on the basis of theircomparative advantage expand. That comparativeadvantage can just as easily be in services as inmanufacturing or indeed agriculture.
50 The Global Development Agenda after the Great Recession of 2008-2009: Revisiting the Seoul Development Consensus

References
Baumol, William J., 1967. “Macroeconomics ofunbalanced growth: The anatomy of urban crisis,inAmerican Economic Review,No. 57 (3), pp. 415-426.
Bhagwati, Jagdish N., 1984. “Splintering anddisembodiment of services and developingnations,in The World Economy, No. 7, pp. 133-144.
Blinder, Alan S., 2006.“Offshoring: The nextindustrial revolution?” in Foreign Affairs, No. 85 (2),pp. 113-28.
Chenery, H.B., 1960.“Patterns of industrialgrowth,in American Economic Review, No. 50.
Collier, Paul., 2007. The bottom billion: Why the poorest
countries are failing and what can be done about it? NewYork and Oxford, Oxford University Press.
Ghani, E. and S. Ahmed., (eds), 2009. Accelerating
growth and job creation, Oxford University Press, India.
Ghani, Ejaz and HomiKharas, 2010.“The servicerevolution overview”. E. Ghani (ed), The service
revolution, Oxford University press.
Ghani, Ejaz., (edited), 2010. The service revolution in
South Asia, Oxford University Press, India
Kaldor, N., 1966.Causes of the slow rate of economic growth
of the United Kingdom. Cambridge University Press.
Kuznets, S., 1959.Six lectures on economic growth. NewYork,The Free Press of Glencoe.
United Nations Industrial Development Organization(UNIDO), 2009. Industrial Development Report,Breaking in and moving up: New industrial challenges for the
bottom billion and the middle income countries. Vienna,UNIDO.
The Global Development Agenda after the Great Recession of 2008-2009: Revisiting the Seoul Development Consensus 51
3. SESSION 2 – JOB CREATION AND GLOBAL DEVELOPMENT
Promotion of Non-traditionalAgricultural Exports and theirEmployment Consequences:Case of the Cut Flower Industryin Ethiopia2
Yukichi Mano, Assistant Professor, National Graduate Institute for PolicyStudies, Japan
Abstract
We examine here the roles of local and personalnetworks in the employment process and theemergence and development of the labour marketin Ethiopia’s growing cut-flower industry. Usingprimary survey data of 320 workers randomlysampled from all 64 farms, we find that workerswho were recruited informally using their social tieswere paid less than the formally-recruited workers atthe time of hiring. However, the former quicklyincreased their productivity and the effect of socialties on wages disappeared over time. Further, wefind that the development of a labour market forthis newly-emerged industry took place particularlywithin industrial clusters.
Introduction
In developing economies the creation of non-farmemployment opportunities is recognized as anessential pathway out of poverty (Otsuka et al.,2009). However, it is often the case that labourmarkets in such economies are yet to be well
established, and the dissemination of informationon employment opportunities tends to be limited toa local community or personal network. Inconsequence, the newly established non-farm sectormay sooner or later face a labour shortage and itslong-run development and contribution to povertyalleviation be severely hampered. Thus, theestablishment of a well-functioning labour market isimportant to help the non-farm sector develop andplay its role in poverty reduction.
The existing literature suggests that information onemployment opportunities tends to be transmittedthrough local and personal networks in developingeconomies to supplement their underdevelopedlabour market (Ben-Porath, 1980; Banerjee, 1984;Carrington, 1996; Munshi, 2003; Luke andMunshi, 2006; Yamauchi and Tanabe, 2008;Kajisa, 2007). However, studies on theemployment process in developing economies arestill scarce (e.g., Frijiters, 1999; Collier and Garg,1999). More importantly, the development processof labour markets beyond reliance on thesepersonal networks has not been sufficientlyexamined since its importance was first raised byMarshall (1920).
52 The Global Development Agenda after the Great Recession of 2008-2009: Revisiting the Seoul Development Consensus
2 This paper is primarily based on Mano, Yamano, Suzuki and Matsumoto (2011) and prepared for the ILO Employment Policy Department ’s One-Day Knowledge SharingConference held in Geneva on 21 November, 2011as part of the partnership programme with the ILO and the Republic of Korea,. See also Mano and Suzuki (2010) on theagglomeration economies in the cut flower industry in Ethiopia and Mano and Suzuki (2011) on the exit and takeover of the flower farms.
In order to fill this gap, this paper examines theevolution of the employment channels and thedevelopment of the labour market in the young andexponentially growing cut-flower industry inEthiopia. The cut-flower industry in Ethiopia is ayoung and fast growing industry. In fact, Ethiopiahas become the third largest cut-flower exporter inAfrica, following Kenya and Zimbabwe. We havedetailed primary information on all the 64 farms inthe cut-flower industry as of 2007, and also on 320workers randomly sampled from its 21,786employees. The flower farms initially employedlocal villagers who resided in their neighbourhood,and then gradually started hiring distant farmerswho were relatives or friends of their employees.The employment of workers outside these socialnetworks used to be a minor option, but its sharehas been steadily increasing over time, especiallywithin the industrial clusters3, and reached 15 percent of the newly employed as of 2007. Theseemployees outside the social networks earnedsignificantly higher initial wages than to the workershired through the social networks. However, thewage rate of the workers hired through the local andpersonal networks increased faster than that ofworkers outside the networks, and the wage gapsoon disappeared. This suggests that those hiredthrough social networks quickly learn new skills, andthat this industry not only created employmentopportunities for poor farmers but also improvedtheir human capital.
The rest of this paper is organized as follows. Section
2 reviews the literature on the role of personal
networks on employment and postulates our main
hypotheses, while we describe the cut-flower industry
in Ethiopia in Section 3. Section 4 describes our
dataset and discusses the descriptive statistics. Our
estimation strategy is presented in Section 5. The
estimation results are reported and examined in
Section 6. Section 7 concludes the paper.
Hypotheses
At the early stage of an infant industry, the
associated input and output markets tend to be
underdeveloped, especially in developing
economies (Sonobe and Otsuka, 2006, 2011). It is
widely recognized that personal networks play an
important role in economic transactions.4 A
number of studies have examined the role of local
and personal networks on the employment process.
One common hypothesis, the so-called “screening
hypothesis”, argues that the use of personal
networks reduces the cost arising from hidden
information about the workers’ quality (Saloner,
1985; Montgomery, 1991; Simon and Warner,
1992). This hypothesis primarily relates to
occupations requiring high skills and predicts that
workers with referrals tend to receive higher initial
wage than non-referred workers because the
employers have more accurate information about
the former. However, because firms acquire more
information about non-referred workers over time,
this information advantage becomes less important,
and thus the growth rate of wages for the referred
workers tends to be slower.
Another strand of the literature considers the cost
arising from the hidden action by the worker, the
so-called “peer-pressure hypothesis” (Milgrom and
Roberts, 1992; Putnam, 2000). This hypothesis
considers situations in which the effort levels of the
workers are unobservable to the employers. It
argues that personal networks lower the employer’s
monitoring cost because referred workers feel
obliged to exert more effort to prevent the
introducers from losing face. Because of the peer
pressure, an employer can afford to pay lower wages
to the referred workers than to the non-referred
workers to extract the same level of effort
throughout their career.
The Global Development Agenda after the Great Recession of 2008-2009: Revisiting the Seoul Development Consensus 53
3. SESSION 2 – JOB CREATION AND GLOBAL DEVELOPMENT
3 In the literature, an industrial cluster is usually defined as the geographical concentration or localization of enterprises producing closely related goods in a small area. Inour case, 14 cut flower farms out of the 64 were located in one village, and 13 were in another, whereas the other farms were scattered across different villages. Thus, werefer these two villages as the industrial clusters throughout this paper.
4 Examples include their role in consumption smoothing (Fafchamps and Lund, 2003), agricultural marketing (Fafchamps and Minten, 2002), capital mobilization for factoryestablishment (Banerjee and Muhshi, 2000; Fafchamps, 2000), technology diffusion (Conley and Udry, 2010), and the prevention of tenant farmers ’ shirking (de Janvry,Sadoulet and Fukui, 1997).

A third hypothesis, which we may refer to as the“information-cost hypothesis, focuses on the role ofpersonal networks in reducing search costs anddisseminating information on employmentopportunities (Granovetter 1974; Holzer, 1988;Mortensen and Vishwanath, 1994). Observing thatthe use of informal hiring methods are morewidespread in developing countries (Ben-Porath,1980), particularly in sectors in which fewercognitive and social skills are required (Holzer,1996), this hypothesis argues that, since the referredapplicants are typically those who are unable to findjobs elsewhere, their reservation wages are low.Thus, this hypothesis predicts low initial wages forsuch referred workers (Pistaferri, 1999; Antoninis,2006).
While these hypotheses have been discussedespecially in the labour economics literature,empirical studies, particularly in the context of thenon-agricultural labour market in developingeconomies, are lacking. Considering the importanceof informal recruitment channels in developingcountries and the significance of thenon-agricultural labour market for povertyreduction, it is important to understand theformulation of labour markets for a newly emergedindustry in a developing country. In our targetindustry, as we explainlater, the tasks required forthe workers are quite simple, as opposed to thesituations considered in the screening hypothesis,and workers are constantly and closely monitoredby supervisors, unlike the situations considered inthe peer-pressure hypothesis. Thus, problemsarising from hidden information or actions may notbe important issues. This leads us to conjecture thatthe information-cost hypothesis best explains thesituation in Ethiopia.
We can test which hypothesis holds for thecut-flower industry in Ethiopia by exploiting thedifferent predictions derived from thesehypotheses. If the initial wages of the workers withinformal networks are significantly lower than theinitial wages of the formally-recruited workers, thescreening hypothesis is rejected. Moreover, if the
wage growth rate for the workers with informalnetworks changes over time in relation to theformally-recruited workers, we can reject thepeer-pressure hypothesis.
First, we assume that workers formally selectedfrom a large labour force pool are more associatedwith higher productivity than workers hired throughlocal and personal networks and should be paidmore highly accordingly. Thus, we postulate thefollowing hypothesis:
Hypothesis 1: Workers recruited formally in the labour
market tend to be more productive, and thus receive higher
wages than workers hired through local and personal
networks.
Secondly, we assume that the labour supply outsidethe clusters is relatively scarce. Thus, farms locatedoutside the clusters may pay higher wages, which weshall call a “premium, to attract and secureemployees with a given level of productivity and tosave on searching for substitute workers. Marshall(1920) stressed the development of skilled labourmarkets as a major advantage of industrial clusters.This advantage seems to be particularly relevant toour focus on the development of the employmentprocess in an industry. Essentially,it claims thatfrequent interaction and enhanced information flowamong firms and workers in industrial clusters tendto alleviate search frictions typically associated withjob-applicants’ access to information about theavailability of jobs (Stigler, 1961, 1962; Pissarides,2001), and help job-applicants match the firms thatare trying to fill vacancies. Furthermore, recentempirical studies on the formation anddevelopment of industrial clusters find that thedevelopment of skilled labour markets in industrialclusters enhances knowledge diffusion and skilltransformation through spin-offs and active labourturnover (Sonobe and Otsuka, 2006). In ourunderstanding, there is no study that directlycompares the development of the labour marketassociated with a particular industry within andoutside industrial clusters. Firms located outsideindustrial clusters may initially enjoy their
54 The Global Development Agenda after the Great Recession of 2008-2009: Revisiting the Seoul Development Consensus

monopsonic or oligopsonic positions in the locallabour market, but they are likely to face difficulty inattracting workers beyond a certain level, aspotential workers expect to find better jobs moreeasily in industrial clusters for the reasons discussedabove. As a consequence, firms outside industrialclusters may want to offer wages in excess ofmarket-clearing to reduce labour turnover (e.g.Salop 1979; Schlicht 1978; Stiglitz 1987), asreplacing workers – which includes the cost ofsearch, recruitment and training – is expensive. Thecut-flower industry in Ethiopia provides us with justsuch an opportunity to investigate the developmentand performance of the labour market within andoutside an industrial cluster.
Hypothesis 2: Farms located outside industrial clusters face a
relative scarcity of labour due to the underdevelopment of the
labour market, and thus they pay higher wages to a worker
with a given level of productivity.
We will test these hypotheses on the cut-flowerindustry in Ethiopia. The next section describes thisindustry in detail.
The cut flower industry inEthiopia
Ethiopia is a country of agriculture, which engagesabout 80 per cent of the population living in ruralareas as subsistence farmers and accounts for morethan 50 per cent of GDP (Embassy of Japan inEthiopia 2008), and the economy has so fardepended on coffee as its primary export product(TABLE 1). Ethiopia is said to have an agro-climaticcondition that is well suited to flower cultivation(Mano and Suzuki, 2010), including wideunderdeveloped highlands near the internationalairport, a climate of high daily temperature and coolnights, and sufficient sunlight and rainfall. Inaddition, Ethiopia has an abundant labour supplywith a low wage rate. Given these advantages,domestic and foreign farms have gradually startedexporting flowers to Europe, the United States andthe Middle East, mainly through the world's largestauction market in Holland and, since the 1990s,increasingly through direct sales (Hughes, 2000;Wijnands 2005).
The Global Development Agenda after the Great Recession of 2008-2009: Revisiting the Seoul Development Consensus 55
3. SESSION 2 – JOB CREATION AND GLOBAL DEVELOPMENT
TABLE 1. ETHIOPIA’S COFFEE AND CUT-FLOWER EXPORTS AND KENYA’S CUT-FLOWER EXPORTS(MILLION USD)
Year Ethiopia Kenya
Total(1)
Coffee(2)
Cut flowers(3)
Cut flowers(4)
2005 926 335 0 242
2006 1,043 426 25 275
2007 1,277 418 68 313
2008 1,601 562 104 446
2009 1,618 369 131 421
2010 2,580 774 159 396
Source: UN COMTRADE at http://comtrade.un.org/db/default.aspx, accessed on October 3, 2011)

The export value of cut flowers has increasedexponentially since the mid-2000s (Column 3 ofTABLE 1). This rapid development in the sector maybe partly due to government support starting in theend of 2002 (Embassy of Japan in Ethiopia 2008;Getu, 2009), including tax exemptions for inputs, arevised investment law for foreign investors, leasedland with basic utilities at low prices, and specialloans provided through the Development Bank ofEthiopia. TABLE 1 also shows the export value ofcut flowers from Kenya, which is the largestcut-flower exporter in Africa and the fourth largestin the world, after the Netherlands, Colombia andEcuador. The export value of Ethiopia’s cutflowers was initially negligible in the trade statistics,but it has drastically increased since the mid-2000sand attained USD 159 million in 2010. Its exportvalue is now almost half of that of Kenya, andEthiopia has become the second largest cut-flowerexporter in Africa and the sixth largest in the world,following Belgium and the four countriesmentioned above.
As flowers are delicate and vulnerable when beingharvested, packaged and transported, it is essentialto have careful manual labour. It is said thatefficient flower production requires at least 20 to 30workers per hectare in Africa (Whitaker andKolavalli, 2006). These production workersperform relatively simple tasks such as planting,harvesting, trimming, and packaging, which areclosely monitored by supervisors. In an informalinterview, one general manager explained that itusually takes less than two months for a novice tolearn the tasks in most sections. Further, as there isvirtually no domestic market for cut-flowers inEthiopia, all the flowers cultivated need to haveexport access. These features together make for thelarge-scale plantation-oriented production systemthat dominates in the industry (Binswanger andRosenzweig 1986; Jaffee and Morton, 1995; Hayami2002). In this kind of environment, because of the
simple tasks assigned to the workers and the closesupervision of their work, the hidden informationand hidden action problems are likely to beunimportant, as previously mentioned.
As the flowers are air-freighted, most of the flowerfarms are located near the capital, and clusters ofthese farms can be found in some areas.5 In ourinformal interviews we learned that these farmsestablish an industry association which, for instance,invites technical consultants from India, Israel andthe Netherlands and coordinates the transportationof the flowers. In all likelihood, they also sharemarket information and orders from large clients sothat they can respond to fluctuations in demand andsmooth their production throughout the year(Mano and Suzuki, 2010). In other villages only afew farmsoperate, if any, and cooperation withother farms is limited.
Data and descriptive analyses
The primary survey data used in this paper comefrom 64 cut-flower farms in Ethiopia collected bythe Ethiopian Development Research Institute incollaboration with the National Graduate Institutefor Policy Studies (GRIPS), Japan. The survey wasconducted from the end of 2007 to early 2008. Asmentioned above, the data include all the registeredcut-flower farms in Ethiopia which, because there isvirtually no domestic market for this industry, are allnecessarily registered enterprises. We alsoconducted interviews with randomly selectedworkers from these 64 cut-flower farms. At eachfarm five workers (three female and two male) wererandomly selected from a list of full-time workers.6
In total, we interviewed 320 workers, 188 femaleand 132 male.
Almost all the workers in the sample wereproduction workers, engaged in simple tasks. To
56 The Global Development Agenda after the Great Recession of 2008-2009: Revisiting the Seoul Development Consensus
5 More precisely, Welmera woreda (meaning village) had 14 out of the 64 farms, while Holeta woreda had 13 farms in 2007.
6 Each observation is given equal weight in the following analysis as well as in the sample selection, irrespective of the volume or male-female ratio of employment at eachfarm. To check if our estimation results are dependent on the sample selection, we have estimated the same regression models in the paper by using the weightedleast-square estimation models. The results are similar to what we find in the paper and are available on request.

facilitate our understanding of the evolution of theemployment channels, we divided our 320 sampleworkers into three groups by type of informationnetwork connected to the farm: (1) locals born inthe same village where the farm is located; (2)friends and relatives invited by the employees; (3)outsiders, who had no such social connections withthe farm or its employees. Through the localnetwork, the locals immediately learn ofemployment opportunities at the nearby farm andthey may well expect to have a fair chance of beingrecruited. If the employees find their workingconditions favourable and some positions are stillvacant, they invite their relatives and friends residingoutside the village to work for the farms.Employment opportunities at a farm can also bewidely known to outsiders through advertisements,which areincreasingly effective as the cut-flowerindustry and its labour market as a whole grow.
TABLE 2 presents the timing of employment by eachgroup of sample workers. From the share of eachgroup over the years, we can see that the dominant
employment channel gradually shifts from the localsto the relatives and the friends of the employees.We also observe an increasing share of workersfrom outside these social networks. More precisely,60 per cent of the workers hired in 2004 or before,when Ethiopia’s cut-flower industry had just startedrevealing its presence in the international market,consisted of locals, whereas the share of localsamong new employees declined over time to 38 percent in 2007. New employees introduced by theirfriends and relatives working at the farm initiallyaccounted for 33 per cent of all new employees,while their share overall increased with slightfluctuations to around 40 to 50 percent. The shareof outsiders among the new employees was 8percent in 2004 or before, but it steadily increased overtime and reached as high as 15 per cent in 2007.
Let us now examine the characteristics of theseworkers and of the farms (TABLE 3). The moststriking characteristic is the statistically significantdifference in the educational level across the groups;the locals have seven years of formal education on
The Global Development Agenda after the Great Recession of 2008-2009: Revisiting the Seoul Development Consensus 57
3. SESSION 2 – JOB CREATION AND GLOBAL DEVELOPMENT
TABLE 2. TIMING OF EMPLOYMENT OF THE SAMPLE WORKERS BY TYPE OF WORKER
Year Locals
(1)
Relatives and friendsof employees
(2)
Outsiders
(3)
Total
(1)+(2)+(3)
2004 or before 27
(59)
15
(33)
4
(8)
46
(100)
2005 28
(40)
35
(50)
7
(10)
70
(100)
2006 50
(46)
42
(42)
13
(12)
109
(100)
2007 36
(38)
45
(47)
14
(15)
95
(100)
Number ofobservations
141
(44)
141
(44)
38
(12)
320
(100)
Notes:(1) The workers in the “locals” group were born in the village where the farm is located. The workers in the second groupwere invited by their relatives and friends working at the farm. The workers in the “outsiders” group had neither local norpersonal relationships with the farm or its employees.(2) The numbers in parentheses are the percentage of workers belonging to each category in each year.

average, the relatives and friends of the employeesslightly more, and the outsiders nine years, whichpartially supports Hypothesis 1. Combined with thefindings from TABLE 2, we can see that thecut-flower industry created employment primarilyfor people with little education, who are more likely
to be living in poverty, and that as it developed itstarted attracting workers with higher education,which is in line with Marshall’s argument. Theaverage new worker is in the early twenties,previously worked at 1.2 farms, with six months ofwork experience in the industry at the time of hiring,
58 The Global Development Agenda after the Great Recession of 2008-2009: Revisiting the Seoul Development Consensus
TABLE 3. WORKER AND FARM CHARACTERISTICS BY TYPE OF WORKER
Locals
(1)
Relativesand friends
(2)
Outsiders
(3)
p-value for mean test(a)
(1) vs (2) (1) vs (3) (2) vs (3)
Worker characteristics at hiring
Female (percentage) 61.7 57.4 52.6 0.468 0.314 0.597
Age 23.0 23.1 21.9 0.870 0.337 0.335
Years of schooling 6.97 7.35 8.92 0.436 0.015** 0.040**
Years of experience in theindustry
0.57 0.37 0.61 0.175 0.870 0.284
Number of flower farmswhere he/she has worked
1.25 1.17 1.29 0.158 0.636 0.170
Distance from home to thefarm (km)
3.49 4.97 3.88 0.002*** 0.506 0.006***
Wage rate (birr(b)/month)
At hiring(c) 173.2 182.9 276.6 0.206 0.002*** 0.006***
Current 283.2 286.9 297.2 0.776 0.537 0.639
Farm characteristics at hiring
Years of operation 0.39 0.82 0.78 0.001*** 0.010*** 0.855
Number employed 253.3 300.2 276.5 0.012** 0.419 0.431
Ownership (percentage)
Domestic 29.0 45.3 26.3 0.004*** 0.739 0.034**
Foreign 43.9 34.0 52.6 0.088* 0.344 0.036**
Joint venture 26.9 20.5 21.0 0.209 0.463 0.948
Located in cluster(f) (%) 41.8 22.0 52.6 0.0003*** 0.237 0.0002***
Notes:(a) * indicates statistical significance at 10 per cent; ** at 5 per cent; *** at 1 per cent.(b) 1birr = 0.1USD as of 2008.(c) Adjusted for inflation (in 2007 birr) using the consumer price index (CPI), World Economic Outlook 2008, IMF.(d) The other payment schemes are on a daily or weekly basis.(e) The other category is temporary or seasonal workers.(f) The farms located in Welmera and Holeta are in the cluster.
despite the youthfulness of this industry. Thisindicates that labour turnover is not negligible in theindustry and knowledge diffusion and skilltransformation therefore may be enhanced (Sonobeand Otsuka, 2006).
The outsiders received substantially higher initialwages than workers in the other two groups, whichmay partly reflect the difference in educational level.This is consistent with Hypothesis 1. However, thewage rate of the locals and the relative/friend grouprapidly increased over a short time, and wage rate atthe time of the survey had almost reached the samelevel as that of the outsiders, at around 290 birr permonth, substantially higher than the average wagerate in the agricultural sector of 200 birr per month.According to the information-cost hypothesis apossible explanation behind these observations isthat workers in the local and relative/friend groupshave relatively low productivity, part of which maybe observable not to econometricians but toemployers, and the workers relied on the informalnetworks in job application as they were less able tofind jobs otherwise. During our survey, themanaging directors of the cut-flower farmsmentioned that the newly-employed workers whoundergo intensive training during the first month ortwo at work receive lower wages than the workerswho do not undergo this training. However,considering that the major tasks required for theproduction workers are quite simple, the wage curvewith respect to labour productivity is likely to benonlinear and soon hits the ceiling. The workerswith social ties are able to catch up with theoutsiders and climb up the wage curve after a fewmonths at the farm. Thus, outsiders recruitedformally eventually lose their wage premium.
We now turn our attention to the characteristics ofthe cut-flower farms. The farms when hiring thesesample workers had been operating for less thanone year. Furthermore, the farms initially hire locals(or the farms hiring locals tend to have beenoperating for the shortest time), and they employthe relative/friend workers and the outsiders afteroperating for a certain period, which is in line with
the finding from TABLE 2. The average length ofoperation as of 2007 was 2.4 years for farms owneddomestically, 1.8 years for foreign ownership and2.1 years for joint venture farms. Presumably, andpartly reflecting this difference in years of operation,farms owned by non-Ethiopians hired more oflocals (45 per cent of their employees) thandomestic owned farms (29 per cent) and jointventure farms (26 per cent).
More importantly, 53 per cent of the employees atthe farms located in the industrial clusters wereoutsiders, who have higher human capital (last rowin TABLE 3), whereas only 12 per cent of theworkers in the cut-flower industry as a whole wereoutsiders (last row in TABLE 2). The average yearsof schooling within the clusters is 7.86 years whilethe average outside the clusters is 7.11 years, and thedifference is statistically significant at 6 per cent.This suggests that the labour market within theclusters is more developed and attracts moreworkers with higher human capital than it doesoutside the clusters, and thus hiring high-qualityworkers through open recruitment can be a majoroption in employment, whereas the labour marketsmay not be as well developed outside the cluster,which is in line with Hypothesis 2.
Estimation strategy
We will estimate the initial monthly wage regressionmodel. The dependent variable is the natural log ofthe real initial monthly wage at hiring, t = 0, of aworker i at a farm k:
(1)
whereDL is the dummy variable indicatingwhether the employee acquired the job throughthe local network (DL = 1) or not (DL = 0), and,similarly, DRF is the dummy variable indicatingwhether the employee acquired the job throughan invitation from their relatives and friendsworking at the farm (DRF = 1) or not (DRF = 0).
The Global Development Agenda after the Great Recession of 2008-2009: Revisiting the Seoul Development Consensus 59
3. SESSION 2 – JOB CREATION AND GLOBAL DEVELOPMENT

The vector x consists of the variables described in
TABLE 3 that characterize a worker i at a farm k,while vector zk0 consists of the variables thatcharacterize a farm k. In particular, the vector ofthe dummy variables indicating the year of hiringwill capture the evolution of the labour marketover time. We will use the Ordinary LeastSquares (OLS) and the farm-level fixed-effectsmethod to estimate this regression function (1).Hypothesis 1 predicts that the estimatedcoefficients on the local network dummy DL andon the personal network dummy DRF will havenegative signs. Moreover, if Hypothesis 2 istrue, the estimated coefficient on the clusterdummy will be negative.
We next regress the current monthly wage on thesame set of explanatory variables as in regressionfunction (1) and examine particularly whichvariables persistently affect a worker’s earningsand which do not. As the current wage rate wasmeasured as of the end of 2007 for every worker,in the wage regression the hiring year dummiesindicate the cohort that each worker belongs toand therefore the length of their experience atthe farm after being hired. The productivityincrease from experience predicts a highercurrent wage rate of workers with longerworking experience at the farm, i.e., those whoare hired at the earlier point in time.Furthermore, as discussed above, we expect thatthe workers relying on social ties tend to lackbasic skills that can be learned relatively quicklythrough proper training and thuscatch up withthe outsiders. This catch-up process will result ina declining difference between outsiders and theworkers who relied on local and social networksin the current wage rate compared to thedifference in the initial wage rate.
Estimation results
The first two columns of TABLE 4 present the initialmonthly wage model, estimated by the OLS andFarm Fixed-effects (FE) method, respectively. Theoutside workers received significantly higher initialmonthly wages of 20 per cent more than theworkers recruited through the local network andpersonal relationships, which supports Hypothesis1. Note that we already control for the variablesindicating human capital characteristics, but thedummy variables for the locals and therelative/friend groups still have highly significantnegative coefficients. This finding is consistent withthe information-cost hypothesis, which predictslower initial wages for the workers who rely on thelocal or the personal networks as they tend to be lessproductive and less likely to find jobs elsewhere(Pistaferri, 1999; Antoninis, 2006). The estimatedcoefficients on our human capital variables stillindicate that older (“more experienced” in the broadsense), male, highly educated workers tend toreceive higher initial monthly wages. Being maleincreases the initial wage by 8 per cent,7 while anadditional year of age adds less than 1 per cent andan additional year of schooling adds around 1 percent. As for the farm’s characteristics, younger andforeign-owned farms tend to pay higher monthlywages. More importantly, the farms located outsidethe industrial clusters pay significantly highermonthly wages, which supports Hypothesis 2. Thesignificantly and increasingly positive coefficients onthe employment year dummy variables may suggestthat the labour demand has been increasing in thisrapidly growing industry, and the initial wage isincreasing over the years.
The estimated model of the current monthly wage ispresented in the third and fourth columns ofTABLE 4. The negative coefficients of the year ofhiring dummies in Column 3 indicate thatexperience at the farm matters for current wages.
60 The Global Development Agenda after the Great Recession of 2008-2009: Revisiting the Seoul Development Consensus
7 In an attempt to analyze further the male-female differences, we conducted all regression models separately for men and women. The results from the men’s and women’smodels are similar overall, and we suspect that we do not have enough observations to identify systematic differences in the models between men and women.

The Global Development Agenda after the Great Recession of 2008-2009: Revisiting the Seoul Development Consensus 61
3. SESSION 2 – JOB CREATION AND GLOBAL DEVELOPMENT
TABLE 4. DETERMINANTS OF INITIAL AND CURRENT WAGE RATES
Initial wage rate Current wage rate
OLS(1)
Farm FE(2)
OLS(3)
Farm FE(4)
Employment channels
Locals -0.190** -0.231*** 0.014 -0.068
(-2.22) (-3.99) (0.25) (-1.30)
Friends and relatives -0.189** -0.227*** 0.023 -0.039
(-2.09) (-3.48) (0.35) (-0.66)
Worker characteristics at hiring
Male dummy 0.096*** 0.090*** 0.195*** 0.200***
(2.85) (2.91) (6.24) (7.12)
Age 0.007*** 0.005* 0.003 0.002
(3.46) (1.72) (1.09) (0.93)
Years of schooling 0.009** 0.014*** 0.024*** 0.017***
(1.98) (3.00) (5.19) (4.00)
Years of experience in the industry 0.018 0.016 0.008 0.018
(0.85) (0.69) (0.44) (0.85)
Number of flower farms where he/ hasworked
0.031 -0.002 0.096** 0.031
(0.56) (-0.04) (2.06) (0.56)
Distance from home to the farm -0.00001 -0.002 0.005 -0.004
(-0.00) (-0.34) (0.64) (-0.68)
Farm characteristics at hiring
Years of operation -0.061*** 0.022 -0.060*** -0.040
(-2.71) (0.51) (-3.30) (-1.01)
Numbers employed 0.0001 0.00004 0.00004 -0.0001
(0.88) (0.12) (0.29) (-0.17)
Domestic ownership dummy -0.012 —- -0.055 —-
(-0.25) (-1.59)
Joint venture dummy -0.094* —- -0.047 —-
(-2.13) (-0.99)
Cluster dummy -0.082** —- -0.105*** —-
(-1.98) (-2.71)
Year of hiring (the default is 2004 or earlier)
2005 0.228*** 0.174** -0.026 0.056
(4.02) (3.33) (-0.47) (0.82)
2006 0.430*** 0.289*** -0.043 0.018
(8.09) (3.39) (-0.90) (0.23)
2007 0.679*** 0.492*** -0.107** -0.037
(9.23) (4.57) (-2.14) (-0.38)
Intercept 4.640*** 4.810*** 5.261*** 5.390***
(33.46) (28.91) (49.07) (35.79)
R-squared 0.479 0.328 0.345 0.282
Notes: The number of observations is 310, and the number of farms is 62. The dependent variables are in the log term.Robust t-statistics are in parenthesis. * indicates that the estimated coefficient is statistically significant at 10 per cent;** significant at 5 per cent; *** significant at 1 per cent. —- indicates that the corresponding variable has been droppedfrom the model.

In particular, although the corresponding effectestimated with the farm fixed effects is weak, thesignificantly negative coefficient of the year dummyfor 2007 estimated with OLS (Column 3) suggeststhat the workers employed in 2004 or before, whohave longer working experience at the farm, tend toreceive significantly higher wages currently than theworkers employed in 2007. More importantly, thestatistical significance of the effects of the local andthe relative/friend dummy variables disappears.Consistent with the descriptive analysis in TABLE 3and the discussion above, this result suggests thatthe monthly wage of the workers among the localsand the relative/friend groups increased at a higherrate than that of the outside workers. This findingthat even workers initially equipped with relativelylow human capital become capable of handlingmore difficult tasks over the years indicates thepotential role of this industry in alleviating povertyfor poor Ethiopian farmers.
The estimated effect of being male and receivinghigher education isgreater in magnitude on thecurrent monthly wage than on the initial monthlywage, which suggests that educated male workersare given more specialized tasks over the years thanfemale workers. The number of flower farms that aworker has worked at also has a significantlypositive effect on the monthly wage rate, accordingto the OLS estimate. More importantly, the farmslocated outside the industrial clusters still paysignificantly higher monthly wages than farmswithin the clusters, which supports Hypothesis 2,and this “premium” has increased from 8 per cent athiring to more than 10 per cent currently. We alsonotice that younger farms still tend to pay highermonthly wages.
Conclusion
Using the survey data of all 64 cut-flower farms inEthiopia as of 2007 and the 320 workers randomlysampled from these farms, we have examined theevolution of the employment channels and the earlydevelopment of the labour market for this youngindustry. We found that local and personalnetworks initially played an important role indisseminating information on employmentopportunities, and those recruited informally usingthese social ties were paid less than theformally-recruited workers at hiring. However, eventhese workers quickly increased their productivityand the effect of social ties on wages disappearedover time. Furthermore, the results of our statisticalanalyses consistently suggest that the developmentof the labour market took place above all theindustrial clusters, which supports the famousargument of Marshall on the advantage of suchclusters.
Our analysis has revealed the benefits of labourmarkets, which have started developingsuccessfully, particularly within industrial clusters. Informing an industrial policy, the Governmentshould take into account these labour marketsbenefits and the role that an industrial cluster canplay in the development of markets. Furthermore,the exceptional growth of the cut-flower industry inEthiopia may not have been achieved without theinitial strong support of the Government. Asmentioned earlier, however, the market for thisexport-oriented industry is highly demand-driven,which implies that the industry as a whole isvulnerable to a large demand shock in theinternational market. The Government should beprepared for such a risk. Our findings also confirmthe importance of education in job acquisition andearnings, and this should encourage further theGovernment’s efforts to improve the country’seducation system.
62 The Global Development Agenda after the Great Recession of 2008-2009: Revisiting the Seoul Development Consensus

References
Antoninis, Manos., 2006. “The wage effects fromthe use of personal contacts as hiring channels,inJournal of economic behavior and organization, No. 59,pp. 133-146.
Banerjee, A. and Munshi, K., 2000. “Network,migration and investment: Insiders and outsiders inTirupur’s production cluster”. Working paper No.00-08, Department of Economics, MassachusettsInstitute of Technology.
Banerjee, B., 1984. “Information flow, expectationsand job search: Rural-to-urban migration process inIndia. Journal of Development Economics, No. 15,pp. 292-311.
Ben-Porath, Y., 1980. “The F-connection: Families,friends and firms and the organization of exchange”.Population and Development Review, No. 6, pp. 1–30.
Binswanger, Hans P. and Mark R. Rosenzwerig,1986. “Behavioural and material determinants ofproduction relations in land- abundant tropicalagriculture”. Journal of Development Studies, Vol. 22,No. 3, pp. 503-540.
Carrington, W.J., Detragiache, E., Vishwanath, T.,1996. “Migration with endogenous moving costs”.American Economic Review No. 86, pp. 909–930.
Collier, P. and Garg, A., 1999. “On kin groups andwages in the Ghanaian labour market”. OxfordBulletin of Economics and Statistics No. 61, pp. 133–151.
Conley, T. and Udry, C., 2010.“Learning about a newtechnology: Pineapple in Ghana”. American EconomicReview, No. 100:1, pp. 35-69.
de Janvry, A., Sadoulet, E. and Fukui, S., 1997. “Themeaning of kinship in share-croppingcontracts”.American Journal of Agricultural EconomicsNo.79, pp. 394–406.
Embassy of Japan in Ethiopia., 2008. A series of studies onindustries in Ethiopia, at http://www.et.emb-japan.go.jp
Fafchamps, M., 2000.“Ethnicity and credit in Africanmanufacturing”. Journal of Development Economics,No.61, pp. 205–35.
Fafchamps, M. and Lund, S., 2003.“Risk sharingnetworks in rural Philippines”. Journal of DevelopmentEconomics, No.71, pp. 261–87.
Fafchamps, M. and Minten, B., 2002. “Returns tosocial network capital among traders”. OxfordEconomic Paper, No. 54, pp. 173-206.
Frijters, P., 1999. “Hiring on the basis of expectedproductivity in a South African clothing firm”.OxfordEconomic Papers, No. 51, pp. 345–354.
Global Development Solutions, 2006.Integrated valuechain analysis for the floriculture (rose) sector inEthiopia.Prepared for the Government of Ethiopiaand the World Bank.
Granovetter, M., 1974. Getting a job: A study of contactsand careers.Cambridge, MA, Harvard University Press.
Hayami, Yujiro, 2002. “Family farms and plantationsin tropical development”. Asian Development Review,Vol. 19, No. 2, pp. 67-89.
Holzer, H. J., 1988. “Search method use byunemployed youth”. Journal of Labor Economics, Vol. 6,No. 1, pp.1–20.
Holzer, H.J., 1996. What employers want: Job prospects forless-educated workers”. RussellSageFoundation,NewYork.
Jaffee, Steven and John Morton, 1995. MarketingAfrica’s high-value foods. Dubuque, Iowa,Kendall/Hunt Publishing Company
Kajisa, K., 2007. “Personal networks andnon-agricultural employment: The case of a farmingvillage in the Philippines”.Economic Development andCultural Change, Vol. 55, No. 4, pp. 669-707.
Kugler, A.D., 2003. “Employee referrals and efficiencywages”. Labour Economics,Vol. 10, pp. 531–556.
Luke, N. and Munshi, K., 2006. “New roles formarriage in urban Africa: Kinship networks and thelabormarket in Kenya”. Review of Economics andStatistics”. Vol. 88, No. 2, pp. 264-82.
The Global Development Agenda after the Great Recession of 2008-2009: Revisiting the Seoul Development Consensus 63
3. SESSION 2 – JOB CREATION AND GLOBAL DEVELOPMENT
Mano, Yukichi, Takashi Yamano, Aya Suzuki andTomoya Matsumoto, 2011.“Local and personalnetworks in employment and the development oflabormarkets: Evidence from the cut flowerIndustry in Ethiopia”. World Development, Vol. 39,No. 10, pp. 1691-1890.
Mano, Yukichi and Aya Suzuki, 2010.Agglomerationeconomies for industrial development: The case of theEthiopian cut flower industry. National GraduateInstitute for Policy Studies GCOE-WP No.43.
Mano, Yukichi and Aya Suzuki., 2011.Industrialdevelopment through takeovers and exits: The case of the cutflower exporters in Ethiopia. National GraduateInstitute for Policy Studies GCOE-WP No.46.
Marshall, A., 1920. Principles of economics. London,Palgrave Macmillan.
Milgrom, P. and Roverts, J., 1992. Economics,organization and management. Upper Saddle River,New Jersey, Princeton Hall.
Montgomery, J. D., 1991. “Social networks andlabormarket outcomes: Toward an economicanalysis”. American Economic Review, Vol. 81, No. 5,pp. 1408–18.
Mortensen, D. T. and Vishwanath, T., 1994.“Personal contacts and earnings” Labour Economics,No.1, pp. 187–201.
Munshi, K., 2003. “Networks in the moderneconomy: Mexican migrants in the U.S.labormarket” Quarterly Journal of Economics, Vol. 118,No. 2, PP. 549-97.
Otsuka, K., Estudillo, J. and Sawada, Y., 2009. Ruralpoverty and income dynamics in Asia and Africa. NewYork,Routledge.
Pissarides, Christopher A., 2000. Equilibriumunemployment theory. Cambridge, MIT Press.
Pistaferri, L., 1999. “Informal networks in theItalian labour market”. Giornaledegli Economisti eAnnali di Economia No. 58, pp. 355–375.
Putnam, R. D., 2000. Bowling alone. New York,Simon and Schuster.
Saloner, G., 1985. “Old boy networks as screeningmechanisms”. Journal of Labor Economics, Vol. 3,No. 3, pp. 255–67.
Salop, Steven C., 1979.“A model of the natural rateof unemployment”. American Economic Review,No. 69, pp. 17-25.
Schlicht, Ekkehart, 1978. “Labour turnover, wagestructure and natural unemployment”. Journal ofInstitutional and Theoretical Economics (Zeitschriftfür diegesamteStaatswissenschaft), Vol. 134, No. 2, pp. 337-364.
Simon, C. J. and Warner, J. T., 1992. “Matchmaker,matchmaker: The effect of old boy networks on jobmatchquality, earnings and tenure. Journal of LaborEconomics, Vol. 10, No. 3, pp. 306-30.
Sonobe, T. and Otsuka, K., 2006. Cluster-basedindustrial development: An East Asia model. PalgraveMacmillan, New York.
Sonobe, T. and Otsuka, K., 2010.Cluster-basedindustrial development: A comparative study of Asia andAfrica. Palgrave Macmillan, New York.
Stigler, George J., 1961. “The economics ofinformation”. Journal of Political Economy, Vol. 69,No. 5, pp. 213-25.
Stigler, George J., 1962. “Information in thelabormarket”. Journal of Political Economy, Vol. 70,No. 5, pp. 94-105.
Stiglitz, Joseph., 1987, “Causes and consequences ofdependence of quantity upon price”. Journal ofEconomic Literature, Vol. 25, No. 1, pp. 1-48.
Whitaker, M. and Kolavalli, S., 2006.“Floriculture inKenya”. Vandana Chandra (ed.), Technology, adoptionand exports: How some developing countries got it right.Washington, World Bank, 2006.
Yamauchi, F. and Tanabe, S., 2008. “Non—marketnetworks among migrants: Evidence frommetropolitan Bangkok, Thailand”. Journal ofPopulation Economics, No. 21, pp. 649-664.
64 The Global Development Agenda after the Great Recession of 2008-2009: Revisiting the Seoul Development Consensus

The Global Development Agenda after the Great Recession of 2008-2009: Revisiting the Seoul Development Consensus 65
4. PROCEEDINGS

Session 1: Revisiting the SeoulDevelopment Consensus
Seoul Development Consensus:Rationale, Current Status andFuture Prospects
Sangheon Lee (PROTECTION/TRAVAIL,ILO), commenting on the perspective produced byMr Jai-Joon Hur , paid tribute to the significantevolution of G20-level discussions, which had gonebeyond the earlier rationale of financial issues andtouched on employment and social issues as well asdevelopment issues. He wondered, however, whatkind of innovation had been achieved in Seoul interms of development, what impact it had made sofar and what unique contributions the G20 hadmade with respect to development, as it wasextremely difficult to understand the relationshipbetween the SDC and the subsequent meetings. Herecognized that the term “development” was notalways used consistently even though many of thedocuments presented dealt with “development-oriented” and “development-related” issues. Whileagreeing that the term “growth that benefits all”coined at the Berlin meeting in 1999 was a goodstarting point, he felt that it has not been madesufficiently clear how this understanding was to betranslated into specific policy measures.
What was unique in the Seoul DevelopmentConsensus was that it was largely based on Korea’sown experience. However, it was hard to see howKorea’s experience was reflected in the SDC assome of the pillars, such as trade andinfrastructure, were irrelevant to the Koreanexperience. Moreover, even though the SDCmight be different from the traditionaldevelopment paradigm as it rejected theone-size-fits-all approach, it was not likely to gobeyond the Washington Consensus. Furthermore,
inequality and growth needed to be tackled moreseriously.
Finally, from the ILO’s perspective, SDC did nothave a concrete linkage with the labour market.According to empirical evidence, the causalrelationship between growth and employment wasmuch weaker than previously thought, and yet theSDC was optimistic about the linkage betweenthem. Moreover, the SDC was not innovative as ittended to paraphrase the ILO’s standard languageregarding the combination of structural reformswith active, labour market policies and effectivelabour institutions that provide incentives forincreasing formal and quality jobs.
Questions and comments on themorning session
John Kirton (University of Toronto) explainedthat, despite several attempts to raise health issues atpast meetings, a substantive discussion had not beenpossible at Cannes as the agenda had focused onfinancial transactions. However, Mexico and theRussian Federation were fully aware of the need todiscuss the health issues, includingnon-communicable diseases, and it was likely thatthey would be dealt with at the Mexico summitwhere the outcome could have a major impact onhuman survival.
José Manuel Salazar-Xirinachs (ExecutiveDirector, Employment Sector, ILO) noted that,though there had been labour market challengesbefore the crisis and during the crisis, it was crucialto have good social policies and good jobs.Moreover, since growth and job creation had
66 The Global Development Agenda after the Great Recession of 2008-2009: Revisiting the Seoul Development Consensus

already been discussed, it was necessary to takeemployment into consideration in the developmentagenda. Setting up a working group on employmentwithin the framework of the G20 would help tobuild a strong framework for the developmentagenda.
John Kirton (University of Toronto) acknowledgedthat it was not possible for every expert to be heardon every issue, but it should be possible for thesocial policy issue (including growth and jobcreations as well as employment) if it were discussedalong with other key elements such as migration andhealth. He suggested that if that issue could bemainstreamed among young entrepreneurs at theBusiness 20 level, it would be feasible to create morejobs and to find more creative ways of creating themin many sectors.
Mariangels Fortuny (EMP/POLICY, ILO)observed that the main achievement of the SeoulDevelopment Consensus was to establish that “onesize does not fit all”. She wondered, however, whatcould be expected from the next summit in Mexicoas there had not been much follow-up on the newdevelopment paradigm at the Cannes Summit.
Mr Kirton (University of Toronto) noted that,while it was not clear what precise impact the SDChad had, a reliable assessment mechanism wasavailable for purposes of G20 governance. Eventhough it was a self-grading system, theDevelopment Working Group would monitor itsprogress. At the same time, in order to enhanceaccountability and to develop multilateralcooperation, an evaluation of the civil societyimpact was needed to reduce the existingaccountability gap.
Iyanatul Islam (EMP/POLICY, ILO), reflectingon the morning session, raised the issue of
inequality. In the light of the Euro-Zone crisis, highunemployment had also become a serious problemin advanced countries, and he therefore urged thatmissing issue be included in the nine pillars of theSDC.
Jai-Joon Hur (Korea Labour Institute)pointed out that the G20 was not the onlyimportant actor for solving development issues,though it had started discussing them moreprofessionally than ever. In addition, ifdeveloping countries could begin by buildingtheir capacity to do something for their owndevelopment, G20 member countries and otheradvanced countries could definitely help them toachieve their goal. In that regard, the SDC was aturning point in a new development paradigm.Because of the unstable financial conditionsbetween 2009 and 2010, the Euro Zone wasfacing difficulties which made the developmentinitiatives more dependent on the G20 meetingsin France and Mexico. As the MexicanGovernment was likely to be supportive of theSDC, one could expect there to be furtherdiscussion on the subject.
Sangheon Lee (PROTECTION/TRAVAIL,ILO) suggested that sharpening its focus wouldhelp the G20 to move forward effectively. It wouldmake a real difference if the G20 countries were tomake their unique and separate contributions tothe development issue. As to the question ofinequality, the term needed to be defined carefully,as there could sometimes be positive forms ofinequality such as work incentives. Since reducinginequality was a core issue for the ChineseGovernment, all the successful developingcountries among the G20 members should focuson the issue in one way or the other. That could bea good point for future discussion on thedevelopment agenda.
The Global Development Agenda after the Great Recession of 2008-2009: Revisiting the Seoul Development Consensus 67
4. PROCEEDINGS

Session 2: Job Creation and GlobalDevelopment
The Role of the Services Sectoras a Major Vehicle for JobCreation
David Kucera (INTEGRATION, ILO)presented the relative contribution ofmanufacturing and services to aggregate labourproductivity growth across countries and regionsand over time, together with the three views ofservices in development policy: services as asubstitute for manufacturing; services as a laggingcomplement of manufacturing; and services as aleading complement of manufacturing. Comparingthe two periods between 1985 and 1998 andbetween 1999 and 2008, it was clear that thecontribution of industry and services to aggregatelabour productivity growth in China and Indiadiffered widely, although the overall importance ofmanufacturing would seem to have increased overtime. At the regional level, the importance ofmanufacturing over time also held across regionsand in fast-growing Asia and slow-growing LatinAmerica and the Caribbean, though there were bigdifferences in the growth of both manufacturingand services, both sectors played a significant role inindustry’s contribution to aggregate labourproductivity growth. Moreover, according to studiesby N. Loayza and C. Radditz, the agriculture andmanufacturing sectors were more associated withpoverty reduction than services.
Mr Kucera agreed that services could serve as asubstitute for manufacturing, inasmuch as theglobalization of services could, like industrialization,provide alternative opportunities for developingcountries, where they could specialize, scale up andachieve robust growth. He suggested that it was
better to focus on both manufacturing and services,as far as countries’ own capacities and circumstancespermitted. According to the traditional structuralistview, however, the size and competitiveness of acountry’s manufacturing base was still the mostimportant determinant of its prosperity. Most of themore dynamic elements of the services sector weredependent on the manufacturing sector as a laggingcomplement. Finally, he pointed out that servicescould be understood as a leading complement tomanufacturing. In the area of InformationTechnology (IT) in India, in particular, it seemedthat services were conducive to the expansion ofmanufacturing, rather than the other way round,which meant that India’s IT services sector was alsoa tool for upgrading its manufacturing andagricultural sectors.
Questions and comments on therole of the services sector as amajor vehicle for job creation
Jai-Joon Hur (Korea Labour Institute)wondered whether tourism and education,including the education of students abroad, werealso considered among India’s service exports. Hesuggested that the development of the servicessector in India was not a substitute formanufacturing, as manufacturing was in turnboosted by the development of the services sector.
Makiko Matsumoto (EMP/POLICY, ILO)wanted to hear more about the Mr Ghani’ssuggestion that if India could do expand its servicessector to reduce poverty, so too could any other
68 The Global Development Agenda after the Great Recession of 2008-2009: Revisiting the Seoul Development Consensus

country. What were the ingredients to developingthe services sector as well as reducing poverty thatIndia’s experience could point to?
Iyanatul Islam (EMP/POLICY, ILO) asked MrGhani to explain how his message was related toAfrica.
Ejaz Ghani (World Bank) responded by pointingout that evidence was needed as to whether or notservices sector was stagnating. Services in India wereeither a substitute or a complement, and such aspecific issue could not be generalized. India, with arelatively small manufacturing sector, was growingas fast as China. The issue was not whether India’sgrowth strategy was better than China’s, but thatthere were alternative paths to growth. He stressedthat China would be facing an exceptional challengein deciding how to redirect growth to differentsectors, especially towards the services sector so asto make it as dynamic as the manufacturing sector.That would enable the country to promote abroad-based, sustainable growth while addressingglobal imbalances. Similarly, India had a verysuccessful services sector, but it realized that thefruits of modernization had so far been shared byonly a small section of the population. More than 60per cent of Indians still worked in agriculture, andone million more people would be joining thelabour force every month for the next two decades,which meant that India would need to develop itsmanufacturing sector as well as infrastructure,education and trade.
Overall, the growth of global trade in services wasmuch greater than in goods. New opportunitieswere arising, and African countries could wellbenefit from the globalization of services. However,the services sector was more skill-intensive than themanufacturing sector, and an important lessonlearnt from India was that human skills wereessential, especially in a telecommunications sectorwith a well-established infrastructure.
Meeting the Job CreationChallenge in Africa
Paul Cook (McKinsey & Company) stressedthat, as its GDP growth showed, Africa wasexperiencing unprecedented economic growth andthere were still huge opportunities. A large share ofAfrica’s GDP growth had been driven by a rapidlygrowing workforce, as the population in Africa wasgrowing. That being so, economic growth was set tocontinue for decades to come. African educationlevels were rising rapidly, too, driven by bettereducated new entrants. The level of people withsecondary education in Africa was in factapproaching that of India. Improving the quality ofeducation was not itself the issue, but raising thelevel of education was a good sign as it broughtpeople into the economy. In addition, theunemployment rate in Africa as a whole, by theILO’s definition, was fairly low, even lower than inthe United States, and was still falling. Across thecontinent it had not even gone up much during therecent economic and financial crisis, except in somecountries – notably in North Africa and SouthAfrica.
Even though it was starting from a very poor base,Africa’s growth appeared to be reducing povertyand improving people’s general welfare. Afterdecades of decline, per capita GDP and GDPgrowth were rising, and that partly explained thefalling poverty rates. In addition, the humandevelopment index showed that education, healthand income were also heading in the right direction,while inequality too seemed to have been fallingover the past decade. Some argued that thecontinent was just catching up on the loss ofopportunities that it had suffered during the pastfew decades, but it was nonetheless exciting to seethat trends in the majority of African countries wereencouraging at last. That said, 2011 had been one ofthe most tumultuous year in Africa’s recent history.There were three sources of frustration that led tosocial upheaval from the economists’ standpoint.Firstly, because of the recent inflation of food
The Global Development Agenda after the Great Recession of 2008-2009: Revisiting the Seoul Development Consensus 69
4. PROCEEDINGS

prices, the poorest 20 per cent of the populationspent around 82 per cent of their income on food.Secondly, although the existence of educated butunemployed population showed that access toeducation was widely open, there remained a seriousproblem of access to jobs. Thirdly, since much ofthe work available was in the form ofself-employment, even though people might havejobs they thought of themselves as unemployedbecause they did not receive a regular wage.
Looking at the labour market in Africa, the demandfor labour was mostly in agricultural sector, with allthat implied of vulnerability and non-wageemployment. The second biggest source ofemployment was the retail trade and hospitality jobs,a sector that had been growing quickly over the pastdecade and where a fair amount of stableemployment could be found. The government andsocial services sector were also major employers,and the most stable. According to research,however, GDP growth in Africa did not necessarilylead to growth in the availability of jobs, as someAfrican economies were still highly dependent onresources; though Algeria, Angola and Nigeria, forexample, are major exporters, their economies reliedvery heavily on oil.
The developed countries of Africa needed to worrymore about unemployment than about vulnerableemployment, as their economies have diversifiedinto a number of different sectors. On the otherhand, countries in the pre-transition process, such asEthiopia, were hugely dominated by the agriculturalsector and therefore by vulnerable and unstableemployment. In other words, even if thosecountries doubled or tripled the number of stablejobs in the next few years, which would be anextraordinary performance, it would still not haveany real impact on the bulk of the population.Looking at each of Africa’s employment sectorsseparately, they were seen to be at different stages ofgrowth. Some countries could even point topatterns that were similar to those of the Republic ofKorea. Mr Cook therefore suggested that if, for
example, South Africa and Ethiopia wanted tofollow the Korean model, they needed to focus onspecific time periods.
Mr Cook believed that there was definite potentialin Africa, as the decline in its rate of vulnerableemployment in recent years had been faster than theglobal average. Furthermore, different sectors had adifferent potential, and the best performing sectorsin petroleum-exporting countries in Africa, forinstance, could provide stable employment for 15per cent of their workers by 2020 – though thatwould of course depend on diversification of theeconomy. Based on the experience of the bestperformers, the sectors with job creation potentialwould differ from country to country. Theconclusion, therefore, was that Africa could indeedaccelerate the rate of stable job creation, but that thenew jobs would be created in different sectors indifferent countries.
Finally, Mr Cook emphasized three importantlessons regarding the sources of stable jobs: (1) thesectors that drove the GDP did not necessarily alsocreate the jobs; (2) the structure of the workforce inAfrican countries differed by industry and by levelof vulnerability, and country case studies must onlybe considered that were comparable; (3) success inreducing the level of vulnerable employment couldbe accelerated dramatically by matching thebest-performing sectors. It was important thatAfrica balanced labour demand and supply. The factthat there was a shortage of tertiary education whilethere was huge surplus of secondary school-leaverswas responsible for a high level of vulnerableemployment and unemployment, though the leveldiffered from one country to another. Nevertheless,African companies agreed that education was notthe principal obstacle to recruitment so much as theshortage of work experience and technical skills. Solong as work-relevant education and practical workexperience were there, the corresponding potentialto reduce vulnerability and unemployment rates inAfrica would be there, too.
70 The Global Development Agenda after the Great Recession of 2008-2009: Revisiting the Seoul Development Consensus

Lawrence Egulu (INTEGRATION, ILO)agreed that Africa was experiencing unprecedentedeconomic growth, but he wondered whether thegrowth was strong, sustainable and balanced,given the source of that growth. The truth wasthat Africa’s economic growth was externallydriven and relied on the exportation of primarycommodities. The African economies wereconsequently very vulnerable to exogenous priceshocks, and sustainable recovery in Africatherefore depended on recovery in the EuropeanUnion and in North America. It was difficult toestablish any direct linkage between GDP growthand the size of the workforce, as it was not theworkforce per se that drove growth, particularly inAfrica where it was greatly underutilized. Giventhe vulnerabilities of African economies, the sizeof their informal sectors and the shortage ofdecent work opportunities, the word“unemployment” could mask a lot ofundercurrents that needed to be clarified anddealt with individually.
It was well known that Africa’s economic growthfailed to have any meaningful impact on people’sgeneral wellbeing because of the phenomenon ofjobless growth without development. The pointmade by Paul Cook that Africa’s growth appearedto be improving the population’s welfare thereforecalled for careful appraisal. Also,country-by-country evidence was needed todemonstrate that the claim was true.
Finally, Mr Egulu commented on the idea that afalling dependency ratio could not be equated with a“demographic dividend”. Although Africa was the“youngest” continent to be experiencing a “youthbulge”, vulnerable employment and informalitywere still on the increase and child labour and earlyschool drop-out levels (and the number of educatedbut unemployed youths) were unacceptably high.
Questions and comments onmeeting the job creationchallenge in Africa
Ejaz Ghani (World Bank) wondered whether MrCook’s recommendation was balanced, as hebelieved infrastructure was more important thaneducation. He stressed the importance of balancinginfrastructure and education. Further explanationwas also required for the concept of “stage ofdevelopment by category”.
Sangheon Lee (PROTECTION/TRAVAIL,ILO) noted that economic growth in Africa mighthave been underestimated, as the number ofhouseholds without wage was also increasing.Furthermore, as unemployment in general wasincreasing, it was urgent for African countries todiversify their economies.
Jai-Joon Hur (Korea Labour Institute) waspositive about Africa’s economic growth (eventhough it was jobless growth) because severalempirical works showed that it could be a goodstarting point. In the late 70s and 80s, there had beenjobless growth in Europe. There was therefore noneed to be pessimistic about Africa’s economicgrowth, as a growth rate of around 2 or 3 per centwas normal when seen in the long term.
The data comparing Africa with the Republic ofKorea seemed promising, but none of the indicatorsin Korea’s case was apparent in African countries.Furthermore, it was not appropriate to mix NorthAfrican and Arab countries, which had completelydifferent outcomes from southern Africancountries.
Paul Cook (McKinsey & Company) noted thatKenya’s economic growth was promising, with theretail trade, telecommunications and mobiletelephones accounting for 24 per cent of thecountry’s GDP. Most foreign direct investmentduring the past three years had been in Africa, whichmeant that there were more opportunities for
The Global Development Agenda after the Great Recession of 2008-2009: Revisiting the Seoul Development Consensus 71
4. PROCEEDINGS

economic growth and development. He agreed thatthere were differences between North Africa andsub-Saharan Africa and that access to the educationwas relatively easier than in sub-Saharan Africa.Moreover, infrastructure in some countries was ahuge issue, whereas skills were more important atthe pan-African level.
Promotion of Non-traditionalAgricultural Exports and theirEmployment Consequences:Case of the Cut Flower Industryin Ethiopia
Frédéric Lapeyre (EMP/POLICY, ILO) saidthat Mr Mano had provided a solid account of locallabour market mechanisms and challenges relatedto the fast-growing cut-flower industry in Ethiopia.The strongest aspect of his paper was that thesurvey data gave a better understanding ofemployment channels and of the role oflocal/personal networks in obtaining a job in thecut-flower industry and of the impact it had oninitial wages. However, providing a better profileof the outsiders was needed, as it could be thattheir higher initial wage was linked to the fact thatthey needed to move in or commute to the farmand to the cost of transportation andaccommodation.
The analysis needed to be broadened from a purelydevelopmental perspective and to show whether anEast-Asian style of industrialization strategy couldbe readily replicated in African conditions within areasonable time-frame, especially for relativelysmall, low-income, land-locked countries. However,even though the employment challenge for Africancountries was rooted in their inability to diversifytheir economy and to promote productiveemployment for a fast-growing labour force, thecase study presented by Mr Mano reminded onethat the agricultural sector should not be neglectedas a source of job-rich growth and that a much
needed-debate was due on the nature of structuraltransformation in Africa. From a job-rich growthperspective, what was important in the expansion ofthe cut-flower industry was its positive impact onjob creation, and more especially on paidemployment. Indeed, though it entailed highstart-up costs, the cut-flower industry involvedlabour-intensive processes at the planting,harvesting and post-harvesting stages that called forrelatively simple skills. Therefore, in principle, theexpansion of cut-flower exports should enhance thedemand for unskilled labour.
He concluded that the development of thecut-flower industry had led to a significant change inthe labour market structure, with an increase inwage employment which was a key variable infighting vulnerability and poverty in Ethiopia. Whileself-employment played a key role in securing alivelihood for vast numbers of workers in the shortterm, any long-term strategy to promote betterliving and working conditions for people shouldfocus on the development of wage employment.
Questions and comments on thepromotion of non-traditionalagricultural exports and theiremployment consequences:Case of the cut flower industryin Ethiopia
Duncan Campbell (ED/EMP, ILO) asked forthe word “outsiders” to be defined as they seemedto be more local workers than outsiders. Theunderlying question was whether Mr Mano’sstudies went into some of the sectoral policiesdirected towards the growth of the sector inEthiopia, as he was interested in knowing in detailwhich policy instruments worked best and whichworked least. He also wanted to know why MrMano was so sure that productivity drove the trendin wages as it could have been the learning effect orsomething else.
72 The Global Development Agenda after the Great Recession of 2008-2009: Revisiting the Seoul Development Consensus
Ejaz Ghani (World Bank) suggested that it wouldhave been better if Mr Mano had includedregion/district characteristics in the same way as hehad considered labour and farm characteristics. Forexample, how far was the farm located from theairport? If one was located in a region with biggerlabour market or high technology, it would probablyhave an impact on wage trends. He also drewattention to the age of the firms, as new firmstended to create more jobs in more innovative ways.
Naoko Otobe (EMP/POLICY, ILO),commenting on the wage premium of outsiders,wondered whether local and “outside” workersperformed different tasks, in the same way that awage gap existed between men and women in thecut-flower industry.
Iyanatul Islam (EMP/POLICY, ILO) askedabout the role of the Government in the cut-flowerindustry in Ethiopia that Mr Mano had mentioned.Mindful of the air pollution and difficultenvironmental circumstances in Kenya, he also
asked about the sustainability of the industry. Lastly,he enquired about the gender balance and whetherthe wages of workers were above the poverty line.
Yukichi Mano (National Graduate Institute forPolicy Studies, Japan) explained that “outsiders”did not mean that they were living outside the farmsbut that they had been employed through a formalplacement process. He also pointed out that thecut-flower industry in Ethiopia was similar to theindustry in more advanced countries such as theNetherlands, as opposed to the East Asian modelthat focused on manufacturing and exports.
As to the learning process of workers in Ethiopia’scut-flower industry, it was the supervisors whodecided how much the employees could work. Ifnecessary, workers undertook one or two monthsof training at lower pay, which could explaindifferences in wages at the beginning. Outsiders, onthe other hand, did not need additional training astheir education level was usually higher and theyalready knew how to do the job.
The Global Development Agenda after the Great Recession of 2008-2009: Revisiting the Seoul Development Consensus 73
4. PROCEEDINGS


Governmentof Republic of Korea
The Global Development Agenda after the Great Recession of 2008-2009
Employment Policy Department
Revisiting the Seoul Development Consensus
Governmentof Republic of Korea
The Global Development Agenda after the Great Recession of 2008-2009
Employment Policy Department
Revisiting the Seoul Development Consensus
Papers and Proceedings of a ConferenceILO, Geneva, 21 November 2011
9 789221 256076
ISBN 978-92-2-125607-6