On flow variability in the Bosphorus Strait
18
REPORT DOCUMENTATION PAGE Form Approved OMB No. 0704-0188 The public reporting burden for this collection of information ts estimated to average 1 hour per response, including the time for reviewing instructions, searching existing data sources, gathering and maintaining the data needed, and completing and reviewing the collection of information. Send comments regarding this burden estimate or any other aspect of this collection of information, including suggestions for reducing the burden, to the Department of Defense, Executive Services and Communications Directorate (0704 0188). Respondents should be aware that notwithstanding any other provision of law, no person shall be subject to any penalty for failing to comply with a collection of information if it does not display a currently valid OMB control number PLEASE DO NOT RETURN YOUR FORM TO THE ABOVE ORGANIZATION. REPORT DATE (DDMM-YYYY) 09-01-20II 2. REPORT TYPE Journal Article 3. DATES COVERED (From To! 4. TITLE AND SUBTITLE On Flow Variability in the Bosphorus Strait 5a. CONTRACT NUMBER 5b. GRANT NUMBER 5c. PROGRAM ELEMENT NUMBER 0601 153N 6. AUTHOR(S) Ewa Jarosz, William J. Teague, Jeffrey W. Book and Sukru Besiktepe 5d. PROJECT NUMBER 5e. TASK NUMBER 5f. WORK UNIT NUMBER 73-9441-00-5 7. PERFORMING ORGANIZATION NAME(S) AND ADDRESS(ES) Naval Research Laboratory Oceanography Division Stennis Space Center, MS 39529-5004 8. PERFORMING ORGANIZATION REPORT NUMBER NRL/JA/7330--10-0044 9. SPONSORING/MONITORING AGENCY NAME(S) AND ADDRESS(ES) Office of Naval Research One Liberty Center 875 North Randolph Street, Suite 1425 Arlington, VA 22203-1995 10. SPONSOR/MONITOR'S ACRONYM(S) ONR 11. SPONSOR/MONITOR'S REPORT NUMBER(S) 12. DISTRIBUTION/AVAILABILITY STATEMENT Approved for public release, distribution is unlimited. 13. SUPPLEMENTARY NOTES 2o\ \UW(7-/7 14. ABSTRACT Two bottom-mounted acoustic Doppler current profilers and a vertical string of temperature, conductivity, and pressure sensors were deployed at each end of the Bosphorus Strait in September 2008 and remained in place for over 5 months. These observations showed a two-layer structure of the exchange flow in the Bosphorus Strait with brackish waters originating in the Black Sea moving southward and more saline, denser waters from the Sea of Marmara flowing northward. Considerable differences in mean flow, current fluctuations, and layer thickness were also found. In the northern Bosphorus, the current variations were more pronounced in the lower layer than in the upper layer. The opposite situation was observed in the southern Bosphorus where the upper layer currents fluctuated more noticeably. The near-surface currents often exceeded 200 cm/s in the southern section and were generally below 30 cm/s in the northern section. Currents usually below 70 cm/s were observed in the lower layer in the southern part of the strait, while the lower layer outflow to the Black Sea in the northern part of the strait frequently reached 100 cm/s, with flow concentrated in a strong midlayer maximum core. The upper layer thickness displayed temporal variability and, on average, was about 39 m near its northern end and about 14 m near its southern end. Flow variability was found to be closely associated with variability of the bottom pressure difference and the atmospheric forcing on the synoptic time scale (2 -10 days). 15. SUBJECT TERMS bosphorus,atmospheric forcing,bottom pressure,stratification 16. SECURITY CLASSIFICATION OF: a. REPORT Unclassified b. ABSTRACT Unclassified c. THIS PAGE Unclassified 17. LIMITATION OF ABSTRACT uu 18. NUMBER OF PAGES 19a. NAME OF RESPONSIBLE PERSON Ewa Jarosz 19b. TELEPHONE NUMBER tlnclude area code) 228-688-4292 Standard Form 298 (Rev 8/98) Prescribed by ANSI Std Z39.18
Transcript of On flow variability in the Bosphorus Strait

REPORT DOCUMENTATION PAGE Form Approved OMB No. 0704-0188
The public reporting burden for this collection of information ts estimated to average 1 hour per response, including the time for reviewing instructions, searching existing data sources, gathering and maintaining the data needed, and completing and reviewing the collection of information. Send comments regarding this burden estimate or any other aspect of this collection of information, including suggestions for reducing the burden, to the Department of Defense, Executive Services and Communications Directorate (0704 0188). Respondents should be aware that notwithstanding any other provision of law, no person shall be subject to any penalty for failing to comply with a collection of information if it does not display a currently valid OMB control number
PLEASE DO NOT RETURN YOUR FORM TO THE ABOVE ORGANIZATION.
REPORT DATE (DDMM-YYYY)
09-01-20II 2. REPORT TYPE
Journal Article 3. DATES COVERED (From To!
4. TITLE AND SUBTITLE
On Flow Variability in the Bosphorus Strait
5a. CONTRACT NUMBER
5b. GRANT NUMBER
5c. PROGRAM ELEMENT NUMBER
0601 153N
6. AUTHOR(S)
Ewa Jarosz, William J. Teague, Jeffrey W. Book and Sukru Besiktepe 5d. PROJECT NUMBER
5e. TASK NUMBER
5f. WORK UNIT NUMBER
73-9441-00-5
7. PERFORMING ORGANIZATION NAME(S) AND ADDRESS(ES)
Naval Research Laboratory Oceanography Division Stennis Space Center, MS 39529-5004
8. PERFORMING ORGANIZATION REPORT NUMBER
NRL/JA/7330--10-0044
9. SPONSORING/MONITORING AGENCY NAME(S) AND ADDRESS(ES)
Office of Naval Research One Liberty Center 875 North Randolph Street, Suite 1425 Arlington, VA 22203-1995
10. SPONSOR/MONITOR'S ACRONYM(S)
ONR
11. SPONSOR/MONITOR'S REPORT NUMBER(S)
12. DISTRIBUTION/AVAILABILITY STATEMENT
Approved for public release, distribution is unlimited.
13. SUPPLEMENTARY NOTES 2o\ \UW(7-/7
14. ABSTRACT Two bottom-mounted acoustic Doppler current profilers and a vertical string of temperature, conductivity, and pressure sensors were deployed at each end of the Bosphorus Strait in September 2008 and remained in place for over 5 months. These observations showed a two-layer structure of the exchange flow in the Bosphorus Strait with brackish waters originating in the Black Sea moving southward and more saline, denser waters from the Sea of Marmara flowing northward. Considerable differences in mean flow, current fluctuations, and layer thickness were also found. In the northern Bosphorus, the current variations were more pronounced in the lower layer than in the upper layer. The opposite situation was observed in the southern Bosphorus where the upper layer currents fluctuated more noticeably. The near-surface currents often exceeded 200 cm/s in the southern section and were generally below 30 cm/s in the northern section. Currents usually below 70 cm/s were observed in the lower layer in the southern part of the strait, while the lower layer outflow to the Black Sea in the northern part of the strait frequently reached 100 cm/s, with flow concentrated in a strong midlayer maximum core. The upper layer thickness displayed temporal variability and, on average, was about 39 m near its northern end and about 14 m near its southern end. Flow variability was found to be closely associated with variability of the bottom pressure difference and the atmospheric forcing on the synoptic time scale (2 -10 days).
15. SUBJECT TERMS
bosphorus,atmospheric forcing,bottom pressure,stratification
16. SECURITY CLASSIFICATION OF:
a. REPORT
Unclassified
b. ABSTRACT
Unclassified
c. THIS PAGE
Unclassified
17. LIMITATION OF ABSTRACT
uu
18. NUMBER OF PAGES
19a. NAME OF RESPONSIBLE PERSON Ewa Jarosz
19b. TELEPHONE NUMBER tlnclude area code)
228-688-4292
Standard Form 298 (Rev 8/98) Prescribed by ANSI Std Z39.18

JOURNAL OF GEOPHYSICAL RESEARCH, VOL. 116, C08038, doi: 10.1029/2010JC0O6861. 2011
On flow variability in the Bosphorus Strait
Ewa Jarosz,1 William J. Teague,' Jeffrey W. Book,' and $ukrii Besiktepe2
Received 3 December 2010; revised 20 May 2011; accepted 2 June 2011; published 27 August 2011.
[I] Two bottom-mounted acoustic Doppler current profilers and a vertical string of temperature, conductivity, and pressure sensors were deployed at each end of the Bosphorus Strait in September 2008 and remained in place for over 5 months. These observations showed a two-layer structure of the exchange flow in the Bosphorus Strait with brackish waters originating in the Black Sea moving southward and more saline, denser waters from the Sea of Marmara flowing northward. Considerable differences in mean flow, current fluctuations, and layer thickness were also found. In the northern Bosphorus, the current variations were more pronounced in the lower layer than in the upper layer. The opposite situation was observed in the southern Bosphorus where the upper layer currents fluctuated more noticeably. The near-surface currents often exceeded 200 cm/s in the southern section and were generally below 30 cm/s in the northern section. Currents usually below 70 cm/s were observed in the lower layer in the southern part of the strait, while the lower layer outflow to the Black Sea in the northern part of the strait frequently reached 100 cm/s, with flow concentrated in a strong midlayer maximum core. The upper layer thickness displayed temporal variability and, on average, was about 39 m near its northern end and about 14 m near its southern end. Flow variability was found to be closely associated with variability of the bottom pressure difference and the atmospheric forcing on the synoptic time scale (2-10 days).
Citation: Jarosz, E., W. J. Teague, J. W. Book, and S. Bc$iktepe (2011), On flow variability in the Bosphoms Strait, J. Geophys. Res., 116, C08038, doi:10.1029/2010JC006861.
1. Introduction
[2] The Bosphorus Strait is a part of the Turkish Straits System (TSS), which also includes the Sea of Marmara and the Dardanelles Strait (Figure 1). The Bosphorus Strait connects the Black Sea to the Sea of Marmara and is the only conduit between the Black Sea and the Marmara, Aegean, and Mediterranean Seas. Consequently, it plays a paramount role in water mass exchange and highly impacts ecology in the adjacent seas. This strait is also a major trade artery in the world with an average of 132 ship transits per day [Akten, 2003]. Hence, understanding of the flow dynamics in the Bosphorus is essential and appealing not only to marine scientists but also to local governmental managers for ensuring safe navigation in the region.
[3] The current structure in the Bosphorus Strait is an example of a two-layer exchange flow that is characterized by brackish waters originating in the Black Sea moving southward and more saline, denser waters from the Sea of Marmara flowing northward [Onliiata et al, 1990; Ozsoy et al, 1998; Gregg and Ozsoy, 2002]. The Bosphorus Strait is about 30 km long and runs approximately in a north-south direction. The strait is narrow, with a width varying between
'Naval Research Laboratory, Stennis Space Center, Mississippi, USA. JNATO Undersea Research Center, La Spezia. Italy.
Copyright 2011 by the American Geophysical Union. 0148-0227/11/2010JC006861
0.6 km and 3.0 km, and is rather shallow, with depths between 28 m and 110m. There is a constriction region in the interior of the strait, one sill south of the constriction, and another sill near the Black Sea exit of the strait. Rapid changes in the channel shape, depth, and width, the two sills, and the constriction make the geometry of the strait very complex and highly influence its current and thcrmo- haline characteristics. Because of these characteristics, the flow is more complex than a basic two-layer exchange flow and has flow separation zones, rccirculation regions, and eddies. There is still an ongoing discussion on whether the exchange flow is a primary example of a two-layer hydraulically controlled exchange. Historical observations along with past and recent modeling studies [Onliiata el al., 1990; Oguz et al, 1990; Oguz, 2005] have suggested that the exchange in the strait is a "maximal exchange" [Farmer and Armi, 1986] due to the hydraulic control exerted at the northern sill and the constriction or at both northern and southern sills and the constriction. Other studies of the Bosphorus Strait dynamics, however, have indicated that the exchange flow is rather quasi-steady and is far from satis- fying hydraulic control conditions for a two-layer flow [Gregg et al, 1999]. Based on current and hydrographic observations, Gregg and Ozsoy [2002] have concluded that the exchange flow may be partly controlled by friction. In addition, the flow in the Bosphorus Strait is also modified by atmospheric forcing resulting in flow blockages and reversals [Onliiata el al, 1990; Ozsoy el al, 1998; Yukseletal, 2008].
C08038 1 of 17

C08038
41.8N
41 .ON
40.SN
JAROSZ ET AL.: ON FLOW VARIABILITY IN THE BOSPHORUS C08038
(a)
41.30N
41.25N
41.20N
41.15N
41.10N
41.05N
26.SE
Bosphorus Strait
27.0E
Black Sea
29.5E
S
30 OE
Black Sea
30.5E
T«4" *m
Northern Bosphorus
(d)
41.00N
40.95N
40.90NJ Sea of Marmara
Southern Bosphorus
T«3
; -
2890E 28.95E 29.0OE 29.05E 29.10E 29.15E 29.20E
Sea of Marmara
2S.MC ».MC lf.01E MOM
Figure 1. Maps of (a) the Turkish Straits System, (b) the Bosphorus Strait, (c) the Black Sea mooring section, and (d) the Marmara mooring section. Depth contours (in meters; see color bar), Barny moorings (red triangles), TC moorings (blue dots), and meteorological stations (black pluses) are also shown. F, Florya; K, Kirecburnu; K.U, Kumkoy; and S, Sile.
[4] In this paper, recent concurrent observations of current, Bosphorus Strait. The paper is organized as follows: section 2 temperature, salinity, bottom pressure, winds, and atmo- describes the deployment, instrumentation, and measure- spheric pressure are analyzed to investigate flow variability ments. Section 3 briefly discusses the meteorological setting, in detail, and the impact of the atmospheric forcing and Variability of the bottom pressure and stratification in the bottom pressure on the flow in the northern and southern northern and southern Bosphorus Strait arc described in
2 of 17

('08(138 JAROSZ ET AL.: ON FLOW VARIABILITY IN THE BOSPHORUS C08038
Table 1. Mooring Summary
Water Depth Range or Depth Instrument Depth*
Mooring Latitude Longitude (m) Start Date End Date (m)
Barny Moorings M5 41°0.423' 28°59.516' 53.4 1 Sep 2008 4 Feb 2009 6.3-50.3 M<5 41°0.411' 28°59.853' 26.9 1 Sep 2008 4 Feb 2009 3.7-26.2 \\: 41°13.454' 29°7.807' 77.8 2 Sep 2008 4 Feb 2009 8.3-73.3 M 41°13.334' 29°7.970' 66.4
TC Moorings
2 Sep 2008 5 Feb 2009 6.3-42.3
TC3: 41 "0.354' 28°59.538' 57 2 Sep 2008 4 Feb 2009 AT31" 55.4 MC31C 54.0 MC32 50.3
TC4: 41°13.384' 29°7.768' 77 2 Sep 2008 4 Feb 2009 AT41 63.5 MC41 57.0 MC42 46.6 MC43 29.9 MC44 24.1
"Depth range, the depth range over which ADCP data were collected (M5-M8); instrument depth, the depth for Aqua Troll and MicroCAT instruments. bAT, Aqua Troll Instruments. CMC, MicroCAT Instruments.
sections 4 and 5, respectively. Observed currents arc analyzed in section 6. Section 7 summarizes the findings.
2. Instrumentation and Observations
[s] The United States Naval Research Laboratory (NRL) and the North Atlantic Treaty Organization (NATO) Undersea Research Center (NURC) in collaboration with the Turkish Navy Office of Navigation, Hydrography, and Oceanography deployed two mooring sections in the Bosphorus Strait (at the Black Sea and Sea of Marmara entrances) from the R/V Alliance (a NATO-NURC research vessel) as a part of TSS08 (NURC project) and "Exchange Processes in Ocean Straits" (EPOS, NRL project) programs in September 2008 (Figure 1 and Table 1). Each section was configured with two trawl-resistant bottom-mounted Barny moorings (called a "Barny" because its shape resembles a barnacle) [Perkins et al., 2009] and one line mooring (temperature-conductivity (TC) mooring). At each end of the strait, a Barny mooring and a TC mooring were deployed in the deep channel, and another Bamy mooring was deployed nearby in the shallower eastern side of the channel. The section near the Sea of Marmara was located to the south of the constriction and the southern sill, and the section near the Black Sea was located to the south of the northern sill.
[6] Each Barny mooring contained the following instru- mentation: an upward looking Doppler current profiler (ADCP), wave-tide gauge (Sea-Bird Electronics 26), and conductivity (Sea-Bird Electronics 4) sensor. Except for mooring M6, which was equipped with a 600 kHz RD Instruments ADCP; all others were outfitted with 300 kHz RD Instruments ADCPs. The ADCP heads with 20° beam angles to the vertical were set about 0.5 m above the bottom and recorded current profiles at 1 m (300 kHz ADCP) or at 0.5 m (600 kHz ADCP) vertical resolution every 15 min. Line moorings were equipped with seven and six tempera- ture, conductivity, and pressure sensors in the Black Sea
section and in the Marmara section, respectively. The sensors were Sea-Bird Electronics MicroCATs 37 and In Situ Aqua Trolls, and they recorded data at 15 min intervals.
[7] All moorings were recovered at the beginning of February 2009. Full time series were returned from the Barny moorings. Unfortunately, both line moorings were damaged during the observational period. Consequently, three sensors were lost (one in the Black Sea section and two in the Marmara section) and two instruments were flooded (one in each section); hence, data return from the TC moorings was limited. Additionally, Aqua Troll con- ductivity sensors failed; thus only temperature and pressure observations were available from these instruments. Table 1 lists only the instruments recovered in February 2009 which returned high-quality observations.
[8] For the majority of the analyses here, high-frequency fluctuations (mostly tidal fluctuations) were eliminated from the data by applying a low-pass filter with a 40 h cutoff frequency. Tides and their dynamics in the TSS will be described in a separate paper. Additionally, the current observations were rotated 90° and 50° counterclockwise from east along the Marmara (southern Bosphorus) and Black Sea (northern Bosphorus) sections, respectively, to align with along- and across-strait coordinate axes. Positive along-strait (u) values are approximately directed northward along the Marmara section and northeastward along the Black Sea section, while negative u values are directed southward along the Marmara section and approximately southwestward along the Black Sea section. Positive cross- strait (v) values are generally directed westward along the Marmara section and northwestward along the Black Sea section.
[9] Concurrent meteorological observations collected at Turkish land stations located inside and near the Bosphorus Strait were also analyzed. Data from the following stations were used: Florya (F), Kirccburnu (K), Kumkoy (KU), and Sile (S) (Figure 1). The analyzed data were hourly mca-
3 of 17

C08038 JAROSZ ET AL.: ON FLOW VARIABILITY IN THE BOSPHORUS C08038
'^^>^^
~i 1 1 1 1 1 1 1 1 1 1 1 1 1 1—-i 1 r 09/02 09/09 09/16 09/23 09/30 10/07 10/14 10/21 10/28 11AM 11(11 11/11 11/25 12/02 12AM 12/16 12/23 12/30 01AM 01/13 01/20 01/27 02/03
Figure 2. (a) Atmospheric pressure (hPa) at the sea level from Florya (F), Kumkoy (KU), Kirecburnu (K), and Sile (S); (b) east-west wind component (m/s); and (c) north-south wind component (m/s) at 10 m from Florya and Kumkoy. Winds are plotted using the oceanographic convention, and north and east wind components are positive.
surcments of atmospheric pressure, air temperature, wind speed, and wind direction.
3. Meteorological Setting
[IO] The TSS region is highly impacted by cyclones. Passage of these systems over the TSS is more frequent between October and April than between May and September when northerly winds are dominant [Alpar and Yiice, 1998]. Past research has indicated that cyclones move along 3-4 main paths [Trewartha, 1968; Karaca et al, 2000]. All cyclones originate west, northwest, or southwest of Turkey and can impact either the entire TSS region or only a part of this region. They usually affect the TSS for 3-10 days, and they often bring sustained winds of about 9 m/s with gusts as high as 35 m/s [Unluata et al, 1990].
[n] Figure 2 displays winds plotted using the oceano- graphic convention and atmospheric pressure observations from Florya and Kumkoy, and additional atmospheric pressure observations from Kirecburnu and Sile (see Figure 1 for locations of the meteorological stations). Our deploy- ment between September 2008 and February 2009 covered mostly months that are historically characterized by the frequent passages of cyclones. Consequently, as expected, there were several storms that impacted the TSS region during the observational period. The most pronounced storm occurred around 20 November 2008 and affected the entire TSS region with the atmospheric pressure dropping to about 984 hPa and winds exceeding 10 m/s. However, there was also an ample number of days in September and October with persistent northeasterly winds that more typically occur during the warm summer months. The spectrum of the wind components (Figures 3a and 3b, red and blue lines) esti-
mated from the data covering the deployment period shows a concentration of energy in the low-frequency synoptic band (approximately between 0.08 and 0.4 cycles per day (cpd)). Enhanced synoptic band energy is also present in the atmospheric pressure spectrum estimated from the mea- surements collected at Kumkoy and Florya (Figures 3a and 3b, green line).
[12] Observations of the atmospheric pressure recorded at four different locations are almost identical (Figure 2a). Hence, the pressure. field was very coherent over the Bosphorus Strait, especially for frequencies lower than 0.6 cpd with the coherence squared being over 0.96 among the con- sidered locations. The winds measured at the meteorological stations were less correlated (Figures 2b and 2c) than the atmospheric pressure over the region. This is clear from Figure 2 and confirmed by a coherence squared analysis. For instance, using the winds from Florya and Kumkoy, the coherence squared at low frequencies (between 0.064 cpd and 0.6 cpd) varied between 0.62 and 0.31 and between 0.91 and 0.50 for the east-west and north-south wind components, respectively (the coherence squared here is statistically sig- nificant when it is larger than 0.22 here).
4. Bottom Pressure Variability
[13] Bottom pressure measurements collected at the Barny moorings allowed an evaluation of pressure variations along the Marmara and Black Sea sections, specifically, the measured bottom pressure variations that arc defined as follows:
Pb = PAlm + pogrf + g p'dz J H
(1)
4 of 17

C'08038 JAROSZ ET AL.: ON FLOW VARIABILITY IN THE BOSPHORUS C08038
_| 1
•
(M i • • ml i *
Me PC Fu
PC:F« PC:F*n
- -^"^ ^/*
(«)
r=>x"" V^TKj
Frequency (f; cpd) 10'
Frequency (f; cpd)
Figure 3. Variance preserving spectra for (a) the bottom pressure (BP) at M7 in the Black Sea section, atmospheric pressure (KUatm), along-strait (KUu) and cross-strait (KUv) wind components recorded at Kumkoy and (b) the bottom pressure at M5 in the Marmara section, atmospheric pressure (Farm), along- strait (Fu), and cross-strait (Fv) wind components recorded at Florya; the 95% confidence interval is also shown. Multiple coherence (MC, black lines) and partial coherence (PC, color lines) between the bottom pressure measured at (c) M7 and (d) M5 and the along-strait (red line) wind component, the across-strait (blue line) wind component, and the atmospheric pressure (green line); the 95% significance level for the coherence is depicted by a dashed line. Frequencies are in cycles per day (cpd).
where p\,m is the atmospheric pressure, rf is the water level, p' is the density, g is gravitational acceleration, p0 is the reference density, and H is the total depth. The primes indicate that the time means were removed, and all pressure and pressure differences discussed hereafter are from such pressure anomalies. Figure 4 displays the time series of the 40 h low-passed bottom pressure at both sections and the time series of the bottom pressure differences (BPD) between the southern and northern Bosphorus. Fluctuations of the bottom pressure at the moorings deployed in the same section were almost identical, and, as expected, very coherent (for both sections, coherence squared is larger than 0.94 for frequencies less than 0.6 cpd). Along the Black Sea section in the northern Bosphorus the bottom pressure varied between -5.5 kPa and 2.4 kPa, while, at the same time, the bottom pressure fluctuated between -2.3 kPa and 2.3 kPa in the southern Bosphorus.
[14] The bottom pressure fluctuations, however, differed between the two sections and were only marginally coherent (coherence squared is less than 0.4 and statistically insig- nificant for frequencies less than 0.25 cpd). As a result, along-strait bottom pressure differences varied significantly and could reach values as high as 5.2 kPa (Figure 4c). A large difference occurred on 22 November 2008 when the bottom pressure in the northern Bosphorus dropped as low as -5.4 kPa. This behavior of the pressure was caused by southwesterly winds and a large atmospheric pressure drop associated with a moving cyclone (Figure 2). There were other instances when the fluctuations were out of phase, and
those were mostly created by large weather systems moving over the TSS region; however, the generated bottom pres- sure difference was usually less than 3.0 kPa. Overall, dif- ferences between the Marmara and Black Sea sections were frequently ±1.5 kPa or less.
[is] There were also instances when an across-strait bot- tom pressure difference was observed (Figures 4a and 4b). This difference reached larger values along the northern Bosphorus section (for example, over 1.0 kPa with a maxi- mum of 1.3 kPa for over a day beginning 31 December 2008). Along this section, differences varied between -1.3 kPa and 0.3 kPa, while differences fluctuated between -0.4 kPa and 0.6 kPa in the southern Bosphorus section. Larger values of across-strait bottom pressure differences were associated with passages of strong storms (for example, 22 November 2008) over the region. In general, the difference was 0.2 kPa or less.
[16] Multiple and partial coherences were employed to evaluate the contribution of the atmospheric forcing to the total bottom pressure anomalies along both sections. Atmospheric pressure is a component of measured bottom pressure. If the water level responds as a perfect inverted barometer then its direct contribution will be canceled, and atmospheric pressure variations will be uncorrelatcd with bottom pressure and have no dynamical effect. Wind forcing can affect both of the latter terms in equation (1) by piling up the water and by causing upwelling or downwclling of isopycnals. Coherence results are shown in Figures 3c and 3d. Observations of the local wind and the atmospheric pressure
5 of 17
C08038 JAROSZ ET AL.: ON FLOW VARIABILITY IN THE BOSPHORUS C08038
J i i i i i i i i i i i i i_
wvxyT
i i i =n i i i i i i i i i M3
i i i i i i —r
~~i 1 1 1 1 1 1 1 1 1 1 1 r 1 1 1 1 1 1 1-
09/02 09/09 09/18 09/23 09/30 10/07 10/14 10/21 10/29 11/04 11/11 11/18 11/28 12/02 12/09 12/16 12723 12/30 01/06 01/13 01/20 01/27 02/03
Figure 4. Bottom pressure (kPa; 40 h low-passed demeaned data) in (a) the northern (moorings M7 and M8) and (b) southern Bosphorus Strait (moorings M5 and M6) and (c) bottom pressure difference between moorings M5 and M7 (kPa).
from Florya and Kumkoy were used in the analyses in the southern and northern Bosphorus, respectively.
[17] For the Black Sea section, the multiple coherence (Figure 3c), which gives an overall influence of atmospheric forcing on bottom pressure, is significant and generally ranges between 0.40 and 0.77. Partial coherence results indicate that the direct effect of the local wind played only a significant role for bottom pressure in the frequency band between 0.34 and 0.55 cpd (approximately 2-3 day periods). The atmospheric pressure had a significant impact on the bottom pressure variability along the northern Bosphorus section, indicating departures from an inverted barometer response and the ability for atmospheric pressure variations
to directly drive barotropic flows. This is in agreement with the findings for frequencies above 0.1 cpd by Ducet et al. [1999] who analyzed the sea level derived from TOPEX/ POSEIDON data near the northern end of the Bosphorus Strait.
[is] Atmospheric forcing also greatly influenced the bot- tom pressure along the Marmara section and indicates the lack of a strong inverted barometer effect there as well. The multiple coherence results imply that the atmospheric forcing accounted for between 56% and 76% of the bottom pressure variance for frequencies between 0.1 cpd and 0.6 cpd in this section (Figure 3d). The partial coherence results indicate that the pressure fluctuations were primarily coherent with
09/02 09/09 09/1S 09/23 09/30 10/07 10/14 10/21 10726 11704 11/11 11/18 11/26 12702 12709 12/16 12723 12730 01/06 01/13 01720 01/27 02703
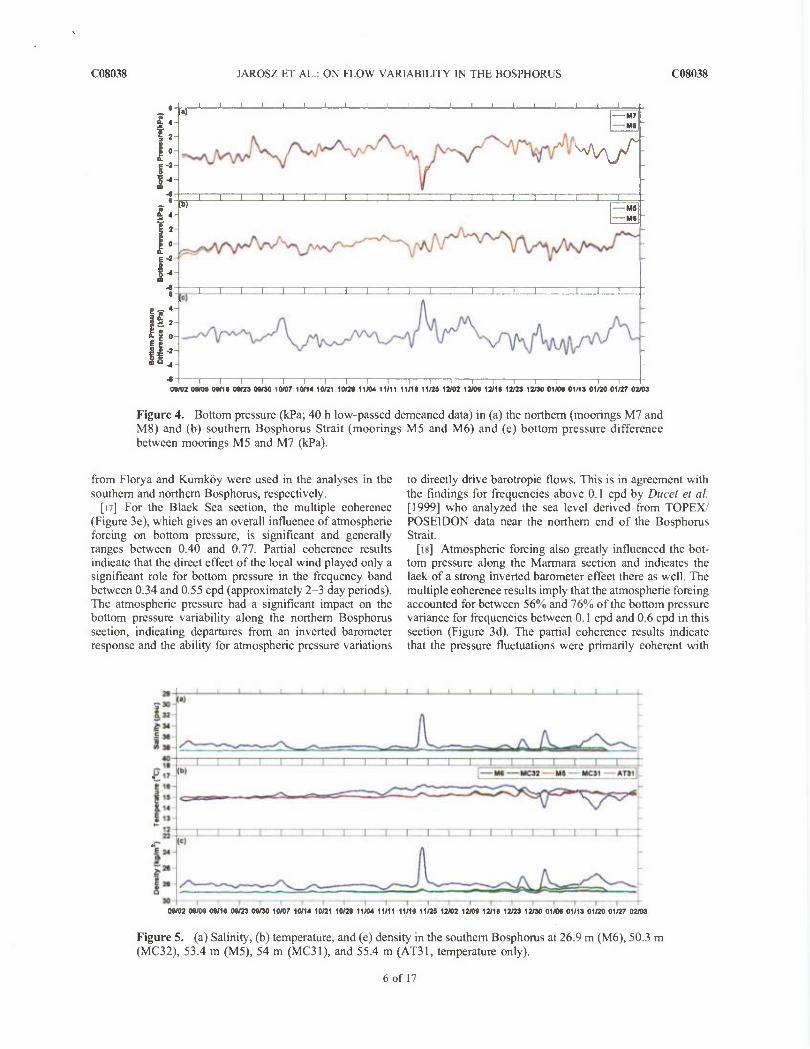
Figure 5. (a) Salinity, (b) temperature, and (c) density in the southern Bosphorus at 26.9 m (M6), 50.3 m (MC32), 53.4 m (M5), 54 m (MC31), and 55.4 m (AT31, temperature only).
6 of 17

C08038 JAROSZ ET AL.: ON FLOW VARIABILITY IN THE BOSPHORUS C08038
-i 1 1 1 1 1 ; 1 i 1 1 1 1 1 1 i i 1 1 1 r ! 09/OS 09(16 09/23 09/30 10/07 10/14 10/21 10/2* 11/04 11/11 11/18 11/25 12/02 12/09 12/16 12/23 12/30 01/06 01/13 01/20 01/27 02703
Figure 6. (a) Salinity, (b) temperature, and (c) density in the northern Bosphorus at 24.1 m (MC44), 29.9 m (MC43), 46.6 m (MC42), 57 m (MC41), 63.5 m (AT41, temperature only), 66.4 m (M8), and 77.8 m (M7).
atmospheric pressure and secondarily, for the frequencies less than 0.30 cpd (periods larger than 3 days), with the wind measured at Florya, especially with its across-strait com- ponent. The importance of the local wind as a forcing for the water level variations near the southern Bosphorus was also pointed out by Yiice and Alpar [1997]. Additionally, the drop in atmospheric pressure partial coherence for both sections at about 0.38 cpd is suggestive of a frequency selective inverted barometer resonance and indeed a sim- plified calculation of the Bosphorus-Marmara Sea system as a Hclmholtz oscillator (neglecting the Dardanelles Strait and treating the Black Sea as a reservoir) predicts resonance at 2.31 days (0.43 cpd). However, more analysis of this affect is needed before definitive conclusions can be drawn.
5. Stratification
[19] Observations of salinity, a key tracer of the water masses in the Bosphorus Strait, are somewhat limited in the Marmara section due to damage to the TC3 mooring. These data and the current observations, however, allow an esti- mation of thicknesses of the brackish water outflow and the more saline, denser water inflow along the southern end of the strait. Figure 5 shows salinity, temperature, and density measured in the deep channel (M5 at 53 m; TC3 at 50 m and 54 m) and at the side of the channel (M6 at 27 m) in the southern Bosphorus Strait.
[20] Salinity at M6 was measured by a sensor mounted near the bottom, but the shallow depth of this site also happened to place these measurements near or occasionally in the interface separating the brackish waters of the upper layer from the more saline waters of the lower layer in the southern Bosphorus. Salinity there was generally 37 psu or higher and therefore, the lower layer persistently extended high enough to reach this site. However, there were instances when salinity decreased (even below 32 psu) probably due to strong mixing that accompanied the reversal of the upper
layer (for instance, around 22 November 2008) and/or the deepening of the upper layer itself (at the end of December 2008). In the deep channel, the waters had nearly constant salinity and density with record long means of 38.66 psu (root-mcan-square error, RMS = 0.04 psu) and 28.9 kg/m (RMS = 0.06 kg/m3), respectively. The temperature in the lower layer in the Marmara section ranged from 14.83°C to 15.67°C with a mean of 15.14°C (RMS = 0.11°C) in the channel (all observations were taken below 50 m). Together these data clearly show that there was a continuous inflow of saline waters from the Sea of Marmara, and that the upper layer never extended as deep as 27 m in the southern Bosphorus.
[21] Salinity, temperature, and density observations from the line mooring (TC4) and two Bamys (M7 and M8) deployed in the northern part of the strait are displayed in Figure 6. These observations resolved both layers relatively well. In the upper layer, salinity displayed limited variability and was generally low with a record mean of 18.04 psu (RMS = 0.15 psu). The lowest salinity in the upper layer occurred in January 2009 when it dropped below 17 psu. Salinity higher than 21 psu was infrequently observed between September 2008 and December 2008. The tem- perature time series (Figure 6b) of the upper layer (MC43 at 30 m and MC44 at 24 m) reflected seasonal changes, with the highest temperature (23.7°C at 24 m) in September 2008 and the lowest temperature (7.5°C at 24 m) in January 2009 and February 2009 in response to surface heating or cooling. In September and October 2008, the temperature measure- ments collected between 24 m and 46 m also indicated an intermittent presence of a Cold Intermediate Water layer (temperature below 11°C). Past studies have indicated that these cold waters are partially formed in the strait in winter and partially formed on the northwestern shelf of the Black Sea and then advected to the strait [Unliiala et a/., 1990; Oguz and Be$iktepe, 1999]. Historical observations show that the cold water is well distinguished from the wanner
7 of 17

C08038 JAROSZ ET AL.: ON FLOW VARIABILITY IN THE BOSPHORUS C08038
waters above and below in late spring and summer when the surface waters warm up to and above 24°C and the lower layer is nearly isothermal with temperatures between 15°C and 16°C in the Bosphorus Strait. As a result of temperature and salinity variability, the density (ag) in the upper layer varied between 11 kg/m3 and 13.5 kg/m3 with a mean of 13 kg/m3 (RMS = 0.15 kg/m3) in the Black Sea section. At times, the upper layer density was even larger and these anomalies were associated with strong mixing events, for instance, the event beginning around 20 November 2008 (Figure 6c).
[22] Simultaneously, the average salinity in the lower layer was 35.97 psu (RMS = 0.39 psu), and on occasions, it rose above 38 psu in the northern Bosphorus. The high salinity values were mainly recorded by the sensor at M7 that was located about 0.20 m above the bottom. Such high values in the northern Bosphorus were not reported by previous studies [see, e.g., Ozsoy et al., 2001]. The con- ductivity sensor at M7 was calibrated and tested to be stable before the deployment but it was not calibrated after the recovery. Both conductivity (not shown) and estimated salinity at M7 (Figure 6a) show almost identical variations as conductivity and salinity variations displayed by the sensors at M8 and MicroCat 41 (MC41) indicating reli- ability of M7 measurements. However, more near-bottom salinity observations in the future are required to actually verify the presence of such high-salinity waters in the northern Bosphorus Strait.
[23] A comparison of the mean salinity at both sections indicates that the lower layer freshened by about 1 psu when it was flowing northward. Temperature observations col- lected below the 63 m depth level (AT41, M8, and M7) ranged from 15°C to 16°C with a record mean of 15.2°C (RMS = 0.36°C), and showed relatively little variability. Exceptions to this were during vigorous mixing events such as on 6 October 2008 and 29 December 2008. Additionally, when concurrent temperature observations in the lower layer arc compared between the sections it is apparent that the waters in the lower layer also reacted to the heating/cooling cycle of the surface layer. From September 2008 to the beginning of the December 2008, the lower layer warmed up (an average difference of 0.48°C), while it cooled down after 5 December 2008 (a temperature difference was gen- erally about -0.5°C but it could reach -3.23°C) when tra- versing the strait from south to north due to mixing with the upper layer waters.
6. Currents
[24] Figures 7 and 8 display time scries of currents recorded along the Black Sea and Marmara sections (across-strait components for M6 and M8 moorings are not shown but are similar to those at M5 and M7 moorings). Figures 7 and 8 show 40 h low-passed rotated data. At both locations, the observations clearly show a two-layer structure of the exchange flow in the Bosphorus Strait with the upper layer flow directed approximately southward and the lower layer flow moving in the opposite direction. In general, the depth of the zero isotach, which separates the oppositely flowing currents in this strait, varied along both ends of the strait. In the northern Bosphorus, the record mean depth of the zero isotach was about 39 m and 38 m at moorings M7 and M8,
respectively, while in the southern part of the strait (Figure 8), it was 13.5 m at mooring M5 and 14.5 m at mooring M6. It is also apparent that the currents in both layers are polarized in the along-strait direction (Figures 7, 8, and 9 and Table 2); that is, the along-strait velocity components are much more energetic than the across-strait components as one expects to observe in the majority of ocean straits.
[25] Along the Black Sea section, the upper layer trans- porting brackish waters was rather thick between September 2008 and February 2009 (Figure 7). Based on the salinity observations (Figure 6), the upper layer usually extended to at least 30 m below the surface and was also vertically homogeneous with salinity less than 20 psu. The mean flow in this layer was rather weak and fairly uniform with along-strait speeds varying between 15 cm/s and 20 cm/s depending on depth (Figure 9 and Table 2) and with a layer-averaged mean of 15.4 cm/s (RMS = 1.7 cm/s/ At times, however, the flow exceeded 30 cm/s. These higher velocities often occurred when the bottom pressure increased (Figure 4a) along the section as a result of strong northeasterly-northwesterly winds over this region (Figures 2 and 10a). During the deployment period, the flow in the upper layer was blocked occasionally. The velocity observations also indicated that the flow twice completely reversed its direction for about a day each time (Figures 7 and 10). One reversal was asso- ciated with persistent winds from the southern quadrant (1-7 October 2008), and another occurred during strong south-southwesterly winds (20-22 November 2008). Both reversals were also associated with a drop in the bottom pressure along the northern Bosphorus section (Figure 4a).
[26] Between September 2008 and February 2009, salty waters (salinity of 36 psu or higher) had almost a permanent presence in the northern Bosphorus (Figure 6). They were mainly observed below 55 m, and the layer-averaged speed of this outflow to the Black Sea was 40 cm/s with an RMS error of 7.4 cm/s. On occasions, the along-strait velocities of this outflow increased above 80 cm/s, or were reduced below 10 cm/s. Additionally, the flow was blocked and even reversed between 27 December 2008 and 14 January 2009 (Figures 7 and 11 b). The longest reversal with a near-bottom southward speed that reached 19.5 cm/s was observed between 28 December 2008 and 1 January 2009. During this event, strong mixing or/and entrainment of the brackish waters into the lower layer also occurred as indicated by the salinity which dropped to about 18 psu as deep as 66 m below the surface (Figure 6). The current measurements in the Black Sea section also indicate the presence of a very ener- getic jet-like northward flow with a core at 50 m depth and a mean speed of 82.5 cm/s (Figures 7 and 9) that was located in the halocline (20-25 m thick). At times, when the upper layer flow was reduced, blocked, or reversed, the velocities at the core increased to 150 cm/s. Those events always coincided with enhanced mixing, i.e., decreased salinity in the lower layer and increased salinity in the lower part of the upper layer (Figure 6). In general, flow fluctuations in the lower layer were more pronounced than those observed in the upper layer in the northern Bosphorus.
[27] In the southern Bosphorus, the along-strait velocities in the upper layer displayed a great deal of variability throughout the deployment period. The layer mean velocity was 84.5 cm/s (RMS = 21.9 cm/s), with a maximum velocity above 230 cm/s (Figure 9 and Table 2). The upper
8 of 17

C08038 JAROSZ ET AL.: ON FLOW VARIABILITY IN THE BOSPHORUS C08038
I I I I ULI I 1 I I I LUULJ I I I I LiULlW ULBl I I L
"i 1 1 1 r w/02 OWM OHM osras oano 10/07 10/14 10/21 ion* H/M 11/11 11/it 11ns 12/02 12/w 12/u 12ns 12/3* 01/oe 01/11 01/20 01/27 02/03
Figure 7. Currents in the northern Bosphorus (40 h low-passed data): along-strait components at (a) M7 and (b) M8 and (c) cross-strait component at M7; ULR and LLR stand for upper layer and lower layer reversals, respectively.
layer flow reversed several times (Figures 8 and 10a). Blockages and reversals of the outflow usually occurred when the bottom pressure rose along the Marmara section, and the BPD between the Sea of Marmara and the Black Sea became positive (Figures 4c and 11 a). These events lasted briefly, i.e., for about 12 h (for instance, the event on 13 September 2008), or they could persist for as much as 5.5 days (the event between 4 and 9 December 2008). During some reversals, northward speeds near the surface often exceeded 50 cm/s. At the same time, the lower layer inflow of the more saline, denser waters to the Bosphorus Strait was a permanent feature at both mooring locations
(Figures 8 and 1 lb). The flow speeds were also less variable than those recorded in the upper layer. That is especially evident in the deep-channel mooring (M5) where the layer mean along-strait velocity was 64.3 cm/s (RMS = 3.3 cm/s) and recorded current speeds varied generally between 40 cm/s and 80 cm/s (Figure 8 and Table 2). The higher velocities in the lower layer usually occurred during the blockages and the reversals of the upper layer flow. Additionally, the currents in the lower layer never reversed or stopped, even at the shallow water mooring (M6). There were, however, instances when the inflow of the dense waters from the Sea of Marmara diminished at mooring M6. For instance, during an event
08/02 08/08 08/16 08/23 08/30 10/07 10/14 10/21 10/28 11/04 11/11 11/U 11/25 12/02 12/08 12/16 12/23 12/30 01/09 01/13 01/20 01/27 02/03
Figure 8. Currents in the southern Bosphorus (40 h low-passed data): along-strait components at (a) M5 and (b) M6 and (c) cross-strait component at M5; ULR stands for an upper layer reversal.
9 of 17

C08038 JAROSZ ET AL.: ON FLOW VARIABILITY IN THE BOSPHORUS (08038
Velocity Components (cmlt| Velocity Components (cmM)
•4Q -ao f * «° *p w f ijo -yo -140 -1» -loo ->o -oo -40 -ao o ao 40 60 80 100
Figure 9. Profiles of the record means at (a) the Black Sea section (along-strait component M7, red thick line; along-strait component M8, green thick line; across-strait component M7, blue thick line; and across-strait component M8, magenta thick line) and (b) the Marmara section (along-strait component M5, red thick line; along-strait component M6, green thick line; across-strait component M5, blue thick line; across-strait component M6, magenta thick line). Thin dotted lines are 95% confidence intervals of the respective means.
on 28 December 2008, currents were reduced to speeds less than 15 cm/s, and simultaneously, the brackish out- flow from the strait deepened approximately to 24.7 m and sped up to 230 cm/s.
[28] It is very apparent from the meteorological and cur- rent observations that the flow in the Bosphorus Strait,
especially in the upper layer, was often substantially impacted by atmospheric forcing (Figure 10). Strong storms (for example, the storm beginning around 19 November 2008; Figure 10) blocked and reversed the flow in the upper layer along both sections. The data also indicate that the currents responded to the southward (negative) along-strait
Table 2. Current Statistics"
Depth Umean uad UOT um» um„ V v mean vsul vOT Vmax v ¥ mm
Mooring (m) (cm/s) (cm/s) (cm/s) (cm/s) (cm/s) (cm/s) (cm/s) (cm/s) (cm/s) (cm/s)
M5 6.3 -90.9 73.6 22.8 118.4 -231.7 -1.7 4.6 0.8 15.2 -19.2 M5 10.3 -41.8 61.1 19.1 119.5 -217.5 2.4 6.7 1 0 15.9 -14.9 MS 13.3 -3.4 44.7 14.1 120.1 -172.2 6.7 6.4 1.0 21.8 -16.5 MS 20.3 54.5 15.8 4.1 118.8 -38.2 1.4 4.7 0.7 16.6 -12.4 MS 40.3 64.9 8.3 3.0 105.5 41.7 -2.8 2.1 0.7 3.9 -8.4 M6 3.7 -98.2 67.4 21.0 113.8 -229.1 -10.5 7.5 1.4 14.7 -26.7 M6 10.2 -48.2 62.4 19.4 114.6 -223.1 -2.8 10.7 2.9 14.6 -32.8 M6 15.2 7.2 42.2 13.3 111.5 -169.1 7.9 7.1 1.6 21.2 -31.2 M(> 22.2 49.4 14.6 4.7 108.8 -46.2 -3.0 3.4 0.4 14.3 -17.7 M7 8.3 -15.9 7.6 1.6 9.8 -43.6 -3.2 4.3 0.4 9.0 -24.7 M7 10.3 -16.3 7.3 1.6 8.6 -43.1 -2.2 4.0 0.7. 5.2 -19.9 M7 20.3 -15.9 74 2.5 24.8 -43.0 -1.9 J.8 0.3 15.9 -20.5 M7 39.3 0.4 30.1 5.8 142.2 -42.6 -0.3 4.5 0.7 10.9 -17.8 M7 50.3 82.5 42.9 14.0 207.5 -41.8 1.2 5.0 1.0 14.6 -12.7 M7 60.3 38.8 20.0 6.7 181.9 -39.6 0.8 2.9 0.5 6.0 -12.4 MX 6.3 -16.9 8.6 l.X 14.9 -41.7 -0.9 3.8 0.3 8.6 -14.9 MX 10.3 -17.2 8.3 1.7 14.0 -44.3 -0.9 .V? 0.3 6.7 -16.9 MX 20.3 -16.5 9.4 1.9 44.1 -44.1 -0.7 3.0 0.2 10.6 -12.5 MX 38.3 1.9 34.9 6.8 154.6 -44.4 1.8 4 ^ 0.3 17.7 -11.9 MX 49.3 63.3 37.6 11.9 166.9 -44.7 -1.4 4.8 0.4 10.8 -13.5 M8 60.3 49.8 24.6 8.0 132.6 -42.0 0.4 1.6 0.3 9.0 -8.8
"Shown are means UInean and Vmea„, standard deviations Usld and Vsld, mean errors (RMS) Uc„ and Vm. maximum Um„ and Vmax and minimum U„ and Vmm values of the along-strait (U) and across-strait (V) velocity components.
10 of 17

C()8038 JAROSZ ET AL.: ON FLOW VARIABILITY IN THE BOSPHORUS C08038
! 08/09 09/16 09/53 09/30 10/07 10/14 10/21 10/21 11/04 11/11 11/11 11/28 12/02 12/09 12/16 12/2S 12/30 01/06 01/13 01/20
Figure 10. Wind stress components (Pa) and along-strait velocity components (cm/s) in the (a) northern and (b) southern Bosphorus (40 h low-passed data). Wind stress components were estimated from wind observations from Kumkoy and Florya for the northern and southern sections, respectively. Current components (first available depth levels) are from M6 (3.7 m) and M8 (6.3 m) moorings.
wind stress which tended to accelerate the upper layer flow, whereas the northward (positive) stress decelerated the currents in the upper layer (for example, near-surface cur- rents in January 2009, Figure 10). Moreover, as shown in Figure 11 a, fluctuations of the flow in the upper layer were highly coherent with fluctuations of the bottom pressure
difference between the southern and northern sections of the strait. It appears that the near-surface currents in the southern Bosphorus tracked the BPD fluctuations more closely than those in the northern Bosphorus. In general, if the BPD variations were positive the flow in the upper layer decelerated, or was blocked, or reversed even if there were
! 09AM 09/16 09/23 09/30 10/07 10/14 10/21 10/28 11/04 11/11 11/19 11/26 12/02 12/09 12/16 12/23 12/30 01/06 01/13 01/20 01/27
Figure 11. (a) Bottom pressure difference (kPa) between the southern and northern Bosphorus and along- strait velocity components (cm/s) of the upper layer and (b) bottom pressure difference (kPa) and lower layer currents (40 h low-passed data). Current components (first available depth levels) are from M5 (6.3 m) and M7 (8.3 m) moorings for the upper layer. The lower layer currents are also from M7 (50.3 m and 67.3 m) and M5 (35.3 m) moorings. Note: along-strait current velocity at M7 in Figure 1 la is multiplied by 5 for pre- sentation purposes.
11 of 17

(08038 JAROSZ ET AL.: ON FLOW VARIABILITY IN THE BOSPHORUS C08038
I 1 Til
M6M 20.3 m IM at 40.3 m M7 at 50.3 m
M7 at (0.3 m
1J.01 Frequency (f, cpd) Frequency (f, cpd)
Figure 12. Variance preserving spectra of the unfiltcred along-strait current components measured in the (a) upper (depths 3.3, 6.3, and 8.3 m) and (b) lower (depths 20.3, 40.3, 50.3, and 60.3 m) layers in the northern (M7 and M8 moorings) and southern (M5 and M6 moorings) Bosphorus Strait. Frequencies arc in cycles per day (cpd).
no strong winds over the region. An example of the impact of the positive BPD was an event observed from 4 through 10 December 2008 during which there was a reversal of the upper layer flow in the Marmara section and weakening currents (10 cm/s or less) were observed in the Black Sea section. Negative values of the BPD, i.e., higher pressure along the Black Sea section, coincided generally with a more energetic flow in the upper layer. The fact that fluc- tuations of the bottom pressure difference were highly coherent with variations of the upper layer flow suggests that current variations in the Bosphorus tended to be mostly depth independent rather than baroclinic and that the bar- oclinic gradient was usually smaller than the gradient of the water level variations. In contrast, the mean flow in this strait is highly baroclinic.
[29] To quantify visual comparisons of the concurrent time series of the atmospheric forcing, BPD, and currents, and to evaluate relationships among them, multiple and partial coherences were employed. The variance preserving spectra of the upper layer currents (Figure 12a) show a concentration of energy in the low-frequency band between 2 and 10 days. Energy concentration at similar frequencies was also observed in the wind, atmospheric pressure, and bottom pressure spectra (Figures 3a and 3b). Results from the coherence analysis for the near surface along-strait currents, i.e., the currents measured at 3.7 m (M6 mooring in the Marmara section) and at about 6 m (M8 mooring at the Black Sea section), arc displayed in Figure 13. In the Black Sea section, the multiple coherence results indicate that the atmospheric forcing and the BPD accounted for 51 % to 79%
of the current variance for the frequencies less than 0.6 cpd (Figure 13a). The same driving mechanisms could explain at least 71% of the near-surface current fluctuations along the Marmara section (Figure 13b). Partial coherence results show that the primary forcing of these variations at both locations was the BPD. Its impact on the flow in the upper layer was more pronounced in the southern Bosphorus, where it could alone account for 38% to 79% of the current variance, while, in the northern Bosphorus, it explained no more than 53% of the variability for the considered fre- quencies. The along-strait wind stress component also directly impacted the upper layer flow fluctuations; how- ever, its impact was clearly secondary compared to the BPD. This wind stress was important for the flow fluctuations with frequencies between 0.4 cpd and 0.6 cpd in the Black Sea section and with the frequencies lower than 0.3 cpd in the Marmara section. The atmospheric pressure showed limited coherence with upper layer current variations at periods of about 4 days. The partial coherence of the across- strait wind stress with the near-surface currents was rarely statistically significant and hence, its importance as a pos- sible direct source of low-frequency fluctuations of the flow in the upper layer was rather small.
[30] To further clarify the role of the pressure difference and local atmospheric forcing as major forces controlling current variability in the Bosphorus Strait, a simple model is employed. This model assumes that current variability in the upper layer is caused solely by the water level gradient and the along-strait wind stress. Thus, the input of energy from these forces into the upper layer currents is balanced only by
12 of 17

('08038 JAROSZ ET AL.: ON FLOW VARIABILITY IN THE BOSPHORUS (08038
0 2 0 3 0 4 Frequency(epd)
0.2 0.3 0.4 Frequency(epd)
Figure 13. Multiple coherence (MC, black line) and partial coherence (PC, color lines) between the near-surface currents and the bottom pressure difference between the southern and northern Bosphorus (red line), the along-strait (blue line) and across-strait (green line) wind stress components, and the atmo- spheric pressure (cyan line) for (a) the Black Sea and (b) Marmara sections. The dashed line is the 95% significance level. The atmospheric pressure and the winds from Kumkoy and Florya were used in the coherence analyses for Black Sea and Marmara sections, respectively.
the temporal acceleration of the along-strait flow and the interfacial friction approximated by the linear friction term. This along-strait momentum balance is expressed as follows:
du' r drf rx -rr • T» ~ -«7 r at h ox pah
(2)
where u' is the along-strait current within the upper layer, r is a drag coefficient, h is the thickness of the upper layer, rf is the water level, TX is the along-strait wind stress, and p0 is a reference density. Note that u' represents only the flow and its variations that are locally driven solely by winds and water level gradient in the upper layer. Integrating (2) in time and solving for u' yields
(3) u,(')=l'(^£+^)e^''+"'(,=o)e" [JI] For these computations, the water level gradient
was approximated by the demeaned BPD that was first converted to depth variations and then divided by the length of the strait (30 km). In addition, atmospheric pressure was also removed from the bottom pressure observations prior to the estimation of the BPD since atmospheric pressure was almost identical near both sections (Figure 2a); thus, an impact of the atmospheric pressure gradient on the flow variability was negligible. The approximation of the water level gradient probably still overestimates this gradient mainly due to the fact that the bottom pressure data also include a contribution from the baroclinic pressure gradient
[^•j. This contribution cannot be removed due to limited
density observations in the southern Bosphorus. Wind stress was estimated from wind observations collected at Kumkoy and Florya along the northern and southern Bosphorus sections, respectively. The friction coefficient (r) was cho- sen to yield the best agreement with the observations.
[32] Results from this oversimplified model for the near surface currents in the northern and southern Bosphorus arc shown in Figure 14. Note that the model results were offset; that is, along-strait velocity means of the first depth levels (-17 cm/s and -98.8 cm/s for the northern and southern location, respectively) were added to the model outputs. A better agreement with the observations was obtained in the Marmara section. Figure 14b shows observations from the M6 mooring and model output (h = 14 m, r = 0.00075 m/s, and po = 1016 kg/m ; squared correlation coefficient (R2) = 0.85). Major events are generally well captured by the model driven just by the water level gradient and the alongshore winds. Amplitudes of the along-strait current fluctuations arc also well simulated by the simple momen- tum balance in the southern Bosphorus. In the northern section, however, there are discrepancies between the cur- rent observations at the M8 mooring and the model simu- lations (Figure 14a; R2 = 0.49, h - 39 m, r = 0.013 m/s, and po = 1013 kg/m ). The model was able to predict fairly well current fluctuations for a few cases but generally over- estimated amplitudes for a majority of the events. The re- sults from the model arc also in agreement with the coherence-squared findings indicating that the observed current variability in the upper layer is highly coherent with
13 of 17

('(18038 JAROSZ ET AL.: ON FLOW VARIABILITY IN THE BOSPHORUS (08038
so i i i i i i i i i i i i i i i i i i i —V««f"-»
40 _ —•«.
M - ?» . _
|« - A n !\l\ A J 0 . /V\ A * E -10
* -20 1*= ̂ lr wAy\ /» A A AA/A A/ °*> / y v^y^ VA j ' v I'uJ VVUlf
-40 V V -
M •i I i III I I I I I I I
09/09 09(16 OS/23 09/30 10/0/ 10/14 10/21 10/28 11/04 11/11 11/18 11/25 12/02 12/09 12/18 12/23 12/30 01/08 01/13 01/20 01/27 02/03
Figure 14. Comparison of along-strait current observations (black line) recorded at (a) M8 and (b) M6 and currents (red line) estimated from equation (3). Offsets of-17 and -98.8 cm/s were added to the model currents for M8 and M6, respectively.
the bottom pressure/water level gradient and the wind var- iations in the Marmara section, while it is only partly related to these forces in the Black Sea location.
[33] Similar to the variability of the upper layer flow, the current fluctuations in the lower layer were partly related to the BPD variations (Figure 1 lb). This relationship was somewhat stronger for the lower layer currents, especially in the Marmara section. The baroclinic and barotropic pressure gradients are expected to be a major driving mechanism of the lower layer currents in the Bosphorus Strait. Unfortu- nately, the data discussed here did not allow the estimation of the barotropic or baroclinic gradient time series. Thus, salinity and temperature profiles taken at several locations near the moorings and the bottom pressure were used to evaluate the order of magnitude of the along-strait bar- oclinic and barotropic pressure gradients near the mooring sections. Figure 15 shows both gradients. The results indi- cate that the baroclinic gradient was of the same order as the barotropic gradient (1CT4). Consequently, they both could have contributed to the observed current variability in the strait. It is important to note that variations of the lower layer currents (M7 and M8 moorings) were coherent with the variability of the baroclinic pressure calculated from the available density time series in the northern Bosphorus (Figure 6). Such coherence may indirectly suggest that there was also a significant relationship between fluctuations of the baroclinic pressure and the baroclinic pressure gradient since the latter is dynamically related to the lower layer cur- rents. Figure 16 displays results from the spectral analysis showing, as an example, multiple and partial coherences between the 50 m currents recorded at M7 with the bottom pressure difference and the baroclinic pressure. For fre- quencies less than 0.6 cpd, it is very apparent that both BPD and pressure had a strong impact on the current variability as
both combined to account for, on average, 70% (multiple coherence) of the current variance. Individually, the BPD variability seemed to influence the current variations more than that of the baroclinic pressure (partial coherences). Due to very limited density observations, a similar spectral analysis for the lower layer currents could not be performed in the southern Bosphorus.
7. Summary and Conclusions
[34] Concurrent atmospheric and oceanographic observa- tions collected between September 2008 and February 2009 allowed a reasonably detailed description of the two-layer exchange flow near both ends of the Bosphorus Strait. The data showed that there were distinct flow variations and that the currents in both layers were polarized in the along-strait direction. In the northern Bosphorus, the current variations were more pronounced in the more saline, denser lower layer moving northward than in the brackish upper layer flowing southward. The opposite situation was observed in the southern Bosphorus where the upper layer currents fluctuated more noticeably. The upper layer flow often ex- ceeded 200 cm/s in the Marmara section and was generally below 30 cm/s in the Black Sea section. Weaker currents, usually below 70 cm/s, were observed in the lower layer along the Marmara section, while the lower layer outflow to the Black Sea frequently reached 100 cm/s. Our measure- ments revealed the persistent presence of a very energetic jet-like northward flow with a core at 50 m depth and a mean speed of 82.5 cm/s in the northern Bosphorus. His- torical and recent observations clearly show that the thick- nesses of the upper and lower layers change throughout the strait. According to the salinity and current observations discussed here, the upper layer thickness was temporally
14 of 17

((18038 JAROSZ ET AL.: ON FLOW VARIABILITY IN THE BOSPHORUS C08038
-05 0
Prtuura Gradient (10"*; m/»')
Figure 15. Concurrent baroclinic (solid line) and barotro- pic (dashed line) pressure gradients in the northern Bo- sphorus (NB, black lines) and the southern Bosphorus (SB, blue lines). The baroclinic pressure gradients were cal- culated from the pressure, temperature, and salinity observa- tions collected on 14 September 2008 (NB) and 3 February 2009 (SB). The barotropic pressure gradient was estimated from the water level difference between the southern and northern ends of the Bosphorus Strait; all gradients were normalized by the reference density.
variable and, on average, was about 39 m near its northern end and about 14 m near its southern end.
[35] Passing storms and associated high winds greatly affected the bottom pressure and the exchange flow in the Bosphorus Strait. The observations presented here indicate that strong winds from the southern quadrant were able to increase the water level along the Marmara section and to block and reverse the flow in the upper layer, whereas northerly winds increased the upper layer flow toward the Sea of Marmara along both sections. Reversals of the upper layer flow are locally known as "Orkoz" which means "a flow from the bottom up" [Be$iktepe et al., 1994; Ozsoy et al., 1998]. In the Bosphorus Strait, they are often observed during strong and/or persistent southerly winds in fall and winter. Current observations discussed here clearly show upper layer flow reversals along both mooring sections around 5 October 2008 and 21 November 2008. To the best of our knowledge, the upper layer flow reversal along the Black Sea sections was never reported before in scientific publications. During the observational period, the flow in the lower layer was never blocked in the southern Bosphorus; however, in the northern Bosphorus, it was stopped and even reversed when strong northerly winds affected the region and significantly increased the bottom pressure along the northern section. These blockage and reversal events were usually accom- panied by vigorous mixing as indicated by the salinity observations.
[.%] In general, the variability observed in the flow of the upper layer was well explained by the combined effects of the bottom pressure difference between the Marmara and Black Sea sections and atmospheric forcing, especially along the Marmara section. When effects of these forcings arc inspected separately, the bottom pressure difference seemed to be a primary driving mechanism of the fluctua- tions. Its impact on the flow in the upper layer was more
pronounced in the southern section than in the northern section of the strait. Moreover, the along-strait wind stress component impacted the upper layer flow fluctuations; however, its importance was secondary compared to the bottom pressure difference. Direct effects of the atmospheric pressure and the across-wind stress on the flow variations in the upper layer were rather limited. Simultaneously, the flow variability in the lower layer was also coherent with the fluctuations of the bottom pressure difference, and this relationship was again stronger for the lower layer currents in the Marmara section.
[37] The unexplained variability of the exchange flow in the northern Bosphorus might have been partially related to processes and circulation in the Black Sea. The circulation in this sea is extremely dynamic with major mesoscale features such as the Rim Current (a cyclonic unstable system with baroclinic and frontal instabilities), interior gyres, and a series of quasi-stable anticyclonic eddies located on the coastal side of the Rim Current [see, e.g., Oguz and Be$iktepe, 1999; Stanev et al, 2000; Korotaev et al., 2003]. The exchange flow could have been impacted by the variability of the thcrmohaline characteristics (due to amount of riverine waters and convection processes) and circulation on the shelf near the strait as well as by the circulation associated with an eddy ("Bosphorus eddy") observed just west of the Bosphorus Strait.
[38] The mooring setup and observations limited to two locations do not permit a thorough investigation of mixing, frictional effects, and hydraulics in the Bosphorus Strait. Further observational and modeling studies are required to fully understand the impact of these processes on the exchange dynamics in this strait. Observations discussed here, however, allowed estimations of the time scries of the composite Froude number defined as follows:
g% g'h2 14)
where g' = g(p2 " P\)/p is reduced gravity, Fb uu h^ and px
are the Froude number, velocity, thickness, and density of the upper layer, and F2, u2, h2, and p2 are the same quan-
0.2 03 04 Frequency(cpd)
Figure 16. Multiple coherence (MC, black line) and partial coherence (PC, color lines) between the 50 m currents (M7) and the bottom pressure difference (red line) and the 50 m currents and the baroclinic pressure (blue line); the dashed line is the 95% significance level.
15 of 17

(08038 JAROSZ ET AL.: ON FLOW VARIABILITY IN THE BOSPHORUS C08038
09/09 09/16 0*73 09/30 10/07 10/14 10/21 10/28 11/04 11/11 11/11 11/25 12/02 12/09 12/16 12/23 12/30 01/01 01/13 01/20 01/27 02/03
Figure 17. Time series of the composite Froude number in the northern (red line) and southern (blue line) Bosphorus mooring sections.
tities of the lower layer. Note that the Black Sea and Mar- mara mooring sections were located just south of the northern and southern sills, respectively. Time series of the layer-averaged along-strait current velocities and densities were used in these calculations, except for density of the upper layer in the Marmara section that was taken as a constant of 1016 kg/m3 due to lack of observations. The thickness of each layer was estimated from the time series of the depth of the zero isotach. Figure 17 shows the time series of the composite Froude number calculated for both mooring sections. The flow in the southern part of the strait often was supercritical as indicated by G2 being often larger than 1. These instances of supercritical flow coincided with upper layer current speeds of 130 cm/s or larger. The su- percriticality of the exchange flow implies that the upper layer flow may experience a hydraulic control (G2 = 1) north of the Marmara mooring section. Modeling efforts by Oguz et al. [1990] and Oguz [2005] indicated that the constriction zone tilts the interface closer to the surface so that the sur- face-intensified upper layer flow is able to exert a strong hydraulic control near the southern exit of the strait. Our observations seem to indicate that in terms of a two-layer composite Froude number a hydraulic control existed at times in the southern Bosphorus but it was lost during upper layer flow reversal. This control may have been also lost when currents were weakened in the upper layer. At the same time, the composite Froude number was always below 1 indicating that the exchange flow in the Black Sea section was subcritical throughout the deployment. This finding is in agreement with modeling results [Oguz et al, 1990; Oguz, 2005] and in situ observations [Gregg and Ozsoy, 2002], These studies found that the exchange flow is sub- critical until it reaches the northern sill where the dense lower layer outflow from the strait is controlled at the crest of this sill, and then the exchange becomes supercritical. In summary, past observations show that there is a hydraulic control near the northern end of the strait and data collected
for the EPOS project imply that the exchange flow may be controlled near the southern exit. Hence, at time, the two- layer flow system in the Bosphorus Strait may possess maximal exchange conditions; however, more detailed observations especially from the southern part of the strait are required to confirm a hydraulic control of the upper layer flow there.
[39] Acknowledgments. This work was supported by Ihe Office of Naval Research as a part of the NRL's basic research project "Exchange Processes in Ocean Straits (EPOS)" under program element 61153N. We would like to thank everyone from the NATO NURC and the Turkish Navy Office of Navigation, Hydrography, and Oceanography who supported and helped to organize and fund cruises to the TSS on the R/V Alliance. We would like to thank Mark Hulbert, Andy Quaid, Wesley Goode, and Steve Sova, our technicians, for outstanding instrument preparation, mooring deployment, and recovery. We are also thankful and indebted to the crew of the R/V Alliance for helping with our mooring deployment and recovery that occurred in very challenging conditions. Finally, we would like to express our gratitude to Mikdat Kodioglu (Istanbul Technical University) for making meteorological observations available to us.
References Akten. N. (2003), Bosphorus: The seaway separating the continents with its
dense shipping traffic, Turk. J. Mar Sci. 9(3). 241-265. Alpar, B., and H. Yiice (1998), Sea-level variations and their interactions
between the Black Sea and the Aegean Sea. Estuarine Coastal Shelf Sci., 46. 609-619, doi:10.1006/ecss.l997.0285.
Besiktepe, S. T., H. I. Sur, E. Ozsoy, M. A. Latif, T. Oguz, and U. Unluata (1994), The circulation and hydrography of the Marmara Sea, Prog. Oceanogr, 34. 285-334, doi:10.1016/0079-6611(94)90018-3.
Ducet, N., P. Y. Le Traon, and P. Gauzelin (1999), Response of the Black Sea mean level to atmospheric pressure and wind forcing, J. Mar. Sysl., 22, 311-327, doi:10.1016/S0924-7963(99)00072-X.
Fanner, D. M., and L. Armi (1986), Maximal two-layer exchange over a sill and through the combination of a sill and contraction with barotropic flow,/ Fluid Mech., 164, 53-76, doi:10.1017/S002211208600246X.
Gregg, M. C, and E. Ozsoy (2002), Flow, water mass changes, and hydrau- lics in the Bosphorus, J. Geophvs. Res., 107(d), 3016. doi:10.1029/ 2000JC000485.
Gregg, M. C, E. Ozsoy, and M. A. Latif (1999), Quasi-steady exchange flow in the Bosphorus, Geophvs. Res. Lett. 26(\). 83-86, doi:10.1029/ 1998GL900260.
16 of 17

C08038 JAROSZ ET AL.: ON FLOW VARIABILITY IN THE BOSPHORUS C08038
Karaca, M., A. Deniz. and M. Tayanc (2000), Cyclone (rack variability over Turkey in association with regional climate. Int. J. Climatol., 20, 1225-1236, doi:l0.1002/1097-0088(200008)20:10<1225::AID- JOC535>3.0.CO;2-1.
Korotaev, G„ T. Oguz, A. Nikiforov, and C. Koblinsky (2003), Seasonal, interannual, and mesoscale variability of the Black Sea upper layer circu- lation derived from altimeter data, / Geophys. Res , 108(C4), 3122, doi: 10.1029/2002JC001508.
Oguz, T. (2005), Hydraulic adjustments of the Bosphorus exchange flow, Geophys. Res. Lett., 32. L06604, doi:10.1029/2005GL022353.
Oguz, T., and S. T. Besiktepe (1999), Observations on the Rim Current structure, C1W formation and transport in the western Black Sea, Deep Sea Res., Parti, 46, 1733-1754, doi:10.1016/S0967-0637(99)00028-X.
Oguz, T., E. Ozsoy, M. A. Latif, H. I. Sur, and U. Unliiata (1990), Modeling of hydraulically controlled exchange flow in the Bosphorus Strait, J. Phys. Oceanogr., 20, 945-965, doi:10.1175/1520-0485(1990) 02(K0945:MOHCEF>2.0.CO;2.
Ozsoy, E., M. A. Latif, S. T. Besiktepe. N. Cetin, M. C. Gregg, V. Belokopytov, Y. Goryachkin, and V. Diaconu (1998), The Bosphorus Strait: Exchange fluxes, currents, and sea-level changes, in Ecosystem Modeling as a Management Tool for the Black Sea, edited by L. Ivanov and T. Oguz, NATO Set. Ser, vol. 2, pp. 1-27, Kluwer Acad., Dordrecht, Netherlands.
Ozsoy, E., D. Di Iorio. M. C. Gregg, and J. O. Backhaus (2001), Mixing in the Bosphorus Strait and the Black Sea continental shelf: Observations and a model of the dense water outflow, J. Mar. Syst., 31, 99-135, doi: 10.1016/S0924-7963(01 )00049-5.
Perkins, H., J. W. Book, F. de Strobel. L. Gualdesi, E. Jarosz, and W. J. Teague (2009), The Barny Program: Fourteen years of NURC-NRL col- laboration, Tech Rep. SP-2009-001, NATO Undersea Res. Cent., La Spezia, Italy.
Stanev, E. V., P. Y. Le Traon, and E. L. Peneva (2000), Sea level variations and their dependency on meteorological and hydrological forcing: Analy- sis of altimeter and surface data for the Black Sea, / Geophys. Res., 105 (C7), 17,203-17,216, doi:10.1029/1999JC900318.
Trewartha, G. T. (1968), The Earth's Problem Climates. 334 pp., Univ. of Wis. Press, Madison.
Unliiata, U., T. Oguz, M. A. Latif, and E Ozsoy (1990). On the physical oceanography of the Turkish Straits, in The Physical Oceanography of Sea Straits, NATO ASI Ser. Ser. C, vol. 318 edited by L. J. Pratt, pp. 25-60, Kluwer Acad., Dordrecht, Netherlands.
Yiice, H„ and B. Alpar (1997), Subtidal sea-level variations in the Sea of Marmara, their interactions with neighboring seas and relations to wind forcing,/ Coastal Res.. 13, 1086-1092.
Yuksel, Y., B. Ayat, M. N. Ozturk, B. Aydogan, I. Guler. E. O. Cevik, and A. C. Yalciner (2008), Responses of the stratified flows to their driving conditions—A field study, Ocean Eng. 35, 1304-1321, doi: 10.1016/j. oceaneng.2008.06.006.
S. Besiktepe. NATO Undersea Research Center, Viale San Bartolomeo 400, La Spezia 1-19126, Italy.
J. W. Book, E. Jarosz, and W. J. Teague, Naval Research Laboratory, Stennis Space Center, MS 39529-5004, USA. ([email protected]. mil)
17 of 17