EFFECT OF END SILL IN RADIAL BASIN ON CHARACTERISTICS OF FREE HYDRAAULIC JUMPS

Estuarine, Coastal and Shelf Science 60 (2004) 325e338
www.elsevier.com/locate/ECSS
Transverse variability of flow on both sidesof a sill/contraction combination in a fjord-like
inlet of southern Chile
Mario Caceresa,), Arnoldo Valle-Levinsonb
aServicio Hidrografico y Oceanografico de la Armada de Chile, Errazuriz 232, Casilla 324, Valparaiso, ChilebCenter for Coastal Physical Oceanography, Department of Ocean, Earth and Atmospheric Sciences, Old Dominion University,
Norfolk, VA 23529, USA
Received 13 August 2001; accepted 19 December 2003
Abstract
Water velocity and density profiles were obtained over a semidiurnal tidal cycle to describe the transverse variability of flow in
either side of Galvarino Pass, a sill/contraction combination in a fjord-like inlet in southern Chile (44.4(S). Velocity profiles wereobtained with a 614.4 kHz Acoustic Doppler Current Profiler (ADCP) during eight repetitions of a circuit that consisted of along-fjord transects along the pass and cross-fjord transects at either side of the pass. The geomorphology in Galvarino Pass representsa coastline contraction of about 90%, decreasing from 2000 m to 200 m in just 1500 m in the along-channel direction. Depth varies
from 40 m on the landward side of the pass to 10 m at the shallowest portion of the sill to 80 m south of the pass.The mean flow in the northern side of the pass showed a tendency of the flow to rotate anticlockwise throughout the water
column. This feature should result in a sluggish flushing of the northern side. South of the pass, mean surface outflow and mean
bottom inflow (at 20 m) developed near the western side of the fjord. Within the pass, the shallowest and narrowest sectionrepresented a boundary between inflows and outflows. The strongest net inflows (w15 cm/s) were observed in the sill region and thestrongest outflows (w10 cm/s) were seen to the south of the pass. The magnitude of the tidal flows increased inside the pass, reaching
a maximum over the sill, and then decreased northward owing to conservation of mass.In the across-channel momentum balance the advective terms seemed to be greater than the rest of the terms in the northern end
of the pass and over the sill. Magnitudes of the terms in the along-channel momentum balance were comparable to those in the
across-channel direction, highlighting the importance of the transverse dimension under strong geometric constraints.� 2004 Elsevier Ltd. All rights reserved.
Keywords: physical oceanography; estuaries; fjords; Chile; momentum balance; straits
1. Introduction
In terms of the transverse dynamics in fjords, it iscustomary to assume an across-channel dynamic bal-ance between the pressure gradient forces and Coriolisforces (Dyer, 1997). Nevertheless, this balance might bemodified by nonlinearities arising from different sources,such as friction, bottom profile, coastal morphology,
) Corresponding author. Formerly at Center for Coastal Physical
Oceanography, ODU.
E-mail addresses: [email protected] (M. Caceres), arnoldo@ccpo.
odu.edu (A. Valle-Levinson).
0272-7714/$ - see front matter � 2004 Elsevier Ltd. All rights reserved.
doi:10.1016/j.ecss.2003.12.010
and others. In regions of sills and coastline contractions,the geometric properties might be relevant in determin-ing the across-channel momentum balance. The stretch-ing and contraction of streamlines by the effect of sillsand/or contractions would invalidate the geostrophicapproximation and make advective accelerations rele-vant to the across-channel momentum balance.
In a previous paper (Valle-Levinson et al., 2001),a study was made of the intratidal variability of the flowover a sill/contraction combination in a Chilean fjord.That work was focused to describe the intratidalvariability of the flows within Galvarino Pass (Fig. 1),a pass connecting the northern and southern portionsof Ventisquero Sound, and to assess the observed

326 M. Caceres, A. Valle-Levinson / Estuarine, Coastal and Shelf Science 60 (2004) 325e338
Fig. 1. (a) General study area on the southern coast of Chile. (b) Enlargement of the region shown in (a). The measurements obtained during this
experiment were made in the box shown at Galvarino Pass.
variability in the context of the existing theories. Theyfound a two-layer flow with falls and rises of thepycnocline, transitions from subcritical to critical flow,and enhanced vertical mixing within the pass.
Nevertheless, the full data set collected during thatfield work included not only the portion of the sill, butalso the northern and southern sides of the pass, whichwere covered with transverse transects of AcousticDoppler Current Profiler (ADCP) measurements. Thesetransects were intended to improve the understanding ofthe transverse variability of flow on both sides of thecontraction. We seek (1) to study the transverse vari-ability of the flow in both sides of the pass, describingthe main characteristics of the residual (or mean) flow,and (2) to assess the main terms contributing to theacross-channel dynamic balance. The analysis of thesedata should provide insights into the differences in thecharacteristics of flow, density, and dynamic balanceat either side of the morphological constriction. Thisstudy quantifies and describes the transverse variabilityproduced by the interaction of tidal currents witha sill in the contraction of a channel. It also presents
Fig. 2. The ADCP profiles were made in the circuit shown in the figure,
following the arrow directions. The approximate position of the
ADCP transects is shown (numbers 1e5). CTD profiles were made in
positions AeD.

327M. Caceres, A. Valle-Levinson / Estuarine, Coastal and Shelf Science 60 (2004) 325e338
Fig. 3. Across-channel distribution of the along-channel mean flow. Net inflows are lighter and net outflows are darker. Transects 1 and 2 show
evidence of inflows in the center and outflows on the sides. Transects 3 and 4 show the strongest outflows in the west side in the first 15 m. Inflows
dominate below 15 m and in the east side near surface. Transect 5 shows along-channel (not across) distribution. The strongest inflows are observed
over the sill. Near the upper right corner of each panel there are the sectional means. Contour interval is 2 cm/s, except in transect 5 where it is 4 cm/s.
Horizontal scales are comparable between transects 1 and 2, and between transects 3 and 4. Data in the shaded region near the bottom were not
considered in the analysis due to side lobe effects. White region near the bottom was out of the profiling range of the ADCP.
estimates of key terms in the across-channel mo-mentum balance to assess the validity of the geostro-phic approximation. The objectives are pursued withobservations of a towed ADCP and of conductivityetemperatureedepth (CTD) profiles throughout onesemidiurnal tidal cycle.
2. Study area
Ventisquero Sound is a fjord-like inlet located in thenorthern region of the Chilean Inland Sea. It is part ofthe northernmost end of Puyuguapi Channel (Fig. 1a).
The position of Ventisquero Sound suggests that it maybe little affected by the shelf processes occurring adja-cent to the Chilean Inland Sea. The tidal wave pro-pagates eastward entering to the Inland Sea throughGuafo Mouth and bifurcates to the north and to thesouth through Moraleda Channel. Tidal ranges reportedfor the confluence of Moraleda Channel and JacafChannel are 2.3 m (SHOA, 1994), which suggests atypical semidiurnal tidal amplitude of about 1.1 m in theregion of Ventisquero Sound. This confirms the fieldobservations of Valle-Levinson et al. (2001) and theirtheoretical approximation to this value based onStigebrandt (1977).

328 M. Caceres, A. Valle-Levinson / Estuarine, Coastal and Shelf Science 60 (2004) 325e338
Fig. 4. Across-channel component of the mean flow. Flows toward the east are lighter and flows to the west are darker. Transects 1 and 2 show
dominance of flow toward the west. Westward flow in transects 3 and 4 dominates near surface in the east side, while eastward flow is important near
surface in the west side. Below 15 m lateral flows are less important (!2 cm/s). Transect 5 shows the strongest west flows (out of the paper) in the
northern region and near surface in the south.Near the upper right corner of each panel there are the sectional means. Contour interval is 2 cm/s, except
in transect 5 where it is 4 cm/s. Horizontal scales are comparable between transects 1 and 2, and between transects 3 and 4. Data in the shaded region
near the bottom were not considered in the analysis due to side lobe effects. White region near the bottom was out of the profiling range of the ADCP.
On the basis of data obtained at Guafo Island(Fig. 1a) by the Meteorological Service of the ChileanNavy (SMA), the wind regime for this region of theInland Sea is dominated by southerly and southwesterlywinds during spring and summer (OcteMar), and nor-therly and northwesterly winds during fall and winter(AprileSept). Because of its orientation at nearly 11(true, and because of the steep land topographysurrounding this inlet, hydrodynamics in VentisqueroSound are believed to be weakly affected by seasonalnorthwesterly and southerly winds. Nevertheless, fun-neling of winds by Puyuguapi Channel (Fig. 1a) couldbe a mechanism to induce currents by winds in this
Sound. No field measurements are available to confirmthis hypothesis.
Freshwater inputs to Ventisquero Sound are pro-vided mainly by Ventisquero River and Pascua River(Fig. 1b), two ungauged streams discharging in thenorthern side of the contraction. Rivers in the Puyu-guapi Channel follow the annual regime of freshwaterdischarges in the region, with two annual peaks of dis-charges corresponding to the autumn increase in preci-pitation (AprileJune) and the summer melting of snow.Sampling for this study was carried out in January, notfar from the snow melting peak in November. The meantotal annual precipitation (1968e1999) for stations

329M. Caceres, A. Valle-Levinson / Estuarine, Coastal and Shelf Science 60 (2004) 325e338
Fig. 5. Arrows of the mean flow distribution at four selected depths (2, 6, 20 and 34 m).
around the study area fluctuates between 1100 and2100 mm (SMA, pers. comm.). By the effect of theseinputs there is a well defined pycnocline shallower than10 m depth in the northern region of PuyuguapiChannel (Silva et al., 1995; Silva et al., 1997).
As indicated by Valle-Levinson et al. (2001), thegeomorphology in Galvarino Pass represents a coastlineconstriction of about 90%, decreasing from 2000 m to200 m in just 1500 m in the along-channel direction.Depth varies from 40 m on the landward side of the passto 10 m at the shallowest portion of the sill to 80 msouth of the pass.
3. Data collection and processing
A 614.4 kHz RD Instruments Broadband ADCP anda Trimble Global Positioning System (GPS) interfacedto a laptop computer were used to obtain velocityprofiles in the sampling area during one complete
semidiurnal tidal cycle on January 12, 1998, duringspring tides. The ADCP was mounted on a catamaranw1.2 m long, that was towed from the starboard side ofthe R/V Arturo Prat (of the Technical Fisheries Institutein Puerto Cisnes, Chile), at speeds between 2 and 2.5 m/s.Velocity profiles with a vertical resolution (bin size) of0.5 m and ping rates of w1 Hz were averaged every 15 s,yielding a spatial resolution of w30e40 m. Four across-channel transects (numbers 1e4) and one along-channeltransect (number 5), covering the circuit indicated inFig. 2 were traversed eight times during the 12 h of datacollection. The ADCP data were calibrated according toTrump and Marmorino (1997). Bad data were removedfollowing the procedure explained by Valle-Levinson andAtkinson (1999). After the heading correction wasapplied, the data were rotated counter clockwise 10((transect 1), �5( (transect 2), 30( (transect 3), 50((transect 4) and �10( (transect 5) to an along- (v-flow)and across- (u-flow) channel coordinate system. Theseangleswere oriented to the direction of greatest variability

330 M. Caceres, A. Valle-Levinson / Estuarine, Coastal and Shelf Science 60 (2004) 325e338
Fig. 6. Tidal current ellipses at selected positions of transects 1, 2, 4 and 5 for depths of 3 and 19 m. Startpoint and direction of rotation of the ellipses
are indicated with an arrow. There is a point at the center of each ellipse. See Fig. 7 for more reference on magnitudes of the tidal currents.
of the tidal currents and of weakest across-channel tidalflows. The present workwas carried out during calmwindconditions.
Density profiles were measured with a HydrolabDatasonde 4 CTD multiprobe at stations AeD indi-cated in Fig. 2. The accuracy of the salinity andtemperature measurements was G 0.2 and G 0.1 (C, re-spectively, and the resolution of these measurements was0.01 for salinity and 0.01 (C for temperature. Problemswith the pressure sensor during the CTD casts invalidatedthe values below w15 m. Density values were obtainedfrom temperature, salinity, and pressure with the in-ternational equation of sea state of seawater (e.g. Gill,1982). The sampling rate of the CTD was 0.2 Hz,thus making each CTD cast a time-consuming task(w10 min).
The semidiurnal tide (represented by the M2 constit-uent) was separated from the subtidal signal of theobserved flow components using sinusoidal least squaresregression analysis (e.g. Lwiza et al., 1991). Afterdetermining the mean subtidal flow, the relative magni-tude of the advective and frictional terms was comparedto that of the Coriolis accelerations. To do this, a right-handed coordinate system was adopted for which y(along-channel direction) was positive toward nearly10( (transect 1), 355( (transect 2), 30( (transect 3), 50((transect 4) and 350( (transect 5); while the x (across-channel direction)was positive tonearly 100( (transect 1),
85( (transect 2), 120( (transect 3), 140( (transect 4)and 80( (transect 5). It followed that the along-channeland across-channel components of the velocity weregiven by v and u, respectively. In the across-channeldirection, the subtidal momentum balance for transects1e4 may be then given by:
Cuðvu=vxÞD� C fvD ¼� C1=rðvp=vxÞDCCAzðv2u=vz2ÞDCCAhðv2u=vx2ÞD ð1Þ
and for transect 5:
Cvðvu=vyÞD� C fvD ¼� C1=rðvp=vxÞDCCAzðv2u=vz2ÞDCCAhðv2u=vy2ÞD ð2Þ
where u(vu/vx) and v(vu/vy) are the advective terms, fvis the Coriolis term ( f ¼ 1:01! 10�4), 1/r(vp/vx) is thepressure gradient term, Az(v
2u/vz2) is the vertical fric-tional term, Ah(v
2u/vx2) and Ah(v2u/vy2) are the hori-
zontal frictional terms, and brackets (CD) denote tidalaverages. The coefficients Az and Ah denote the verticaland horizontal eddy viscosities, respectively. These werethe terms of the complete momentum balance that couldbe reliably approximated, with exception of the pressuregradient term. The magnitudes of each term were usedto compare their relative contribution to the momentumbalance in the across-estuary direction.
For the vertical eddy viscosity, Az, we used the empir-ical form Az ¼ 1:5! 10�5 u2rms=f of Bowden and

331M. Caceres, A. Valle-Levinson / Estuarine, Coastal and Shelf Science 60 (2004) 325e338
Fig. 7. Across-channel distribution of the along-channel tidal amplitude for the semidiurnal component, obtained from the ADCP current
measurements. Transects 1e4 looking up-estuary, transect 5 looking toward the west. Near the upper right corner of each panel there are the
sectional means. Contours are 2, 5, 10, 15,.cm/s, except in transect 5 where they are 5, 10, 20, 30,.cm/s. Horizontal scales are comparable between
transects 1 and 2, and between transects 3 and 4. Data in the shaded region near the bottom were not considered in the analysis due to side lobe
effects. White region near the bottom was out of the profiling range of the ADCP.
Hamilton (1975) to obtain a first estimate for themagnitude of this coefficient, where urms is the rms tidalvelocity. For the magnitudes of the currents and depthsobserved in this experiment, the applicability of thissolution seemed to be acceptable, following the procedureof Ianniello (1977). The relationship proposed byCsanady (1975), Az ¼ u2�=200f for estuaries of largedepth, where u* is the frictional velocity (t/r)1/2, alsoleads to similar results. The values obtained from bothsolutions for our data set are in the range of Az ¼ 0:0001to Az ¼ 0:0014 m2=s. We use a constant eddy viscositycoefficient of 0.0005 m2/s for transects 1e4 and 0.001 m2/sfor transect 5.
Similar empirically derived forms for the magnitudeof the horizontal eddy viscosity in tidal channels are lesswidely used. Tee (1976) used a value of Ah ¼ 100 m2=sfor an energetic tidal channel (currents of w5 m/s),Ianniello (1979) used estimates ranging from 1 to 10 m2/sfor tidal channels, and Jones and Elliot (1996) usedestimates of 0.5e10 m2/s in the parametrization of fric-tion in rivers. Ianniello (1979) also proposed a way toestimate the width of the channel that makes horizontalfriction comparable to the vertical friction. According tothis, the widths in Ventisquero Sound are within theranges where horizontal friction is important.We will usea conservative estimate of Ah ¼ 0:5 m2=s for transects

332 M. Caceres, A. Valle-Levinson / Estuarine, Coastal and Shelf Science 60 (2004) 325e338
1e4 and Ah ¼ 1 m2=s for transect 5, according to thevelocities observed in this system.
4. Results
This section presents the across-channel distributionof the subtidal (or mean) and tidal flows for the periodof observation in the five transects. It also describesmean vertical density profiles made at the four stations(AeD, Fig. 2). It also presents the magnitudes andacross-channel distributions of the terms indicated inEq. (1), with exception of the pressure gradient term.A comparison among the magnitude of various termsis shown in Section 5.
Fig. 8. Density profiles in the positions AeD indicated in Fig. 2. (a)
North of the sill and (b) south of the sill. Vertical stratification is
greater in the southern side of the pass. Stations close to the coast
(A and D) are less saline than those near the center.
4.1. Mean flow
Figs. 3e5 show the main characteristic of the meanflow over the period of observations. The along-channelmean flow for transects 1 and 2 is shown in Fig. 3. Thenorthern transect 1 showed inflows in the channel andoutflows over the slopes, which was more evident in theeast side. This pattern is similar to that obtained fromtheoretical results (Wong, 1994), and is also suggested inthe east side of transect 2, as this transect did not coverthe full width of the channel. The along-channel meanflow for transects 3 and 4 (Fig. 3) showed the greatestmagnitudes (w10 cm/s) in the west side, consistent withthe presence of the channel on the left (west) and theconstriction on the right (east). In the channel, outflowoccurred in the upper 15 m and inflow between 15 and30 m. It is interesting to note that in the upper 25 minflows and outflows are practically depth-independent.Owing to continuity, in transect 5 the along-channelflow showed maximum net velocities of about 12 cm/sover the sill.
In the case of the across-channel mean u-flow (Fig. 4),it remarkably showed mean sectional values comparableto those of the along-channel mean flow. Means oftransects 1 and 2 were greater than their equivalent inthe along-channel mean flow. This pattern might beattributed to the marked effect of the coastal geometryin the region of the contraction, which accelerates theflows in the transverse direction. Transects 1 and 2 in thenorthern side showed dominance of negative values(flow to the west) in the sections. This produceda tendency of the flow to the north of the pass to rotateanticlockwise with depth. On the other hand, to thesouth of the pass the flow exhibited a convergence atabout 400 m from the western side in the upper 20 m.This pattern might be attributed to the coastalgeometry, which caused a westward deflection of theflow. The across-channel mean flows of transect 5 alsoconfirmed the tendency for recirculations and conver-gence at the north end of the transect, as flow wasdirected to the east (positive values) in this region. In thesouthern side of this transect, positive values were alsoconsistent with the south-east direction of the outflow.
Vectors at selected depths plotted for the mean flowdescribed above are presented in Fig. 5. Circulationpatterns suggested by the contours presented above,were confirmed in these figures. In the northern sidethere was a tendency of the flow to rotate anticlockwiseat all depths. It was noticeable how in the deep region(depth of 34 m, Fig. 5), residual flows were still about5 cm/s in the northern region, which suggests that thepresence of the sill favors retention of waters in thenorthern basin. South of the pass, there was a two-layerstructure on the west with surface outflow (at 2 and 6 m)and inflow at depth (20 m), which is supported bydensity profiles that will be shown later.

333M. Caceres, A. Valle-Levinson / Estuarine, Coastal and Shelf Science 60 (2004) 325e338
Fig. 9. Contours of the tidally averaged Coriolis term in the five transects. Near the upper right corner of each panel there are the sectional means.
Title of transect 1 is valid for transects 1e4. Contour interval is 2 (!10�6) m/s2 except in transect 5 where it is 4 (!10�6) m/s2. Horizontal scales are
comparable between transects 1 and 2, and between transects 3 and 4. Data in the shaded region near the bottom were not considered in the analysis
due to side lobe effects. White region near the bottom was out of the profiling range of the ADCP.
Strongest outflows and inflows appearing to thesouth of the pass were concentrated over the west side.Convergence of the flow was more clearly observed at6 m in Fig. 5 in the west side of transects 3 and 4. Thisfeature was observed in the field in at least four ofthe eight ADCP repetitions. The narrowest portion ofthe pass seems to represent a region for divergenceof the near surface flow and convergence for the nearbottom flow. There was also a near surface (w2 m depth)convergent flow over the sill not completely resolvedby the sampling strategy. This mechanism is explainedby Valle-Levinson et al. (2001). The strongest inflows(w12 cm/s) were observed in the sill region and thestrongest outflows (w8 cm/s) to the south of the pass.
4.2. Tidal current amplitudes
The tidal current ellipses at selected points oftransects 1, 4 and 5 are shown in Fig. 6. The tendencyto rotate anticlockwise to the north of the pass at alldepths and the tendency of the flow to converge in theupper layer to the south of the pass were also confirmedby the orientation of the semimajor axis.
The across-channel distribution of the semidiurnaltidal current amplitudes is presented in Fig. 7. To thenorth of the pass, maximum amplitudes of about15e20 cm/s occurred preferentially at mid-depth andnear surface. To the south of the pass, the greatestamplitudes of about 22 cm/s (transect 3) and 15 cm/s

334 M. Caceres, A. Valle-Levinson / Estuarine, Coastal and Shelf Science 60 (2004) 325e338
Fig. 10. Contours of the tidally averaged advective term in the five transects. Near the upper right corner of each panel there are the sectional means.
Title of transect 1 is valid for transects 1e4. Contour interval is 10 (!10�6) m/s2 except in transect 5 where it is 50 (!10�6) m/s2. Horizontal scales
are comparable between transects 1 and 2, and between transects 3 and 4. Data in the shaded region near the bottom were not considered in the
analysis due to side lobe effects. White region near the bottom was out of the profiling range of the ADCP.
(transect 4) were located over the channel on the westernside, near surface, with amplitudes tending to zero below20m depth. Transect 5 showed the greatest amplitudesof about 65 cm/s over the sill. There is a pattern showingmaximum amplitudes increasing northward, with thegreatest values over the sill, and decreasing northwardto almost one half of those to the south of the pass. Thispattern, also observed in the semimajor axis of Fig. 6,seems to follow continuity constraints and reflecta Bernoulli-type of dynamics.
4.3. Density profiles
Mean density profiles for stations A, B, C and D(Fig. 2) are presented in Fig. 8. Vertical stratification
was stronger in the southern (C, D) side than in thenorthern (A, B) side of the sill, as a result of greatersupply of saline water to the southern side. Theevolution of the density in time for stations B and C,presented by Valle-Levinson et al. (2001), also revealedthat the northern side experiences weak perturbationsfrom tidal forcing, as deduced by the position of the15 st isopycnal during one tidal cycle.
Water is less dense at coastal stations (A and D) thanin the stations in the center of the channel. In thenorthern side, lower salinities at station A are probablydue to the effect of a nearby river discharge and theeffects of the earth’s rotation. Differences in densitybetween stations A and B might be also related to thealong-channel mean flow (Fig. 3). Net outflow, near the

335M. Caceres, A. Valle-Levinson / Estuarine, Coastal and Shelf Science 60 (2004) 325e338
Fig. 11. Contours of the tidally averaged vertical friction term in the five transects. Near the upper right corner of each panel there are the sectional
means. Title of transect 1 is valid for transects 1e4. Contour interval is 3 (!10�6) m/s2 except in transect 5 where it is 2 (!10�6) m/s2. Horizontal
scales are comparable between transects 1 and 2, and between transects 3 and 4. Data in the shaded region near the bottom were not considered in the
analysis due to side lobe effects. White region near the bottom was out of the profiling range of the ADCP.
eastern coast, might be associated with lighter water (A),and net inflow, in the center, with heavier water (B).
4.4. Across-channel dynamics
The across-channel distributions of the tidally aver-aged Coriolis term C fvD, the advective term Cu(vu/vx)Dand the frictional terms CAz(v
2u/vz2)D and CAh(v2u/vx2)D
were used to establish their relative contribution to theacross-channel momentum balance. Figs. 9e12 show thedistribution of the Coriolis, advective, vertical frictionaland horizontal frictional terms, respectively, with mag-nitudes expressed in units of acceleration m=s2 ! 10�6.
In all of these figures transects 1e4 are looking up-estuary, and transect 5 is looking toward the west. Scales
of distance and depth are comparable between transects1 and 2, and between transects 3 and 4. Scales in transect5 are not comparable with other transects.
As expected, the Coriolis term (Fig. 9) mimics themean v-flow distribution (Fig. 4), as it is directly propor-tional to it. The advective term (Fig. 10) showed greatersectional means to the north of the pass than south ofthe pass, as expected from the recirculation of the meanflow observed in Fig. 5. In the case of transect 5, theacross-channel advective term was greater over the sillthan in deeper regions, and its sectional mean was thehighest of the five transects. The sectional distribution ofthe vertical friction term is presented in Fig. 11. Asexpected, transect 5 showed the highest values over theshallowest region and near the bottom. To the north of
336 M. Caceres, A. Valle-Levinson / Estuarine, Coastal and Shelf Science 60 (2004) 325e338
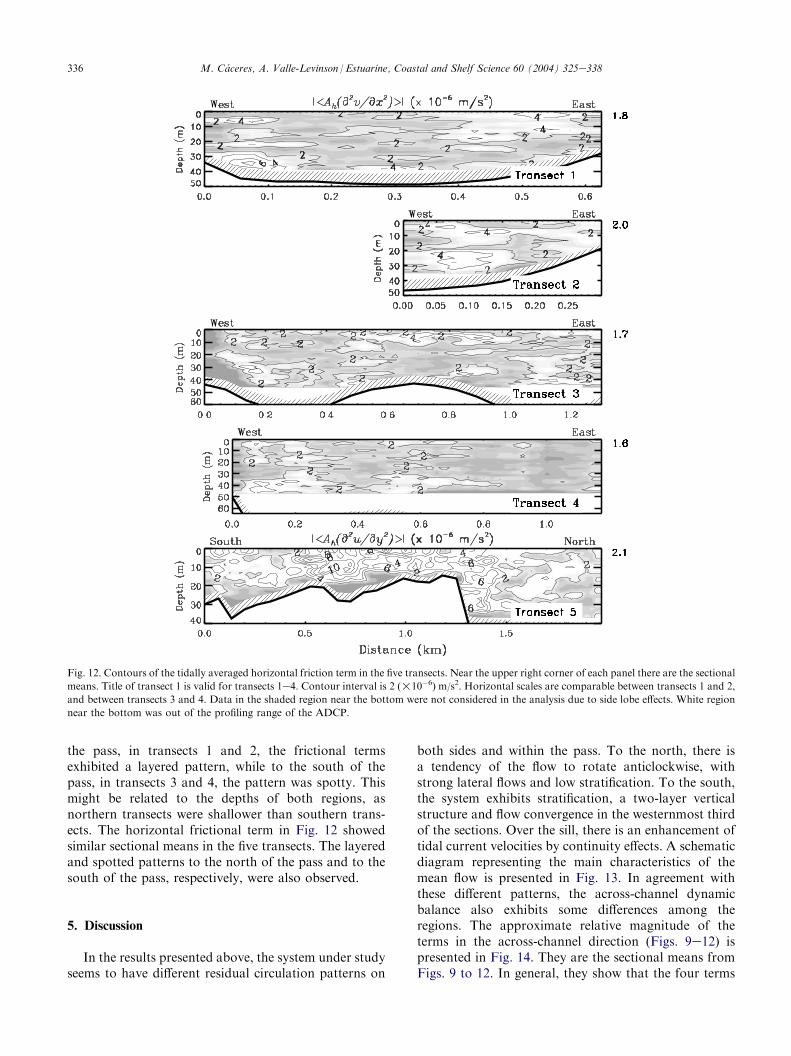
Fig. 12. Contours of the tidally averaged horizontal friction term in the five transects. Near the upper right corner of each panel there are the sectional
means. Title of transect 1 is valid for transects 1e4. Contour interval is 2 (!10�6) m/s2. Horizontal scales are comparable between transects 1 and 2,
and between transects 3 and 4. Data in the shaded region near the bottom were not considered in the analysis due to side lobe effects. White region
near the bottom was out of the profiling range of the ADCP.
the pass, in transects 1 and 2, the frictional termsexhibited a layered pattern, while to the south of thepass, in transects 3 and 4, the pattern was spotty. Thismight be related to the depths of both regions, asnorthern transects were shallower than southern trans-ects. The horizontal frictional term in Fig. 12 showedsimilar sectional means in the five transects. The layeredand spotted patterns to the north of the pass and to thesouth of the pass, respectively, were also observed.
5. Discussion
In the results presented above, the system under studyseems to have different residual circulation patterns on
both sides and within the pass. To the north, there isa tendency of the flow to rotate anticlockwise, withstrong lateral flows and low stratification. To the south,the system exhibits stratification, a two-layer verticalstructure and flow convergence in the westernmost thirdof the sections. Over the sill, there is an enhancement oftidal current velocities by continuity effects. A schematicdiagram representing the main characteristics of themean flow is presented in Fig. 13. In agreement withthese different patterns, the across-channel dynamicbalance also exhibits some differences among theregions. The approximate relative magnitude of theterms in the across-channel direction (Figs. 9e12) ispresented in Fig. 14. They are the sectional means fromFigs. 9 to 12. In general, they show that the four terms

337M. Caceres, A. Valle-Levinson / Estuarine, Coastal and Shelf Science 60 (2004) 325e338
are important to the across-channel momentum balance,with comparable values among them. The exception tothis is the advective term, which seems to be about threeto four times greater to the north of the pass than to thesouth of the pass, and about six times greater in transect5 than to the south of the pass. This is probably a resultof the recirculation produced in the northern basin andnonlinearities induced by bathymetry and coastlinegeometry in the sill, respectively. The baroclinic pressuregradient might also be relevant to this balance asdifferences in density (Fig. 8) between both sides of thesill are noticeable and also there is marked stratificationto the south of the pass. The influence of the barotropicpressure gradient is unknown, but because the advectiveterms are of order of 10�5 m/s2, transverse slopes in sealevel would have to be of order of w10�6 to contributeto the balance. Although this is a rough approximationto the dynamics, it suggests (Fig. 14) that most of theterms in Eqs. (1) and (2) should be important to thelateral momentum balance. Nevertheless, as mentionedbefore in the analysis of figures of the along-channel andacross-channelmean flow (Figs. 3 and 4, respectively), themagnitudes of the mean flow in both dimensions seemedto be comparable between them. In order to further
Fig. 13. Schematic representation of the mean flow at surface
(black arrows) and at �20 m depth (solid gray arrows) in the study
region.
explore the effect of this similarity in the dynamic balance,we will make some comparisons with the along-channelmomentum balance.
In the along-channel direction, the subtidal momen-tum balance for transects 1e4 is given by:
Cuðvv=vxÞDCC fuD ¼� C1=rðvp=vyÞDCCAzðv2v=vz2ÞDCCAhðv2v=vx2ÞD ð3Þ
and for transect 5:
Cvðvv=vyÞDCC fuD ¼� C1=rðvp=vyÞDCCAzðv2v=vz2ÞDCCAhðv2v=vy2ÞD ð4Þ
which contain the terms that, with the exception of thepressure gradient term, may be reliably computed withthe sampling design. As shown in Fig. 14, sectionalmeans obtained for these terms on each transect(contours not plotted here) are remarkably similar tothe magnitudes of the means in the across-channeldirection. The importance of the advective term in bothdirections in transects 1, 2 and 5 is also observed in thealong-channel terms. This behavior might be attributed
Fig. 14. Absolute values of the sectional means (squares) of the across
and along-channel terms. Advective terms were more important
than the rest of the terms in the northern side and within the pass.
Across-channel values were comparable to along-channel values. Bars
denote one standard deviation. See Eqs. (1e4) for specifications of theterms.
338 M. Caceres, A. Valle-Levinson / Estuarine, Coastal and Shelf Science 60 (2004) 325e338
to the similar magnitudes of the u velocities and vvelocities in the transects of the northern side and overthe sill (Figs. 3 and 4), which make the terms u(vu/vx)and v(vv/vy) also the largest in the transects.
It is noteworthy to highlight the resemblance of themagnitudes between the terms in the across-channel andalong-channel direction, as the across-channel dimen-sion is customarily neglected in estuarine systems.Convergence of the coastline in the region of thecontraction might be responsible for the enhancing oflateral accelerations of flow in these regions, makinglateral flow comparable to the along-channel flow. Riverdischarge in the northern side could also be a factorinfluencing the tendency of the flow to rotate, enhancingthe lateral flow to the west exhibited in transect 1 at alldepths. The effects of river discharge in the formation oftidal eddies in the northern side is a matter that requiresmore attention.
It is also notable that recirculation in the northernregion might constitute a mechanism of retention ofwater, making residence times of the water in thenorthern basin much longer than in the south. Thisfinding should be a matter of further investigation in theregion as the mechanisms of dispersion of pollutantsand particulate material are strongly restricted by thepresence of the sill in Galvarino Pass. This issue mightbecome particularly sensitive as the main populationarea (Puyuguapi Port, Fig. 1) is located in thenorthernmost region of Ventisquero Sound.
In summary, the mean flow in the northern side of thepass showed a tendency of the flow to rotate anticlock-wise throughout the water column. This feature shouldresult in a sluggish flushing of the northern side. Southof the pass, mean surface outflow and mean bottominflow (at 20 m) developed near the western side of thefjord. Within the pass, the shallowest and narrowestsection represented a region of divergence of nearsurface flows and convergence of near bottom flows.The strongest net inflows (w15 cm/s) were observed inthe sill region and the strongest outflows (w10 cm/s)were seen to the south of the pass. The magnitude of thetidal flows increased toward the north, reachinga maximum over the sill, and then decreased northwardowing to conservation of mass. In the across-channelmomentum balance the advective terms seemed to begreater than the rest of the terms to the north of the passand over the sill. Magnitudes of the terms in the along-channel momentum balance were comparable to thosein the across-channel direction, highlighting the impor-tance of the transverse dimension under strong geo-metric constraints.
Acknowledgements
F. Jara, C. Molinet, A. Figueroa, and D. Sotoassisted in the data collection. This study was funded bythe Chilean National Environmental Commission. Wethank the captain and crew of the R/V Arturo Prat fortheir commitment. R. C. Kidd provided invaluable helpin the field.
References
Bowden, K.H., Hamilton, P., 1975. Some experiments with a numerical
model of circulation and mixing in a tidal estuary. Estuarine,
Coastal and Shelf Science 3, 281e301.Csanady, G.T., 1975. Lateral momentum flux in boundary currents.
Journal of Physical Oceanography 5, 705e717.
Dyer, K., 1997. Estuaries, a Physical Introduction, second ed. John
Wiley & Sons, 195 pp.
Gill, A.E., 1982. AtmosphereeOcean Dynamics. Academic Press, San
Diego, California, 622 pp.
Ianniello, J., 1977. Tidally induced residual currents in estuaries of con-
stant breadth and depth. Journal of Marine Research 35, 755e786.
Ianniello, J., 1979. Tidally induced residual currents in estuaries of
variable breadth and depth. Journal of Physical Oceanography 9,
962e974.Jones, B., Elliot, A.J., 1996. The parametrization of lateral and bottom
friction in depth integrated numerical models. Journal of Marine
Environmental Engineering 3, 1e13.
Lwiza, K.M.M., Bowers, D.G., Simpson, J.H., 1991. Residual and
tidal flow at a tidal mixing front in the North Sea. Continental
Shelf Research 11 (11), 1379e1395.
SHOA, Nautical Chart 802, Canales Puyuguapi y Jacaf, Hydrographic
and Oceanographic Service of Chilean Navy (SHOA). 1a ed.,
corrected until 1994.
Silva, N., Sievers, H., Prado, R., 1995. Caracterısticas oceanograficas y
una proposicion de circulacion para algunos canales de la costa de
Chile entre 41(20#S y 46(40#S. Revista de Biologıa Marina
(Valparaıso) 30 (2), 207e254.
Silva, N., Calvete, C., Sievers, H., 1997. Caracterısticas oceanograficas
fısicas y quımicas de canales australes chilenos entre Puerto Montt
y Laguna San Rafael, (Crucero Cimar-Fiordo 1). Ciencia y
Tecnologıa del Mar 20, 23e106.
Stigebrandt, A., 1977. On the effect of barotropic current fluctuations
on the two-layer transport capacity of a constriction. Journal of
Physical Oceanography 7, 118e122.
Trump, C.L., Marmorino, G., 1997. Calibrating a gyrocompass using
ADCP and DGPS data. Journal of Atmospheric and Oceanic
Technology 14, 211e214.
Tee, K.T., 1976. Tide-induced residual current, a 2-D nonlinear
numerical tidal model. Journal of Marine Research 34, 603e628.
Valle-Levinson, A., Atkinson, L.P., 1999. Spatial gradients in the flow
over an estuarine channel. Estuaries 22 (2A), 179e193.
Valle-Levinson, A., Jara, F., Molinet, C., Soto, D., 2001. Observations
of intratidal variability of flows over a sill/contraction combination
in a Chilean fjord. Journal of Geophysical Research 106 (c4),
7051e7064.
Wong,K., 1994.On the nature of transverse variability in a coastal plain
estuary. Journal of Geophysical Research 99 (c7), 14209e14222.
Copyright © 2022 FDOKUMEN