
Davis Strait volume, freshwater and heat fluxes
24
Deep-Sea Research I 52 (2005) 519–542 Davis Strait volume, freshwater and heat fluxes Je´roˆme Cuny a, , Peter B. Rhines a , Ron Kwok b a School of Oceanography, University of Washington, Seattle, Washington, USA b Jet Propulsion Laboratory, California Institute of Technology, Pasadena, CA, USA Received 3 September 2003; received in revised form 29 June 2004; accepted 18 October 2004 Available online 29 January 2005 Abstract Volume, freshwater and heat transport through Davis Strait, the northern boundary of the Labrador Basin, are computed using a mooring array deployed for three consecutive years. The net volume, freshwater and heat transports are 2:6 1:0 Sv; 92 34 mSv; 18 17 10 12 W: Both southward and northward volume and freshwater transports are maximum in November. The seasonal variability is dictated by the variability in the main water mass transports: Irminger Sea Water, West Greenland shelf water, surface meltwater, and a cold intermediate layer (CIL) originating from Lancaster Sound. The southward freshwater transport seasonal amplitude is dominated by the CIL transport rather than the surface meltwater layer. Sea-ice transport through Davis Strait deduced from remote sensing data is equal to 528 km 3 =year which is much smaller than equivalent estimates for Fram Strait. Using these new estimates, we attempt to close the Arctic Ocean volume and freshwater budget. r 2004 Elsevier Ltd. All rights reserved. Keywords: Davis Strait; Labrador Sea; Baffin Bay; Transports; Freshwater; Sea ice 1. Introduction The Arctic hydrological cycle is a complex combination of land runoff, precipitation, ice freezing–melting and input of salty water from Bering Strait, Fram Strait and Barents Sea shelf. The Arctic Ocean represents only 1% of the world ocean but receives 11% of world river runoff (Shiklomanov et al., 2000). The atmosphere and the ocean play complementary roles as the atmo- sphere brings moisture to the Arctic and the ocean carries the freshwater southward. Any change in the fresh water flux out of the Arctic affects the nearby ocean convection regions, the Greenland Sea and Labrador Sea. The freshwater route from the Arctic to the Greenland Sea goes through Fram Strait while the route to the Labrador Sea passes through the Canadian Archipelago, into Baffin Bay, and then through Davis Strait (Fig. 1). Lazier and Wright (1993) estimated that the freshwater flux coming out of Baffin Bay asso- ciated with the sea ice melting in that area repre- sents 70% of the freshwater seasonal anomaly ARTICLE IN PRESS www.elsevier.com/locate/dsr 0967-0637/$ - see front matter r 2004 Elsevier Ltd. All rights reserved. doi:10.1016/j.dsr.2004.10.006 Corresponding author. E-mail address: [email protected] (J. Cuny).
-
Upload
washington -
Category
Documents
-
view
0 -
download
0
Transcript of Davis Strait volume, freshwater and heat fluxes

ARTICLE IN PRESS
0967-0637/$ - se
doi:10.1016/j.ds
�CorrespondiE-mail addre
Deep-Sea Research I 52 (2005) 519–542
www.elsevier.com/locate/dsr
Davis Strait volume, freshwater and heat fluxes
Jerome Cunya,�, Peter B. Rhinesa, Ron Kwokb
aSchool of Oceanography, University of Washington, Seattle, Washington, USAbJet Propulsion Laboratory, California Institute of Technology, Pasadena, CA, USA
Received 3 September 2003; received in revised form 29 June 2004; accepted 18 October 2004
Available online 29 January 2005
Abstract
Volume, freshwater and heat transport through Davis Strait, the northern boundary of the Labrador Basin, are
computed using a mooring array deployed for three consecutive years. The net volume, freshwater and heat transports
are �2:6� 1:0Sv; �92� 34mSv; 18� 17� 1012 W: Both southward and northward volume and freshwater transports
are maximum in November. The seasonal variability is dictated by the variability in the main water mass transports:
Irminger Sea Water, West Greenland shelf water, surface meltwater, and a cold intermediate layer (CIL) originating
from Lancaster Sound. The southward freshwater transport seasonal amplitude is dominated by the CIL transport
rather than the surface meltwater layer. Sea-ice transport through Davis Strait deduced from remote sensing data is
equal to 528km3=year which is much smaller than equivalent estimates for Fram Strait. Using these new estimates, we
attempt to close the Arctic Ocean volume and freshwater budget.
r 2004 Elsevier Ltd. All rights reserved.
Keywords: Davis Strait; Labrador Sea; Baffin Bay; Transports; Freshwater; Sea ice
1. Introduction
The Arctic hydrological cycle is a complexcombination of land runoff, precipitation, icefreezing–melting and input of salty water fromBering Strait, Fram Strait and Barents Sea shelf.The Arctic Ocean represents only 1% of the worldocean but receives 11% of world river runoff(Shiklomanov et al., 2000). The atmosphere andthe ocean play complementary roles as the atmo-
e front matter r 2004 Elsevier Ltd. All rights reserve
r.2004.10.006
ng author.
ss: [email protected] (J. Cuny).
sphere brings moisture to the Arctic and the oceancarries the freshwater southward. Any change inthe fresh water flux out of the Arctic affects thenearby ocean convection regions, the GreenlandSea and Labrador Sea. The freshwater route fromthe Arctic to the Greenland Sea goes throughFram Strait while the route to the Labrador Seapasses through the Canadian Archipelago, intoBaffin Bay, and then through Davis Strait (Fig. 1).Lazier and Wright (1993) estimated that the
freshwater flux coming out of Baffin Bay asso-ciated with the sea ice melting in that area repre-sents 70% of the freshwater seasonal anomaly
d.

ARTICLE IN PRESS
Fig. 1. (a) Circulation diagram for the northwest North Atlantic and Baffin Bay. WGC: West Greenland Current; EGC: East
Greenland Current; NAC: North Atlantic Current; DWBC: Deep Western Boundary Current. The rectangle indicates the area shown
in (b). (b) Circulation diagram for the Davis Strait region.
J. Cuny et al. / Deep-Sea Research I 52 (2005) 519–542520
downstream on the Labrador shelf. The remainingseasonal freshwater anomaly observed on theLabrador shelf and the interior Labrador Sea aredue to the melting of ice drifting with the shelfLabrador Current (Khatiwala et al., 2002). Hud-son Bay runoff or sea ice melt is not consideredresponsible for the Labrador Sea fresh waterannual minimum because of the inconsistenttiming (Myers et al., 1990).The thickness and freshness of the cap formed
by the freshwater influx atop the Labrador Sea arekey components of the convective activity. Goosseet al. (1997) have tested with their model theimportance of the fresh water inflow from DavisStrait by opening and closing the CanadianArchipalego passage. They observed a 10%decrease of the overturning circulation whenopening the archipelago passage. Wadley and Bigg(2002) suggest from another numerical model runthat the decrease could reach 35%. Moreover,Steele et al. (1996) suggest with their model resultsthat in the case of an increased melting of theArctic Ocean ice, the export of excess fresh water
would be more important through the CanadianArchipelago than through Fram Strait.Houghton and Visbeck (2002) presented the
interannual salinity variations of the freshwatersources for the Labrador Sea, emphasizing thelarge anomalous events called ‘Great SalinityAnomalies’ (GSA) which were observed at thebeginning of the 1970s, 1980s and 1990s. Theyestimated that the magnitude of the fresh watertransport (liquid and sea ice) through Davis Straitwas large enough that an anomaly of reasonableamplitude could explain the GSAs in the LabradorSea. They did not observe a clear decadalfluctuation in the freshwater flowing southwardthrough Davis Strait. However, they found thatthe salinity had a general downward trend from1948 till the beginning of the 1990s. On the eastside of Davis Strait, the salinity had significantdecadal fluctuations clearly related to similarfluctuations in the salinity upstream along theWest Greenland coast, but quite different from thesignal observed at Cape Farewell. The interactionbetween the boundary current and the interior

ARTICLE IN PRESS
J. Cuny et al. / Deep-Sea Research I 52 (2005) 519–542 521
Labrador Sea seems to be the main factor in thesalinity fluctuations along the West Greenlandcoast.Mean annual volume and fresh water transports
in the northwest North Atlantic have been esti-mated to compute the fresh water budget of theLabrador Sea and to determine the origin of theMiddle Atlantic Bight waters (Chapman andBeardsley, 1989; Mertz et al., 1993; Loder et al.,1998). Loder et al. (1998) found that the liquid freshwater input from Davis Strait (120mSv) represents60% of the total annual mean fresh water input inthe Labrador Sea, thus being the largest source byfar. Hudson Strait, the East Greenland Current,precipitation and runoff from Greenland andLabrador are the other main sources. Ingram andPrinsenberg (1998) estimate that the annual meansea-ice export through Davis Strait is equivalent to35mSv of fresh water, making sea ice a significantfactor in the fresh water budget.The Canadian Archipelago is a complex maze of
channels which still need to be monitored accu-rately over an extended period of time. DavisStrait is a more constrained passage which allowsus to measure more easily the exchanges betweenthe Arctic and the North Atlantic subpolar gyre onthe western side of Greenland. In this study, weanalyze a very complete dataset which coveredDavis Strait from September 1987–1990 (Ross,1992). The dataset includes observations fromcurrent meter moorings and hydrographic sec-tions. We also analyzed the sea-ice transportdeduced from satellite data through Davis Strait.The mooring data show that the Davis Strait
circulation is mostly a two-way flow with thesouthward flow covering most of the strait width.We computed the volume, freshwater and heattransport annual cycle from the mooring data. Thesouthward freshwater flow is composed of asurface meltwater layer and a cold intermediatelayer (CIL). The amplitude of the seasonal cycleis mostly dictated by the CIL which originatesfrom the Lancaster Sound (Fig. 1). The sea-icetransport through Davis Strait shows signifi-cant month to month variability through thewinter but no real interannual variability. Theheat flux anomaly with respect to 0 �C towardsthe Arctic is mainly defined by the northward
flow of warm Irminger sea water (ISW) and thesouthward flow of the cold intermediate layer,with sub-zero temperature.
2. Data description
2.1. Moorings
A set of moorings was placed across Davis Straitbetween September 1987 and August 1990 (Ross(1992); Fig. 2). The moorings were equipped withAandera RCM5 current meters. Each instrumentwas set up to measure at hourly intervals thecurrent velocity, temperature and salinity. Statis-tics for each mooring are presented in Table 1 andthe data return is shown in Table 2. Theinstruments were located approximately at thesame locations during the 3-year period except forone mooring which was displaced from the middleof the ridge during the first year to the easternflank of the ridge for the two following years. Wecalibrated the salinity and temperature data byusing the available conductivity temperature depth(CTD) casts described below. The numerous gapsin the data prevented us from deducing a 3-yeartime series at each instrument. An instrument toinstrument correlation reveals that instrumentsfrom the same mooring are well correlated to eachother with a vertical e-folding scale of approxi-mately 400m in the vertical. However, correlationbetween instruments from different moorings isvery poor suggesting that the mooring array is toosparse to fully capture all the variability in thestrait circulation. We assumed that the instrumentswere close enough from one year to the next thatwe can average all the data available to obtain oneaverage year of daily data at each instrumentlocation. We considered six mooring locations andthree depths (150, 300, 500m) and called themoorings M1 through M6 starting from thewesternmost mooring.In order to compute meaningful transport
estimates, we had to compensate for the lack ofdata in the top 150m of the water column. First,we assumed that when the surface above themoorings is covered with ice, the temperature andthe salinity are constant from 150m to the surface.

ARTICLE IN PRESS
Table 1
Mooring statistics
Nominal depth (L on, L at) Time period Zonal vel. Merid. Vel. Speed Temp. Salinity
in m 3W, 3N mean � std mean � std mean � std mean � std mean � std
in cm/s in cm/s in cm/s in 3C
M1 157, 153, 142 60.96, 66.26 Sep. 1987 1� 11:9 1:5� 24:8 46� 34:9 1:5� 0:1 33:14� 0:28307, 302, 292 Aug. 1990 2:2� 7:9 4:2� 23:3 37:7� 31:3 0:9� 0:4 33:69� 0:15
M2 171, 165, 151 59.98, 66.26 Sep. 1987 1:1� 8:8 4:4� 19:9 35:1� 24:9 1:6� 0:1 33:26� 0:28321, 313, 301 Aug. 1990 0:7� 5:7 3� 16:4 27:8� 20:8 0:3� 0:6 33:91� 0:17521, 513, 501 0:8� 5:8 2:1� 13:2 23:2� 16:6 0:9� 0:1 34:39� 0:06
M3 166, 170, 163 59, 66.25 Sep. 1987 0:9� 7:8 5� 16:9 28:5� 20:8 1:3� 0:3 33:53� 0:15316, 318, 313 Aug. 1990 0:2� 5:6 1:1� 14:8 23:1� 16:8 0:3� 0:8 34:09� 0:12516, 517, 513 0:2� 4:5 0:1� 13:7 21:7� 16:5 1:3� 0:3 34:49� 0:06
M4 150 58.38, 66.26 Sep. 1987 2:4� 13:1 4:2� 24:6 39:9� 29:1 0:6� 1:5 33:71� 0:2300 Oct. 1988 0� 7:2 0:9� 14 20:5� 14:4 2:6� 1:3 34:41� 0:18500 3:3� 9:5 1� 13:2 18:1� 12:7 1:7� 0:3 34:51� 0:05
M5 146, 150 57.44, 66.25 Oct. 1988 2:6� 7:2 8� 13 27:4� 18:7 0:9� 1:8 34:13� 0:19295, 300 Aug. 1990 1:4� 6:6 4:7� 12:5 20:9� 15:2 2:5� 1:4 34:46� 0:18495, 500 1:4� 6:6 3:6� 12:3 19:7� 14:5 2:4� 1 34:71� 0:09
M6 145, 156, 150 56.77, 66.26 Sep. 1987 2:1� 8:2 5:3� 14:3 22:3� 18:4 2:2� 1:4 34:27� 0:15295, 304, 300 Aug. 1990 1:4� 6:3 4:8� 14:3 23� 18:2 3:8� 0:8 34:64� 0:08495, 504, 500 1� 5:6 3:7� 15:1 24:7� 18:8 3:4� 0:7 34:84� 0:09
Nominal depths are given for each one-year period when the moorings were deployed.
Fig. 2. Mooring and hydrographic station locations in Davis Strait for (a) September 1987, (b) October 1988, (c) September 1989, (d)
September 1990. Circles indicate the location of the moorings which were present for the following year. The black dots indicate the
hydrographic station location.
J. Cuny et al. / Deep-Sea Research I 52 (2005) 519–542522
ARTICLE IN PRESS
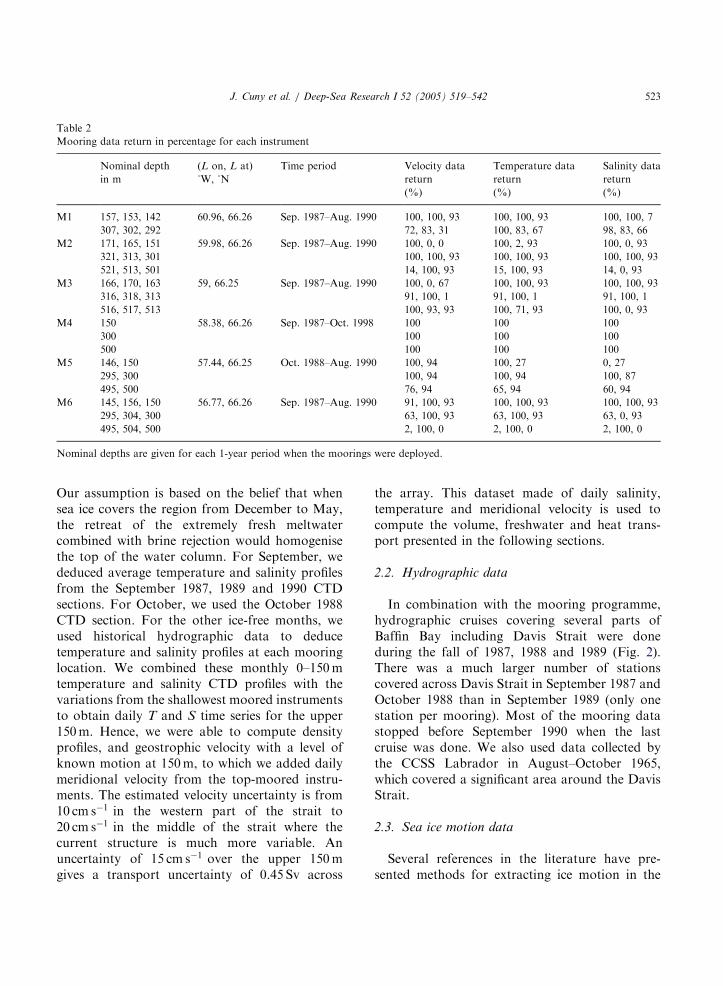
Table 2
Mooring data return in percentage for each instrument
Nominal depth (L on, L at) Time period Velocity data Temperature data Salinity data
in m 3W, 3N return return return
(%) (%) (%)
M1 157, 153, 142 60.96, 66.26 Sep. 1987–Aug. 1990 100, 100, 93 100, 100, 93 100, 100, 7
307, 302, 292 72, 83, 31 100, 83, 67 98, 83, 66
M2 171, 165, 151 59.98, 66.26 Sep. 1987–Aug. 1990 100, 0, 0 100, 2, 93 100, 0, 93
321, 313, 301 100, 100, 93 100, 100, 93 100, 100, 93
521, 513, 501 14, 100, 93 15, 100, 93 14, 0, 93
M3 166, 170, 163 59, 66.25 Sep. 1987–Aug. 1990 100, 0, 67 100, 100, 93 100, 100, 93
316, 318, 313 91, 100, 1 91, 100, 1 91, 100, 1
516, 517, 513 100, 93, 93 100, 71, 93 100, 0, 93
M4 150 58.38, 66.26 Sep. 1987–Oct. 1998 100 100 100
300 100 100 100
500 100 100 100
M5 146, 150 57.44, 66.25 Oct. 1988–Aug. 1990 100, 94 100, 27 0, 27
295, 300 100, 94 100, 94 100, 87
495, 500 76, 94 65, 94 60, 94
M6 145, 156, 150 56.77, 66.26 Sep. 1987–Aug. 1990 91, 100, 93 100, 100, 93 100, 100, 93
295, 304, 300 63, 100, 93 63, 100, 93 63, 0, 93
495, 504, 500 2, 100, 0 2, 100, 0 2, 100, 0
Nominal depths are given for each 1-year period when the moorings were deployed.
J. Cuny et al. / Deep-Sea Research I 52 (2005) 519–542 523
Our assumption is based on the belief that whensea ice covers the region from December to May,the retreat of the extremely fresh meltwatercombined with brine rejection would homogenisethe top of the water column. For September, wededuced average temperature and salinity profilesfrom the September 1987, 1989 and 1990 CTDsections. For October, we used the October 1988CTD section. For the other ice-free months, weused historical hydrographic data to deducetemperature and salinity profiles at each mooringlocation. We combined these monthly 0–150mtemperature and salinity CTD profiles with thevariations from the shallowest moored instrumentsto obtain daily T and S time series for the upper150m. Hence, we were able to compute densityprofiles, and geostrophic velocity with a level ofknown motion at 150m, to which we added dailymeridional velocity from the top-moored instru-ments. The estimated velocity uncertainty is from10 cm s�1 in the western part of the strait to20 cm s�1 in the middle of the strait where thecurrent structure is much more variable. Anuncertainty of 15 cm s�1 over the upper 150mgives a transport uncertainty of 0.45 Sv across
the array. This dataset made of daily salinity,temperature and meridional velocity is used tocompute the volume, freshwater and heat trans-port presented in the following sections.
2.2. Hydrographic data
In combination with the mooring programme,hydrographic cruises covering several parts ofBaffin Bay including Davis Strait were doneduring the fall of 1987, 1988 and 1989 (Fig. 2).There was a much larger number of stationscovered across Davis Strait in September 1987 andOctober 1988 than in September 1989 (only onestation per mooring). Most of the mooring datastopped before September 1990 when the lastcruise was done. We also used data collected bythe CCSS Labrador in August–October 1965,which covered a significant area around the DavisStrait.
2.3. Sea ice motion data
Several references in the literature have pre-sented methods for extracting ice motion in the

ARTICLE IN PRESS
J. Cuny et al. / Deep-Sea Research I 52 (2005) 519–542524
winter (December to May) from SMMR/SSMIpassive microwave data (Agnew et al., 1998; Liuand Cavalieri, 1998; Kwok et al., 1998). Summerice motion is unreliable because of the confound-ing effects of surface melt and atmospheric watervapor. The ice area fluxes presented here areproduced by the ice tracking procedure describedby Kwok et al. (1998). The error on the ice fluxestimates includes a spatial and temporal compo-nent. The spatial error formula is sF ¼ suL=
ffiffiffiffiffiffiffiNS
p
in km2: L is the length of the line across which thefluxes are computed (345 km for Davis Strait), su
is the standard error in motion estimates, and NS
is the number of independant samples. Thesenumbers give a spatial error of 1991 km2 before1992 (su ¼ 10 km and NS ¼ 3) and 925 km2 after1992 (su ¼ 6 km and NS ¼ 5). The error over acertain period of time is given by sT ¼ sF �
ffiffiffiffiffiffiffiND
p
in km2: ND is the number of observations over theperiod of time considered. We used monthly valuesof ice area flux, so the total error on each monthlyvalue of ice area flux is 7711 km2 before 1992(ND ¼ 15) and 5066 km2 after 1992 (ND ¼ 30).The results after 1992 are more reliable not onlybecause of the resolution but also because the37GHz channel used before rarely allowed fluxestimates beyond April, whereas the 85GHzchannel used after 1992 systematically provideddata for May.
3. Davis Strait circulation
3.1. Mean circulation from hydrographic data
There is a two way flow going through the 600mdeep Davis Strait. Cold and fresh water(y � �1:5 �C; 32:5pSp33:5) flows south fromBaffin Bay with the Baffin Island Current (Figs.1, 3 and 4). Warm and salty Irminger SeaWater (y � 4 �C; S � 34:78), remnant of the GulfStream water which has travelled around thesubpolar gyre, flows north with the West Green-land Current at the bottom on the eastern side ofDavis Strait. This current is one of the branches ofthe system which splits the ISW between the deepLabrador Current, the West Greenland CurrentExtension and the West Greenland Current (Cuny
et al., 2002). In Baffin Bay, ISW mixes with polarwaters particularly in the North Water Polynyaregion (Melling et al., 2001). On the West Green-land shelf (WGS), fresh and cold water ofArctic origin (y � 2:3 �C; 32pSp33) which hastravelled around Greenland from Fram Straitand Denmark Strait flows northward and formsa density front at the shelf break with thewarmer ISW. The densest water crossing theDavis Strait northward is at the bottom of theISW core with an average potential density of27:72s0 and some peaks at 27:78s0 recorded atmooring M6.The large number of hydrographic stations done
in September 1987 and October 1988 provides aclear picture of the circulation in the fall (Figs. 3and 4). We assumed geostrophy with a level of nomotion at the bottom. Then at each mooringlocation, we deduced a barotropic component asthe average difference between the 3-day averagemoored instruments velocity and the CTD geos-trophic velocity. We interpolated to obtain thebarotropic component at each CTD station loca-tion. We must mention that the velocity sectionwas very dependant on the chosen level of nomotion, most likely because there is no real level ofno motion in the strait. For the WGS, wecomputed the geostrophic velocity with a levelof no motion at the bottom and added the velo-city obtained from the shallowest instrumentat the easternmost mooring M6 (3 cm s�1 for1987 and 8 cm s�1 for 1988). This is surely anoverestimate as this instrument is close to the coreof the shelf break West Greenland Current.However, it was the closest absolute velocityavailable.The Baffin Island Current core is located above
the 400m isobath and peaks at the surface at15–20 cm s�1 (Figs. 3d and 4d) with a 5� 10�4 s�1
vertical shear in the top 150m. On the eastern side,the West Greenland Current flows along the shelfbreak with a maximum speed of 15 cm s�1with a4� 10�4 s�1 vertical shear in the top 150m. Wealso observed a southward current on the easternside of the ridge, which we thought at first to bethe continuity of the Baffin Island Current travell-ing around the ridge to reach the eastern flank.This branch can also reach 20 cm s�1: Strangely,

ARTICLE IN PRESS
Fig. 3. Salinity (a), Potential temperature (�C) (b), Potential density s0 (kgm�3) (c), and absolute velocity (cm s�1) (d) across Davis
Strait in September 1987. The contour intervals are respectively 0.5 from 24 to 33.5 and then 0.2 for 33.7 and beyond for (a), 1 �C for
(b), 0:5 kgm�3 for (c), and 5 cm s�1 for (d). The absolute velocity section is deduced from the CTD section and the mooring data
available during the same period of time (see text for detail). The circles indicate the CTD cast locations and the squares indicate the
mooring locations available at the time of the CTD section.
J. Cuny et al. / Deep-Sea Research I 52 (2005) 519–542 525
we observed a significant northward flow betweenthe two southward branches, evidence of arecirculation west of the ridge, only in theSeptember 1987 section (Fig. 3d). This suggeststhat the recirculation might not be a permanentfeature or that the Baffin Island Current divergesupstream into two branches when the isobathsdiverge at around 67�N.We used the extensive hydrographic survey done
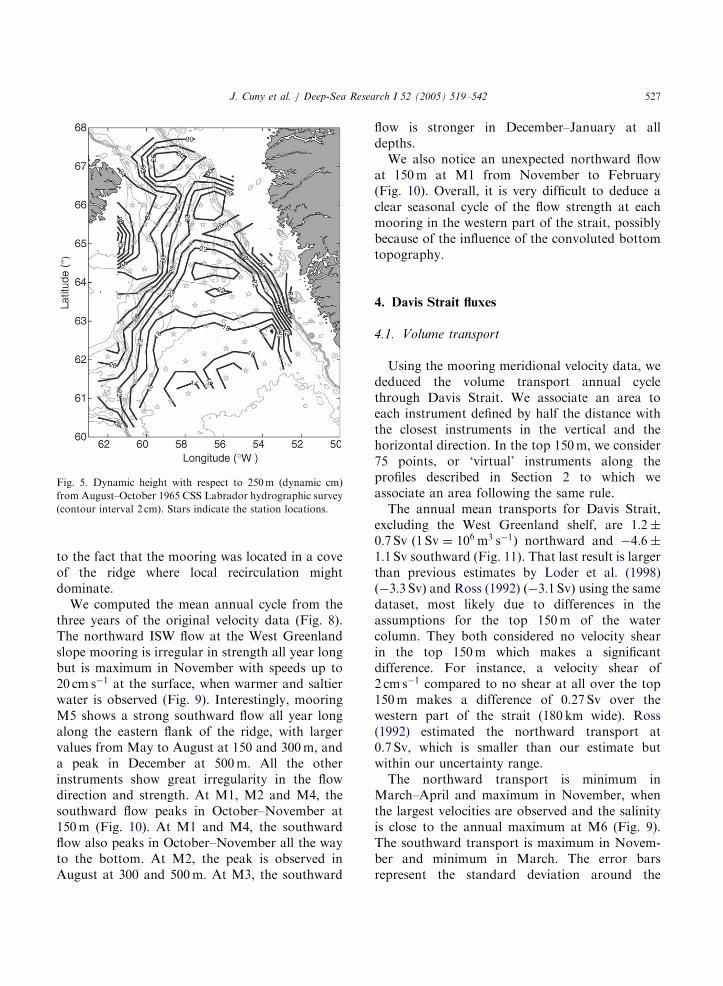
in August–October 1965 from 60�N to 68�N to geta better understanding of the 2-D circulation inhorizontal space by mapping the dynamic heightwith respect to a reference depth of 250m (Fig. 5).There are recirculation regions north and south-
east of the ridge with dynamic height values of 26dynamic cm. The recirculation north of the ridge,already mentioned earlier was expected due to thesouthward flow and the ridge shape, but therecirculation south of the ridge was more surpris-ing. It seems that when the West GreenlandCurrent gets closer to the ridge, it gets partiallydiverted to the south due to the branch of theBaffin Island Current flowing on the eastern flankof the ridge.On the WGS, speeds can reach 10 cm s�1; which
agrees well with the speeds measured by twosurface drifters that crossed this region in Decem-ber 1996 and November 1995 (Cuny et al., 2002).

ARTICLE IN PRESS
Fig. 4. Same as Fig. 3 but for October 1988.
J. Cuny et al. / Deep-Sea Research I 52 (2005) 519–542526
We notice some evidence of a northward currentof low salinity water very close to the coast andseparate from the shelf break flow, similar to theEast Greenland Coastal Current described byBacon et al. (2002) . The historical hydrographicdata on the WGS between 66�N and 67�N (Fig. 6)show that between October and December, whenthe freshest water is observed, the salinity mini-mum is found quite close to the Greenland coast,between 30 and 60 km. There seems to be a secondminimum closer to the shelf break between 70 and90 km. There is another salinity minimum veryclose to the coast around 20 km offshore observedonly in summer which could be the continuity ofthe East Greenland Coastal Current described byBacon et al. (2002). The waters above the shelfbreak (120–130 km) show very little seasonal
variability. Considering the error bars, there is alot of uncertainty in the lateral salinity gradient wejust described.
3.2. Circulation from the mooring data
We also estimated the mean circulation byaveraging the 3 years of the original raw mooringvelocity data (Fig. 7). The circulation is essentiallya two way flow and matches the description so far.In the western part of the strait, most of the flowconverges towards the 600m isobath as the BaffinIsland Current. The fastest flow is always observedat 150m except at M1, for reasons that we willmention in Section 5. Only M4 seems to have anunusual behaviour with each instrument indicat-ing a different direction. This is most likely due
ARTICLE IN PRESS
Fig. 5. Dynamic height with respect to 250m (dynamic cm)
from August–October 1965 CSS Labrador hydrographic survey
(contour interval 2 cm). Stars indicate the station locations.
J. Cuny et al. / Deep-Sea Research I 52 (2005) 519–542 527
to the fact that the mooring was located in a coveof the ridge where local recirculation mightdominate.We computed the mean annual cycle from the
three years of the original velocity data (Fig. 8).The northward ISW flow at the West Greenlandslope mooring is irregular in strength all year longbut is maximum in November with speeds up to20 cm s�1 at the surface, when warmer and saltierwater is observed (Fig. 9). Interestingly, mooringM5 shows a strong southward flow all year longalong the eastern flank of the ridge, with largervalues from May to August at 150 and 300m, anda peak in December at 500m. All the otherinstruments show great irregularity in the flowdirection and strength. At M1, M2 and M4, thesouthward flow peaks in October–November at150m (Fig. 10). At M1 and M4, the southwardflow also peaks in October–November all the wayto the bottom. At M2, the peak is observed inAugust at 300 and 500m. At M3, the southward
flow is stronger in December–January at alldepths.We also notice an unexpected northward flow
at 150m at M1 from November to February(Fig. 10). Overall, it is very difficult to deduce aclear seasonal cycle of the flow strength at eachmooring in the western part of the strait, possiblybecause of the influence of the convoluted bottomtopography.
4. Davis Strait fluxes
4.1. Volume transport
Using the mooring meridional velocity data, wededuced the volume transport annual cyclethrough Davis Strait. We associate an area toeach instrument defined by half the distance withthe closest instruments in the vertical and thehorizontal direction. In the top 150m, we consider75 points, or ‘virtual’ instruments along theprofiles described in Section 2 to which weassociate an area following the same rule.The annual mean transports for Davis Strait,
excluding the West Greenland shelf, are 1:2�0:7 Sv ð1 Sv ¼ 106 m3 s�1Þ northward and �4:6�1:1 Sv southward (Fig. 11). That last result is largerthan previous estimates by Loder et al. (1998)ð�3:3 SvÞ and Ross (1992) ð�3:1 SvÞ using the samedataset, most likely due to differences in theassumptions for the top 150m of the watercolumn. They both considered no velocity shearin the top 150m which makes a significantdifference. For instance, a velocity shear of2 cm s�1 compared to no shear at all over the top150m makes a difference of 0.27 Sv over thewestern part of the strait (180 km wide). Ross(1992) estimated the northward transport at0.7 Sv, which is smaller than our estimate butwithin our uncertainty range.The northward transport is minimum in
March–April and maximum in November, whenthe largest velocities are observed and the salinityis close to the annual maximum at M6 (Fig. 9).The southward transport is maximum in Novem-ber and minimum in March. The error barsrepresent the standard deviation around the

ARTICLE IN PRESS
0 20 40 60 80 100 12030
30.5
31
31.5
32
32.5
33
33.5
34
34.5
35
Distance from Greenland coast (km)
Sal
inity
Fig. 6. Salinity across the WGS versus distance from the Greenland coast. We considered the historical data collected between 66�N
and 67�N between 1920 and 2000. All the data are shown with the grey symbols. The black lines with symbols show the seasonal mean
per 5 km bin. Stars are for winter months (January through March), squares are for spring (April through June), triangles are for
summer (July through September), and circles are for fall (October through December). The error bars indicate the standard deviation
around each mean. The standard deviation represents an upper bound on the standard error which is defined by std=pðN � 1Þ; with
std the standard deviation and N the effective number of degrees of freedom. The effective number of degrees of freedom is defined as
the number of points included in the mean computation, which are statistically independent. We consider a minimum value for N of 2
for each 5 km bin.
J. Cuny et al. / Deep-Sea Research I 52 (2005) 519–542528
monthly mean deduced from the daily transportvalues. However, we suspect that they under-estimate the error as they do not explicitely includethe error associated with our assumptions for thetop 150m. Comparisons with the transport esti-mates from the CTD absolute velocity sectionpresented earlier should provide more realisticuncertainty estimates (Table 3, Fig. 11). Theaverage uncertainty on the mooring estimate is20% for the northward transport and 40% for thesouthward transport. The uncertainty for thenorthward transport seems surprisingly smallconsidering that the northward flow is capturedby only one mooring. For the northward trans-port, the average uncertainty in the top 150m istwice as big as for the transport below 150m. Forthe southward transport, the average uncertaintyin the top 150m is two thirds of the uncertainty
below 150m. This is expected as the southwardtransport dominates the section and the top 150mmooring estimate is dependant on the fall CTDprofiles. The CTD transport estimates also revealthat on average 55% of the southward transportand 34% of the northward transport are containedin the top 150m.It is interesting to use the CTD data also to look
at the transport distribution with respect totemperature and salinity (Fig. 12a, d). We computethe net transport for three main water massesdefined by different regions on the y� S diagram:ISW (S4 ¼ 34:5), CIL (yo ¼ �1 �C and So34:5)and the rest of the diagram which includes thesurface waters, the WGS and the bottom waters onthe western part of the strait (So34:5 andy4� 1 �C). The bottom waters on the westernpart of the strait have only a marginal effect on

ARTICLE IN PRESS
300
400
500
600
700
600
700
1000
68°N
67°N
66°N
65°N
64°N 63°N 60°N 57°N 54°N 51°N
6 cm.s-1
Longitude (°W )
Latit
ude
(°N
)
Fig. 7. Three-year mean velocity from the original mooring data (cm s�1). The dark, medium and light grey arrows are respectively for
the instruments at 150, 300, and 500m.
J. Cuny et al. / Deep-Sea Research I 52 (2005) 519–542 529
this net transport because of the very weakvelocities. Most of the southward transport isassociated with cold and fresh water while thenorthward transport is associated with warmerand saltier waters. We observed slight differencesbetween the 1987 and 1988 results. The largestsouthward transport is more confined in the range33pSp33:5 with y close to �1:8 �C in October1988 compared to September 1987. In both years,there is a significant southward transport of warmand salty water where we expected only northwardtransport. It is even more marked in September1987 than October 1988 when the Baffin Islandcurrent branch on the eastern side of the ridgeentrains a significant amount of ISW southward(Fig. 3d).The hydrographic estimates used in for the
earlier comparisons did not include the WGScomponent which is not covered at all by themooring array. Hydrographic transport estimatesfor the WGS are given in Table 4. This suggeststhat the mooring array misses a northwardtransport component possibly as large as 1.6 Sv.We computed an upper limit of the transportover a year by multiplying the velocity given bythe top instrument at M6 with the area above
the shelf, assuming that the vertical shear wasweak (Figs. 3d and 4d). With that approachSeptember and October transports are, respec-tively, equal to 0.9 and 1.6 Sv, quite close to theestimates from CTD sections (Table 4). Weobtained an annual mean volume transport of0:8� 0:8 Sv on the shelf. Combining the monthlytransport time series for the strait and the shelfgives a net transport of 2:6� 1:0 Sv southwardbetween Baffin Bay and the Labrador Sea.
4.2. Freshwater transport
4.2.1. Mean transport
We compute a freshwater transport annual cyclethrough Davis Strait using the meridional velocityand salinity data described in Section 2. We definethe freshwater transport as
TFW ¼
Z ZVðS0 � SÞ
S0dA; (1)
with V being the speed across the section of area A,and S the salinity. The reference salinity S0 ischosen at 34.8. We choose this value for two mainreasons. It is the average isohaline between thefresh boundary current water and the offshore

ARTICLE IN PRESS
Jan68°N
67°N
66°N
65°N
64°N63°N 60°N 57°N 54°N 51°N
68°N
67°N
66°N
65°N
64°N
68°N
67°N
66°N
65°N
64°N
68°N
67°N
66°N
65°N
64°N
68°N
67°N
66°N
65°N
64°N
68°N
67°N
66°N
65°N
64°N
6 cm.s-1
Mar
6 cm.s -1
May
63°N 60°N 57°N 54°N 51°N
Sep
63°N 60°N 57°N 54°N 51°N
63°N 60°N 57°N 54°N 51°N63°N 60°N 57°N 54°N 51°N
Nov
63°N 60°N 57°N 54°N 51°N
Jul
6 cm.s -1
6 cm.s -1
6 cm.s -1
6 cm.s -1
(a) (b)
(c) (d)
(e) (f)
Fig. 8. Mean velocity from the original mooring data for January (a), March (b), May (c), July (d), September (e), and November (f).
The dark, medium and light grey arrows are respectively for the instruments at 150, 300, and 500m.
J. Cuny et al. / Deep-Sea Research I 52 (2005) 519–542530
saltier water in the Labrador Sea on both sides ofthe basin. It is also considered the mean ArcticOcean salinity (Aagaard and Carmack, 1989) andthe value most used in the literature allowing forappropriate comparisons. A change in the refer-ence salinity of 0.2 can change the freshwatertransport by 15% (Loder et al., 1998).
The annual mean freshwater transports excludingWGS are 22� 17mSv (1mSv ¼ 103 m3 s�1) north-ward, and �152� 58mSv southward (Fig. 13).The last estimate is close to the 120mSv given byLoder et al. (1998) for southward transport. Themaximum is in October–November for the south-ward transport which matches with the southward

ARTICLE IN PRESS
J F M A M J J A S O N D
-20
-10
0
10
J F M A M J J A S O N D32.632.8
3333.233.433.6
Sal
inity
J F M A M J J A S O N D -1.8
-1.6
-1.4
-1.2
V
eloc
ity (
cm s
- 1)
Tem
pera
ture
(° C
)
Fig. 10. Daily meridional velocity (top), salinity (middle) and temperature (bottom) at top instruments (150m) of mooring M1 and
M2. The darkest line corresponds to the mooring M1. Positive velocity means northward.
J F M A M J J A S O N D-10
0
10
20
Vel
ocity
(cm
s-1)
J F M A M J J A S O N D34
34.5
35
Sal
inity
J F M A M J J A S O N D1
2
3
4
5
Tem
pera
ture
(° C
)
Fig. 9. Daily meridional velocity (top), salinity (middle) and temperature (bottom) at all instruments (150, 300, 500m) of mooring M6.
The dark, medium and light grey lines are respectively for the instruments at 150, 300, and 500m. Positive velocity means northward.
J. Cuny et al. / Deep-Sea Research I 52 (2005) 519–542 531

ARTICLE IN PRESS
J. Cuny et al. / Deep-Sea Research I 52 (2005) 519–542532
maximum velocity at M2 at 150m but not with itsFebruary salinity minimum (Fig. 10). The max-imum northward transport is in November and isassociated with high velocities but also withsurprisingly salty waters at 150m (Fig. 9). Thereis a very good correlation between the freshwatertransport and the volume transport (larger than0.8) suggesting that both the West GreenlandCurrent and the Baffin Island Current are pre-dominantly buoyancy driven.We compare the mooring estimates to the CTD
estimates to get a more realistic range of un-
J F M A M J J A S O N D-8
-6
-4
-2
0
2
4
Sve
rdru
p (1
06 m3 .s
-1)
Fig. 11. Monthly mean volume transport (Sv ¼ 106 m3 s�1)
through Davis Strait deduced from the 1 year average mooring
data, WGS excluded. The negative and positive time series are
respectively for the southward and northward volume trans-
port. The error bars are the monthly standard deviation. Solid
circles and squares represent, respectively, the southward and
northward CTD volume transport estimates (see Table 3).
Table 3
Volume, freshwater and heat transport estimates from the CTD secti
Absolute transport from CTD Absolute fre
section (in Sv ¼ 106 m3=s) from CTD s
Southward Northward Southward
Sept. 1987 7.5 1.4 265.1
(3.8, 3.7) (0.9, 0.5) (190.6, 74.5)
Oct. 1988 4.3 1.2 218.6
(2.8, 1.5) (0.3, 0.9) (178.3, 40.3)
Sept. 1989 7.1 1.4 298.5
(3.7, 3.4) (0.2, 1.2) (214.7, 83.8)
The transport above and below 150m are given in parenthesis.
certainty (Table 3). The average uncertainty is63% of the mooring estimate for the northwardtransport and 36% for the southward transport.For the northward freshwater transport, theaverage uncertainty in the top 150m is two timeslarger than for the transport below 150m. For thesouthward freshwater transport, the average un-certainty in the top 150m is one third of theuncertainty below 150m. The CTD freshwatertransport estimates indicate that on average 75%of the southward freshwater transport and 70% ofthe northward freshwater transport are containedin the top 150m.In a similar fashion to our earlier estimate of the
net volume transport, we estimated the WGSfreshwater transport annual cycle to infer the netfreshwater transport between Baffin Bay and theLabrador Sea. We used the M6 top instrumentvelocity combined with historical salinity data. Weobtained freshwater transports for September andOctober, respectively, equal to 44.5 and 65.6mSvto be compared with the corresponding estimatesfrom the CTD sections (Table 4). The meanannual transport on the shelf is 38� 45mSv:Hence the net freshwater transport between BaffinBay and the Labrador Sea is �92� 34mSvsouthward, WGS included.
4.2.2. Seasonal cycle
We tried to explain the southward freshwaterseasonal cycle by quantifying the seasonal range ofeach freshwater source. The seasonal range insouthward freshwater transport is 135mSv whichcorresponds to a cumulative volume of fresh water
ons for the strait only, WGS excluded
shwater transport Absolute heat transport from
ection ð103 m3=sÞ CTD Section ð1012 WÞ
Northward Southward Northward
52 25.6 28.8
(42.5, 9.5) (10.5, 15.1) (20.5, 8.3)
18.6 8 27
(14.5, 4.1) (5.3, 2.7) (11.9, 15.1)
12.2 16 36.7
(6.3, 5.9) (8.7, 7.3) (11.8, 24.9)

ARTICLE IN PRESS
31 32 33 34 35-2
-1
0
1
2
3
4
5
6
24.8
25.6
26.4 27
.2
28
-2.1 Sv
-2.8 Sv
0.7
Sv
(a) (b) (c)
(d) (e) (f)
-1
-0.8
-0.6
-0.4
-0.2
0
0.2
0.4
0.6
0.8
1
31 32 33 34 35 -2
-1
0
1
2
3
4
5
6
24.8
25.6
26.4
27.2
28
-73.5 mSv
-118.5 mSv
-3.
8 m
Sv
-5000
-4000
-3000
-2000
-1000
0
1000
2000
3000
4000
5000
31 32 33 34 35 -2
-1
0
1
2
3
4
5
6
24.8
25.6
27.2
28
-1*1012W
16.4*1012W
-7.3
* 1012
W
-8
-6
-4
-2
0
2
4
6
8
31 32 33 34 35 -2
-1
0
1
2
3
4
5
6
Salinity
Pot
entia
l tem
pera
ture 24
.8
26.4 27
.2
28
-0.3 Sv
-1.8 Sv
0.7
Sv
-1
-0.8
-0.6
-0.4
-0.2
0
0.2
0.4
0.6
0.8
1
31 32 33 34 35 -2
-1
0
1
2
3
4
5
6
24.8 25
.6 26.4
27.2
28
-48.7 mSv
-80.1 mSv
2.4
mS
v
-5000
-4000
-3000
-2000
-1000
0
1000
2000
3000
4000
5000
31 32 33 34 35 -2
-1
0
1
2
3
4
5
6
24.8
25.6
26.4
27..2
28
13.6*1012W
11*1012W
10.3
* 1012
W
-8
-6
-4
-2
0
2
4
6
8
x105
x105
x1011
x1011
26.4
25.6
Fig. 12. (a) Volume (m3 s�1), (b) freshwater (m3 s�1), and (c) heat (W) transport per y� S class from Davis Strait hydrographic section
in September 1987, WGS included. (d,e,f) same as for a,b,c but for October 1988. Squares indicate northward transport and circles
indicate southward transport. We indicate the transport for three main water masses: ISW (S4 ¼ 34:5), CIL (yo ¼ �1 �C and
So34:5) and the surface waters (So34:5 and y4� 1 �C).
Table 4
CTD transport estimates for the WGS
Geostrophic transport Absolute transport Fresh water transport ðSo34:8Þ Heat transport NAO index
ð106 m3=sÞ ð106 m3=sÞ ð103 m3=sÞ ð1012 WÞ
Southward Northward Southward Northward Southward Northward Southward Northward
Sept. 1987 0.1 0.1 0.02 0.4 1.1 18.3 0.4 5.2 �0.75
Oct. 1988 0.03 0.3 0 1.6 0 73.5 0 16 0.72
J. Cuny et al. / Deep-Sea Research I 52 (2005) 519–542 533
of �12� 1011 m3 (Fig. 14a) from May to Novem-ber. The Baffin Bay sea-ice area annual cycle ispresented in Fig. 14b. Assuming an ice thickness of1m from mid-March to mid-June, 0.7m from mid-
June to mid-July, 0.5m from mid-July to mid-August and 0.3m from mid-August to mid-September (National Ice center data (http://www.
natice.noaa.gov/eastarct.htm)), we find that the

ARTICLE IN PRESS
J. Cuny et al. / Deep-Sea Research I 52 (2005) 519–542534
volume of fresh water equivalent to the vanish-ing sea ice is �3:9� 1011 m3 (see Section 4.3for formula). The vanishing ice either melted orwas advected south out of Baffin Bay. Asmentioned in the data presentation, the scatte-
J F M A M J J A S O N D-350
-300
-250
-200
-150
-100
-50
0
50
100
FW
tran
spor
t (10
3 m3 .s
-1)
Fig. 13. Monthly mean freshwater transport (mSv, 103 m3 s�1)
through Davis Strait deduced from the 1 year average mooring
data, WGS excluded. The negative and positive time series are
respectively for the southward and northward freshwater
transport. The error bars are the monthly standard deviation.
Solid circles and squares represent, respectively, the south-
ward and northward CTD freshwater transport estimates (see
Table 3).
J F M A M J J A S O N D-300
-250
-200
-150
-100
FW
tran
spor
t (10
3 m3 .
s-1)
(a)
Fig. 14. (a) Southward freshwater transport from the one year averag
around the monthly mean transport values. (b) Baffin Bay sea ice are
rometer instruments cannot detect ice motionbeyond the month of May. We had to rely onthe work done by Jordan and Neu (1982), whomeasured the ice width and speed at Davis Straitfrom NOAA-5 weather satellite pictures over ayear. Using the mean April and May sea ice fluxdeduced from SSM/I over 1992–2000 and theconditions described by Jordan and Neu (1982) in1979 for June and July, we find that the volume offresh water equivalent to the cumulated southwardtransport of solid sea ice through Davis Straitfrom April to July is roughly �1:3� 1011 m3: Weassumed an ice thickness of 1m in April–May and0.7m in June–July. As Baffin Bay is ice free at theend of summer, this means that the remaining2:6� 1011 m3 corresponds to melted water. Inorder to infer the amount of meltwater goingthrough Davis Strait, we used results from Tanand Strain (1980), who separated meltwater frommeteoric water (precipitation, runoff and glaciermelt) using d18O and salinity. They found that inthe western part of the strait the meltwaterconcentration went from 0 at 35m to 15% at thesurface. We applied this gradient to our dailyvelocity field and computed the freshwater trans-port in the top 35m of the water column assuminga salinity of 5 for the meltwater. The volume of
J F M A M J J A S O N D0
1
2
3
4
5
6
7
8
Sea
ice
area
( 1
05 km
2 )
(b)
e mooring data. The error bars represent the standard deviation
a (km2) mean annual cycle.

ARTICLE IN PRESS
J. Cuny et al. / Deep-Sea Research I 52 (2005) 519–542 535
fresh water equivalent to the meltwater goingthrough Davis Strait from May to November is�0:8� 1011 m3: This volume is surprisingly smallas we expected the melting sea ice in Baffin Bay tohave a larger impact on the freshwater transportseasonal cycle. This implies that two thirds of themeltwater from Baffin Bay sea ice recirculateswithin Baffin Bay and that the meteoric waters(river runoff+precipitation) are a main factor forthe seasonal cycle in southward freshwater trans-port at Davis Strait. The freshwater transportdistribution per y� S (Fig. 12b, e) separates theinput from two different water masses in thesouthward transport: one located at the surfacewith density between 25 and 25.5s0 and salinitybetween 31.5 and 32, and the other one locatedaround 150m with density between 26.5 and 27s0and salinity between 33 and 33.5. The cumulativetransport in the latter class is the largest. If themeltwater estimate is realistic, we deduce thatthe deeper fresh water class is more important forthe seasonal cycle in transport.
85 80 75 7064
66
68
70
72
74
76
78
80
Longitud
Latit
ude
(°N
)
1000500
Smith Sound
Jones Sound
Lancaster Sound
Fig. 15. Locations of the stations used for the evolution of the she
collected at different times: West Greenland shelf 66�N, 71.5�N, 76�N
1983), Lancaster Sound (Aug. 1983), Baffin Island coast 72�N, 66�N (
Using Baffin Bay hydrographic data, we locatedthe source of this CIL (Figs. 15 and 16). The waterobserved at Davis Strait in the density range26.5–27s0 is not a mix of WGS water with watersfrom the Canadian Archipelago. The westernDavis Strait profiles do not lie between the profilesfrom the eastern Baffin Bay and the profiles fromthe different straits on the y� S diagram (Fig. 16).It is indeed very close to the profiles from thesouthern Lancaster Sound suggesting that it isoverwhelmingly influenced by Arctic water comingthrough Parry Channel. Macdonald et al. (1989)suggest that this water mass is a combination ofPacific water and Beaufort shelf water whichspilled off the shelf when its salinity increaseddue to ice formation. This agrees with the highPacific water concentration observed in the wes-tern part of Davis Strait (Jones et al., 2003).Hamilton et al. (2002) reported that a 170m deepinstrument in Lancaster Sound recorded a salinityminimum in June–July at 90�W. Combining themooring data from different sources (Hamilton
65 60 55 50
e (° W)
500
200
500
500
500
Davis Strait
lf waters around Baffin Bay shown in Fig. 16. The data were
(September 1987), Smith Sound (Aug. 1980), Jones Sound (Aug.
September 1987). The 200, 500, and 1000m isobaths are shown.

ARTICLE IN PRESS
2
2.5
326
.2
26.4
26.4
26.4
26.6
26.6
26.6
26.8
26.8
26.8
27
27
30 31 32 33 34 -2
-1
0
1
2
3
4
5
23.6
24 24.4
24.8
25.2
25.6
26
26.4
26.8
27.2
27.6
32.8 32.9 33 33.1 33.2 33.3 33.4 33.5 33.6 33.7-2
-1.5
-1
-0.5
0
0.5
1
1.5
Salinity
Pot
entia
l tem
pera
ture
Davis Strait E.
W. Greenland 71°NW. Greenland 75°NSmith SoundJones SoundLancaster SoundBaffin Isl. 72°NDavis Strait W.
Fig. 16. y� S diagram showing the evolution of the shelves water masses around the Baffin Bay. Each marker used correspond to the
marker showing the station location in Fig. 15. We focus on the CIL with density beween 26.5 and 27s0:
J. Cuny et al. / Deep-Sea Research I 52 (2005) 519–542536
et al., 2002; Lemon and Fissel, 1982; Ross, 1990a,b), we estimated a transit time of 180 days fromLancaster Sound to Davis Strait. This wouldexplain the salinity minimum observed in Decem-ber–February in the western part of the strait(Fig. 10).We used the mooring array to deduce the lateral
distribution of southward freshwater transportacross Davis Strait. The freshwater transport iswidespread from March till May when the regionis ice covered, and then it weakens overall fromJune to August when the flow speed is weak (seeSection 3). From September to November, weobserve a very large transport in the top western
part of the strait where Tan and Strain (1980) havefound most of the meltwater (Fig. 17). This isaccompanied by large transports above or on theeast side of the ridge, more related to the CIL.Through the winter, the freshwater transport isshifted eastward towards the ridge. It seems thatthere is a shift from the meltwater influence to theCIL influence. The CIL is closer to the surface atthe ridge due to the isopycnal slope. One has tokeep in mind that the large freshwater transportsare observed above 150m where we had to makestrong assumptions about the salinity. Moreadequate sampling of the top 150m will benecessary to confirm these results.

ARTICLE IN PRESS
0 100 200 300
600
400
200
0Sept
0 100 200 300
600
400
200
0Oct
0 100 200 300
600
400
200
0Nov
0 100 200 300
600
400
200
0
Distance (km)
Jan
Dep
th (
m)
0 100 200 300
600
400
200
0Feb
0 100 200 300
600
400
200
0Dec
Sou
thw
ard
FW
tran
spor
t in
mS
v (1
03 m
3 .s-1
)
-40
-30
-20
-10
0
Fig. 17. Southward freshwater transport per bin (mSv ¼ 103 m3 s�1) deduced from the mooring array for the period
September–February. Each bin has approximately the same area which allows for useful comparisons (see text for details). The
circles at the surface indicate the mooring locations.
J. Cuny et al. / Deep-Sea Research I 52 (2005) 519–542 537
4.3. Sea-ice transport
The sea-ice transport is another component ofthe freshwater fluxes through Davis Strait. DavisStrait is ice covered at least 6 months of the year(Deser et al., 2002). Sea-ice constitutes a fresh-water reservoir under solid form as the ice mostlymelts on the Labrador shelf. Using SMMR-SSM/Idata, we were able to compute the sea-ice area fluxthrough Davis Strait. We considered a thickness of0.5m in December and 1m from January till May(National Ice center data (http://www.natice.-
noaa.gov/eastarct.htm)) to compute volume fluxes(Fig. 18). Taking into consideration the monthlyice concentration, the mean annual cumulativesea-ice volume flux through Davis Strait overDecember–May from the 1992–2000 data are496� 50 km3 (Fig. 18b). If we consider thenumbers deduced earlier from the work ofJordan and Neu (1982), we can add an additional17 km3 for the sea-ice transport in June–July
ðthickness ¼ 0:7mÞ and 15 km3 in Novemberðthickness ¼ 0:5mÞ: This gives a total of south-ward transport of 528 km3:There is little interannual variability and the
correlation between the sea-ice volume transportand the NAO is very weak ðr ¼ �0:05Þ: Thissuggests that the larger ice extent in the LabradorSea in years of high NAO index (Deser et al., 2002)is due to local formation more than strongersouthward advection. The correlation between thewinter–spring mean meridional winds and theyearly transport is better (r ¼ �0:47; not signifi-cant at 95%, though) (Fig. 18b and d). Thecorrelation between the mean winter–spring mer-idional winds and the NAO index is close to zero.Using only the meridional winds from Decemberto March or using wind speed instead of mer-idional wind barely improves the correlation. TheNAO index does not appear as a good climaticproxy for the Davis Strait region when the indexand the main winds are so little related. There is a

ARTICLE IN PRESS
1988 1989 1990 1991 1992 1993 1994 1995 1996 1997 1998 1999 2000-50
050
100150
km3
1988 1989 1990 1991 1992 1993 1994 1995 1996 1997 1998 1999 2000200
400
600
km3 /y
ear
1988 1989 1990 1991 1992 1993 1994 1995 1996 1997 1998 1999 20002
4
6
8
105 k
m2 /
year
1988 1989 1990 1991 1992 1993 1994 1995 1996 1997 1998 1999 2000
2024
1988 1989 1990 1991 1992 1993 1994 1995 1996 1997 1998 1999 2000 -8 -6 -4 -2
0
m.s
-1
(a)
(b)
(c)
(d)
(e)
Fig. 18. (a) Monthly mean sea-ice transport (km3) through Davis Strait for winter spring 1988 through 2000. (b) Yearly cumulative
sea-ice volume transport (km3) through Davis Strait. The corresponding error estimates are represented by the surrounding grey lines.
The results for 1988–1991 are drawn with dashed curves because they are not considered as reliable as the results after 1992. (c) Same as
for (b) but for the sea-ice area transport in (105 km2). (d) Winter NAO index. (e) Monthly mean meridional wind (m s�1) for winter
spring 1988 through 2000. The winter–spring mean wind speed is given by the thick line with circles. The first marker for each year
corresponds to December.
J. Cuny et al. / Deep-Sea Research I 52 (2005) 519–542538
significant variability from month to month withthe largest sea-ice transport observed in Februar-y–March. The correlation between the monthlytransport and the local meridional wind is goodduring 1992–2000 (r ¼ �0:62; significant at 95%)but not significant over 1988–1991. We cannot besure if the weaker correlation is real or just due tothe poor quality of the transport estimates before1992.In order to obtain fresh water transport equiva-
lent from the sea-ice area flux, we apply thefollowing formula:
TFWeq ¼ðS0 � SÞ
S0� F ice � h �
Cice
100�
ricerwater
; (2)
where F ice is the sea-ice area flux (km2), h the icethickness (m), Cice the mean sea-ice concentration
across Davis Strait (%), rice the sea-ice density(900 kgm�3) and rwater the density of water(1000 kgm�3). In this case, S0 ¼ 34:8 and weassume the sea-ice salinity to be 5. Hence theannual mean transport of 528 km3 is equivalent to12.9mSv of fresh water, which is an order ofmagnitude smaller than the transport under liquidform.
4.4. Heat transport
We can also compute the heat transportanomaly with respect to 0 �C through Davis Straitusing the mooring meridional velocity and thetemperature data. We use 0 �C as a referencetemperature to allow for comparison with the heatfluxes through more southern latitude lines. The

ARTICLE IN PRESS
J F M A M J J A S O N D
-40
-20
0
20
40
60
80
1012
W
Fig. 19. Monthly mean heat transport (in TW ¼ 1012 W)
through Davis Strait deduced from the 1 year average mooring
data, West Greenland shelf excluded. The negative and positive
time series are respectively for the southward and northward
heat transport. The error bars are the monthly standard
deviation. Solid circles and squares represent, respectively, the
southward and northward CTD heat transport estimates (see
Table 3).
J. Cuny et al. / Deep-Sea Research I 52 (2005) 519–542 539
annual mean heat transport anomaly, West Green-land shelf excluded, is 27� 15� 1012 W north-ward and �15:5� 8� 1012 W southward (Fig. 19).The northward heat transport anomaly is max-imum in November and minimum in March, whilethe southward transport is maximum in Decemberand minimum in April–May.The northward heat transport anomaly seasonal
cycle is influenced by the southward transport inthe CIL (with weakly varying sub-zero tempera-ture) (Fig. 10), the ISW and WGS transport andtemperature seasonal cycle (see Section 4.1 andFig. 9).From hydrographic data, we observe that the
southward heat transport anomaly in September1987 is due to the western surface flow and to alarge portion of ISW which gets entrained south-ward close to the eastern flank of the ridge(Fig. 12c). In October 1988 (Fig. 12f), the westernsurface flow has already cooled off and is nowincluded in the northward heat transport, whilethe southward entrainment of ISW has stopped.Again, we compare the mooring estimates to the
CTD estimates to get a more realistic range ofuncertainty (Table 3). The average uncertainty is
48% of the mooring estimate for the northwardtransport and 38% for the southward transport.For the northward heat transport anomaly, theaverage uncertainty in the top 150m is as large asfor the transport below 150m. For the southwardtransport anomaly, the average uncertainty in thetop 150m is half of the uncertainty below 150m.The CTD heat transport anomaly estimatesindicate that on average 50% of the southwardheat transport and 50% of the northward heattransport are contained in the top 150m.In order to compute the net heat transport
through Davis Strait, we have to estimate theannual mean heat transport anomaly on the WestGreenland shelf. For this purpose, we used themooring M6 top instrument combined withhistorical temperature data. The September andOctober estimates are 9:8� 1012 and 18:8�1012 W (Table 4). We obtain an annual mean heattransport anomaly of 6:5� 7:2� 1012 W north-ward on the shelf. This gives a net heat transportof 18� 17� 1012 W through Davis Strait, WGSincluded. Hence the heat transport through DavisStrait represents only 3% of the total estimatednorthward heat transport into the North Atlanticsubpolar gyre (0:6� 1015 W; Ganachaud andWunsch (2000)).
5. Summary and discussion
Using an extensive dataset collected in1987–1990, we described the circulation in DavisStrait and computed transports. The ridge in themiddle of the strait was found to affect thecirculation particularly during the spring–summerwhen the transport is the weakest. We also obser-ved an interesting reversal of the flow at 150m atM1 from November to February (Fig. 8a, d). Thisnorthward flow can reach 12 cm s�1: This pheno-menor is concentrated in the upper layer of thewestern portion of the strait as the reversal is notobserved at the 300m instrument at mooring M1(Fig. 8a, d), nor at mooring M2. The reversal is notdue to the bottom topography because it wouldaffect the entire water column, and the arrival offresher water does not match the current reversalsuggesting that this is not a different water mass

ARTICLE IN PRESS
J. Cuny et al. / Deep-Sea Research I 52 (2005) 519–542540
suddenly coming from the south (Fig. 10). Thedensity distribution deduced from the mooringarray in January (not shown) suggests thatupwelling takes place in the western part of thestrait. If this upwelling is related to an eastwardEkman transport, it has to be due to a northwardstress. This stress could be due to the speeddifference between the ocean and the sea-ice whichis almost land-fast close to Baffin Island (H. Stern,personal communication). However, the stresscould only cancel the velocity but not reverse theflow.The similarity of the annual cycles in volume
and freshwater transport suggest that the BaffinIsland Current and the West Greenland Currentare predominantly buoyancy driven. The ampli-tude of the southward freshwater transport annualcycle is more dictated by the flow of meteoricwaters coming from Lancaster Sound than by thesea-ice melting-freezing cycle in Baffin Bay. Theseasonality in the transport of these two freshwatersources affected the Baffin Island Current struc-ture, with the meltwater flow closer to the coastbeing stronger in the fall while the CIL flow wasstronger in the winter and flowed closer to themiddle of the strait. The sea-ice transport throughDavis Strait presents significant monthly varia-bility, related to the meridional local wind, butvery little interannual variability. We also showedfrom the heat transport anomaly estimates, thatthe southward flow of sub-zero CIL is asimportant as the northward flow of ISW for thenorthward heat transport anomaly.Davis Strait plays a fundamental role in the
North Atlantic as a connection between the Arcticand the subpolar gyre linking Baffin Bay with theLabrador Sea. Baffin Bay plays a buffer rolebetween the Canadian Archipelago and theLabrador Sea as it is 100% covered with ice inthe winter and ice free at the end of summer. Thecumulated southward transport through the threemain straits of the Canadian Archipalego is about1–2 Sv (Fissel et al., 1988; Rudels, 1986). Theliquid freshwater transport through the archipela-go is of the order of 30–40mSv (Rudels, 1986;Aagaard and Carmack, 1989; Steele et al., 1996).The volume transport compares well with our2.6 Sv net transport estimate, but the freshwater
estimate is less than half of our estimate of 92mSv.The earlier estimate is not necessarily unrealistic ifwe consider the influence of interannual variabilityand the range of uncertainty associated with ourestimate. The discrepancy might also be due to theCanadian Archipelago lack of data, which haveled the freshwater transports estimates to becomputed by considering an average transportand an average salinity. As a simple test, weestimated the freshwater transport in the westernpart of the Davis Strait by two different methods:the first one is similar to our earlier calculationwhere we combined each bin velocity and salinity,and the second consists in multiplying the trans-port by the mean salinity in the area of interest.Using the 1988 section, which showed only south-ward flow in the western part of the strait(Fig. 4d), we find that the average value multi-plication method gives a result 46% smaller.The sea-ice transport is assumed negligible
through the Canadian Archipelago because thesea-ice is mostly land-fast, whereas it is very largethrough Fram Strait (annual mean: 64mSv of FWwith a salinity of 5, 2366 km3=year in volume(Kwok and Rothrock, 1999)). Hence, the sea-icetransport at Davis Strait (528 km3=year) representsslightly more than a fifth of the Fram Straittransport. Meredith et al. (2001) suggest that theliquid southward freshwater transport by the EastGreenland Current is two times larger than theequivalent transport by sea ice. From Aagaard andCarmack (1989), we deduce a 5mSv freshwatertransport southward by the saline West Spitsber-gen current. Hence the net freshwater transport(liquid+solid) through Fram Strait (197mSv) islarger than the transport through Davis Strait(105mSv).We can try to close the Arctic volume budget as
Davis Strait is a more constrained gate to theArctic than the Canadian Archipelago. We assumethat the main passages to the Arctic are the BeringStrait, Fram Strait, Barents Sea, HudsonStrait and Davis Strait. The following values arefound in the literature for the volume trans-ports: 0:8� 0:3 Sv for Bering Strait (Roach et al.,1995), �1:7� 2:0 Sv for Fram Strait (Fahrbachet al., 2001), 1:6� 1:2 Sv for the Barents Sea(Mauritzen, 1996) and �0:1� 0:3 Sv for Hudson

ARTICLE IN PRESS
J. Cuny et al. / Deep-Sea Research I 52 (2005) 519–542 541
Strait (Drinkwater, 1988). The river runoff con-tributes around 0.1 Sv. This leaves net transport of0.7 Sv for the Canadian Archipelago-Davis Straitexit. This is smaller than our estimate of 2.6 Sv .Using the estimates collected by Carmack
(2000), we try the same exercise for the fresh-water transports. The total arctic runoff includ-ing mainland and arctic islands is 4269 km3 yr�1
(135.3mSv, Vuglinsky (1997)). Bering Straitliquid freshwater inflow is 1670 km3 yr�1
(52.9mSv, Aagaard and Carmack (1989)). Smallamount of ice coming through Bering Straitconstitutes 24 km3 yr�1 (0.7mSv, Aagaard andCarmack (1989)). Precipitation minus evaporationrepresents 1944 km3 yr�1 (61.6mSv) as obtainedfrom NCEP and ECMWF (Bromwich et al.,2000). The Norwegian Coastal Current throughBarents Sea represents 330 km3 yr�1 (10.4mSv).The salty flow through the Barents Sea provides anegative contribution to the freshwater budget of�540 km3 yr�1 (�17:1mSv; Aagaard and Carmack(1989)). We have mentioned earlier a net fresh-water transport of �6235 km3 yr�1ð�197mSvÞthrough Fram Strait. There is no good freshwaterflux estimate for Hudson Strait, so we will use thelower end of the range suggested by Mertz et al.(1993): 946 km3 yr�1 or 30mSv.This leads to a net of 516 km3 yr�1; i.e. 16.3mSv
of fresh water, which is close to the lower end ofour estimate range for Davis Strait. The inter-annual variability being so large at all the sources,a simultaneous monitoring within the samepentade would clearly help to refine the ArcticOcean budget.
Acknowledgements
The authors would like to thank Charlie Rossfrom BIO for collecting and providing the DavisStrait dataset analyzed in this manuscript. Sugges-tions from several people at BIO (Brian Petrie,Charles Tang and Igor Yashayaev) and fromthree reviewers were helpful for improving themanuscript. Finally, we would like to thankLuanne Thompson and Craig Lee for theirthorough editing of a first version of the manu-script.
References
Aagaard, K., Carmack, E.C., 1989. The role of sea ice and
other fresh water in the Arctic circulation. Journal of
Geophysics Research 94 (C10), 14485–14498.
Agnew, T., Le, H., Hirose, T., 1998. Estimation of large scale
sea ice motion from SSM/I 85.5GHz imagery. Journal of
Geophysics Research 25 (Ann. Glaciol.), 305–311.
Bacon, S., Reverdin, G., Rigor, I., Snaith, H., 2002. A
freshwater jet on the east Greenland shelf. Journal of
Geophysics Research 107 (C7) 5–1–5–16.
Bromwich, D., Cullather, R., Serreze, M., 2000. Reanalyses
depictions of the Arctic moisture budget. In: Lewis, E. (Ed.),
The Freshwater Budget of the Arctic Ocean. NATO Science
series. Kluwer Academic Publishers, Dordrecht (Chapter 8).
Carmack, E., 2000. The Arctic Ocean’s freshwater budget:
sources storage and export. In: Lewis, E. (Ed.), The
Freshwater Budget of the Arctic Ocean. NATO Science
series. Kluwer Academic Publishers, Dordrecht (Chapter 5).
Chapman, D., Beardsley, R., 1989. On the origin of shelf water
in the Middle Atlantic Bight. Journal of Physical Oceano-
graphy 19, 384–391.
Cuny, J., Rhines, P.B., Niiler, P.P., Bacon, S., 2002. Labrador
Sea boundary currents and the fate of the Irminger Sea
Water. Journal of Physical Oceanography 32 (2), 627–647.
Deser, C., Holand, M., Reverdin, G., Timlin, M.S., 2002.
Decadal variations in Labrador Sea Ice Cover and North
Atlantic Sea surface temperatures. Journal of Geophysics
Research 107.
Drinkwater, K., 1988. On the mean and tidal currents in
Hudson Strait. Atmosphere Ocean 26, 252–266.
Fahrbach, E., Meincke, J., Osterhus, S., Rohardt, G., Schauer,
U., Tverberg, V., Verduin, J., 2001. Direct measurements of
volume transports through Fram Strait. Polar Research 20
(2), 217–224.
Fissel, D., Birch, J., Melling, H., Lake, R., 1988. Non-tidal
flows in the North-West Passage. Canadian technical report
of hydrography and ocean sciences 98, Fisheries and Ocean
Canada.
Ganachaud, A., Wunsch, C., 2000. Improved estimates of
global ocean circulation, heat transport and mixing from
hydrographic data. Nature 408, 453–457.
Goosse, H., Fichefet, T., Campin, J.-M., 1997. The effects of
the water flow through the Canadian Archipelago in a
global ice-ocean model. Geophysics Research Letters 24
(12), 1507–1510.
Hamilton, J., Prinsenberg, S., Malloch, L., 2002. Moored
current meter and CTD observations from Barrow Strait
1998–1999. Canadian data report of hydrography and
Ocean Sciences 157, Fisheries and Ocean Canada.
Houghton, R., Visbeck, M., 2002. Quasi-decadal salinity
fluctuations in the Labrador Sea. Journal of Physical
Oceanography, 687–701.
Ingram, R., Prinsenberg, S., 1998. Coastal oceanography of
Hudson Bay and surrounding eastern Canadian Arctic
waters. In: Robinson, A., Brink, K. (Eds.), The Sea, vol. 11.
Wiley, New York, pp. 835–861.

ARTICLE IN PRESS
J. Cuny et al. / Deep-Sea Research I 52 (2005) 519–542542
Jones, E.P., Swift, J., Anderson, L., Lipizer, M., Civitarese, G.,
Falkner, K., Kattner, G., McLaughlin, F., 2003. Tracing
Pacific water in the North Atlantic Ocean. Journal of
Geophysics Research 108, 13 1–13 10.
Jordan, F., Neu, H., 1982. Ice drift in southern Baffin Bay and
Davis Strait. Atmospheric Ocean 20 (3), 268–275.
Khatiwala, S., Schlosser, P., Visbeck, M., 2002. Rates and
mechanisms of water mass transformation in the Labrador
Sea as inferred from tracer observations. Journal of Physical
Oceanography, 666–686.
Kwok, R., Rothrock, D.A., 1999. Variability of Fram Strait ice
flux and North Atlantic Oscillation. Journal of Geophysics
Research 104 (C3), 5177–5189.
Kwok, R., Schweiger, A., Rothrock, D.A., Pang, S., Kottmeier,
C., 1998. Sea ice motion from satellite passive microwave
data assessed with ERS and buoy motion. Journal of
Geophysics Research 103, 8191–8214.
Lazier, J.R.N., Wright, D.G., 1993. Annual velocity variations
in the Labrador Current. Journal of Physical Oceanography
23 (4), 659–678.
Lemon, D., Fissel, D., 1982. Seasonal variations in currents and
water properties in northwestern Baffin Bay, 1978–1979.
Arctic 35 (1), 211–218.
Liu, A., Cavalieri, D., 1998. On sea-ice drift from wavelet
analysis of Defense Meteorological Satellite Program
(DMSP) special sensor microwave imager (SSM/I) data.
International Journal of Remote Sensing 19, 1415–1423.
Loder, J.W., Petrie, B., Gawarkiewicz, G., 1998. The coastal
ocean off North-Eastern North America: a large-scale view.
In: Robinson, A.R., Brink, K.H. (Eds.), The Sea, vol. 11.
Wiley, New York, pp. 105–133.
Macdonald, R.W., Carmack, E.C., McLauglin, F.A., Iseki, K.,
Macdonald, D., O’Brien, M., 1989. Composition and
modification of water masses in the Mackenzie shelf estuary.
Journal of Geophysics Research 94 (C12), 18057–18070.
Mauritzen, C., 1996. Production of dense overflow waters
feeding the North Atlantic across the Greenland-Scotland
ridge. Part 2: an inverse model. Deep-Sea Research I 43,
807–835.
Melling, H., Gratton, Y., Ingram, G., 2001. Ocean circulation
within the North water Polynya of Baffin Bay. Atmosphere-
Ocean 39 (3), 301–325.
Meredith, M., Heywood, K., Dennis, P., Goldson, L., White,
R., Fahrbach, E., Schauer, U., Østerhus, S., 2001. Fresh-
water fluxes through Fram Strait. Geophysics Research
Letters 28 (8), 1615–1618.
Mertz, G., Narayanan, S., Helbig, J., 1993. The freshwater
transport of the Labrador Current. Atmosphere-Ocean 31
(2), 281–295.
Myers, R., Akenhead, S., Drinkwater, K., 1990. The influence
of Hudson Bay runoff and ice-melt on the salinity of the
inner Newfoundland shelf. Atmosphere-Ocean 28 (2),
241–256.
Roach, A., Aagaard, K., Pease, C., Salo, S., Weingartner, T.,
Pavlov, V., Kulakov, M., 1995. Direct measurements of
transport and water properties through the Bering Strait.
Journal of Geophysics Research 100, 18443–18457.
Ross, C., 1990a. Currents and temperature data from north-
western Baffin Bay, september 1983–1984. Canadian data
report of hydrography and ocean sciences 78, Fisheries and
Oceans Canada.
Ross, C., 1990b. Currents and temperature data from south-
western Baffin Bay, October 1984–1985. Canadian data
report of hydrography and ocean sciences 79, Fisheries and
Oceans Canada.
Ross, C., 1992. Moored current meter measurements across
Davis Strait. NAFO Research Document 92/70.
Rudels, B., 1986. The outflow of polar water through the Arctic
Archipelago and the oceanographic conditions in Baffin
Bay. Polar Research 4, 161–180.
Shiklomanov, I., Shiklomanov, A., Lammers, R., Peterson, B.,
Vorosmarty, C., 2000. The dynamics of river water
inflow to the arctic ocean. In: Lewis, E. (Ed.), The
Freshwater Budget of the Arctic Ocean. NATO
Science series. Kluwer Academic Publishers, Dordrecht
(Chapter 13).
Steele, M., Thomas, D., Rothrock, D., Martin, S., 1996. A
simple model study of the Arctic Ocean freshwater balance,
1979–1985. Journal of Geophysics Research 101 (C9),
20 833–20 848.
Tan, F., Strain, P., 1980. The distribution of sea ice meltwater
in the eastern Canadian Arctic. Journal of Geophysics
Research 85 (C4), 1925–1932.
Vuglinsky, V., 1997. River inflow to the arctic ocean: condi-
tions of formation time variability and forecasts. In:
Polar Processes and Global Climate. ACSYS,
pp. 275–276.
Wadley, M.R., Bigg, G.R., 2002. Impact of flow through the
Canadian Archipelago and Bering Strait on the North
Atlantic and Arctic Circulation: an ocean modelling study.
Quarterly Journal of the Royal Meteorological Society 128
(585), 2187–2203.