Nitrogen Cycling with Respect to Environmental Load in Farm Systems in Southwest China
16
-1 Nitrogen cycling with respect to environmental load in farm systems in Southwest China Lei Liang 1, *, Toshiyuki Nagumo 2 and Ryusuke Hatano 1,3 1 Graduate School of Agriculture, Hokkaido University, Sapporo 060-8589, Japan; 2 Center for Education and Research of Field Sciences, Shizuoka University, Fujieda 426-0001, Japan; 3 Field Science Center for Northern Biosphere, Hokkaido University, Sapporo 060-8589, Japan; *Author for correspondence (e-mail: [email protected]) Received 15 September 2004; accepted in revised form 14 June 2005 Key words: Agricultural system, Chemical fertilizer, China, Nitrogen balance, Nitrogen cycling Abstract In Qibainong, a steep-mountainous karst region in southwestern China, self-sustaining societies have long existed, but increasing socioeconomic liberation has fuelled the recent rapid structural change of its economy. Consequently, environmental deterioration and exhaustion of resources have become prob- lematic issues. We carried out a field survey in Qibainong in southwestern China and used both estimated and measured N flows and N balances from obtained results. Our results are summarized as follows (1) farmers used large amounts of chemical N fertilizers at intensities of 113–1124 kg N ha 1 ; (2) substantial application of chemical fertilizer in Qibainong has contributed to an increase in potential NO 3 -N leaching of 6–511 kg N ha 1 , followed by NH 3 volatilization; (3) crop products are largely distributed to feed livestock, the products of which are a major income source; (4) this area has a great requirement for imported food; (5) in addition, unused manure N (up to 191 kg N ha 1 ) is generated by the increase in manure N production. Chemical fertilizer application, in addition to unused manure can be regarded as a major source of environmental damage. Based on the relationship between the N application rate and the NO 3 -N leaching potential, we estimated the critical limit of the N application rate of chemical fertil- izer + manure to be 297 kg N ha 1 . In Qibainong, unused manure, which is an important nutrient re- source, was applicable within the critical limit. We recommend that all manure N produced within the village be used effectively on arable land, and that any shortages be supplemented by chemical N fertilizer up to 297 kg N ha 1 to maintain water resource quality. Further improvement might be achieved through incorporating chemical fertilizers, P and K supplemented manure, and so on. Introduction Nitrogen (N) is the most limiting factor in crop production. Human activities have more than doubled the rate of N input into agro-ecosystems during the 20th century (Richter and Roelcke 2000; Mosier et al. 2001). Most N input is attrib- utable to chemical fertilizers. The increase in N fertilizer contributes to an increase in crop yield and consequently, the human food supply. Simultaneously, however, it increases the envi- ronmental N load attributable to NO 3 ,N 2 O, and NH 3 . Nitrate-N leaching is one of the contributors for eutrophication and hypoxia in aquatic eco- systems as well as higher NO 3 -N concentration in drinking water (for example, Bouwman and van Vuuren 1999). Nitrous oxide is the major green- house gas emitted in agricultural sector (Isermann Nutrient Cycling in Agroecosystems (2005) 73:119–134 ȑ Springer 2005 DOI 10.1007/s10705-005-0074-4
Transcript of Nitrogen Cycling with Respect to Environmental Load in Farm Systems in Southwest China

-1
Nitrogen cycling with respect to environmental load in farm systems
in Southwest China
Lei Liang1,*, Toshiyuki Nagumo2 and Ryusuke Hatano1,31Graduate School of Agriculture, Hokkaido University, Sapporo 060-8589, Japan; 2Center for Education andResearch of Field Sciences, Shizuoka University, Fujieda 426-0001, Japan; 3Field Science Center for NorthernBiosphere, Hokkaido University, Sapporo 060-8589, Japan; *Author for correspondence (e-mail:[email protected])
Received 15 September 2004; accepted in revised form 14 June 2005
Key words: Agricultural system, Chemical fertilizer, China, Nitrogen balance, Nitrogen cycling
Abstract
In Qibainong, a steep-mountainous karst region in southwestern China, self-sustaining societies have longexisted, but increasing socioeconomic liberation has fuelled the recent rapid structural change of itseconomy. Consequently, environmental deterioration and exhaustion of resources have become prob-lematic issues. We carried out a field survey in Qibainong in southwestern China and used both estimatedand measured N flows and N balances from obtained results. Our results are summarized as follows (1)farmers used large amounts of chemical N fertilizers at intensities of 113–1124 kg N ha�1; (2) substantialapplication of chemical fertilizer in Qibainong has contributed to an increase in potential NO3-N leachingof 6–511 kg N ha�1, followed by NH3 volatilization; (3) crop products are largely distributed to feedlivestock, the products of which are a major income source; (4) this area has a great requirement forimported food; (5) in addition, unused manure N (up to 191 kg N ha�1) is generated by the increase inmanure N production. Chemical fertilizer application, in addition to unused manure can be regarded as amajor source of environmental damage. Based on the relationship between the N application rate and theNO3-N leaching potential, we estimated the critical limit of the N application rate of chemical fertil-izer + manure to be 297 kg N ha�1. In Qibainong, unused manure, which is an important nutrient re-source, was applicable within the critical limit. We recommend that all manure N produced within thevillage be used effectively on arable land, and that any shortages be supplemented by chemical N fertilizerup to 297 kg N ha�1 to maintain water resource quality. Further improvement might be achieved throughincorporating chemical fertilizers, P and K supplemented manure, and so on.
Introduction
Nitrogen (N) is the most limiting factor in cropproduction. Human activities have more thandoubled the rate of N input into agro-ecosystemsduring the 20th century (Richter and Roelcke2000; Mosier et al. 2001). Most N input is attrib-utable to chemical fertilizers. The increase in Nfertilizer contributes to an increase in crop yield
and consequently, the human food supply.Simultaneously, however, it increases the envi-ronmental N load attributable to NO3, N2O, andNH3. Nitrate-N leaching is one of the contributorsfor eutrophication and hypoxia in aquatic eco-systems as well as higher NO3-N concentration indrinking water (for example, Bouwman and vanVuuren 1999). Nitrous oxide is the major green-house gas emitted in agricultural sector (Isermann
Nutrient Cycling in Agroecosystems (2005) 73:119–134 � Springer 2005
DOI 10.1007/s10705-005-0074-4

1994). Ammonia emission was indicated to be acause of acidification and N saturation in naturalecosystems through re-deposition (Bouwman andvan Vuuren 1999; Matson et al. 2002).
Asia is a hotspot for increasing N fertilizer:China is the fastest growing among them (Richterand Roelcke 2000; Galloway and Cowling 2002;Zheng et al. 2002; Zhu and Chen 2002; Tong et al.2003). In China, the N application rate was esti-mated to be 50–100 kg ha�1 before the 1950s; al-most all N input was supplied by organic matterDazhong and Pimentel 1986; Guo and Bradshaw1993; Ellis and Wang 1997; Smil 2002). However,N fertilizer use increased drastically thereafter,recently ranging between 500–1900 kg ha�1
(Zhang et al. 1996; Ellis and Wang 1997; Hatanoet al. 2002; Chen et al. 2004a). It is estimated that,although the annual N balance was negative untilthe mid-1970s, the balance has remained approx-imately in balance or positive since the late 1980s(Syers et al. 2002). In addition, animal protein hasalso been increasingly demanded because of theeconomic development in China (Mosier et al.2001), which in turn increases the pressure forincreasing demand of cereals as feed (Bouwmanand Booji 1998). Consequently, N emissions andtheir resultant adverse impact on the regional andglobal environment have been increasing, becom-ing a serious issue in China: for example, increasein NO3-N concentration and load to aquatic eco-systems (Zhang et al. 1996; Richter and Roelcke2000; Shuiwang et al. 2000; Yan and Zhang 2003).
Qibainong is located in the steep mountainouskarst region of southwestern China. A large karstterrain forms peak-cluster topography and cavitiesexist in this area. It was a self-sufficient society forover 600 years, probably attributed to such geo-graphical and topological constraints. Recently,Chinese economic liberation extended repidly tothis area, resulting in the reforms in society andhence agricultural and food system. Agriculturalintensification is apparent: the increased demandfor chemical fertilizers, sales of livestock products,and import of feed as well as income (Hatano et al.2002). However, the area of arable land area percapita was limited, as low as 0.03 ha per capita peryear in Qibainong (Tan 1998), and cereals con-sumption as food in Qibainong was estimated tobe still limited as <140 kg per capita per year(mainly maize) (Tamura 1998), which is less thanthe Chinese average of 175 or world average of
155 kg per capita (FAO 2004). It is a driving forcefor increased use of chemical N fertilizers moreand more to satisfy the increasing demand for feedand food on the basis of the limited land resourcesin Qibainong. Qibainong is a typical rural area inChina, now under such a considerable change.This area is located within the Zhujiang Riverbasin, in which an increasing trend of the nitrate-Nconcentration was shown since 1980s (Shuiwanget al. 2000). A limited but suspicious indication ofthe consequences of such a change appeared in thisarea.
Therefore, it is necessary to investigate the Ncycling and balance associated with food produc-tion and consumption at farm and village scale inQibainong. Based on these results, we evaluate thecurrent situation and directives of the changes inagricultural N cycling, the impact on potential Npollution, discussed agricultural practices andmitigation strategies.
Materials and methods
Study site
The study area is located in Qibainong, DahuaCounty, Zhuangzu autonomous region of Guan-gxi Province, southwestern China (23�3¢ N,107�59¢ E). Qibainong has total area of 304 km2,in which about 16,000 residents live. However, thisarea is a large karst terrain, forms peak-clustertopography and so many cavities (so called ‘Do-line’). The arable land area was limited to an ex-tremely small area in flatland, and others wereamong exposed rocks and in fissures, arranged onsteeply sloped or terraced land. Soil condition istypically a calcareous alkaline soil with clayeytexture, derived from dolomite. The region is in asubtropical monsoon climate zone: the averageannual temperature, 19.5 �C; the average annualprecipitation, 1566 mm. The annual potentialcultivation period is more than 300 days: mainlyupland crops are cultivated during the rainy sea-sons of March–October.
We targeted the four villages (called ‘tun’ inChinese) in Qibainong: Nongshi-tun, Nongli-tun,Patan-tun, and Waixian-tun (Table 1). The farmsand population at those study sites were 46 farmswith 211 people in four villages. Each village hasthe adjoining 3–8 Doline, and 48.4–124 ha of total
120

area. Agriculture is the major occupation with 8–16 farms and 1.0–4.4 ha of arable land available toeach village. Each village supports a population(farming family) of 39–77 persons. Populationpressure is extremely high now, exceeding this re-gion’s food supply capacity (Wang et al. 2004).
Agricultural practices are labor-intensive. Atour study site, maize is cultivated inter-croppedwith soybean and sweet potato. Ammoniumbicarbonate and urea are applied in China asmajor N fertilizers (Li and Chen 1980; Jin andPortch 2001; Yan and Zhang 2003), as they areavailable in this region. These two types of fertil-izer are cheap for farmers (Stone 1986; Roelckeet al. 2004), and equipment and technical demandis less for the factory. Phosphorus (P) (also‘superphosphate’) and to a lesser extent, potassium(K) fertilizers have been used in most Chineseagriculture (Stone 1986; Jin and Portch 2001), asthey are available in this region. Chinese agricul-ture still largely depends on manure to provideP and K input (Chen et al. 2004a). Livestock feedfundamentally comprises crop residues along withgarbage and foliage, the latter of which is gatheredfrom farm gardens, rangeland, forests, and othersources. Livestock excreta and human excreta andcrop residues are also gathered, composted, andapplied to arable land as manure. Fertilizationusing both chemical fertilizers and manure wassplit and top-dressed way which is common in thisregion.
Data collection (Field survey)
In order to calculate N flows, the followinginformation was obtained through application of aquestionnaire and an interview: briefly (1) farmsize such as human and livestock population, andarable land area; (2) farming practices such ascropping, fertilization, livestock feeding, and
manure composting; (3) rough estimates of pur-chase and sales of food and feed. First we sent thequestionnaire sheet to the owner of farms. Thenwe directly visited every farm to collect the datasheets, and simultaneously we tried face-to-faceinterview to confirm and supplement the data.These tasks were carried out for all 46 farms in allfour villages from December 2000 to January2001.
Livestock density was calculated using livestockunits (LU): 1 cow = 13 pigs = 19 sheep orgoats = 100 chickens based on the amount ofexcreta N (Harada 1996; Nagumo and Hatano2000).
N-flow estimation
Figure 1 shows the farm scale N flow model. Themodel consists of external input and output, andinternal recycling flows. External inputs includespurchase of food and feed, ‘gathering’ of herbage inthe surrounding hilly natural forest and grasslandsfor feed, and chemical fertilizer, biological N2 fix-ation and atmospheric deposition into arable land.External outputs were sales of crop and livestockproducts, and environmental emissions viaammonia (NH3) volatilization (both during man-ure composting, and due to chemical fertilizer andmanure application), and denitrification and ni-trate leaching from arable land. On the other hand,there is internal cycling among compartments:human, livestock, and arable land, via crop (foodand feed) production and manure application.
The N flow through the food and feed(including gathered herbage) was estimated bymultiplying the amount of organic matter by theN content. Sales and on-farm intake of livestockproducts (meat and eggs) were also estimated bymultiplying the commodities, mass by the cor-responding N content. The amount of food andfeed was obtained from our field survey for themajor commodities. We used the measured val-ues by Hatano et al. (2002) and the commonvalues in Food Composition Table (RCSTA1982) for the N content of food and feed andlivestock products. Human excreta were assumedto be the same amount of total N human intake;in other words, we assumed that net gain inhuman body N was none in this study. Livestockexcreta were estimated by subtracting the N
Table 1. Study site information.
Nongshi Nongli Patan Waixian
The number of Doline 5 4 3 8
Land area – total (ha) 12.4 4.9 8.0 10.0
Land area – arable (ha) 4.4 1.0 2.3 2.6
The number of farm 16 8 10 12
Population 77 42 53 39
121

amount consumed for sales and human intakefrom the total N amount of feed. It is note-worthy that ‘grazing’ in surrounding areas (for-est, grasslands, and garden) as well as post-harvested arable land was not included in ourestimates because the corresponding excreta isapplied directly onto the lands. Thereby, the netgain is inferred as zero.
Human and livestock excreta produced wereused as manure source into arable land. Manure Napplication was estimated by the amount ofmanure, which was obtained by our field survey,by the N content (Hatano et al. 2002). On theother hand, manure N was lost as ammonia(referred as ‘NH3 volatilization’) during compo-sting. The NH3 volatilization during compostingwas estimated by multiplying the excreta N both ofhuman and livestock by an emission factor. Weemployed the factor, 36% of excreta N, accordingto an average of a limited data in China (Wen andPimentel 1986; Guo and Bradshaw 1993). Thisvalue was within the common range, 0–66% ofexcreta N (Bussink and Oenema 1998), but almosttwice higher compared to IPCC methodology(20% of human and livestock excreta N; IPCC1996). By subtracting the manure N applicationand the NH3 volatilization from the livestock and
human excreta N, the difference was defined as‘unused manure’ in this study.
In arable land compartment, the N input wasfrom atmospheric deposition, biological N2 fixa-tion, chemical fertilizer and manure application,whereas the N output was crop production(including the residues), NH3 volatilization, deni-trification, and nitrate leaching. Atmosphericdeposition was estimated as 20 kg N ha�1 year�1,assumed from the southern Chinese case studylisted in Table 2. Biological N2 fixation for non-leguminous upland crops was 15 kg N ha�1
year�1, according to the researches of Yan andZhang (2003) and Zhu (1997); cited by Xing andZhu (2002). Chemical fertilizer N was estimated bymultiplying the amount of AB and urea, whichwas obtained from field survey, by the corre-sponding N content (AB, 17.7%; urea, 46.7%).
Denitrification rate expressed as percentage ofapplied N was reported to be in the range upto11% using acetylene inhibition technique and 11–67% using 15N mass balance (Table 3), whereasthe US and European study showed the range of0–77% (Colbourn and Dowdell 1984; Nieder et al.1989; von Rheinbaben 1990). Xing and Zhu (2002)reviewed the Chinese case study, and showed to bethe value of 13–29% of synthetic (chemical)
Figure 1. Nitrogen flow model in farm systems.
122

fertilizer N and 10–30% of organic fertilizer N.Following to those studies, we used the denitrifi-cation factor of 20% for both chemical and or-ganic fertilizer N.
Ammonia was also emitted during compostingand post-application of manure and chemical fer-tilizer into arable land. The factor for appliedchemical fertilizer N widely ranged between 0 and65%, depending on fertilizer type, soil conditionsand management strategies (Terman 1979;Martens and Bremner 1989; Harrison and Webb2001). In our study area, ammonium bicarbonate(AB) and urea were used as the only N fertilizers,and their application practice was split and ‘top-dressing’ way. The reported value in Chinese studyranged 1–48% for such practice (Cai et al. 1998;Cai et al. 2002; Roelcke et al. 2002; Yan et al.2003; Zhang et al. 2004). We employed the uppervalue of 30% (Yan et al. 2003) as our emission
factor for both AB and urea, because NH3 vola-tilization from AB was generally equivalent to orslightly higher than urea (Zhu et al. 1989; Xingand Zhu 2000; Cai et al. 2002; Roelcke et al. 2002)and the reported factor for AB was limited com-pared to urea. On the other hand, the factor forapplied manure N expressed as percentage ofmanure NH4-N was also reported to range widelybetween 45 and 100% (Terman 1979; Bussink andOenema 1998), which is considered to correspondto the 50% of manure ‘total-N’ because manurecontains up to 50% of NH4-N or urea form(Bussink and Oenema 1998). Because we could notobtain the Chinese case study, 10% of manure Napplied into arable land (Javis and Pain 1990) wasemployed in this study. This value was within thecommon range mentioned above.
Nitrate-N leaching was estimated as the differ-ence between the N input (atmospheric deposition,
Table 2. Atmospheric deposition rates in the published case studies in China.
Wet deposition (kg N/ha/year) Site Reference
13.9 Jiulian, Jiangxi Province,
Southern China 1979 mm,0.7mgN/L
Nakagawa and Iwatsubo (2000)
22 Guanzhong Plain,
Shaanxi Province, Southern China
Li et al. (1993) cited by Richter and Roelcke (2000)
9–19.5 Taihu region,eastern China Zhu and Wen (1992) cited by Richter and Roelcke(2000)
28.5 Zhujiang River basin,
south China 1440 mm, 1.981 mg/l
Adopted by Xing and Zhu (2002)
35–38 Sub tropical (south) China Chen et al. (2004b)
Table 3. Denitrification rates in the published case studies in China.
Denitrification (% of applied N) Remarksb Reference
Top-dressing Incorporatinga
2.2–10 U, W–M, C2H2 Liu et al. (2003)
12.9 AB, W, 15N Cai et al. (1998)
28.6 U, W, 15N
1.1–11 U, M, C2H2 Cai et al. (2002)
0.8–0.9 U, W, C2H2
11–67 U, M, 15N
18 U, W, 15N
0.7–2.9 U, M, C2H2 Zhang et al. (2004)
0.3–0.5 U, W, C2H2
15.8 ND Yan et al. (1999)
aIncluding top-dressing just before rain or irrigation.bU, urea; AB, ammonium bicarbonate; M, (summer) maize; W, (winter) wheat; W–M, wheat–maize rotation; C2H2, acetylene inhi-
bition technique; 15N, 15N mass balance technique; and ND, nitrate dissappearance method.
123

biological N2 fixation, chemical fertilizer, andmanure application) and the N output (crop pro-duction, NH3 volatilization, and denitrification) inarable land compartments. This approach wasbased on the field N balance approach assumingno soil N accumulation. The field N balance wasconfirmed as equivalent to nitrate leaching inEurope (for example, Barry et al. 1993; Goss andGoorahoo 1995). Our study area revealedremarkable characteristics for nitrate leaching andnegligible surface runoff, such as shallow soildepth, rapid water drainage through cracks inlimestone, without rivers, and without paddyfields. No evidence exists that soil N was eitheraccumulated or lost. Therefore, we estimated the‘potential’ nitrate leaching in arable land using theapproach in this study.
The above-mentioned estimates were performedat farm unit, then summed up for the village unit.
Estimation of potential N concentration
Assuming the drainage water volume, the poten-tial N concentration in groundwater is predictablefrom the estimated amount of potential nitrate-Nleaching. Based on the water balance measured inour study area, the drainage volume was estimatedto be 900 mm (Hatano et al. 2002). Spring water(groundwater) as well as rainwater is the majordrinking water source, at our study site, dependingon the geological condition of karst mountainousregion. WHO (1998) recommended maximumallowable concentration of nitrate in drinkingwater as 50 mg NO3 l
�1 (equivalent to 11.3 mgNO3-N l�1). More recent studies have indicatedthe beneficial rather than threatening effects ofnitrate-N (Addiscott and Benjamin 2004; Lund-berg et al. 2004). Boink and Speijers (2001), how-ever, suggested that consumption of drinkingwater with such high nitrate concentration for aprolonged period should be avoided. On the otherhand, a half of the leaching volume is dischargedfinally into Zhujiang River via subterraneanpathway in this karst region (Zheng et al. 2003). Itis to be noted that the nitrate-N leaching isundoubtedly an environmental aspect. The excessfertilization, which results in large nitrate leachingloss, can also be an economical loss (Neetesonet al. 1999). In this study, therefore, we employedtemporarily the WHO recommended limit of
11.3 mg N l�1 as the criteria for evaluating themagnitude of nitrate-N leaching loss.
Results and discussion
Current situation of land resources related to arablecrop production and livestock husbandry
The arable land area per capita was 0.058 (0.018–0.135) ha at an average for all 46 farms (Figure 2).This value of 0.058 ha per capita was twice higherthan the value of 0.03 ha per capita that was re-ported previously in Qibainong (Tan 1998), butlower than the Chinese average (0.11 ha per capitain 2002) and much lower than the world average(0.23 in 2002) (FAO 2004). In addition, most ofthe arable land in Qibainong was arranged onsteeply sloped or terraced land among exposedrocks and in fissures, in which crop yield wasgenerally low (Iwama et al. 2003).
Chickens and pigs were raised on all farms inQibainong; cattle were raised on some farms inNongshi-tun, Nongli-tun, and Patan-tun. Live-stock density per unit of arable land area was 5.4(0.2–24.1) LU in average (Figure 3). For 36 of 46farms, the values were higher than the critical levelof 2–3 LU per ha, proposed for groundwater ni-trate protection in developed countries (Shiga1994). Particularly, the cattle-raising farms tendedto have higher livestock density (6.5–24.1 LU perha) than the others, with a maximum value of 11.0LU per ha (Figure 3). ‘Gathering’ herbage, as wellas ‘grazing’, play an important role in livestockfeeding in Qibainong, which might supplement ashortage of the feed.
N-cycling at the village scale
Food N consumption including both self-sup-ported and purchased was 93–254 kg N year�1,which corresponds to 2.2–3.3 kg N per cap-ita year�1 (Figure 4). This value was obviouslylower than the average consumption of protein N4.4 kg N per capita year�1 of the world averagebased on the FAO statistics (FAO 2004): 5.8 kgN year�1 in developed nations, 4.1 kg N year�1 indeveloping nations, and 5.0 kg N year�1 in China.The values were almost identical to that for thelimit of maintaining human health of 2–3 kg N per
124

capita year�1 (Smil 1997, 2002; Mosier et al. 2001;Galloway and Cowling 2002). Imported food Nwas 0.6–1.4 kg N per capita year�1 (Figure 4),which comprised 25–41% of the food N con-sumption, indicating many of food N supply wassupported by food imports from outside the vil-lage. In addition, food consumption at farm scalevaried among farms, which ranged between 1.1and 7.0 kg N per capita year�1 (3.1 kg N percapita year�1 in average) in Qibainong. In China,these variations are commonly observed. Manyauthors (Guo et al. 1999; Popkin et al. 2002;Popkin and Du 2003) show that the protein intake,
as well as the protein source in diet, for the richpeople was up to 2 times higher than that for thepoor.
The total amount of feed was 148–300 kgN year�1 at village scale (Figure 4): 49–81% of thefeed N was supplied by crops and their residuesharvested in the villages, and 17–47% was suppliedby gathering, whereas imported feed accounted foronly 1–6%. It shows the livestock feeding was self-supported within the village in Qibainong. Theamount of feed including grain cereals, however,was almost identical to the amount of food Nconsumed. It is indicated that large portion of cropproduction (grain and residues), which amountedto 115–339 kg N year�1 (77–112 kg N ha�1 year�1)
Figure 2. Population pressure for arable land area in Qibai-
nong, southwestern China. Data were sorted in order of
chemical fertilizer consumption in kg N ha�1, similar to the
manner used in Figure 5. Figures in this graph indicate the
population pressure, expressed as arable land area per capita.
Figure 3. Livestock density in Qibainong, southwestern China.
Data were sorted in order of chemical fertilizer consumption in
kg N ha�1 year�1, similar to the manner used in Figure 5.
125
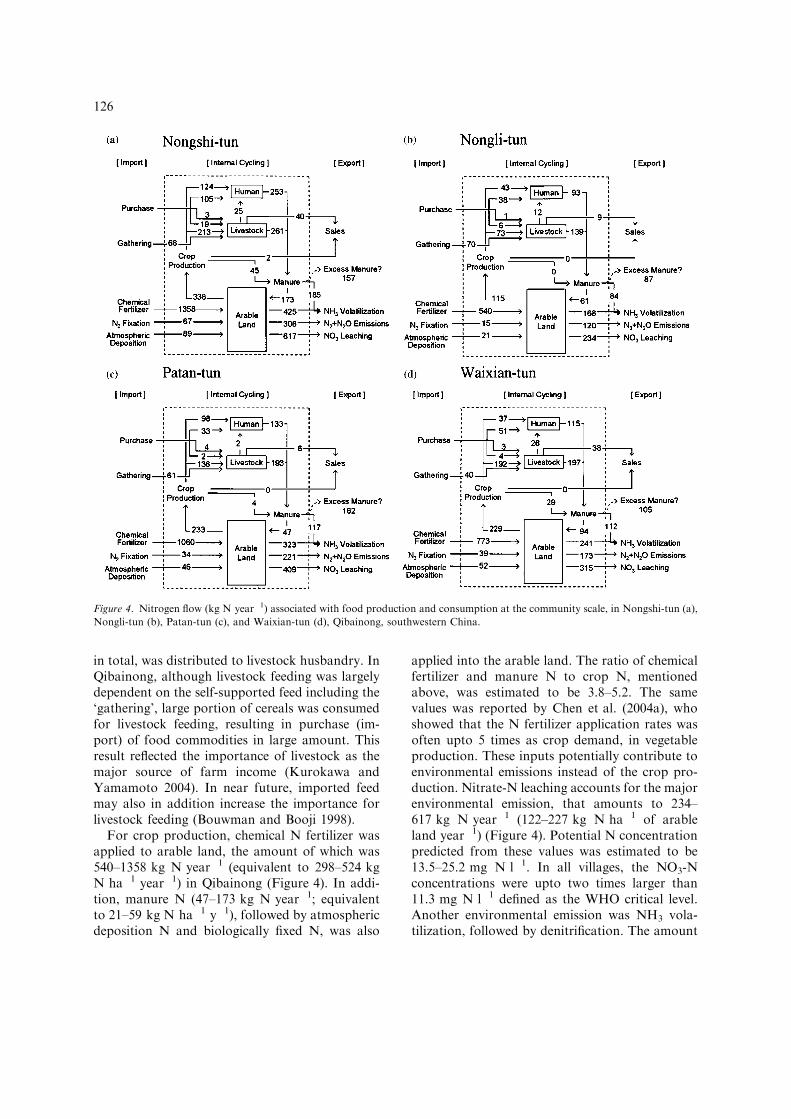
in total, was distributed to livestock husbandry. InQibainong, although livestock feeding was largelydependent on the self-supported feed including the‘gathering’, large portion of cereals was consumedfor livestock feeding, resulting in purchase (im-port) of food commodities in large amount. Thisresult reflected the importance of livestock as themajor source of farm income (Kurokawa andYamamoto 2004). In near future, imported feedmay also in addition increase the importance forlivestock feeding (Bouwman and Booji 1998).
For crop production, chemical N fertilizer wasapplied to arable land, the amount of which was540–1358 kg N year�1 (equivalent to 298–524 kgN ha�1 year�1) in Qibainong (Figure 4). In addi-tion, manure N (47–173 kg N year�1; equivalentto 21–59 kg N ha�1 y�1), followed by atmosphericdeposition N and biologically fixed N, was also
applied into the arable land. The ratio of chemicalfertilizer and manure N to crop N, mentionedabove, was estimated to be 3.8–5.2. The samevalues was reported by Chen et al. (2004a), whoshowed that the N fertilizer application rates wasoften upto 5 times as crop demand, in vegetableproduction. These inputs potentially contribute toenvironmental emissions instead of the crop pro-duction. Nitrate-N leaching accounts for the majorenvironmental emission, that amounts to 234–617 kg N year�1 (122–227 kg N ha�1 of arableland year�1) (Figure 4). Potential N concentrationpredicted from these values was estimated to be13.5–25.2 mg N l�1. In all villages, the NO3-Nconcentrations were upto two times larger than11.3 mg N l�1 defined as the WHO critical level.Another environmental emission was NH3 vola-tilization, followed by denitrification. The amount
Figure 4. Nitrogen flow (kg N year�1) associated with food production and consumption at the community scale, in Nongshi-tun (a),
Nongli-tun (b), Patan-tun (c), and Waixian-tun (d), Qibainong, southwestern China.
126

of NH3 volatilization, including during manurecomposting and post-application of chemical andmanure fertilizer, was 252–610 kg N year�1
(equivalent to 136–245 kg N ha�1 year�1) (Fig-ure 4).
With particular attention tomanureN, it is notedthat there was a large amount of unused manure(87–162 kg N year�1; 35–85 kg N ha�1 year�1),which was equivalent to 48–78% of the proportionto the total amount of manure N produced(149–329 kg N year�1; 74–145 kg N ha�1 year�1)(Figure 4). The unused manure N was accumulatedin the farm, potentially contributing to the nitratepollution and other environmental and healthaspects.
Farm-gate N balance and field surplus N balanceat the farm scale
N balances of farm system (‘Farm-Gate N Bal-ance’, Figure 5) showed total input ranged from168 to 1216 kg N ha�1 year�1, most of which werechemical N fertilizer from 113 to 1124 kgN ha�1 year�1, followed by food import, gather-ing the feed, and others. With special reference to‘Field N balance’ in the arable land (Figure 6),total input was estimated to be 152–1191 kgN ha�1 year�1, almost all input (67–96%) waschemical N fertilizer. The values varied amongfarms by as much as 10 times. Chemical N fertil-izer application rates were within the range of 500–1900 kg N ha�1 year�1 reported in previousChinese studies, varied among regions as well asamong farms within the region (Zhang et al. 1996;Ellis and Wang 1997; Hatano et al. 2002; Chenet al. 2004a). In addition, there was manure Ninput ranged from 0 to 132 kg N ha�1 year�1. Onthe other hand, crop production N was only 45–146 kg N ha�1 year�1, which did not increase withthe increase in the application rates of chemicalfertilizer + manure (Figure 7). Crop N reachedthe limit, eventhough much variations in the val-ues existed. N use efficiency, defined as the ratio ofcrop N uptake to chemical fertilizer and manure Napplication rate, was 8–85%, with quite a lowarithmetic average of 26% (Figure 8). The N useefficiency dropped drastically to about 10% withincreased chemical N fertilizer application, andonly three farms showed the ratio above 50%. Inchina, the efficiency reported to be decreasing
below 50% (Chen et al. 2004a), was observed nowin Qibainong.
Such a low productivity of fertilizer N (bothchemical fertilizer and manure) might be due tosome causes. One of them is the susceptibility toenvironmental loss: NH3 volatilization due to top-dressing ammoniac fertilizer on the calcareousalkaline soil, or rapid NO3 leaching due to nitri-fication in upland condition combined with thegeological and soil physical condition that favorleaching in Qibainong (Hatano et al. 2002). Inaddition, it has been estimated that at countryscale, in China serious K depletion (followed by P)in agricultural soils has been increasing (Syerset al. 2002; Sheldrick et al. 2003; Chen et al.2004a). As a consequence K deficiencies may be alimiting factor for cereal production. Indeed,soil available K content was low (about70–80 mg kg�1 soil; pH 7, ammonium acetate-exchangeable) (He et al. 1998), probably the rea-son for less P and K fertilization in this region.Beneficial effect of K application on cereal cropyield was proved in our study area (Shinano et al.2003). Major cause of the prevailing expansion ofK application indicated was the low response to Kfertilizer in many cases (Cai 2004), as well as lackof farmer’s education and expansion efforts. Thelatter also is pointed out to be the cause for top-dressing the ammonium-form fertilizer (Cai 2004).
Output consists of NO3-N leaching of �6 to511 kg N ha�1 year�1, followed by NH3 emission(56–401 kg N ha�1 year�1), denitrification (23–231 kg N ha�1 year�1), and unused manure N (2–191 kg N ha�1 year�1). These are increasing withthe increase in chemical and manure N application(Figures 5 and 6). Figure 9, for example, illus-trates the relationships between the N applicationrates of chemical fertilizer and manure, and NO3-N leaching potential. This loss was linearly corre-lated to the chemical N fertilizer application rate.The potential N concentration in drainage waterwas predicted to be 0–57 mg N l�1 at the farmscale; the geometric average was 18.6 mg N l�1.Thirty-three of 46 farms exceeded the WHO criti-cal limit. The potential risk of N pollution in waterresources appeared to be serious in Qibainong,combined with the village scale estimates as men-tioned above. Based on the equation between theN application rate of chemical fertilizer + manureand NO3-N leaching (Figure 9), the critical Napplication rate, maintaining below 11.3 mg N l�1
127

Figure 5. Farm-gate nitrogen balance at the farm scale in Nongshi-tun (NS01-16), Nongli-tun (NL01-08), Patan-tun (PT01-12), and
Waixian-tun (WX01-10), Qibainong, southwestern China. Data were sorted in order of consumption of chemical fertilizer in kg N per
ha of arable land year�1: e.g., in Nongshi-tun, NS01 was the highest farm and NS16 the lowest in terms of chemical fertilizer
consumption.
128

Figure 6. Field Nitrogen Balance at farm scale in Nongshi-tun (NS01-16), Nongli-tun (NL01-08), Patan-tun (PT01-12), and Waixian-
tun (WX01-10), Qibainong, southwestern China. Data were sorted in order of chemical fertilizer consumption in kg N ha�1 year�1, in
the same manner as that used in Figure 5.
129

of WHO critical level, was estimated to be 297 kgN ha�1 year�1 in this study. Hatano et al. (2002)estimated that the critical level of N applicationrate to maintain drainage water nitrate-N con-centration less than 10 mg N l�1 was 165–180 kgN ha�1 year�1 in Qibainong. They used the same
procedure of our study, but they employed thelower emission rate in the NH3 volatilization,which might overestimate the leaching potential.
Unused manure N (Figure 10) increased line-arly, concomitant with the increase of manure Nproduction (Figure 11). The proportion of unusedmanure to total manure N was 57% at an average(3–100%). Unused manure N was accumulatedwithin the farm or village, creating another N-pollution source. In this study, we estimated themanure N produced to be 29–253 kgN ha�1 year�1 at the farm scale (Figure 10). Cao(1999) described that ‘modern young Chinesefarmers will have no interest to collect, prepare(composting), and use the organic manure, be-cause of labor cost, time consuming, and the lownutrient contents’. Cai (2004) provided more sim-ple and clear reason for quitting a traditionalrecycling of organic manures: Chemical fertilizer isconvenient to practice, and farmer can get moreincome using chemical fertilizer. Kelly and Levin(1986) noted that the requirement for recyclingnutrients diminishes as the external inputs in-creased, from their researches of nutrient flow re-ports in a large number of natural ecosystems. InQibainong, the expansion of the external inputs,i.e. chemical fertilizer, may promote the dimin-ishing manure recycling, resulting in the largeamount of unused manure.
Unused manure N were large, but all thesevalues were below the critical level of 297 kg
Figure 9. Relationship between the N application rate of
chemical fertilizer and manure, and NO3-N leaching potential
in Qibainong, southwestern China.
Figure 8. Relationship between the N application rate of
chemical fertilizer and the N-use efficiency, as estimated by the
proportion of the N application rate of chemical fertilizer +
manure to the crop production N, in Qibainong, southwestern
China.
Figure 7. Relationship between N application rate of chemical
fertilizer and manure N vs. the N rate of crop production at
farm scale, in Qibainong, southwestern China.
130

N ha�1 year�1 for N application rate of chemicalfertilizer + manure. Considering the village scale,we estimated the average amount of manure Nproduction to be below the critical level: 74 kgN ha�1 year�1 for Nongshi-tun 144 kg Nha�1 year�1 for Nongli-tun, 92 kg N ha�1 year�1
for Patan-tun, and 77 kg N ha�1 year�1 forWaixian-tun. Therefore, it is suggested that therecycling of excess manure within the village mightbe achievable. Thereby, unused manure can bereduced. In addition, K supplementation alsomight be achievable, since manure is still animportant P and K source in Chinese crop pro-duction (Chen et al. 2004a). We recommended
that all manure N be used effectively on arableland, with shortages supplemented by chemical Nfertilizer up to 297 kg N ha�1 year�1 in Qibai-nong.
Conclusion
Important changes in agricultural practices andresultant N flows indicated that farmers desire aprosperous livelihood along with the economicdevelopment progressing in Qibainong. One mea-sure for this is the sale of livestock products-themajor source of farm income as well as migrantwork. Increased incomes have improved accessi-bility to chemical fertilizers, while encouragingfarmers to keep themselves away from traditionalorganic manure use; which eventually enhancedenvironmental problems such as nitrate leachingand ammonia volatilization. To ensure better Nmanagement, all manure N produced within thevillage should be used effectively on arable landsand the shortages should be supplemented bychemical fertilizers not exceeding 297 kg N ha�1.It is concluded that estimating farm-gate N bal-ances is an important tool in evaluating the Nflows within the agricultural systems and in rec-ommending for various measures to reduce theenvironmental load.
Figure 10. Manure production and consumption in Qibainong,
southwestern China. Total lengths of bars indicate the manure
production rate at the farm scale.
Figure 11. Relationship between the amount of total manure
and unused manure (kg N ha�1 year�1) of arable land area in
Qibainong, southwestern China.
131

Acknowledgement
This study was supported by Research of FutureProgram, Japan Society of the Promotion of Sci-ence (JSPS).
References
Addiscott T.M. and Benjamin N. 2004. Nitrate and human
health. Soil Use Manage. 20: 98–104.
Barry D.A.J., Goorahoo D. and Goss M.J. 1993. Estimation of
nitrate concentrations in groundwater using a whole farm
nitrogen budget. J. Environ. Qual. 22: 767–775.
Boink A. and Speijers G. 2001. Health effects of nitrates and
nitrites, a review. Acta Hort. 563: 29–36.
Bouwman A.F. and Booji H. 1998. Global use and trade of
feedstuffs and consequences for the nitrogen cycle. Nutr.
Cycl. Agroecosyst. 52: 261–267.
Bouwman L. and van Vuuren D. 1999. Global Assessment of
Acidification and Eutrification of Natural Ecosystems. , p.52,
UNEP/DEIA&EW/TR. 99–6 and RIVM402001012.
Bussink D.W. and Oenema O. 1998. Ammonia volatilization
from dairy farming systems in temperate areas: a review.
Nutr. Cycl. Agroecosyst. 51: 19–33.
Cai G., Chen D., Ding H., Pacholski A., Fan X.H. and Zhu
Z.L. 2002. Nitrogen losses from fertilizers applied to maize,
wheat and rice in the North China Plain. Nutr. Cycl. Agro-
ecosyst. 63: 187–195.
Cai G., Fan X., Yang Z. and Zhu Z. 1998. Gaseous loss of
nitrogen from fertilizers applied to wheat on calcareous soil
in North China Plain. Pedosphere 8(1): 45–52.
Cai Z. 2004. Strategies for rational application of nitrogen
fertilizers and alleviation of nitrogen pollution in China. In:
Proceedings of 2004 IFA Regional Conference for Asia and
The Pacific. Auckland, New Zealand. (14–16 December,
2004). www.fertilizer.org/ifa/.
Cao Z. 1999. Present status of bio-recycling/composting in
China. In: Proceedings of International Symposium of Bio-
recycling/Composting in Sapporo. Sapporo, Japan. (6–8
September, 1999). I-4-1–10.
Chen Q., Zhang X., Zhang H., Christie P., Li X., Horlacher D.
and Liebig H.-P. 2004a. Evaluation of current fertilizer
practice and soil fertility in vegetable production in the
Beijing region. Nutr. Cycl. Agroecosyst. 69: 51–58.
Chen X.Y., Mulder J., Wang Y.H., Zhao D.W. and Xiang R.J.
2004b. Atmospheric deposition, mineralization and leaching
of nitrogen in subtropical forested catchments, South China.
Environ. Geochem. Health. 26: 179–186.
Colbourn P. and Dowdell R.J. 1984. Denitrification in field
soils. Plant Soil 76: 213–226.
Dazhong W. and Pimentel D. 1986. Seventeenth century or-
ganic agriculture in China: cropping systems in the Jiaxing
region. Human Ecol. 14: 1–14.
Ellis E.C. and Wang S.M. 1997. Sustainable traditional agri-
culture in the Tai Lake region of China. Agric. Ecosyst.
Environ. 61: 177–193.
FAO 2004. Food balance sheet 2001. http://faostat.fao.org/.
Galloway J.N. and Cowling E.B. 2002. Reactive nitrogen and
the world: 200 years of change. AMBIO 31: 64–71.
Goss M.J. and Goorahoo D. 1995. Nitrate contamination of
groundwater: measurement and prediction. Fert. Res. 42:
331–338.
Guo J.Y. and Bradshaw A.D. 1993. The flow of nutrients and
energy through a Chinese farming system. J. Appl. Ecol. 30:
86–94.
Guo X., Popkin B.M., Mroz T.A. and Zhai F. 1999. Food price
policy can favorable alter macronutrient intake in China. J.
Nutr. 129: 994–1001.
Harada Y. 1996. Treatment and utilization of livestock manure
in foreign countries (‘Kaigai no Fun-nyo Shori to Riyou’).
Animal Husbandry (‘Chikusan no Kenkyu’) 50: 1335–1343
(in Japanese).
Harrison R. and Webb J. 2001. A review of the effect of N
fertilizer type on gaseous emissions. Adv. Agron. 73: 65–108.
Hatano R., Shinano T., Taigen Z., Okubo M. and Zuowei L.
2002. Nitrogen budgets and environmental capacity in farm
systems in a large-scale karst region, southern China. Nutr.
Cycl. Agroecosyst. 63: 139–149.
He Z., Tan H., Hasegawa I., Shinano T., Zhen T. and Tadano
T. 1998. Chemical properties of calcareous alkaline soil and
reddish acid soil in Qibainong and Beijing Experimental
Station. In: Second Report of General Study of Ecosystem
Restructuring and Continuous Biological Production in
Southwestern China, pp. 61–62. (in Japanese).
IPCC 1996. Reviced 1996 IPCC Guidelines for National
Greenhouse Gas Inventries. Reference Manual (Vol. 3),
Agriculture. http://www.ipcc-nggip.iges.or.jp/.
Isermann K. 1994. Agriculture’s share in the emission of trace
gases affecting the climate and some cause-oriented proposals
for sufficiently reducing this share. Environ. Poll. 83: 95–111.
Iwama K., Hasegawa T. and Jitsuyama Y. 2003. Productivity
of corn and potato in Qibainong, the southwest China. In:
Final Report of General Study of Ecosystem Restructuring
and Continuous Biological Production in Southwestern
China, pp. 330–340. (in Japanese).
Javis S.C. and Pain B.F. 1990. Ammonia volatilization from
agricultural land. Proc. Fert. Soc. 298: 1–35.
Jin J. and Portch S. 2001. Recent agricultural and fertilizer
developments in China. In: Proceedings of IFA Regional
Conference for Asia and the Pacific, (Ha Noi, 10–13
December, 2001).
Kelly J.R. and Levin S.A. 1986. A comparison of aquatic and
terrestrial nutrient cycling and production processes in nat-
ural ecosystems, with reference to ecological concepts of
relevance to some waste disposal issues. In: Kullenberg G.
(ed.), The Role of the Ocean as a Waste Disposal Option.
Reidel, Dordrecht, The Netherlands, pp. 165–203.
Kurokawa I. and Yamamoto M. 2004. Farm managements and
economic exploitations of minority groups in mountainous
karst areas, south-western China – Qibainongxiang village,
Dahuaxian prefecture, Guanxi. Rev. Agricult. Econ., Hok-
kaido University 60: 19–31. (in Japanese with English sum-
mary).
Li C.-K. and Chen R.-Y. 1980. Ammonium bicarbonate used as
a nitrogen fertilizer in China. Fert. Res. 1: 125–136.
Lundberg J.O., Weitzberg E., Cole J.A. and Benjamin N. 2004.
Nitrate, bacteria and human health. Nat. Rev. Microbiol. 2:
593–681.
132

Martens D.A. and Bremner J.M. 1989. Soil properties affecting
volatilization of ammonia from soils treated with urea.
Commun. Soil Sci. Plant Anal. 20(15–16): 1645–1657.
Matson P., Lohse K.A. and Hall S.J. 2002. The globalization of
nitrogen deposition: consequences for terrestrial ecosystems.
AMBIO 31: 113–119.
Mosier A.R., BlekenM.A., Chaiwanakupt P., Ellis E.C., Freney
J.R., Howarth R.B., Matson P.A., Minami K., Naylor R.,
Weeks K.N. and Zhu Z.-L. 2001. Policy implications of hu-
man-accelerated nitrogen cycling. Biogeochem. 52: 281–320.
Nakagawa Y. and Iwatsubo G. 2000. Water chemistry in a
number of mountainous streams of east Asia. J. Hydrol. 240:
118–130.
Nagumo T. and Hatano R. 2000. Impact of nitrogen cycling
associated with production and consumption of food on
nitrogen pollution of stream water. Soil Sci. Plant Nutr. 46:
325–342.
Neeteson J.J., Booij R. and Whitmore A.P. 1999. A review on
sustainable nitrogen management in intensive vegetable
production systems. Acta Hort. 506: 17–26.
Nieder R., Schollmayer G. and Richter J. 1989. Denitrification
in the rooting zone of cropped soils with regard to method-
ology and climate: a review. Biol. Fertil. Soils. 8: 219–226.
Popkin B.M. and Du S. 2003. Dynamics of the nutrition
transition toward the animal foods sector in China and its
implication: a worried perspective. J. Nutr. 133: 3898S–
3906S.
Popkin B.M., Lu B. and Zhai F. 2002. Understanding the
nutrition transition: measuring rapid dietary changes in tra-
ditional countries. Public Health Nutr. 5(6A): 947–953.
Resources Council, Science and Technology Agency (RCSTA)
1982. Standard Tables of Food Composition in Japan, 4th
edn. Printing Bureau, Ministry of Finance, Tokyo, pp. 1–368.
(in Japanese).
Richter J. and Roelcke M. 2000. The N-cycle as determined by
intensive agriculture – examples from central Europe and
China. Nutr. Cycl. Agroecosyst. 57: 33–46.
Roelcke M., Han Y., Schleef K.H., Zhu J.-G., Liu G., Cai Z.-C.
and Richter J. 2004. Recent trends and recommendations for
nitrogen fertilization in intensive agriculture in eastern China.
Pedosphere 14(4): 449–460.
RoelckeM., Li S.X., TianX.H., GaoY.J. andRichter J. 2002. In
situ comparisons of ammonia volatilization from N fertilizers
in Chinese loess soils. Nutr. Cycl. Agroecosyst. 62: 73–88.
Sheldrick W.F., Syers J.K. and Lingard J. 2003. Soil nutrient
audits for China to estimate nutrient balances and output/
input relationships. Agric. Ecosyst. Environ. 94: 341–354.
Shinano T., Taigen Z., Yamamura T., Meng Y., Lu W. and
Tan H. 2003. Production of maize in the karst mountain area
of sowthwest China. In: Final Report of General Study of
Ecosystem Restructuring and Continuous Biological Pro-
duction in Southwestern China. pp. 341–353. (in Japanese).
Shuiwang D., Shen Z. and Honryu H. 2000. Transport of dis-
solved inorganic nitrogen from the major rivers to estuaries
in China. Nutr. Cycl. Agroecosyst. 57: 13–22.
Shiga H. 1994. Management and recycling of livestock waste
for environmental protection in EC. J. Hokkaido Soc. Grassl.
Sci. 28: 11–15.
Smil V. 1997. Global population and the nitrogen cycle. Sci.
Am. 277: 76–81.
Smil V. 2002. Nitrogen and food production: proteins for hu-
man diets. AMBIO 31: 126–131.
Stone B. 1986. Chinese fertilizer application in the 1980s and
1990s: issues of growth, balance, allocation, efficiency and
response. In: China’s Economy Looks Toward the Year
2000. U.S. Joint Economic Committee, Vol. 1 (May). U.S.
Gov. Prin. Office, Washington, D.C., pp. 453–496.
Syers J.K., Sheldrick W. and Lingard J. 2002. Nutrient balance
changes as an indicator of sustainable agriculture. In: Trans.
17th World Cong. Soil Sciece. Paper No. 1641 (CD-ROM).
Tamura S. 1998. Chikyu Kankyo Saisei he no Kokoromi
(Challenge for the restoration of global environment). Ken-
sei-sha, Tokyo, pp. 179–208 (in Japanese).
Tan S.M. 1998. Current condition of forest resources and sit-
uation of afforestation at Qibainong, Beijing County. In: 1st
Report of General Study of Ecosystem Restructuring and
Continuous Biological Production in Southwestern China.
pp. 31–33. (in Chinese).
Terman G.L. 1979. Volatilization losses of nitrogen as ammo-
nia from surface-applied fertilizers, organic amendments, and
crop residues. Adv. Agron. 31: 189–223.
Tong C., Hall C.A.S. and Wang H. 2003. Land use change in
rice, wheat and maize production in China (1961–1998).
Agric. Ecosyst. Environ. 95: 523–536.
von Rheinbaben W. 1990. Nitrogen losses from agricultural
soils through denitrification – a critical evaluation. Z. Pflan-
zenernahr. Bodenk. 153: 157–166.
Wang S.-J., Liu Q.-M. and Zhang D.-F. 2004. Karst rocky
desertification in southwestern China: geomorphology,
landuse, impact and rehabilitation. Land Degrad. Develop.
15: 115–121.
Wen D. and Pimentel D. 1986. The flow of nutrients and energy
through a Chinese farming system. Human Ecol. 14(1): 1–14.
WHO 1998. Guidelines for Drinking-water Quality. Volume 1
Recommendations. 2nd edn. World Health Organization,
Geneva.
Xing G.X. and Zhu Z.L. 2000. An assessment of N loss from
agricultural fields to the environment in China. Nutr. Cycl.
Agroecosyst. 57: 67–73.
Xing G.X. and Zhu Z.L. 2002. Regional nitrogen budgets for
China and its major watersheds. Biogeochem. 57/58: 405–
427.
Yan W., Yin C. and Zhang S. 1999. Nutrient budgets and
biogeochemistry in an experimental agricultural watershed in
Southeastern China. Biogeochem. 45: 1–19.
Yan W. and Zhang S. 2003. How do nitrogen inputs to the
Changjiang basin impact the Changjiang River nitrate: a
temporal analysis for 1968–1997. Global Biogeochem. Cycles
17: 1091–1099.
Yan X., Akimoto H. and Ohara T. 2003. Estimation of nitrous
oxide, nitric oxide and ammonia emissions from croplands in
East, Southeast and South Asia. Global Change Biol. 9:
1080–1096.
Zhang W.L., Tian Z.X., Zhang N. and Li X.Q. 1996. Nitrate
pollution of ground water in northern China. Agric. Ecosyst.
Environ. 59: 223–231.
Zhang Y.-M., Chen D.-L., Zhang J.-B., Edis R., Hu C.-S. and
Zhu A.-N. 2004. Ammonia volatilization and denitrification
losses from an irrigated maize–wheat rotation field in the
North China Plain. Pedosphere 14(4): 533–540.
133

Zheng T., Meng Y., Tan H., Li Z., Ishii H. and Demura K.
2003. The historical change of the human society and the
ecosystem in the karst region, southwest China. In: Final
Report of General Study of Ecosystem Restructuring and
Continuous Biological Production in Southwestern China.
pp. 100–114.(in Japanese).
Zheng X., Fu C., Xu X., Yan X., Huang Y., Han S., Hu F. and
Chen G. 2002. The Asian nitrogen cycle case study. AMBIO
31: 79–87.
Zhu Z.L., Cai G.X., Simpson J.R., Zhang S.L., Chen D.L.,
Jackson A.V. and Freney J.R. 1989. Processes of nitrogen
loss from fertilizers applied to flooded rice fields on a cal-
careous soil in north-central China. Fertil. Res. 18: 101–115.
Zhu Z.L. and Chen D.L. 2002. Nitrogen fertilizer use in China
– contributions to food production, impacts on the environ-
ment and best management strategies. Nutr. Cycl. Agroeco-
syst. 63: 117–127.
134