Bioaccumulation and Trophic Transfer of Methylmercury in Long Island Sound

RESEARCH ARTICLE
Sedimentary record of water column trophic conditionsand sediment carbon fluxes in a tropical water reservoir(Valle de Bravo, Mexico)
Vladislav Carnero-Bravo & Martín Merino-Ibarra &
Ana Carolina Ruiz-Fernández & Joan Albert Sanchez-Cabeza &
Bassam Ghaleb
Received: 10 March 2014 /Accepted: 7 October 2014# Springer-Verlag Berlin Heidelberg 2014
Abstract Valle de Bravo (VB) is the main water reservoir ofthe Cutzamala hydraulic system, which provides 40 % of thedrinking water consumed in the Mexico City MetropolitanArea and exhibits symptoms of eutrophication. Nutrient (C, Nand P) concentrations were determined in two sediment coresto reconstruct the water column trophic evolution of thereservoir and C fluxes since its creation in 1947. Radiometric
methods (210Pb and 137Cs) were used to obtain sedimentchronologies, using the presence of pre-reservoir soil layersin one of the cores as an independent chronological marker.Mass accumulation rates ranged from 0.12 to 0.56 g cm−2
year−1 and total organic carbon (TOC) fluxes from 122 to380 g m−2 year−1. Total N ranged 4.9–48 g m−2 year−1, andtotal P 0.6–4.2 g m−2 year−1. The sedimentary record showsthat all three (C, N and P) fluxes increased significantly after1991, in good agreement with the assessed trophic evolutionof VB and with historic and recent real-time measurements. Inthe recent years (1992–2006), the TOC flux to the bottom ofVB (average 250 g m−2 year−1, peaks 323 g m−2 year−1) issimilar to that found in highly eutrophic reservoirs and im-poundments. Over 1/3 of the total C burial since dam con-struction, circa 70,000 t, has occurred in this recent period.These results highlight the usefulness of the reconstruction ofcarbon and nutrient fluxes from the sedimentary record toassess carbon burial and its temporal evolution in freshwaterecosystems.
Keywords 210Pb chronology . Eutrophication . Lakesediments . Organic carbon fluxes . Valle de Bravo reservoir
Introduction
In parallel with population growth and technology develop-ment, environmental change is substantial and increasing.Anthropogenic eutrophication and the resulting hypoxic (O2
<2.0 mg L−1) or anoxic (complete absence of oxygen) condi-tions (Diaz 2001) are amongst the most important environ-mental problems of aquatic ecosystems. Seasonal redox con-ditions are linked to eutrophication because oxygen is con-sumed during organic matter (OM) degradation and this pro-cess enhances nutrient release to the water column
Responsible editor: Philippe Garrigues
V. Carnero-BravoPosgrado en Ciencias del Mar y Limnología, Universidad NacionalAutónoma de México, Cd. Universitaria, México, Distrito Federal,Mexicoe-mail: [email protected]
M. Merino-IbarraUnidad Académica de Ecología y Biodiversidad Acuática, Institutode Ciencias del Mar y Limnología, Universidad Nacional Autónomade México, Ciudad Universitaria, Coyoacán, Mexico, DistritoFederal 04510, Mexicoe-mail: [email protected]
A. C. Ruiz-Fernández (*)Unidad Académica Mazatlán, Instituto de Ciencias del Mar yLimnología, Universidad Nacional Autónoma de México, Calz. J.Montes Camarena s/n, Col. Playa Sur, 82040 Mazatlán, Sinaloa,Mexicoe-mail: [email protected]
J. Sanchez-CabezaUnidad Académica de Procesos Oceánicos y Costeros, Instituto deCiencias del Mar y Limnología, Universidad Nacional Autónoma deMéxico, Ciudad Universitaria, Coyoacán, 04510 México, DistritoFederal, Mexicoe-mail: [email protected]
B. GhalebCentre de Recherche en Géochimie et Géodynamique (GEOTOP),Université du Québec à Montréal, 201 Avenue Président-Kennedy,Montréal H2X 3Y7, Canadae-mail: [email protected]
Environ Sci Pollut ResDOI 10.1007/s11356-014-3703-0

(Zimmerman and Canuel 2000). However, to better constrainglobal carbon fluxes, the methodologies used to sample andcalculate carbon cycling in freshwater ecosystems should beimproved (Downing 2010; Pittman et al. 2013).
The combination of phosphorus and nitrogen loadings inlakes, both through internal processes and external inputs,may largely increase primary productivity (i.e. high phyto-plankton biomass) often accompanied by unpleasantcyanobacteria blooms, high OM settling rates and anoxichypolimnetic water layers (Gächter and Wehrli 1998). In-creased eutrophication is a common problem in Mexicanwater bodies, including Valle de Bravo Lake (VB) (Olvera-Viascán et al. 1998; Merino-Ibarra et al. 2008; Ramírez-Zierold et al. 2010), which has also been reported to experi-ence toxic algal blooms by the filamentous cyanobacteriumPseudanabaena tenuis (Olvera-Ramirez et al. 2010).
Eutrophication problems can be better understood andmanaged if information about pre-existing conditions of aparticular ecosystem is available. Particulate and dissolvedsubstances tend to accumulate in bottom sediments due toscavenger agents, absorptive components and particle settling(Mulligan et al. 2001; Peng et al. 2009). When sediments arenot affected by bioturbation, physical mixing or erosion, thesediment profile contains an integrated archive of informationon the temporal changes of, for example, pollution (Goldberget al. 1977). A fraction of the nutrients received from thedrainage basins are transferred to the hypolimnion, wherethe exchange between bottom sediments and the overlyingwater is highly mediated by the trophic state (Alaoui-Mhamdiet al. 2014). Therefore, lake sediments are natural archives thatmay record water quality changes associated to eutrophication(Appleby 2001) through the evolution of nutrient fluxes to thesediment. Accurate sediment chronologies are crucial to inter-pret the sedimentary record and 210Pb and 137Cs provideindependent methods to establish reliable chronologies(Robbins 1978).
The aim of the present work was to assess the historicalchanges of the water column trophic conditions in the mainreservoir of the Mexico City water supply system, throughchanges in concentrations and fluxes to sediments of totalorganic carbon (TOC), total nitrogen (TN), total phosphorus(TP), as well as C/N ratios, in two sedimentary records datedwith the 210Pb method. The TOC accumulation rates andsediment storing capacity were determined, and the impor-tance of VB as a sink of organic carbon was discussed. Thisstudy shows the outstanding potential of the sedimentaryrecord of nutrients fluxes to reveal the major anthropogenicperturbations (e.g. increase of sewage inputs due to urbaniza-tion) occurring in aquatic systems. In addition, results are arelevant contribution to carbon budget analysis for climatechange models. This knowledge can be extended to otherwater bodies where information on timing and nature ofpast perturbations is not available.
Study site
Valle de Bravo is an artificial lake located in the State ofMexico (19° 21 30 N, 100° 11 00 W) at an altitude of1830 m above sea level (Fig. 1). The climate in this region iswarm to temperate with pronounced dry (Nov–May) and wetseasons (Jun–Oct). Mean precipitation is 836 mm year−1, andmean evaporation is 1620 mm year−1 (Ramírez-Zierold et al.2010). Base rocks in the area are volcanic (basalts) and meta-morphic, and the overlying soils are predominantly orthicacrisol and humic andosol (Olvera-Viascán et al. 1998).
Valle de Bravo is the largest of the seven water reservoirs ofthe Cutzamala Hydraulic System, which supplies 6 m3 s−1 ofthe drinking water consumed in the Mexico City metropolitanarea. VB was formed by flooding farmland by 1947; it re-ceives water through the Amanalco River, smaller tributaries(Molino, González, Carrizal) and sewage outlets from the VBtown (Fig. 1). It has a surface area of ∼18.55 km2, a meandepth of 21.1 m (maximum 38.6 m) and a storage capacity of391 million of cubic meters (Merino-Ibarra et al. 2008). Inaddition, VB is a relevant touristic attraction for the region dueto its scenic beauty.
Through time, VB has experienced important water levelfluctuations particularly between 1950 and 1982 (up to 25 m),when it was used for hydroelectric power generation (Fig. 1).Since 1984, it serves as a water supply reservoir and its levelhas remained high, with small-level fluctuations (<10 m) re-lated to the balance between water extraction and rainfall.Since 1987, VB behaves as a warm holomictic–monomicticwater body (Olvera-Viascán et al. 1998).
Valle de Bravo is affected by nutrient pollution derivedfrom local town sewage, agriculture and wastewater dis-charges from the watershed (Ramírez-Zierold et al. 2010).According to Olvera-Viascán et al. (1998), between 1980and 1987, VB became mesotrophic and by 1993, it hadbecome eutrophic. Previous studies show cyanobacteria dom-inance during summer and anoxia in the hypolimnion duringthe stratification period (Merino-Ibarra et al. 2008).
Materials and methods
Sample collection
Two sediment cores were collected on 21 April 2006 with aUWITEC gravity corer (8.6-cm diameter): core 4VB (46-cmlong) at 19° 11.76 N, 100° 9.25 W and 20.4-m depth; andcore 8VB (87-cm long) at 19° 12.54 N, 100° 10.32 W and28-m depth. Core 4VB was sectioned at 1 cm, except only thefirst section (0–0.5 cm). Core 8VBwas sectioned at 1 cm fromthe top to 20 cm, and at 1.5 cm below. Except for grain sizeanalysis aliquots, sediment samples were freeze-dried, groundto a powder with a porcelain mortar and pestle, and stored in
Environ Sci Pollut Res

polyethylene bags. Sediment dry weight was used for massdepth (g cm−2) calculation according to Sanchez-Cabeza andRuiz-Fernández (2012) in order to compensate for sed-iment compaction due to burial and sampling artefacts(Robbins 1978).
Laboratory analysis
Grain size distribution was determined by standard methodsof sieving and pipetting analysis (Folk 1974). Total carbon(TC), total organic carbon (TOC) and total nitrogen (TN)concentrations were determined with a CE Instruments FlashEA 1112 Element Analyzer. TOC measurement followedremoval of the carbonate fraction in silver capsules using1.5 M HCl, and was analyzed only in core 8VB. The coeffi-cient of variation of the measurement (1 % for TC and TN)was determined by replicate analyses of the certified reference
material LECO 502–309 (Leco 2003). For total phosphorus(TP), samples were burnt at 550 °C for 1 h and TP wasmeasured as molybdate-reactive P by UV spectrometry(Páez-Osuna et al. 1991). Replicate analyses yielded a 6 %TP precision.
Al, Mn and Fe concentrations were determined by flameatomic absorption spectrophotometry. Dry sediment aliquots(0.5 g) were digested in closed Savillex™ containers on a hotplate (∼120 °C overnight; Loring and Rantala 1992). Accura-cy and analytical precision were evaluated through six repli-cates of the certified reference material IAEA SL-3(LaBrecque et al. 1987). Metal recovery ranged from 90 to107 %. Analytical precision was 2 % for Al, 8 % for Fe and3 % for Mn. Magnetic susceptibility (MS) was measured in aBartington Magnetic Susceptibility Meter model MS2G(Bartington Instruments 2000) and expressed in dimension-less volume units.
Amanalco River
Dam
Local Sewage
VALLE DE BRAVO TOWN
Molino River
Gonzalez River Carrizal River
SYMBOLOGY
10 level curve
cores
town
10
0
20
25
30
35
25
20
10
0
001
0252
0 500 1000 m
4VB
8VB
N
Tizates River
YEAR
) M
SLevoba
sr et em(
ED
UT ITLAL EVE L
RETAW
b
a
1950 1955 1960 1965 1970 1975 19801795
1800
1805
1810
1815
1820
1825
1830
1985 1990 1995 2000 2005
Water reservoirHydroelectricplant
Fig. 1 a Valle de Bravo reservoirbathymetry (modified fromMerino-Ibarra et al. 2008);sampling sites and main inputs(rivers and sewage); isobaths arein metre below the maximum.b Water level from 1950 to 2006(sample collection date).MSL = mean sea level
Environ Sci Pollut Res

The age of the sediments in VB cores was determined byusing the 210Pb datingmethod. 210Pb (T1/2=22.23±0.12 years)is a natural radionuclide of the 238U decay series. The totalactivity of 210Pb in the sediments is integrated by (1) thesupported 210Pb (210Pbsup) which is formed in situ in thesediments, derived from 226Ra (T1/2=1,600±7 years), and(2) the excess 210Pb (210Pbxs) that is formed in the atmospherethrough the radioactive decay of the 222Rn (T1/2=3.8232±0.0008 days) exhaled through the soils. Once incorporatedto aquatic undisturbed sediments, 210Pb is subject to radioac-tive decay and can be used to determine sediment chronolo-gies and accumulation rates (Sanchez-Cabeza and Ruiz-Fernández 2012). 210Pb activity was quantified through theactivity of its daughter product 210Po, assuming secular equi-librium between the two isotopes (Schell and Nevissi 1983) atthe Laboratorio de Geoquímica Isotópica y Geocronología-UNAM. Sediment aliquots (0.25 g) were spiked with 209Po asa recovery tracer and were acid digested (1:5:4 HF + HNO3 +HCl) in closed PFA Savillex™ containers on a hotplate(120 °C, overnight). The digestate was evaporated to dryness;the residue was converted to a chloride salt by repeatedevaporation with 12 M HCl and then dissolved in 0.5 MHCl in the presence of ascorbic acid as a reducing agent forFe3+. 209Po and 210Po isotopes were spontaneously depositedon a spinning Ag disc (Hamilton and Smith 1986) and theactivity was measured byα-spectrometry using ORTEC siliconsurface barrier detectors coupled to a PC running under Mae-stro™ data acquisition software. 210Pbsup was estimatedthrough the activity of 226Ra, assuming secular equilibriumbetween both radionuclides, and the 210Pbxs was obtained fromthe difference between the measured 210Pb activity minus the210Pbsup activity. Sediment chronologies were established usingthe constant flux (CF) 210Pb dating model (Sanchez-Cabezaand Ruiz-Fernández 2012) and uncertainties were estimatedwith a Monte Carlo method (Sanchez-Cabeza et al. 2014).
For 210Pb chronology validation, we have used 137Cs ac-tivity as a chronological marker. The artificial radionuclide137Cs (T1/2=30.05±0.08 years) was globally distributed dueto the atmospheric nuclear weapon tests (Aoyama et al. 2006),showed maximum tropospheric concentrations in 1962–1964and it is often used to corroborate 210Pb chronologies in orderto improve the dating accuracy (Ruiz-Fernández et al. 2005).137Cs and 226Ra were measured by γ-ray spectrometry using aCanberra HPGe well detector at GEOTOP-UQAM in selectedsections of core 8VB (59- to 74-cm depth). Weighed sedimentsamples were stored in glass vials (8×40 mm, 1-mL capacity)for 3 weeks before measurement to allow for secular equilib-rium between 226Ra and some daughter products. 226Ra con-centrations were calculated as the average of 214Pb and 214Biactivities in each section, assuming secular equilibrium. Rep-licate analyses (n=12) of the standard reference materialIAEA-300 (radionuclides in Baltic Sea sediment) confirmedthe reliability gamma spectrometry results.
Results
Characterization and nutrients
Sediment cores were mostly clayey (44–100 %) and only afew sections showed more than 30 % of silts (Table 1). MSprofiles (Fig. 2) showed increasing values with depth in bothcores, although in core 8VB, theMS values tended to decreasebelow 82 cm (16.5 g cm−2). Al and Fe concentrations (Fig. 2)showed overall increasing trends with depth in both cores,although in 8VB they showed a decreasing trend below 69-cmdepth (∼12 g cm−2). The Mn concentrations in core 4VB(Fig. 2) showed almost constant concentrations with depth,in contrast to core 8VB, where segment 65–74 cm (11–14 g cm−2) showed higher values than the rest of the core.TC and TN concentration profiles (Fig. 3) showed significantdecreasing trends with depth in both cores (p<0.05, r>0.91).TOC (Fig. 3) and CaCO3 (Fig. 2) concentration profiles incore 8VB also showed a decreasing trend until 65 cm(∼11 g cm−2) depth, from where increments were observedto the core bottom. In the bottom segment (65–87 cm, ∼11–16.5 g cm−2) peak values were observed for TC, TN, CaCO3
and TOC concentrations. The C/N values oscillated within arelatively low range (4–8) from the surface to 87-cm depth(∼17 g cm−2) but also peaked to a higher range (9–11) belowthat depth (Fig. 3). TP concentrations also showed a decreas-ing trend with depth but with higher values at the deepestsegment (Fig. 3), although the breakpoint was observed at71 cm (13 g cm−2). The higher concentrations of total phos-phorus (Fig. 3) were found in the superficial sediments (aver-age concentration 0.83±0.22 mg g−1), within the range of TPconcentrations in sediments of other eutrophicated reservoirs(0.55–0.99mg g−1) in China (Jin et al. 2013;Wang et al. 2009;Gao et al. 2008) and Argentina (Borgnino et al. 2006).
The values and trends observed in all depth profiles forboth cores are similar. The higher values of TC, TN, TOC,CaCO3 and C/N and the lower values of MS in the 8VBbottom segment (below 81.5-cm depth) most likely identifythe original soils which were flooded to build the reservoir.
Radiochronology
The 210Pb depth profiles obtained for the two sediment coresare shown in Fig. 4 and Table 1. The two 210Pbex depthprofiles showed subsurface maxima in the upper segment ofthe cores (above 0.44 g cm−2 in core 8VB and 0.36 g cm−2 incore 4VB); nonetheless, the 210Pbex profiles showed signifi-cant exponential trends with depth (r2>0.50, p<0.05; Fig. 4),indicating that mixing is negligible.
Equilibrium between 210Pb and 226Ra was not achieved inany core, thus, the 210Pbex inventory was incomplete(Appleby 2001). In order to estimate de 210Pbex inventory incore 8VB, we used as a reference date the dam flooding date
Environ Sci Pollut Res

Table 1 210Pbex, age, mass accumulation rate (MAR) and sediment accumulation rate (SAR) in sediment cores from VB reservoir
Section Mass depth Dry bulk density Silt Clay 210Pbex ± Age ± MAR ± SAR ± Date(cm) (g cm–2) (g cm–3) (%) (%) (Bq kg–1) (year) (g cm–2 year–1) (cm year–1)
Core 8VB
0–1 0.00796 0.0159 56 44 11 4 0.0045 0.0002 0.40 0.03 17.3 0.3 2006.3
1–2 0.0367 0.0415 0 100 60 5 0.072 0.003 0.44 0.02 14.0 0.7 2006.2
2–3 0.0733 0.0316 0 100 67 6 0.189 0.006 0.260 0.007 6.6 0.2 2006.1
3–4 0.118 0.0578 23 77 122 6 0.422 0.014 0.218 0.010 4.1 0.2 2005.9
4–5 0.183 0.0716 20 80 51 5 0.69 0.02 0.320 0.006 4.85 0.04 2005.6
5–6 0.249 0.0617 11 89 43 5 0.86 0.02 0.349 0.001 5.34 0.07 2005.4
6–7 0.313 0.0652 0 100 93 6 1.08 0.03 0.271 0.004 4.16 0.03 2005.2
7–8 0.380 0.0689 21 79 57 5 1.34 0.03 0.231 0.004 3.51 0.12 2005.0
8–9 0.444 0.0595 31 69 129 8 1.65 0.05 0.196 0.003 3.0 0.2 2004.7
9–10 0.509 0.0698 0 100 72 5 1.98 0.05 0.228 0.004 3.00 0.13 2004.3
10–11 0.595 0.103 44 56 66 5 2.30 0.06 0.287 0.010 3.28 0.07 2004.0
11–12 0.683 0.0731 26 74 54 5 2.60 0.07 0.32 0.02 3.52 0.10 2003.7
12–13 0.778 0.117 13 87 53 4 2.88 0.08 0.308 0.011 2.99 0.04 2003.4
13–14 0.894 0.114 19 81 78 5 3.29 0.09 0.238 0.002 2.22 0.02 2003.0
14–15 0.992 0.0819 29 71 101 5 3.77 0.10 0.184 0.002 1.942 0.011 2002.5
15–16 1.08 0.101 10 90 106 7 4.32 0.12 0.175 0.002 1.791 0.013 2002.0
16–17 1.19 0.107 11 89 85 5 4.89 0.13 0.1975 0.0013 1.879 0.002 2001.4
17–18 1.29 0.105 19 81 73 5 5.39 0.14 0.215 0.005 2.04 0.07 2000.9
18–19 1.40 0.106 15 85 82 5 5.87 0.16 0.225 0.007 2.10 0.10 2000.4
19–20 1.51 0.113 0 100 59 5 6.34 0.17 0.2480 0.0012 2.117 0.013 2000.0
20–21.5 1.67 0.138 12 88 66 5 7.0 0.2 0.2817 0.0013 1.95 0.06 1999.3
21.5–23 1.92 0.195 13 87 39 4 7.8 0.2 0.3381 0.0006 1.99 0.15 1998.6
23–24.5 2.18 0.148 5 95 43 4 8.4 0.2 0.362 0.013 2.0 0.2 1997.9
24.5–26 2.46 0.228 14 86 43 4 9.2 0.3 0.38 0.04 2.0 0.2 1997.1
26–27.5 2.75 0.158 14 86 28 4 10.0 0.3 0.40 0.03 2.3 0.2 1996.3
27.5–29 2.98 0.157 5 95 47 4 10.6 0.3 0.391 0.006 2.24 0.05 1995.7
29–30.5 3.27 0.230 4 96 25 4 11.3 0.3 0.44 0.02 2.23 0.09 1995.0
30.5–32 3.58 0.174 13 87 32 4 11.9 0.3 0.47 0.03 2.4 0.2 1994.4
32–33.5 3.85 0.194 15 85 29 4 12.5 0.4 0.49 0.03 3.1 0.3 1993.8
33.5–35 4.06 0.0872 0 100 20 4 12.9 0.4 0.56 0.03 4.2 0.3 1993.4
35–36.5 4.26 0.170 7 93 25 4 13.3 0.4 0.51 0.03 3.5 0.2 1993.0
36.5–38 4.52 0.177 0 100 35 4 13.9 0.4 0.39 0.02 2.42 0.08 1992.4
38–39.5 4.74 0.125 0 100 38 4 14.5 0.4 0.37 0.02 2.43 0.10 1991.8
39.5–41 4.97 0.182 0 100 26 4 15.1 0.5 0.372 0.014 2.22 0.10 1991.2
41–42.5 5.26 0.192 15 85 43 5 15.9 0.5 0.321 0.003 1.70 0.04 1990.4
42.5–44 5.54 0.190 8 92 40 4 16.9 0.5 0.274 0.005 1.39 0.02 1989.4
44–45.5 5.85 0.220 4 96 50 5 18.1 0.6 0.242 0.008 1.18 0.03 1988.2
45.5–47 6.15 0.186 17 83 49 5 19.4 0.6 0.2422 0.0004 1.208 0.011 1986.9
47–48.5 6.45 0.210 7 93 32 4 20.6 0.7 0.3581 0.0010 1.65 0.02 1985.7
48.5–50 6.79 0.247 25 75 13 4 21.3 0.7 0.4226 0.0012 1.792 0.011 1985.0
50–51.5 7.16 0.242 14 86 39 4 22.2 0.7 0.318 0.004 1.31 0.02 1984.1
51.5–53 7.52 0.238 4 96 40 4 23.7 1.1 0.242 0.009 1.02 0.05 1982.6
53–54.5 7.87 0.226 10 90 39 4 25.2 1.2 0.238 0.006 1.02 0.04 1981.1
54.5–56 8.22 0.246 8 92 35 4 26.6 1.3 0.248 0.006 1.01 0.02 1979.7
56–57.5 8.61 0.269 14 86 31 4 28.1 1.4 0.277 0.006 1.05 0.03 1978.2
57.5–59 9.01 0.267 15 85 24 4 29.5 1.5 0.304 0.010 1.12 0.04 1976.8
59–60.5 9.42 0.282 0 100 26 4 30.8 1.6 0.321 0.012 1.19 0.04 1975.5
Environ Sci Pollut Res

Table 1 (continued)
Section Mass depth Dry bulk density Silt Clay 210Pbex ± Age ± MAR ± SAR ± Date(cm) (g cm–2) (g cm–3) (%) (%) (Bq kg–1) (year) (g cm–2 year–1) (cm year–1)
60.5–62 9.82 0.247 0 100 19 4 32.0 1.7 0.306 0.009 1.18 0.05 1974.3
62–63.5 10.2 0.264 8 92 32 4 33.4 1.8 0.277 0.014 1.02 0.05 1972.9
63.5–65 10.6 0.322 0 100 18 4 35.0 1.9 0.30 0.03 0.97 0.06 1971.3
65–66.5 11.1 0.322 27 73 23 4 36 2 0.28 0.03 0.89 0.06 1969.9
66.5–68 11.6 0.296 0 100 30 4 38 2 0.233 0.015 0.76 0.05 1967.9
68–69.5 12.0 0.317 0 100 21 4 40 2 0.253 0.010 0.80 0.03 1965.9
69.5–71 12.5 0.336 12 88 18 4 42 2 0.290 0.014 0.87 0.03 1964.2
71–72.5 13.0 0.345 0 100 17 4 44 2 0.28 0.04 0.84 0.11 1962.5
72.5–74 13.5 0.303 4 96 21 4 46 2 0.25 0.03 0.80 0.09 1960.6
74–75.5 14.0 0.314 0 99 17 4 48 3 0.26 0.04 0.82 0.13 1958.7
75.5–77 14.5 0.326 9 90 16 4 49 3 0.25 0.04 0.79 0.15 1957.0
77–78.5 14.9 0.304 14 85 21 4 51 3 0.21 0.03 0.65 0.08 1954.9
78.5–80 15.4 0.349 3 96 21 4 54 3 0.178 0.010 0.53 0.03 1952.3
80–81.5 16.0 0.351 8 91 21 4 57 3 0.143 0.004 0.396 0.014 1949.2
81.5–83 16.5 0.408 0 99 33 4 – – – – – – –
83–84.5 17.2 0.530 0 99 21 4 – – – – – – –
84.5–86 18.0 0.522 0 99 12 4 – – – – – – –
86–87 18.6 0.373 10 89 15 4 – – – – – – –
Core 4VB
0–0.5 0.0170 0.0679 0 100 52 5 0.065 0.003 0.26 0.03 4.3 0.4 2006.2
0.5–1.5 0.0559 0.0438 53 47 52 5 0.214 0.007 0.22 0.03 4.3 0.6 2006.1
1.5–2.5 0.100 0.0441 29 71 102 7 0.467 0.014 0.164 0.012 3.3 0.3 2005.8
2.5–3.5 0.156 0.0692 0 100 70 6 0.821 0.024 0.166 0.012 2.8 0.2 2005.5
3.5–4.5 0.218 0.0544 20 80 76 6 1.16 0.03 0.17 0.02 2.5 0.3 2005.1
4.5–5.5 0.289 0.0881 19 81 92 5 1.64 0.05 0.139 0.010 1.9 0.3 2004.7
5.5–6.5 0.365 0.0626 0 100 115 6 2.24 0.07 0.126 0.007 1.8 0.3 2004.1
6.5–7.5 0.432 0.0727 23 77 78 6 2.75 0.08 0.158 0.006 2.0 0.2 2003.6
7.5–8.5 0.523 0.109 36 63 55 5 3.22 0.10 0.181 0.008 1.9 0.2 2003.1
8.4–9.5 0.628 0.100 24 76 83 6 3.81 0.12 0.154 0.007 1.50 0.12 2002.5
9.5–10.5 0.729 0.102 30 70 95 5 4.57 0.14 0.126 0.002 1.19 0.01 2001.7
10.5–11.5 0.841 0.123 33 67 99 6 5.52 0.17 0.124 0.005 0.98 0.03 2000.8
11.5–12.5 0.984 0.163 13 87 74 6 6.6 0.2 0.144 0.009 0.99 0.09 1999.7
12.5–13.5 1.13 0.134 18 82 61 5 7.5 0.2 0.174 0.005 1.20 0.11 1998.8
13.5–14.5 1.27 0.150 4 96 50 5 8.3 0.3 0.244 0.006 1.6 0.2 1998.0
14.5–15.5 1.43 0.167 13 87 19 4 8.8 0.3 0.322 0.011 1.86 0.14 1997.5
15.5–16.5 1.62 0.208 9 91 40 5 9.4 0.3 0.323 0.009 1.75 0.04 1996.9
16.5–17.5 1.80 0.154 31 69 26 4 10.0 0.3 0.31 0.02 1.77 0.07 1996.3
17.5–18.5 1.98 0.194 15 84 34 4 10.5 0.3 0.30 0.02 1.67 0.08 1995.8
18.5–19.5 2.16 0.166 13 87 38 5 11.2 0.4 0.250 0.011 1.45 0.05 1995.1
19.5–20.5 2.32 0.162 8 92 42 5 11.9 0.4 0.23 0.02 1.41 0.12 1994.4
20.5–21.5 2.48 0.166 3 97 39 5 12.6 0.4 0.23 0.02 1.32 0.09 1993.7
21.5–22.5 2.67 0.198 12 88 41 5 13.4 0.4 0.252 0.011 1.33 0.03 1992.9
22.5–23.5 2.86 0.195 14 82 23 4 14.1 0.5 0.31 0.04 1.7 0.2 1992.2
23.5–24.5 3.05 0.169 13 85 26 4 14.7 0.5 0.35 0.04 2.2 0.3 1991.7
24.5–25.5 3.19 0.114 12 87 24 4 15.1 0.5 0.36 0.03 3.1 0.4 1991.2
25.5–26.5 3.29 0.0901 21 79 20 4 15.3 0.5 0.40 0.03 3.7 0.4 1991.0
26.5–27.5 3.40 0.137 8 91 21 4 15.6 0.5 0.34 0.03 2.6 0.3 1990.7
27.5–28.5 3.57 0.206 11 89 38 4 16.3 0.5 0.27 0.03 1.6 0.2 1990.0
Environ Sci Pollut Res
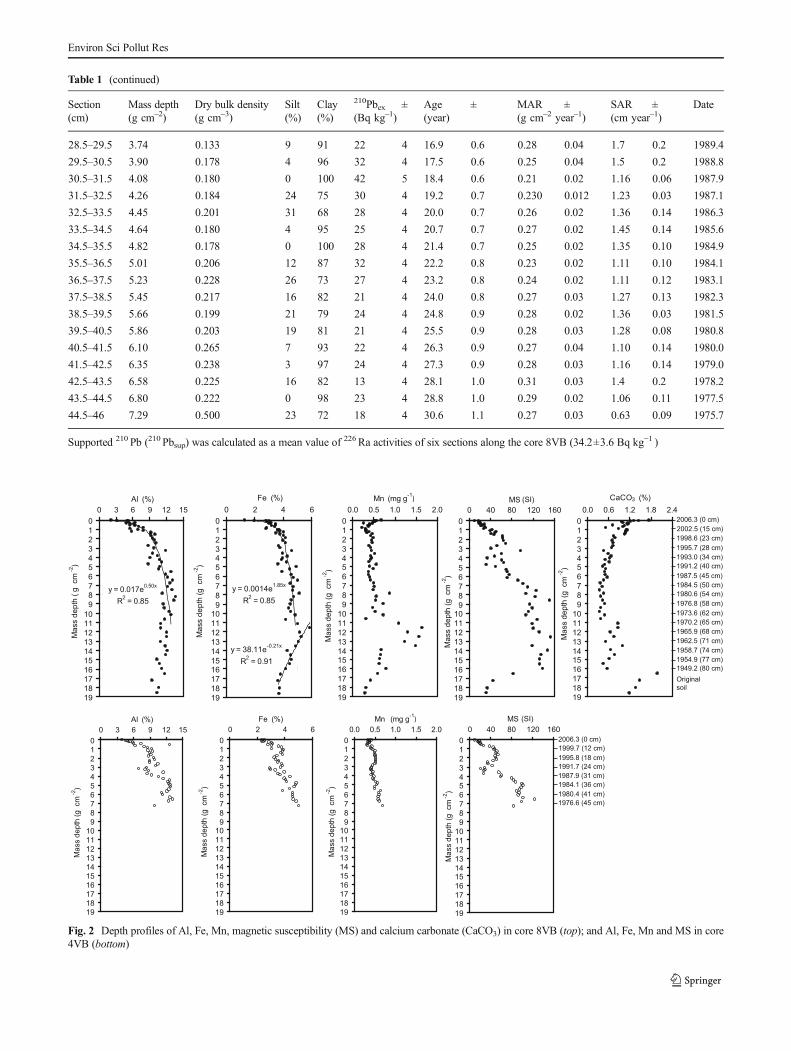
Table 1 (continued)
Section Mass depth Dry bulk density Silt Clay 210Pbex ± Age ± MAR ± SAR ± Date(cm) (g cm–2) (g cm–3) (%) (%) (Bq kg–1) (year) (g cm–2 year–1) (cm year–1)
28.5–29.5 3.74 0.133 9 91 22 4 16.9 0.6 0.28 0.04 1.7 0.2 1989.4
29.5–30.5 3.90 0.178 4 96 32 4 17.5 0.6 0.25 0.04 1.5 0.2 1988.8
30.5–31.5 4.08 0.180 0 100 42 5 18.4 0.6 0.21 0.02 1.16 0.06 1987.9
31.5–32.5 4.26 0.184 24 75 30 4 19.2 0.7 0.230 0.012 1.23 0.03 1987.1
32.5–33.5 4.45 0.201 31 68 28 4 20.0 0.7 0.26 0.02 1.36 0.14 1986.3
33.5–34.5 4.64 0.180 4 95 25 4 20.7 0.7 0.27 0.02 1.45 0.14 1985.6
34.5–35.5 4.82 0.178 0 100 28 4 21.4 0.7 0.25 0.02 1.35 0.10 1984.9
35.5–36.5 5.01 0.206 12 87 32 4 22.2 0.8 0.23 0.02 1.11 0.10 1984.1
36.5–37.5 5.23 0.228 26 73 27 4 23.2 0.8 0.24 0.02 1.11 0.12 1983.1
37.5–38.5 5.45 0.217 16 82 21 4 24.0 0.8 0.27 0.03 1.27 0.13 1982.3
38.5–39.5 5.66 0.199 21 79 24 4 24.8 0.9 0.28 0.02 1.36 0.03 1981.5
39.5–40.5 5.86 0.203 19 81 21 4 25.5 0.9 0.28 0.03 1.28 0.08 1980.8
40.5–41.5 6.10 0.265 7 93 22 4 26.3 0.9 0.27 0.04 1.10 0.14 1980.0
41.5–42.5 6.35 0.238 3 97 24 4 27.3 0.9 0.28 0.03 1.16 0.14 1979.0
42.5–43.5 6.58 0.225 16 82 13 4 28.1 1.0 0.31 0.03 1.4 0.2 1978.2
43.5–44.5 6.80 0.222 0 98 23 4 28.8 1.0 0.29 0.02 1.06 0.11 1977.5
44.5–46 7.29 0.500 23 72 18 4 30.6 1.1 0.27 0.03 0.63 0.09 1975.7
Supported 210 Pb (210 Pbsup) was calculated as a mean value of 226Ra activities of six sections along the core 8VB (34.2±3.6 Bq kg−1 )
Mas
s de
pth
(g c
m -2
)
0123456789
10111213141516171819
0.0 0.6 1.2 1.8 2.4CaCO3 (%)
Mas
s de
pth
(g c
m -2
)
0123456789
10111213141516171819
0 40 80 120 160MS
2006.3 (0 cm)2002.5 (15 cm)1998.6 (23 cm)1995.7 (28 cm)1993.0 (34 cm)1991.2 (40 cm)1987.5 (45 cm)1984.5 (50 cm)1980.6 (54 cm)1976.8 (58 cm)1973.6 (62 cm)1970.2 (65 cm)1965.9 (68 cm)1962.5 (71 cm)1958.7 (74 cm)1954.9 (77 cm)1949.2 (80 cm)
2006.3 (0 cm)1999.7 (12 cm)1995.8 (18 cm)1991.7 (24 cm)1987.9 (31 cm)1984.1 (36 cm)1980.4 (41 cm)1976.6 (45 cm)
(SI)
Mas
s de
pth
(g c
m -2
)
0123456789
10111213141516171819
0.0 0.5 1.0 1.5 2.0Mn (mg g-1)
Mas
s de
pth
(g c
m - 2
)
0123456789
10111213141516171819
0 40 80 120 160MS
Originalsoil
Mas
s de
pth
( g c
m -2
)
y = 0.017e0.50x
R2 = 0.85
0123456789
10111213141516171819
0 3 6 9 12 15Al (%)
Mas
s de
pth
(g c
m - 2
)
0123456789
10111213141516171819
0 3 6 9 12 15Al (%)
Mas
s de
pth
(g c
m -2
)
0123456789
10111213141516171819
0 2 4 6Fe (%)
Mas
s de
pth
(g c
m -2
)
0123456789
10111213141516171819
0.0 0.5 1.0 1.5 2.0Mn (mg g-1)
(SI)
Mas
s de
pth
(g c
m -2
)
y = 38.11e-0.21x
R2 = 0.91
y = 0.0014e1.85x
R2 = 0.85
0123456789
10111213141516171819
0 2 4 6Fe (%)
Fig. 2 Depth profiles of Al, Fe, Mn, magnetic susceptibility (MS) and calcium carbonate (CaCO3) in core 8VB (top); and Al, Fe, Mn and MS in core4VB (bottom)
Environ Sci Pollut Res

Mas
sde
pth
( gc m
-2)
0123456789
10111213141516171819
0 2 4 6 8 10 12C/N
Mas
sde
pth
(gcm
-2)
0123456789
10111213141516171819
0.0 0.4 0.8 1.2TP (mg g -1)
2006.3 (0 cm)2002.5 (15 cm)1998.6 (23 cm)1995.7 (28 cm)1993.0 (34 cm)1991.2 (40 cm)1987.5 (45 cm)1984.5 (50 cm)1980.6 (54 cm)1976.8 (58 cm)1973.6 (62 cm)1970.2 (65 cm)1965.9 (68 cm)1962.5 (71 cm)1958.7 (74 cm)1954.9 (77 cm)1949.2 (80 cm)
2006.3 (0 cm)1999.7 (12 cm)1995.8 (18 cm)1991.7 (24 cm)1987.9 (31 cm)1984.1 (36 cm)1980.4 (41 cm)1976.6 (45 cm)
Mas
sde
pth
(gcm
- 2)
0123456789
10111213141516171819
0 2 4 6 8TOC (%)
Mas
sde
pth
(gcm
-2)
0123456789
10111213141516171819
0 2 4 6 8 10TC (%)
Mas
sde
pth
(gcm
-2)
0123456789
10111213141516171819
0.0 0.5 1.0TN (%)
Mas
sde
pth
(gcm
-2)
0123456789
10111213141516171819
0.0 0.4 0.8 1.2TP (mg g -1)
OriginalSoil
Mas
sde
pth
(gcm
-2)
0123456789
10111213141516171819
0 2 4 6 8 10TC (%)
Mas
sde
pth
(gcm
-2)
0123456789
10111213141516171819
0.0 0.5 1.0TN (%)
Fig. 3 Nutrient depth profiles in sediment cores fromValle de Bravo Reservoir. Total organic carbon (TOC), total carbon (TC), total nitrogen (TN), totalphosphorus (TP) and C/N ratios in core 8VB (top); and TC, TN and TP in core 4VB (bottom)
0 5 10 15 20 25137Cs (Bq kg -1)
Mas
sde
pth
(gcm
-2)
0123456789
10111213141516171819
0 35 70 105 140
210Pbex (Bq kg -1)
0123456789
Y = 58e
R = 0.53
-0.08 (X)
2
Y= 68e
R = 0.65
-0.21 (X)
2
a b
Mas
sde
pth
(gcm
-2)
10111213141516171819
0 35 70 105 140
210Pbex (Bq kg -1)
2006.3 (0 cm)
2002.5 (15 cm)1998.6 (23 cm)1995.7 (28 cm)
1993.0 (34 cm)1991.2 (40 cm)
1987.5 (45 cm)1984.5 (50 cm)
1980.6 (54 cm)
1976.8 (58 cm)1973.6 (62 cm)
1970.2 (65 cm)1965.9 (68 cm)
1962.5 (71 cm)1958.7 (74 cm)1954.9 (77 cm)
1949.2 (80 cm)
OriginalSoil
2006.3 (0 cm)1999.7 (12 cm)1995.8 (18 cm)1991.7 (24 cm)
1987.9 (31 cm)1984.1 (36 cm)1980.4 (41 cm)1976.6 (45 cm)
Fig. 4 Depth profiles of 210Pbex(circles) and 137Cs (triangles) incore 8VB (a) and 210Pbex in core4VB (b). In the exponentialequations, Y is the 210Pbex activityand X is the mass depth
Environ Sci Pollut Res

(1947), which was assigned to the soil upper layer (i.e. 81.5-cm depth, 16.2 g cm−2 mass depth). The total inventoryin core 4VB was inferred by comparison with core8VB, the MS peak in 4VB (∼124 SI, 6.6 g cm−2;Fig. 2) was identified to correlate with the MS peakin 8VB (∼151 SI, ∼8.6 g cm−2), which corresponds to1978.2±1.3 A.D. Using this date as a reference point,the missing inventory of 4VB was calculated.
The total inventories were 6385±105 Bq m−2 for core 8VBand 4329±60 Bq m−2 for core 4VB, which would correspondto a mean 210Pbex flux to the sediment surface of 199±3 Bq m−2 year−1 and 135±2 Bq m−2 year−1, respectively.The difference between the inventories was attributed to sed-iment (and thus 210Pb) focusing related to water depth andenhanced scavenging of particles reaching deeper sedi-ments, as core 8VB is 8-m deeper than 4VB. Theseinventories were considerably higher than those estimat-ed for other Mexican lakes (Table 2) but comparable tothe inventory in Espejo de los Lirios Lake (metropolitanzone of Mexico City, at similar altitude than VB). The210Pbex fluxes were in agreement with the average210Pbex fallout values estimated for North America byFeichter et al. (1991; 142 Bq m−2 year−1) and Preisse t a l . ( 1 9 9 6 ; l a t i t u d e 1 0 – 3 0 ° N , 1 4 0 –185 Bq m−2 year−1).
The 210Pb-derived chronology and 137Cs profile of core8VB is shown in Fig. 4. The maximum 137Cs activity wasobserved at 67-cm depth (11.59 g cm−2) which corresponds toyear 1967.9±1.6, close enough to the period of maximumatmospheric concentrations due to nuclear weapons testing(1962–1964).
Mass accumulation rates (MAR) ranged from 0.143±0.004to 0.56±0.03 g cm−2 year−1 in core 8VB and from 0.124±0.005 to 0.40±0.03 g cm−2 year−1 in core 4VB (Fig. 5),whereas sediment accumulation rates (SAR) ranged from0.396±0.014 to 17.3±0.3 cm year−1 in core 8VB and from0.63±0.09 to 4.3±0.6 cm year−1 in core 4VB (Table 1). The8VB core MAR values (Fig. 5) showed three peak values: (1)at the surface (2004–2006); (2) between 1990 and 1998; and(3) between 1984 and 1986. In agreement with the 8VB corerecord, the MAR peak values (>0.30 g cm−2 year−1) in sedi-ment core 4VB were observed in the periods 1990–1992 and1996–1997.
Nutrient fluxes in core 8VB
According to Middleburgh (1989), organic matter decays dueto diagenesis as:
TOCt ¼ TOC0 e−3:2 t0:05
where TOCt is the metabolizable organic component ofTOC deposited at time t and TOC0 is the degradable concen-tration at the sediment surface. From this equation, TOC0 wasestimated upon the minimum value observed at 64.25 cm(TOC=1.20 %), which corresponds to TOC0=4.77 % at thesurface layer (0.0045±0.0002 years). Following the methoddescribed by Ruiz-Fernández et al. (2011), the TOC flux(TOCflux) was calculated as:
TOCflux ¼ TOCt � MAR
The TOCt values were calculated using only the data abovethe 80-cm depth (∼16 g cm−2) in order to avoid the pre-reservoir soil layers. The TOCflux (Fig. 6) ranged from 122to 380 g m−2 year−1 (mean value 216±60 g m−2 year−1). PeakTOCflux values were observed in 1985, from 1992 to 1998 andfrom 2004 to 2006. Values above the mean were almostconsistently observed between the surface and 40-cm depth(i.e. since 1991).
TNflux (Fig. 6) to the sediments ranged from 4.9±0.2 to 48±3.0 g m−2 year−1 (mean value 14±8 g m−2 year−1). TPflux(Fig. 6) ranged from 0.63±0.04 to 4.2±0.4 g m−2 year−1
(mean value 1.6±0.8 g m−2 year−1). The maximum TNflux
and TPflux occurred in 2006 (Fig. 6).
Discussion
The Al concentrations did not vary markedly along the coresand the slight changes observed (Fig. 2) are most likely theresult of dilution due to OM accumulation within the top coresections. The small variations in silt and clay content along thecore might be due to differences in the amount of rainfall withtime, since runoff is the main carrier of terrigenous materials
Table 2 210Pbex total inventory and 210Pbex supply rate from some water bodies in Mexico
Chapala lake Zirahuén lake Espejo de los Lirios lake Lago Verde crater lake VB
210Pbex total inventory (Bq m−2) 1443 1539 7003±315 1343±15 6385±104210Pbex supply rate (Bq m−2 year−1) 45 48 218±10 41.9±0.5 199±3
Latitude N 20° 14 19° 21 19° 38 18° 33 19° 21
Longitude W 103° 02 101° 46 99° 13 95° 18 100° 11
Reference Fernex et al. 2001 Davies et al. 2004 Ruiz-Fernández et al. 2005 Ruiz-Fernández et al. 2007b This study
Environ Sci Pollut Res

to the reservoir and sediment sources have not changed sig-nificantly since the damming.
Iron and Mn are natural products of the continentalweathering of silicate rocks and are subsequently transportedby rivers as dissolved weathering products. Both of them aremobile in aquatic systems during diagenesis, depending on theredox conditions. Under anoxic or suboxic conditions, thereduced species dissolve in pore waters and can either precip-itate with sulfides or migrate to the sediment surface wherethey reoxidize and precipitate as oxyhydroxides, resulting inhigher concentrations of Fe and Mn at the sediment–waterinterface (Cochran et al. 1998). However, the Fe concentrationdepth profile showed a decreasing trend towards the coresurface and a significant correlation with Al concentrations(p<0.05, r=0.86) indicating that Fe has a predominantlyterrigenous origin. Fe, as well as Al, is a major constituentof a large variety of mineral structures such as feldspars, clayminerals and amorphous aluminosilicate gels (Bortleson andLee 1972).
Mn is very sensitive to redox conditions and the concen-tration of Mn in sediments is higher when oxic conditionsprevail (Stumm andMorgan 1970). Lowwater level can causepolymictic periods in the water column and, therefore, in-creased availability of dissolved oxygen at the sediment–
water interface. The peak Mn concentrations recorded at8VB (1959–1970, Fig. 2) correspond to the periodwhenwaterlevel reached its minima in VB. Since shorter water columnwould allow better water oxygenation, this would lead tomanganese oxides precipitation in the surface sediments(Calvert and Price 1972). This Mn maximum at core 8VBhas also contributed to validate the accuracy of the 210Pb-derived chronology.
S i nc e 1980 , Mn concen t r a t i on s we r e l ow(<0.5 mg g−1) and rather constant, indicating that bot-tom waters at this site had similar low oxygen contents.The lowest Mn concentration (0.22±0.01 mg g−1) in∼2003 suggests strong reducing conditions in the sedi-ment–water interface, consistent with strong anoxic wa-ter column conditions reported by Ramírez-Zierold et al.(2010) during a high eutrophication period. Nutrient(TP, TN and TOC) concentrations in both cores showedan increase since ca. 1990 (Fig. 3), following an inversepattern to that observed for Al and Fe, tracers of ter-restrial inputs, indicating an increase of organic mattersupply through time consistent with eutrophication driv-en by the rising wastewater supply to VB (Olvera-Viascán et al. 1998; Merino-Ibarra et al. 2008;Ramírez-Zierold et al. 2010).
b
a
Year
0.00
0.10
0.20
0.30
0.40
0.50
0.60
1945 1950 1955 1960 1965 1970 1975 1980 1985 1990 1995 2000 2005
MA
R(g
cm-2
year
-1)
0.00
0.10
0.20
0.30
0.40
0.50
0.60
1945 1950 1955 1960 1965 1970 1975 1980 1985 1990 1995 2000 2005
MA
R(g
cm-2
year
-1)
Fig. 5 Historical massaccumulation rate (MAR) in core8VB (a) and 4VB (b)
Environ Sci Pollut Res

C/N ratio
C/N can provide information on the OM sources. Algae haveC/N from 4 to 10 (absence of cellulose) and vascular landplants (abundance of cellulose) have C/N ratios over 20(Meyers 1994). Proteins, which are the primary nitrogencompounds of phytoplankton and zooplankton, have C/Nratios of 5 to 6 (Bordowskiy 1965a, b). Freshly depositedOM, derived mainly from planktonic organisms, has a C/Nratio of 6 to 9 (Bordowskiy 1965a; Prahl et al. 1980; Biggset al. 1983).
C/N increases within sediment profiles have been used toidentify periods when sediments received a high proportion ofterrestrial OM (Guilizzoni et al. 1996). Conversely, C/N de-creases have been used to identify periods when lake sedi-ments have received a high proportion of algal OM (Kansanenand Jaakkola 1985). C/N ratios in the post-reservoir sediments∼(4–8) are concordant to algae-derived OM, whereas the C/Nvalues (9–11) in the pre-reservoir segment of ∼8VB are con-sistent with the presence of soils. These C/N values wererelatively low for terrestrial plants (>20; Meyers 1994), butsuch low C/N ratios have been also reported for soils in which
Year
0
50
100
150
200
250
300
350
400
450
1945 1950 1955 1960 1965 1970 1975 1980 1985 1990 1995 2000 2005
TOC
(gm
-2ye
ar-1
)
0
10
20
30
40
50
60
1945 1950 1955 1960 1965 1970 1975 1980 1985 1990 1995 2000 2005
TN(g
m-2
year
-1)
0.0
2.0
4.0
6.0
1945 1950 1955 1960 1965 1970 1975 1980 1985 1990 1995 2000 2005
TP(g
m-2
year
-1)
Fig. 6 Fluxes (g m−2 year−1) oftotal organic carbon (TOC), totalnitrogen (TN) and totalphosphorus (TP) in core 8VB
Environ Sci Pollut Res

remineralization of carbon is accompanied by microbial im-mobilization of nitrogenous material (Sollins et al. 1984).
TN and TP fluxes
The TN and TP fluxes were compared with the real-timeestimates, using water and nutrient budgets of VB for the year2005 by Ramírez-Zierold et al. (2010). They calculated thewater column TPflux at ∼102.3×10³ kg TP for the whole lake(i.e. ∼5.5 g TP m−2 year−1), whereas the sediment TPfluxobtained from our sediment records was ∼4.3 ±0.4 g m−2 year−1, in good agreement (78 %) with the Pmass-balance figure. In contrast, the TNflux calculated by theseauthors (1386.4×103 kg of TN, i.e. TNflux of 75 g m
−2 year−1)for the same year was higher than the sediment TNflux herereported (28±2 g m−2 year−1), which accounted only to 37 %of the N mass-balance figure. As the water column estimationdid not take into account denitrification and nitrogen fixation,our TNflux is likely a more reliable estimation for the VB.
There are few published data on nutrient fluxes to sedi-ments, either in lakes or reservoirs. The TPflux and TNflux
values observed in VB are higher than the values reportedfor the mesotrophic manmade urban Lake Longjinghu inChina (TPflux=0.7–1.0 g m−2 year−1; Pan et al. 2014) andvalues reported for the eutrophic Otisco Lake in New York(TNflux=2.0–6.0 g m−2 year−1; Bookman et al. 2010).
TOC fluxes
The drop in TOC concentrations with depth reflects the TOCsupply rate, the type of OC (labile or refractory) and themicrobial degradation (Ruiz-Fernández et al. 2007a). Micro-bial communities tend to sequentially use organic substrates,with the more reactive substrates being consumed first(Stumm-Zollinger 1968), which implies that the reactivity ofsedimentary organic material decreases with time (Berner1980). In addition, low dissolved oxygen concentrations, aswell as increased primary production, may lead to enhancedpreservation of OM (Lee 1992).
The TOCflux were compared with real-time measurementsin VB, in particular, the net carbon flux calculated byValdespino-Castillo et al. (2014) from production
Table 3 Comparison of total organic carbon fluxes (TOC flux, g m−2 year−1) in VB with other reservoirs and aquatic systems in the world. Except forVB, reservoirs and aquatic systems are ordered from the highest to the lowest median/mean TOC reported flux
TOC flux (g m−2 year−1)
Study site Min Max Median/mean Reference
Valle de Bravo* Overall 122 380 216 This study(1949–1991) 122 266 175
(1992–2006) 173 380 250
Maximum values 291 380 323
Reservoirs 400 Dean and Gorham 1998
Impoundments (USA) 52 2000 350 Downing et al. 2008 and references therein
Impoundments (Africa) 260 Downing et al. 2008 and references therein
Missouri impoundments 183 279 231 Pittman et al. 2013
Marine-vegetated habitats 83 151 139 Downing et al. 2008 and references therein
Global organic carbon burial rate 83 118 Ruiz-Fernández et al. 2011 and references therein
Small meso-eutrophic lakes 11 198 94 Downing et al. 2008 and references therein
Boreal reservoir, Quebec 25 200 77 Teodoru et al. 2013
Small lakes 72 Dean and Gorham 1998
Wetlands and peatlands 8 105 31 Downing et al. 2008 and references therein
Marine depositional areas 17 45 31 Downing et al. 2008 and references therein
Boreal lakes Quebec 11 55 29 Teodoru et al. 2013
Alchichica oligotrophic lake, Mexico 15 35 28 Alcocer et al. 2014
Small oligotrophic lakes 3 128 27 Downing et al. 2008 and references therein
Large meso-eutrophic lakes 10 30 18 Downing et al. 2008 and references therein
Large oligotrophic lakes 2 9 6 Downing et al. 2008 and references therein
*Values for VB are reported overall, for two periods of its trophic evolution identified (1947–1991) and (1992–2006) and for the eight highest values(peaks). For other systems, minimum,maximum andmedian (or mean), TOC fluxes are included, depending on how they are reported.When themedianor mean was not reported, the mean was calculated averaging the range reported
Environ Sci Pollut Res

measurements during 2006. Their calculations on net carbonflux for the 2006 (250 g m−2 year−1) fall within the range(160–340 g m−2 year−1) of the TOCflux estimated from 8VBcore for that period (Fig. 6).
In terms of the temporal evolution of the trophic conditions,the TOCflux profile in 8VB (Fig. 6) clearly suggests a gener-alized increase in OM flux to the sediments since 1991,particularly between 1991–1999 and 2003–2006. TheTOC f l u x du r i ng t h e p e r i od 1992–2006 (mean250 g m−2 year−1, Table 3) was significantly (t=6.44,p<0.01) higher than that during the period 1949–1990 (mean175 g m−2 year−1, Table 3). Differences between the TN andTP fluxes between these periods were also statisticallysignificant (Kruskal–Wallis test, p<0.01 in both cases;Sheskin 2003).
This pattern and data sustain quantitatively the descriptionof the trophic evolution of VB by Olvera-Viascán et al.(1998), who assessed that VB had become eutrophic since1993; and the findings of recent studies (Merino-Ibarra et al.2008; Ramírez-Zierold et al. 2010), which report a recent andrapid (∼20 years) increase in primary productivity and eutro-phication in VB. Overall, the observed agreement between thefluxes obtained from the sedimentary record sustain the reli-ability and utility of sediment reconstruction in aquaticsystems.
Assuming that the 8VB core is representative of thewhole VB, one may grossly estimate the total TOCflux
to the reservoir sediments since its creation in 1947, byintegrating the TOCflux with time and multiplying bythe VB surface area, yielding a gross total of circa200,000 t. Since 1991, where the broad TOCflux maxi-mum starts, the total amount of TOC accumulated iscirca 70,000 t, i.e. about one third of the total duringone fourth of the time period considered.
There is an urgent need to compare and assess car-bon fluxes in diverse ecosystems (Downing et al. 2008;2010), and particularly, carbon burial in lakes and res-ervoirs (Dean and Gorham 1998). When compared tothe carbon burial observations in other aquatic systems(Table 3), the TOCflux VB is higher than found inoligotrophic and mesotrophic, large and medium lakes,and also than diverse marine depositional areas, includ-ing the vegetated ones. When compared to eutrophicwater systems, the TOCflux for full sedimentary recordof VB remains relatively low, below impoundments andreservoirs in general (Table 3). But, when only therecent (1992–2006) period is considered, VB seems tobe reaching the high levels observed in eutrophic reser-voirs and impoundments (Dean and Gorham 1998;Downing et al. 2008; Pittman et al. 2013). In particular,the TOCflux peaks of 1991–1999 and 2003–2006(Fig. 6, Table 3) indicate conditions similar to most ofthe eutrophic systems.
Conclusions
Since its creation in 1947, VB has undergone major biogeo-chemical changes. In the early years, the C/N ratio indicatedthat the increasing water column was well mixed and highlyoxygenated. Eventually, bottom waters became more anoxicas the water level reached its maximum, thus changing thesedimentary environment. The high Mn concentrations foundin the 1960s were related to re-oxygenation of the watercolumn due to abrupt and important decreases of the waterlevel. In the 1990s and 2000s, eutrophication became the mainproblem and this was recorded in the sediments as increasedfluxes of TOC, TN and TP. This study shows the remarkableusefulness of the sedimentary records to reveal major pertur-bations in aquatic environments, including eutrophication andwater level fluctuations, and it encourages the use of sedi-ments profiles to reconstruct the nutrient pollution history ofthe water column.
Water level changes, MAR and TOCflux, are crucial param-eters to estimate the amount of OM that could be buried. VBbehaves as a warm monomictic lake and a large part of OMmatter can be buried because anoxic conditions dominate forabout three quarters of the time, and only in winter OM isdegradation favoured. The TOCflux since 1991 indicate thatabout 70,000 t of organic carbon have been exported to thesediments, most likely related with the increase of urbaniza-tion in the catchment. VB, and possibly many reservoirs,reflect the anthropogenic impact in their basins and, underanoxic conditions, they become an important carbon sink. Inorder to reduce the anthropogenic impact, water level andnutrient loading from basin tributaries should be better con-trolled. Our data sustain that the reconstruction of carbon andnutrient fluxes from the sedimentary record can be a valuabletool to address the paucity of carbon burial data and itstemporal evolution in freshwater ecosystems.
Acknowledgements We thank Humberto Bojórquez Leyva, SergioCastillo Sandoval and Libia Hascibe Pérez Bernal for their technicalassistance and Alejandro Rodríguez for his help in the field, and AnnGrant for the review of an early version of this manuscript. This researchwas accomplished with financial support from projects grants PAPIIT-UNAM IN-207702, PAPIIT-UNAM IN105009-3, SEMARNATCONACYTC01-1125 and CONACYT INFR-2013-01 204818.
References
Alaoui-Mhamdi M, Dhib A, Bouhaddioui A, Ziadi B, Turki S, Aleya L(2014) Assessment of nitrogen and phosphate balance and the rolesof bacteria and viruses at the water-sediment interface in the Allal ElFassi reservoir (Morocco). Environ Monit Assess 186:5817–5829
Alcocer J, Ruiz-Fernández AC, Escobar E, Pérez-Bernal LH, OsegueraLA, Ardiles-Gloria V (2014) Deposition, burial and sequestration ofcarbon in an oligotrophic, tropical lake. Journal ofLimnology. In press.
Environ Sci Pollut Res

Aoyama M, Hirose K, Igarashi Y (2006) Re-construction and updatingour understanding on the global weapons tests 137Cs fallout. JEnviron Monit 8:431–438
Appleby PG (2001) Chronostratigraphic techniques in recent sediments.In: Last WM, Smol JP (eds) Tracking Environmental ChangesUsing Lake Sediments, Basin Analysis, Coring and ChronologicalTechniques. Kluwer Academic Publishers, Dordrecht 1, pp 171–203
Bartington Instruments Ltd. (200) Operation manual for MS2 magneticsusceptibility system. Bartington Instruments, Ltd., Oxford. 1–71 pp
Berner RA (1980) A rate model for organic carbon decomposition duringbacterial sulfate reduction in marine sediments. Biogeochemistry ofOrganic Matter at the Sediment–Water Interface. CNRS Int. Colloq.35–44
Biggs RB, Sharp JH, Church TM, Tramontano JM (1983) Optical prop-erties, suspended sediments, and chemistry associated with theturbidity maxima of the Delaware Estuary. Can J Fish Aqua Sci40(Suppl I):172–179
Bookman R, Driscoll CT, Effler SW, Engstrom DR (2010)Anthropogenic impacts recorded in recent sediments from OtiscoLake, New York, USA. J Paleolimnol 43:449–462
Bordowskiy OK (1965a) Sources of organic matter in marine basins. MarGeol 3:5–31
Bordowskiy OK (1965b) Accumulation of organic matter in bottomsediments. Mar Geol 3:33–82
Borgnino L, AvenaM, De Pauli C (2006) Surface properties of sedimentsfrom two Argentinean reservoirs and the rate of phosphate release.Water Res 40:2659–2666
Bortleson GC, Lee GF (1972) Recent sedimentary history of LakeMendota, Wis. Environ Sci Technol 6(9):799–808
Calvert SE, Price NB (1972) Diffusion and reaction profiles of dissolvedmanganese in the pore waters of marine sediments. Earth Planet SciLett 16(2):245–249
Cochran JK, Hirschberg DJ, Wang J, Dere C (1998) Atmospheric depo-sition of metals to coastal waters (Long Island Sound, New YorkU.S.A.): evidence from saltmarsh deposits. Estuar Coast Shelf Sci46:503–522
Davies SJ, Metcalfe SE, MacKenzie AB, Newton AJ, Endfield GH,Farmer JG (2004) Environmental changes in the ZirahuénBasin, Michoacán, Mexico, during the last 1000 yers. JPaleolimnol 31:77–98
DeanWE, Gorham E (1998)Magnitude and significance of carbon burialin lakes, reservoirs, and peatlands. Geology 26:535–538
Diaz RJ (2001) Overview of hypoxia around the world. J Environ Qual30(2):275–281
Downing JA (2010) Emerging global role of small lakes and ponds: littlethings mean a lot. Limnetica 29:9–24
Downing JA, Cole JJ, Middelburg JJ, Striegl RG, Duarte CM,Kortelainen P, Prairie YT, Laube KA (2008) Sediment organiccarbon burial in agriculturally eutrophic impoundments over the lastcentury. Glob Biogeochem Cycles 22:GB1018. doi:10.1029/2006GB002854
Feichter J, Brost RA, HeimannM (1991) Three-dimensional modeling ofthe concentration and deposition of 210Pb aerosols. J Geophys Res96(D12):22447–22460
Fernex F, Zárate-del Valle P, Ramírez-Sánchez H, Michaud F, Parron C,Dalmasso J, Barci-Funel G, Guzman-Arroyo M (2001)Sedimentation rates in Lake Chapala (western Mexico): possibleactive tectonic control. Chem Geol 177:213–228
Folk R (1974) Petrology of sedimentary rocks. Hemphill Pub. Co, TexasGächter R, Wehrli B (1998) Ten years of artificial mixing and oxygena-
tion: no effect on the internal phosphorus loading of two eutrophiclakes. Environ Sci Technol 32:3659–3665
Gao Z, Zheng X, Li W (2008) Determination of nutrient fluxes across thesediment-water interface in a nitrate-rich reservoir. 2nd InternationalConference on Bioinformatics and Biomedical Engineering, ICBBE2008, Article number 4536039;3319–3322
Goldberg ED, Gamble E, Griffin JJ, Koide M (1977) Pollution history ofNarragansett Bay as recorded in its sediments. Estuar Coast Mar Sci5:549–561
Guilizzoni P, Marchetto A, Lami A, Cameron NG, Appleby PG, RoseNL, Guzzi L (1996) The environmental history of a mountain lake(Lago Paione Superiore, Central Elps, Italy) for the last c. 100 years:a multidisciplinary, palaeolimnological study. J Paleolimnol 15(3):245–264
Hamilton TF, Smith JD (1986) Improved alpha-energy resolution for thedetermination of polonium isotopes by alpha-spectrometry. ApplRad Isot 37:628–630
Jin X, He Y, Kirumba G, Hassan Y, Li J (2013) Phosphorus fractions andphosphate sorption-release characteristics of the sediment in theYangtze River estuary reservoir. Ecol Eng 55:62–66
Kansanen PH, Jaakkola T (1985) Assessment of pollution history fromrecent sediments in Lake Vanajavesi, southern Finland. I. Selectionof representative profiles, their dating and chemostratigraphy. AnnZool Fenn 22:27–69
LaBrecque JJ, Hanna AN, Rassoul A, Schelenz R (1987) Report on theintercomparison run IAEA-SL-3: Trace elements in lake sediments.IAEA/RL/143, IAEA, Vienna, Austria.
Leco Corporation (2003) Organic application note. Carbon, nitrogen andsulfur testing in soil/plant tissue. Form no. 203-821-002.
Lee C (1992) Controls on organic carbon preservation: the use of strat-ified water bodies to compare intrinsic rates of decomposition inoxic and anoxic systems. Geochim Cosmochim Acta 56:3323–3335
Loring DH, Rantala RTT (1992) Geochemical analyses of marine sedi-ments and suspended particulate matter. Earth-Sci Rev 32:235–283
Merino-Ibarra M, Monroy-Ríos E, Vilaclara G, Castillo FS, GallegosME, Ramírez-Zierold J (2008) Physical and chemical limnologyof a wind-swept tropical highland reservoir. Aquat Ecol 42:335–345
Meyers PA (1994) Preservation of elemental and isotopic source identi-fication of sedimentary organic matter. Chem Geol 114:289–302
Middelburg JJ (1989) A simple rate model for organic matterdecomposition in marine sediments. Geochim CosmochimActa 53:1577–1581
Mulligan CN, Yong RN, Gibbs BF (2001) An evaluation of technologiesfor the heavy metal remediation of dredged sediments. J HazardMater 85:145–163
Olvera-Ramirez R, Centeno-Ramos C, Martínez-Jerónimo F (2010)Toxic effects of Pseudabaena tenius (Cyanobacteria) on the cladoc-erans Daphnia magna and Ceriodaphnia dubia. Hidrobiológica20(3):203–212
Olvera-Viascán V, Bravo-Inclán L, Sánchez-Chávez J (1998) Aquaticecology management assessment in Valle de Bravo reservoir andits watershed. Aquat Ecosyst Health Manag 1:277–290
Páez-Osuna F, Bojórquez-Leyva H, Osuna-López JI (1991)Accumulation and distribution of phosphorus in sediments of theGulf of California. Mar Min 10:285–301
Pan YA, Lei P, Zhang H, Shan BQ, Li J (2014) Distribution of nitrogenand phosphorus in the sediments and estimation of the nutrientsfluxes in Longjinhu Lake, Chongqing City, during the initial im-poundment period. Environ Sci 35(5):1727–1734
Peng JF, Song YH, Yuan P, Cui XY, Qui GL (2009) The remediation ofheavy metals contaminated sediment. J Hazard Mater 161:633–640
Pittman B, Jones JR, Millspaugh JJ, Kremer RJ, Downing JA (2013)Sediment organic carbon distribution in 4 small northern Missouriimpoundments: implications for sampling and carbon sequestration.Inland Waters 3(1):39–46
Prahl FG, Bennett JT, Carpenter R (1980) The early diagenesis of ali-phatic hydrocarbons and organic matter in sedimentary particulatesfrom Dabob Bay. Washington. Geochim Cosmochim Acta 44:1967–1976
Preiss N, Mélieres MA, Pourchet M (1996) A compilation of data onlead-210 concentration in surface air and fluxes at the air-surface andwater-sediment interfaces. J Geophys Res 101(D22):28847–28862
Environ Sci Pollut Res

Ramírez-Zierold JA, Merino-Ibarra M, Monroy-Ríos E, OlsonM, CastilloFS, Gallegos ME, Vilaclara G (2010) Changing water, phosphorusand nitrogen budgets for Valle de Bravo reservoir, water supply forMexico City Metropolitan Area. Lake Reserv Manag 26:23–34
Robbins JA (1978) Geochemical and geophysical applications of radio-active lead isotopes. In: Nriagu JP (ed) Biogeochemistry of Lead.Elsevier Science B.V., Amsterdam, pp 285–393
Ruiz-Fernández AC, Páez-Osuna F, Urrutia-Fucugauchi J, Preda M(2005) 210Pb geochronology of sediment accumulation rates inMexico City Metropolitan Zone as recorded at Espejo de losLirios lake sediments. Catena 61:31–48
Ruiz-Fernández AC, Frignani M, Tesi T, Bojórquez-Leyva H,Bellucci LG, Páez-Osuna F (2007a) Recent sedimentary his-tory of organic matter and nutrient accumulation in theOhuira Lagoon, Northwestern Mexico. Arch EnvironContam Toxicol 53:159–167
Ruiz-Fernández AC, Hillaire-Marcell C, Páez-Osuna F, Ghalebb B,Caballero M (2007b) 210Pb chronology and trace metal geochemis-try at Los Tuxtlas, Mexico, as evidenced by a sedimentary recordfrom the Lago Verde crater lake. Quat Res 67:181–192
Ruiz-Fernández AC, Marrugo-Negrete JL, Paternina-Uribe R, Pérez-Bernal LH (2011) 210Pb-derived Sedimentation Rates and CorgFluxes in Soledad Lagoon (Cispatá Lagoon System, NWCaribbean Coast of Colombia). Estuar Coasts 34:1117–1128
Sanchez-Cabeza JA, Ruiz-Fernández AC (2012) 210Pb sedimentradiochronology: an integrated formulation and classification ofdating models. Geochim Cosmochim Acta 82:183–200
Sanchez-Cabeza JA, Ruiz-Fernández AC, Ontiveros-Cuadras JF,Pérez-Bernal LH, Olid C (2014) Monte Carlo uncertaintycalculation of 210Pb sediment dating chronologies and
accumulation rates of sediments and peat bogs. QuatGeochronol 23:80–93
Schell WR, Nevissi A (1983) Sedimentation in lakes and reservoirs. In:Guidebook on nuclear techniques in hydrology. Technical ReportsSeries No. 91. IAEA, Vienna (Chapter 11).
Sheskin DJ (2003) Handbook of parametric and nonparametric statisticalprocedures (3rd edn). Chapman & Hall/CRC. No of pages 1232.ISBN: 1-58488-440-1
Sollins P, Spycher G, Glassman CA (1984) Net nitrogen mineralizationfrom light-fraction and heavy fraction forest soil organic matter. SoilBiol Biochem 16:31–37
StummW, Morgan JJ (1970) Aquatic chemistry. JohnWiley & Sons Inc,New York, 1022 pp
Stumm-Zollinger E (1968) Substrate utilization in heterotrophic bacterialcommunities. J Water Pollut Ctrl Fed 40:213–229
Teodoru CR, del Giorgio PA, Prairie YT, St-Pierre A (2013) Depositionalfluxes and sources of particulate carbon and nitrogen in natural lakesand a young boreal reservoir in Northern Québec. Biogeochemistry113(1–3):323–339
Valdespino-Castillo PM,Merino-IbarraM, Jiménez-Contreras J, Castillo-Sandoval FS, Ramírez-Zierold JA (2014) Effects of high water-levelfluctuations on planktonic community metabolism in a deep(stratified) tropical reservoir. Environmental Monitoring andAssessment, manuscript number EMAS-D-13-02439
Wang Y, Shen Z, Niu J, Liu R (2009) Adsorption of phosphorus onsediments from the Three-Gorges Reservoir (China) and the relationwith sediment compositions. J Hazard Mater 162:92–98
Zimmerman AR, Canuel EA (2000) A geochemical record of eutrophi-cation and anoxia in Chesapeake Bay sediments: anthropogenicinfluence on organic matter composition. Mar Chem 69:117–137
Environ Sci Pollut Res
Copyright © 2022 FDOKUMEN