Analysis of institutional capacity in wetland management and ...
Upload
independentCategory
view
0download
0
Water 2009, 1, 54-79; doi:10.3390/w1010054
waterISSN 2073-4441
www.mdpi.com/journal/water
Article
A Water Balance Budget for Bung Boraphet—A Flood Plain Wetland-Reservoir Complex in Thailand
Nutchanart Sriwongsitanon *, Kritsanat Surakit and Peter R. Hawkins
Department of Water Resources Engineering, Kasetsart University, 50 Paholyothin Rd, Ladyao,
Jatujak, Bangkok 10900, Thailand
* Author to whom correspondence should be addressed; E-Mail: [email protected];
Tel.: +66 2 5791567; Fax: +66 2 5791567.
Received: 12 October 2009; in revised form: 26 November 2009 / Accepted: 26 November 2009 /
Published: 30 November 2009
Abstract: A water balance model was developed for Bung Boraphet reservoir, a large flood
plain lake in Thailand, from daily measurements over three inflow outflow cycles between
2003 and 2006. Measurement error was 10% (as one standard deviation) of the total
measured volume. The specific yield from the Bung Boraphet catchment was 3.9 m3/ha/yr
and surface water inflow from the local catchment was the largest gain term and evaporation
was the largest loss term in the water budget. Irrigation was the second largest loss term and
dry season demand exceeded the storage supply. Uncontrolled extraction of water for
irrigation is regarded as a threat to the reservoir fishery, although the increasing drawdown
range may benefit wetland biodiversity. Sustainable management of the Bung Boraphet
wetland will depend on careful management based on an informed understanding of the eco-
hydrological requirements of all wetland uses. Water balance models like this one are
recommended as a tool to allocate water equitably and in ways which can be integrated
across the Chao Phraya basin.
Keywords: Bung Boraphet; water budget; floodplain reservoir; irrigation demand
OPEN ACCESS
Water 2009, 1
55
1. Introduction
Wetlands are diverse and productive ecosystems that provide numerous resources for human use.
All wetlands depend on specific hydrologic conditions for maintenance, but tropical wetland/shallow
reservoir systems are especially sensitive to change in water balance as the important physical,
chemical and biological processes are all accelerated by higher ambient temperatures [1].
Bung Boraphet is the largest shallow reservoir and wetland complex in Thailand. It is situated at the
head of Chao Phraya River flood plain in central Thailand (Figure 1). The human population living
around Bung Boraphet uses the reservoir-wetland for rice cultivation and fishing. Other recognised
values of the wetland are tourism and biodiversity [2].
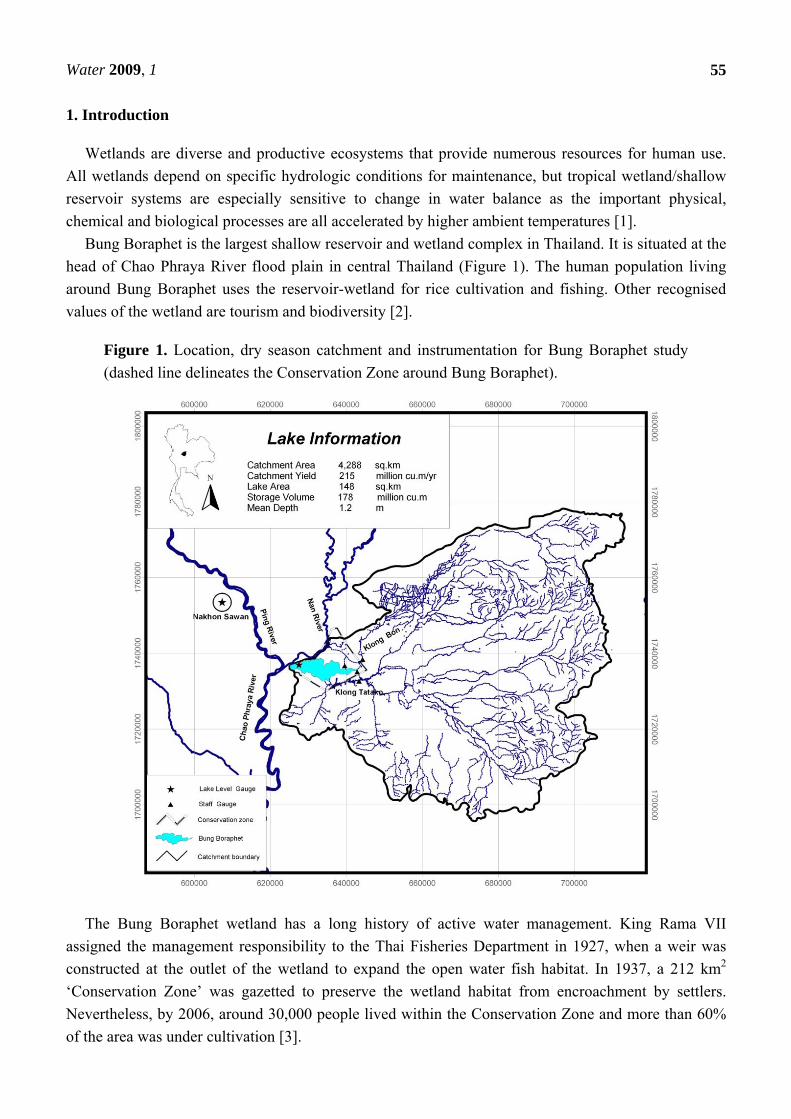
Figure 1. Location, dry season catchment and instrumentation for Bung Boraphet study
(dashed line delineates the Conservation Zone around Bung Boraphet).
The Bung Boraphet wetland has a long history of active water management. King Rama VII
assigned the management responsibility to the Thai Fisheries Department in 1927, when a weir was
constructed at the outlet of the wetland to expand the open water fish habitat. In 1937, a 212 km2
‘Conservation Zone’ was gazetted to preserve the wetland habitat from encroachment by settlers.
Nevertheless, by 2006, around 30,000 people lived within the Conservation Zone and more than 60%
of the area was under cultivation [3].

Water 2009, 1
56
In response to increasing demand for storage for dry season irrigation supply water, the weir crest
was raised to +23.8 m (MSL) in 1970’s and again to +24.0 m (MSL) in 1993. The area of irrigated rice
paddy within the Conservation Zone doubled between 1993 and 2003 (to 76 km2) [4]. Despite
increased storage capacity, the average annual drawdown of the storage has increased, from 77%
between 1993 and 2001, to 91% between 2002 and 2006 [3].
The developments in the Bung Boraphet catchment reflect an expansion in dry season rice
cultivation that has occurred elsewhere in the middle Chao Phraya River basin. This particularly
affects the availability of water resources in the dry season (January to June), when the basin
undergoes seasonal closure [5]. Dry season water scarcity is predicted to increase in future [6].
Thailand has a long cultural tradition of irrigated rice cultivation, centered on the flood plain of the
Chao Phraya River. Historical water resource development was based on the concept that Thais were a
nation of rice-growers and thus provision of irrigation infrastructure was the best development option
in rural areas [7]. This traditional view has encouraged Thai decision makers to focus on the benefits,
rather than the cost/benefit ratios, when considering further irrigation infrastructure development [8].
The continuing demand for irrigation water from Bung Boraphet has prompted new proposals to
increase the yield of the storage by raising the weir height [9] or by increasing the rate of diversion
from the Nan River [10].
This paper describes the development of a reservoir water budget model for Bung Boraphet, which
we propose as an essential tool for hydrological management of the lake-wetland system to sustain the
fishery, the biodiversity and the developing tourist industry as well as cultivation of rice.
Simple hydrologic models have been used extensively to describe water balance in wetlands (e.g.,
[11,12] and shallow flood plain lakes [13,14]). The Bung Boraphet system is more complex because of
reverse flows from reservoir to catchment in the dry season.
Our aims in developing the water balance model were to 1) quantify the components of the Bung
Boraphet water budget seasonally and over the annual inflow outflow cycle; 2) identify the uncertainty
associated with the estimate of each component; and 3) to provide a hydrological basis for more
equitable and sustainable management of the wetland complex.
2. Materials and methods
2.1. The setting
Bung Boraphet is situated in Central Thailand, between latitude 15˚40N (1732407 N) and 15˚45N
(1741767 N) and longitude 100˚10E (625350 E) and 100˚23E (648260 E) on the floodplain of the
Chao Phraya River just below the confluence of the Ping and Nan Rivers (Figures 1 and 2).
In very wet years, major flood events in the Chao Phraya River system submerge the reservoir and a
large area of the Bung Boraphet catchment. These events are less frequent since the construction of the
Bhumibol and Sirikit Dams in 1964 and 1974, which have considerably augmented low flows and
greatly decreased the frequency of very high discharge events in the Chao Phraya River [15].
However, a major Chao Phraya River flood preceded this study in 2002.
In this study we delineated a dry season Bung Boraphet catchment area of approximately 4,300 km2
from topographic survey maps. Two major streams, Klong Tatako and K. Bon, drain the catchment

Water 2009, 1
57
(Figure 1). Other drainage features were two irrigation canals constructed to permit farmers to extract
water from Bung Boraphet.
Agriculture is the dominant landuse, occupying 3,730 km2 (87%) of the catchment. There are still
some areas of natural forest (5% of catchment) mostly in the conservation zone of the Bung Boraphet
wetland [3].
Figure 2. Conceptual model of the water budget for Bung Boraphet.
Paddy rice is cultivated intensively in the Bung Boraphet catchment and especially within the
conservation zone, where farmers have encroached onto the wetland and use reservoir water to irrigate
one or two dry season rice crops per year. This land is particularly susceptible to wet season flooding,
so these farmers rely on successful irrigated crops for their livelihood. The area of irrigated paddy
within the conservation zone increased from 36 to 76 km2 over 10 years from 1993–2003 [4].
2.2. Modeling the water budget
Hydrologic models of lakes and reservoirs that gain or lose water through multiple sources typically
decompose the sources into individual components. The model can be calibrated and validated by
comparing the predicted net gain or loss against the observed change in the stored volume over the
same time period. The mass-balance equation used to estimate the water budget for Bung Boraphet is
defined in equation 1:

Water 2009, 1
58
eAETItOstIst
Ssr
(1)
where S is the change in the stored water volume; t is the time interval (daily); tIs is the total surface water inflow; tOs is the total surface water outflow;
Ir is the rainfall onto the reservoir;
ET is the evaporation from the reservoir surface;
AS is the surface area of the reservoir computed from the water level; and
e is a residual error term representing contributions from ungauged watersheds, seepage, other
extractive uses like aquaculture, and method and measurement errors.
Conceptual model and calculation methodology
The surface water flow pattern in the Bung Boraphet catchment was unusual because in the dry
season, flow in the streams and irrigation canals close to the lake reversed, when farmers upstream
pumped water for irrigation. These extractions drew down the lake storage. A conceptual model of the
Bung Boraphet water budget (Figure 2) illustrates these seasonal changes in direction of water flow.
The methodology used to calculate the main components of the budget is explained in Figure 3.
Figure 3. Process model for calculating the daily water budget for Bung Boraphet.

Water 2009, 1
59
2.3. Components of the water budget
The hydrology of the Bung Boraphet system is governed by a monsoonal climatic regime and is
highly seasonal. We divided each annual hydrological cycle into inflow and outflow periods
determined by the trend in the change in reservoir water level and the direction of water flow in the
catchment streams. An annual cycle commenced when the reservoir level started to rise was the
minimum of the previous year and ended on the minimum of that year.
Observational data on all components were collected over more than three complete cycles, from
December 2002 until April 2006. We then estimated the contributions of each term in the water
balance to each flow period within each complete annual water cycle. This approach was a better
estimate of the resource use than an account based on the Thai water year (1 April and 31 March).
2.3.1. Surface water flows (ΣIs and ΣOs)
Surface water flowed into the reservoir from the Bung Boraphet catchment, from the Chao Phraya
River system in floods which exceeded +24 m (MSL), or at other times if the lake level was less than
the level of the Nan River and the control regulator was open (Figure 2).
Surface water flowed out from the reservoir in three ways. In the dry season there was a reverse
flow from the reservoir into the catchment, as farmers collectively extracted water from the reservoir
to irrigate their paddy rice, by pumping from locations in the stream network close to the reservoir.
Secondly, the reservoir could spill when the stage height exceeded +24 m (MSL) and it exceeded the
level in the Chao Phraya River system. Thirdly, the reservoir manager (Thai Fisheries Department)
could make controlled releases to the Nan or Chao Phraya Rivers, whenever the reservoir level
exceeded the river levels.
We categorised outflows (upstream) into the reservoir catchment as regulated Outflow Type 1,
which could be gauged, and Outflow Type 2, which could not be gauged. Type 1 outflows represented
the net cumulative extraction by individual farmers pumping from the two streams and the irrigation
canals upstream of the reservoir. This outflow occurred in the first part of the drawdown period, whilst
the pump sites in the catchment were hydraulically connected to the reservoir. This outflow rate was
controlled by the rate of pumping and the channel cross-section.
As the reservoir level fell, more and more farmland lost hydraulic connectivity until at a critical
stage height, farmers constructed temporary check dams at a series of locations in the stream network,
which completely severed the hydraulic connectivity between reservoir and catchment. The type 2
outflow periods were identifiable by catchment gauge levels exceeding the reservoir level during the
drawdown part of the cycle (Figure 4).
Rating curves and flow rules
Staff gauges (precision 5 mm) were installed near the mouths of the two main natural streams and
two irrigation canals constructed to irrigate areas that cannot access natural streams. These sites
represented more than 96% of the catchment drainage. The remaining direct runoff into the reservoir
was included in the residual term. Manual observations were made of stream level (three times a day
and averaged) and reservoir level once each day (Figure 1).

Water 2009, 1
60
Separate inflow and outflow rating curves were prepared for each stream from measurements of
flow rate and channel cross section at the staff gauge locations. The volume of surface water that
flowed into or out of the reservoir each day was calculated using the appropriate rating curves and
level observations. The flows in K. Bon and the Irrigation Canals were always confined within the
channel and so were described by single rating curves. However, when the reservoir water level
exceeded +24.30 m (MSL), the outlet of K. Tatako was submerged, so a second rating curve was
prepared for this location to estimate the volume of overbank flow. A set of flow rules were developed
to determine when each rating curve should be used (Table 1).
Figure 4. Reservoir and streams level relationships used to define flow periods in each
hydrological cycle used in this study. (Note: Stream level observations were not used to
calculate Outflow Type 2 volumes).
Table 1. Description of the surface flow rating curves.
† Curve Rule to determine when to change the rating curves or when rating curves do not apply.
Flow direction Flow Type Description Curve Rule†
Into the
reservoir
Regulated
inflow
Inflows from the catchment under gravity Stream stage >
Reservoir stage
Out of the
reservoir
Regulated
Outflow Type 1
Outflow from the reservoir to the catchment
by pumped extraction from streams
hydraulically connected to the reservoir
Stream stage <
Reservoir stage
Out of the
reservoir
Regulated
Outflow Type 2
Outflow from the reservoir to the catchment
by pumped extraction when check dams are
constructed in the stream network. Rating
curves were not applicable during this period.
Stream stage >
Reservoir stage
in the dry season

Water 2009, 1
61
2.3.2. Direct rainfall (Ir)
The rainfall onto the reservoir surface from 2002 to April 2005 was estimated from rainfall
measured 10 km west of Bung Boraphet, at Muang Nakhon Sawan Meteorological Station. After 1
May 2005, Standard 8 inch Rain Gauges (precision of measurement of ±0.05 mm), were installed at
four new stations around the reservoir shore. The daily rainfall onto the reservoir from May 2005 until
May 2006 was calculated using the data from Nakhon Sawan plus the four reservoir side stations using
the Thiessen Polygon areal weighting method [16]. The daily increase in water volume in the reservoir
attributed to rain fall was calculated as rainfall depth multiplied by reservoir surface area on that day
(Figure 3).
2.3.3. Evaporation (ET)
The daily evaporation from Bung Boraphet was calculated using the modified Penman equation
[17] with data collected at the Meteorological Station at Nakhon Sawan, 10 km from the reservoir.
2.3.4. Stored water volume (S)
The water level in Bung Boraphet has been measured daily since April 1993, by the Thai Fisheries
Department from a staff gauge near the regulator to the Nan River (precision of ±5 mm). The daily
change in the stored water volume of Bung Boraphet ( S / t from eq. 1) was calculated from the
volume-elevation curve and the observed water levels.
The bathymetry of the reservoir has been mapped at 0.5 meter intervals, from a depth survey on a
150 x 200 m grid conducted in 2003 [9]. The volume and area - elevation curves were interpolated
from the 0.5 m contour chart. Thus the linear interpolated value for reservoir volume at FSL was
177.5 x 10⁶ m3 and the uncertainty (observation error) at FSL was ±2.82 x 10⁶ m3.
2.3.5. Error terms
The volume of each measured component in the annual inflow-outflow cycle was multiplied by the
percent error associated with the respective measurement method to estimate the error in the volume of
that component (Table 2), which represented 1 SD for that component [18]. The uncertainty in the
seepage estimate was not estimated as it was calculated from the residual.
The residual term (e) in the water balance equation, comprised measurement uncertainty associated
with the estimates of the major components of the budget listed in Table 2. In order of decreasing
methodological uncertainty these were: 1) uncertainty associated with applying rainfall and
meteorological data from distant locations to the reservoir; 2) systematic errors associated with rating
curves and volume and area elevation curves; 3) random type error due to measurement precision; and
4) systematic underestimate of inflow from the small fraction (<1%) of ungauged catchment.
The systematic extraction of water from the reservoir for aquaculture and potable supply were not
modeled independently but included in the residual term as they were small relative to the main water
balance components. Approximately 104 m3 d-1 was extracted to maintain aquaculture [3] and the
Tatako District Waterworks Authority extracted a similar volume in the dry season, between
December and February each year to supply domestic users [3].

Water 2009, 1
62
In addition to the measurement uncertainty, the residual error also included two important
unmeasured terms. The inflow and outflow of groundwater and the ungauged extraction during the
outflow type 2 period.
Table 2. Methods of estimation of model variables and uncertainty in each.
Variable Description Obs.
Error†
Method Method Error ‡
IP Precipitation 0.05 Rain gauge 20%
Is Surface inflow 5 Staff gauge and rating curve 15%
OET Evaporation nd Climatic model (Penman) 20%
Os1 Outflow Type 1 5 Staff gauge and rating curve 15%
ΔS change in volume 5 mm staff gauge error and hypsograph 10%
ST Total Error (1 SD) √(sum of squares of obs. components)
Os2 Outflow Type 2 5 mm residual error
Ig/Og Seepage in/out 5 mm residual error
‡Error in measurement method (after LaBaugh and Winter, 1984); nd - not determined.
†Uncertainty in making an observation.
2.3.5.1. Groundwater exchange (Gw)
Ground-water exchange is a complex hydrologic property, and accurate measurement of daily
ground-water exchange in floodplain wetland systems is time-consuming, difficult, and
expensive [12,19].
Groundwater loss is often considered a minor component of the annual water budget in floodplain
lakes, which occur in sedimentary environments with low hydraulic conductivities, e.g., [13]. For these
reasons, we did not directly measure the groundwater contribution to the reservoir water budget and it
was initially assigned to the residuals term of the water balance (eq. 1).
However, the regular cycle of flood plain inundation means that groundwater inflow may be an
important seasonal component of flood plain lake hydrology and ecology [19]. Therefore we analysed
the residual term of the water balance model to derive a seasonal estimate of the seepage flux between
the reservoir and the groundwater.
During the Type 1 Outflow periods there were no inflows so equation 1 simplified to:
Gw= ΔH – ET – ΣOT1– Aw (as ΣIs = Ir= 0) (2)
where Gw was the net inflow or outflow attributed to seepage, in mm d-1;
ΔH was the change in reservoir level in mm d-1;
ΣOT1 was the total Type 1 Outflow in mm d-1; and
Aw was the average daily extraction for aquaculture and potable use (in mm d-1).
Water 2009, 1
63
At these times the residual error term simplified to 1) random type error due to measurement
precision; 2) systematic errors associated with volume and area elevation curves; 5) variable
unmeasured seepage inflow or outflow; and 6) a systematic loss to aquaculture and potable supply.
Measurement errors were random (either positive or negative), whilst the seepage component was
assumed to be constant (either positive or negative) over the course of a flow season, whilst the daily
loss to ‘other use’ (aquaculture and domestic potable use) was assumed as a constant throughout the
outflow periods.
The mean seepage for each inflow and Outflow type 1 period was estimated from the slope of the
line of best fit through the daily residuals, corrected for a systematic loss to ‘other use’ in the dry
season which was 2 x 10⁴ m3/d during Outflow type 1 and 1 x 10⁴ m3/d in Outflow type 2
(= an average change in level of 0.45 mm/d).
Seepage could not be estimated in this way during the Outflow type 2 periods as the stream outflow
volumes were ungauged. However, as the hydraulic conditions were assumed to remain relatively
constant throughout the Outflow period, the seepage co-efficient from Outflow type 1 was extrapolated
to the Outflow type 2 period of each drawdown cycle.
The losses to aquaculture and potable use of 2 x 10⁴ m3d-1 in the dry season were also included in
the residual term. These extractions corresponded to a fall in reservoir level of between 0.3 and 0.6mm
per day, which was significant when compared to the groundwater seepage rates estimated from the
residual term. Therefore seepage estimates during the dry season (Outflow periods) were corrected for
the aquaculture and potable supply components by subtracting 0.45 mm/d.
2.3.5.2. Outflow type 2
As the daily volume of Type 2 outflows could not be determined by the rating curve method, these
were estimated from the difference between the change in the observed reservoir volume and the sum
of the other model parameter components (eq. 3).
OT2 = Ir – ΔS – Gw – ET– Aw + e (3)
where OT2 was the total Type 2 Outflow;
ΔS was the daily reservoir volume change;
Gw was the net seepage flow estimated in the preceding Outflow type 1;
ET was the evaporation;
Ir was the volume of rainfall on the reservoir;
Aw was the average daily extraction for aquaculture and potable use; and
e is a residual error term representing method and measurement errors.
2.4. Demand modeling
The outflows from Bung Boraphet upstream to the catchment were almost exclusively for irrigation
of paddy rice. Therefore as a validation of the water balance model and as an estimate of the
effectiveness of resource usage, we determined the area of rice which could be optimally irrigated in
the dry season, using water volumes derived from the water balance and an irrigation demand model
[20].

Water 2009, 1
64
The irrigation efficiency (Ei) was established for an irrigated area of 76 km2 reported by [4] for the
Outflow 1 period of November 2003 to February 2004 and this Ei was assumed in the
subsequent years.
3. Results
The hydrodynamic behaviour of Bung Boraphet was highly cyclic. A uni-modal filling phase
commenced in mid-year and a prolonged drawdown followed from October-November. This annual
cycle is evident in daily records of reservoir level since the weir was raised to +24 MSL in 1993
(Figure 5). Over that period the annual maximum level exceeded the weir height in 11 of 14 years.
More significantly, there have been 3 major floods in the Chao Phraya River system, identified by
maximum water levels more than 2 m above the weir, which inundated large areas of the Chao Phraya
flood plain including the Bung Boraphet wetland. The inflow-outflow cycle in Bung Boraphet that we
used in this analysis always lagged the start of the official Thai water year (1 April and 31 March). The
first inflow to Bung Boraphet followed the onset of the monsoon and was usually 6-8 weeks after the
start of the water year. This variability in the start of the cycle, plus interannual differences in the
magnitude of the flood, meant the duration of the natural cycle varied between 261 and 431 days
during this study (Table 3).
Figure 5. Daily observations of water level of Bung Boraphet (1993-2006).
Lak
e L
evel
(m
, MS
L)
Lak
e L
evel
(m
, MS
L)
The volume of each component of the water budget was calculated for each season in three
complete inflow/outflow cycles from 2003 to 2006 (Table 3 and Figure 6). A very large surface water
inflow from the Chao Phraya River preceded the commencement of this study in 2002, but during the

Water 2009, 1
65
study period there was only a single minor inflow from Nan River in 2003. Thus this study was an
opportunity to accurately assess the contribution of the local catchment to the water budget of the
reservoir, in the absence of ungauged input from the Chao Phraya River.
Table 3. Summary of water balance components for three inflow/outflow cycles.
2003-04 2004-05 2005-06
Losses (106 m3)
Evaporation 83 137 89
Net Seepage outflow 4 48 12
Outflow Type1 78 64 44
Outflow Type2 13 20 8
Total Irrigation outflows 91 84 52
Outflow to CP‡ 4 22 6
Outflow to Others§ 3 5 3
Total of loss terms 186 295 162
Gains (106 m3)
K. Bon 19 20 25
K. Tatako 151 118 147
Irrigation Canals 4 6 4
Stream inflows 174 145 176
Direct rainfall 33 100 73
Inflow from CP‡ 0 6 2
Net Seepage inflow 2 4 0
Total of gain terms 210 255 251
Net Storage 28 -36 92
Total error (1 SD) 41 42 41
Duration of Outflow period (d) 202 309 158
Duration† of annual cycle (d) 311 431 261
† The annual hydrological cycle for Bung Boraphet was determined from the beginning of rising reservoir
level to end of falling level in the same cycle.
‡ Chao Phraya River system.
§ Other quantified uses were for aquaculture (Outflow type 1 and 2) and potable supply (Outflow type 1).
3.1. Surface water flows
Stream gauges were installed on the four main streams for this project. Although there were no
control structures at the gauge sites, rating curve data was gathered over the duration of the project, so
the error in these curves was expected to be within the normal range for such curves. The rating curve
coefficients are listed in the Appendices.
Surface runoff from the Bung Boraphet catchment was the most important gain term in the water
budget. The main source of surface water was K. Tatako. The inflow from K. Bon was about 15% of

Water 2009, 1
66
that from K. Tatako in each cycle and the contributions from two irrigation canals were minor
(Table 3).
The specific yield of the Bung Boraphet catchment was 39,000 m3 km -2 y-1 which was significantly
lower than the yields from the two much larger tributaries of the Chao Phraya River, namely the Ping
River (150,000 m3 km -2 y-1) and Nan River (339,000 m3 km -2 y-1).
Figure 6. Volume of water (106 m3) for water balance components over three complete
inflow outflow cycles between November 2003 and May 2006. One standard deviation
(SD) of the total error in the volume is super-imposed on the outflow summary. It was
~40 10 6 m3 each year.
0
50
100
150
200
250
300
350
2003‐04 2004‐05 2005‐06
OutflowsAquacult. +Potable
Net Seepage
Outflow to CP
Irrigation
Evaporation
1 SD of total error of Volume budget
3.2. Rainfall
Rainfall in the Bung Boraphet catchment was highly seasonal. The majority of the precipitation
occurring during the monsoon period (May to October) and in the wetter years more than 80% of the
direct rainfall on the reservoir fell during this period.
Direct rainfall contributed 16–40% of the total input. The 2003 inflow season was comparatively
dry and direct rainfall only contributed 16% of the total input of water to the reservoir whereas in
2004-5 and 2005-6 the direct rainfall onto the reservoir was 30 and 40% respectively of the total gain.

Water 2009, 1
67
3.3. Evaporation
The average annual evaporation from Bung Boraphet was 1770 mm/y and evaporation was the
dominant loss term in the budget, contributing about 50% of the water loss in each cycle. The mean
depth of the reservoir at FSL is 1.2 metres and does not vary much across the drawdown range.
Therefore evaporation was always a significant loss factor at any storage level.
Over the duration of the study, the total volume of loss by evaporation was 1.5 times greater than
the gain from direct rainfall onto the reservoir. However, the volume of water lost to evaporation
varied between cycles principally because of differences in cycle duration.
3.4. Surface water outflows
The surface water outflow components of the budget were; 1) outflows via the catchment streams;
2) outflows for other uses (public water supply and aquaculture); and 3) discharges downstream via the
weir or the Nan River regulator. Outflow to the catchment occurred during the dry season, when
farmers extracted reservoir water via the streams, to irrigate paddy rice.
The outflow rating curves for each catchment stream had slightly poorer correlation coefficients
than the inflow curves (see Appendices) because outflows were rated in conditions of variable
pumping rates, whereas inflow (driven by gravity) was less variable. This was true for all streams
except Irrigation Canal 1 – which had the least rating flow measurements.
Irrigation outflows were the second largest loss term in the water budget. The range,
92–58 x106 m3, represented 50% and 30% of the total losses for the respective years (Table 3 and
Figure 6). The volume of the irrigation outflow varied more than evaporation between cycles as it
depended not only on the volume of water in the reservoir available for extraction but also
environmental factors like catchment runoff and farmers decisions on the profitability of a second or
third rice crop.
Gauged outflows (type 1) occurred at the beginning of the drawdown cycle and were used to
irrigate a second rice crop. These outflows comprised the greatest extraction volume each year.
Ungauged outflows (type 2) occurred later in the drawdown period, when the reservoir level fell to
about +22.8 m and farmers constructed temporary check dams in the stream network to continue
extracting reservoir water. The change from Outflow type 1 to type 2 was confirmed when levels at
catchment gauge stations exceeded the reservoir level (Figure 4).
The volume of ungauged Outflow type 2 represented less than 10% of the total inflow in two years
but in 2004–05, it rose to 28% of the inflow, and comprised 20% of volume extracted for irrigation.
These outflows were generally used to irrigate a third rice crop in the year. These outflows occurred
late in the dry season when all other inputs were negligible, so reservoir drawdown was exaggerated
by this use. In 2004–5, the largest type 2 Outflow of the three cycles studied coincided with the lowest
reservoir level since the weir was raised in 1993.
The smallest loss term during the study was the volume discharged downstream. There were minor
discharges over the control structures at maximum reservoir level in 2003–04 and 2004–05. Although
a fishway is incorporated in the weir, there were no recorded releases when the reservoir was below
Full Supply Level (FSL), so water exchange between Bung Boraphet and the Chao Phraya River
system was very limited during the study period.

Water 2009, 1
68
Reservoir levels above FSL were not recorded in 2003 (Figure 7), due to operator error. However,
the outflow volumes at those times were estimated by substituting levels from the catchment streams,
which would slightly over-estimate the volume discharged.
Figure 7. Observations of the reservoir stage height over the study period vs. predicted
values. (Note: observed =observed level; predicted = predicted level for inflow and
Outflow 1periods; interpolated data for unrecorded reservoir levels).
3.5. Seepage
A major flood in the Chao Phraya system in 2002 peaked at a height of +27.2 m (MSL) in Bung
Boraphet and temporarily inundated more than 880 km2 of the Bung Boraphet catchment (Table 4).
After this inundation event, groundwater seeped into the reservoir from bank storage at a diminishing
rate until 2004. Overlaid on this multiyear trend of a diminishing seepage into the reservoir was a
seasonal cycle of seepage loss during the inflow season and seepage gains (or lesser loss) during the
outflow season.
The mean daily seepage component of the budget for inflow periods varied between a gain of
0.8 mm/d and a loss of 0.3 mm/d. During the outflows the maximum gain was 1.1mm/d in 2003 after
the Chao Phraya River flood and the maximum loss was 2.2 mm/d in 2005 (Table 4).
The gross seepage flux for each annual cycle (Table 3) was calculated from the sum of the seasonal
seepage terms (see Table 4). Overall, there was a net seepage loss from the reservoir in every
hydrological cycle. The magnitude of the loss ranged from 1% of the total losses in 2003–04 (after the
2002 flood), to 15% in 2004–5 when inflows were lowest and drawdown most prolonged. The greater

Water 2009, 1
69
seepage losses in 2004–2006 were presumably because the minor floods in those years did not
recharge the bank storage in the same way as in 2002 (Table 4).
Table 4. Seasonal seepage co-efficients for each water cycle.
Period Start Date Duration
(d)
Reservoir
starting level
(m, MSL)
max level
(m, MSL)
Temporary
inundated Area†
(km2)
Net Seepage
(mm/d) ‡
Inflow 1-Jul-02 123 22.2 27.20 882 nd
Out type 1 11-Dec-02 89 27.2 -1.23
Inflow 15-Jul-03 99 22.3 24.00 116 -0.30
Out type 1 10-Nov-03 105 24.0 -0.02
Inflow 24-May-04 122 22.0 24.50 229 -0.34
Out type 1 24-Sep-04 151 24.5 2.02
Inflow 26-Aug-05 79 21.5 24.20 123 0.80
Out type 1 14-Nov-05 112 24.2 0.20
† Difference in inundated area from low water (permanent lake) to the following annual high water
‡ Seepage calculated from residual error and then corrected for the daily loss to other minor uses. +ve seepage represents a
flow out of the reservoir; nd – not determined
3.6. Water budget model calibration and validation
The water-budget model was developed using Excel software (Microsoft Excel 2003) with daily
time steps. The model was validated for all inflow and Outflow type 1 periods, by comparing the
predicted daily change in stored volume (ΔS/Δt in eq. 1) to the observed change. There were several
short periods when reservoir level was not recorded. The level change during those times was assumed
to be linear (Figure 7).
The accuracy of the reservoir water budget model (eq. 1) was evaluated by comparing the daily
reservoir water level observations with model predictions for inflow and Outflow type 1 periods
between December 2002 and May 2006 (Figure 7). The flow characteristics for each flow period were
different, so the appropriate co-efficients for flow prediction were set at the start of each flow period.
Statistical assessments of goodness of fit of model prediction of water level to the observations for
inflow and Outflow period 1 were all satisfactory (Correlation coefficient [21] r=0.98 - best fit when
r = 1; Root mean square error [22] = 0.09 with best fit when RMSE = 0;
Nash-Sutcliffe criterion [23] = 96.8% with best fit when EI = 100%).
The results of the statistical analyses gives confidence that the water budget model can accurately
estimate the contribution of different components of the water balance during periods in 2003 and
2005, when the reservoir level was not recorded.
3.7. Demand model results
The demand model derived irrigation efficiency (Ei) for Outflow 1 flow in 2003-2004 was 42%.
This was very similar to the dry season Ei (averaged over 4 years) of 43.4%, reported by [24] for

Water 2009, 1
70
irrigated paddy rice areas in the Chao Phraya Basin adjacent to Bung Boraphet. We applied the same
Ei and used the irrigation demand model to estimate the optimum area for irrigation in the Outflow 1
and 2 periods of the following dry seasons (2004–2006) (Table 5).
Table 5. Mean water losses and estimated irrigated area during Outflows.
Period Mean rate of Loss
106 m3 d-1
Reservoir
Stage ht
Optimum
Irrigated Area*
Type Start date Duration
(days)
Net Evapn† Irrigat. Seepage to begin period
(m, MSL)
km2
Y2 Out 1 02-Nov-03 113 -0.21 -0.69 -0.04 +24.0 76
Y3 Out 1 24-Sep-04 151 -0.28 -0.42 -0.26 +24.5 54
Y4 Out 1 14-Nov-05 112 -0.41 -0.39 -0.07 +24.2 40
Y2 Out 2 24-Feb-04 89 -0.25 -0.15 -0.02 +22.6 22
Y3 Out 2 23-Feb-05 158 -0.11 -0.13 -0.07 +23.2 10
Y4 Out 2 07-Mar-06 46 -0.31 -0.19 -0.03 +23.0 9
† Evaporation plus precipitation (precipitation was usually very low in these seasons)
‡ Ratio of Irrigation (I) to Evaporation (E)
§ Ratio of rate of Outflow 2 (O2) to rate of Outflow 1 (O1)
* Estimate of the optimum area for irrigation (from demand model with irrigation efficiency of 42%)
3.8. Errors in measurement
The total error in the measured components of the water balance cannot be calculated directly from
the sum of the individual component error volumes, because the sign of the error for each component
may be positive or negative with respect to the true value. We used the method of [18] to determine the
standard deviation (SD) in the total error from the sum of the variance of all the measured components
(eq. 4):
ST2 = SIs
2 + SIr2 + SET
2 + SOs2 + SΔS
2 (4)
where ST2 is variance of the total error in volume of the water budget;
Si2 is variance of error in volume for measured component I; and
ST is 1 SD of the total error in volume of the water budget.
The total error is most sensitive to uncertainty in measurement of the largest terms (i.e. evaporation,
inflow and outflow) and least sensitive to uncertainty in measurement of smaller terms like change in
storage volume. The standard deviation (SD) of the total error was close to constant each year with 1
SD ~40 x 106 m3 (Figure 6). The measurement error for each component converted to volume is
reported in the Appendices. The residual term was <10% of the total water input to Bung Boraphet in
the first and last annual cycle. However, in 2004-05 the residual term, which includes seepage and
outflow type 2, was 28% of the total outflow. More precise, automated records of reservoir level
would improve the reliability of future water balances and the accuracy of the seepage estimate.

Water 2009, 1
71
4. Discussion
4.1. Surface water inflows
The hydrological characteristics of the Bung Boraphet catchment streams were similar to those of
the much larger tributaries of the Chao Phraya River at Nakhon Sawan described by [15]. However,
the specific yield of the Bung Boraphet catchment (38,500 m3 km-2 y-1) was significantly less than for
the larger rivers (e.g., 26% and 11% respectively of the Ping and Nan catchment yields). This may be
due to the larger proportion of agricultural landuse – especially intensive rice cultivation – in the Bung
Boraphet catchment, which would intercept and detain surface water inflows.
All surface flow monitoring sites in the stream network were close to the reservoir. Thus the water
budget model only calculated water withdrawals from the reservoir. It did not include the volume
extracted from streams during inflow periods.
4.2. Rainfall
Direct rainfall was a significant component of the budget as the reservoir has such a large surface
area. The very low volume of direct rainfall in 2003–4 was anomalous, considering the total stream
discharge in that cycle was equal highest. The difference in rainfall between cycles was unlikely to be
solely due to the increased gauge coverage that occurred in April 2005 and improved the accuracy of
rainfall estimates in the final inflow period. It may be another indicator of the contribution of intensive
farming to the low specific yield from this catchment.
4.3. Surface water outflows
This assessment of the water budget was based on the rise and fall of the reservoir water level in
inflow outflow cycles. The cycles were not uniform in duration, and this variability had greatest effect
on the size of the evaporation term. Thus, when reservoir water levels fell to a record low in 2005, it
was mainly because the 2004 wet season finished early and the 2005 wet season was late. It was
309 days from the start of outflow in September 2004 until the reservoir level rose again in August
2005. The net evaporation over this extended outflow was 50% more than for the shorter cycles.
Seepage was also significantly higher than in other years, whereas extraction for irrigation was
relatively constant.
The outflows to irrigate rice in the catchment were the second largest loss term in the water budget.
Demand for water for irrigation has increased throughout the Chao Phraya River floodplain over the
past two decades, as technological advances permitted cultivation of two or even three rice crops per
year [5]. In the Bung Boraphet catchment, the increase in demand due to multiple crops per year has
been further exacerbated by a doubling in the area of rice paddy [4] and the dry season drawdown
observed in each hydrological cycle of this study suggest that the area of dry season irrigation in the
catchment is already periodically exceeding the storage capacity of the Bung Boraphet reservoir.
Water 2009, 1
72
Irrigation demand
A survey of Bung Boraphet farmers in 2002 reported that farmers would plant a second (dry season)
rice crop on all irrigated paddy in the Bung Boraphet catchment, if the reservoir was full at the
beginning of the dry season.
The farmers also reported that dry season rice yield varied from year to year depending on water
availability. But since a new weir was constructed in 1993, the reservoir has always been full (≥24 m)
at the beginning of the dry season (Figure 5). Therefore reservoir level at the start of drawdown
seemed to be a poor indicator of water availability.
Our study seemed to confirm this, because although the reservoir was ≥24 m at the beginning of
drawdown in each year of this study, the volume extracted for irrigation progressively declined from
91 x 106 m3 (2003–04) to 53 x 106 m3 (2005–06) (Table 3 and Figure 6).
If we assume the entire irrigable area was planted to rice each dry season, the diminished irrigation
supply after 2003 was either supplemented from other sources, or the crops received inadequate water
and the yield suffered.
To answer this question, we compared the irrigation consumption with the net evaporation
(evaporation less direct rainfall) and seepage terms during each Outflow season. The seasonal volumes
were converted to daily rates to normalise for different seasonal durations to aid the comparison
(Table 5).
The extraction rate in Outflow 1 periods was negatively correlated with the net evaporation rate.
This is a clear indicator that the stored supply was insufficient because if the stored supply was in
excess we would expect irrigation consumption to rise in drier years to match the loss from higher net
evaporation. Conversely if the irrigated area is in excessive of the supply capacity of the storage, an
increase in the seasonal net evaporation would further reduce the water available for irrigation use.
In summary, the evidence from water balance and the demand modeling indicated that if farmers
cultivated 76 km2 of irrigated land for a second rice crop every dry season (as reported by survey),
then the yields from the second (and third) crops in 2004–5 and 2005–6 would have been reduced by
water resource limitation, despite full reservoir storage at the beginning of the dry season.
In the lower Chao Phraya basin, the anticipated price at harvest is the most important driver for dry
season rice planting, even where the availability of irrigation water is controlled by a government
agency [5]. In the Bung Boraphet catchment, where extraction is uncontrolled, crop price is also likely
to be the dominant influence on farmer’s planting decisions, perhaps aided by the farmer
misconception that a full reservoir at the end of the wet season will provide sufficient water for the dry
season crop.
4.4. Evaporation
Evaporation is a very important feature of the Bung Boraphet water balance as it was the largest
loss term in 2 of the 3 years. The Bowen-ratio energy-budget (BREB) method is generally considered
as a benchmark standard for measurement of evaporation and it is assumed to be within 10% of true
values when averaged over a season and within 15% when averaged over a month [25]. The Penman
method used in this study has also been widely applied in hydrological studies of reservoir water
balance. The average annual evaporation rate of Bung Boraphet of 1,700 mm/y was comparable to

Water 2009, 1
73
Penman evaporation estimates from other large shallow tropical lakes with a monsoonal climate (e.g.
Lake Manton, Northern Territory Australia 1,971 mm/y [26] and Lake Ziway, Ethiopia
1,870 mm/y [27].
We estimated the uncertainty in the Penman evaporation estimate used here was 20%, based on the
findings of [28] that 85% of the Penman estimates were within 20% of the BREB measure. The
uncertainty in the evaporation estimate could be reduced by installing measurement instrumentation
closer to the reservoir than in this study.
4.5. Groundwater
The residual term of reservoir water budgets includes all ungauged inputs and outputs. Although the
net ungauged contribution to the Bung Boraphet water budget in this study were generally small
(<10% of the total inflow in 2 of 3 hydrological cycles), evidence from other floodplain lakes has
shown seepage into and out of the reservoir during the course of the annual inundation and drawdown
cycle, can be significant [14,29].
The seepage behaviour of the Bung Boraphet reservoir was relatively complex. A regional flood
event in 2002 provided bank storage sufficient to provide unidirectional seepage into the reservoir
throughout the following muted hydrological cycle. The annual floods during this study period were
much smaller than 2002 and by the 2004–5 cycle the seepage flux had reversed to become a net loss.
Towards the end of the study, seasonal reversals in the direction of seepage which are typically
associated with flood plain lakes became evident.
These results indicate that the magnitude and the duration of the annual flood have a dominant
effect on the direction of subsequent seepage flows. Although seepage was the least significant net loss
term in the budget, long term average seasonal seepage terms should only be applied with caution and
a consideration of the magnitude of the annual flood in modeling different management options.
4.6. Eco-hydrological implications of the changes in water balance
The original Bung Boraphet weir was constructed to create a permanent reservoir fishery and this
use is still an important use today. However, some of the hydrological management strategies
advocated by Thailand’s Department of Fisheries for the Bung Boraphet reservoir fishery conflict with
the eco-hydrological principles for sustaining other wetland uses.
For example, floodplain wetland ecosystems are very sensitive to variability in the hydrological
cycle, so that wide annual or interannual fluctuations in water level are normal and indeed beneficial to
wetland productivity and functionality. A survey of the birdlife of Australian lakes and reservoirs
showed water bird diversity was correlated with hydrological variability; natural wetlands had greatest
diversity and reservoirs with tightly regulated levels had least [30].
The inundation ratio (seasonal: permanent flooded area) is an eco-hydrological indicator of
potential wetland productivity. A local example of its use is as a predictor of the annual productivity of
the Tonle Sap fishery (on the Mekong River flood plain) [31].
The inundation ratio of the Bung Boraphet reservoir- wetland during this study ranged from 3:1 to
12:1, which is comparable to the mean inundation ratio of 6:1 reported for wetlands on the Niger and
the Senegal Rivers in Africa [32]. This suggests the recent trend towards an increasing inundation ratio

Water 2009, 1
74
in the Bung Boraphet wetland (as observed in this study) may be more beneficial to wetland health
(diversity) and function (productivity), than maintenance of a regulated storage with minimum
drawdown of +23 m (MSL). It is noteworthy that fish diversity in Bung Boraphet is reported to have
diminished significantly since it has been managed as a regulated reservoir.
There are benefits in maintaining the reservoir fishery as a closed system in the dry season. Flood
plain lakes are recognized as the nurseries and recruitment areas for highly productive tropical river
fisheries. Nutrients and silt that are transported on the floodplain by floodwaters are trapped and
become available for use in subsequent aquatic and terrestrial phases of the inundations cycle. This
process makes wetlands highly productive ecosystems. The wetland productivity is usually exported to
the river system during the flood recession phase, but the discharge to the Chao Phraya River system
was only 4.5% of the total input during this study. Thus wetland production is retained in the reservoir
and the local fishery benefits at the expense of fish production throughout the Chao Phraya system.
However, this local benefit may be compromised if the minimum storage volume is not maintained
(as occurred in each year of this study). During the prolonged dry season of 2005 the volume fell to
9% of the storage (+21.4 m (MSL)). If fish cannot escape downstream from such extreme drawdown
events, they will be concentrated in a diminishing area of open water, where growth is reduced by
increased competition for food and predation is increased by water birds and illegal fishermen. The
Bung Boraphet region recorded the highest level of convictions for illegal fishing in the 23 Thai
fishing regions in 2004–5 represent 14% of the national total [33].
Other fisheries management practices in Bung Boraphet seem to contradict best management
practices used elsewhere. For example the Fishery Department has an operational target to dredge one
million cubic metres of silt from Bung Boraphet reservoir every year, to maintain the reservoir volume
and keep deeper water channels available for boat access and fish refuge [34]. This is a planned
response to an estimated average annual deposition of 2.2 million cubic metres of sediment from the
Chao Phraya system.
One could question whether ongoing dredging is an appropriate response to address a silt loading
delivered by floods with a recurrence interval of 3–5 years. More important is the practical impact of
the dredging activity in raising turbidity levels and reducing the submerged aquatic plant cover in the
lower half of the reservoir [4].
Aquatic macrophyte beds provide nursery habitats for many fish species. Activities that increase the
turbidity of macrophyte dominated shallow lakes risk switching the main primary production of these
systems from macrophytes to phytoplankton with blooms of toxic cyanobacteria (blue green algae).
4.7. Management
Balancing consumptive water use with the eco-hydrological requirements of environmental
resources is an important element of integrated water basin management for sustainable development
[35]. The demand for water from the Bung Boraphet reservoir for dry season irrigation is now in
excess of the storage volume and management of the irrigation demand will be imperative in the
future. Understanding and careful accounting of the components of the reservoir water budget will be
important in achieving a balance between the competing uses. Areas of uncertainty in components of
the water budget identified in this study could be reduced by simple improvements in instrumentation

Water 2009, 1
75
(e.g., automated recording of reservoir level and measuring climatic factors at sites closer to the
reservoir).
The current proposal for dry season diversions from the Nan River into the Bung Boraphet reservoir
[10] to maintain the reservoir volume at +23 m (MSL), seems ill conceived for several reasons. Firstly,
dry season diversions from the Nan River would decrease the water flowing to the Chao Phraya delta,
where farmers are also requesting a bigger dry season allocation [24]. Therefore, rice production
would really be re-allocated not increased. Secondly, even temporary storage in the Bung Boraphet
reservoir would result in a significant volume of diverted water being lost by evaporation. Thirdly,
natural resource managers, farmers and even the public are likely to question the allocation of valuable
dry season water for cultivation of rice in a designated conservation zone. Finally, the maintenance of
a minimum reservoir level at 40% of the stored volume may be beneficial for the reservoir fishery, but
detrimental to other properties of the system such as wetland bio-diversity and the productivity of the
greater Chao Phraya river system.
5. Conclusions
A water balance model for the Bung Boraphet reservoir was developed from daily measurements
over three annual inflow outflow cycles and used to prepare a reservoir water budget. There were no
system wide floods during this study and monsoon derived surface water inflow from the local
catchment was the dominant inflow term. A basin wide flood inundated the floodplain in the wet
season of 2002, immediately before this study commenced, and that flood contributed to groundwater
flows into the reservoir in 2003.
Evaporation was the biggest overall loss term. In two of the flow cycles evaporative loss was
~86 x 106 m3. The outflow period of the 2004–2005 cycle was very long and evaporation reached
137 x 106 m3, which contributed to the extreme drawdown of the reservoir. Most of the irrigation
extraction was gauged in each drawdown cycle (Outflow type 1) but in late drawdown the extraction
had to be estimated by statistical analysis of the daily residual (Outflow type 2). The outflow for
irrigation was the second largest loss term in the budget and averaged 76 x 106 m3/cycle. Seepage was
the smallest loss term. The direction and the magnitude of seepage flow were influenced by the extent
and duration of the flood and there were net gains from seepage into the reservoir in some flow
periods.
The uncertainty in total volume due to measurement was ±40 x 106 m3 (1 standard deviation). This
uncertainty would be reduced by improving the precision of the water level measurement and by
establishing a new evaporation measurement station to closer to the reservoir.
Demand modeling showed that irrigation demand in the Bung Boraphet catchment exceeded the
reservoir storage capacity and the catchment water yield in the dry season. Future management plans
should focus on balancing the consumptive water needs with the hydrological requirements of the
reservoir fishery and the requirement to sustain a diverse and productive wetland. The differing eco-
hydrological requirements of the fishery and the wetland need to be better understood to reconcile
existing management practices with sustainable use in future.
Water balance models are a scientific way of identifying the relative contribution of different
components of the water budget. Water budgets are an important step in matching the available

Water 2009, 1
76
resource with the hydrological requirements of different uses. This study has highlighted evaporation
as the biggest contributor to water loss from the Bung Boraphet reservoir. The significance of
evaporative loss should not be overlooked, when allocating Nan River water for dry season irrigation
use within the Chao Phraya basin.
Acknowledgements
The authors gratefully acknowledge the Kasetsart University Research and Development Institute
and Ramsar Small Grants Fund for financially supporting this research. We also would like to thank
Mahidol University for financial support for the second author to carry out his PhD study. We wish to
thank the Department of Fisheries and Thai Meteorological Department (TMD) for providing useful
information for the water balance calculations. We are grateful to the many national and local
government officers and people of Nakhon Sawan Province for their past support and their continuing
interest and help. We also thank Nimal Chandrasena for his support and advice and last but by no
means least, we are grateful to three anonymous reviewers whose critique helped us to improve the
style and the content of the paper.
References
1. Talling, J.F. Environmental controls on the functioning of shallow tropical lakes. Hydrobiologia
2001, 458, 1–8.
2. ONREPP The Biodiversity in Bung Boraphet Wetland; Office of Natural Resources and
Environmental Policy and Planning: Bangkok, Thailand, 2002.
3. Surakit, K. Integrated Water Resource Management For Bung Boraphet. Kasetsart University,
Bangkok, 2007.
4. Sriwongsitanon, N.; Surakit, K.; Hawkins, P.; Chandrasena, N. Decision Support Tools for Water
Resource Management: A Case Study of Bung Boraphet Wetland, Thailand. J. Develop. Sustain.
Agric. 2007, 2, 17–26.
5. Molle, F. Technical and institutional responses to basin closure in the Chao Phraya river basin,
Thailand. Wat. Int. 2004, 29, 70–80.
6. Pattanee, S. Challenges in Managing the Chao Phraya‘s Water. In Ninth International
Riversymposium, Brisbane City Council, Brisbane, Australia, 4-7 September 2006.
7. Phongpaichit, P., Why the decision-making process on big projects has to change. In Seminar on
Good Governance, Public Participation and Decision-making Process for Environmental
Protection, Institute of Social and Economic Policy, Bangkok, Thailand, 18–19 March 2000.
8. Molle, F.; Floch, P. Megaprojects and Social and Environmental Changes: The Case of the Thai
“Water Grid”. Ambio 2008, 37, 199.
9. RID Final Report; Royal Irrigation Department: Bangkok, Thailand, 2003.
10. DWR The Feasibility Study, Survey and Detailed Design for Water Network System for Bung
Boraphet, Nakhon Sawan; Department of Water Resources: Bangkok, Thailand, 2007.
11. Mansell, R.S.; Bloom, S.A.; Sun, G. A model for wetland hydrology: description and validation.
Soil Sci. 2000, 384–397.

Water 2009, 1
77
12. Boone, R.; Johnson, C.; Johnson, L. Simulating Vernal Pool Hydrology In Central Minnesota,
USA. Wetlands 2006, 26, 581–592.
13. Hamilton, S.K.; Lewis, W.M., Jr. Causes of seasonality in the chemistry of a lake on the Orinoco
River floodplain, Venezuela. Limnol. Oceanogr. 1987, 32, 1277–1290.
14. Bonnet, M.P.; Barroux, G.; Martinez, J.M.; Seyler, F.; Moreira-Turcq, P.; Cochonneau, G.;
Melack, J.M.; Boaventura, G.; Maurice-Bourgoin, L.; León, J.G.; Roux, E.; Calmant, S.; Kosuth,
P.; Guyoth, J.L.; Seyler., P. Floodplain hydrology in an Amazon floodplain lake (Lago Grande de
Curuai). J. Hydrol. 2008, 349, 18–30.
15. Takeuchi, K. Analyses of the flow regime of the Chao Phraya River. In Hydrology of Warm
Humid Regions, Proceedings of the Yokohama Symposium, Yokohama, Japan, July 1993;
International Association of Hydrological Sciences: Paris, France, 1993; Vol. 216, pp 181-193.
16. Chow, V.T.; Maidment, D.; Mays, L. Applied Hydrology. McGraw-Hill: New York, NY, USA,
1988; p. 572.
17. Shuttleworth, W.J. In Evaporation; Maidment, D.R., Ed. McGraw-Hill: New York, NY, USA,
1993; pp. 4.1–4.53.
18. LaBaugh, J.W.; Winter, T.C. The impact of uncertainties in hydrologic measurement on
phosphorus budgets and empirical models for two Colorado reservoirs. Limnol. Oceanogr. 1984,
29, 322–339.
19. Krause, S.; Bronstert, A. An advanced approach for catchment delineation and water balance
modelling within wetlands and floodplains. Adv. Geosci. 2005, 5, 1–5.
20. Jensen, M.E. Consumptive Use of Water and Irrigation Water Requirement. American Society of
Civil Engineers: New York, NY, USA, 1973.
21. Chapra, S.C.; Canale, R.P. Numerical Methods for Engineers. McGraw-Hill Book Company: New
York, NY, USA, 2002.
22. Madsen, H. Automatic Calibration and Uncertainty Assessment in Rainfall-Runoff Modelling. In
Proceedings of Joint Conference on Water Resource Engineering and Water Resources Planning
and Management 2000, Minneapolis, MN, USA, 30 July–2 August 2000; Hotchkiss, R.H., Glade,
M., Eds.; ASCE: Reston, VA, USA; pp 1-10.
23. Krause, P.; Boyle, D.P.; Base, F. Comparison of different efficiency criteria for hydrological
model Assessment. Adv. Geosci. 2005, 5, 89–97.
24. Vudhivanich, V.; Pajongkitkran, S.; Bunpian, A.; Cherdchanpipat, N. Irrigation Efficiency of the
Greater Chao Phraya and the Greater Mae Klong Irrigation Projects. Kasetsart J.: Nat. Sci. 2002,
36, 110-118
25. Rosenberry, D.O.; Winter, T.C.; Buso, D.C.; Likens, G.E. Comparison of 15 evaporation models
applied to a small mountain lake in the northeastern USA. J. Hydrol 2007, 340, 149–166.
26. Vadervas, M.; Fountoulakis, A., Estimation of lake evaporation from standard meteorological
measurements: application to four Australian lakes in different climatic regions. Ecol. Model.
1996, 84, 139–150.
27. Vallet-Coulomb, C.; Legessea, D.; Gassea, F.; Travic, Y.; Chernet, T. Lake evaporation estimates
in tropical Africa (Lake Ziway, Ethiopia). J. Hydrol. 2001, 245, 1–18.

Water 2009, 1
78
28. Rosenberry, D.O.; Stannard, D.I.; Winter, T.C.; Martinez, M.L. Comparison of 13 equations for
determining evapotranspiration from a prairie wetland, Cottonwood Lake area, North Dakota,
USA. Wetlands 2004, 24, 483–497.
29. Lesack, L. Seepage Exchange in an Amazon Floodplain Lake. Limnol. Oceanogr. 1995, 40, 598–
609.
30. Kingsford, R.T.; Jenkins, K.M.; Porter, J.L. Imposed Hydrological Stability On Lakes In Arid
Australia And Effects On Waterbirds. Ecology 2004, 85, 2478–2492.
31. Halls, A.S.; Lieng, S.; Ngor, P.; Tun, P. New research reveals ecological insights into dai fishery.
Catch and Culture, June 2008, pp. 8-12.
32. Sutcliffe, J.V.; Parks, Y.P. Comparative water balances of selected African wetlands. Hydrol. Sci.
1989, 34, 49–62.
33. Samma, A. Inland Fisheries Administration, Thai Department of Fisheries, Bangkok, Thailand.
Personal Communication, 2005.
34. Thai Fisheries Department, Bangkok, Thailand. Personal Communication, 2006.
35. King, J.; Brown, C., Environmental flows: striking the balance between development and resource
protection. Ecol. Society 2006, 11, 26.
Appendices
Rating curve information and staff gauge location.
Inflow Rating Curve Outflow Type 1 Rating Curve
Location Type n Q R Range Type n Q R Range
K. Bon† channel 18 0.044 H 35 0.91 23.2-24.2 Pumped 14 0.044 H 46 0.94 22.0-22.8
K. Tatako channel 26 0.046 H 37 0.90 22.3-24.1 Pumped 15 0.044 H 61 0.81 21.8-22.8
K. Tatako overbank 13 0.043 H 41 0.90 24.2-25.0 NA
Irrigation 1 channel 19 0.042 H 66 0.65 23.1-24.4 Pumped 6 0.043 H 31 0.81 22.0-22.7
Irrigation 2 channel 17 0.042 H 48 0.94 23.2-24.1 Pumped 10 0.042 H 45 0.90 22.5-22.8
Weir NA NA Gravity 7 0.043 H 143 0.99 NA
Nan Regulator NA NA Gravity 7 0.043 H 133 0.89 NA
Note: Q is discharge in m3 s-1; H is stage height in metres (MSL); R is the correlation coefficient; and Range is the stage
range of the flow measurements used to construct the curve. NA – not applicable.
† The inflow rating curve for K. Bon was not calibrated for flows > 24.2 m. Although these were rare, the error in the
inflow estimates would be higher at that time.

Water 2009, 1
79
Volume of water represented by the measurement error in each component of the water budget
over three complete water cycles.
© 2009 by the authors; licensee Molecular Diversity Preservation International, Basel, Switzerland. This article is an open-access article distributed under the terms and conditions of the Creative Commons Attribution license (http://creativecommons.org/licenses/by/3.0/).
Copyright © 2022 FDOKUMEN