Ornamental plants for micropollutant removal in wetland systems
Upload
khangminh22Category
view
1download
0
ADDIS ABABA UNIVERSITY
COLLEGE OF NATURAL SCIENCES
SCHOOL OF GRADUATE STUDIES
ENVIRONMENTAL SCIENCE PROGRAM
AW
Evaluation of Selected Wetland Plants for the Removal Efficiency of
Chromium and Organic Pollutants from Tannery Wastewater in
Constructed Wetlands at Modjo Tannery
By
Tadesse Alemu
September 2010
Addis Ababa
i

Evaluation of Selected Wetland Plants for the Removal Efficiency of
Chromium and Organic Pollutants from Tannery Wastewater in
Constructed Wetlands at Modjo Tannery
By Tadesse Alemu
The Thesis Submitted to the School of Graduate Studies of Addis Ababa University in Partial Fulfillment of the Requirement for the Degree of
Masters of Science in Environmental Sciences
Department of Environmental Sciences Addis Ababa University
September, 2010 Addis Ababa
ii

DECLARATION This thesis is my original work; it has not been presented in this and any other University. All
sources of materials used in this thesis work have been duly acknowledged.
Name: Tadesse Alemu
Signature: ________
iii
Evaluation of Selected Wetland Plants for the Removal Efficiency of
Chromium and Organic Pollutants from Tannery Wastewater in
Constructed Wetlands at Modjo Tannery
By Tadesse Alemu
Approved by board of examiners Name Signature Dr. Satiskumar Belliethathan _______________ (Chairman) Dr. Seyoum Leta ________________ (Advisor) Dr. Mekibib Dawit (Internal Examiner) ________________ Dr. Fassil Asefa _________________ (External Examiner)
iv

Acknowledgments
I would like to express my sincere gratitude and appreciation to my research advisor Dr. Seyoum Leta, for his technical support, guidance, kindness and encouragement starting from title selection, final proposal formulation and proposal implementation throughout this study. I also would like thank BIO-EARN for providing financial support that enabled me to perform the hard tasks related with construction of wetlands and chemical analysis fee in a sound way. My sincere thank also go to Modjo Tannery for allowing me to perform all activities of the study.
My appreciation and special thanks also extends to Mr. Chrisogan Paschal for his assistance in data collection, letting me to do my research in his project, correcting papers, helping in analyzing data, valuable advice, technical support as well as his encouragement and contribution to make my study become reality.
I also would like thank all AAU community in general and Environmental Science in particular for allowing me to continue my education and providing me partial financial support for the thesis project. Special thanks also goes to EPA lab workers for their good will in any assistance.
Special thanks and deepest appreciation goes to my intimate friend Fenta Minas, and Hana H/Mariam for their advice, material supplements and assisting in editing the research paper.
I also provide special thanks to Ato Workineh Mihirete, Mr. Silesh Workineh, and their family for providing financial support and encouragement from starting my education up to the fulfillment of this research paper.
Finally, I would like to express my great appreciation to my wife Mulusew Workneh for her contribution in writing and editing the thesis and my families for their love close follow up my work and education since the beginnings up to the end of my education career.
v

Table of Contents Page Acknowledgments .................................................................................................................... i Table of Contents .................................................................................................................... ii List of Tables .......................................................................................................................... iv List of Figures.......................................................................................................................... v Acronyms................................................................................................................................. x Abstract.................................................................................................................................. vii
CHAPTER ONE INTRODUCTION................................................................................................................... 1
1.1 Background and Justification.......................................................................................... 1 1.3 Statement of the problem................................................................................................ 3 1.4 Objectives of the Study................................................................................................... 4
1.4.1 General objective ..................................................................................................... 4 1.4.2 Specific objectives ................................................................................................... 4
CHAPTER TWO LITERATURE REVIEW ...................................................................................................... 5
2.1 Tanning and Characteristics of Tannery Wastewater ..................................................... 5 2.2. The Source of Chromium in Tannery Wastewater ........................................................ 6 2.3 Chemistry of Chromium ................................................................................................. 6 2.4 Environmental Impacts of Chromium ............................................................................ 7
2.4.1 Toxicity of Chromium ............................................................................................. 8 2.5 Treatment Methods of Tannery Wastewater................................................................... 9
2.5.1 Physico-chemical methods………………………………………………………...9 2.5.2 Biological treatment methods ................................................................................ 10
2.5.2.1 Trickling filter ……………………………………………………………..…10 2.5.2.2 Activated sludge……………………………………………………………...10 2.5.2.3 Sequencing Batch reactor……………………………………………………11 2.5.2.4 Phytoextraction ……………………………………………………………...11
2.5.3 Constructed Wetland Technology.......................................................................... 12 2.5.3.1 Surface flow (SF) wetland ………...……………………………….………..14 2.5.3.2 Subsurface flow (SSF) wetland ……………………………………………..15
2.6 Mechanisms of Pollutant Removal and Transformations in Wetlands......................... 17 2.7. Role of Plants in Constructed Wetland........................................................................ 18
2.7.1. Translocation and Uptake of Cr by Plant.............................................................. 19 2.7. 2. Hyper Accumulating and High Biomass Tree Species........................................ 20 2.7.3 Anaerobic Condition Tolerance of Plant ............................................................... 20
2.8. Selection of Phytoextractor Wetland Plants ................................................................ 21 2.8.1 Characteristics of Selected Wetland Plant Species................................................ 22
vi

CHAPTER THREE MATERIALS AND METHODS ......................................................................................... 24
3.1 Description of the Study Area....................................................................................... 24 3.2. Design and Pilot Constructed Wetland Establishment ................................................ 25 3.3. Plant Selection and Experimental Start-up .................................................................. 26 3.4. Sample Collection and Analysis .................................................................................. 29
3.4.1 Wastewater samples collation and analysis ........................................................... 29 3.4.2 Plant sample preparation........................................................................................ 29 3.4.3 Plant sample analysis ............................................................................................. 30 3.4.4 Gravel analysis....................................................................................................... 30 3.4.4 Soil sample collection and analysis ....................................................................... 31
3.5. Statistical Data Analysis .............................................................................................. 31 CHAPTER FOUR RESULTS AND DISCUSSION ........................................................................................... 32
4.1. Influent Wastewater Characteristics ............................................................................ 32 4.2. Plant growth................................................................................................................. 33
4.2.1 Plant root development .......................................................................................... 33 4.3. COD and BOD removal............................................................................................... 34 4.4. Nitrogen and Sulfur Removal ...................................................................................... 36
4.4.1 Nitrogen removal ................................................................................................... 36 4.4.2 Sulfur removal ....................................................................................................... 37
4.5 Chromium Removal Efficiency of Constructed Wetlands ........................................... 39 4.6 Chromium Partitioning in Wetlands ............................................................................. 40
4.6.1 Chromium adsorption on clay mineral .................................................................. 41 4.7 Chromium Accumulation in Plant Tissues ................................................................... 42
4.7.1 Comparison of chromium accumulation in roots of different plants..................... 43 4.7.2. Chromium accumulation in roots compared with stems....................................... 44 4.7.3. Chromium accumulation in stems compared with leaves..................................... 44
4.8. Selection of Potential Chromium Phytoextractor Plant ............................................... 45 4.8.1 Chromium Bioaccumulation Factor (BAF)............................................................ 45 4.8.2 Chromium Translocation Factor (TF).................................................................... 46
4.9. Chromium Tolerance of the Selected Plant Species .................................................... 47
CHAPTER FIVE CONCLUSIONS AND RECOMENDATIONS ................................................................. 49
5.1. Conclusions.................................................................................................................. 49 5.2. Recommendation ......................................................................................................... 50
References Annex
vii
List of Tables
Table 4.1 Percentage ratio used to dilute the Wastewater with tap water ................26
Table 4.1 Mean Composition of Influent Tannery Wastewater ...............................32
Table 4.2 Root Length of Selected Plants in CWs.....................................................33
Table 4.3 Average effluent Nitrogen concentrations (mg/L) and removal efficiency…………………………………………………..36
Table 4.4 Average effluent sulfate and sulfide concentrations (mg/L) and removal efficiency ……….……………………………………………..37
Table 4.5 Percentage of Chromium Partitioning in CWs …………………………. 41
Table 4.6 Average Cr concentrations in selected plants tissues (in mg/kg) ............43
Table 4.7 Calculated Values of Bioaccumulation Factor (BAF) ..............................45
Table 4.8 Chromium Translocation factors (TF)..............................................…… 46
viii

List of Figures Figure 2.1 Surface Flow (SW) Wetland ...........................................................14
Figure 2.2 Subsurface Flow (SSF) Wetland .....................................................15
Figure 2.3 Translocation and Uptake of Cr in Plant Tissues ............................19
Figure 3.1 Map of the Study Area (Lume Woreda) ..........................................24
Figure 3.2 Constructed Wetland Experimental Setup.......................................25
Figure 3.3 Plates Showing the Different Phases of Construction
and Transplantation in CWs.............................................................28
Figure 3.4 Plate Showing Inlet and Outlet piping; the Growth of
Selected Plant Species in CWs ..............................................................28
Figure 4.1 BOD and COD Removal Efficiency in CWs ..................................34
Figure 4.2 Chromium Removal Efficiency of CWs .........................................39
Figure 4.3 Chromium Adsorbed on Clay Soil ..................................................41
ix

Acronyms APHA American public health Association BOD Biological Oxygen Demand BAF Chromium Bioaccumulation Factor COD Chemical Oxygen Demand Cr Chromium CW Constructed Wetland DW Dry weight EEPA Ethiopian Environmental Protection Authority FWS Free water Surface flow g Gram GTZ Germen Agency for Technical cooperation HRT Hydraulic Retention Time ITRC Interstate Technology and Regulatory Council kg Kilo gram L Liter mg Milligram ml Milliliter NADP Nicotinamide di-nucleotide phosphate Ni Nickel PPM Parts per million PVC Polyvinylchloride (plastic pipe) SF Surface Flow SSF Sub Surface Flow TF Translocation Factor TN Total Nitrogen UNIDO United Nations Industrial Development Organization. USEPA United States Environmental Protection Authority USPHS United States Public Health VSB- Vegetated Submerged bed µm Micro Meter
x
Abstract
Wastewater from leather processing industries is very complex and leads to water pollution if discharged untreated, especially due to its high organic loading and chromium content. In this study the phytoremediation efficiency of selected wetland plant species in subsurface flow (SSF) constructed wetlands receiving tannery wastewater was investigated. Four pilot units were vegetated with C. alternifolius, T. domingensis, P. Karaka and B. aethiopium and a fifth unit was left as unvegetated (control). The treatment performance of the systems for total Cr, COD, BOD and nutrients under a 5 day hydraulic retention time were analyzed based on HACH manual. The Cr in the plant tissue was analyzed through oven dried plant tissue, milled, weighed, digested and analyzed using Atomic Absorption Spectrophotometer (AAS.) The wastewater analysis showed that Cr in the effluent was reduced up to 99.3 % for an inlet average Cr loading rate of 40 mg/L, COD was reduced by 56-80% for an inlet organic loading varying between 2202 and 8100mg/L and BOD5 was reduced by 66-77% for an inlet organic loading varying between 650 and 1950 mg/L. Nitrate removal ranges from 30% to 57% and ammonia-nitrogen removal ranges from 53% to 82%. P. karake and B. aethiopium were the plants that establish successfully and show higher BOD5, COD and nutrient removal. Despite the high removal of Cr from the influent wastewater, no significant differences in performance were observed between CW units. Plant analysis showed that Roots accumulate significantly higher Cr in all plant species compared with shoots. Roots of T. domingensis showed a high Cr accumulation capability per gram of dry weight (1848 mg/kg DW) followed by C. alteroifolius (1472mg/kg DW), B. aethiopium (180.9 mg/kg DW) and P. Karaka (62.24 mg/kg DW) and B. aethiopium and P. karaka shows higher Cr translocation factor. Constructed wetlands are cost effective and environmentally friendly treatment methods hence can be used us an alternative treatment method in developing countries.
Keywords: Constructed wetland; SSF, Tannery wastewater treatment, Chromium uptake,
Translocation factor and Chromium bioaccumulation factor
xi

CHAPTER ONE
INTRODUCTION
1.1 Background and Justification
In Ethiopia industrial wastewater has become one of the most serious problems because of
the increase in discharge of untreated effluent to the environment. Many industries fail to
afford investments in pollution remediation equipment and technologies, because their profit
margin is very low (EPA, 1997). High level of pollutants which are discharged into rivers
pose severe problems for plant, animal and human health due to their toxicity and persistence
in the environment. (Zinabu and Zerihun, 2002).
Leather tanning has been ranked as one of the most polluting activities in Ethiopia due to the
high growth rate and availability of livestock skins and hides (EEPA, 2003). There are more
than 20 tanning industries of which 90% of them directly discharge wastewater into nearby
surface water or onto open land without treatment (Seyoum Leta et al., 2004).
The transformation of raw or semi-pickled skins into commercial products requires high
water consumption, roughly 50-150 liters and about 300 kg chemicals are added per ton of
hides (Infogate/GTZ, 2002; Anthony, 1997). The major chemicals used in the various
processing stages include chromium salts, sulfate, sodium sulfide, lime powder, ammonium
sulfate, sodium chloride, sulfuric acid, sulphonated and sulfated oils, formaldehyde,
pigments, dyes and anti-fungal agents. These chemicals in tannery effluents cause the highest
toxic intensity per unit of output (Khan, 2001). Chrome tanning is favored by the majority of
leather industry than vegetable tanning because of the speed of processing, low cost,
flexibility and greater stability of the leather (Hafez et al., 2002).
Chromium is one of the most toxic heavy metals to both plants and aquatic organisms.
Uptake of the chromium into the leather is not complete and relatively large amounts are
found in the effluent; estimated range, from 2,000 – 3,000 mg dm-3 (Bajza and Vrcek, 2001)
to 3 –350 mg dm-3 (Vlyssides and Israilides, 1997) and 12mg/L to 64 mg/L (Seyoum Leta et
al., 2004).
1
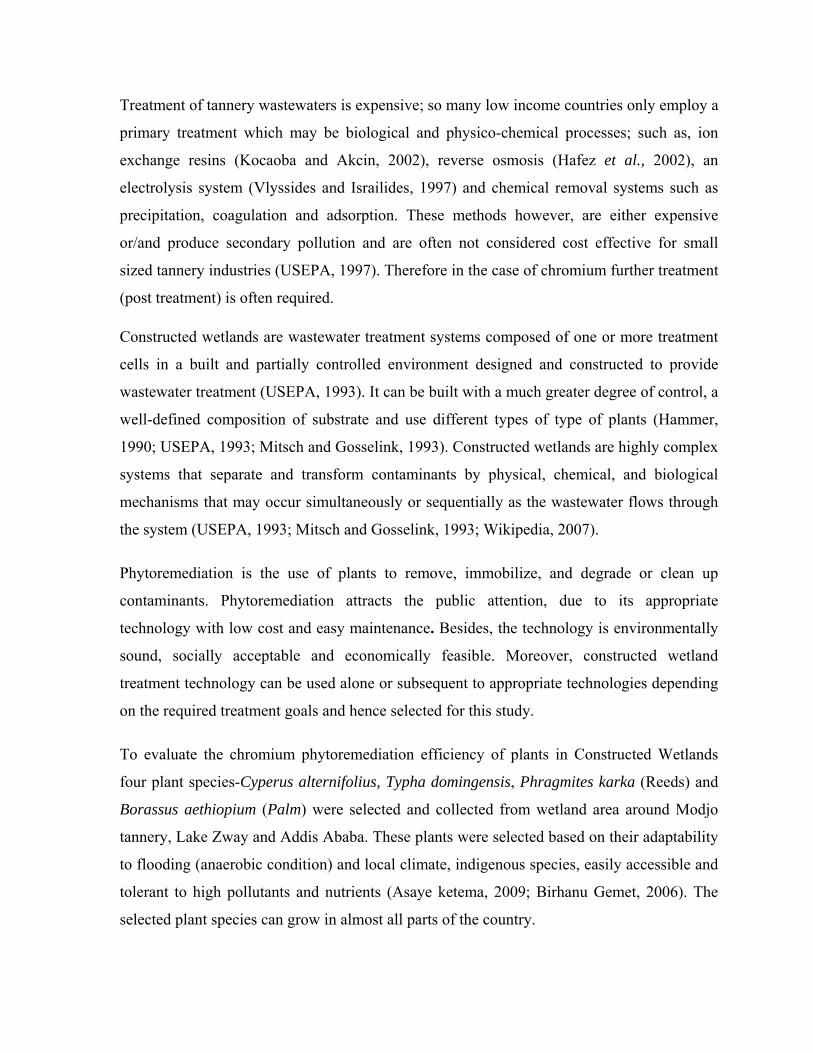
Treatment of tannery wastewaters is expensive; so many low income countries only employ a
primary treatment which may be biological and physico-chemical processes; such as, ion
exchange resins (Kocaoba and Akcin, 2002), reverse osmosis (Hafez et al., 2002), an
electrolysis system (Vlyssides and Israilides, 1997) and chemical removal systems such as
precipitation, coagulation and adsorption. These methods however, are either expensive
or/and produce secondary pollution and are often not considered cost effective for small
sized tannery industries (USEPA, 1997). Therefore in the case of chromium further treatment
(post treatment) is often required.
Constructed wetlands are wastewater treatment systems composed of one or more treatment
cells in a built and partially controlled environment designed and constructed to provide
wastewater treatment (USEPA, 1993). It can be built with a much greater degree of control, a
well-defined composition of substrate and use different types of type of plants (Hammer,
1990; USEPA, 1993; Mitsch and Gosselink, 1993). Constructed wetlands are highly complex
systems that separate and transform contaminants by physical, chemical, and biological
mechanisms that may occur simultaneously or sequentially as the wastewater flows through
the system (USEPA, 1993; Mitsch and Gosselink, 1993; Wikipedia, 2007).
Phytoremediation is the use of plants to remove, immobilize, and degrade or clean up
contaminants. Phytoremediation attracts the public attention, due to its appropriate
technology with low cost and easy maintenance. Besides, the technology is environmentally
sound, socially acceptable and economically feasible. Moreover, constructed wetland
treatment technology can be used alone or subsequent to appropriate technologies depending
on the required treatment goals and hence selected for this study.
To evaluate the chromium phytoremediation efficiency of plants in Constructed Wetlands
four plant species-Cyperus alternifolius, Typha domingensis, Phragmites karka (Reeds) and
Borassus aethiopium (Palm) were selected and collected from wetland area around Modjo
tannery, Lake Zway and Addis Ababa. These plants were selected based on their adaptability
to flooding (anaerobic condition) and local climate, indigenous species, easily accessible and
tolerant to high pollutants and nutrients (Asaye ketema, 2009; Birhanu Gemet, 2006). The
selected plant species can grow in almost all parts of the country.
2
Although, study on selected plant species for the removal of selected pollutants including
chromium from tannery wastewater treatment using constructed wetland system was
conducted by Asaye Ketema (2009); information on the rate and efficiency of these plants in
absorbing chromium is lacking. Therefore, these study aims at evaluating the potential of
wetlands for the treatment of chromium rich tannery effluent and the efficiency of selected
plants in a constructed wetland system for chromium removal.
1.3 Statement of the problem The high tannery industrial growth coupled with lack of technology for efficient effluent
treatment and unimplemented or/and lack of effluent discharge standards/ policies/ lead to
serious consequences for rivers receiving tannery effluents from Modjo Tannery. These
causes increased pressure on ecology, health and environmental resources.
Tannery effluents contain large amount of chromium and in Ethiopia are above the
permissible standards (Seyoum Leta et al., 2004; Asaye ketema, 2009). The chromium is one
of the most toxic metals to plants, animals and microorganisms. Even in low concentrations,
it has a toxic effect upon aquatic biota such as fish and disrupting the food chain, causes soil
salinity in irrigated farmland and possibly affecting aquatic organisms, like in Modjo River.
These adverse effects require effluent treatment of chromium-rich wastewater before
discharging into the rivers. However, treatment of tannery chromium-rich effluents by
primary treatment systems such as; biological, oxidation or physico-chemical processes still
leaves chromium levels in the treated wastewater above the legal discharge limit for surfaces
waters (Alves et al., 1993, Asaye Ketema, 2009). Hence, further treatment (post treatment) is
often required for chromium removal.
3
1.4 Objectives of the Study
1.4.1 General Objective The main objective of the study is to evaluate the efficiency of selected wetland plant species
for the removal of chromium and related pollutants from tannery wastewater using
constructed wetlands.
1.4.2 Specific objectives
i) To evaluate the efficiency of constructed wetland system for the treatment of tannery
effluent laden with Cr, COD, BOD, and nutrients.
ii) To evaluate chromium uptake capability of selected plant types used in the
constructed wetland systems.
4
CHAPTER TWO
LITERATURE REVIEW
2.1 Tanning and Characteristics of Tannery Wastewater
Tanning is a process by which putrefable biological material, such as leather, is converted
into a stable material which is resistant to microbial attack and has enhanced to wet and dry
heat. Tanning consists of a series of successive operation converting raw hide and skin into
leather. During the tanning process at least about 300 kg chemicals are added per ton of hides
(Anthony, 1997). The uncontrolled release of tannery effluents to natural water bodies
increases health risks for human beings and environmental pollution.
The production process in a tannery can be split into four main categories, namely, beam
house, tanning (tan-yard), post-tanning and finishing operation. The beam-house is a source
of an important pollutant charge, not only with respect to the organic matter but also with
respect to solid materials and sulfide (Jochimsen & Jekel, 1997). Effluents from tanyard are
the highest source of N-NH4+, SO4
–2 and Cr in the wastewaters, the COD content also being
very relevant in these streams ranging from 1.1to 15g COD/L) (Jochimsen & Jekel, 1997;
Infogate/GTZ, 2002).
The characteristics of the wastewater vary considerably from tannery to tannery depending
upon the size of the tannery, chemicals used for the specific process, amount of water used,
type of final product produced by a tannery and technology advancement. According to
Seyoum et al. (2004), a composite tannery wastewater has BOD5 (1900 - 4800 mg/L), COD
(7900 - 15200 mg/l), sulfide (325 - 930 mg/l) and total chromium (12 - 64 mg/l).
Another study in Pakistan also indicated BOD5 (840 - 18620 mg/L), COD (1320 – 5400
mg/L), TN (236 - 350 m/L), sulfate (800 - 6480 mg/L), sulfide (800 - 6480 mg/L) and
chromium (41-133 mg/L) (Haydar et al., 2007). A study conducted by Asaye Ketema (2009)
the average BOD5, COD and TSS of the influent of modjo tannery were 2505 ± 134.3 mg/L,
4647 ± 168.7 mg/L and 94 ± 1.5 mg/L, respectively.
5

Effluents from these raw hide processing tanneries, which produce wet blue, crust leather
or/and finished leather, contain compounds of trivalent chromium (Cr) high BOD and
sulfides in most cases. Chromium compounds are not biodegradable. It can thus be regarded
as long-term environmental impacts. Since Cr can also have accumulative properties, it
becomes the subject of close attention (Peter and Grvatt, 1998) and emphasis of this study.
2.2. The Source of Chromium in Tannery Wastewater
The use of chromium (Cr) in chrome tanning, plating, paints, corrosion inhibitors, reinforced
steel, textiles, and fungicides contribute to Cr discharge in the environment. However, the
tanning industry is one of the major contributors of Cr pollution in many water resources
(Palmer and Wittbrodt, 1991).
Tannery wastewater is characterized by being strongly alkaline with a high salt content, one
of which is chromium (Bajza and Vreck, 2001). The present chrome tanning practice only
50 - 60 % of chromium applied is taken by the leather and the balance is discharged as waste
(Rajamanickam, 2000). This chromium was produced from the tanning operation. Two forms
of chrome associated with the tanning industry are trivalent and hexavalent.
Trivalent chromium is mainly found in waste from the chrome tanning process; it occurs as
part of the re-tanning system and is displaced from leathers during re-tanning and dyeing
process. This chrome is discharged from processes in soluble form; however, when mixed
with tannery wastewaters from other processes, if proteins are present, the reaction is very
rapid. Precipitates are formed, mainly protein-chrome, which add to sludge generation.
Tannery effluents are unlikely to contain hexavalent chromium (Perk, 2006). Dichromates
are toxic to fish life since they swiftly penetrate cell walls. They are mainly absorbed through
the gills and the effect is accumulative (Perk, 2006).
2.3 Chemistry of Chromium Chromium is a heavy metal, symbolically represented by Cr, with atomic number of 24, and
mass number of 51.9961. It belongs to the first series of transition metals. It is the 17th most
abundant element in the earth's crust. Chromium occurs naturally in ultramafic igneous
rocks, soil, plants, animals, and in volcanic dust and gases. It may occur in nine different
6

forms of oxidation state ranging from Cr (-II) up to Cr (+VI), but the two common valence
states are trivalent Cr (III), the most stable, and hexavalent Cr (VI) which is not
thermodynamically stable. Solubility of chromium (III) depends on pH; decreases
dramatically at pH value greater than 4.5. Cr (III) can form stable complexes with organic
legends at pH value as high as 8.5 (Perk, 2006).
During the tanning process only Cr (III) salts are used. Nevertheless, under certain
prevailing conditions, the Cr (III) can be transformed into Cr (VI). Also, the conversion of
Cr (VI) to Cr (III) occurs readily by a variety of reducing agents in water and soil, but a few
oxidants in natural water can oxidize Cr (III) to Cr (VI). Cr (VI) is known human carcinogen,
where as Cr (III) is less toxic. Chromate is toxic to both plants and animals and strong
oxidizing agent and corrosive in nature (USPHS, 1997).
2.4 Environmental Impacts of Chromium In pursuit of a better life, industrialization is growing day by day leaving behind the
pollutants in the environment. Since most heavy metals are non-degradable and may lead to
toxic end products, their concentrations must be reduced to acceptable levels before
discharging them into the environment. Otherwise these could pose threat to public health
and affect the quality of natural water bodies. The metals of most immediate concern are
chromium, zinc, mercury and lead (Masud et al., 2001).
Cr (VI) compounds are responsible for the majority of the health problems. If chrome
discharges are excessive, the chromium might remain in the solution. Even in low
concentrations, it has a toxic effect upon aquatic life, thus disrupting the food chain for
aquatic life. It also causes underground water pollution (Perk, 2006). Chromium in soils
affects plant growth, it is non-essential for microorganisms and other life forms and when in
excess amounts it exerts toxic effect on them after cellular uptake (Singanan, et al., 2007).
7
2.4.1 Toxicity of Chromium
Chromium has a ‘chronic’ toxic effect upon aquatic life (UNIDO, 2000). Dichromates are
toxic to fish life since they rapidly penetrate cell walls. They are mainly absorbed through the
gills and the effect is accumulative.
Concentration of chromium in natural water that has not been affected by waste disposal is
commonly ranges from 0.1-0.6 μg/mL (Perk, 2006). The WHO standard for the acceptable
amount of Chromium in drinking water is 0.05 mg/L and 0.2mg/L in river water. The EEPA
standard for the acceptable amount of Chromium in industrial wastewater effluent is 2 mg/L.
Average daily intake of 50-200 μg/day of Cr (III) is safe and adequate for adults (USPHS,
1997). Cr (III) is an essential nutrient, required for normal energy metabolisms in animals
(Perk, 2006). However the consumption of contaminated fish, other foodstuffs and drinking
water could increase the daily intake levels far beyond those recommended levels.
Ingesting small amounts of Cr (both Cr +3 and Cr +6 forms) will generally not harm, however
ingesting above recommended levels over long periods of time can result in adverse health
effects including gastro-intestinal irritation, stomach ulcers, heart burning, respiratory tract
infection, sever cough, fever and loss of eyesight. Lung cancer and kidney failure were the
reported causes of death in many cases (USPHS, 1997, Infogate/GTZ, 2002, and Perk, 2006).
Skin contact may result in systemic poisoning, damage or even severe burns, interference
with the healing of cut or scrapes which, if not treated properly, may lead to ulceration and
severe chronic allergies. Eye exposure may cause permanent damage. In general, Cr (VI) is
more toxic, more soluble, more mobile and hence absorbed into cells more readily than Cr
(III) (James, 1996). This chromium can replace other metals in biological systems with toxic
effects and its accumulation throughout the food chain leads to serious ecological and health
problems (UNIDO, 2000).
Investigations have been performed on fish under conditions of exposure insufficient to cause
severe toxicity, yet sufficient to cause visible changes in behaviour at a dosages of 0.2 mg/L.
It is understood however, that daphnia are even more susceptible at this dosage, thus posing a
potential hazard to the food chain for fish (USPHS, 1997).
8
Chromium is also toxic to agronomic plants at about 5 to 100 μg/g of available Cr in the soil
(Perk, 2006). Plants absorb Cr (VI) better than Cr (III); whereas Cr (VI) is more toxic. Plant
growth studies of solution cultures with low levels of Cr have indicated that Cr is not an
essential component of plant nutrition (Huffman and Alloway, 1973). Although some crops
are not affected by low concentration of Cr, it is toxic at high concentration or may reduce
yield. Skiffington, et al. (1976) observed that barely crops could tolerate a Cr levels up to 5
mg/L but a 75 % yield reduction was observed. Higher application of chromium to the plant
soil growing media brought poor quality and poor growth of the seedlings Mehari Alebachew
(2006).
2.5 Treatment Methods of Tannery Wastewater
Treatment of tannery effluent is a challenge because it is a mixture of biogenic matter of
hides, inorganic chemicals and a large variety of organic pollutant. Chromium and organic
matter removal methods are physicochemical and Biological.
2.5.1 Physico-chemical methods
Physico-chemical methods include precipitation, coagulation/flocculation, adsorption,
membrane filtration, ion exchange, advanced oxidation etc. Mostly, chemical precipitation
methods are practiced for the removal of chromium and organic matter, but it has the
disadvantage of producing secondary byproducts (USEPA, 1999).
Conventional treatment methods for removal of chromium and organic matter are simple in
principle; however, they are expensive (high operating and maintenance cost, and
consumption of chemicals) and also may produced harmful secondary products such as
chrome-bearing solid wastes. Using precipitation method there is 99% Cr removal, 85 - 90%
BOD removal and 60 - 70% removal if COD can be achieved (Kornaros and Lyberatos,
2006).
9
2.5.2 Biological treatment methods Now a day, there is a growing interest in the development of new technologies and methods
for the purification of industrial waste. Among these methods, biological methods have been
recognized as a viable possibility for the degradation of these wastewaters (Delpozo and
Diez, 2003).
In biological treatment, microorganisms convert metals and organic wastes into stabilized
compounds. Typical biological treatment processes includes trickling filters, activated
sludge, Sequencing Batch Reactor (SBR) and Phytoremediation.
2.5.2.1 Trickling filter
The trickling or biological filter system involves a bed, which is formed by a layer of filter
medium held within a containing tank or vessel, often cast from concrete, and equipped with
a rotating dosing device over which the wastewater is gently sprayed by a rotating arm. The
filter is designed to permit good drainage and ventilation. In addition sedimentation and
settling tanks are generally associated with the system. The microbial growth occurs on the
subsurface of stone or plastic media and the wastewater passes over the media along with air
to provide oxygen (Evans and Furlong, 2003). Water needs to be trickled several times over
the rock before it is sufficiently cleaned. The wastewater percolates over the biofilm growing
on the carrier material to achieve a very high biofilm specific area. Using a trickling filter a
removal of 85 - 90% for BOD and 60 - 70% for COD can be achieved (Kornaros and
Lyberatos, 2006).
2.5.2.2 Activated sludge Activated sludge process is a continuous or semi-continuous flow system containing a mass
of activated microorganisms that are capable of stabilizing organic matter. This process
consists essentially of an aerobic treatment and consortia of microorganisms that oxidizes
organic matter to CO2, H2O, NH4, new cell biomass and other end products. It is the most
widely used biological treatment process because the recirculation of the biomass allows
microorganisms to adapt to changes in the wastewater composition by a relatively short
acclimation process (Doan and Lohi, 2001).
10
The unsettleable suspended solid and other constituents are adsorbed on or entrapped by the
activated sludge floc (sluge + microbial cells) (Cloete and Muyima, 1997). Metals like Cr can
also precipitate and removed together with the sludge. According to Haydar et al. (2007), a
BOD and COD removal of 90% and 80% respectively can be achieved using activated sludge
for tannery wastewater treatment
2.5.2.3 Sequencing Batch Reactor (SBR)
The sequencing batch reactor (SBR) is a fill and draw activated sludge system for wastewater
treatment using settling thank, anaerobic thank, aeration thank and equalizer thank. In this
system wastewater is added to a single batch reactor, treated to remove undesirable
components and then discharged. Sequencing batch reactors operate by a cycle of periods
consisting of fill, react, settle and decant. The duration, oxygen concentration and mixing in
these periods could be altered according to the needs of the particular treatment plant.
2.5.2.4 Phytoextraction
The remediation of chromium typically makes use of wetlands through the natural abilities of
certain plant species to remove or stabilize these chemicals by means of bioaccumulation,
phytoextraction, rhizofiltration or phytostabilisation. High removal efficiency for total Cr
(98%) can be achieved using wetlands for tannery wastewater treatment (Asaye Ketema,
2009).
The process of phytoextraction involves the uptake of metal contaminants from the water or
soil by the roots and their translocation into the above-ground regions of the plants involved.
Certain species, termed hyperaccumulators, have an innate ability to absorb exceptionally
large amounts of metals compared to most ordinary plants, typically 50–100 times as much
(Chaney et al., 1997, Brooks et al., 1998).
11

2.5.3 Constructed Wetland Technology
Constructed wetland is an artificial marsh or swamp, created for anthropogenic discharge
such as industrial wastewater, storm water runoff or sewage treatment, and as habitat for
wildlife, or for land reclamation after mining or other disturbance. Natural wetlands act as
bio-filter or “Kidney’s of Landscape”, removing sediments and pollutants such as heavy
metals from the water, and constructed wetlands can be designed to emulate these features
(Mitsch and Gosseline, 2000).
Constructed wetlands are wastewater treatment systems composed of one or more treatment
cells in a built and partially controlled environment designed and constructed to provide
wastewater treatment. It has been used to treat many types of wastewater at various levels of
treatment (USEPA, 1999). Hammer (1990) defines constructed wetland as a designed, man-
made complex of saturated substrate, emergent and submerged vegetation, animal life and
water that simulate wetland for human uses and benefits.
Studies on the feasibility of using wetland for wastewater treatment were initiated during the
early 1950’s in Germany. The first operating horizontal subsurface flow constructed wetland
was operating in 1974 (Kadlec and Knight, 1996). In the United State, wastewater- to-
wetland research began in the late 1960’s and increased dramatically in scope during the
1970’s. As a result, the use of wetlands for water and wastewater treatment has gained
considerable popularity worldwide (Joseph, 2005).
Though, a better understanding of the benefit that wetlands provide has led to the use of
constructed wetlands to mimic the filtration process that takes place in the fragile ecosystem
of a natural wetland. Constructed wetland are planned systems designed and constructed to
employ wetland vegetation to assist in treating wastewater in a more controlled environment
than occurs in natural wetland (USEPA, 1993).
Constructed wetlands can be built with a much greater degree of control, thus allowing the
establishment of experimental treatment facilities with a well-defined composition of
substrate, type of vegetation and flow pattern. In addition, constructed wetlands offer several
additional advantages compared to natural wetlands including site selection, flexibility in
12
sizing and most importantly, control over the hydraulic pathways and retention time (Asaye,
2009).
In Ethiopia, some researchers have investigated the wide use of constructed wetland for
different type of wastewater, including domestic (Birhanu Genet, 2006) and industrial
(Tannery wastewater) (Asaye Ketema, 2009) and have shown significant improvements in
water quality in these systems.
Compared with the conventional wastewater treatment system currently in use the
constructed wetland has its own advantage and limitations. Constructed wetlands are cost
effective, eco-friendly and technically feasible approach for treating wastewater. When
compared to conventional treatment systems, constructed wetlands are less expensive to
build as well as operational and maintenance costs are low. Study conducted in Ireland by
Reddy (2004) showed that the cost of a typical constructed wetland with a size of 4650 m2 is
about $122000 which was cheaper by 30% than conventional treatment methods of the same
size considering the lifespan and replacement value of the wetland. The above case studies
confirmed that the cost for constructing wetlands was lower than the conventional treatment
system. Furthermore, operation and maintenance require only periodic rather than continues,
on-site labor.
In addition, constructed wetland attracts wildlife such as bird, mammals, amphibians and
variety of dragon flies and other insects make the wetland home (Martha, 2003). For
instance, the recent USEPA (1999) publications indicated that more than 1,400 species of
wildlife have been identified from constructed and natural treatment wetlands, of these more
than 800 species were reported in constructed wetland alone. Moreover, Constructed
Wetland plants provide a more aesthetically pleasing alternative than many other
conventional wastewater treatment systems (Richard, 1998).
However, constructed wetlands have limitations for their application in the treatment of
wastewater.
• They generally require larger land areas than do conventional wastewater treatment
system. Wetland treatment may be economical relative to other options only where
land is available and affordable;
13

• Performance of constructed wetlands may be less consistent than in conventional
treatment. Wetland treatment efficiencies may vary seasonally in response to
changing environmental conditions including rainfall and drought. Wetland treatment
cannot be relied upon if effluent quality must meet stringent discharge standards at all
times (Mitsch and Gosselink, 1993),
• They are not used as a primary treatment because high organic load may clog the
pores in wetland media and the performance of BOD, COD and nutrients removal is
low.
In General the vast majority of wetlands constructed for wastewater treatment are classified
as surface flow or free water surface (FWS) systems and subsurface flow (SSF) system.
2.5.3.1 Surface Flow (SF) wetland
Surface Flow (SF) or free water surface (FWS) wetland resemble natural wetlands both in the
way they look and the way they provide treatment. Both designs can be used to treat
wastewater from individual and community sources, but SF wetlands are usually more
economical for treating large volumes of wastewater (Sinclair, 2000).
Figure 2.1 Surface flow wetland (Source; USEPA, 1999)
Wetlands are areas on land where the ground maintains saturated conditions for much of the
year. SF wetland stay saturated enough to maintain a shallow level of water and wastewater
(10 to 45 cm deep) above the soil (Figure 2.1). Wetland plants also are present in SF, and
natural forces such as wind, sun, rain and temperature affect the plants, water and the
treatment processes in these systems (Pipeline, 1998).
14

As soon as wastewater enters a SF cell, natural processes immediately begin to break down
and remove the waste materials in the water (Renee, 2001; Kaseva, 2003). Before the
wastewater has moved very far in the wetland, small suspended waste materials are
physically filtered out by submerged plants, plant stems, and plant litter in the wetland
(Hammer, 1992). The roots, stems, leaves, and litter of wetland plants also provide a
multitude of small surfaces where wastes can become trapped and waste-consuming bacterial
can attach themselves to the plant (USEPA, 1993; Sinclair, 2000).
Bacteria provide the majority of wastewater treatment (Christina, 2005). Aerobic bacteria
thrive in wetlands wherever oxygen is present, especially near the surface. Wind, rain,
wastewater and anything else that agitates the water surface can add oxygen to the system.
Anaerobic bacteria thrive where there is little or no oxygen. In surface flow cells, oxygen is
scarce in the lower substrate and soil. When these bacteria consume waste particles in the
water they convert them into other substances, such as methane, carbon dioxide and new
cellular material. Some of these substances are used as food by plants and other bacteria
(Christina, 2005).
2.5.3.2 Subsurface Flow (SSF) wetland
The pollutant removal performance of subsurface flow (SSF) or vegetated submerged bed
(VSB) systems depends on many factors including influent wastewater quality, hydraulic
retention time and pollutant loading, climate, and the physical characteristics of the system.
The main advantage of a SSF system over a surface flow (SF) wetland system is the isolation
of the wastewater from vectors, animals and humans. Concerns with mosquitoes and
pathogen transmission are greatly reduced with a SSF system (USEPA, 1993).
In SSF wetland, cells are filled with a treatment media, such as clay and rock or gravel,
which is placed on the cell bottom. In properly functioning system, the wastewater flows just
below the media surface and remain unexposed to the atmosphere while it saturates the layer
below (Figure 2.2). The saturated media and soil, together with the wetland plants roots,
create conditions below the surface of the system that are conducive to treatment.
15
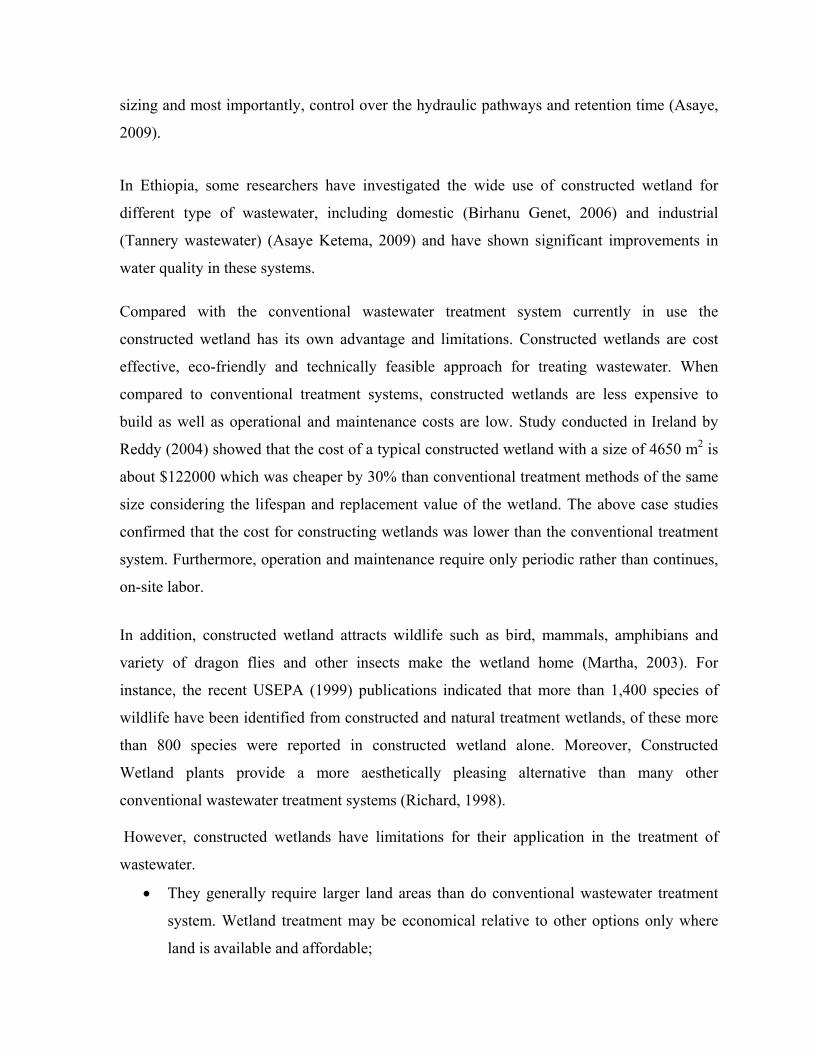
Figure 2.2 Subsurface flow wetland (Source: USEPA, 2000)
Treatment in the SSF system is more efficient than in the SF wetland because the media
provides a greater number of small surfaces, pores and crevices where treatment can occur.
Waste-consuming bacterial attach themselves to the various surfaces, and waste materials in
the water become trapped in the pores and crevices on the media and in the spaces between
media (USEPA, 1993). Vegetation in a wetland (roots, stems, and leaves) provides a
substrate upon which microorganisms can grow as they break down organic materials. This
community of microorganisms is known as the periphyton. The periphyton and natural
chemical processes are responsible for approximately 90% of pollutant removal and waste
breakdown (Wikipedia, 2007).
The submerged plant roots can provide substrate for microbial processes and since most
emergent macrophytes can transmit oxygen from the leaves to their roots. There are aerobic
micro-sites on the rhizome and root surfaces. Wetland macrophytes transport oxygen into the
root zone through lenticles, which are small openings on the above portions of these plants,
and aerenchymous tissue, which transport gases to and from the roots (Hammer, 1992; Brix,
1994; Kadlec and Knight, 1996; Newman et al., 2000). The remainder of the submerged
environment in the SSF wetland tends to be devoid of oxygen. This indicates biological
treatment in SSF wetlands is mostly anaerobic because the layers of media and soil remain
saturated and unexposed to the atmosphere (Pottir and Karathanosis, 2001). Furthermore, the
macrophytes contribute to wastewater treatment by providing additional surfaces where
bacterial can reside and where waste materials can become trapped (Faithfull, 1996; Joseph,
2005).
16
SSF constructed wetlands are recommended for areas where an exposed wastewater
treatment site may not be suitable due to potential health and safety concerns. Odors,
mosquito and flies are not a problem with proper system design, construction and
maintenance. Due to the fact that subsurface wetland has more surface area than SF wetland,
it has higher reaction rates.
2.6 Mechanisms of Pollutant Removal and Transformations in Wetlands
Constructed wetlands are highly complex systems that separate and transform contaminants
by physical, chemical, and biological mechanisms that may occur simultaneously or
sequentially as the wastewater flows through the system.
Metals are removed in a SSF by three mechanisms. First, because many metals (e.g. Zn, Cr,
Pb, Cd, Fe, Al) are associated with particles (Heukelekian & Balmat, 1959), the high
efficiency of particulate separation in a SSF should remove these metals accordingly.
Second, sulfide precipitation occurs due to the reduction of sulfates to sulfides in the absence
of nitrate, and renders some metals insoluble, resulting in significant removals, as described
in Reed et. al., (1995). Thirdly, metals can be removed through plant uptake. Metals may be
incorporated into the wetland biomass by way of the primary production process. For
macrophytes, metals are taken up through the root system and distributed through the plant.
The extent of uptake is dependent on the metal species and plant type.
Nitrogen transformation involves several biological processes. First the nitrogen contained in
the protein (hide and skin) and other sources decompose anaerobically to ammonia nitrogen
(NH4+ and NH3). Once NH4
+ is formed in anaerobic phase, it can take several pathways -
absorbed by plants, nitrification, denitrification and NH3 volatilization. In addition
immobilized through ion exchange on negatively charged clay soil particle contribute to
nitrogen removal (Mitsch and Gosselink, 2000).
17

2.7. Role of Plants in Constructed Wetland In SSF wetlands, emergent macrophytes grow in a saturated substrate which may be
intermittently flooded and drained. One of the most important mechanisms for pollutant
removal in wetlands is done by biological means (Debusk, 1999a), in which plants play
partial role. Plants can be involved, either directly or indirectly, in the removal of pollutants
present in wastewater. When plants directly uptake contaminants into their root structures,
this process is called phytodegradation (phytoextraction), when plants secret substances
that adds to biological degradation, this process is called rhizodegradation. The process
from where contaminants entered the plant biomass and transpired through the plant leaves is
called phytovolatization (ITRC, 2003).
Wetland plants take up macro-nutrients (such as N and P) and micro-nutrients through their
roots during active plant growth. At the beginning of plant senescence most of the nutrients
are translocated to the rhizomes and roots (Mitsch and Gosselink, 1993).
Aquatic plants have both structural and physiological adaptations to water logging, which
allows them to tolerate anoxia in saturated substrates (Mitsch and Gosselink, 1993).
Emergent macrophytes that have been used successfully in surface flow treatment wetlands
and subsurface flow treatment wetlands are adapted to cope with anoxia associated with
permanent water logging or saturated solids respectively.
Plants capacity to supply oxygen to the root zone and nutrient uptake varies among species
due to the difference in vascular tissue, metabolism and root distribution (Gersberg et al.,
1986; Steinberg and Coonrod, 1994; Jackson and Armstrong, 1999). This also suggests that,
if the plant is expected to play a major role, the depth of the bed should not exceed the
potential root development for the plant species selected.
In addition, apart from providing attachment sites and diffusible oxygen to bacteria, root-
mats increase wastewater residence time and retention of suspended organic particles, which
upon degradation benefit nutrients to bacteria and plants (Joseph, 2005). Furthermore; during
the active growth period plants are able to significantly reduce pollutants than in the
senescent phase, even though it still contribute some (Myers et al., 2001). Kadlec and Knight
18

(1996) listed 37 families of vascular plants that have been used in water quality treatment.
These include Cattails (Typha spp.), reeds (Phragmites spp), rushes (Juncus spp.), bulrushes
(Scirpus spp.) and sedges (Carex spp.)
Constructed wetland usually requires time for plant development to be fully operational.
According to Kadlec et al. (2000), in general a complete root–rhizome development for a
newly constructed wetland may require 3–5 years. Wood (1990) also noted that it takes six to
twelve months for an adequate stand of vegetation to develop, though it may be three to four
years before the stand is fully developed with and active rhizosphere. For instance, for
Phragmites, three to four growing seasons are usually needed to reach maximum standing
crop but in some systems it may take even longer (Vymazal and Kr+opfelova, 2005).
2.7.1. Translocation and Uptake of Cr by Plant The mechanism of adsorption and translocation of Cr in plants seem to be similar to those of
Fe, which is reflected by a fairly Cr/Fe ratio in plant tissues. Tiffin (1997) concluded that Cr
is transported in plants anionic complexes, which have been identified in the extract of plant
tissues and in xylem fluid.
Chromate (Cr6+) uptake is an active process via a sulfate carrier and mostly accumulated by
shoots. In contrast, the uptake of Cr3+ is passive process occurring mostly in roots (Peterson
and Girling, 1981). Zayed, et al. (1998) inferred that patterns of accumulation and
translocation of the two Cr ions.
c = Cr
Figure 2.3 Translocation and Uptake of Cr in Plant tissues (USEPA, 2000)
19

2.7. 2. Hyper Accumulating and High Biomass Tree Species
The process of phytoextraction involves the uptake of metal contaminants from the soil or
wastewater by the roots and then translocate into the above-ground regions of the plants.
Certain species, termed hyperaccumulators, have an innate ability to absorb exceptionally
large amounts of metals compared to most ordinary plants. Hyper accumulators will
concentrate more than 10 ppm Hg, 100 ppm Cd, 1000 ppm, Co, Cr, Cu and 10,000 ppm Zn
and Ni (Chaney et al. 1997, Brooks et al. 1998).
Phytoremediation is viewed as long-term remediation solution to reduce metals to acceptable
regulatory levels. Research results showed that trees could accumulate 10-500 times higher
level of heavy metals than crops (Reeves, 2004). The use of hyper accumulating metal
tolerant or tree species plants provide an alternative remediation technology. Cultivating such
plants, on industrial waste site can provide a clean, cheap, alternative to cleaning approach to
decontaminant heavy metal contaminated soil.
Bioaccumulation factor, (mean concentration of metal in the plant/mean concentration of
metal in wastewater), is the index used for screening plants and evaluating metal uptake and
phytotoxicity effects (Baker et al., 1994b; Nanda Kumar et al., 1995). The higher the
bioaccumulation factor the higher the plant uptake from influent wastewater.
2.7.3 Anaerobic condition tolerance of plant
Diffusion of oxygen in aqueous solution has been estimated at 10,000 times slower than
oxygen diffuse through a porous media such as dried soil (Green wood, 1961, Gallagher and
Patrick 1978). This low diffusion leads to anaerobic condition. The resulting lack of oxygen
prevents plants from carrying out normal aerobic root respiration and strongly affects the
availability of plant nutrients, cell division, cell extension, etc. As a result, plants that grow in
anaerobic environment have a number of specific adaptations.
The primary plant strategy in response to flooding or aqueous environment is structural
adaptation such as development of air space (aerenchyma) in roots and stems which allow
the diffusion of oxygen from aerial portion of the plant in to the roots. Typha species and
Reeds are typical examples of such type adaptations.
20

The ability of emergent macrophytes to transfer oxygen to their submerged portions is a well
appreciated phenomenon, which in nature enables them to cope with effective water-logging
and functional anoxia. As much as 60% of the oxygen transported to these parts of the plant
can pass out into the rhizosphere, creating aerobic conditions for the thriving microbial
community associated with the root zone, the leaf surfaces and the surrounding substrate.
This accounts for a significant increase in the dissolved oxygen levels within the water
generally and, most particularly, immediately adjacent to the macrophytes themselves (Evans
and Furlong, 2003). Other adaptations include hormone production, such as ethylene, which
stimulate development of adventitious roots just above anaerobic sirface.
2.8. Selection of Phytoextractor Wetland Plants
The choice of plants is an important issue in constructed wetland, as they must survive the
potential toxic effects of the wastewater and its variability. The major criteria for plant
selection are based on their adaptation to that particular site, the type of contaminants, and
polluting of that specific area.
The Selected tree species for phytoremediation should be fast growing, deep rooted, high
biomass production, large transpiration rates and preferably indigenous. It is the combination
of high metal accumulation with high biomass production that results in most metal removal.
In addition, plants considered for phytoremediation must tolerate the targeted metal or
metals, and be efficient in translocation of metals from roots to the harvestable above ground
portions of the plant (Blylock and Kong, 2000).
Other desirable plant characteristics include the ability to tolerate difficult soil conditions, the
production of dense root system, ease of care and establishment. Several researchers have
screened fast growing, high biomass accumulating plants, with ability to tolerate and
accumulate in shoots (Raskin, et al., 1997). In the case of organic phytotransformation;
species of vegetation which are hardy and fast growing, easy to maintain, have a high
transpiration pull and transform the pollutants present to nontoxic or less toxic products. In
addition, for many such applications, deep rooting plants are particularly valuable.
21
2.8.1 Characteristics of selected wetland plant species Modjo Tannery constructed wetland was planted with four different plant species, identified
in the local areas, namely Cyprus alternifolius, Borassus aethiopium, Phragmites karka and
Thypha domingensis, which are among the typical plant species of wetland ecosystems of
Ethiopia (EIBC, 2007). This plant species are common in different wetlands of Ethiopia such
as Lake Tana, Lake Awassa, Lake Zeway, and in different Lakes found in Debere-Zeyet and
river basins.
Cyprus alternifolius, belongs to the family Cyperaceae, are robust perennial with 2-10 mm
thick creeping woody rhizomes and several stems /culms usually places in a straight row.
They can be grown in swamps, wet grasslands and streams banks; 700-2400m above sea
level. They are widely distributed in Ethiopia, Tropical Africa and south west Asia. (Sebsibe,
et al., 1997).
Another species of this plant, Cyprus Papyrus, was found in different parts of Ethiopia
(especially in Amahara, Tigry, Hrire and Oromia regions) grows in lake margins beds and
other wet habitats with an altitude of 500-2200m. They are widespread in tropical and
subtropical regions throughout the world. The plant was used by the local communities to
produce materials like roofs, fence, ’Tanka’, coffee Ceremonies etc. These plants were used
for wastewater treatment in constructed wetlands for different types of wastewaters (Kadlec
and Knight, 1996; Frew, 2010; Asaye, 2010).
Typha domingensis, which belongs to the family Typhaceae, are herbs with creeping sterch
rhizomes growing in wetlands. They lack aerial stem. They are widely distributed in
Ethiopia. The plant is used by the local communities to produce materials like roofs, sleeping
beds, Coffee Ceremonies etc. they can produce high biomass within a short period of time.
These plants were used for industrial and domestic wastewater treatment in constructed
wetlands (Kadlec and Knight, 1996) Frew, 2010; Asaye, 2010).
Phragmites karak / commonly called Reeds / species are belonging to the family Poaceae
(Arundineae). They are robust perennial which forms an extensive creeping woody rhizomes,
stems /culms 2-8m high, very stout often woody and a bamboo like. It grows in marshy or
22

seasonally flooded alluvial soils along river banks; 500-2100m above sea level widely
distributed in many regions of Ethiopia such as Tigray, Amhara, Oromaya, DNNP regions
(Flora of Eth. ,1997), Tropical Africa, Tropical Asia and other parts of the world (Flora of
Eth. 1995). Reeds were used for domestic and industrial wastewater treatments in many
countries.
The Borassus aethiopium (commonly called palm tree), is very widely planted as an
ornamental plant in warm temperate regions of the world. It is cultivated as a street tree in
many of the larger towns and cities of Ethiopia replacing (Phoenix canariesis) with altitude
of 500-2400 m.a.s.l. (Sebsebe et al., 1997) particularly in areas with continental climates
where temperatures never fall below 100C. Nowadays, it is also common in most parts of
Ethiopia as ornamental plant in cities such as Addis Ababa, Bahir-Dar, Debere-Zeyet Jimma
etc and in natural wetlands found in different parts of the country (Sebsebe et al., 1997;
EIBC, 2007). These palm attracts many birds particularly pink breasted pigeon to nest in it
(Sebsebe et al., 1997). These plants were used for wastewater treatment in constructed
wetlands (Birhanu, 2007).
23
CHAPTER THREE
MATERIALS AND METHODS
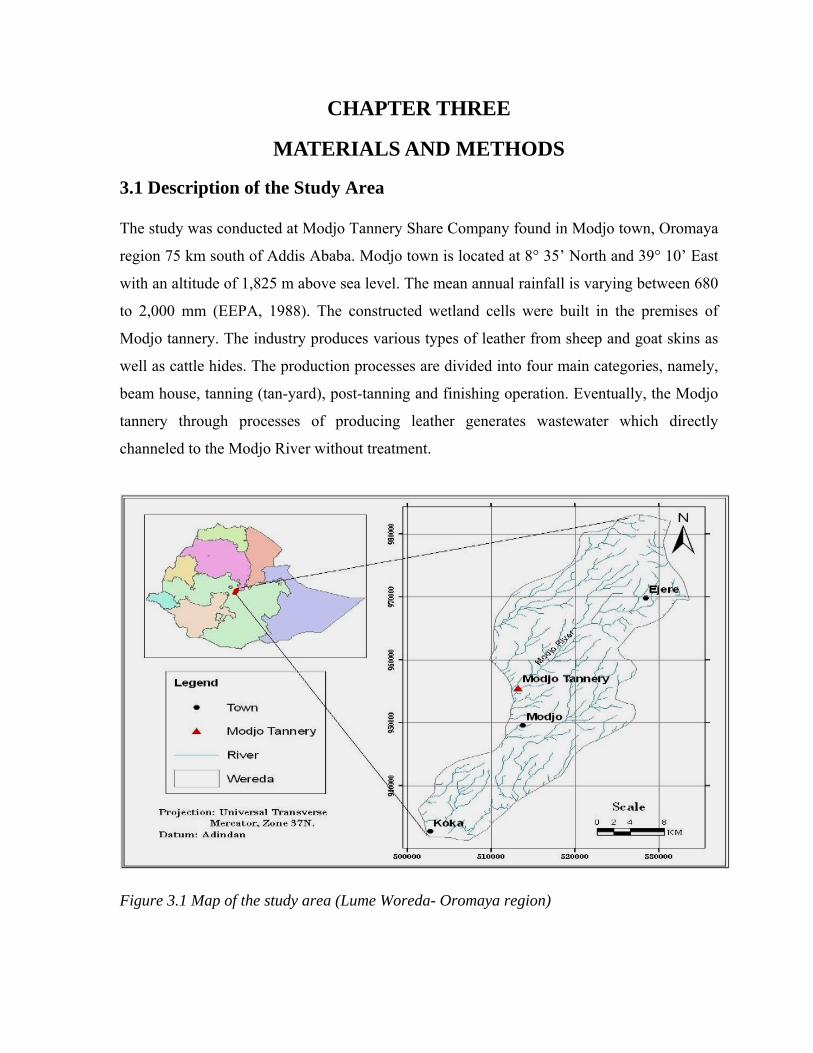
3.1 Description of the Study Area
The study was conducted at Modjo Tannery Share Company found in Modjo town, Oromaya
region 75 km south of Addis Ababa. Modjo town is located at 8° 35’ North and 39° 10’ East
with an altitude of 1,825 m above sea level. The mean annual rainfall is varying between 680
to 2,000 mm (EEPA, 1988). The constructed wetland cells were built in the premises of
Modjo tannery. The industry produces various types of leather from sheep and goat skins as
well as cattle hides. The production processes are divided into four main categories, namely,
beam house, tanning (tan-yard), post-tanning and finishing operation. Eventually, the Modjo
tannery through processes of producing leather generates wastewater which directly
channeled to the Modjo River without treatment.
Figure 3.1 Map of the study area (Lume Woreda- Oromaya region)
24
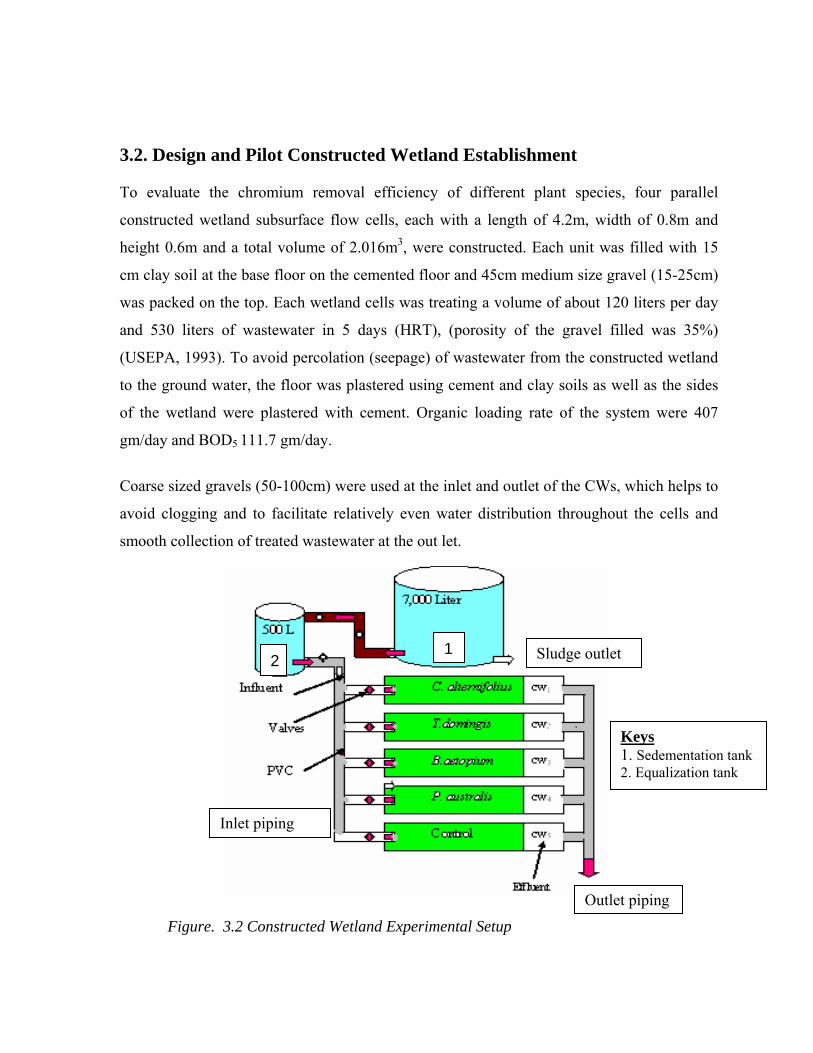
3.2. Design and Pilot Constructed Wetland Establishment
To evaluate the chromium removal efficiency of different plant species, four parallel
constructed wetland subsurface flow cells, each with a length of 4.2m, width of 0.8m and
height 0.6m and a total volume of 2.016m3, were constructed. Each unit was filled with 15
cm clay soil at the base floor on the cemented floor and 45cm medium size gravel (15-25cm)
was packed on the top. Each wetland cells was treating a volume of about 120 liters per day
and 530 liters of wastewater in 5 days (HRT), (porosity of the gravel filled was 35%)
(USEPA, 1993). To avoid percolation (seepage) of wastewater from the constructed wetland
to the ground water, the floor was plastered using cement and clay soils as well as the sides
of the wetland were plastered with cement. Organic loading rate of the system were 407
gm/day and BOD5 111.7 gm/day.
Coarse sized gravels (50-100cm) were used at the inlet and outlet of the CWs, which helps to
avoid clogging and to facilitate relatively even water distribution throughout the cells and
smooth collection of treated wastewater at the out let.
Figure. 3.2 Constructed Wetland Experimental Setup
Keys 1. Sedementation tank 2. Equalization tank
Inlet piping
Outlet piping
2 1 Sludge outlet
25
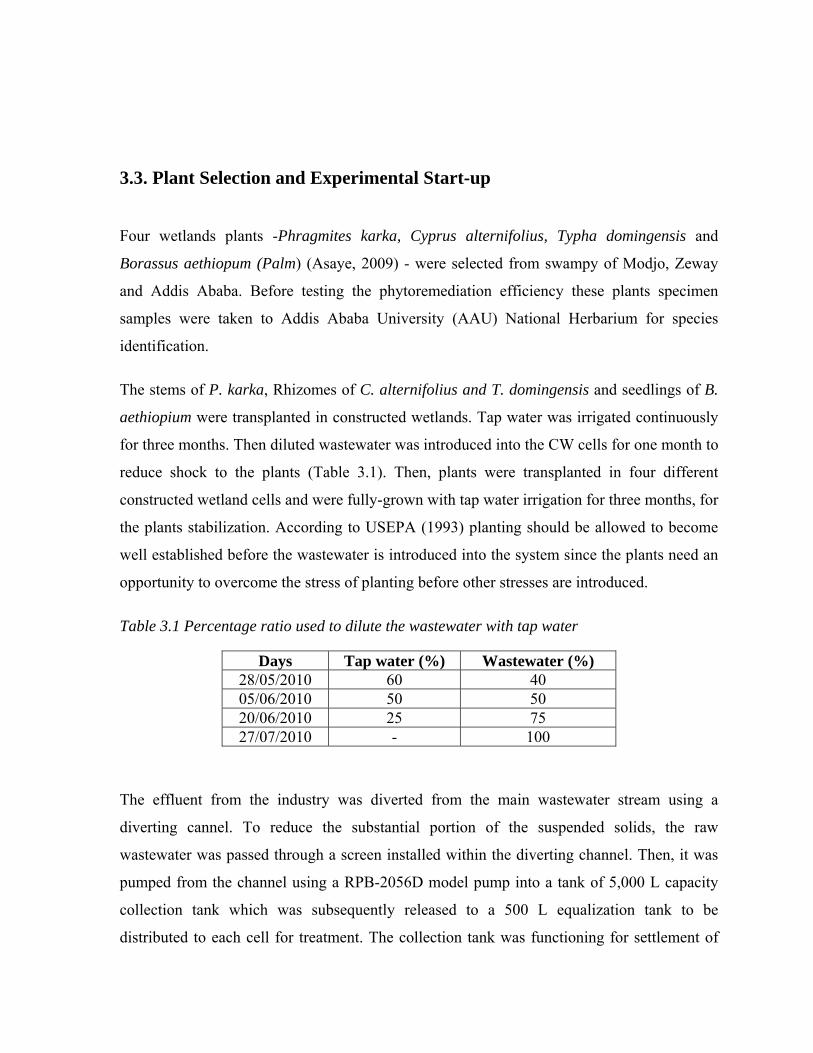
3.3. Plant Selection and Experimental Start-up
Four wetlands plants -Phragmites karka, Cyprus alternifolius, Typha domingensis and
Borassus aethiopum (Palm) (Asaye, 2009) - were selected from swampy of Modjo, Zeway
and Addis Ababa. Before testing the phytoremediation efficiency these plants specimen
samples were taken to Addis Ababa University (AAU) National Herbarium for species
identification.
The stems of P. karka, Rhizomes of C. alternifolius and T. domingensis and seedlings of B.
aethiopium were transplanted in constructed wetlands. Tap water was irrigated continuously
for three months. Then diluted wastewater was introduced into the CW cells for one month to
reduce shock to the plants (Table 3.1). Then, plants were transplanted in four different
constructed wetland cells and were fully-grown with tap water irrigation for three months, for
the plants stabilization. According to USEPA (1993) planting should be allowed to become
well established before the wastewater is introduced into the system since the plants need an
opportunity to overcome the stress of planting before other stresses are introduced.
Table 3.1 Percentage ratio used to dilute the wastewater with tap water
Days Tap water (%) Wastewater (%) 28/05/2010 60 40 05/06/2010 50 50 20/06/2010 25 75 27/07/2010 - 100
The effluent from the industry was diverted from the main wastewater stream using a
diverting cannel. To reduce the substantial portion of the suspended solids, the raw
wastewater was passed through a screen installed within the diverting channel. Then, it was
pumped from the channel using a RPB-2056D model pump into a tank of 5,000 L capacity
collection tank which was subsequently released to a 500 L equalization tank to be
distributed to each cell for treatment. The collection tank was functioning for settlement of
26
suspended solids, and the equalization tank controls the flow rate to the constructed wetland
cells.
The influent flow from the equalization tank and collection tank were controlled by gate-
valves. The effluent from the equalization tank was distributed to each constructed wetland
cell through a polyvinylchloride (PVC) pipe of size 50mm, installed with flow control plastic
gate-valves.
The inflow and outflow rate was measured for five days (HRT) using a stopwatch and
measuring cylinder. The average inflow to each CW was 120 Liter/d and outflow rate was 90
L/day. The wastewater hydraulic retention time (HRT) was calculated based on Darcy’s law
QVpT = …………………………………………………..Equation 3.1
Where T is residence time (in days), Vp the void or porous volume of constructed wetland (in
m3) at porosity P of the medium (35%) and Q is the flow rate of the constructed wetland (in
m3/day) which is calculated as (Qi+Qo)/2, where Qi is inflow and Qo is outflow (USEPA,
1993).
27
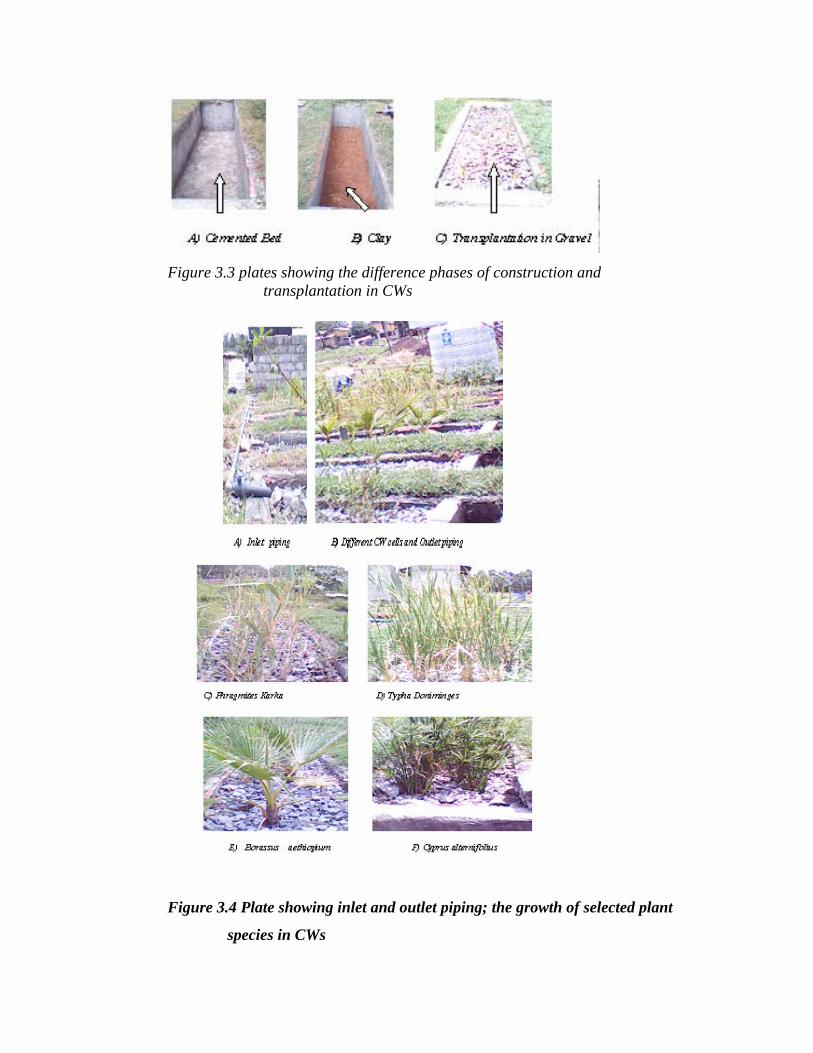
Figure 3.3 plates showing the difference phases of construction and
transplantation in CWs
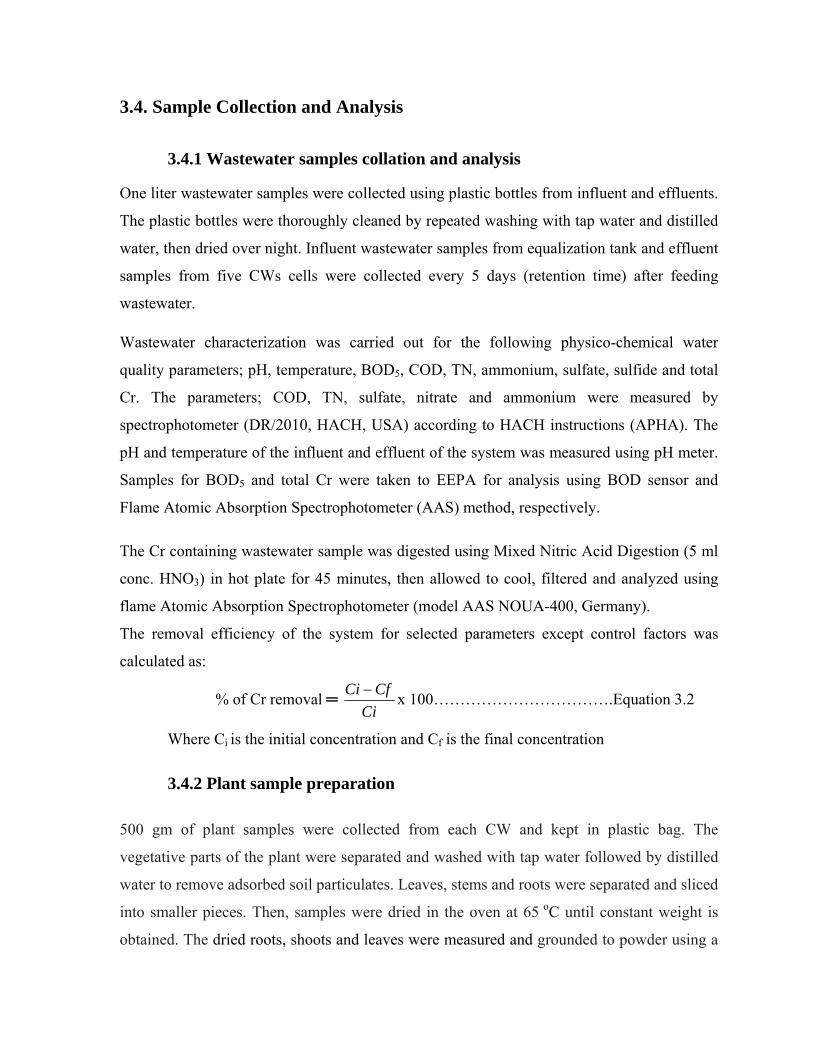
Figure 3.4 Plate showing inlet and outlet piping; the growth of selected plant
species in CWs
28
3.4. Sample Collection and Analysis
3.4.1 Wastewater samples collation and analysis
One liter wastewater samples were collected using plastic bottles from influent and effluents.
The plastic bottles were thoroughly cleaned by repeated washing with tap water and distilled
water, then dried over night. Influent wastewater samples from equalization tank and effluent
samples from five CWs cells were collected every 5 days (retention time) after feeding
wastewater.
Wastewater characterization was carried out for the following physico-chemical water
quality parameters; pH, temperature, BOD5, COD, TN, ammonium, sulfate, sulfide and total
Cr. The parameters; COD, TN, sulfate, nitrate and ammonium were measured by
spectrophotometer (DR/2010, HACH, USA) according to HACH instructions (APHA). The
pH and temperature of the influent and effluent of the system was measured using pH meter.
Samples for BOD5 and total Cr were taken to EEPA for analysis using BOD sensor and
Flame Atomic Absorption Spectrophotometer (AAS) method, respectively.
The Cr containing wastewater sample was digested using Mixed Nitric Acid Digestion (5 ml
conc. HNO3) in hot plate for 45 minutes, then allowed to cool, filtered and analyzed using
flame Atomic Absorption Spectrophotometer (model AAS NOUA-400, Germany).
The removal efficiency of the system for selected parameters except control factors was
calculated as:
% of Cr removal ═ Ci
CfCi − x 100…………………………….Equation 3.2
Where Ci is the initial concentration and Cf is the final concentration
3.4.2 Plant sample preparation
500 gm of plant samples were collected from each CW and kept in plastic bag. The
vegetative parts of the plant were separated and washed with tap water followed by distilled
water to remove adsorbed soil particulates. Leaves, stems and roots were separated and sliced
into smaller pieces. Then, samples were dried in the oven at 65 oC until constant weight is
obtained. The dried roots, shoots and leaves were measured and grounded to powder using a
29

grinding machine and stored in glass flasks at ambient temperature. The Cr content in the
plant roots before introducing wastewater was also studied.
3.4.3 Plant sample analysis
The dried plant material (1 g DW Sample) was transferred to hot plate and heated at 2000C
for 40 minutes and then calcinated at 4500C for 2 hours, as the method described by EEPA
(2003) (ash method). The extraction of chromium was performed by adding 5ml, 6M HNO3
(nitric acid) and digested by gently boiling until 1mL remained. Then 5mL, 3M HNO3 was
added and reheated for further 30 minutes. The warm solution was filtered into 100 ml
volumetric flask. The extract was recovered through filtration. Deionized water was added to
dilute the recovered sample to 100ml. The concentration of chromium in the extract was
determined by atomic absorption spectrophotometer (AAS) (graphite method) in EEPA. A
blank was prepared to subtract the Cr contained in the reagent from the plant extract.
The Cr bioaccumulation factor (BAF) and Translocation factor (TF) of the selected plant
species was estimated, (as a method described by Baker, et. al., 2000 and Shanker et al.,
2004):
BAF = mg Cr/kg dw plant mg Cr/L Wastewater ………………………………………Equation 3.3 Translocation factor of Cr was calculated as:
TF = mg Cr/kg dw shoot mg Cr/kg dw root …………………………………………...Equation 3.4
3.4.4 Gravel analysis The amount of chromium which had been adsorbed to the gravel or the biofilm on the gravel
was examined. Gravel samples were collected from different cells. 1000cm3 gravel were
measured and washed by the same volume of tap water. The liquid obtained from washed
gravel was then taken to EEPA for chromium analysis using AAS, the same methods
described in wastewater Cr analysis. The total amounts of Cr contained in the gravel within
two months of period were calculated using the formula (developed):
Total Cr = mg Cr in the sample x Total volume of gravel Sample volume …………….Equation 3.5
30

3.4.4 Soil sample collection and analysis
The 0.5kg soil sample was collected from five CW cells bed surface and one control. The
samples were air dried to constant weight for a week and large debris and silts were filtered.
Then the samples were ground, homogenized and digested.
The ground and homogenized soil samples were analyzed for Cr content. The 0.5g of soil
sample were transferred in to a 100mL flask and digested by aqua-regia method (3:1 ratio of
HCl to HNO3) and followed by 1.5 of H2O2. A 100ml supernatant was used for Cr analysis
with graphite Atomic Absorption Spectrometry.
The Cr contained in the soil was calculated and expressed in mg /kg dry weight as follows:
Total Cr = mg Cr in the soil sample x Total volume of soil Soil Sample volume …….Equation 3.6 Bioaccumulation factor (BAF) of each plant tissues can be determined using the equation
(developed by Baker et al., 1994; Nanda Kumar et al., 1995):
BAF = mg Cr/kg dw plant mg Cr/L Wastewater ……………………………… Equation 3.7
The translocation factor (TF) can be calculated based on the formula (developed by Shanker et al. 2004):
TF = mg Cr/kg DW shoot mg Cr/kg DW root…………………………………… Equation 3.8
3.5. Statistical Data Analysis
Statistical analysis was performed using SPSS program (SPSS; Version 16.0). The data was
analyzed through one-way analysis of variance (ANOVA) at 95% confidence level to
compare the performance efficiency of each CW concerning the removal of BOD5, COD,
NH3-N, NO3-, SO4
2- and S2- and Cr uptake and removal.
The ANOVA was used for statistical analysis because it uses the F statistics to compare
whether the difference between sample means of Cr or nutrients in different CW cells are
significant or not. That is if the calculated value of F (the ratio of SD between samples to SD
within samples) is greater than F critical (the value obtained from the table at a specified
confidence level and degree of freedom), then the difference in sample means are significant,
if the contrast, it is not significant.
31
CHAPTER FOUR
RESULTS AND DISCUSSION
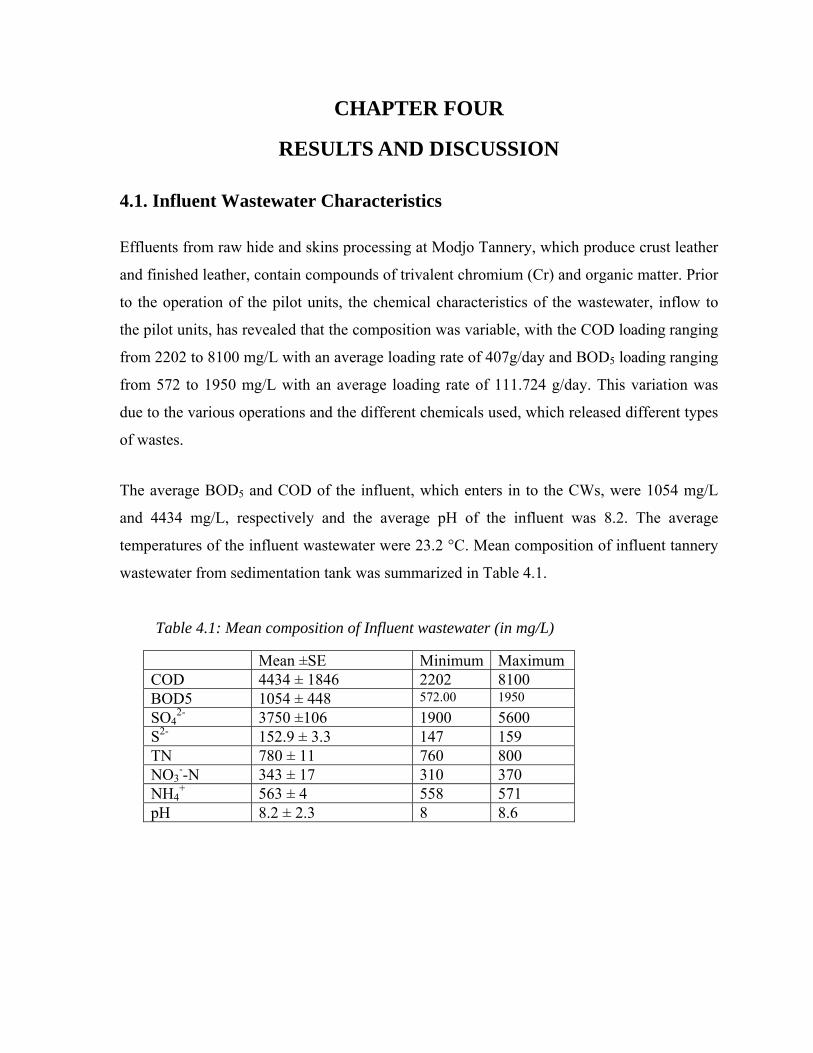
4.1. Influent Wastewater Characteristics
Effluents from raw hide and skins processing at Modjo Tannery, which produce crust leather
and finished leather, contain compounds of trivalent chromium (Cr) and organic matter. Prior
to the operation of the pilot units, the chemical characteristics of the wastewater, inflow to
the pilot units, has revealed that the composition was variable, with the COD loading ranging
from 2202 to 8100 mg/L with an average loading rate of 407g/day and BOD5 loading ranging
from 572 to 1950 mg/L with an average loading rate of 111.724 g/day. This variation was
due to the various operations and the different chemicals used, which released different types
of wastes.
The average BOD5 and COD of the influent, which enters in to the CWs, were 1054 mg/L
and 4434 mg/L, respectively and the average pH of the influent was 8.2. The average
temperatures of the influent wastewater were 23.2 °C. Mean composition of influent tannery
wastewater from sedimentation tank was summarized in Table 4.1.
Table 4.1: Mean composition of Influent wastewater (in mg/L)
Mean ±SE Minimum Maximum COD 4434 ± 1846 2202 8100 BOD5 1054 ± 448 572.00 1950 SO4
2- 3750 ±106 1900 5600 S2- 152.9 ± 3.3 147 159 TN 780 ± 11 760 800 NO3
--N 343 ± 17 310 370 NH4
+ 563 ± 4 558 571 pH 8.2 ± 2.3 8 8.6
32
4.2. Plant growth
At the beginning of the study period C. alternifolius and T. domingensis were the plant
species adapt to raw tannery wastewater. However, at the end of experiment (two months of
feeding raw wastewater), some of the leaves of T. domingensis and C. alternifolius became
yellow and then dried. This may be due to the toxic effects of Cr. On the other hand, P. karka
and B. aethiopium continued to grow well until the end of the experiment.
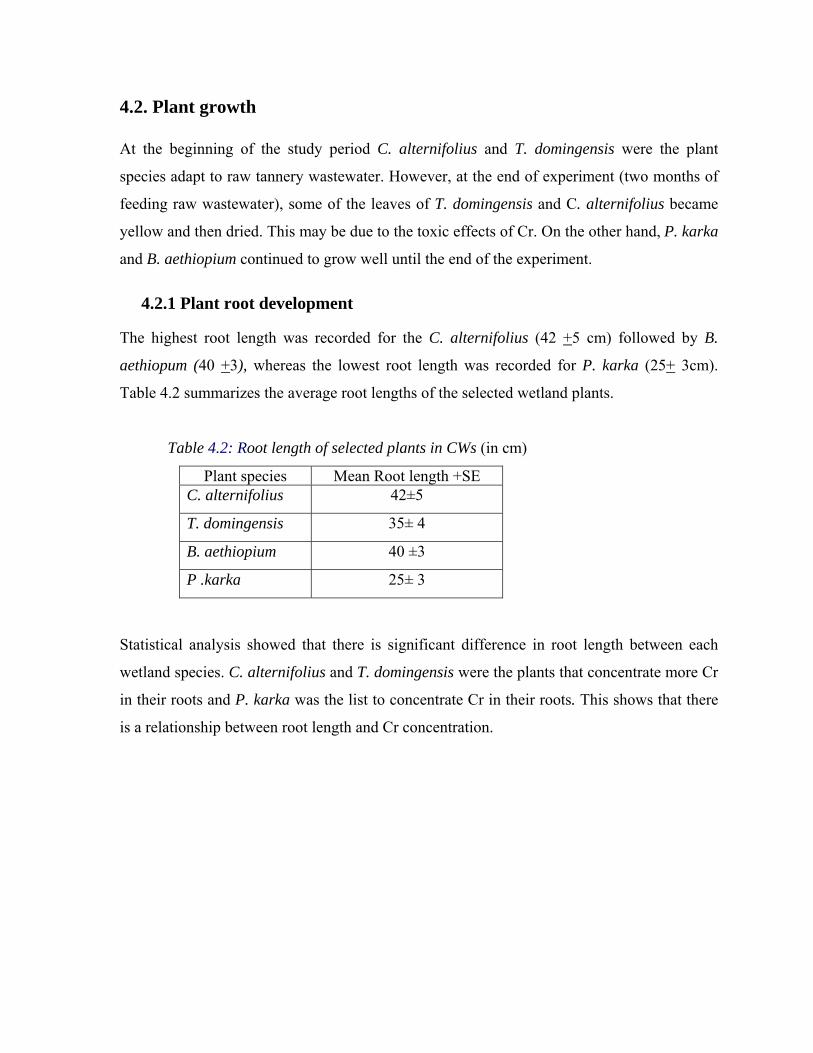
4.2.1 Plant root development
The highest root length was recorded for the C. alternifolius (42 +5 cm) followed by B.
aethiopum (40 +3), whereas the lowest root length was recorded for P. karka (25+ 3cm).
Table 4.2 summarizes the average root lengths of the selected wetland plants.
Table 4.2: Root length of selected plants in CWs (in cm)
Plant species Mean Root length +SE C. alternifolius 42±5
T. domingensis 35± 4
B. aethiopium 40 ±3
P .karka 25± 3
Statistical analysis showed that there is significant difference in root length between each
wetland species. C. alternifolius and T. domingensis were the plants that concentrate more Cr
in their roots and P. karka was the list to concentrate Cr in their roots. This shows that there
is a relationship between root length and Cr concentration.
33

4.3. COD and BOD removal
In this study organic matter removal efficiency of the different plant species in the different
cells of constructed wetland was evaluated. The BOD and COD removal efficiency were
summarized in Figure 4.1.
As shown in Figure 4.1 the maximum COD removal was observed in the cell planted with P.
karka (80.9%) followed by C. alternifolius (64.8%). Whereas, CWs planted with, B.
aethiopium and T. domingensis showed a removal efficiency of (58%) and (56.6%),
respectively. The minimum removal efficiency was observed in the Control (38.3%).
Statistical analysis showed that, the COD removal from the CWs panted with P. karka was
significantly higher (p < 0.05) than other plants and control. Statistical analysis also showed
that there is a significant difference between vegetated and unvegetated CWs.
Also the highest BOD5 removal was recorded in the cell planted with P. karka (77%). The
lower BOD5 removal efficiency was observed in the control (64%). There was no statistical
difference in BOD5 removal efficiency among the units was observed however, all units were
significantly higher (p < 0.05) from the control CWs. The high BOD and COD removal in P.
karaka may be due to its capacity to supply oxygen via it’s hallow stems that helps to oxidize
organic matter in root zone.
BOD5 and COD Removal
67.556.6
66.758
66
80.9 77
38.4
6464.8
020406080
100
COD BOD5
Rem
oval
effi
cien
cy C. Alternifolius
T. domingensis
B. Aethiopium
P. Karka
Control
Figure 4.1: BOD and COD removal efficiency
34

A study conducted by Asaye Ketema (2009) using tannery wastewater CW cells under 5 days
HRT showed that BOD5 was reduced by 84% and COD was reduced by 57-68% using
Schenoplectus corymbosus, Cyperus alopcuroides Typha domingensis and Sesbania sesban
plants. A similar study conducted by Cristina et al. (2006) in CW system vegetated with
different plants to the treatment of tannery wastewater showed that COD was reduced by 41-
73% and BOD5 was reduced by 41-58% under 3 and 6 HRT. The results obtained in this
study agree with these studies.
The findings from this study showed that most CWs containing plants lead to higher organic
matter removal when compared to the control unit. This indicates that plants contribute to
wastewater treatment processes in a number of ways, such as providing surface area for
microorganisms, increasing uptake of nutrients, and trace elements and oxygen transfer, by
the aerenchymatic tissue, to their roots (Kadlack, et al., 2000; Renee, 2001; Cristina, et al.,
2006).
Wetland plants also improve organic matter removal due to the growth of biofilms on the
root surface, releasing chelating substances and enzymes by their roots which enhance
adsorption and degradation of organic compounds and adsorption of certain organic matter
on clay soil and sand (Mitsch and Gooselike, 1993; Reddy et al., 1989). However, the
overall organic matter removal efficiency was low. This is because of the use of high organic
loading due to raw wastewater and inactivation of methanogens by high chromium content
and sulfide toxicity.
The provisional tannery industry discharge limit, set by the EEPA (2003b), to water bodies,
is 500 mg/L and 200 mg/L (> 90%) removal of COD and BOD5, respectively. But in this
study, the COD and BOD5 effluent from the constructed wetland do not meet the discharge
limit set by the EEPA. However P. karaka showed better removal efficiency approaching to
EEPA standards (242 mg/L).
The reason for lower removal efficiency of the system is that the study uses the CWs for
primary treatment, in which the raw wastewater has high organic load. The recommended
organic loading rate recommended by Metcalf and Eddy (1991), was 67.25 kg BOD5/ha/day,
which is less than the organic loading rate used in this study (219 to 650 kg BOD5/ha/day).
35

4.4. Nitrogen and Sulfur Removal
4.4.1 Nitrogen removal
After 5 days of HRT, the constructed wetlands showed a reduction of nitrogen concentration
in the effluent. The mean influent TN, NO3- and NH4
+ concentration was 780 + 11 mg/L, 343
+ 17 mg/L and 563 + 4 mg/L, respectively (Table 4.1). The nitrogen removal efficiency of
each CW is presented in Table 4.3.
Table 4.3: Average effluent Nitrogen concentrations (mg/L) and removal efficiency
Cells pH TN
(mean + SE)
%
removal
NO3-
(mean + SE)
%
removal
NH4+
(mean +SE)
%
removal
C. alternifolus 7.1 420 ± 20 46 262 ±118 23.6 198 ± 2 64.8
T. domingensis 7.3 416.67± 55 46.7 256.6 ± 60 25 263± 6 53.3
B. aethiopium 7.0 163.33 ±15 58 146.6 ± 95 57.3 112 ±3 80
P. karaka 8.3 298.3 ±10 61 161 ± 78 53 98 ± 2 82.5
Control 8.2 394 ± 15 49.5 190 ± 60 44.6 210 ±+ 4 62.7
As shown in Table 4.3, the maximum TN removal was observed in CWs planted with P.
karka (61%) followed by B. aethiopium (58%) and the minimum removal was observed in
the C. alternifolius (46%). In the case of NO3-, maximum removal was observed in CWs
planted with B. aethiopium (57.3%) followed by P. karka (53%) and the minimum NO3-
removal was observed in the C. alternifolius (29.72 %) and T. domingensis (23.6%).
Likewise, the maximum NH4+ removal was observed in CWs planted with P. karka (82.5%)
followed by B. aethiopium (80%). The minimum ammonium removal was observed in CWs
planted with T. domingensis and Control (53.3% and 62.7% respectively). Statistical analysis
(p < 0.05) showed that there is a significant difference in NO3- and NH4
+ removal among
vegetated wetlands. This variation may have come from the difference in plant uptake.
The highest NH4+ removal observed in CWs may be due to nitrification by aerobic nitrifying
bacteria in the root zone and physicochemical processes such as the fixation of NH4+ in to the
clay soil (Mitsch and Gooselike, 1993). The high NO3- removal in CWs planted with B.
36
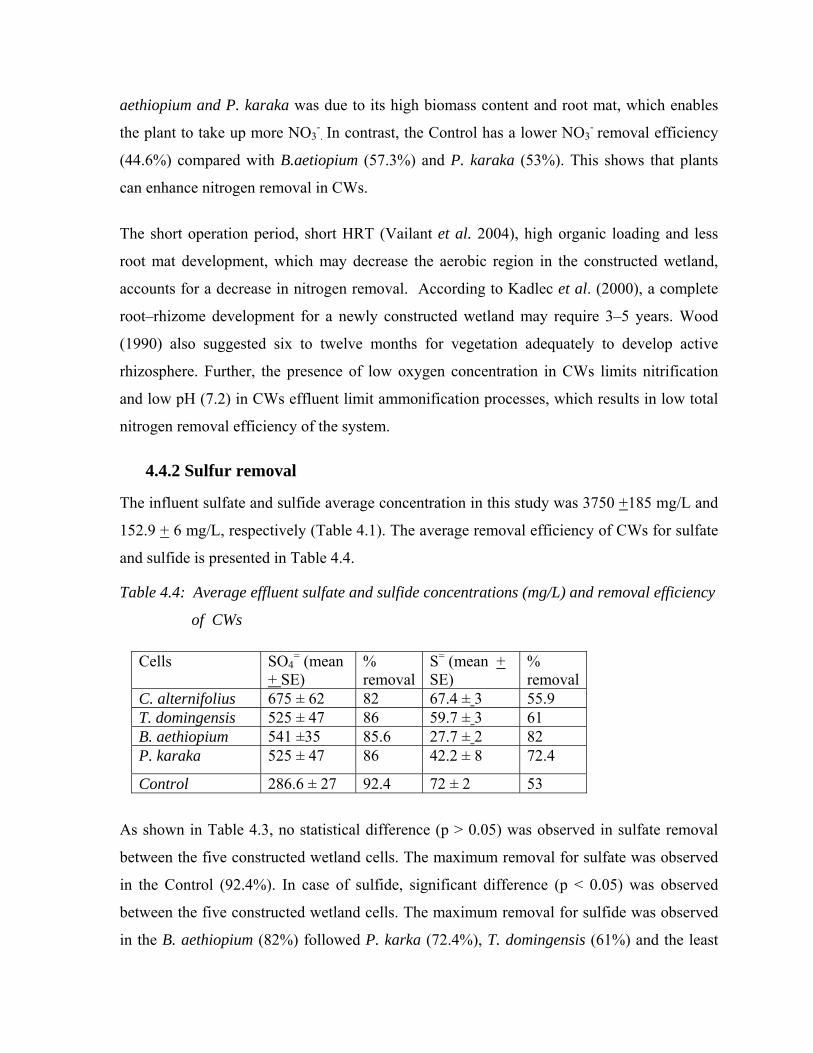
aethiopium and P. karaka was due to its high biomass content and root mat, which enables
the plant to take up more NO3-. In contrast, the Control has a lower NO3
- removal efficiency
(44.6%) compared with B.aetiopium (57.3%) and P. karaka (53%). This shows that plants
can enhance nitrogen removal in CWs.
The short operation period, short HRT (Vailant et al. 2004), high organic loading and less
root mat development, which may decrease the aerobic region in the constructed wetland,
accounts for a decrease in nitrogen removal. According to Kadlec et al. (2000), a complete
root–rhizome development for a newly constructed wetland may require 3–5 years. Wood
(1990) also suggested six to twelve months for vegetation adequately to develop active
rhizosphere. Further, the presence of low oxygen concentration in CWs limits nitrification
and low pH (7.2) in CWs effluent limit ammonification processes, which results in low total
nitrogen removal efficiency of the system.
4.4.2 Sulfur removal
The influent sulfate and sulfide average concentration in this study was 3750 +185 mg/L and
152.9 + 6 mg/L, respectively (Table 4.1). The average removal efficiency of CWs for sulfate
and sulfide is presented in Table 4.4.
Table 4.4: Average effluent sulfate and sulfide concentrations (mg/L) and removal efficiency
of CWs
Cells SO4= (mean
+ SE) % removal
S= (mean + SE)
% removal
C. alternifolius 675 ± 62 82 67.4 ± 3 55.9 T. domingensis 525 ± 47 86 59.7 ± 3 61 B. aethiopium 541 ±35 85.6 27.7 ± 2 82 P. karaka 525 ± 47 86 42.2 ± 8 72.4
Control 286.6 ± 27 92.4 72 ± 2 53
As shown in Table 4.3, no statistical difference (p > 0.05) was observed in sulfate removal
between the five constructed wetland cells. The maximum removal for sulfate was observed
in the Control (92.4%). In case of sulfide, significant difference (p < 0.05) was observed
between the five constructed wetland cells. The maximum removal for sulfide was observed
in the B. aethiopium (82%) followed P. karka (72.4%), T. domingensis (61%) and the least
37

removal for sulfide was observed in the Control (53 %). The maximum sulfate removal
observed in the Control was may be due to the reduction of sulfate to sulfides in the anoxic
regions favored by the lack of oxygen.
A study conducted by Assaye Ketema (2009) in Modjo Tannery using subsurface flow CWs
showed that sulfate removal ranges 94% - 96% and sulfide removal ranges 20% -50%.
Another study conducted by Berhanu Genet (2007) also showed sulfide removal of 98.7%,
98.7% and 99% using Cyperus papyrus, Cyperus alternifolus and Phoenix canariensis,
respectively for domestic wastewater using subsurface flow constructed wetlands, which has
been operating for four years. The possible reason for the lower removal efficiency of sulfide
and sulfate, compared with Berhanu Genet, might be due to the presence of high sulfur
compounds in the present study. It may also be due to the short operation time of the
constructed wetland conducted.
The sulfate can be removed through plant uptake, precipitation as chromium sulfate and
reduction to sulfides in the anoxic zones (Mitsch and Gosselink, 1993). Sulfides can be
oxidized by both chemoautotrophic and photosynthetic microorganisms to elemental sulfur
and sulfates in the aerobic zones (Mitsch and Gosselink, 1993). Certain species of
Thiobacillus bacteria obtain energy from the oxidization of hydrogen sulfide to elemental
sulfur and then further oxidize to sulfate by other species of bacteria (Mitsch and Gosselink,
1993). The produced sulfide and sulfate, readily reacts with chromium and other metals to
precipitate as metal sulfide and chromium sulfate. Sulfides of most metals such as iron (Fes)
are very stable under anoxic water-saturated conditions (US EPA, 1997). Hydrogen sulfide,
which is characteristic of anaerobic wetland, can also emit to the atmosphere.
Clay soil has a positive charge at the edge where some anions such as S042- and NH4
+ can
adsorbed on it (Collin, 2002). This capacity of clay mineral to adsorb anions is a significant
feature for the retention and transport of nutrients and pollutants through soil and water in
constructed wetlands.
38

4.5 Chromium Removal Efficiency of Constructed Wetlands
Chromium removal efficiency of the different Constructed wetlands was examined first by
studying the percentage reduction of chromium in the wastewater phase. Wastewater analysis
showed that the average influent Cr concentration was 40 ± 27 mg/L. This high variability of
Cr in the influent wastewater observed comes from different sources of wastewater released
due to different operations in the industry. Figure 4.2 below summarizes the average removal
efficiency of each CW.
Cr Removal Efficency
98
9999.3
97.797.4
9696.5
9797.5
9898.5
9999.5
CW1CW2
CW3CW4
CW5
CW cells
Rem
oval
effi
cien
cy
Keys CW1 = C. alternifolius CW2 = T. domingensis CW3 = B. aethiopium CW4 = P. karaka CW5 = Control
Figure 4. 2: Chromium removal efficiency of each CW cells
As shown in Figure 4.2, maximum chromium removal was observed in CWs planted with B.
aethiopium (99.3%) followed by T. domingensis (99%), C. alternifolius (98%) and P. Karka
(97.7%). The minimum Cr removal was observed in unvegetated CW (control) (97.4%).
Statistical analysis (p > 0.05) showed that, no significant difference was observed between
the vegetated CW cells and control, but there is an increment in Cr removal efficiency in the
vegetated CWs.
The primary mechanism for removal of metals in CWs is through immobilization by the
sulfide, sulfate (Weisa and Weisb, 2003) and hydro-oxide precipitation in the anoxic
waterlogged clay soils. Under these conditions, decay of sulfur containing proteins from
39
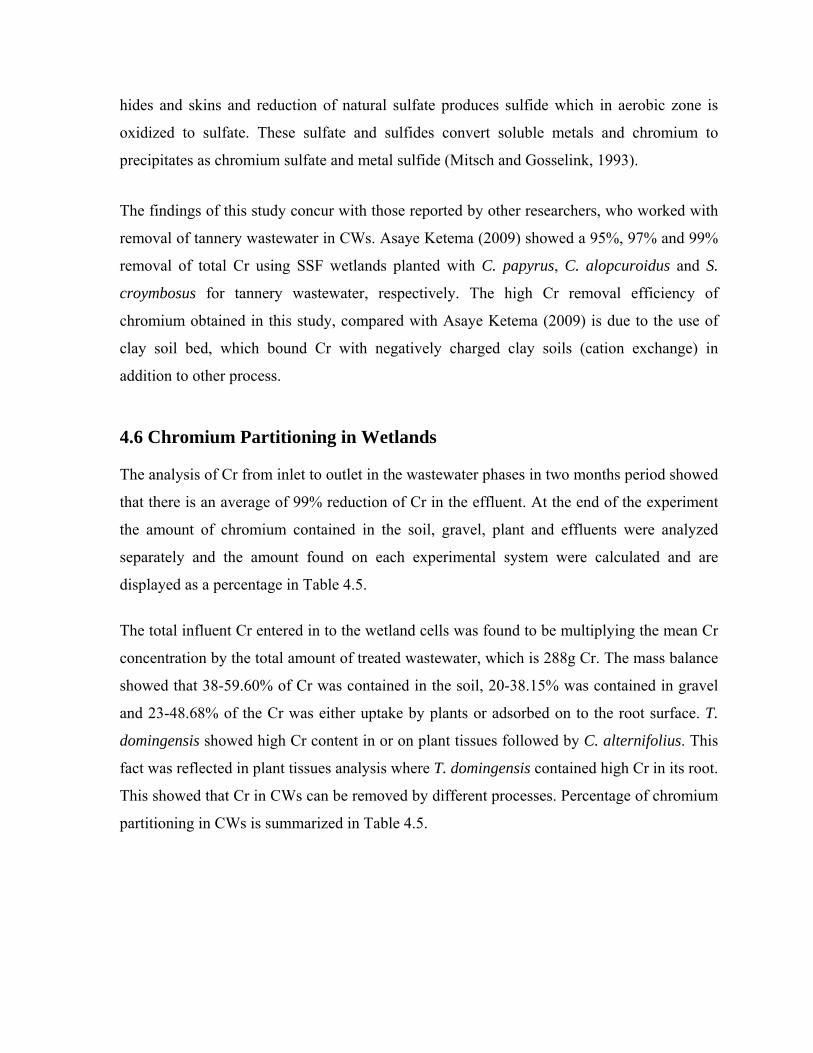
hides and skins and reduction of natural sulfate produces sulfide which in aerobic zone is
oxidized to sulfate. These sulfate and sulfides convert soluble metals and chromium to
precipitates as chromium sulfate and metal sulfide (Mitsch and Gosselink, 1993).
The findings of this study concur with those reported by other researchers, who worked with
removal of tannery wastewater in CWs. Asaye Ketema (2009) showed a 95%, 97% and 99%
removal of total Cr using SSF wetlands planted with C. papyrus, C. alopcuroidus and S.
croymbosus for tannery wastewater, respectively. The high Cr removal efficiency of
chromium obtained in this study, compared with Asaye Ketema (2009) is due to the use of
clay soil bed, which bound Cr with negatively charged clay soils (cation exchange) in
addition to other process.
4.6 Chromium Partitioning in Wetlands
The analysis of Cr from inlet to outlet in the wastewater phases in two months period showed
that there is an average of 99% reduction of Cr in the effluent. At the end of the experiment
the amount of chromium contained in the soil, gravel, plant and effluents were analyzed
separately and the amount found on each experimental system were calculated and are
displayed as a percentage in Table 4.5.
The total influent Cr entered in to the wetland cells was found to be multiplying the mean Cr
concentration by the total amount of treated wastewater, which is 288g Cr. The mass balance
showed that 38-59.60% of Cr was contained in the soil, 20-38.15% was contained in gravel
and 23-48.68% of the Cr was either uptake by plants or adsorbed on to the root surface. T.
domingensis showed high Cr content in or on plant tissues followed by C. alternifolius. This
fact was reflected in plant tissues analysis where T. domingensis contained high Cr in its root.
This showed that Cr in CWs can be removed by different processes. Percentage of chromium
partitioning in CWs is summarized in Table 4.5.
40
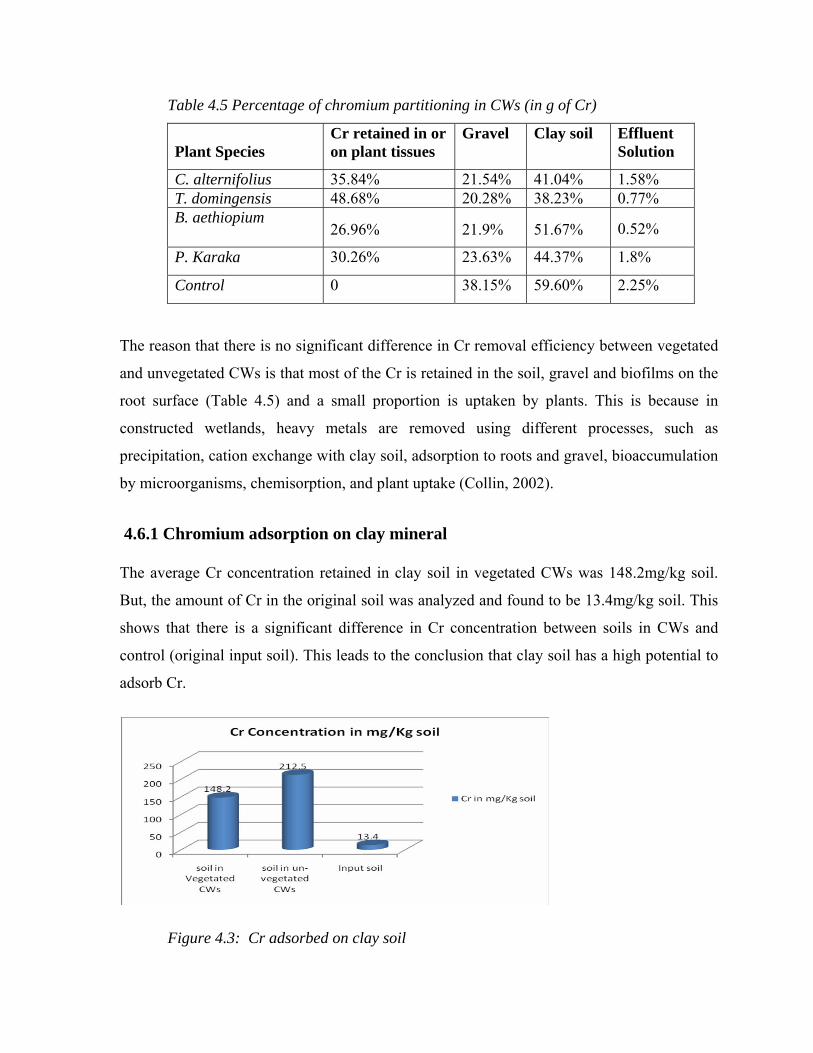
Table 4.5 Percentage of chromium partitioning in CWs (in g of Cr)
Plant Species
Cr retained in or on plant tissues
Gravel Clay soil Effluent Solution
C. alternifolius 35.84% 21.54% 41.04% 1.58% T. domingensis 48.68% 20.28% 38.23% 0.77% B. aethiopium
26.96% 21.9%
51.67%
0.52%
P. Karaka 30.26% 23.63% 44.37% 1.8%
Control 0 38.15% 59.60% 2.25%
The reason that there is no significant difference in Cr removal efficiency between vegetated
and unvegetated CWs is that most of the Cr is retained in the soil, gravel and biofilms on the
root surface (Table 4.5) and a small proportion is uptaken by plants. This is because in
constructed wetlands, heavy metals are removed using different processes, such as
precipitation, cation exchange with clay soil, adsorption to roots and gravel, bioaccumulation
by microorganisms, chemisorption, and plant uptake (Collin, 2002).
4.6.1 Chromium adsorption on clay mineral
The average Cr concentration retained in clay soil in vegetated CWs was 148.2mg/kg soil.
But, the amount of Cr in the original soil was analyzed and found to be 13.4mg/kg soil. This
shows that there is a significant difference in Cr concentration between soils in CWs and
control (original input soil). This leads to the conclusion that clay soil has a high potential to
adsorb Cr.
Figure 4.3: Cr adsorbed on clay soil
41

The soil in unvegetated CWs showed higher Cr content compared to vegetated CWs. This
may be due to plant uptake, adsorption of Cr on root surface by chelating agents, which
reduce Cr availability for cation exchange in vegetated CWs (Reddy, et al., 1989).
The adsorption of Cr on the clay soil results from chemical reactions between Cr species and
sites at the mineral surface of the clay soil or gravel. Cation exchange capacity (CEC) is
responsible for the adsorption of chromium to clay soils (Collin, 2002). In addition the
CrSO42- formed in the system precipitated and added to the soil. This phenomenon
contributes for high chromium removal by the Control.
The total amount of chromium contained in each CW gravel and soils was calculated
according to equation 3.5 and 3.6 (Table 4.5). The amount of chromium contained in the
gravel was obtained by washing the gravel with tap water and the supernatant was analyzed
for chromium. Based on this the average chromium in each CW was calculated according to
equation 3.5.
4.7 Chromium Accumulation in Plant Tissues The concentration of Cr in plant roots before introducing tannery wastewater was found to be
very low. T. domingensis and B. aethiopium has 2.07mg/kg DW and C. alternifolius and P.
karka has 0.699 mg/kg DW and 0.723 mg/kg DW, respectively.
Plant analysis, at the end of the experiment, showed that most of the chromium taken up by
the plants remained in the root (up to 83%) and the plant species differ significantly in Cr
uptake capacity and distribution within the plant. Statistical analysis (p< 0.05) showed that,
there is a significant difference in chromium uptake and accumulation in roots, stem and
leaves of each experimental plant. The average chromium concentration (mg/kg DW) in the
four selected plant tissues is summarized in Table 4.6.
42

Table- 4.6: Average Cr concentrations (mg/kg) in selected plans tissues
Plant tissues C. alternifolius T. domingensis B. aethiopium (Palm)
P. karka (Reeds)
Roots 1472.00 1848.00 180.90 69.24
Stems 96.22 No stem 82.24 16.98
Leaves 162.40 111.70 65.17 34.78
Control(Root) 0.699 2.07 2.07 0.723
Total 1730.32 1961.77 330.38 121.72
4.7.1 Comparison of chromium accumulation in roots of different plants
Statistical analysis (p < 0.05) showed that there is a significant difference in chromium
uptake between roots of each experimental plant. The maximum chromium concentration
was observeed in T. domingensis (1848 mg/kg DW) followed by C. alternifolius (1472
mg/kg DW). These plants have significantly greater chromium concentration in their roots
than any other plants. However, they exhibited the signs of chromium toxicity in their leaves.
The concentration of chromium in the roots of T. domingensis (1848 mg/kg DW) was
significantly greater than C. alternifolius (1472 mg/kg DW), P. karka (69.24 mg/kg DW) and
B. aethiopium (180.9 mg/kg DW). In contrast, the B. aethiopium and P. karka removed
significantly more chromium and nutrients in the wastewater phase because of its greater root
and shoot mass.
The reason that T. domingensis has high concentration of Cr in its roots is the plants have fast
growing spongy root which enables the plant to absorb more Cr compared to other plants. C.
alternifolius has also has higher chromium concentration in the root compared to B.
aethiopium and P. karka due its high growth rate.
43

4.7.2. Chromium accumulation in roots compared with stems
Statistical analysis showed (p < 0.05) that there is significantly higher concentration of Cr in
roots compared to stems. All plant species used in this study accumulated more Cr in their
roots. This is because chromium can be adsorbed at the extracellular negatively charged sites
(COO-) of the root cell walls (Weisa and Weisb, 2003). These binding capacities of
chromium to cell wall and adsorption to the root surface increase its concentration in the root.
In addition, it may be due to the insufficient translocation ability of plants from roots to
shoots and Cr immobilization in the vacuoles of the root cells (Shanker et al., 2004).
There is also considerable variation between selected plant species in the amount of Cr
accumulated in the roots and transported to the stems. Root to stem Cr concentration ratios
were in the range of 15 to 4 in T. domingensis and P. karka, respectively.
The biomass of the aerial parts of C. alternifolius contained significantly more chromium
than any other plants in the CWs (Table 4.4). Although T. domingensis do not have aerial
stem to accumulate Cr in their stems (due to the short underground rhizome), they
accumulated more Cr in their roots.
4.7.3. Chromium accumulation in stems compared with leaves
Stems and leaves analysis also showed that there is a significant difference in Cr
accumulation in shoots compared to leaves of experimental plants. The highest value of Cr
accumulation in leaves was recorded in C. alternifolius (162.4 mg/kg DW) followed by T.
domingensis (111.7 mg/kg DW) and B. aethiopium (65.17 mg/kg DW) (Table 4.4). The
minimum was recorded in P. karka (34.78). The maximum Cr accumulation in stems was
recorded in C. alternifolius (96.22 mg/kg DW) and the minimum was recorded in P. karka
(16.98). All plants leaves accumulated more Cr than stems, because during translocation up
wards, Cr destination is the leaf, where it is stored
44
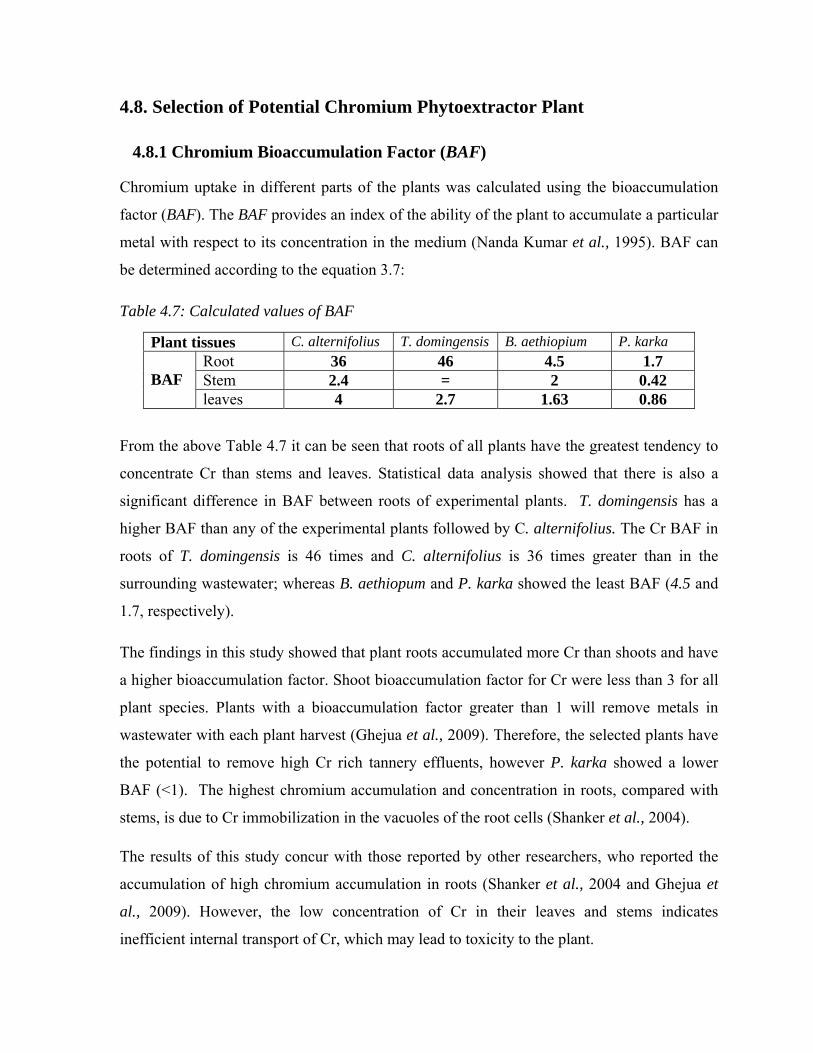
4.8. Selection of Potential Chromium Phytoextractor Plant
4.8.1 Chromium Bioaccumulation Factor (BAF) Chromium uptake in different parts of the plants was calculated using the bioaccumulation
factor (BAF). The BAF provides an index of the ability of the plant to accumulate a particular
metal with respect to its concentration in the medium (Nanda Kumar et al., 1995). BAF can
be determined according to the equation 3.7: Table 4.7: Calculated values of BAF
Plant tissues C. alternifolius T. domingensis B. aethiopium P. karka Root 36 46 4.5 1.7 Stem 2.4 = 2 0.42
BAF
leaves 4 2.7 1.63 0.86
From the above Table 4.7 it can be seen that roots of all plants have the greatest tendency to
concentrate Cr than stems and leaves. Statistical data analysis showed that there is also a
significant difference in BAF between roots of experimental plants. T. domingensis has a
higher BAF than any of the experimental plants followed by C. alternifolius. The Cr BAF in
roots of T. domingensis is 46 times and C. alternifolius is 36 times greater than in the
surrounding wastewater; whereas B. aethiopum and P. karka showed the least BAF (4.5 and
1.7, respectively).
The findings in this study showed that plant roots accumulated more Cr than shoots and have
a higher bioaccumulation factor. Shoot bioaccumulation factor for Cr were less than 3 for all
plant species. Plants with a bioaccumulation factor greater than 1 will remove metals in
wastewater with each plant harvest (Ghejua et al., 2009). Therefore, the selected plants have
the potential to remove high Cr rich tannery effluents, however P. karka showed a lower
BAF (<1). The highest chromium accumulation and concentration in roots, compared with
stems, is due to Cr immobilization in the vacuoles of the root cells (Shanker et al., 2004).
The results of this study concur with those reported by other researchers, who reported the
accumulation of high chromium accumulation in roots (Shanker et al., 2004 and Ghejua et
al., 2009). However, the low concentration of Cr in their leaves and stems indicates
inefficient internal transport of Cr, which may lead to toxicity to the plant.
45

4.8.2 Chromium Translocation Factor (TF)
The moment wetland plants translocate metals from root to aerial tissue; they accumulated in
stems and leaves. The degree of upward translocation is dependent on the plant species and
the particular metal (Shanker et al., 2004). Uptake of metals into root cells, the point of entry
into living tissues, is the first step for the process of phytoextraction. However, for
phytoextraction to occur continuously metals must also be transported from the root to the
shoot. The TF can be calculated according to the equation 3.8:
Table 4.8: Chromium Translocation factor (TF)
C. alternifolius T. domingensis B. aethiopium
(Paln)
P. karka
(Reeds)
TF
0.17 0.06 .0.8 0.72
The plant translocation factor (TF), the ratio of Cr concentration in shoot tissue to Cr
concentration in root tissue is shown in Table 4.8. The highest TF is assumed by B.
aethiopium and followed by P. karka, which showed their higher Cr translocation efficiency.
These plants have high biomass per meter square area than Typha and Cyprus. This fact is
reflected in the Cr and nutrient removal efficiency in the water phase, where B. aethiopium
has the highest Cr removal efficiency and P. karka has the highest BOD5, COD and nitrogen
removal efficiency.
Plants with high BAF coupled with high TF values are efficient in the removal of Cr from
CWs because harvesting the areal part removes Cr from the system. Plants must have the
ability to translocate Cr from the root to the shoot, in order for a plant to continue absorption
of Cr from the medium, since a higher concentration of Cr in the root is toxic to plants
(Skiffington, et al., 1976; Perk, 2006). Translocation can reduce Cr concentration, and thus
reduce toxicity potential to the root and it is also one of the mechanisms of resistance to Cr,
because the high concentration of Cr will be lost during harvesting or leaf fall.
46

It is important to note that, the total amount of chromium ions associated with the root; only a
part is absorbed into cells. A significant ion fraction is physically adsorbed at the
extracellular negatively charged sites (COO-) of the root cell walls (Lasat, 2000). The cell
wall-bound fraction cannot be translocated to the shoots, therefore, cannot be removed by
harvesting shoot biomass (phytoextraction). Thus, it is possible that a plant exhibiting
significant metal accumulation into the root, expresses a limited capacity for phytoextraction.
For supporting this, Blaylock and Huang (1999) concluded that the limiting step for metal
phytoextraction is the long distance translocation from roots to shoots.
4.9. Chromium Tolerance of the Selected Plant Species The concentration of chromium in the plants and whether they appear healthy or not can
indicate the tolerance of that plant to the metal concerned, and therefore their potential for
phytoremediation (Mant, et al., 2006). During the study period B. aethiopium and P. karka
have not showen signs of toxicity. They tolerated high Cr concentration in the tannery
wastewater ranging 8mg/L to 95 mg/L total Cr. However, C. alternifolius and T. domingensis
leaves and some stems of C. alternifolius dried after being exposed to a high Cr content of
tannery wastewater (95 mg/L).
The ability of B. aethiopium and P. karka to withstand greater concentrations was by
minimizing these effects which indicate plants tolerance to the chromium. The ability of the
plants to stay healthy, high overall efficiency of nutrient removal and therefore continue to
grow in the system, in addition to bioaccumulation, is also an important factor in the choice
of plants for phytoremediation. A plant will only take up chromium to a great extent if it is
growing, and it will only grow if it can tolerate the concentration of metal in the media in
which it is growing.
47

Tolerance to metals in plants can be achieved by sequestering them in tissues or cellular
compartments (e.g. central vacuoles) that are insensitive to metals and adsorbed at the
extracellular negatively charged sites (COO-) of the root cell walls (Weisa and Weisb, 2003).
The translocation of excessive metals into old leaves before their shedding can also be
considered as tolerance mechanisms (Weisa and Weisb, 2003). Plants may also be able to
reduce Cr(VI) to Cr(III), a detoxification reaction that very likely occurs in roots (Ernst, et
al., 1992).
48

CHAPTER FIVE
CONCLUSIONS AND RECOMENDATIONS
5.1. Conclusions The aim of this study was to investigate phytoextraction potential of selected plant species in
CWs receiving high strength (chromium rich) tannery industry wastewater. The results of
this experiment lead to the following conclusions.
1. Subsurface flow wetlands (SSF) planted with C. alternifolius, T. domingensis, B.
aethiopium and P. karka are capable of removing Cr and organic pollutants from tannery
wastewater. However, for Cr no significant difference removal efficiency was observed
between the control and vegetated CWs. all CWs containing plants showed 97.7% to
99.3% Cr removal efficiency.
2. T. domingensis is the plant species with high chromium BAF (46) followed by C.
alternifolius (36) but have less TF and nutrient removal efficiency.
3. The plants B. aethiopium and P. karka were the plant species with high Cr translocation
factor (0.46 and 0.23, respectively) and better adapted to tannery wastewater, therefore,
they are potential candidates for the phytoremediation of Cr.
4. CWs with subsurface flow can be a viable alternative for the removal of chromium (>99%)
from tannery wastewater, below EEPA standards, and able to tolerate inflow fluctuations,
including interruptions in the feed.
5. COD and BOD5 removal (ranges from 58-80% and 66-77%, respectively), when compared
with the removal efficiencies achieved for Chromium and the effluent discharge limits set
by EEPA, were low. Also nutrient removal is low when compared with the removal
efficiencies achieved for COD and BOD5.
6. For small factories, with no land scarcity, conventional treatment methods, to remove Cr,
are often not considered to be economically feasible. The findings from this study
indicates that CWs, using selected plant species, could achieve the similar levels of clean
up and are often very cost effective and environmentally friendly. Therefore, the
development of this experimental system into a large-scale working unit offers an
attractive alternative for low-level income countries to protect their environment.
49
5.2. Recommendation In order to recommend a subsurface constructed wetland system for the treatment of tannery
effluents in developing countries like Ethiopia, further study should be done on:
1. Subsurface flow constructed wetland using a combination of more than one type
of plant is essential to remove different pollutants.
2. It was recommended that T. domingensis, B. aethiopium and P. karka should be
taken for further study in phytoremediation work of chromium contaminated
sites in different hydraulic retention times.
3. For better nutrient removal and to meet EEPA standards constructed wetland
should be used as a secondary treatment.
4. The different Cr species in the plant tissue should be studied.
5. The efficiency of subsurface constructed wetland system as secondary or tertiary
treatment after the reduction of nutrients and Cr should also be studied.
50

References
Alves, M. M., Gonzalez, C.G., Guedes De Carvalho, R., Castanheira, J.M., Sol Pereira, M.C.,
Vasconcelos, L.A.T. (1993). Chromium Removal in Tannery Wastewaters:
‘Polishing’, Pinus Sylvestris Bark. Water Research, 27(8), pp-1333-1338.
Anthony, D. C. (1997). Modern Tanning Chemistry, British School of Leather Technology,
Nene College of higher education, Boughton Green Road. Mountain Park
Northampton, UK NN2 7AL. Chemical Society Review. pp. 111 - 126.
APHA (1998). Standard Methods for the Examination of Water and Wastewater: Twentieth
ed. American Public Health Association/ American Water Works
Association/Water Environment Federation; Washington DC; USA.
Aruns, K., Shanker (2000). Uptake and Phytoaccumulation of Chromium by Selected Tree
species: Tamilnadu Agricultural University; Department of Physiology.
Washington DC.
Asaye Ketema (2009). Evaluation of Selected Plant Species for the Treatment of Tannery
Effluent in a Constructed Wetland System; (Unpublished Thesis), AAU, Addis
Ababa. Avilable at: en.wikipidia.org/winki/ITRC
Bajza, Z. and Vreck, I. V. (2001). Water Quality Analysis of Mixture Obtained From
Tannery Waste Effluent. Ecotoxicology and Environmental Safety; pp 15 - 18.
Baker, A.J.M. and P.L. Walker (1990). Ecophysiology of Metal Uptake by Tolerant Plants,
In Heavy Metal Tolerance in Plants: Evolutionary Aspects, Shaw, A.J., Ed., CRC
Press, Boca Raton, FL, 155-177.
Baker, ATM. Mcgranth, Reeves, RD. and Smith, JAC. (2000). Metal Hyper Accumulator
Plants. A review of the Ecology and Physiology of Biochemical Resource for
Phytoremediation of Contaminated Soil and Water: PP.85-107.
Beatriz, R. (2000). Towards a Cleaner Production in Developing Country: A Case Study in a
Chilean Tannery.
Berhanu Genet (2007). Constructed wetland system for domestic wastewater treatment: A
case study in Addis Ababa, Ethiopia. Unpublished MSc thesis in Environmental
science. Addis Ababa University.
Blaylock M. J. and Hang, M. (2000). Enhanced Accumulation of Pb in Indian mustered
Family by Soil-Applied Chelating Agents.Environm-Sci.-Techno.31: 860-865.
51

Bolt, G.H. and Bruggenwert, M.G.M. (1978). Soil Chemistry: A Basic Element.
Brix, H. (1993). Wastewater Treatment in Constructed Wetland System Design: Removal
Processes and Treatment Performance. In Moshiri, G. A. (ed). Constructed
wetland for water quality improvement; CRC press Inc.
Brix, H. (1994). Functions of Macrophytes in Constructed Wetlands: Water Sciences
Technology. 29 (4), 71 – 78.
Brodrick, S. J. Cullen, P. and Maher, W. (1988). Denitrification in Natural Water Receiving
Secondary Treated Effluent: Water Research. 22(4), 431 – 434.
Brooks, R., Chambers, M., Nicks, L. and Robonson, B. (1998). Phytomining: Trends in
Plant Science, 3:359–62.
Byrne, C.J. and DeLeon, I. R. (1986). Trace Metal Residues in Biota and Sediments from
Lake Pontchartrain, Louisiana. Bulletin of Environmental Contamination and
Toxicology 37, 151- 158.
Cervantes, C., Campos, J., Devars, S., Gutierrez, F., Loza, H., Torres, J.C., Moreno, R.
(2001). Interactions of Chromium with Microorganisms and Plants. Microbiology
Reviews 25, 335-347.
Chaney, L., Brown SL., Homer FA., Malikm Angel Js., Baker AJM., Reeves RD., and Chin
M. (2000). Improving Metal Hyper Accumulator Wild Plants to Develop
Commercial Phyoextraction System: Approaches and Progress in
Phytoremediation of Contaminated Soil and Water PP. 129-158.eds N Terry,
G.Banvelos and Jvangronsreld CRC press.
Cloete, T. E. and Muyima, N. Y. O. (1997). Microbial community analysis: The key for the
design of biological wastewater treatment systems. IAWQ No. 5, England. ISBN
1-900222 - 02 - 7.
Collin, B and Michael, C. (2002). Environmental Chemistry; 4th ed. New York.
Cristina, S. C. C., Rangel, A. O. S. S. and Castro, P. M. L. (2006). Constructed Wetland
System Vegetated With Different Plant Applied to the Treatment of Tannery
Wastewater. Elsevier Ltd.
DeBusk, W. F. (1999a). Wastewater Treatment Wetlands; Contaminant Removal Processes:
Soil and Water Sciences. Department; University of Florida. SL155.
52
DeBusk, W. F. (1999b). Wastewater Treatment Wetlands; Applications and Treatment
Efficiency: Soil and Water Sci. Department. University of Florida. SL156.
Del Pozo, R. and Diez, V. (2003). Organic Matter Removal in Combined Anaerobic–aerobic
fixed-film Bioreactors. Wat. Res. 37, 3561 – 3568.
Doan, H and Lohi, A. (2001). Intermittent aeration in biological treatment of wastewater;
American J. of Engineering and Applied Sciences 2 (2), 260 - 267.
EEPA (1997). Environmental Protection Authority. Annual Report; Addis Ababa, Ethiopia.
EEPA (2003). Environmental Protection Authority. Annual Report; Addis Ababa, Ethiopia.
EIBC (2007). Ecosystem of Ethiopia: Ethiopian Institute of Biodiversity Conservation.
Institute of Biodiversity Conservation.
Ernst, W.H.O., Verkleij, J.A.C. and H. Schat (1992): Metal Tolerance in Plants. Acta Bot. Neerl. 41,229-248,
ETPI (1998). Environmental Report of the Leather Sector: Final Report; Environmental
Technology Program for Industry, Karachi.
Evans, M.; Furlong, C. (2003). Environmental Biotechnology: Theory and Application.
University of Durham, UK and Taeus Biotech Ltd.
Faithefull, L. (1996). The Fate of Phosphorus in Wetland: Review Report for the Queensland
Department of Natural Resource. Australia Centre for Tropical Freshwater
research.
Gallagher, R.P., and Patrick, J., (1978). Chemical and Microbial Properties of Anaerobic Soil
and Sediments, in plant life in an aerobic environment. Ann Arbor Sci. Pub. Inc.,
Ann Arbor, Mich., pp.375-423.
Gersberg, R. M., Elkins, B. V., Lyon, S. R. and Goldman, C. R. (1986). Role of Aquatic
Plants in Wastewater Treatment by Artificial Wetlands. Water Res. 20, 363 - 368.
Gersberg, R.M. (1984). The Removal of Heavy Metals by Artificial Wetlands. In
Proceedings Water Reuse Symposium, III. Vol. 2. AWWA Research Foundation,
p. 639.
Ghejua, M., Balcub, I. and Ciopeca, M. (2009). Analysis of Hexavalent Chromium Uptake by Plants in Polluted Soils Volume 20, Number 1, Pp. 127-131, Ovidius University Press, Romania
Greenway, M. (2003). Suitability of Macrophytes for Nutrient Removal from Surface Flow
Constructed Wetland Receiving Secondary Treated Effluent In Queensland,
Australia. Wat. Sci. Tech. 48 (2), 211 - 218.
53
Greenwood, D. J., (1961). Effect of Oxygen Concentration on the Decomposition of Organic
Material in Soil and Plant. p 360.
Guntenspergen, G. R., Stearns, F. F. and Kadlec, J. A. (1989). Wetland vegetation:
Constructed Wetlands for Wastewater Treatment; Municipal, Industrial and
Agricultural. Lewis Publishers, Michigan. pp. 73 - 89.
Hafez, A.I., El-Manharawy, M.S., Khedr, M.A. (2002). RO Membrane Removal of
Unreacted Chromium from Spent Tanning Effluent: A Pilot- Scale Study, Part 2.
Hammer, D. A. (1990). Constructed Wetlands for Wastewater Treatment: Municipal,
Industrial and Agricultural. CRC press, Roca Raton, FL.
Haydar, S., Aziz, J. A. and Ahmad, M. S. (2007). Biological Treatment of Tannery
Wastewater Using Activated Sludge Process. Pakistan Journal of Engineering
and Applied Science. 1, 61 – 66.
Hazen and Sawyer (2006). A Review of Nitrogen Loading and Treatment Performance
Recommendations for Onsite Wastewater Treatment Systems (OWTS): in the
Wekiva Study Area, Florida Department of Health, Wekiva Issue Paper. Folorida.
Herna´ndez , J.T. and Dendooven, L.(2006). Effects of tanneries wastewater on chemical
and biological soil characteristics. App. Soil Ecol. 33.
Heukelekian, H., Balmat J.L. (1959). Chemical composition of the particulate fractions of
domestic sewage. Sewage & Industrial Wastes, 81:413-423.
http//www.epa.gov/nrmr/pubs/625r00008/html/html/tfs9hkm.
Huffman, Jr EWD, Allaway HW. (1973b). Growth of Plants in Solution Culture Containing
Lowlevels of Cr. Plant Physiolog. 52:72-5.
Hughes, JB., Shanks, J.V., Anderford, M., Lautizen (2002). Plant Tissue Cultures: Environ,
Sci. Techno, 31:266-271.
Infogate/GTZ (2002). Treatment of Tannery wastewater. Germen Appropriate Technology
(GATE) information system. Available at: http://www.gtz.de/gate/gateid.afp.
ITRC (2003). Industrial Technology Research Center; India.
Jackson, M. B. and W. Armstrong, W. (1999). Formation of Aerenchyma and the Process of
Plant Ventilation in Relation to Soil Flooding and Submergence Plant. Biol.1 pp
274 - 287.
54
James, B.R. (1996). The Challeng of Remediating Chromium-Contaminated Soil. Environ, Sci. Techn.30: 248A-51A
Jochimsen, J.C. & Jekel, M.R. (1997): Partial oxidation effects during the combined
oxidative and biological treatment of separated streams of tannery wastewater.
Water Science and Technology 35, 337–345.
Joseph, K. (2005). Optimizing Processes for Biological Nitrogen Removal in Nakivubo
Wetland. Uganda. Stocholm, Sweeden.
Kadlec, R. H. and Knight, R. L. (1996). Treatment Wetlands. CRC press. LLC, Baco Rabon,
Florida.
Kadlec, R. H., Knight, R. L., Vymazal, J., Brix, H., Cooper, P. and Haberl, R. (2000).
Constructed Wetlands For Pollution Control Processes, Performance, Design And
Operation. IWA Scientific and Technical Report, No. 8. IWA Publishing,
London, UK.
Karen .K and Michael, L. (1994). Textile Process Wastewater Permits: An Update and
Strategies. African dyestuff reporter, Univ. of Georgia, Athens, GA
Kaseva, M. (2003). Performance of Subsurface Flow Constructed Wetland in Polishing Pre-
treated water; A tropical case study. J. Water Research. 38, 681 - 687.
Khan, A.G., 2001. Relationships between Chromium Biomagnification Ratio, Accumulation
Factor, and Mycorrhizae in Plants Growing on Tannery Effluent-Polluted Soil.
Environmental International. 26, 417-423.
Kocaoba, S., Akcin, G. (2002). Removal and Recovery of Chromium and Chromium
Speciation with MINTEQA2; Talanta 57, 23-30.
Kornarios, M. and Lyberato, G. (2006). Biological Treatment of Wastewater from a Dye
Manufacturing Company Using a Trickling Filter. Journal of Hazardous Material. pp
95 – 102.
Kvet. J., Dusek, J. and Husak, S. (1999). Vascular Plants Suitable for Wastewater Treatment
in Temperate Zones. In Vymasal, J. (ed.), Wetlands-nutrients, Metals and Mass
Cycling. Backhuys Pubishers, Leiden, The Netherlands. pp. 101 - 110.
Lasat, M. (2000). The Use of Plants for the Removal of Toxic Metals from Contaminated
Soil; American Association for the Advancement of Science: Environmental
Science and Engineering Fellow.
55

Lefebvre, O., Vasudevan, N., Thanasekaran, K.and Moletta, R. (2006). Anaerobic digestions
of tannery soak liquor with an aerobic post-treatment. Wat.Res., 40, 1492– 1500.
Lyon G L., Brooks R R., Peterson, P J., and Butle, GW. (1969). Some Trace Elements in
Plants Serpentine Soils; Nz.J.Sci.13 133-139.
Mahdi Ahmed, et.al. (2007). (The Malaysian Journal of Analytical Sciences: Behaviour and
Fate of Heavy Metals in the Composting Of Industrial Tannery Sludge.
Department of Chemica and Environment, Faculty of Engineering 43400 UPM,
Serdang, Malaysia, Vol 11 No 2
Mahvi, A. H. (2008). Sequencing Batch Reactor: A promising technology in wastewater
treatment. Iran. J. Environ. Health. Sci. Eng. 5 (2), 79 – 90.
Maine, M. A., Sune, N., Hadal, H., Sanchez, G. and Bonetto, C. (2006). Nutrient and Metal
Removal in a Constructed Wetland for Wastewater Treatment from a Metallurgic
Industry: Ecological Engineering. 26, 341 - 347.
Mant, C. Costa, S. Williams, J. and Tambourgi, E. (2005). Studies of Removal of Chromium
by Model Constructed Wetland: Brazilian Journal of Chemical Engineering.
Department of Civil Engineering, University of Portsmouth, Portsmouth,
Hampshire, PO1 3HF, UK. Vol. 22, No. 03, pp. 381 – 387.
Martha, S. (2003). Habitat Value Of Natural And Constructed Wetlands Used To Treat
Urban Runoff. Literature Review; A Report Prepared for the California State
Costal Conservancy, Southern California coastal water research project.
Masud, M., Baig, M., Hassan,I., Qazi, A., and Malik, M. (2001). Textile wastewater
characterization and reduction of its COD & BOD by oxidation. Electronic
Journal of Environment, Agriculture and Food chemistry.
Mehari Alebachew (2006). Uptake and Phytoaccumulation of Chromium at Seedling Stage
for Three Commonly Grown Tree Species in Ethiopia. (Unpublished
Thesis).AAU. Addis Ababa.
Mitsch, W.J., and Gosselink, J.G. (1993). Wetlands, 2nd Edition. Van Nostar and Reinhold,
New York.
Myers, J. E., Texaco S. H. and E. L. M. Jackson. (2001). Evaluation of Subsurface Flow and
Free Water Surface Wetlands Treating NPR-3 Produced Water. Prepared For The
US Department Of Energy/Rocky Mountain Oil Field Testing Center. Critique Inc.
56

Naidu, R., Smith LH., Mowart D.,Kookana, RS. (2000b). Soil plant, Transfer of Chromium
from Tannery Waste Sludge. Results from Glass House Study: In: Naidu
R.Willer.Proceedings No.88. Canberra, Australia.
Nanda Kumar, P. B. A., Dushenkov, V., Motto, H., and Raskin, I. 1995. Phytoremediation:
The Use of Plants to Remove Heavy Metals from Soils. Environ. Sci. Technol. 29,
1232–1238.
NAS (National Academy of Science) (1974). Chromium-NAC.Washingten DC.USA.
Newman, J. M., Clausen, J. C. and Neafsey, J. A. (2000). Seasonal Performance Of A
Wetland Constructed To Process Dairy Milkhouse Wastewater In Connecticut:
Ecological Engineering 14, 181 - 198.
Palmer, C. D. and Wittbrodt, P. R. (1991). Processes Affecting The Remediation Of
Chromium Contaminated Sites. Environ. Health Perspect. 92, 25–40.
Perk,M.V.D. (2006). Soil and Water Contamination: From Molecular to Catchments Scale.
London; JK.
Peter, C. Grevatt, Ph.D. (1998).Toxicological Review of trivalent chromium: In Support of
Summary Information on the Integrated Risk Information System (IRIS). U.S.
Environmental Protection Agency, Washington, DC.
Petterson, RR., and Girling J. (1981). Reduction of Hexavalent Cr by Amorphous Iron
Sulfide. Environ Sci.Techon 31: 2039-2044.
Potter, C. and Karathanasis, A. (2001). Vegetation Effect on the Performance of Constructed
Wetlands Treating Domestic Wastewater. Proceeding of the 9th National
Symposium on On-site Wastewater Treatment (11 - 14 March, 2001 Forth Worth,
Texas, USA). American Society of Agriculture and Biological Engineers. pp. 662 - 672.
Pries, J. H. (1994). Wastewater and Stormwater Applications of Wetlands in Canada. North
American Wetlands Conservation Council (Canada), Ottawa, Ont. pp. 66.
Rajamanickam, S. V. (2000). A Successful and Sustainable Hazardous Waste Management
Technology Chromium Recovery and Reuse System in Tanneries of South Asia
and Africa. Pollution Prevention/ Waste Minimization. India.
Ramelow, G.J., Webre, C.L., and Mueller, J. (1989). Variations of Heavy Metals and Arsenic
in Fish and Other Organisms from the Calcasieu River and Lake, Louisiana. Arch.
Environmental Contamination Toxicology 18, 804- 818.
57

Ramsar Convention Bureau (1997). The Ramsar Convention Manual. A Guide to the
Convention on Wetlands (Ramsar, Iran, 1971), 2nd ed. Ramsar Convention. RCB.
Raskin I., Smith, RD., and Salt, DE. (1997). Phytoremediation of Metals: Using Plants to
Remove Pollutants from the Environment; Curr.Opin.Biotechnol.8221-226.
Reddy, K (2004). Nitrification-Denitrification at the Plant Root–Sediment Interface in
Wetlands. Limnol. Oceanogr. 34 (6), 1004 – 1013.
Reed, S. C., Crites, R. W., Middlebrooks, E. J. (1995). Natural Systems for Waste
Management and Treatment; 2nd edition. McGraw - Hill, New York
Reeves, RD. (2004). Nickel and Zinc Accumulation by Species of Thlapsi L., Cochlearia L.,
and other Genera of the Brassicaceae. Taxon 37 309-318.
Regional Programme for Pollution Control in the Tanning Industry in South-East Asia united
nation’s industrial development organization
Renee, L. (2001). Constructed Wetlands; Passive System for Wastewater Treatment.
Technology Status Report, Prepared For the USEPA Technology Innovation
Office under a National Network of Environmental Management Studies Fellowship.
Richard, E. (1998). Demonstration/Evaluation of Constructed Wetland as an Alternative
Onsite Wastewater Treatment System. Texas Agricultural Extension Service
Project, Department of Agricultural Engineering. Galveston Bay information.
Salt, D. E., Blaylock, M., Kumar, N. P. B. A., Dushenkov, V., Ensley, B. D., Chet, I., and
Raskin, I. 1995. Phytoremediation. A Novel Strategy for the Removal of Toxic
Metals from the Environment Using Plants. Biotechnology 13, 468–474.
Saxena,R.M.,P.F.,Kewal,R.S.,Yadav and A.K.Bhatnargar(1986). Impact of Tannery
Effluents on Some Pulse Crops. Indian.J.Environ Hlth.28 (4): 345-348.
Sebsibe, D., Sue, E., and Inga, H. (1997). Flora of Ethiopia and Eritrea; Hydrocharitaceae to
Arecaceae. Addis Abeba Ethiopia. Vol. 6. and Vol. 7.
Seyoum Leta, Fasil Assefa, Gumaelius. L, and Dalhammar G. (2004). Biological Nitrogen
and Organic Matter Removal from Tannery Wastewater in Pilot Plant Operations
in Ethiopia. Appl Microbiol Biotechnology. Springer-Verlag .
Shahandeh, H. and Hossner, L. R. (2000). International Journal of Phytoremediation. Plant
Screening for Chromium Phytoremediation. Soil and Crop Sciences Dept., Texas
A&M University, TX
58

Shanker, A.K., Djanaguiraman, M., Sudhagar, R., Chandrashekar, C.N. and Pathmanabhan,
G. (2004). Plant Science. 166, 1035.
Sharma DC., Sharma, P. (1993). Chromium Uptake and its Effect on Growth and Biological
Yield of Wheat. Cetreal Res Commun; 21:317-21.
Sinclair, K. (2000). Guidelines for Using Free Water Surface Constructed Wetlands to Treat
Municipal Wastewater Sewage. Queensland Department of Natural Resources.
Singanan, M., Alemayehu Abebaw and Singanan, V. (2007). Studies of the Removal of
Hexavalent Chromium from Industrial Wastewater by Using Biomaterials. ISSN;
1579-4377. EJEAFChe. 6 (11), 2557 - 2564.
Skeffington, R., Shwery.PA., Peterson, PJ. (1976). Chromium Uptake and Transport in
Barely Seedlings (Hordeum vulgare L.). Plantrta (Ber) 132:209-214.
Stanberg,A.L.,D.D.Hemphilli and V.V.Volk(1984c).Yield and Elemental Concentration of
Sweet Corn Grown on Tannery Wastes Amended Soil.J.Environ.Qual.13:162-166.
Tchobanoglous, G. (1997). Land Based Systems Constructed Wetland And Aquatic Plant
Systems In The United States. An overview, In: Etnier, C. and Guterstan, B. (eds),
Ecological Engineering for wastewater treatment, 2nd edition. CRC press, Boca
Raton, Florida. pp. 77 – 87.
Thares .S and Wongpanga (2000). Chromium Removal Efficiency by Vetiveria Zizanioides
and Treatment Wastewater Department of Environmental Engineering, Faculty of
Engineering, Interdepartment of Environmental Science, Chulalongkorn
University, Bangkok 10330, Thailand.
Tiffin, L.D.(1997).The Form and Distribution of Metals in Plants: an overview,In
Proc.Manford Life Science.Symps. U.S. Department of Energy,Symposium Series,
Washington DC.PP.315.
UNIDO (2000). United Nations Industrial Development Organization.
USEPA (2000). Introduction to Phytoremediation; Office of Research and Development,
EPA/600/R99/107, Available at: http://www.itrcweb.org/PHYTO2.pdf.
USEPA (1993). Subsurface Flow Constructed Wetland for Wastewater Treatment. A
Technology Assessment. EPA/832/R/93/008.
USEPA (1999). Constructed Wetlands Treatment of Municipal Wastewaters.
EPA/625/R/99/010. Cincinnati, Ohio.
59

USEPA (2004). Primer for Municipal Wastewater Treatment Systems. Office of Wastewater
Management, Washington D. C.
USEPA (2008). Onsite Wastewater Treatment Technology Fact Sheet 9, Enhanced Nitrogen
Removal - Nitrogen. pp. 45 - 52. EPA/625/R/00/008. Accessed on
USPHS (1997). Toxicological Profile for Chromium. Agency for Toxic Substances and
Disease Registry. U.S. Public Health Service.
Vlyssides, A., Israilides, C.J., 1997. Detoxification of Tannery Waste Liquors with an
Electrolysis System. Environmental Pollution 97(1-2), 147- 152.
Vymazal, J. (1998). Constructed Wetlands for Wastewater Treatment in Europe; Backhuys
Publishers, Leiden, The Netherlands. pp. 95 - 121.
Vymazal, J. and Kr+opfelova, L. (2005). Growth of Phragmites Australis and Phalaris
Arundinacea in Constructed Wetlands for Wastewater Treatment in the Czech
Republic. Ecol. Eng. 25, 606 – 621.
Weisa J. S. and Weisb, P. (2003). Metal Uptake, Transport and Release by Wetland Plants:
Implications for Phytoremediation and Restoration. Environment International, Pp
685– 700. Available at: Www.Elsevier.Com/Locate/Envint. Wikipidea (2007). Constructed wetland. Accessed on March 19th, 2009.
http;//en.wikipedia.org/wiki/constructedwetland.
William, N. A. (1990). Human Impact on the South Florida Wetlands. In Woodwell, G. M.
(eds.) The earth in transition pattern and process of biotic impoverishment.
Cambridge University press, New York. pp. 463 – 475.
Wood, A. (1990). Constructed Wetlands For Wastewater Treatment - Engineering And
Design Considerations; In: Cooper, P. F. and Findlater, (eds) (1990); Constructed
wetlands in water pollution control. pp. 481 - 494.
Zayed, A., Lytle, C.M., Qian-Jinhong: Terry, N., J.H. (1998). Chromium Accumulation,
Translocation and Chemical Speciation in Vegetable Crops”. Plants, 206:293-299.
Zinabu Gebre-Mariam and Zerihun Desta (2002).The Chemical Compostion of of
Theeffluent from Awassa Textile Factory and Its Effects on Aquatic Biota.
SINET: Ethiop.J. Sci., 25 (2):263-274 .
60
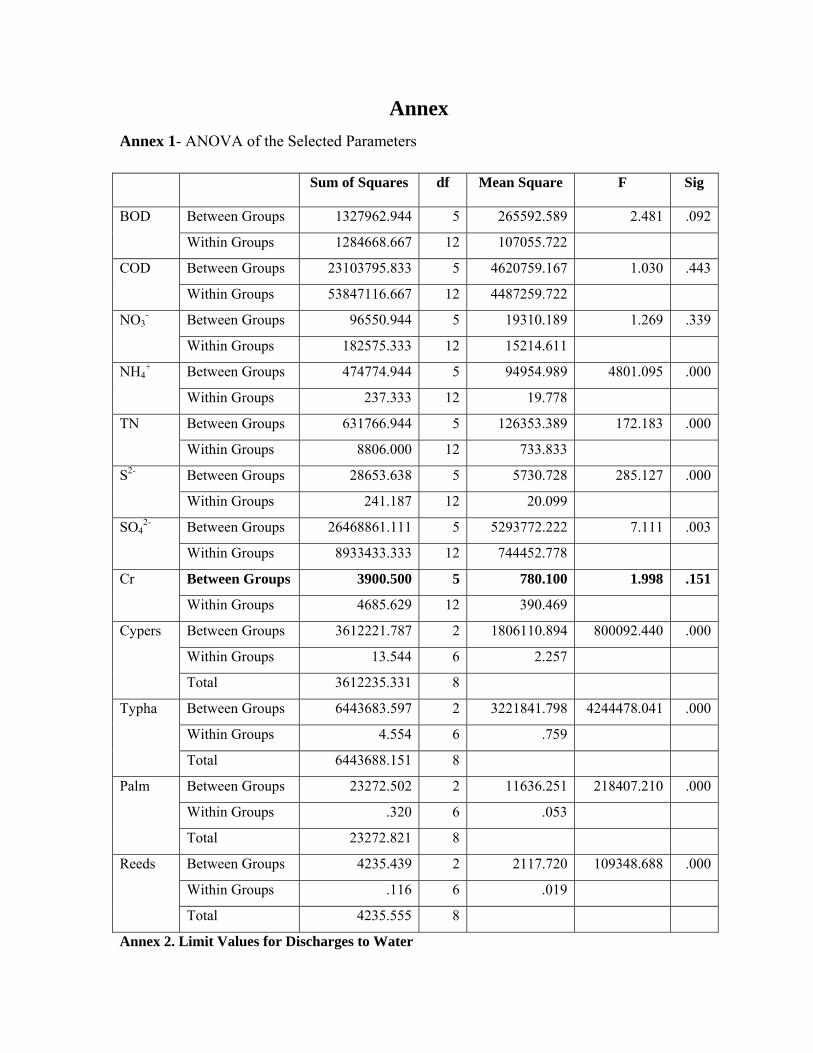
Annex
Annex 1- ANOVA of the Selected Parameters
Sum of Squares df Mean Square F Sig
Between Groups 1327962.944 5 265592.589 2.481 .092BOD
Within Groups 1284668.667 12 107055.722
Between Groups 23103795.833 5 4620759.167 1.030 .443COD
Within Groups 53847116.667 12 4487259.722
Between Groups 96550.944 5 19310.189 1.269 .339NO3-
Within Groups 182575.333 12 15214.611
Between Groups 474774.944 5 94954.989 4801.095 .000NH4+
Within Groups 237.333 12 19.778
Between Groups 631766.944 5 126353.389 172.183 .000TN
Within Groups 8806.000 12 733.833
Between Groups 28653.638 5 5730.728 285.127 .000S2-
Within Groups 241.187 12 20.099
Between Groups 26468861.111 5 5293772.222 7.111 .003SO42-
Within Groups 8933433.333 12 744452.778
Between Groups 3900.500 5 780.100 1.998 .151Cr
Within Groups 4685.629 12 390.469
Between Groups 3612221.787 2 1806110.894 800092.440 .000
Within Groups 13.544 6 2.257
Cypers
Total 3612235.331 8
Between Groups 6443683.597 2 3221841.798 4244478.041 .000
Within Groups 4.554 6 .759
Typha
Total 6443688.151 8
Between Groups 23272.502 2 11636.251 218407.210 .000
Within Groups .320 6 .053
Palm
Total 23272.821 8
Between Groups 4235.439 2 2117.720 109348.688 .000
Within Groups .116 6 .019
Reeds
Total 4235.555 8
Annex 2. Limit Values for Discharges to Water
61

Parameter Limit Value Temperature 40 °C pH 6 – 9 BOD5 at 200C 90% removal or 200 mg/l, whichever is less COD 500 mg/l Total ammonia 30 mg/l Total nitrogen 80% removal or 60 mg/l, whichever is less Total phosphorus 80% removal or 10 mg/l, whichever is less Chromium (as total Cr) 2 mg/l Chromium (as Cr VI) 0.1 mg/l
Annex-3 Mean influent and effluent COD and BOD concentrations (+SE mg/l) and removal efficiency of CWs.
Cells COD Mean ± SE
% removal BOD Mean ± SE
% removal
CW1 1561+ 159 64.8% 342.67 + 37 67.5 % CW2 1926.7 + 105 56.6 % 351.33 + 45 66.7 % CW3 1864.7 + 116 58 % 357.33 + 18 66 % CW4 845.3+ 57 80.9 % 242.00 + 94 77 % CW5 2733 + 165 38.4 % 379.33 + 17 64%
Annex-3 Average effluent concentration of each CW (Mean ± SD) of total chromium, and
percentage removal of each cell
Planted Cells
Average Effluent mg/L
% removal
CW1 0.84± 0.42 98 CW 2 0.41 ± 0.06 99 CW 3 0.28 ± 0.10 99.3 CW4 0.93 ± 0.37 97.7 CW 5 1.02 ± 0.26 97.4
Annex- 4 Concentration (mg/kg (ppm) DW) of chromium in the CWs Soils
soil in Vegetated CWs soil in un-vegetated CWs Input soil
Cr mg/Kg soil 148.2 212.5 13.4
62
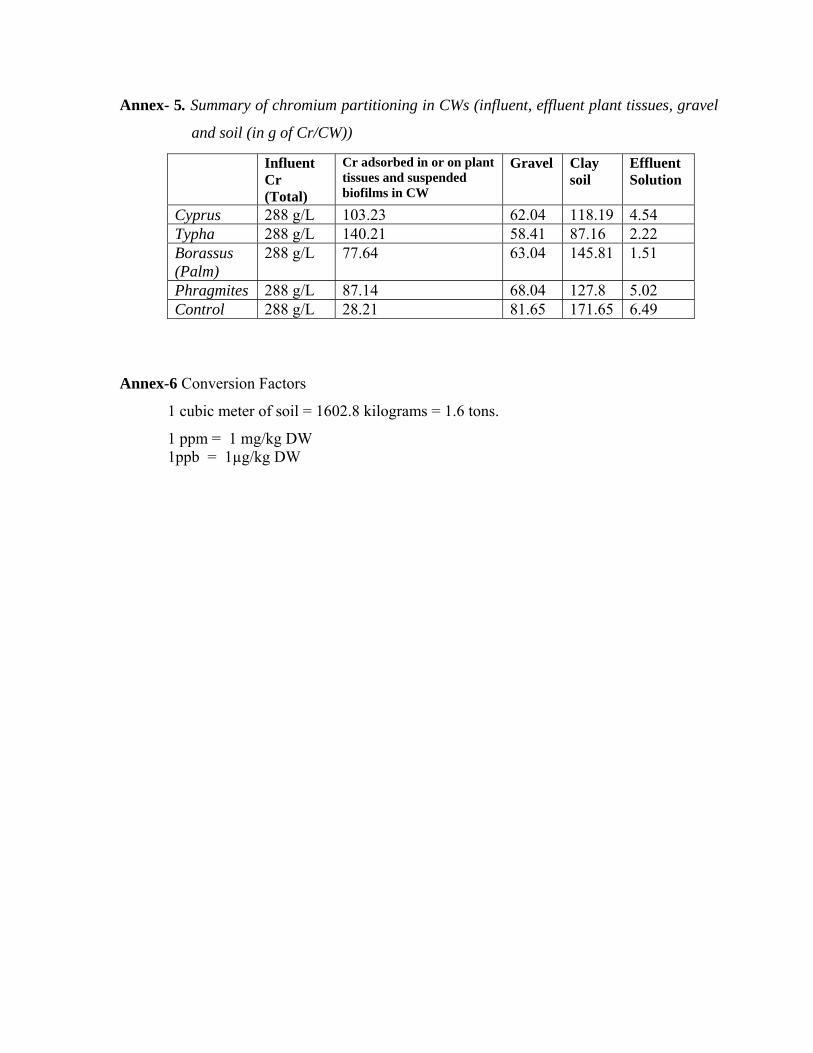
Annex- 5. Summary of chromium partitioning in CWs (influent, effluent plant tissues, gravel
and soil (in g of Cr/CW))
Influent Cr (Total)
Cr adsorbed in or on plant tissues and suspended biofilms in CW
Gravel Clay soil
Effluent Solution
Cyprus 288 g/L 103.23 62.04 118.19 4.54 Typha 288 g/L 140.21 58.41 87.16 2.22 Borassus (Palm)
288 g/L 77.64 63.04 145.81 1.51
Phragmites 288 g/L 87.14 68.04 127.8 5.02 Control 288 g/L 28.21 81.65 171.65 6.49
Annex-6 Conversion Factors
1 cubic meter of soil = 1602.8 kilograms = 1.6 tons.
1 ppm = 1 mg/kg DW 1ppb = 1µg/kg DW
63
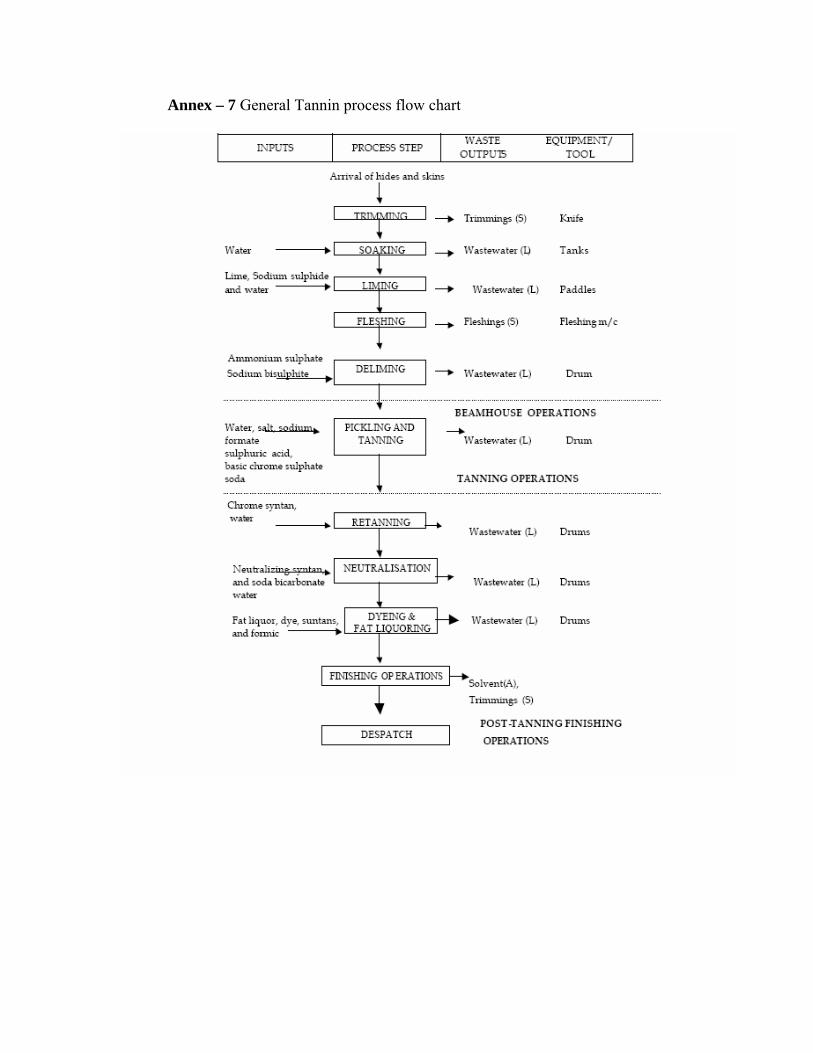
Annex – 7 General Tannin process flow chart
64

65
Copyright © 2022 FDOKUMEN