Desrtification in jafra plain
261
Climate Change in Libya and Desertification of Jifara Plain Using Geographical Information System and Remote Sensing Techniques Dissertation zur Erlangung des Grades Doktor der Naturwissenschaften am Fachbereich Chemie, Pharmazie, Geowissenschaften der Johannes Gutenberg-Universität in Mainz vorgelegt von Attia Mahmoud Mohamed El-Tantawi Geboren am 13. September 1966 in El-Gharbia, Ägypten Mainz 2005
Transcript of Desrtification in jafra plain

Attia El-tantawi: Climate change in Libya and desertification of Jifara Plain
Climate Change in Libya and Desertification of Jifara Plain
Using Geographical Information System and Remote Sensing Techniques
Dissertation
zur Erlangung des Grades
Doktor der Naturwissenschaften
am Fachbereich Chemie, Pharmazie, Geowissenschaften
der Johannes Gutenberg-Universität
in Mainz
vorgelegt von
Attia Mahmoud Mohamed El-Tantawi
Geboren am 13. September 1966 in El-Gharbia, Ägypten
Mainz 2005

Attia El-Tantawi: Climate change in Libya and desertification of Jifara Plain
II
Tag der mündlichen Prüfung: 05.07.2005
Attia El-Tantawi: Climate change in Libya and desertification of Jifara Plain
III
Dedication
to
Prof. Dr. Dr. h. c. Manfred Domrös
Mrs. Gisela Domrös
as a token of admiration and respect
Attia El-Tantawi: Climate change in Libya and desertification of Jifara Plain
IV
Table of contents
1
1.1
1.2
1.3
1.4
1.5
1.6
1.7
1.8
2
2.1
2.2
2.3
2.3.1
2.3.2
2.3.3
2.3.4
2.4
3
3.1
3.1.1
3.1.2
3.1.3
3.1.4
3.2
3.2.1
Dedication…………………………………………………………………..
Table of contents……………………………………………………............
List of tables………………………………………………………………...
List of figures……………………………………………………………….
List of photos …………………………………………………………........
Introduction………………………………………………………………..
Background ………………………………………………………………...
Objectives ……………………………………………………………….....
Assumptions …………………………………………………………….....
Data and methods ……………………………………………………….....
Fieldwork study in Libya …………………………………………………..
Computer programs used …………………………………………………..
Organization of the thesis.………………………………………………….
Previous studies…………………………………………………………….
Physical setting of the study area ………………………………………..
Location and population of Libya …………………………….....................
Landforms ………………………………………………………………….
Climate …………………………………………………………..................
Controlling factors.………………………………………………………....
Climatic elements …………………………………………………………..
Climatic characteristics of Libya …………………………………………..
Climatic regions in Libya …………………………………………………..
Water resources ………………………………………………………….....
Observed climate changes ………………………………………………..
Global climate change ……………………………………………………...
Observed changes in temperature ……………………………………….....
Observed changes in precipitation ………………………………………....
Observed changes in total cloud amount …………………………………..
Observed climate changes and extreme climate events.................................
Observed climate changes in Libya ………………………………………..
Observed changes of temperatures ………………………………………...
III
IV
VIII
XII
XV
1
1
5
5
6
12
13
13
14
16
16
17
20
20
23
31
35
38
43
43
43
49
50
51
51
51
Attia El-Tantawi: Climate change in Libya and desertification of Jifara Plain
V
3.2.1.1
3.2.1.2
3.2.2
3.2.2.1
3.2.2.2
3.2.3
3.2.4
3.2.5
3.2.5.1
3.2.5.2
3.2.5.3
3.2.5.4
3.3
3.3.1
3.3.2
4
4.1
4.2
4.3
4.4
4.5
4.5.1
4.5.2
Temporal temperature trends ……………………………………………....
Trends of mean annual temperature ………………………… …………….
Trends of mean minimum temperature …………………………………….
Trends of mean maximum temperature ……………………………………
Trends of extreme events temperature ……………………….….................
Changes of mean temperature range ……………………………………….
Seasonal temperature trends ………………………………………………..
Spatial changes of temperature …………..…………………………….…..
Observed precipitation changes ….………………………………………...
Temporal precipitation trends.……………………………………………...
Changes of annual precipitation totals………………………………….......
Changes of annual precipitation intensity ………………………………….
Trends of seasonal precipitation ……………………………………………
Spatial changes of precipitation ………..…………………………………..
Observed changes of mean annual relative humidity ……………………...
Observed changes of annual cloud amount totals………………………….
Observed climate changes over all-Libya ………………………………....
Observed temperature changes over all-Libya …………………………......
Observed precipitation changes over all-Libya …………………………….
Changes of mean annual relative humidity over all-Libya ………………...
Changes of cloud amount over all-Libya …………………………………..
Libya and global climate changes ………………………………………….
Temperature ………………………………………………………………..
Precipitation ………………………………………………………………..
Causes of climate change …………………………………………………
Continental drift …………………………………………………………....
Orbital forcing ……………………………………………………………...
Variations in solar output ………………………………………………......
Volcanic activities ……………………………………………………….....
Atmospheric-oceanic oscillations ………………………………………….
North Atlantic Oscillation (NAO) ………………………………………….
El-Nino Southern Oscillation (ENSO) ……………………………………..
51
51
56
60
63
66
69
79
81
81
81
85
88
95
97
100
103
103
106
108
109
110
110
111
112
113
113
113
117
119
120
122
Attia El-Tantawi: Climate change in Libya and desertification of Jifara Plain
VI
4.6
4.7
4.7.1
4.7.2
4.7.3
4.7.4
4.8
4.9
5
5.1
5.2
5.3
5.4
5.5
6
6.1
6.2
6.2.1
6.2.2
6.2.3
6.2.4
6.2.5
6.3
6.3.1
6.3.2
6.3.3
6.3.4
6.3.5
6.3.6
6.4
Cloud cover ………………………………………………………………...
Variations in atmospheric composition ……………………….....................
Carbon dioxide ……………………………………………………………..
Aerosol ……………………………………………………………………..
Methane ………………………………………………………………….....
Ozone ……………………………………………………………………....
Patterns of landuse ………………………………………………………....
Urban heat islands ………………………………………………………….
Impacts of climate change ………………………………………………..
Impacts on crop productions and food security …………………………....
Impacts on water resources ………………………………………………...
Impacts on human health …………………………………………………..
Impacts on human settlements ……………………………………………..
Impacts on biodiversity …………………………………………………….
Case study: Desertification of Jifara Plain ...…………………………....
Drought and desertification ………………………………………………...
Manifestations of desertification …………………………………………...
Soil degradation …………………………………………………………....
Deterioration of vegetation ………………………………………………....
Scarcity and pollution of water resources ………………………………....
Sand dunes movements ……………………………………………………..
Settlement expansion …………………………………………………….....
Causes of desertification …………………………………………………...
Climate change …………………………………………………………….
Topography of the Plain ……………………………………………….......
Soil erosion ………………………………………………………………...
Over-grazing ……………………………………………………………….
Over-cultivation ……………………………………………………………
Population growth ………………………………………………………....
Desertification effects ……………………………………………………...
123
124
127
133
134
135
136
137
139
143
150
153
155
157
159
159
161
161
170
176
182
185
188
189
196
198
199
201
203
205
Attia El-Tantawi: Climate change in Libya and desertification of Jifara Plain
VII
7
7.1
7.2
7.2.1
7.2.2
7.2.3
7.3
7.4
7.4.1
7.4.2
7.4.3
7.4.4
7.4.5
7.4.6
7.4.7
7.4.8
7.4.9
8
Projections and mitigations of climate change and desertification ……
Outlook: Climate change projections ………………………………………
Mitigation of climate change ………………………………………………
International efforts to mitigate climate change …………………………...
Reduction of greenhouse gas emissions ……………………………………
Adaptation of climate change and sustainable development ………………
Outlook: Desertification projection of Jifara Plain ………………………...
Desertification combat ……………………………………………………..
National and international efforts ………………………………………….
Land management (soil conservation) ……………………………………..
Sustainable development …………………………………………………...
Scientific management of the pastoral and farming lands …………………
Stop the movements of sands (stabilizing sand surfaces) ……………….....
Water resources management ……………………………………………...
The Great Man-Made River Project ……………………………………….
Enacting laws legislative acts to combat desertification …………………..
Popular administration and participation ………………………………....
Results and recommendations …………………………………………...
Summary …………………………………………………………………..
References …………………………………………………………………
207
207
210
210
211
212
213
215
215
216
217
218
219
220
220
222
223
224
234
237
Attia El-Tantawi: Climate change in Libya and desertification of Jifara Plain
VIII
List of Tables
1 Stations under study, their location, elevation and observation period ……....................... 6
2 Satellites images used in the present study ……………………………………………….. 9
3 Latitude and elevation of stations under study and their annual, winter and summer tem-peratures, 1946-2000……………........................................................................................
23
4 Mean annual temperature ranges in Libya, 1946-2000…………………………………… 26
5 Spatial variations of mean annual precipitation in Libya, 1946-2000.…………………..... 27
6 Mean annual and seasonal relative humidity in Libya, 1946-2000...................................... 29
7 Mean annual total cloud amount in Libya , 1946-2000……………..................................... 30
8 Seasonal percentages of precipitation in Libya, 1946-2000 …………….….…………….. 33
9 Number of humid and arid months in Libya …………………………............................... 35
10 Global annual and seasonal temperature trends, 1901-2000 ……………........................... 45
11 Global annual and seasonal temperature trends, 1910-1945………..………………..…… 47
12 Rate of global warming for annual and seasonal temperatures, 1946-1975.………..…….. 47
13 Rate of global warming for annual and seasonal temperatures, 1976-2000......................... 47
14 Decadal temperature trends over globe, Northern and Southern Hemisphere and Africa during 20th century………………………………………………………………... ………
48
15 Annual temperature trends, trend-noise ratios and Mann-Kendall test for trend (Test Z) in Libya, 1946-2000………….……………………………………………………............
52
16 Trends of annual temperature, trend-noise ratios and Mann-Kendall test for trend (Test Z) in Libya, 1946-1975 ……………………………………………………………………
54
17 Trends of annual temperature, trend-noise ratios and Mann-Kendall test for trend (Test Z) in Libya, 1976-2000 ………………………………………………………...................
56
18 Trends of annual mean minimum temperature, trend-noise ratios and Mann-Kendall test for trend (Test Z) in Libya, 1946-2000…………………………………………………….
57
19 Trends of annual mean minimum temperature, trend-noise ratios and Mann-Kendall test for trend (Test Z) in Libya, 1946-1975………………………..…………………………..
57
20 Trends of annual mean minimum temperature, trend-noise ratios and Mann-Kendall test for trend (Test Z) in Libya, 1976-2000…………………………………… ………………
58
21 Trends of annual mean maximum temperature, trend-noise ratios and Mann-Kendall test for trend (Test Z) in Libya, 1946-2000…………………………………….………………
60
22 Trends of annual mean maximum temperature, trend-noise ratios and Mann-Kendall test for trend (Test Z) in Libya, 1946-1975……………………………………………... ……
62
23 Trends of annual mean maximum temperature, trend-noise ratios and Mann-Kendall test for trend (Test Z) in Libya, 1976-2000………………………………………….….…......
62
24 Trends of extreme minimum temperature, trend-noise ratios and Mann-Kendall test for trend (Test Z) in Libya, 1946-2000………………………………………………………..
64
25 Trends of extreme maximum temperature, trend-noise ratios and Mann-Kendall test for trend (Test Z) in Libya, 1946-2000………………………………………………………..
64
26 Trends of extreme minimum temperature, trend-noise ratios and Mann-Kendall test for trend (Test Z) in Libya, 1976-2000………………………………………………………..
65
Attia El-Tantawi: Climate change in Libya and desertification of Jifara Plain
IX
27 Trends of extreme maximum temperature, trend-noise ratios and Mann-Kendall test for trend (Test Z) in Libya, 1976-2000……………………………………………..................
66
28 Trends of annual temperature range, trend-noise ratios and Mann-Kendall test for trend (Test Z) in Libya, 1946-2000……………………………………………………………...
67
29 Trends of annual temperature range, trend-noise ratios and Mann-Kendall test for trend (Test Z) in Libya, 1976-2000……………..……………………………………………….
67
30 Temperature trends in summer, trend-noise ratios and Mann-Kendall test for trend (Test Z) in Libya, 1946-2000……………………...……………………………………………..
71
31 Temperature trends in winter, trend-noise ratios and Mann-Kendall test for trend (Test Z) in Libya, 1946-2000………………………………………………………...……….....
71
32 Temperature trends in autumn, trend-noise ratios and Mann-Kendall test for trend (Test Z) in Libya, 1946-2000……………………………………………………………………
73
33 Temperature trends in spring, trend-noise ratios and Mann-Kendall test for trend (Test Z) in Libya, 1946-2000……………………………………………………………………
73
34 Temperature trends in summer, trend-noise ratios and Mann-Kendall test for trend (Test Z) in Libya, 1976-2000……………………………………................................................
75
35 Temperature trends in winter, trend-noise ratios and Mann-Kendall test for trend (Test Z) in Libya, 1976-2000……………………………………………………………………
75
36 Temperature trends in autumn, trend-noise ratios and Mann-Kendall test for trend in Libya, 1976-2000…………………………………………………………………………..
78
37 Temperature trends in spring, trend-noise ratios and Mann-Kendall test for trend (Test Z) in Libya, 1976-2000……………………………………………………………..……...
79
38 Trends of annual precipitation total, trend-noise ratios and Mann-Kendall test for trend (Test Z) in Libya, 1946-2000………………………………………….…………………..
82
39 Trends of annual precipitation total, trend-noise ratios and Mann-Kendall test for trend (Test Z) in Libya, 1976-2000……………………………….……………………………..
85
40 Trends of annual precipitation intensity, trend-noise ratios and Mann-Kendall test for trend (Test Z) in Libya, 1946-2000…………………………………………………..........
87
41 Trends of annual precipitation intensity, trend-noise ratios and Mann-Kendall test for trend (Test Z) in Libya, 1976-2000…………………………………………..……………
87
42 Trends of precipitation totals in winter, trend-noise ratios and Mann-Kendall test for trend (Test Z) in Libya, 1946-2000………………………...……………………………...
89
43 Trends of precipitation totals in spring, trend-noise ratios and Mann-Kendall test for trend (Test Z) in Libya, 1946-2000………………………………………………………..
89
44 Trends of precipitation totals in autumn, trend-noise ratios and Mann-Kendall test for trend (Test Z) in Libya, 1946-2000…………..…………………………………………....
93
45 Trends of precipitation totals in winter, trend-noise ratios and Mann-Kendall test for trend (Test Z) in Libya, 1976-2000………………………………………………………..
94
46 Trends of precipitation totals in spring, trend-noise ratios and Mann-Kendall test for trend (Test Z) in Libya, 1976-2000………………………………………………………..
94
47 Trends of precipitation totals in autumn, trend-noise ratios and Mann-Kendall test for trend (Test Z) in Libya, 1976-2000…………...…………………………………………...
95
48 Trends of mean annual relative humidity, trend-noise ratios and Mann-Kendall test for
Attia El-Tantawi: Climate change in Libya and desertification of Jifara Plain
X
trend (Test Z) in Libya, 1946-2000……………………………………………………….. 98
49 Trends of annual mean relative humidity, trend-noise ratios and Mann-Kendall test for trend (Test Z) in Libya, 1976-2000………………………………………………………..
98
50 Trends of annual cloud amount totals, trend-noise ratios and Mann-Kendall test for trend (Test Z) in Libya, 1946-2000……………………………………………………………...
100
51 Trends of annual cloud amount totals, trend-noise ratios and Mann-Kendall test for trend (Test Z) in Libya, 1976-2000……………………………………………………………...
102
52 Trends of annual, minimum, maximum and seasonal temperatures for all-Libya, trend-noise ratios and Mann-Kendall test for trend (Test Z), 1951-2000………………………..
103
53 Trends of annual, minimum, maximum and seasonal temperatures for all-Libya trend-noise ratios and Mann-Kendall test for trend (Test Z), 1951-1975 ……………………….
104
54 Trends of annual, minimum, maximum and seasonal temperatures for all-Libya and Mann-Kendall test for trend (Test Z), 1976-2000 ………………………………………...
106
55 Trends of annual precipitation, intensity and seasonal precipitation over all-Libya and Mann-Kendall test for trend (Test Z), 1951-2000 ………...................................................
106
56 Trends of annual precipitation, annual intensity and seasonal precipitation over all-Libya, trend-noise ratios and Mann-Kendall test for trend (Test Z), 1976-2000 …………
108
57 Trends of mean annual relative humidity for all-Libya trend-noise ratios and Mann-Kendall test for trend (Test Z), 1951-2000 and 1976-2000 ……………………………….
109
58 Trends of annual cloud amount total for all-Libya and Mann-Kendall test for trend (Test Z), 1951-2000 and 1976-2000 ……..……………………………………………………...
109
59 Correlation coefficients (after Pearson) between sunspot number and mean annual tem-perature in Libya, 1951-2000…………………………………………...............................
116
60 Correlation coefficients between NAO index and temperature in Libya, 1951-2000 ……. 121
61 Correlation coefficients (after Pearson) between NAO index and annual precipitation totals in Libya, 1951-2000…………………………………………………………………
121
62 Correlation coefficients (after Pearson) between SOI and mean annual and seasonal tem-peratures in Libya, 1950-2000 ……………………………………………………….........
123
63 Correlation coefficients (after Pearson) between SOI and annual and seasonal precipita-tion totals in Libya, 1950-2000…………………………………………………………….
123
64 Correlation coefficients (after Pearson) between cloud amounts and temperatures at Benina and Tripoli city, 1950-2000 ……………………………………….........................
124
65 Change of greenhouse gases, 1750-2000... ………………………………………………. 126
66 Global CO2 emissions from fossil-fuels, gas fuel consumption, liquid fuel consumption, solid fuel consumption, cement production, and gas flaring, 1901-2000………………….
128
67 Total CO2 concentrations and the annual trend in Libya , 1950-2000.……………………. 129
68 Total CO2 emissions from (fossil-fuels, solid fuel consumption, liquid fuel consumption, gas fuel consumption, cement production and gas flaring) in Libya, 1950-2000…………
131
69 Correlation coefficients (after Pearson) between CO2 concentrations and mean annual temperatures in Libya, 1950-2000 …………………………………………………….......
131
70 Number of arid and humid years in Libya, 1951-2000 ………………...………………… 141
71 Areas affected by water erosion in Libya …………………………………….................... 142
Attia El-Tantawi: Climate change in Libya and desertification of Jifara Plain
XI
72 Areas affected by wind erosion in Libya …………………………………………………. 142
73 Growth in wheat requirements in Libya , 1990-2000 ……………………………………... 145
74 Population and percentages of economically active population ………………………….. 146
75 Correlation coefficient (after Pearson) between annual precipitation at selected stations and harvest areas and production of barley in Libya, 1968-2001... ……………................
148
76 Cattle , sheep and goats in Libya, 1981-2000. .….….……………………………………... 150
77 Water resources demand by different users in Libya, 1990-2025 (projected)……………. 151
78 Urban and rural population in Libya, 1980-2000 ………………………………………… 156
79 Degree of water and wind erosions in western part of Libya……………………………... 165
80 Changes of soil classes and land cover in El-Witia area ……………………..................... 170
81 Changes of vegetation and agricultural areas in northern Jifara Plain due to analysis of landsat MSS 1976, TM 1989 and ETM+ 2001 images (ha) using IR/R indices…………..
173
82 Deforestation around Tripoli city in northern Jifara Plain , 1986-1993 …………………... 176
83 Groundwater quality in some parts of Jifara Plain ……………………………………….. 181
84 Climate classification of Jifara Plain, after De Martonne.................................................... 190
85 Wettest months at Tripoli city, 1995-1999………………………………………………... 194
86 Projection trends upto 2050 of annual mean temperature and annual precipitation total in Libya based on 1946-2000 and 1976-2000 trends ……………...........................................
208
87 Utilities and deficit of water in Libya, 1990-2025 ……………………………………….. 214
87 Agricultural projects on the Great Man-Made River Project, second stage …………........ 222

Attia El-Tantawi: Climate change in Libya and desertification of Jifara Plain
XII
List of figures
1 Location of climatic stations under study in Libya …………………………………......... 7
2 Spatial distribution of population in Libya, 2001 ……………………….......................… 17
3 Relief map of Libya ……………………….…………………………………………....... 18
4 Main landforms in Libya …………………………………………………………............ 19
5 Mean annual isotherms in Libya , 1946-2000………………………………...................... 24
6 Mean winter isotherms in Libya, 1946-2000 …… ………………………………………. 25
7 Mean summer isotherms in Libya, 1946-2000………………............................................ 25
8 Distribution of mean annual precipitation in Libya , 1946-2000 …....………..................... 27
9 Mean annual relative humidity in Libya, 1946-2000………............................................... 29
10 Mean annual total cloud amount in Libya , 1946-2000……………………........................ 30
11 Inter-annual variabilities of temperature and precipitation in Libya , 1946-2000………… 32
12 Annual variation of precipitation and temperature according to humid and arid months distribution ………………………………………………………………………………..
34
13 Climatic types in Libya, after Köppen and De Martonne climate classification schemes.. 37
14 Water resources in Libya , 2000…………………………………………………………... 39
15 Water balance in the groundwater basins in Libya, 1995 …………………………........... 39
16 Water deficit in Libya , 1995-2025 …………………………………….............................. 41
17 Global inter-annual and inter-decadal temperature variabilities in the 20th century……… 44
18 Global winter temperature trends in the 20th century ……………………………………. 46
19 Global summer temperature trends in the 20th century …………………........................... 46
20 Anomalies of mean annual temperatures in Libya, 1946-2000 ………………………….. 53
21 Inter-annual variabilities and trends of annual temperatures in Libya, 1946-2000, 1946-1975 and 1976-2000 ……………………………………………………………………...
55
22 Inter-annual variabilities and trends of mean minimum temperatures in Libya, 1946-2000………………………………………………………………………………………..
59
23 Inter-annual variabilities and trends of annual mean maximum temperatures in Libya, 1946-2000.……………………………………………………………………..….………
61
24 Inter-annual variabilities and trends of annual temperature range in Libya, 1946-2000…. 68
25 Inter-annual variabilities and trends of summer temperatures in Libya, 1946-2000……... 70
26 Inter-annual variabilities and trends of winter temperatures in Libya, 1946-2000……….. 72
27 Trends and inter-annual variabilities of summer temperatures in Libya, 1976-2000…...... 76
28 Trends and inter-annual variabilities of winter temperatures in Libya, 1976-2000 ……... 77
29 Regionalization of mean annual temperature trends in Libya, 1946-2000 ………………. 80
30 Regionalization of mean annual temperature trends in Libya, 1976-2000……………….. 81
31 Inter-annual variabilities and trends of annual precipitation in Libya, 1946-2000……….. 83
32 Inter-annual variabilities and trends of annual precipitation in Libya, 1976-2000……….. 84

Attia El-Tantawi: Climate change in Libya and desertification of Jifara Plain
XIII
33 Inter-annual variabilities and trends of annual precipitation intensity in Libya, 1946-2000......................................................................................................................................
86
34 Inter-annual variabilities and trends of winter precipitation totals in Libya, 1946-2000… 90
35 Inter-annual variabilities and trends of spring precipitation totals in Libya, 1946-2000…. 91
36 Inter-annual variabilities and trends of autumn precipitation totals in Libya , 1946-2000... 92
37 Regionalization of mean annual precipitation trends in Libya, 1946-2000………………. 96
38 Distribution of mean annual precipitation trends in Libya, 1976-2000………………...… 97
39 Inter-annual variabilities and trends of annual relative humidity in Libya, 1946-2000….. 99
40 Inter-annual variabilities and trends of annual cloud amount totals in Libya, 1946-2000. 101
41 All-Libya temperature trends of mean annual and seasonal and inter-annual variabilities with low-pass filter 25 years, 1951-2000.………………...................................................
105
42 Inter-annual variabilities and trends of all-Libya for annual total, annual intensity and seasonal precipitation with low-pass filter 25 years, 1951-2000…………………….........
107
43 Trends of mean annual relative humidity and inter-annual variabilities with low-pass filter 25 years, 1951-2000.………………………………………………………………...
108
44 Trends of annual total cloud amount for all-Libya and inter-annual variabilities with low-pass filter 25 years, 1951-2000 ………………….......................................................
109
45 Photograph of sunspots taken on 28 October 1991, 12:06 UT, with an 8 inch refractor at focus ……………………………………………………....................................................
114
46 Inter-annual variabilit ies of sunspot number, an 11-year cycle , double magnetic 22-year cycle and the behavior of trend, 1700-2000 ……………………………..………………..
115
47 Tele-connection between global mean annual temperature and sunspot number over the 20th century ………………………………………………………………..........................
116
48 A huge cloud of volcanic ash and gas above Mt. Pinatubo, 12 June 1991……………….. 117
49 Mean annual temperature anomalies for all-Libya, 1946-2000 ………………………….. 118
50 Inter-annual and inter-decadal variabilities of NAO index, 1901-2000………………….. 120
51 Tele-connection between SOI and global mean annual temperatures, 1901-2000……….. 122
52 Total concentrations of global CO2, 1750-2000 ………………......................................... 128
53 Global mean annual temperature anomalies and CO2 concentrations in the 20th century... 129
54 Total CO2 emissions from different sectors in Libya , 1950-2000 …………..…………… 130
55 CO2 emissions per capita in Libya, 1950-2000 ...………………………….…………….. 132
56 CO2 emissions compared with all-Libya mean annual temperatures, 1950-2000…........... 132
57 CO2 emissions compared with all-Libya mean annual temperatures, 1976-2000…........... 133
58 Tele-connection between global mean annual temperatures and CH4 concentrations in the 20th century ……………………………………………………………………………
135
59 Number of arid and humid years in Libya, 1951-2000………………..….......................... 141
60 Harvest areas and production of wheat in Libya, 1968-2001………….............................. 147
61 Harvest areas and production of barley in Libya, 1968-2001………….............................. 148
62 Development of water demand in Libya, 1990-2025….…………………………………. 151
Attia El-Tantawi: Climate change in Libya and desertification of Jifara Plain
XIV
63 Inter-annual variability of reserved water in El-Majenin dam lake, 1973-1994…….......... 152
64 Saharan dust off Libya and Tunisia………………………………………………………. 154
65 Soil types in Jifara Plain ……………………………..…………………………………... 162
66 Changes of landuse patterns in Jifara Plain using TM and ETM+ mosaics 1989-2000 …. 163
67 Degree of water and wind erosions in western area of Libya (Jifara Plain and Jebal Naf-fusah)……………………………………………………………........................................
166
68 Soil degradation in eastern Jifara Plain using subpixel classification, 1990-2001 ……..... 168
69 Land degradation of El-Witia area, 1986-1996………………………………................... 169
70 Vegetation intensity in Jifara Plain, 1977 ………………………………………............... 171
71 Change detection of vegetation and agricultural lands in northern Jifara Plain using IR/R indices, 1976, 1989, 2001…………………………………………………………………
174
72 Deforestation around Tripoli city, 1986-1993………………………….……………........ 175
73 Annual precipitation distribution over Jifara Plain ………………………………………. 177
74 Water balance, after Thornthwaite in Jifara Plain ………….............................................. 178
75 Annual decrease of groundwater in some parts of Jifara Plain ………………………….. 179
76 Sea water intrusion in Tripoli area, 1957-1994 ………………………………………….. 180
77 Groundwater use in Jifara Plain, 1948-1998 ……………………………………………... 181
78 Sand dunes movements in northern Jifara Plain , 1989-2001……………………………... 183
79 Sand dunes movements in southern Jifara Plain , 1987-2000….......................................... 184
80 Changes in the urbanization rates in Libya, 1950-2030……….………............................. 185
81 Built-up area expansion of Tripoli city, 1970-2000............................................................. 186
82 Built-up area changes of Tripoli city, 1976, 1989 and 2001 …………………………….. 187
83 Causes of soil degradation in North Africa ………………………………......................... 189
84 Climate regions in Jifara Plain according to De Martonne classification ………………... 190
85 Aridity index trends in Jifara Plain , after De Martonne, 1976-2000 …………………….. 191
86 Arid and humid months in Jifara Plain, after Walter and Lieth…………………………... 192
87 Percentage shares of annual precipitation in Jifara Plain… ……………………………… 193
88 November precipitation variabilities at Surman, Elzawia and Ras Jdeir, 1971-2000……. 194
89 Relief profiles in Jifara Plain using SRTM (189/37 and 190/38) images ………………... 197
90 Population growth in Jifara Plain , 1984-2000… ………………………………………… 204
91 Population growth of Tripoli city, 1950-2015 …………………... …………………….... 205
92 Water demands in Libya, 1990-2025 …………………………………………………….. 214
93 The Great Man-Made River Project in Libya…………………………..…........................ 221
Attia El-Tantawi: Climate change in Libya and desertification of Jifara Plain
XV
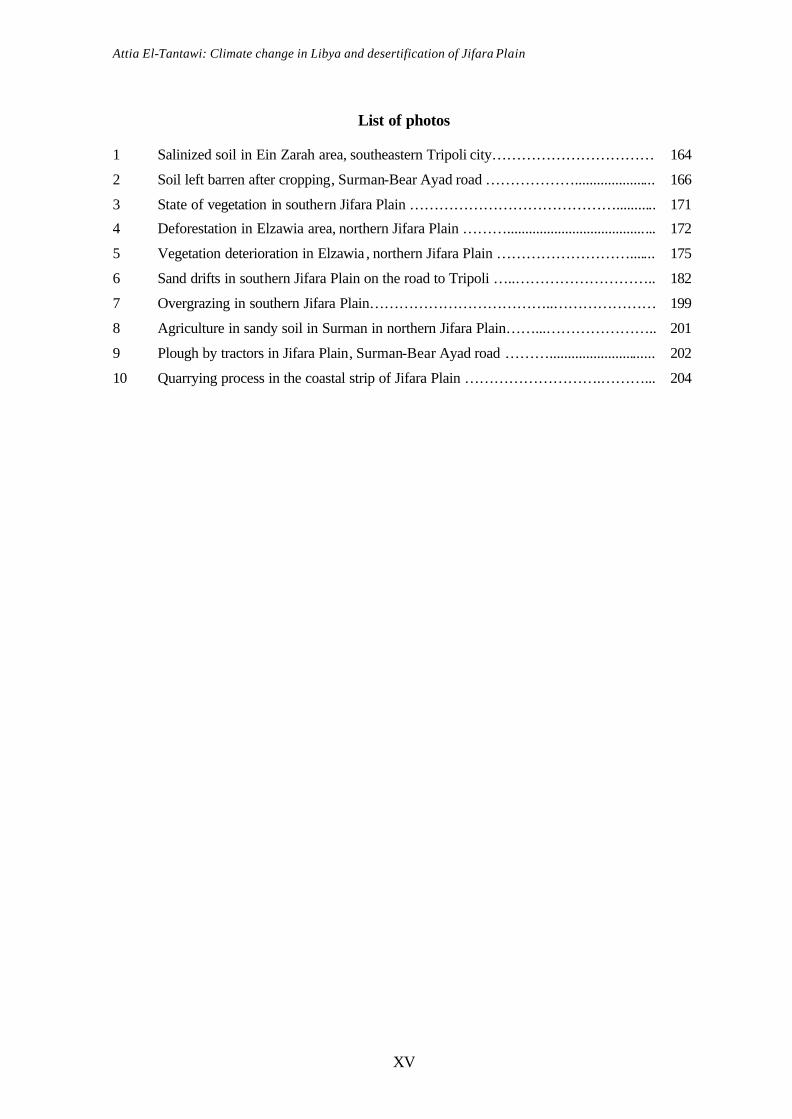
List of photos
1 Salinized soil in Ein Zarah area, southeastern Tripoli city…………………………… 164
2 Soil left barren after cropping, Surman-Bear Ayad road ………………...................... 166
3 State of vegetation in southern Jifara Plain ……………………………………........... 171
4 Deforestation in Elzawia area, northern Jifara Plain ………......................................... 172
5 Vegetation deterioration in Elzawia , northern Jifara Plain ………………………....... 175
6 Sand drifts in southern Jifara Plain on the road to Tripoli …..……………………….. 182
7 Overgrazing in southern Jifara Plain………………………………..………………… 199
8 Agriculture in sandy soil in Surman in northern Jifara Plain……...………………….. 201
9 Plough by tractors in Jifara Plain, Surman-Bear Ayad road ………............................. 202
10 Quarrying process in the coastal strip of Jifara Plain ……………………….………... 204

Attia El-Tantawi: Climate change in Libya and desertification of Jifara Plain
1
1. Introduction 1.1 Background
1.1.1 Climate change
Climate is always changing and has forever been a hot topic of discussion for park-
bench philosophers (ROACH, 1997). In the late 20th century, natural sciences have in-
creasingly focused on the problems and risks of modern societies. Climate change is con-
sidered as the most serious environmental challenge that threatens developed and less de-
veloped countries. It has reached a critical magnitude with a serious impact on society,
human welfare and quality of human life (DOMRÖS, 1996: 163). So, the impact on envi-
ronment, human welfare, and socio-economic systems, at present time, is seriously taken
into consideration by international authorities and has been receiving considerable recent
attention from governments.
Climate change is every deviation from the normal, having significance according to
the actual use of statistical tests. It seems to be very difficult to put apart man- induced
changes from natural ones as the natural changes are not yet well understood (DONAIRE,
2000: 140). In addition to changes of climate, there are other terms for describing climate
(e.g. variability, trends, oscillation, periodicity and fluctuation). Climate variability means
the variability inherent in the stationary stochastic process approximating the climate on
scale of a few decades (ALMABRUK, 1995: 51). Climatic variations involve changes in
the magnitude of the annual or decadal values and the mean is constant, while in climatic
changes, both the mean and the variance are changing with time (DONAIRE, 2000: 127).
The term trend 1 denotes climate change characterized by a smooth, monotonic increase or
decrease of average values over the period of record.
The number of scientific publications on varies aspects of the climate change reached
7,000 abstracts, the period 1951–1997 containing 95 % of the literature, with a steeper
exponential growth rate, doubling every 11 years (STANHILL, 2001: 516). The number of
conferences on climate change abstracted in Meteorological and Geostrophysical Abstracts
were examined. The first appeared in 1962 and by 1997 abstracts of a total of 89 confer-
ence proceedings had been published (e.g. Berlin in March/April 1995, where, in an
1 The word “trend” was used in the study to designate a generally progressive change in the level of a
variable.

Attia El-Tantawi: Climate change in Libya and desertification of Jifara Plain
2
agreement called the "Berlin Mandate", the Kyoto Protocol was adopted in Kyoto in De-
cember 1997). In Kyoto, more than 170 nations were to sign a treaty to stop human-
induced climate change (HOUGHTON, et al., 2001). The estimation of global spending on
climate change research presented above is similar to the sum of US$ 3 billion (STAN-
HILL, 2001: 516).
It is clearly identified that the 20th century was the warmest century during the past
1000 years; it was also shown that warming pronouncedly occurred over two periods,
1910-1945 and 1976-2000. The 1990s were experienced as the warmest decade while 1998
was the warmest individual year during instrumental records (HOUGHTON, et al., 2001).
Global mean surface temperature is projected to increase between 1.5 and 6 °C by 2100
(DESANKER, 2002). Climate changes have also occurred in other important aspects; pre-
cipitation increased by 0.5-1 % per decade in the 20th century over most mid- and high-
latitudes of the Northern Hemisphere, and by 0.2-0.3 % per decade over the tropical land
areas (10° N-10° S), while it decreased over much of the north hemispheric sub-tropical
land areas (10° N-30° N) by about 0.3 %/decade. It has been observed that the cloud cover
has increased over mid- and high- latitude land areas by 2 % (HOUGHTON, et al., 2001).
Global warming is commonly explained by the anthropogenic greenhouse effect re-
sulting from emissions of CO22. The contribution of CO2 emissions to global warming is
more than 50 % of greenhouse gases (WELLBURN, 1997: 188), and other gases which
allow sunlight to reach the earth’s surface but prevent some of the infrared or heat radia-
tion given off by the earth from escaping into space (PITTOCK, 1988: 306). During the
past 100 years, as a result of burning (coal, oil, and gas) and clearing forests, the chemical
composition of the atmospheric layers has greatly changed. These changes in the chemist
composition have far-reaching consequences for the earth’s climate and ecosystems that
are sustained by climate as well as human health and economy (HARDY, 2003: 3).
The magnitude and rate of future climate change depends on the amount of green-
house gases emitted, the sensitivity of climate to these gases and the degree to which the
effects are modified by aerosol emissions (JACQUELINE, 2000). In Libya, due to 2002
estimations, energy consumption was 69.2 % from oil and 30.8 % from natural gas, the
emissions of CO2 attributed mainly to oil (71.7 %) and (28.3 %) natural gas (EIA, 2005),
2 CO2 is chemically stable and lasts for many decades

Attia El-Tantawi: Climate change in Libya and desertification of Jifara Plain
3
which means that the energy sector which is the main source of greenhouse emissions in
Libya depends mainly on fossil fuels (oil and natural gas).
The expected impacts of climate change will be acute in different aspects, such as bio-
diversity, food security, water resources and human health. Libya is potentially one of the
countries most at risk from the effects of climate change because it has limited natural re-
sources (water and soils); located in the arid and semi-arid lands and more than 95 % of its
people live in coastal zone which is threatened by sea level rise.
1.1.2 Desertification
Among the important consequences resulting from climate change in arid and semi-
arid lands, ranks desertification. It is a worldwide phenomenon affecting about one-fifth of
the world population, 70 % of all dry lands (3.6 billion ha) and one-quarter of the total land
area of the world. Every year an additional 200,000 km2 of productive lands are lost by
desertification to the point of yielding nothing (ABAHUSSAIN, et al., 2002: 522). The
risks of desertification have increased over the last century as population in the desert
margins has multiplied several times, the cultivated area has increased and stock numbers
have grown with disease controlled to meet commercial demands (GROVE, 1977: 305).
The term "desertification" refers not only to areas surrounding deserts, but also to major
food-producing areas in semi-arid and sub-humid areas (IMAGAWA, et al., 1997). The
problems of desertification are greatest in poor countries where people rely directly on
what the land at the desert margins can produce (GROVE, 1977: 306).
Due to the United Nations Environment Programme (UNEP)’s definition, desertifica-
tion is the diminution or destruction of the biological potential of the land that can ulti-
mately lead to desert-like conditions. It is an aspect of widespread deterioration of ecosys-
tems because of the adverse climate fluctuation and excessive exploitation (ODINGO,
1990: 18). Desertification differs from drought; drought is a temporary phenomenon oc-
curring when precipitation falls below normal or when near normal precipitation is made
less effective by other climate parameters such as high temperature, low humidity and
strong winds.
In the context of the FAO/UNEP assessment and mapping project of desertification, it
is defined as a comprehensive expression of economic and social processes as well as
Attia El-Tantawi: Climate change in Libya and desertification of Jifara Plain
4
those of natural origin or induced ones which destroy the equilibrium of soil, vegetation,
air and water in areas subject to climatic aridity. Continued deterioration leads to decrease
or destruction of the biological potential of the land, deterioration of living conditions and
increasing of desert landscapes (ODINGO, 1990: 24).
Many conferences have been held to investigate desertification process (e.g. United
Nations Conference on Desertification (UNCOD) Nairobi 1977), The Ad-Hoc Consulta-
tive Meeting on Assessment of Global Desertification: status and methodologies, February
1990, UNEP- Nairobi and international conferences held (October 1994 and May 1997) in
Tucson, Arizona, USA, in support of (UNCCD) United Nations Conventions to Combat
Desertification). These conferences raised the world's awareness to the effects and causes
of desertification and provided programs of action for sustainable development and combat
desertification.
Jifara Plain which lies in northwestern Libya has suffered from desertification in the
last half of the 20th century; soils has been degraded, vegetation cover disappeared and the
ground water wells were getting dry in many areas. Actions and measures had been taken
to combat desertification in Libya from the early 1960s (BEN-MAHMOUD, et al., 2000).
Climate change and desertification remain inextricably linked through feedbacks be-
tween land degradation and variabilities of precipitation. Climate change might exacerbate
desertification through alteration of spatial and temporal patterns in temperature, precipita-
tion, solar insolation, and winds. Conversely, desertification induces climate change
through the release of CO2 from cleared and dead vegetation and reduction of the carbon
sequestration potential of desertified land (McCARTHY, et al., 2001).
Urgent actions are needed to mitigate climate change and to combat desertification. It
is essential that communities develop the capacity to make informed decisions about their
development strategies. Substantial reductions of heat-trapping gas emissions in developed
countries and adaptation strategies are crucial (DESANKER, 2002).
The present study tried to discuss the spatial and temporal climate changes, its causes
and its impacts in Libya and the effect of climate change on desertification process in Ji-
fara Plain as a case study, as well as the other causes and manifestations of desertification
in Jifara Plain.
Attia El-Tantawi: Climate change in Libya and desertification of Jifara Plain
5
1.2 Objectives
The main objectives of this study are:
§ To discern the characteristics of the climate parameters in Libya.
§ To analyze the climate parameters using instrumental climate data in Libya.
§ To investigate recent climate changes over time and space in Libya and to com-
pare them with the global scenario.
§ To reveal the pattern of climate change which has occurred in the second half of
the 20th century in two periods (1946-2000), as a long-term period, and (1976-
2000), as a short-term period.
§ To determine the real causes of climate change.
§ To assess the impacts of climate change on life in Libya.
§ To evaluate the relationship between climate change and desertification.
§ To depict manifestations and degrees of desertification in Jifara Plain.
§ To investigate the factors and processes that cause and affect land degradation
and desertification in Jifara Plain.
§ To discuss the mitigation of climate change in Libya and combating of desertifi-
cation of Jifara Plain.
1.3 Assumptions
§ There are clear changes of climate parameters in Libya (e.g. temperature charac-
teristics, precipitation, relative humidity and cloud amount).
§ The effect of an abnormal long series of dry years is going to give a foreseeing
of what may happen in Libya following climate change.
§ The change of climatic components is able to re-rank the climate classification
in Libya.
§ Climate change has caused changes in the flora and fauna in Libya.
§ There are many problems as a result of climate change in Libya such as drought,
desertification, and water scarcity.
Attia El-Tantawi: Climate change in Libya and desertification of Jifara Plain
6
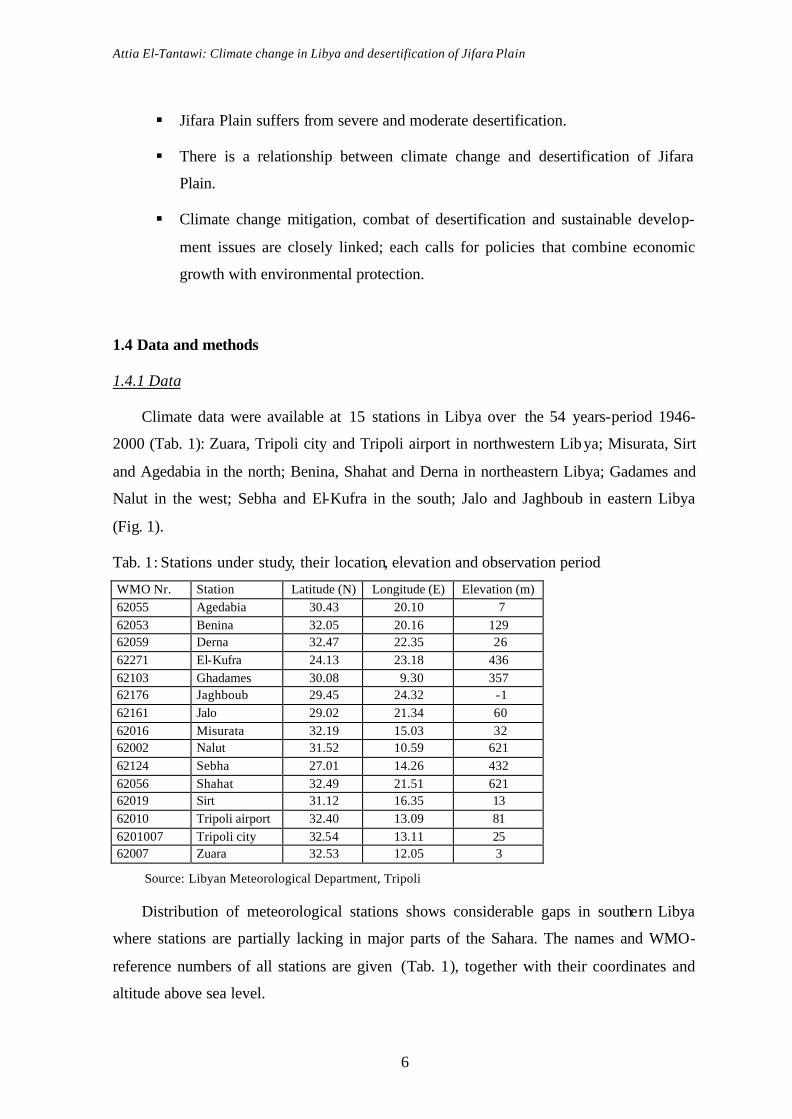
§ Jifara Plain suffers from severe and moderate desertification.
§ There is a relationship between climate change and desertification of Jifara
Plain.
§ Climate change mitigation, combat of desertification and sustainable develop-
ment issues are closely linked; each calls for policies that combine economic
growth with environmental protection.
1.4 Data and methods
1.4.1 Data
Climate data were available at 15 stations in Libya over the 54 years-period 1946-
2000 (Tab. 1): Zuara, Tripoli city and Tripoli airport in northwestern Libya; Misurata, Sirt
and Agedabia in the north; Benina, Shahat and Derna in northeastern Libya; Gadames and
Nalut in the west; Sebha and El-Kufra in the south; Jalo and Jaghboub in eastern Libya
(Fig. 1).
Tab. 1: Stations under study, their location, elevation and observation period
WMO Nr. Station Latitude (N) Longitude (E) Elevation (m) 62055 Agedabia 30.43 20.10 7 62053 Benina 32.05 20.16 129 62059 Derna 32.47 22.35 26 62271 El-Kufra 24.13 23.18 436 62103 Ghadames 30.08 9.30 357 62176 Jaghboub 29.45 24.32 -1 62161 Jalo 29.02 21.34 60 62016 Misurata 32.19 15.03 32 62002 Nalut 31.52 10.59 621 62124 Sebha 27.01 14.26 432 62056 Shahat 32.49 21.51 621 62019 Sirt 31.12 16.35 13 62010 Tripoli airport 32.40 13.09 81 6201007 Tripoli city 32.54 13.11 25 62007 Zuara 32.53 12.05 3
Source: Libyan Meteorological Department, Tripoli
Distribution of meteorological stations shows considerable gaps in southern Libya
where stations are partially lacking in major parts of the Sahara. The names and WMO-
reference numbers of all stations are given (Tab. 1), together with their coordinates and
altitude above sea level.

Attia El-Tantawi: Climate change in Libya and desertification of Jifara Plain
7
Fig. 1: Location of climatic stations under study in Libya
Source: AMANAT EL-TAKHTIET, 1978: National Atlas of Libya, Tripoli
Libyan Metrological Department, Tripoli
All climate information used in this study is represented by original data, according to
the official readings from the Libyan Meteorological Department, Climatic Section. Illus-
trations of the present study represent original drafts and compiled from climatic records.
The reference data of the global temperature trends were taken from IPCC Third Assess-
ment Report climate change, 2001 and from JONES et al., 1999 and 2001.
The climate data consisted of mean monthly and annual records of temperature, pre-
cipitation, relative humidity and cloud amount records for individual stations selected in
Libya. Annual means are the means of all 12 months from a respective year; seasons were
defined as follows: winter is the mean through December-January-February; spring
through March-April-May; summer through June-July-August; and autumn through Sep-
tember-October-November.
Other main data used in the present study were acquired as follows:
!(
!(!(
!(
!(!(
!(
!(!(
!(
!(
!(
!(!(!(
12°E
12°E
18°E
18°E
24°E
24°E24
°N
24°N
30°N
30°NJaghboub
Airport
Mediterranean SeaTunisia
Sudan
Chad
Niger
Shahat ±
Algeria E
gypt
0 100 200 300Km
Ghadames
Tripoli city
Sebha
El-Kufra
Jalo
Agedabia
Benina
Derna
Sirt
Misurata
Zuara
Nalut
Libya
Libya

Attia El-Tantawi: Climate change in Libya and desertification of Jifara Plain
8
Sunspots number data (NOAA's National Geophysical Data Center, 2004),
http://www.ngdc.noaa.gov/stp/SOLAR/ftpsunspotnumber.html#international
North Atlantic Oscillation index (NAOI) and Southern Oscillation Index (SOI) data
(JONES, 2003), http://www.cru.uea.ac.uk/cru/data/pci.htm
Global and Libyan annual CO2 emissions from fossil- fuel burning, cement production,
and gas flaring (MARLAND, et al., 2003), http://cdiac.esd.ornl. gov/ndps/ndp030.html
Annual estimates of global anthropogenic methane emissions (STERN and KAUF-
MANN, 1998), http://cdiac.ornl.gov/trends/meth/ch4.htm
For the investigation of desertification of Jifara Plain, in addition to precipitation and
temperature data used, also data of water resources, population and agricultural production
were analyzed acquiring from the Libyan Water Authority, National Information Authority
of Libya, http://www.nidaly.org/skan.htm and Libyan Agricultural Research Center.
The national atlas of Libya, the first national report of environment (GENERAL EN-
VIRONMENTAL AUTHORITY, 2002) and National Commit to Combat Desertification
reports (1999, 2002) were also used. The data used in the present study were collected dur-
ing the field work in Libya carried out from 7 October to 4 November 2002.
In order to monitor desertification process of Jifara Plain, the following data were
used (Tab. 2): Landsat data (MSS3, TM4, ETM+5) acquired form ftp://ftp.glcf.umiacs.umd
.edu/glcf/Landsat (NASA Landsat Program, the Earth Science Data Interface (ESDI) at the
Global Land Cover Facility (GLCF), U.S. Geological Survey). Mosaics ID zone (30-33
N), TM (mosaics 1987-1990) and ETM+ (mosaics 1999-2002) acquired from Global Land
Cover Facility, http://glcfapp.umiacs.umd.edu:8080/esdi/index.jsp. And Shuttle Radar
3 The Multispectral Scanner (MSS) is a multispectral scanning radiometer that was carried on board Landsats 1 through 5. MSS image data consists of four spectral bands from within the visible green, visible red and near-infrared wavelengths. The resolution for all bands is 79 meters. 4 Thematic Mapper (TM): The TM was flown on Landsat-4 and Landsat-5. The TM is a cross-track scanner providing seven multispectral channels (3 visible, 1 near-infrared, 2 mid-infrared, 1 thermal-infrared) at 30-meter resolution (120-meter resolution for the thermal-infrared band). 5 Enhanced Thematic Mapper Plus (ETM+): The ETM+ instrument currently flying on Landsat-7 is similar to the earlier TM, but adds an extra 15-meter resolution panchromatic band, and improved resolution for the thermal-infrared band (60-meters).

Attia El-Tantawi: Climate change in Libya and desertification of Jifara Plain
9
Topography Mission (SRTM)6 acquired from ftp://ftp.glcf.umiacs.umd.edu/glcf/SRTM
(USGS reprocessing by the GLCF, 2004, University of Maryland).
Tab. 2: Satellites images used in the present study
Sensor Image ID Date Platform MSS p203r37_2m 29.01.1976 Landsat2 TM P188R37_4T 31.07.1990 Landsat 4 TM P189R37_4T 29.03.1989 Landsat 4 TM P189R38_5T 04.06.1987 Landsat 5 TM P190R38_5T 02.01.1987 Landsat 5 ETM+ p188r037_7T 11.06.2001 Landsat 7 ETM+ p189r037_7T 25.01.2001 Landsat 7 ETM+ p189r038_7T 23.01.2000 Landsat 7 ETM+ p190r038_7T 11.11.1999 Landsat 7 SRTM SRTM_u03 Feb-00 SRTM SRTM SRTM_u03 Feb-00 SRTM
1.4.2 Methods
In respect of the objectives outlined above, the following statistical approaches are
used in the present study:
Homogeneity: Applying the statistical test for homogeneity after Abbe (SCHÄFER,
1996: 15), temperature data series under study at Zuara, Tripoli city, Misurata, Sirt, Derna,
Gadames, Nalut, Sebha, El-Kufra, Jalo and Jaghboub were shown as homogeneous data
from 1946-2000, at Agedabia, Benina and Shahat, data were homogeneous from 1946-
1998, while temperature data at Tripoli airport were inhomogeneous. In contrast, precipita-
tion data series was shown as inhomogeneous at most stations under study from 1946-
2000, while in the period 1946-1975, precipitation data at eleven stations were homogene-
ous and in the period 1976-2000, it was homogeneous at five stations.
A simple linear regression analysis, namely the least square method or linear regres-
sion (THOM, 1966) was used to detect climatic trends over time series at all fifteen sta-
tions under investigation, as the trend is the basic tool for describing and analysing the
changes of climate parameters (HOUGHTON, et al., 2001). The least-square method
(SCHÄFER, 1996 and SCHÖNWIESE, 1992) (y) is a linear function of (x) - y = mx + b -
6 SRTM obtained elevation data on a near-global scale to generate the most complete high-resolution digital topographic database of Earth. SRTM is an international project spearheaded by the National Geospatial-Intelligence Agency (NGA) and the National Aeronautics and Space Administration (NASA).
Attia El-Tantawi: Climate change in Libya and desertification of Jifara Plain
10
where the slope of the line is given by “m” (? x over ? y or the rise over the run) and the
intercept of the y axis is given as “b”. For “N” data pairs, the equations used to find the
slope “m” and intercept “b” are: 2 2 2( )/( ( ) )b y x x xy N x x= − −∑ ∑ ∑ ∑ ∑ ∑
2 2( )/( ( ) )m N xy y x N x x= − −∑ ∑ ∑ ∑ ∑
Low-pass filtering for the annual temperature, precipitation data was investigated over
the two different study periods (1946-2000) and (1976-2000). A trend test based on a
trend-to-noise ratio (total trend/standard deviation) was applied for detecting linear or non-
linear trends (a T/N ratio >1.96), which means two times of its standard deviation, can be
regarded as a significant trend at a 95 % level of confidence. Lower ratios express a less
significant level of confidence (DOMRÖS, 1996: 167). The values of the T/N ratio are
expressed as (SCHÖNWIESE, 1992: 212):
T/N ratio 3.90 3.291 2.576 1.960 1.645 1.282 Level of confidence % 99.99 99.90 99 95 90 80
The non-parametric Mann-Kendall test for trend was also computed to detect the be-
havior of trends over the periods under study and their significance levels. This test is
widely used in environmental science, because it is simple, robust and can cope with miss-
ing values and values below a detection limit. Since the first proposals of the test by
MANN 1945 and KENDALL 1975, covariance between Mann-Kendall statistics were
proposed by DIETZ and KILEEN 1981 (LIBISELLER, 2002). If the number of data va l-
ues less than 10, the Mann-Kendall test statistic S is calculated using the formula:
1
1 1
sgn( )n n
j kk i k
S X X−
= = +
= −∑ ∑
where xj and xk are the annual values in years j and k, j > k, respectively, and
1 0sgn( ) 0 0
1 0
j k
j k j k
j k
if x xx x if x x
if x x
−
− = − = − −
f
p
If the number of data values (n) is at least 10, the variance of S is computed by the follow-
ing equation:
1
1( ) ( 1)(2 5) ( 1)(2 5)
18
q
p p pp
VAR S n n n t t t=
= − + − − +
∑
Attia El-Tantawi: Climate change in Libya and desertification of Jifara Plain
11
Here q is the number of tied groups and tp is the number of data values in the pth group.
The values of S and VAR(S) are used to compute the test statistic Z as follows:
10
( )
0 01
0( )
sif S
VAR S
Z if Ss
if SVAR S
− = =
−
f
p
A positive (negative) Z value indicates an upward (downward) trend. Levels of sig-
nificant range between (0,001) level of significance which means that the existence of a
monotonic trend is very probable and null hypothesis of no trend should be rejected, and
(0.1) level which means there is a 10 % probability that we make a mistake when rejecting
H0 of no trend. If the cell is blank, the significance level is >0.1 (SALMI, et al., 2002).
Trends of temperature and precipitation over Libya were computed for the available
data, from 1946-2000, as a “long-term trend”, from 1946-1975 and from 1976-2000, as
“short-term trend”. The short-term periods are corresponding with the IPCC Third As-
sessment Report 2001 about climate change which has divided the 20th century in three
periods according to the behavior of temperature trends; 1910-1945, 1946-1975 and 1976-
2000. The trends of mean annual relative humidity and annual cloud amount were elabo-
rated as a long-term period from 1946-1975 and a short-term period from 1976-2000 at all
meteorological stations under study.
Principle Component Analysis was used to construct the All-Libya climatic parame-
ters trends7 for the mean annual and seasonal data. 15 stations were taken to build the data
matrix for two periods (1951-2000 and 1976-2000). Trend computations of temperature
are based on means of annual, maximum and minimum as well as seasonal temperatures.
Trends of precipitation were based on the means of annual and seasonal precipitation, and
annual precipitation intensity. Computations of relative humidity trends and annual total
cloud amount trends are based on the mean annual values.
Humidity and aridity shown after Walter-Lieth was applying the correlation n=2t
(DOMRÖS and GONGBING, 1988: 258) for computing humid respectively arid months
at all stations under study in Libya and to compile the corresponding diagrams. 7 Trends of parameters were typified by a regular and monotonous increase or decrease of the mean values during the observation periods.
Attia El-Tantawi: Climate change in Libya and desertification of Jifara Plain
12
Geographical Information System (GIS) techniques were applied to clarify the illus-
trations of the present study (e.g. locations of meteorological stations, distribution of popu-
lation, isotherms maps, isohyets maps, annual relative humidity and annual cloud amount
distribution, climatic regions).
Correlation coefficient, after Pearson, was used to detect the tele-connection between
CO2 and methane emissions, North Atlantic Oscillation Index (NAOI), Southern Oscilla-
tion Index (SOI), sun spot numbers from one hand, and global warming and climate
change in Libya from other hand.
De Martonne’s aridity index which is given by AI = P/ (T+10) where, P = mean an-
nual precipitation (mm), t = mean annual temperature (°C) was applied to classify the cli-
matic regions in Libya, as well as to elaborate the trends of aridity index in Jifara Plain.
Remote sensing techniques were applied to investigate desertification in Jifara Plain
using the available satellite images through the following digital imaging processing:
- Geometric correction: all images have been referenced as UTM projection, Zone
number: 33-30 North. Datum: WGS84, ellipsoid: WGS84 and output map: geographical
latitude and longitude.
- Spectral enhancement (indices) was applied in vegetation analysis to bring out the
differences between various vegetation classes and sand dunes encroachments. Such ind i-
ces infrared/red (IR/R), Vegetation Index = (IR-R), Iron Oxide = TM 3/1 (LEICA GEO-
SYSTEMS, 2003: 182).
- Subpixel classification method was also applied to detect the changes of vegetation
cover and settlement areas between TM and ETM+ images and relief profiles in Jifara
plain were compiled from SRTM (189/37 and 190/38) using digital elevation model.
1.5 Fieldwork study in Libya
The present study is based not only on raw climate data and satellite images but also
on field investigations on Jifara Plain in northwestern Libya. Field work was carried out
from 7 October to 4 November 2002.
All reference data were collected from Libyan authorities: Libyan Meteorological De-
partment (Climatic Section); General Environmental Authority; General Water Resources

Attia El-Tantawi: Climate change in Libya and desertification of Jifara Plain
13
Authority; Agricultural Research Centre; ACSAD (the Arab Centre for the Studies of Arid
zones and Dry lands) in Tripoli, and the libraries of El-Fateh University, Tripoli and El-
Sabeà Men April University, El-Zawia, Libya
An excursion, arranged by Mr. H. Ageli (Secretary of popular committee, desalination
and water treatment research center, was carried out in Jifara Plain on 4 November 2002;
in El-Ajilat, El-Zawia, Surman and the road which connects south of the Plain (Jebal Naf-
fusah8) and Tripoli city9. Some photos were taken to clarify some of desertification mani-
festations on the plain.
1.6 Computer programs used
Illustrations and data analyses contained in this study were achieved using different
programs: SPSS 11, Origin 6.0, Excel 2003, Surfer 7, Arc GIS 9, and Erdas Imagine 7, in
addition to the general cartography skills. The full text of the thesis is typed using word
processing (Word 2003) system. Klimagramm was used to investigate humid and arid
months after Walter-Lieth and an Excel template MAKESENS (SALMI, 2002) was also
used to depict Mann-Kendall test for trend of the annual values of climate parameters.
1.7 Organization of the thesis
The thesis was arranged to manifest its objectives through preceding it with an intro-
duction, six chapters followed by the main results and recommendations as follows:
In the second part, after introduction and before attempting to analyze climate data,
particular attention was paid to detect the physical setting of the study area, together with
an attempt to show the climatic characteristics in Libya.
Climate data were analyzed in the third chapter in order to investigate observed cli-
mate change in Libya through the trends of temperature, precipitation, relative humidity
and cloud amount in the study periods (1946-2000), (1946-1975), and (1976-2000), as well
as to compare the results with global scales.
8 A plateau with elevations of up to 800 m, locates in the south of Jifara Plain. 9 Excursion was arranged by Secretary of Popular Committee, Desalination and Water Treatment Research Center, National Association of Scientific Research, Tripoli , Libya.
Attia El-Tantawi: Climate change in Libya and desertification of Jifara Plain
14
The forth part of the study investigated the natural and human causes of climate
change concentrating on the greenhouse effect.
The potential impacts of climate change on Libya were examined in the fifth chapter.
Case study: desertification of Jifara Plain in northwestern Libya, its manifestations, its
causes and its effects were studied in the sixth part of the study.
In the last chapter, projections and mitigations of climate change and desertification
were discussed.
Ultimately, the main results and recommendations of the study were summarized.
1.8 Previous studies
Although a large amount of global climate change studies were carried out, studies
about climate change in Libya are sparse. The present study is considered as one of the
primary studies that are concerned with climate change in Libya. There are many environ-
mental and climatic studies about Libya, among them:
Abufayed, A. and El-Ghuel, M. (2001): Desalination process applications in Libya,
Presented at the European Conference on Desalination and the Environment: Water Short-
age. Lemesos, Cyprus, 28–31 May 2001. Desalination 138: 47–53.
Al-Adyoush, R. (2000): Environmental deterioration in northwestern Jifara Plain in
Libya, unpublished M. Sc., El-Fateh University, Tripoli, Libya. (in Arabic)
Almabruk, A. (1995): Reflections on climate variability within selected monthly mean
time series in Libya and neighboring countries, Geographia Polonica 65: 51-62.
Almabruk, A. (1997): Estimation of evapotranspiration in Libya under the impact of
plausible global climate change, Geographia Polonica 70: 25-42.
Ben-Mahmoud, R., Mansur, S. and Al-Gomati, A. (2000): Land degradation and de-
sertification in Libya, Land Degradation and Desertification Research Unit, Libyan Center
for Remote Sensing and Space Science, Tripoli, Libya.
El-Tantawi, A. (1998): Water resources in Libya (applied study), published M. Sc.,
Institute of African Researches and Studies, Cairo University, Egypt. (in Arabic)
Attia El-Tantawi: Climate change in Libya and desertification of Jifara Plain
15
El-Tantawi, A. (1998): Water balance in Libya, presented in the first Arabic confer-
ence on water and desertification, Academy of Scientific Research, Cairo. (in Arabic)
Kredegh, A. M. (2002): Sand storm and its effect on man and environment in north
western Libya (1965-1997), unpublished M. Sc., Elsabeà Men April University, El-Zawia,
Libya. (in Arabic)
Mgely, M. (1994): Drought and desertification in arid and semi-arid lands: Northwest
Libya, Journal of Faculty of Education, El-Fateh University, Tripoli. (in Arabic)
Attia El-Tantawi: Climate change in Libya and desertification of Jifara Plain
16
2. Physical setting of the study area
2.1 Location and population of Libya10
Libya occupies a part of northern Africa from 20 to 34° N and 10 to 25° E (Fig. 1). It
is bounded in the east by Egypt (1150 km), in the west by Tunisia (459 km), and Algeria
(982 km), Mediterranean Sea in the north, and by Sudan (383 km), Chad (1055 km), and
Niger (354 km), in the south (CIA, 2004). It has an important physical asset by its strategic
location at the midpoint of Africa’s northern rim. Total area of Libya is about 1.76 Million
km2; it ranks forth in area among all countries of Africa and fifteenth among all countries
on earth (McMORRIS, 1979: 62). More than 95 % of Libya is desert which is a part of
Sahara11 that is the most extensive area of severe aridity. Aridity of the central and eastern
Sahara is due to its domination by continental tropical air (cT) all-year which is continu-
ally descending from the upper levels of the atmosphere where, in these latitudes, anticy-
clone conditions are permanent.
The cultivable areas are estimated at 3.8 mill. ha or slightly over 2 % of the total area,
while the irrigation areas in all Libya were estimated at 400,000 ha (BEN-MAHMOUD, et
al. 2000: 2). The fertile lands of Jifara Plain in the northwest, Jebal Al-Akhdar in the
northeast and the coastal plain east of Sirt receive sufficient precipitation to support agr i-
culture. As a result, more than 90 % of Libyan population resides there. Between the pro-
ductive lowland agriculture zones lies the Gulf of Sirt that stretches 500 km along the
coast, from where deserts extend northward to the sea. Libya’s total population was at 5.3
million in 2001 including more than 500,000 non-nationals; in 2004, population estimate
was at 5.9 million with a growth rate of 2.37 %, birth rate of 27.17/1,000/year and death
rate of 3.48/1,000/year (National Information Authority of Libya, 2002). Almost 95 % of
the population lives in the coastal region in the north, and the rest in widely scattered oases
in mid- and southern Libya.
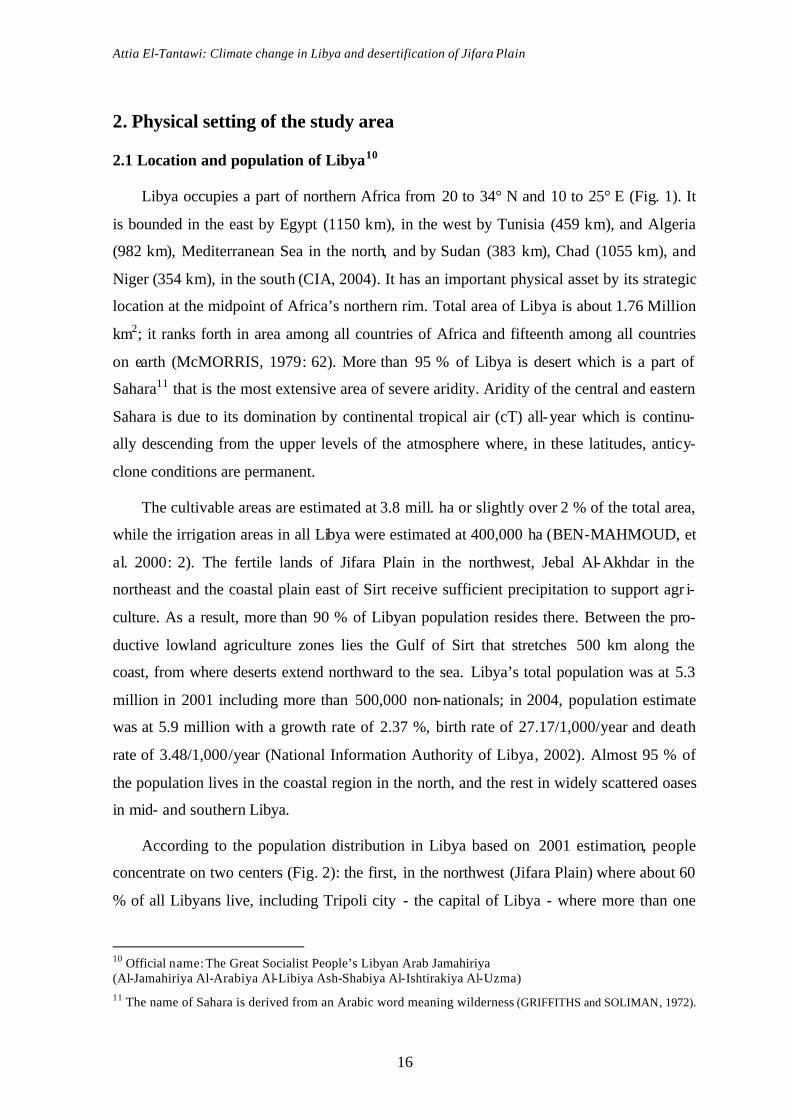
According to the population distribution in Libya based on 2001 estimation, people
concentrate on two centers (Fig. 2): the first, in the northwest (Jifara Plain) where about 60
% of all Libyans live, including Tripoli city - the capital of Libya - where more than one
10 Official name: The Great Socialist People’s Libyan Arab Jamahiriya (Al-Jamahiriya Al-Arabiya Al-Libiya Ash-Shabiya Al-Ishtirakiya Al-Uzma) 11 The name of Sahara is derived from an Arabic word meaning wilderness (GRIFFITHS and SOLIMAN, 1972).
Attia El-Tantawi: Climate change in Libya and desertification of Jifara Plain
17
million people live, and the second center in northeastern Libya (Ben-Ghazi Plain). The
main reasons for this concentration are fertile soils and seasonable, moderate climatic con-
ditions.
Fig. 2: Spatial distribution of population in Libya, 2001
Data source: National Information Authority of Libya, 2002
2.2 Landforms
Landforms of Libya generally consist of barren plains in the north against plateaus and
depressions in the south; the Mediterranean coast lands and the Sahara desert are the most
prominent natural features. Though there are several highlands, no true mountain ranges
exist except in southern desert near the Chad border where the Tibesti Massif rises to over
3,000 m (Fig. 3). Elsewhere a barren waste land of rocky plateaus and sand occur which
only allow minimal human habitation and agriculture possible in a few scattered oases
(McMORRIS, 1979: 63). The dominant features of the northern coastal zone are the low-
lying areas. The lowest point is Sebkhat Ghuzayil (47 m below sea- level), the highest one
12°E
12°E
18°E
18°E
24°E
24°E
24°N
24°N
30°N
30°N
Jaghboub
Mediterranean SeaTunisia
Sudan
Chad
Niger
Jebal El-Akhdar±
Txt
Algeria
Egypt
0 100 200 300Km
Ghadames
Tripoli city
Benghazi
El-Batnan
Ghat
El-Kufra
El-Wahat
Agedabia
Sebha
Nalut Sirt
Misurata
Murzuk
Beni Walid
1000 capita1
10
100
1,000
Wadi El Sha
El Joufra
Attia El-Tantawi: Climate change in Libya and desertification of Jifara Plain
18
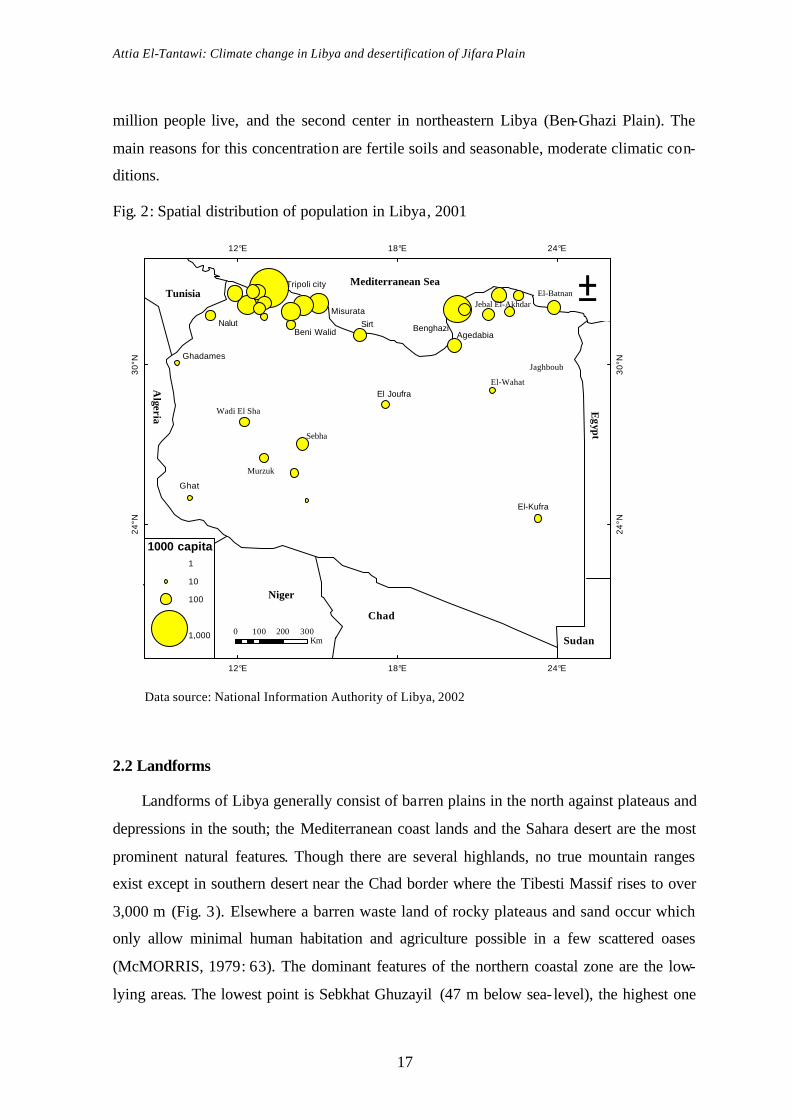
Bikku Bitti (2,267 m) above sea- level (CIA, 2004). The Mediterranean coastal zone of
Libya which stretches from west to east , from the Tunisian border to the Egyptian border,
over about 1,900 km ranging between 15 and 100 km in width (BEN-MAHMOUD, et al,
2000: 2). The main contrast is between narrow enclaves of fertile lowlands along the
Mediterranean coast and the vast expanse of arid rocky plains and sand seas to the south
(NELSON, 1979).
Fig. 3: Relief map of Libya
Source: AMANAT EL-TAKHTIET, 1978: National Atlas of Libya: 43
The main landforms of Libya can be identified as follow (Fig. 4):
In northern Libya, coastal plain includes coastal lowlands (Jifara Plain, Sirt Plain and
Ben-Ghazi Plain) as well as Sebkhas12, lagoons, salty marshes, swamps and coastal sand
dunes. Coastal lowlands are separated from each other by pre-desert zone and backed by
plateaus with steep, north-facing scarps. In the west, along the coast of Tripoli, more than
300 km coastal oases alternate with sandy areas and lagoons. Inland, the Jifara Plain is a
quaternary erosion surface developed on the northern flank of the regional dome of Jebal 12 Sebkha: the arab term sebkha refers to the broad, salt-encrusted, supra-tidal surfaces or coastal flats bor-dering lagoonal or inner shelf regions (WHITTEN AND BROOKS, 1972: 397)
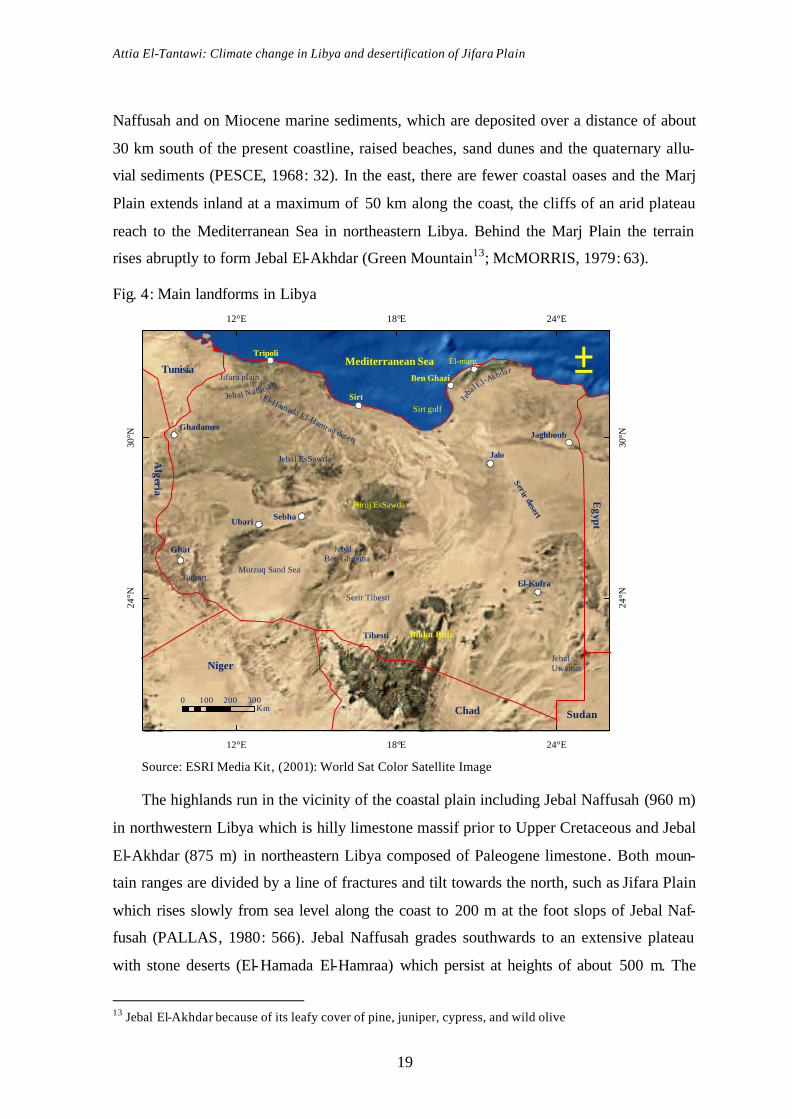
Attia El-Tantawi: Climate change in Libya and desertification of Jifara Plain
19
Naffusah and on Miocene marine sediments, which are deposited over a distance of about
30 km south of the present coastline, raised beaches, sand dunes and the quaternary allu-
vial sediments (PESCE, 1968: 32). In the east, there are fewer coastal oases and the Marj
Plain extends inland at a maximum of 50 km along the coast, the cliffs of an arid plateau
reach to the Mediterranean Sea in northeastern Libya. Behind the Marj Plain the terrain
rises abruptly to form Jebal El-Akhdar (Green Mountain13; McMORRIS, 1979: 63).
Fig. 4: Main landforms in Libya
Source: ESRI Media Kit, (2001): World Sat Color Satellite Image
The highlands run in the vicinity of the coastal plain including Jebal Naffusah (960 m)
in northwestern Libya which is hilly limestone massif prior to Upper Cretaceous and Jebal
El-Akhdar (875 m) in northeastern Libya composed of Paleogene limestone. Both moun-
tain ranges are divided by a line of fractures and tilt towards the north, such as Jifara Plain
which rises slowly from sea level along the coast to 200 m at the foot slops of Jebal Naf-
fusah (PALLAS, 1980: 566). Jebal Naffusah grades southwards to an extensive plateau
with stone deserts (El-Hamada El-Hamraa) which persist at heights of about 500 m. The
13 Jebal El-Akhdar because of its leafy cover of pine, juniper, cypress, and wild olive
12°E
12°E
18°E
18°E
24°E
24°E
24°N
24°N
30°N
30°N
±
0 100 200 300Km
Mediterranean SeaTunisia
SudanChad
Niger
Algeria
Egypt
Tibesti
JebalUwainat
Hiruj EsSawda
Serir desert
El-Hamada El-Hamraa desert
Jebal Naffusah
Jeba
l E l-Akhdar
Sirt gulf
Murzuq Sand Sea
El-Kufra
Jebal EsSawda
Tadrart
Sirt
Tripoli
Jifara plain Ben Ghazi
Sebha
Jaghboub
Jalo
Ghadames
El-marg
Serir Tibesti
Ghat
Ubari
Jebal Ben Ghnema
Bikku Bitti

Attia El-Tantawi: Climate change in Libya and desertification of Jifara Plain
20
same elevation is gained further to the east by shallow gradation of the Sirt gulf hinterland.
The low table-shaped elevations surround the gravel areas (Serir desert) in the east, sizable
in places and in parts covered by extensive basalt slabs towards the south. The volcanoes
rise to 800 m above sea level in the El-Sawda Mountain and up to 1,200 m in the Haruj es
Sawda (KANTER, 1967: 76).
Jebal El-Akhdar is economically the most important highland, and some forest rem-
nants are found. Otherwise, vegetation - where existing - consists mainly of shrubs, scrub
and palms (GRIFFITHS, 1972: 38). From Jebal El-Akhdar, a barren grazing belt gives
way to the Sahara desert and extends southward where elevation is generally below 200 m.
Here the extensive gravel areas of the Serir desert and the sands of the Libyan deserts ad-
vance close to 300 km from the coast (KANTER, 1967: 77).
In southern Libya, the prominent and very rugged slopes Tadrart Mountain dip gently
north and north eastward, the board valley extends northward from the oases of Ghat and
the great sand seas of Murzuq and Ubari which are separated from the Serir Tibesti by the
Nubian-Post-Tassilian outcrops of Jebal Ben-Ghnema and Jebal El-Gussa (PESCE, 1968:
24). Only on arrival in the vicinity of El-Kufra, low hill ranges rise to some 700 m, small
oases, and near the southern border; Jebal Uwainat attains 1,934 m (KANTER, 1967: 77).
2.3 Climate
2.3.1 Controlling factors
Climate of Libya is largely determined by the interaction of the following factors:
1 - Location: Libya due to its location between 20° to 34° N experiences a sub-tropical
climate. Libya climate is determined by contrasting Mediterranean and Sahara climates, so
air masses of either continental or maritime origin affect climate. A costal belt follows the
coast receiving more efficient precipitation against the dry, vast area occupied by the Sa-
hara desert. As from a global perspective, the sun's mean angle is highest, on average at the
equator and then becomes progressively lower polewards, mean temperatures gradually
decrease with increasing latitude in Libya.
2 - Landforms: Mountains act as strong barriers which block the further passage of air
masses associated with a different pattern of precipitation on the windward and leeward
sides either (DOMRÖS, and GONGBING, 1988: 26). In Libya, there are no mountain

Attia El-Tantawi: Climate change in Libya and desertification of Jifara Plain
21
ranges extending either from west to east or from north to south, so the Saharan influence
extends northwards to the Mediterranean coast (Sirt gulf). Jebal Naffusah and Jebal El-
Akhdar in northern Libya have local effects on climate (precipitation and temperature).
Different elevation can cause the locations at similar latitudes vary greatly in temperature
that decreases an average of about 0.64 °C/100 m. Therefore, high mountains and plateau
stations (Shahat (621 m), 16.5 °C) are colder than low-elevation stations (Zuara (3 m),
19.8 °C) at approximately the same latitude. Aerological influence is the air lifting effect
of mountain peaks and ranges on winds that pass over them. As air approaches a mountain
barrier, it rises, typically producing clouds and precipitation on the windward (upwind)
side of the mountains. After it crosses the crest, it descends downwind side of the moun-
tains (SCOTT, 2001).
3 - Distribution of land and sea: Libya has no interior lakes or rivers, all its area is
land, and only Mediterranean Sea plays an important role in modifying the climatic pa-
rameters in the coastal zone. It affects temperature and moisture conditions. The relatively
warm Mediterranean Sea area attracts cool masses of maritime polar air sometimes, mari-
time Arctic air from the Atlantic and continental air from Europe. These air masses are
rapidly transformed, especially from November to January, when the Sea is warmer than
the land. The influence of Mediterranean Sea on land areas decreases generally southward.
Climate in Libya is mainly considered the interaction between the Mediterranean Sea and
Sahara desert.
4 - Air pressure and wind belts: The air pressure distribution which is responsible of
the wind patterns affects the annual temperature and precipitation. Wind is produced by
the differences in the air pressure and the weather systems, such as weather fronts and
storms controlled by wind patterns. Globally, the subtropical high-pressure belts centered
near 30 degrees north and south latitude is responsible for many of the world's deserts. The
regions between the ITCZ and the sub-tropical highs are dominated by the trade winds.
The mid- latitudes are mostly situated between the subtropical highs and the sub-polar lows
and are within the westerly wind belt. In the equatorial zone there is a permanent belt of
low pressure due to heating and strong convection currents. North and south of this belt,
subtropical highs are formed in belts of descending air masses, going farther polewards
(MARTYN, 1992: 14).

Attia El-Tantawi: Climate change in Libya and desertification of Jifara Plain
22
In winter, six important features of pressure built can be identified, each of which can
play a significant role in the weather over the northern desert; 1- The Sahara High, an ex-
tension of the Azores anticyclone ; 2- The Arabian High, another part of the sub-tropical
high pressure built. 3- The Balkan High in conjunction with the great anticyclone over
central Asia, 4- A low pressure area over the central and eastern Mediterranean. 5- The
equatorial trough over central Africa. 6- The ITCZ14 (GRIFFITHS and SOLIMAN, 1972:
76). At the beginning of winter the belt of the horse latitude with high pressure gradually
move south and origination from the Azores south of the atlas mountain and on the plateau
of shots, they form a zone of high pressure with a small area of high pressure over the
Ahaggar extending before it. The pressure gradient reaches from them both to the tropical
belt, i.e. the north-east trade which below from the Mediterranean into the country during
summer is being moved farther south into the Sahara. It is now replaced by winter depres-
sions which advance from the Northwest to the North African coast moving a long the
polar front to the east and bringing humid Atlantic air towards the east (KANTER, 1967:
97).
In summer, an approximate inverse of the winter situation is experienced. The main
features are; 1 - a depression over the Arabian Peninsula, 2 – a depression over the south-
ern Sahara; 3 - a high pressure ridge over central Africa; 4 - the ITCZ (GRIFFITHS and
SOLIMAN, 1972: 77). When the Azores High intensifies, a period of calm sunny weather
predominates. The belt of high pressure from the horse latitude gradually shifts to the north
and a Saharan depression forms south of the tropics and the north east trade succeeds,
bringing with it the fine summer days. But soon the hot southerly wind (Gibli) starts here
and there to blow from the desert to the steppe (KANTER, 1967: 98).
This zone continuous in spring to be affected by depressions related to the air mass
movements over Europe. This is a windy time around the coast line but because of the
small temperature deferential between land and sea, there is relatively little rain and cloud
(GRIFFITHS, 1972: 39).
In autumn, a hot, close wind from the south usually blows and thunderstorms with
precipitation occur repeatedly, possibly together with varying Southerlies and Northwest-
erlies to Northeasterlies for several days. Winds that entrain and transport the dust from
14 Intertropical Convergence Zone is a belt of low pressure girdling the globe at the equator. It is formed by the convergence of warm, moist air from the latitudes above and below the equator. This region is also known as Intertropical Front or the Equatorial Convergence Zone (Wikipedia encyclopedia, 2005).
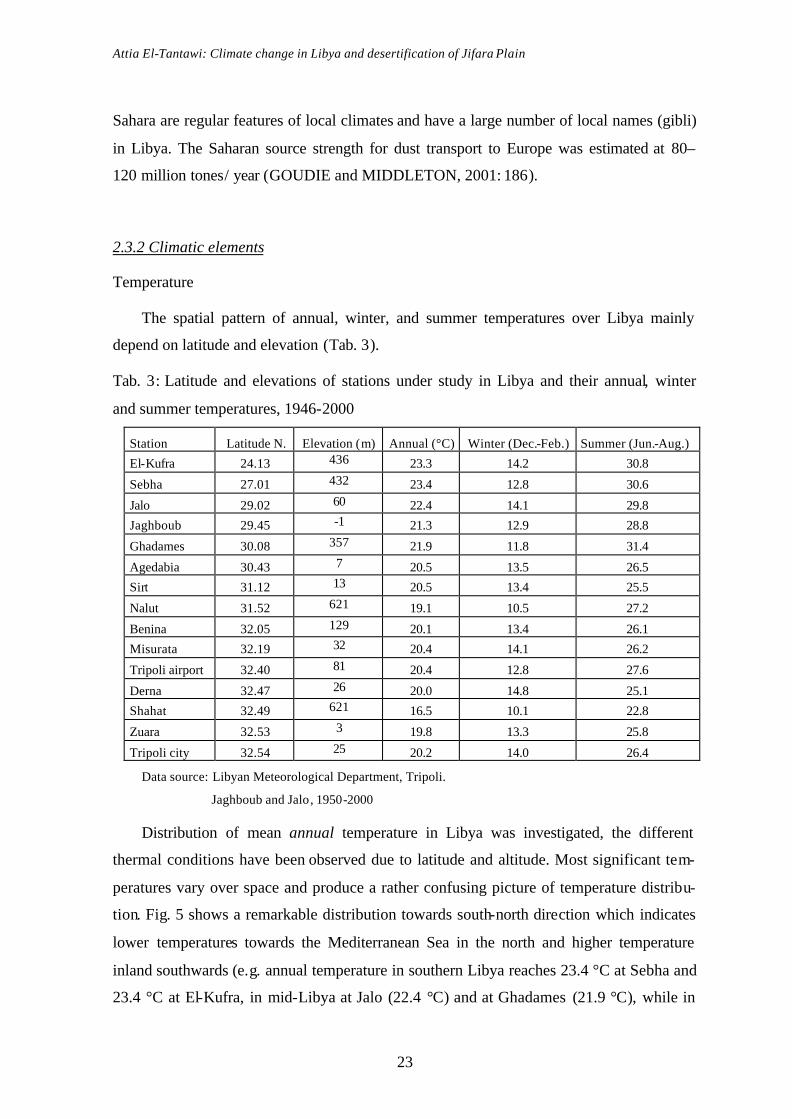
Attia El-Tantawi: Climate change in Libya and desertification of Jifara Plain
23
Sahara are regular features of local climates and have a large number of local names (gibli)
in Libya. The Saharan source strength for dust transport to Europe was estimated at 80–
120 million tones/ year (GOUDIE and MIDDLETON, 2001: 186).
2.3.2 Climatic elements
Temperature
The spatial pattern of annual, winter, and summer temperatures over Libya mainly
depend on latitude and elevation (Tab. 3).
Tab. 3: Latitude and elevations of stations under study in Libya and their annual, winter
and summer temperatures, 1946-2000
Station Latitude N. Elevation (m) Annual (°C) Winter (Dec.-Feb.) Summer (Jun.-Aug.)
El-Kufra 24.13 436 23.3 14.2 30.8
Sebha 27.01 432 23.4 12.8 30.6
Jalo 29.02 60 22.4 14.1 29.8
Jaghboub 29.45 -1 21.3 12.9 28.8
Ghadames 30.08 357 21.9 11.8 31.4
Agedabia 30.43 7 20.5 13.5 26.5
Sirt 31.12 13 20.5 13.4 25.5
Nalut 31.52 621 19.1 10.5 27.2
Benina 32.05 129 20.1 13.4 26.1
Misurata 32.19 32 20.4 14.1 26.2
Tripoli airport 32.40 81 20.4 12.8 27.6
Derna 32.47 26 20.0 14.8 25.1
Shahat 32.49 621 16.5 10.1 22.8
Zuara 32.53 3 19.8 13.3 25.8
Tripoli city 32.54 25 20.2 14.0 26.4
Data source: Libyan Meteorological Department, Tripoli.
Jaghboub and Jalo, 1950-2000
Distribution of mean annual temperature in Libya was investigated, the different
thermal conditions have been observed due to latitude and altitude. Most significant tem-
peratures vary over space and produce a rather confusing picture of temperature distribu-
tion. Fig. 5 shows a remarkable distribution towards south-north direction which indicates
lower temperatures towards the Mediterranean Sea in the north and higher temperature
inland southwards (e.g. annual temperature in southern Libya reaches 23.4 °C at Sebha and
23.4 °C at El-Kufra, in mid-Libya at Jalo (22.4 °C) and at Ghadames (21.9 °C), while in
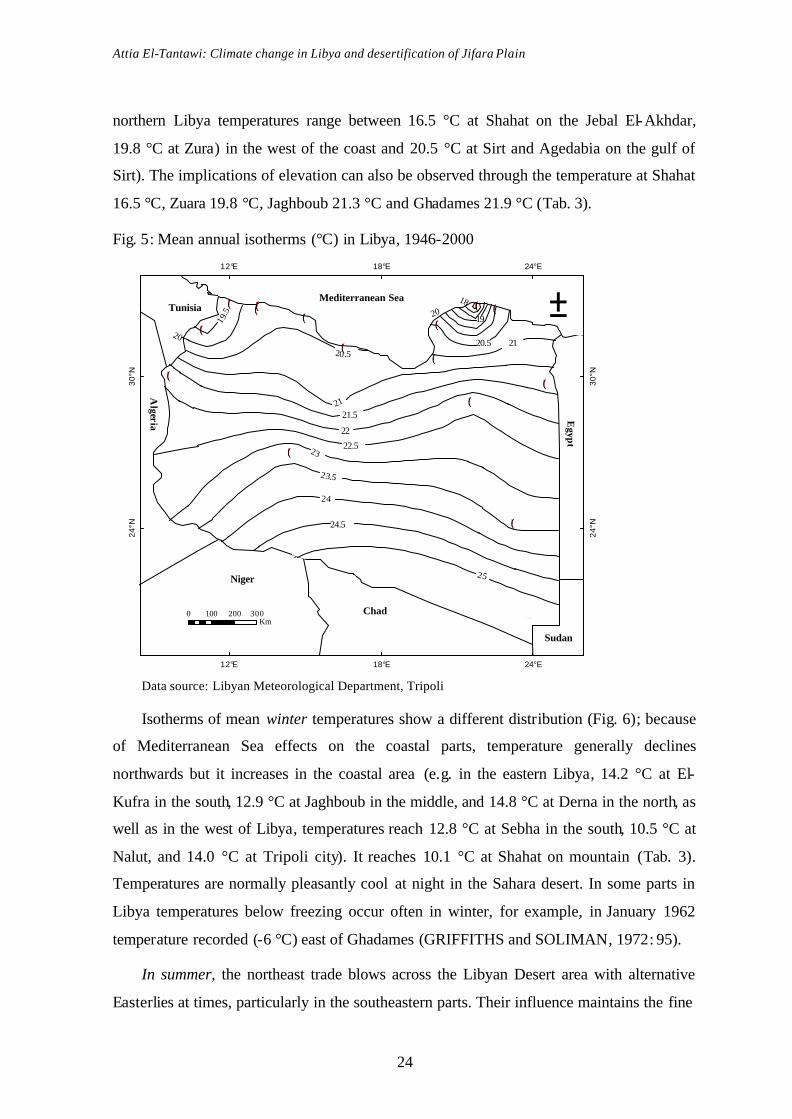
Attia El-Tantawi: Climate change in Libya and desertification of Jifara Plain
24
northern Libya temperatures range between 16.5 °C at Shahat on the Jebal El-Akhdar,
19.8 °C at Zura) in the west of the coast and 20.5 °C at Sirt and Agedabia on the gulf of
Sirt). The implications of elevation can also be observed through the temperature at Shahat
16.5 °C, Zuara 19.8 °C, Jaghboub 21.3 °C and Ghadames 21.9 °C (Tab. 3).
Fig. 5: Mean annual isotherms (°C) in Libya, 1946-2000
Data source: Libyan Meteorological Department, Tripoli
Isotherms of mean winter temperatures show a different distribution (Fig. 6); because
of Mediterranean Sea effects on the coastal parts, temperature generally declines
northwards but it increases in the coastal area (e.g. in the eastern Libya, 14.2 °C at El-
Kufra in the south, 12.9 °C at Jaghboub in the middle, and 14.8 °C at Derna in the north, as
well as in the west of Libya, temperatures reach 12.8 °C at Sebha in the south, 10.5 °C at
Nalut, and 14.0 °C at Tripoli city). It reaches 10.1 °C at Shahat on mountain (Tab. 3).
Temperatures are normally pleasantly cool at night in the Sahara desert. In some parts in
Libya temperatures below freezing occur often in winter, for example, in January 1962
temperature recorded (-6 °C) east of Ghadames (GRIFFITHS and SOLIMAN, 1972: 95).
In summer, the northeast trade blows across the Libyan Desert area with alternative
Easterlies at times, particularly in the southeastern parts. Their influence maintains the fine
!(
!(
!(
!(
!(!(
!(
!(!(
!(
!(
!(
!(!(!(
12°E
12°E
18°E
18°E
24°E
24°E
24°N
24°N
30°N
30°N
Mediterranean SeaTunisia
Chad
Niger
Sudan
Egypt
Algeria
±
0 100 200 300Km
1820
20.5 21
21.5
22
22.523
23.5
24
24.5
25
21
20.5
20
19.5
19
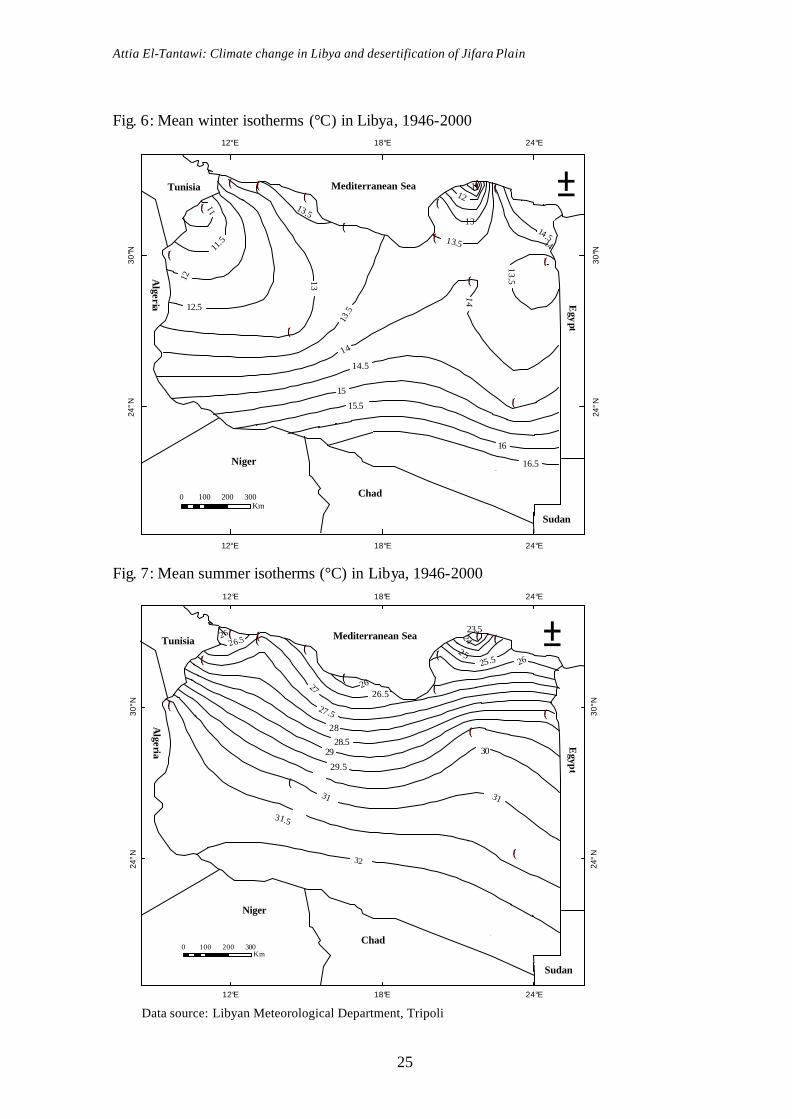
Attia El-Tantawi: Climate change in Libya and desertification of Jifara Plain
25
Fig. 6: Mean winter isotherms (°C) in Libya, 1946-2000
Fig. 7: Mean summer isotherms (°C) in Libya, 1946-2000
Data source: Libyan Meteorological Department, Tripoli
!(
!(
!(
!(
!(!(
!(
!(!(
!(
!(
!(
!(!(!(
12°E
12°E
18°E
18°E
24°E
24°E
24°N
24°N
30°N
30°N
Mediterranean SeaTunisia
Chad
Niger
Sudan
Egypt
Algeria
±
0 100 200 300Km
23.5
26.5
2828.5
29
29.5
27.5
27 26
25.5
26.5 2 4
2 5
30
31
31.5
32
31
26
26
!(
!(
!(
!(
!(!(
!(
!(!(
!(
!(
!(
!(!(!(
12°E
12°E
18°E
18°E
24°E
24°E
24°N
24°N
30°N
30°N
Mediterranean SeaTunisia
Chad
Niger
Sudan
Egypt
Algeria
±
0 100 200 300Km
17 16.5
16
15.5
15
14.5
1413
.5
14
13.513
12.5
14
14.513.5
12
13
1112
11.5
11 13.5

Attia El-Tantawi: Climate change in Libya and desertification of Jifara Plain
26
weather with predominantly cloudless skies and temperatures are 30.8 °C at El-Kufra in
southeastern Libya, 30.6 °C at Sebha in the southwest, while in the north, temperature
ranges between 27.6 °C at Tripoli airport in the west of coastal area, 25.5 °C at Sirt in the
middle and 22.8 °C at Shahat in eastern Libya on Jebal El-Akhdar (Fig. 7). Temperatures
generally increase southwards and decrease northwards. But with the onset of the gibli
wind which blows from Sahara, temperature rises to an uncomfortable 30 °C, bellowing
dust are evident and an innervating sultriness occur (GRIFFITHS and SOLIMAN, 1972:
95). The highest temperature ever recorded on the earth was experienced in Libya 57.8 °C
at Al-Azizia near Tripoli on 13 September 1922 (MARTYN, 1992: 31).
It can be observed that annual, winter and summer temperatures over Libya increase
gradually from north to south; additionally, the specific location of the stations must be
taken into account. The highest month in the coastal zone is August, while July is the heist
month in the desert and the coldest one in Libya is January.
The mean of annual temperature ranges were computed at study stations (Tab. 4)
showing the lowest values in the north and the highest in the south explained by the
Mediterranean Sea and Sahara effects (e.g. minimum range of 4.9 °C at Tripoli city and
6.8 °C at Derna in the coastal area, with southward the values of the mean annual
temperature ranges rise to a maximum value of 14.7 °C at Sebha and 15 °C at El-Kufra in
southern Libya).
Tab. 4: Mean annual temperature ranges in Libya, 1946-2000
Station range °C Station range °C Station range °C Agedabia 12.4 Jaghboub 15.4 Shahat 8.5 Benina 10.3 Jalo 14.4 Sirt 9.0 Derna 6.8 Misurata 9.4 Tri. airport 13.0 El-Kufra 15.0 Nalut 10.7 Tripoli city 4.9 Ghadames 15.0 Sebha 14.7 Zuara 9.3
Data source: Libyan Meteorological Department, Tripoli
Precipitation
Rainfall is the main feature of precipitation in Libya, but snow can fall along the
Mediterranean coast (e.g. in Feb. 1949, a 1-m-thick layer of snow persisted for three days
at Jebal El-Akhdar; MARTYN, 1992: 222). Fig. 8 expresses annual isohyets in Libya
based on the period 1946-2000 showing parallel to the coastal configuration except where
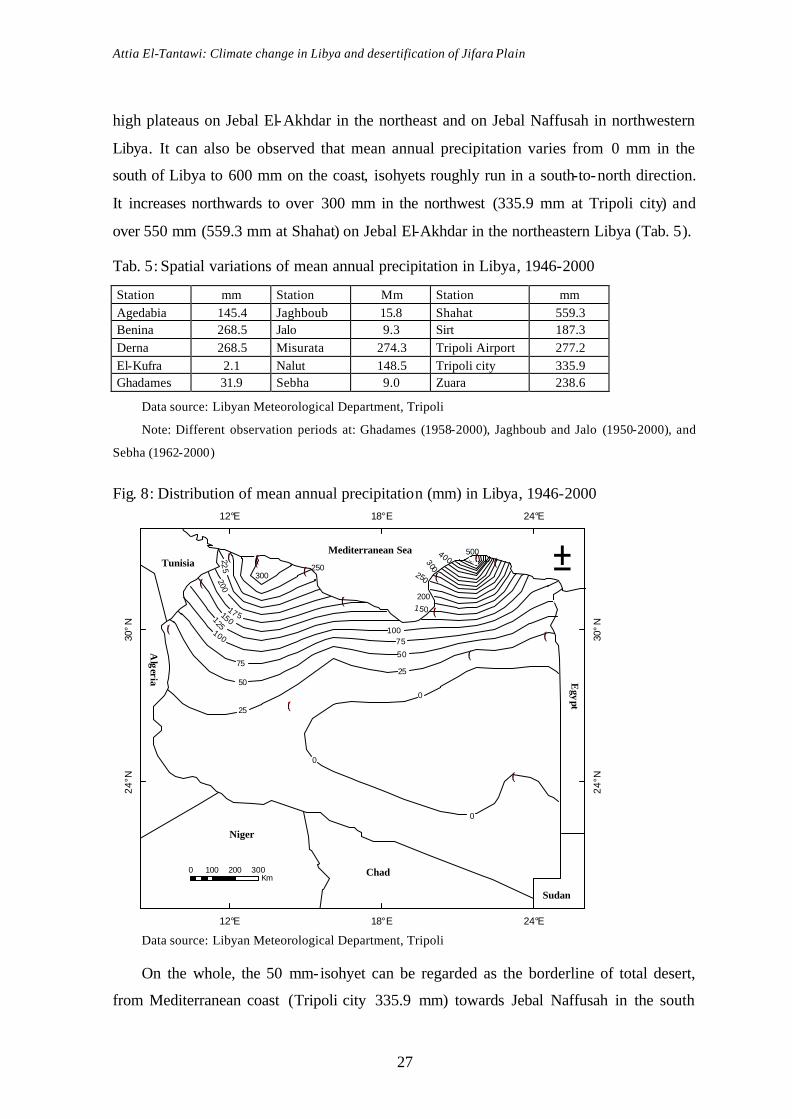
Attia El-Tantawi: Climate change in Libya and desertification of Jifara Plain
27
high plateaus on Jebal El-Akhdar in the northeast and on Jebal Naffusah in northwestern
Libya. It can also be observed that mean annual precipitation varies from 0 mm in the
south of Libya to 600 mm on the coast, isohyets roughly run in a south-to-north direction.
It increases northwards to over 300 mm in the northwest (335.9 mm at Tripoli city) and
over 550 mm (559.3 mm at Shahat) on Jebal El-Akhdar in the northeastern Libya (Tab. 5).
Tab. 5: Spatial variations of mean annual precipitation in Libya, 1946-2000
Station mm Station Mm Station mm Agedabia 145.4 Jaghboub 15.8 Shahat 559.3 Benina 268.5 Jalo 9.3 Sirt 187.3 Derna 268.5 Misurata 274.3 Tripoli Airport 277.2 El-Kufra 2.1 Nalut 148.5 Tripoli city 335.9 Ghadames 31.9 Sebha 9.0 Zuara 238.6
Data source: Libyan Meteorological Department, Tripoli
Note: Different observation periods at: Ghadames (1958-2000), Jaghboub and Jalo (1950-2000), and
Sebha (1962-2000)
Fig. 8: Distribution of mean annual precipitation (mm) in Libya, 1946-2000
Data source: Libyan Meteorological Department, Tripoli
On the whole, the 50 mm-isohyet can be regarded as the borderline of total desert,
from Mediterranean coast (Tripoli city 335.9 mm) towards Jebal Naffusah in the south
!(
!(
!(
!(
!(!(
!(
!(!(
!(
!(
!(
!(!(!(
12°E
12°E
18°E
18°E
24°E
24°E
24°N
24°N
30°N
30°N
0
0
0
25
25
50
5075
75100
125
15017 5
20022
5
100
150
250
300
400
200
500
250300
Mediterranean SeaTunisia
Chad
Niger
Sudan
Egypt
Algeria
±
0 100 200 300Km
Attia El-Tantawi: Climate change in Libya and desertification of Jifara Plain
28
(Tripoli airport 277.2 mm) as well as towards the Tunisian border (Zuara 238.6 mm). Pre-
cipitation decreases ever farther and increases again on Jebal Naffusah (322 mm) at Ghar-
ian. Southern Jebal shows a decreasing precipitation, total mean annual at Nalut is only
149 mm. In the Sirt region towards the east, precipitation decreases (Sirt 187.3 mm,
Agedabia 145.4 mm) but increases in the plain west of Jebal El-Akhder (Benina 268.5
mm), on the mountain Jebal El-Akhdar, annual precipitation rises to 559 mm at Shahat,
towards the east, the amount of precipitation decreases (Derna 269 mm), while on the
southern slope of Jebal Naffusah and Jebal El-Akhdar, the amount of precipitation de-
creases because it is situated in the rain shadow.
South of 30° N, Libya is almost entirely occupied by desert (see the annual
precipitation total for El-Kufra, Sebha and Jalo); only some higher mountains, like Haruj
and Jebal El-Sawda, receive some precipitation. High-mountain steppe, however, is only
developed outside Libya in the Tibesti in the south (KANTER, 1967: 97). The rare and
isolated rain showers which are known in parts of the Sahara are caused chiefly by
incursions of unstable maritime polar air (mP) from the northwest or the occasional
penetration of moist equatorial air from the south. In the southern areas precipitation can
stem from small depressions moving from the north respectively northwest and northeast
and, if ITCZ takes place, heavy precipitation over El-Hamada south of Jebal Naffusah can
occur (e.g. October 1937), producing large lakes of precipitation water (GRIFFITHS and
SOLIMAN, 1972: 94).
Relative humidity
Relative humidity is generally low throughout the year owing to minimal evaporation
and paucity of water vapour. Mean annual relative humidity falls from 65-75 % in the
coastal region to less than 35 % in the desert (Fig. 9).
Highest water vapour only occurs in coastal region by Mediterranean Sea effects. In
winter, relative humidity decreases southwards, it ranges between 76 % at Shahat, 73.3 %
at Benina in the coastal zone and 41.6 % at El-Kufra. It can be observed that relative hu-
midity varies between winter and summer. On the coast, summer values are at most sta-
tions higher than winter values, while in the desert, winter values are mostly higher (Tab.
6). Relative humidity also varies over the day. In the early morning hours it falls from 80-
90 % on coasts to 40 % and less in January and to 20-30 % and less in July inland. In

Attia El-Tantawi: Climate change in Libya and desertification of Jifara Plain
29
January and July alike, the air in the afternoon hours is very dry in the Sahara and humid-
ity then may even drop to 5-30 % (MARTYN, 1992: 220).
Fig. 9: Mean annual relative humidity (%) in Libya, 1946-2000
Data source: Libyan Meteorological Department, Tripoli
Tab. 6: Mean annual and seasonal relative humidity in Libya (%), 1946-2000
Station Annual Summer (Jun.-Aug.) Winter (Dec.-Feb.) Location Agedabia 61.8 59.5 69.1 Coast Benina 65.3 61.6 73.3 Coast Derna 72.0 74.9 71.0 Coast El-Kufra 29.3 21.7 41.6 Desert Ghadames 33.8 22.2 48.7 Desert Jaghboub 48.2 40.2 59.9 Desert Jalo 45.2 37.7 56.2 Desert Misurata 70.8 72.0 70.6 Coast Nalut 50.7 42.5 59.9 Desert Sebha 33.9 25.0 46.7 Desert Shahat 68.9 63.8 76.1 Coast Sirt 70.4 74.7 68.3 Coast Tripoli airport 61.8 55.5 69.0 Coast Tripoli city 64.8 63.5 62.5 Coast Zuara 73.1 76.2 70.7 Coast
Data source: Libyan Meteorological Department, Tripoli
Note: Observation periods at El-Kufra (1949-2000), Jaghboub and Jalo (1951-2000)
!(
!(
!(
!(
!(!(
!(
!(!(
!(
!(
!(
!(!(!(
12°E
12°E
18°E
18°E
24°E
24°E
24°N
24°N
30°N
30°N
Mediterranean SeaTunisia
Chad
Niger
Sudan
Egypt
Algeria
±
0 100 200 300Km
70
65
60
55
50
45
40
35
70
75

Attia El-Tantawi: Climate change in Libya and desertification of Jifara Plain
30
Cloud amount
Cloudiness is highest in the coastal region decreasing to the south and from east to
west (Fig. 10); correspondingly, cloudiness increases with elevation: Shahat (46.5 Oktas)
on Jebal El-Akhdar records among all stations under study the highest values (Tab. 7).
Tab. 7: Mean annual total cloud amount (Oktas) in Libya, 1946-2000
Coastal stations Annual total Desert stations Annual total Agedabia 24.5 El-Kufra 20.0 Benina 35.1 Ghadames 18.4 Derna 11.1 Jaghboub 15.6 Misurata 35.6 Jalo 33.7 Shahat 17.1 Nalut 38.4 Sirt 46.5 Sebha 26.0 Tripoli airport 33.3 Tripoli city 32.2 Zuara 31.3
Data source: Libyan Meteorological Department, Tripoli
Note: Observation periods at Ghadames and Sebha (1962-2000), Jaghboub and Jalo (1950-2000)
Fig. 10: Mean annual total cloud amount (Oktas) in Libya, 1946-2000
Data source: Libyan Meteorological Department, Tripoli
!(
!(
!(
!(
!(!(
!(
!(!(
!(
!(
!(
!(!(!(
12°E
12°E
18°E
18°E
24°E
24°E
24°N
24°N
30°N
30°N
Mediterranean SeaTunisia
Chad
Niger
Sudan
Egypt
Algeria
±
0 100 200 300Km
32
31
30
29
28
27
26
25
24
23
22
Attia El-Tantawi: Climate change in Libya and desertification of Jifara Plain
31
The increased cloudiness of the Mediterranean region during winter is of cyclonic ori-
gin. In January, cloudiness is higher by 40-50 %, in the transition seasons, by 40 % in the
western Atlas and by 30 % in the eastern atlas. Summer is a fair weather period with less
than 10-20 % cloudiness. The finest part of North Africa is the driest belt of the Sahara as
here conditions are not conducive to cloud formation (MARTYN, 1992: 221).
2.3.3 Climatic characteristics of Libya
Climate is by nature a rather complex theme, because of the manifold earth-
atmosphere interaction which considerably varies over space and time and finally creates a
specific type of climate at a particular location (DOMRÖS and GONGBING, 1988: 1).
Most descriptions of climate deal with temperature and precipitation characteristics
because these two major climatic elements usually exert more impacts on environmental
conditions and human activities than other elements do, such as wind, humidity, and cloud
cover. Mean monthly precipitation and temperature data were used to investigate the main
characteristics.
Concerning the inter-annual variabilities of temperature and precipitation for all
reference stations, it can be observed that the warmest period of the year can occur in June
to August in southern and middle parts of Libya (El-Kufra, Sebha, Jalo, Ghadames, and
Jaghboub), and in August on Mediterranean Sea coast (Zuara, Tripoli city, Tripoli airport,
Misurata, Sirt, Benina, Shahat, and Derna). In the desert, climate is continental with very
hot summer and extreme daily temperature ranges (Fig. 11).
It must be underlined that Libya is an arid country with only trace precipitation from
the southern border to just south of Jebal Naffusah in northwestern Libya and Jebal El-
Akhdar in northeastern Libya. There is no precipitation at El-Kufra, Jalo, Jaghboub, Sebha,
and Ghadames, while up to 250 mm of annual precipitation is experienced at Tripoli,
Zuara, Misurata, Derna, Benina and Shahat which are along the Mediterranean coast. Less
than 2 % of Libya’s territory receives enough precipitation for settled agriculture.
As far as precipitation is concerned, winter is prevailing followed by autumn and
spring, while no or negligible precipitation occurs sometimes in summer, in the latter of
thunderstorms are experienced in summer.
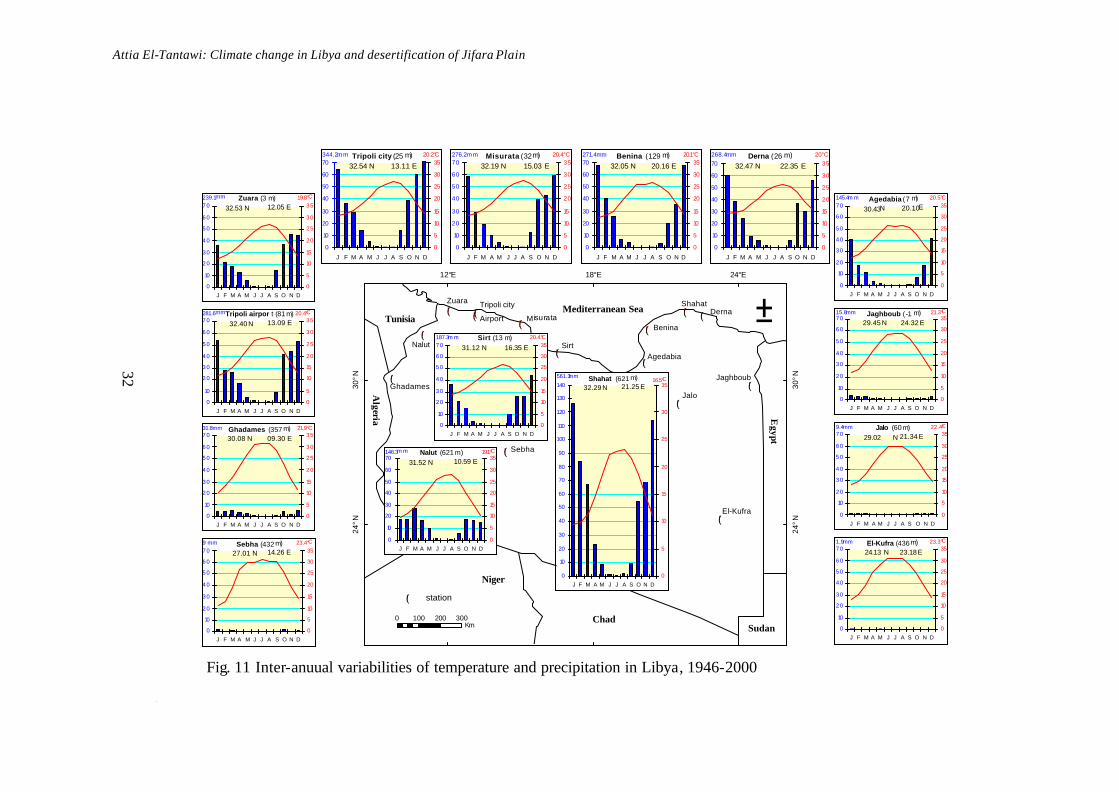
Attia El-Tantawi: Climate change in Libya and desertification of Jifara Plain
1
32
!(
!(
!(
!(
!(!(
!(
!(!(
!(
!(
!(
!(!(!(
12°E
12°E 18°E 24°E
24°N
24°N
30°N
30°NJaghboub
AirportMediterranean Sea
Tunisia
SudanChad
Niger
Shahat ±
Tex
Algeria E
gypt
0 100 200 300Km
Tripoli city
Sirt
Benina
Agedabia
Jalo
El-Kufra
Ghadames
Nalut
Zuara
Sebha
DernaM isurata
Benina (129 m) 32.05 N 20.16 E
0
10
20
30
40
50
60
70
J F M A M J J A S O N D
20.1°C
0
5
10
15
20
25
30
35271.4 mm Derna (26 m)
32.47 N 22.35 E
0
10
20
30
40
50
60
70
J F M A M J J A S O N D
20°C
0
5
10
15
20
25
30
35268.4mmMisurata (32 m)
32.19 N 15.03 E
0
10
20
30
40
50
60
70
J F M A M J J A S O N D
20.4°C
0
5
10
15
20
25
30
35276.2m mTripoli city (25 m)
32.54 N 13.11 E
0
10
20
30
40
50
60
70
J F M A M J J A S O N D
20.2°C
0
5
10
15
20
25
30
35344.2m m
Agedabia (7 m)
30.43N 20.10E
0
10
2 0
3 0
4 0
5 0
6 0
7 0
J F M A M J J A S O N D
145.4m m
0
5
10
15
20
25
30
3520.5°C
El-Kufra (436 m) 24.13 N 23.18 E
0
10
2 0
3 0
4 0
5 0
6 0
7 0
J F M A M J J A S O N D
23.3°C
0
5
10
15
20
25
30
351.9mm
Jaghboub (-1 m)29.45 N 24.32 E
0
10
2 0
3 0
4 0
5 0
6 0
7 0
J F M A M J J A S O N D
21.3°C
0
5
10
15
20
25
30
3515.8mm
Jalo (60 m) 29.02 N 21.34 E
0
10
2 0
3 0
4 0
5 0
6 0
7 0
J F M A M J J A S O N D
22.4°C
0
5
10
15
20
25
30
359.4mmGhadames (357 m)
30.08 N 09.30 E
0
10
2 0
3 0
4 0
5 0
6 0
7 0
J F M A M J J A S O N D
21.9°C
0
5
10
15
2 0
2 5
3 0
3 531.8mm
Sebha (432 m) 27.01 N 14.26 E
0
10
2 0
3 0
4 0
5 0
6 0
7 0
J F M A M J J A S O N D
23.4°C
0
5
10
15
20
25
30
359 mm
Tripoli airpor t (81 m)32.40 N 13.09 E
0
10
2 0
3 0
4 0
5 0
6 0
7 0
J F M A M J J A S O N D
20.4°C
0
5
10
15
2 0
2 5
3 0
3 5281.6mm
Zuara (3 m) 32.53 N 12.05 E
0
10
2 0
3 0
4 0
5 0
6 0
7 0
J F M A M J J A S O N D
19.8°C
0
5
10
15
2 0
2 5
3 0
3 5239.1mm
Shahat (621 m) 32.29 N 21.25 E
0
10
20
30
40
50
60
70
80
90
100
110
120
130
140
J F M A M J J A S O N D
561.3mm
0
5
10
15
20
25
30
3516.5°C
Sirt (13 m) 31.12 N 16.35 E
0
10
2 0
3 0
4 0
5 0
6 0
7 0
J F M A M J J A S O N D
20.4°C
0
5
10
15
20
25
30
35187.3m m
Nalut (621 m) 31.52 N 10.59 E
0
10
20
30
40
50
60
70
J F M A M J J A S O N D
19.1°C
0
5
10
15
20
25
30
35146.3m m
!( station
Fig. 11: Inter-annual variabilities of temperature and precipitation at all stations under study in Libya, (1946-2000)Fig. 11 Inter-anuual variabilities of temperature and precipitation in Libya, 1946-2000
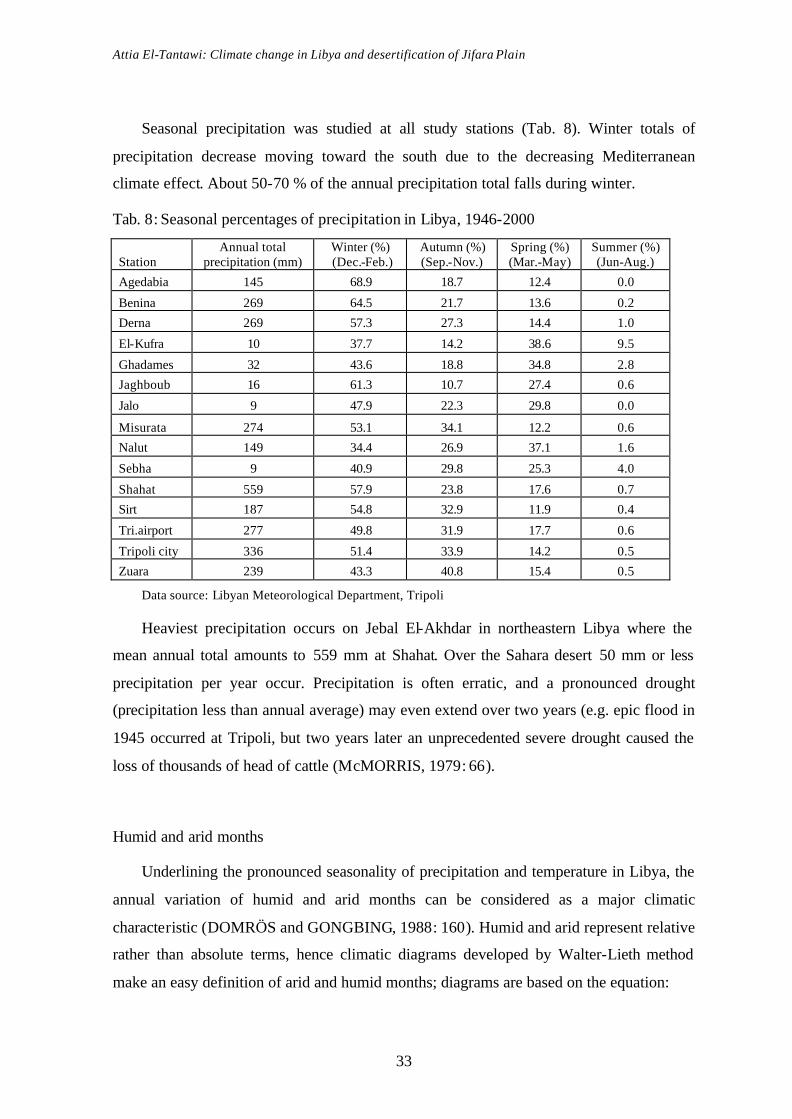
Attia El-Tantawi: Climate change in Libya and desertification of Jifara Plain
33
Seasonal precipitation was studied at all study stations (Tab. 8). Winter totals of
precipitation decrease moving toward the south due to the decreasing Mediterranean
climate effect. About 50-70 % of the annual precipitation total falls during winter.
Tab. 8: Seasonal percentages of precipitation in Libya, 1946-2000
Station Annual total
precipitation (mm) Winter (%) (Dec.-Feb.)
Autumn (%) (Sep.-Nov.)
Spring (%) (Mar.-May)
Summer (%) (Jun-Aug.)
Agedabia 145 68.9 18.7 12.4 0.0
Benina 269 64.5 21.7 13.6 0.2
Derna 269 57.3 27.3 14.4 1.0
El-Kufra 10 37.7 14.2 38.6 9.5
Ghadames 32 43.6 18.8 34.8 2.8
Jaghboub 16 61.3 10.7 27.4 0.6
Jalo 9 47.9 22.3 29.8 0.0
Misurata 274 53.1 34.1 12.2 0.6
Nalut 149 34.4 26.9 37.1 1.6
Sebha 9 40.9 29.8 25.3 4.0
Shahat 559 57.9 23.8 17.6 0.7
Sirt 187 54.8 32.9 11.9 0.4
Tri.airport 277 49.8 31.9 17.7 0.6
Tripoli city 336 51.4 33.9 14.2 0.5
Zuara 239 43.3 40.8 15.4 0.5
Data source: Libyan Meteorological Department, Tripoli
Heaviest precipitation occurs on Jebal El-Akhdar in northeastern Libya where the
mean annual total amounts to 559 mm at Shahat. Over the Sahara desert 50 mm or less
precipitation per year occur. Precipitation is often erratic, and a pronounced drought
(precipitation less than annual average) may even extend over two years (e.g. epic flood in
1945 occurred at Tripoli, but two years later an unprecedented severe drought caused the
loss of thousands of head of cattle (McMORRIS, 1979: 66).
Humid and arid months
Underlining the pronounced seasonality of precipitation and temperature in Libya, the
annual variation of humid and arid months can be considered as a major climatic
characteristic (DOMRÖS and GONGBING, 1988: 160). Humid and arid represent relative
rather than absolute terms, hence climatic diagrams developed by Walter-Lieth method
make an easy definition of arid and humid months; diagrams are based on the equation:
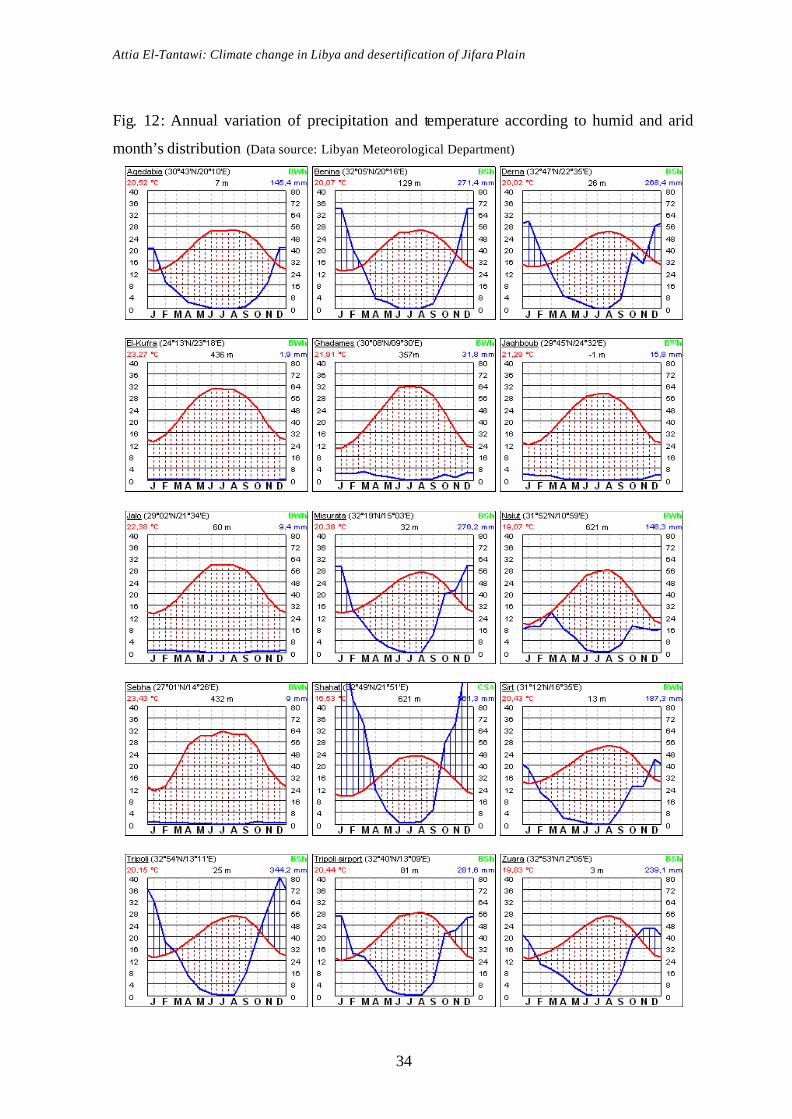
Attia El-Tantawi: Climate change in Libya and desertification of Jifara Plain
34
Fig. 12: Annual variation of precipitation and temperature according to humid and arid
month’s distribution (Data source: Libyan Meteorological Department)
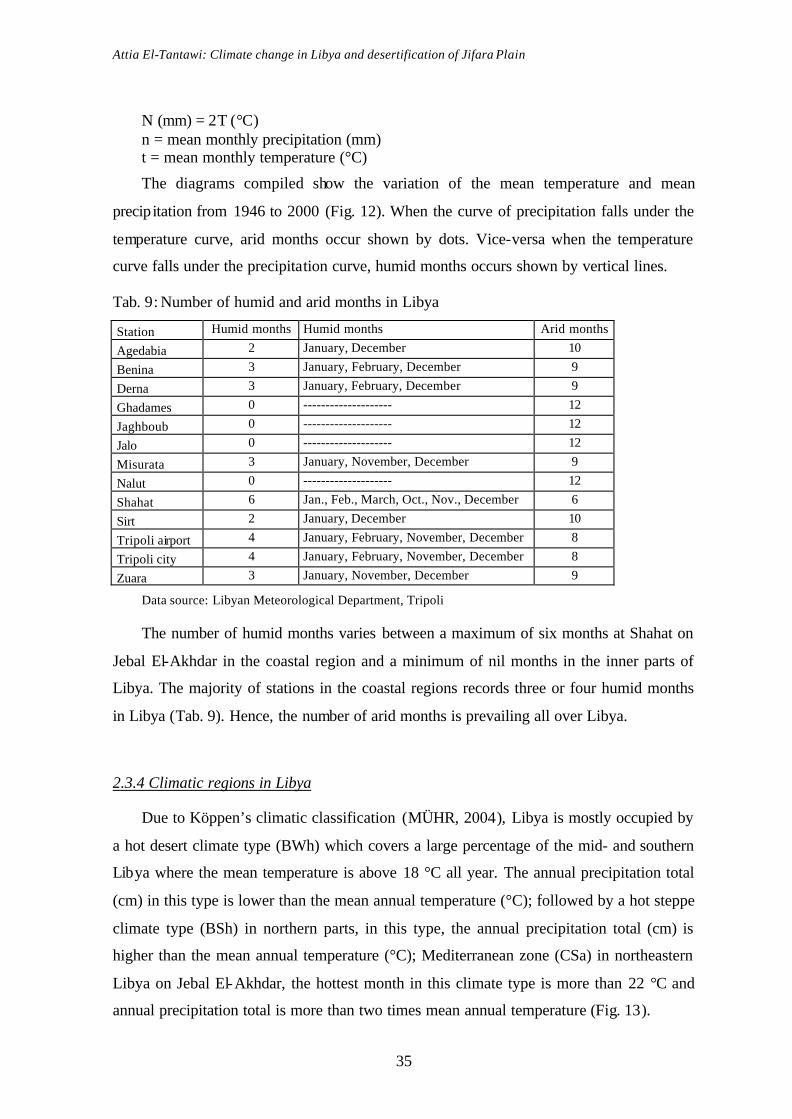
Attia El-Tantawi: Climate change in Libya and desertification of Jifara Plain
35
N (mm) = 2T (°C) n = mean monthly precipitation (mm) t = mean monthly temperature (°C)
The diagrams compiled show the variation of the mean temperature and mean
precipitation from 1946 to 2000 (Fig. 12). When the curve of precipitation falls under the
temperature curve, arid months occur shown by dots. Vice-versa when the temperature
curve falls under the precipitation curve, humid months occurs shown by vertical lines.
Tab. 9: Number of humid and arid months in Libya
Station Humid months Humid months Arid months
Agedabia 2 January, December 10
Benina 3 January, February, December 9
Derna 3 January, February, December 9
Ghadames 0 -------------------- 12
Jaghboub 0 -------------------- 12
Jalo 0 -------------------- 12
Misurata 3 January, November, December 9
Nalut 0 -------------------- 12
Shahat 6 Jan., Feb., March, Oct., Nov., December 6
Sirt 2 January, December 10
Tripoli airport 4 January, February, November, December 8
Tripoli city 4 January, February, November, December 8
Zuara 3 January, November, December 9
Data source: Libyan Meteorological Department, Tripoli
The number of humid months varies between a maximum of six months at Shahat on
Jebal El-Akhdar in the coastal region and a minimum of nil months in the inner parts of
Libya. The majority of stations in the coastal regions records three or four humid months
in Libya (Tab. 9). Hence, the number of arid months is prevailing all over Libya.
2.3.4 Climatic regions in Libya
Due to Köppen’s climatic classification (MÜHR, 2004), Libya is mostly occupied by
a hot desert climate type (BWh) which covers a large percentage of the mid- and southern
Libya where the mean temperature is above 18 °C all year. The annual precipitation total
(cm) in this type is lower than the mean annual temperature (°C); followed by a hot steppe
climate type (BSh) in northern parts, in this type, the annual precipitation total (cm) is
higher than the mean annual temperature (°C); Mediterranean zone (CSa) in northeastern
Libya on Jebal El-Akhdar, the hottest month in this climate type is more than 22 °C and
annual precipitation total is more than two times mean annual temperature (Fig. 13).
Attia El-Tantawi: Climate change in Libya and desertification of Jifara Plain
36
Libya was also classified into climatic regions according to the De Martonne climate
classification based on the duration of the aridity period over the year. The aridity index is
defined by
A = [P/ (T+10)]
P = annual precipitation total (mm)
T = mean annual temperature (°C)
Due to the De Martonne aridity index, climate can be identified by the following types
as: desert (0-5); steppe (5-12); Mediterranean (15-20); sub-humid (20-30); humid (30-60)
very humid (>60). Based on precipitation and temperature data (1946-2000), arid indices
were computed at all stations under study in Libya to produce the regions shown (Fig. 13).
Arid desert climate type: It occupies most of Libya stretching from the south border to the
Mediterranean Sea along the Gulf of Sirt. Deserts are characterized by low precipitation
that is highly variable both intra- and inter-annually. Desert air is very dry, large daily
temperature fluctuations occur and the potential evapotranspiration is high (NOBLE and
GITAY, 1995:162). The desert climate type in Libya is distinguished by high mean annual
temperature, El-Kufra (23.3 °C), Sebha (23.4 °C), and by erratic annual rainfall, El-Kufra
(2.1 mm), Sebha (9.0 mm), and a very high mean annual temperature range, El-Kufra (15
°C), Sebha (14.7 °C). Summer temperatures are extremely hot, mean summer temperature
are30.8 and 30.6 °C at El-Kufra and Sebha, respectively. The dry air enables rapid relative
cooling during winter, when temperatures reach at El-Kufra (14.2 °C) and at Sebha (12.8
°C). Annual precipitation totals under the desert climate type are generally less than 50
mm; it sometimes falls violent after thunderstorms. The rare and isolated rain showers are
caused chiefly by incursions of unstable maritime polar air (mP) from the northwest or the
occasional penetration of moist equatorial air from the south.
In the desert, the hot summer (Jun.-Aug.) is almost rainless. In November 1937, an
exceptionally heavy thunderstorm raged during the night in the area from Edri to Brak in
western Libya included the southern sand desert collapsing most houses in Akar north of
Sebha. In autumn (Sep. - Nov.) 1963, rainstorms filled west of Hiruj EsSawda in the
middle of Libya resulting large basins of water fold to about 2 meters. Deeps and Wadis
carried water for up to four months (KANTER, 1967: 99). Mean annual relative humidity
in this type is low, El-Kufra (29.3 %) and Sebha (33.9 %) with decreasing values of 21.7
% and 25 % in summer and increasing values of 41.6 %, 46.7 % in winter, respectively.

Attia El-Tantawi: Climate change in Libya and desertification of Jifara Plain
37
Fig. 13: Climatic types in Libya, after the Köppen and De Martonne climate classification
schemes
Data source: Libyan Meteorological Department, Tripoli
Steppe climate type: It is found mostly on the northern margins of the arid climate
with decreasing mean annual temperatures northwards (Misurata 20.4 °C, Zuara 19.8 °C).
A few higher mountain ranges rise from the desert fringe, showing slight deviations in the
increase of precipitation and temperature (Jebal Naffusah in northwestern Libya and Jebal
El-Akhdar in northeastern Libya). Annual precipitation usually ranges from 100 to 350
mm (Tripoli airport 277 mm, Misurata 274, Derna 269 mm), most of it occurring during
winter due to the penetration of cyclonic storms associated with the equatorward shift of
the westerly wind belt. Mean annual temperatures are high exceeding 18 °C at all stations
(Zuara 19.8 °C, Benina 20.1 °C). The moderating influence of the Mediterranean Sea helps
to keep temperature relatively low during summer (GRIFFITHS, 1968: 40). Mean annual
relative humidity is higher than for the desert climate type (Zuara 73 %, Misurata 70.8 %).
Sub-humid Mediterranean climate type: This type is caused by the seasonal shift in
latitude of the Subtropical High and the Westerlies. During summer, the Subtropical high
Mediterranean Sea

Attia El-Tantawi: Climate change in Libya and desertification of Jifara Plain
38
shifts poleward into the Mediterranean region, blanketing them with dry, warm and stable
air. As winter approaches, this pressure center retreats equatorward, allowing the Wester-
lies, with their eastward-traveling weather fronts and cyclonic storms, to overspread this
region (SCOTT, 2001). It is characterized by a distinctive pattern of dry summers and
moderately wet winters; annual precipitation is above 325 mm.
This region occupies El-Jebal El-Akhdar region in northeastern Libya and a tiny area
around Tripoli city in northwestern Libya. In altitudinal respects, there is a cooler and wet
altitudinal climate which resembles that of the Mediterranean (at Shahat on Jebal El-
Akhdar (621 m), the mean annual temperature is (16.5 °C) and the annual precipitation is
(559 mm). Most precipitation is in the form of rain and snow is rare. In most instances,
precipitation is associated with Northerlies or Westerlies so that obviously wind exposed
northern and western slopes are wetter than the sheltered southern and eastern slopes.
Concerning livelihoods systems, in general, light pastoral use is possible in arid areas,
in semi-arid areas, grazing is satisfactory, agricultural areas are irregular and rainfed
agriculture prevails, while irrigated agriculture prevails in Mediterranean climate.
2.4 Water resources
Based on Libyan General Water Authority and General Environmental Authority
reports, water resources in Libya were compiled (Fig. 14):
Groundwater is the main source of water supply with 88 % of the water needs. It is
found in five basins, three of them in northern Libya: Jifara Plain, El Jebal El-Akhdar, El-
Hamada El-Hamra, two in southern Libya: Murzuq and El-Kufra-Serir. The basins in the
north suffer from severe deterioration; their recharges have not been precisely determined,
it is estimated about 500 mill. m3 per year only from precipitation. Water storage of the
basins in the south is not renewable, but the basins contain huge storage of water. These
storages are transferred to the northern areas by the Great Man-made River Project (EL-
TANTAWI, 1998a).
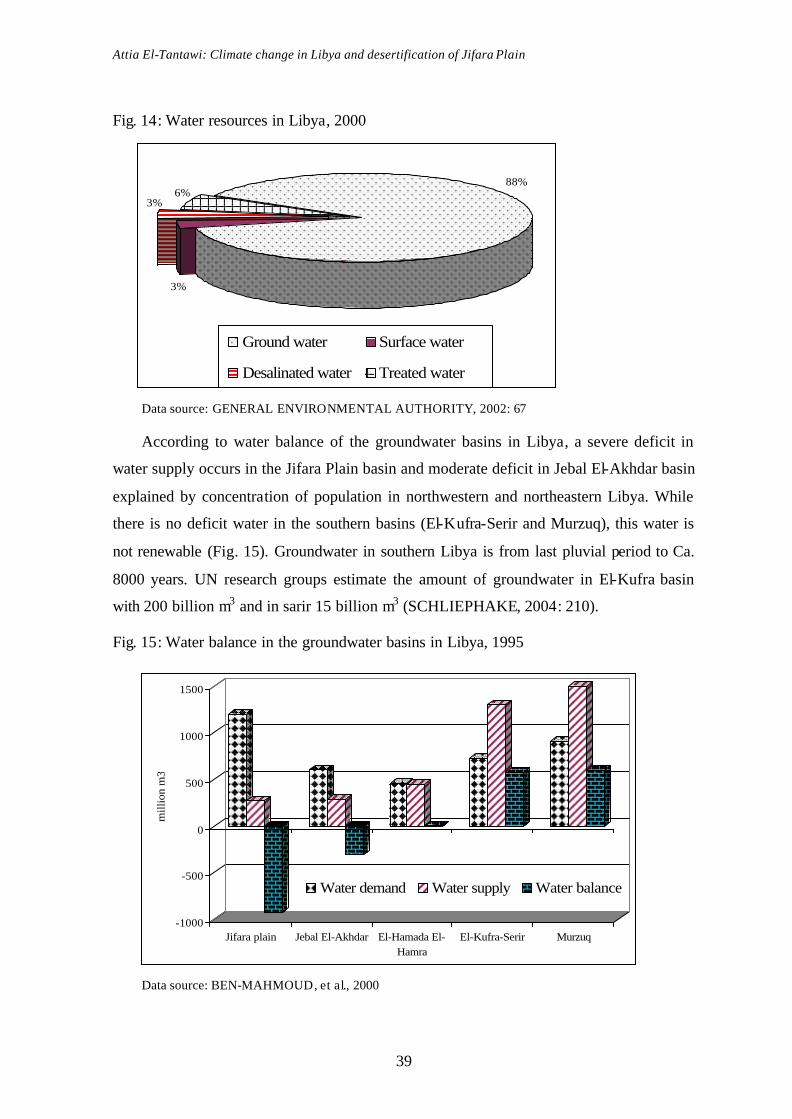
Attia El-Tantawi: Climate change in Libya and desertification of Jifara Plain
39
Fig. 14: Water resources in Libya, 2000
3%
88%6%
3%
Ground water Surface water
Desalinated water Treated water
Data source: GENERAL ENVIRONMENTAL AUTHORITY, 2002: 67
According to water balance of the groundwater basins in Libya, a severe deficit in
water supply occurs in the Jifara Plain basin and moderate deficit in Jebal El-Akhdar basin
explained by concentration of population in northwestern and northeastern Libya. While
there is no deficit water in the southern basins (El-Kufra-Serir and Murzuq), this water is
not renewable (Fig. 15). Groundwater in southern Libya is from last pluvial period to Ca.
8000 years. UN research groups estimate the amount of groundwater in El-Kufra basin
with 200 billion m3 and in sarir 15 billion m3 (SCHLIEPHAKE, 2004: 210).
Fig. 15: Water balance in the groundwater basins in Libya, 1995
-1000
-500
0
500
1000
1500
mill
ion
m3
Jifara plain Jebal El-Akhdar El-Hamada El-Hamra
El-Kufra-Serir Murzuq
Water demand Water supply Water balance
Data source: BEN-MAHMOUD, et al., 2000
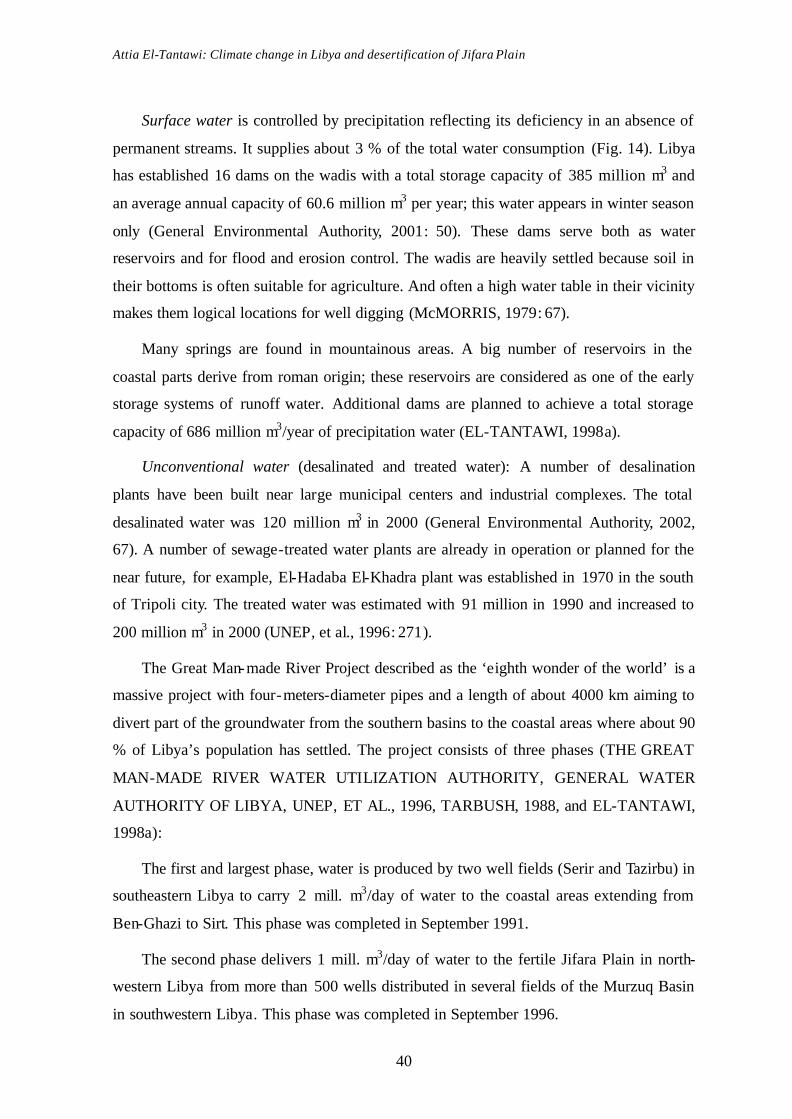
Attia El-Tantawi: Climate change in Libya and desertification of Jifara Plain
40
Surface water is controlled by precipitation reflecting its deficiency in an absence of
permanent streams. It supplies about 3 % of the total water consumption (Fig. 14). Libya
has established 16 dams on the wadis with a total storage capacity of 385 million m3 and
an average annual capacity of 60.6 million m3 per year; this water appears in winter season
only (General Environmental Authority, 2001: 50). These dams serve both as water
reservoirs and for flood and erosion control. The wadis are heavily settled because soil in
their bottoms is often suitable for agriculture. And often a high water table in their vicinity
makes them logical locations for well digging (McMORRIS, 1979: 67).
Many springs are found in mountainous areas. A big number of reservoirs in the
coastal parts derive from roman origin; these reservoirs are considered as one of the early
storage systems of runoff water. Additional dams are planned to achieve a total storage
capacity of 686 million m3/year of precipitation water (EL-TANTAWI, 1998a).
Unconventional water (desalinated and treated water): A number of desalination
plants have been built near large municipal centers and industrial complexes. The total
desalinated water was 120 million m3 in 2000 (General Environmental Authority, 2002,
67). A number of sewage-treated water plants are already in operation or planned for the
near future, for example, El-Hadaba El-Khadra plant was established in 1970 in the south
of Tripoli city. The treated water was estimated with 91 million in 1990 and increased to
200 million m3 in 2000 (UNEP, et al., 1996: 271).
The Great Man-made River Project described as the ‘eighth wonder of the world’ is a
massive project with four-meters-diameter pipes and a length of about 4000 km aiming to
divert part of the groundwater from the southern basins to the coastal areas where about 90
% of Libya’s population has settled. The project consists of three phases (THE GREAT
MAN-MADE RIVER WATER UTILIZATION AUTHORITY, GENERAL WATER
AUTHORITY OF LIBYA, UNEP, ET AL., 1996, TARBUSH, 1988, and EL-TANTAWI,
1998a):
The first and largest phase, water is produced by two well fields (Serir and Tazirbu) in
southeastern Libya to carry 2 mill. m3/day of water to the coastal areas extending from
Ben-Ghazi to Sirt. This phase was completed in September 1991.
The second phase delivers 1 mill. m3/day of water to the fertile Jifara Plain in north-
western Libya from more than 500 wells distributed in several fields of the Murzuq Basin
in southwestern Libya. This phase was completed in September 1996.
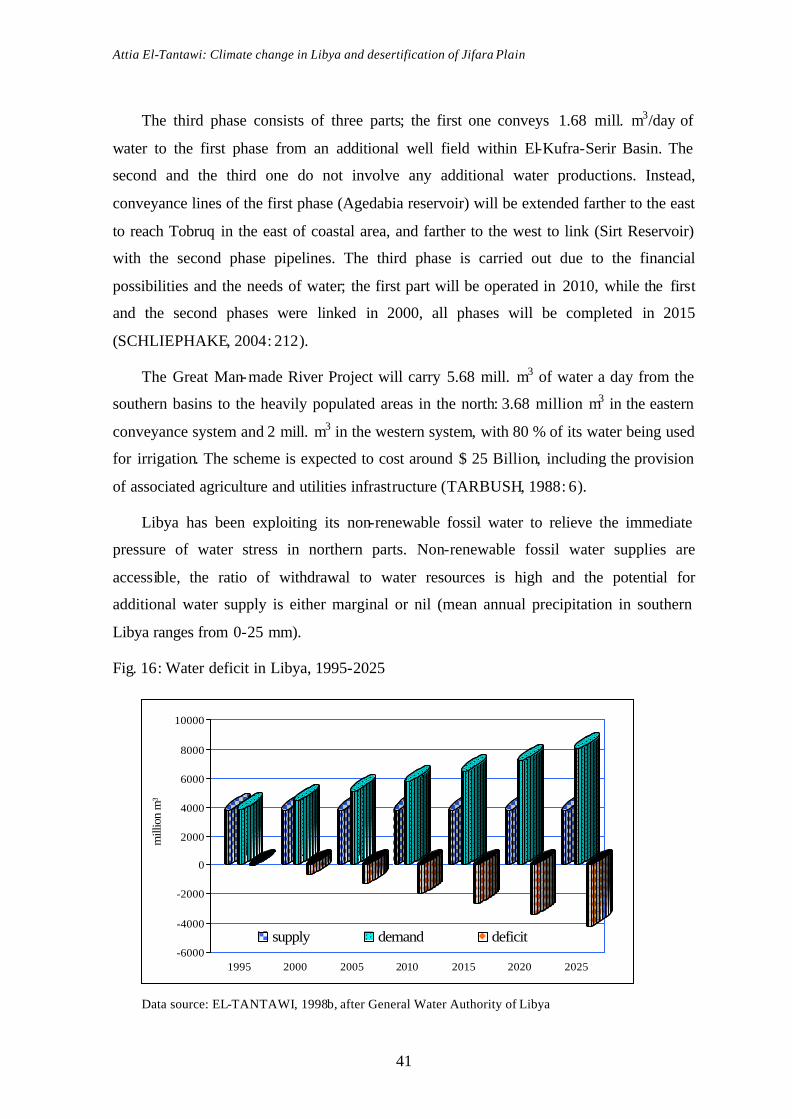
Attia El-Tantawi: Climate change in Libya and desertification of Jifara Plain
41
The third phase consists of three parts; the first one conveys 1.68 mill. m3/day of
water to the first phase from an additional well field within El-Kufra-Serir Basin. The
second and the third one do not involve any additional water productions. Instead,
conveyance lines of the first phase (Agedabia reservoir) will be extended farther to the east
to reach Tobruq in the east of coastal area, and farther to the west to link (Sirt Reservoir)
with the second phase pipelines. The third phase is carried out due to the financial
possibilities and the needs of water; the first part will be operated in 2010, while the first and the second phases were linked in 2000, all phases will be completed in 2015
(SCHLIEPHAKE, 2004: 212).
The Great Man-made River Project will carry 5.68 mill. m3 of water a day from the
southern basins to the heavily populated areas in the north: 3.68 million m3 in the eastern
conveyance system and 2 mill. m3 in the western system, with 80 % of its water being used
for irrigation. The scheme is expected to cost around $ 25 Billion, including the provision
of associated agriculture and utilities infrastructure (TARBUSH, 1988: 6).
Libya has been exploiting its non-renewable fossil water to relieve the immediate
pressure of water stress in northern parts. Non-renewable fossil water supplies are
accessible, the ratio of withdrawal to water resources is high and the potential for
additional water supply is either marginal or nil (mean annual precipitation in southern
Libya ranges from 0-25 mm).
Fig. 16: Water deficit in Libya, 1995-2025
-6000
-4000
-2000
0
2000
4000
6000
8000
10000
mill
ion
m³
1995 2000 2005 2010 2015 2020 2025
supply demand deficit
Data source: EL-TANTAWI, 1998b, after General Water Authority of Libya

Attia El-Tantawi: Climate change in Libya and desertification of Jifara Plain
42
It is noted that in Libya the amount of water withdrawal is over eight times its renew-
able water resources. The gap is filled largely by the pumping of fossil groundwater (FAO,
2001 ). Water needs of Libya are growing rapidly and water deficit will be more than 4
billion m3/year in 2025 (Fig. 16).
Total annual renewable water resources in Libya in 2000 was about 0.70 billion m3,
and renewable water resources were 538 m3/capita/year in 1960, (154 m3) in 1990 (154
m3), projected to 55 m3 in 2025 (HIRJI and IBREKK, 2001). With the intensification of
water resources stress and the limited potential for additional water supply, increasing
emphasis has been given to the improvement of water use efficiency in recent years. In the
agricultural sector, it has been concretized as ‘more crop and higher value per drop’
(YANG and ZEHNDER, 2001: 1315).
Attia El-Tantawi: Climate change in Libya and desertification of Jifara Plain
43
3. Observed climate changes
Climate of the past 1000 years has undergone a warm period during the middle ages
(1150-1350 A.D.) followed by a cold period known as the ‘little ice age’ (1500-1850 A.D)
and a warming trend was set from 1880 until the late 1930s and early 1940s (MGELY,
1984: 1). Recent climate analyses for the last 1000 years over the northern hemisphere
indicate that the magnitude of 20th century warming is likely to have been the largest of
any century during this period. In addition, the 1990s were experienced as the warmest
decade of the millennium. The regional patterns of warming that occurred in the early part
of the 20th century were different from those occurred in the latter part, as well as for three
periods according to IPCC division (1910-1945), (1946-1975) and (1976-2000) in the
Third Assessment Report about Climate Change, 2001. The more recent period of
warming (1976-2000) has been almost global. The overall picture does also suggest an
increase in the frequency of extreme events (JACQUELINE, 2000). Climatic parameters
trends (temperature, precipitation, relative humidity and cloud amount) and the trend-noise
ratio over three different periods (1946-2000) as a long-term period, (1946-1975) and
(1976-2000) as short-term periods were elaborated at all reference stations in order to
estimate the observations of climate changes in Libya and to compare them with global
climate change. These methods require the determination of the statistical significance of
the trend, for which the non-parametric Mann-Kendall test for trend was applied.
3.1 Global climate change
3.1.1 Observed changes in temperature
Global surface air temperature has clearly risen over the last 150 years, it is virtually
agreed that a generally increasing trend in global surface air temperature has occurred over
the 20th century; annual global air surface temperatures warmed by 0.62 °C over 1901-
1997 (JONES, et al., 1999: 196). IPCC Third Assessment Report, 2001 and several studies
objectively identified the worldwide behavior of temperature changes in the three periods;
1910-1945 (first warming period), 1946-1975 (period of little temperature changes), and
1976-2000 (the warmest period).
According to IPCC 2001, average global air surface temperature has increased by 0.6
°C (limits of close to 0.4 and 0.8 °C) during the past 100 years, with 95 % confidence. The
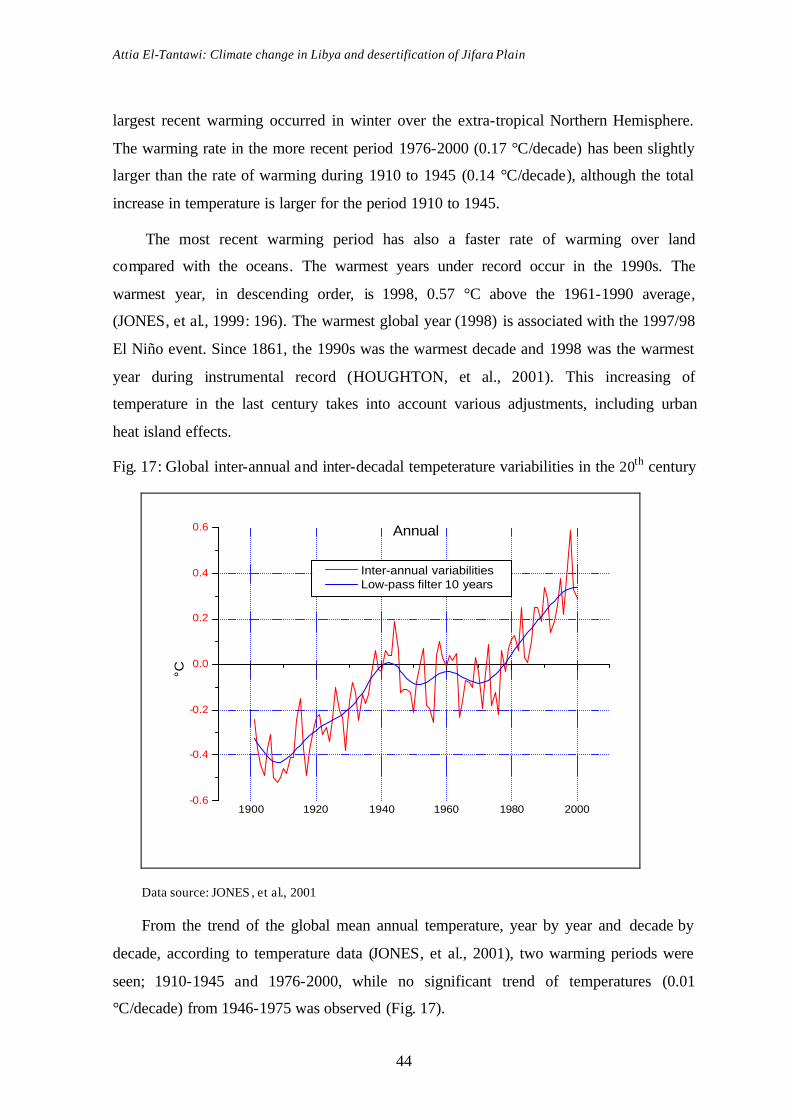
Attia El-Tantawi: Climate change in Libya and desertification of Jifara Plain
44
largest recent warming occurred in winter over the extra-tropical Northern Hemisphere.
The warming rate in the more recent period 1976-2000 (0.17 °C/decade) has been slightly
larger than the rate of warming during 1910 to 1945 (0.14 °C/decade), although the total
increase in temperature is larger for the period 1910 to 1945.
The most recent warming period has also a faster rate of warming over land
compared with the oceans. The warmest years under record occur in the 1990s. The
warmest year, in descending order, is 1998, 0.57 °C above the 1961-1990 average,
(JONES, et al., 1999: 196). The warmest global year (1998) is associated with the 1997/98
El Niño event. Since 1861, the 1990s was the warmest decade and 1998 was the warmest
year during instrumental record (HOUGHTON, et al., 2001). This increasing of
temperature in the last century takes into account various adjustments, including urban
heat island effects.
Fig. 17: Global inter-annual and inter-decadal tempeterature variabilities in the 20th century
1900 1920 1940 1960 1980 2000-0.6
-0.4
-0.2
0.0
0.2
0.4
0.6
Annual
°C
Inter-annual variabilities Low-pass filter 10 years
Data source: JONES , et al., 2001
From the trend of the global mean annual temperature, year by year and decade by
decade, according to temperature data (JONES, et al., 2001), two warming periods were
seen; 1910-1945 and 1976-2000, while no significant trend of temperatures (0.01
°C/decade) from 1946-1975 was observed (Fig. 17).
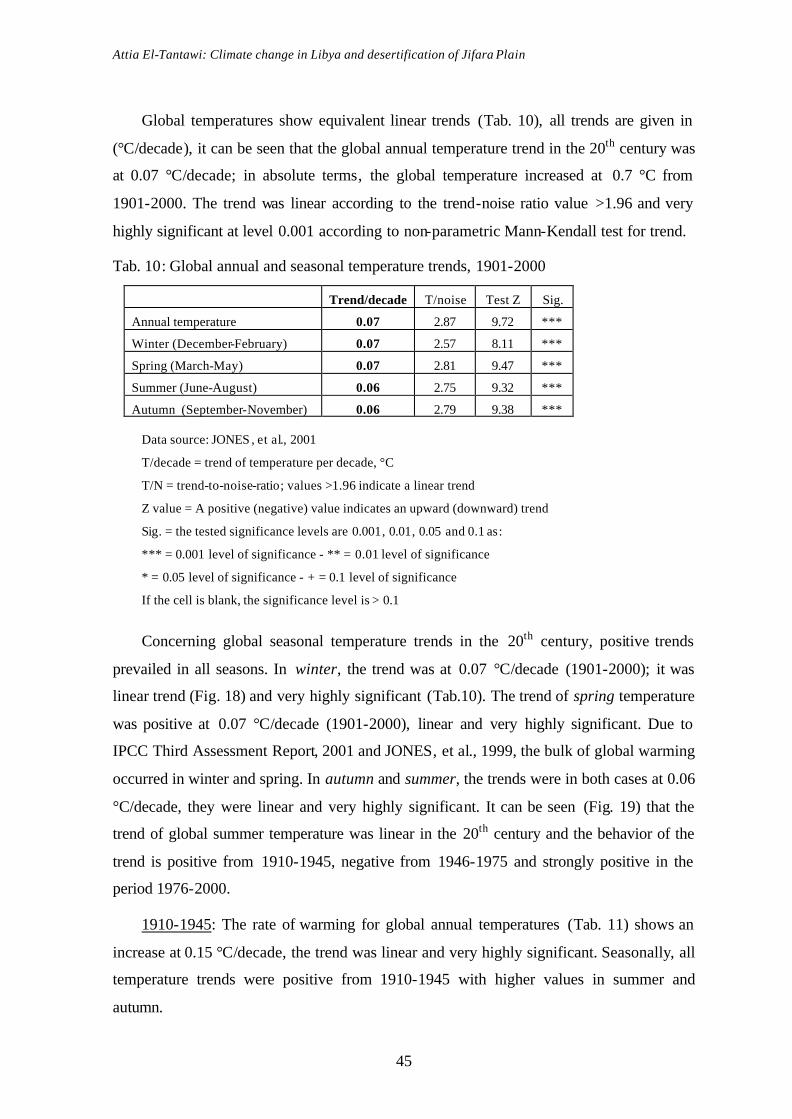
Attia El-Tantawi: Climate change in Libya and desertification of Jifara Plain
45
Global temperatures show equivalent linear trends (Tab. 10), all trends are given in
(°C/decade), it can be seen that the global annual temperature trend in the 20th century was
at 0.07 °C/decade; in absolute terms, the global temperature increased at 0.7 °C from
1901-2000. The trend was linear according to the trend-noise ratio value >1.96 and very
highly significant at level 0.001 according to non-parametric Mann-Kendall test for trend.
Tab. 10: Global annual and seasonal temperature trends, 1901-2000
Trend/decade T/noise Test Z Sig.
Annual temperature 0.07 2.87 9.72 ***
Winter (December-February) 0.07 2.57 8.11 ***
Spring (March-May) 0.07 2.81 9.47 ***
Summer (June-August) 0.06 2.75 9.32 ***
Autumn (September-November) 0.06 2.79 9.38 ***
Data source: JONES , et al., 2001
T/decade = trend of temperature per decade, °C
T/N = trend-to-noise-ratio; values >1.96 indicate a linear trend
Z value = A positive (negative) value indicates an upward (downward) trend
Sig. = the tested significance levels are 0.001, 0.01, 0.05 and 0.1 as:
*** = 0.001 level of significance - ** = 0.01 level of significance
* = 0.05 level of significance - + = 0.1 level of significance
If the cell is blank, the significance level is > 0.1
Concerning global seasonal temperature trends in the 20th century, positive trends
prevailed in all seasons. In winter, the trend was at 0.07 °C/decade (1901-2000); it was
linear trend (Fig. 18) and very highly significant (Tab.10). The trend of spring temperature
was positive at 0.07 °C/decade (1901-2000), linear and very highly significant. Due to
IPCC Third Assessment Report, 2001 and JONES, et al., 1999, the bulk of global warming
occurred in winter and spring. In autumn and summer, the trends were in both cases at 0.06
°C/decade, they were linear and very highly significant. It can be seen (Fig. 19) that the
trend of global summer temperature was linear in the 20th century and the behavior of the
trend is positive from 1910-1945, negative from 1946-1975 and strongly positive in the
period 1976-2000.
1910-1945: The rate of warming for global annual temperatures (Tab. 11) shows an
increase at 0.15 °C/decade, the trend was linear and very highly significant. Seasonally, all
temperature trends were positive from 1910-1945 with higher values in summer and
autumn.

Attia El-Tantawi: Climate change in Libya and desertification of Jifara Plain
46
Fig. 18: Global winter temperature trends in the 20th century
1900 1920 1940 1960 1980 2000-0.6
-0.4
-0.2
0.0
0.2
0.4
0.6 Winter
°C
Inter-annual variabilities Low-pass filter 10 years
Fig. 19: Global summer temperature trends in the 20th century
1900 1920 1940 1960 1980 2000-0.6
-0.4
-0.2
0.0
0.2
0.4
0.6
Summer
°C
Inter-annual variabilities Low-pass filter 10 years
Data source: JONES , et al., 2001

Attia El-Tantawi: Climate change in Libya and desertification of Jifara Plain
47
Tab. 11: Global annual and seasonal temperature trends, 1910-1945
Trend/decade T/noise Test Z Sig.
Annual 0.15 2.91 6.03 ***
Winter (December-February) 0.14 2.30 4.53 ***
Spring (March-May) 0.14 2.54 5.07 ***
Summer (June-August) 0.16 2.98 6.14 ***
Autumn (September-November) 0.15 2.93 6.26 ***
Data source: JONES, et al., 2001. Explanation: see Tab. 10
1946-1975: Although positive temperature trends prevailed in annual and seasonal
respects, such trends were very weakly positive (Tab. 12). This period had no significant
changes of temperature and all trends were not linear.
Tab. 12: Rate of global warming for annual and seasonal temperatures, 1946-1975
Trend/decade T/noise Test Z Sig.
Annual 0.01 0.34 0.45
Winter (December-February) 0.02 0.24 0.06
Spring (March-May) 0.02 0.46 0.55
Summer (June-August) 0.02 0.48 0.37
Autumn (September-November) 0.01 0.26 0.23
Data source: JONES , et al., 2001. Explanation: see Tab. 10
1976-2000: Warming during this period was globally largely synchronous, especially
during winter and spring, and was faster (but inter-annually more variable) than from
1910-1945 warming. Mean annual temperature increased at 0.18 °C/decade, in absolute
terms it increased at 0.45 °C. Trends of temperature in this period were very highly
significant (Tab. 13), all trends were linear (due to trend-noise ratio >1.96). It can also be
observed that the bulk of global warming occurred in winter and spring, in contrast to the
warming period 1910-1945.
Tab. 13: Rate of global warming for annual and seasonal temperatures, 1976-2000
Trend/decade T/noise Test Z Sig.
Annual 0.18 2.62 4.38 ***
Winter (December-February) 0.21 2.42 3.60 ***
Spring (March-May) 0.20 2.60 4.63 ***
Summer (June-August) 0.19 2.57 4.30 ***
Autumn (September-November) 0.15 2.25 3.50 ***
Data source: JONES , et al., 2001. Explanation: see Tab. 10
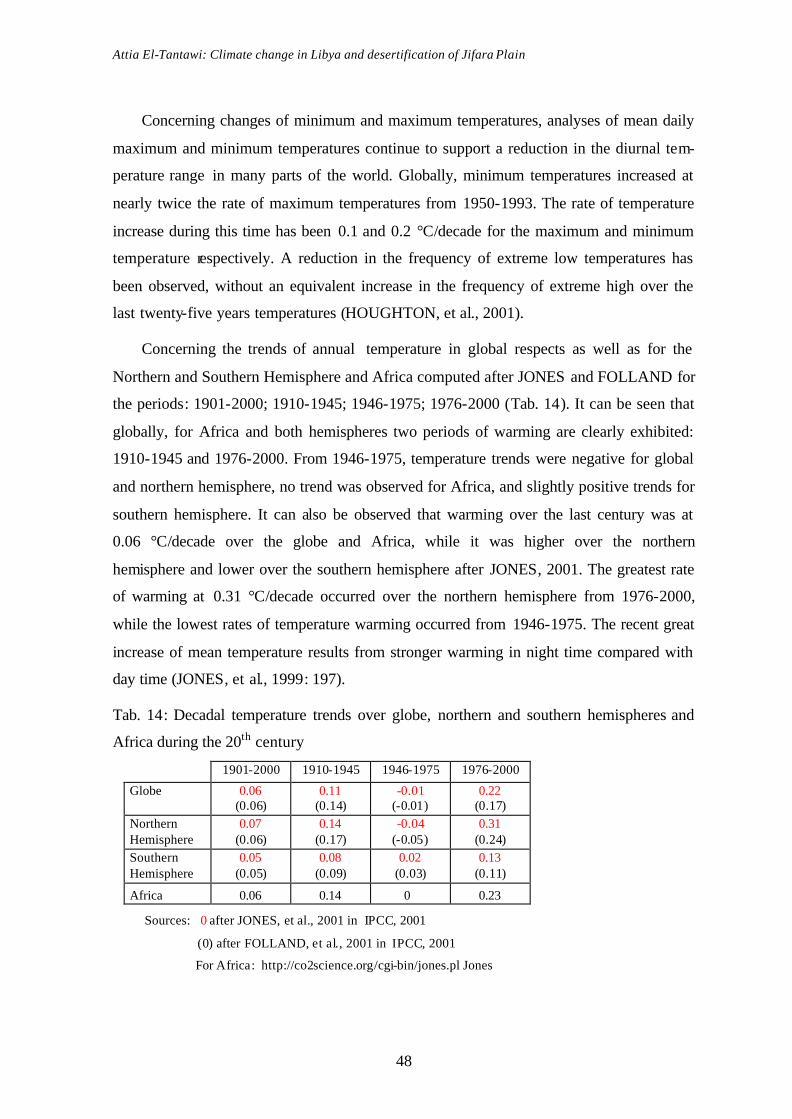
Attia El-Tantawi: Climate change in Libya and desertification of Jifara Plain
48
Concerning changes of minimum and maximum temperatures, analyses of mean daily
maximum and minimum temperatures continue to support a reduction in the diurnal tem-
perature range in many parts of the world. Globally, minimum temperatures increased at
nearly twice the rate of maximum temperatures from 1950-1993. The rate of temperature
increase during this time has been 0.1 and 0.2 °C/decade for the maximum and minimum
temperature respectively. A reduction in the frequency of extreme low temperatures has
been observed, without an equivalent increase in the frequency of extreme high over the
last twenty-five years temperatures (HOUGHTON, et al., 2001).
Concerning the trends of annual temperature in global respects as well as for the
Northern and Southern Hemisphere and Africa computed after JONES and FOLLAND for
the periods: 1901-2000; 1910-1945; 1946-1975; 1976-2000 (Tab. 14). It can be seen that
globally, for Africa and both hemispheres two periods of warming are clearly exhibited:
1910-1945 and 1976-2000. From 1946-1975, temperature trends were negative for global
and northern hemisphere, no trend was observed for Africa, and slightly positive trends for
southern hemisphere. It can also be observed that warming over the last century was at
0.06 °C/decade over the globe and Africa, while it was higher over the northern
hemisphere and lower over the southern hemisphere after JONES, 2001. The greatest rate
of warming at 0.31 °C/decade occurred over the northern hemisphere from 1976-2000,
while the lowest rates of temperature warming occurred from 1946-1975. The recent great
increase of mean temperature results from stronger warming in night time compared with
day time (JONES, et al., 1999: 197).
Tab. 14: Decadal temperature trends over globe, northern and southern hemispheres and
Africa during the 20th century
1901-2000 1910-1945 1946-1975 1976-2000
Globe 0.06 (0.06)
0.11 (0.14)
-0.01 (-0.01)
0.22 (0.17)
Northern Hemisphere
0.07 (0.06)
0.14 (0.17)
-0.04 (-0.05)
0.31 (0.24)
Southern Hemisphere
0.05 (0.05)
0.08 (0.09)
0.02 (0.03)
0.13 (0.11)
Africa 0.06 0.14 0 0.23
Sources: 0 after JONES, et al., 2001 in IPCC, 2001
(0) after FOLLAND, et al., 2001 in IPCC, 2001
For Africa: http://co2science.org/cgi-bin/jones.pl Jones
Attia El-Tantawi: Climate change in Libya and desertification of Jifara Plain
49
3.1.2 Observed changes in precipitation
Historic changes in global-scale precipitation are considerably more difficult reliably
to estimate from measurements than changes in surface air temperature. For example, prior
to the 1970s recordings existed only for about 30 % of the total Earth's surface (HULME,
1995). Overall global land precipitation has increased by about 2 % since the beginning of
the 20th century. Though the increase is statistically significant, it is neither spatially nor
temporally uniform (FOLLAND, et al., 2001). The IPCC Third Assessment Report 2001,
climate change: the scientific basis, pointed out that annual land precipitation has
continued to increase at about 0.5-1 %/decade in the mid- and high latitudes of the
northern hemisphere except over Eastern Asia. Over the northern subtropics (10-30° N),
land-surface precipitation has decreased on average at about 0.3 %/decade, although this
has shown signs of recovery in recent years.
DAI, A., FUNG, I. Y. and DEL GENIO, A. D. (1997) have analyzed global stations
data and created a grid dataset of monthly precipitation from 1900-1988. The mode
suggests that, during winters with high North Atlantic Oscillation Index (NAOI),
precipitation is above normal in northern Europe, eastern United States, northern Africa
and the Mediterranean, while below-normal precipitation occurs in southern Europe,
eastern Canada and western Greenland. Overall, global land precipitation has increased by
about 2 % since the beginning of the 20th century. The increase is statistically significant
but has been neither spatially nor temporally uniform (HOUGHTON, et al., 2001).
Increasing precipitation over the tropics is not evident during the past few decades.
Precipitation of Africa also exhibits high inter-decadal variabilities; there has been
throughout North Africa, south of the Sahara, a pattern of continuous aridity since the late
1960s, this pattern is most persistent over the western parts, the driest period was in the
1980s with some recovery occurring during the 1990s (FOLLAND, et al., 2001). The
decade 1950-1959 was characterized by above-normal precipitation over most parts of
Africa, although precipitation deficiencies prevailed over the near-equatorial region.
During 1960-1969, the precipitation anomaly pattern dramatically reversed with
precipitation deficits observed for most of Africa while the equatorial region experienced
widespread abundance of precipitation (McCARTHY, et al. 2001).
In general, global precipitation was relatively stable, or slightly increased from 1900
to the early 1940s. It then increased sharply from the mid-1940s to the mid-1950s and has
Attia El-Tantawi: Climate change in Libya and desertification of Jifara Plain
50
remained relatively high since then over most of the land areas except the tropics, where
precipitation decreased to below the 1900–1988 average in the 1970s and 1980s (DAI, et
al, 1997). There is also a generally decreasing trend in precipitation since the late 1970s
over all latitudes south of 60 °N. Under the most rapid global warming scenario, growing
areas of Africa experience changes in summer or winter precipitation. Over large parts of
eastern Africa, increasing winter precipitation of 50-100 % was experienced while de-
creasing precipitation in summer occurred over parts of the Horn of Africa (McCARTHY,
et al. 2001).
The temporal change of global precipitation is directly attributed to the changes of
temperatures and its effect on the global air pressure systems and air masses movements
(RITTER, 2003). The existence of such precipitation time series, neve rtheless, enables a
comparison to be made between terrestrial-mean precipitation and global-mean
temperature during the 20th century. While there have been considerable decadal
variabilities in the relationship between temperature and precipitation; periods of global
warming have actually seen no change or slight decreases in terrestrial precipitation, while
periods of increasing precipitation have occurred during times with little global warming;
over the duration of the observed record the "terrestrial" surface has got wetter by about
1.6 %, while the world has warmed by about 0.5 °C (HULME, 1995).
3.1.3 Observed changes in total cloud amount
Clouds are an internal component of the climate system. The presence and variations
of cloud sky coverage and cloud radiative effects are closely related to atmospheric
humidity (SUN, et al., 2000: 4341). Over northern hemisphere mid- and high- latitude
continental regions indicate an increase in cloud cover of about 2 % since the beginning of
the 20th century, this increase is positively correlated with decreases in the diurnal
temperature range, similar changes have been shown over Australia, the only parts of
southern hemisphere, while changes in total cloud amount are uncertain both over sub-
tropical and tropical land areas, as well as over the oceans (HOUGHTON, et al. 2001).

Attia El-Tantawi: Climate change in Libya and desertification of Jifara Plain
51
3.1.4 Observed climate changes and extreme climate events
In the northern hemisphere, statistically significant increases have occurred in the
annual precipitation total derived from heavy and extreme precipitation events. There has
been a 2 to 4 % increase in the frequency of heavy precipitation events over the latter half
of the 20th century. At the same time, relatively small increases of land areas experiencing
severe drought or severe wetness have been observed. The frequency and intensity of
droughts have been increased in recent decades in some regions, such as parts of middle
Asia and Africa north of Sahara. In many regions, these changes are dominated by inter-
annual and inter-decadal climate variabilities, such as the shift in El-Nino Southern
Oscillation (ENSO) and its effect on the global warming (HOUGHTON, et al., 2001).
Extreme variabilities of precipitation are very dangerous (droughts, floods) especially
in arid and semi-arid lands. In trying to define a wet season or a season of reliable
precipitation, it is necessary to consider not only the amount of precipitation but also its
variability (LOCKWOOD, 1974: 118). Droughts and floods are two extremes of
precipitation variability. Such extreme precipitation events are usually associated with
large anomalies in the atmospheric circulation (in terms of both spatial scales and
magnitude), and the resulting anomalous surface conditions may amplify and prolong the
perturbations (DAI, et al., 1997: 2956)
3.2 Observed climate changes in Libya
3.2.1 Observed changes of temperatures
3.2.1.1 Temporal temperature trends
Trends of temperature have been computed in the present study for a long-term period
(1946-2000) and for two short-term periods (1946-1975) (1976-2000) referring to the
mean of annual, minimum and maximum as well as seasonal temperatures.
Trends of mean annual temperature
Long-term trends 1946-2000
According to the least-square method and the Mann-Kendall test for trend (Tab. 15),
positive trends of the mean annual temperature were observed at all study stations except
at Misurata (-0.05 °C/decade). The trends ranged between 0.05 and 0.31 °C/decade at Jag-

Attia El-Tantawi: Climate change in Libya and desertification of Jifara Plain
52
boub and Tripoli city, respectively. Trends at Derna, Jaghboub, Jalo and Sirt were weakly
positive (Fig. 21).
Except the trends of mean annual temperature at Agedabia and Tripoli city which
were linear, expressed by a trend-to-noise-ratio >1.96, most trends were, however, not
linear due to the high inter-annual temperature variabilities (Fig. 20).
For significance of trends, according to Mann-Kendall test for trend, the trends at
seven stations (Agedabia, El-Kufra, Ghadames, Nalut, Sebha, Tripoli city and Zuara) were
very high significant at 0.001 level; high significance trends were observed at Benina,
Shahat and Tripoli airport, significant trend and weakly significant trend were computed at
Sirt and Jalo, respectively, while the trends of mean annual temperature were not
significant in this period at Derna, Jaghboub and Misurata.
Tab. 15: Annual temperature trends (°C), trend-noise ratios and Mann-Kendall test for
trend (Test Z) in Libya, 1946-2000
Station Mean annual Trend/decade T/noise Test Z Sig.
Agedabia 20.5 0.19 1.97 4.46 ***
Benina 20.1 0.12 1.36 2.66 **
Derna 20.0 0.06 0.86 1.39
El-Kufra 23.2 0.20 1.73 3.87 ***
Ghadames 21.9 0.25 1.75 4.41 ***
Jaghboub 21.3 0.05 0.61 1.51
Jalo 22.4 0.07 0.76 1.70 +
Misurata 20.4 -0.05 -0.42 -0.58
Nalut 19.1 0.20 1.67 3.73 ***
Sebha 22.8 0.19 1.67 3.99 ***
Shahat 16.5 0.12 1.28 2.96 **
Sirt 20.4 0.09 1.12 2.31 *
Tripoli airport 20.5 0.13 1.45 3.04 **
Tripoli city 20.4 0.31 2.53 6.02 ***
Zuara 19.8 0.24 1.95 4.66 ***
Data source: Libyan Meteorological Department, Tripoli. Explanation: see Tab. 10
Short-term trends 1946-1975
The trends of temperature and the Mann-Kendall test for trend in the short-term period
1946-1976 (30 years) were computed for all study stations (Tab. 16) in order to investigate
the behavior of trends and their significances.
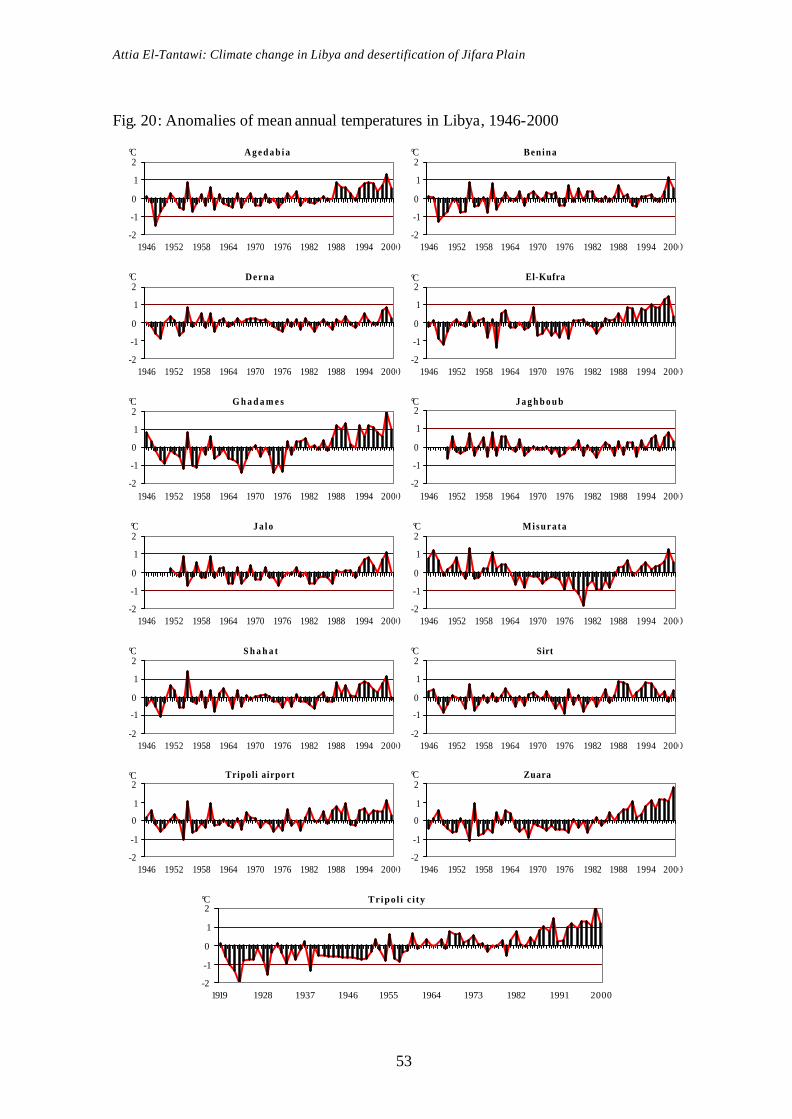
Attia El-Tantawi: Climate change in Libya and desertification of Jifara Plain
53
Fig. 20: Anomalies of mean annual temperatures in Libya, 1946-2000
A g e d a b i a
-2
-1
0
1
2
1946 1952 1958 1964 1970 1976 1982 1988 1994 2000
°C Benina
-2
-1
0
1
2
1946 1952 1958 1964 1970 1976 1982 1988 1994 2000
°C
D e r n a
-2
-1
0
1
2
1946 1952 1958 1964 1970 1976 1982 1988 1994 2000
°C El-Kufra
-2
-1
0
1
2
1946 1952 1958 1964 1970 1976 1982 1988 1994 2000
°C
G h a d a m e s
-2
-1
0
1
2
1946 1952 1958 1964 1970 1976 1982 1988 1994 2000
°C J a g h b o u b
-2
-1
0
1
2
1946 1952 1958 1964 1970 1976 1982 1988 1994 2000
°C
J a l o
-2
-1
0
1
2
1946 1952 1958 1964 1970 1976 1982 1988 1994 2000
°C Misurata
-2
-1
0
1
2
1946 1952 1958 1964 1970 1976 1982 1988 1994 2000
°C
S h a h a t
-2
-1
0
1
2
1946 1952 1958 1964 1970 1976 1982 1988 1994 2000
°C Sirt
-2
-1
0
1
2
1946 1952 1958 1964 1970 1976 1982 1988 1994 2000
°C
Tripoli airport
-2
-1
0
1
2
1946 1952 1958 1964 1970 1976 1982 1988 1994 2000
°C Zuara
-2
-1
0
1
2
1946 1952 1958 1964 1970 1976 1982 1988 1994 2000
°C
Tripol i c i ty
-2
-1
0
1
2
1919 1928 1937 1946 1955 1964 1973 1982 1991 2000
°C
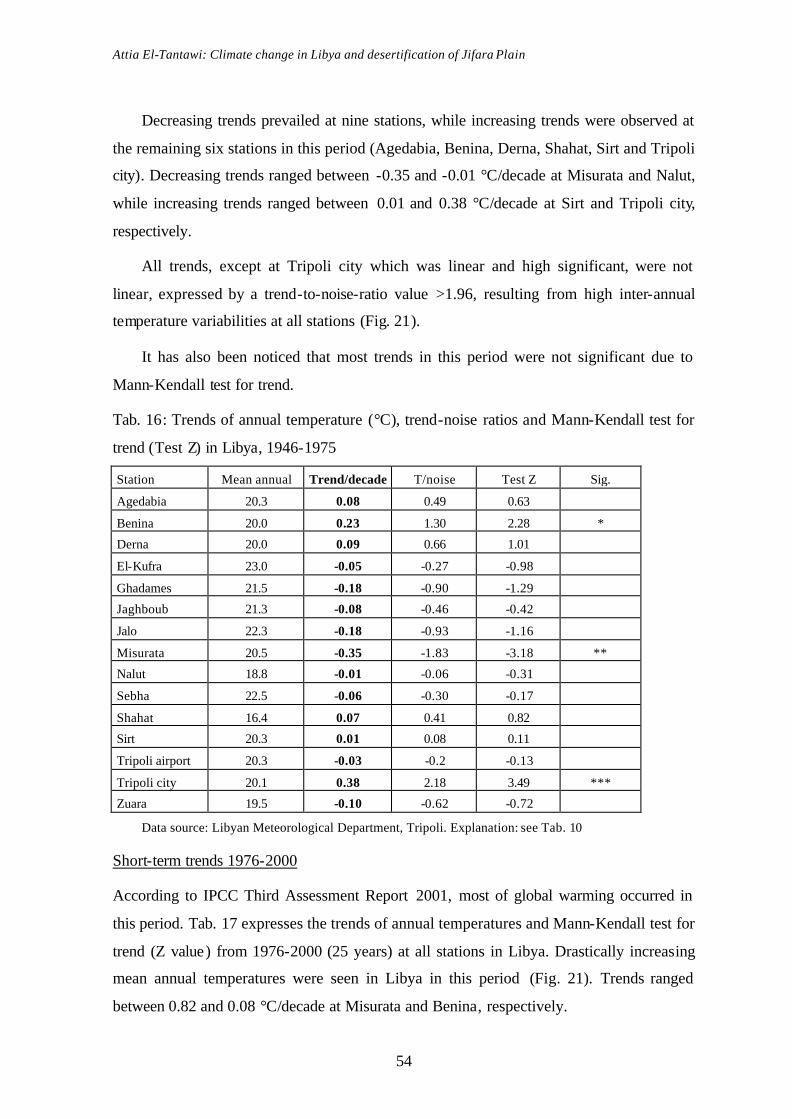
Attia El-Tantawi: Climate change in Libya and desertification of Jifara Plain
54
Decreasing trends prevailed at nine stations, while increasing trends were observed at
the remaining six stations in this period (Agedabia, Benina, Derna, Shahat, Sirt and Tripoli
city). Decreasing trends ranged between -0.35 and -0.01 °C/decade at Misurata and Nalut,
while increasing trends ranged between 0.01 and 0.38 °C/decade at Sirt and Tripoli city,
respectively.
All trends, except at Tripoli city which was linear and high significant, were not
linear, expressed by a trend-to-noise-ratio value >1.96, resulting from high inter-annual
temperature variabilities at all stations (Fig. 21).
It has also been noticed that most trends in this period were not significant due to
Mann-Kendall test for trend.
Tab. 16: Trends of annual temperature (°C), trend-noise ratios and Mann-Kendall test for
trend (Test Z) in Libya, 1946-1975
Station Mean annual Trend/decade T/noise Test Z Sig.
Agedabia 20.3 0.08 0.49 0.63
Benina 20.0 0.23 1.30 2.28 *
Derna 20.0 0.09 0.66 1.01
El-Kufra 23.0 -0.05 -0.27 -0.98
Ghadames 21.5 -0.18 -0.90 -1.29
Jaghboub 21.3 -0.08 -0.46 -0.42
Jalo 22.3 -0.18 -0.93 -1.16
Misurata 20.5 -0.35 -1.83 -3.18 **
Nalut 18.8 -0.01 -0.06 -0.31
Sebha 22.5 -0.06 -0.30 -0.17
Shahat 16.4 0.07 0.41 0.82
Sirt 20.3 0.01 0.08 0.11
Tripoli airport 20.3 -0.03 -0.2 -0.13
Tripoli city 20.1 0.38 2.18 3.49 ***
Zuara 19.5 -0.10 -0.62 -0.72
Data source: Libyan Meteorological Department, Tripoli. Explanation: see Tab. 10
Short-term trends 1976-2000
According to IPCC Third Assessment Report 2001, most of global warming occurred in
this period. Tab. 17 expresses the trends of annual temperatures and Mann-Kendall test for
trend (Z value) from 1976-2000 (25 years) at all stations in Libya. Drastically increasing
mean annual temperatures were seen in Libya in this period (Fig. 21). Trends ranged
between 0.82 and 0.08 °C/decade at Misurata and Benina, respectively.

Attia El-Tantawi: Climate change in Libya and desertification of Jifara Plain
55
Fig. 21: Inter-annual variabilities and trends of annual temperature in Libya, 1946-2000,
1946-1975 and 1976-2000
Data source: Libyan Meteorological Department, Tripoli
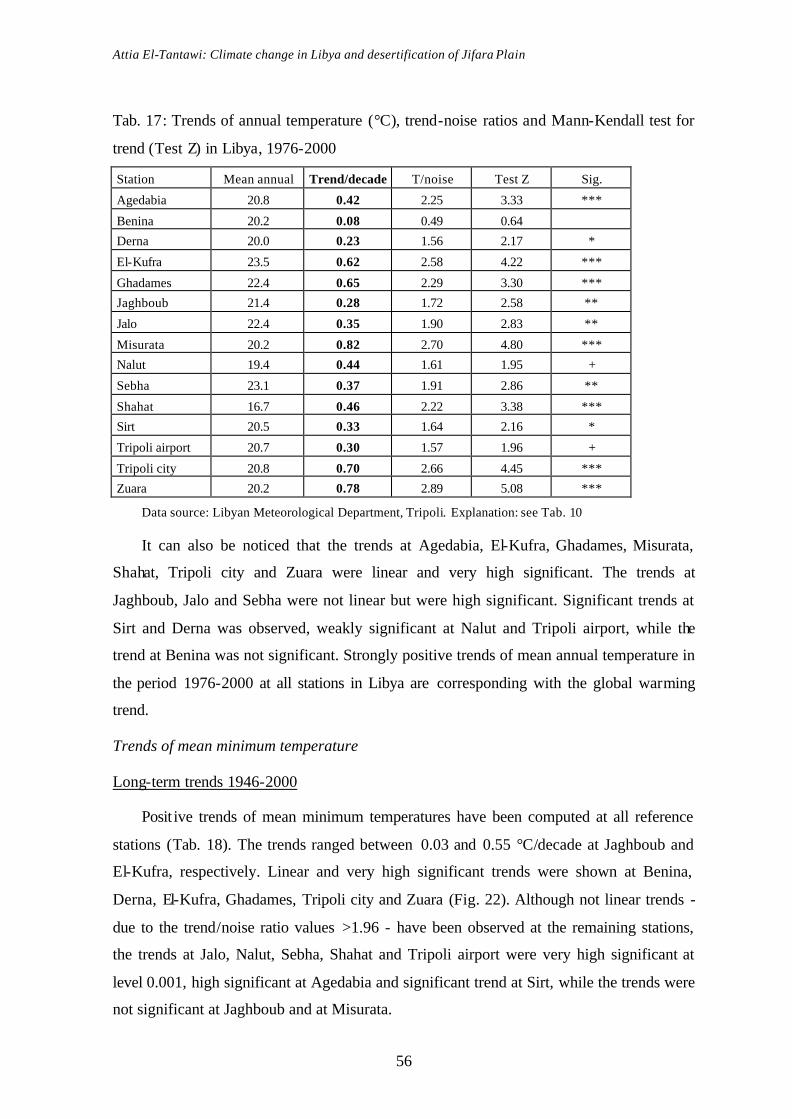
Attia El-Tantawi: Climate change in Libya and desertification of Jifara Plain
56
Tab. 17: Trends of annual temperature (°C), trend-noise ratios and Mann-Kendall test for
trend (Test Z) in Libya, 1976-2000
Station Mean annual Trend/decade T/noise Test Z Sig.
Agedabia 20.8 0.42 2.25 3.33 ***
Benina 20.2 0.08 0.49 0.64
Derna 20.0 0.23 1.56 2.17 *
El-Kufra 23.5 0.62 2.58 4.22 ***
Ghadames 22.4 0.65 2.29 3.30 ***
Jaghboub 21.4 0.28 1.72 2.58 **
Jalo 22.4 0.35 1.90 2.83 **
Misurata 20.2 0.82 2.70 4.80 ***
Nalut 19.4 0.44 1.61 1.95 +
Sebha 23.1 0.37 1.91 2.86 **
Shahat 16.7 0.46 2.22 3.38 ***
Sirt 20.5 0.33 1.64 2.16 *
Tripoli airport 20.7 0.30 1.57 1.96 +
Tripoli city 20.8 0.70 2.66 4.45 ***
Zuara 20.2 0.78 2.89 5.08 ***
Data source: Libyan Meteorological Department, Tripoli. Explanation: see Tab. 10
It can also be noticed that the trends at Agedabia, El-Kufra, Ghadames, Misurata,
Shahat, Tripoli city and Zuara were linear and very high significant. The trends at
Jaghboub, Jalo and Sebha were not linear but were high significant. Significant trends at
Sirt and Derna was observed, weakly significant at Nalut and Tripoli airport, while the
trend at Benina was not significant. Strongly positive trends of mean annual temperature in
the period 1976-2000 at all stations in Libya are corresponding with the global warming
trend.
Trends of mean minimum temperature
Long-term trends 1946-2000
Posit ive trends of mean minimum temperatures have been computed at all reference
stations (Tab. 18). The trends ranged between 0.03 and 0.55 °C/decade at Jaghboub and
El-Kufra, respectively. Linear and very high significant trends were shown at Benina,
Derna, El-Kufra, Ghadames, Tripoli city and Zuara (Fig. 22). Although not linear trends -
due to the trend/noise ratio values >1.96 - have been observed at the remaining stations,
the trends at Jalo, Nalut, Sebha, Shahat and Tripoli airport were very high significant at
level 0.001, high significant at Agedabia and significant trend at Sirt, while the trends were
not significant at Jaghboub and at Misurata.

Attia El-Tantawi: Climate change in Libya and desertification of Jifara Plain
57
Tab. 18: Trends of annual mean minimum temperature (°C), trend-noise ratios and Mann-
Kendall test for trend (Test Z) in Libya, 1946-2000
Station Mean Trend/decade T/noise Test Z Sig.
Agedabia 14.3 0.18 1.46 3.28 **
Benina 14.9 0.36 2.63 6.39 ***
Derna 16.6 0.18 2.03 4.51 ***
El-Kufra 15.7 0.55 2.78 6.25 ***
Ghadames 14.1 0.42 2.13 4.55 ***
Jaghboub 13.6 0.03 0.32 0.69
Jalo 15.2 0.24 1.88 3.70 ***
Misurata 15.6 0.09 0.65 1.14
Nalut 13.7 0.26 1.92 4.17 ***
Sebha 15.4 0.27 1.69 4.24 ***
Shahat 12.2 0.25 1.79 3.33 ***
Sirt 15.9 0.11 1.07 2.14 *
Tripoli airport 13.9 0.18 1.66 3.48 ***
Tripoli city 15.5 0.52 2.99 7.83 ***
Zuara 15.1 0.39 2.48 5.93 ***
Data source: Libyan Meteorological Department, Tripoli. Explanation: see Tab. 10
Short-term trends 1946-1975
Tab. 19: Trends of annual mean minimum temperature (°C), trend-noise ratios and Mann-
Kendall test for trend (Test Z) in Libya, 1946-1975
Station Mean Trend/decade T/noise Test Z Sig.
Agedabia 14.1 -0.09 -0.43 -0.34
Benina 14.5 0.43 2.00 3.33 ***
Derna 16.4 0.10 0.79 1.15
El-Kufra 15.0 0.04 0.26 0.02
Ghadames 13.5 -0.32 -1.47 -2.20 *
Jaghboub 13.6 -0.15 -0.81 -1.53
Jalo 14.9 -0.04 -0.18 -0.50
Misurata 15.6 -0.17 -1.23 -1.89 +
Nalut 13.3 0.00 -0.01 0.22
Sebha 15.0 -0.23 -1.01 -1.24
Shahat 12.0 -0.07 -0.42 -0.86
Sirt 15.7 -0.08 -0.49 -0.47
Tripoli airport 13.7 0.10 0.70 1.13
Tripoli city 14.9 0.49 2.53 4.37 ***
Zuara 14.6 0.03 0.14 0.18
Data source: Libyan Meteorological Department, Tripoli. Explanation: see Tab. 10

Attia El-Tantawi: Climate change in Libya and desertification of Jifara Plain
58
Trends of annual mean minimum temperatures (Tab. 19) showed negative values at
eight stations, while weakly positive or no trends prevailed at the remaining seven stations.
At most reference stations trends of mean minimum temperature were not linear and not
significance. Trends at Benina and Tripoli city in northern Libya were linear and very
highly significant, significant trend at Ghadames in the west and weakly significant trend
at Misurata in the north.
Short-term trends 1976-2000
Trends of annual mean minimum temperature from 1976-2000 showed a rapid
warming at all stations. Trends ranged between 1.27 and 0.21 °C/decade. Most trends were
above 0.50 °C/decade (Tab. 20).
Tab. 20: Trends of annual mean minimum temperature (°C), trend-noise ratios and Mann-
Kendall test for trend (Test Z) in Libya, 1976-2000
Station Mean Trend/decade T/noise Test Z Sig.
Agedabia 14.6 0.65 2.37 3.54 ***
Benina 15.4 0.45 2.07 3.09 **
Derna 16.8 0.45 2.21 3.57 ***
El-Kufra 16.6 1.11 2.94 4.83 ***
Ghadames 14.9 1.12 2.65 4.23 ***
Jaghboub 13.6 0.21 1.08 2.10 *
Jalo 15.4 0.69 2.50 3.83 ***
Misurata 15.7 1.27 2.90 4.70 ***
Nalut 14.2 0.37 1.18 1.70 +
Sebha 16.0 0.42 1.35 3.39 ***
Shahat 12.6 1.09 3.01 5.17 ***
Sirt 16.1 0.31 1.19 1.67 +
Tripoli airport 14.2 0.48 1.71 2.44 *
Tripoli city 16.2 0.89 2.75 4.78 ***
Zuara 15.8 0.74 2.62 4.14 ***
Data source: Libyan Meteorological Department, Tripoli. Explanation: see Tab. 10
It can also be noticed from Tab. 20 that the trends at nine stations were linear. Non-
linear trends at the remaining six stations are due to the high inter-annual variabilities of
minimum temperature (Fig. 22).
For significance, the trends in this period were very highly significance at 10 station,
highly significant at level 0.01 at Benina, significant trends at level 0.05 at two stations,
and weakly significant at Nalut and Sirt (Tab. 20).

Attia El-Tantawi: Climate change in Libya and desertification of Jifara Plain
59
Fig. 22: Inter-annual variabilities and trends of annual mean minimum temperature in
Libya, 1946-2000
Agedabia
2000199019801970196019501940
18
16
14
12
10
Benina
2000199019801970196019501940
18
16
14
12
10
Derna
2000199019801970196019501940
18
16
14
12
10
El-Kufra
2000199019801970196019501940
18
16
14
12
10
Ghadames
2000199019801970196019501940
18
16
14
12
10
Jaghboub
2000199019801970196019501940
18
16
14
12
10
Jalo
2000199019801970196019501940
18
16
14
12
10
Misurata
2000199019801970196019501940
18
16
14
12
10
Nalut
2000199019801970196019501940
18
16
14
12
10
Sebha
2000199019801970196019501940
18
16
14
12
10
Shahat
2000199019801970196019501940
18
16
14
12
10
Sirt
2000199019801970196019501940
18
16
14
12
10
Tripoli airport
2000199019801970196019501940
18
16
14
12
10
Tripoli city
2000199019801970196019501940
18
16
14
12
10
Zuara
2000199019801970196019501940
18
16
14
12
10
Data source: Libyan Meteorological Department, Tripoli
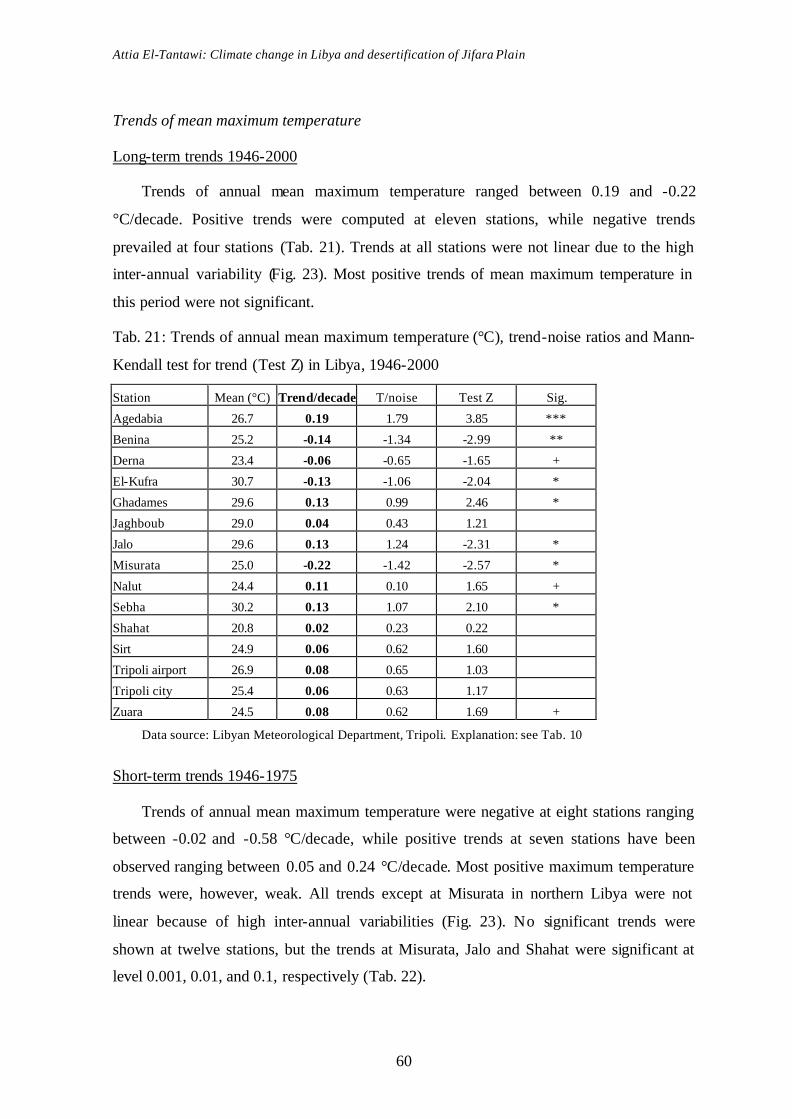
Attia El-Tantawi: Climate change in Libya and desertification of Jifara Plain
60
Trends of mean maximum temperature
Long-term trends 1946-2000
Trends of annual mean maximum temperature ranged between 0.19 and -0.22
°C/decade. Positive trends were computed at eleven stations, while negative trends
prevailed at four stations (Tab. 21). Trends at all stations were not linear due to the high
inter-annual variability (Fig. 23). Most positive trends of mean maximum temperature in
this period were not significant.
Tab. 21: Trends of annual mean maximum temperature (°C), trend-noise ratios and Mann-
Kendall test for trend (Test Z) in Libya, 1946-2000
Station Mean (°C) Trend/decade T/noise Test Z Sig.
Agedabia 26.7 0.19 1.79 3.85 ***
Benina 25.2 -0.14 -1.34 -2.99 **
Derna 23.4 -0.06 -0.65 -1.65 +
El-Kufra 30.7 -0.13 -1.06 -2.04 *
Ghadames 29.6 0.13 0.99 2.46 *
Jaghboub 29.0 0.04 0.43 1.21
Jalo 29.6 0.13 1.24 -2.31 *
Misurata 25.0 -0.22 -1.42 -2.57 *
Nalut 24.4 0.11 0.10 1.65 +
Sebha 30.2 0.13 1.07 2.10 *
Shahat 20.8 0.02 0.23 0.22
Sirt 24.9 0.06 0.62 1.60
Tripoli airport 26.9 0.08 0.65 1.03
Tripoli city 25.4 0.06 0.63 1.17
Zuara 24.5 0.08 0.62 1.69 +
Data source: Libyan Meteorological Department, Tripoli. Explanation: see Tab. 10
Short-term trends 1946-1975
Trends of annual mean maximum temperature were negative at eight stations ranging
between -0.02 and -0.58 °C/decade, while positive trends at seven stations have been
observed ranging between 0.05 and 0.24 °C/decade. Most positive maximum temperature
trends were, however, weak. All trends except at Misurata in northern Libya were not
linear because of high inter-annual variabilities (Fig. 23). No significant trends were
shown at twelve stations, but the trends at Misurata, Jalo and Shahat were significant at
level 0.001, 0.01, and 0.1, respectively (Tab. 22).

Attia El-Tantawi: Climate change in Libya and desertification of Jifara Plain
61
Fig. 23: Inter-annual variabilities and trends of annual mean maximum temperature (°C) in
Libya, 1946-2000
Agedabia
2000199019801970196019501940
32
30
28
26
24
22
20
Benina
2000199019801970196019501940
32
30
28
26
24
22
20
Derna
2000199019801970196019501940
26
25
24
23
22
21
El-Kufra
2000199019801970196019501940
32
30
28
26
24
22
20
Ghadames
2000199019801970196019501940
32
30
28
26
24
22
20
Jaghboub
2000199019801970196019501940
32
30
28
26
24
22
20
Jalo
2000199019801970196019501940
32
30
28
26
24
22
20
Misurata
2000199019801970196019501940
32
30
28
26
24
22
20
Nalut
2000199019801970196019501940
32
30
28
26
24
22
20
Sebha
2000199019801970196019501940
32
30
28
26
24
22
20
Shahat
2000199019801970196019501940
32
30
28
26
24
22
20
Sirt
2000199019801970196019501940
32
30
28
26
24
22
20
Tripoli airport
2000199019801970196019501940
32
30
28
26
24
22
20
Tripoli city
2000199019801970196019501940
32
30
28
26
24
22
20
Zuara
2000199019801970196019501940
32
30
28
26
24
22
20
Data source: Libyan Meteorological Department, Tripoli
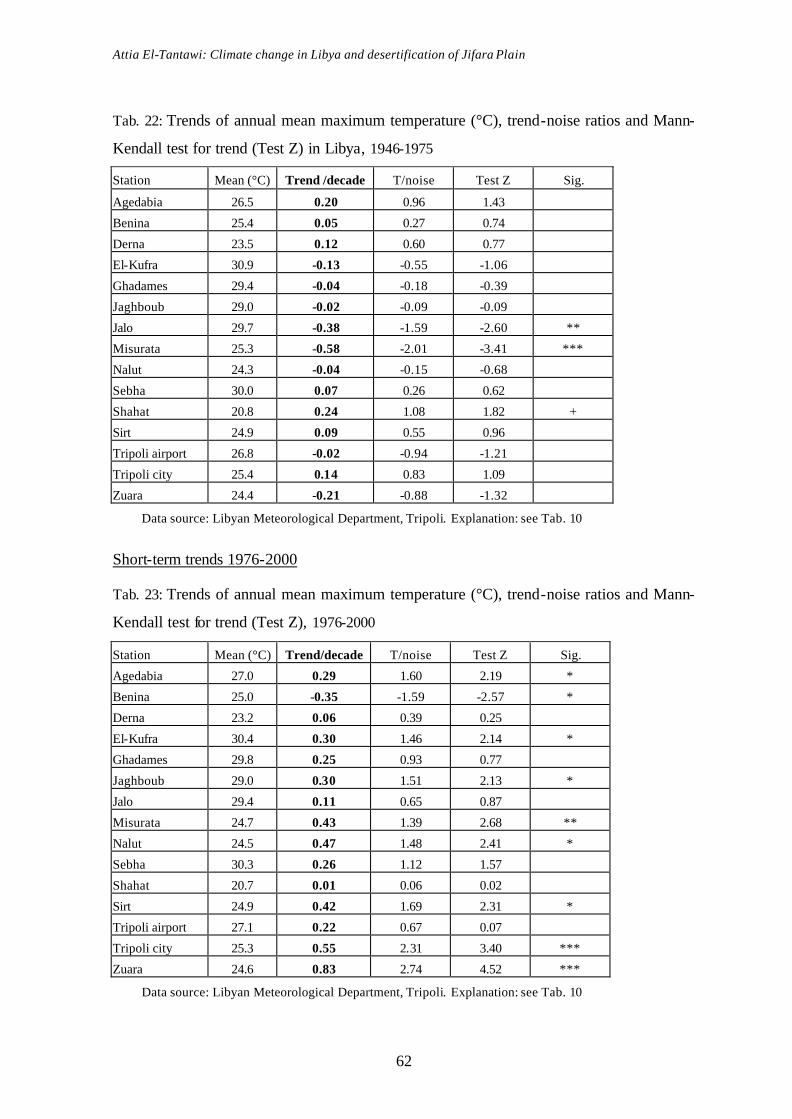
Attia El-Tantawi: Climate change in Libya and desertification of Jifara Plain
62
Tab. 22: Trends of annual mean maximum temperature (°C), trend-noise ratios and Mann-
Kendall test for trend (Test Z) in Libya, 1946-1975
Station Mean (°C) Trend /decade T/noise Test Z Sig.
Agedabia 26.5 0.20 0.96 1.43
Benina 25.4 0.05 0.27 0.74
Derna 23.5 0.12 0.60 0.77
El-Kufra 30.9 -0.13 -0.55 -1.06
Ghadames 29.4 -0.04 -0.18 -0.39
Jaghboub 29.0 -0.02 -0.09 -0.09
Jalo 29.7 -0.38 -1.59 -2.60 **
Misurata 25.3 -0.58 -2.01 -3.41 ***
Nalut 24.3 -0.04 -0.15 -0.68
Sebha 30.0 0.07 0.26 0.62
Shahat 20.8 0.24 1.08 1.82 +
Sirt 24.9 0.09 0.55 0.96
Tripoli airport 26.8 -0.02 -0.94 -1.21
Tripoli city 25.4 0.14 0.83 1.09
Zuara 24.4 -0.21 -0.88 -1.32
Data source: Libyan Meteorological Department, Tripoli. Explanation: see Tab. 10
Short-term trends 1976-2000
Tab. 23: Trends of annual mean maximum temperature (°C), trend-noise ratios and Mann-
Kendall test for trend (Test Z), 1976-2000
Station Mean (°C) Trend/decade T/noise Test Z Sig.
Agedabia 27.0 0.29 1.60 2.19 *
Benina 25.0 -0.35 -1.59 -2.57 *
Derna 23.2 0.06 0.39 0.25
El-Kufra 30.4 0.30 1.46 2.14 *
Ghadames 29.8 0.25 0.93 0.77
Jaghboub 29.0 0.30 1.51 2.13 *
Jalo 29.4 0.11 0.65 0.87
Misurata 24.7 0.43 1.39 2.68 **
Nalut 24.5 0.47 1.48 2.41 *
Sebha 30.3 0.26 1.12 1.57
Shahat 20.7 0.01 0.06 0.02
Sirt 24.9 0.42 1.69 2.31 *
Tripoli airport 27.1 0.22 0.67 0.07
Tripoli city 25.3 0.55 2.31 3.40 ***
Zuara 24.6 0.83 2.74 4.52 ***
Data source: Libyan Meteorological Department, Tripoli. Explanation: see Tab. 10

Attia El-Tantawi: Climate change in Libya and desertification of Jifara Plain
63
Positive trends of annual mean maximum temperature in this period prevailed at all
study stations except one station (Benina -0.35 °C/decade) ranging between 0.06 and 0.83
°C/decade. Fig. 23 shows very highly significant and linear trends at Tripoli city and Zuara
only, while not linear trends have been shown at the other remaining stations. Although the
trends at most stations were not linear resulting from increasing inter-annual temperature
variabilities, most of them were highly significant at level 0.01 and significant at level 0.05
(Tab. 23).
Trends of extreme events temperature
According to IPCC Third Assessment Report 2001, scientific bases, extremes are a
key aspect of climate change. Changes in the frequency of many extremes (increases or
decreases) can be surprisingly large for seemingly modest mean changes in climate.
Moreover, changes in extremes are often most sensitive to inhomogeneous climate
monitoring practices, making assessment of change more difficult than assessing the
change in the mean. Climate, both at local and global scales, is not only characterized by
the mean values of surface fields like temperature, but also by the frequency of occurrence
of extreme events and by their intensity (TOMOZEIU, et al., 2002). Extremes of
maximum and minimum temperature trends were investigated for the periods 1946-2000
and 1976-2000.
Long-term trends 1946-2000
Positive trends of extreme minimum temperatures have been observed at all reference
stations in this period ranging between 0.04 and 0.82 °C/decade. Linear and very highly
significant trends were shown at eight stations, while not linear trends prevailed at the
remaining seven stations. Except at Ghadames, all trends were very highly, highly,
significant and weakly significant (Tab. 24).
In contrast to extreme minimum temperature, the trends of extreme maximum
temperature were negative or weakly positive at most stations in the period 1946-2000.
Negative trends ranged between -0.11 and -0.26 °C/decade, positive trends between 0.01
and 0.14 °C/decade. All extreme maximum temperature trends were not linear. For the
significance of trends, the trends at eleven stations were not significant; the remaining
trends were at level 0.001, 0.05, 0.1, 0.1 of significance (Tab. 25).
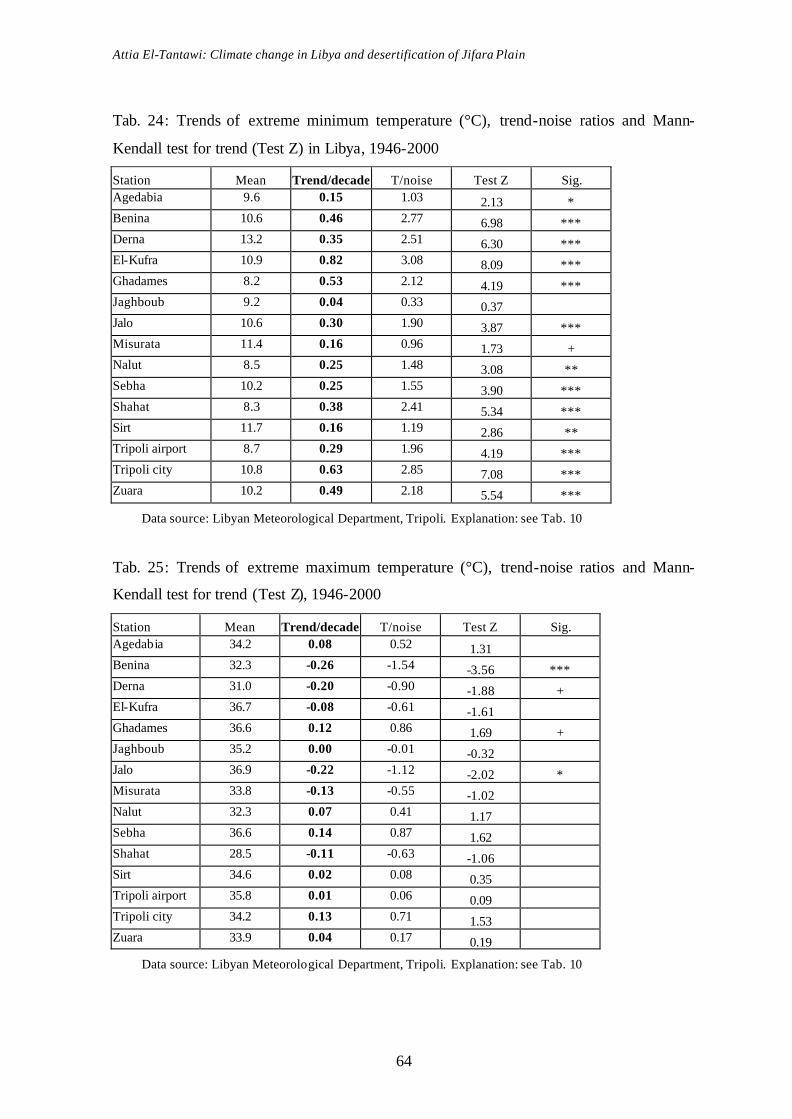
Attia El-Tantawi: Climate change in Libya and desertification of Jifara Plain
64
Tab. 24: Trends of extreme minimum temperature (°C), trend-noise ratios and Mann-
Kendall test for trend (Test Z) in Libya, 1946-2000
Station Mean Trend/decade T/noise Test Z Sig. Agedabia 9.6 0.15 1.03 2.13 * Benina 10.6 0.46 2.77 6.98 *** Derna 13.2 0.35 2.51 6.30 *** El-Kufra 10.9 0.82 3.08 8.09 *** Ghadames 8.2 0.53 2.12 4.19 *** Jaghboub 9.2 0.04 0.33 0.37 Jalo 10.6 0.30 1.90 3.87 *** Misurata 11.4 0.16 0.96 1.73 + Nalut 8.5 0.25 1.48 3.08 ** Sebha 10.2 0.25 1.55 3.90 *** Shahat 8.3 0.38 2.41 5.34 *** Sirt 11.7 0.16 1.19 2.86 ** Tripoli airport 8.7 0.29 1.96 4.19 *** Tripoli city 10.8 0.63 2.85 7.08 *** Zuara 10.2 0.49 2.18 5.54 ***
Data source: Libyan Meteorological Department, Tripoli. Explanation: see Tab. 10
Tab. 25: Trends of extreme maximum temperature (°C), trend-noise ratios and Mann-
Kendall test for trend (Test Z), 1946-2000
Station Mean Trend/decade T/noise Test Z Sig. Agedabia 34.2 0.08 0.52 1.31 Benina 32.3 -0.26 -1.54 -3.56 *** Derna 31.0 -0.20 -0.90 -1.88 + El-Kufra 36.7 -0.08 -0.61 -1.61 Ghadames 36.6 0.12 0.86 1.69 + Jaghboub 35.2 0.00 -0.01 -0.32 Jalo 36.9 -0.22 -1.12 -2.02 * Misurata 33.8 -0.13 -0.55 -1.02 Nalut 32.3 0.07 0.41 1.17 Sebha 36.6 0.14 0.87 1.62 Shahat 28.5 -0.11 -0.63 -1.06 Sirt 34.6 0.02 0.08 0.35 Tripoli airport 35.8 0.01 0.06 0.09 Tripoli city 34.2 0.13 0.71 1.53 Zuara 33.9 0.04 0.17 0.19
Data source: Libyan Meteorological Department, Tripoli. Explanation: see Tab. 10

Attia El-Tantawi: Climate change in Libya and desertification of Jifara Plain
65
Short-term trends 1976-2000
Trends of mean extreme minimum temperature expressed a striking warming at all
reference stations. The highest trend was 1.45 °C/decade at Misurata, while the lowest
trend was 0.14 °C/decade at Sirt. It has also been observed that the trends at most stations
were linear. The trends at eight stations were very highly significant at level 0.001.
Significant trends at level 0.05 were computed at four stations, while the trends at Nalut
and Sirt were not significant (Tab. 26).
Tab. 26: Trends of extreme minimum temperature (°C), trend-noise ratios and Mann-
Kendall test for trend (Test Z) in Libya, 1976-2000
Station Mean (°C) Trend/decade T/noise Test Z Sig.
Agedabia 9.8 1.00 2.84 4.69 ***
Benina 11.4 0.52 2.10 3.19 **
Derna 13.6 0.36 1.56 2.35 *
El-Kufra 12.3 1.19 2.94 5.42 ***
Ghadames 9.2 1.28 2.58 4.31 ***
Jaghboub 9.3 0.35 1.48 2.27 *
Jalo 10.9 0.81 2.38 3.51 ***
Misurata 11.6 1.45 2.81 4.50 ***
Nalut 8.9 0.36 0.87 1.42
Sebha 10.6 0.65 2.02 2.22 *
Shahat 8.9 1.03 2.84 4.77 ***
Sirt 12.0 0.14 0.42 1.47 Tripoli airport 9.2 0.43 1.29 2.04 *
Tripoli city 11.6 1.24 2.69 4.42 ***
Zuara 11.1 0.85 2.45 3.94 ***
Data source: Libyan Meteorological Department, Tripoli. Explanation: see Tab. 10
For mean extreme maximum temperature changes, positive trends prevailed at eight
stations ranging between 0.77 and 0.03 °C/decade, while negative trends at the remaining
seven stations ranging between -0.50 and -0.10 °C/decade, respectively. The trends at most
stations were not linear and not significant (Tab. 27).
A change in time of either the mean value of temperature or the frequency and
intensity of its extremes can affect substantially the ecosystems, the society and the economy
(TOMOZEIU, et al., 2002).

Attia El-Tantawi: Climate change in Libya and desertification of Jifara Plain
66
Tab. 27: Trends of extreme maximum temperature (°C), trend-noise ratios and Mann-
Kendall test for trend (Test Z) in Libya, 1976-2000
Station Mean Trend/decade T/noise Test Z Sig.
Agedabia 34.3 -0.12 -0.32 -0.10
Benina 32.0 -0.50 -1.43 -1.92 +
Derna 30.7 -0.48 -1.19 -1.89 +
El-Kufra 36.6 0.22 0.75 1.02
Ghadames 36.8 -0.10 0.38 -0.10
Jaghboub 35.3 0.03 0.08 0.02
Jalo 36.7 -0.28 -0.75 -1.02
Misurata 33.6 0.32 0.71 1.47
Nalut 32.3 0.69 1.63 2.36 *
Sebha 36.7 0.35 1.14 1.27
Shahat 28.3 -0.47 -1.19 -1.57
Sirt 34.6 0.30 0.71 1.37 Tripoli airport 35.9 -0.15 -0.33 -0.90
Tripoli city 34.2 0.77 2.33 3.86 ***
Zuara 33.9 0.62 1.04 1.39
Data source: Libyan Meteorological Department, Tripoli. Explanation: see Tab. 10
Changes of mean temperature range
Long-term trends 1946-2000
Mean annual temperature range results from the respective of maximum and
minimum temperatures. Negative trends were computed at all study stations except at
Jaghboub ranging between 0.01 and -0.68 °C/decade (Tab. 28). Negative trends of
temperature range temperatures at most stations result from the increasing mean minimum
temperatures more than the increasing mean maximum temperatures.
Fig. 24 shows the linear and very highly significant trends at Benina, Derna, El-Kufra,
Ghadames, Jalo, Misurata, Nalut, Tripoli city and Zuara, highly significant was showed at
Shahat. The trends at Sebha and Tripoli airport were significant, while at Agedabia,
Jaghboub and Sirt the trends were not linear and not significant.
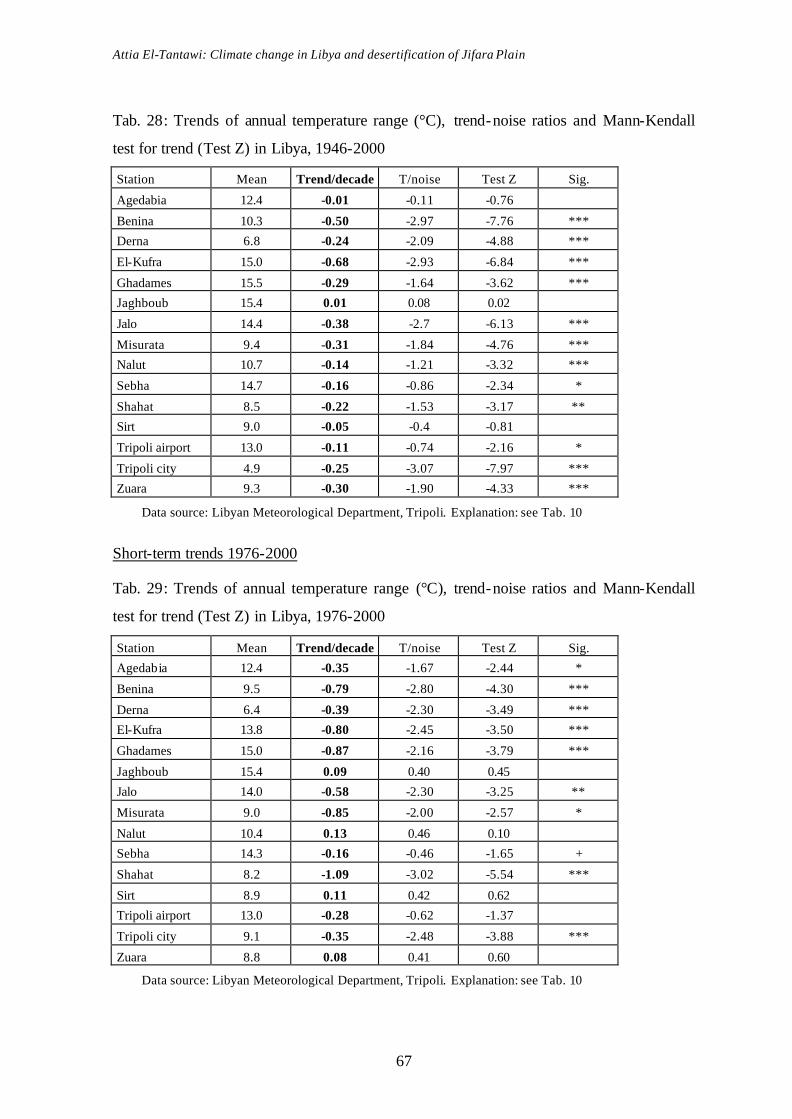
Attia El-Tantawi: Climate change in Libya and desertification of Jifara Plain
67
Tab. 28: Trends of annual temperature range (°C), trend-noise ratios and Mann-Kendall
test for trend (Test Z) in Libya, 1946-2000
Station Mean Trend/decade T/noise Test Z Sig.
Agedabia 12.4 -0.01 -0.11 -0.76
Benina 10.3 -0.50 -2.97 -7.76 ***
Derna 6.8 -0.24 -2.09 -4.88 ***
El-Kufra 15.0 -0.68 -2.93 -6.84 ***
Ghadames 15.5 -0.29 -1.64 -3.62 ***
Jaghboub 15.4 0.01 0.08 0.02
Jalo 14.4 -0.38 -2.7 -6.13 ***
Misurata 9.4 -0.31 -1.84 -4.76 ***
Nalut 10.7 -0.14 -1.21 -3.32 ***
Sebha 14.7 -0.16 -0.86 -2.34 *
Shahat 8.5 -0.22 -1.53 -3.17 **
Sirt 9.0 -0.05 -0.4 -0.81
Tripoli airport 13.0 -0.11 -0.74 -2.16 *
Tripoli city 4.9 -0.25 -3.07 -7.97 ***
Zuara 9.3 -0.30 -1.90 -4.33 ***
Data source: Libyan Meteorological Department, Tripoli. Explanation: see Tab. 10
Short-term trends 1976-2000
Tab. 29: Trends of annual temperature range (°C), trend-noise ratios and Mann-Kendall
test for trend (Test Z) in Libya, 1976-2000
Station Mean Trend/decade T/noise Test Z Sig.
Agedabia 12.4 -0.35 -1.67 -2.44 *
Benina 9.5 -0.79 -2.80 -4.30 ***
Derna 6.4 -0.39 -2.30 -3.49 ***
El-Kufra 13.8 -0.80 -2.45 -3.50 ***
Ghadames 15.0 -0.87 -2.16 -3.79 ***
Jaghboub 15.4 0.09 0.40 0.45
Jalo 14.0 -0.58 -2.30 -3.25 **
Misurata 9.0 -0.85 -2.00 -2.57 *
Nalut 10.4 0.13 0.46 0.10
Sebha 14.3 -0.16 -0.46 -1.65 +
Shahat 8.2 -1.09 -3.02 -5.54 ***
Sirt 8.9 0.11 0.42 0.62
Tripoli airport 13.0 -0.28 -0.62 -1.37
Tripoli city 9.1 -0.35 -2.48 -3.88 ***
Zuara 8.8 0.08 0.41 0.60
Data source: Libyan Meteorological Department, Tripoli. Explanation: see Tab. 10

Attia El-Tantawi: Climate change in Libya and desertification of Jifara Plain
68
Fig. 24: Inter-annual variabilities and trends of annual temperature range (°C) in Libya,
1946-2000
Agedabia
2000199019801970196019501940
18
16
14
12
10
8
6
Benina
2000199019801970196019501940
18
16
14
12
10
8
6
Derna
2000199019801970196019501940
18
16
14
12
10
8
6
El-Kufra
2000199019801970196019501940
18
16
14
12
10
8
6
Ghadames
2000199019801970196019501940
18
16
14
12
10
8
6
Jaghboub
2000199019801970196019501940
18
16
14
12
10
8
6
Jalo
2000199019801970196019501940
18
16
14
12
10
8
6
Misurata
2000199019801970196019501940
18
16
14
12
10
8
6
Nalut
2000199019801970196019501940
18
16
14
12
10
8
6
Sebha
2000199019801970196019501940
18
16
14
12
10
8
6
Shahat
2000199019801970196019501940
18
16
14
12
10
8
6
Sirt
2000199019801970196019501940
18
16
14
12
10
8
6
Tripoli airport
2000199019801970196019501940
18
16
14
12
10
8
6
Tripoli city
2000199019801970196019501940
18
16
14
12
10
8
6
Zuara
2000199019801970196019501940
18
16
14
12
10
8
6
Data source: Libyan Meteorological Department, Tripoli
Attia El-Tantawi: Climate change in Libya and desertification of Jifara Plain
69
Trends of annual temperature range from 1976-2000 showed negative Z values
(decreasing trends) at 11 stations ranging between -1.09 and -0.16 °C decade, while
positive Z values (increasing trends) prevailed at four stations ranging between 0.08 and
0.13 °C/decade. The trends were linear at eight stations in this period, while not liear
trends were observed at the remaining seven stations (Fig. 24). Not linear trends due to
high inter-annual variabilities. Trends were very highly significant at six, highly significant
at one, significant at two, weakly significant at one station while not significant trends
were noticed at the remaining five stations (Tab. 29).
Seasonal temperature trends
It can be strikingly seen from the seasonal temperature trends in Libya that warming
mostly occurred in summer and autumn in contrast to the global observations identifying
warming mostly in winter and spring. Trends of seasonal temperatures at all reference
stations have been computed for all seasons - winter = December, January and February;
spring = March, April and May; summer = June, July and August; autumn = September,
October and November- for the period 1946 - 2000 and the period 1976 - 2000.
Long-term trends 1946-2000
Fig. 25 and Tab. 30 show the trends of temperature for summer from 1946-2000.
Positive trends were computed at all stations except at Misurata which was negative (-
0.16 °C/decade). The lowest positive trend in this period was 0.09 °C/decade, while the
highest was 0.43 °C/decade. All trends in summer were not linear except Tripoli city
because the inter-annual temperature variabilities were very high resulting high standard
deviation. Trends were very highly significant at five stations, significant at four stations,
weakly significant at one station, while they were not significant at the remaining five
stations (Tab. 30).
In winter, the trends of temperature in general were weakly positive or negative at
most stations. Weakly positive trends were computed at seven stations. High inter-annaul
temperature variabilities have been shown at all stations (Fig. 26), therefore all trends in
winter were not linear. The trends were not significant at all stations in this period except
at Zuara and Nalut which were highly and weakly significant, respectively (Tab. 31).

Attia El-Tantawi: Climate change in Libya and desertification of Jifara Plain
70
Fig. 25: Inter-annual variabilities and trends of summer temperatures in Libya, 1946-2000
Agedabia
2000199019801970196019501940
33
31
29
27
25
23
21
Benina
2000199019801970196019501940
33
31
29
27
25
23
21
Derna
2000199019801970196019501940
33
31
29
27
25
23
21
El-Kufra
2000199019801970196019501940
33
31
29
27
25
23
21
Ghadames
2000199019801970196019501940
33
31
29
27
25
23
21
Jaghboub
2000199019801970196019501940
33
31
29
27
25
23
21
Jalo
2000199019801970196019501940
33
31
29
27
25
23
21
Misurata
2000199019801970196019501940
33
31
29
27
25
23
21
Nalut
2000199019801970196019501940
33
31
29
27
25
23
21
Sebha
2000199019801970196019501940
33
31
29
27
25
23
21
Shahat
2000199019801970196019501940
33
31
29
27
25
23
21
Sirt
2000199019801970196019501940
33
31
29
27
25
23
21
Tripoli airport
2000199019801970196019501940
33
31
29
27
25
23
21
Tripoli city
2000199019801970196019501940
33
31
29
27
25
23
21
Zuara
2000199019801970196019501940
33
31
29
27
25
23
21
Data source: Libyan Meteorological Department, Tripoli
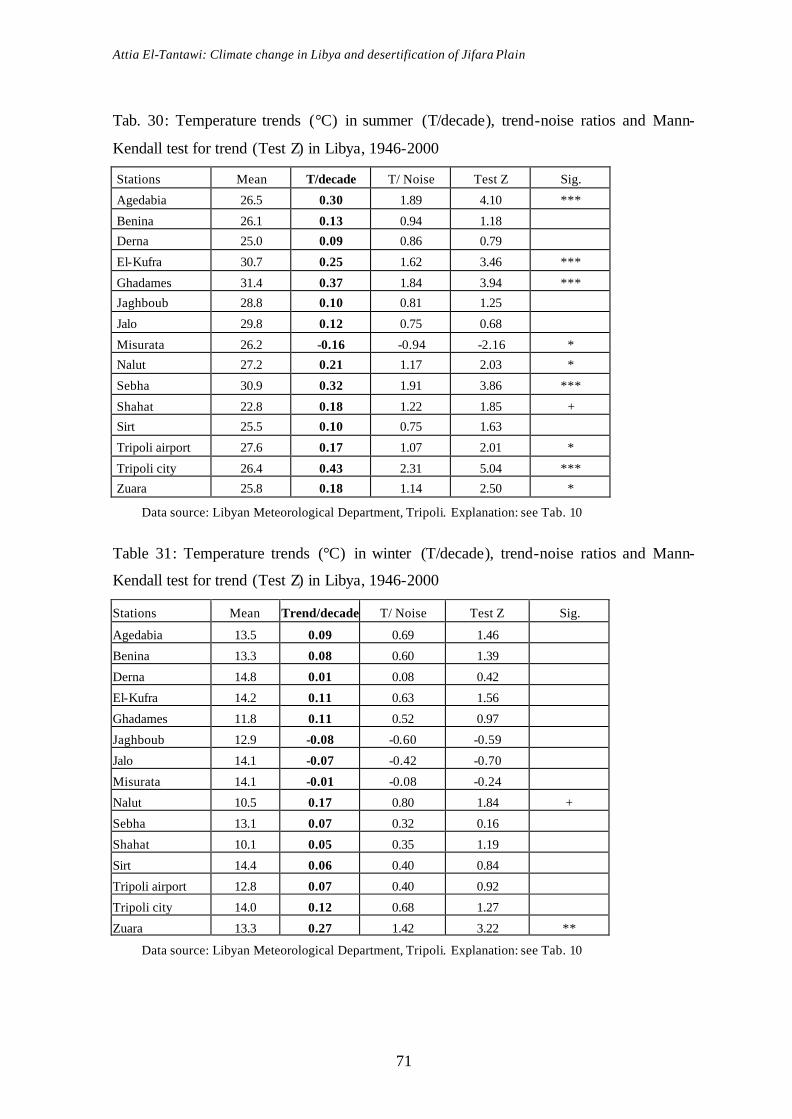
Attia El-Tantawi: Climate change in Libya and desertification of Jifara Plain
71
Tab. 30: Temperature trends (°C) in summer (T/decade), trend-noise ratios and Mann-
Kendall test for trend (Test Z) in Libya, 1946-2000
Stations Mean T/decade T/ Noise Test Z Sig.
Agedabia 26.5 0.30 1.89 4.10 ***
Benina 26.1 0.13 0.94 1.18
Derna 25.0 0.09 0.86 0.79
El-Kufra 30.7 0.25 1.62 3.46 ***
Ghadames 31.4 0.37 1.84 3.94 ***
Jaghboub 28.8 0.10 0.81 1.25
Jalo 29.8 0.12 0.75 0.68
Misurata 26.2 -0.16 -0.94 -2.16 *
Nalut 27.2 0.21 1.17 2.03 *
Sebha 30.9 0.32 1.91 3.86 ***
Shahat 22.8 0.18 1.22 1.85 +
Sirt 25.5 0.10 0.75 1.63
Tripoli airport 27.6 0.17 1.07 2.01 *
Tripoli city 26.4 0.43 2.31 5.04 ***
Zuara 25.8 0.18 1.14 2.50 *
Data source: Libyan Meteorological Department, Tripoli. Explanation: see Tab. 10
Table 31: Temperature trends (°C) in winter (T/decade), trend-noise ratios and Mann-
Kendall test for trend (Test Z) in Libya, 1946-2000
Stations Mean Trend/decade T/ Noise Test Z Sig.
Agedabia 13.5 0.09 0.69 1.46
Benina 13.3 0.08 0.60 1.39
Derna 14.8 0.01 0.08 0.42
El-Kufra 14.2 0.11 0.63 1.56
Ghadames 11.8 0.11 0.52 0.97
Jaghboub 12.9 -0.08 -0.60 -0.59
Jalo 14.1 -0.07 -0.42 -0.70
Misurata 14.1 -0.01 -0.08 -0.24
Nalut 10.5 0.17 0.80 1.84 +
Sebha 13.1 0.07 0.32 0.16
Shahat 10.1 0.05 0.35 1.19
Sirt 14.4 0.06 0.40 0.84
Tripoli airport 12.8 0.07 0.40 0.92
Tripoli city 14.0 0.12 0.68 1.27
Zuara 13.3 0.27 1.42 3.22 **
Data source: Libyan Meteorological Department, Tripoli. Explanation: see Tab. 10

Attia El-Tantawi: Climate change in Libya and desertification of Jifara Plain
72
Fig. 26: Inter-annual variabilities and trends of winter temperatures in Libya, 1946-2000
Agedabia
2000199019801970196019501940
18
16
14
12
10
8
Benina
2000199019801970196019501940
18
16
14
12
10
8
Derna
2000199019801970196019501940
18
16
14
12
10
8
El-Kufra
2000199019801970196019501940
18
16
14
12
10
8
Ghadames
2000199019801970196019501940
18
16
14
12
10
8
Jaghboub
2000199019801970196019501940
18
16
14
12
10
8
Jalo
2000199019801970196019501940
18
16
14
12
10
8
Misurata
2000199019801970196019501940
18
16
14
12
10
8
Nalut
2000199019801970196019501940
18
16
14
12
10
8
Sebha
2000199019801970196019501940
18
16
14
12
10
8
Shahat
2000199019801970196019501940
18
16
14
12
10
8
Sirt
2000199019801970196019501940
18
16
14
12
10
8
Tripoli airport
2000199019801970196019501940
18
16
14
12
10
8
Tripoli city
2000199019801970196019501940
18
16
14
12
10
8
Zuara
2000199019801970196019501940
18
16
14
12
10
8
Data source: Libyan Meteorological Department, Tripoli

Attia El-Tantawi: Climate change in Libya and desertification of Jifara Plain
73
Table 32: Temperature trends in autumn (°C), trend-noise ratios and Mann-Kendall test for
trend (Test Z) in Libya, 1946-2000
Stations Mean Trend/decade T/ Noise Test Z Sig.
Agedabia 22.2 0.26 1.46 3.22 ** Benina 22 0.15 1 2.31 *
Derna 22.3 0.08 0.7 1.64 El-Kufra 23.8 0.22 1.01 2.63 **
Ghadames 22.7 0.34 1.48 3.15 ** Jaghboub 22.5 0.13 0.68 1.68 +
Jalo 23.4 0.15 0.82 1.58 Misurata 22.8 0.03 0.16 0.01
Nalut 20.5 0.21 1.13 2.49 * Sebha 23.9 0.21 0.98 2.35 *
Shahat 18.3 0.17 1.06 2.45 * Sirt 22.8 0.19 1.31 2.8 **
Tripoli airport 22.3 0.18 1.07 2.38 * Tripoli city 22.6 0.29 1.55 3.68 *** Zuara 22.1 0.35 1.88 3.96 ***
Data source: Libyan Meteorological Department, Tripoli. Explanation: see Tab. 10
Table 33: Spring temperature trends (°C), trend-noise ratios and Mann-Kendall test for
trend (Test Z) in Libya, 1946-2000
Stations Mean Trend/decade T/ Noise Test Z Sig.
Agedabia 19.9 0.18 1.14 2.62 **
Benina 18.8 0.09 0.64 1.69 +
Derna 17.9 0.04 0.35 0.76
El-Kufra 24.2 0.25 1.50 3.14 **
Ghadames 21.7 0.28 1.48 3.05 **
Jaghboub 21.0 0.01 0.06 0.89
Jalo 22.3 0.03 0.18 0.49
Misurata 18.5 -0.07 -0.50 -1.21
Nalut 17.9 0.17 0.83 1.29
Sebha 23.3 0.27 1.46 3.05 **
Shahat 15.0 0.10 0.66 1.59
Sirt 18.9 0.02 0.16 0.87
Tripoli airport 19.0 0.07 0.49 0.96
Tripoli city 18.7 0.41 2.04 4.58 ***
Zuara 18.1 0.17 1.30 2.75 **
Data source: Libyan Meteorological Department, Tripoli. Explanation: see Tab. 10
The behavior of temperature trends in autumn expressed positive trends at all study
stations. Trends ranged between 0.03 °C/decade as lowest trend and 0.35 °C/decade at
Zuara as highest trend. All temperature trends in autumn were not linear. Very highly
Attia El-Tantawi: Climate change in Libya and desertification of Jifara Plain
74
significant trends at Tripoli city and zuara, high significant trends at Agedabia, El-Kufra,
Ghadames and Sirt, significant trends at Benina, Nalut, Sebha, Shahat and Tripoli airport
were computed, while the trends at Jalo and Misurata were not significant (Tab. 32).
In spring, positive trends have been observed at all stations from 1946 to 2000 except
at one station which weakly negative trend (-0.07 °C/decade). Positive trends ranged
between 0.01 and 0.41 °C/decade. Not linear trends were shown at all stations except at
one (Tripoli city) which was linear and at level 0.001 of significance (very high). Trends at
14 stations were not linear explaind by the high inter-annual temperature variabilities in
spring. Though the trends at five stations were not linear, they were highly significant and
weakly significant at Benina, while the trends at Derna, Jaghboub, Jalo, Misurata, Nalut,
Shahat, Sirt and Tripoli airport were not significant (Tab. 33).
Short-term trends 1976-2000
Remarkably large seasonal variations of temperature were observed for the period
1976 to 2000. Summer is clearly shown as the governing season responsible for the annual
temperature increase from 1976-2000. Temperature trends in summer showed the highest
rate of warming at 0.96 °C/decade at Zuara and the lowest rate at 0.04 °C/decade at Benina
(Tab. 34). In absolute values, summer temperatures increased between 2.40 °C and 0.10 °C
at Zuara and Benina, respectively.
It can also be seen that the temperature trends were strongly positive at all stations
except one station with a weakly positive trend. The trends were not linear at ten stations
explained by the high inter annual variabilities (Fig. 27), while at El-Kufra, Misurata,
Shahat, Tripoli city and Zuara were linear. Trends at three stations were at level 0.001
(very highly significant ), at four stations at level 0.01 (highly significant ), at two stations at
level 0.05 (significant) and at Ghadames and Jaghboub at level 0.1 (weakly significant ),
while the trends of summer temperature were not significant from 1976-2000 at the
remaining four stations (Tab. 34).
Concerning temperature trends in winter from 1976-2000, positive trends were
computed at nine stations ranging between 0.05 and 0.49 °C/decade at Sirt and Misurata,
no trend at Derna, while negative trends prevailed at five stations ranging between -0.04
and -0.18 °C/decade at Sebha and Tripoli airport (Tab. 35).
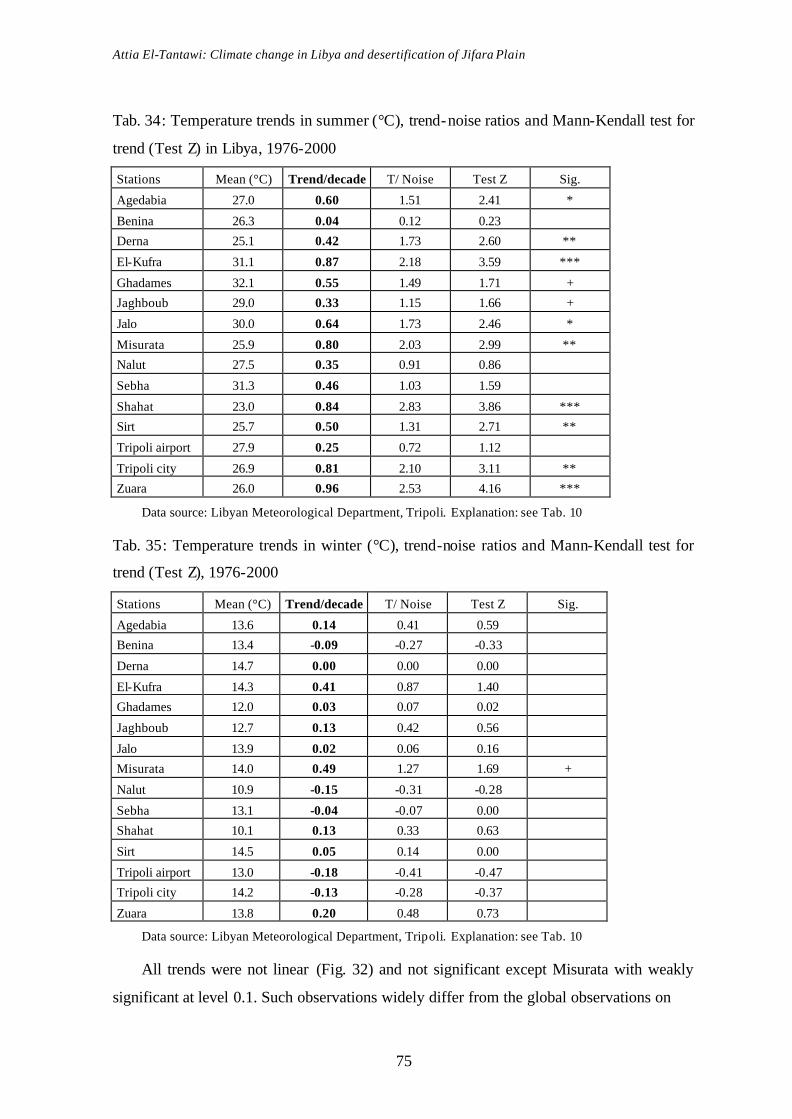
Attia El-Tantawi: Climate change in Libya and desertification of Jifara Plain
75
Tab. 34: Temperature trends in summer (°C), trend-noise ratios and Mann-Kendall test for
trend (Test Z) in Libya, 1976-2000
Stations Mean (°C) Trend/decade T/ Noise Test Z Sig.
Agedabia 27.0 0.60 1.51 2.41 *
Benina 26.3 0.04 0.12 0.23
Derna 25.1 0.42 1.73 2.60 **
El-Kufra 31.1 0.87 2.18 3.59 ***
Ghadames 32.1 0.55 1.49 1.71 +
Jaghboub 29.0 0.33 1.15 1.66 +
Jalo 30.0 0.64 1.73 2.46 *
Misurata 25.9 0.80 2.03 2.99 **
Nalut 27.5 0.35 0.91 0.86
Sebha 31.3 0.46 1.03 1.59
Shahat 23.0 0.84 2.83 3.86 ***
Sirt 25.7 0.50 1.31 2.71 **
Tripoli airport 27.9 0.25 0.72 1.12
Tripoli city 26.9 0.81 2.10 3.11 **
Zuara 26.0 0.96 2.53 4.16 ***
Data source: Libyan Meteorological Department, Tripoli. Explanation: see Tab. 10
Tab. 35: Temperature trends in winter (°C), trend-noise ratios and Mann-Kendall test for
trend (Test Z), 1976-2000
Stations Mean (°C) Trend/decade T/ Noise Test Z Sig.
Agedabia 13.6 0.14 0.41 0.59
Benina 13.4 -0.09 -0.27 -0.33
Derna 14.7 0.00 0.00 0.00
El-Kufra 14.3 0.41 0.87 1.40
Ghadames 12.0 0.03 0.07 0.02
Jaghboub 12.7 0.13 0.42 0.56
Jalo 13.9 0.02 0.06 0.16
Misurata 14.0 0.49 1.27 1.69 +
Nalut 10.9 -0.15 -0.31 -0.28
Sebha 13.1 -0.04 -0.07 0.00
Shahat 10.1 0.13 0.33 0.63
Sirt 14.5 0.05 0.14 0.00
Tripoli airport 13.0 -0.18 -0.41 -0.47
Tripoli city 14.2 -0.13 -0.28 -0.37
Zuara 13.8 0.20 0.48 0.73
Data source: Libyan Meteorological Department, Tripoli. Explanation: see Tab. 10
All trends were not linear (Fig. 32) and not significant except Misurata with weakly
significant at level 0.1. Such observations widely differ from the global observations on
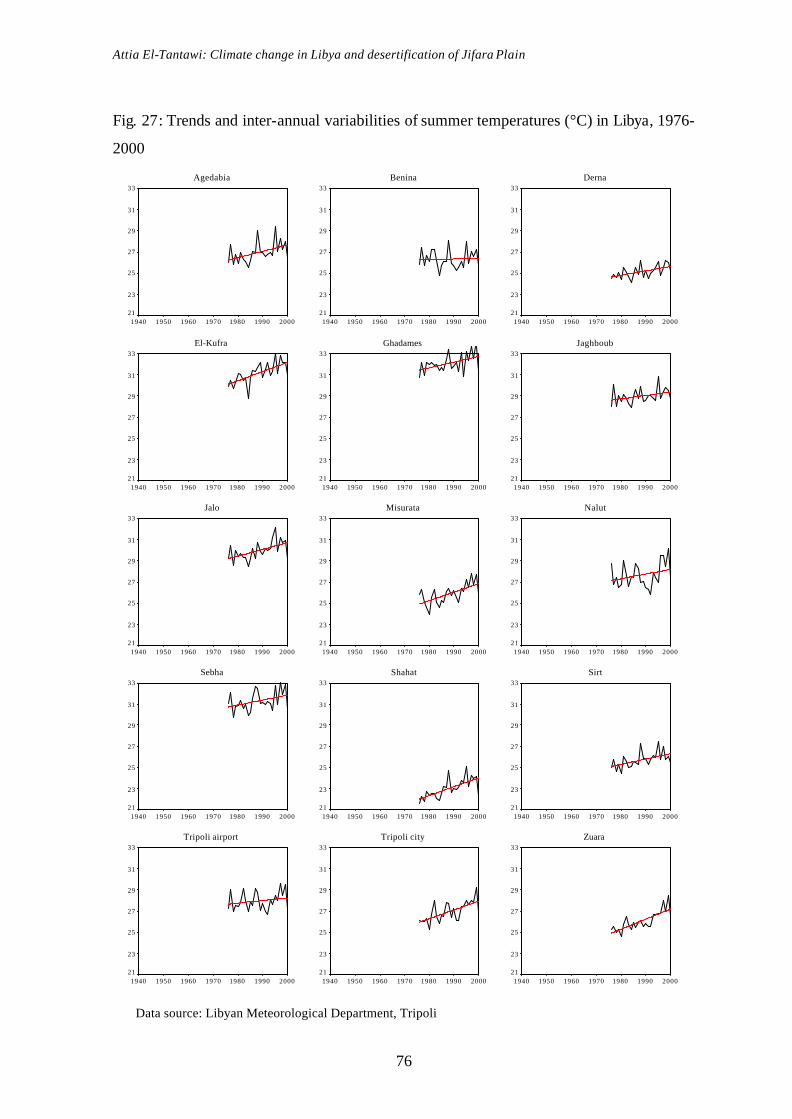
Attia El-Tantawi: Climate change in Libya and desertification of Jifara Plain
76
Fig. 27: Trends and inter-annual variabilities of summer temperatures (°C) in Libya, 1976-
2000
Agedabia
2000199019801970196019501940
33
31
29
27
25
23
21
Benina
2000199019801970196019501940
33
31
29
27
25
23
21
Derna
2000199019801970196019501940
33
31
29
27
25
23
21
El-Kufra
2000199019801970196019501940
33
31
29
27
25
23
21
Ghadames
2000199019801970196019501940
33
31
29
27
25
23
21
Jaghboub
2000199019801970196019501940
33
31
29
27
25
23
21
Jalo
2000199019801970196019501940
33
31
29
27
25
23
21
Misurata
2000199019801970196019501940
33
31
29
27
25
23
21
Nalut
2000199019801970196019501940
33
31
29
27
25
23
21
Sebha
2000199019801970196019501940
33
31
29
27
25
23
21
Shahat
2000199019801970196019501940
33
31
29
27
25
23
21
Sirt
2000199019801970196019501940
33
31
29
27
25
23
21
Tripoli airport
2000199019801970196019501940
33
31
29
27
25
23
21
Tripoli city
2000199019801970196019501940
33
31
29
27
25
23
21
Zuara
2000199019801970196019501940
33
31
29
27
25
23
21
Data source: Libyan Meteorological Department, Tripoli
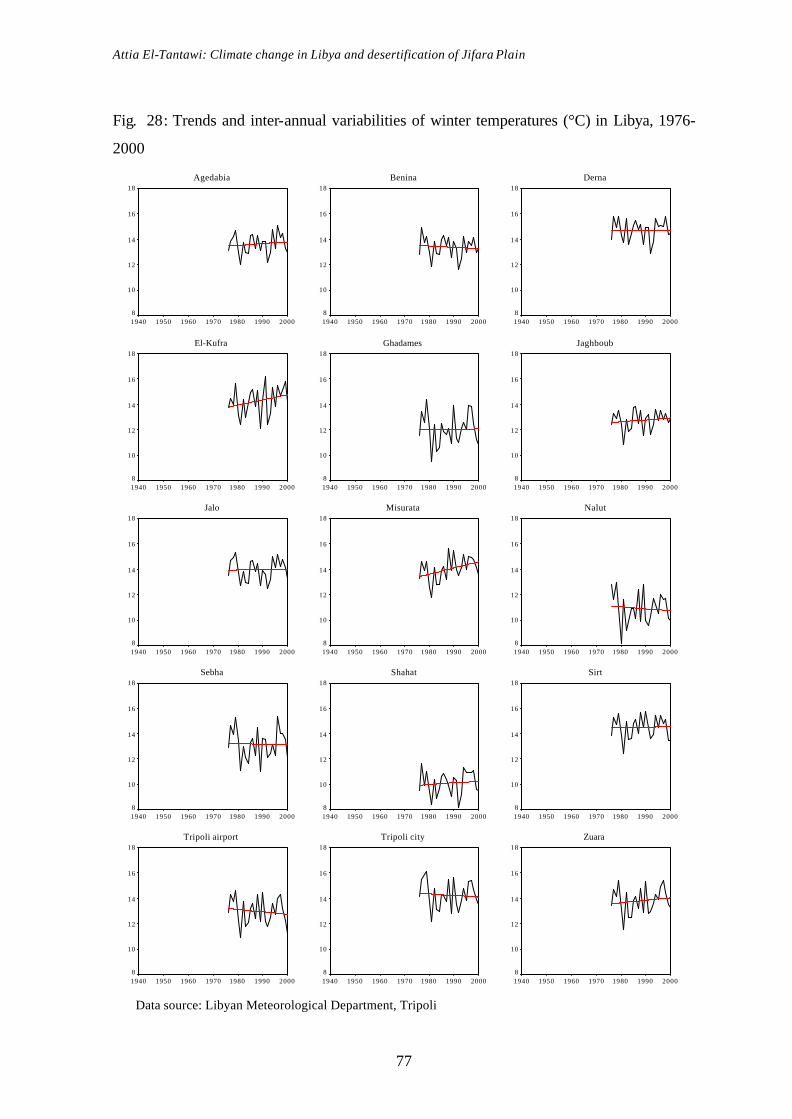
Attia El-Tantawi: Climate change in Libya and desertification of Jifara Plain
77
Fig. 28: Trends and inter-annual variabilities of winter temperatures (°C) in Libya, 1976-
2000
Agedabia
2000199019801970196019501940
18
16
14
12
10
8
Benina
2000199019801970196019501940
18
16
14
12
10
8
Derna
2000199019801970196019501940
18
16
14
12
10
8
El-Kufra
2000199019801970196019501940
18
16
14
12
10
8
Ghadames
2000199019801970196019501940
18
16
14
12
10
8
Jaghboub
2000199019801970196019501940
18
16
14
12
10
8
Jalo
2000199019801970196019501940
18
16
14
12
10
8
Misurata
2000199019801970196019501940
18
16
14
12
10
8
Nalut
2000199019801970196019501940
18
16
14
12
10
8
Sebha
2000199019801970196019501940
18
16
14
12
10
8
Shahat
2000199019801970196019501940
18
16
14
12
10
8
Sirt
2000199019801970196019501940
18
16
14
12
10
8
Tripoli airport
2000199019801970196019501940
18
16
14
12
10
8
Tripoli city
2000199019801970196019501940
18
16
14
12
10
8
Zuara
2000199019801970196019501940
18
16
14
12
10
8
Data source: Libyan Meteorological Department, Tripoli
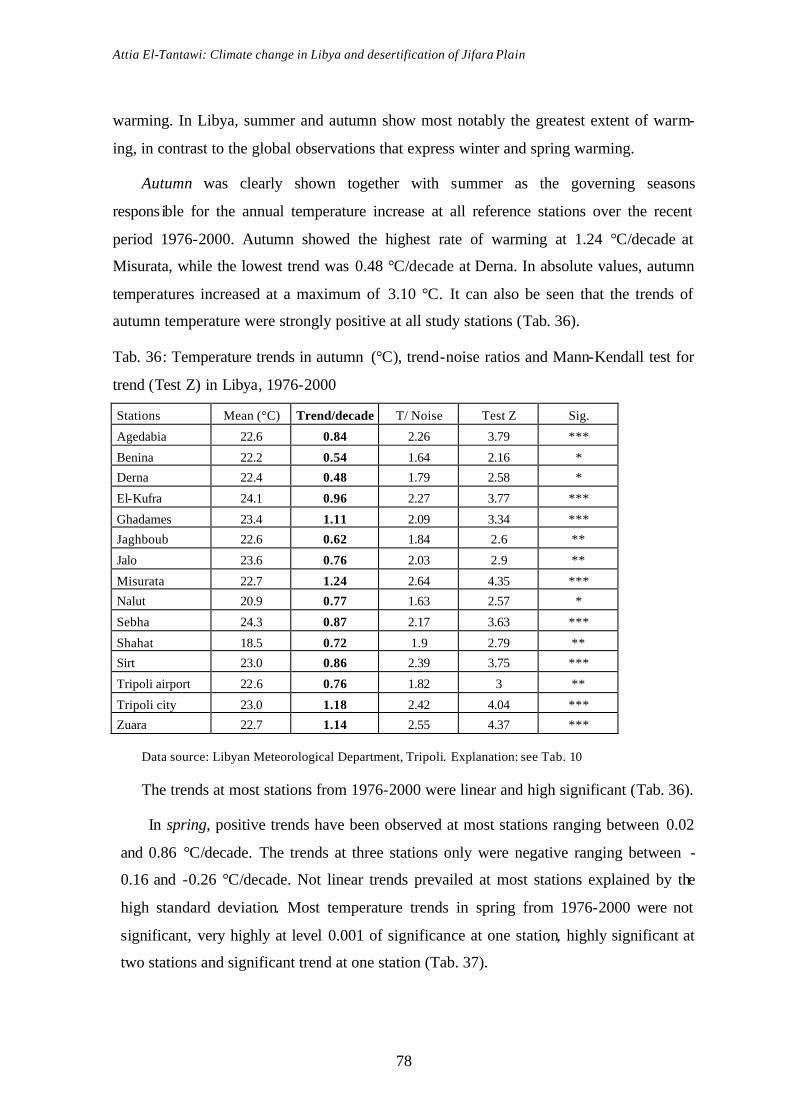
Attia El-Tantawi: Climate change in Libya and desertification of Jifara Plain
78
warming. In Libya, summer and autumn show most notably the greatest extent of warm-
ing, in contrast to the global observations that express winter and spring warming.
Autumn was clearly shown together with summer as the governing seasons
respons ible for the annual temperature increase at all reference stations over the recent
period 1976-2000. Autumn showed the highest rate of warming at 1.24 °C/decade at
Misurata, while the lowest trend was 0.48 °C/decade at Derna. In absolute values, autumn
temperatures increased at a maximum of 3.10 °C. It can also be seen that the trends of
autumn temperature were strongly positive at all study stations (Tab. 36).
Tab. 36: Temperature trends in autumn (°C), trend-noise ratios and Mann-Kendall test for
trend (Test Z) in Libya, 1976-2000
Stations Mean (°C) Trend/decade T/ Noise Test Z Sig.
Agedabia 22.6 0.84 2.26 3.79 ***
Benina 22.2 0.54 1.64 2.16 *
Derna 22.4 0.48 1.79 2.58 *
El-Kufra 24.1 0.96 2.27 3.77 ***
Ghadames 23.4 1.11 2.09 3.34 ***
Jaghboub 22.6 0.62 1.84 2.6 **
Jalo 23.6 0.76 2.03 2.9 **
Misurata 22.7 1.24 2.64 4.35 ***
Nalut 20.9 0.77 1.63 2.57 *
Sebha 24.3 0.87 2.17 3.63 ***
Shahat 18.5 0.72 1.9 2.79 **
Sirt 23.0 0.86 2.39 3.75 ***
Tripoli airport 22.6 0.76 1.82 3 **
Tripoli city 23.0 1.18 2.42 4.04 ***
Zuara 22.7 1.14 2.55 4.37 ***
Data source: Libyan Meteorological Department, Tripoli. Explanation: see Tab. 10
The trends at most stations from 1976-2000 were linear and high significant (Tab. 36).
In spring, positive trends have been observed at most stations ranging between 0.02
and 0.86 °C/decade. The trends at three stations only were negative ranging between -
0.16 and -0.26 °C/decade. Not linear trends prevailed at most stations explained by the
high standard deviation. Most temperature trends in spring from 1976-2000 were not
significant, very highly at level 0.001 of significance at one station, highly significant at
two stations and significant trend at one station (Tab. 37).
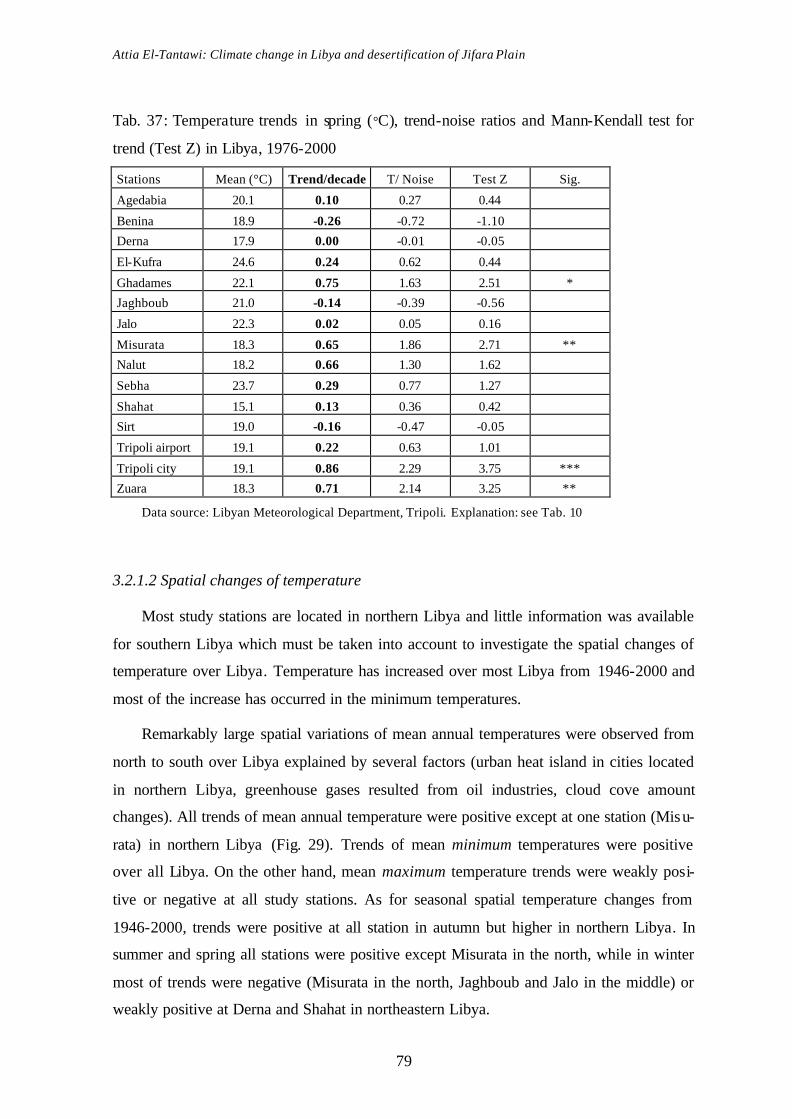
Attia El-Tantawi: Climate change in Libya and desertification of Jifara Plain
79
Tab. 37: Temperature trends in spring (°C), trend-noise ratios and Mann-Kendall test for
trend (Test Z) in Libya, 1976-2000
Stations Mean (°C) Trend/decade T/ Noise Test Z Sig.
Agedabia 20.1 0.10 0.27 0.44
Benina 18.9 -0.26 -0.72 -1.10
Derna 17.9 0.00 -0.01 -0.05
El-Kufra 24.6 0.24 0.62 0.44
Ghadames 22.1 0.75 1.63 2.51 *
Jaghboub 21.0 -0.14 -0.39 -0.56
Jalo 22.3 0.02 0.05 0.16
Misurata 18.3 0.65 1.86 2.71 **
Nalut 18.2 0.66 1.30 1.62
Sebha 23.7 0.29 0.77 1.27
Shahat 15.1 0.13 0.36 0.42
Sirt 19.0 -0.16 -0.47 -0.05
Tripoli airport 19.1 0.22 0.63 1.01
Tripoli city 19.1 0.86 2.29 3.75 ***
Zuara 18.3 0.71 2.14 3.25 **
Data source: Libyan Meteorological Department, Tripoli. Explanation: see Tab. 10
3.2.1.2 Spatial changes of temperature
Most study stations are located in northern Libya and little information was available
for southern Libya which must be taken into account to investigate the spatial changes of
temperature over Libya. Temperature has increased over most Libya from 1946-2000 and
most of the increase has occurred in the minimum temperatures.
Remarkably large spatial variations of mean annual temperatures were observed from
north to south over Libya explained by several factors (urban heat island in cities located
in northern Libya, greenhouse gases resulted from oil industries, cloud cove amount
changes). All trends of mean annual temperature were positive except at one station (Misu-
rata) in northern Libya (Fig. 29). Trends of mean minimum temperatures were positive
over all Libya. On the other hand, mean maximum temperature trends were weakly posi-
tive or negative at all study stations. As for seasonal spatial temperature changes from
1946-2000, trends were positive at all station in autumn but higher in northern Libya. In
summer and spring all stations were positive except Misurata in the north, while in winter
most of trends were negative (Misurata in the north, Jaghboub and Jalo in the middle) or
weakly positive at Derna and Shahat in northeastern Libya.
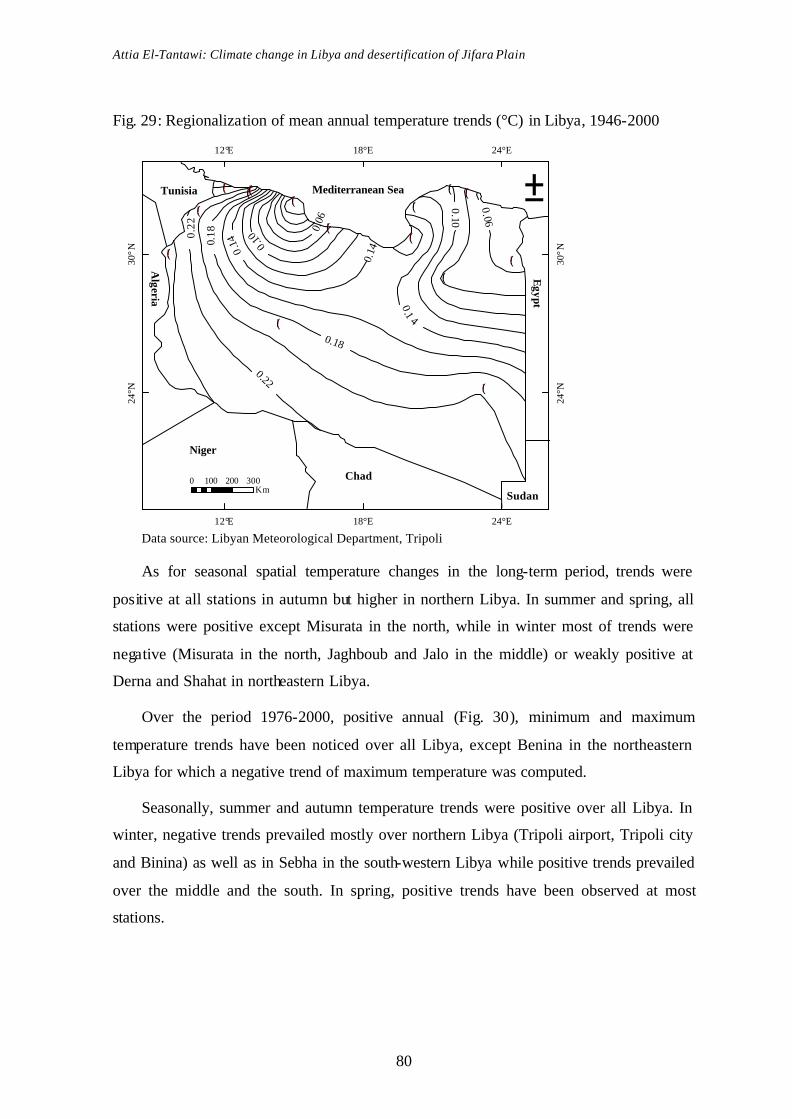
Attia El-Tantawi: Climate change in Libya and desertification of Jifara Plain
80
Fig. 29: Regionalization of mean annual temperature trends (°C) in Libya, 1946-2000
Data source: Libyan Meteorological Department, Tripoli
As for seasonal spatial temperature changes in the long-term period, trends were
positive at all stations in autumn but higher in northern Libya. In summer and spring, all
stations were positive except Misurata in the north, while in winter most of trends were
negative (Misurata in the north, Jaghboub and Jalo in the middle) or weakly positive at
Derna and Shahat in northeastern Libya.
Over the period 1976-2000, positive annual (Fig. 30), minimum and maximum
temperature trends have been noticed over all Libya, except Benina in the northeastern
Libya for which a negative trend of maximum temperature was computed.
Seasonally, summer and autumn temperature trends were positive over all Libya. In
winter, negative trends prevailed mostly over northern Libya (Tripoli airport, Tripoli city
and Binina) as well as in Sebha in the south-western Libya while positive trends prevailed
over the middle and the south. In spring, positive trends have been observed at most
stations.
!(
!(!(
!(
!(!(
!(
!(!(
!(
!(
!(
!(!(!(
0.10
0.1
4
0.14
12°E
12°E
18°E
18°E
24°E
24°E
24°N
24°N
30°N
30°N
0. 06
0.22
0.18
0.14 0.10
0.06
0.18
0.22
±
0 100 200 300Km
Niger
Chad
Sudan
Tunisia Mediterranean Sea
Algeria
Egypt
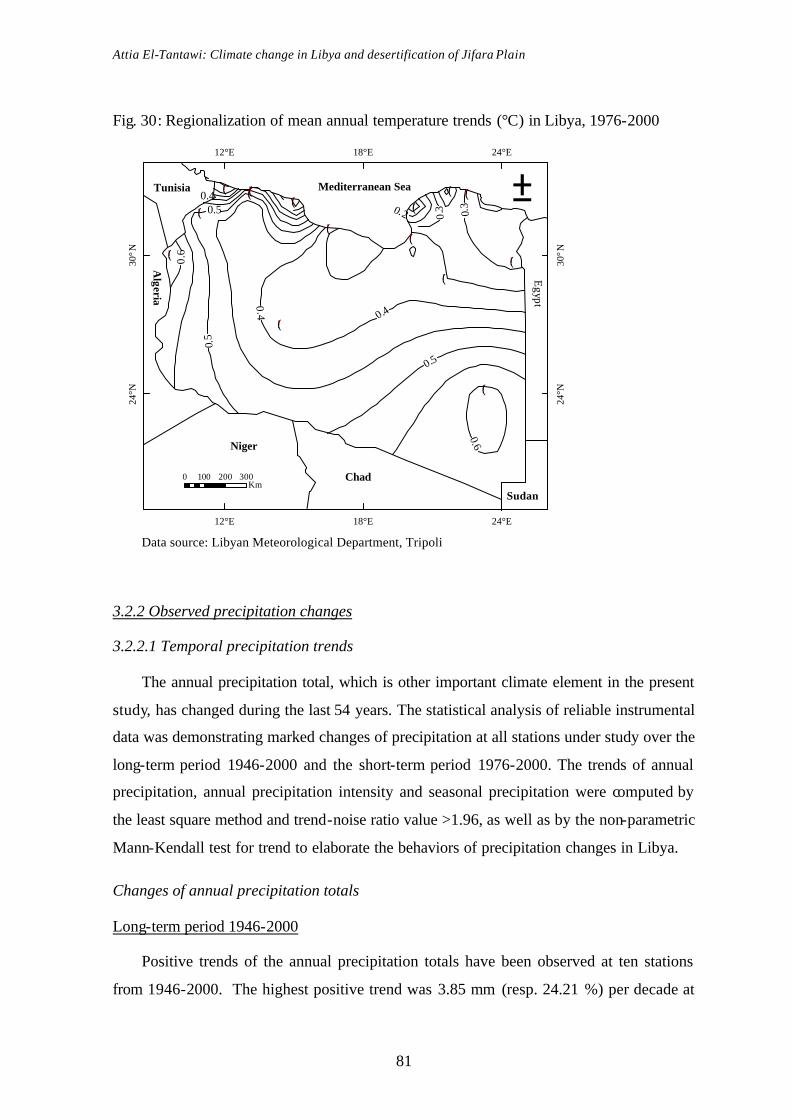
Attia El-Tantawi: Climate change in Libya and desertification of Jifara Plain
81
Fig. 30: Regionalization of mean annual temperature trends (°C) in Libya, 1976-2000
Data source: Libyan Meteorological Department, Tripoli
3.2.2 Observed precipitation changes
3.2.2.1 Temporal precipitation trends
The annual precipitation total, which is other important climate element in the present
study, has changed during the last 54 years. The statistical analysis of reliable instrumental
data was demonstrating marked changes of precipitation at all stations under study over the
long-term period 1946-2000 and the short-term period 1976-2000. The trends of annual
precipitation, annual precipitation intensity and seasonal precipitation were computed by
the least square method and trend-noise ratio value >1.96, as well as by the non-parametric
Mann-Kendall test for trend to elaborate the behaviors of precipitation changes in Libya.
Changes of annual precipitation totals
Long-term period 1946-2000
Positive trends of the annual precipitation totals have been observed at ten stations
from 1946-2000. The highest positive trend was 3.85 mm (resp. 24.21 %) per decade at
!(
!(!(
!(
!(!(
!(
!(!(
!(
!(
!(
!(!(!(
0.6
12°E
12°E
18°E
18°E
24°E
24°E
24°N
24°N
30°N
30°N
0.6
0.5
±
0 100 200 300Km
Niger
Chad
Sudan
Tunisia Mediterranean Sea
Egypt
Algeria
0.5
0 .4 0.4
0.3
0.30.2
0.5
0.4
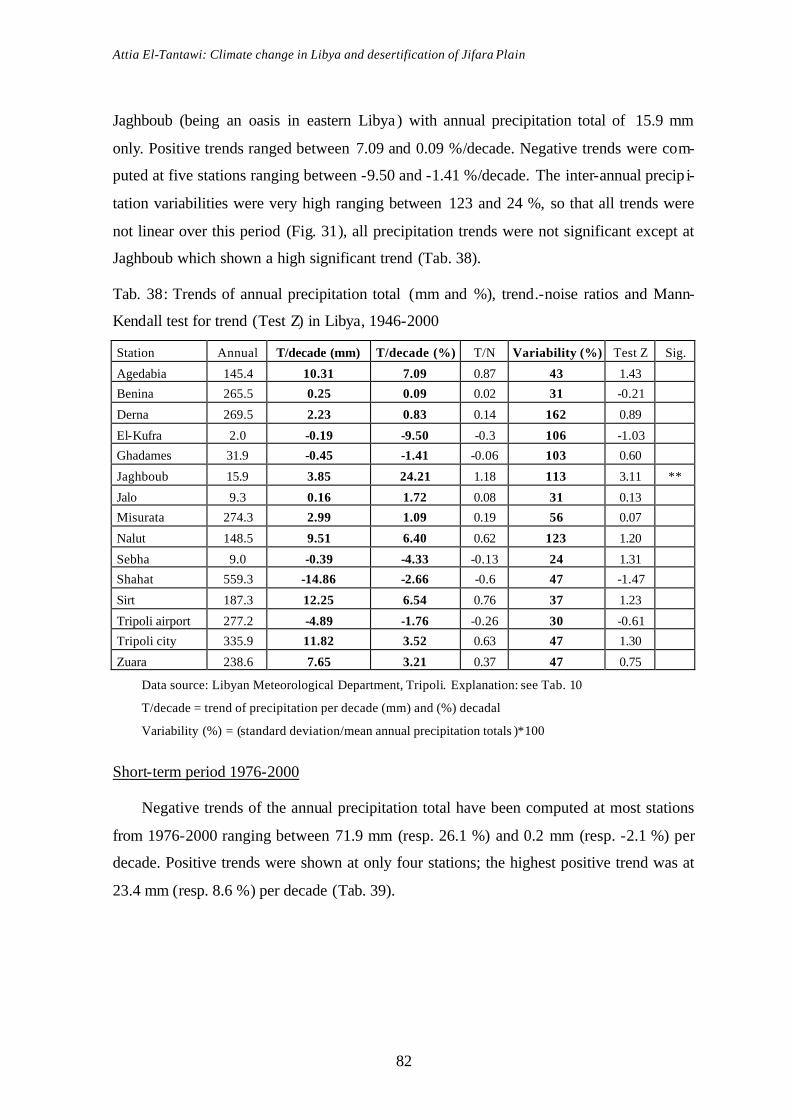
Attia El-Tantawi: Climate change in Libya and desertification of Jifara Plain
82
Jaghboub (being an oasis in eastern Libya) with annual precipitation total of 15.9 mm
only. Positive trends ranged between 7.09 and 0.09 %/decade. Negative trends were com-
puted at five stations ranging between -9.50 and -1.41 %/decade. The inter-annual precip i-
tation variabilities were very high ranging between 123 and 24 %, so that all trends were
not linear over this period (Fig. 31), all precipitation trends were not significant except at
Jaghboub which shown a high significant trend (Tab. 38).
Tab. 38: Trends of annual precipitation total (mm and %), trend.-noise ratios and Mann-
Kendall test for trend (Test Z) in Libya, 1946-2000
Station Annual T/decade (mm) T/decade (%) T/N Variability (%) Test Z Sig.
Agedabia 145.4 10.31 7.09 0.87 43 1.43
Benina 265.5 0.25 0.09 0.02 31 -0.21
Derna 269.5 2.23 0.83 0.14 162 0.89
El-Kufra 2.0 -0.19 -9.50 -0.3 106 -1.03
Ghadames 31.9 -0.45 -1.41 -0.06 103 0.60
Jaghboub 15.9 3.85 24.21 1.18 113 3.11 **
Jalo 9.3 0.16 1.72 0.08 31 0.13
Misurata 274.3 2.99 1.09 0.19 56 0.07
Nalut 148.5 9.51 6.40 0.62 123 1.20
Sebha 9.0 -0.39 -4.33 -0.13 24 1.31
Shahat 559.3 -14.86 -2.66 -0.6 47 -1.47
Sirt 187.3 12.25 6.54 0.76 37 1.23
Tripoli airport 277.2 -4.89 -1.76 -0.26 30 -0.61
Tripoli city 335.9 11.82 3.52 0.63 47 1.30
Zuara 238.6 7.65 3.21 0.37 47 0.75
Data source: Libyan Meteorological Department, Tripoli. Explanation: see Tab. 10
T/decade = trend of precipitation per decade (mm) and (%) decadal
Variability (%) = (standard deviation/mean annual precipitation totals )*100
Short-term period 1976-2000
Negative trends of the annual precipitation total have been computed at most stations
from 1976-2000 ranging between 71.9 mm (resp. 26.1 %) and 0.2 mm (resp. -2.1 %) per
decade. Positive trends were shown at only four stations; the highest positive trend was at
23.4 mm (resp. 8.6 %) per decade (Tab. 39).
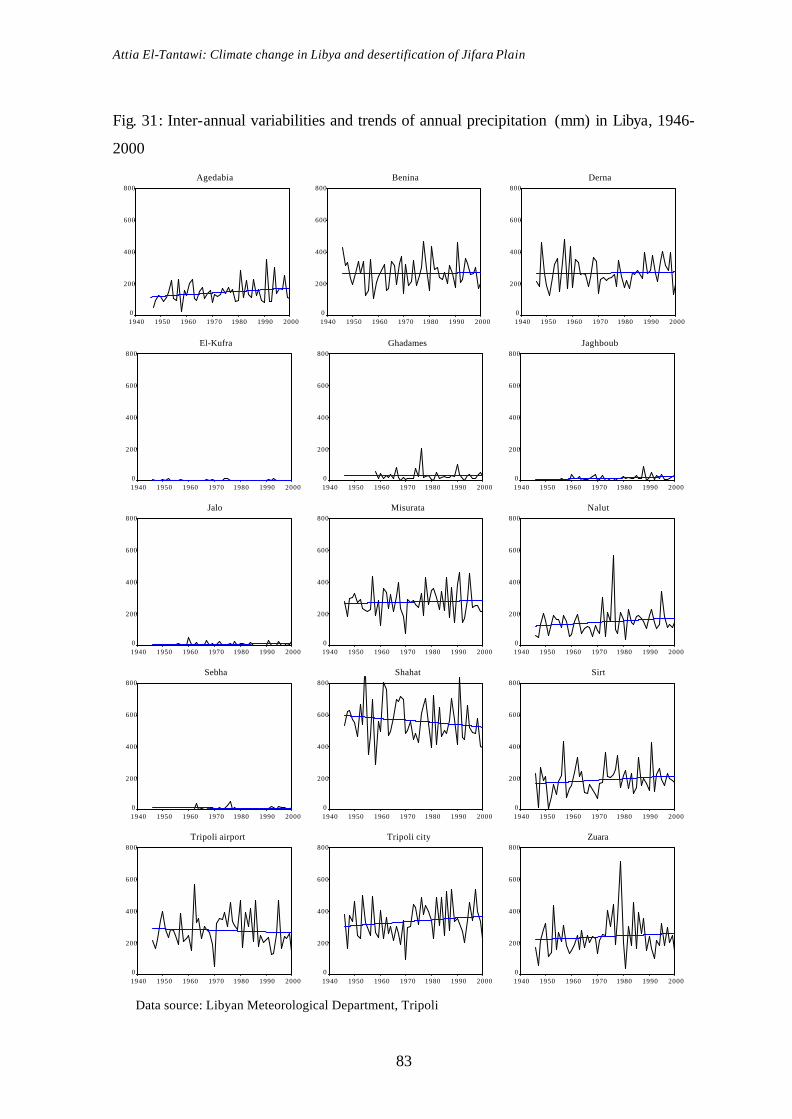
Attia El-Tantawi: Climate change in Libya and desertification of Jifara Plain
83
Fig. 31: Inter-annual variabilities and trends of annual precipitation (mm) in Libya, 1946-
2000
Agedabia
2000199019801970196019501940
800
600
400
200
0
Benina
2000199019801970196019501940
800
600
400
200
0
Derna
2000199019801970196019501940
800
600
400
200
0
El-Kufra
2000199019801970196019501940
800
600
400
200
0
Ghadames
2000199019801970196019501940
800
600
400
200
0
Jaghboub
2000199019801970196019501940
800
600
400
200
0
Jalo
2000199019801970196019501940
800
600
400
200
0
Misurata
2000199019801970196019501940
800
600
400
200
0
Nalut
2000199019801970196019501940
800
600
400
200
0
Sebha
2000199019801970196019501940
800
600
400
200
0
Shahat
2000199019801970196019501940
800
600
400
200
0
Sirt
2000199019801970196019501940
800
600
400
200
0
Tripoli airport
2000199019801970196019501940
800
600
400
200
0
Tripoli city
2000199019801970196019501940
800
600
400
200
0
Zuara
2000199019801970196019501940
800
600
400
200
0
Data source: Libyan Meteorological Department, Tripoli

Attia El-Tantawi: Climate change in Libya and desertification of Jifara Plain
84
Fig. 32: Inter-annual variabilities and trends of annual precipitation (mm) in Libya, 1976-
2000
Agedabia
2000199019801970196019501940
800
600
400
200
0
Benina
2000199019801970196019501940
800
600
400
200
0
Derna
2000199019801970196019501940
800
600
400
200
0
El-Kufra
2000199019801970196019501940
800
600
400
200
0
Ghadames
2000199019801970196019501940
800
600
400
200
0
Jaghboub
2000199019801970196019501940
800
600
400
200
0
Jalo
2000199019801970196019501940
800
600
400
200
0
Misurata
2000199019801970196019501940
800
600
400
200
0
Nalut
2000199019801970196019501940
800
600
400
200
0
Sebha
2000199019801970196019501940
800
600
400
200
0
Shahat
2000199019801970196019501940
800
600
400
200
0
Sirt
2000199019801970196019501940
800
600
400
200
0
Tripoli airport
2000199019801970196019501940
800
600
400
200
0
Tripoli city
2000199019801970196019501940
800
600
400
200
0
Zuara
2000199019801970196019501940
800
600
400
200
0
Data source: Libyan Meteorological Department, Tripoli

Attia El-Tantawi: Climate change in Libya and desertification of Jifara Plain
85
Tab. 39: Trends of annual precipitation total (mm and %), trend-noise ratios and Mann-
Kendall test for trend (Test Z) in Libya, 1976-2000
Station Annual T/decade (mm) T/decade (%) T/noise Test Z Sig.
Agedabia 161.0 5.1 3.2 0.17 0.02
Benina 278.8 -25.5 -9.1 -0.73 -1.07
Derna 271.7 23.4 8.6 0.75 1.33
Elkufra 1.6 0.7 43.4 0.58 0.83
Ghadames 34.7 -11.1 -32.0 -0.66 -0.89
Jaghboub 20.4 4.2 20.5 0.53 1.07
Jalo 9.4 -0.2 -2.1 -0.05 -1.01
Misurata 288.3 -28.8 -10.0 -0.71 -1.00
Nalut 171.3 -27.8 -16.2 -0.66 -0.61
Sebha 8.9 -0.8 -9.0 -0.18 -1.64
Shahat 544.6 -52.1 -9.6 -1.02 -1.56
Sirt 204.1 -13.0 -9.4 -0.41 -0.54
Tripoli airport 275.6 -71.9 -26.1 -1.56 -2.08 *
Tripoli city 368.5 -26.5 -7.2 -0.63 -0.89
Zuara 259.5 -66.7 -25.7 -1.15 -1.52
Data source: Libyan Meteorological Department, Tripoli. Explanation: see Tab. 38
All trends were not linear explained by the high inter-annual variabilities in this period
(Fig. 32). All annual precipitation total trends were also not significant except one station
(Tripoli airport) which was at level 0.05 of significance.
Changes of annual precipitation intensity
Precipitation intensity is very important in precipitation studies because of its
important role of precipitation efficiency as a main source of water. Agriculture lands in
Libya can be affected in a large degree by precipitation intensity through the soil erosion
especially in northern parts.
Long-term period 1946-2000
Tab. 40 shows positive trends at ten stations. The highest positive trend was 1.20
mm/day/decade. Negative trends were shown at five stations. The lowest trend was -0.65
mm/day/decade at Ghadames. All trends of precipitation intensity were not linear because
the inter-annual variabilities of precipitation intensity were very high from 1946-2000
(Fig. 33). For significance, most trends were not significant, only at Jaghboub the trend
was significant at level 0.05 and were weakly significant at Nalut, Tripoli airport and
Tripoli city.

Attia El-Tantawi: Climate change in Libya and desertification of Jifara Plain
86
Fig. 33: Inter-annual variabilities and trends of annual precipitation intensity
mm/day/decade in Libya, 1946-2000
Agedabia
2000199019801970196019501940
15
12
9
6
3
0
Benina
2000199019801970196019501940
15
12
9
6
3
0
Derna
2000199019801970196019501940
15
12
9
6
3
0
El-Kufra
2000199019801970196019501940
15
12
9
6
3
0
Ghadames
2000199019801970196019501940
15
12
9
6
3
0
Jaghboub
2000199019801970196019501940
15
12
9
6
3
0
Jalo
2000199019801970196019501940
15
12
9
6
3
0
Misurata
2000199019801970196019501940
15
12
9
6
3
0
Nalut
2000199019801970196019501940
15
12
9
6
3
0
Sebha
2000199019801970196019501940
15
12
9
6
3
0
Shahat
2000199019801970196019501940
15
12
9
6
3
0
Sirt
2000199019801970196019501940
15
12
9
6
3
0
Tripoli airport
2000199019801970196019501940
15
12
9
6
3
0
Tripoli city
2000199019801970196019501940
15
12
9
6
3
0
Zuara
2000199019801970196019501940
15
12
9
6
3
0
Data source: Libyan Meteorological Department, Tripoli

Attia El-Tantawi: Climate change in Libya and desertification of Jifara Plain
87
Tab. 40: Trends of annual precipitation intensity (mm/day/decade), trend-noise ratios and
Mann-Kendall test for trend (Test Z) in Libya, 1946-2000
Station Intensity Trend/decade T/noise Test Z Sig.
Agedabia 4.1 0.29 1.20 1.62
Benina 4.8 0.04 0.18 0.30
Derna 5.3 0.24 0.86 1.47
El-Kufra 1.0 -0.08 -0.17 -0.18
Ghadames 3.2 -0.40 -0.65 -1.18
Jaghboub 2.4 0.29 0.57 2.15 *
Jalo 1.6 0.05 0.16 0.16
Misurata 5.8 0.03 0.30 0.04
Nalut 6.5 0.54 0.72 1.94 +
Sebha 2.3 -0.08 -0.19 -0.10
Shahat 7.3 0.14 0.57 0.83
Sirt 5.6 -0.01 -0.01 -0.12
Tripoli airport 6.1 -0.21 -0.62 -1.77 +
Tripoli city 6.5 0.19 0.62 1.66 +
Zuara 7.3 0.26 0.34 0.72
Data source: Libyan Meteorological Department, Tripoli. Explanation: see Tab. 38
Short-term period 1976-2000
Tab. 41: Trends of annual precipitation intensity (mm/day/decade), trend-noise ratios and
Mann-Kendall test for trend (Test Z) in Libya, 1976-2000
Station Intensity Trend/decade T/noise Test Z Sig.
Agedabia 4.6 0.65 1.10 1.17
Benina 4.9 -0.67 -1.40 -1.87 +
Derna 5.7 0.73 1.06 1.72 +
El-Kufra 0.7 0.28 0.58 0.90
Ghadames 2.9 -0.84 -1.01 -0.35
Jaghboub 2.4 0.09 0.11 0.12
Jalo 1.6 0.17 0.32 0.05
Misurata 6.1 -1.12 -1.38 -2.16 *
Nalut 7.9 -1.68 -0.7 -0.32
Sebha 2.1 0.33 0.44 0.92
Shahat 7.6 -0.43 -0.76 -1.02
Sirt 5.3 -0.37 -0.63 -0.62
Tri. airport 5.8 -1.17 -1.28 -1.84 +
Tripoli city 7.0 0.16 0.28 0.60
Zuara 8.2 -3.06 -1.38 -1.12
Data source: Libyan Meteorological Department, Tripoli. Explanation: see Tab. 38
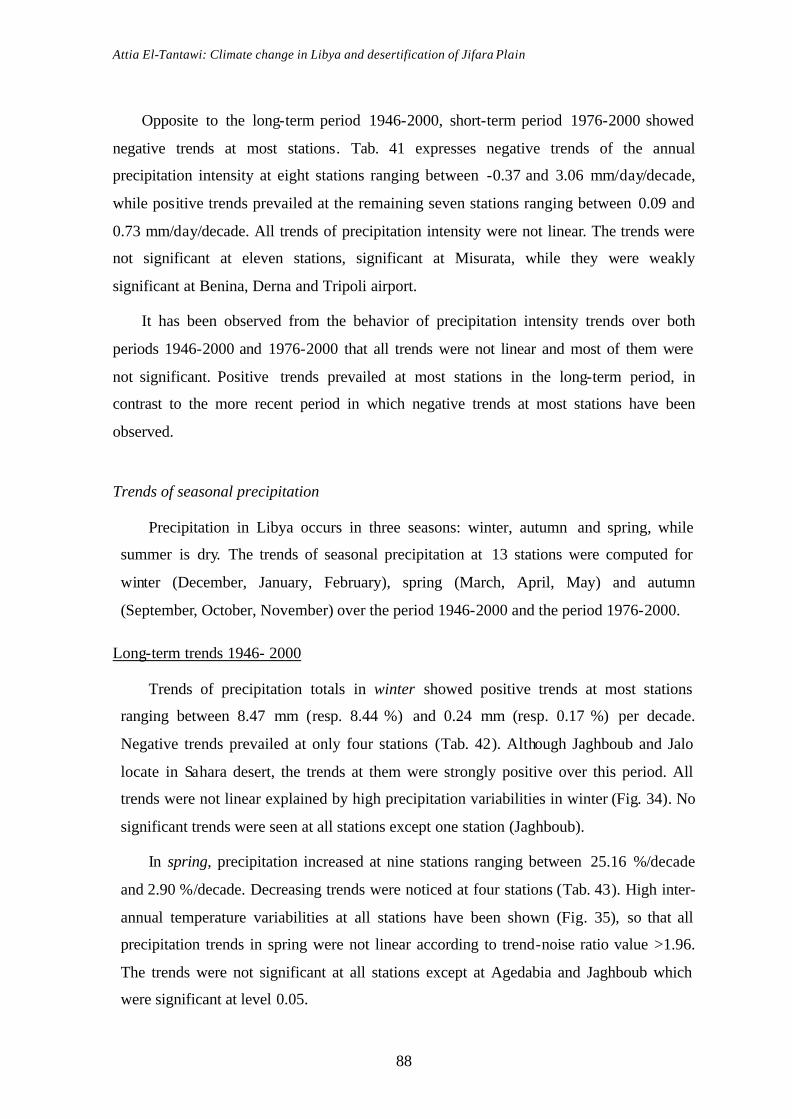
Attia El-Tantawi: Climate change in Libya and desertification of Jifara Plain
88
Opposite to the long-term period 1946-2000, short-term period 1976-2000 showed
negative trends at most stations. Tab. 41 expresses negative trends of the annual
precipitation intensity at eight stations ranging between -0.37 and 3.06 mm/day/decade,
while positive trends prevailed at the remaining seven stations ranging between 0.09 and
0.73 mm/day/decade. All trends of precipitation intensity were not linear. The trends were
not significant at eleven stations, significant at Misurata, while they were weakly
significant at Benina, Derna and Tripoli airport.
It has been observed from the behavior of precipitation intensity trends over both
periods 1946-2000 and 1976-2000 that all trends were not linear and most of them were
not significant. Positive trends prevailed at most stations in the long-term period, in
contrast to the more recent period in which negative trends at most stations have been
observed.
Trends of seasonal precipitation
Precipitation in Libya occurs in three seasons: winter, autumn and spring, while
summer is dry. The trends of seasonal precipitation at 13 stations were computed for
winter (December, January, February), spring (March, April, May) and autumn
(September, October, November) over the period 1946-2000 and the period 1976-2000.
Long-term trends 1946- 2000
Trends of precipitation totals in winter showed positive trends at most stations
ranging between 8.47 mm (resp. 8.44 %) and 0.24 mm (resp. 0.17 %) per decade.
Negative trends prevailed at only four stations (Tab. 42). Although Jaghboub and Jalo
locate in Sahara desert, the trends at them were strongly positive over this period. All
trends were not linear explained by high precipitation variabilities in winter (Fig. 34). No
significant trends were seen at all stations except one station (Jaghboub).
In spring, precipitation increased at nine stations ranging between 25.16 %/decade
and 2.90 %/decade. Decreasing trends were noticed at four stations (Tab. 43). High inter-
annual temperature variabilities at all stations have been shown (Fig. 35), so that all
precipitation trends in spring were not linear according to trend-noise ratio value >1.96.
The trends were not significant at all stations except at Agedabia and Jaghboub which
were significant at level 0.05.
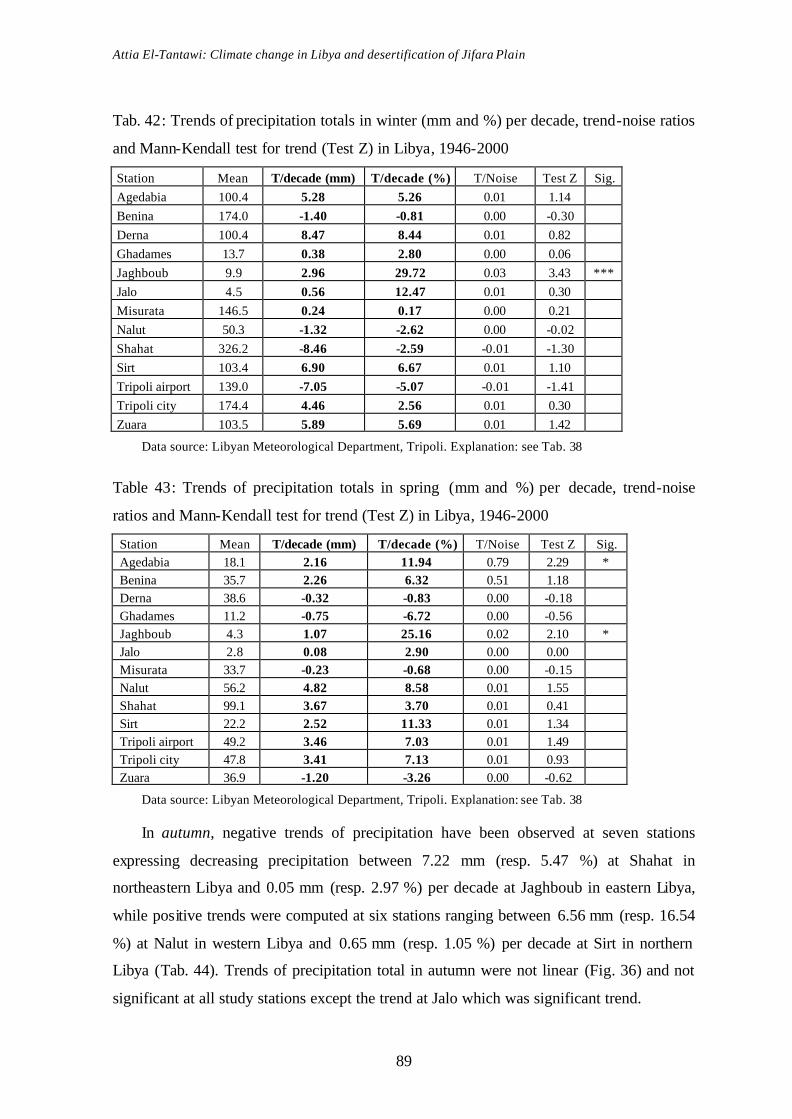
Attia El-Tantawi: Climate change in Libya and desertification of Jifara Plain
89
Tab. 42: Trends of precipitation totals in winter (mm and %) per decade, trend-noise ratios
and Mann-Kendall test for trend (Test Z) in Libya, 1946-2000
Station Mean T/decade (mm) T/decade (%) T/Noise Test Z Sig. Agedabia 100.4 5.28 5.26 0.01 1.14 Benina 174.0 -1.40 -0.81 0.00 -0.30 Derna 100.4 8.47 8.44 0.01 0.82 Ghadames 13.7 0.38 2.80 0.00 0.06 Jaghboub 9.9 2.96 29.72 0.03 3.43 *** Jalo 4.5 0.56 12.47 0.01 0.30 Misurata 146.5 0.24 0.17 0.00 0.21 Nalut 50.3 -1.32 -2.62 0.00 -0.02 Shahat 326.2 -8.46 -2.59 -0.01 -1.30 Sirt 103.4 6.90 6.67 0.01 1.10 Tripoli airport 139.0 -7.05 -5.07 -0.01 -1.41 Tripoli city 174.4 4.46 2.56 0.01 0.30 Zuara 103.5 5.89 5.69 0.01 1.42
Data source: Libyan Meteorological Department, Tripoli. Explanation: see Tab. 38
Table 43: Trends of precipitation totals in spring (mm and %) per decade, trend-noise
ratios and Mann-Kendall test for trend (Test Z) in Libya, 1946-2000
Station Mean T/decade (mm) T/decade (%) T/Noise Test Z Sig. Agedabia 18.1 2.16 11.94 0.79 2.29 * Benina 35.7 2.26 6.32 0.51 1.18 Derna 38.6 -0.32 -0.83 0.00 -0.18 Ghadames 11.2 -0.75 -6.72 0.00 -0.56 Jaghboub 4.3 1.07 25.16 0.02 2.10 * Jalo 2.8 0.08 2.90 0.00 0.00 Misurata 33.7 -0.23 -0.68 0.00 -0.15 Nalut 56.2 4.82 8.58 0.01 1.55 Shahat 99.1 3.67 3.70 0.01 0.41 Sirt 22.2 2.52 11.33 0.01 1.34 Tripoli airport 49.2 3.46 7.03 0.01 1.49 Tripoli city 47.8 3.41 7.13 0.01 0.93 Zuara 36.9 -1.20 -3.26 0.00 -0.62
Data source: Libyan Meteorological Department, Tripoli. Explanation: see Tab. 38
In autumn, negative trends of precipitation have been observed at seven stations
expressing decreasing precipitation between 7.22 mm (resp. 5.47 %) at Shahat in
northeastern Libya and 0.05 mm (resp. 2.97 %) per decade at Jaghboub in eastern Libya,
while positive trends were computed at six stations ranging between 6.56 mm (resp. 16.54
%) at Nalut in western Libya and 0.65 mm (resp. 1.05 %) per decade at Sirt in northern
Libya (Tab. 44). Trends of precipitation total in autumn were not linear (Fig. 36) and not
significant at all study stations except the trend at Jalo which was significant trend.
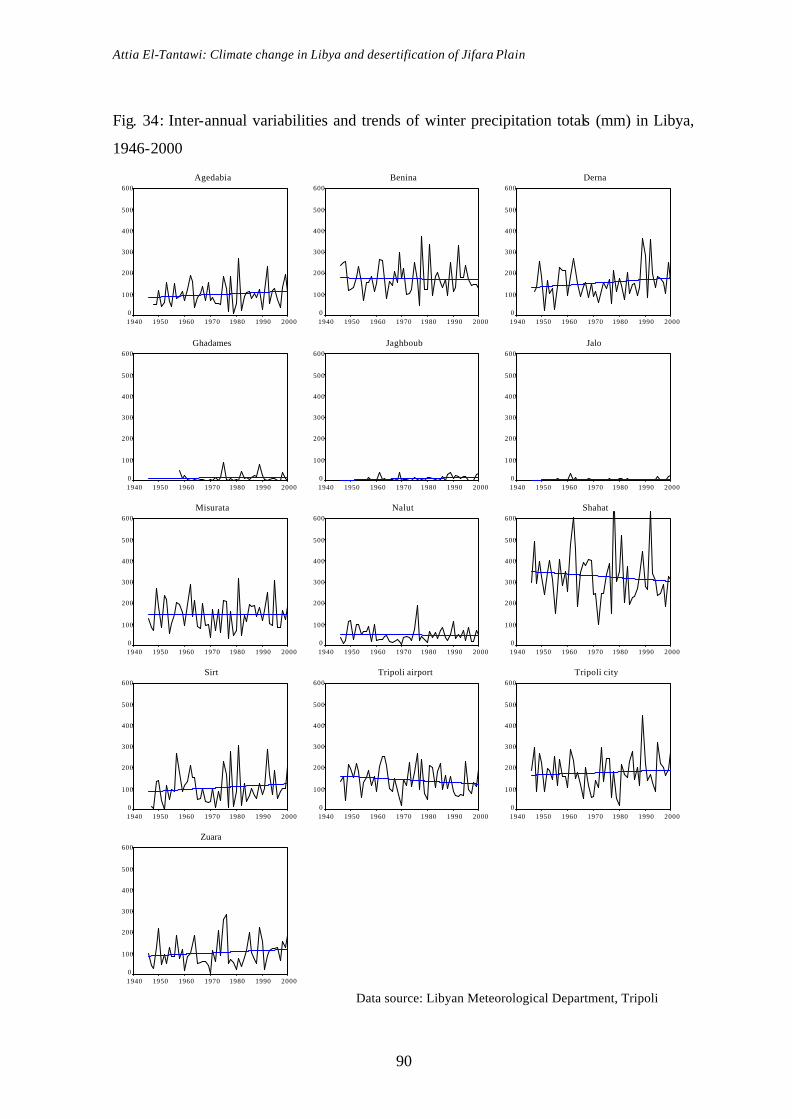
Attia El-Tantawi: Climate change in Libya and desertification of Jifara Plain
90
Fig. 34: Inter-annual variabilities and trends of winter precipitation totals (mm) in Libya,
1946-2000
Agedabia
2000199019801970196019501940
600
500
400
300
200
100
0
Benina
2000199019801970196019501940
600
500
400
300
200
100
0
Derna
2000199019801970196019501940
600
500
400
300
200
100
0
Ghadames
2000199019801970196019501940
600
500
400
300
200
100
0
Jaghboub
2000199019801970196019501940
600
500
400
300
200
100
0
Jalo
2000199019801970196019501940
600
500
400
300
200
100
0
Misurata
2000199019801970196019501940
600
500
400
300
200
100
0
Nalut
2000199019801970196019501940
600
500
400
300
200
100
0
Shahat
2000199019801970196019501940
600
500
400
300
200
100
0
Sirt
2000199019801970196019501940
600
500
400
300
200
100
0
Tripoli airport
2000199019801970196019501940
600
500
400
300
200
100
0
Tripoli city
2000199019801970196019501940
600
500
400
300
200
100
0
Zuara
2000199019801970196019501940
600
500
400
300
200
100
0
Data source: Libyan Meteorological Department, Tripoli

Attia El-Tantawi: Climate change in Libya and desertification of Jifara Plain
91
Fig. 35: Inter-annual variabilities and trends of spring precipitation totals (mm) in Libya,
1946-2000
Agedabia
2000199019801970196019501940
300
250
200
150
100
50
0
Benina
2000199019801970196019501940
300
250
200
150
100
50
0
Derna
2000199019801970196019501940
300
250
200
150
100
50
0
Ghadames
2000199019801970196019501940
300
250
200
150
100
50
0
Jaghboub
2000199019801970196019501940
300
250
200
150
100
50
0
Jalo
2000199019801970196019501940
300
250
200
150
100
50
0
Misurata
2000199019801970196019501940
300
250
200
150
100
50
0
Nalut
2000199019801970196019501940
300
250
200
150
100
50
0
Shahat
2000199019801970196019501940
300
250
200
150
100
50
0
Sirt
2000199019801970196019501940
300
250
200
150
100
50
0
Tripoli airport
2000199019801970196019501940
300
250
200
150
100
50
0
Tripoli city
2000199019801970196019501940
300
250
200
150
100
50
0
Zuara
2000199019801970196019501940
300
250
200
150
100
50
0
Data source: Libyan Meteorological Department, Tripoli
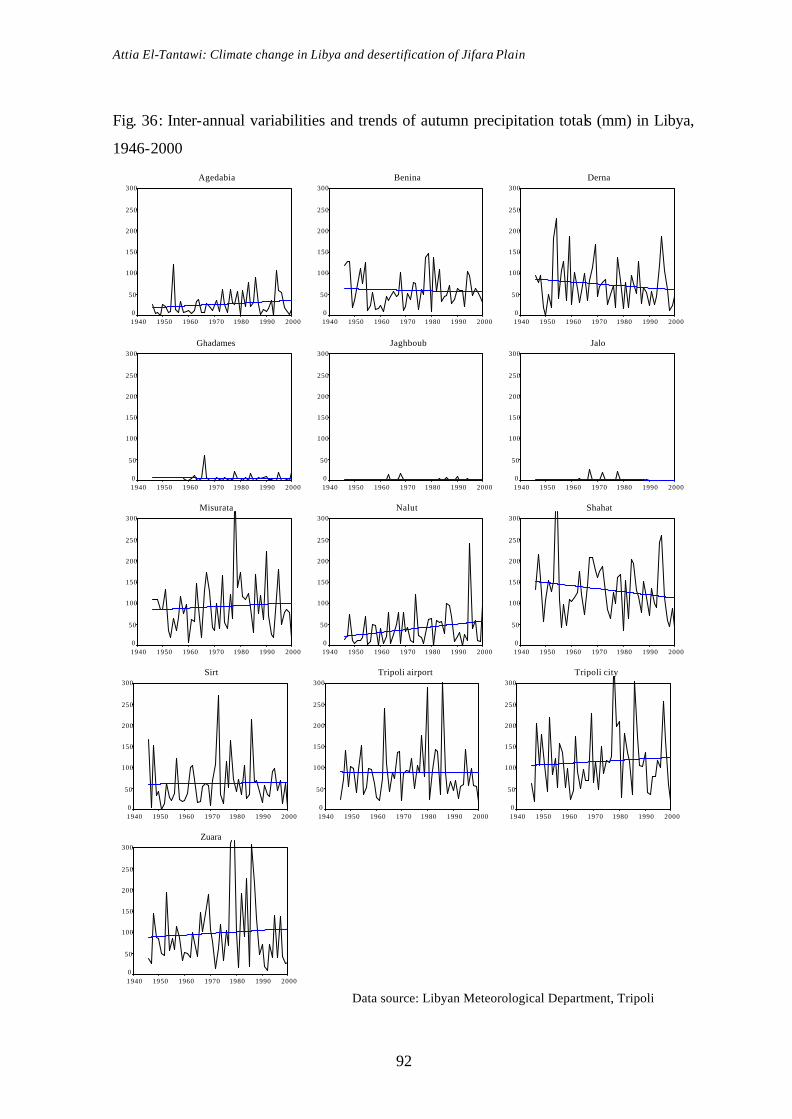
Attia El-Tantawi: Climate change in Libya and desertification of Jifara Plain
92
Fig. 36: Inter-annual variabilities and trends of autumn precipitation totals (mm) in Libya,
1946-2000
Agedabia
2000199019801970196019501940
300
250
200
150
100
50
0
Benina
2000199019801970196019501940
300
250
200
150
100
50
0
Derna
2000199019801970196019501940
300
250
200
150
100
50
0
Ghadames
2000199019801970196019501940
300
250
200
150
100
50
0
Jaghboub
2000199019801970196019501940
300
250
200
150
100
50
0
Jalo
2000199019801970196019501940
300
250
200
150
100
50
0
Misurata
2000199019801970196019501940
300
250
200
150
100
50
0
Nalut
2000199019801970196019501940
300
250
200
150
100
50
0
Shahat
2000199019801970196019501940
300
250
200
150
100
50
0
Sirt
2000199019801970196019501940
300
250
200
150
100
50
0
Tripoli airport
2000199019801970196019501940
300
250
200
150
100
50
0
Tripoli city
2000199019801970196019501940
300
250
200
150
100
50
0
Zuara
2000199019801970196019501940
300
250
200
150
100
50
0
Data source: Libyan Meteorological Department, Tripoli
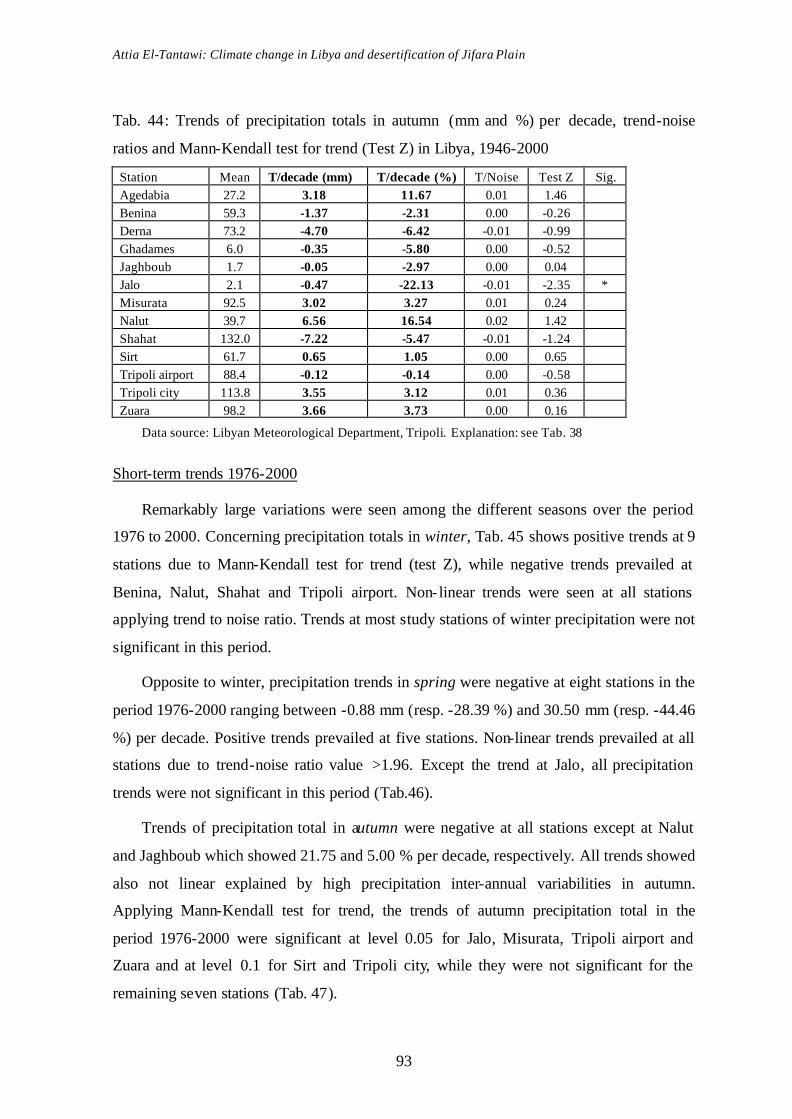
Attia El-Tantawi: Climate change in Libya and desertification of Jifara Plain
93
Tab. 44: Trends of precipitation totals in autumn (mm and %) per decade, trend-noise
ratios and Mann-Kendall test for trend (Test Z) in Libya, 1946-2000
Station Mean T/decade (mm) T/decade (%) T/Noise Test Z Sig. Agedabia 27.2 3.18 11.67 0.01 1.46 Benina 59.3 -1.37 -2.31 0.00 -0.26 Derna 73.2 -4.70 -6.42 -0.01 -0.99 Ghadames 6.0 -0.35 -5.80 0.00 -0.52 Jaghboub 1.7 -0.05 -2.97 0.00 0.04 Jalo 2.1 -0.47 -22.13 -0.01 -2.35 * Misurata 92.5 3.02 3.27 0.01 0.24 Nalut 39.7 6.56 16.54 0.02 1.42 Shahat 132.0 -7.22 -5.47 -0.01 -1.24 Sirt 61.7 0.65 1.05 0.00 0.65 Tripoli airport 88.4 -0.12 -0.14 0.00 -0.58 Tripoli city 113.8 3.55 3.12 0.01 0.36 Zuara 98.2 3.66 3.73 0.00 0.16
Data source: Libyan Meteorological Department, Tripoli. Explanation: see Tab. 38
Short-term trends 1976-2000
Remarkably large variations were seen among the different seasons over the period
1976 to 2000. Concerning precipitation totals in winter, Tab. 45 shows positive trends at 9
stations due to Mann-Kendall test for trend (test Z), while negative trends prevailed at
Benina, Nalut, Shahat and Tripoli airport. Non- linear trends were seen at all stations
applying trend to noise ratio. Trends at most study stations of winter precipitation were not
significant in this period.
Opposite to winter, precipitation trends in spring were negative at eight stations in the
period 1976-2000 ranging between -0.88 mm (resp. -28.39 %) and 30.50 mm (resp. -44.46
%) per decade. Positive trends prevailed at five stations. Non-linear trends prevailed at all
stations due to trend-noise ratio value >1.96. Except the trend at Jalo, all precipitation
trends were not significant in this period (Tab.46).
Trends of precipitation total in autumn were negative at all stations except at Nalut
and Jaghboub which showed 21.75 and 5.00 % per decade, respectively. All trends showed
also not linear explained by high precipitation inter-annual variabilities in autumn.
Applying Mann-Kendall test for trend, the trends of autumn precipitation total in the
period 1976-2000 were significant at level 0.05 for Jalo, Misurata, Tripoli airport and
Zuara and at level 0.1 for Sirt and Tripoli city, while they were not significant for the
remaining seven stations (Tab. 47).
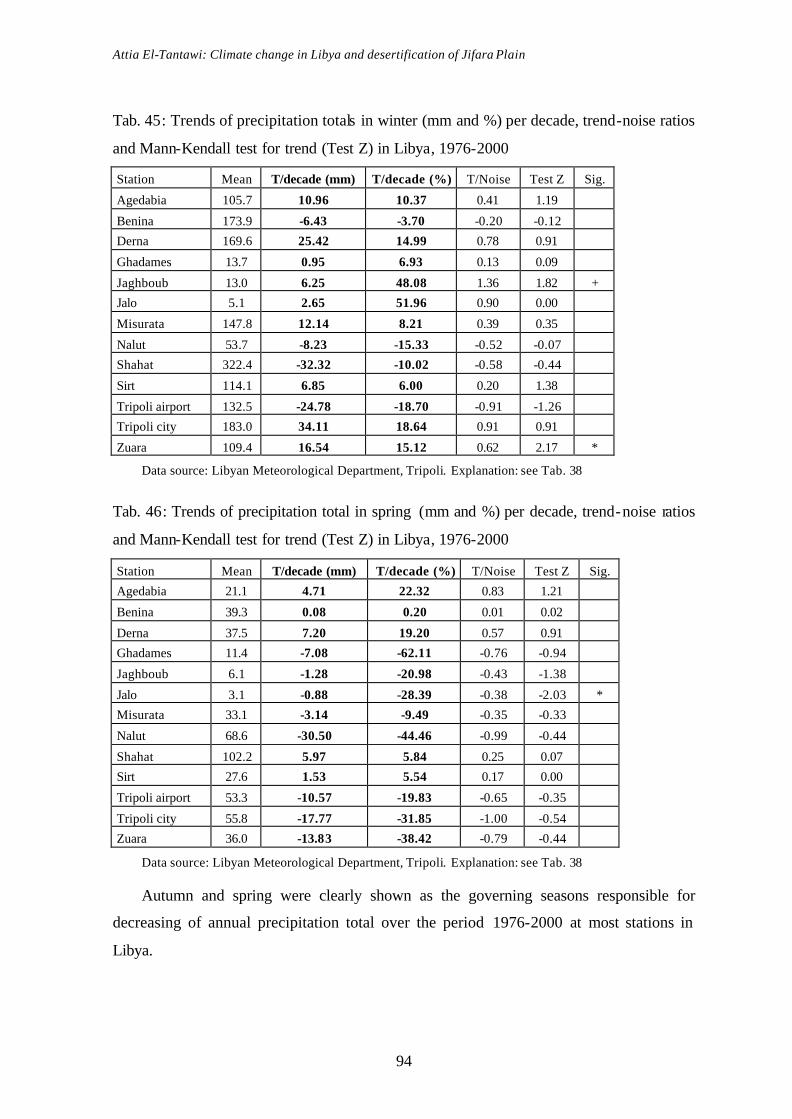
Attia El-Tantawi: Climate change in Libya and desertification of Jifara Plain
94
Tab. 45: Trends of precipitation totals in winter (mm and %) per decade, trend-noise ratios
and Mann-Kendall test for trend (Test Z) in Libya, 1976-2000
Station Mean T/decade (mm) T/decade (%) T/Noise Test Z Sig.
Agedabia 105.7 10.96 10.37 0.41 1.19
Benina 173.9 -6.43 -3.70 -0.20 -0.12
Derna 169.6 25.42 14.99 0.78 0.91
Ghadames 13.7 0.95 6.93 0.13 0.09
Jaghboub 13.0 6.25 48.08 1.36 1.82 +
Jalo 5.1 2.65 51.96 0.90 0.00
Misurata 147.8 12.14 8.21 0.39 0.35
Nalut 53.7 -8.23 -15.33 -0.52 -0.07
Shahat 322.4 -32.32 -10.02 -0.58 -0.44
Sirt 114.1 6.85 6.00 0.20 1.38
Tripoli airport 132.5 -24.78 -18.70 -0.91 -1.26
Tripoli city 183.0 34.11 18.64 0.91 0.91
Zuara 109.4 16.54 15.12 0.62 2.17 *
Data source: Libyan Meteorological Department, Tripoli. Explanation: see Tab. 38
Tab. 46: Trends of precipitation total in spring (mm and %) per decade, trend-noise ratios
and Mann-Kendall test for trend (Test Z) in Libya, 1976-2000
Station Mean T/decade (mm) T/decade (%) T/Noise Test Z Sig.
Agedabia 21.1 4.71 22.32 0.83 1.21
Benina 39.3 0.08 0.20 0.01 0.02
Derna 37.5 7.20 19.20 0.57 0.91
Ghadames 11.4 -7.08 -62.11 -0.76 -0.94
Jaghboub 6.1 -1.28 -20.98 -0.43 -1.38
Jalo 3.1 -0.88 -28.39 -0.38 -2.03 *
Misurata 33.1 -3.14 -9.49 -0.35 -0.33
Nalut 68.6 -30.50 -44.46 -0.99 -0.44
Shahat 102.2 5.97 5.84 0.25 0.07
Sirt 27.6 1.53 5.54 0.17 0.00
Tripoli airport 53.3 -10.57 -19.83 -0.65 -0.35
Tripoli city 55.8 -17.77 -31.85 -1.00 -0.54
Zuara 36.0 -13.83 -38.42 -0.79 -0.44
Data source: Libyan Meteorological Department, Tripoli. Explanation: see Tab. 38
Autumn and spring were clearly shown as the governing seasons responsible for
decreasing of annual precipitation total over the period 1976-2000 at most stations in
Libya.
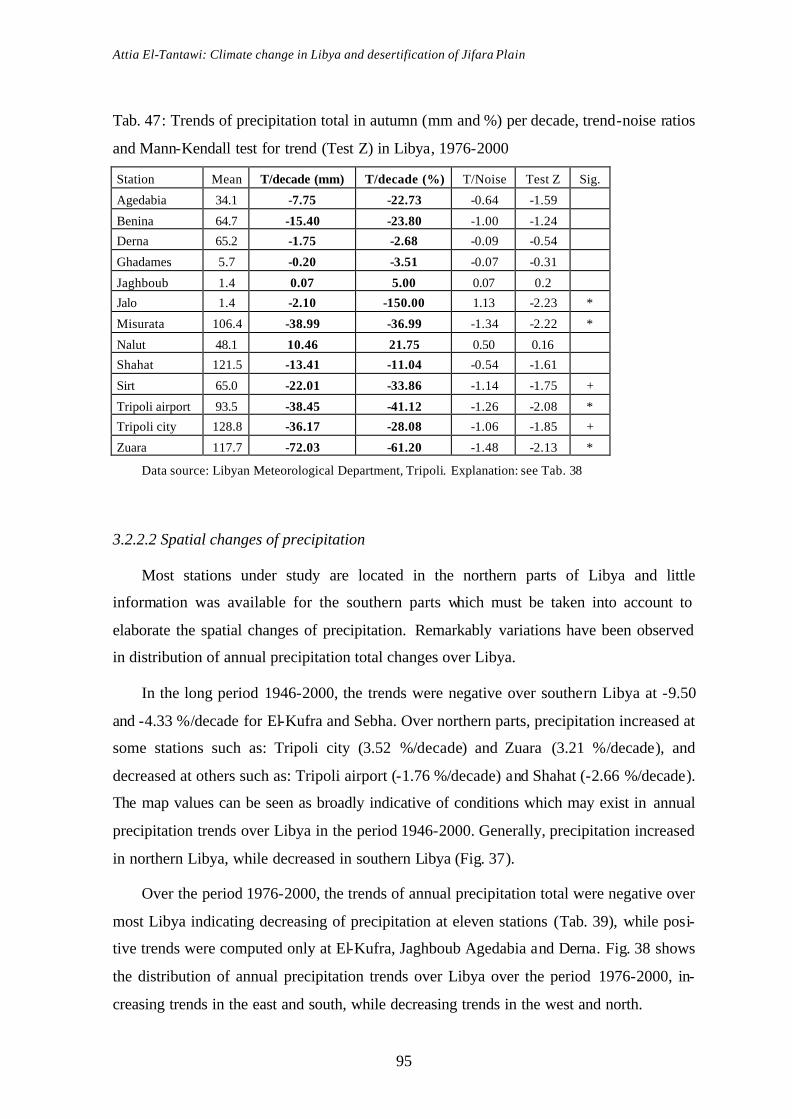
Attia El-Tantawi: Climate change in Libya and desertification of Jifara Plain
95
Tab. 47: Trends of precipitation total in autumn (mm and %) per decade, trend-noise ratios
and Mann-Kendall test for trend (Test Z) in Libya, 1976-2000
Station Mean T/decade (mm) T/decade (%) T/Noise Test Z Sig.
Agedabia 34.1 -7.75 -22.73 -0.64 -1.59
Benina 64.7 -15.40 -23.80 -1.00 -1.24
Derna 65.2 -1.75 -2.68 -0.09 -0.54
Ghadames 5.7 -0.20 -3.51 -0.07 -0.31
Jaghboub 1.4 0.07 5.00 0.07 0.2
Jalo 1.4 -2.10 -150.00 1.13 -2.23 *
Misurata 106.4 -38.99 -36.99 -1.34 -2.22 *
Nalut 48.1 10.46 21.75 0.50 0.16
Shahat 121.5 -13.41 -11.04 -0.54 -1.61
Sirt 65.0 -22.01 -33.86 -1.14 -1.75 +
Tripoli airport 93.5 -38.45 -41.12 -1.26 -2.08 *
Tripoli city 128.8 -36.17 -28.08 -1.06 -1.85 +
Zuara 117.7 -72.03 -61.20 -1.48 -2.13 *
Data source: Libyan Meteorological Department, Tripoli. Explanation: see Tab. 38
3.2.2.2 Spatial changes of precipitation
Most stations under study are located in the northern parts of Libya and little
information was available for the southern parts which must be taken into account to
elaborate the spatial changes of precipitation. Remarkably variations have been observed
in distribution of annual precipitation total changes over Libya.
In the long period 1946-2000, the trends were negative over southern Libya at -9.50
and -4.33 %/decade for El-Kufra and Sebha. Over northern parts, precipitation increased at
some stations such as: Tripoli city (3.52 %/decade) and Zuara (3.21 %/decade), and
decreased at others such as: Tripoli airport (-1.76 %/decade) and Shahat (-2.66 %/decade).
The map values can be seen as broadly indicative of conditions which may exist in annual
precipitation trends over Libya in the period 1946-2000. Generally, precipitation increased
in northern Libya, while decreased in southern Libya (Fig. 37).
Over the period 1976-2000, the trends of annual precipitation total were negative over
most Libya indicating decreasing of precipitation at eleven stations (Tab. 39), while posi-
tive trends were computed only at El-Kufra, Jaghboub Agedabia and Derna. Fig. 38 shows
the distribution of annual precipitation trends over Libya over the period 1976-2000, in-
creasing trends in the east and south, while decreasing trends in the west and north.
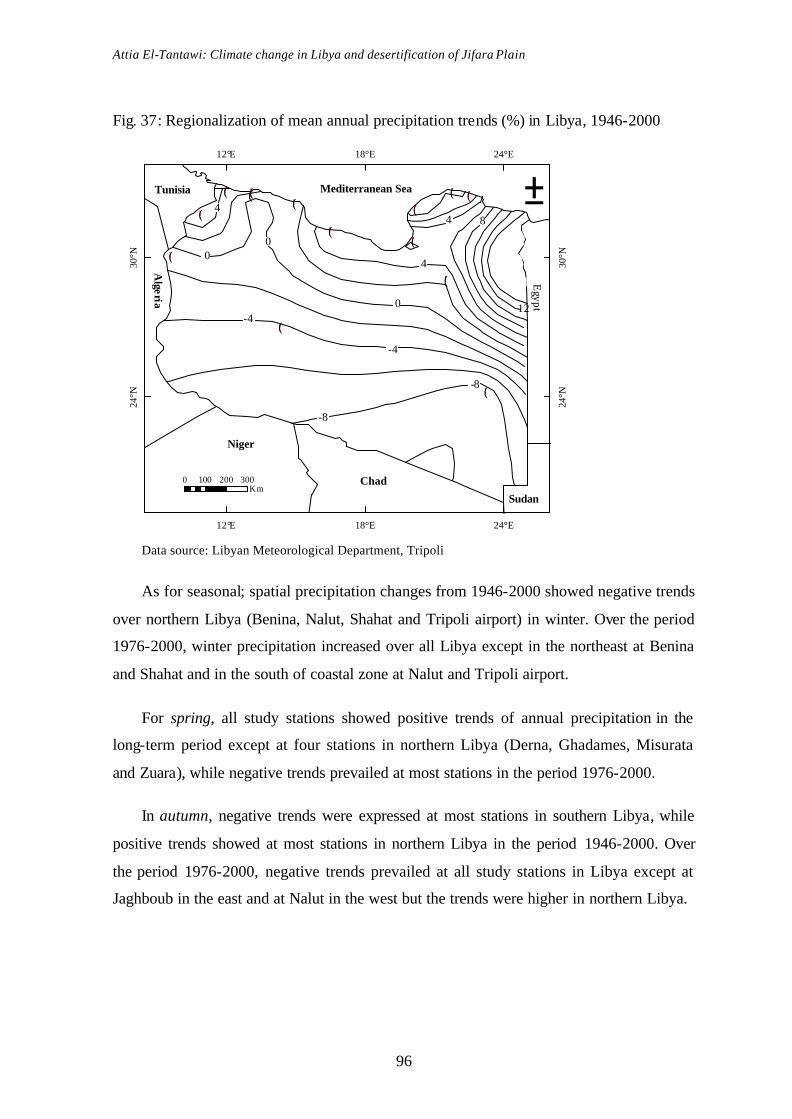
Attia El-Tantawi: Climate change in Libya and desertification of Jifara Plain
96
Fig. 37: Regionalization of mean annual precipitation trends (%) in Libya, 1946-2000
Data source: Libyan Meteorological Department, Tripoli
As for seasonal; spatial precipitation changes from 1946-2000 showed negative trends
over northern Libya (Benina, Nalut, Shahat and Tripoli airport) in winter. Over the period
1976-2000, winter precipitation increased over all Libya except in the northeast at Benina
and Shahat and in the south of coastal zone at Nalut and Tripoli airport.
For spring, all study stations showed positive trends of annual precipitation in the
long-term period except at four stations in northern Libya (Derna, Ghadames, Misurata
and Zuara), while negative trends prevailed at most stations in the period 1976-2000.
In autumn, negative trends were expressed at most stations in southern Libya, while
positive trends showed at most stations in northern Libya in the period 1946-2000. Over
the period 1976-2000, negative trends prevailed at all study stations in Libya except at
Jaghboub in the east and at Nalut in the west but the trends were higher in northern Libya.
!(
!(!(
!(
!(!(
!(
!(!(
!(
!(
!(
!(!(!(
12°E
12°E
18°E
18°E
24°E
24°E
24°N
24°N
30°N
30°N
±
0 100 200 300Km
Niger
Chad
Sudan
Tunisia Mediterranean Sea
Egypt
Algeria
-8
-8
-4
-40
0
4
4
0
48
12

Attia El-Tantawi: Climate change in Libya and desertification of Jifara Plain
97
!(
!(!(
!(
!(!(
!(
!(!(
!(
!(
!(
!(!(!(
12°E
12°E
18°E
18°E
24°E
24°E
24°N
24°N
30°N
30°N
±
0 100 200 300Km
Niger
Chad
Sudan
TunisiaMediterranean sea
Egypt
Algeria
372921
13
13
21
5
5-3
-3
-11
-19
-3-23
Fig. 38: Distribution of mean annual precipitation trends (%) in Libya, 1976-2000
Data source: Libyan Meteorological Department, Tripoli
3.2.3 Observed changes of mean annual relative humidity
Long-term trends 1946-2000
Negative trends prevailed at eight stations ranging between -1.88 and 0.30 %/decade
at El_Kufra and Benina, respectively, while positive trends of mean annual relative humid-
ity were shown at seven sations ranging between 0.14 and 1.32 %/decade at Jalo and Trip-
oli city, respectively (Tab.48). As a result of high inter-annual variabilities of annual rela-
tive humidity at all stations, the trends were not linear, expressed by a trend-to-noise-ratio
>1.96, (Fig. 39).
For significance: trends at Agedabia, shahat and Tripoli city were very high signifi-
cant; high significant trends were computed at El-Kufra, Misurata, Sebha, Sirt and Tripoli
airport); while the trends at Benina, Derna, ghadames, Jaghboub, Jalo, Nalut and Zuara
were not significant in this period.
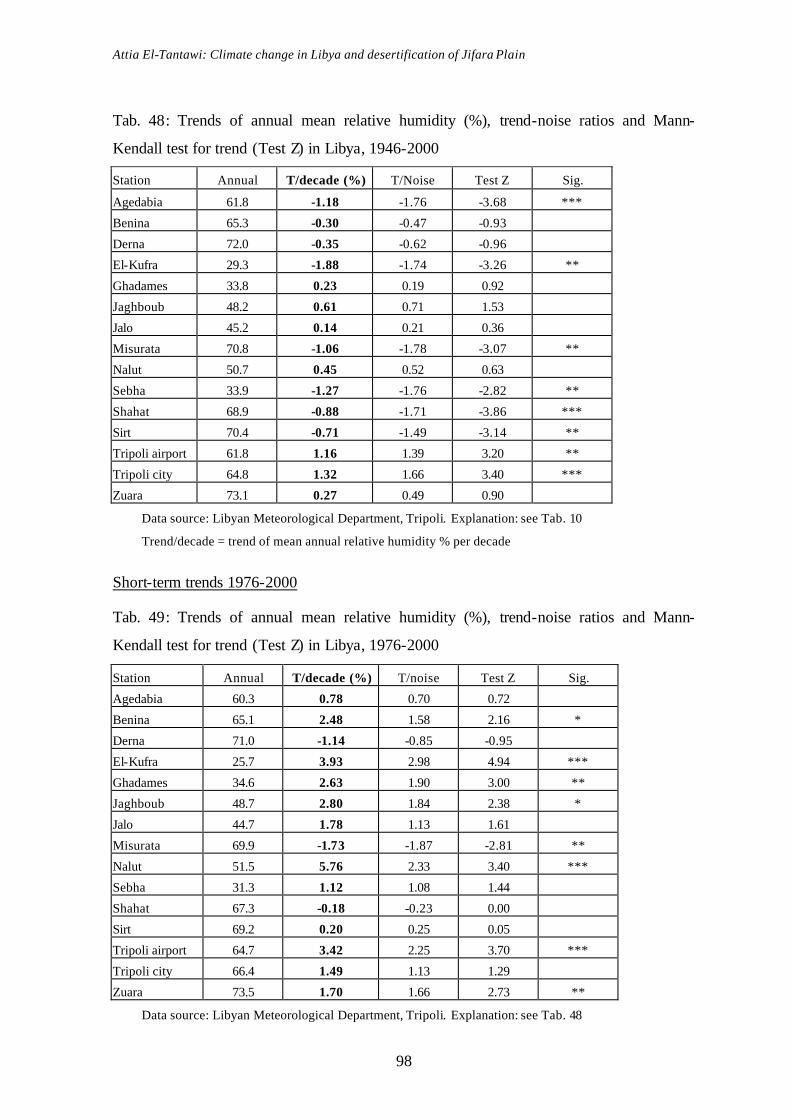
Attia El-Tantawi: Climate change in Libya and desertification of Jifara Plain
98
Tab. 48: Trends of annual mean relative humidity (%), trend-noise ratios and Mann-
Kendall test for trend (Test Z) in Libya, 1946-2000
Station Annual T/decade (%) T/Noise Test Z Sig.
Agedabia 61.8 -1.18 -1.76 -3.68 ***
Benina 65.3 -0.30 -0.47 -0.93
Derna 72.0 -0.35 -0.62 -0.96
El-Kufra 29.3 -1.88 -1.74 -3.26 **
Ghadames 33.8 0.23 0.19 0.92
Jaghboub 48.2 0.61 0.71 1.53
Jalo 45.2 0.14 0.21 0.36
Misurata 70.8 -1.06 -1.78 -3.07 **
Nalut 50.7 0.45 0.52 0.63
Sebha 33.9 -1.27 -1.76 -2.82 **
Shahat 68.9 -0.88 -1.71 -3.86 ***
Sirt 70.4 -0.71 -1.49 -3.14 **
Tripoli airport 61.8 1.16 1.39 3.20 **
Tripoli city 64.8 1.32 1.66 3.40 ***
Zuara 73.1 0.27 0.49 0.90
Data source: Libyan Meteorological Department, Tripoli. Explanation: see Tab. 10
Trend/decade = trend of mean annual relative humidity % per decade
Short-term trends 1976-2000
Tab. 49: Trends of annual mean relative humidity (%), trend-noise ratios and Mann-
Kendall test for trend (Test Z) in Libya, 1976-2000
Station Annual T/decade (%) T/noise Test Z Sig.
Agedabia 60.3 0.78 0.70 0.72
Benina 65.1 2.48 1.58 2.16 *
Derna 71.0 -1.14 -0.85 -0.95
El-Kufra 25.7 3.93 2.98 4.94 ***
Ghadames 34.6 2.63 1.90 3.00 **
Jaghboub 48.7 2.80 1.84 2.38 *
Jalo 44.7 1.78 1.13 1.61
Misurata 69.9 -1.73 -1.87 -2.81 **
Nalut 51.5 5.76 2.33 3.40 ***
Sebha 31.3 1.12 1.08 1.44
Shahat 67.3 -0.18 -0.23 0.00
Sirt 69.2 0.20 0.25 0.05
Tripoli airport 64.7 3.42 2.25 3.70 ***
Tripoli city 66.4 1.49 1.13 1.29
Zuara 73.5 1.70 1.66 2.73 **
Data source: Libyan Meteorological Department, Tripoli. Explanation: see Tab. 48

Attia El-Tantawi: Climate change in Libya and desertification of Jifara Plain
99
Fig. 39: Inter-annual variabilities and trends of annual mean relative humidity (%) in
Libya, 1946-2000
Data source: Libyan Meteorological Department, Tripoli

Attia El-Tantawi: Climate change in Libya and desertification of Jifara Plain
100
Positive trends were computed at most stations, while negative trends prevailed at
only three stations (Derna, Misurata and Shahat) from 1976-2000. The highest trend was
5.76 % per decade at Nalut in western Libya and the lowest trend was -1.73 % per decade
at Misurata on Mediterranean coast. Annual mean relative humidity trends were not linear
at most stations. Trends at El-kufra, Nalut and Tripoli airport were linear and very high
significant. It can be observed that the trends were high significant at Ghadames, Misurata
and Zuara, and significant trends at Benina and Jaghboub (Tab. 49). Mean annual relative
humidity increased, in general, at most stations over the period 1976-2000 especially in
southern and middle Libya.
3.2.4 Observed changes of annual cloud amount totals
Clouds are an internal component of the climate system. The presence and variations
of cloud coverage effects are closely related to atmospheric humidity (SUN, et al., 2000:
4341). Annual total cloud amount trends in Libya were computed in both periods 1946-
2000 and 1976-2000.
Long-term trends 1946-2000
Tab. 50: Trends of annual cloud amount totals (Oktas and %), trend-noise ratios and
Mann-Kendall test for trend (Test Z) in Libya, 1946-2000
Station Annual Trend/decade (Oktas) T/decade (%) T/noise Test Z Sig.
Agedabia 24,5 -1,45 -5,92 -1,99 -4,17 ***
Benina 35,1 0,97 2,76 1,92 4,25 ***
Derna 38,4 0,63 1,64 1,00 1,71 +
El-Kufra 11,1 -0,66 -5,95 -1,39 -2,75 **
Ghadames 20,0 -0,38 -1,90 -0,32 -1,46
Jaghboub 18,4 -0,80 -4,35 -1,28 -2,40 *
Jalo 15,6 -1,69 -10,83 -2,26 -4,94 ***
Misurata 33,7 -0,44 -1,31 -0,62 -2,23 *
Nalut 26,0 -1,30 -5,00 -1,77 -4,53 ***
Sebha 17,1 -0,54 -3,16 -0,68 -0,82
Shahat 46,5 -0,91 -1,96 -0,85 -1,10
Sirt 33,3 -0,23 -0,69 -0,29 -0,78
Tripoli airport 32,2 0,99 3,07 1,63 3,74 ***
Tripoli city 35,6 -0,12 -0,34 -0,20 -0,45
Zuara 31,3 -0,16 -0,51 -0,31 -0,40
Data source: Libyan Meteorological Department, Tripoli. Explanation: see Tab. 10

Attia El-Tantawi: Climate change in Libya and desertification of Jifara Plain
101
Fig. 40: Inter-annual variabilities and trends of annual cloud amount totals (Oktas) in
Libya, 1946-2000
Agedabia
2000199019801970196019501940
60
50
40
30
20
10
0
Benina
2000199019801970196019501940
60
50
40
30
20
10
0
Derna
2000199019801970196019501940
60
50
40
30
20
10
0
El-Kufra
2000199019801970196019501940
60
50
40
30
20
10
0
Ghadames
2000199019801970196019501940
60
50
40
30
20
10
0
Jaghboub
2000199019801970196019501940
60
50
40
30
20
10
0
Jalo
2000199019801970196019501940
60
50
40
30
20
10
0
Misurata
2000199019801970196019501940
60
50
40
30
20
10
0
Nalut
2000199019801970196019501940
60
50
40
30
20
10
0
Sebha
2000199019801970196019501940
60
50
40
30
20
10
0
Shahat
2000199019801970196019501940
60
50
40
30
20
10
0
Sirt
2000199019801970196019501940
60
50
40
30
20
10
0
Tripoli airport
2000199019801970196019501940
60
50
40
30
20
10
0
Tripoli city
2000199019801970196019501940
60
50
40
30
20
10
0
Zuara
2000199019801970196019501940
60
50
40
30
20
10
0
Data source: Libyan Meteorological Department, Tripoli

Attia El-Tantawi: Climate change in Libya and desertification of Jifara Plain
102
It can be seen that the annual cloud amount totals decreased at most stations from
1946-2000, an increase was observed only at Benina, Derna and Tripoli airport. It can also
be noticed that very highly significant trends were computed at three stations, highly
significant trend at El-Kufra, significant trends at Jaghboub and Misurata and weakly
significant trend at Derna, while the trends at six stations were not significant (Tab. 50).
All trends were not linear in this period except at Agedabia and Jalo (Fig. 40).
Short-term trends 1976-2000
Negative trends of annual cloud amount prevailed at most stations over the period
1976-2000 ranging between -7.95 oktas (resp. -17.83 %) per decade at Shahat on Jebal El-
Akhdar and -0.16 oktas (resp. -0.48 %) at Tripoli airport. Positive trends were seen only at
four stations (Tab. 51). Non- linear trends were seen at eight stations, while linear trends
were shown at seven stations. For significance, very highly significant trends were
observed at Agedabia, Jalo, Shahat and Sirt; highly significant trends at Derna, Jaghboub
and Tripoli city; significant trends at Nalut, Sebha and Zuara, while not significant trends
were computed at Benina, El-Kufra, Ghadames, Misurata and Tripoli airport.
Tab. 51: Trends of annual cloud amount totals, trend-noise ratios and Mann-Kendall test
for trend (Test Z) in Libya, 1976-2000
Station Annual T/decade (Oktas) T/decade (%) T/noise Test Z Sig.
Agedabia 22.7 -4.64 -20.44 -2.86 -4.79 ***
Benina 36.6 0.76 2.08 0.85 0.89
Derna 39.9 -2.63 -6.59 -2.02 -3.20 **
El-Kufra 9.9 0.03 0.30 0.04 0.00
Ghadames 19.4 1.52 7.84 0.75 1.49
Jaghboub 17.7 -3.11 -17.57 -2.27 -2.81 **
Jalo 13.7 -3.57 -26.06 -2.41 -3.75 ***
Misurata 32.0 -0.44 -1.38 -0.50 -0.55
Nalut 23.9 -1.56 -6.53 -1.15 -2.38 *
Sebha 16.4 0.88 5.37 0.70 2.03 *
Shahat 44.6 -7.95 -17.83 -2.87 -4.86 ***
Sirt 33.8 -5.70 -16.86 -2.88 -5.06 ***
Tripoli airport 33.5 -0.16 -0.48 -0.16 -0.65
Tripoli city 35.8 -2.64 -7.37 -2.09 -2.83 **
Zuara 31.2 -1.33 -4.26 -1.43 -1.97 *
Data source: Libyan Meteorological Department, Tripoli.
Explanation: see Tab. 10
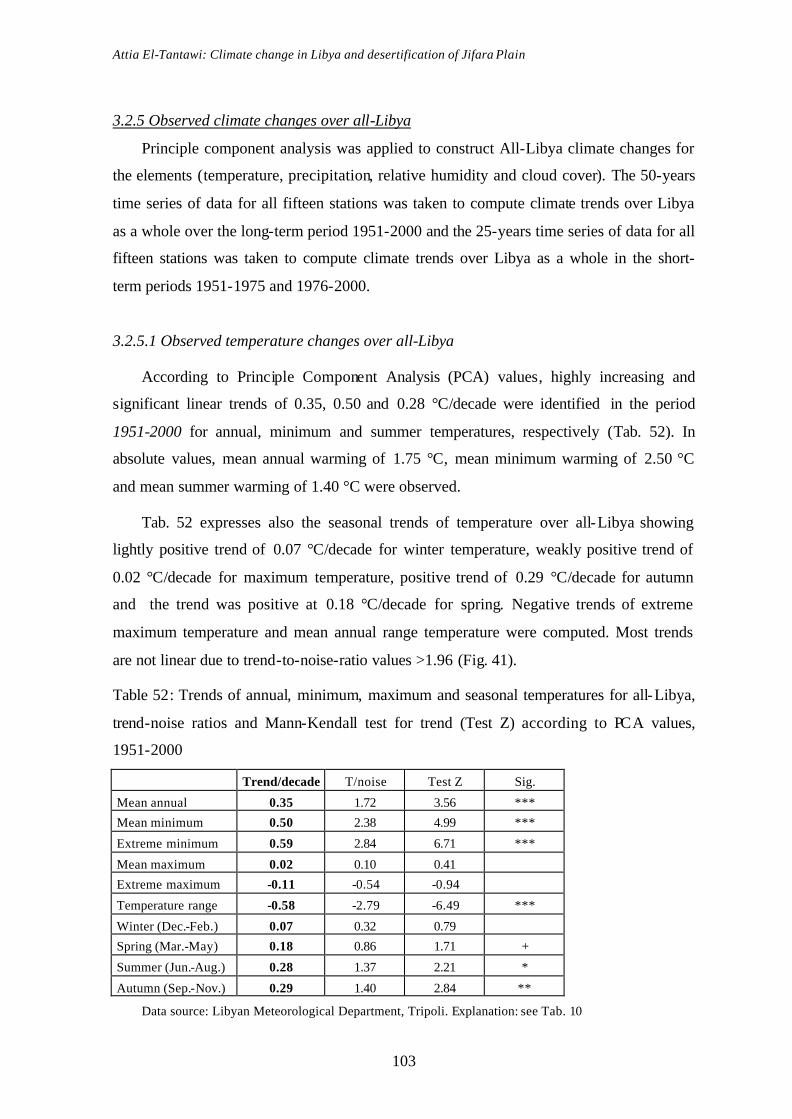
Attia El-Tantawi: Climate change in Libya and desertification of Jifara Plain
103
3.2.5 Observed climate changes over all-Libya
Principle component analysis was applied to construct All-Libya climate changes for
the elements (temperature, precipitation, relative humidity and cloud cover). The 50-years
time series of data for all fifteen stations was taken to compute climate trends over Libya
as a whole over the long-term period 1951-2000 and the 25-years time series of data for all
fifteen stations was taken to compute climate trends over Libya as a whole in the short-
term periods 1951-1975 and 1976-2000.
3.2.5.1 Observed temperature changes over all-Libya
According to Principle Component Analysis (PCA) values, highly increasing and
significant linear trends of 0.35, 0.50 and 0.28 °C/decade were identified in the period
1951-2000 for annual, minimum and summer temperatures, respectively (Tab. 52). In
absolute values, mean annual warming of 1.75 °C, mean minimum warming of 2.50 °C
and mean summer warming of 1.40 °C were observed.
Tab. 52 expresses also the seasonal trends of temperature over all-Libya showing
lightly positive trend of 0.07 °C/decade for winter temperature, weakly positive trend of
0.02 °C/decade for maximum temperature, positive trend of 0.29 °C/decade for autumn
and the trend was positive at 0.18 °C/decade for spring. Negative trends of extreme
maximum temperature and mean annual range temperature were computed. Most trends
are not linear due to trend-to-noise-ratio values >1.96 (Fig. 41).
Table 52: Trends of annual, minimum, maximum and seasonal temperatures for all-Libya,
trend-noise ratios and Mann-Kendall test for trend (Test Z) according to PCA values,
1951-2000
Trend/decade T/noise Test Z Sig.
Mean annual 0.35 1.72 3.56 ***
Mean minimum 0.50 2.38 4.99 ***
Extreme minimum 0.59 2.84 6.71 ***
Mean maximum 0.02 0.10 0.41
Extreme maximum -0.11 -0.54 -0.94
Temperature range -0.58 -2.79 -6.49 ***
Winter (Dec.-Feb.) 0.07 0.32 0.79
Spring (Mar.-May) 0.18 0.86 1.71 +
Summer (Jun.-Aug.) 0.28 1.37 2.21 *
Autumn (Sep.-Nov.) 0.29 1.40 2.84 **
Data source: Libyan Meteorological Department, Tripoli. Explanation: see Tab. 10
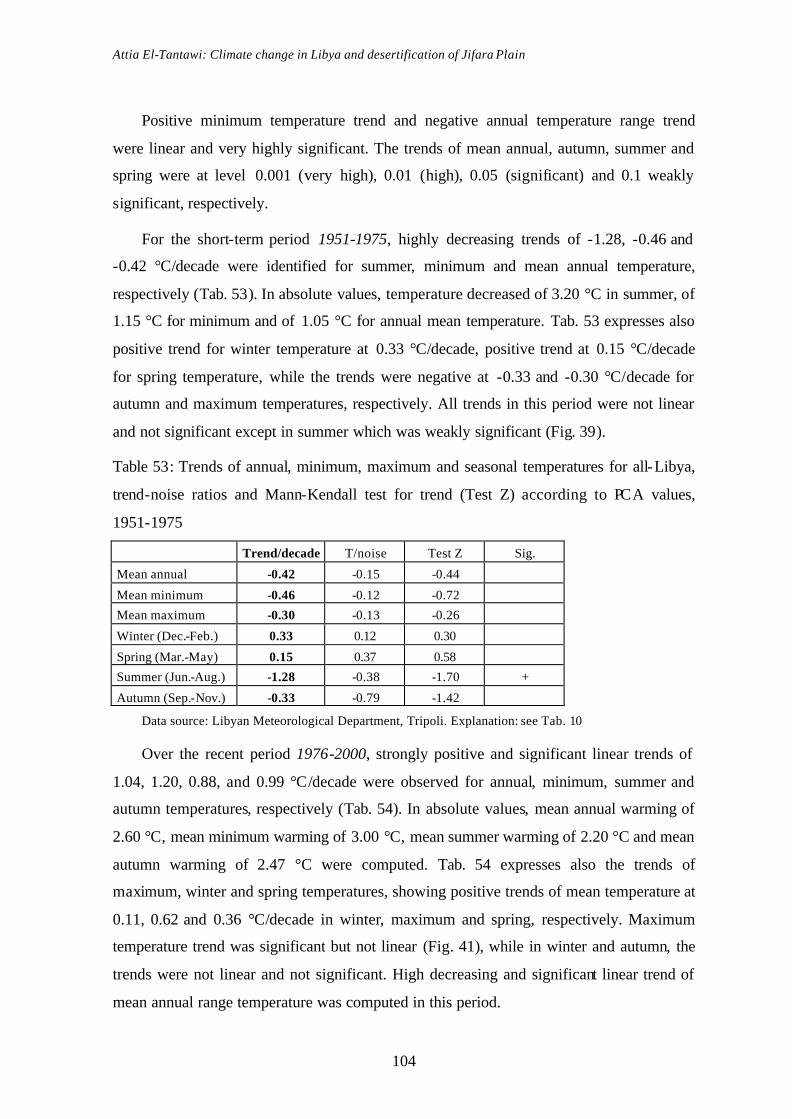
Attia El-Tantawi: Climate change in Libya and desertification of Jifara Plain
104
Positive minimum temperature trend and negative annual temperature range trend
were linear and very highly significant. The trends of mean annual, autumn, summer and
spring were at level 0.001 (very high), 0.01 (high), 0.05 (significant) and 0.1 weakly
significant, respectively.
For the short-term period 1951-1975, highly decreasing trends of -1.28, -0.46 and
-0.42 °C/decade were identified for summer, minimum and mean annual temperature,
respectively (Tab. 53). In absolute values, temperature decreased of 3.20 °C in summer, of
1.15 °C for minimum and of 1.05 °C for annual mean temperature. Tab. 53 expresses also
positive trend for winter temperature at 0.33 °C/decade, positive trend at 0.15 °C/decade
for spring temperature, while the trends were negative at -0.33 and -0.30 °C/decade for
autumn and maximum temperatures, respectively. All trends in this period were not linear
and not significant except in summer which was weakly significant (Fig. 39).
Table 53: Trends of annual, minimum, maximum and seasonal temperatures for all-Libya,
trend-noise ratios and Mann-Kendall test for trend (Test Z) according to PCA values,
1951-1975
Trend/decade T/noise Test Z Sig.
Mean annual -0.42 -0.15 -0.44
Mean minimum -0.46 -0.12 -0.72
Mean maximum -0.30 -0.13 -0.26
Winter (Dec.-Feb.) 0.33 0.12 0.30
Spring (Mar.-May) 0.15 0.37 0.58
Summer (Jun.-Aug.) -1.28 -0.38 -1.70 +
Autumn (Sep.-Nov.) -0.33 -0.79 -1.42
Data source: Libyan Meteorological Department, Tripoli. Explanation: see Tab. 10
Over the recent period 1976-2000, strongly positive and significant linear trends of
1.04, 1.20, 0.88, and 0.99 °C/decade were observed for annual, minimum, summer and
autumn temperatures, respectively (Tab. 54). In absolute values, mean annual warming of
2.60 °C, mean minimum warming of 3.00 °C, mean summer warming of 2.20 °C and mean
autumn warming of 2.47 °C were computed. Tab. 54 expresses also the trends of
maximum, winter and spring temperatures, showing positive trends of mean temperature at
0.11, 0.62 and 0.36 °C/decade in winter, maximum and spring, respectively. Maximum
temperature trend was significant but not linear (Fig. 41), while in winter and autumn, the
trends were not linear and not significant. High decreasing and significant linear trend of
mean annual range temperature was computed in this period.
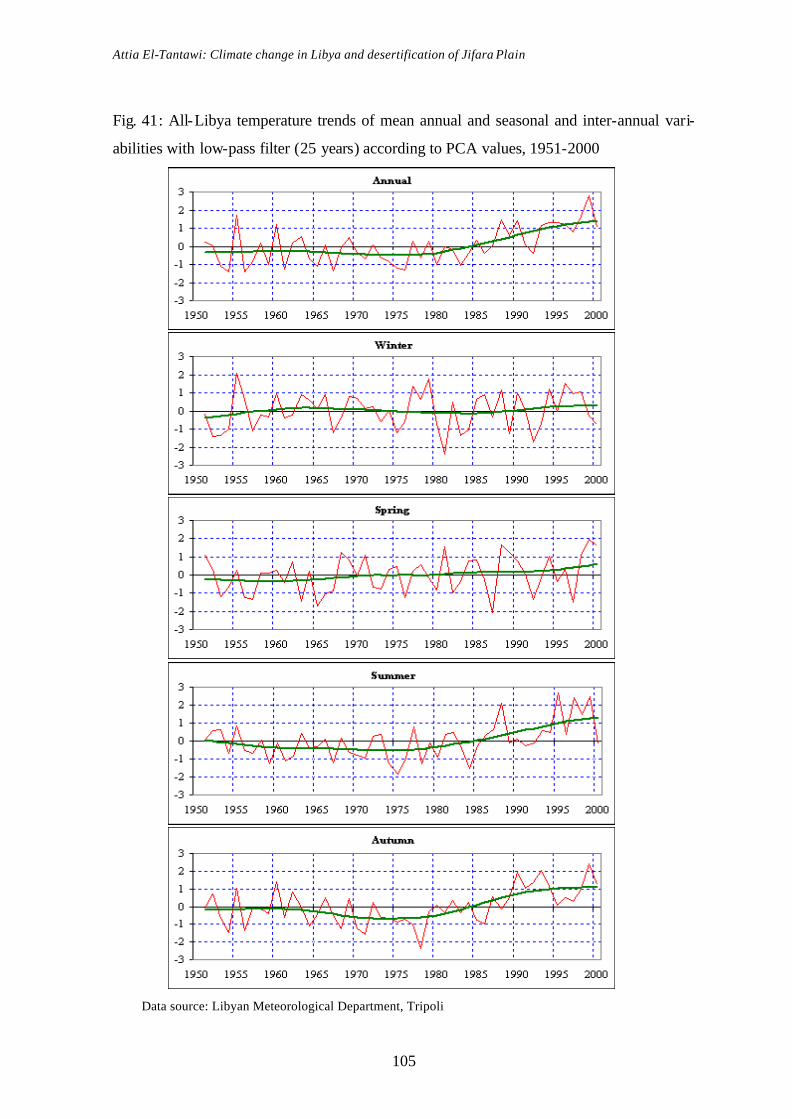
Attia El-Tantawi: Climate change in Libya and desertification of Jifara Plain
105
Fig. 41: All-Libya temperature trends of mean annual and seasonal and inter-annual vari-
abilities with low-pass filter (25 years) according to PCA values, 1951-2000
Data source: Libyan Meteorological Department, Tripoli

Attia El-Tantawi: Climate change in Libya and desertification of Jifara Plain
106
Tab. 54: Trends of annual, minimum, maximum and seasonal temperatures for all-Libya,
trend-noise ratios and Mann-Kendall test for trend (Test Z) according to PCA values,
1976-2000
Trend/decade T/noise Test Z Sig.
Annual 1.04 2.50 3.76 ***
Minimum 1.20 2.85 4.64 ***
Extreme minimum 1.28 2.94 5.13 ***
Maximum 0.62 1.54 2.31 *
Extreme maximum 0.13 0.30 0.42
Temperature range -1.25 -2.86 -4.69 ***
Winter (Dec.-Feb.) 0.11 0.22 0.3
Spring (Mar.-May) 0.36 0.87 1.28
Summer (Jun.-Aug.) 0.88 1.87 2.59 **
Autumn (Sep.-Nov.) 0.99 2.37 3.90 ***
Data source: Libyan Meteorological Department, Tripoli. Explanation: see Tab. 10
3.2.5.2 Observed precipitation changes over all-Libya
Two observations must be taken into account: the first is most study stations are
located in northern Libya, and the second is there is precipitation in Libya concentrates in
the north. Trends of annual precipitation total, the annual intensity as well as seasonal
precipitation were elaborated over all-Libya from 1951-2000 applying Principal
Component Analyses (PCA) based on precipitation data at all study stations showing
weakly positive and not significant trends of 0.03, 0.03, 0.06 and 0.07 mm/decade for
annual total, annual precipitation intensity, winter precipitation and spring precipitation,
respectively. No trend was seen for autumn precipitation. All precipitation trends were not
linear in this period (Fig. 42). Trend of annual precipitation total over all-Libya was
negative at -.20 mm/decade, not linear and not significant in the period 1951-1975.
Tab. 55: Trends of annual precipitation, intensity and seasonal precipitation over all-Libya,
trend-noise ratios and Mann-Kendall test for trend (Test Z) according to PCA values,
1951-2000
Trend/decade T/noise Test Z Sig.
Annual 0.03 0.13 0.23
Intensity 0.03 0.14 0.54
Winter (Dec.-Feb.) 0.06 0.30 0.23
Spring (Mar.-May) 0.07 0.35 1.04
Autumn (Sep.-Nov.) 0.00 0.00 -0.15
Data source: Libyan Meteorological Department, Tripoli. Explanation: see Tab. 10

Attia El-Tantawi: Climate change in Libya and desertification of Jifara Plain
107
Fig. 42: Inter-annual variabilities and trends of all-Libya for annual, annual intensity and
seasonal precipitation with low-pass filter (25 years) according to PCA values, 1951-2000
Data source: Libyan Meteorological Department, Tripoli
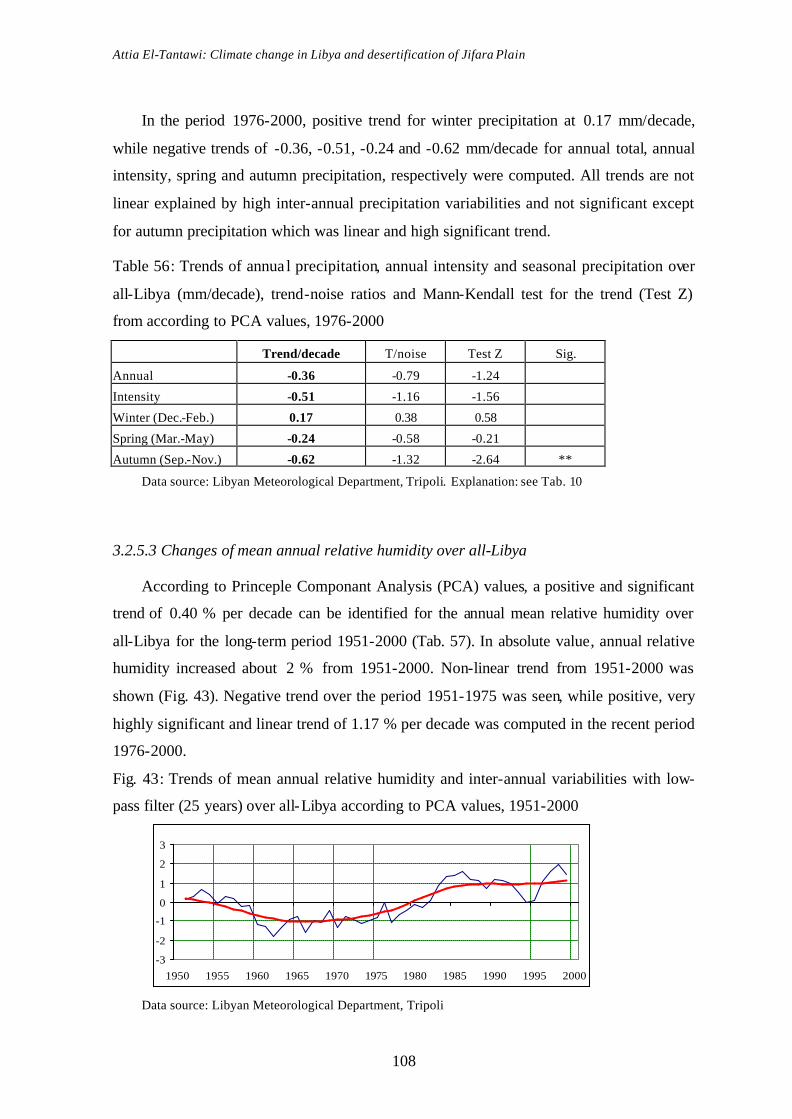
Attia El-Tantawi: Climate change in Libya and desertification of Jifara Plain
108
In the period 1976-2000, positive trend for winter precipitation at 0.17 mm/decade,
while negative trends of -0.36, -0.51, -0.24 and -0.62 mm/decade for annual total, annual
intensity, spring and autumn precipitation, respectively were computed. All trends are not
linear explained by high inter-annual precipitation variabilities and not significant except
for autumn precipitation which was linear and high significant trend.
Table 56: Trends of annua l precipitation, annual intensity and seasonal precipitation over
all-Libya (mm/decade), trend-noise ratios and Mann-Kendall test for the trend (Test Z)
from according to PCA values, 1976-2000
Trend/decade T/noise Test Z Sig.
Annual -0.36 -0.79 -1.24
Intensity -0.51 -1.16 -1.56
Winter (Dec.-Feb.) 0.17 0.38 0.58
Spring (Mar.-May) -0.24 -0.58 -0.21
Autumn (Sep.-Nov.) -0.62 -1.32 -2.64 **
Data source: Libyan Meteorological Department, Tripoli. Explanation: see Tab. 10
3.2.5.3 Changes of mean annual relative humidity over all-Libya
According to Princeple Componant Analysis (PCA) values, a positive and significant
trend of 0.40 % per decade can be identified for the annual mean relative humidity over
all-Libya for the long-term period 1951-2000 (Tab. 57). In absolute value, annual relative
humidity increased about 2 % from 1951-2000. Non-linear trend from 1951-2000 was
shown (Fig. 43). Negative trend over the period 1951-1975 was seen, while positive, very
highly significant and linear trend of 1.17 % per decade was computed in the recent period
1976-2000.
Fig. 43: Trends of mean annual relative humidity and inter-annual variabilities with low-
pass filter (25 years) over all-Libya according to PCA values, 1951-2000
Data source: Libyan Meteorological Department, Tripoli
-3
-2
-1
0
1
2
3
1950 1955 1960 1965 1970 1975 1980 1985 1990 1995 2000
%

Attia El-Tantawi: Climate change in Libya and desertification of Jifara Plain
109
Tab. 57: Trends of mean annual relative humidity for all-Libya, trend-noise ratios and
Mann-Kendall test for trend (Test Z) according to PCA values, 1951-2000 and 1976-2000
period Trend/decade T/noise Test Z Sig.
1951-2000 0.40 1.93 3.73 ***
1976-2000 1.17 2.68 4.14 ***
Data source: Libyan Meteorological Department, Tripoli. Explanation: see Tab. 10
3.2.5.4 Changes of cloud amount over all-Libya
According to Princeple Componant Analysis (PCA) values, Annual cloud amount
totals decreased over all-Libya in the period 1951-2000, the trend was very highly
significant at level 0.001. In the period 1976-2000, very highly significant negative trend (-
1.11 Oktas/decade) was computed. In absolute value, the annual cloud amount totals over
all-Libya decreased about 2.77 Oktas from 1976 to 2000. The trend for the long period was
not linear, while in the period 1976-2000, it was linear (Tab. 58 and Fig. 44).
Table 58: Trends of annual cloud amount totals for all-Libya, trend-nose ratios and Mann-
Kendall test for trend (Test Z) according to PCA values, 1951-2000 and 1976-2000
period Trend/decade T/noise Test Z Sig.
1951-2000 -0.32 -1.57 -3.68 ***
1976-2000 -1.11 -2.55 -3.75 ***
Data source: Libyan Meteorological Department, Tripoli. Explanation: see Tab. 10
Fig. 44: Trends of annual cloud amount totals for all-Libya and inter-annual variabilities
with low-pass filter (25 years) according to PCA values, 1951-2000
Data source: Libyan Meteorological Department, Tripoli
-3
-2
-1
0
1
2
3
1950 1955 1960 1965 1970 1975 1980 1985 1990 1995 2000
Oktas

Attia El-Tantawi: Climate change in Libya and desertification of Jifara Plain
110
3.3 Libya and global climate changes
3.3.1 Temperature
To compare the global warming with the recent temperature changes in Libya, mean of
global annual and seasonal temperatures have been analyzed based on global temperature
data after JONES, et al., 2001 for the periods 1951-2000, 1946-1975 and 1976-2000.
Over the period 1951-2000, mean annual temperature in all-Libya increased of 0.35
°C/decade, while the trend was 0.08 °C/decade for the globe and 0.09 °C/decade of mean
annual temperature in Africa.
For seasonal temperatures, the trends of all-Libya were 0.07, 0.18, 0.28 and 0.29
°C/decade for winter, spring, summer and autumn, respectively, while for the globe
seasonal temperature trends were 0.11, 0.10, 0.08 and 0.08 °C/decade for winter, spring,
summer and autumn, respectively. It can be followed that annual and seasonal temperature
trends over Libya were higher than the global trends.
Annual temperature trend for Libya was more than three times compared with the
global one. It can also be noticed, from the behaviors of seasonal temperature trends in
Libya, that warming mostly occurred in summer and autumn in contrast to the global
observations identifying warming mostly in winter and spring in the long period from
1951-2000. In the period 1951-1975, strongly negative trend at -0.42 was computed for
mean annual temperature over all-Libya, while weakly positive trend at 0.01 °C/decade of
the global mean annual temperature.
Mean annul temperature over Africa increased weakly at 0.01 °C/decade in the same
period. For the period 1976-2000, mean annual temperature trends accounted of 0.18, 0.23
and 1.04 °C/decade for globe, Africa and all-Libya, respectively. Notably, the annual
temperature increase in Libya corresponds with the global warming but the trend over
Libya was higher than over globe and Africa. All-Libya mean annual temperature trend
was more than five times compared with the global annual temperature trend in the more
recent period 1976-2000.
Generally, it can be said that warming over Libya was similar in magnitude to the
global increase. Globally, the 1990s was the warmest decade and 1998 the warmest year in
the last century. In Libya, it has also been observed that the 1990s was the warmest dec-
ade, while 1999 was the warmest yeas. In seasonal respect, the bulk of warming in Libya
Attia El-Tantawi: Climate change in Libya and desertification of Jifara Plain
111
occurred in summer (0.88 °/decade) and autumn (0.99 °C/decade), while winter (0.21
°C/decade) and spring (0.36 °C/decade) were the governing seasons for the global annual
temperature increase over the period 1976-2000.
3.3.2 Precipitation
Precipitation as a global mean has risen by slightly more than 2 % (STEITZ, and
CHANDLER, 1997). Large areas of equatorial Africa experienced to increase in winter
precipitation of 50-100 % over parts of eastern Africa, with decrease in summer over parts
of the Horn of Africa. However, there are some summer precipitation increases for the
Sahel region (McCARTHY, et al., 2001). For all-Libya, annual precipitation total
increased of 0.03 mm/decade over the period 1951-2000, while decrease trend of 0.36
mm/decade over the period 1976-200 was computed.

Attia El-Tantawi: Climate change in Libya and desertification of Jifara Plain
112
4. Causes of climate change
Changes in the state of the climate system can occur due to external reasons such as
variation in the sun’s output and continental drift or due to internal reason such as changes
in the concentrations of atmospheric gases, volcanic activity, and atmospheric-oceanic
oscillations. Climate changes naturally occur in all timescales due to changes in
atmospheric and ocean circulation, solar output and volcanic activities. Qualitative
comparisons suggest that natural causes produce little warming to fully explain the 20th
century warming scenario (HOUGHTON, et al., 2001). Climate forcing by changes in
solar irradiance and volcanism has likely caused fluctuations in global and hemispheric
mean temperatures. The interlinked nature of the climate system ensures that there are
feedbacks; a change in one component leads to a change in most, if not all, other
components (BUCHDAHL, 1999: 12). Climate is dominated by a balance among
numerous interacting physical processes in the ocean, the atmosphere, and the land
surface. Locally, as well as globally, climate is subject to change in all time-scales. This
variability in climate is due to various feed back mechanisms among the immeasurable
number of climatic variables. Anomalies in one part of the climate system will produce
anomalies in others (MGELY, 1984: 1).
It seems to be very difficult to put apart man-induced changes from natural ones, as
natural changes are not yet well understood (DONAIRE, 2000: 140). Reconstructions of
climate causes in the 20th century indicate that the natural climate forcing probably
increased during the first half of the 20th century and the direct effect of variations in solar
forcing over the 20th century was about 20-25 % of the change in forcing due to increases
in the well-mixed greenhouse gases (HOUGHTON, et al., 2001). The changes observed
over the last several decades are mostly due to human activities, and some changes are also
reflecting natural variability (CICERONE, et al., 2001: 1). Since 1951, the observed
warming can be explained by a combination of the changes in greenhouse gases, sulphate
aerosol particles and ozone, all of which result from human activities (ALEXANDER, et
al., 2000: 5).
This chapter discusses several natural and human causes of climate change globally
and in Libya as below.
Attia El-Tantawi: Climate change in Libya and desertification of Jifara Plain
113
4.1 Continental drift
Continental drift is one of the natural causes that affect global climatic system. The
separation of the landmasses (continents) can change the flow of ocean currents and winds,
which affected the climate at large scales. This drift of the continents continues even
currently; the Himalayas are rising by about 1 mm every year because the Indian land mass
is moving slowly but steadily towards the Asian land mass (TERI, 2004). Continental
movements affect the heat exchange on the earth, the landmasses are moving toward the
northern hemisphere, drifting apart changes their latitude which influences the amount of
solar radiation and materials escaping into the atmosphere from these activities affect the
atmospheric composition (BROOKS, 1991).
4.2 Orbital forcing
Changes in the orientation and position of the earth in relation to the sun have caused
the spectrum of sunlight reaching the earth’s surface to vary over time. These changes of
orbital variations are primarily responsible for the cycle of ice ages and inter-glacials that
have repeatedly caused changes in the global environment (ALVERSON, et al., 2001: 13).
Slow variations in the earth’s orbit affect the seasonal and latitudinal distribution of solar
radiation (HOUGHTON, et al., 1990). Changes in the tilt of the earth can also affect the
severity of the seasons; more tilt means warmer summers and colder winters; less tilt
means cooler summers and milder winters. This gradual change in the direction of the
earth's axis, expressing the so-called precession, is responsible for changes in the climate
(TERI, 2004).
4.3 Variation in solar output
Sun is the main source of energy for the earth's climate system. Thus, any change in
solar output will result in changes of insolation and generation of heat energy which drives
the climate system. Changes in the output of energy from the sun, such as the variability
over the 11-year solar cycle, may also change the ratio between the energy absorbed by the
earth and the energy emitted causing the radiative forcing on climate (HOUGHTON, et al.,
1990). Measurements made during the early 1980s showed a decrease of 0.1 % in the total
amount of solar energy reaching the earth over just an 18-month period. If this trend is to

Attia El-Tantawi: Climate change in Libya and desertification of Jifara Plain
114
extend over several decades, it could influence global climate. Numerical climatic models
predict that a change in solar output of only 1 %/century would alter the earth's average
temperature by 0.5-1.0 °C (PIDWIRNY, 2004). A 1 % change of solar constant result in a
change in equilibrium temperature of 0.6 °C, while a 2 % increase causes up to a 10 %
increase in the rate of precipitation, and of evaporation as well. Change in precipitation
rate resulting from changes in the solar constant is not uniform in all latitudes, but it is
distinctly small in low-latitudes and relatively large in mid- and high- latitudes (LOCK-
WOOD, J.G. 1977: 105).
Solar variability remains a controversial mechanism of climate change; the best
known solar cycle is the variation in the sunspots number over an 11-year period. Sunspot
cycles are thought to be related to solar magnetic variations, and a double magnetic cycle
(approximately 22 years) can also be identified. It is of course possible that the
approximate 11-year cycle identified in many climate records is caused by some unknown
internal oscillation and not by external solar forcing (BUCHDAHL, 1999: 16). Sunspots
appear as dark spots on the surface of the sun (Fig. 45). They have a lower temperature
than the surrounding photosphere. Sunspots radiate less energy than the undisturbed
photosphere of the sun and are therefore visible as dark spots.
Fig. 45: Photograph of sunspots taken on 28 October 1991, 12:06 UT, with an 8 inch
refractor at focus
Source: PAECH W, 1991: Institut für Erdmessung, Astronomische Station, Universität Hannover
http://www-gik.bau-verm.uni-karlsruhe.de/~fags/sidc003.htm. Accessed 05.01.2004
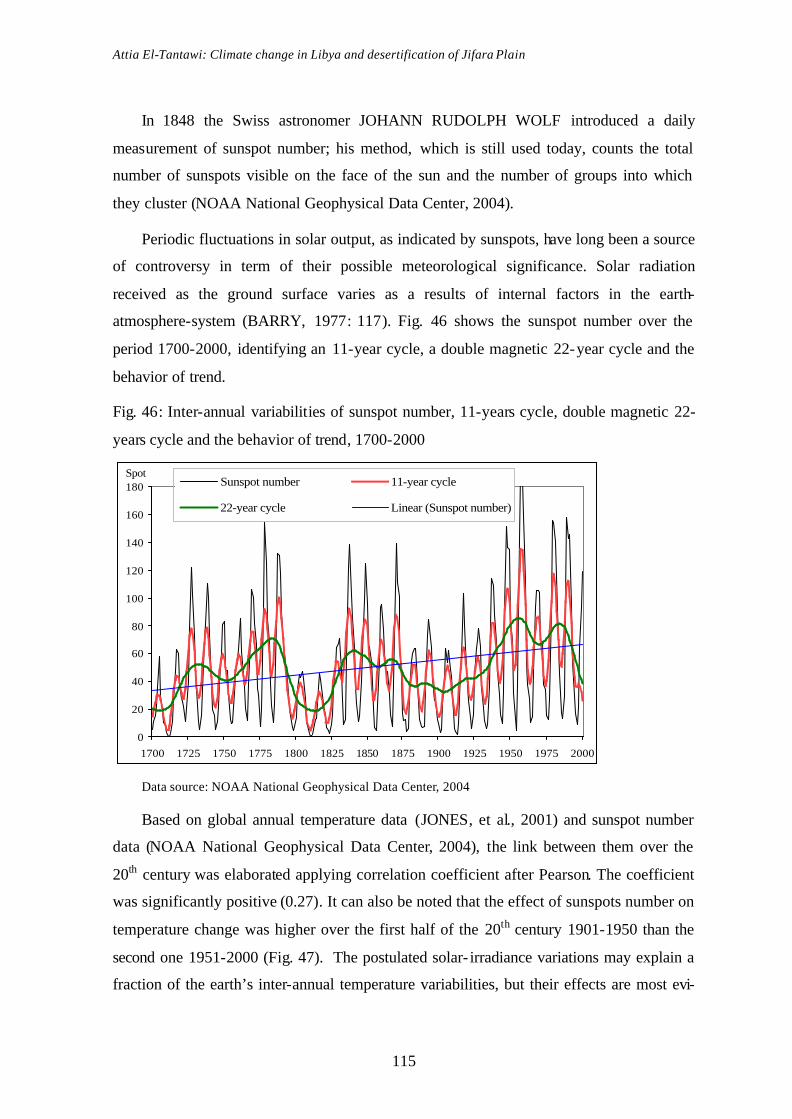
Attia El-Tantawi: Climate change in Libya and desertification of Jifara Plain
115
In 1848 the Swiss astronomer JOHANN RUDOLPH WOLF introduced a daily
measurement of sunspot number; his method, which is still used today, counts the total
number of sunspots visible on the face of the sun and the number of groups into which
they cluster (NOAA National Geophysical Data Center, 2004).
Periodic fluctuations in solar output, as indicated by sunspots, have long been a source
of controversy in term of their possible meteorological significance. Solar radiation
received as the ground surface varies as a results of internal factors in the earth-
atmosphere-system (BARRY, 1977: 117). Fig. 46 shows the sunspot number over the
period 1700-2000, identifying an 11-year cycle, a double magnetic 22-year cycle and the
behavior of trend.
Fig. 46: Inter-annual variabilities of sunspot number, 11-years cycle, double magnetic 22-
years cycle and the behavior of trend, 1700-2000
0
20
40
60
80
100
120
140
160
180
1700 1725 1750 1775 1800 1825 1850 1875 1900 1925 1950 1975 2000
SpotSunspot number 11-year cycle
22-year cycle Linear (Sunspot number)
Data source: NOAA National Geophysical Data Center, 2004
Based on global annual temperature data (JONES, et al., 2001) and sunspot number
data (NOAA National Geophysical Data Center, 2004), the link between them over the
20th century was elaborated applying correlation coefficient after Pearson. The coefficient
was significantly positive (0.27). It can also be noted that the effect of sunspots number on
temperature change was higher over the first half of the 20th century 1901-1950 than the
second one 1951-2000 (Fig. 47). The postulated solar- irradiance variations may explain a
fraction of the earth’s inter-annual temperature variabilities, but their effects are most evi-

Attia El-Tantawi: Climate change in Libya and desertification of Jifara Plain
116
dently long-term temperature trends on hemispheric and global special scales (HOYT and
SCHATTEN, 1997: 179).
Fig. 47: Tele-connection between global mean annual temperature and sunspot number
over the 20th century
0
20
40
60
80
100
120
140
160
180
200
1900 1910 1920 1930 1940 1950 1960 1970 1980 1990 2000
°CSpot
-0.6
-0.4
-0.2
0
0.2
0.4
0.6
0.8
Sunspots number
Global annual temperature
Data source: JONES , et al. 2001 and NOAA National Geophysical Data Center, 2004
For Libya, correlation coefficients (after Pearson) between sunspot number and
climate parameters (temperature and precipitation) were computed at three stations (El-
Kufra, Shahat and Tripoli city) as well as for all-Libya, from 1951-2000, showing no
significant correlations between sunspots number and mean annual temperatures.
Tab. 59: Correlation coefficients (after Pearson) between sunspot number and mean annual
temperature in Libya, 1951-2000
El-Kufra Shahat Tripoli city All-Libya
Correlation Sig. Correlation Sig. Correlation Sig. Correlation Sig.
Annual 0.03 0.81 -0.05 0.74 -0.10 0.47 0.03 0.82
Summer (JJA) 0.00 0.98 -0.10 0.51 -0.23 0.10 -0.12 0.39 Winter (DJF) -0.13 0.37 -0.25 0.08 -0.05 0.75 -0.12 0.39
Data source: Libyan Meteorological Department and NOAA National Geophysical Data Center, 2004
In seasonal terms, correlation coefficients were weakly negative for winter and sum-
mer temperatures except at El-Kufra in summer. For mean annual temperature, weakly

Attia El-Tantawi: Climate change in Libya and desertification of Jifara Plain
117
negative correlation coefficients were observed at Shahat and Tripoli city, and a weakly
positive coefficient at El-Kufra and for all-Libya (Tab. 59).
It can be followed that there is no effect of solar variations on climate change over
Libya in the second half of the 20th century. This observation corresponds with the all
reconstructions which suggest a rise in solar forcing15 during the early decades of the 20th
century with little change on inter-decadal time-scales in the second half (HOUGHTON, et
al. 2001). The present short-term changes in climate cannot be caused by solar variability,
but there is evidence for long-term solar variability (LOCKWOOD, 1977: 109).
4.4 Volcanic activities
For many years, the connection between large explosive volcanic eruptions and short-
term climate change has been noticed; when a volcano erupts, large volumes of sulphur
dioxide (SO2), water vapour, dust, and ash are emitted into the atmosphere. These gases
and dust particles partially block sun insolation leading to cooling and changing
atmospheric circulation patterns.
Fig. 48: A huge cloud of volcanic ash and gas above Mt Pinatubo, on 12 June 1991, after
the volcano eruption
Source: U.S. Geological Survey Fact Sheet 113-97.
15 Climate forcing can be identified as an imposed perturbation of earth’s energy balance ((CICERONE, et al., 2001: 6)
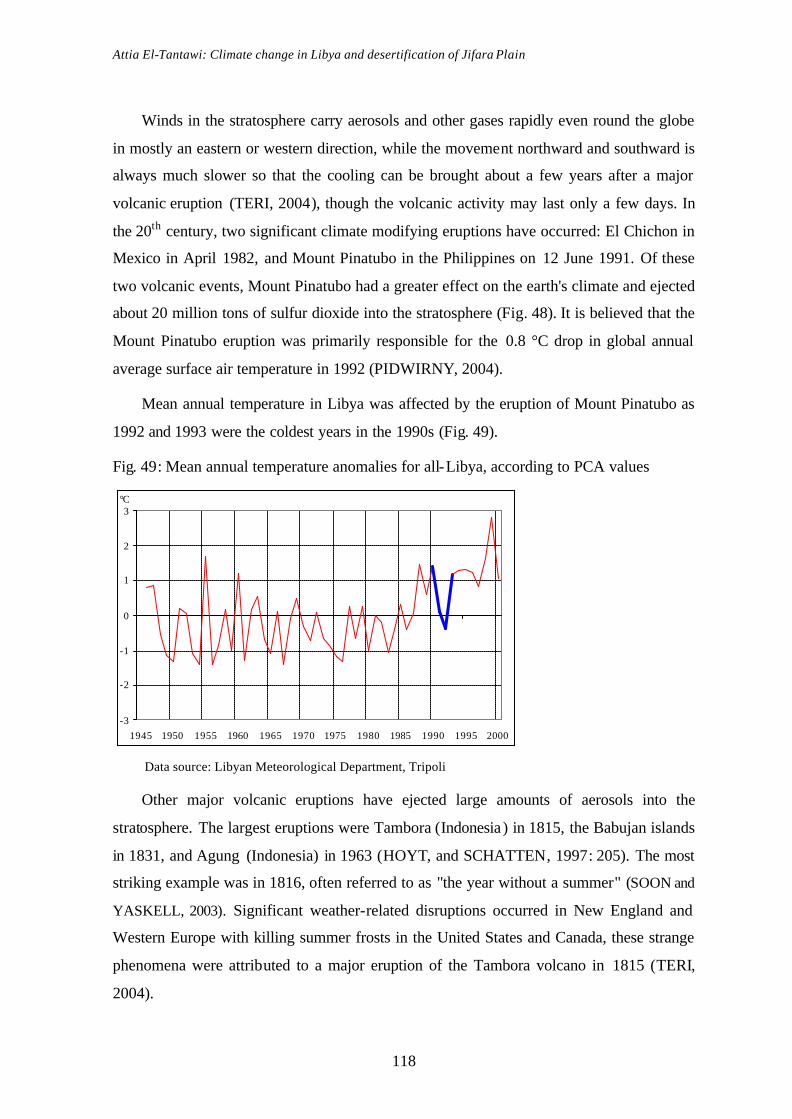
Attia El-Tantawi: Climate change in Libya and desertification of Jifara Plain
118
Winds in the stratosphere carry aerosols and other gases rapidly even round the globe
in mostly an eastern or western direction, while the movement northward and southward is
always much slower so that the cooling can be brought about a few years after a major
volcanic eruption (TERI, 2004), though the volcanic activity may last only a few days. In
the 20th century, two significant climate modifying eruptions have occurred: El Chichon in
Mexico in April 1982, and Mount Pinatubo in the Philippines on 12 June 1991. Of these
two volcanic events, Mount Pinatubo had a greater effect on the earth's climate and ejected
about 20 million tons of sulfur dioxide into the stratosphere (Fig. 48). It is believed that the
Mount Pinatubo eruption was primarily responsible for the 0.8 °C drop in global annual
average surface air temperature in 1992 (PIDWIRNY, 2004).
Mean annual temperature in Libya was affected by the eruption of Mount Pinatubo as
1992 and 1993 were the coldest years in the 1990s (Fig. 49).
Fig. 49: Mean annual temperature anomalies for all-Libya, according to PCA values
-3
-2
-1
0
1
2
3
1945 1950 1955 1960 1965 1970 1975 1980 1985 1990 1995 2000
°C
Data source: Libyan Meteorological Department, Tripoli
Other major volcanic eruptions have ejected large amounts of aerosols into the
stratosphere. The largest eruptions were Tambora (Indonesia) in 1815, the Babujan islands
in 1831, and Agung (Indonesia) in 1963 (HOYT, and SCHATTEN, 1997: 205). The most
striking example was in 1816, often referred to as "the year without a summer" (SOON and
YASKELL, 2003). Significant weather-related disruptions occurred in New England and
Western Europe with killing summer frosts in the United States and Canada, these strange
phenomena were attributed to a major eruption of the Tambora volcano in 1815 (TERI,
2004).
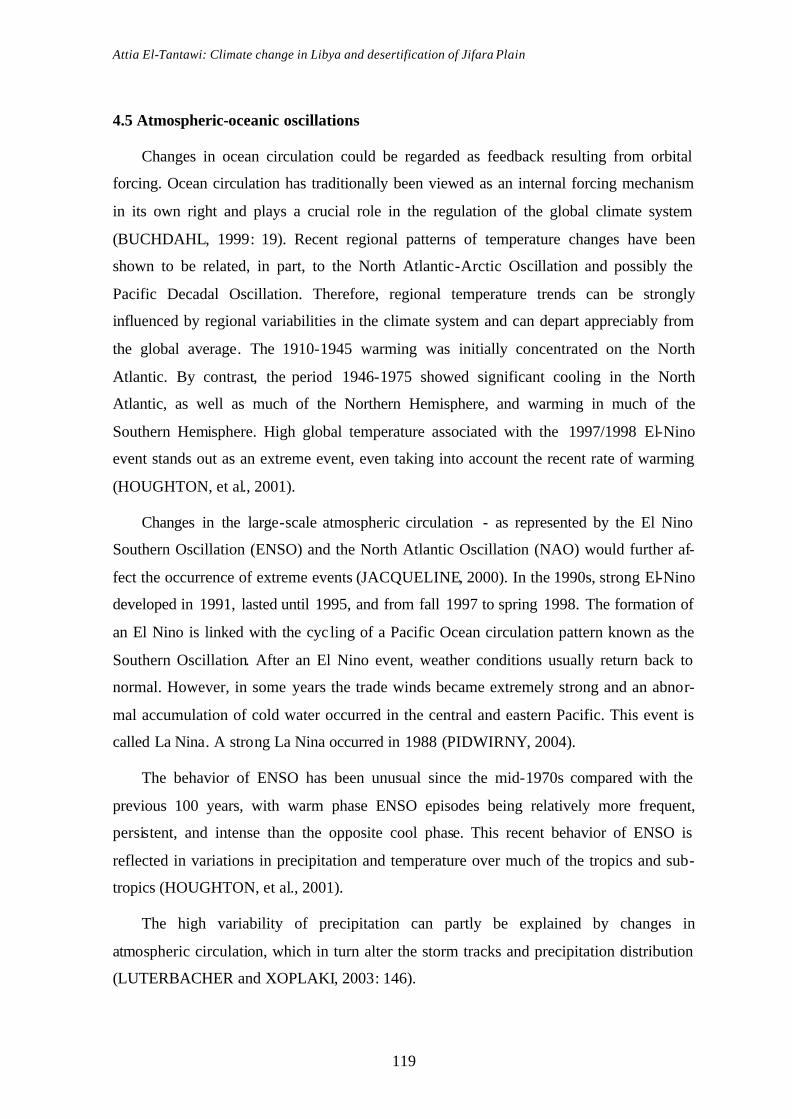
Attia El-Tantawi: Climate change in Libya and desertification of Jifara Plain
119
4.5 Atmospheric-oceanic oscillations
Changes in ocean circulation could be regarded as feedback resulting from orbital
forcing. Ocean circulation has traditionally been viewed as an internal forcing mechanism
in its own right and plays a crucial role in the regulation of the global climate system
(BUCHDAHL, 1999: 19). Recent regional patterns of temperature changes have been
shown to be related, in part, to the North Atlantic-Arctic Oscillation and possibly the
Pacific Decadal Oscillation. Therefore, regional temperature trends can be strongly
influenced by regional variabilities in the climate system and can depart appreciably from
the global average. The 1910-1945 warming was initially concentrated on the North
Atlantic. By contrast, the period 1946-1975 showed significant cooling in the North
Atlantic, as well as much of the Northern Hemisphere, and warming in much of the
Southern Hemisphere. High global temperature associated with the 1997/1998 El-Nino
event stands out as an extreme event, even taking into account the recent rate of warming
(HOUGHTON, et al., 2001).
Changes in the large-scale atmospheric circulation - as represented by the El Nino
Southern Oscillation (ENSO) and the North Atlantic Oscillation (NAO) would further af-
fect the occurrence of extreme events (JACQUELINE, 2000). In the 1990s, strong El-Nino
developed in 1991, lasted until 1995, and from fall 1997 to spring 1998. The formation of
an El Nino is linked with the cyc ling of a Pacific Ocean circulation pattern known as the
Southern Oscillation. After an El Nino event, weather conditions usually return back to
normal. However, in some years the trade winds became extremely strong and an abnor-
mal accumulation of cold water occurred in the central and eastern Pacific. This event is
called La Nina. A strong La Nina occurred in 1988 (PIDWIRNY, 2004).
The behavior of ENSO has been unusual since the mid-1970s compared with the
previous 100 years, with warm phase ENSO episodes being relatively more frequent,
persistent, and intense than the opposite cool phase. This recent behavior of ENSO is
reflected in variations in precipitation and temperature over much of the tropics and sub-
tropics (HOUGHTON, et al., 2001).
The high variability of precipitation can partly be explained by changes in
atmospheric circulation, which in turn alter the storm tracks and precipitation distribution
(LUTERBACHER and XOPLAKI, 2003: 146).
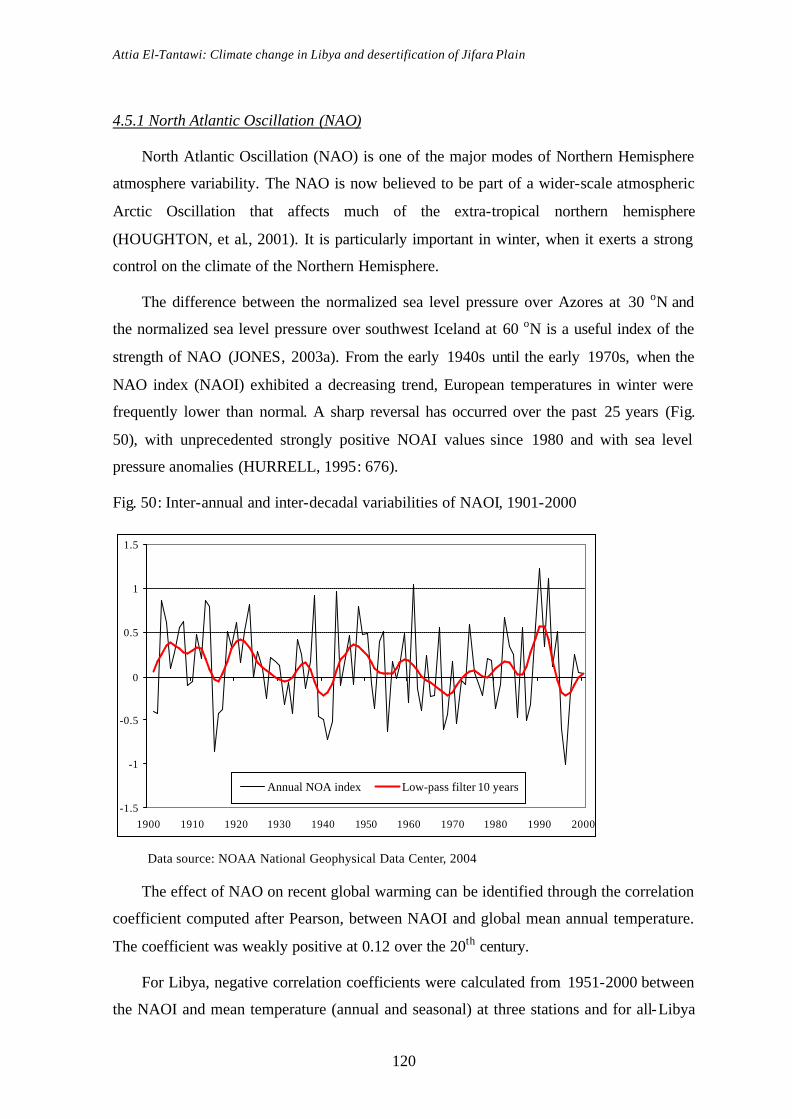
Attia El-Tantawi: Climate change in Libya and desertification of Jifara Plain
120
4.5.1 North Atlantic Oscillation (NAO)
North Atlantic Oscillation (NAO) is one of the major modes of Northern Hemisphere
atmosphere variability. The NAO is now believed to be part of a wider-scale atmospheric
Arctic Oscillation that affects much of the extra-tropical northern hemisphere
(HOUGHTON, et al., 2001). It is particularly important in winter, when it exerts a strong
control on the climate of the Northern Hemisphere.
The difference between the normalized sea level pressure over Azores at 30 oN and
the normalized sea level pressure over southwest Iceland at 60 oN is a useful index of the
strength of NAO (JONES, 2003a). From the early 1940s until the early 1970s, when the
NAO index (NAOI) exhibited a decreasing trend, European temperatures in winter were
frequently lower than normal. A sharp reversal has occurred over the past 25 years (Fig.
50), with unprecedented strongly positive NOAI values since 1980 and with sea level
pressure anomalies (HURRELL, 1995: 676).
Fig. 50: Inter-annual and inter-decadal variabilities of NAOI, 1901-2000
-1.5
-1
-0.5
0
0.5
1
1.5
1900 1910 1920 1930 1940 1950 1960 1970 1980 1990 2000
Annual NOA index Low-pass filter 10 years
Data source: NOAA National Geophysical Data Center, 2004
The effect of NAO on recent global warming can be identified through the correlation
coefficient computed after Pearson, between NAOI and global mean annual temperature.
The coefficient was weakly positive at 0.12 over the 20th century.
For Libya, negative correlation coefficients were calculated from 1951-2000 between
the NAOI and mean temperature (annual and seasonal) at three stations and for all-Libya
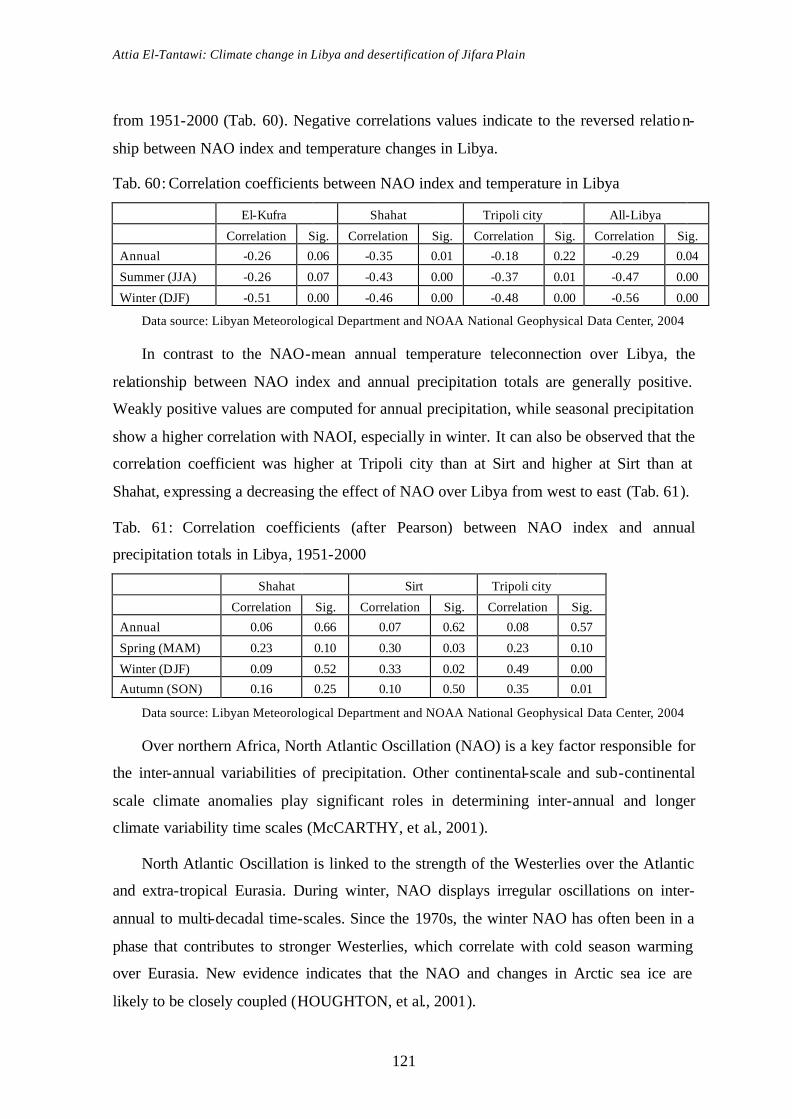
Attia El-Tantawi: Climate change in Libya and desertification of Jifara Plain
121
from 1951-2000 (Tab. 60). Negative correlations values indicate to the reversed relation-
ship between NAO index and temperature changes in Libya.
Tab. 60: Correlation coefficients between NAO index and temperature in Libya
El-Kufra Shahat Tripoli city All-Libya
Correlation Sig. Correlation Sig. Correlation Sig. Correlation Sig.
Annual -0.26 0.06 -0.35 0.01 -0.18 0.22 -0.29 0.04
Summer (JJA) -0.26 0.07 -0.43 0.00 -0.37 0.01 -0.47 0.00
Winter (DJF) -0.51 0.00 -0.46 0.00 -0.48 0.00 -0.56 0.00
Data source: Libyan Meteorological Department and NOAA National Geophysical Data Center, 2004
In contrast to the NAO-mean annual temperature teleconnection over Libya, the
relationship between NAO index and annual precipitation totals are generally positive.
Weakly positive values are computed for annual precipitation, while seasonal precipitation
show a higher correlation with NAOI, especially in winter. It can also be observed that the
correlation coefficient was higher at Tripoli city than at Sirt and higher at Sirt than at
Shahat, expressing a decreasing the effect of NAO over Libya from west to east (Tab. 61).
Tab. 61: Correlation coefficients (after Pearson) between NAO index and annual
precipitation totals in Libya, 1951-2000
Shahat Sirt Tripoli city
Correlation Sig. Correlation Sig. Correlation Sig.
Annual 0.06 0.66 0.07 0.62 0.08 0.57
Spring (MAM) 0.23 0.10 0.30 0.03 0.23 0.10
Winter (DJF) 0.09 0.52 0.33 0.02 0.49 0.00
Autumn (SON) 0.16 0.25 0.10 0.50 0.35 0.01
Data source: Libyan Meteorological Department and NOAA National Geophysical Data Center, 2004
Over northern Africa, North Atlantic Oscillation (NAO) is a key factor responsible for
the inter-annual variabilities of precipitation. Other continental-scale and sub-continental
scale climate anomalies play significant roles in determining inter-annual and longer
climate variability time scales (McCARTHY, et al., 2001).
North Atlantic Oscillation is linked to the strength of the Westerlies over the Atlantic
and extra-tropical Eurasia. During winter, NAO displays irregular oscillations on inter-
annual to multi-decadal time-scales. Since the 1970s, the winter NAO has often been in a
phase that contributes to stronger Westerlies, which correlate with cold season warming
over Eurasia. New evidence indicates that the NAO and changes in Arctic sea ice are
likely to be closely coupled (HOUGHTON, et al., 2001).

Attia El-Tantawi: Climate change in Libya and desertification of Jifara Plain
122
4.5.2 El-Nino Southern Oscillation (ENSO)
El-Nino phenomenon, through interactions between the ocean and the atmosphere, is
now widely recognized as the recurring cause of major natural perturbations to the climate
system (KINMONTH, 1999: 257). The most dramatic and best defined pattern of inter-
annual variabilities are the global set of climatic anomalies referred to as El-Nino Southern
Oscillation (ENSO), an acronym derived from its oceanographic component, El-Nino, and
its atmospheric component, the Southern Oscillation. The 1982/83 ENSO event was the
most extreme in the 20th century. On the average, an ENSO event occurs about every four
years, but the cycle is highly irregular; there are only two years between events, sometimes
almost a decade (CANE, 1997). There is recent evidence that the teleconnection of ENSO
has extended its reach into parts of the Mediterranean region in recent decades
(LUTERBACHER and XOPLAKI, 2003: 134).
Fig. 51: Tele-connection between SOI and global mean annual temperatures, 1901-2000
-2
-1
0
1
2
1900 1910 1920 1930 1940 1950 1960 1970 1980 1990 2000
Inter-annual SOI Low-pass 10 year Global annual temperature
Data source: JONES, et a l. 2001 and NOAA National Geophysical Data Center, 2004
Southern Oscillation Index (SOI) is defined as the normalized pressure difference
between Tahiti and Darwin (JONES, 2003b). The correlation coefficient (after Pearson)
between the SOI and global annual temperature was weakly negative (-0.25) over the 20th
century (Fig. 51).
In Libya, correlation between mean annual temperatures and the SOI were negative at
El-Kufra, Tripoli city and for all-Libya since the early 1950s, while at Shahat the correla-
tion was very weakly positive. From 1950-2000, negative correlations were calculated

Attia El-Tantawi: Climate change in Libya and desertification of Jifara Plain
123
between the SOI and summer temperatures in contrast to winter temperatures which were
computed a positive correlation to SOI at all three stations and for all-Libya (Tab. 62). No
significant correlations between SOI and temperatures in Libya indicate to the weakly
effect of Southern Oscillation.
Tab. 62: Correlation coefficients (after Pearson) between SOI and mean annual and
seasonal temperatures in Libya, 1950-2000
El-Kufra Shahat Tripoli city All-Libya
Correlation Sig. Correlation Sig. Correlation Sig. Correlation Sig.
Annual -0.18 0.19 0.06 0.66 -0.08 0.58 -0.08 0.59
Summer (JJA) -0.17 0.17 -0.01 0.95 -0.18 0.21 -0.14 0.31
Winter (DJF) 0.10 0.50 0.18 0.21 0.03 0.83 0.11 0.46
Data source: Libyan Meteorological Department and NOAA National Geophysical Data Center, 2004
In general, weakly links occur between SOI and precipitation over Libya (Tab.63).
Weakly negative correlations for annual and seasonal precipitation were observed at
Shahat. Negative links were computed for annual, spring and autumn precipitation, while a
weakly positive correlation was for winter at Tripoli city. Negative correlations were
noticed at Sirt for spring and winter precipitation and no correlations for annual and
autumn.
Tab. 63: Correlation coefficients (after Pearson) between SOI and annual and seasonal
precipitation totals in Libya, 1950-2000
Shahat Sirt Tripoli city
Correlation Sig. Correlation Sig. Correlation Sig.
Annual -0.12 0.39 0.03 0.86 -0.04 0.79
Spring (SON) -0.12 0.39 -0.18 0.21 -0.10 0.49
Winter (DJF) -0.15 0.30 -0.11 0.43 0.15 0.31
Autumn (MAM) -0.02 0.87 0.02 0.90 -0.20 0.17
Data source: Libyan Meteorological Department and NOAA National Geophysical Data Center, 2004
4.6 Cloud cover
The net effect of cloud cover on the surface radiative balance is still uncertain and
there are no simple relationships between cloudiness and surface temperature (HARVEY,
1980: 519). The interaction of cloud amounts with radiation alters the surface–atmosphere
heating distribution, which in turn drives atmospheric motion that is responsible for the
redistribution of clouds (SUN, et al. 2000: 4341). With greater global cloud coverage,

Attia El-Tantawi: Climate change in Libya and desertification of Jifara Plain
124
more incident radiation is reflected reducing radiative forcing and leading to a lowering of
the global temperature (BUCHDAHL, 1999: 21).
Effects of cloud amounts effects on climate changes in Libya are very weak.
Correlation coefficients (after Pearson) between cloud cover amount and the mean annual,
minimum and maximum temperatures were elaborated at two stations (Benina and Tripoli
city) from 1946-2000 (Tab. 64).
Tab. 64: Correlation coefficients (after Pearson) between cloud amounts and temperatures
at Benina and Tripoli city, 1950-2000
Station Benina Tripoli city
Correlation Sig. Correlation Sig.
Annual -0.07 0.62 -0.26 0.06
Minimum 0.30 0.03 -0.14 0.32
Maximum -0.53 0.00 -0.40 0.00
Data source: Libya Meteorological Department, Tripoli
The correla tion coefficients between cloud cover amounts and mean minimum
temperature were positive at Benina and weakly negative at Tripoli city, while it was
negative for annual and maximum temperatures at both stations. It can also be seen that the
increasing minimum temperature trend in northeastern Libya may be partly caused by the
increase of cloud cover amount.
This simple picture of the cloud feedback is, however, complicated by the fact that
clouds also serve to trap terrestrial infrared radiation, augmenting the greenhouse effect,
and thus act as a positive feedback, also, to increased radiative forcing. High level clouds
are expected to have a net positive feedback, with the effect of long-wave radiation
absorption outweighing albedo effects. Clouds at high altitudes exist in colder air and tend
to emit less radiation generating a stronger greenhouse effect. Low level clouds, on the
other hand, probably have a net negative feedback effect (BUCHDAHL, 1999: 21).
4.7 Variations in atmospheric composition
Comparisons of records of solar radiation changes with volcanic eruptions, as well as
modeling studies, show that these factors were responsible for most of temperature
changes prior to the 20th century. However, the rate of temperature change over the last
century cannot be explained without taking into account the increase in atmospheric
Attia El-Tantawi: Climate change in Libya and desertification of Jifara Plain
125
greenhouse gases due to human activities (ALVERSON, et al., 2001: 16). The changing
composition of the atmosphere, including greenhouse gases and aerosol content, is a major
internal forcing mechanism of climate change.
The greenhouse effect is a natural phenomenon, without it the earth’s temperature
would be about 33 °C colder than currently at around 15 °C as a global mean. The
problem, as first identified by ARRHENIUS in 1896, is that human activities, like driving
cars, burning coal to heat and run factories, chopping down forests, and raising cattle have
significantly increased the atmospheric concentrations of the greenhouse gases, namely
carbon dioxide, methane and nitrous oxide (ROACH, 1997). An increase of CO2 and other
gases which allow sunlight to reach the earth’s surface but prevent some of the infrared,
respect heat-radiation given off by the earth from escaping into space.
The greenhouse gases H2O, CO2, O3, N2O, CH4 and others affect directly on climate.
H2O is adjusted by the water circulation over evaporation and precipitation and is
concentrated in the troposphere. CO2, CH4 and N2O increased from 280, 0.80 and 0.28
ppm, respectively, before beginning of the industrialization until today 370, 1.75 and 0.32
ppm, respectively (FABIAN, 2002: 23). Recent global warming may result from
combination of greenhouse gases and increase in cloud cover amounts resulting mainly
from CO2 concentration. Since 1958, accurate measurements of the increasing CO2
concentrations in the atmosphere have been made showing a fairly regular annual rate of
increase at about 4 %, a doubling of CO2 would lead to an average surface warming of
about 2-4 °C with greater warming occurring in winter by the latter half of the 21st century
(PITTOCK, et al. 1988: 306).
Monitoring of atmospheric concentrations shows that CO2, as well as other green-
house gases, increased during the past few decades (NOVELLI, et al., 1995: 32). Changes
of greenhouse gas contents in the atmosphere can occur as a result of both natural and an-
thropogenic factors. Natural changes occur in numerous ways, most often in response to
other primary forcing factors, while anthropogenic changes occur through the burning of
fossil fuels, forest clearing and other industrial processes. Atmospheric concentrations of
the principal anthropogenic greenhouse gases have increased significantly from the 18th
century and have largely increased over the 20th century as a result of population growth,
economic expansion, landuse pattern changes, deforestation, land clearing, agriculture, and
the ever increasing consumption of fossil fuels (Tab. 65). The consumption of fossil fuels
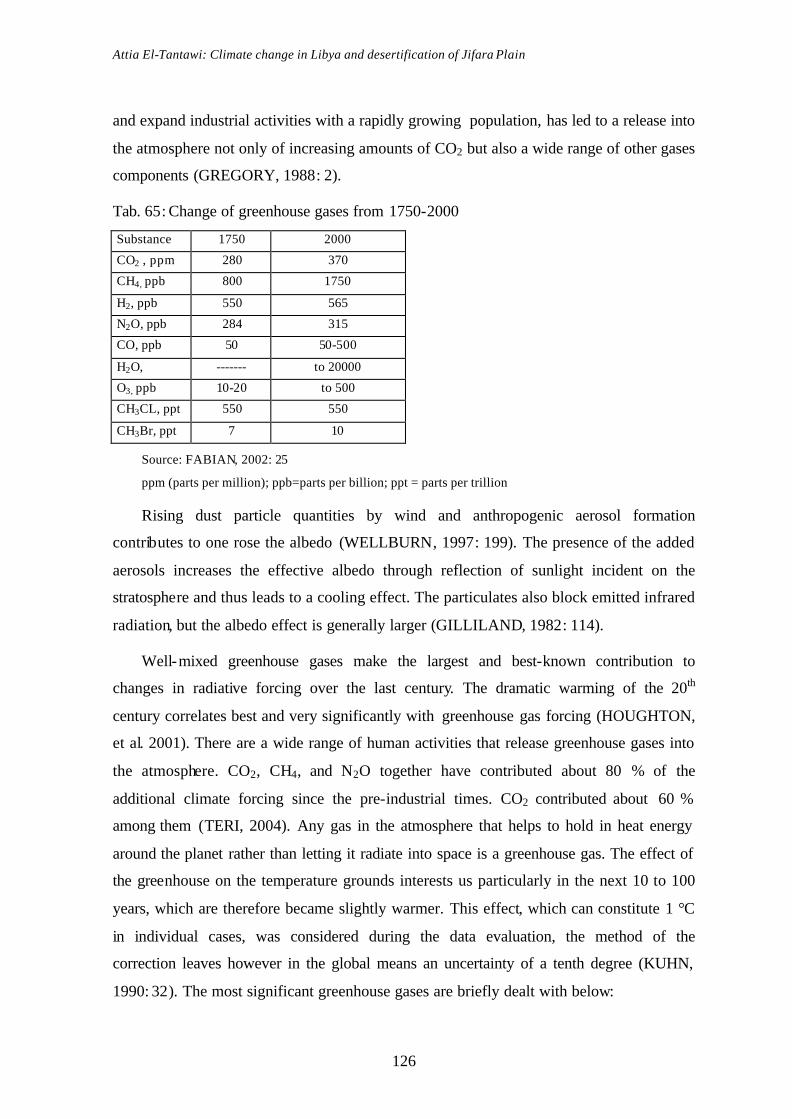
Attia El-Tantawi: Climate change in Libya and desertification of Jifara Plain
126
and expand industrial activities with a rapidly growing population, has led to a release into
the atmosphere not only of increasing amounts of CO2 but also a wide range of other gases
components (GREGORY, 1988: 2).
Tab. 65: Change of greenhouse gases from 1750-2000
Substance 1750 2000
CO2 , ppm 280 370
CH4, ppb 800 1750
H2, ppb 550 565
N2O, ppb 284 315
CO, ppb 50 50-500
H2O, ------- to 20000
O3, ppb 10-20 to 500
CH3CL, ppt 550 550
CH3Br, ppt 7 10
Source: FABIAN, 2002: 25
ppm (parts per million); ppb=parts per billion; ppt = parts per trillion
Rising dust particle quantities by wind and anthropogenic aerosol formation
contributes to one rose the albedo (WELLBURN, 1997: 199). The presence of the added
aerosols increases the effective albedo through reflection of sunlight incident on the
stratosphere and thus leads to a cooling effect. The particulates also block emitted infrared
radiation, but the albedo effect is generally larger (GILLILAND, 1982: 114).
Well-mixed greenhouse gases make the largest and best-known contribution to
changes in radiative forcing over the last century. The dramatic warming of the 20th
century correlates best and very significantly with greenhouse gas forcing (HOUGHTON,
et al. 2001). There are a wide range of human activities that release greenhouse gases into
the atmosphere. CO2, CH4, and N2O together have contributed about 80 % of the
additional climate forcing since the pre-industrial times. CO2 contributed about 60 %
among them (TERI, 2004). Any gas in the atmosphere that helps to hold in heat energy
around the planet rather than letting it radiate into space is a greenhouse gas. The effect of
the greenhouse on the temperature grounds interests us particularly in the next 10 to 100
years, which are therefore became slightly warmer. This effect, which can constitute 1 °C
in individual cases, was considered during the data evaluation, the method of the
correction leaves however in the global means an uncertainty of a tenth degree (KUHN,
1990: 32). The most significant greenhouse gases are briefly dealt with below:
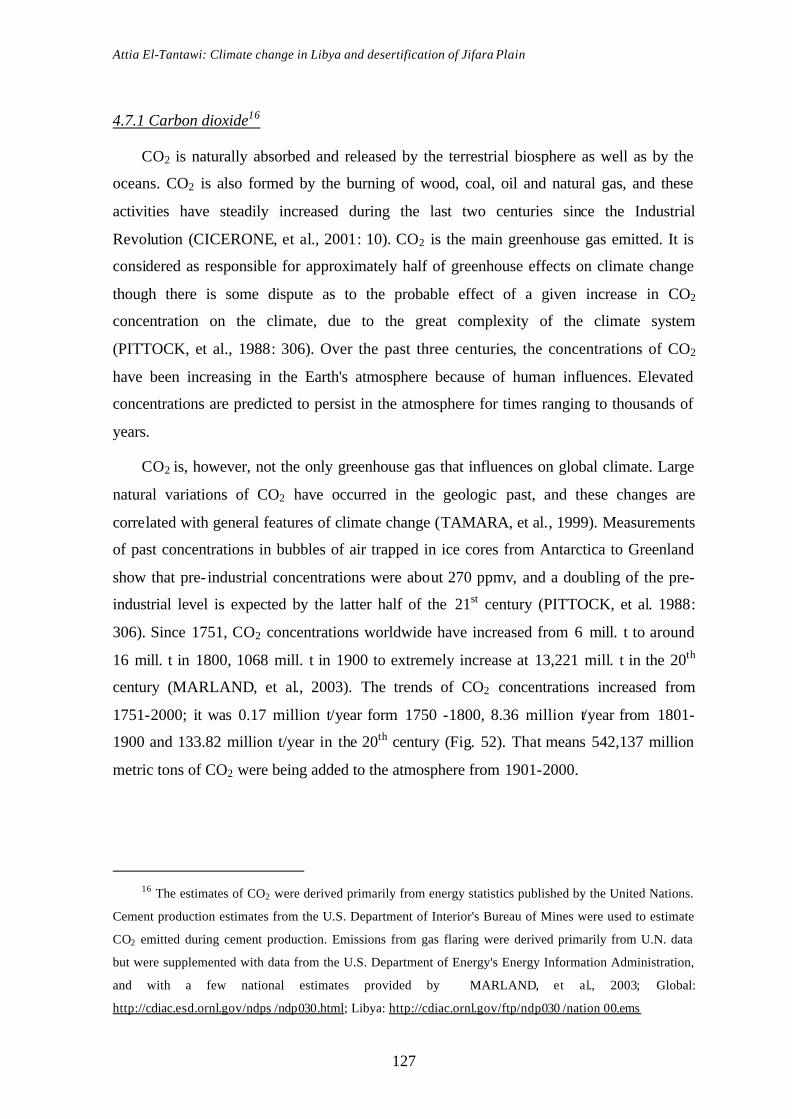
Attia El-Tantawi: Climate change in Libya and desertification of Jifara Plain
127
4.7.1 Carbon dioxide16
CO2 is naturally absorbed and released by the terrestrial biosphere as well as by the
oceans. CO2 is also formed by the burning of wood, coal, oil and natural gas, and these
activities have steadily increased during the last two centuries since the Industrial
Revolution (CICERONE, et al., 2001: 10). CO2 is the main greenhouse gas emitted. It is
considered as responsible for approximately half of greenhouse effects on climate change
though there is some dispute as to the probable effect of a given increase in CO2
concentration on the climate, due to the great complexity of the climate system
(PITTOCK, et al., 1988: 306). Over the past three centuries, the concentrations of CO2
have been increasing in the Earth's atmosphere because of human influences. Elevated
concentrations are predicted to persist in the atmosphere for times ranging to thousands of
years.
CO2 is, however, not the only greenhouse gas that influences on global climate. Large
natural variations of CO2 have occurred in the geologic past, and these changes are
correlated with general features of climate change (TAMARA, et al., 1999). Measurements
of past concentrations in bubbles of air trapped in ice cores from Antarctica to Greenland
show that pre- industrial concentrations were about 270 ppmv, and a doubling of the pre-
industrial level is expected by the latter half of the 21st century (PITTOCK, et al. 1988:
306). Since 1751, CO2 concentrations worldwide have increased from 6 mill. t to around
16 mill. t in 1800, 1068 mill. t in 1900 to extremely increase at 13,221 mill. t in the 20th
century (MARLAND, et al., 2003). The trends of CO2 concentrations increased from
1751-2000; it was 0.17 million t/year form 1750 -1800, 8.36 million t/year from 1801-
1900 and 133.82 million t/year in the 20th century (Fig. 52). That means 542,137 million
metric tons of CO2 were being added to the atmosphere from 1901-2000.
16 The estimates of CO2 were derived primarily from energy statistics published by the United Nations.
Cement production estimates from the U.S. Department of Interior's Bureau of Mines were used to estimate
CO2 emitted during cement production. Emissions from gas flaring were derived primarily from U.N. data
but were supplemented with data from the U.S. Department of Energy's Energy Information Administration,
and with a few national estimates provided by MARLAND, et al., 2003; Global:
http://cdiac.esd.ornl.gov/ndps /ndp030.html; Libya: http://cdiac.ornl.gov/ftp/ndp030 /nation 00.ems
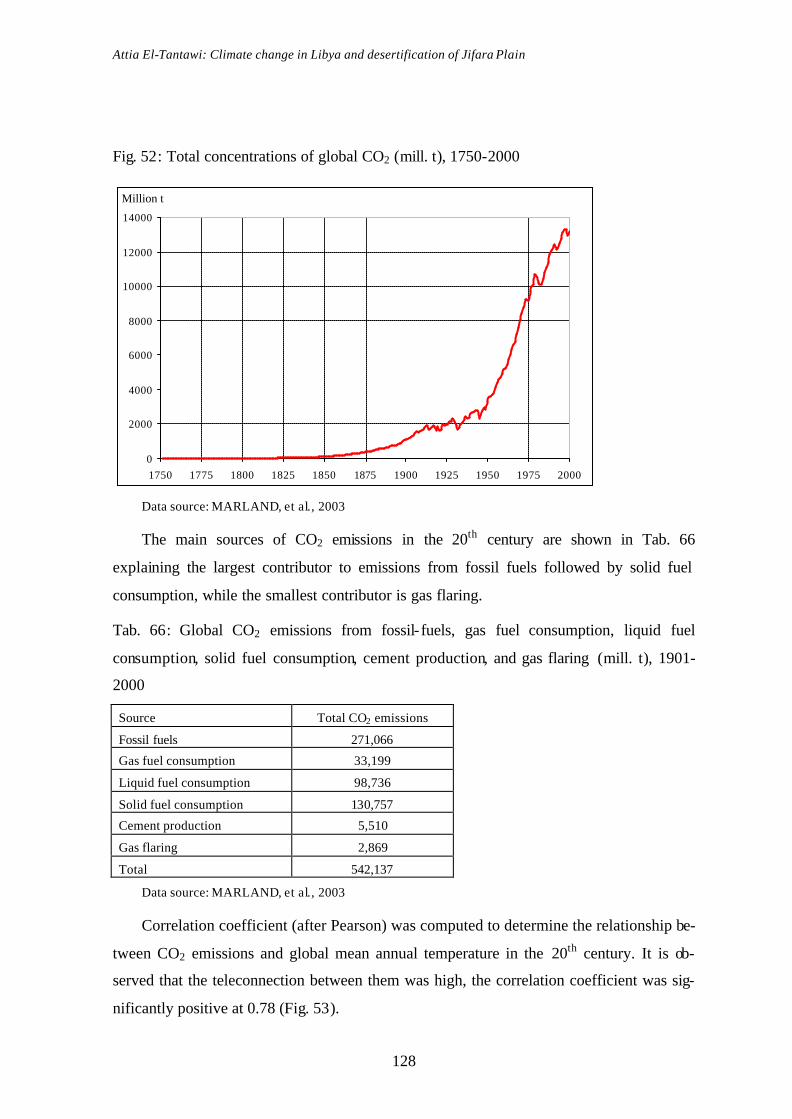
Attia El-Tantawi: Climate change in Libya and desertification of Jifara Plain
128
Fig. 52: Total concentrations of global CO2 (mill. t), 1750-2000
0
2000
4000
6000
8000
10000
12000
14000
1750 1775 1800 1825 1850 1875 1900 1925 1950 1975 2000
Million t
Data source: MARLAND, et al., 2003
The main sources of CO2 emissions in the 20th century are shown in Tab. 66
explaining the largest contributor to emissions from fossil fuels followed by solid fuel
consumption, while the smallest contributor is gas flaring.
Tab. 66: Global CO2 emissions from fossil- fuels, gas fuel consumption, liquid fuel
consumption, solid fuel consumption, cement production, and gas flaring (mill. t), 1901-
2000
Source Total CO2 emissions
Fossil fuels 271,066
Gas fuel consumption 33,199
Liquid fuel consumption 98,736
Solid fuel consumption 130,757
Cement production 5,510
Gas flaring 2,869
Total 542,137
Data source: MARLAND, et al., 2003
Correlation coefficient (after Pearson) was computed to determine the relationship be-
tween CO2 emissions and global mean annual temperature in the 20th century. It is ob-
served that the teleconnection between them was high, the correlation coefficient was sig-
nificantly positive at 0.78 (Fig. 53).

Attia El-Tantawi: Climate change in Libya and desertification of Jifara Plain
129
Fig. 53: Global mean annual temperature anomalies and CO2 concentrations in the 20th
century
-0.6
-0.4
-0.2
0
0.2
0.4
0.6
1900 1910 1920 1930 1940 1950 1960 1970 1980 1990 2000
mill. t
0
2000
4000
6000
8000
10000
12000
14000
°C
Mean annual temperature
Total CO2 emissions
Data source: JONES, et al., 2001 and MARLAND, et al., 2003
In Libya, the total energy consumption was about 0.16 % of the world total energy
consumption, the energy-related carbon emissions was about 0.2 % of world carbon
emissions. Fuel share of energy consumption was oil (69.2 %) and natural gas (30.8 %).
Fuel share of CO2 is oil (71.5 %) and natural gas (28.4 %; EIA, 2004).
Tab. 67: Total CO2 concentrations and the annual trend in Libya, 1950-2000 (1,000 t)
CO2 emissions Totals from 1950-2000 Annual trend
Fossil fuels 286,430.0 284.22
Solid fuel consumption 318.0 -33
Liquid fuel consumption 153,645.0 189.79
Gas fuel consumption 45,900.0 68.462
Cement production 11,117.1 12.545
Gas flaring 75,449.9 13,753
Data source: MARLAND, et al., 2003
The main source of CO2 emissions from 1950-2000 is the energy sector which de-
pends mainly on fossil fuels, followed by industrial emissions, chiefly from the cement
industries. The largest contributor to CO2 emissions in Libya is from fossil fuels followed
by liquid fuel consumption, while the smallest contributor is solid fuel consumption (Tab.
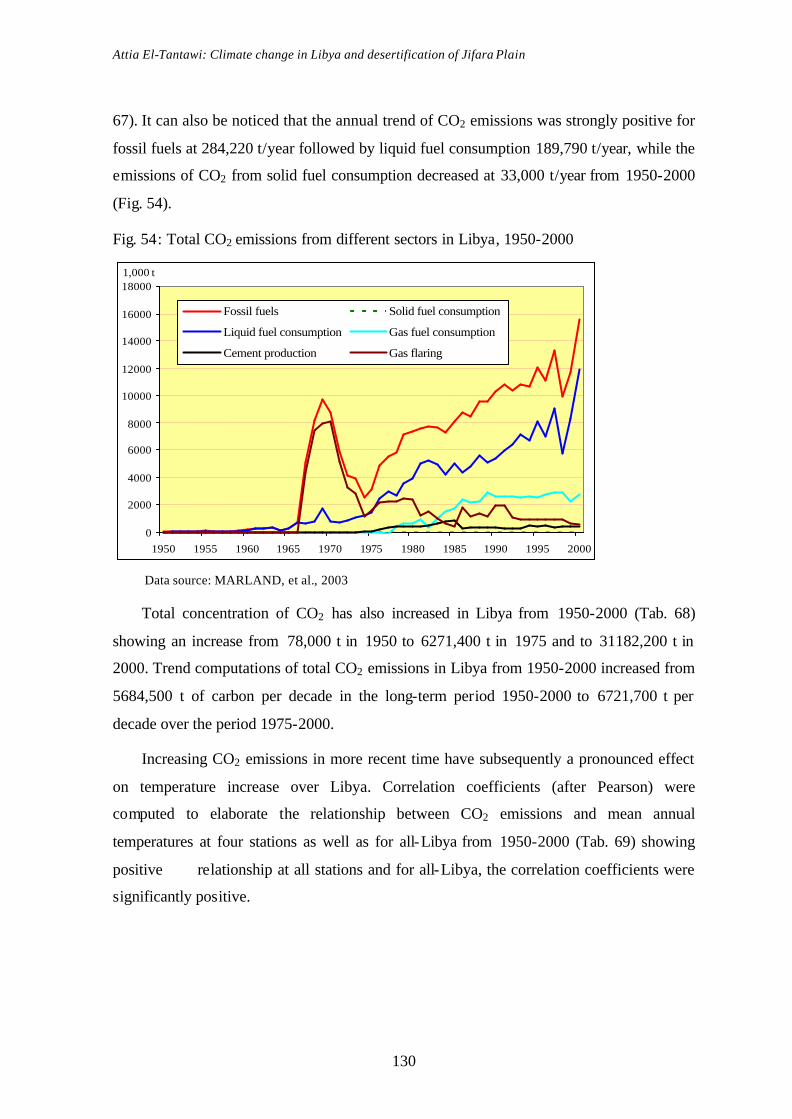
Attia El-Tantawi: Climate change in Libya and desertification of Jifara Plain
130
67). It can also be noticed that the annual trend of CO2 emissions was strongly positive for
fossil fuels at 284,220 t/year followed by liquid fuel consumption 189,790 t/year, while the
emissions of CO2 from solid fuel consumption decreased at 33,000 t/year from 1950-2000
(Fig. 54).
Fig. 54: Total CO2 emissions from different sectors in Libya, 1950-2000
0
2000
4000
6000
8000
10000
12000
14000
16000
18000
1950 1955 1960 1965 1970 1975 1980 1985 1990 1995 2000
1,000 t
Fossil fuels Solid fuel consumption
Liquid fuel consumption Gas fuel consumption
Cement production Gas flaring
Data source: MARLAND, et al., 2003
Total concentration of CO2 has also increased in Libya from 1950-2000 (Tab. 68)
showing an increase from 78,000 t in 1950 to 6271,400 t in 1975 and to 31182,200 t in
2000. Trend computations of total CO2 emissions in Libya from 1950-2000 increased from
5684,500 t of carbon per decade in the long-term period 1950-2000 to 6721,700 t per
decade over the period 1975-2000.
Increasing CO2 emissions in more recent time have subsequently a pronounced effect
on temperature increase over Libya. Correlation coefficients (after Pearson) were
computed to elaborate the relationship between CO2 emissions and mean annual
temperatures at four stations as well as for all-Libya from 1950-2000 (Tab. 69) showing
positive relationship at all stations and for all-Libya, the correlation coefficients were
significantly positive.

Attia El-Tantawi: Climate change in Libya and desertification of Jifara Plain
131
Tab. 68: Total CO2 emissions from fossil fuels, solid fuel consumption, liquid fuel
consumption, gas fuel consumption, cement production and gas flaring in Libya, 1950-
2000
year Total CO2 emissions (1,000 t ) year Total CO2 emissions (1,000 t ) 1950 78.0 1976 9771.3
1951 92.0 1977 10966.1 1952 89.0 1978 11584.1
1953 136.0 1979 14178.8 1954 164.0 1980 14694.2 1955 234.0 1981 15155.5
1956 180.0 1982 15362.4 1957 170.0 1983 15305.8
1958 191.0 1984 14444.5 1959 235.0 1985 16056.1
1960 378.0 1986 17633.3 1961 653.0 1987 16932.1
1962 571.0 1988 19154.5 1963 799.0 1989 19114.2
1964 361.0 1990 20618.8 1965 554.0 1991 21600.1
1966 1434.0 1992 20720.7 1967 10093.4 1993 21695.9
1968 16438.6 1994 21408.9 1969 19390.0 1995 24156.1 1970 17614.1 1996 22260.0
1971 11781.9 1997 26586.5 1972 8256.6 1998 19894.7
1973 7832.0 1999 23345.5 1974 5040.7 2000 31182.2
1975 6271.4
Data source: MARLAND, et al., 2003
Tab. 69: Correlation coefficients (after Pearson) between CO2 concentrations and mean
annual temperatures in Libya, 1950-2000
Station El-Kufra Sebha Shahat Tripoli city All-Libya
Correlation coefficient 0.49 0.56 0.29 0.72 0.52
Significance 0.00 0.00 0.04 0.00 0.00
Data source: MARLAND, et al. 2003 and Libyan Meteorological Department, Tripoli
CO2 emissions per capita increased in Libya at 0.05 t/year from 1950-2000 as a result
of urbanization growth followed by increasing of energy use (Fig. 55).
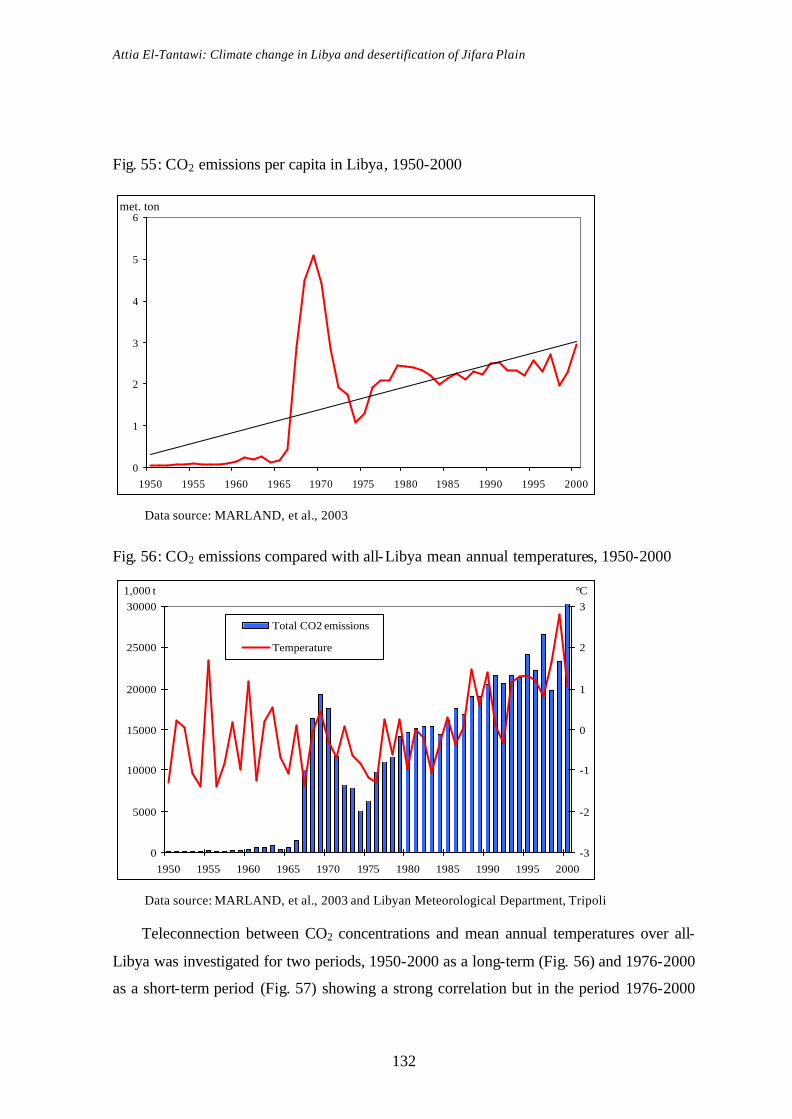
Attia El-Tantawi: Climate change in Libya and desertification of Jifara Plain
132
Fig. 55: CO2 emissions per capita in Libya, 1950-2000
0
1
2
3
4
5
6
1950 1955 1960 1965 1970 1975 1980 1985 1990 1995 2000
met. ton
Data source: MARLAND, et al., 2003
Fig. 56: CO2 emissions compared with all-Libya mean annual temperatures, 1950-2000
0
5000
10000
15000
20000
25000
30000
1950 1955 1960 1965 1970 1975 1980 1985 1990 1995 2000
1,000 t
-3
-2
-1
0
1
2
3°C
Total CO2 emissions
Temperature
Data source: MARLAND, et al., 2003 and Libyan Meteorological Department, Tripoli
Teleconnection between CO2 concentrations and mean annual temperatures over all-
Libya was investigated for two periods, 1950-2000 as a long-term (Fig. 56) and 1976-2000
as a short-term period (Fig. 57) showing a strong correlation but in the period 1976-2000
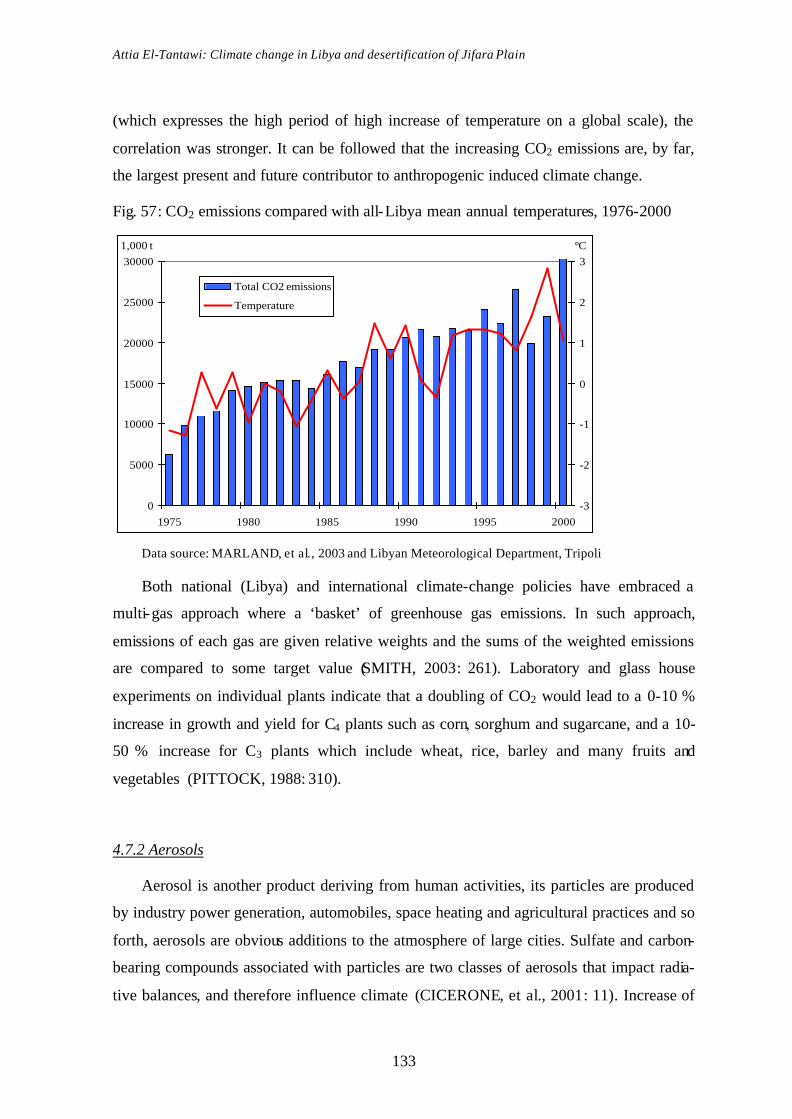
Attia El-Tantawi: Climate change in Libya and desertification of Jifara Plain
133
(which expresses the high period of high increase of temperature on a global scale), the
correlation was stronger. It can be followed that the increasing CO2 emissions are, by far,
the largest present and future contributor to anthropogenic induced climate change.
Fig. 57: CO2 emissions compared with all-Libya mean annual temperatures, 1976-2000
0
5000
10000
15000
20000
25000
30000
1975 1980 1985 1990 1995 2000
°C
-3
-2
-1
0
1
2
31,000 t
Total CO2 emissions
Temperature
Data source: MARLAND, et al., 2003 and Libyan Meteorological Department, Tripoli
Both national (Libya) and international climate-change policies have embraced a
multi-gas approach where a ‘basket’ of greenhouse gas emissions. In such approach,
emissions of each gas are given relative weights and the sums of the weighted emissions
are compared to some target value (SMITH, 2003: 261). Laboratory and glass house
experiments on individual plants indicate that a doubling of CO2 would lead to a 0-10 %
increase in growth and yield for C4 plants such as corn, sorghum and sugarcane, and a 10-
50 % increase for C3 plants which include wheat, rice, barley and many fruits and
vegetables (PITTOCK, 1988: 310).
4.7.2 Aerosols
Aerosol is another product deriving from human activities, its particles are produced
by industry power generation, automobiles, space heating and agricultural practices and so
forth, aerosols are obvious additions to the atmosphere of large cities. Sulfate and carbon-
bearing compounds associated with particles are two classes of aerosols that impact radia-
tive balances, and therefore influence climate (CICERONE, et al., 2001: 11). Increase of

Attia El-Tantawi: Climate change in Libya and desertification of Jifara Plain
134
atmospheric aerosol also affects the atmospheric energy budget by increasing the scatter-
ing of incoming solar radiation (BUCHDAHL, 1999: 21). Possible effects of aerosol load-
ing are dependent on the absorption and scattering properties of the particles, their vertical
distribution and the albedo. The evidence suggests that recent climatic trends have not
been determined by the aerosol increase due to pollution although such effects may occur
in the future (BARRY 1977:118).
In contrast to gases, aerosols may either warm or cool the surface air layer depending
on their optical properties and their distribution with height. An overall warming of the
surface air layer would lead to enhanced evaporation and cloud formation which would
increase the planetary albedo but decrease the surface air temperature (BACH, 1979: 64).
Sulfate aerosol is solid compound commonly found in the atmosphere. The particles
play an important role in reflecting, absorbing, and scattering incoming insolation. The
source of these compounds is both natural and human-made. Most of the human-made
particles come from the combustion of fossil fuels. Sulphate emissions increased steadily
until World War I, and then leveled off, and increased more rapidly since the 1950s,
though not as fast as greenhouse gas emissions. Under the almost monotonic increase in
greenhouse gas forcing in recent decades, the ratio of sulphate to greenhouse gas forcing
has probably been decreasing since 1960 (HOUGHTON, et al. 2001).
Unlike CO2 with a residence time of 2-5 years resulting in a uniform atmospheric
mixing ratio, aerosols with a mean tropospheric residence time of 9 years show regionally
high concentrations near urban and industrial agglomerations and near areas with
agricultural burning (BACH, 1979: 68).
It is also possible that dust may affect climate through its influence on marine primary
productivity changes in atmospheric temperatures and in concentrations of potential
condensation nuclei may affect convectional activity and cloud formation, thereby
modifying precipitation amounts (GOUDIE and MIDDLETON, 2001: 180).
4.7.3 Methane
Methane (CH4) is another important greenhouse gas in the atmosphere. Both CH4 and
CO2 are more abundant in earth’s atmosphere now than at any time during the past
400,000 years (CICERONE, et al., 2001: 11). Notably, a molecule of CH4 is a more potent
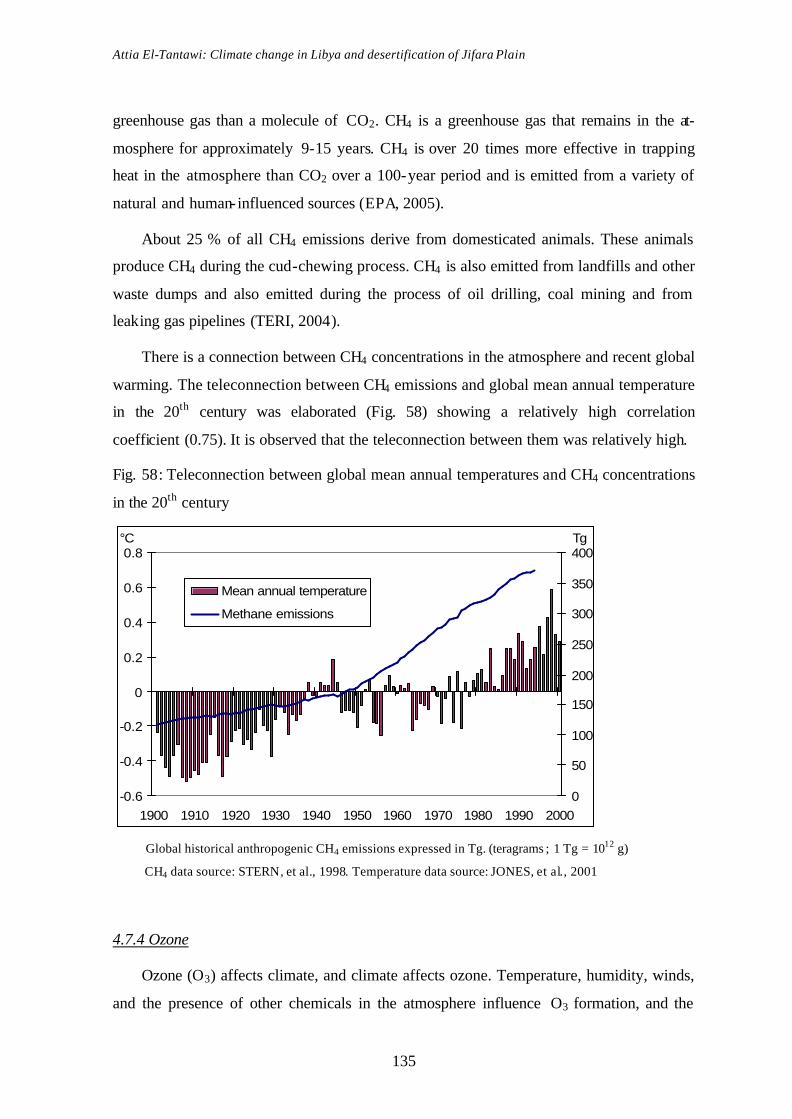
Attia El-Tantawi: Climate change in Libya and desertification of Jifara Plain
135
greenhouse gas than a molecule of CO2. CH4 is a greenhouse gas that remains in the at-
mosphere for approximately 9-15 years. CH4 is over 20 times more effective in trapping
heat in the atmosphere than CO2 over a 100-year period and is emitted from a variety of
natural and human-influenced sources (EPA, 2005).
About 25 % of all CH4 emissions derive from domesticated animals. These animals
produce CH4 during the cud-chewing process. CH4 is also emitted from landfills and other
waste dumps and also emitted during the process of oil drilling, coal mining and from
leaking gas pipelines (TERI, 2004).
There is a connection between CH4 concentrations in the atmosphere and recent global
warming. The teleconnection between CH4 emissions and global mean annual temperature
in the 20th century was elaborated (Fig. 58) showing a relatively high correlation
coefficient (0.75). It is observed that the teleconnection between them was relatively high.
Fig. 58: Teleconnection between global mean annual temperatures and CH4 concentrations
in the 20th century
-0.6
-0.4
-0.2
0
0.2
0.4
0.6
0.8
1900 1910 1920 1930 1940 1950 1960 1970 1980 1990 2000
°C
0
50
100
150
200
250
300
350
400Tg
Mean annual temperature
Methane emissions
Global historical anthropogenic CH4 emissions expressed in Tg. (teragrams ; 1 Tg = 1012 g)
CH4 data source: STERN, et al., 1998. Temperature data source: JONES, et al., 2001
4.7.4 Ozone
Ozone (O3) affects climate, and climate affects ozone. Temperature, humidity, winds,
and the presence of other chemicals in the atmosphere influence O3 formation, and the
Attia El-Tantawi: Climate change in Libya and desertification of Jifara Plain
136
presence of O3, in turn, affects those atmospheric constituents (ALLEN, 2004). O3 acts as a
greenhouse gas by absorbing outgoing long wave radiation. It also absorbs solar radiation
in particular the UV-B radiation. Changes in the vertical distribution of O3 can perturb the
solar and long-wave radiative forcing of the troposphere-surface climate system. It has
been noted that a decrease in stratospheric O3 prompts an increase in solar radiation avail-
able for absorption, and a cooling effect created by a lowering of downward long-wave
radiation (MOHNEN, et al., 1995: 39).
O3 influences both stratospheric and troposphere temperatures by absorbing solar
radiation which would otherwise heat the earth’s surface. It creates the greenhouse effect
by absorbing and remitting infrared radiation (HARVEY, 1980: 514). The impact of O3 on
climate forcing stands in striking contrast to the impact from other greenhouse gases that
are more uniformly distributed throughout the troposphere. O3 life times run generally to
an order of days or weeks in the troposphere, but to many months in the lower stratosphere
run. The climate forcing due to O3 in not uniform and the impact on surface temperatures
is more difficult to asses than for other well-mixed greenhouse gases (MOHNEN, et al.,
1995: 40).
Observations show that over recent decades, the mid to upper stratosphere has cooled
by 1-6 °C. This stratospheric cooling has taken place at the same time that greenhouse gas
amounts in the lower atmosphere troposphere have risen (ALLEN, 2004).
4.8 Patterns of landuse
Deforestation, settlement expansion, agriculture, and other human activities have
substantially altered and fragmented the landscape resulting change the atmospheric
concentration of CO2 which is the principal greenhouse gas, as well as affect local,
regional, and global climate by changing the energy balance on Earth's surface. Farther
model calculations show that a 50 % change of forests into agricultural land would
increase the CO2 emissions by 95 ppm) which would rise the global surface air
temperature by 0.6 °C (BACH, 1979: 70). In 1980s land became a small net sink for
carbon, that is, the various processes storing carbon globally exceeded the loss due to
tropical deforestation, which by itself as estimated to add 10-40 % as much CO2 to the
atmosphere as burning of fossil fuels (CICERONE, et al., 2001: 11)

Attia El-Tantawi: Climate change in Libya and desertification of Jifara Plain
137
There are many ways by which mankind can influence the heat balance of the earth,
for example, when a forest is cleared for pastoral and agriculture lands. In Libya, 500,000
ha are cleared in Ainzarah, Elkurabolli, Misurata and Jebal El-Akhadar for seasonaly
irrigated plantations (TECHNICAL CENTRE OF ENVIRONMENTAL PROTECTION,
1998: 15). Overgrazing in semi-arid areas bares soils of high albedo, which have a greater
irradiative heat loss than adjacent vegetated areas (BARRY, 1977:118).
As a result, lands generally reflect more sunlight, since crops and grasses land usually
absorb less than trees. Over- irrigation and inadequate soil drainage are the most common
problems leading to water logging and thus induce salinization in northern Libya. This
problem is caused by unsuitable selection of land for irrigation and poor irrigation
management (BIN-MAHMOUD, et al., 2000).
Same is true when nomadic tribesmen allow their cattle or goats to overgraze on
marginal lands, since the distribution of vegetation markedly increases the reflectivity of
the surface. A number of anthropogenic causes of climate change in terms of their effect
on mean surface temperature, and in some their effects on precipitation as well
(KELLOGG, 1977: 237).
Italian colonization altered the patterns of landuse in Libya turning pastoral and
rainfed agriculture lands in many parts to cultivated lands followed by deterioration of
ecosystem especially in the coastal areas. Most of water wells in Jifara plain were dug by
hand to about 15 meter, while the Italian people brought equipments that able to deg
hundreds of wells some of which reached 750 m for irrigation (BAQI, 1991: 116).
4.9 Urban heat islands
An urban heat island is the name given to describe the characteristic warmth of both
the atmosphere and surfaces in cities (urban areas) compared to their (non-urbanized)
surroundings. The heat island is an example of unintentional climate modification when
urbanization changes the characteristics of the Earth’s surface and atmosphere (VOOGT,
2004). The conversion of rural landscapes to urban landscapes is characterized by large
emissions of gases, particles, water vapour, and the heat from many combustion processes
(BACH, 1979: 69).
Attia El-Tantawi: Climate change in Libya and desertification of Jifara Plain
138
Clearly, the urban heat island can affect climate in urban areas, this effcet is not repre-
sentative of larger areas. Over the last few decades, the observed increases in land air tem-
peratures are, on the one hand, due to urban heat island related to the observed decrease in
the diurnal temperature range and, on the other, due to a lower rate of warming observed
over the past twenty years in the lower troposphere compared with the surface (HOUGH-
TON, et al. 2001).
As rapid urbanization- industrialization is overlapping with global warming, climate
data from the urbanized areas might be contaminated with urban heat island effect
(CHUNG, et al., 2004: 127). Extensive tests have shown that the urban heat island effects
are no more than about 0.05 °C up to 1990 in the global mean annual temperature records
(HOUGHTON, et al. 2001).
Regional urbanization and industrialization were believed to be more influential on
the regional temperature than the global warming from 1951-2000 (CHUNG, et al., 2004:
128). In Libya, weak effects of urban heat island on climate may appear only in Tripoli
city and Ben-Ghazi where most of Libya’s people are resided.
Attia El-Tantawi: Climate change in Libya and desertification of Jifara Plain
139
5. Impacts of climate change
The effects of such factors on estimates of the impacts of climate change have only
been poorly explored if misleading assessments of adaptation strategies to climate change
impacts are to be avoided, future studies should consider the impacts of natural multi-
decadal climate variability alongside those of human-induced climate change (HULME, et
al., 1999: 688). This recent intensification of concern has derived from many disasters
which are caused by climate change such as droughts, floods and hurricanes. Thus, there is
a growing social awareness of climatic hazards across the globe which did not really exist
previously (GREGORY, 1988: 1).
Even more troubling are concerns about the possible relationship between climate
change and the frequency as well as intensity of extreme weather events, like hurricanes,
typhoons, droughts, and floods. Estimations indicate weather-related damage in 1999
totaled at $67 billion worldwide. Likewise, weather-related damage in the 1990s increased
five fold from the 1980s (USAID, 2000). It has also been estimated that the 1982-83 El-
Nino Southern Oscillation (ENSO) event was responsible for $8 billions in damages and
the loss of two thousand lives (Cane, 1997: 2). Over 700,000 people died in the 1980s as a
direct result of hazardous weather events. Hence, natural weather events such as storms
(hurricanes), floods and drought are, in all respects, major disasters. Sometimes, they
destroy hard-won economic achievements in developing countries, throwing the economy
into chaos (BEDRITSKY, 1999: 176).
Global climate change is likely to result in changes of the hydrological cycle including
increases in storms and droughts, changes in both the amount and geographical distribution
of precipitation. This in turn affects agricultural crops patterns and food production, having
a severe effect on food intake per capita, particularly in the developing countries (EEAA,
1999: 61) threatening food security and increasing poverty.
Changing precipitation patterns may put freshwater resources at risk, water scarcity is
endemic and changes in the water balance would have substantial implications for agricul-
ture and water supplies, loss of already scarce vegetation cover, increased desertification
and associated socio-economic impacts. Changes of precipitation could also lead to wide-
spread flooding in certain regions of the world while inflicting drought in other regions
altering the ecosystems. Excessive precipitation, which may occur in some parts, has seri-

Attia El-Tantawi: Climate change in Libya and desertification of Jifara Plain
140
ous negative effects on road networks and air transport. A warmer earth could lead to the
spread of diseases such as malaria and dengue, and increase heat-related mortality, deaths
caused by extreme weather events. Changes in the frequency, timing and duration of heat
waves affect agricultural yields and they increase the number and variety of insect pests
(ROACH, 1997).
Changes in climate would have severe impacts not only on distribution of human
beings but also on the quality of their life. It may lead to industrial relocation, resulting
either from sea- level rise in coastal-zone areas or from transitions to agro-ecological zones.
If sea- level rise occurs as a result of climate change, the effect on many harbors and ports
will be quite devastating economically for many coastal-zone countries (McCARTHY, et
al., 2001). Although all areas will be affected, the type and extent of impacts experienced
will vary markedly depending on local circumstances.
In arid and semi- lands, which serves primarily as pastoral lands, precipitation is scanty
and irregular, evaporation rate is very high, and the natural balance of plant life is fragile.
As too much livestock feeds within these diminishing areas, plants disappear speedily
under the stresses of overgrazing and lack of water. The consequence is that natural
resource managers in arid and semi-arid environments must deal not only with low amount
of precipitation but also with highly variable precipitation. Precipitation occurs less
frequently in arid areas so that few if any adaptations have developed other than talking
advantage of the diversified resource base that periodically results (SEELY, 1999: 1).
Libya is vulnerable to climate change because of prevailing arid and semi-arid climate
conditions, recurrent droughts, inequitable land distribution, and overdependence on
rainfed agriculture. Precipitation is the main parameter of climate which may control the
socio-economic prospects. It begins usually in autumn to winter which is the rainiest
season and end in spring, while a negligible precipitation occurs in summer. High
precipitation variabilities and severe precipitation intensities over Libya may cause severe
moisture stress on cultivated crops and reduce yields. As a common rule, precipitation in
arid and semi-arid areas has in most cases negative effects. Due to high temperatures, most
water evaporates without any benefit to agriculture, whereas a small percentage of
precipitation only infiltrates to groundwater.
Over the 50-year period 1951-2000, precipitation data at 15 stations in Libya were
analyzed to investigate the number of arid (below the average) and humid (above the aver-
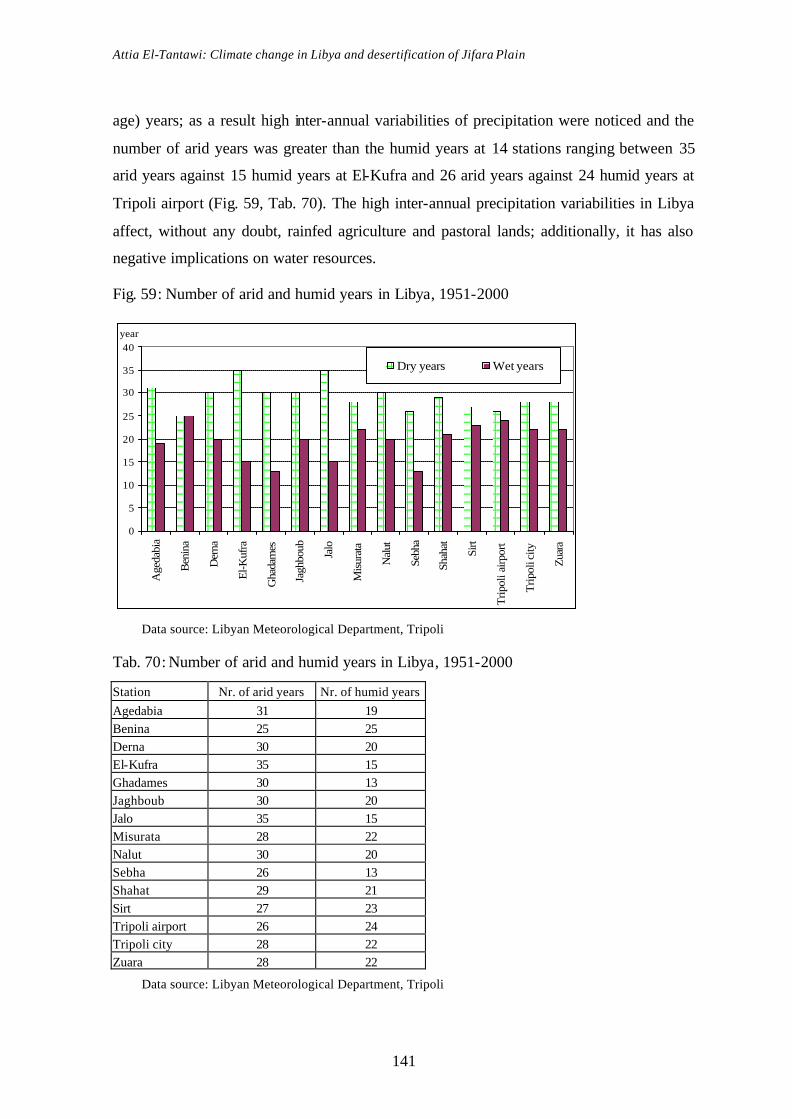
Attia El-Tantawi: Climate change in Libya and desertification of Jifara Plain
141
age) years; as a result high inter-annual variabilities of precipitation were noticed and the
number of arid years was greater than the humid years at 14 stations ranging between 35
arid years against 15 humid years at El-Kufra and 26 arid years against 24 humid years at
Tripoli airport (Fig. 59, Tab. 70). The high inter-annual precipitation variabilities in Libya
affect, without any doubt, rainfed agriculture and pastoral lands; additionally, it has also
negative implications on water resources.
Fig. 59: Number of arid and humid years in Libya, 1951-2000
0
5
10
15
20
25
30
35
40
Age
dabi
a
Ben
ina
Der
na
El-K
ufra
Gha
dam
es
Jagh
boub
Jalo
Mis
urat
a
Nal
ut
Sebh
a
Shah
at
Sirt
Trip
oli a
irpor
t
Trip
oli c
ity
Zuar
a
year
Dry years Wet years
Data source: Libyan Meteorological Department, Tripoli
Tab. 70: Number of arid and humid years in Libya, 1951-2000
Station Nr. of arid years Nr. of humid years Agedabia 31 19 Benina 25 25 Derna 30 20 El-Kufra 35 15 Ghadames 30 13 Jaghboub 30 20 Jalo 35 15 Misurata 28 22 Nalut 30 20 Sebha 26 13 Shahat 29 21 Sirt 27 23 Tripoli airport 26 24 Tripoli city 28 22 Zuara 28 22
Data source: Libyan Meteorological Department, Tripoli

Attia El-Tantawi: Climate change in Libya and desertification of Jifara Plain
142
Severe precipitation intensities have serious implications on soil in Libya. Soil is sub-
ject to severe, moderate and light water erosion as shown in Tab. 71.
Tab.71: Areas affected by water erosion in Libya, (ha)
Type of erosion Light (>10 %) Moderate (10-25 %) Severe (25-50 %) Total Western areas 165,600 164,600 64,500 304,700 Middle areas ------ 2,453 ------ 2,453
Eastern areas 241,700 41,500 1,700 284,900 Total 407,300 208,553 66,200 592,053
Source: GENERAL ENVIRONMENTAL AUTHORITY, 2002: 210
Although precipitation may be limited to a few days, extreme precipitation intensities
may lead to disastrous floods damaging agriculture and even resulting in loss of lives (e. g.
El-Migenin wadi flood in September 1969 and El-Kharwaa wadi flood in December 1983;
GENERAL ENVIRONMENTAL AUTHORITY, 2002: 239). Seasonality of precipitation
most strikingly characterizes across all-Libya, it can also be considered as a limiting factor
for rainfed agriculture.
Increasing temperature comes also soil erosion and leads to increase wind speed,
which in turn increases amount of Saharan dust blown off and causing health and
economic problems. In spring and autumn, strong southerly winds – namely the so-called
Gibli - blow from the desert, filling the air with sand and dust and raising the temperature
to over 50 °C in some areas, for example 53 °C at Tripoli airport in 1996 (KREDEGH,
2002: 126). Strong Gibli winds cause soil erosion in Libya (Tab. 72) transferring a big
amount of sand from Sahara desert to the northern parts of Libya.
Tab. 72: Areas affected by wind erosion in Libya, (ha)
Type of erosion Light Moderate Severe Totals Western areas 180,000 266,400 136,400 582,800
Middle areas 160,838 49,494 4,402 214,734 Eastern areas 53,500 8,400 200 62,100 Totals 394,338 324,294 141,002 859,634
Source: GENERAL ENVIRONMENTAL AUTHORITY, 2002: 210
Gibli has drastically effects on Libya in many ways to agriculture, human health, and na-
tional economy. It has been observed that Gibli sand storms increased in recent decades
shown by the number of sand storms in northwestern Libya from 1965-1997 (Kredegh,
2002: 115). Increasing number of sand storms is explained by the recent climate change
scenario, by decreasing precipitation and increasing temperature, followed by overgrazing
Attia El-Tantawi: Climate change in Libya and desertification of Jifara Plain
143
and over-cultivation in marginal lands which cause severe soil erosion. Increase frequen-
cies of dust events reflect some of environmental changes.
The most affected sectors by climate change, according to IPCC, Third Assessment
Report 2001, are water resources, coastal zones, agriculture, rangeland and livestock,
human health, human settlements, forest, bio-diversity species, communities and
ecosystems and fisheries. These adverse impacts represent real threats on sustainable
development, especially in developing countries.
Climate in Libya played a substantial role in determining land uses and in forming the
sensitive water balance rarely achieved in most area owing to precipitation variabilities
and seasonality. It is to be shown that Libya is affected by climate change in many ways,
in particular crop production and food security, pastoral lands and livestock production,
water resources, human health, population emigration and settlement, natural resources
management and biodiversity.
5.1 Impacts on crop productions and food security
Seasonal patterns of solar radiation, temperature, air humidity, atmospheric CO2
concentration and soil conditions are the main determinants for agricultural production
(ROETTER, and VAN DE GEIJN, 1999: 651). Crop production is primarily affected by
climatological variables, uneven precipitation distribution and prolonged arid period will
lead to the further development of soil salinization and soil erosion, losses of fertile soil
will increase (SCHÄFER, 2001). Changes in soil properties, arising from climate change,
will have profound implications for agriculture given both the time scales and spatial
coverage over which soil processes can operate (ROUNSEVELL, et al., 1999: 683).
Increasing drought will lead to significant declines in agricultural productivity in many
developing countries and the loss of food security will increase their vulnerability to
drought. Unfortunately, most of the vulnerable developing countries, such as Libya, are
already troubled by crucial imbalances between rapidly growing populations and existing
constraints on food-production capabilities (SWEARINGEN, 1992: 401).
The ability to absorb climatic change effects varies from country to other because of
the different social and environmental context. Lack of understanding of the societal con-

Attia El-Tantawi: Climate change in Libya and desertification of Jifara Plain
144
text of drought hampers the ability of governments to cope with potential increases in
drought that may result from global warming (SWEARINGEN, 1992: 403).
Biophysical effects of climate change on agricultural production may be positive in
some agricultural systems and regions, and negative in others, and these effects will vary
over time. There is a wide consensus that climate change will worsen food security, mainly
through increased extremes and temporal-spatial shifts (McCARTHY, et al., 2001).
Agriculture can be affected by climate change through high temperature and recurrent
extreme events whichl reduce crop yield, temperature variabilities may induce changes of
crop distribution, and temperature can negatively affect marginal lands through soil
erosion, as well as increases ambient CO2 concentration would directly affect plant growth
(PITTOCK, 1988: 310). It can also be expected that climate change causes plant diseases,
such as fungal diseases, and insect pests such as locusts and aphids. Although the exact
magnitude of this CO2 fertilization is uncertain, positive outcomes prevail. Considering the
positive effects of CO2 on crop growth an increase in productivity can be projected, but its
magnitude remains uncertain (SCHÄFER, 2001).
Given the fact that sharp fluctuations in agricultural production and imports are
common features in arid and semi-arid countries where irrigation coverage is low, the
overall impact of water scarcity resulting from climate change on the world food market
can be substantial (YANG and ZEHNDER, 2001: 1320). Expected higher prices for food
imported from developed countries as a result of global climate changes would aggravate
their vulnerability to impacts of climate change and lead to a deterioration in levels of food
security. For example, yields of grains and other food crops could decrease substantially
across the Mediterranean region due to increased frequency of drought, climate changes
associated with a doubling of CO2 could cause yield losses of over 20 % for wheat, corn
and other coarse grains (JACQUELINE, 2000). In coastal areas, large areas of productive
land may be lost through flooding, saline intrusion and water logging.
Precipitation is, however, only one of the factors influencing productivity as well as
sustainability. Agricultural drought is the deficiency or absence of precipitation that affects
the normal functions of the agricultural year. Crop droughts refer to insufficient precipita-
tion for at least part of the growing season (SEELY, 1999: 3). Agricultural drought occurs
when water supply is insufficient to cover crop water requirements and can threat farmers
even when precipitation levels indicate that meteorological drought is not occurring

Attia El-Tantawi: Climate change in Libya and desertification of Jifara Plain
145
(SWEARINGEN, 1992: 402). Other aspects of climate such as temperature, evaporation,
cloud cover and wind also affect the response of agricultural and other natural resources.
Libya already experiences a deficit in food production and depends mainly on food
import. In the middle of 1990s Libya imported about 60 % from its food requirements
(SCHLIEPHAKE, 2004: 211). Agricultural production constitutes only a small percentage
(8.6 %) of the GDP of Libya (CIA, 2004). Arable land is only 1.815 million ha, out of
which, permanent crops cover 335,000 ha (figures for 2001, FAO, 2002: 4). The areas
under irrigation were estimated at 435,000 ha in 1989-1991 and increased to 470,000 ha in
1999-2001 (FAO, 2002: 17). These areas include large scheme project, settlements and
smallholder farms, while most of cultivated lands are under rainfed agriculture and
pastures (BIN-MAHMOUD et al., 2000). Most of the arable and pastoral lands occupy the
northern semi-arid parts of Libya, while deserts in southern Libya are subject to frequent
periods of drought. Principal crops cultivated in Libya are wheat, potatoes, barley, citrus
fruits, dates, and olives. With the depletion of non-renewable groundwater resources,
irrigated areas are in Libya unlikely to increase, but may decrease. Imbalance between
rapidly growing population and food-production capability can be observed by wheat
production, consumption and decreasing of self-sufficiency in Libya (Tab. 73).
Tab. 73: Growth of wheat requirements in Libya, 1990-2000
Year Population (1000)
Wheat production (1000)
Amount consumed (1000)
Gap (1000)
% of self- sufficiency
1990 4,202 185 682 427 27 1995 5,112 185 830 645 22 2000 6,220 185 1,010 825 18
Source: NATIONAL COMMITTEE TO COMBAT DESERTIFICATION, 1999
Precipitation across Libya is mostly <100 mm/year expressing a great severity of dry-
ness and drought conditions with even some years experience no precipitation at all. Dis-
tribution of total annual precipitation over time and space is clearly expressing the scarcity
of precipitation over most parts of Libya. An increase in precipitation variability can rap-
idly reduce agricultural productivity and alter the composition of steppes and grassland.
Libya is chiefly a desert country characterized by arid and semi-arid climate types which
played a substantial role in determining landuses and in forming the sensitive water bal-
ance rarely achieved in most areas. Under these limitations, the various drought factors
produced specific chemical properties and soils which are naturally and characteristically
fragile. Agricultural land is, therefore, limited to less than 2 % of Libya’s total area. More-
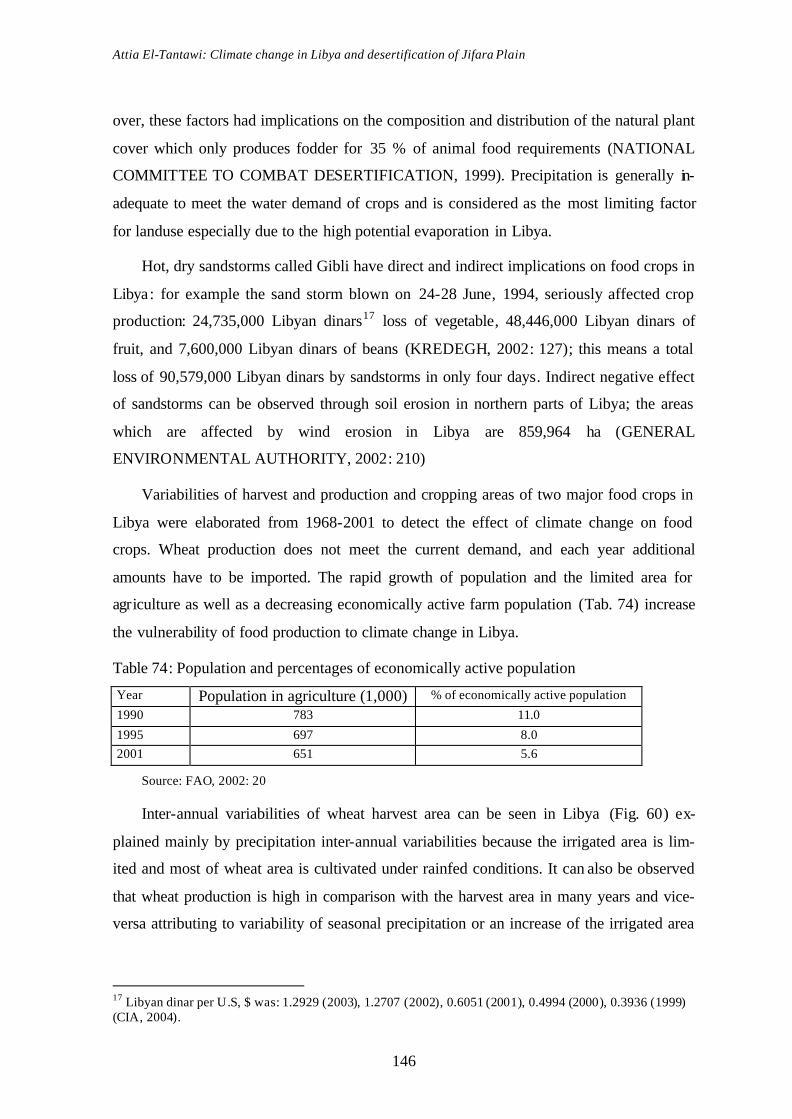
Attia El-Tantawi: Climate change in Libya and desertification of Jifara Plain
146
over, these factors had implications on the composition and distribution of the natural plant
cover which only produces fodder for 35 % of animal food requirements (NATIONAL
COMMITTEE TO COMBAT DESERTIFICATION, 1999). Precipitation is generally in-
adequate to meet the water demand of crops and is considered as the most limiting factor
for landuse especially due to the high potential evaporation in Libya.
Hot, dry sandstorms called Gibli have direct and indirect implications on food crops in
Libya: for example the sand storm blown on 24-28 June, 1994, seriously affected crop
production: 24,735,000 Libyan dinars17 loss of vegetable, 48,446,000 Libyan dinars of
fruit, and 7,600,000 Libyan dinars of beans (KREDEGH, 2002: 127); this means a total
loss of 90,579,000 Libyan dinars by sandstorms in only four days. Indirect negative effect
of sandstorms can be observed through soil erosion in northern parts of Libya; the areas
which are affected by wind erosion in Libya are 859,964 ha (GENERAL
ENVIRONMENTAL AUTHORITY, 2002: 210)
Variabilities of harvest and production and cropping areas of two major food crops in
Libya were elaborated from 1968-2001 to detect the effect of climate change on food
crops. Wheat production does not meet the current demand, and each year additional
amounts have to be imported. The rapid growth of population and the limited area for
agriculture as well as a decreasing economically active farm population (Tab. 74) increase
the vulnerability of food production to climate change in Libya.
Table 74: Population and percentages of economically active population
Year Population in agriculture (1,000) % of economically active population
1990 783 11.0
1995 697 8.0 2001 651 5.6
Source: FAO, 2002: 20
Inter-annual variabilities of wheat harvest area can be seen in Libya (Fig. 60) ex-
plained mainly by precipitation inter-annual variabilities because the irrigated area is lim-
ited and most of wheat area is cultivated under rainfed conditions. It can also be observed
that wheat production is high in comparison with the harvest area in many years and vice-
versa attributing to variability of seasonal precipitation or an increase of the irrigated area
17 Libyan dinar per U.S, $ was: 1.2929 (2003), 1.2707 (2002), 0.6051 (2001), 0.4994 (2000), 0.3936 (1999) (CIA, 2004).

Attia El-Tantawi: Climate change in Libya and desertification of Jifara Plain
147
in some years as high precipitation variabilities, recurrent droughts and over-dependence
on rainfed agriculture affect wheat production.
Fig. 60: Harvest areas and production of wheat in Libya, 1968-2001
0
50
100
150
200
250
300
1968
1971
1974
1977
1980
1983
1986
1989
1992
1995
1998
2001
1,000 ha
0
50
100
150
200
250
300
1,000 tarea harvested
production
Data source: 1968-1990: AGRICULTURE RESEARCH CENTER, 1992. 1991-1998: ELZAEDY and
ELTAHER, 2000. 1999-2001: FAO, 2002
The critical precipitation limits of wheat were some 30 % higher than those for barley.
Additionally, barley ripens and can be harvested earlier than wheat; these characteristics
make barley less vulnerable to arid conditions during the early onset of summer
(SWEARINGEN, 1992: 406).
Cultivated as rainfed agriculture in Libya, barley relies mainly on precipitation. As a
result, barley is highly vulnerable to climate changes, seasonal shifts, and precipitation
patterns. Any warming leads to an increasing water stress. Increased temperatures would
increase evapotranspiration which is likely to increase crop water requirements and lower
yields. Variabilities of precipitation negatively affect barley. Mean annual barley
production was 117,656 t from 1968-1990, while its production was very low at 100,000,
71,000, 87,000, and 83,000 t in 1979, 1980, 1984, and 1985, respectively
(AGRICULTURE RESEARCH CENTER (Tripoli), 1992).
To clarify the effects of precipitation variabilities on barley, correlation coefficients
(after Pearson) were computed between harvest areas under barley, its productions and
annual total precipitation at eight stations in northern Libya where barley was planted from
1968-2001 (Tab. 75). It has been observed that the harvest area and production of barley

Attia El-Tantawi: Climate change in Libya and desertification of Jifara Plain
148
correlated positively with precipitation at all stations except Zuara and Tripoli airport.
Highly significant correlation for harvest area and precipitation was computed at Shahat
which records the heaviest precipitation among all stations.
Tab. 75: Correlation coefficient (after Pearson) between annual precipitations at selected
stations and harvested areas and production of barley in Libya, 1968-2001
Station Harvested area Production
Correlation coefficient Significance Correlation coefficient Significance Agedabia 0.28 0.12 0.29 0.10 Benina 0.31 0.08 0.10 0.60
Derna 0.31 0.07 0.35 0.05
Misurata 0.15 0.41 0.09 0.63 Shahat 0.44 0.01 0.12 0.50
Sirt 0.28 0.11 0.34 0.06 Tripoli airport 0.02 0.92 0.00 0.98
Zuara 0.05 0.79 -0.01 0.98
Data source: 1968-1990: AGRICULTURE RESEARCH CENTER, 1992. 1991-1998: ELZAEDY and
ELTAHER, 2000. 1999-2001: FAO, 2002
Fig. 61: Harvest areas and production of barley in Libya, 1968-2001
0
100
200
300
400
500
600
700
1968
1970
1972
1974
1976
1978
1980
1982
1984
1986
1988
1990
1992
1994
1996
1998
2000
1000 ha
0
50
100
150
200
250
1000 tarea harvested
production
Data source: 1968-1990: AGRICULTURE RESEARCH CENTER, 1992. 1991-1998: ELZAEDY and
ELTAHER, 2000. 1999-2001: FAO, 2002
Variabilities of barley-harvest areas and barley production are explained by high inter-
annual and intra-annual variabilities of precipitation (Fig. 61) showing a barley production
in comparison with the harvest areas in many years and, vice-versa.

Attia El-Tantawi: Climate change in Libya and desertification of Jifara Plain
149
As Gibli winds leads to increase temperatures (e.g. 1995 and 1996 when during sand-
storms temperature climbed at 53 °C at Tripoli airport and 51 °C at Zuara) with speed
above 80 km in most areas, Gibli sandstorms destroyed most crops especially vegetables
like paprika, tomatoes and fruit in northwestern Libya (KREDEGH, 2002: 126). Gibli
winds may affect food crops through transferring the locust from desert to the cultivated
areas in Libya. Climate change may also affect scheduling of the cropping season, as well
as the duration of the growing period of the crop (SCHAEFER, 2001).
Food production would be affected by other climate impacts such as desertification,
increased fire risk, spread of pests and diseases and changes in the global markets. Even in
the absence of climate change, basic food security in developing countries such as Libya is
likely to deteriorate due to a combination of population growth, land use changes and
water scarcity.
Livestock production in Libya will be affected by climate change; deterioration in the
quality of rangeland associated with higher concentrations of atmospheric carbon dioxide
and due to changes in areas of rangeland as climate boundaries moves northwards. In
North Africa, most of the steppe rangeland under semi-arid condition could give way to
desert by 2050 or earlier (JACQUELINE, 2000).
Domestic livestock play an important role in Libya. Sheep and goats, in particular,
have an importance that goes beyond the production of meat. Climate change affects
animal feed availability, livestock pastures and forage crop production and quality,
additionally, the direct effects of weather and extreme events on animal health, growth,
and production (ROETTER, and VAN DE GEIJN, 1999: 652).
Climate change in Libya may increase the vulnerability of livestock due to shortage of
water resources, increased salinity in northern parts, and loss of grazing sites. As a result
of precipitation variabilities and high temperature, the pastoral lands are inconstant in
quantity and in quality resulting annual variabilities of animal numbers (Tab. 76).
Most of pastoral lands in Libya are opened without any controls that accelerate
overgrazing followed by desertification. Consumers could benefit from climate change if
there are increases in global output and national markets are free to respond to changes in
international prices (YATES, and STRZEPEK, 1998: 284).
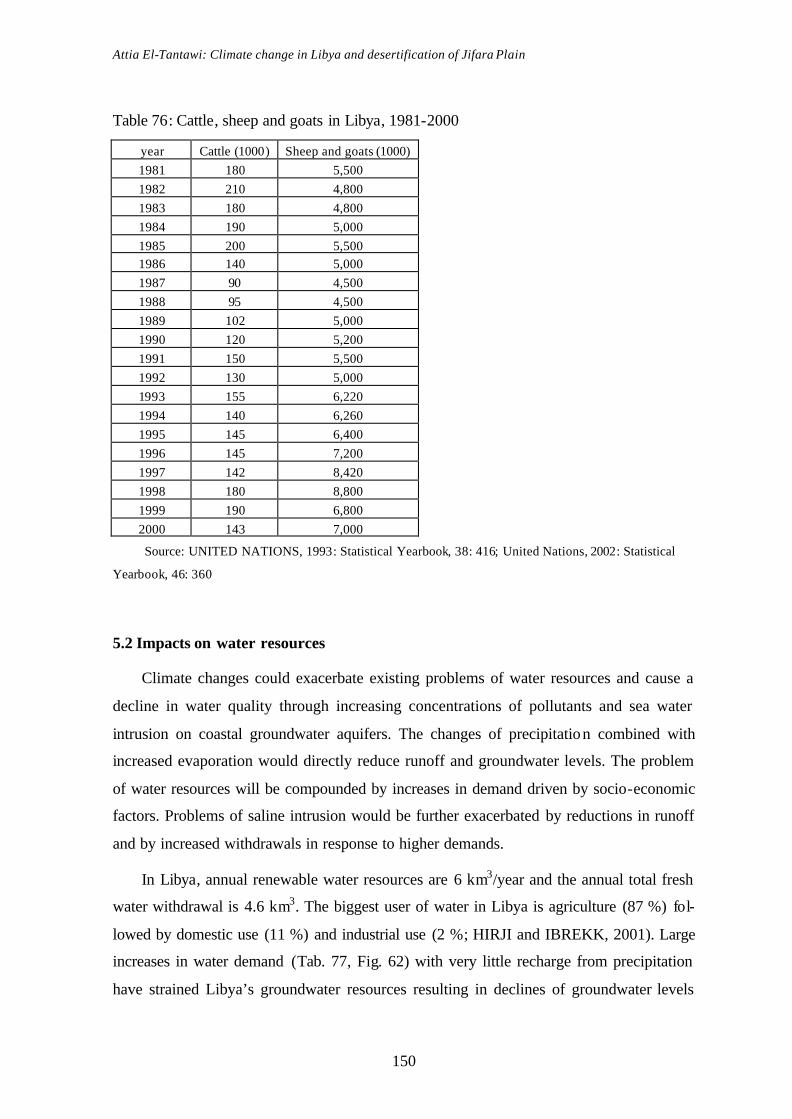
Attia El-Tantawi: Climate change in Libya and desertification of Jifara Plain
150
Table 76: Cattle, sheep and goats in Libya, 1981-2000
year Cattle (1000) Sheep and goats (1000) 1981 180 5,500 1982 210 4,800 1983 180 4,800 1984 190 5,000 1985 200 5,500 1986 140 5,000 1987 90 4,500 1988 95 4,500 1989 102 5,000 1990 120 5,200 1991 150 5,500 1992 130 5,000 1993 155 6,220 1994 140 6,260 1995 145 6,400 1996 145 7,200 1997 142 8,420 1998 180 8,800 1999 190 6,800 2000 143 7,000
Source: UNITED NATIONS, 1993: Statistical Yearbook, 38: 416; United Nations, 2002: Statistical
Yearbook, 46: 360
5.2 Impacts on water resources
Climate changes could exacerbate existing problems of water resources and cause a
decline in water quality through increasing concentrations of pollutants and sea water
intrusion on coastal groundwater aquifers. The changes of precipitation combined with
increased evaporation would directly reduce runoff and groundwater levels. The problem
of water resources will be compounded by increases in demand driven by socio-economic
factors. Problems of saline intrusion would be further exacerbated by reductions in runoff
and by increased withdrawals in response to higher demands.
In Libya, annual renewable water resources are 6 km3/year and the annual total fresh
water withdrawal is 4.6 km3. The biggest user of water in Libya is agriculture (87 %) fol-
lowed by domestic use (11 %) and industrial use (2 %; HIRJI and IBREKK, 2001). Large
increases in water demand (Tab. 77, Fig. 62) with very little recharge from precipitation
have strained Libya’s groundwater resources resulting in declines of groundwater levels

Attia El-Tantawi: Climate change in Libya and desertification of Jifara Plain
151
and its quality, especially on Mediterranean coastal areas where most of the agriculture,
domestic and industrial activities are concentrated.
Table 77: Water resources demand by different users in Libya, 1990-2025 (projected),
mill. m3
1990 2000 2010 2020 2025 Agricultural use 4,275 4,800 5,325 5,850 6,640 Domestic use 408 647 1,015 1,512 1,759 Industrial use 74 132 236 422 566 Total 4,757 5,579 6,576 7,784 8,965
Source: GENERAL ENVIRONMENTAL AUTHORITY, 2002: 66
Fig. 62: Development of water demand in Libya, 1990-2025
0
1000
2000
3000
4000
5000
6000
7000
1990 1995 2000 2005 2010 2015 2020 2025
mill. m3
Agricultural use Domestic use Industrial use
Data source: GENERAL ENVIRONMENTAL AUTHORITY, 2002: 66
The growth of water demand has a marked impact on the water resources of Libya
which suffered serious depletions and quality deterioration (ABUFAYED and EL-
GHUEL, 2001: 48). The common benchmark for water scarcity is 1000 m3/year/person. In
Middle East and North Africa, 53 % of the people are said to live with less 100
m3/year/person (JACQUELINE, 2000). Water availability in Libya is very below and does
not amount to 1000 m3/year/person. Renewable resources per person were 538 and 154
m3/year/person in 1960 and 1990, respectively, and are expected farther to shrink to only
55 m3/year/person in 2025 (HIRJI and IBREKK, 2001).
Seasonal changes of precipitation affect supply of surface runoff through the effects
on the precipitation efficiency which depends mainly on temperature and evaporation. De-
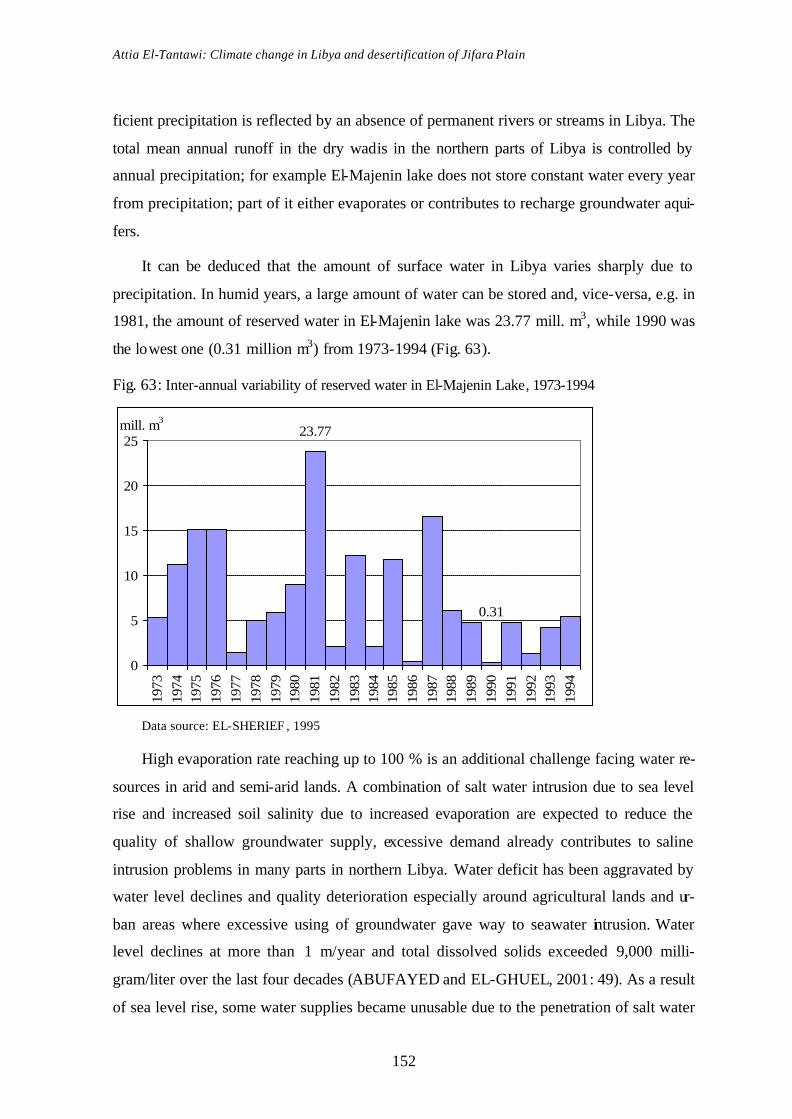
Attia El-Tantawi: Climate change in Libya and desertification of Jifara Plain
152
ficient precipitation is reflected by an absence of permanent rivers or streams in Libya. The
total mean annual runoff in the dry wadis in the northern parts of Libya is controlled by
annual precipitation; for example El-Majenin lake does not store constant water every year
from precipitation; part of it either evaporates or contributes to recharge groundwater aqui-
fers.
It can be deduced that the amount of surface water in Libya varies sharply due to
precipitation. In humid years, a large amount of water can be stored and, vice-versa, e.g. in
1981, the amount of reserved water in El-Majenin lake was 23.77 mill. m3, while 1990 was
the lowest one (0.31 million m3) from 1973-1994 (Fig. 63).
Fig. 63: Inter-annual variability of reserved water in El-Majenin Lake, 1973-1994
23.77
0.31
0
5
10
15
20
25
1973
1974
1975
1976
1977
1978
1979
1980
1981
1982
1983
1984
1985
1986
1987
1988
1989
1990
1991
1992
1993
1994
mill. m3
Data source: EL-SHERIEF , 1995
High evaporation rate reaching up to 100 % is an additional challenge facing water re-
sources in arid and semi-arid lands. A combination of salt water intrusion due to sea level
rise and increased soil salinity due to increased evaporation are expected to reduce the
quality of shallow groundwater supply, excessive demand already contributes to saline
intrusion problems in many parts in northern Libya. Water deficit has been aggravated by
water level declines and quality deterioration especially around agricultural lands and ur-
ban areas where excessive using of groundwater gave way to seawater intrusion. Water
level declines at more than 1 m/year and total dissolved solids exceeded 9,000 milli-
gram/liter over the last four decades (ABUFAYED and EL-GHUEL, 2001: 49). As a result
of sea level rise, some water supplies became unusable due to the penetration of salt water
Attia El-Tantawi: Climate change in Libya and desertification of Jifara Plain
153
into coastal aquifers (Jifara Plain, Sirt, Jebal El-Akhdar). Thus, monitoring, analyzing and
forecasting variation of climate are of prime importance particularly for policy- and deci-
sion makers (MGELY, 1984: 3). Changing temperature and precipitation regimes cause
changes in the water budget. As a result, irrigation and flood control system, water storage,
and hydroelectric installations as well as for a production systems are seriously affected.
5.3 Impacts on human health
Just a few common remarks were given about the impact of climate change on human
health in the present study. Various sources concerned with the impact of weather on
human mortality and well-beings express a controversial opinion on the magnitude and
specific nature of the impact as well as on the role of acclimatization (KALKSTEIN and
VALIMONT, 1987). Human health is predicted to be adversely affected by projected
climate change, increasing of temperatures will extend the habitats of vectors of diseases
such as malaria and high temperatures of coastal waters could aggravate cholera epidemics
in coastal areas (McCARTHY, et al., 2001).
Climate change is only one of the many factors that are discussed to have significant
influence on human health, for example temperature extremes (both hot and cold) appear
to increase mortality. Medical disorders such as bronchitis, peptic ulcer, adrenal ulcer,
glaucoma, goiter, eczema, and herpes zoster are related to seasonal variations in
temperature. Humidity has an important impact on mortality since it influences the body's
ability to cool itself by means of evaporation of perspiration (KALKSTEIN and
VALIMONT, 1987). Current evidence suggests that inter-annual and inter-decadal climate
variabilities have a direct influence on the epidemiology of vector-borne diseases.
Temporal and spatial changes in temperature, precipitation and relative humidity which are
expected to occur under different climate change scenarios will affect the biology and
ecology of vectors and intermediate hosts and consequently the risk of disease
transmission (GITHEKO, et al., 2000: 1136).
Direct negative effects of climate change on human health will arise from increasing
extreme weather events (such as heat waves, floods, drought, and sand storms) Most series
implications come indirectly through the effects of climate change on prevalence of infec-
tious diseases, water quality and food security. Generally, the combination of warming and
pollution would lead to an upsurge in respiratory illness among urban populations, while

Attia El-Tantawi: Climate change in Libya and desertification of Jifara Plain
154
extreme weather events could increase death and injury rates. Water shortages and dam-
aged infrastructure would increase the risk of cholera and dysentery (JACQUELINE,
2000). Cholera is a water- and food-borne disease and has a complex mode of transmis-
sion. Flood causes contamination of public water supplies, and drought encourages unhy-
gienic practices because of water shortage. Extreme weather events such as El-Nino have
been associated with increased episodes of diarrhea (McCARTHY, et al., 2001). Increas-
ing relative humidity and temperature decrease the human activity level, and may reduce
human productivity resulting from health problems.
The greatest effect of climate change on disease transmission is observed at the
extremes of the temperature range at which transmission occurs for many diseases that lie
in the range 14-18 °C at the lower end and 35-40 °C at the upper end. Warming above 34
°C generally has a negative effect on the survival of vectors and parasites. In addition to
the direct influence of temperature on the biology of vectors and parasites, changing
precipitation patterns can also have short- and long-term effects on vector habitats
(GITHEKO, et al., 2000: 1137).
Fig. 64: Saharan dust off Libya and Tunisia
Source: NASA (2003)
Increased dust pollution has direct adverse impacts on human health, installations and
equipment. Airborne mineral dust generated from the land surface has significant impacts
on human health in Libya. Sandstorm over northwestern Libya lasting for 12 hours on
29.03.2002 with speed 70 km affected human health through charging the air with 387
Attia El-Tantawi: Climate change in Libya and desertification of Jifara Plain
155
microgram/m3 pollutants, against a safe level by WHO at 120 microgram/m3/day (KRE-
DEGH, 2001: 124). A large plume of Saharan Desert dust (tan pixels) was blowing north-
ward off the coast of Libya and spreading over much of the Mediterranean Sea on October
3, 2003 (Fig. 64). Vector borne diseases in Libya may be a significant risk in some loca-
tions during the transmission season (April through October; CIA, 2004).
Urban environment plays an important role in mediating people’s exposure to airborne
dust and also to temperature extremes. The growing urban heat island in the cities tends to
aggravate the risk of more frequent heat waves as well as their impacts. Variability in
summer nighttime minimum temperature combined with lack of acclimatization, high
humidity, and poorly ventilated and insulated housing stock may be the most important
factor in urban heat deaths. Elderly and very young people, people in ill health and poor
people are most likely to be affected by climate change (McCARTHY, et al., 2001).
5.4 Impacts on human settlements
Climate changes affect human settlements, especially urban settlements with high
population density, and suffer from poor in safe water and public health services. Rapid
urbanization may farther increase the vulnerability to all disasters. Migration and
resettlement may be the most threatening short-term effects of climate change. Migration
may occur as a result of loss of livelihood and land degradation. Drought, sandstorms, and
other climatic extremes may affect settlements and infrastructure.
The vulnerability of human settlements to climatic events is most serious in
developing countries, where high population densities and growing urban congestion are
likely to increase the sensitivity to potential magnitude of natural disasters. Changes in
production systems may lead to industrial relocation or employment reductions. Migration
may be a preferred response to threatened loss of housing or employment (IPCC, 1990).
Review of sanitary facilities now rather than later will not only be beneficial to
communities now but in the long run will be cost saving for long-term health delivery
services (McCARTHY, et al., 2001). Global sea level will rise as oceans expand and
glaciers melt, around much of the Mediterranean coast, sea level could rise by close to 1
meter by 2100 affecting some low-lying coastal areas would be lost through flooding or
erosion (JACQUELINE, 2000).

Attia El-Tantawi: Climate change in Libya and desertification of Jifara Plain
156
Semi-arid areas have supported nomadic societies that migrate in response to annual
and seasonal rainfall variations. Nomadic pastoral systems are intrinsically able to adapt to
fluctuating and extreme climates provided they have sufficient scope for movement and other
necessary elements in the system remain in place (DESANKER, 2002). In Libya, population
and urbanization increased sharply in the second have of the 20th century, it generated
impacts on natural resources and the environment (water and soil) which are very
vulnerable to climate change. Over 80 % of Libya’s population resides along a mild thin
strip on its 1,900 km long Mediterranean coast which also contains the country’s most
fertile lands and its major industrial projects (ABUFAYED and EL-GHUELM, 2001: 48).
Because of the vast oil wealth of Libya, significant improvements in the standard of
living can be observed. Population is unevenly distributed across the country (2000): 87.6
% live in urban areas, mostly on the coast. Some of Libyan’s people still live in nomadic
or semi-nomadic groups in the plains and desert. Urban population in Libya increased
from 69.6 % in 1980 to 87.6 % in 2000 (Tab. 78).
Tab. 78: Urban and rural population in Libya, 1980-2000
Year Urban % Rural % 1980 69.6 30.4 1990 82.4 17.6
1995 85.3 14.7 2000 87.6 12.4
Source: United Nations, 1993: Statistical Yearbook, 38: 71; UN, 2002: Statistical Yearbook, 46: 46
The depletion of surface and underground water resulting from climate change, in
addition to irrigation of large tracts of land may lead to the uprooting of local people from
their traditional lands and adverse environmental impacts of reservoir development
(KINUTHIA, 1997: 5). Farmers engage in unemployment- induced migration to urban
centers as one of the strategies for coping with scarcity. But related to anthropogenic-
induced global warming, migration has been considered only since recent times. Life at the
desert margins is adjusted to stresses resulting from climatic variation. Responses to long-
continued drought, overgrazing and cultivation vary according to small- and large-scale
differences in soil, slope, and past landuse (GROVE, 1977: 303).
Attia El-Tantawi: Climate change in Libya and desertification of Jifara Plain
157
5.5 Impacts on biodiversity
Climate change is one of several threats include increasing land-use conversion and
subsequent destruction of habitat; pollution; and the introduction of exotic (nonnative)
species. Land-use conversion from wild habitat to agricultural, grazing and logging uses,
for example, leads to habitat loss, fragmentation, and introduction of exotic species—all of
which adversely impact biodiversity. Given this multitude of stress factors on biodiversity,
climate change may exacerbate the stress on environmental systems beyond recovery
(DESANKER, 2002).
Climate change will affect ecosystems through the associated increase in CO2, sea
level rise and changes of climate in different ways. The higher ambient CO2 concentrations
which favour some plant and animal species over other, together with climatic changes,
will lead to changes in species compositions in natural vegetation, and in many farming
environments. As a consequence, it may be necessary in some areas to switch from one
crop to another and to change weed control strategies (PITTOCK, 1988: 312).
Loss of biodiversity is a consequence of climate change at the local and global level.
Land use changes as a result of population and development pressures will continue to be
the major force of land cover changes affecting the distribution and productivity of plant
and animal species. Losses of biodiversity are accelerated by climate change; projected
climate change is expected to lead to altered frequency, intensity, and extent of vegetation
fires, with potential feedback effects on climate change (McCARTHY, et al., 2001).
Almost all aspects of human society are dependant on climate; human life would
mostly be affected by climate change, either directly or indirectly as the effects cascade
through the socio-economic system. The combined impacts could cause a much more
serious risk to human well-being than the effects on any individual sector (JACQUELINE,
2000). Plants will naturally attempt to adapt by migrating, assuming the landscape is not
too fragmented.
Coastal zone flooding and erosion will particularly affect mangroves. Particularly in
limited areas where sharp climatic gradients occur, such as in case of many nature reserves
designed to protect endangered species, changing climate may render the reserves inap-
propriate and threaten the extinction of some species of plants and animals (PITTOCK
1988: 313). There are also secondary impacts of climate change, among them recurrent
drought might decrease the ability of trees to resist pests. In theory, some other plant spe-
Attia El-Tantawi: Climate change in Libya and desertification of Jifara Plain
158
cies could keep up with the rate of climate change, but in practice their ability to establish
themselves elsewhere will be constrained by the extent of desertification and by human
land uses. As a result, many valuable species and habitats may be lost (JACQUELINE,
2000). Climate change may lead to biome shifts. Certain landuse practices, such as shifting
cultivation, bush burning or overgrazing have been very destructive of the flora, and it is
hardly possible to distinguish between primary and secondary growth.
Although Libya was known as the breadbasket of the Roman Empire for its output of
grains, climatic changes have eroded its agricultural productivity. Today, most of Libya
supports only sparse growth or is without any vegetation at all. Most of Libya has either
little or no vegetation. Date palm, olive and orange trees grow in the oases, and
junipers and mastic trees are found in higher lands. The only areas of natural forest are in
the coastal parts (Jebal Al-Akhdar), where the forests are characterized by juniper and
mastic species. Shrub lands occur on the Jebal Naffusah with predominant species being
non-woody shrubs such as asphodel. Inland, vegetation is mainly confined to oases where
date palms predominate. Acacia species are sparsely scattered in desert regions. Libya has
larger areas of plantation forest than natural forest. Much of this has been planted in sand
dune stabilization projects, particularly in the Jifara Plain and Jebal Naffusah, or as
windbreaks (THE WOOD EXPLORER, 2004).
Only a few large mammals are found in Libya. Wildlife includes desert rodents,
hyenas, gazelles, and wildcats. Eagles, hawks, and vultures are common (ENCARTA,
2005). Climate change affects biodiversity in Libya, several kinds of animals and plants
have recently disappeared. Conservation of animal and plant varieties will be a serious
issue, as some nature reserves and national parks become increasingly inappropriate
climatically for the species they were meant to protect. Loss of genetic diversity which
might follow could have long-term implications for plant breeding and medical research
and development (PITTOCK, 1988: 313).
Attia El-Tantawi: Climate change in Libya and desertification of Jifara Plain
159
6. Case study: Desertification of Jifara Plain
6.1 Drought and desertification
The notion of desertification was probably first introduced by AUBREVILLE (1949)
who evaluated the alarming degradation of land through erosion and other processes
resulting from mismanagement by the resource-poor farmers of Africa (REICH, et al.,
2001). Desertification has emerged as an issue of global concern over the last few decades.
The definition of desertification due to United Nations Conference on Desertification held
in Nairobi 1977 is “diminution or destruction of the biological potential of land, and can
lead ultimately to desert- like conditions”. Consultative Meeting on the Assessment of
Desertification in Nairobi in 1990 suggested: “Desertification is land degradation in arid,
semi-arid and dry sub-humid areas resulting from adverse human impact” (NASR, 1999:
5). In this context, the term ‘land’ includes a whole ecosystem comprising soil, water,
vegetation, crops and animals while the term ‘degradation’ implies reduction of resource
potential by one or a combination of degradation processes including (erosion and
sediments), the amount and diversity of natural vegetation, and salinization. However, the
process of desertification is not alone confined to the dry lands of the tropics or
economically developing regions (LAL, 2001: 37).
Desertification should be restricted to processes where the ecological potential is seri-
ously damaged or even destroyed by human exploitation under the given climatic condi-
tions in arid, semi-arid and possibly sub-humid lands (MENSCHING, 1986: 10). At least
half the countries on globe have been affected, at least to some degree, by desertification
associated with aridity (GLANTZ, 1977: 8). Globally, every year an additional 200,000
km2 of productive lands are converted by desertification to the point of yielding nothing
(ABAHUSSAIN, et al., 2002: 522). Desertification processes affected about 46 % of
whole Africa (REICH, et al., 2001). Desertification is a gradual process by which the pro-
ductivity of land is reduced. It is also going through several stages before reaching the fi-
nal one, which is an irreversible change. Natural threshold changes exist-historical events
as well as current geo-socio-economic changes- which either provoke or keep constant the
intensity of desertification process (ODINGO, 1990: 24). Desertification is of wide-spread
interest among the international community; part of it results from the fact that one-ninth
of the surface of the earth is affected by desertification, it has severe financial and societal
consequences including property damage, increased health and safety hazards, and de-
Attia El-Tantawi: Climate change in Libya and desertification of Jifara Plain
160
creased agricultural productivity. The increasing use of desert shrub lands by humans for
habitation, agriculture, industry, and recreation increases the amount of arid land directly
impacted (OKIN, et al., 2001: 124).
Unlike desertification, there is no universally accepted definition of drought. The term
drought is associated with prolonged precipitation deficiency or lack of soil moisture.
Drought embraces a phenomenon with diverse, complex origin, indeterminate onset,
defuse, creeping nature and an ability to occur virtually anywhere on the globe. All
definitions point to the same basic phenomena: a shortfall in precipitation that results in
water shortages (SWEARINGEN, 1992: 402). THORNTHWAITE (1947) defined drought
as a condition in which the amount of water needed for evapotranspiration exceeds the
amount available in the soil, due to the lack of precipitation. The U.S. Weather Bureau
(1953) defined drought as a period of dry weather sufficient in length and severity to cause
at least partial crop failure. The Indian Meteorological Department described an annual
precipitation of 75 % of normal or less as drought, and 50 % or less as severe drought
(MGELY, 1984: 52).
The most common definitions have attempted to qualify drought as the temporary
situation when the demand of water exceeds the supply available from various resources,
while most of the definitions of desertification have broadly reflected some degree of land
degradation processes (OGALLO, 1994: 18). Drought is an inevitable part of normal
climate changes and should be considered as a recurring, albeit unpredictable,
environmental feature which must be included in planning (THUROW and TAYLOR,
1999: 413).
It can be said that drought is a natural phenomenon and occurs when precipitation is
significantly below normal for a long time (usually a season or more). Desertification is a
more deadly enemy than drought because it threatens the whole ecological basis of
production in the affected lands. It is keenly felt in arid regions as it adversely affects the
precariously maintained farm and pasture lands (KASSAS, 1987: 389).
Jifara Plain experiences a stress on its natural resources (water and soil) in recent
decades as a result of heavy population growth and increasing food demand. Indicators of
desertification in Jifara Plain are developed by the author from the field work, from the
published data, and satellite images ‘The Multispectral Scanner (MSS), Thematic Mapper
(TM) and Enhanced Thematic Mapper plus (ETM+).
Attia El-Tantawi: Climate change in Libya and desertification of Jifara Plain
161
Desertification in Jifara Plain was explained using spectral enhancement (indices)
which are used extensively in vegetation analysis to identify the differences between
various vegetation classes. In many cases, judiciously chosen indices can highlight and
enhance differences that can not be deduced using normal digital image processing. Such
indices have been preprogrammed in the Image Interpreter Menu included within ERDAS
IMAGINE 8.7: Infrared/red (IR/R), Vegetation Index, Normalized Difference Vegetation
Index (NDVI), Iron Oxide (LEICA GEOSYSTEMS, 2003: 182).
6.2 Manifestations of desertification
Increasing rates of desertification are being experienced in many rigions, as
demonstrated by the degradation and depletion of natural resources, the shortage and poor
quality of water, the fall in the productivity and the settlement expansion. Desertification
appears also through sand dune movements and deterioration of vegetation cover.
Traditional landuse of Jifara Plain expressing a serious degree of aridity are mainly
range land, rainfed agriculture, and irrigated agriculture. Although settled agriculture was
developed at early date, the scale of arable and orchard cultivations was limited to parts
around coastal towns (BIN-MAHMOUD, et al., 2000). Due to TM (1989) and ETM+
(2000) images mosaics (Fig. 66), Jifara Plain experienced vegetation deterioration,
settlement expansions and sand dunes encroachment. It can also be observed from mosaic
images that the salty lands (Sebkha) increased in northwestern Jifara Plain and vegetation
became more dispread and disappeared in many parts.
The main manifestations of desertification prevailing in Jifara Plain are discussed
briefly.
6.2.1 Soil degradation
Soils of Jifara Plain are usually calcareous and often shallow, with huge areas of cal-
crete outcrops developed during the Pleistocene epoch. Gypsum encrustation is common-
place in the drier parts below an annual precipitation total of 200 mm. Saline soils are usu-
ally of the solontchak type in the low-lying areas in the northwestern parts of the Plain.
Sandy arid and semi-arid soils prevail in the eastern parts of the Plain (Fig. 65). The soils
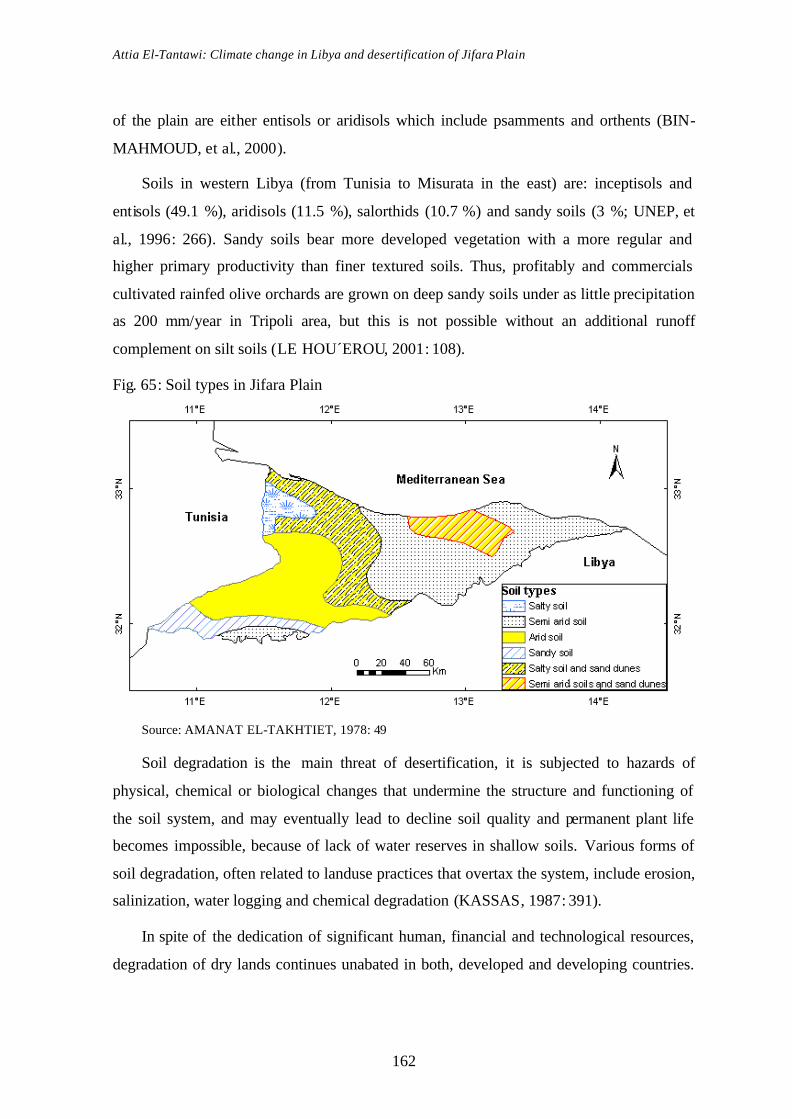
Attia El-Tantawi: Climate change in Libya and desertification of Jifara Plain
162
of the plain are either entisols or aridisols which include psamments and orthents (BIN-
MAHMOUD, et al., 2000).
Soils in western Libya (from Tunisia to Misurata in the east) are: inceptisols and
entisols (49.1 %), aridisols (11.5 %), salorthids (10.7 %) and sandy soils (3 %; UNEP, et
al., 1996: 266). Sandy soils bear more developed vegetation with a more regular and
higher primary productivity than finer textured soils. Thus, profitably and commercials
cultivated rainfed olive orchards are grown on deep sandy soils under as little precipitation
as 200 mm/year in Tripoli area, but this is not possible without an additional runoff
complement on silt soils (LE HOU´EROU, 2001: 108).
Fig. 65: Soil types in Jifara Plain
Source: AMANAT EL-TAKHTIET, 1978: 49
Soil degradation is the main threat of desertification, it is subjected to hazards of
physical, chemical or biological changes that undermine the structure and functioning of
the soil system, and may eventually lead to decline soil quality and permanent plant life
becomes impossible, because of lack of water reserves in shallow soils. Various forms of
soil degradation, often related to landuse practices that overtax the system, include erosion,
salinization, water logging and chemical degradation (KASSAS, 1987: 391).
In spite of the dedication of significant human, financial and technological resources,
degradation of dry lands continues unabated in both, developed and developing countries.
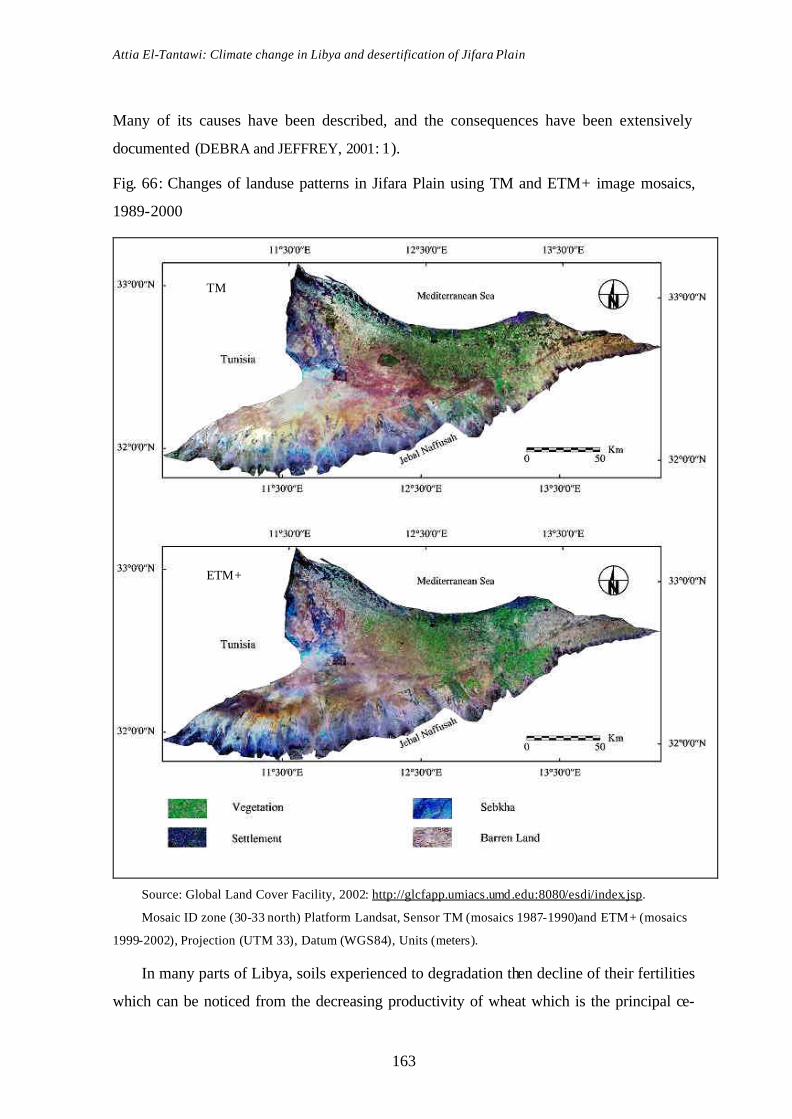
Attia El-Tantawi: Climate change in Libya and desertification of Jifara Plain
163
Many of its causes have been described, and the consequences have been extensively
documented (DEBRA and JEFFREY, 2001: 1).
Fig. 66: Changes of landuse patterns in Jifara Plain using TM and ETM+ image mosaics,
1989-2000
Source: Global Land Cover Facility, 2002: http://glcfapp.umiacs.umd.edu:8080/esdi/index.jsp.
Mosaic ID zone (30-33 north) Platform Landsat, Sensor TM (mosaics 1987-1990)and ETM+ (mosaics
1999-2002), Projection (UTM 33), Datum (WGS84), Units (meters).
In many parts of Libya, soils experienced to degradation then decline of their fertilities
which can be noticed from the decreasing productivity of wheat which is the principal ce-
TM
ETM+
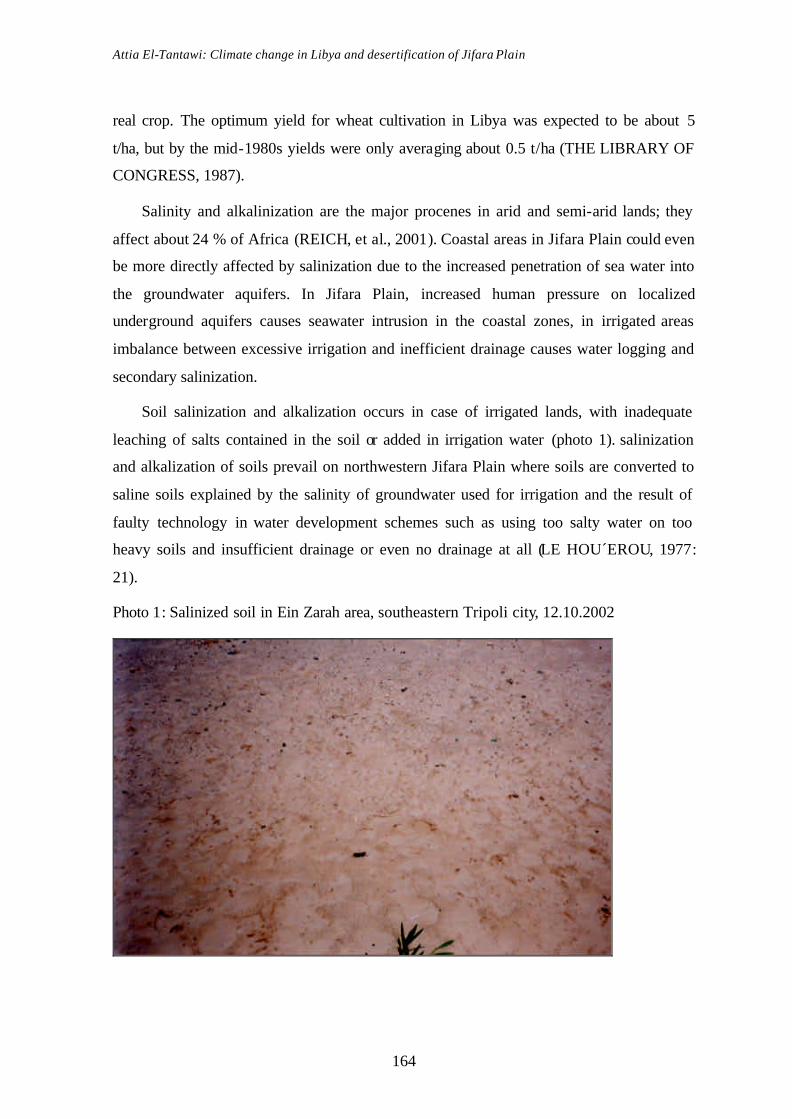
Attia El-Tantawi: Climate change in Libya and desertification of Jifara Plain
164
real crop. The optimum yield for wheat cultivation in Libya was expected to be about 5
t/ha, but by the mid-1980s yields were only averaging about 0.5 t/ha (THE LIBRARY OF
CONGRESS, 1987).
Salinity and alkalinization are the major procenes in arid and semi-arid lands; they
affect about 24 % of Africa (REICH, et al., 2001). Coastal areas in Jifara Plain could even
be more directly affected by salinization due to the increased penetration of sea water into
the groundwater aquifers. In Jifara Plain, increased human pressure on localized
underground aquifers causes seawater intrusion in the coastal zones, in irrigated areas
imbalance between excessive irrigation and inefficient drainage causes water logging and
secondary salinization.
Soil salinization and alkalization occurs in case of irrigated lands, with inadequate
leaching of salts contained in the soil or added in irrigation water (photo 1). salinization
and alkalization of soils prevail on northwestern Jifara Plain where soils are converted to
saline soils explained by the salinity of groundwater used for irrigation and the result of
faulty technology in water development schemes such as using too salty water on too
heavy soils and insufficient drainage or even no drainage at all (LE HOU´EROU, 1977:
21).
Photo 1: Salinized soil in Ein Zarah area, southeastern Tripoli city, 12.10.2002
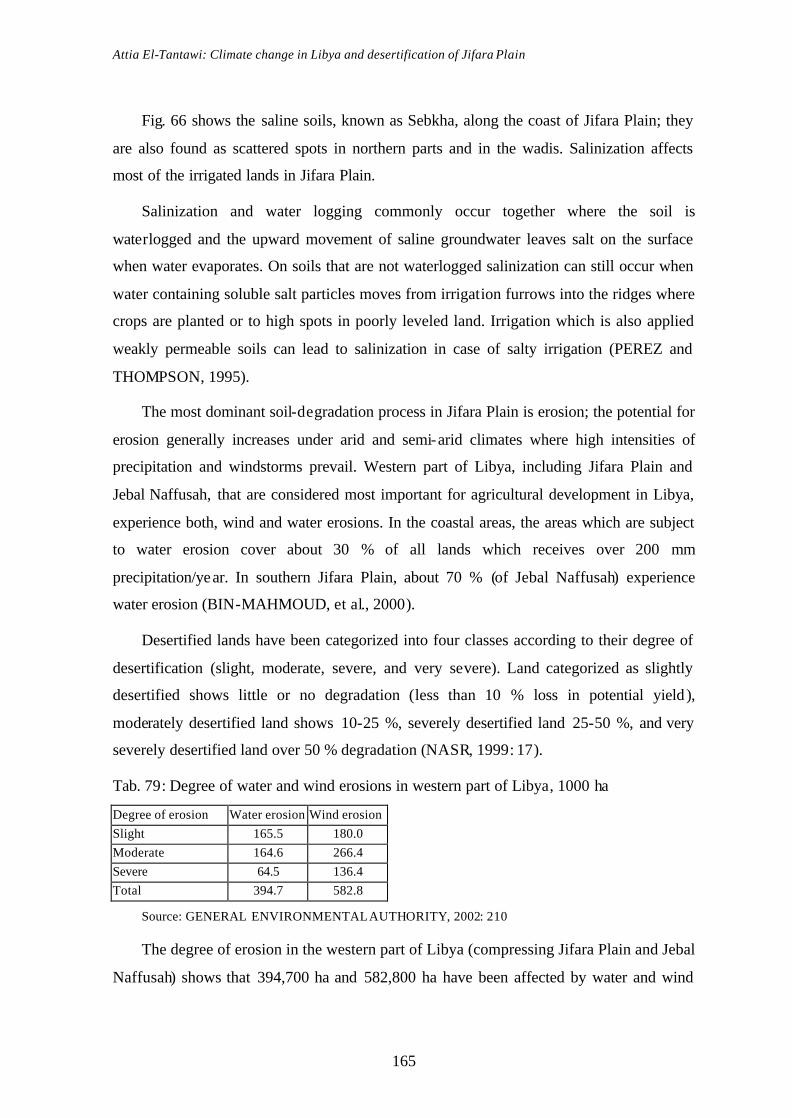
Attia El-Tantawi: Climate change in Libya and desertification of Jifara Plain
165
Fig. 66 shows the saline soils, known as Sebkha, along the coast of Jifara Plain; they
are also found as scattered spots in northern parts and in the wadis. Salinization affects
most of the irrigated lands in Jifara Plain.
Salinization and water logging commonly occur together where the soil is
waterlogged and the upward movement of saline groundwater leaves salt on the surface
when water evaporates. On soils that are not waterlogged salinization can still occur when
water containing soluble salt particles moves from irrigation furrows into the ridges where
crops are planted or to high spots in poorly leveled land. Irrigation which is also applied
weakly permeable soils can lead to salinization in case of salty irrigation (PEREZ and
THOMPSON, 1995).
The most dominant soil-degradation process in Jifara Plain is erosion; the potential for
erosion generally increases under arid and semi-arid climates where high intensities of
precipitation and windstorms prevail. Western part of Libya, including Jifara Plain and
Jebal Naffusah, that are considered most important for agricultural development in Libya,
experience both, wind and water erosions. In the coastal areas, the areas which are subject
to water erosion cover about 30 % of all lands which receives over 200 mm
precipitation/year. In southern Jifara Plain, about 70 % (of Jebal Naffusah) experience
water erosion (BIN-MAHMOUD, et al., 2000).
Desertified lands have been categorized into four classes according to their degree of
desertification (slight, moderate, severe, and very severe). Land categorized as slightly
desertified shows little or no degradation (less than 10 % loss in potential yield ),
moderately desertified land shows 10-25 %, severely desertified land 25-50 %, and very
severely desertified land over 50 % degradation (NASR, 1999: 17).
Tab. 79: Degree of water and wind erosions in western part of Libya, 1000 ha
Degree of erosion Water erosion Wind erosion Slight 165.5 180.0 Moderate 164.6 266.4 Severe 64.5 136.4 Total 394.7 582.8
Source: GENERAL ENVIRONMENTAL AUTHORITY, 2002: 210
The degree of erosion in the western part of Libya (compressing Jifara Plain and Jebal
Naffusah) shows that 394,700 ha and 582,800 ha have been affected by water and wind
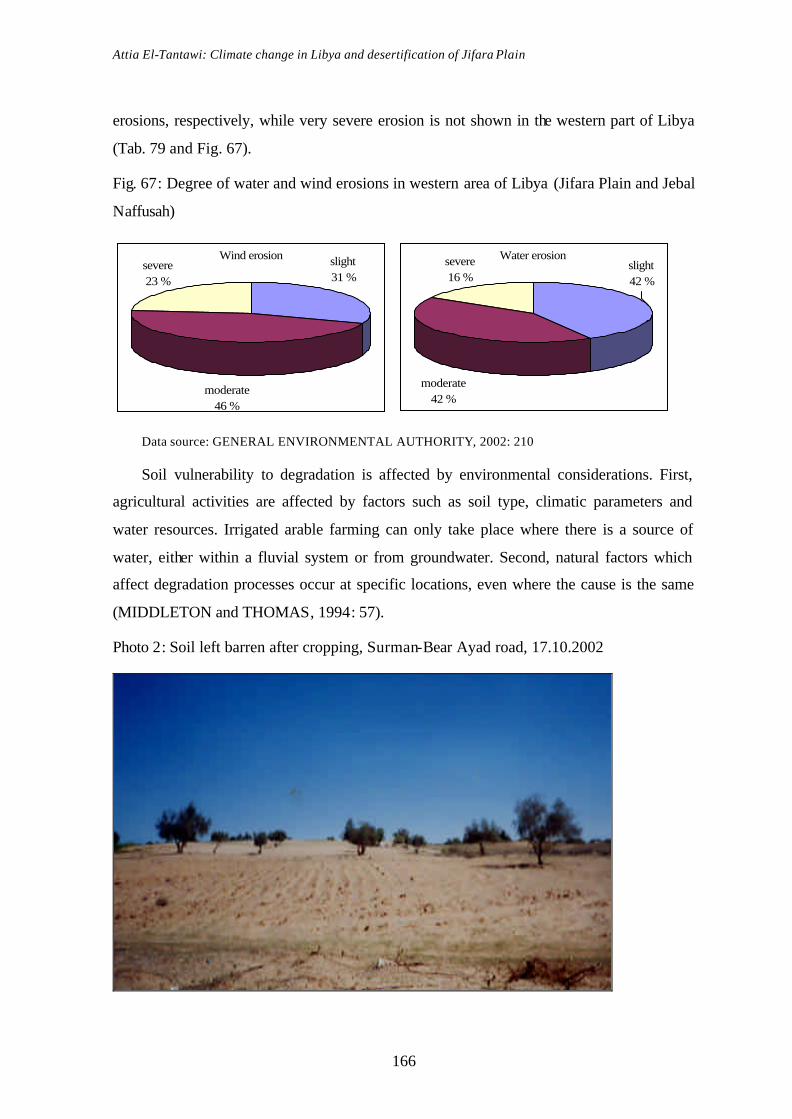
Attia El-Tantawi: Climate change in Libya and desertification of Jifara Plain
166
erosions, respectively, while very severe erosion is not shown in the western part of Libya
(Tab. 79 and Fig. 67).
Fig. 67: Degree of water and wind erosions in western area of Libya (Jifara Plain and Jebal
Naffusah)
Data source: GENERAL ENVIRONMENTAL AUTHORITY, 2002: 210
Soil vulnerability to degradation is affected by environmental considerations. First,
agricultural activities are affected by factors such as soil type, climatic parameters and
water resources. Irrigated arable farming can only take place where there is a source of
water, either within a fluvial system or from groundwater. Second, natural factors which
affect degradation processes occur at specific locations, even where the cause is the same
(MIDDLETON and THOMAS, 1994: 57).
Photo 2: Soil left barren after cropping, Surman-Bear Ayad road, 17.10.2002
Water erosionSevere16%
Slight42%
Moderate42%
Wind erosion
Moderate46%
Slight31%
Severe23%
Water erosionsevere16 %
slight42 %
moderate42 %
Wind erosion
moderate46 %
slight31 %
severe23 %

Attia El-Tantawi: Climate change in Libya and desertification of Jifara Plain
167
Another reason of land degradation is that, soils are left barren after cropping or after
crop failure are subjected to wind erosion (photo 2). It is important to bear in mind how
easily and quickly a soil, built up over long times, can be impoverished or destroyed by
unsuitable methods of cultivation, and that once destroyed, little can be done to restore the
soil. In sandy cultivated and fallow fields, erosion rates of 10 mm of top soil removed have
been measured in southern Tunisia for example (LE HOU´EROU, 1977: 26).
Causes of increasing loss of topsoil are mainly the removal of protective vegetation
cover by overgrazing and poor management practices on agricultural fields. Terrain
deformation plays a smaller role in degraded soils on a large scale; however, it is dominant
in some of the more vegetated regions showing a significant amount of soil degradation
(FEDDEMA, 1999: 573). Removal of fine topsoil materials means the loss of the most
productive and nutritious portions of the soil complex, while sterile sand accumulations
cover plants and good soil. In addition, the blasting impact of moving sand harms young
crops. Fine airborne particles may carry soil-borne diseases, irritate respiratory tracts of
humans and animals, cause wear on machinery parts and reduce visibility (PEREZ and
THOMPSON, 1995).
On rangelands where accelerate erosion processes, the gradual decrease in soil depth
translates into a loss of soil moisture storage capability which, in turn, can increase both
the frequency and length of periods without enough soil moisture for expected plant
growth (THUROW and TAYLOR, 1999: 415). Soil depth had the greatest effect on
recolonising plant cover, and depth was in turn affected by parent material. There is a
crit ical soil depth necessary for plants to survive and if the soil is thinner, erosion
processes will dominate.
With consequent increase in runoff, sheet and gully erosion set on sloping ground, and
the topsoil and its store are lost. The ability of a rain-shower to attack the structure of the
top-soil and to erode the soil surface depends upon the size of the raindrops and on the
intensity of the shower (WMO, 1983: 9). These changes result in an environment
inhospitable to plant growth and less suitable as pasture. With continuing erosion, formerly
productive lands may be lost through soil stripping and gully erosion (PEREZ and
THOMPSON, 1995). Soil compaction and crusting are the most serious forms of physical
degradation affecting several irrigated areas in Libya especially the sandy soils (BEN-
MAHMOUD, et al., 2000).
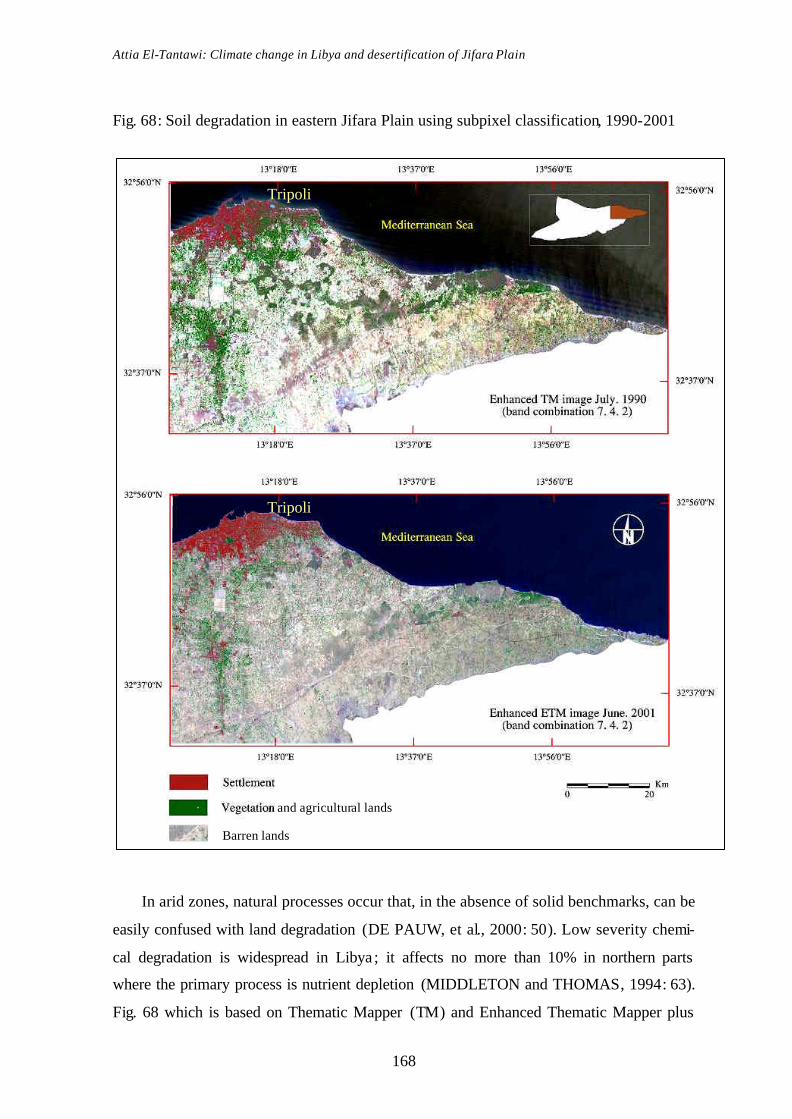
Attia El-Tantawi: Climate change in Libya and desertification of Jifara Plain
168
Fig. 68: Soil degradation in eastern Jifara Plain using subpixel classification, 1990-2001
In arid zones, natural processes occur that, in the absence of solid benchmarks, can be
easily confused with land degradation (DE PAUW, et al., 2000: 50). Low severity chemi-
cal degradation is widespread in Libya ; it affects no more than 10% in northern parts
where the primary process is nutrient depletion (MIDDLETON and THOMAS, 1994: 63).
Fig. 68 which is based on Thematic Mapper (TM) and Enhanced Thematic Mapper plus
Tripoli
Tripoli
and agricultural lands
Barren lands

Attia El-tantawi: Climate change in Libya and desertification of Jifara Plain
Fig. 69: Land degradation of El-Witia area, 1986-1996
Source: Modified after the Libyan Center for Remote Sensing and Space Science, Tripoli
Note: Vegetation is classified due to its intensity from 1-4
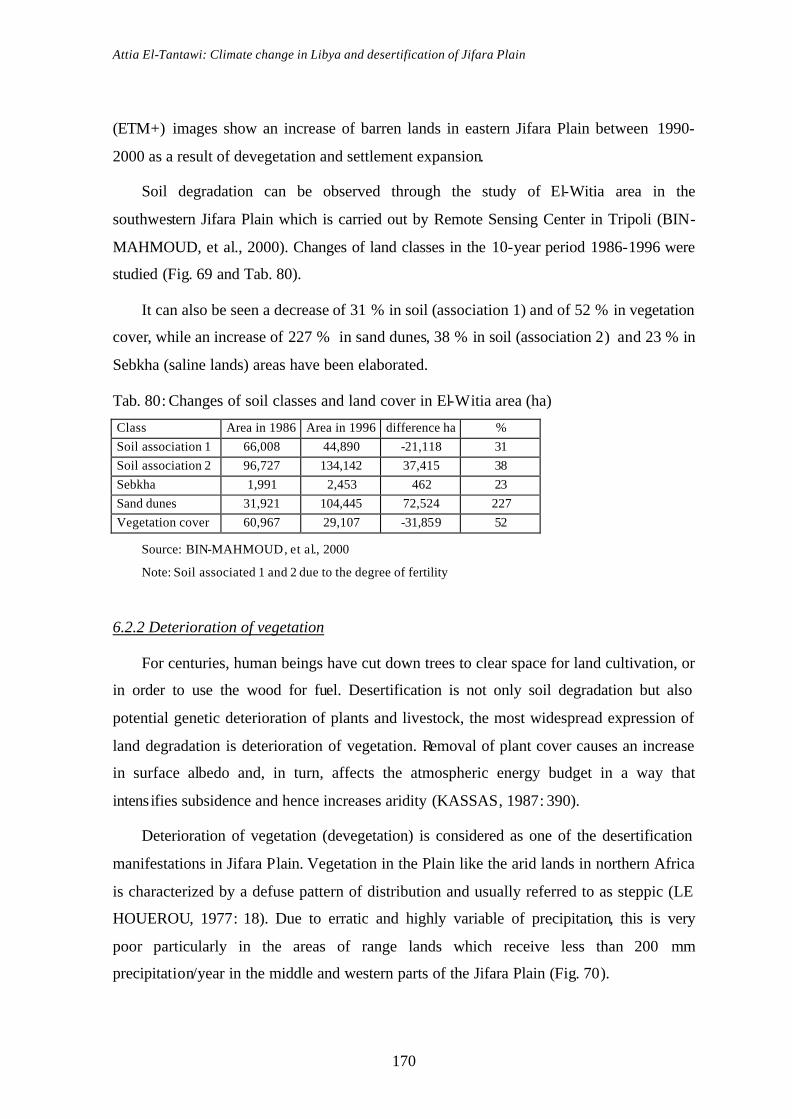
Attia El-Tantawi: Climate change in Libya and desertification of Jifara Plain
170
(ETM+) images show an increase of barren lands in eastern Jifara Plain between 1990-
2000 as a result of devegetation and settlement expansion.
Soil degradation can be observed through the study of El-Witia area in the
southwestern Jifara Plain which is carried out by Remote Sensing Center in Tripoli (BIN-
MAHMOUD, et al., 2000). Changes of land classes in the 10-year period 1986-1996 were
studied (Fig. 69 and Tab. 80).
It can also be seen a decrease of 31 % in soil (association 1) and of 52 % in vegetation
cover, while an increase of 227 % in sand dunes, 38 % in soil (association 2) and 23 % in
Sebkha (saline lands) areas have been elaborated.
Tab. 80: Changes of soil classes and land cover in El-Witia area (ha)
Class Area in 1986 Area in 1996 difference ha % Soil association 1 66,008 44,890 -21,118 31 Soil association 2 96,727 134,142 37,415 38 Sebkha 1,991 2,453 462 23 Sand dunes 31,921 104,445 72,524 227 Vegetation cover 60,967 29,107 -31,859 52
Source: BIN-MAHMOUD, et al., 2000
Note: Soil associated 1 and 2 due to the degree of fertility
6.2.2 Deterioration of vegetation
For centuries, human beings have cut down trees to clear space for land cultivation, or
in order to use the wood for fuel. Desertification is not only soil degradation but also
potential genetic deterioration of plants and livestock, the most widespread expression of
land degradation is deterioration of vegetation. Removal of plant cover causes an increase
in surface albedo and, in turn, affects the atmospheric energy budget in a way that
intensifies subsidence and hence increases aridity (KASSAS, 1987: 390).
Deterioration of vegetation (devegetation) is considered as one of the desertification
manifestations in Jifara Plain. Vegetation in the Plain like the arid lands in northern Africa
is characterized by a defuse pattern of distribution and usually referred to as steppic (LE
HOUEROU, 1977: 18). Due to erratic and highly variable of precipitation, this is very
poor particularly in the areas of range lands which receive less than 200 mm
precipitation/year in the middle and western parts of the Jifara Plain (Fig. 70).

Attia El-Tantawi: Climate change in Libya and desertification of Jifara Plain
171
Fig. 70: Vegetation intensity in Jifara Plain, 1977
Source: AMANAT EL-TAKHTIET, 1978: 55
Photo 3: State of vegetation in southern Jifara Plain, 4.11.2002

Attia El-Tantawi: Climate change in Libya and desertification of Jifara Plain
172
Generally, vegetation is sparse with little variety of species (photo 3) and can adapt
with climate conditions. The species which do grow are more or less drought-resistant.
Being xerophytes, they have a highly developed root system and their foliage is reduced to
a minimum; their leaves are filiform, dry and shiny, the epidermis thickened and cutinized.
Many species are spherical in shape, most of the bushes are spiny and prickly
(MESSINES, 1952). Remaining of forest named pistacia atlantic grows in Jifara plain
(UNEP, et al., 1996: 261).
In Jifara Plain, the steppe in the northern and eastern parts seems as spots and in the
western part is negligible. The thinning and death of vegetation in dry season increases the
extent of bare ground. This is followed, in turn, by a deterioration of the surface conditions
that are vital to plant growth. Practices such as shifting cultivation, bush burning or
overgrazing have been very destructive of the flora, and it is often difficult to distinguish
between primary and secondary growth. The arid steppes of northern Africa are chiefly of
a secondary nature, originated from a pristine xerophilous open forest and woodland
through a over-grazing process which affects both soil and vegetation, via the nature and
distribution of the organic matter in the soil profile. As a matter of fact, about 50 % of the
steppes have been cleared for cultivation over the past 80 years (LE HOU´EROU, 2001:
126).
Photo 4: Deforestation in Elzawia area, in northern Jifara Plain, 03.11.2002
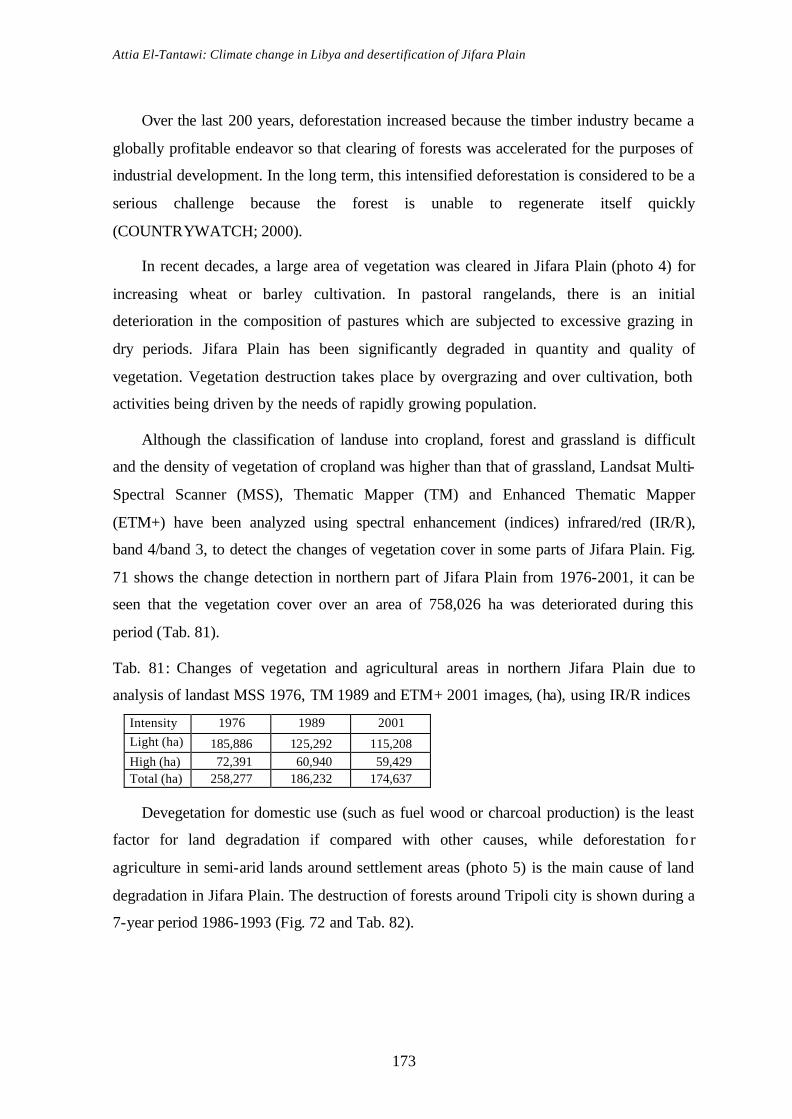
Attia El-Tantawi: Climate change in Libya and desertification of Jifara Plain
173
Over the last 200 years, deforestation increased because the timber industry became a
globally profitable endeavor so that clearing of forests was accelerated for the purposes of
industrial development. In the long term, this intensified deforestation is considered to be a
serious challenge because the forest is unable to regenerate itself quickly
(COUNTRYWATCH; 2000).
In recent decades, a large area of vegetation was cleared in Jifara Plain (photo 4) for
increasing wheat or barley cultivation. In pastoral rangelands, there is an initial
deterioration in the composition of pastures which are subjected to excessive grazing in
dry periods. Jifara Plain has been significantly degraded in quantity and quality of
vegetation. Vegetation destruction takes place by overgrazing and over cultivation, both
activities being driven by the needs of rapidly growing population.
Although the classification of landuse into cropland, forest and grassland is difficult
and the density of vegetation of cropland was higher than that of grassland, Landsat Multi-
Spectral Scanner (MSS), Thematic Mapper (TM) and Enhanced Thematic Mapper
(ETM+) have been analyzed using spectral enhancement (indices) infrared/red (IR/R),
band 4/band 3, to detect the changes of vegetation cover in some parts of Jifara Plain. Fig.
71 shows the change detection in northern part of Jifara Plain from 1976-2001, it can be
seen that the vegetation cover over an area of 758,026 ha was deteriorated during this
period (Tab. 81).
Tab. 81: Changes of vegetation and agricultural areas in northern Jifara Plain due to
analysis of landast MSS 1976, TM 1989 and ETM+ 2001 images, (ha), using IR/R indices
Intensity 1976 1989 2001 Light (ha) 185,886 125,292 115,208 High (ha) 72,391 60,940 59,429 Total (ha) 258,277 186,232 174,637
Devegetation for domestic use (such as fuel wood or charcoal production) is the least
factor for land degradation if compared with other causes, while deforestation fo r
agriculture in semi-arid lands around settlement areas (photo 5) is the main cause of land
degradation in Jifara Plain. The destruction of forests around Tripoli city is shown during a
7-year period 1986-1993 (Fig. 72 and Tab. 82).
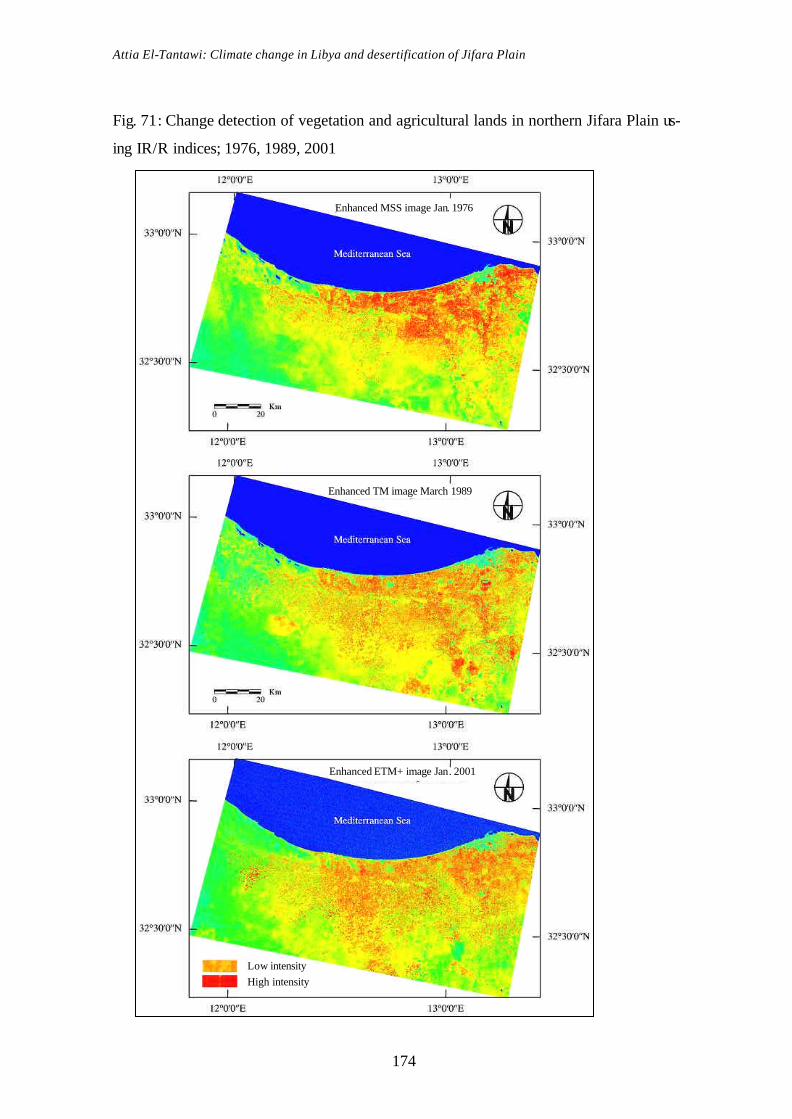
Attia El-Tantawi: Climate change in Libya and desertification of Jifara Plain
174
Fig. 71: Change detection of vegetation and agricultural lands in northern Jifara Plain us-
ing IR/R indices; 1976, 1989, 2001
High intensity Low intensity High intensity Low intensity
High intensity Low intensity High intensity Low intensity
Enhanced MSS image Jan. 1976
Enhanced TM image March 1989
Enhanced ETM+ image Jan. 2001

Attia El-Tantawi: Climate change in Libya and desertification of Jifara Plain
175
Photo 5: Vegetation deterioration in Elzawia, northern Jifara Plain, 17.10.2002
Fig. 72: Deforestation around Tripoli city, 1986-1993 (ha)
0
1000
2000
3000
4000
5000
6000
Ein Zara ElhadabaElkhadra
ElhashanElgharby
Elnasr Elmayah Gouddaem Tlil
ha
1986 1993
Data source: KREDEGH, 2002: 47
It can be deduced that the forest of Jifara Plain are subjected to severe destruction in
Elhadaba Elkhadra and Ein Zara, most of the forest in the first case and about 40 % in the
second case were cleared in seven years only. Moderate destruction at Elhashan Elgharby
(33 %) and Tlil 25 % is observed, while the remaining forests were not experienced to
destruction from 1986-1993. The deterioration of vegetation caused by people will affect
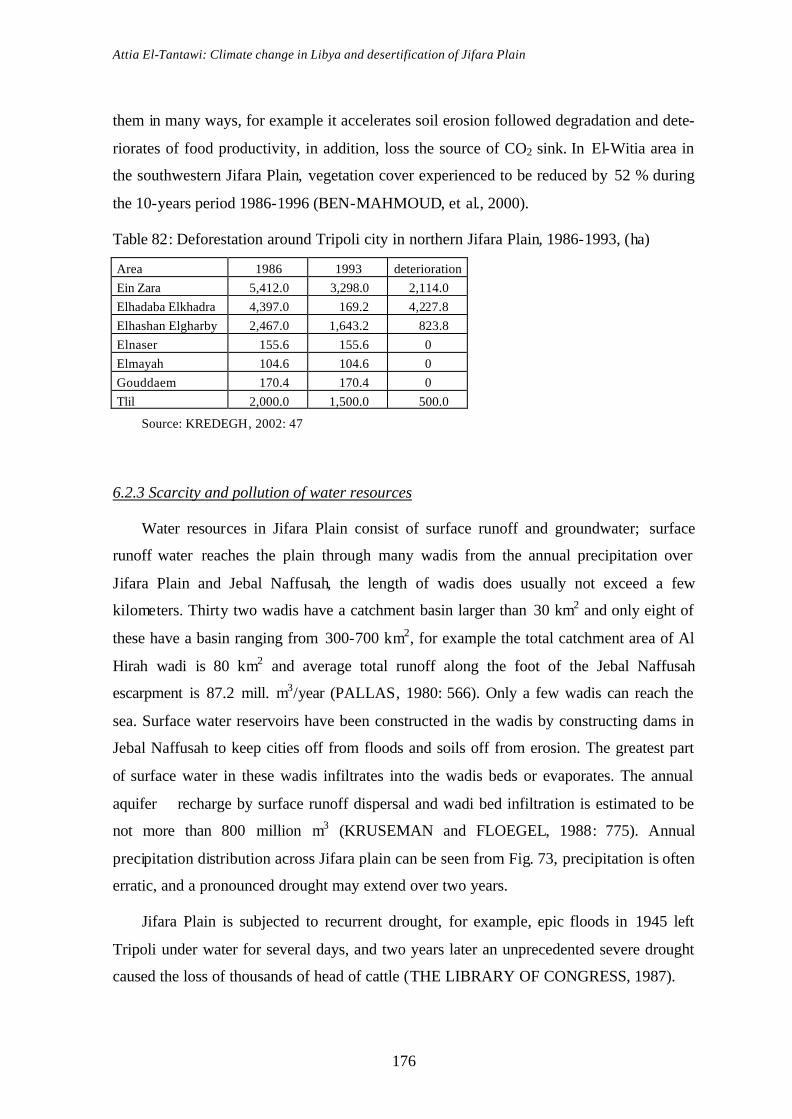
Attia El-Tantawi: Climate change in Libya and desertification of Jifara Plain
176
them in many ways, for example it accelerates soil erosion followed degradation and dete-
riorates of food productivity, in addition, loss the source of CO2 sink. In El-Witia area in
the southwestern Jifara Plain, vegetation cover experienced to be reduced by 52 % during
the 10-years period 1986-1996 (BEN-MAHMOUD, et al., 2000).
Table 82: Deforestation around Tripoli city in northern Jifara Plain, 1986-1993, (ha)
Area 1986 1993 deterioration Ein Zara 5,412.0 3,298.0 2,114.0 Elhadaba Elkhadra 4,397.0 169.2 4,227.8 Elhashan Elgharby 2,467.0 1,643.2 823.8 Elnaser 155.6 155.6 0 Elmayah 104.6 104.6 0 Gouddaem 170.4 170.4 0 Tlil 2,000.0 1,500.0 500.0
Source: KREDEGH, 2002: 47
6.2.3 Scarcity and pollution of water resources
Water resources in Jifara Plain consist of surface runoff and groundwater; surface
runoff water reaches the plain through many wadis from the annual precipitation over
Jifara Plain and Jebal Naffusah, the length of wadis does usually not exceed a few
kilometers. Thirty two wadis have a catchment basin larger than 30 km2 and only eight of
these have a basin ranging from 300-700 km2, for example the total catchment area of Al
Hirah wadi is 80 km2 and average total runoff along the foot of the Jebal Naffusah
escarpment is 87.2 mill. m3/year (PALLAS, 1980: 566). Only a few wadis can reach the
sea. Surface water reservoirs have been constructed in the wadis by constructing dams in
Jebal Naffusah to keep cities off from floods and soils off from erosion. The greatest part
of surface water in these wadis infiltrates into the wadis beds or evaporates. The annual
aquifer recharge by surface runoff dispersal and wadi bed infiltration is estimated to be
not more than 800 million m3 (KRUSEMAN and FLOEGEL, 1988: 775). Annual
precipitation distribution across Jifara plain can be seen from Fig. 73, precipitation is often
erratic, and a pronounced drought may extend over two years.
Jifara Plain is subjected to recurrent drought, for example, epic floods in 1945 left
Tripoli under water for several days, and two years later an unprecedented severe drought
caused the loss of thousands of head of cattle (THE LIBRARY OF CONGRESS, 1987).

Attia El-Tantawi: Climate change in Libya and desertification of Jifara Plain
177
Fig. 73: Annual precipitation distribution over Jifara Plain (isohyets)
Data source: Libyan Meteorological Department, Tripoli
Jifara Plain suffers from severe hydrological drought; water behind dams experienced
to be decreased or disappeared (GENERAL ENVIRONMENTAL AUTHORITY, 2002:
206) resulting from erratic and great variabilities of precipitation. Benefited precipitation
in Jifara Plain is only 15-20 %, while lost water is 70-78 % through evaporation, 2 %
waste to the sea and 5 % infiltrate into the soil (KSOUDH, 1996: 329). In addition, high
temporal and spatial variabilities of precipitation lead to a greater variability of short
duration runoff, accelerated soil erosion by water and high sediment transport rates. Water
scarcity seriously affects pastoral and agriculture activities in Jifara plain.
Water balance, computed after Thornthwaite at three stations (Fig. 74), clarifies a big
gap between precipitation and evapotranspiration. It can be noticed that water deficit
prevails for nine, eight and nine months per year at Al-Azizia, Tripoli city and Zuara,
respectively. It can also be seen that during summer, spring and autumn, water demand is
greater than water supply by precipitation. As a result, vegetation suffers from deficiency
of water, as well as soil moisture and accelerates water scarcity.
Groundwater is the major source of water in Jifara Plain. The upper aquifer (Miocene-
Pliocene-Pleistocene) collects water under unconfined conditions and extends throughout
the Plain; it is 100-150 m thick and contains good quality water in the central and eastern
parts, the middle Miocene aquifer is well developed in the western part of the Plain and
found at 70-120 m below the surface with thickness of the aquifer between 125-200 m.

Attia El-Tantawi: Climate change in Libya and desertification of Jifara Plain
178
Fig. 74: Water balance, after Thornthwaite, at three stations in Jifara Plain
Al Azizia
0
50
100
150
200
250
JA
N.
FE
B.
M
AR
.
A
PR.
M
AY
JU
N.
JU
L.
A
UG
.
SE
P.
O
CT.
N
OV
.
D
EC.
mm soil moisture storageprecipitationpotential evapotranspirationwater deficitactual evaporation
Tripoli city
0
50
100
150
200
250
JA
N.
FE
B.
M
AR
.
A
PR.
M
AY
JU
N.
JU
L.
A
UG
.
SE
P.
O
CT.
N
OV
.
D
EC.
mm soil moisture storageprecipitationpotential evapotranspirationwater deficitactual evaporation
Zuara
0
50
100
150
200
250
JA
N.
FE
B.
M
AR
.
A
PR.
M
AY
JU
N.
JU
L.
A
UG
.
SE
P.
O
CT.
N
OV
.
D
EC.
mm soil moisture storageprecipitationpotential evapotranspirationwater deficitactual evaporation
Data source: THORNTHWAITE, 1962: 117

Attia El-Tantawi: Climate change in Libya and desertification of Jifara Plain
179
Clay layers separate the aquifer from the quaternary and lower Miocene aquifers (SADEG,
and KARAHANOLU, 2001: 1155). Ground water is mainly recharged from precipitation,
infiltration from surface runoff which inflows from the south.
The scarcity of water was aggravated by water level declines and quality deterioration.
Water level declines over 1 m/year in some parts (Fig. 75) and total dissolved solids have
exceeded 9,000 mg/liter in the last four decades (ABUFAYED and EL-GHUEL, 2001:
49). Water levels have dropped at most parts and, along the southern boundary, drawdown
of more than 30 meter is recorded. In addition, water levels often drop below sea level,
presumably because of excessive discharge from a well field located in this profile
(SADEG, and KARAHANOLU, 2001: 1161). In 1968, ground water level decreased 1 m
in some areas around Tripoli and it was experienced to sea water intrusion (BAQI, 1991:
119).
Fig. 75: Annual decrease of groundwater in different parts of Jifara Plain
-3
-2.5
-2
-1.5
-1
-0.5
0
Met
re
Qurabolli Tagoraa Ein zarah Tripoli Elghiran Elsaadia Binghasher
Data source: ELTANTAWI, 1998a, after, ELGHTISY, 1990
Over-extraction of groundwater in the coastal parts, particularly, in eastern Jifara
Plain, has led to a continuous decline in the groundwater level and sea water intrusion
which is estimated to be advancing at a rate of 100-250 m/year. If this over-extraction is
not stopped or reversed, it is expected to deteriorate all productive aquifers by the near
future (BIN-MAHMOUD, et al., 2000). A serious deficiency was thus produced between
the natural water supply and the quantities exploited; it is estimated, for instance, that over
one billion cubic meters are annually taken from the reservoir of Jifara Plain, where farm-
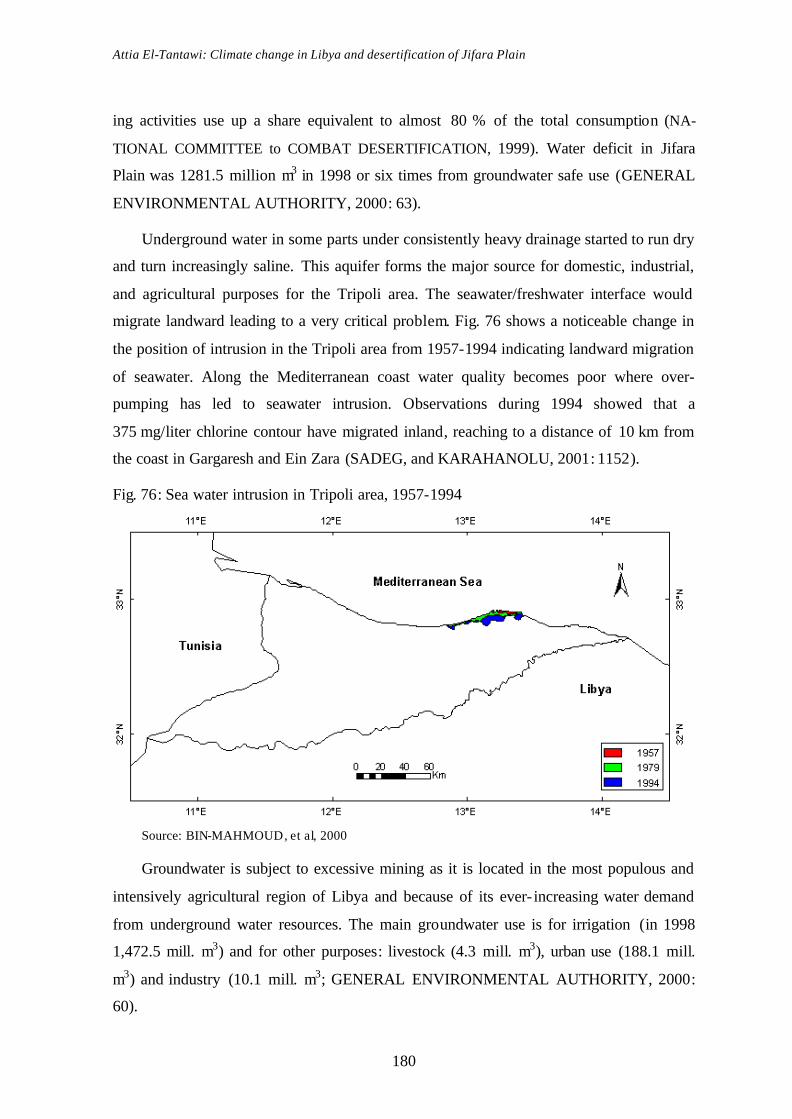
Attia El-Tantawi: Climate change in Libya and desertification of Jifara Plain
180
ing activities use up a share equivalent to almost 80 % of the total consumption (NA-
TIONAL COMMITTEE to COMBAT DESERTIFICATION, 1999). Water deficit in Jifara
Plain was 1281.5 million m3 in 1998 or six times from groundwater safe use (GENERAL
ENVIRONMENTAL AUTHORITY, 2000: 63).
Underground water in some parts under consistently heavy drainage started to run dry
and turn increasingly saline. This aquifer forms the major source for domestic, industrial,
and agricultural purposes for the Tripoli area. The seawater/freshwater interface would
migrate landward leading to a very critical problem. Fig. 76 shows a noticeable change in
the position of intrusion in the Tripoli area from 1957-1994 indicating landward migration
of seawater. Along the Mediterranean coast water quality becomes poor where over-
pumping has led to seawater intrusion. Observations during 1994 showed that a
375 mg/liter chlorine contour have migrated inland, reaching to a distance of 10 km from
the coast in Gargaresh and Ein Zara (SADEG, and KARAHANOLU, 2001: 1152).
Fig. 76: Sea water intrusion in Tripoli area, 1957-1994
Source: BIN-MAHMOUD, et al, 2000
Groundwater is subject to excessive mining as it is located in the most populous and
intensively agricultural region of Libya and because of its ever- increasing water demand
from underground water resources. The main groundwater use is for irrigation (in 1998
1,472.5 mill. m3) and for other purposes: livestock (4.3 mill. m3), urban use (188.1 mill.
m3) and industry (10.1 mill. m3; GENERAL ENVIRONMENTAL AUTHORITY, 2000:
60).
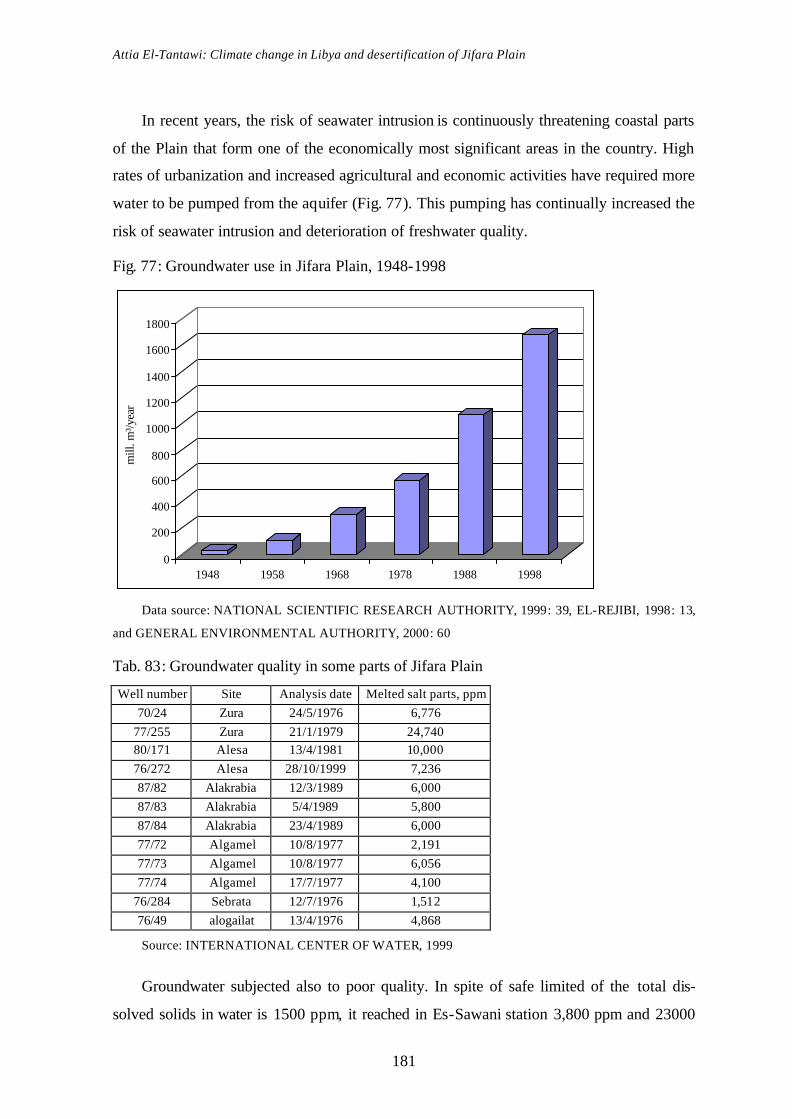
Attia El-Tantawi: Climate change in Libya and desertification of Jifara Plain
181
In recent years, the risk of seawater intrusion is continuously threatening coastal parts
of the Plain that form one of the economically most significant areas in the country. High
rates of urbanization and increased agricultural and economic activities have required more
water to be pumped from the aquifer (Fig. 77). This pumping has continually increased the
risk of seawater intrusion and deterioration of freshwater quality.
Fig. 77: Groundwater use in Jifara Plain, 1948-1998
0
200
400
600
800
1000
1200
1400
1600
1800
mill
. m³/y
ear
1948 1958 1968 1978 1988 1998
Data source: NATIONAL SCIENTIFIC RESEARCH AUTHORITY, 1999: 39, EL-REJIBI, 1998: 13,
and GENERAL ENVIRONMENTAL AUTHORITY, 2000: 60
Tab. 83: Groundwater quality in some parts of Jifara Plain
Well number Site Analysis date Melted salt parts, ppm 70/24 Zura 24/5/1976 6,776
77/255 Zura 21/1/1979 24,740 80/171 Alesa 13/4/1981 10,000 76/272 Alesa 28/10/1999 7,236 87/82 Alakrabia 12/3/1989 6,000 87/83 Alakrabia 5/4/1989 5,800 87/84 Alakrabia 23/4/1989 6,000 77/72 Algamel 10/8/1977 2,191 77/73 Algamel 10/8/1977 6,056 77/74 Algamel 17/7/1977 4,100
76/284 Sebrata 12/7/1976 1,512 76/49 alogailat 13/4/1976 4,868
Source: INTERNATIONAL CENTER OF WATER, 1999
Groundwater subjected also to poor quality. In spite of safe limited of the total dis-
solved solids in water is 1500 ppm, it reached in Es-Sawani station 3,800 ppm and 23000
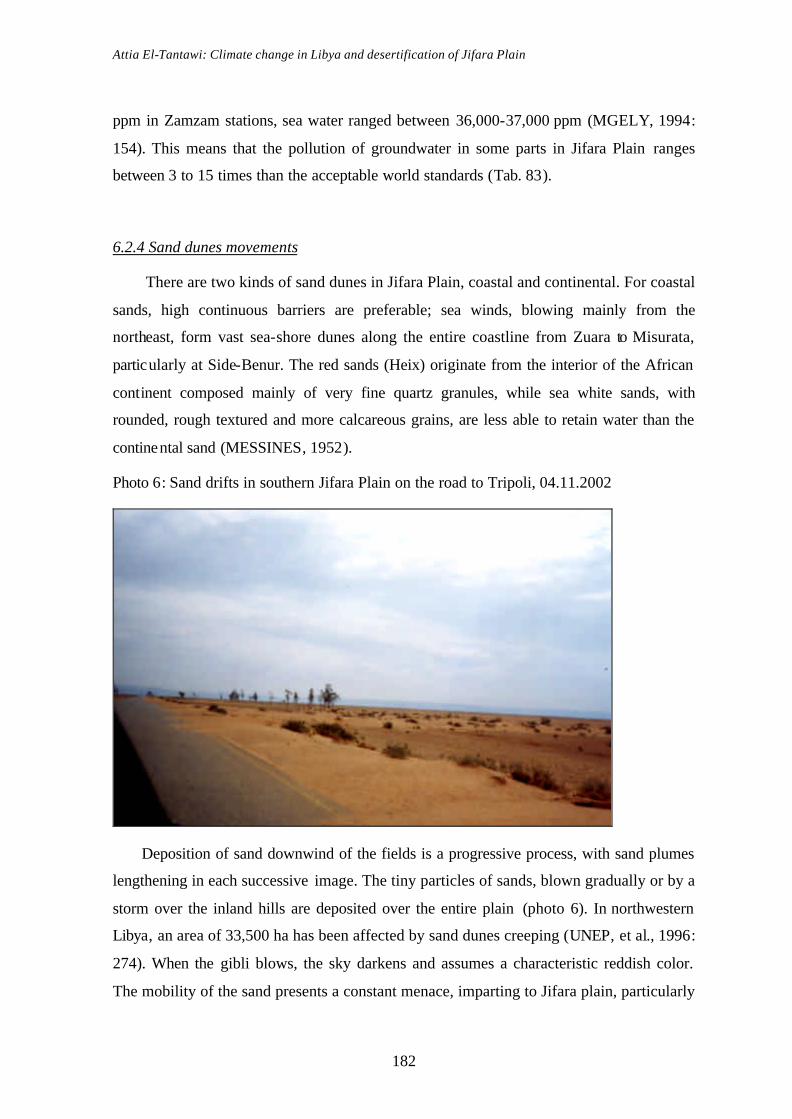
Attia El-Tantawi: Climate change in Libya and desertification of Jifara Plain
182
ppm in Zamzam stations, sea water ranged between 36,000-37,000 ppm (MGELY, 1994:
154). This means that the pollution of groundwater in some parts in Jifara Plain ranges
between 3 to 15 times than the acceptable world standards (Tab. 83).
6.2.4 Sand dunes movements
There are two kinds of sand dunes in Jifara Plain, coastal and continental. For coastal
sands, high continuous barriers are preferable; sea winds, blowing mainly from the
northeast, form vast sea-shore dunes along the entire coastline from Zuara to Misurata,
particularly at Side-Benur. The red sands (Heix) originate from the interior of the African
continent composed mainly of very fine quartz granules, while sea white sands, with
rounded, rough textured and more calcareous grains, are less able to retain water than the
continental sand (MESSINES, 1952).
Photo 6: Sand drifts in southern Jifara Plain on the road to Tripoli, 04.11.2002
Deposition of sand downwind of the fields is a progressive process, with sand plumes
lengthening in each successive image. The tiny particles of sands, blown gradually or by a
storm over the inland hills are deposited over the entire plain (photo 6). In northwestern
Libya, an area of 33,500 ha has been affected by sand dunes creeping (UNEP, et al., 1996:
274). When the gibli blows, the sky darkens and assumes a characteristic reddish color.
The mobility of the sand presents a constant menace, imparting to Jifara plain, particularly
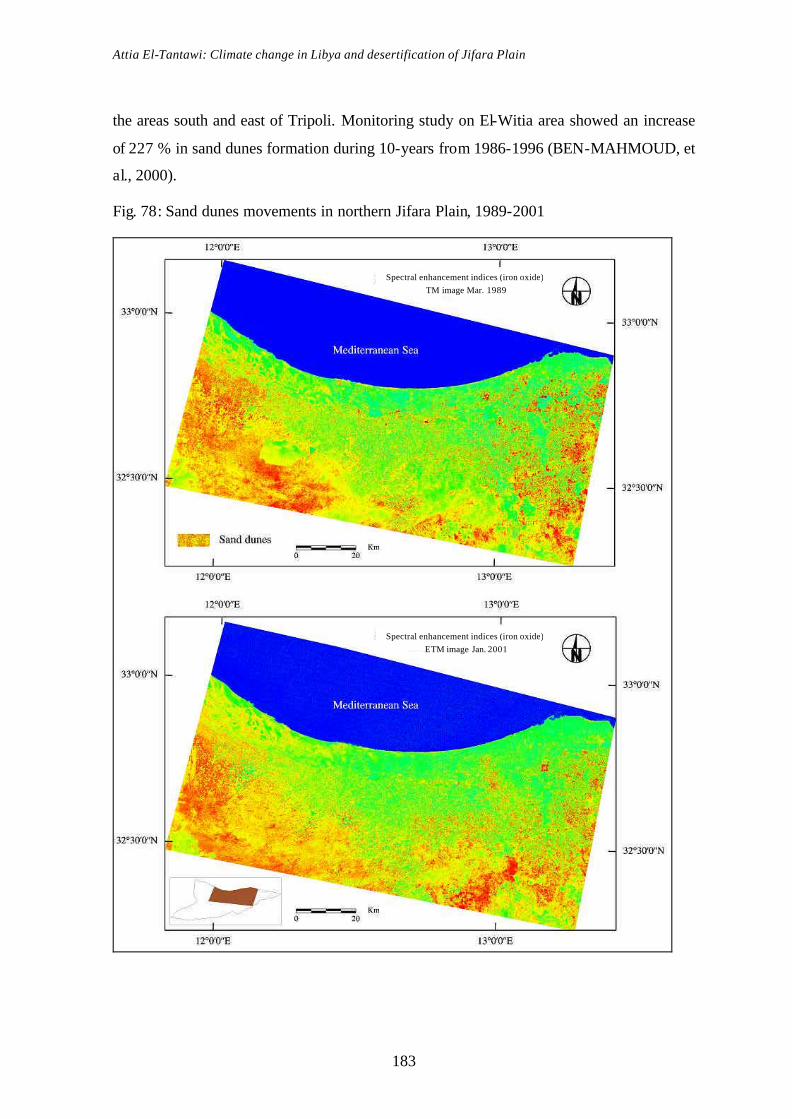
Attia El-Tantawi: Climate change in Libya and desertification of Jifara Plain
183
the areas south and east of Tripoli. Monitoring study on El-Witia area showed an increase
of 227 % in sand dunes formation during 10-years from 1986-1996 (BEN-MAHMOUD, et
al., 2000).
Fig. 78: Sand dunes movements in northern Jifara Plain, 1989-2001
Spectral enhancement indices (iron oxide) TM image Mar. 1989
Spectral enhancement indices (iron oxide) ETM image Jan. 2001

Attia El-Tantawi: Climate change in Libya and desertification of Jifara Plain
184
Fig. 79: Sand dunes movements in the southern of Jifara Plain; 1987-2000
The arable lands in the coastal parts of Libya are steadily invaded by fine-grained,
rust-red sand. Landsat images Thematic Mapper (TM) and Enhanced Thematic Mapper
(ETM+) have been analyzed using spectral enhancement (indices) Iron oxide, band 3 /
band 1, to detect the movements of sands in northern and southern Jifara Plain (Figs. 78
and 79). It can be observed that the sand areas were expanded over Jifara plain from 1989-
2001. In the northern Plain (over an area of 758,026.2 ha), the sand covered area has in-
creased from 430,154.6 ha in 1989 to 450,636.3 in 2001. In southern Jifara Plain (over an
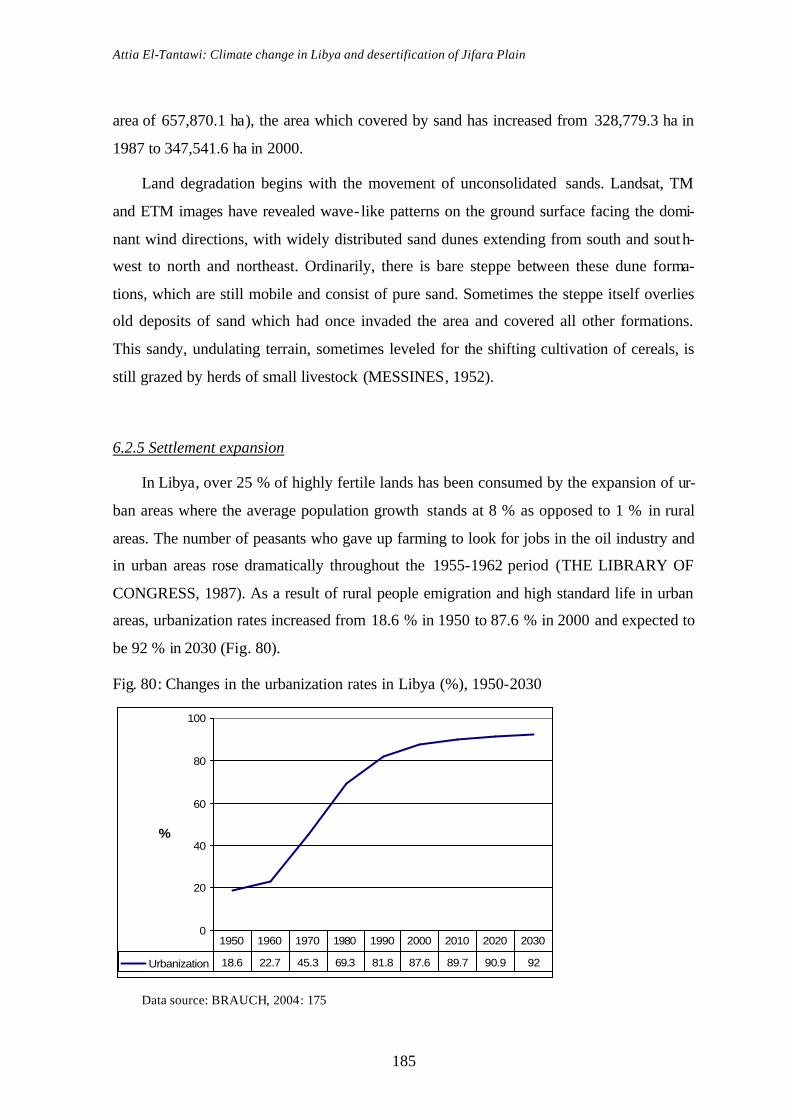
Attia El-Tantawi: Climate change in Libya and desertification of Jifara Plain
185
area of 657,870.1 ha), the area which covered by sand has increased from 328,779.3 ha in
1987 to 347,541.6 ha in 2000.
Land degradation begins with the movement of unconsolidated sands. Landsat, TM
and ETM images have revealed wave- like patterns on the ground surface facing the domi-
nant wind directions, with widely distributed sand dunes extending from south and south-
west to north and northeast. Ordinarily, there is bare steppe between these dune forma-
tions, which are still mobile and consist of pure sand. Sometimes the steppe itself overlies
old deposits of sand which had once invaded the area and covered all other formations.
This sandy, undulating terrain, sometimes leveled for the shifting cultivation of cereals, is
still grazed by herds of small livestock (MESSINES, 1952).
6.2.5 Settlement expansion
In Libya, over 25 % of highly fertile lands has been consumed by the expansion of ur-
ban areas where the average population growth stands at 8 % as opposed to 1 % in rural
areas. The number of peasants who gave up farming to look for jobs in the oil industry and
in urban areas rose dramatically throughout the 1955-1962 period (THE LIBRARY OF
CONGRESS, 1987). As a result of rural people emigration and high standard life in urban
areas, urbanization rates increased from 18.6 % in 1950 to 87.6 % in 2000 and expected to
be 92 % in 2030 (Fig. 80).
Fig. 80: Changes in the urbanization rates in Libya (%), 1950-2030
0
20
40
60
80
100
%
Urbanization 18.6 22.7 45.3 69.3 81.8 87.6 89.7 90.9 92
1950 1960 1970 1980 1990 2000 2010 2020 2030
Data source: BRAUCH, 2004: 175
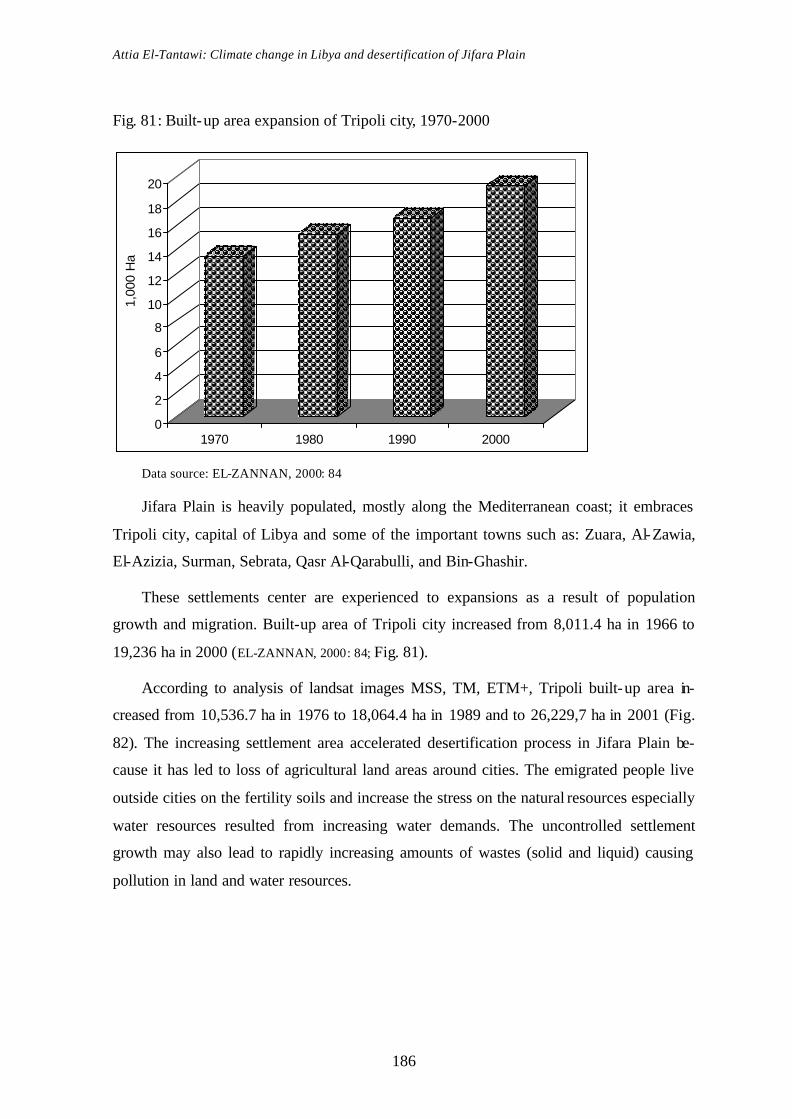
Attia El-Tantawi: Climate change in Libya and desertification of Jifara Plain
186
Fig. 81: Built-up area expansion of Tripoli city, 1970-2000
0
2
4
6
8
10
12
14
16
18
20
1,00
0 H
a
1970 1980 1990 2000
Data source: EL-ZANNAN, 2000: 84
Jifara Plain is heavily populated, mostly along the Mediterranean coast; it embraces
Tripoli city, capital of Libya and some of the important towns such as: Zuara, Al-Zawia,
El-Azizia, Surman, Sebrata, Qasr Al-Qarabulli, and Bin-Ghashir.
These settlements center are experienced to expansions as a result of population
growth and migration. Built-up area of Tripoli city increased from 8,011.4 ha in 1966 to
19,236 ha in 2000 (EL-ZANNAN, 2000: 84; Fig. 81).
According to analysis of landsat images MSS, TM, ETM+, Tripoli built-up area in-
creased from 10,536.7 ha in 1976 to 18,064.4 ha in 1989 and to 26,229,7 ha in 2001 (Fig.
82). The increasing settlement area accelerated desertification process in Jifara Plain be-
cause it has led to loss of agricultural land areas around cities. The emigrated people live
outside cities on the fertility soils and increase the stress on the natural resources especially
water resources resulted from increasing water demands. The uncontrolled settlement
growth may also lead to rapidly increasing amounts of wastes (solid and liquid) causing
pollution in land and water resources.
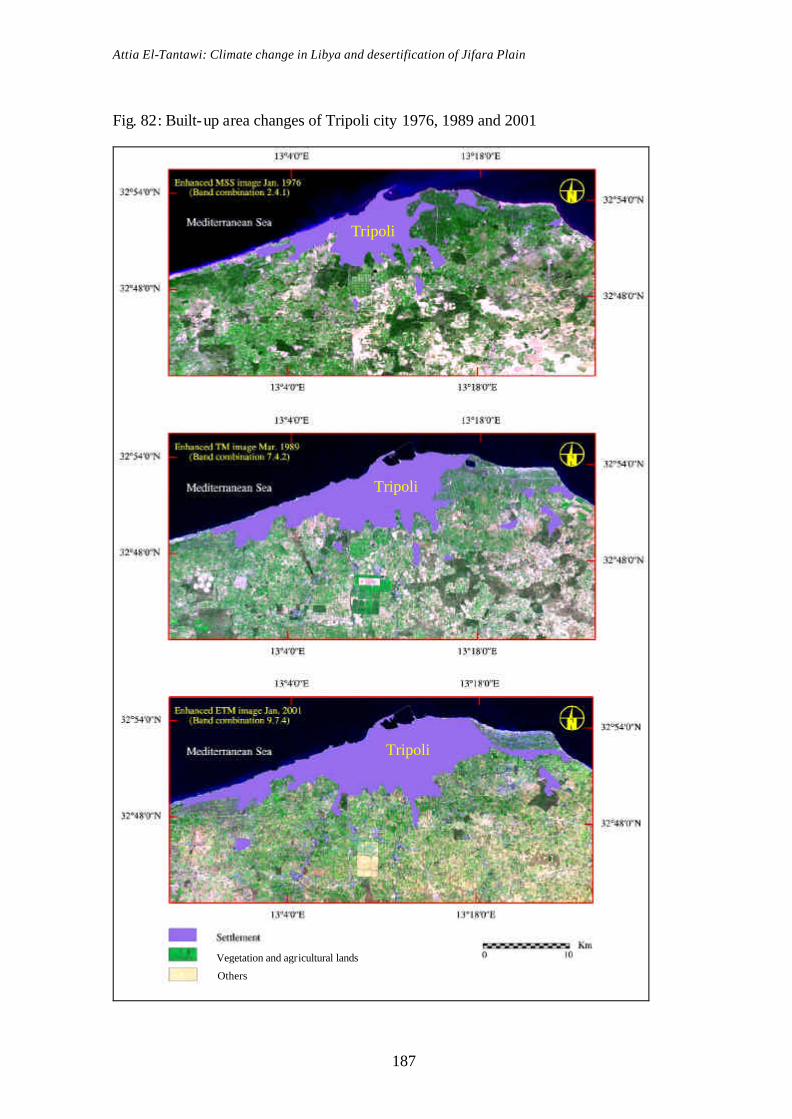
Attia El-Tantawi: Climate change in Libya and desertification of Jifara Plain
187
Fig. 82: Built-up area changes of Tripoli city 1976, 1989 and 2001
Tripoli
Tripoli
Tripoli
Vegetation and agricultural lands
Others
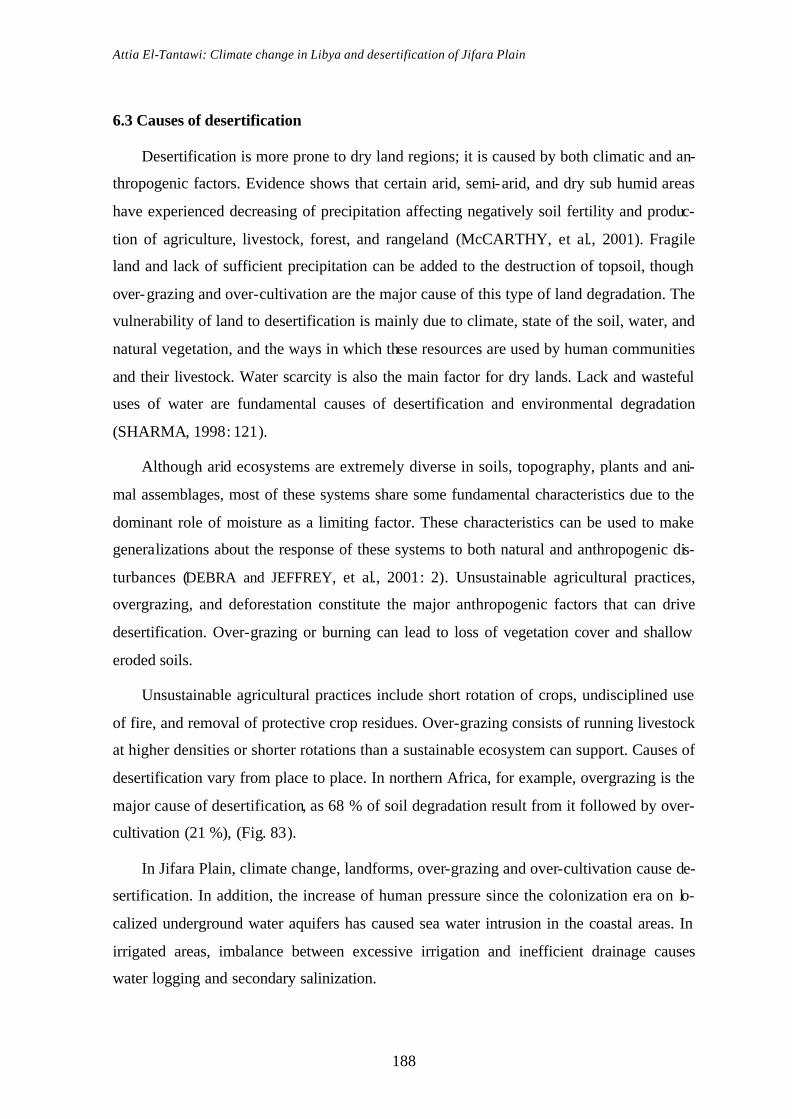
Attia El-Tantawi: Climate change in Libya and desertification of Jifara Plain
188
6.3 Causes of desertification
Desertification is more prone to dry land regions; it is caused by both climatic and an-
thropogenic factors. Evidence shows that certain arid, semi-arid, and dry sub humid areas
have experienced decreasing of precipitation affecting negatively soil fertility and produc-
tion of agriculture, livestock, forest, and rangeland (McCARTHY, et al., 2001). Fragile
land and lack of sufficient precipitation can be added to the destruction of topsoil, though
over-grazing and over-cultivation are the major cause of this type of land degradation. The
vulnerability of land to desertification is mainly due to climate, state of the soil, water, and
natural vegetation, and the ways in which these resources are used by human communities
and their livestock. Water scarcity is also the main factor for dry lands. Lack and wasteful
uses of water are fundamental causes of desertification and environmental degradation
(SHARMA, 1998: 121).
Although arid ecosystems are extremely diverse in soils, topography, plants and ani-
mal assemblages, most of these systems share some fundamental characteristics due to the
dominant role of moisture as a limiting factor. These characteristics can be used to make
generalizations about the response of these systems to both natural and anthropogenic dis-
turbances (DEBRA and JEFFREY, et al., 2001: 2). Unsustainable agricultural practices,
overgrazing, and deforestation constitute the major anthropogenic factors that can drive
desertification. Over-grazing or burning can lead to loss of vegetation cover and shallow
eroded soils.
Unsustainable agricultural practices include short rotation of crops, undisciplined use
of fire, and removal of protective crop residues. Over-grazing consists of running livestock
at higher densities or shorter rotations than a sustainable ecosystem can support. Causes of
desertification vary from place to place. In northern Africa, for example, overgrazing is the
major cause of desertification, as 68 % of soil degradation result from it followed by over-
cultivation (21 %), (Fig. 83).
In Jifara Plain, climate change, landforms, over-grazing and over-cultivation cause de-
sertification. In addition, the increase of human pressure since the colonization era on lo-
calized underground water aquifers has caused sea water intrusion in the coastal areas. In
irrigated areas, imbalance between excessive irrigation and inefficient drainage causes
water logging and secondary salinization.

Attia El-Tantawi: Climate change in Libya and desertification of Jifara Plain
189
Fig. 83: Causes of soil degradation in North Africa
0.5 %
21 %
68 %
10.5 %
over-grazing
over-cultivation
over-exploitation
deforestation
Data source: MIDDLETON, and THOMAS, 1994: 71
6.3.1 Climate change
The conditions of desertification are dictated by climatic factors since the process oc-
curs mainly in arid, semi-arid and dry sub-humid regions. The reduction in moisture avail-
ability projected under climate change would both increase aridity of existing drylands and
progressively shift the boundaries of areas susceptible to desertification (JACQUELINE,
2000).
According to the De Martonne climate classification, Jifara Plain is classified by arid
climate in the west, semi-arid climate in the middle and dry sub-humid climate in the east
(Fig. 84). These climate types are characterized by a high level of incident radiation, high
seasonal temperature variations, low humidity and strong winds with frequent dust storms.
Precipitation is generally intense and sporadic.
Higher temperatures could result in a reduction of soil fertility due to higher rates of
decomposition and losses of organic matter, and could affect nutrient cycling (DUBIEF,
1971: 281). Precipitation and temperature data at 10 meteorological stations were elabo-
rated to clarify the aridity index trends from 1975-2000 in Jifara Plain, after De Martonne
(Tab. 84).
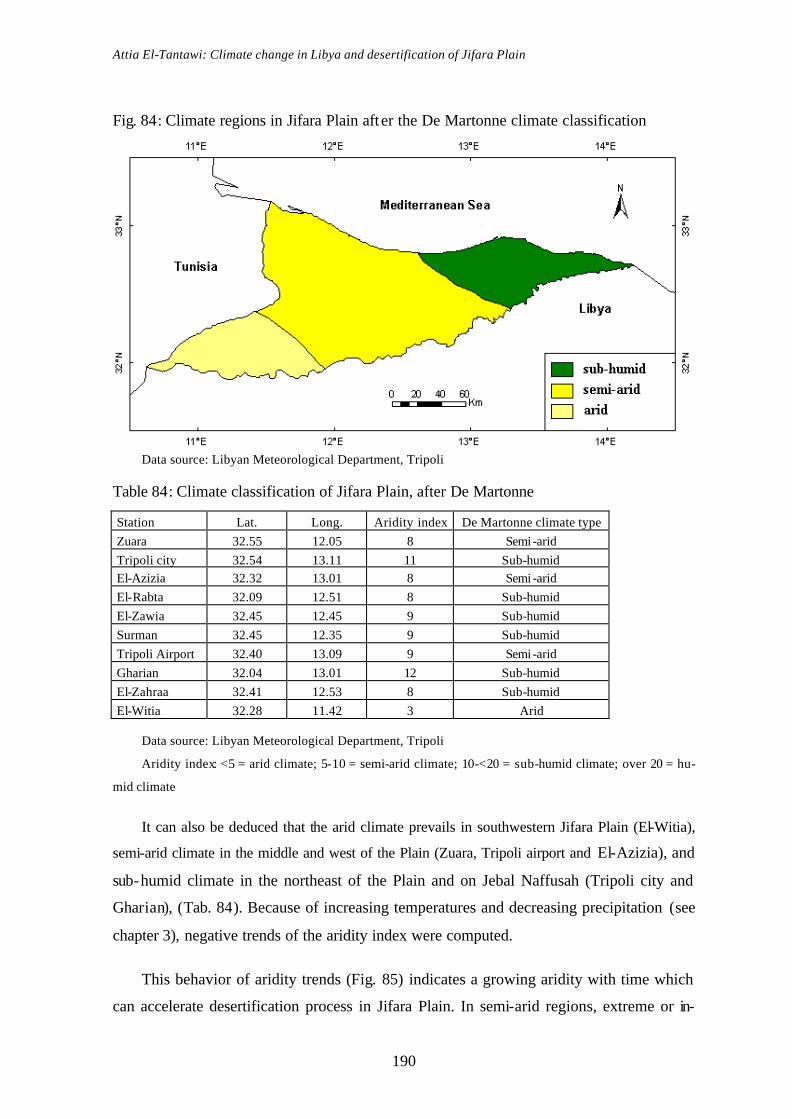
Attia El-Tantawi: Climate change in Libya and desertification of Jifara Plain
190
Fig. 84: Climate regions in Jifara Plain aft er the De Martonne climate classification
Data source: Libyan Meteorological Department, Tripoli
Table 84: Climate classification of Jifara Plain, after De Martonne
Station Lat. Long. Aridity index De Martonne climate type Zuara 32.55 12.05 8 Semi -arid Tripoli city 32.54 13.11 11 Sub-humid El-Azizia 32.32 13.01 8 Semi -arid El-Rabta 32.09 12.51 8 Sub-humid El-Zawia 32.45 12.45 9 Sub-humid Surman 32.45 12.35 9 Sub-humid Tripoli Airport 32.40 13.09 9 Semi -arid Gharian 32.04 13.01 12 Sub-humid El-Zahraa 32.41 12.53 8 Sub-humid El-Witia 32.28 11.42 3 Arid
Data source: Libyan Meteorological Department, Tripoli
Aridity index: <5 = arid climate; 5-10 = semi-arid climate; 10-<20 = sub-humid climate; over 20 = hu-
mid climate
It can also be deduced that the arid climate prevails in southwestern Jifara Plain (El-Witia),
semi-arid climate in the middle and west of the Plain (Zuara, Tripoli airport and El-Azizia), and
sub-humid climate in the northeast of the Plain and on Jebal Naffusah (Tripoli city and
Gharian), (Tab. 84). Because of increasing temperatures and decreasing precipitation (see
chapter 3), negative trends of the aridity index were computed.
This behavior of aridity trends (Fig. 85) indicates a growing aridity with time which
can accelerate desertification process in Jifara Plain. In semi-arid regions, extreme or in-
Attia El-Tantawi: Climate change in Libya and desertification of Jifara Plain
191
tense precipitation events do occur which can transport large quantities of sediment, yet
cover is needed to protect the soil from wind and water erosion which is incomplete
(THUROW and TAYLOR, 1999: 414). The potential for desertification is still further en-
hanced through the direct effects of climate change on soil erosion, soil quality and salini-
zation. Hazard of water erosion would also be made worse by any accompanying increas-
ing precipitation intensity. Climate change leads to reduce the productivity of rangelands
which are already under pressure from land use changes and population growth (JAC-
QUELINE, 2000).
Fig. 85: Aridity index trends in Jifara Plain, after De Martonne, 1976-2000
Tripoli city
y = -0.0877x + 13.087
0
5
10
15
20
25
1975
1978
1981
1984
1987
1990
1993
1996
1999
Nalut
y = -0.0892x + 7.0497
0
5
10
15
20
25
1975
1978
1981
1984
1987
1990
1993
1996
1999
Tripoli airport
y = -0.2273x + 12.123
0
5
10
15
20
25
1975
1978
1981
1984
1987
1990
1993
1996
1999
Surman
y = -0.0765x + 10.022
0
5
10
15
20
25
1975
1978
1981
1984
1987
1990
1993
1996
1999
Zuara
y = -0.2311x + 11.797
0
5
10
15
20
25
1975
1978
1981
1984
1987
1990
1993
1996
1999
Gharian
y = -0.3794x + 18.791
0
5
10
15
20
25
1975
1977
1979
1981
1983
1985
1987
1989
1991
1993
1995
1997
1999
Data source: Libyan Meteorological Department, Tripoli

Attia El-Tantawi: Climate change in Libya and desertification of Jifara Plain
192
As for intra-annual variations of arid and humid months in Jifara Plain, the aridity in-
dex was computed at six stations, after Walter and Lieth, this index reads as n=2t where
(n) represents the monthly precipitation (mm), (t) temperature (°C), (Fig. 86).
Fig. 86: Arid and humid months in Jifara Plain, after Walter and Lieth
humid
arid
precipitation
temperature
Data source: Libyan Meteorological Department, Tripoli
It can be observed that precipitation curves (blue lines) are considerably lower through
out the year than the temperature curves (red lines) reflecting arid conditions over most of
the yeas, the number of arid months ranged from seven months at Gharian on Jebal Naf-
fusah in southern Jifara to nine at Zuara in the northwest. Humidity months concentrate in
winter which is the rainiest season. There is a long period of water deficit from March to
September through June with peak values of deficit in June, July, and August. Precipita-
tion typically onsets in the Plain with a small amount in September, then increases until the
peak rainy months December and January, afterwards it decreases until April with a small
amount.
Throughout the Plain, precipitation is generally low and does not exceed 400 mm;
more than 90 % of the Jifara Plain receives more than 150 mm/year (Fig. 87). Precipitation

Attia El-Tantawi: Climate change in Libya and desertification of Jifara Plain
193
falls mostly as heavy showers and are lost to run-off. Furthermore, precipitation occurs
irregularly, and is badly distributed over time. In addition, wide fluctuations occur over
years and decades, frequently leading to drought.
A high rate of potential evapotranspiration further reducing yields; weeds growing
more vigorously than cultivated crops and competing for scarce reserves of moisture. In
trying to define a wet season or a season of reliable precipitation, it is necessary to con-
sider not only the amount of precipitation but also its variability (LOCKWOOD, 1974:
118). Another source of desertification is caused by the action of raindrops. Barren salty,
loamy or clay ground becomes sealed on the surface by the action of raindrops. Raindrops
disperse the fine elements of surface soil aggregates (LE HOU´EROU, 1977: 20).
Fig. 87: Percentage shares of annual precipitation in Jifara Plain
8.1%14.3%
26.7%
43%
0.2%
0.5%1.9%
4.7% < 25 mm
25-50 mm
50-100 mm
100-150 mm
150-200 mm
200-250 mm
250-300 mm
> 350mm
Data source: BAQI, 1991: 125
Most precipitated water evaporates without any benefit, whereas a small percentage
infiltrates to groundwater. It has also serious implications on soil erosion especially on
Jebal Naffusah. Though precipitation may be limited, extreme precipitation intensities may
lead to disastrous results damaging agriculture and even loss of lives (e.g. epic floods in
1945 over Tripoli) Tripoli was under water for several days, but two years later an un-
precedented severe drought caused the loss of thousands of animals (THE LIBRARY OF
CONGRESS, 1987).

Attia El-Tantawi: Climate change in Libya and desertification of Jifara Plain
194
Seasonality of precipitation is also considered a limiting factor for rainfed agriculture
and pastoral lands. Representing the rainiest season with 50-70 % of the annual totals, win-
ter precipitation decreases southwards due to the decreasing Mediterranean Sea effect.
High variabilities of annual precipitation, intensity of precipitation and seasonality cause
severe moisture stress on crops, reduce yields and negatively affect pasture lands. Fur-
thermore, intra-annual precipitation distribution does, however considerably vary showing
a variable amount of monthly precipitation which is recorded every year for the wettest
month at Tripoli city (Tab. 85)
Tab. 85: Wettest months at Tripoli city, 1995-1999
Year Wettest month Total precipitation (mm) % of annual total of the respective year
1995 January 186.2 41 1996 February 98.8 29 1997 October 130.7 25 1998 November 140.2 35 1999 December 104.3 31
Data source: Libyan Meteorological Department, Tripoli
Monthly precipitation totals also experience high inter-annual variabilities shown for
example in November, which is very important to rainfed agriculture in Libya, at three
stations in northern Jifara (Surman, Elzawia and Ras Jdeir) from 1971 to 2000 (Fig. 88).
Fig. 88: November precipitation variabilities at Surman, Elzawia and Ras Jdeir, 1971-2000
-100
-50
0
50
100
150
1971 1975 1979 1983 1987 1991 1995 1999
mm
Surman Elzawia Ras Jdeir
Data source: Libyan Meteorological Department, Tripoli
It can be identified that precipitation in November varies seriously in interannual re-
spect. Precipitation is less than average at Elzawia in 21 years (1971-2000), at Surman in

Attia El-Tantawi: Climate change in Libya and desertification of Jifara Plain
195
13 years (1975-1999), and at Ras Jdeir in 22 years (1971-1999). These variabilities of No-
vember precipitation have negative effect on agriculture because it represents a limiting
factor to the range of success for barley and wheat productions (MGELY, 1994: 157).
Recurrent or prolonged drought is a non-predictable climatic incidence; its effect is of-
ten dramatic as it causes wide-spread failure of food producing systems (KASSAS, 1987:
391). Drought occurs frequently in the areas affected by desertification; the relations be-
tween desertification and drought, on the one hand, and the human influence on the other
are complex. Occasional droughts due to seasonal or inter-annual variations in precipita-
tion and long-term droughts covering wide areas are both caused or aggravated by the in-
fluence of man on the environment. Drought may sharply reduce seal production and af-
fect food security because soil erosion and desertification become more pervasive
(SWEARINGEN: 1992. 403). As an example of occasional drought, the years 1927 and
1928 are considered. In Tripoli the annual precipitation total was only 196.7 mm in 1927,
the period from November to May (1928) included 187 days without any rains. The 220-
days continuing period from the start of April 1928 until November 1928 were only
broken by a few isolated days of precipitation. The total amount of rain in 1928 reached
341.5 mm while over 100 days in the following year did not receive any rain and annual
total was below the average (KANTER, 1967: 98).
Strong wind is considered a dangerous meteorological phenomenon; it can cause a
significant damage, particularly for natural resources, as it is blowing dust accompanied by
erosion of soils. Wind is a more frequent phenomenon in arid and semi-arid lands leading
to degradation and a high degree of strong air pollution (WMO, 1983: 13).
In spring and autumn, strong southerly winds - Gibli - blow from the desert, filling the
air with sand and dust and raising the temperature to about 50 °C in some parts. This
distractive wind is one of the major erosion factors in the Jifara Plain transporting the
eroded soils from one place to another. The dust transported from Sahara to Europe from
Saharan was estimated at 80–120 mill. t/ year (GOUDIE and MIDDLETON, 2001: 186).
Plantations suffer greatly from a prolonged subjection to southerly winds because of the
greatly reduced relative humidity, leaves are withering and crops are destroyed (KANTER,
1967: 98).
Attia El-Tantawi: Climate change in Libya and desertification of Jifara Plain
196
6.3.2 Topography of Jifara Plain
Jifara Plain is characterized by a flat topography; it can be divided into three different
parts: coastal strip (in the north), the central parts and the foot of Jebal Naffusah (moun-
tain) in the south. Jifara Plain is covered by quaternary deposits with occasional outcrops
of limestone hills belonging to the Azizia formation. Calcarenites, covered by coastal
sandstones and brown silts, form the coastal strip. The central parts are covered mainly by
poorly consolidated aeolian deposits mixed with brownish silts. The southern border of the
central part interlocks with the foot-mountain strip, which is made up of fluvial coarser
sediments (SADEG and KARAHANOLU, 2001: 1154). Jifara Plain elevates gradually
southwrds and reaches about 400 m above mean sea level in the south and 700 m at some
parts on Jebal (Fig. 89).
Seasonal streams (wadis) flow over the central part, drain the Jebal Naffusah and fan
out in the Jifara Plain. Between Mediterranean Sea and Jebal Naffusah, 40 km of partly
consolidated dunes are found, flowed by the flat spreading zones of the wadis that rise in
Jebal Naffusah, the transition between Jifara Plain and Jebal Naffusah is very sharp west of
Azizia-Gharian road and more gradual east of this road (KRUSEMAN and FLOEGEL,
1980: 764).
Landforms in Jifara Plain accelerate soil erosion followed by desertification. The beat-
ing action of precipitation on naked soil puddles the surface, which crusts when the sun
comes out, reducing infiltration of water. Even water erosion, as expressed by rills and
gullies can rapidly increase especially in southern Jifara Plain. Limited vegetation cover in
the Plain cannot protect the soils from impacts of precipitation intensities, which tend to
seal up and produce relatively large runoff volumes in relation to the absolute precipitation
amounts; this in turn leads to an increase of soil erosion. Gullies may form on the lower
parts of Jebal Naffusah slopes, impeding or preventing farming operations. Sediment de-
posited at the foot of slopes, fills waterways and aggravates flooding in low-lying areas.
The flooding follows increased runoff from the slopes above (e.g. El-Majenin wadi dated
16.09.1969 and Al-Kharwaa wadi dated 22.12.1983) accelerating soil erosion in the south-
ern Jifara Plain (GENERAL ENVIRONMENTAL AUTHORITY, 2002: 239).
Jebal Naffusah, at an elevation of 300-700 m, is neither high enough nor sufficiently
continuous to prevent the gibli wind to blow over Jifara Plain from the south, occasionally
with incredible violence, picking up, transporting, and depositing thousands of tons of sand

Attia El-Tantawi: Climate change in Libya and desertification of Jifara Plain
197
(MESSINES, 1952) affecting all human activities, especially agricultural crops and vege-
tation cover.
Fig. 89: Relief profiles in Jifara Plain using SRTM (189/37 and 190/38) images
Tunisia
NW
NW
NW
NW NW
NW
E W
SE SE
SE
SE
SE SE
Profile 2 Profile 1
Profile 4 Profile 3
Profile 6 Profile 5
Profile 7
Distance m Distance m
Distance m Distance m
Distance m Distance m
Distance m
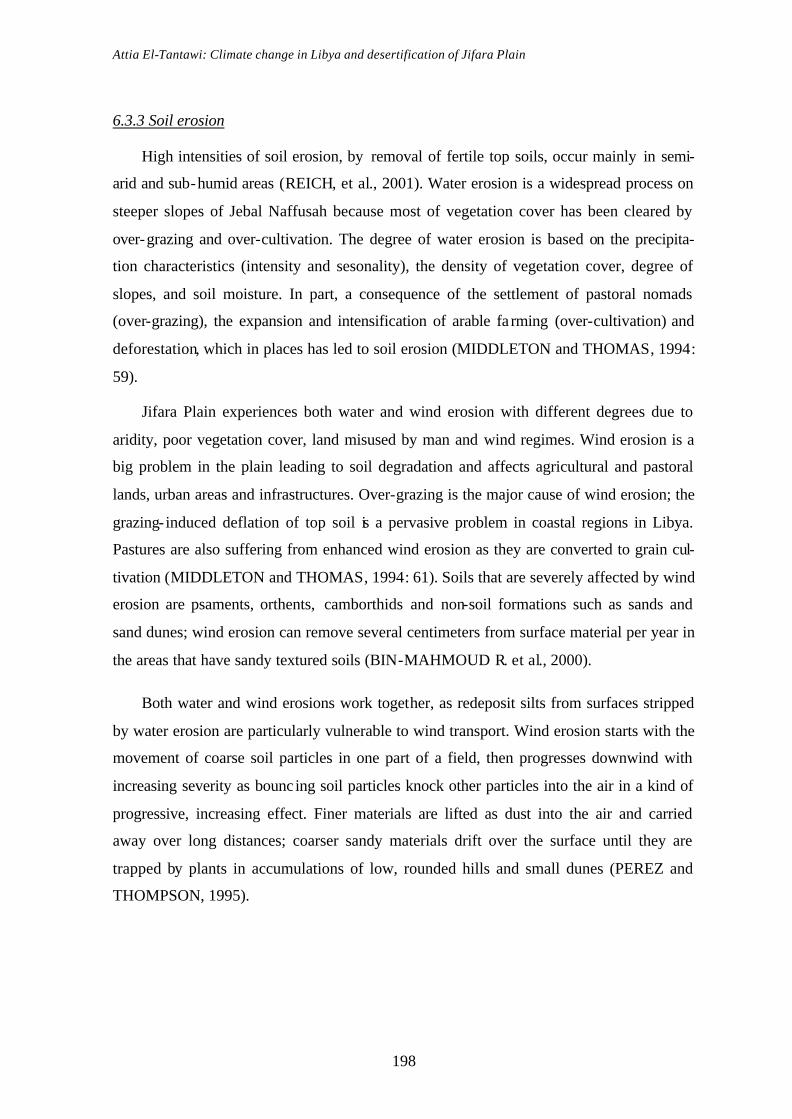
Attia El-Tantawi: Climate change in Libya and desertification of Jifara Plain
198
6.3.3 Soil erosion
High intensities of soil erosion, by removal of fertile top soils, occur mainly in semi-
arid and sub-humid areas (REICH, et al., 2001). Water erosion is a widespread process on
steeper slopes of Jebal Naffusah because most of vegetation cover has been cleared by
over-grazing and over-cultivation. The degree of water erosion is based on the precipita-
tion characteristics (intensity and sesonality), the density of vegetation cover, degree of
slopes, and soil moisture. In part, a consequence of the settlement of pastoral nomads
(over-grazing), the expansion and intensification of arable fa rming (over-cultivation) and
deforestation, which in places has led to soil erosion (MIDDLETON and THOMAS, 1994:
59).
Jifara Plain experiences both water and wind erosion with different degrees due to
aridity, poor vegetation cover, land misused by man and wind regimes. Wind erosion is a
big problem in the plain leading to soil degradation and affects agricultural and pastoral
lands, urban areas and infrastructures. Over-grazing is the major cause of wind erosion; the
grazing- induced deflation of top soil is a pervasive problem in coastal regions in Libya.
Pastures are also suffering from enhanced wind erosion as they are converted to grain cul-
tivation (MIDDLETON and THOMAS, 1994: 61). Soils that are severely affected by wind
erosion are psaments, orthents, camborthids and non-soil formations such as sands and
sand dunes; wind erosion can remove several centimeters from surface material per year in
the areas that have sandy textured soils (BIN-MAHMOUD R. et al., 2000).
Both water and wind erosions work together, as redeposit silts from surfaces stripped
by water erosion are particularly vulnerable to wind transport. Wind erosion starts with the
movement of coarse soil particles in one part of a field, then progresses downwind with
increasing severity as bounc ing soil particles knock other particles into the air in a kind of
progressive, increasing effect. Finer materials are lifted as dust into the air and carried
away over long distances; coarser sandy materials drift over the surface until they are
trapped by plants in accumulations of low, rounded hills and small dunes (PEREZ and
THOMPSON, 1995).

Attia El-Tantawi: Climate change in Libya and desertification of Jifara Plain
199
6.3.4 Over-grazing
Desertification is attributed to overgrazing in arid and semi-arid lands because the
animals are the major user of primary production. United Nations Environment Pro-
gramme (UNEP) singled out human impact and, specifically, livestock grazing as the
cause of the irreversible degradation which has prevailed during 1970s and 1980s
(PEARCE, 1992). The uprooting of shrubs leads to the destruction of the soil structure and
thus to accelerated erosion by wind and water. Over-grazing refers to the practice of allow-
ing a large number of animals to graze at a location than it can actually support. Pastoral
areas in Libya are estimated at 13.244 mill. ha out of which 4.773 mill. ha are in the west-
ern area (Jifara Plain and Jebal Naffusah). Grazing capacity in Libya is very low in com-
parison with the world because its deterioration and the high variabilities of precipitation
(UNEP, et al., 1996: 273).
In Jifara Plain, pastoralists herd without any control in numbers or kinds of animals in
spite of the fragility of the ecosystem (photo 7). There is a trend towards diminished flexi-
bility as a result of increasing technological inputs arising from the push towards higher
productivity. For instance, introduction of deep wells has improved the availability of wa-
ter while increasing herd size and decreasing herd mobility, leading to local overgrazing
and excessive trampling around the new watering points. Technological changes can ac-
celerate desertification process through excessive demands on limited natural resources
(PEREZ and THOMPSON, 1995).
Photo 7: Over-grazing in southern Jifara Plain, 04.11.2002

Attia El-Tantawi: Climate change in Libya and desertification of Jifara Plain
200
Livestock around the water sources may lead to a zonation of the impacts that animals
have on vegetation communities, radiating out from the central point. The zones that result
are called biospheres. If livestock numbers are allowed to proliferate, and are supported by
the import of artificial feeds during times of drought and environmental stress, then the
points may become desertified land (MIDDLETON and THOMAS, 1994: 71).
Overgrazing is also a factor causing the land to be stripped of its grasses. In 1976-
1977, Jifara Plain was subjected to over-grazing followed by deteriorating the vegetation
cover in many parts that led to a loss of a large amount of animals (Al-Adyoush, 2000: 68).
At present, animal population densities are far beyond carrying capacity, the land is now
over-grazed due to the six-fold growth in the number of animals during the latter half of
the 20th century (UNCCD, 1999). The result is a progressive reduction in vegetation cover
and increased soil erosion and salinity leading to a nearly irreversible loss of soil produc-
tive potential.
The effect of over-grazing on soil in Jifara Plain appears clearly during dry years, the
soil which deprived of its vegetation cover, is blown away by the gibli wind. Many arid
and semi-arid lands which are confronted with over-grazing and precarious agriculture,
such as Jifara Plain, are subjected to uncertain precipitation, poor surface water and deple-
tion of groundwater. In such areas human use of natural resources needs to be in balance
with the carrying capacity of these resources (SHARMA, 1998: 121).
Over-grazing increases around the settlement areas, it is often related to the sedentari-
sation of nomadic herder. Expansion of cultivation and disruption of trade routes have un-
dermined the traditional north-south seasonal migration of herders. The resulting disorgan-
ized utilization of grazing lands and the self-generated sedentarisation of many formerly
nomadic groups has led to accelerated development of dunes and badlands after severe
vegetation transformation in areas with permanent water supply or with sandy soils
(MIDDLETON and THOMAS, 1994: 69). The nomadic and semi-nomadic pasture- farm-
ing has much less damage of the sedentary than combined tillage-animal production sys-
tem and quasi-sedentary population in semi-arid lands (MENSCHING, 1986: 14).
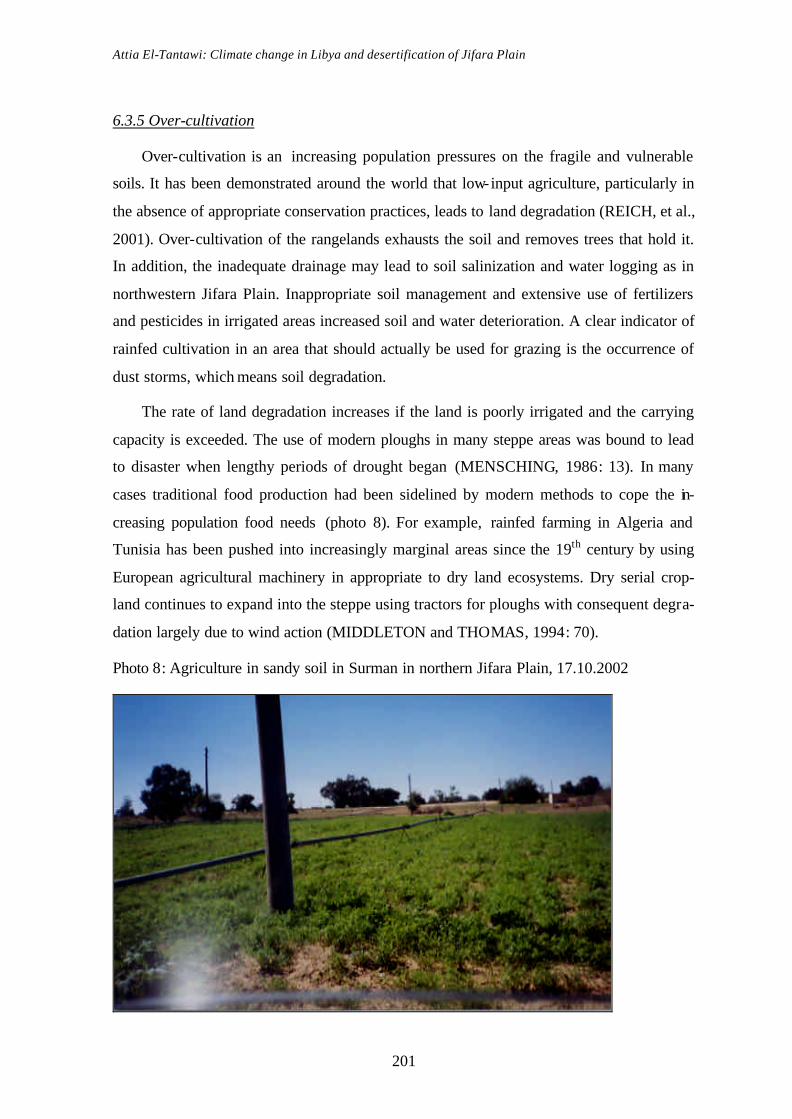
Attia El-Tantawi: Climate change in Libya and desertification of Jifara Plain
201
6.3.5 Over-cultivation
Over-cultivation is an increasing population pressures on the fragile and vulnerable
soils. It has been demonstrated around the world that low-input agriculture, particularly in
the absence of appropriate conservation practices, leads to land degradation (REICH, et al.,
2001). Over-cultivation of the rangelands exhausts the soil and removes trees that hold it.
In addition, the inadequate drainage may lead to soil salinization and water logging as in
northwestern Jifara Plain. Inappropriate soil management and extensive use of fertilizers
and pesticides in irrigated areas increased soil and water deterioration. A clear indicator of
rainfed cultivation in an area that should actually be used for grazing is the occurrence of
dust storms, which means soil degradation.
The rate of land degradation increases if the land is poorly irrigated and the carrying
capacity is exceeded. The use of modern ploughs in many steppe areas was bound to lead
to disaster when lengthy periods of drought began (MENSCHING, 1986: 13). In many
cases traditional food production had been sidelined by modern methods to cope the in-
creasing population food needs (photo 8). For example, rainfed farming in Algeria and
Tunisia has been pushed into increasingly marginal areas since the 19th century by using
European agricultural machinery in appropriate to dry land ecosystems. Dry serial crop-
land continues to expand into the steppe using tractors for ploughs with consequent degra-
dation largely due to wind action (MIDDLETON and THOMAS, 1994: 70).
Photo 8: Agriculture in sandy soil in Surman in northern Jifara Plain, 17.10.2002
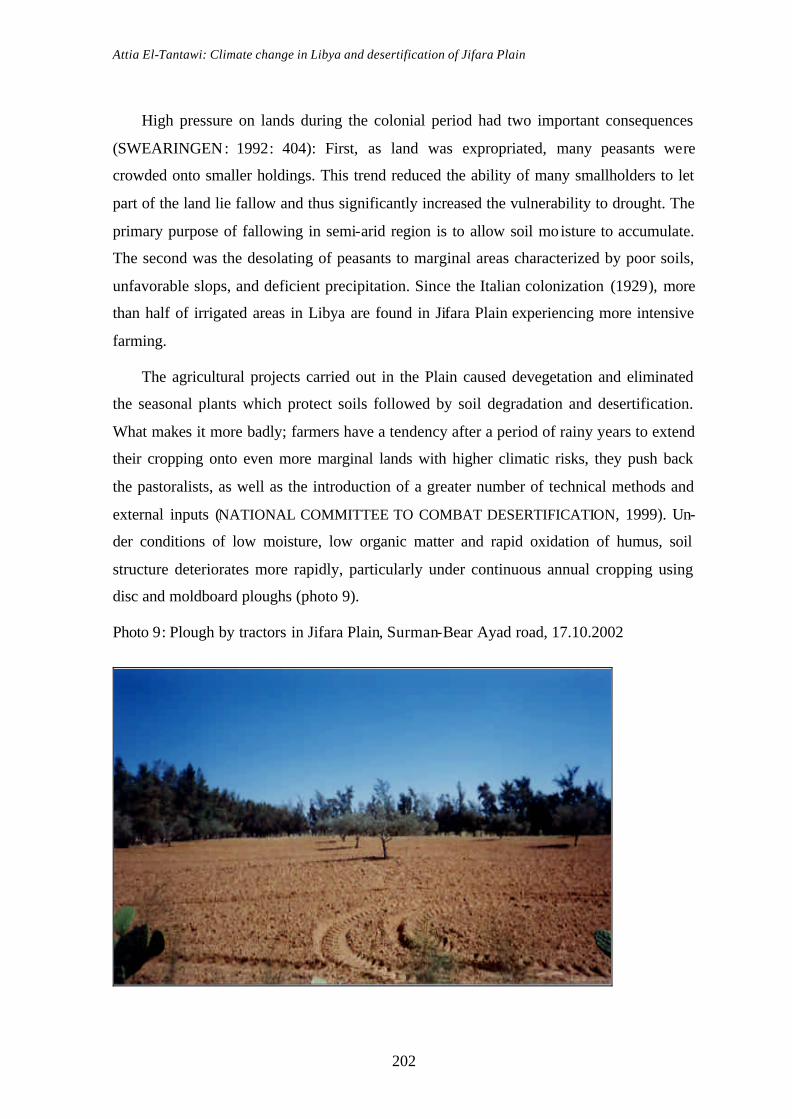
Attia El-Tantawi: Climate change in Libya and desertification of Jifara Plain
202
High pressure on lands during the colonial period had two important consequences
(SWEARINGEN: 1992: 404): First, as land was expropriated, many peasants were
crowded onto smaller holdings. This trend reduced the ability of many smallholders to let
part of the land lie fallow and thus significantly increased the vulnerability to drought. The
primary purpose of fallowing in semi-arid region is to allow soil moisture to accumulate.
The second was the desolating of peasants to marginal areas characterized by poor soils,
unfavorable slops, and deficient precipitation. Since the Italian colonization (1929), more
than half of irrigated areas in Libya are found in Jifara Plain experiencing more intensive
farming.
The agricultural projects carried out in the Plain caused devegetation and eliminated
the seasonal plants which protect soils followed by soil degradation and desertification.
What makes it more badly; farmers have a tendency after a period of rainy years to extend
their cropping onto even more marginal lands with higher climatic risks, they push back
the pastoralists, as well as the introduction of a greater number of technical methods and
external inputs (NATIONAL COMMITTEE TO COMBAT DESERTIFICATION, 1999). Un-
der conditions of low moisture, low organic matter and rapid oxidation of humus, soil
structure deteriorates more rapidly, particularly under continuous annual cropping using
disc and moldboard ploughs (photo 9).
Photo 9: Plough by tractors in Jifara Plain, Surman-Bear Ayad road, 17.10.2002

Attia El-Tantawi: Climate change in Libya and desertification of Jifara Plain
203
Under over-cultivation, the topsoil becomes denser, less aerated and less pervious to
rain and plant roots, at the same time, splash erosion causes crust formation and the cap-
ping of the topsoil, sealing the surface and erosion (DE PAUW, et al., 2000: 51). The tradi-
tional technology of agriculture, though environmentally more sensitive than modern agr i-
cultural machinery which prevailed in Libya. Intensive agriculture exhausts the natural
fertility of the soil. In many cases, manure or artificial fertilizers are not available.
In Jifara Plain, farming and grazing are being increasingly erosive due to widening
and excessive use of technical methods, for example it was on average one tractor for 885
ha in 1960, increased to one tractor for only 76 ha in 1985 (NATIONAL COMMITTEE
TO COMBAT DESERTIFICATION; 1999). The availability of cheap pumps and lack of
regulation of groundwater abstraction have allowed many farmers in the Plain to expand
irrigation into the pastoral land to save their food needs. Removing vegetation before
plough leads also to an increasing evaporation rate from the soil surface and exposes it to
precipitation wash and then erosion especially in southwestern parts of Jifara Plain where
sandy soil prevails and torrential precipitation can be occurred.
6.3.6 Population growth
Desertification results from a combination of man’s excessive use of ecosystem that is
inherently fragile or vulnerable to deterioration (KASSAS, 1987: 391). It occurs when
people penetrate such environments and act there out of the need for survival, without an
understanding of or proper regard for their sensitivities and limitations (PEREZ and
THOMPSON, 1995). The problem of rapidly increasing population in Libya, which is
more than 3 % annually, considering among the highest worldwide, pressures on the frag-
ile and vulnerable soils translating into overexploitation of water, land and pasture re-
sources through over-cultivation, overgrazing, deforestation and poor irrigation practices.
The resulting erosion and degradation of productive lands has led to food insecurity. An
increasing water demand for social, agricultural, and industrial developments has acceler-
ated groundwater deterioration.
The increase population of Jifara Plain (Fig. 90) is a major force for settlement expan-
sion on agricultural lands. Emigrations from the rural to the urban areas, especially in case
of Tripoli city, exacerbate desertification; emigrated people prepared their land to agricul-
ture clearing its vegetation and leaved it without adequate farmers, then it experiences to

Attia El-Tantawi: Climate change in Libya and desertification of Jifara Plain
204
erosion and degradation. Modern societies may also threat the dry lands in many ways;
they need roads and highways, constructing pipelines and canals, establishing factories,
and buildings. Quarrying process in the coastal parts of Jifara Plain (Photo 10) to build
new buildings for people affect the ecosystem through accelerating seawater intrusion,
agriculture and animals health. This process is practiced in the coastal parts of Jifara Plain
(Elzawia, Surman, Sebrata and God Adam).
Fig. 90: Population growth in Jifara Plain, 1984-2000
0
200
400
600
800
1000
1200
1984 1995 2000
1,000 Capita Tripoli EljafaraZawia Sabrata&SurmanElnikaht El Khams
Data source: NATIONAL INFORMATION AUTHORITY OF LIBYA, 2002
Photo 10: Quarrying process in the coastal strip of Jifara Plain, 17.10.2002

Attia El-Tantawi: Climate change in Libya and desertification of Jifara Plain
205
Fig. 91: Population growth of Tripoli city, 1950-2015 (million capita)
Population of Tripoli city
0.0
0.5
1.0
1.5
2.0
2.5
Million capita
Population 0.11 0.14 0.17 0.24 0.4 0.61 0.8 1.04 1.3 1.52 1.73 1.94 2.12 2.27
1950 1955 1960 1965 1970 1975 1980 1985 1990 1995 2000 2005 2010 2015
Data source: BRAUCH, 2004: 176
Fig. 91 expresses the increasing and prediction of Tripoli’s population from 1950-
2015, it can be noticed that the growth is sharp from 1960, the increasing population needs
increasing food supply followed by intensification of the agriculture leading heavy, con-
centrated use of fertilizers and pesticides. The destruction of vegetation has always pro-
ceeded from regions under human influence in response to the need for agricultural areas,
roads, watering places, firewood, etc (NASR, 1999: 27).
Growing human population in many areas has led to wholesale tree cutting in place of
the collection of dead wood (MIDDLETON and THOMAS, 1994: 70), it is probably the
most important domestic, principally used in households for cooking, but is also an impor-
tant fuel for certain rural and small industries. The most fundamental problem is that hu-
man activities are already seriously degrading the environment as a life support system,
through their key role in desertification, over-extraction of water from aquifers and pollu-
tion.
6.4 Desertification effects
Climate change might exacerbate desertification through spatial and temporal changes
of temperature, precipitation, solar insolation, and wind systems. Conversely, desertifica-
tion aggravates CO2-induced climate change through releasing it from cleared and dead
vegetation and through the reduction of the carbon sequestration potential of desertified

Attia El-Tantawi: Climate change in Libya and desertification of Jifara Plain
206
land (McCARTHY, et al., 2001). Saharan dust has an important impact on climatic proc-
esses, nutrient cycles, soil formation and sediment cycles. In recent decades, the frequency
of Saharan dust events has varied markedly in response to climatic factors such as drought
and anthropogenic disturbance of desert marginal surfaces. Nonetheless, the Sahara’s ma-
jor dust sources are little affected by human activities and are in fact located in areas that
receive very low precipitation totals (GOUDIE and MIDDLETON, 2001: 179).
Soil degradation impacts the global carbon cycle through its effect on landuse change
and reduction in vegetation cover. There exists a strong link between soil quality, soil or-
ganic carbon content, and desertification. Further, these adverse effects of decline in soil
quality are more severe in hot and dry than in cold and moist environments. Desertification
leads also to decline in soil structure and reduction in aggregation, decline in soil structure
leads to emission of carbon from soil to the atmosphere (LAL, 2001: 39). Groundwater
resources are impacted by prolonged droughts and changes in land cover and landuse, in a
complex interaction of human activity and population growth rates, climate, and environ-
mental responses.
Desertification reduces soil fertility, particularly base caution content, organic matter
content, pore space, and water-retention capacity. Desertification also reduces crop pro-
ductivity, leading to long-term declines in agricultural yields, livestock yields, plant stand-
ing biomass, and plant biodiversity. These changes reduce the ability of the land to support
people, often sparking an exodus of rural people to urban areas (McCARTHY, et al.,
2001). Desertification has also significant implications on livestock industry and the na-
tional economy. It accelerates migration from rural to urban settlement areas as the land
cannot support the original inhabitants.
Attia El-Tantawi: Climate change in Libya and desertification of Jifara Plain
207
7. Projections and mitigations of climate change and desertification
7.1 Outlook: climate change projections
IPCC predicted increasing global annual temperature at 1.4-5.8 °C from 1990-2100.
However, this global average will widely integrate various regional responses, such as the
likelihood that land areas will warm much faster than ocean temperatures (NOAA, 2004).
Based on the temperature trend from 1976-2000, which is the warmest period in the last
century, the global annual temperature will increase at 1.8 °C in the 21st century. On the
other hand, the Atmosphere-Ocean General Circulation Model (AOGCM) experiments,
applying the mean change and range of global average surface air temperature from 1961-
1990, estimated change of temperature at +1.3°C upto the mid-21st century (2021-2050)
ranging between +0.8 to +1.7 °C explained by greenhouse gases and sulphates
(McCARTHY, et al., 2001).
Climate change scenarios for Africa, based on results from several general circulation
models, indicate future warming across Africa in the 21st century ranging from 0.2 °C (low
scenario) to more than 0.5 °C per decade (high scenario). Warming is greatest predicted
over the interior of semi-arid margins of the Sahara and central southern Africa (HOUGH-
TON, et al. 2001). Results of four equilibrium experiments indicate that temperatures over
the Mediterranean region, as a whole, could rise by about 3.5 °C until the latter half of the
21st century in response to a doubling of CO2 (JACQUELINE, 2000).
As for climate change projections in Libya, in the absence of major shifts in policy,
economic growth, energy prices, and consumer trends, temperature and precipitation
trends over both study periods 1945-2000 and 1976-2000 give a clear indicator for increas-
ing temperature at all station in the 21st century; only at Misurata, the long-term trend is
negative. It can also be deduced that the projection of temperatures in Libya is highly
based on the trends computations over the period 1976-2000. The mean annual tempera-
ture of all-Libya is computed to increase at about 1 °C from 2000-2050 based on tempera-
ture increase from 1976-2000 (Tab. 86). The projection of temperature in the 21st century
in Libya is corresponding with the global temperature trend projection.
For precipitation, increasing totals are experienced at ten stations in the long-term
period (1951-2000), while the remaining five stations only had decreasing precipitation
(Tab. 86). In contrast to long-term projection of precipitation, the short-term projection
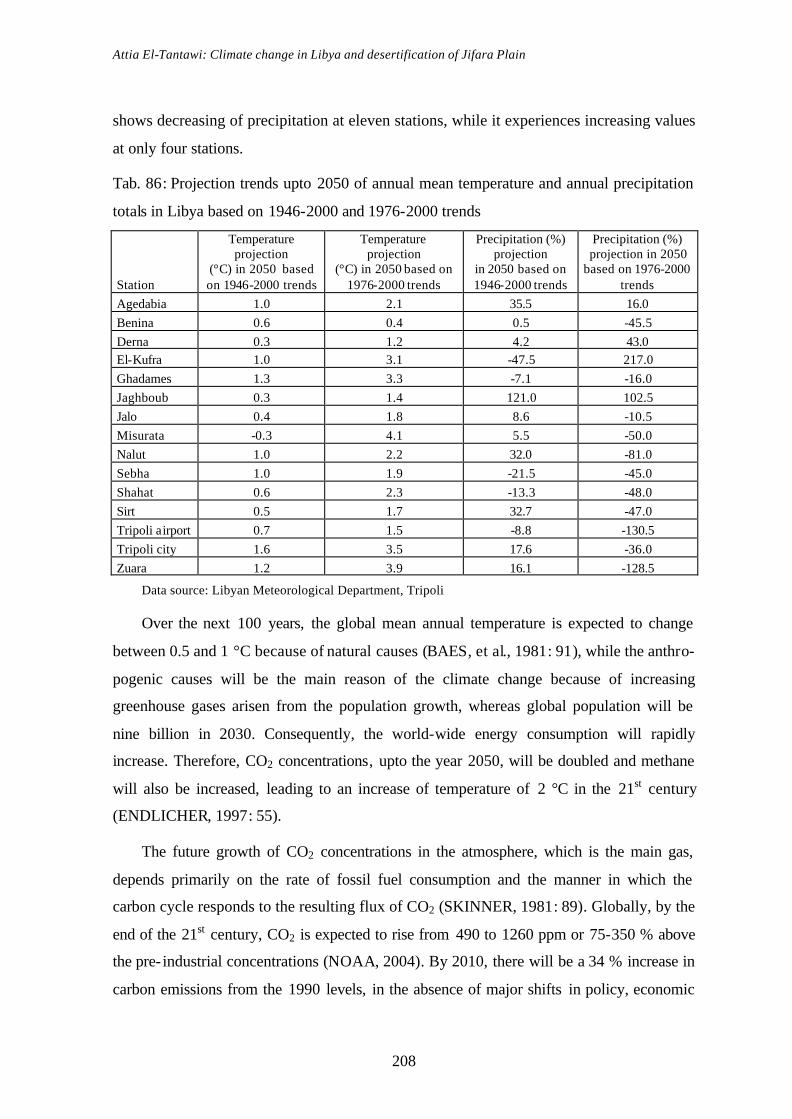
Attia El-Tantawi: Climate change in Libya and desertification of Jifara Plain
208
shows decreasing of precipitation at eleven stations, while it experiences increasing values
at only four stations.
Tab. 86: Projection trends upto 2050 of annual mean temperature and annual precipitation
totals in Libya based on 1946-2000 and 1976-2000 trends
Station
Temperature projection
(°C) in 2050 based on 1946-2000 trends
Temperature projection
(°C) in 2050 based on 1976-2000 trends
Precipitation (%) projection
in 2050 based on 1946-2000 trends
Precipitation (%) projection in 2050
based on 1976-2000 trends
Agedabia 1.0 2.1 35.5 16.0 Benina 0.6 0.4 0.5 -45.5 Derna 0.3 1.2 4.2 43.0 El-Kufra 1.0 3.1 -47.5 217.0 Ghadames 1.3 3.3 -7.1 -16.0 Jaghboub 0.3 1.4 121.0 102.5 Jalo 0.4 1.8 8.6 -10.5 Misurata -0.3 4.1 5.5 -50.0 Nalut 1.0 2.2 32.0 -81.0 Sebha 1.0 1.9 -21.5 -45.0 Shahat 0.6 2.3 -13.3 -48.0 Sirt 0.5 1.7 32.7 -47.0 Tripoli airport 0.7 1.5 -8.8 -130.5 Tripoli city 1.6 3.5 17.6 -36.0 Zuara 1.2 3.9 16.1 -128.5
Data source: Libyan Meteorological Department, Tripoli
Over the next 100 years, the global mean annual temperature is expected to change
between 0.5 and 1 °C because of natural causes (BAES, et al., 1981: 91), while the anthro-
pogenic causes will be the main reason of the climate change because of increasing
greenhouse gases arisen from the population growth, whereas global population will be
nine billion in 2030. Consequently, the world-wide energy consumption will rapidly
increase. Therefore, CO2 concentrations, upto the year 2050, will be doubled and methane
will also be increased, leading to an increase of temperature of 2 °C in the 21st century
(ENDLICHER, 1997: 55).
The future growth of CO2 concentrations in the atmosphere, which is the main gas,
depends primarily on the rate of fossil fuel consumption and the manner in which the
carbon cycle responds to the resulting flux of CO2 (SKINNER, 1981: 89). Globally, by the
end of the 21st century, CO2 is expected to rise from 490 to 1260 ppm or 75-350 % above
the pre- industrial concentrations (NOAA, 2004). By 2010, there will be a 34 % increase in
carbon emissions from the 1990 levels, in the absence of major shifts in policy, economic

Attia El-Tantawi: Climate change in Libya and desertification of Jifara Plain
209
growth, energy prices, and consumer trends (COUNTRYWATCH, 2000). According to
U.S. Environmental Protection Agency (EPA) model, CO2 concentrations will increase at
30-150 % by the year 2100 contributing further rise in global temperatures of about 5 de-
grees (ROACH, 1997).
The projection of CO2 trend based on 1901-2000 indicates increasing global CO2
concentrations of 1,338.2 mill. t/decade in the 21st century. For Libya, the projection based
on 1950-2000, indicates increasing CO2 concentrations of 5.685 mill. t/decade. Like CO2,
most other greenhouse gases will increase in the 21st century. For example, the trend
projection of global methane based on 1901-1995 deduced an increase at 28.2 mill.
t/decade in the 21st century. Even if emission rates of greenhouse gases are stabilised, tem-
peratures would be continued to climb for several decades (JACQUELINE, 2000).
Global warming will increase the water cycle rate; change the distribution of precip i-
tation, causing more droughts and floods as well as to increase the vulnerability to natural
hazards in many countries. Precipitation is also expected to increase over the 21st century,
particularly at northern mid-high latitudes, though the trends may be more variable in the
tropics (NOAA, 2004).
Future changes of seasonal precipitation in Africa are less well defined. Under the
lowest warming scenario, few areas will be experienced to changes in winter precipitation
that may exceed two standard deviations of natural variability by 2050. The exceptions are
parts of equatorial east Africa, where precipitation may increase by 5-20 % in winter and
decrease by 5-10 % in summer (McCARTHY, et al., 2001).
Around much of the Mediterranean basin, sea level could rise close to 1 meter by
2100. Consequent ly, some low-lying coastal areas would be lost by flooding or erosion,
while rivers and coastal aquifers would become more salty (JACQUELINE, 2000). Snow
extent and sea- ice are also projected to decrease further in the northern hemisphere, and
glaciers and ice-caps are expected to continue to retreat resulting from global warming
(NOAA, 2004).
Attia El-Tantawi: Climate change in Libya and desertification of Jifara Plain
210
7.2 Mitigation of climate change
7.2.1 International efforts to mitigate climate change
Over the 1990s, significant progress has been made relating to national capacity build-
ing and institutional development in the field of climate change. United Nations through
many of its different conventions, programs and organizations plays the main role in initi-
ating the world concerns with climate change. In 1992, the United Nations Framework
Convention on Climate Change (UNFCCC) was signed by 150 nations at the Earth Sum-
mit in Rio de Janeiro and entered into force on 21.03.1994. The main objective of the con-
vention is the deep cut in emissions that required stabilizing the atmospheric concentra-
tions of greenhouse gases. Therefore, all countries need to find ways to meet their deve l-
opment requirements, at the same time, to minimize their greenhouse gas emissions.
In Bonn, 1996, the chairman of the IPCC, BERT BOLIN, announced that reductions
undertaken solely by industrialized countries will not be sufficient to limit global warming
unless developing countries begin to reduce the rates at which they are increasing their use
of fossil fuels as well. Developing countries argued they will not agree to new limitations
until the industrialized nations have set their legally binding targets (HUGHES, 1997)
In November 1997, the parties to the UNFCCC adapted the Kyoto Protocol in which
industrialized countries are committed to reduce their GHG emissions by 5 % below the
base year 1990 as a first commitment to be achieved within period 2008-2012. The Kyoto
Protocol is the first legally binding international agreement that places limits on emissions
from industrialized countries. The major greenhouse gas emissions addressed in the Proto-
col include CO2, nitrous oxide, hydro-fluorocarbons, per- fluorocarbons, sulfur
hexafluoride, and methane (COUNTRYWATCH, 2000). The Protocol also established
international emissions trading, joint implementation between developed countries, and a
clean development mechanism to encourage joint emission reduction projects between
developed and developing countries (MOHSEN, 1999).
By 1999, the International Energy Outlook projected that Eastern Europe and parts of
Asia are expected to show a marked decrease in their level of energy related CO2 emis-
sions in 2010. Nations with the highest emissions, specifically the U.S., the EU and Japan,
are anticipated to reduce their emissions by up to 8 % from 1990 levels by 2012. Many
participant countries have resigned themselves to the reality that the goals of the Kyoto
Protocol cannot be achieved without U.S. involvement (COUNTRYWATCH, 2000). The

Attia El-Tantawi: Climate change in Libya and desertification of Jifara Plain
211
United States which with 4 % of the global population is responsible for 20 to 25 percent
of global GHG emissions (HUGHES, 1997) rejected the Kyoto Protocol. The latest round
of international climate negotiations is known officially as the 10th Conference of the Par-
ties to UNFCCC which took place from 6-17th December 2004 in Buenos Aires, Argen-
tina. The Framework Convention was agreed at the Earth Summit in Rio de Janeiro, Bra-
zil, in 1992, and it has been ratified by 189 countries (GREENPEACE, 2005).
Libya cooperated with United Nations and the international organizations to mitigate
climate change. It has signed and ratified a number of international and regional agree-
ments which effectively established a policy framework for actions to mitigate climate
change such as: Montreal Protocol on substances that deplete the ozone layer, Libya has
signed on 16.09.1987 and has ratified on 11.07.1990. Libya has ratified the Vienna Con-
vention for Ozone Protection on 09.10.1990. It has signed UNFCCC on 05.06.1992, and
has ratified on 14.6.1999 (GENERAL ENVIRONMENTAL AUTHORITY, 2002: 39). In
December 1997, Libya was one of the representatives from 160 signatory nations to the
UN Framework Convention on Climate Change while attending a meeting in Kyoto, Ja-
pan, and reached an agreement, called the Kyoto Protocol.
7.2.2 Reduction of greenhouse gas emissions
The "greenhouse effect" is the earth's trapping of infrared radiation or heat. Scientists
have linked the greenhouse effect to the emission of two primary sources, or "greenhouse
gases" CO2 and CH4 (BURNS, et al., 1997: 433). The reduction of greenhouse gas emis-
sions is considered as the key of climate change mitigation. Several programs of GHGs
reduction were carried out by many research centers and organizations. Many actions and
measures were taken to encourage the utilization of more efficient, less GHGs-emitting
technologies worldwide. Nations around the world have held many conferences to monitor
and assist the problem. While some economic forecasters see this as an opportunity to
boost economy through the implementation of new technologies, others see it costing bil-
lions of dollars through taxes and the loss of thousands of jobs at the closure of polluting
industries (ROACH, 1997).
Stabilization of CO2 concentrations require reducing the emissions at 50-70 % other
gases would also have to be reduced significantly or even stopped completely if atmos-
pheric concentrations are to be stabilized as well and the risk of climate change reduced
Attia El-Tantawi: Climate change in Libya and desertification of Jifara Plain
212
(JACQUELINE, 2000). UNFCCC stipulated the main objective to stabilize greenhouse
gas concentrations within the atmosphere using advanced energy sources and technologies,
as well as international cooperation in implementation and regulation. This stabilization
process would facilitate the natural adaptation of ecosystems to face climate change ef-
fects. Greenhouse gases can also be reduced by improving energy efficiency using cleaner
energy sources and technologies, efficient production and transmission of energy and pro-
moting renewable energy in electricity generation using wind and solar energy (EEAA,
1999: 95).
Sink actions of CO2 can also be carried to dominate the emissions through the increase
of CO2 absorption capacity because the world in the past few decades experienced the loss
of world carbon sinks (mainly deforestation). This includes planting and maintaining suit-
able types of trees along the roads and the inner cities, as well as along the water drains.
Forests and high biomass producing crops are also an important sink for carbon dioxide.
For most parts of Libya, the afforestation of some 250,000 ha, two nature reserves and five
national parks were established in several outstanding environmental regions, covering a
substantial area of 134,000 ha (NATIONAL COMMITTEE TO COMBAT DESERTIFI-
CATION, 1999).
7.2.3 Adaptation of climate change and sustainable development
The scopes for adapting both the rate of climate change and the uncertainty over the
extent of the expected changes make adaptation difficult, particularly in many areas such
as infrastructure development, where planning timescales are long in relation to the time-
scales of predicted climate changes (McCARTHY, et al., 2001). In parallel to adaptation
and mitigation efforts, capacity building pertaining to climate change, including training,
education and awareness, is a crucial pre-requisite for any serious effort in that manner.
For example, clean air policies alleviate health hazards. Modern technologies and ap-
proaches in agriculture and water resources management are very crucial for climate
change adaptation.
Adaptation Strategies according to IPCC Third Assessment Report, 2001 are:
Refinement of early warning systems to enable timely remedial measures; shared ba-
sin management, necessitating international agreements; water resource management; in-
Attia El-Tantawi: Climate change in Libya and desertification of Jifara Plain
213
tensified monitoring to improve data reliability; intensive research into energy usage and
alternate renewable energy at household and industrial levels; intensive research into de-
sign of infrastructure facilities to withstand extreme events; intensive research into flood
control management technology, innovation in building designs (e.g., to minimize urban
flooding), research and commencement of coastal defense facilities and others.
Researches on sustainable development play positive and effective roles in climate
change mitigation. This may be achieved by exploring the optimum use of the available
resources and lands through an integrated system of conservation and development meas-
ures matched to the natural and environmental conditions (NATIONAL COMMITTEE TO
COMBAT DESERTIFICATION, 1999). Sustainable deve lopment strategy needs to in-
clude climate change. It is contended that, for sustainable development strategies, policies
should put the welfare of people at the center of the development agenda (McCARTHY, et
al., 2001).
7.3 Outlook: Desertification projections of Jifara Plain
Future population projections indicate that population in Libya will exceed 10 mill. in
2025; more than 90 % of them will live in urban areas. On the one hand, increasing popu-
lation needs a rapid achievement of increasing agricultural and animal productions. On the
other hand, it leads settlement expansion with loss of fertile lands. Economic and social
interactions will, therefore, play an essentially valuable role in determining the overall
framework for the future of agriculture and animal productions in the 21st century. In Jifara
Plain, increasing population growth associated with limited natural resources (especially
water resources and fertile soils) and high precipitation variabilities accelerate, without any
doubt, desertification in the future.
Under the increasing population, water deficit will increase in response to increasing
water demands for domestic, industrial and agricultural purposes. In Libya, as a whole,
water demands will increase from 5,579 mill. m3 in 2000 to 8,965 mill. m3 in 2025 leading
to a water deficit of 4,735 mill. m3 (NATIONAL ENVIRONMENTAL AUTHORITY,
2002: 67). Approximately half of water deficit in all-Libya will be in Jifara Plain which is
inhabited by more than 50 % of total population. Water deficit of Jifara Plain in 1998 was
1,281.5 million m3 denoting that the Plain will face water restrictions in the 21st century.
So, discharges from the groundwater aquifer should be properly managed and the rate of
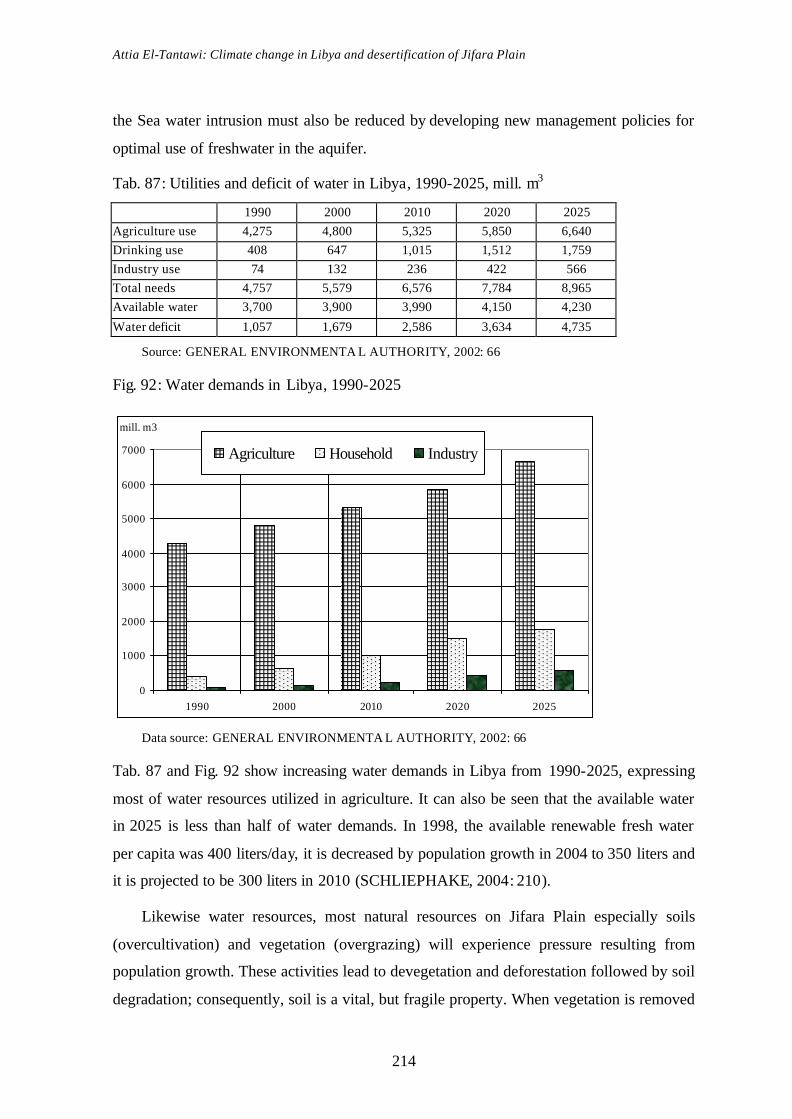
Attia El-Tantawi: Climate change in Libya and desertification of Jifara Plain
214
the Sea water intrusion must also be reduced by developing new management policies for
optimal use of freshwater in the aquifer.
Tab. 87: Utilities and deficit of water in Libya, 1990-2025, mill. m3
1990 2000 2010 2020 2025 Agriculture use 4,275 4,800 5,325 5,850 6,640 Drinking use 408 647 1,015 1,512 1,759 Industry use 74 132 236 422 566 Total needs 4,757 5,579 6,576 7,784 8,965 Available water 3,700 3,900 3,990 4,150 4,230
Water deficit 1,057 1,679 2,586 3,634 4,735
Source: GENERAL ENVIRONMENTA L AUTHORITY, 2002: 66
Fig. 92: Water demands in Libya, 1990-2025
0
1000
2000
3000
4000
5000
6000
7000
1990 2000 2010 2020 2025
mill. m3
Agriculture Household Industry
Data source: GENERAL ENVIRONMENTA L AUTHORITY, 2002: 66
Tab. 87 and Fig. 92 show increasing water demands in Libya from 1990-2025, expressing
most of water resources utilized in agriculture. It can also be seen that the available water
in 2025 is less than half of water demands. In 1998, the available renewable fresh water
per capita was 400 liters/day, it is decreased by population growth in 2004 to 350 liters and
it is projected to be 300 liters in 2010 (SCHLIEPHAKE, 2004: 210).
Likewise water resources, most natural resources on Jifara Plain especially soils
(overcultivation) and vegetation (overgrazing) will experience pressure resulting from
population growth. These activities lead to devegetation and deforestation followed by soil
degradation; consequently, soil is a vital, but fragile property. When vegetation is removed
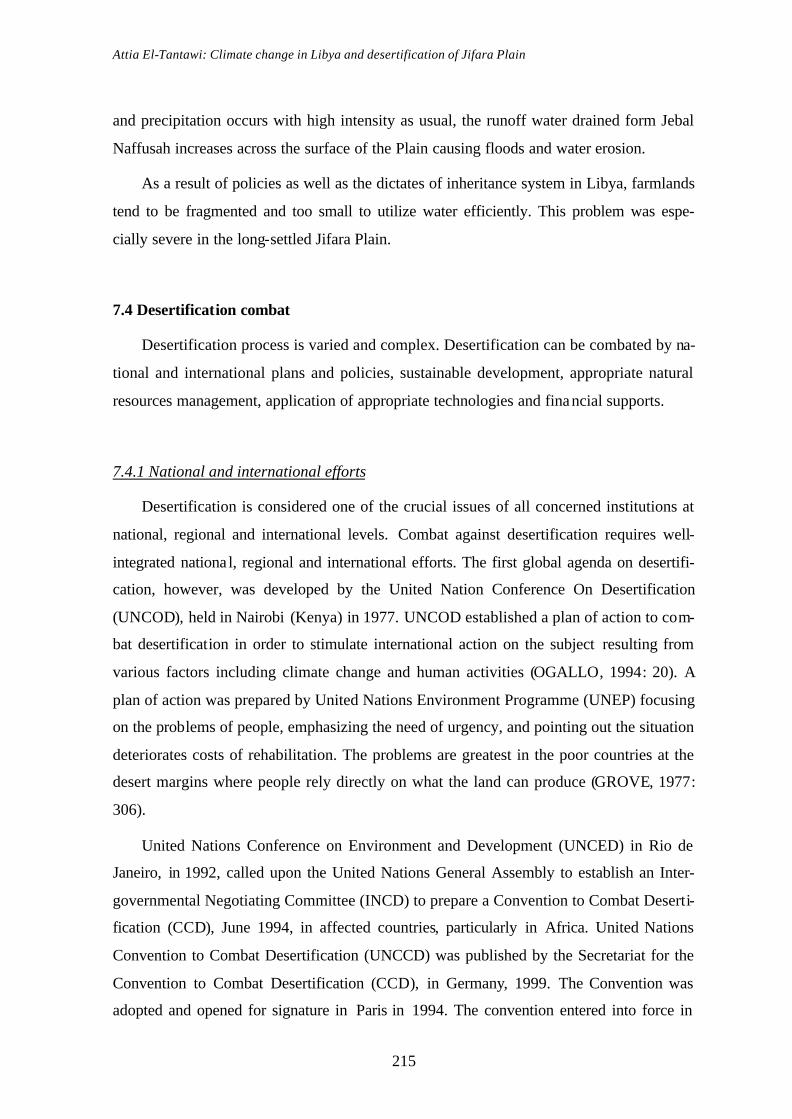
Attia El-Tantawi: Climate change in Libya and desertification of Jifara Plain
215
and precipitation occurs with high intensity as usual, the runoff water drained form Jebal
Naffusah increases across the surface of the Plain causing floods and water erosion.
As a result of policies as well as the dictates of inheritance system in Libya, farmlands
tend to be fragmented and too small to utilize water efficiently. This problem was espe-
cially severe in the long-settled Jifara Plain.
7.4 Desertification combat
Desertification process is varied and complex. Desertification can be combated by na-
tional and international plans and policies, sustainable development, appropriate natural
resources management, application of appropriate technologies and financial supports.
7.4.1 National and international efforts
Desertification is considered one of the crucial issues of all concerned institutions at
national, regional and international levels. Combat against desertification requires well-
integrated nationa l, regional and international efforts. The first global agenda on desertifi-
cation, however, was developed by the United Nation Conference On Desertification
(UNCOD), held in Nairobi (Kenya) in 1977. UNCOD established a plan of action to com-
bat desertification in order to stimulate international action on the subject resulting from
various factors including climate change and human activities (OGALLO, 1994: 20). A
plan of action was prepared by United Nations Environment Programme (UNEP) focusing
on the problems of people, emphasizing the need of urgency, and pointing out the situation
deteriorates costs of rehabilitation. The problems are greatest in the poor countries at the
desert margins where people rely directly on what the land can produce (GROVE, 1977:
306).
United Nations Conference on Environment and Development (UNCED) in Rio de
Janeiro, in 1992, called upon the United Nations General Assembly to establish an Inter-
governmental Negotiating Committee (INCD) to prepare a Convention to Combat Deserti-
fication (CCD), June 1994, in affected countries, particularly in Africa. United Nations
Convention to Combat Desertification (UNCCD) was published by the Secretariat for the
Convention to Combat Desertification (CCD), in Germany, 1999. The Convention was
adopted and opened for signature in Paris in 1994. The convention entered into force in
Attia El-Tantawi: Climate change in Libya and desertification of Jifara Plain
216
1996, and some 120 countries are now Parties. The Conference of the Parties which is the
Convention’s supreme body, held its first session in Rome, in 1997, the second session in
Dakar, in 1998, launching a global mechanism to obtain adequate financial and techno-
logical resources (NASR, 1999: 10). The Convention to Combat Desertification (which
met in Senegal, December 1998) discussed, developed, and planned to fund a global action
plan to combat the processes leading to desertification (REICH, et al., 2001).
The enlistment of community participation should not be thought of exclusively in
terms of outside experts persuading people to do what the experts think is good for them.
Local knowledge should also be enlisted. Sometimes the best procedure would be the
elimination of obstacles to the good landuse practices that local people would otherwise
prefer to carry out (PEREZ and THOMPSON, 1995). It can be argued that solutions for
the desertification problems will ultimately rest with national decisions makers and will
directly and primarily depend on national political, economic, and social conditions within
those states directly affected by desertification. These socio-political factors are reinforced
by other constraints of a more technical nature (GLANTZ, 1977: 11).
Libya was ranked during the 1960s and 1970s as a world pioneer in the field of deser-
tification combat. It has signed the UNCCD on June 17, 1994 and ratified on July 22,
1996. Libya had paid significant efforts and implemented programs which can be considered
under the mandate of environmental conservation in general and combating desertific ation in
partic ular, e.g. in Jifara Plain, it established a settlement project named El-Majenin (8,000
ha) and treeing project in Bear Ayad in southern Jifara Plain (12,000 ha). Government of
Libya established Natural Protectorates in many parts of the country (NATIONAL COM-
MITTEE TO COMBAT DESERTIFICATION, 2002).
7.4.2 Land management (soil conservation)
Soil erosion by wind and running water can be restricted by planting trees and grass
along wadis sides. Also helpful are the construction of diversion banks and dams across
the wadis and gullies. Sheet erosion which scours topsoil from wide areas can be countered
with contour banks and ditches, grass-covered contour strips, and terraces. Hydrological
constructions have been carried out on slopes and stream beds in Libya. Some examples
are terraces, dams and water spreaders; strip cropping and contour cultivation practices
have to prevent water erosion (BEN-MAHMOUD, et al., 2000).
Attia El-Tantawi: Climate change in Libya and desertification of Jifara Plain
217
During 1960s, Government of Libya has actively pursued an afforestation program
accelerated in the 1970s. An estimated 213 million seedlings had been planted by 1977,
about 33 million of them were fruit trees. Most reforestations have been done in western
Libya (THE LIBRARY OF CONGRESS, 1987).
Landuse practices should also be combined with efficient marketing systems to make
possibly an appropriate response to drought. It is ambiguous to use the unpredictability of
drought as an excuse for inadequate planning decisions that have failed to take precipita-
tion variability into account. Exposing the land to accelerate erosion hazard should be
viewed as a managerial failure, instead of making drought a scapegoat for faulty policies
(THUROW and TAYLOR, 1999: 418). Land users should also take advantage equally of
wet years, employing them to replenish the ultimate agricultural resources, the fertility of
the soil and the production of vegetation (PEREZ and THOMPSON, 1995).
The implementation of intensive soil conservation measures was carried out by estab-
lishing projects over an area of 192,000 hectares in the mountainous regions in northern
Libya in order to combat water erosion and to stabilize sand dunes movements using oil
derivatives and mechanical methods, for conversion into green belts. Water development
projects were also established including steps for the utilization of surface water, in addi-
tion to the construction of thousands of reservoirs and tanks. Sixteen major dams with an
estimated annual storage capacity of 300 mill. m3 were constructed and over 100 mill. m3
are treated annually for reuse in agriculture (NATIONAL COMMITTEE TO COMBAT
DESERTIFICATION, 1999).
Government's long-term goals for the massive planting program include the growth of
enough trees to meet its domestic lumber needs, which in the past had been met by im-
ports. Short-term goals include soil conservation, reclamation, and the creation of wind-
breaks for crop and settlement protection (THE LIBRARY OF CONGRESS, 1987).
7.4.3 Sustainable development
There are many definitions of sustainable development, including this landmark one
which first appeared in 1987: "Development that meets the needs of the present without
compromising the ability of future generations to meet their own needs (THE WORLD
BANK GROUP, 2001).
Attia El-Tantawi: Climate change in Libya and desertification of Jifara Plain
218
In order to achieve the objectives and requirements of sustainable development, it is
therefore essential to provide more equal opportunities for the utilization of natural re-
sources and food supply for the increasing population (NATIONAL COMMITTEE TO
COMBAT DESERTIFICATION, 1999). Marginal lands outside these limits should be
removed from cropping by acquisition, by financial inducements or by the establishment
of forests, grazing or water-catchments reserves. Measures to combat desertification must
ultimately be directed towards people, sustaining and improving their livelihoods. Thus,
measures must be seen as having human and social dimensions. They must be inspired by
an acknowledgment of dry land people's rights to acceptable standards of health, nutrition,
education, livelihood and social well-being (PEREZ AND THOMPSON, 1995).
7.4.4 Scientific management of the pastoral and farming lands
Due to the harsh natural environment, arid and semi-arid climates and dominantly
shallow soils on Jifara Plain, the ecosystem of the Plain is in most parts highly vulnerable
to desertification. The main effects are attributed to overgrazing and overcultivation. Main-
tenance of vegetation that will sustain the pastoral system is the most obvious goal of lan-
duse planning. Modern range-management practices and techniques were being used to
prevent overgrazing and to make optimal use of the pastures. Thousands hectare of pas-
toral land had been fenced along the coastal region of Libya for use as cattle breeding sta-
tions as well as livestock-fattening pens (THE LIBRARY OF CONGRESS, 1987).
Expansion the safely cropped areas by introducing crops that are more resistant to ex-
treme climate conditions and by improving methods of cultivation and water conservation
play a critical role in the future policy and development of Jifar Plain and to combat deser-
tification (BEN-MAHMOUD et al., 2000).
Consideration should be given to fencing rangeland areas in order to control stock
movements and pastures that are particularly vulnerable. Increased meat production can be
achieved without massive expansion of area grazed or size of the herds, namely by appli-
cation of modern herd and animal diet management. In many situations, this would require
a cultural shift from regarding livestock principally as an asset and symbol to regarding
them as a production system.
Attia El-Tantawi: Climate change in Libya and desertification of Jifara Plain
219
Libya’s efforts in the field of agriculture and animal production over the past decades
can be viewed as intensive efforts to combat desertification. Allocations of over $15 bil-
lion were earmarked in 1990s for these efforts, mainly to carry out a vast series of agricul-
tural, rural development and activities comprising the reclamation and development of
some two million hectares of land and the implementation of 117 agricultural projects
(NATIONAL COMMITTEE TO COMBAT DESERTIFICATION, 1999).
To combat desertification, irrigation system used must depend on quantity and quality
of water resource available as well as on the characteristics of soils because these will de-
termine drainage requirements and water availability to crops. In addition to water and
soil, improved irrigation methods, mechanization, fertilization, plant protection and the
selection of crops that use water more efficiently are important for facing desertification
(BEN-MAHMOUD, et al., 2000).
7.4.5 Stop the movements of sands (stabilizing sand surfaces)
Sand movements can be countered by planting lines of shrubs and trees as barriers
against wind. Cyanophella plant is the most important to fix sand dunes and to improve
fertile soil in Libya. In 1978, Libya could fix about 52,868 ha of sand dunes (BAQI, 1991:
123). The first use of fixation with petroleum emulsion was applied in Libya in 1961;
125,000 ha have been stabilized by this method, in 1971, oil derivatives have been used to
fix sand dunes (NATIONAL ENVIRONMENTAL AUTHORITY, 2002: 214). The
method of sand fixation has been widely applied internationally thereafter.
Libya applied several methods to stop sand dunes encroachment as:
Sand dunes fixation by arid plants like Aristida, Pungens and Imperata cylindrical, and
palm branches as obstacles against winds which bear sands
Hedges are established in a chess board pattern by setting the grass upright, buried in
trenches at a depth of 15 cm.
Forest trees are then planted in the enclosures formed by hedges and fixation with syn-
thetic rubber but this method needs large amount of water (UNEP, et al., 1996: 278). Vast
expansion of rangelands and arable lands in Jifara Plain are steadily invaded by fine-
grained, rust-red sand consisting entirely of quartz (BEN-MAHMOUD, et. al., 2000).

Attia El-Tantawi: Climate change in Libya and desertification of Jifara Plain
220
7.4.6 Water recourses management
Water development projects were also established as part of national programs and ac-
tivities to combat desertification. The main objectives of water management are reduction
of the water deficit and improving water quality that can be achieved through: the rainfall
harvest and control of runoff by constructing more dams on wadis to store runoff waters
and prevents flood hazards (BEN-MAHMOUD, et al., 2000).
Wadis are heavily settled because their soils are often very suitable for agriculture,
and the high water table in their vicinity makes them logical locations for digging wells.
Libya has paid attention to this problem and has diverted water development projects, par-
ticularly around Tripoli (THE LIBRARY OF CONGRESS, 1987). Groundwater supplies
must be kept in balance with the requirements of landuse to face the sea water intrusion.
Most of North Africa nations practice one or more water harvesting techniques inten-
sively in order to collect and store rainwater for use in meeting plant demands as well as
human and animal needs (NASR, 1999: 29). Also alternate sources of irrigation water are
applied such as treated sewage water. Desalination will thus play an ever- increasing role in
the future of Libya’s development, not only to ensure the continuous supply of water to
existing communities and industries in particular, but also to allow the development of
new ones as well. Moreover, desalination has a special strategic role as a readily available,
alternative standby source in cases of partial or total failure of the existing water sources
(ABUFAYED and EL-GHUEL, 2001: 52).
7.4.7 The Great Man-Made River Project
The Great Man-Made River Project is large water development scheme (Fig. 93). It is con-
sidered the biggest project to combat desertification in Libya. Pumping large amount of
groundwater in Jifara Plain has resulted in deterioration of groundwater quality and quan-
tity. It alleviates the pressure on water resources in northern parts of Libya including Jifara
Plain.
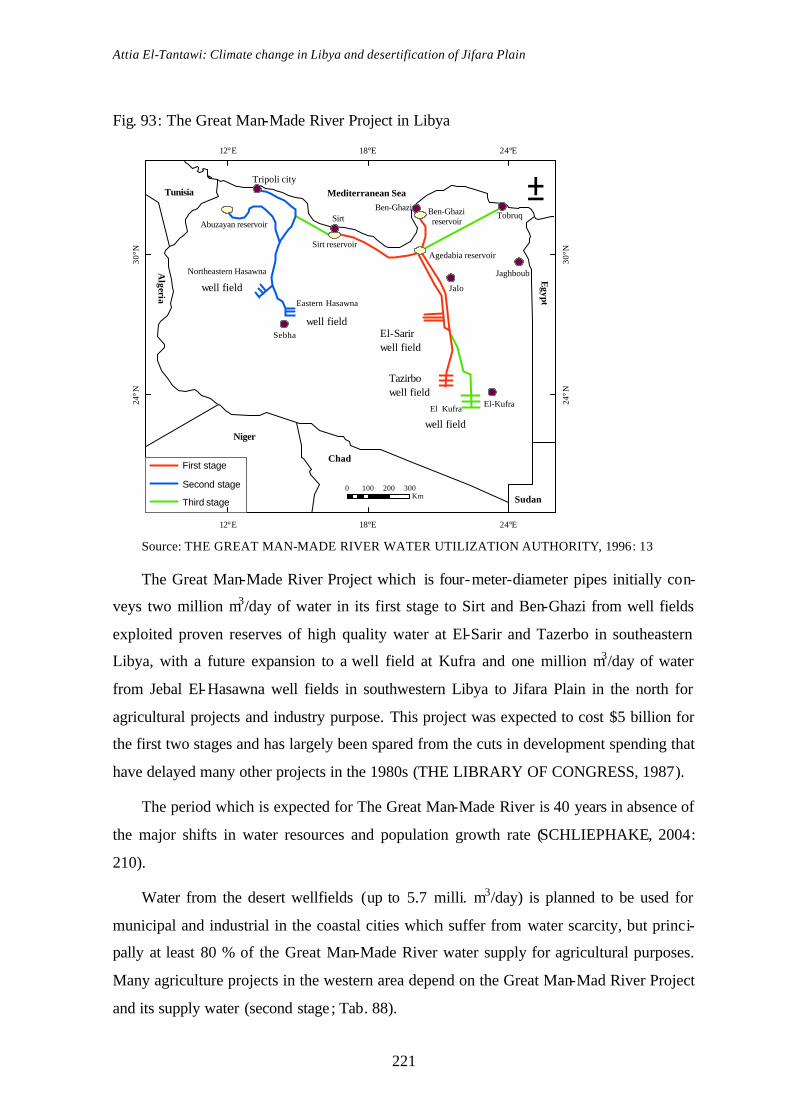
Attia El-Tantawi: Climate change in Libya and desertification of Jifara Plain
221
Fig. 93: The Great Man-Made River Project in Libya
Source: THE GREAT MAN-MADE RIVER WATER UTILIZATION AUTHORITY, 1996: 13
The Great Man-Made River Project which is four-meter-diameter pipes initially con-
veys two million m3/day of water in its first stage to Sirt and Ben-Ghazi from well fields
exploited proven reserves of high quality water at El-Sarir and Tazerbo in southeastern
Libya, with a future expansion to a well field at Kufra and one million m3/day of water
from Jebal El-Hasawna well fields in southwestern Libya to Jifara Plain in the north for
agricultural projects and industry purpose. This project was expected to cost $5 billion for
the first two stages and has largely been spared from the cuts in development spending that
have delayed many other projects in the 1980s (THE LIBRARY OF CONGRESS, 1987).
The period which is expected for The Great Man-Made River is 40 years in absence of
the major shifts in water resources and population growth rate (SCHLIEPHAKE, 2004:
210).
Water from the desert wellfields (up to 5.7 milli. m3/day) is planned to be used for
municipal and industrial in the coastal cities which suffer from water scarcity, but princi-
pally at least 80 % of the Great Man-Made River water supply for agricultural purposes.
Many agriculture projects in the western area depend on the Great Man-Mad River Project
and its supply water (second stage ; Tab. 88).
12°E
12°E
18°E
18°E
24°E
24°E
24°N
24°N
30°N
30°N
El_Kufra well fields
Tazirbo well fields
El-Sarir well fileds
Agedabia reservoir
Ben-Ghazi reservoir
Tobruq
Sirt reservoir
Abuzayan reservoir
Tripoli cityMediterranean Sea
Egypt
Algeria
Tunisia
Chad
Niger
Sudan
±
0 100 200 300Km
First stage
Second stage
Third stage
Northeastern Hasawna well fileds
Eastern Hasawna well fileds
El-Kufra
Jalo
Jaghboub
SirtBen-Ghazi
Sebha
well field
well field
well field
Tazirbo well field
El-Sarir well field

Attia El-Tantawi: Climate change in Libya and desertification of Jifara Plain
222
Tab. 88: Agricultural projects on the Great Man-Made River Project, second stage
Project Irrigated area (ha) Mill. m3/year of irrigation water Al- Qarabulli (agriculture) 4,175 45.0 Al-Hirah (settlement) 4,240 25.8 Al-Hay wadi (agriculture) 3,344 28.1 Bear Terfas (agriculture) 2,365 24.2 Abu-Shaibah (settlement) 1,000 6.1 Abu-Shaibah (production) 1,158 9.0 Almejinin wadi 1,800 9.5 Al-Hirah (Cows) 1,000 10.1
Source: GENERAL AUTHORITY OF THE GREAT MAN-MADE RIVER, 1996: 45
The first of the three planned phases in the construction of The Great Man-Made
River was completed in 1991; Ben-Ghazi and Sirt were supplied with water. The second
phase was completed in 1996 when water pipelines reached Tripoli city. The third phase is
carried out due to the financial possibilities and the needs of water; the first part (El-Kufra-
El-Sarir) will be operated in 2010, the second part (the first and the second phases were
linked in 2000), all phases will be completed in 2015 (SCHLIEPHAKE, 2004: 212).
7.4.8 Enacting legislative acts to combat desertification
Libya has implemented several laws and legislative acts, with a number of ancillary
and supplementary rules to regulate, to protect agriculture and rangelands, and to restrict
urban development at the expense of agriculture lands, and to restrict the deterioration of
water resources as well as to serve as an appropriate framework for the efforts made to
combat desertification and achieve the objectives and requirements of sustainable deve l-
opment. The promulgation of such laws, legislative enactments, regulations and controls
will, however, be insufficient in itself, as it is also crucial to supervise their implementa-
tion, monitoring and follow-up. The various inspection, protection and monitoring agen-
cies require guidance concerning the significance and size of the different effects of deser-
tification and its causes, as well as the potential role which they can play in alleviating the
severe limitations and the ensuing pressures. Predictions of occasional spells of drought
and shortages of natural resources in the affected areas are therefore required (NA-
TIONAL COMMITTEE TO COMBAT DESERTIFICATION, 2002).
The followings are some of the laws and legislative acts to conserve natural resources
and to combat desertification in Libya: governmental decisions no. 33 in 1970 and no. 46
Attia El-Tantawi: Climate change in Libya and desertification of Jifara Plain
223
in 1975 in order to protect agriculture lands from settlement expansion; law no. 5 in 1982
to protect pastoral and forests lands, modified by law no. 14 in 1992, and law no. 7 in 1982
for protection of the environment ; law no. 3 in 1982 for controlling and limiting the over-
exploitation of water resource use; law no. 15 in 1992 to protect vegetation which stabi-
lizes sand dunes; and law no. 277 in 1997 to create the national committee to combat de-
sertification (GENERAL ENVIRONMENTAL AUTHORITY, 2002).
7.4.9 Popular administration and participation
Popular awareness of desertification process and protection of natural resources (water
and soil) endure as a major strategic to achieve the objectives and requirements of sustain-
able development. Action to combat desertification will largely be carried out by national
organizations. In 1971, the national activities in Libya began after implementing the law
no. 111 in 1970 (NATIONAL COMMITTEE TO COMBAT DESERTIFICATION, 2002).
In 1999, there were 102 national societies and institutions for environmental protec-
tion (GENERAL ENVIRONMENTAL AUTHORITY, 2002: 212). Natural resources
management can successfully generate the positive and active participation of the inhabi-
tants concerned, which begins with a sound diagnosis, continues through the stage of for-
mulating and implementing the measures and arrangements needed to reduce the serious
obstacles and pressures of which the fundamental elements of resources and land in gen-
eral are exposed, and ends with appropriate development and investment activities (NA-
TIONAL COMMITTEE TO COMBAT DESERTIFICATION, 1999).

Attia El-Tantawi: Climate change in Libya and desertification of Jifara Plain
224
8. Results and Recommendations
8.1 Results
The present study has revealed a number of results; the following are considered the main:
(1) Libya occupies a part of northern Africa between 20° to 34° N and 10° to 25° E.
(2) Libya’s total population was at 5.3 million in 2001 including more than 500,000 non-
nationals, almost 90 % of them living in the coastal region, and about 10 % live widely
scattered oases in mid- and southern Libya.
(3) Lands of Libya are generally divided into northern coastal plain and high lands, iso-
lated mountains and depressions in the south. Serir desert in the east, El-Hamada El-
Hamra desert in the west are the most obvious geomorphological features in Libya.
(4) Climate of Libya is determined by contrasting Mediterranean and Sahara climates.
More than 95 % is desert. Mean annual temperatures decrease gradually northward, in
contrast to precipitation which decreases southward. Winter is the rainiest season 50-70
% followed by autumn and spring, while no or negligible precipitation occurs in sum-
mer. Climatic regions in Libya are: Arid desert climate (BWh) in mid- and southern
Libya, Steppe climate (BSh) in northern Libya, and Mediterranean climate type (CSa)
in northeastern Libya on Jebal El-Akhdar.
(5) Groundwater is the main water resource in Libya ; it supplies about 88 % of the water
needs. The Great Man-Made River Project is a massive project with four-meters-
diameter pipes and a length of about 4000 km aiming to divert the groundwater from
the southern basins to the coastal areas where about 90 % of Libya’s population has
settled.
(6) Climate change is every deviation from the normal having significance according to
the actual use of statistical tests, while the term trend denotes climate change character-
ized by a smooth, monotonic increase or decrease of average values over the period of
record.
(7) It is clearly identified that the 20th century was the warmest century during the past
1,000 years. Trend of the global mean annual temperature was 0.07 °C/decade. Warm-
ing pronouncedly occurred over two periods, 1910-1945 (0.14 °C/decade) and 1976-
2000 (0.17 °C/decade). The bulk of global warming occurred in summer and autumn

Attia El-Tantawi: Climate change in Libya and desertification of Jifara Plain
225
from 1910-1946, while winter and spring were the governing seasons of global warm-
ing from 1976-2000. Minimum temperatures increased at nearly twice the rate of
maximum temperatures.
(8) Global land precipitation has increased by about 2 % since the beginning of the 20th
century. Though the increase is statistically significant, it is neither spatially nor tempo-
rally uniform. It was relatively stable, or slightly increased from 1900 to the early
1940s, then increased sharply from the mid-1940s to the mid-1950s and has remained
relatively high over most of the land areas except the tropics, where precipitation de-
creased to below the 1900–1988 average in the 1970s and 1980s.
(9) Trends of mean annual temperature over Libya were positive at all study stations from
1946-2000 except at one, negative trends prevailed at most stations from 1946-1975,
while strongly positive trends were computed at all study stations from 1976-2000
corresponding with the global warming trend. Positive trends of mean minimum tem-
peratures were observed at all reference stations over the periods 1946-2000 and 1976-
2000, while negative trends prevailed at most stations from 1946-1975. For mean
maximum temperature, positive trends were computed from 1946-2000 and from 1976-
2000 at most stations, while most trends were negative from 1946-1975. Minimum
temperatures increased at nearly more than twice the rate of maximum temperatures at
most study stations. Negative trends of mean temperature range were computed at most
stations over both periods 1946-2000 and 1976-2000.
(10) Positive trends of extreme minimum temperatures were deduced at all reference
stations from 1946-2000. In contrast, the trends of extreme maximum temperature were
negative or weakly positive at most stations in the same period. Trends of mean
extreme minimum temperature expressed a striking warming from 1976-2000 at all sta-
tions, while positive trends of extreme maximum temperature prevailed at only eight
stations.
(11) For seasonal temperature trends over Libya, warming mostly occurred in summer and
autumn in contrast to the global observations identifying warming mostly in winter and
spring in both periods 1946-2000 and 1976-2000.
(12) The 1990s were the warmest decade over global and Libya, the 1998 was the warmest
year over global, while 1999 was the warmest yeas over Libya in the 20th century.
Attia El-Tantawi: Climate change in Libya and desertification of Jifara Plain
226
(13) Most study stations are located in northern Libya and little information was available
for southern parts which must be taken into account to investigate the spatial changes of
temperature over Libya. Remarkably large spatial variations of temperature changes
were observed from north to south over Libya.
(14) Positive trends of annual precipitation totals were observed from 1946-2000, while
negative trends were computed at most stations from 1976-2000. Positive trends of an-
nual precipitation intensity were elaborated in the long-observation period (1946-2000),
while negative trends prevailed in the short-observation period (1976-2000) at most sta-
tions. Trends of winter and spring precip itation showed positive trends, while and
trends of autumn precipitation were negative at most stations from 1946-2000. Re-
markably large variations were seen among the different seasons over the period 1976
to 2000.
(15) Remarkable variations were observed in distribution of annual precipitation total
changes over Libya. From 1946-2000, precipitation increased over northern Libya,
while it decreased over southern Libya. From 1976-2000, the trends of annual precipita-
tion total were negative over most Libya indicating decreasing precipitation at most sta-
tions.
(16) Negative trends prevailed for mean annual relative humidity at eight stations, while
positive trends were shown at seven stations from 1946-2000. For the short observation
period 1976-2000, positive trends were computed at most stations.
(17) Annual cloud amount totals decreased at most study stations over both periods 1946-
2000 and 1976-2000.
(18) For all-Libya from 1951-2000, positive trends were identified for annual, minimum,
autumn, summer, winter, maximum, and spring temperatures, while negative trends of
extreme maximum temperature and mean annual temperature range were computed.
From 1951-1975, decreasing trends were identified for mean annual, summer, mini-
mum, autumn and maximum temperatures, while increasing trends were observed for
winter and spring temperatures. From 1976-2000, strongly positive trends were ob-
served for annual, minimum, summer and autumn temperatures, and positive trends
were computed for winter, maximum and spring temperatures.
Attia El-Tantawi: Climate change in Libya and desertification of Jifara Plain
227
(19) From 1951-2000, weakly positive trends of 0.03, 0.03, 0.06 and 0.07 mm/decade pre-
vailed for annual precipitation total over all-Libya, annual precipitation intensity, winter
precipitation and spring precipitation, respectively. No trend was seen for autumn pre-
cipitation. Trend of annual precipitation over all-Libya was negative of -0.20
mm/decade. From 1976-2000, positive trend occur for winter precipitation at 0.17
mm/decade, while negative trends were computed for annual total, annual intensity,
spring and autumn precipitation.
(20) A positive trend was identified for the annual mean relative humidity over all-Libya
from 1951-2000, a positive trend was computed from 1976-2000, while a negative trend
was seen from 1951-1975.
(21) Annual cloud amount totals decreased over all-Libya in both periods 1951-2000 and
1976-2000.
(22) Natural climate forcing probably increased during the first half of the 20th century,
while since 1951, the changes observed are mostly due to human activities, and some
changes are also reflection are natural variability.
(23) Correlation coefficient was significantly positive (0.27) between global annual tem-
perature and sunspots number in the 20th century. The effect of sunspots number on
temperature change was higher over the first half of the 20th century (1901-1950) than
over the second one (1951-2000).
(24) There was no correlation between sunspots number and mean annual temperatures
over Libya during the study period 1946-2000.
(25) The Pinatubo eruption was primarily responsible for the 0.8 °C drop in global average
air temperature in 1992. Mean annual temperature in Libya is affected by the eruption
of Mount Pinatubo (15°N-121°E) on 12 June 1991, the years 1992 and 1993 were the
coldest in the 1990s.
(26) High variability of precipitation can partly be explained by changes in atmospheric
circulation, which in turn alter the storm tracks and precipitation distribution.
(27) Correlation coefficient between North Atlantic Oscillation and global mean annual
temperature was weakly positive (0.12) over the 20th century.
(28) Reversed relationship was seen between NAO index and temperatures in Libya.
Attia El-Tantawi: Climate change in Libya and desertification of Jifara Plain
228
(29) The relationship between NAO index and annual precipitation totals in Libya are posi-
tive in winter. The effect of NAO decreases eastward.
(30) El-Nino phenomenon is now widely recognized as the recurring cause of major natu-
ral perturbations to the climate system.
(31) There was no correlation between Southern Oscillation Index (SOI) and climate
change over Libya (temperature and precipitation).
(32) Anthropogenic causes of climate change have increased significant ly from the 19th
century and have largely increased over the 20th century.
(33) A strong relationship between CO2 concentrations and global warming was observed
in the 20th century, correlation coefficient was significantly positive at 0.78. Correlation
coefficient between methane and global mean annual temperature from 1901-1994 was
positive and significant (0.75).
(34) Total concentration of CO2 has increased in Libya from 1950-2000. The largest con-
tributor to CO2 emissions is fossil fuel consumption. Correlation coefficient between
CO2 and temperature trends in Libya was significantly positive.
(35) Patterns of landuse and urban heat islands can play a small role of climate change in
settlement centers located in northern Libya.
(36) Libya is vulnerable to climate change because of prevailing arid and semi-arid cli-
mates, recurrent droughts, and inequitable land distribution. High precipitation vari-
abilities and intensities may cause severe moisture stress on cultivated crops.
(37) Increasing temperature derives also soil erosion and wind speed, which in turn in-
crease amount of Saharan dust causing health and economic problems. Gibli wind has
drastically effects on Libya.
(38) Crop productions and food security, water resources, human health, population set-
tlement and biodiversity can be affected by climate change over Libya. But the effects
depend on its magnitude and the rate with which climate change occurs.
(39) As high precipitation variabilities, wheat and barely crops in Libya experience to
greatly changes from year to year in their productions and harvest areas.
(40) Climate change may increase the vulnerability of livestock due to shortage of water
resources, increased salinity, and loss of grazing sites.
Attia El-Tantawi: Climate change in Libya and desertification of Jifara Plain
229
(41) Changing temperature and precipitation regimes cause change in the water budget. As
a result, irrigation and flood control system, water storage, and hydroelectric installa-
tions as well as for a production systems are seriously affected.
(42) Sandstorms over northwestern Libya dating 29.03.2002 for 12 hours with a speed of
70 km/hour affected human health through charging the air with 387 microgram/m3 pol-
lutions, the safe level according to WHO is 120 micrigram/m3/day.
(43) In Libya, population and urbanization increased sharply in the second have of the 20th
century, it generated impacts on natural resources and the environment (water resources
and soils) which are very vulnerable to climate change.
(44) Loss of biodiversity is a consequence of climate change at the local and global level,
recurrent drought might decrease the ability of trees to resist pests, several kinds of
animals and plants disappeared.
(45) Among the important consequences resulting from climate change in arid and semi-
arid lands, ranks desertification which is diminution or destruction of the biological po-
tential of land, and can lead ultimately to desert- like conditions.
(46) Jifara Plain, located in northwestern Libya, has experienced to desertification, soil was
degraded, vegetation cover disappeared and groundwater wells were getting dry in
many areas.
(47) Soil degradation is the main aspect of desertification in Jifara Plain; the most domi-
nant soil-degradation process is wind and water erosion.
(48) Vegetation destruction takes place in Jifara Plain through overgrazing and over-
cultivation, both activities being driven by the needs of growing population.
(49) The scarcity of water was aggravated by water level declines and deterioration of wa-
ter quality. Water level declined over 1 m/year in some parts and total dissolved solids
increased exceeding 9,000 mg/liter in the last four decades in Jifara Plain. Water deficit
in Jifara Plain was six times from groundwater safe use.
(50) In northwestern Libya, 33,500 ha have been affected by sand dunes movements. In
northern Jifara Plain (758,026.2 ha), the area which covered by sands has increased
from 430,154.6 ha in 1989 to 450,636.3 ha in 2001.
Attia El-Tantawi: Climate change in Libya and desertification of Jifara Plain
230
(51) Over 25 % of highly fertile lands have been consumed by the expansion of urban ar-
eas in Libya. The belt-up area of Tripoli increased from 8,011.4 ha in 1966 to 19,236 ha
in 2000.
(52) Desertification of Jifara Plain was caused by: climate change which can accelerate
desertification process through precipitation patterns and Gibli wind; landforms in Ji-
fara Plain accelerate soil erosion followed by desertification; overgrazing and over-
cultivation are being increasingly eroded due to the widening and excessive use of
technical methods; Increasing of population alters the consumption patterns against the
limited natural resources.
(53) The effect of desertification on Jifara Plain appears through reducing soil fertility and
crops productivity, leading to long-term declines in agricultural yields, livestock yields,
plant standing biomass, and plant biodiversity. It has also significant implications on
livestock industry and the national economy. It accelerates migration from rural to ur-
ban settlement areas as the land cannot support the original inhabitants.
(54) In the absence of major shifts in policy, economic growth, energy prices, and con-
sumer trends, global warming is expected to continue. The mean annual temperature of
all-Libya will be increased about 1 °C from 2000-2050 based on the projection of trend
from 1976-2000 corresponding with the global temperature trend projection. Precipita-
tion at 10 stations represented a decrease based on 1976-2000 period, while two stations
only declared increasing of precipitation in the first half of 21st century.
(55) Water deficit will be increased in response to the increasing of water demands for
domestic, industrial and agricultural purposes. In Libya, as a whole, water demands will
be increased from 5,579 mill. m3 in 2000 to 8,965 mill. m3 in 2025 followed by water
deficit of 4,735 mill. m3. Approximately half of the deficit water in all Libya will be in
Jifara Plain which is inhabited by more than 50 % of Libya’s total population.
(56) Libya cooperates with the United Nations and international organizations. It has
signed and ratified a number of international and regional agreements which effectively
established a policy framework for actions to mitigate climate change and combat de-
sertification. Libya has implemented several laws and legislative acts, with a number of
ancillary and supplementary rules to regulate.
Attia El-Tantawi: Climate change in Libya and desertification of Jifara Plain
231
(57) In Libya, two nature reserves and five national parks were established in several out-
standing environmental regions, covering a substantial area of 134,000 hectares. Libya
in interested in establishing of the Natural Protectorates in many parts of Jifara plain.
(58) Libya was ranked during the 1960s and 1970s as a world pioneer in the field of deser-
tification combat. The first use of fixation with petroleum emulsion was in Libya 1961.
125,000 ha have been stabilized by this method, in 1971 oil derivatives has been used to
fix sand dunes named internationally the Libyan method.
(59) Water development projects were also established including steps for the utilization of
surface water; in addition to the construction of thousands of reservoirs and tanks. Six-
teen major dams with an estimated annual storage capacity of 300 mill. m3 were con-
structed and over 100 mill/m3 are treated annually for agricultural purposes. The Great
Man-Made River project alleviates the pressure on water resources in northern parts of
Libya such as Jifara Plain.
8.2 Recommendations
Despite the current efforts and ongoing projects being undertaken in Libya in the field
of climate change and desertification, urgent actions are needed to mitigate climate change
and combat desertification in the future.
(1) Mitigation of climate change and desertification combat require well- integrated na-
tional, regional and international efforts. Developing countries need international sup-
port in these fields and substantial reductions of greenhouse gases in developed coun-
tries and adaptation strategies are crucial.
(2) Greenhouse gases can be reduced by improving energy efficiency using cleaner en-
ergy sources and technologies and promoting renewable energy in electricity generation
using wind and solar energies.
(3) Sink actions of CO2 can also be carried out through the increase of CO2 absorption
capacity including planting and maintaining suitable types of trees in city center and
along the roads, as well as along the water drains. In addition planting forests using
treated sewage water for their irrigation, which have high biomass as are also an impor-
tant sink for carbon dioxide.

Attia El-Tantawi: Climate change in Libya and desertification of Jifara Plain
232
(4) The present number of meteorological stations in Libya is inadequate and must be
improved and intensified especially in the southern parts of the country.
(5) Research projects of climate change and desertification and development strategies in
Libya must be set up as soon as possible.
(6) Gathering all the institutions which work in climate change and desertification issues
in order to avoid the quarrel in decisions. Supporting the scientific institutions and insti-
tutes in order to increase the role of researches, education, and training. Monitoring,
analyzing and forecasting variation is of prime importance to climatologists as well as
policy and decision makers.
(7) Adaptation could be impeded in many areas by anticipated rate of climate change,
limited access to technical expertise and wider social and economic circumstances and
policies. Impacts of climate change could seriously undermine efforts for reorientation
the society towards sustainable development.
(8) Sustainable deve lopment strategies must include expected climate change. Subse-
quently, national environmental action plans and implementation must incorporate
long-term changes and should put the welfare of people at the center of the develop-
ment agenda. More cooperation between people and government is crucial to imple-
ment polices.
(9) Improving and well management of natural resources, especially soil and water, suc-
cess will be achieved by the means of an effective and decisive management taking into
account the social and economic circumstances of the inhabitants. Measures to combat
desertification must ultimately be directed toward people, sustaining and improving
their livelihoods.
(10) Expansion of safely cropped areas by introducing crops which are more resistant to
extreme conditions and by improving methods of cultivation and water conservation.
Priority has to given to the quality of agriculture productions which has to be improved,
instead of cultivating more marginal lands. Modern technologies and approaches in ag-
riculture and water resources management are very important to meet increasing de-
mands and to alleviate the effects of climate change and desertification.
(11) Discharges from the groundwater aquifer in Jifara Plain should be properly managed
and the rate of the sea water intrusion could also be reduced by investigation and new

Attia El-Tantawi: Climate change in Libya and desertification of Jifara Plain
233
management policies for optimal use of the freshwater in the aquifer. Improved irriga-
tion methods, mechanization, fertilization, plant protection and the selection of crops
that use water more efficiently are important for facing desertification.
(12) Conservation of animal and plant varieties will be a series issue, as some nature re-
serves and national parks become increasingly inappropriate from climate for the spe-
cies they were meant to protect.
(13) Popular awareness of climate change and desertification is crucial to achieve the ob-
jectives and requirements of sustainable development. Citizens should be aware about
the importance of natural resources and not be excusive in using them. Local
knowledge should also be enlisted.
(14) The availability of information base is very important for putting policies and action
plans to mitigate climate change and combat desertification.

Attia El-Tantawi: Climate change in Libya and desertification of Jifara Plain
234
Summary
The study was arranged to manifest its objectives through preceding it with an intro-
duction. Particular attention was paid in the second part to detect the physical settings of
the study area, together with an attempt to show the climatic characteristics in Libya. In the
third part, observed temporal and spatial climate change in Libya was investigated through
the trends of temperature, precipitation, relative humidity and cloud amount over the peri-
ods (1946-2000), (1946-1975), and (1976-2000), comparing the results with the global
scales. The forth part detected the natural and human causes of climate change concentrat-
ing on the greenhouse effect. The potential impacts of climate change on Libya were ex-
amined in the fifth chapter. As a case study, desertification of Jifara Plain was studied in
the sixth part. In the seventh chapter, projections and mitigations of climate change and
desertification were discussed. Ultimately, the main results and recommendations of the
study were summarized.
In order to carry through the objectives outlined above, the following methods and
approaches were used: a simple linear regression analysis was computed to detect the
trends of climatic parameters over time; a trend test based on a trend-to-noise-ratio was
applied for detecting linear or non- linear trends; the non-parametric Mann-Kendall test for
trend was used to reveal the behavior of the trends and their significance; PCA was applied
to construct the all-Libya climatic parameters trends; aridity index after Walter-Lieth was
shown for computing humid respectively arid months in Libya; correlation coefficient,
(after Pearson) for detecting the teleconnection between sun spot numbers, NAOI, SOI,
GHGs, and global warming, climate changes in Libya; aridity index, after De Martonne, to
elaborate the trends of aridity in Jifara Plain; Geographical Information System and Re-
mote Sensing techniques were applied to clarify the illustrations and to monitor desertifi-
cation of Jifara Plain using the available satellite images MSS, TM, ETM+ and Shuttle
Radar Topography Mission (SRTM). The results are explained by 88 tables, 96 figures and
10 photos.
Temporal and spatial temperature changes in Libya indicated remarkably different an-
nual and seasonal trends over the long observation period 1946-2000 and the short obser-
vation periods 1946-1975 and 1976-2000. Trends of mean annual temperature were posi-
tive at all study stations except at one from 1946-2000, negative trends prevailed at most
stations from 1946-1975, while strongly positive trends were computed at all study stations

Attia El-Tantawi: Climate change in Libya and desertification of Jifara Plain
235
from 1976-2000 corresponding with the global warming trend. Positive trends of mean
minimum temperatures were observed at all reference stations from 1946-2000 and 1976-
2000, while negative trends prevailed at most stations over the period 1946-1975. For
mean maximum temperature, positive trends were shown from 1946-2000 and from 1976-
2000 at most stations, while most trends were negative from 1946-1975. Minimum tem-
peratures increased at nearly more than twice the rate of maximum temperatures at most
stations. In respect of seasonal temperature, warming mostly occurred in summer and au-
tumn in contrast to the global observations identifying warming mostly in winter and
spring in both study periods.
Precipitation across Libya is characterized by scanty and sporadically totals, as well as
high intensities and very high spatial and temporal variabilities. From 1946-2000, large
inter-annual and intra-annual variabilities were observed. Positive trends of annual precip i-
tation totals have been observed from 1946-2000, negative trends from 1976-2000 at most
stations. Variabilities of seasonal precipitation over Libya are more strikingly experienced
from 1976-2000 than from 1951-1975 indicating a growing magnitude of climate change
in more recent times.
Negative trends of mean annual relative humidity were computed at eight stations,
while positive trends prevailed at seven stations from 1946-2000. For the short observation
period 1976-2000, positive trends were computed at most stations. Annual cloud amount
totals decreased at most study stations in Libya over both long and short periods. Re-
markably large spatial variations of climate changes were observed from north to south
over Libya.
Causes of climate change were discussed showing high correlation between tempera-
ture increasing over Libya and CO2 emissions; weakly positive correlation between pre-
cipitation and North Atlantic Oscillation index; negative correlation between temperature
and sunspot numbers; negative correlation between precipitation over Libya and Southern
Oscillation Index. The years 1992 and 1993 were shown as the coldest in the 1990s result-
ing from the eruption of Mount Pinatubo, 1991.
Libya is affected by climate change in many ways, in particular, crop production and
food security, water resources, human health, population settlement and biodiversity. But
the effects of climate change depend on its magnitude and the rate with which it occurs.
Attia El-Tantawi: Climate change in Libya and desertification of Jifara Plain
236
Jifara Plain, located in northwestern Libya, has been seriously exposed to desertifica-
tion as a result of climate change, landforms, overgrazing, over-cultivation and population
growth. Soils have been degraded, vegetation cover disappeared and the groundwater wells
were getting dry in many parts. The effect of desertification on Jifara Plain appears
through reducing soil fertility and crop productivity, leading to long-term declines in agr i-
cultural yields, livestock yields, plant standing biomass, and plant biodiversity. Desertifi-
cation has also significant implications on livestock industry and the national economy.
Desertification accelerates migration from rural and nomadic areas to urban areas as the
land cannot support the original inhabitants.
In the absence of major shifts in policy, economic growth, energy prices, and con-
sumer trends, climate change in Libya and desertification of Jifara Plain are expected to
continue in the future.
Libya cooperated with United Nations and other international organizations. It has
signed and ratified a number of international and regional agreements which effectively
established a policy framework for actions to mitigate climate change and combat deserti-
fication. Libya has implemented several laws and legislative acts, with a number of ancil-
lary and supplementary rules to regulate. Despite the current efforts and ongoing projects
being undertaken in Libya in the field of climate change and desertification, urgent actions
and projects are needed to mitigate climate change and combat desertification in the near
future.
Attia El-Tantawi: Climate change in Libya and desertification of Jifara Plain
237
References
ABAHUSSAIN, A., ABDU, A., AL-ZUBARI, W., ALAA EL-DEEN, N., and ABDUL-RAHEEM, M. (2002): Desertification in the Arab Region: analysis of current status and trends. Journal of Arid Environments 51: 521–545. Elsevier Science Ltd. http://www.idealibrary.com 05.09.2004
ABUFAYED, A. and EL-GHUEL, M. (2001): Desalination process applications in Libya, pre-sented at the European Conference on Desalination and the Environment: Water Shortage. Le-mesos, Cyprus, 28–31 May 2001. Desalination 138: 47–53.
AGRICULTURAL RESEARCH CENTER (1992): Wheat and barley (facts and numbers), Tripoli.
AL-ADYOUSH, R. (2000): Environmental deterioration in northwestern Jifara Plain in Libya, unpublished M.Sc., El-Fateh University, Tripoli, Libya (in Arabic).
ALEXANDER, L., et al. (2000): Climate change , Hadley Centre. http://www.metoffice.gov.uk
Allen, J. (2004): Ozone and Climate Change, NASA Earth Observatory, http://www.theozon ehole.com/climate.htm, 13.03.2005
ALMABRUK, A. (1995): Reflections on climate variability within selected monthly mean time series in Libya and neighboring countries, Geographia Polonica, 65: 51-62.
ALMABRUK, A. (1997): Estimation of evapotranspiration in Libya under the impact of plausible global climate change, Geographia Polonica, 70: 25-42.
ALVERSON, K., BRADLEY, R. and PEDERSEN, T. (2001): Environmental variability and cli-mate change (past global change), Science, no. 3. Stockholm.
AMANAT EL-TAKHTIET, (1978): National Atlas of Libya, Tripoli.
BACH, W. (1979): Short-term climatic alterations caused by human activities: status and outlook, Progress in Physical Geography, 1979, Edward Arnold Pub. LTD., London.
BAES C. F., GOELLER H. E., OLSON J. S., and ROTTY R. M. (1981): Carbon Dioxide and cli-mate: the uncontrolled experiment, in: Skinner, B., (Ed.), 1981, Climates Past and Present, William Kaufmann, INC. Los Altos, California.
BAQI, M. (1991): Desertification in North Africa, its causes and its treatments. Desert Studies Series 2, Murzuq, Libya (Translated into Arabic by EL-MEHESHI).
BARRY, R. (1977): Short-term climatic fluctuations, Progress in Physical Geography, 1977. Ed-ward Arnold Pub., LTD., London.
BEDRITSKY, A. I. (1999): The impact of weather and climate on economic development and sustainability, WMO Bulletin: 48, World Meteorological Organization.
BEN-MAHMOUD, R., MANSUR, S., and AL-GOMATI, A. (2000): Land degradation and deser-tification in Libya, Land Degradation and Desertification Research Unit, Libyan Center for Remote Sensing and Space Science, Tripoli, Libya.
BRAUCH, H. G. (2004): Urbanization and Natural Disasters in the Mediterranean: Population Growth and Climate Change in the 21st Century. http://www.proventionconsortium.org/files /conference_papers/brauch.pdf 20.10.2004
BROOKS, R. (1991): Weather, Climate and Environmental Change, Global Chang,, Vol. VI, Yale -New, http://www.yale .edu/ynhti/curriculum/units/1991 /6/91.06.01.x. html#i 20.4.2005
BUCHDAHL, J. (1999): A review of contemporary and prehistoric global climate change, Atmos-phere, Climate & Environment Information Programme, aric, Manchester Metropolitan University, http://www.doc.mmu.ac.uk/aric/ 12.02.2005

Attia El-Tantawi: Climate change in Libya and desertification of Jifara Plain
238
BURNS, T., DAVIS, B., and KICK, E. (1997): Position in the world-system and national emis-sions of greenhouse gases, Journal of World-Systems Research 3: 432-466. http://jwsr.ucr.edu/index.php1 2.07.2004
CANE, M. (1997): ENSO (El-Nino Southern Oscillation) and Its Prediction: how well can we forecast it, Internet Journal of African Studies, No. 2, March. 1997, http://www.brad.ac.uk /research/ijas/ijasno2/ayalew.html 25.12.2003
CHUNG, U., CHOI, J., and YUN, J. (2004): Urbanization effect on the observed change in mean monthly temperatures between 1951-1980 and 1971-2000 in Korea, Climatic Change 66: 127–136, Kluwer Academic Publishers. Netherlands.
CIA (2004): Libya, world fact book, www.cia.gov/cia/publications/factbook/geos/ly.html 10.01.05
CICERONE, et al. (2001): Climate change science: an analysis of some key questions, committee on the science of climate change, national academy press, Washington, D.C. USA., http://books.nap.edu/html/climatechange/ 10.02.2005
COUNTRYWATCH, Inc. (2000): http://aol.countrywatch.com/aolprint.asp?vCOUNTRY=100& SECTION=APP&TOPIC=EVCON&TYPE=APPEN 12.01.2005
CURRY, L. (1962): Climate change as a random series, Annals of the association of American Geographers, Vol. 52, Blackwell Publisher, Cambridge.
DAI, A., FUNG, I. Y., and DEL GENIO A. D. (1997): Surface observed global land precipitation variations during 1900-1988, Journal of climate 10: 2943-2962, American Meteorological Society.
DE PAUW, E., GÖBELA, W., and ADAMB, H. (2000): Agro-meteorological aspects of agricul-ture and forestry in the arid zones, Agricultural and Forest Meteorology 103: 43–58, Elsevier, Amsterdam, London.
DEBRA, P. C., and JEFFREY, E. H., (2001): Modeling Vegetation Change and Land Degradation in Semiarid and Arid Ecosystems: An Integrated Hierarchical Approach Advances, Environmental Monitoring and Modeling 1: 1-29.
DESANKER, P. V. (2002): Impacts of climate change on Africa, www.wwf.org.uk/filelibray/pdf/ Africa-climate-text.pdf 14.10.2003
DOMRÖS, M. (1996): Rainfall variability over Sri Lanka. In: Yash P. A., Suloclana G., and Go-vind B. P. (Eds.), 1996: Climate variability and agriculture, Narosa Publishing House, New Delhi: 163-179.
DOMRÖS, M. and EL-TANTAWI, A. (2005): Recent temporal and spatial temperature changes in Egypt, International Journal of Climatology, 25, 1: 51–63, John Wiley & Sons, Inc. Royal Mete-orological Society, London.
DOMRÖS, M. and GONGBING, P. (1988): The climate of China, Springer-Verlag, Berlin.
DONAIRE, J. (2000): New Definitions of climate and climatic change, Bull. Soc. Geog: Egypt, Tome LXXIII, 73, Cairo, Egypt.
DUBIEF, J. (1971): Die Sahara, eine Klima-Wüste. In: Schiffers, H. (Ed.) Die Sahara und ihre Randgebiete ’Darstellung eines Naturgroßraumes’ Band 1: 227-347, Physiogeographie , Weltforum Verlag, München, Germany.
EEAA (Egyptian Environmental Affairs Agency) (1999): The Arab Republic of Egypt: initial na-tional communication on climate change, prepared for the United Nations Framework, Convention on Climate Change (UNFCCC).
EIA (Energy Information Administration) (2004): Libya, Country Analysis Brief. Washington. http://www.eia.doe.gov/emeu/cabs/libya.pdf 10.08.2004
Attia El-Tantawi: Climate change in Libya and desertification of Jifara Plain
239
EL-ASRAG, A. M. (2002): Climate change over Egypt and its relevance to global change. http://nwp.gov.eg/research/RES1/EgyptCC.htm 10.01.2003
EL-SHERIEF, S. (1995): Water amount reserved in the Al-Majenin dam Lake (1973-1994), un-published report, General Water Authority, Tripoli, Libya.
EL-TANTAWI, A. (1998a): Water resources in Libya (applied study), MSc, Institute of African Researches and Studies, Cairo University (in Arabic).
EL-TANTAWI, A. (1998b): Water balance in Libya, presented in the first Arabic conference on water and desertification, Academy of Scientific Research, Cairo (in Arabic).
EL-ZAEDY, M. S. and EL-TAHER, F. A. (2000): Improvements Seeds production in Libya , In-ternational conference for seeds industry, Tripoli, Libya (in Arabic).
EL-ZANNAN, E. (2000): Settlement expansion on agricultural lands : its geographical, social and economic causes (Tripoli city), MSc., El-Fateh University, Tripoli, Libya (in Arabic).
ENCARTA, (2005): Libya, Microsoft Encarta Online Encyclopedia 2005, http://encarta.msn.Com /text_761570705__1/Libya.html 24.02.2005
ENDLICHER, W. (1997): Klima und Zukunft: Zurück in die Eiszeit oder vorwärts in die wärme Katastrophe? Eine Zwischenbilanz: 49-59. Jahrbuch 1997, Marburger Geographische Gesellschaft, Marburg/Lahn.
EPA (U.S. Environmental Protection Agency), (2005): Methane (CH4), http://www.epa.gov/ meth-ane/index.html, 20.04.2005
ESRI MEDIA KIT, (2001): World Sat Color Satellite Image, ESRI Data & Maps 2000 (Courtesy of ESRI, Inc.), ESRI, Redlands, USA.
FABIAN, P. (2002): Leben im Treibhaus. Unser Klimasystem und was wir daraus machen. Springer Verlag. Berlin, Germany.
FAO (Food and Agriculture Organization), (2001): FAO production yearbook, Vol. 55, Rome.
FAO (Food and Agriculture Organization), (2002): FAO production yearbook, Vol. 56, Rome.
FEDDEMA, J. (1999): Future African water resources: interactions between soil degradation and global warming, Climatic change, Vol. 42, No. 3: 561-596, Kluwer Academic Publishers, Nether-lands.
FOLLAND, C. K., et al. (2001): Observed climate variability and change. In: Houghton, J. T.,Ding, Y., Griggs, D. J., Noguer, M., Linden, P. J., Dai, X., Maskell K. and Johnson C. A., (Eds.) (2001): Climate Change: the Scientific Basis, Working Group I, Third Assessment Report, Inter-governmental Panel on Climate Change, UNEP and WMO.
GENERAL ENVIRONMENTAL AUTHORITY (2002): The first environmental report, Tripoli, Libya.
GILLILAND, R. L. (1982): Solar, volcanic , and CO2 forcing of recent climatic change, Climatic change, 4, no. 2. Kluwer Academic Publishers, Netherlands.
GITHEKO, A., LINDSAY, S., CONFALONIERI, U., and PATZ, J. (2000): Climate change and vector-borne diseases: a regional analysis, Bulletin of the World Health Organization, 78: 136-1147, World Health Organization.
GLANTZ, M., (Ed.) (1977): Desertification: environmental degradation in and around arid lands , Westview Press, Colorado.
GLOBAL LAND COVER FACILITY (2002): ID zone (30-33 north) Platform Landsat, Sensor TM (mosaics 1987-1990) and ETM+ (mosaics 1999-2002), Institute for Advanced Computer Studies, University of Maryland, College Park, USA, http://glcfapp.umiacs.umd.edu:8080/esdi/ index.jsp 08.02.2005

Attia El-Tantawi: Climate change in Libya and desertification of Jifara Plain
240
GOMMES, R. and PETRASSI, F. (1996): Rainfall variability and drought in sub-Saharan Africa since 1960, FAO Agrometeorology Series, Working Paper: 9. http://www.fao.org/waicent/faoinfo /sustdev/EIdirect/EIan0004.htm 20.07.2004
GOUDIE, A., and MIDDLETON, N. (2001): Saharan dusts storms: nature and consequences. Earth-Science Reviews, 56: 179–204, Elsevier.
GREENPEACE, (2005): A Quick Guide to the Climate Negotiations in Buenos Aires: 6-17 De-cember, 2004 http://weblog.greenpeace.org/climatesummit/archives/aquickguidetotheclimat ene-gotiations inba.pdf 12.02.2005
GREGORY, S. (1988): Studies of recent climatic change-setting the scene. In: Gregory, S, 1988: (Ed.), Recent Climatic Change: ‘a regional approach’, Belhaven Press, London & New York.
GRIFFITHS, J. (1968): Applied climatology: ‘an introduction’ , Oxford University Press, London.
GRIFFITHS, J. (1972): The Mediterranean Zone. In: Griffiths, J. (Ed.), 1972: Climate of Africa, world survey of climatology, Vol. 10, Elsevier, Amsterdam, London.
GRIFFITHS, J. and SOLIMAN, K. (1972): The Northern desert (Sahara). In: Griffiths J. (Ed.) 1972: Climate of Africa, world survey of climatology, Vol. 10, Elsevier, London.
GROVE, A. T. (1977): Desertification, Progress in Physical Geography 1977, Edward Arnold (Publishers) Ltd., London.
HADLEY CENTRE STAFF, (2000): Climate change. The Hadley Centre for climate prediction and research, UK. http://www.metoffice.gov.uk 09.08.2004
HARDY, J. (2003): Climate change: causes, effects, and solutions, John Wiley & Sons, Ltd., Lon-don.
HARVEY, D. (1980): Solar variability as a contributing factor to Holocene climatic change, Pro-gress in Physical Geography, no. 4, Edward Arnold (Publishers) Ltd. London.
HIRJI, R. and IBREKK, H. (2001): Water stressed and water scarce countries ‘2025 projections’, Environmental and water resources management strategy series. No. 2, October 2001. World Bank ‘Environment Department’ http://www.waterinfo.gr/pages/data.htm 20.09.2004
HOUGHTON, J. T., DING, Y., GRIGGS, D. J., NOGUER, M., LINDEN, P. J., DAI, X., MAS-KELL, K. and JOHNSON C. A., (eds.), (2001): Climate Change: the Scientific Basis, Working Group I, Third Assessment Report, Intergovernmental Panel on Climate Change, UNEP and WMO.
HOUGHTON, J. T., JENKINS, G. J. and EPHRAUMD, J. J. (Eds.), (1990): Climate change: The IPCC Scientific Assessment, Cambridge University Press, Cambridge.
HOYT, D. V. and SCHATTEN, K. H. (1997): The role of the sun in climate change, Oxford Uni-versity Press, UK.
HUGHES, K. (1997): Countdown to Kyoto, ENN (Environmental News Network) Special Reports, http://www.enn.com/specialreports/climate, 13.09.2003
HULME, M. (1995): Estimating global changes in precipitation, Weather, http://www.cru.uea.ac.uk/cru/papers/mh9502a/weather.htm 17.08.2004
HULME, M., BARROW, E. M., ARNELL, N., HARRISON, P. A., DOWNING, T. E. and JOHNS, T. C. (1999): Relative impacts of human-induced climate change and natural climate vari-ability, Nature, Jan. 1999, 688-691.
HURRELL, J. W. (1995): Decadal trends in the North Atlantic Oscillation and relationships to regional temperature and precipitation. Science 269: 676-679, American Association for the ad-vancement of science.
Attia El-Tantawi: Climate change in Libya and desertification of Jifara Plain
241
IMAGAWA, T., FUKUHARA, M., TAO, W. and ZHENDA, Z. (1997): A monitoring method of land cover/land use change in Naiman, inner Mongolia autonomous region, China using landsat data, GIS development net (AARS-ACRS 1997) poster session, National Institute of Agro-Environmental Sciences, ministry agriculture, forestry and fisheries , Japan.
INTERNATIONAL CENTER FOR WATER RESOURCES, (1999): Groundwater quality in some wells in northwestern Libya, El-Ajilat, Libya.
IPCC, (1990): Potential impacts of climate change, Report of Working Group 2, Intergovernmental Panel on Climate Change, 1: 1-2. Geneva.
IPCC, (2001): Third Assessment Report, climate Change, UNEP and WMO.
JACQUELINE, K. (2000): Climate change and the Mediterranean region, http://archive.greenpeace.org/climate/kimpacts/fulldesert.html, 23.01.2002
JONES, et al. (2004): Temperature calculations, Center for the Study of Carbon Dioxide and Global Change2004, http://co2science.org/cgi-bin/jones.pl 22.01.2005
JONES, P. (2003a): North Atlantic Oscillation (NAO), Climatic Research Unit, University of East Anglia, UK, http://www.cru.uea.ac.uk/cru/data/nao.htm 10.11.2004
JONES, P. (2003b): Southern Oscillation Index (SOI), Climatic Research Unit, University of East Anglia, UK, http://www.cru.uea.ac.uk/cru/data/soi.htm, 10.11.2004
JONES, P. D., NEW, M., PARKER, D. E., MARTIN, S. and RIGOR, I. G. (1999): surface air temperature and its changes over the past 150 years, Reviews of Geophysics, 37: 173-199, The American Geophysical Union.
JONES, P. D., PARKER, D. E., OSBORN, T. J. and BRIFFA, K. R. (2001): Global and hemi-spheric temperature anomalies, land and marine instrumental records. In Trends: A Compendium of Data on Global Change. Carbon Dioxide Information Analysis Center, Oak Ridge National Labo-ratory, U.S. Department of Energy, Oak Ridge, Tenn., U.S.A. http://cdiac.esd.ornl.gov /trends/temp/jonescru/data.html 07.05.2004
KALKSTEIN, L. S., and VALIMONT, K. M. (1987): Climate effects on human health. In: Poten-tial effects of future climate changes on forests and vegetation, agriculture, water resources, and human health . EPA Science and Advisory Committee Monograph no. 25389, 122-152. Washing-ton, Environmental Protection Agency, http://www.ciesin.Org/docs/001-338/001-338.html 23.01.2005
KANTER, H. (1967): Libyen: Eine geographisch-medizinische Landeskunde (A Geomedical Monograph). In:Jusatz, H. (Ed.), 1967: Medizinische Länderkunde, Heidelberg, Germany.
KASSAS, M. (1987): Drought and desertification, Land use policy 4, issue 4: 389-400 Elsevier Science Ltd., Amsterdam, London.
KELLOGG, W. (1977): Effects of human activities on global climate (part 1), WMO Bulletin, Vol. XXVI, No.4, October 1977, Geneva.
KININMONTH, W. R. (1999): The 1997/1998 El Nino event: scientific and technical initiatives, WMO Bulletin , 48: 3, July 1999, Geneva.
KINUTHIA, J. (1997): Global warming and climate impacts in southern Africa: how might things change? Internet Journal of African Studies, no. 2, March 1997, http://www.brad.ac.uk /research/ijas/ijasno2/ayalew.html 27.3.2004
KREDEGH, A. (2002): Sand storm and its effects on man and environment in north western Libya (1965-1997), MSc., Elsabeà Men April Uni. El-Zawia, Libya. (in Arabic),
KRUSEMAN, G. P. and FLOEGEL H. (1980): Hydrogeology of the Jifara Plain, NW Libya, In: Salem, M. and Pusrewil, M., (Eds.): The Geology of Libya, 2, El-Fateh University, Tripoli, Libya.

Attia El-Tantawi: Climate change in Libya and desertification of Jifara Plain
242
KUHN, M. (1990): Klimaänderung: Treibhauseffect und Ozon, Kulturverlag, Austria .
LAL, R. (2001): Potential of desertification control to sequester carbon and mitigate the green-house effect, Climatic change, 51: 35–72, Kluwer Academic Publishers. Amsterdam, Netherlands
LE HOU´EROU, H. (1977): The nature and causes of desertification. In: GLANTZ, M., (Ed.), (1977): Desertification: environmental degradation in and around arid lands, Westview Press, Colorado.
LEICA GEOSYSTEMS, (2003): ERDAS Field Guide TM, 7th ed., GIS & Mapping, LLC., Atlanta, Georgia, USA.
LIBISELLER, C. (2002) MULTMK/PARTMK: A program for the computation of mult ivariate and partial Mann-Kendall tests, http://www.mai.liu.se/~cllib/welcome/Manual.pdf, 12.07.2004
LOCKWOOD, J. (1974): World climatology ‘an environmental approach’, Edward Arnold , London.
LOCKWOOD, J. G. (1977): Long-term climatic changes, Progress in Physical Geography, 1: 1977, Edward Arnold (Publishers) Ltd, London: 114-125.
LUTERBACHER, J. and XOPLAKI, E. (2003): 500-year winter temperature and precipitation variability over the Mediterranean area and its connection to the large-scale atmospheric circula-tion, In: Bolle, H. J. (Ed.), Mediterranean climate variability and trends, Springer, Berlin and Hei-delberg: 133-153.
MARLAND, G., BODEN, T. A. and ANDRES, R. J. (2003): Carbon Dioxide Information Analy-sis Center: Global, Regional, and National Annual CO2 Emissions from Fossil-Fuel Burning, Ce-ment Production, and Gas Flaring: 1751-2000, http://cdiac.esd.ornl.gov/ndps/ndp030.html 17.09.2004.
MARTYN, D. (1992): Climates of the world , PWN-Polish Scientific Publishers, Warszawa, Po-land.
MARUFU, C. Z., BUBU P. J., SHAKESPEARE, M. R., and OKOTH-OGENDO, H.W.O. (2001): The regional impact of climate change, Chapter 2, Africa. IPCC, UNEP and WMO, http://www.grida.no/climate/ipcc/regional/006.htm 05.01.03
McCarthy, J. J., Canziani, O. F., Leary, N. A., Dokken, D. J. and White, K. S., (Eds.) (2001): Cli-mate change ‘Impacts, Adaptation and Vulnerability’, IPCC, Third Assessment Report, Working Group II, UNEP and WMO.
McMORRIS, D.S. (1979): Society and its environment. In: Nelson, H. D., (Ed.) 1979: Libya a country study ‘foreign area studies’, 3rd edition, The American University, Washington.
MENSCHING, H. (1986): Is the desert spreading? Desertification in the Sahel zone in Africa, Applied climatology and development, 27, Institute for Scientific Co-operation, Tübingen, Ger-many.
MESSINES, J. (1952): Sand-dune fixation and afforestation in Libya, Unasylva, 6, an international Review of Forestry and Forest Products, FAO Forestry and Forest products studies.
MGELY, M. (1984): A forecasting model for monthly precipitation and temperature, and analysis of the characteristics of droughts in central California, unpublished Ph.D, Department of Geogra-phy, Indiana University.
MGELY, M. (1994): Drought and desertification in arid and semi-arid lands: NW Libya, Journal of faculty of education, autumn 1994, El-Fateh University, Tripoli, Libya. (in Arabic).
MIDDLETON, N., AND THOMAS, D. (Eds.), (1994): World atlas of desertification, second edi-tion, UNEP, London, New York.

Attia El-Tantawi: Climate change in Libya and desertification of Jifara Plain
243
MOHNEN, V. A., GOLDSTEIN, W. and WANG, W. C. (1995): The potential role of tropospheric ozone as a climate gas, WMO- Bulletin, 44: 1 World Metrological Organization.
MOHSEN, A. (1999): Sustainable development in the light of climate change. In: IIIEE Network, the First Global Environmental Experience Sharing Conference, 24-26 September 1999, http://www.iiiee.lu.se/networkconference/2.4ahmed.htm 01.02.2004.
MÜHR, B. (2004): Die Klimaklassifikation nach W. Köppen, http://www.klimadiagramme.de/ Frame/koeppen.html 02.04.2005
NASA (2003) Saharan dust off Libya and Tunisia, Moderate Resolution Imaging Spectrora-diometer, aboard NASA's Aqua satellite, http://visibleearth.nasa.gov/view_rec.php?id=5955 23.02.2005
NASA Landsat Program, the Earth Science Data Interface (ESDI) at the Global Land Cover Facil-ity (GLCF), U.S. Geological Survey, ftp://ftp.glcf.umiacs.umd.edu/glcf/Landsat 21.06.2004
NASR, M. (1999): Assessing desertification and water harvesting in the Middle East and North Africa: policy implications, no. 10, Center for Development Research, Bonn University, Germany.
NATIONAL COMMIT TO COMBAT DESERTIFICATION, (1999): Summary of programmes to combat desertification in the Libyan Arab Jamahiriya (past, present and future), http://www.unccd .int/cop/reports/africa/national/1999/Libyan_arab_Jamahiriya-eng.pdf 12.08.2002
NATIONAL COMMITTEE TO COMBAT DESERTIFICATION (2002): National reports about Libyan’s efforts to combat desertification, http://www.unccd.int 10.06.2004 (in Arabic).
NATIONAL INFORMATION AUTHORITY OF LIBYA, (2002): General census of population in Libya, http://www.nidaly.org/index.htm 13.09.2002
NELSON, H. D. (1979): Libya, a country study ‘foreign area studies’, 3rd edition, The American University, Washington.
NOAA (National Oceanic and Atmospheric Administration), (1994): El-Nino and climate predic-tion - Reports to the nation on our changing climate, US department of commerce, http://www.pmel.noaa.gov/tao/elnino/nino-home.html 13.10.2004
NOAA's National Geophysical Data Center, 2004: Sunspot numbers, http://www.ngdc .noaa.gov/stp/SOLAR/ftpsunspotnumber.html#international 17.10.2004
NOBLE, I. and GITAY, H. (1995): Deserts in a changing climate: impacts. In: Watson, R., Zin-yowera, M. and Moss, R. (1995): Climate change 1995, IPCC, Cambridge University Press.
NOVELLI, P., CONWAY, T. J., DLUGOKENCKY, E. J., and TANS, P. P. (1995): Recent changes in carbon dioxide, carbon monoxide and methane and the implications for Global climate change, WMO Bulletin, 44: 1 World Metrological Organization. Geneva.
ODINGO, R. S. (1990): Review of UNEP’s definition of desertification and its programmatic im-plications, In: Odingo R., (Ed.) 1990: Desertification revisited. Proceeding of an Ad-Hoc Consul-tative Meeting on the assessment of Desertification. UNEP-DC (PAC), Nairobi.
OGALLO L. A. (1994): Drought and desertification: ‘an overview’, WMO Bulletin , 43: 1, Geneva.
OKIN, J., MURRA, B., and SCHLESINGER, W. (2001): Degradation of sandy arid shrub land environments: observations, process modeling, and management implications, Journal of Arid Environments. 47: 123-144, Elsevier Amsterdam, http://www.idealibrary.com 23.11.2003.
PAECH, W. (1991): Photograph of sunspots, Institute für Erdmessung, Astronomische Station, Universität Hannover, http://www-gik.bau-verm.uni-karlsruhe.de/~fags/sidc003.htm. 05.01.2004
PALLAS, P. (1980): Water resources of the Socialist People 's Libyan Arab Jamahiriya. In: Salem, M. and Pusrewil, M., (Eds.): The Geology of Libya, Vol. 2, El-Fatih University, Tripoli, Libya.
Attia El-Tantawi: Climate change in Libya and desertification of Jifara Plain
244
PEREZ, E. and THOMPSON, P. (1995): Natural hazards: causes and effects, Disaster Manage-ment Center, University of Wisconsin-Madison, http://dmc.engr.wisc.edu/courses/hazards/ BB02-08.html. 24.11.2004
PESCE, A. (1968): Gemini space photographs of Libya and Tibisti, Angus S. Campbell, Editor, Petroleum Exploration society of Libya, Tripoli.
PIDWIRNY, M. (2004): Fundamentals of physical geography, http://www.physicalgeography.net /fundamentals/contents.html, 11.01.2005
PITTOCK, A. B. (1988): The greenhouse effect and future climatic change. In: Gregory, S. (Ed.), 1988: Recent Climatic Change (A Regional Approach), Belhaven Press: London: 306–315.
QSOUDH, M. (1996): Possibility of using rainfall in Tripoli area, Journal of faculty of education, El-Fateh University, Tripoli, Libya.
REICH, P., NUMBEM, S., ALMARAZ, R., and ESWARAN, H. (2001): Land resource stresses and desertification in Africa. In: Bridges, E. M., Hannam, I. D., Oldeman, L. R., Pening de Vries, F., Scherr, S. J. and Sompatpanit S., (Eds.), 2001: Responses to land degradation process, 2nd In-ternational Conference on Land Degradation and Desertification, Khon Kaen, Thailand, Oxford Press, New Delhi, India.
RITTER, M. (2003): The physical Environment: an introduction to physical geography, http://www.uwsp.edu/geo/faculty /ritter/geog101/textbook/title_page.html, 23.2.2005
ROACH, J. (1997): What is climate change? http://www.safariseeds.com/botanical/climate %20 change´/climatechange.htm 19.04.2003
ROETTER, R. and VAN DE GEIJN, S. C. (1999): Climate change effects on plant growth, crop yield and livestock, Climatic Change 43: 651-681, Kluwer Academic Publishers, Amsterdam, Netherlands.
ROUNSEVELL, M., EVANS, S., and BULLOCK, P. (1999): Climate change and agricultural soils: impacts and adaptation, Climatic Change 43: 683-709, Kluwer Academic Publishers, Am-sterdam, Netherlands.
SADEG, S. and KARAHANOLU, N. (2001): Numerical assessment of seawater intrusion in the Tripoli region, Libya, Environmental Geology. 40, no 9: 1151-1168, Aug. 2001, Springer Verlag.
SALMI, T., MÄÄTTÄ, A., ANTTILA, P., RUOHO-AIROLA, T. and AMNELL, T. (2002): De-tecting trends of annual values of atmospheric pollutants by the Mann-Kendall test and Sen’s slope estimates ‘the Excel temperate application MAKESENS’, publications on air quality, Finish Mete-orological Institute, Helsinki.
SCHÄFER, D. (1996): Uni- und multivariate statistische Untersuchungen zu rezenten Klimaänderungen in Sri Lanka, Ph.D. Thesis, Geography Institute, Mainz University, Germany.
SCHÄFER, D. (2001): Recent climate change in China and possible impacts on Agriculture, Deutscher Tropentag, Bonn, 9-11 October 2001, Conference on International Agricultural Re-search for Development.
SCHLIEPHAKE, K. (2004): Der Große künstliche Fluss in Libyen, in: MEYER, G., (Hrsg.), Die Arabische Welt: im Spiegel der Kulturgeographie, Zentrum für Forschung zur Arabischen Welt, Geographisches Institut der Universität Mainz, Germany: 210-213
SCHÖNWIESE, C. (1992): Praktische Statistik für Meteorologen und Geowissenschaftler, 2. verbesserte Auflage, Gebrüder Borntraeger, Berlin and Stuttgart.
SCOTT, R. C. 2001: Global Climates, HTTP://WWW.MASTERPLOTS.COM/DISPLAY.ASP?ID=342 &COLUMN=SAMPLE_ARTICLE3 12.07.2004
Attia El-Tantawi: Climate change in Libya and desertification of Jifara Plain
245
SEELY, M. (1999): Climate variability: implications for sustainable natural resource management, international conference on integrated drought management in sub-Saharan Africa, 20-22 Septem-ber 1999, Pretoria , South Africa.
SHARMA, K. (1998): The hydrological indicators of desertification. Journal of Arid Environ-ments, 39: 121–132, Academic Press, Elsevier, Amsterdam, London.
SKINNER, B. J. (Ed.), (1981): Climates Past and Present, William Kaufmann, INC. Los Altos, California.
SMITH, S. J. (2003): The evaluation of greenhouse gas Indices--an Editorial Comment, Climatic Change 58: 261–265, Kluwer Academic Publishers, Netherlands.
Soon, W and Yaskell, S. (2003): Year without a summer, Mercury Magazine, 32, no. 3: 13-26 Astronomical Society of the Pacific, http://www.astrosociety.org/pubs/mercury/3203/summer.html
STANHILL, G. (2001): The growth of climate change science: a scientometric study, Climatic Change 48: 515-524, Kluwer Academic Publishers, Amsterdam, Netherlands.
STERN, D. I. and Kaufmann, R. (1998): Annual estimates of global anthropogenic methane emis-sions: 1860-1994. Trends Online: A Compendium of Data on Global Change. Carbon Dioxide Information Analysis Center, Oak Ridge National Laboratory, U.S. Department of Energy, Oak Ridge, Tenn., U.S.A. http://cdiac.ornl.gov/trends/meth/ch4.htm, 19.08.2004
SUN, B., GROISMAN P., BRADLEY, R. and KEIMIG F. T. (2000): Temporal Changes in the Observed Relationship between clouds cover and surface air temperature, Journal of Climate. 13: 4341-4357, American Meteorological Society.
SWEARINGEN W. D. (1992): Drought hazard in Morocco, The Geographical Review, 82, the American Geographical Society. New York.
TAMARA S. LEDLEY, ERIC T. SUNDQUIST, STEPHEN E. SCHWARTZ, DOROTHY K. HALL, JACK D. FELLOWS, and TIMOTHY L. KILLEEN (1999): Climate change and green-house gases. EOS. 80, No. 39, September 28: 453, http://www.agu.org/eos_elec/99148e .html, 25.08.2002.
TARBUSH, S. (1988): the next stage for the man-made river, the Middle East’s Business Weakly, Vol.33 Nr.12: 6-8, March 1988, London.
TECHNICAL CENTRE OF ENVIRONMENTAL PROTECTION (1998): Assesment and protec-tion of pastures, Tripoli, Libya (in Arabic).
TERI (The Energy and Resources Institute) (2004): Climate change. New Delhi, http://edugreen.teri.res.in/explore/climate/causes.htm 15.09.2004
THATCHAM, J. B. (2000): The sensitivity of the Mediterranean environment to degradation caused by land use and climate change, Catena, 40: 1-2, Elsevier, Amsterdam, London.
THE GREAT MAN-MADE RIVER WATER UTILIZATION AUTHORITY, (1996): The great Man-Made River General Authority (second phase), Eljamahireiah Press, Tripoli, Libya.
THE LIBRARY OF CONGRESS, (1987): Country studies, Libya, http://Lcweb2.loc.gov/frd/cs /lytoc.html 15.06.2002
THE WOOD EXPLORER, (2004): Libya , http://www.thewoodexplorer.com/Country%20Data/ Libya/home.php, 20.01.2005.
The World Bank Group, (2001): What is Sustainable Development? http://www.worldbank.org /depweb/english/sd.html, 19.02.2005
THOM, H. (1966): Some methods of climatological analysis , technical note, No.81, WMO, Ge-neva.
Attia El-Tantawi: Climate change in Libya and desertification of Jifara Plain
246
THOMAS, D. and MIDDLETON, N. (1994): Desertification: Exploding the Myth, John Wiley & Sons, New York.
THORNTHWAITE, C. W. (1962): Associates laboratory of climatology, publications in climatol-ogy, Vol. XV, Nr. 2, average climatic water balance data of the continents, part 1, Africa, technical report Nr. 1 national science foundation, Centerton, New Jersey.
THUROW, T., and TAYLOR, C. (1999): Viewpoint: The role of drought in range management, Journal of Range Management, 52: 413-419, Sep. 1999. Society for Range Management, USA, http://saint-denis.library.arizona.edu:4000/cgi-bin/JRMLogon.cgi
TOMOZEIU, R., PAVAN, V. and CACCIAMANI, C. (2002): Changes in extreme minimum and maximum temperature in Emilia -Romagna as derived from observed data during 1960-2000 pe-riod, http://www.cru.uea.ac.uk/cru/projects/stardex/publications/tomozeiu03.pdf#search='trends %20of %20annual%20mean%20extreme%20temperature, 29.04.2005
U.S. GEOLOGICAL SURVEY, (1997): Fact Sheet 113-97: The Cataclysmic 1991 Eruption of Mount Pinatubo, Philippines, http://pubs.usgs.gov/fs/1997/fs113-97/ 19.10.2004
UNEP, (2002): Global Environment Outlook 3: ‘Past, present and future perspectives’, Earthscan Publications Ltd, London, http://www.unep.org/geo/geo3/ 20.03.2003
UNEP, ACSAD and THE ARAB LEAGUE, (1996): State of desertification in Arab world , Cairo.
UNITED NATIONS, (1992): United Nations Framework Convention on Climate Change (WITH ANNEXES 9: New York, on 9 May 1992.
UNITED NATIONS, (1993): Statistical Yearbook, 38 issue, New York.
UNITED NATIONS, (2002): Statistical Yearbook, 46 issue, New York.
USAID (The United States Agency for International Development), (2000): Climate change initia-tive ‘addressing climate change in developing countries and countries with economies in transi-tion’, http://www.usaid.gov/invironment/climate_change_intiative_nov/ 2000.pdf, 27.8.2002
VOOGT, J. (2004): Urban Heat Islands : Hotter Cities, American Institute of Biological Sciences, http://www.actionbioscience.org/environment/voogt.html, 17.04.2005
WELLBURN, A. (1997): Luftverschmutzung und Klimaänderung ‘Auswirkungen auf Flora, Fauna und Mensch’, Springer, Berlin, Germany.
WHITTEN, D. G. A. and BROOKS, J. R. V. (1972): The penguin dic tionary of geology, Penguin Books, Great Britain.
WIKIPEDIA ENCICLOPEDIA, (2005): Intertropical convergence zone, http://en.Wikipedia.org/ wiki/Intertropical_convergence_zone 20.3.2005
WMO (World Meteorological Organization), (1983): Meteorological aspects of certain processes affecting soil degradation- especially erosion, report of the CAgM working group on meteorologi-cal factors associated with certain aspects of soil degradation and erosion, technical note, no. 178, WMO, no. 591. Geneva.
YANG, H. and ZEHNDER, A. J. (2001): Water Scarcity and Food Import: A Case Study for Southern Mediterranean Countries, World Development, Vol.: 30 Issue: 8, August, 2002: 1413-1430, Elsevier Science Ltd., Amserdam, London.
YATES, D. and STRZEPEK, K. (1998): An assessment of integrated climate change impacts on the agricultural economy of Egypt, Climatic Change 38: 261–287, Kluwer Academic Publishers, Amsterdam, Netherlands.