Groundwater Overexploitation in the North China Plain - OAPEN
171
Springer Water Wolfgang Kinzelbach · Haijing Wang · Yu Li · Lu Wang · Ning Li Groundwater Overexploitation in the North China Plain: A Path to Sustainability
-
Upload
khangminh22 -
Category
Documents
-
view
1 -
download
0
Transcript of Groundwater Overexploitation in the North China Plain - OAPEN
Springer Water
Wolfgang Kinzelbach · Haijing Wang · Yu Li · Lu Wang · Ning Li
Groundwater Overexploitation in the North China Plain: A Path to Sustainability
Springer Water
Series Editor
Andrey Kostianoy, P. P. Shirshov Institute of Oceanology, Russian Academy ofSciences, Moscow, Russia
Editorial Board
Angela Carpenter, School of Earth and Environment, University of Leeds, Leeds,West Yorkshire, UK
Tamim Younos, Green Water-Infrastructure Academy, Blacksburg, VA, USA
Andrea Scozzari, CNR Institute of Geosciences and Earth Resources, Pisa, Italy
Stefano Vignudelli, CNR—Istituto di Biofisica, Pisa, Italy
Alexei Kouraev, LEGOS, Université de Toulouse, Toulouse, France

The book series Springer Water comprises a broad portfolio of multi- andinterdisciplinary scientific books, aiming at researchers, students, and everyoneinterested in water-related science. The series includes peer-reviewed monographs,edited volumes, textbooks, and conference proceedings. Its volumes combine allkinds of water-related research areas, such as: the movement, distribution andquality of freshwater; water resources; the quality and pollution of water and itsinfluence on health; the water industry including drinking water, wastewater, anddesalination services and technologies; water history; as well as water managementand the governmental, political, developmental, and ethical aspects of water.
More information about this series at https://link.springer.com/bookseries/13419
Wolfgang Kinzelbach · Haijing Wang · Yu Li ·Lu Wang · Ning Li
GroundwaterOverexploitation in the NorthChina Plain: A Pathto Sustainability
Wolfgang KinzelbachInstitute of Environmental EngineeringETH ZürichZürich, Switzerland
Yu LiInstitute of Environmental EngineeringETH ZürichZürich, Switzerland
Ning LiInstitute of Environmental EngineeringETH ZürichZürich, Switzerland
Haijing WangHydrosolutions Ltd.Zürich, Switzerland
Lu WangInstitute of Environmental EngineeringETH ZürichZürich, Switzerland
ISSN 2364-6934 ISSN 2364-8198 (electronic)Springer WaterISBN 978-981-16-5842-6 ISBN 978-981-16-5843-3 (eBook)https://doi.org/10.1007/978-981-16-5843-3
© The Editor(s) (if applicable) and The Author(s) 2022. This book is an open access publication.OpenAccess This book is licensed under the terms of the Creative Commons Attribution 4.0 InternationalLicense (http://creativecommons.org/licenses/by/4.0/), which permits use, sharing, adaptation, distribu-tion and reproduction in any medium or format, as long as you give appropriate credit to the originalauthor(s) and the source, provide a link to the Creative Commons license and indicate if changes weremade.The images or other third party material in this book are included in the book’s Creative Commons license,unless indicated otherwise in a credit line to the material. If material is not included in the book’s CreativeCommons license and your intended use is not permitted by statutory regulation or exceeds the permitteduse, you will need to obtain permission directly from the copyright holder.The use of general descriptive names, registered names, trademarks, service marks, etc. in this publicationdoes not imply, even in the absence of a specific statement, that such names are exempt from the relevantprotective laws and regulations and therefore free for general use.The publisher, the authors and the editors are safe to assume that the advice and information in this bookare believed to be true and accurate at the date of publication. Neither the publisher nor the authors orthe editors give a warranty, expressed or implied, with respect to the material contained herein or for anyerrors or omissions that may have been made. The publisher remains neutral with regard to jurisdictionalclaims in published maps and institutional affiliations.
This Springer imprint is published by the registered company Springer Nature Singapore Pte Ltd.The registered company address is: 152 Beach Road, #21-01/04 Gateway East, Singapore 189721,Singapore
With contributions by
Yuanyuan Li, Jie Hou, Lili Yu, Fei Chen,Yan Yang (Sects. 2.1.7, 2.2, 2.3, 4.2.1and 5.4)General Institute of Water Resources andHydropower Planning and Design (GIWP),Beijing, China
Haitao Li, Wenpeng Li, Kai Zhao(Sects. 1.3, 4.1, 4.2.1, and 4.3.2)China Institute of Geo-EnvironmentalMonitoring (CIGEM), Beijing, China
Jinxia Wang (Sects. 2.1, 2.2 and 3.2)China Center of Agricultural Policy, PekingUniversity, Beijing, China
Tianhe Sun (Sects. 2.1, 2.2 and 3.2)Hebei University of Economics and Business,Shijiazhuang, China
Yanjun Shen (Sects. 3.1 and 5.3)Centre for Agricultural Resources Research,Chinese Academy of Sciences, Shijiazhuang,China
Jianmei Luo (Sect. 3.1)Hebei GEO University, Shijiazhuang, China

Silvan Ragettli (Sect. 4.2.4 and AppendixA.2), Beatrice Marti (Boxes 4.2 and 4.3,and Appendix A.7)Hydrosolutions Ltd., Zürich Switzerland
Foreword
The agricultural sector increasingly relies on groundwater abstraction for irrigationin many regions of the world. Expansion of irrigated agriculture and groundwateruse has contributed to increased food production and has improved food security.At the same time, the depletion of groundwater resources by excessive pumpinghas become a common challenge in key agricultural production areas across theworld, threatening the sustainability of production. Over-pumping of aquifers causesecological and environmental degradation of vegetation, wetlands, and streams andreduces the ability of aquifers to serve as a buffer for weather extremes induced byclimate change. Unsustainable use of groundwater needs to be urgently addressedthrough sustainable rehabilitation and management strategies, in order to assure theavailability of groundwater, today and for future generations.
Recognizing the groundwater over-exploitation issue in the North China Plain,the Swiss Agency for Development and Cooperation and the Ministry of WaterResources of the People’s Republic of China co-launched the project “Rehabilita-tion and management strategies of over-pumped aquifers in a changing climate” in2014, in partnership with the China Geological Survey. The leading project imple-mentation partner on the Chinese side was the General Institute of Water Resourcesand Hydropower Planning Design (GIWP), while the leading project implementa-tion partner on the Swiss side was the Swiss Federal Institute of Technology (ETH)Zürich.
The overall goal of the project was to test and implement groundwater manage-ment and water saving policies in order to strengthen the capacity for adaptationto climate variability and climate change. Any management strategy must be basedon reliable data. A main element of the project was thus to establish a real-timegroundwater monitoring and control system. This monitoring data, coupled withstate-of-the-art modelling, serves as a basis for the development and implementationof different policy instruments in the fields of water resources and agriculture.
The present book features the impressive results of the second phase of theproject. The project developed, tested, and implemented an array of innovativeapproaches and tools for monitoring and modelling groundwater abstraction, as wellfor supporting sustainable management decisions. To name just a few: For the first
vii
viii Foreword
time in China, groundwater abstraction has been monitored on such a large-scaleusing electricity consumption as proxy indicator. Cutting-edge groundwater models,both real-time and data-driven, were established and a web-based comprehensivedecision support system (DSS) was developed. The DSS entails tools for water quotaplanning, scenario analysis, estimation of actual crop water demand, remote sensingbased automatic mapping of cropped areas, and a data base, all integrated in oneplatform. The project also developed a groundwater game, which mimics the agri-cultural practice in the North China Plain and was used in a serious game approachto assess farmers’ reactions to policy changes.
With all the monitoring, modelling, and decision support in place, SDC willcontinue the dialoguewith sub-national and national governments inChina to supportthe uptake of the findings in existing and new policies for sustainable groundwatermanagement. Many of the findings of the project and all the tools developed underit are also highly relevant for other areas in the world suffering from groundwaterdepletion. We are thus convinced that the findings and tools presented in this bookcan provide inspiration and advice in support of our common goal of managinggroundwater more sustainably across the globe.
Felix FellmannHead of International Cooperation
DivisionSwiss Embassy in the People’s
Republic of ChinaBeijing, China
Acknowledgements
First and foremost, we would like to thank the Swiss Agency for Developmentand Cooperation (SDC) for the courage of taking on a multi-year commitmentin supporting and financing this Sino-Swiss cooperation project “Rehabilitationand Management Strategies of Over-Pumped Aquifers under a Changing Climate”.Without SDC’s firm commitment to support this project, the knowledge we sharein this book would not be there. Special thanks should be given to SDC staff Dr.Liyan Wang, Dr. Manfred Kaufmann, Dr. Felix Fellmann, Dr. Jacqueline Schmid,and Dr. Philip Zahner whose help and support throughout the project have beengreatly appreciated by the project expert team. Dr. Liyan Wang shaped the initialdesign of the project. She was personally involved in the implementation processtogether with the project team and attended all major workshops and numerous fieldvisits. Without her enthusiastic involvement, the project could not have been imple-mented as smoothly as it was. We would also like to thank Dr. Manfred Kaufmannand Dr. Liyan Wang for their valuable comments, which helped us to improve themanuscript and make it more accessible for the general reader.
We owe great gratitude to Mr. Andreas Goetz, the deputy director general of theFederal Office of Environment in Switzerland at the time, who grasped the impor-tance of sustainable management of over-pumped aquifers through innovative tech-nology. Mr. Goetz communicated between the Ministry of Water Resources and theSwiss Agency for Development and Cooperation to initiate a dialogue on the project.Without his strong support and help, this project would not have come into existence.
We would like to thank Ms. Nongdi Wu and her colleagues from the Ministryof Water Resources in China, who persuaded the Swiss expert team to pay specialattention to the groundwater management problem of the North China Plain, whichbecame the main focus of the project. Special thanks should be given to Ms. Jing Xuand Mr. Ge Li who actively supported us in their role as members of the projectsteering committee. We acknowledge all the local partners in the Departmentsof Water Resources in Hebei Province, Handan Prefecture, and Guantao County.Without their diligent work in implementing project ideas and their great support,our field activities, includingmore than 300 pumping tests, an aquifer recharge exper-iment and more than 20 field visits for stakeholder consultation, trouble shooting,
ix
x Acknowledgements
game tests and surveys, could not have been accomplished. We owe great gratitudeto Dr. Junfang Gu and Mr. Hongliang Liu, whose support from the beginning hashelped us to choose Guantao County as the pilot site. They and their colleagues, Mr.Xiantong Yan and Ms. Xinmei Chen, accompanied the expert team during almostevery field visit to Guantao.
Special gratitude is due to the local implementation team in Guantao County.Mr. Huaixian Yao has been our most valuable local expert, whose local knowledgeand great experience in dealing with local problems have been a highlight for ourteam. Mr. Huaitao Wu, Mr. Guangchao Li, Mr. Dongchao Yang, Mr. Depeng Fan,and Mr. Fei Gao all contributed to the tailor-made decision support system in theproject with their knowledge and experience. We would also like to acknowledgeMr. Fei Li from the State Grid Hebei Electric Power Co. Ltd., staff from GuantaoElectric Power Supply Company, and the village electricians of Shoushansi ElectricPower Supply Agency, who were willing to share their knowledge regarding bothelectricity metering and farmers’ pumping habits. We also owe our gratitude toGuantao Department of Agriculture and Rural Affairs for sharing information oncrop planting area and local irrigation practice.
We would like to acknowledge the extraordinary support provided by the ChinaGeological Survey (CGS) by conducting a detailed hydrogeological survey ofGuantao and surroundings, by drilling new groundwater observation boreholes, bothalong the border of Guantao County and inside, and by delivering observation datamonthly on time and without fail according to the project needs. The groundwaterlevel observation points on the border of Guantao made the innovative groundwatermodelling of an administrative unit as well as the separation of inside and outsidecontributions to drawdown possible. Special thanks should go to Mr. Yuan Zhangfrom China Institute of Geo-Environment Monitoring (CIGEM) for his reliable anddiligent work of sending monthly groundwater data until the end of the project.
Special thanks should be given to Prof. Shuqian Wang, whose knowledge andexperience, accumulated in his work in water resources management of the regionover the past decades, have been enlightening to the project team. Professor Wanggenerously allowed his students at Hebei University of Engineering to participateand help in the pumping tests, game tests, and game survey. His valuable input hasbeen a treasure for our work in Guantao and Handan.
Wewould like to acknowledge the game designers from Zürich University of Arts(ZHdK), Mr. Réne Bauer and Mr. Livio Lunin, who co-designed and implementedboth board game and online game “SavetheWater”, which provided an excellenttool to test farmers’ feedback to policies. We would also like to thank our colleaguesProf. PanHe (Southwest University of Finance and Economics, Chengdu),Mr. JakobSteiner (fromhydrosolutions Ltd.),Mr.Dominik Jäger (Geoprävent Ltd.),Mr.GianniPedrazzini (ETH Zürich), Mr. Alexandre Mérrilat (ETH Zürich), and Mr. AndreasHagmann (ETH Zürich), who have been involved in our earlier field activities, andwhose work has become an integral part of this project. We further acknowledgethe assistance in climate change projections for Guantao by Dr. Nadav Peleg (ETHZürich).

Acknowledgements xi
We owe our deepest gratitude to Prof. Paolo Burlando, who has taken the financialresponsibility and co-lead role for the project within ETH.Without his generous help,the project could not have been continued after the opening phase.
Finally, we would like to thank the farmers in Guantao, who participated in ourconsultationmeetings, game tests, and surveys andwatchedwith interest the pumpingtests, metre installation, and drone flights for remote sensing validation. They havealways been willing to share their views in terms of crop planting and groundwateruse. They and the farmers in North China Plain in general should be given credit forfulfilling the task of feeding a huge population under severe resource constraints. Weacknowledge their willingness to save water and thank them for cooperating with usduring the project.
Contents
1 Introduction . . . . . . . . . . . . . . . . . . . . . . . . . . . . . . . . . . . . . . . . . . . . . . . . . . . 11.1 Groundwater Over-Pumping and Consequences . . . . . . . . . . . . . . . . . 11.2 What Does Sustainable Groundwater Use Mean? . . . . . . . . . . . . . . . 61.3 Role of Irrigation in Over-Pumping in NCP . . . . . . . . . . . . . . . . . . . . 81.4 Requirements for Sustainability in NCP and Guantao
as an Example . . . . . . . . . . . . . . . . . . . . . . . . . . . . . . . . . . . . . . . . . . . . . 17References . . . . . . . . . . . . . . . . . . . . . . . . . . . . . . . . . . . . . . . . . . . . . . . . . . . . . 20
2 Policy Options of Over-Pumping Control in the NCP . . . . . . . . . . . . . . 252.1 China’s Groundwater Policies in Recent years . . . . . . . . . . . . . . . . . . 26
2.1.1 Permit Policy for Well Drilling . . . . . . . . . . . . . . . . . . . . . . . . . 262.1.2 Well-Spacing Policy . . . . . . . . . . . . . . . . . . . . . . . . . . . . . . . . . . 262.1.3 Quota Management . . . . . . . . . . . . . . . . . . . . . . . . . . . . . . . . . . 272.1.4 Water Resources Fee and Tax . . . . . . . . . . . . . . . . . . . . . . . . . . 272.1.5 Irrigation Water Price Policy . . . . . . . . . . . . . . . . . . . . . . . . . . . 282.1.6 Water Rights System and Water Markets . . . . . . . . . . . . . . . . 292.1.7 National Policy Focus: NCP’s Groundwater
Over-Pumping . . . . . . . . . . . . . . . . . . . . . . . . . . . . . . . . . . . . . . . 302.2 Groundwater Over-Pumping Control Measures in Hebei
Province . . . . . . . . . . . . . . . . . . . . . . . . . . . . . . . . . . . . . . . . . . . . . . . . . . 322.2.1 Seasonal Land Fallowing . . . . . . . . . . . . . . . . . . . . . . . . . . . . . . 322.2.2 Substitution of Non-food Crops for Grain Crops . . . . . . . . . . 332.2.3 Replacing Groundwater by Surface Water . . . . . . . . . . . . . . . 342.2.4 Buy-Back of Water Rights . . . . . . . . . . . . . . . . . . . . . . . . . . . . . 362.2.5 “Increase Price and Provide Subsidy” . . . . . . . . . . . . . . . . . . . 372.2.6 Tiered Scheme of Water Fees . . . . . . . . . . . . . . . . . . . . . . . . . . 382.2.7 Import of Surface Water Versus Water Saving
and Change of Cropping Structure . . . . . . . . . . . . . . . . . . . . . . 412.3 Governance Structure in the Water Sector . . . . . . . . . . . . . . . . . . . . . . 46
2.3.1 Governmental Stakeholders in Water Sector . . . . . . . . . . . . . . 46
xiii
xiv Contents
2.3.2 Stakeholders in the Electricity Sector Relatedto Irrigation . . . . . . . . . . . . . . . . . . . . . . . . . . . . . . . . . . . . . . . . . 47
2.3.3 Stakeholders in the Water Sector of Guantao County . . . . . . 48References . . . . . . . . . . . . . . . . . . . . . . . . . . . . . . . . . . . . . . . . . . . . . . . . . . . . . 49
3 Cropping Choices and Farmers’ Options . . . . . . . . . . . . . . . . . . . . . . . . . 533.1 Options of Optimizing Crop Structure
in Hebei-Beijing-Tianjin Region . . . . . . . . . . . . . . . . . . . . . . . . . . . . . . 543.1.1 Introduction . . . . . . . . . . . . . . . . . . . . . . . . . . . . . . . . . . . . . . . . . 543.1.2 Optimization Scenarios . . . . . . . . . . . . . . . . . . . . . . . . . . . . . . . 563.1.3 Scenario Analysis of Planting Structure Optimization . . . . . 573.1.4 Conclusion and Discussion . . . . . . . . . . . . . . . . . . . . . . . . . . . . 58
3.2 Farmers’ Feedback in a Household Survey on Seasonal LandFallowing . . . . . . . . . . . . . . . . . . . . . . . . . . . . . . . . . . . . . . . . . . . . . . . . . 593.2.1 Effects of Seasonal Land Fallowing . . . . . . . . . . . . . . . . . . . . . 613.2.2 Challenges of Implementing SLFP . . . . . . . . . . . . . . . . . . . . . 62
3.3 Farmers’ Reaction to PolicyAssessed Through aGroundwaterGame . . . . . . . . . . . . . . . . . . . . . . . . . . . . . . . . . . . . . . . . . . . . . . . . . . . . . 653.3.1 Introduction . . . . . . . . . . . . . . . . . . . . . . . . . . . . . . . . . . . . . . . . . 653.3.2 Data and Materials . . . . . . . . . . . . . . . . . . . . . . . . . . . . . . . . . . . 673.3.3 Results . . . . . . . . . . . . . . . . . . . . . . . . . . . . . . . . . . . . . . . . . . . . . 693.3.4 Discussion and Conclusions . . . . . . . . . . . . . . . . . . . . . . . . . . . 72
References . . . . . . . . . . . . . . . . . . . . . . . . . . . . . . . . . . . . . . . . . . . . . . . . . . . . . 73
4 Decision Support for Local Water Authorities in Guantao . . . . . . . . . . 774.1 Hydrogeological Basis: Shallow Versus Deep Groundwater . . . . . . . 78
4.1.1 Borehole Locations . . . . . . . . . . . . . . . . . . . . . . . . . . . . . . . . . . . 784.1.2 Borehole Logs and Pumping Tests . . . . . . . . . . . . . . . . . . . . . . 794.1.3 The Distribution of Total Dissolved Solids (TDS) . . . . . . . . . 80
4.2 Monitoring Options . . . . . . . . . . . . . . . . . . . . . . . . . . . . . . . . . . . . . . . . . 804.2.1 Groundwater Level Monitoring (Contributed
by CIGEM and GIWP) . . . . . . . . . . . . . . . . . . . . . . . . . . . . . . . 814.2.2 Groundwater Pumping Monitoring . . . . . . . . . . . . . . . . . . . . . 874.2.3 Pumping Electricity Monitoring . . . . . . . . . . . . . . . . . . . . . . . . 944.2.4 Land Use Monitoring . . . . . . . . . . . . . . . . . . . . . . . . . . . . . . . . . 101
4.3 Modeling for Decision Support . . . . . . . . . . . . . . . . . . . . . . . . . . . . . . . 1024.3.1 Box Model . . . . . . . . . . . . . . . . . . . . . . . . . . . . . . . . . . . . . . . . . . 1034.3.2 Distributed Groundwater Model for Guantao . . . . . . . . . . . . . 1104.3.3 Real-Time Groundwater Model . . . . . . . . . . . . . . . . . . . . . . . . 1154.3.4 Data Driven Groundwater Model . . . . . . . . . . . . . . . . . . . . . . . 118
4.4 An Integrated Decision Support System (DSS) . . . . . . . . . . . . . . . . . . 1224.4.1 Motivation . . . . . . . . . . . . . . . . . . . . . . . . . . . . . . . . . . . . . . . . . . 1224.4.2 Key components . . . . . . . . . . . . . . . . . . . . . . . . . . . . . . . . . . . . . 1244.4.3 Architecture of the GTDSS . . . . . . . . . . . . . . . . . . . . . . . . . . . . 132
References . . . . . . . . . . . . . . . . . . . . . . . . . . . . . . . . . . . . . . . . . . . . . . . . . . . . . 134

Contents xv
5 Way Forward . . . . . . . . . . . . . . . . . . . . . . . . . . . . . . . . . . . . . . . . . . . . . . . . . . 1375.1 Recommendations for Guantao . . . . . . . . . . . . . . . . . . . . . . . . . . . . . . . 1375.2 Agriculture and Future Groundwater Management in the NCP . . . . 140
5.2.1 Transition from Smallholder Agriculture to LargerFarms . . . . . . . . . . . . . . . . . . . . . . . . . . . . . . . . . . . . . . . . . . . . . . 140
5.2.2 Consumer Behavior and Food Demand . . . . . . . . . . . . . . . . . . 1425.3 Drought Resistant and High Yield Wheat Varieties . . . . . . . . . . . . . . 1445.4 Importing Surface Water: Benefit and Risk . . . . . . . . . . . . . . . . . . . . . 1465.5 Climate Change in the NCP . . . . . . . . . . . . . . . . . . . . . . . . . . . . . . . . . . 147References . . . . . . . . . . . . . . . . . . . . . . . . . . . . . . . . . . . . . . . . . . . . . . . . . . . . . 151
Final Remarks . . . . . . . . . . . . . . . . . . . . . . . . . . . . . . . . . . . . . . . . . . . . . . . . . . . . 155
Appendices: Technical Guides and Manuals of Tools . . . . . . . . . . . . . . . . . . 157
Abbreviations and Units
Abbreviations
ADB Asian Development BankBTH Beijing-Tianjin-Hebei regionCART Classification and Regression Tree AlgorithmCAS Chinese Academy of ScienceCCAP China Centre of Agricultural Policy, Beijing UniversityCGS China Geological SurveyCIGEM China Institute of Geo-Environmental Monitoring, BeijingCMIP Coupled Model Intercomparison ProjectCMIP5 5th phase of Coupled Model Intercomparison ProjectCNCG China National Administration of Coal GeologyCNY Chinese YuanCORDEX Coordinated Regional Climate Downscaling ExperimentDSS Decision Support SystemDWR Department of Water ResourcesEnKF Ensemble Kalman Filter MethodEPSA Electric Power Supply AgencyEPSC Electric Power Supply CompanyET EvapotranspirationETH Swiss Federal Institute of Technology, Zürich.GCM Global Circulation ModelGEF Global Environmental FacilityGHG Greenhouse GasGIWP General Institute of Water Resources and Hydropower Planning and
Design, BeijingGRACE FO Gravity Recovery and Climate Experiment Follow-UpGRACE Gravity Recovery and Climate ExperimentGTDSS Guantao Decision Support SystemGUI Graphical User Interface
xvii
xviii Abbreviations and Units
ICT Information and Communication TechnologyID Irrigation districtIPCC Intergovernmental Panel on Climate ChangeIWHR China Institute of Water Resources and Hydropower Research,
BeijingMAR Managed Aquifer RechargeMEA Millennium Ecosystem AssessmentMNR Ministry of Natural Resources, People’s Republic of ChinaMWR Ministry of Water Resources, People’s Republic of ChinaNASA United States National Aeronautics and Space AdministrationNCP North China PlainNILM Non-intrusive Load MonitoringRCM Regional Circulation ModelRCP Representative Concentration PathwaySDC Swiss Agency for Development and CooperationSJZIAM Centre for Agricultural Resources Research, Shijiazhuang, Chinese
Academy of SciencesSLF Seasonal Land FallowingSLFP Seasonal Land Fallowing ProgramSNWT South-North Water TransferStW “Save the Water” GameSYB Statistical YearbookTDS Total Dissolved SolidsUI User InterfaceUSGS United States Geological SurveyWUA Water User AssociationWUE Water Use Efficiency
Units
a Yearmu Chinese Measure of Land Area, 1 mu = 1/15 haCNY Chinese Currency (Yuan Renminbi), 1 CNY ≈ 0.14 Swiss Franksd Dayyr Yearha HectareMio. MillionBio. Billiont Ton°C Degree Centigrade
Chapter 1Introduction
The depletion of aquifers by excessive pumping is one of the prominent globalsustainability issues in the field of water resources. It is mainly caused by thewater needs of irrigated agriculture. The North China Plain is a global hotspot ofgroundwater overexploitation. Since the 1980s, groundwater levels dropped by about1 m/year mainly due to the intensification of agricultural production by a doublecropping system of winter wheat and summer maize. The consequences of declininggroundwater levels include the drying up of streams and wetlands, soil subsidence,seawater intrusion at the coast and rising cost of pumping. The depletion of storagemakes the production systemmore vulnerable with respect to climatic extremes asso-ciated with climate change. Sustainable management of aquifers keeps groundwaterlevels between an upper and a lower red line. While the upper red line is designedto prevent soli salinization, the lower red line is motivated by ecological require-ments, water quality constraints or infrastructural concerns. Global water balancesare useful in identifying the scope of the problem and the size of efforts required torestore a sustainable pumping regime. Adequate local action needs a local analysis.Guantao County is selected for such a local analysis in the North China Plain.
1.1 Groundwater Over-Pumping and Consequences
Aquifer depletion caused by excessive pumping has been described in the literatureover the last two decades (Foster and Chilton 2003; Kinzelbach et al. 2003; Konikowand Kendy 2005), with the Ogallala aquifer in the United States’ Midwest beingthe first and iconic case of a large, significantly depleted aquifer (Wines 2013). TheMillennium Ecosystem Assessment Report (MEA 2005) identifies more hotspots ofaquifer depletion due to agricultural irrigation, including California, Spain, Pakistan,India, and the main case of interest here, the North China Plain (NCP) (Fig. 1.1). Inall these cases, aquifer depletion shows through constantly declining groundwater
© The Author(s) 2022W. Kinzelbach et al., Groundwater Overexploitation in the North China Plain:A path to Sustainability, Springer Water,https://doi.org/10.1007/978-981-16-5843-3_1
1
2 1 Introduction
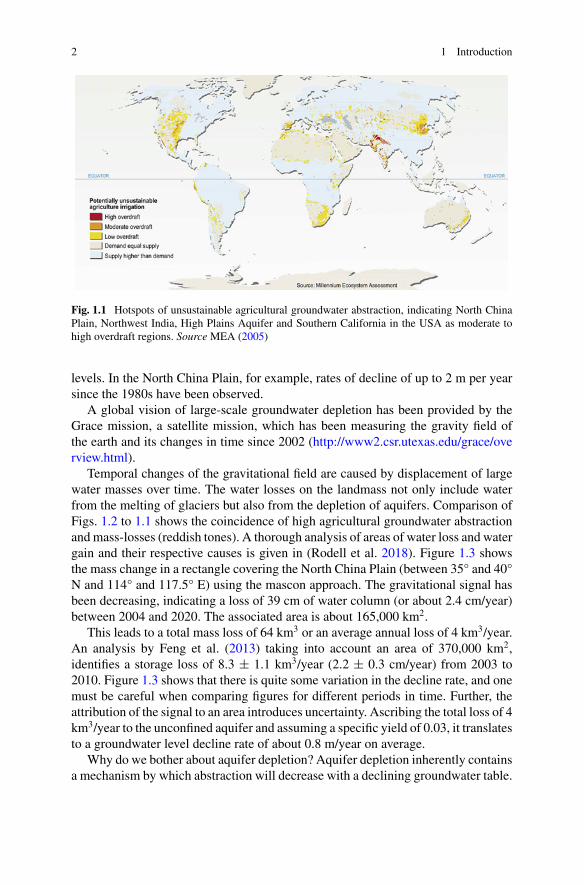
Fig. 1.1 Hotspots of unsustainable agricultural groundwater abstraction, indicating North ChinaPlain, Northwest India, High Plains Aquifer and Southern California in the USA as moderate tohigh overdraft regions. Source MEA (2005)
levels. In the North China Plain, for example, rates of decline of up to 2 m per yearsince the 1980s have been observed.
A global vision of large-scale groundwater depletion has been provided by theGrace mission, a satellite mission, which has been measuring the gravity field ofthe earth and its changes in time since 2002 (http://www2.csr.utexas.edu/grace/overview.html).
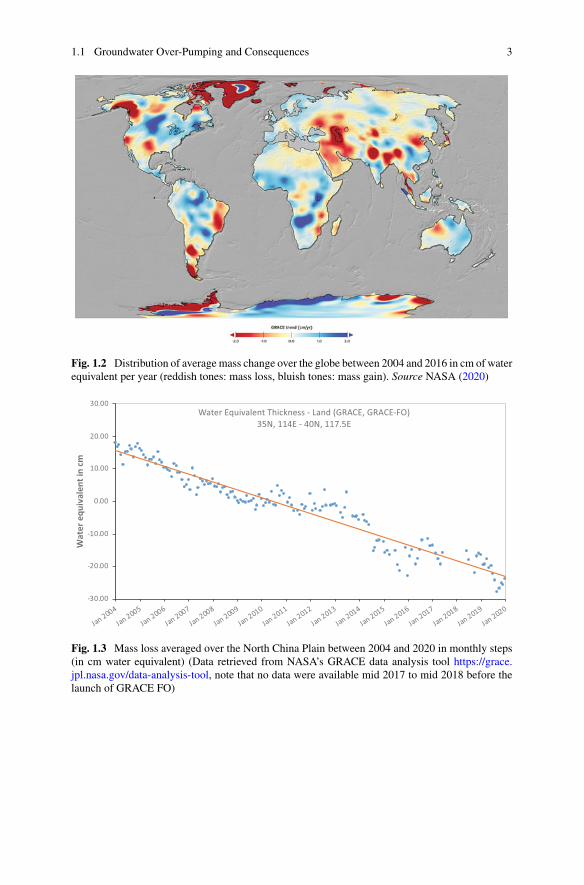
Temporal changes of the gravitational field are caused by displacement of largewater masses over time. The water losses on the landmass not only include waterfrom the melting of glaciers but also from the depletion of aquifers. Comparison ofFigs. 1.2 to 1.1 shows the coincidence of high agricultural groundwater abstractionandmass-losses (reddish tones). A thorough analysis of areas of water loss and watergain and their respective causes is given in (Rodell et al. 2018). Figure 1.3 showsthe mass change in a rectangle covering the North China Plain (between 35° and 40°N and 114° and 117.5° E) using the mascon approach. The gravitational signal hasbeen decreasing, indicating a loss of 39 cm of water column (or about 2.4 cm/year)between 2004 and 2020. The associated area is about 165,000 km2.
This leads to a total mass loss of 64 km3 or an average annual loss of 4 km3/year.An analysis by Feng et al. (2013) taking into account an area of 370,000 km2,identifies a storage loss of 8.3 ± 1.1 km3/year (2.2 ± 0.3 cm/year) from 2003 to2010. Figure 1.3 shows that there is quite some variation in the decline rate, and onemust be careful when comparing figures for different periods in time. Further, theattribution of the signal to an area introduces uncertainty. Ascribing the total loss of 4km3/year to the unconfined aquifer and assuming a specific yield of 0.03, it translatesto a groundwater level decline rate of about 0.8 m/year on average.
Why do we bother about aquifer depletion? Aquifer depletion inherently containsa mechanism by which abstraction will decrease with a declining groundwater table.
1.1 Groundwater Over-Pumping and Consequences 3
Fig. 1.2 Distribution of average mass change over the globe between 2004 and 2016 in cm of waterequivalent per year (reddish tones: mass loss, bluish tones: mass gain). Source NASA (2020)
-30.00
-20.00
-10.00
0.00
10.00
20.00
30.00
Jan 2004
Jan 2005
Jan 2006
Jan 2007
Jan 2008
Jan 2009
Jan 2010
Jan 2011
Jan 2012
Jan 2013
Jan 2014
Jan 2015
Jan 2016
Jan 2017
Jan 2018
Jan 2019
Jan 2020
Wat
er e
quiv
alen
t in
cm
Water Equivalent Thickness - Land (GRACE, GRACE-FO)35N, 114E - 40N, 117.5E
Fig. 1.3 Mass loss averaged over the North China Plain between 2004 and 2020 in monthly steps(in cm water equivalent) (Data retrieved from NASA’s GRACE data analysis tool https://grace.jpl.nasa.gov/data-analysis-tool, note that no data were available mid 2017 to mid 2018 before thelaunch of GRACE FO)
4 1 Introduction
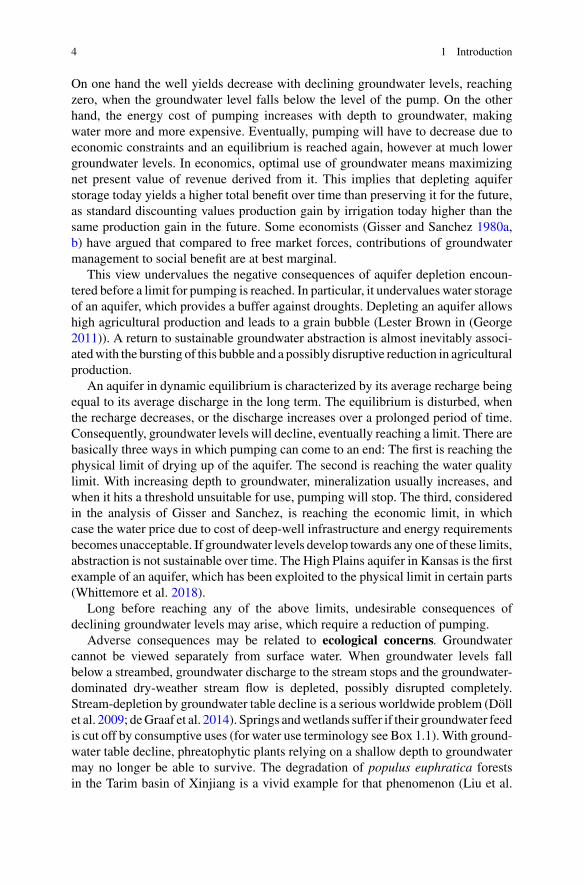
On one hand the well yields decrease with declining groundwater levels, reachingzero, when the groundwater level falls below the level of the pump. On the otherhand, the energy cost of pumping increases with depth to groundwater, makingwater more and more expensive. Eventually, pumping will have to decrease due toeconomic constraints and an equilibrium is reached again, however at much lowergroundwater levels. In economics, optimal use of groundwater means maximizingnet present value of revenue derived from it. This implies that depleting aquiferstorage today yields a higher total benefit over time than preserving it for the future,as standard discounting values production gain by irrigation today higher than thesame production gain in the future. Some economists (Gisser and Sanchez 1980a,b) have argued that compared to free market forces, contributions of groundwatermanagement to social benefit are at best marginal.
This view undervalues the negative consequences of aquifer depletion encoun-tered before a limit for pumping is reached. In particular, it undervalues water storageof an aquifer, which provides a buffer against droughts. Depleting an aquifer allowshigh agricultural production and leads to a grain bubble (Lester Brown in (George2011)). A return to sustainable groundwater abstraction is almost inevitably associ-atedwith the bursting of this bubble and a possibly disruptive reduction in agriculturalproduction.
An aquifer in dynamic equilibrium is characterized by its average recharge beingequal to its average discharge in the long term. The equilibrium is disturbed, whenthe recharge decreases, or the discharge increases over a prolonged period of time.Consequently, groundwater levels will decline, eventually reaching a limit. There arebasically three ways in which pumping can come to an end: The first is reaching thephysical limit of drying up of the aquifer. The second is reaching the water qualitylimit. With increasing depth to groundwater, mineralization usually increases, andwhen it hits a threshold unsuitable for use, pumping will stop. The third, consideredin the analysis of Gisser and Sanchez, is reaching the economic limit, in whichcase the water price due to cost of deep-well infrastructure and energy requirementsbecomes unacceptable. If groundwater levels develop towards any one of these limits,abstraction is not sustainable over time. The High Plains aquifer in Kansas is the firstexample of an aquifer, which has been exploited to the physical limit in certain parts(Whittemore et al. 2018).
Long before reaching any of the above limits, undesirable consequences ofdeclining groundwater levels may arise, which require a reduction of pumping.
Adverse consequences may be related to ecological concerns. Groundwatercannot be viewed separately from surface water. When groundwater levels fallbelow a streambed, groundwater discharge to the stream stops and the groundwater-dominated dry-weather stream flow is depleted, possibly disrupted completely.Stream-depletion by groundwater table decline is a serious worldwide problem (Döllet al. 2009; deGraaf et al. 2014). Springs andwetlands suffer if their groundwater feedis cut off by consumptive uses (for water use terminology see Box 1.1).With ground-water table decline, phreatophytic plants relying on a shallow depth to groundwatermay no longer be able to survive. The degradation of populus euphratica forestsin the Tarim basin of Xinjiang is a vivid example for that phenomenon (Liu et al.
1.1 Groundwater Over-Pumping and Consequences 5
2005). Generally, shallow groundwater affects terrestrial ecosystems by sustainingriver base-flow and root-zone soil water in the absence of rain. 22 to 32% of globalland area is of this type (Fan et al. 2013). Its decline over time is a cause for concern.
Adverse consequences may also be related to infrastructural safety and waterquality. A common phenomenon of declining groundwater tables is soil subsidence,which is prominent if soft aquifer layers are depressurized by pumping (Herrera-García et al. 2021). In Cangzhou (a city in Hebei province, NCP, China) for example,the soil subsidence has led to a sinking of the topography by 2.5 m. All over HebeiProvince, soil fissures often several kilometers long have appeared (Gong et al.2018). The most prominent example of soil subsidence due to groundwater pumpingis Mexico City, where the settling has caused immense damage to infrastructure(Ortega-Guerrero et al. 1999). At the coast, groundwater level decline may lead toseawater intrusion as it is seen for example in California (Franklin et al. 2017), andthe east coasts of India and China. In Hebei Province, the saline waterfront hasadvanced inland by up to 50 km due to groundwater level decline (CIGEM 2019)with the subsequent pollution of wells located within that zone.
Last but not least, adverse consequences may be related to loss of resilience.Storage volumes of aquifers are often large compared to surface water reservoirsand therefore able to buffer multi-year droughts. Depletion of an aquifer decreasesits storage and thus its ability to buffer the stochastic nature of precipitation andsurface water availability. Loss of storage makes a groundwater supply system—e.g. an irrigation system—less reliable. Maintaining storage by allowing recharge inyears of good rains is considered an adaptation measure to extremes associated withclimate change.
A disequilibrium between recharge and discharge can be caused by decreasingrecharge (e.g. due to climate change), increasing discharge (due to increasedpumping) or both at the same time. Typically, a climatic change with decreasingprecipitation will both decrease recharge by rainfall and increase water demand forirrigation and thus discharge by pumping. Note that not every groundwater tabledecline indicates over-pumping. The aquifer could just be on the way from one equi-librium to another one, trading off discharge to streams or by phreatic evaporationagainst discharge by pumping. We generally speak of over-pumping, when in thelong term—typically decades—discharge by pumping exceeds recharge.
Estimates of global unsustainable groundwater depletion vary from about 115km3/year (Döll et al. 2014) to 283 km3/year (Wada et al. 2010) and 362 km3/year(Pokhrel et al. 2012), with the respective authors’ estimates of total global abstrac-tions being anywhere between 600 and 1000 km3/year. These figures are of interestto scientists who estimate for example the contribution of groundwater depletionto sea level rise or the impact of decreasing groundwater availability on the globalproduction of agricultural goods. They are less relevant for water managers caringabout a single aquifer, since groundwater is essentially a local resource, which mustbe managed locally.
6 1 Introduction
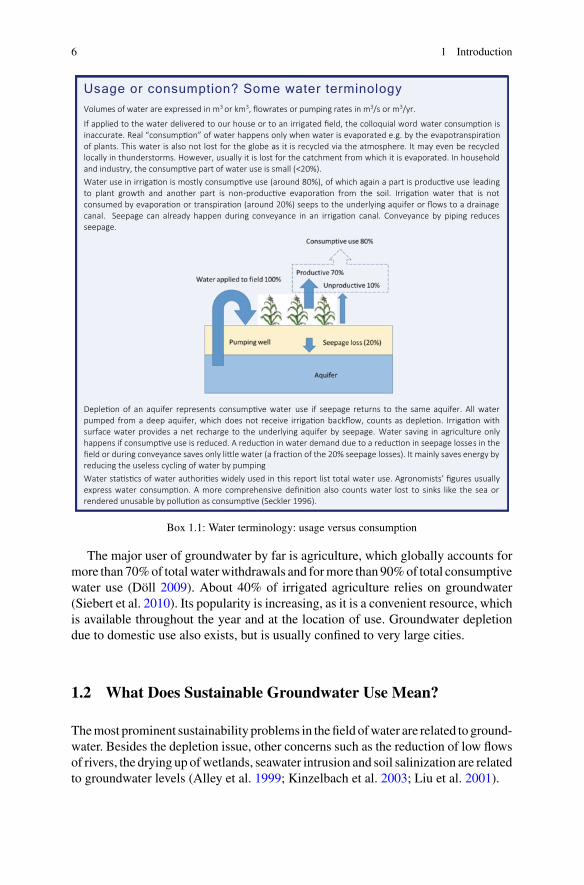
Usage or consumption? Some water terminologyVolumes of water are expressed in m3 or km3, flowrates or pumping rates in m3/s or m3/yr.
If applied to the water delivered to our house or to an irrigated field, the colloquial word water consumption is inaccurate. Real “consump on” of water happens only when water is evaporated e.g. by the evapotranspirationof plants. This water is also not lost for the globe as it is recycled via the atmosphere. It may even be recycled locally in thunderstorms. However, usually it is lost for the catchment from which it is evaporated. In household and industry, the consump ve part of water use is small (<20%). Water use in irriga on is mostly consump ve use (around 80%), of which again a part is produc ve use leading to plant growth and another part is non-produc ve evapora on from the soil. Irriga on water that is not consumed by evapora on or transpira on (around 20%) seeps to the underlying aquifer or flows to a drainage canal. Seepage can already happen during conveyance in an irriga on canal. Conveyance by piping reduces seepage.
Deple on of an aquifer represents consump ve water use if seepage returns to the same aquifer. All water pumped from a deep aquifer, which does not receive irriga on backflow, counts as deple on. Irriga on with surface water provides a net recharge to the underlying aquifer by seepage. Water saving in agriculture only happens if consump ve use is reduced. A reduc on in water demand due to a reduc on in seepage losses in the field or during conveyance saves only li le water (a frac on of the 20% seepage losses). It mainly saves energy by reducing the useless cycling of water by pumpingWater sta s cs of water authori es widely used in this report list total water use. Agronomists’ figures usually express water consump on. A more comprehensive defini on also counts water lost to sinks like the sea or rendered unusable by pollu on as consump ve (Seckler 1996).
Box 1.1: Water terminology: usage versus consumption
The major user of groundwater by far is agriculture, which globally accounts formore than 70%of totalwaterwithdrawals and formore than 90%of total consumptivewater use (Döll 2009). About 40% of irrigated agriculture relies on groundwater(Siebert et al. 2010). Its popularity is increasing, as it is a convenient resource, whichis available throughout the year and at the location of use. Groundwater depletiondue to domestic use also exists, but is usually confined to very large cities.
1.2 What Does Sustainable Groundwater Use Mean?
Themost prominent sustainability problems in thefield ofwater are related to ground-water. Besides the depletion issue, other concerns such as the reduction of low flowsof rivers, the drying up ofwetlands, seawater intrusion and soil salinization are relatedto groundwater levels (Alley et al. 1999; Kinzelbach et al. 2003; Liu et al. 2001).
1.2 What Does Sustainable Groundwater Use Mean? 7
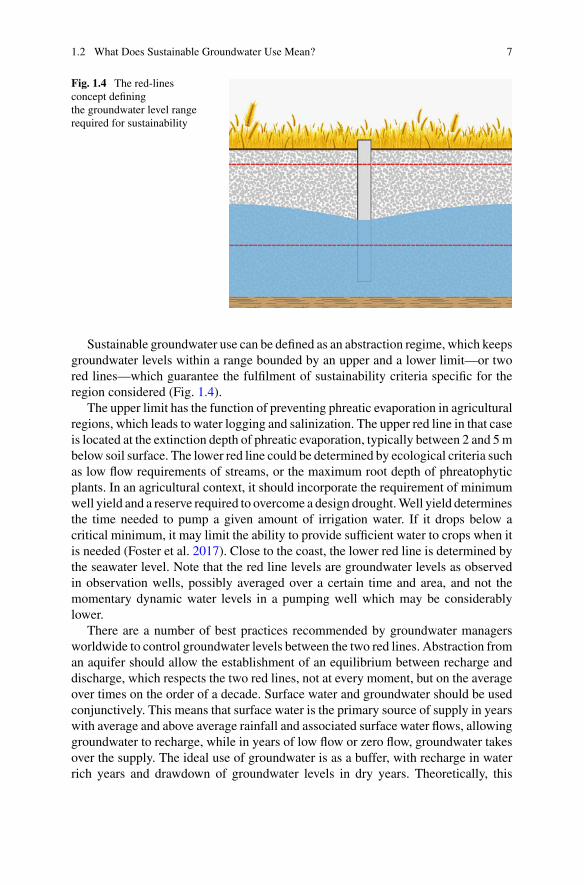
Fig. 1.4 The red-linesconcept definingthe groundwater level rangerequired for sustainability
Sustainable groundwater use can be defined as an abstraction regime, which keepsgroundwater levels within a range bounded by an upper and a lower limit—or twored lines—which guarantee the fulfilment of sustainability criteria specific for theregion considered (Fig. 1.4).
The upper limit has the function of preventing phreatic evaporation in agriculturalregions, which leads to water logging and salinization. The upper red line in that caseis located at the extinction depth of phreatic evaporation, typically between 2 and 5mbelow soil surface. The lower red line could be determined by ecological criteria suchas low flow requirements of streams, or the maximum root depth of phreatophyticplants. In an agricultural context, it should incorporate the requirement of minimumwell yield and a reserve required to overcome a design drought.Well yield determinesthe time needed to pump a given amount of irrigation water. If it drops below acritical minimum, it may limit the ability to provide sufficient water to crops when itis needed (Foster et al. 2017). Close to the coast, the lower red line is determined bythe seawater level. Note that the red line levels are groundwater levels as observedin observation wells, possibly averaged over a certain time and area, and not themomentary dynamic water levels in a pumping well which may be considerablylower.
There are a number of best practices recommended by groundwater managersworldwide to control groundwater levels between the two red lines. Abstraction froman aquifer should allow the establishment of an equilibrium between recharge anddischarge, which respects the two red lines, not at every moment, but on the averageover times on the order of a decade. Surface water and groundwater should be usedconjunctively. This means that surface water is the primary source of supply in yearswith average and above average rainfall and associated surface water flows, allowinggroundwater to recharge, while in years of low flow or zero flow, groundwater takesover the supply. The ideal use of groundwater is as a buffer, with recharge in waterrich years and drawdown of groundwater levels in dry years. Theoretically, this
8 1 Introduction
means that it is sufficient to design the maximum abstraction to stay below averagerecharge. However, in times of climate change, averages change, and managementmust be adaptive, correcting the average e.g. by considering moving averages or byactively controlling the groundwater level based on the red-line concept.
Real sustainability of agriculture irrigated with groundwater is achieved whenwater resources availability and agricultural production are in balance. Both anincrease in supply and a decrease in demand can contribute to the restoration ofan equilibrium between recharge and discharge in an over-pumped aquifer. Thismeans that in the efforts to reach aquifer sustainability, an adaptation of the croppingsystem and a reduction of agricultural production should be taken as seriously asthe search for new resources. In water scarce areas of today demand management ofwater resources increasingly replaces supply management.
An engineering measure of control is managed aquifer recharge (MAR), whichuses excess water, e.g. surface water available outside of the irrigation season, forinfiltration into the aquifer via ponds, canals, or wells. This water can then be pumpedagain at times of need. MAR is a promising adaptation measure to reduce vulner-ability to climate change and hydrological variability. It can play a certain role inthe restoration of the groundwater balance of aquifers. It can also be used to controlsaltwater intrusion or land subsidence. Finally, it can contribute to sustaining ground-water dependent ecosystems. The extreme form of MAR is water banking, wherewater is bought cheaply in times of excess, infiltrated into an aquifer, and pumpedand sold in times of scarcity at the high water price associated with it. Several suchschemes are working beneficially in the US and Australia. One of the first successfulexamples is the Arvin Edison groundwater bank in California (Scanlon et al. 2012).
Nevertheless, MAR is not a panacea. It is notoriously inefficient and plagued byclogging. It is always easier to pump water out of an aquifer than to put it back intothe aquifer. Before considering such an operation the suitability of sites andmethods,the costs of building and maintenance and the alternatives have to be investigated(Dillon et al. 2009).Given the order ofmagnitude of over-pumping In theNorthChinaPlain, the role of MAR in restoring the aquifer balance is limited. Two examples arediscussed in Sect. 2.3.
1.3 Role of Irrigation in Over-Pumping in NCP
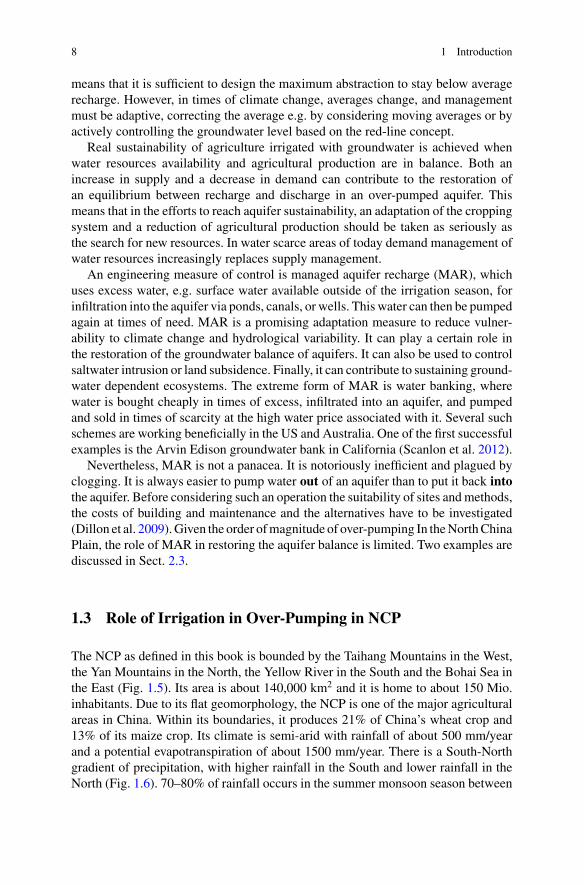
The NCP as defined in this book is bounded by the Taihang Mountains in the West,the Yan Mountains in the North, the Yellow River in the South and the Bohai Sea inthe East (Fig. 1.5). Its area is about 140,000 km2 and it is home to about 150 Mio.inhabitants. Due to its flat geomorphology, the NCP is one of the major agriculturalareas in China. Within its boundaries, it produces 21% of China’s wheat crop and13% of its maize crop. Its climate is semi-arid with rainfall of about 500 mm/yearand a potential evapotranspiration of about 1500 mm/year. There is a South-Northgradient of precipitation, with higher rainfall in the South and lower rainfall in theNorth (Fig. 1.6). 70–80% of rainfall occurs in the summer monsoon season between
1.3 Role of Irrigation in Over-Pumping in NCP 9
Fig. 1.5 The North China Plain (NCP) covering the sedimentary plain within the hydrogeologicalborders formed by the Yan mountains, the Taihang Mountains, the Yellow River and the Bohai Sea.It includes parts of Beijing, Tianjin, Hebei, Henan and Shandong Provinces
June and September.The NCP can be divided into four hydrogeological zones: (I) the piedmont plain
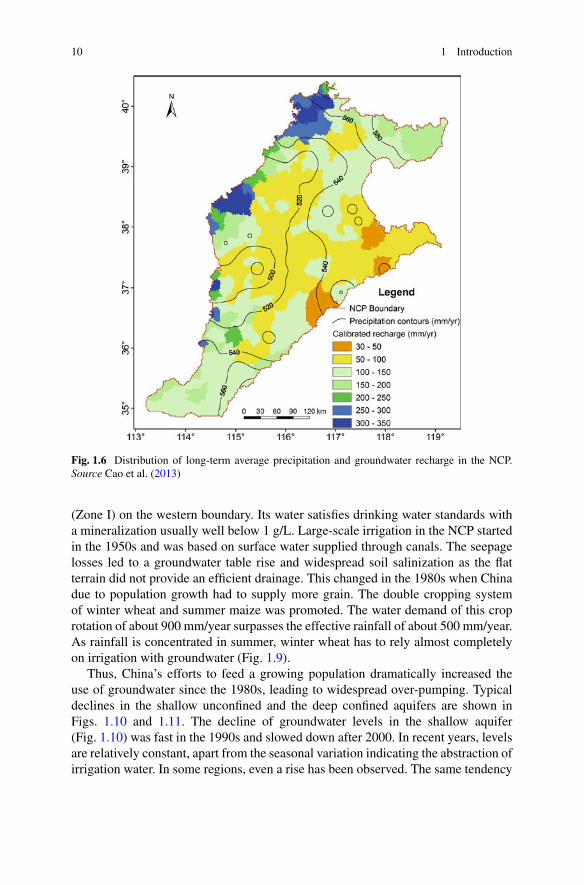
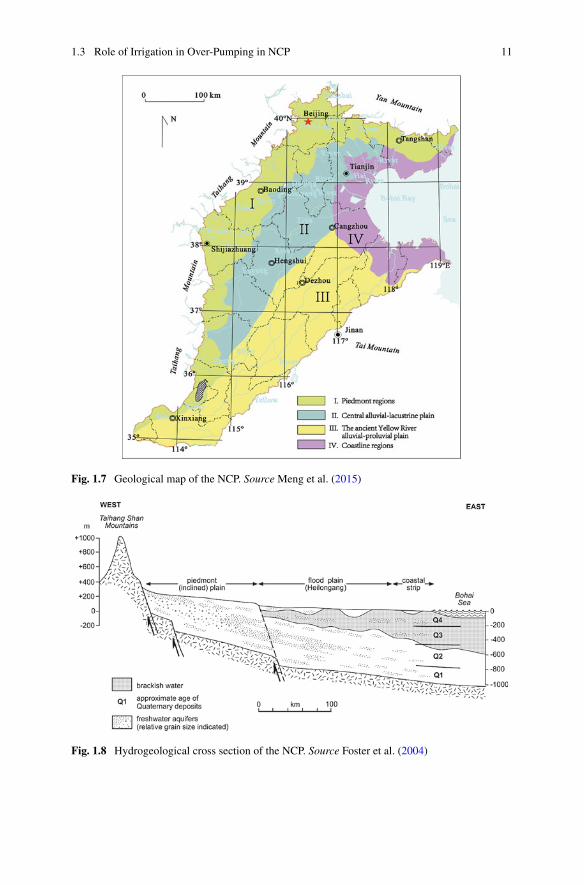
adjacent to the mountains in the west, (II) the central alluvial fan and lacustrine zoneformed by the rivers coming from the Taihang and Yan mountains, (III) the floodplain created by the ancient Yellow River (including today’s Zhang and Wei rivers)and (IV) the coastal plain bordering on the Bohai Sea in the East. Zones II and IIIoccupy most of the NCP (Fig. 1.7).
The groundwater systemof theNCP is divided into fourmain aquifers. The bottomof the first aquifer is at a depth of 40–60 m, the bottom of the second at 120–170 m,while the third and the fourth aquifers reach to depths of 250–350 m and 550–650 m,respectively. The first and the second aquifer are well connected and form the so-called “shallow aquifer”, while the two deep layers are known as the “deep aquifer”(Wu et al. 2010). The shallow and the deep aquifer are only connected in the piedmontregion, while with distance from the mountains they are increasingly separated bythick aquitards of low hydraulic conductivity and high salinity (Fig. 1.8).
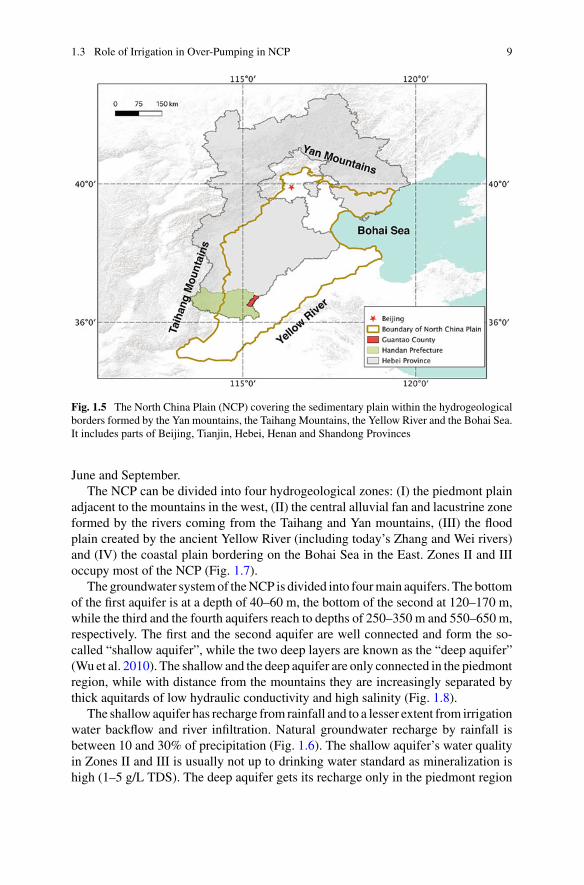
The shallow aquifer has recharge from rainfall and to a lesser extent from irrigationwater backflow and river infiltration. Natural groundwater recharge by rainfall isbetween 10 and 30% of precipitation (Fig. 1.6). The shallow aquifer’s water qualityin Zones II and III is usually not up to drinking water standard as mineralization ishigh (1–5 g/L TDS). The deep aquifer gets its recharge only in the piedmont region
10 1 Introduction
Fig. 1.6 Distribution of long-term average precipitation and groundwater recharge in the NCP.Source Cao et al. (2013)
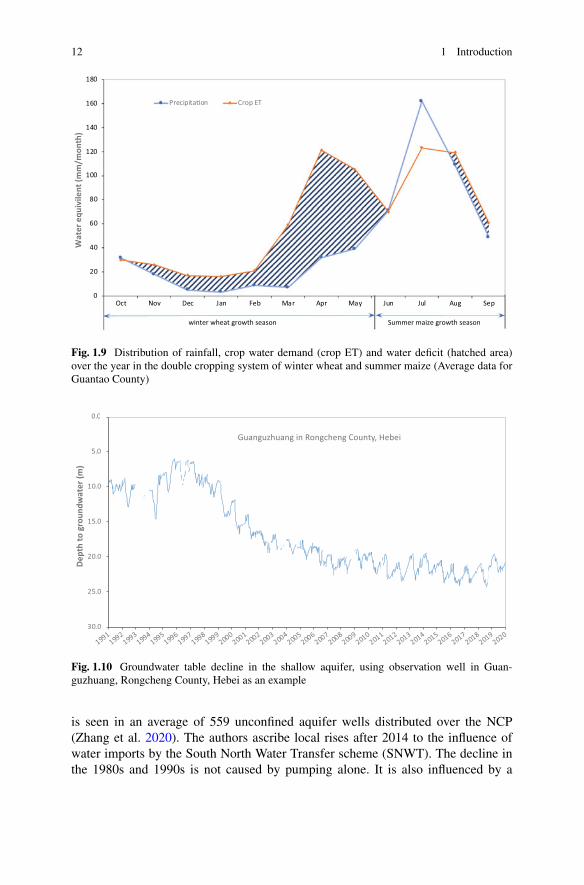
(Zone I) on the western boundary. Its water satisfies drinking water standards witha mineralization usually well below 1 g/L. Large-scale irrigation in the NCP startedin the 1950s and was based on surface water supplied through canals. The seepagelosses led to a groundwater table rise and widespread soil salinization as the flatterrain did not provide an efficient drainage. This changed in the 1980s when Chinadue to population growth had to supply more grain. The double cropping systemof winter wheat and summer maize was promoted. The water demand of this croprotation of about 900 mm/year surpasses the effective rainfall of about 500 mm/year.As rainfall is concentrated in summer, winter wheat has to rely almost completelyon irrigation with groundwater (Fig. 1.9).
Thus, China’s efforts to feed a growing population dramatically increased theuse of groundwater since the 1980s, leading to widespread over-pumping. Typicaldeclines in the shallow unconfined and the deep confined aquifers are shown inFigs. 1.10 and 1.11. The decline of groundwater levels in the shallow aquifer(Fig. 1.10) was fast in the 1990s and slowed down after 2000. In recent years, levelsare relatively constant, apart from the seasonal variation indicating the abstraction ofirrigation water. In some regions, even a rise has been observed. The same tendency
1.3 Role of Irrigation in Over-Pumping in NCP 11
Fig. 1.7 Geological map of the NCP. Source Meng et al. (2015)
Fig. 1.8 Hydrogeological cross section of the NCP. Source Foster et al. (2004)
12 1 Introduction
0
20
40
60
80
100
120
140
160
180
Oct Nov Dec Jan Feb Mar Apr May Jun Jul Aug Sep
Wat
er e
quiv
ilent
(mm
/mon
th)
Precipita�on Crop ET
winter wheat growth season Summer maize growth season
Fig. 1.9 Distribution of rainfall, crop water demand (crop ET) and water deficit (hatched area)over the year in the double cropping system of winter wheat and summer maize (Average data forGuantao County)
0.0
5.0
10.0
15.0
20.0
25.0
30.0
19911992
19931994
19951996
19971998
19992000
20012002
20032004
20052006
20072008
20092010
20112012
20132014
20152016
20172018
20192020
Dept
h to
gro
undw
ater
(m)
Guanguzhuang in Rongcheng County, Hebei
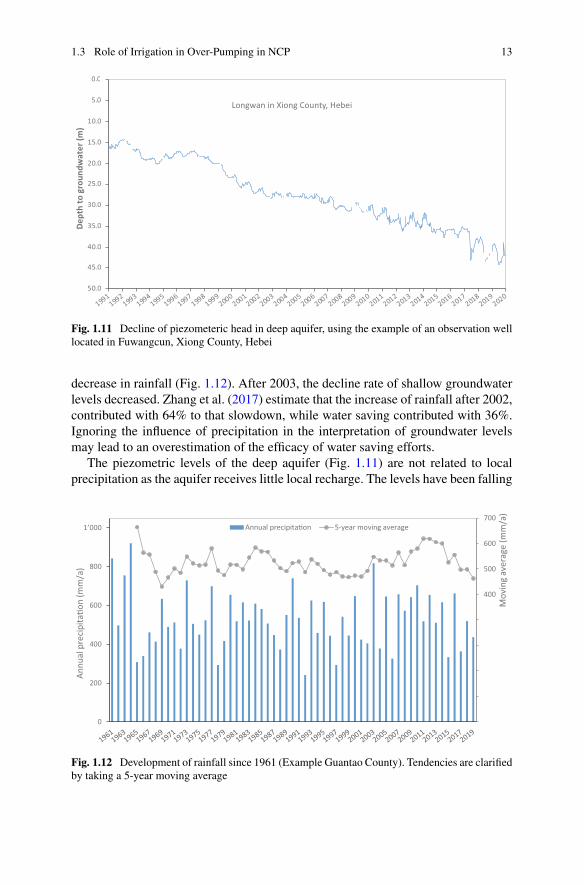
Fig. 1.10 Groundwater table decline in the shallow aquifer, using observation well in Guan-guzhuang, Rongcheng County, Hebei as an example
is seen in an average of 559 unconfined aquifer wells distributed over the NCP(Zhang et al. 2020). The authors ascribe local rises after 2014 to the influence ofwater imports by the South North Water Transfer scheme (SNWT). The decline inthe 1980s and 1990s is not caused by pumping alone. It is also influenced by a
1.3 Role of Irrigation in Over-Pumping in NCP 13
0.0
5.0
10.0
15.0
20.0
25.0
30.0
35.0
40.0
45.0
50.0
19911992
19931994
19951996
19971998
19992000
20012002
20032004
20052006
20072008
20092010
20112012
20132014
20152016
20172018
20192020
Dept
h to
gro
undw
ater
(m)
Longwan in Xiong County, Hebei
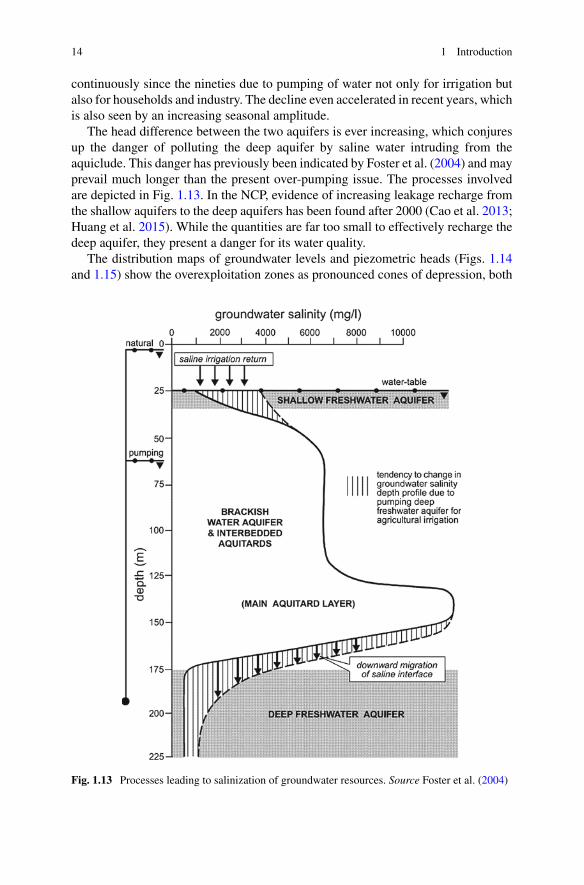
Fig. 1.11 Decline of piezometeric head in deep aquifer, using the example of an observation welllocated in Fuwangcun, Xiong County, Hebei
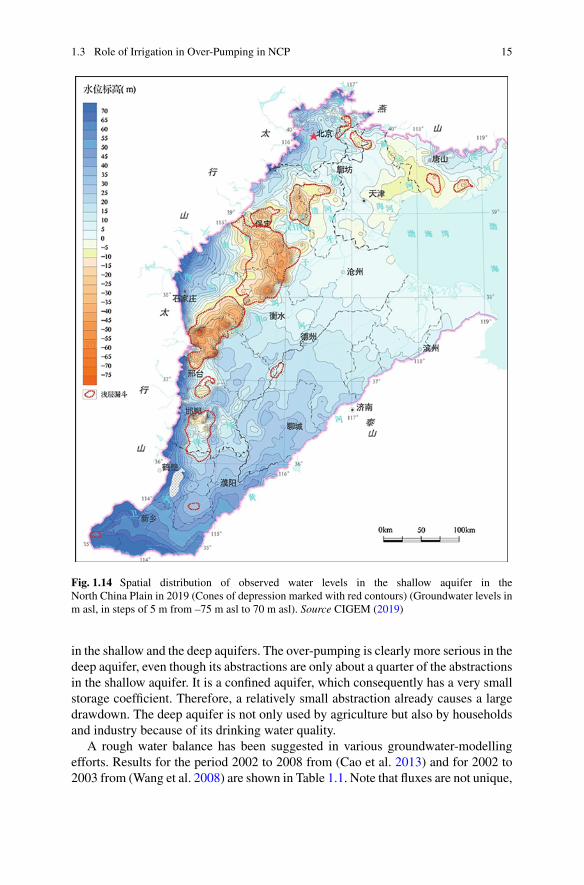
decrease in rainfall (Fig. 1.12). After 2003, the decline rate of shallow groundwaterlevels decreased. Zhang et al. (2017) estimate that the increase of rainfall after 2002,contributed with 64% to that slowdown, while water saving contributed with 36%.Ignoring the influence of precipitation in the interpretation of groundwater levelsmay lead to an overestimation of the efficacy of water saving efforts.
The piezometric levels of the deep aquifer (Fig. 1.11) are not related to localprecipitation as the aquifer receives little local recharge. The levels have been falling
-100
0
100
200
300
400
500
600
700
0
200
400
600
800
1’000
Mov
ing
aver
age
(mm
/a)
Annu
al p
reci
pita
�on
(mm
/a)
Annual precipita�on 5-year moving average
Fig. 1.12 Development of rainfall since 1961 (Example Guantao County). Tendencies are clarifiedby taking a 5-year moving average
14 1 Introduction
continuously since the nineties due to pumping of water not only for irrigation butalso for households and industry. The decline even accelerated in recent years, whichis also seen by an increasing seasonal amplitude.
The head difference between the two aquifers is ever increasing, which conjuresup the danger of polluting the deep aquifer by saline water intruding from theaquiclude. This danger has previously been indicated by Foster et al. (2004) and mayprevail much longer than the present over-pumping issue. The processes involvedare depicted in Fig. 1.13. In the NCP, evidence of increasing leakage recharge fromthe shallow aquifers to the deep aquifers has been found after 2000 (Cao et al. 2013;Huang et al. 2015). While the quantities are far too small to effectively recharge thedeep aquifer, they present a danger for its water quality.
The distribution maps of groundwater levels and piezometric heads (Figs. 1.14and 1.15) show the overexploitation zones as pronounced cones of depression, both
Fig. 1.13 Processes leading to salinization of groundwater resources. Source Foster et al. (2004)
1.3 Role of Irrigation in Over-Pumping in NCP 15
Fig. 1.14 Spatial distribution of observed water levels in the shallow aquifer in theNorth China Plain in 2019 (Cones of depression marked with red contours) (Groundwater levels inm asl, in steps of 5 m from –75 m asl to 70 m asl). Source CIGEM (2019)
in the shallow and the deep aquifers. The over-pumping is clearly more serious in thedeep aquifer, even though its abstractions are only about a quarter of the abstractionsin the shallow aquifer. It is a confined aquifer, which consequently has a very smallstorage coefficient. Therefore, a relatively small abstraction already causes a largedrawdown. The deep aquifer is not only used by agriculture but also by householdsand industry because of its drinking water quality.
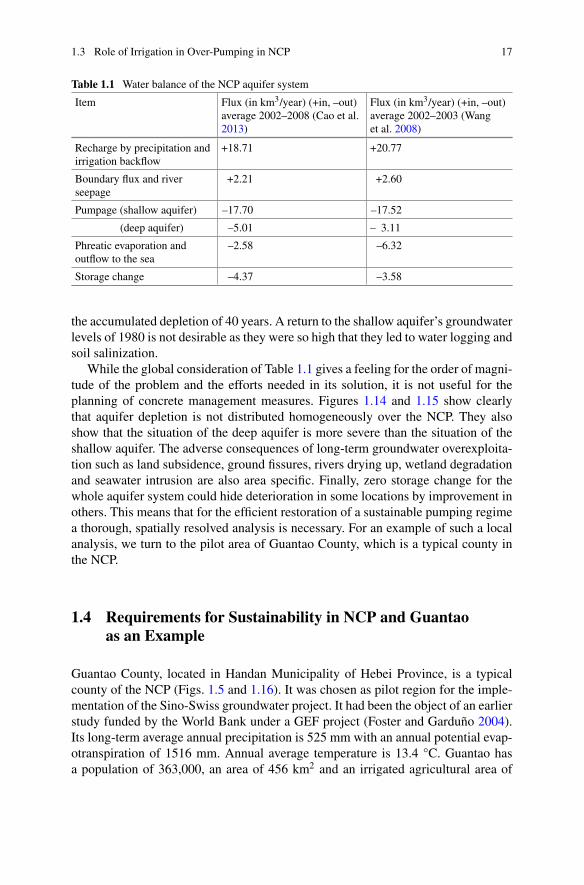
A rough water balance has been suggested in various groundwater-modellingefforts. Results for the period 2002 to 2008 from (Cao et al. 2013) and for 2002 to2003 from (Wang et al. 2008) are shown in Table 1.1. Note that fluxes are not unique,
16 1 Introduction
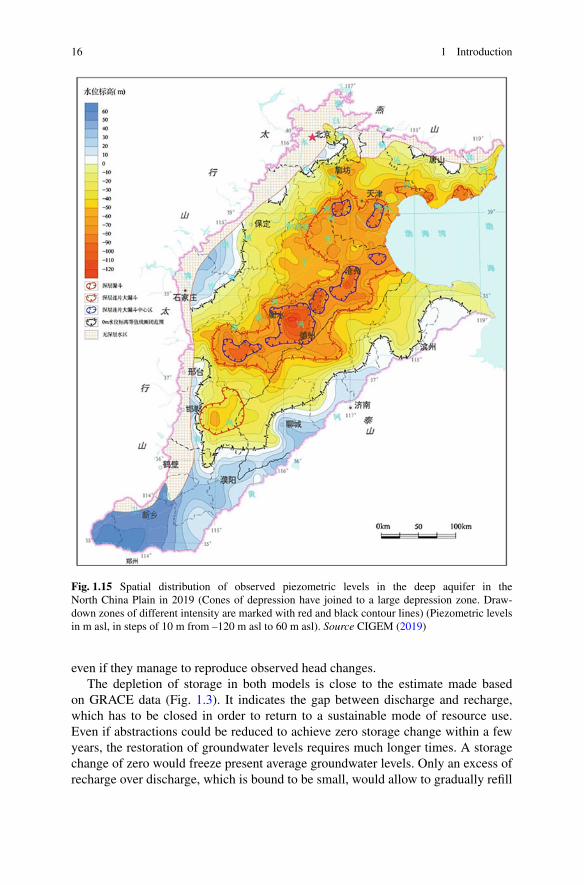
Fig. 1.15 Spatial distribution of observed piezometric levels in the deep aquifer in theNorth China Plain in 2019 (Cones of depression have joined to a large depression zone. Draw-down zones of different intensity are marked with red and black contour lines) (Piezometric levelsin m asl, in steps of 10 m from –120 m asl to 60 m asl). Source CIGEM (2019)
even if they manage to reproduce observed head changes.The depletion of storage in both models is close to the estimate made based
on GRACE data (Fig. 1.3). It indicates the gap between discharge and recharge,which has to be closed in order to return to a sustainable mode of resource use.Even if abstractions could be reduced to achieve zero storage change within a fewyears, the restoration of groundwater levels requires much longer times. A storagechange of zero would freeze present average groundwater levels. Only an excess ofrecharge over discharge, which is bound to be small, would allow to gradually refill
1.3 Role of Irrigation in Over-Pumping in NCP 17
Table 1.1 Water balance of the NCP aquifer system
Item Flux (in km3/year) (+in, –out)average 2002–2008 (Cao et al.2013)
Flux (in km3/year) (+in, –out)average 2002–2003 (Wanget al. 2008)
Recharge by precipitation andirrigation backflow
+18.71 +20.77
Boundary flux and riverseepage
+2.21 +2.60
Pumpage (shallow aquifer) –17.70 –17.52
(deep aquifer) –5.01 – 3.11
Phreatic evaporation andoutflow to the sea
–2.58 –6.32
Storage change –4.37 –3.58
the accumulated depletion of 40 years. A return to the shallow aquifer’s groundwaterlevels of 1980 is not desirable as they were so high that they led to water logging andsoil salinization.
While the global consideration of Table 1.1 gives a feeling for the order of magni-tude of the problem and the efforts needed in its solution, it is not useful for theplanning of concrete management measures. Figures 1.14 and 1.15 show clearlythat aquifer depletion is not distributed homogeneously over the NCP. They alsoshow that the situation of the deep aquifer is more severe than the situation of theshallow aquifer. The adverse consequences of long-term groundwater overexploita-tion such as land subsidence, ground fissures, rivers drying up, wetland degradationand seawater intrusion are also area specific. Finally, zero storage change for thewhole aquifer system could hide deterioration in some locations by improvement inothers. This means that for the efficient restoration of a sustainable pumping regimea thorough, spatially resolved analysis is necessary. For an example of such a localanalysis, we turn to the pilot area of Guantao County, which is a typical county inthe NCP.
1.4 Requirements for Sustainability in NCP and Guantaoas an Example
Guantao County, located in Handan Municipality of Hebei Province, is a typicalcounty of the NCP (Figs. 1.5 and 1.16). It was chosen as pilot region for the imple-mentation of the Sino-Swiss groundwater project. It had been the object of an earlierstudy funded by the World Bank under a GEF project (Foster and Garduño 2004).Its long-term average annual precipitation is 525 mm with an annual potential evap-otranspiration of 1516 mm. Annual average temperature is 13.4 °C. Guantao hasa population of 363,000, an area of 456 km2 and an irrigated agricultural area of
18 1 Introduction
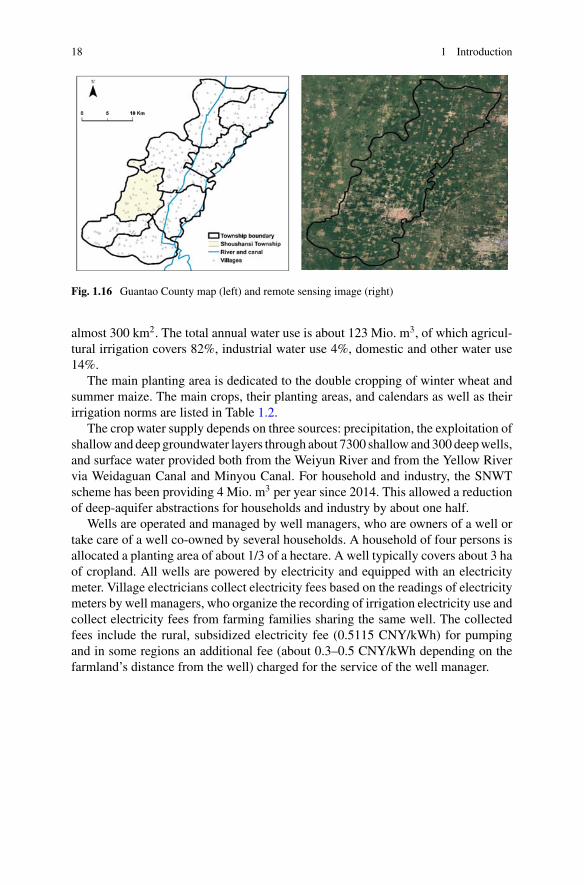
Fig. 1.16 Guantao County map (left) and remote sensing image (right)
almost 300 km2. The total annual water use is about 123 Mio. m3, of which agricul-tural irrigation covers 82%, industrial water use 4%, domestic and other water use14%.
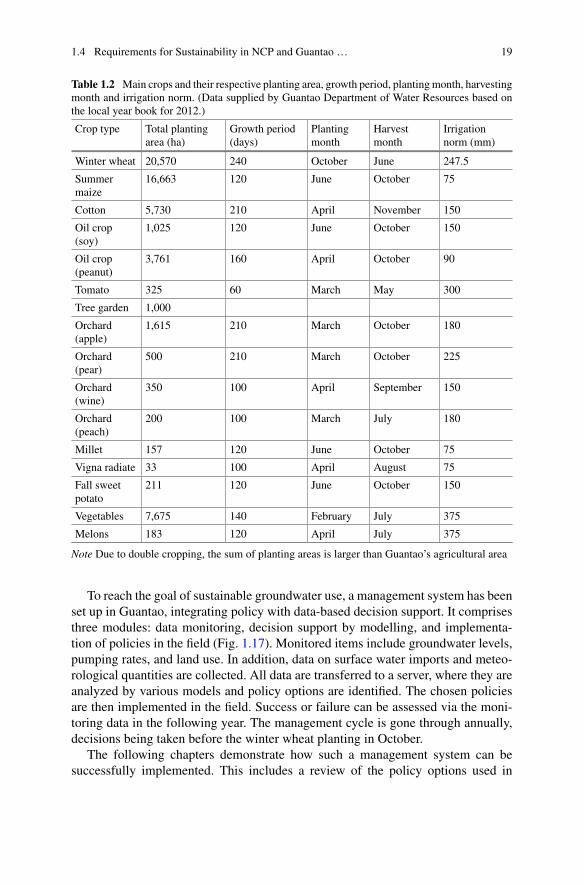
The main planting area is dedicated to the double cropping of winter wheat andsummer maize. The main crops, their planting areas, and calendars as well as theirirrigation norms are listed in Table 1.2.
The crop water supply depends on three sources: precipitation, the exploitation ofshallow and deep groundwater layers through about 7300 shallow and 300 deepwells,and surface water provided both from the Weiyun River and from the Yellow Rivervia Weidaguan Canal and Minyou Canal. For household and industry, the SNWTscheme has been providing 4 Mio. m3 per year since 2014. This allowed a reductionof deep-aquifer abstractions for households and industry by about one half.
Wells are operated and managed by well managers, who are owners of a well ortake care of a well co-owned by several households. A household of four persons isallocated a planting area of about 1/3 of a hectare. A well typically covers about 3 haof cropland. All wells are powered by electricity and equipped with an electricitymeter. Village electricians collect electricity fees based on the readings of electricitymeters by well managers, who organize the recording of irrigation electricity use andcollect electricity fees from farming families sharing the same well. The collectedfees include the rural, subsidized electricity fee (0.5115 CNY/kWh) for pumpingand in some regions an additional fee (about 0.3–0.5 CNY/kWh depending on thefarmland’s distance from the well) charged for the service of the well manager.
1.4 Requirements for Sustainability in NCP and Guantao … 19
Table 1.2 Main crops and their respective planting area, growth period, plantingmonth, harvestingmonth and irrigation norm. (Data supplied by Guantao Department of Water Resources based onthe local year book for 2012.)
Crop type Total plantingarea (ha)
Growth period(days)
Plantingmonth
Harvestmonth
Irrigationnorm (mm)
Winter wheat 20,570 240 October June 247.5
Summermaize
16,663 120 June October 75
Cotton 5,730 210 April November 150
Oil crop(soy)
1,025 120 June October 150
Oil crop(peanut)
3,761 160 April October 90
Tomato 325 60 March May 300
Tree garden 1,000
Orchard(apple)
1,615 210 March October 180
Orchard(pear)
500 210 March October 225
Orchard(wine)
350 100 April September 150
Orchard(peach)
200 100 March July 180
Millet 157 120 June October 75
Vigna radiate 33 100 April August 75
Fall sweetpotato
211 120 June October 150
Vegetables 7,675 140 February July 375
Melons 183 120 April July 375
Note Due to double cropping, the sum of planting areas is larger than Guantao’s agricultural area
To reach the goal of sustainable groundwater use, a management system has beenset up in Guantao, integrating policy with data-based decision support. It comprisesthree modules: data monitoring, decision support by modelling, and implementa-tion of policies in the field (Fig. 1.17). Monitored items include groundwater levels,pumping rates, and land use. In addition, data on surface water imports and meteo-rological quantities are collected. All data are transferred to a server, where they areanalyzed by various models and policy options are identified. The chosen policiesare then implemented in the field. Success or failure can be assessed via the moni-toring data in the following year. The management cycle is gone through annually,decisions being taken before the winter wheat planting in October.
The following chapters demonstrate how such a management system can besuccessfully implemented. This includes a review of the policy options used in
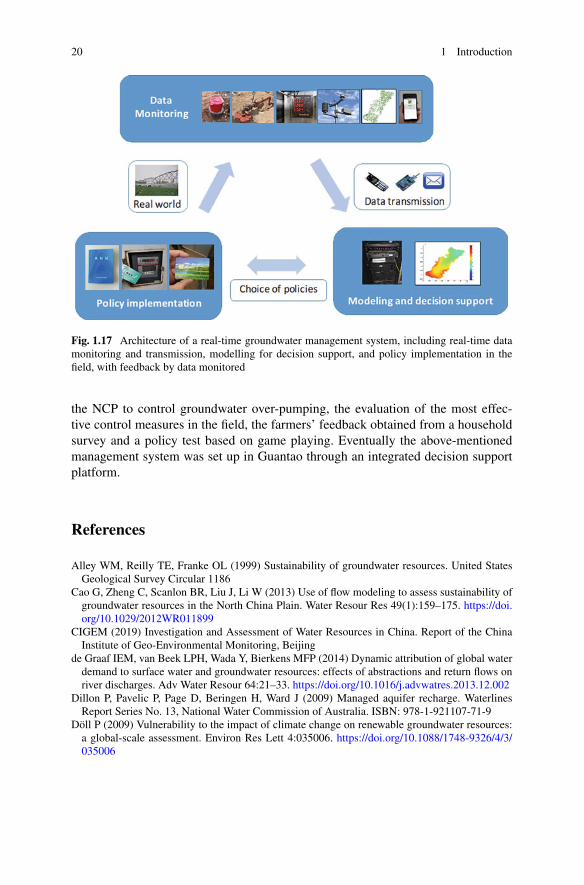
20 1 Introduction
Fig. 1.17 Architecture of a real-time groundwater management system, including real-time datamonitoring and transmission, modelling for decision support, and policy implementation in thefield, with feedback by data monitored
the NCP to control groundwater over-pumping, the evaluation of the most effec-tive control measures in the field, the farmers’ feedback obtained from a householdsurvey and a policy test based on game playing. Eventually the above-mentionedmanagement system was set up in Guantao through an integrated decision supportplatform.
References
Alley WM, Reilly TE, Franke OL (1999) Sustainability of groundwater resources. United StatesGeological Survey Circular 1186
Cao G, Zheng C, Scanlon BR, Liu J, Li W (2013) Use of flow modeling to assess sustainability ofgroundwater resources in the North China Plain. Water Resour Res 49(1):159–175. https://doi.org/10.1029/2012WR011899
CIGEM (2019) Investigation and Assessment of Water Resources in China. Report of the ChinaInstitute of Geo-Environmental Monitoring, Beijing
de Graaf IEM, van Beek LPH, Wada Y, Bierkens MFP (2014) Dynamic attribution of global waterdemand to surface water and groundwater resources: effects of abstractions and return flows onriver discharges. Adv Water Resour 64:21–33. https://doi.org/10.1016/j.advwatres.2013.12.002
Dillon P, Pavelic P, Page D, Beringen H, Ward J (2009) Managed aquifer recharge. WaterlinesReport Series No. 13, National Water Commission of Australia. ISBN: 978-1-921107-71-9
Döll P (2009) Vulnerability to the impact of climate change on renewable groundwater resources:a global-scale assessment. Environ Res Lett 4:035006. https://doi.org/10.1088/1748-9326/4/3/035006
References 21
Döll P, Fiedler K, Zhang J (2009) Global-scale analysis of river flow alterations due to waterwithdrawals and reservoirs. Hydrol Earth Syst Sci 13:2413–2432. https://doi.org/10.5194/hess-13-2413-2009
Döll P, Müller-Schmied H, Schuh C, Portmann FT, Eicker A (2014) Global-scale assessment ofgroundwater depletion and related groundwater abstractions: Combining hydrological modelingwith information fromwell observations andGRACE satellites.Water Resour Res 50:5698–5720.https://doi.org/10.1002/2014WR015595
Fan Y, Li H, Miguez-Macho G (2013) Global patterns of groundwater table depth. Science339(6122):940–943. https://doi.org/10.1126/science.1229881
Feng W, Zhong M, Lemoine JM, Biancale R, Hsu HT, Xia J (2013) Evaluation of groundwaterdepletion in North China using the Gravity Recovery and Climate Experiment (GRACE) dataand ground-basedmeasurements.Water Resour Res 49:2110–2118. https://doi.org/10.1002/wrcr.20192
Foster S, Chilton P (2003) Groundwater: the processes and global significance of aquifer degra-dation. Philos Trans R Soc Lond Ser B 358:1957–1972. https://doi.org/10.1098/rstb.2003.1380
Foster S, Garduño H (2004) China: towards sustainable groundwater resource use for irrigatedagriculture on theNorth China Plain.World Bank. Sustainable groundwater management: lessonsfrom practice. GW-MATE Case Profile Collection Number 8
Foster S, Garduño H, Evans R, Olson D, Tian Y, Zhang W, Han Z (2004) Quaternary Aquifer ofthe North China Plain—assessing and achieving groundwater resource sustainability. HydrogeolJ 12:81–93. https://doi.org/10.1007/s10040-003-0300-6
Foster T, Brozovic N, Butler AP (2017) Effects of initial aquifer conditions on economic benefitsfrom groundwater conservation.Water Resour Res 53:744–762. https://doi.org/10.1002/2016WR019365
Franklin H et al (2017) Recommendations to address the expansion of seawater intrusion in theSalinas Valley groundwater basin. Monterey County Water Resources Agency, Special ReportsSeries 17-01
George A (2011) Lester Brown: The food bubble is about to burst. New Scientist 209(2798):27.https://doi.org/10.1016/S0262-4079(11)60259-5
Gisser M, Sánchez DA (1980) Competition versus optimal control in groundwater pumping. WaterResour Res 16:638–642. https://doi.org/10.1029/WR016i004p00638
GisserM, SánchezDA (1980) Some additional economic aspects of groundwater resources replace-ment flows in semi-arid agricultural areas. Int J Control 31(2):331–334. https://doi.org/10.1080/00207178008961044
Gong H, Pan Y, Zheng L, Li X, Zhu L, Zhang C, Huang Z, Li Z, Wang H, Zhou C (2018) Long-term groundwater storage changes and land subsidence development in the North China Plain(1971–2015). Hydrogeol J 26:1417–1427. https://doi.org/10.1007/s10040-018-1768-4
Herrera-García G, Ezquerro P, Tomás R, Béjar-Pizarro M, López-Vinielles J, Rossi M, Mateos RM,Carreón-Freyre D, Lambert J, Teatini P, Cabral-Cano E, Erkens G, Galloway D, Hung W, KakarN, Sneed M, Tosi L, Wang H, Ye S (2021) Mapping the global threat of land subsidence. Science371(6524):34–36. https://doi.org/10.1126/science.abb8549
Huang Z, Pan Y, Gong H, Yeh PJF, Li X, Zhou D, Zhao W (2015) Subregional-scale groundwaterdepletion detected by GRACE for both shallow and deep aquifers in North China Plain. GeophysRes Lett 42:1791–1799. https://doi.org/10.1002/2014GL062498
Kinzelbach W, Brunner P, Bauer-Gottwein P, Siegfried T (2003) Sustainable groundwatermanagement. Episodes 26(4):279–284
Konikow LF, Kendy E (2005) Groundwater depletion: a global problem. Hydrogeol J 13:317–320.https://doi.org/10.1007/s10040-004-0411-8
Liu C, Yu J, Kendy E (2001) Groundwater exploitation and its impact on the environment in theNorth China Plain. Water Int 26(2):265–272. https://doi.org/10.1080/02508060108686913
Liu J, Chen Y, Chen Y, Zhang N, Li W (2005) Degradation of populous Euphratica community inthe lower reaches of the Tarim River, Xinjiang China. J Environ Sci (China) 17(5):740–747
22 1 Introduction
MEA (2005) Millennium Ecosystem Assessment, 2005. Ecosystems and Human Well-being:Synthesis. Island Press, Washington, DC
Meng S, Liu J, Zhang Z, Lei T, Qian Y, Li Y, Fei Y (2015) Spatiotemporal evolution characteristicsstudy on the precipitation infiltration recharge over the past 50 years in the North China Plain. JEarth Sci 26:416–424. https://doi.org/10.1007/s12583-014-0494-7
NASA (2020) https://grace.jpl.nasa.gov/data/get-data/Ortega-Guerrero A, Rudolph DL, Cherry JA (1999) Analysis of long-term land subsidence nearMexico City: field investigations and predictive modeling. Water Resour Res 35(11):3327–3341.https://doi.org/10.1029/1999WR900148
Pokhrel YN, Hanasaki N, Yeh PJF, Yamada TJ, Kanae S, Oki T (2012) Model estimates of sea-levelchange due to anthropogenic impacts on terrestrial water storage. Nat Geosci 5:389–392. https://doi.org/10.1038/ngeo1476
Rodell M, Famiglietti JS, Wiese DN et al (2018) Emerging trends in global freshwater availability.Nature 557:651–659. https://doi.org/10.1038/s41586-018-0123-1
Scanlon BR, Faun CC, Longuevergne L, Reedy RC, AlleyWM,McGuire VL,McMahon PB (2012)Groundwater depletion and sustainability of irrigation in the US High Plains and Central Valley.PNAS 109(24):9320–9325. https://doi.org/10.1073/pnas.1200311109
Siebert S, Burke J, Faures JM, Frenken K, Hoogeveen J, Döll P, Portmann FT (2010) Groundwateruse for irrigation—a global inventory. Hydrol Earth Syst Sci 14:1863–1880. https://doi.org/10.5194/hess-14-1863-2010
Seckler DW (1996) The new era of water resourcesmanagement: from “dry” to “wet”water savings.IWMI Report
Wada Y, van Beek LPH, van Kempen CM, Reckman JWTM, Vasak S, BierkensMFP (2010) Globaldepletion of groundwater resources. Geophys Res Lett 37:L20402. https://doi.org/10.1029/2010GL044571
Wang S, Shao J, Song X, Zhang Y, Huo Z, Zhou X (2008). Application of MODFLOW andgeographic information system to groundwater flow simulation in North China Plain. ChinaEnviron Geol 55(7):1449–1462. https://doi.org/10.1007/s00254-007-1095-x
Whittemore DO, Butler JJ Jr, BrownieWilson B (2018) Status of the High Plains Aquifer in Kansas.Kansas Geological Survey Technical Series 22
Wines M (2013). Wells dry, fertile plains turn to dust. New York Times, May 19, 2013.Wu A, Li C, Xu Y et al (2010) Key issues influencing sustainable groundwater utilization and itscountermeasures in North China Plain. South North Water TransfS Water Sci Technol 8(6):110–113 (In Chinese)
Zhang HB, Singh VP, Sun DY, Yu QJ, Wei C (2017) Has water-saving irrigation recovered ground-water in the Hebei Province plains of China? Int J Water Resour Dev 33(4):534–552. https://doi.org/10.1080/07900627.2016.1192994
Zhang C, Duan Q, Yeh PJF, Pan Y, Gong H, Gong W, et al (2020) The effectiveness of the South-to-North Water Diversion Middle Route Project on water delivery and groundwater recoveryin North China Plain. Water Resour Res 56:e2019WR026759. https://doi.org/10.1029/2019WR026759

References 23
Open Access This chapter is licensed under the terms of the Creative Commons Attribution 4.0International License (http://creativecommons.org/licenses/by/4.0/), which permits use, sharing,adaptation, distribution and reproduction in any medium or format, as long as you give appropriatecredit to the original author(s) and the source, provide a link to the Creative Commons license andindicate if changes were made.
The images or other third party material in this chapter are included in the chapter’s CreativeCommons license, unless indicated otherwise in a credit line to the material. If material is notincluded in the chapter’s Creative Commons license and your intended use is not permitted bystatutory regulation or exceeds the permitted use, you will need to obtain permission directly fromthe copyright holder.
Chapter 2Policy Options of Over-Pumping Controlin the NCP
Starting in the 1990s, China has been issuing regulations and policy rules relatedto groundwater management and pumping control on both national and provinciallevels. These policies include the requirement of permits for well drilling, a wellspacing policy, pumping quota management, water resources fee collection, settingof irrigation water prices, a water rights system, water markets, and more. Since theearly 2010s, the central government increasingly paid attention to the groundwaterdepletion issue, leading to the deployment of the pilot program “ComprehensiveControl of Groundwater Overdraft in North China Plain” in 2014. It coordinatedefforts of several ministries and included innovative measures such as subsidies forfallowing of winter wheat and substitution of groundwater by surface water, espe-cially for household and industry through the South-NorthWater Transfer Project. InGuantao County about 8 Mio. m3/yr of groundwater were saved through subsidizedfallowing of winter wheat, while the import of surface water could be increasedto almost 60 Mio m3/yr. However, continued funding of subsidies for fallowing isnot guaranteed and the seemingly large imports of Yellow River water were usedvery inefficiently as the region lacks storage facilities to cope with water arrivingoff-season.
In China, policies are generally implemented through a top-down approach.Even though some policy pilots start on provincial or county level, eventually anational policy follows, upscaling the pilot experience to all relevant regions. Thischapter summarizes China’s recent national policies on groundwater managementand assesses the efficiency of major measures for groundwater over-pumping controlimplemented throughvarious pilots inHebei province from2014 to2017.The chapteralso highlights the most effective control measures adopted for further implementa-tion in Beijing-Tianjin-Hebei (BTH) region from 2018 on and their implementationstatus. The governance structure of the water sector in China is introduced presentingthe overall picture of groundwatermanagement across different governmental bodies.
© The Author(s) 2022W. Kinzelbach et al., Groundwater Overexploitation in the North China Plain:A path to Sustainability, Springer Water,https://doi.org/10.1007/978-981-16-5843-3_2
25
26 2 Policy Options of Over-Pumping Control in the NCP
2.1 China’s Groundwater Policies in Recent years
China has issued regulations and policy rules related to groundwater managementand pumping control on both national and provincial levels. These policies includethe requirement of permits for well drilling, a well spacing policy, pumping quotamanagement, water resources fee collection, setting of irrigationwater prices, awaterrights system, water markets, and more. A summary of these policy instruments isgiven below:
2.1.1 Permit Policy for Well Drilling
In the early 1990s, some provinces in northern China began to implement formal orinformal well-drilling permit policies to control the drilling of tube wells and thuslimit the utilization of groundwater. Although the policy has been implemented incertain provinces as early as the 1990s and is effective up to now, well permits werenot included in the 2002 Water Law and no national water regulation has addressedthis policy. Shen (2015) pointed out that well permits are inconsistent with the recentreform aiming at a reduction of administrative permits in China.
Based on a survey covering six provinces (Hebei, Henan, Shanxi, Shaanxi,Liaoning and Inner Mongolia) in North China, done by Prof. Jinxia Wang and herteam at Peking University, in 1995 18% of villages had implemented a well-drillingpermit policy. This share increased to 34% by 2004 and to 54% by 2015 (Wang et al.2020a).
2.1.2 Well-Spacing Policy
In 2010, the Ministry of Water Resources issued technical guidance on tube wellspacing in both rural and urban regions (MWR 2010). Depending on the distance,the groundwater withdrawal of one tube well will affect the groundwater availabilityat other tube wells in the same aquifer (Huang et al. 2013). Frija et al. (2015) statedthat management tools such as appropriate well spacing are needed in areas withgroundwater overexploitation and degradation. Therefore, a well-spacing policy tocontrol farmers’ tube well drilling is a crucial measure to ensure the supply reli-ability of groundwater irrigation. However, it is both time-consuming and techni-cally demanding to provide scientific information for well spacing based on the localhydrogeological conditions. The implementation of this policy so far dependsmainlyon local people’s experience (e.g. county officials, drilling teams, farmers).
2.1 China’s Groundwater Policies in Recent years 27
2.1.3 Quota Management
Water quota management was first introduced in China in the 2002 “Water Law”.It only became a priority policy instrument after the “Three Red Lines” policieswere issued by the central government in 2012 (State Council 2012). The centralgovernment required river basin management authorities and local water resourcesbureaus to determine water quotas for various water users at different administrativelevels (i.e. river basin, province, city, county, irrigation district, and village). Underthe water quota system, all water users should be issued withdrawal permits fromupper-level water management authorities and their withdrawal rates (of both surfaceand groundwater) should not exceed the allocated quota. In recent years, the waterquota concept has also been used in groundwater pumping control in the frameworkof the agricultural water pricing reform.
Despite central and local governments’ efforts, implementation of water quotamanagement remains difficult in rural areas. The main reasons are: First, water usediffers by crops, farmers, and regions (according to soil and climate conditions) andit is difficult to calculate generally applicable water quota. Second, metering facilitiesfor groundwater use in irrigation rarely exist. Third, the water rights system has notyet been established in all of China, and the relationship between water quota andthis system remains unclear.
2.1.4 Water Resources Fee and Tax
(Kemper 2007) indicated that a water resources fee could provide incentives to usegroundwater more efficiently. This is especially true if this fee is tied to the volume ofgroundwater used. Since the early 1980s,water resources fees havebeen introduced incertain provinces in northern China (e.g. Tianjin, Shanxi, Beijing) (Shen 2015). Theyare also included in the 2002 Water Law. In 2006 China’s central government issuedthe “Regulations on the Management of Water Abstraction Permit and Collection ofWater Resources Fee”. The fee is collected by the water administration departmentsat the county level based on approvedwater abstraction permits.Where an abstractionpermit is approved by river basin management organizations, the fee is collected bythe relevant department of the province in which the water intake is located. It isbased on the actual water abstraction volume and fee standards (Shen 2015).
Collecting groundwater resource fees in rural areas remains a major challenge forpolicymakers. Groundwater cost for irrigation includes pumping costs (includingcost for drilling and equipment of tube wells, electricity cost or diesel fuel cost) butdoes not account for the scarcity value of groundwater. As (Yu et al. 2015) pointedout, the water price does not include the groundwater resource fee in most parts ofrural China.
There is an ongoing transformation from awater resources fee to awater resourcestax to enhance its potential role. In 2016 Hebei Province was selected as the pilot
28 2 Policy Options of Over-Pumping Control in the NCP
province for the fee to tax transformation. From 2017 the fee to tax reform hasbeen expanded to 9 provinces including Beijing, Tianjin, Shanxi, Inner Mongolia,Henan, Shandong, Sichuan, Ningxia, and Shaanxi. No matter whether fee or tax, it isdifficult to implement the policy in rural groundwater use. Farmers’ low revenue fromagricultural production and the lack of metering facilities for millions of irrigationpumping wells are both huge obstacles preventing the collection of a water resourcestax from individual farmers.
2.1.5 Irrigation Water Price Policy
Over the past 40 years, the reform of China’s irrigation water price policy has madesome progress. After the first water fee regulation in 1985, surface water supply forirrigation was transformed from being fully subsidized to covering at least part of thecost by a supply fee. In 1992, price bureaus took over themanagement responsibilitiesfor the irrigation fee from the Water Resources Bureaus, changing the nature of thefee from an administrative issue to a commodity issue. The irrigation fee furtherchanged from a single to a two-part structure in the last two decades. The two partsinclude a basic fee charged by area and a volumetric fee charged by the amount ofwater used. In the last decade, the scarcity value of water resources was added as acomponent of the irrigation fee. In addition, from 2016 on, the central governmentbegan selecting regions to set up pilot projects to shift from water resources fees towater resources taxes. This might seem a change in name only. However, fees goto the water administration, possibly reducing their interest in water saving, whiletaxes go to the government tax office. The government also realized that irrigationprice reform should be accompanied by improvement of irrigation facilities andinstitutional innovation (such as establishing WUAs).
Reform progress was mainly related to the price of surface water resources forirrigation, and not to the price of groundwater. In groundwater irrigation the majorinvestors are farmers or village collectives. They mainly pay electricity or dieselfuel cost incurred for pumping water and so far, do not need to pay the resourcefee. Collection of a groundwater resource fee is what the government expects fromthe reform of the irrigation water price. However, due to high implementation costfor collecting such a fee, until now this expectation cannot be fulfilled. Therefore,groundwater irrigation cost presently mainly consists of the energy cost (electricityor diesel fuel cost), cost for drilling and equipment of tube wells and eventually laboror service cost incurred during irrigation.
Due to poor measurement facilities and high implementation cost, it is hard toimplement volumetric groundwater irrigation fees in the field. However, since mosttube wells include electricity metering, and the major operation cost of a tube wellis the electricity cost, it is common to collect groundwater irrigation fees based onelectricity use. Charging groundwater irrigation fees according to electricity use canbe treated as a proxy approach to a volumetric irrigation fee. A field survey by(Wang et al. 2020b) tracked 125 community tube wells managed by well managers.
2.1 China’s Groundwater Policies in Recent years 29
For this sample, the percentage of tube wells collecting a groundwater irrigation feeproportional to the electricity fee increased from 36% in 2001 to 78% in 2015. Inanother approach, tube well managers collected groundwater irrigation fees by timeof use of the well, which is another type of proxy approach to a volumetric irrigationfee. Over the past 15 years, the share of tube wells collecting groundwater irrigationfees by time of use slightly decreased from 25% in 2001 to 22% in 2015. Before2015, some tube well managers also collected groundwater irrigation fees by areairrigated or by the amount of diesel fuel consumed.
2.1.6 Water Rights System and Water Markets
The Chinese government has been trying to set up a water rights system and allocatewater through market mechanisms since the early 2000s (Calow et al. 2009). Intheory, regulatory caps on total water use within a given region in a rational waterrights system can lead to socially optimal allocation of water resources; thus, watercan be used by those who value it most (Howe et al. 1986), (Debaere et al. 2014).Considering the potential benefit, the central government has been issuing regulationsto promote the development of a water rights system over the last two decades.The first two important regulations were issued in 2005: “Some Opinions on WaterRights Transfer and Establishing a Framework ofWater Rights System”. In 2014, thegovernment launched formal pilot projects in seven provinces to further acceleratethe development. These provinces includedNingxia, Jiangxi, Hubei, InnerMongolia,Henan, Gansu, and Guangdong. To support the implementation of pilot projects andencourage water rights transactions among regions, sectors, and individual waterusers, the MWR issued the “Temporary Management Regulation on Water Rights’Transfer” in 2016. In the same year, the first national Transaction Institute of WaterRights was established in Beijing.
So far, only a few pilot projects of water rights transfer have been consideredsuccessful, especially those which trade among regions and industries. For example,there are two prominent water rights transfer projects (Speed 2009), (Moore 2015):between Dongyang and Yiwu in Zhejiang province, and between agricultural andindustrial sectors in Inner Mongolia and Ningxia provinces. Though successful, theyare mainly coordinated by local governments; water users in these regions havenot been directly involved in the transactions. It should also be noted that whilethe transfer of water rights may increase water use efficiency it does not reducethe amount of water pumped from an aquifer and is therefore no solution to over-pumping.
It is more difficult to establish a water rights system to promote rights transferamong irrigation water users in rural areas. At the irrigation district (ID) level, waterrights have only been granted to farmers at a few select pilot sites, where water rightstransactions among individual farmers are not always effective (Sun et al. 2016). Fieldsurveys in China seldom found evidence of water rights’ transfer among farmers.In fact, many farmers are unaware of their water use rights or the fact that they can
30 2 Policy Options of Over-Pumping Control in the NCP
be traded. A typical example for establishing a water rights system in rural areasis the institutional reform in Zhangye Prefecture in Gansu Province. Here, waterrights have been granted to individual farmers in the form of water rights certificates.These certificates state the upper limit of the amount of water a household can buy,which is computed by area and crop irrigation quota. Even so, transactions involvingwater rights are rare in Zhangye. Importantly, because of poor implementation andhigh monitoring cost, water rights certificates do not have a sustainable function inreducing irrigation water demand. They only played a significant role in the earlystages of the reform, where irrigation of wheat was reduced by 23% (before 2010).The survey (Sun et al. 2016) also found that farmers incurred practically no penaltyfor exceeding their water rights, which encourages them to use yet more water.
Despite progress made in establishing a water rights system and developing watermarkets, China still faces challenges in expanding reforms. There has also been aheated debate on the suitability of water markets in rural areas. The major issue isthat initial water rights have not yet been allocated to various water users in mostregions (Wang et al. 2017). It is impossible to develop water markets without a fullyestablished water rights system. Recently, a water quota system has been suggestedfor allocating initial water rights to users. However, there is no clear agreement on therelationship between the water rights system and the water quota policy. In addition,the implementation of a water quota policy in rural areas has been slow because ofthe lack of metering facilities and the high cost involved in monitoring large numbersof small-holder farmers’ wells. Therefore, some officials and scholars question itssuitability for developing water markets in rural China, at least at the individualfarmer level. If possible, it is better to encourage trade at the level of WUAs or IDsinstead. (Lewis and Zheng 2018) noted that promoting water trade at the WUA levelrequires strong efforts to encourage farmers to participate in the activities of WUAs.Finally, the potential effects of water rights transfer on disadvantaged water usersand on the environment also need to be seriously considered (Heaney et al. 2005;Johansson et al. 2002; Etchells et al. 2006).
2.1.7 National Policy Focus: NCP’s GroundwaterOver-Pumping
Regardless of all the policy rules and regulations published, implementation lagsand groundwater over-pumping remains a major issue in the NCP. It has becomea focus of national policy, appearing in many important state documents issued bythe Central Committee of the Communist Party of China and the State Council. Themost recent state documents include:
2.1 China’s Groundwater Policies in Recent years 31
1. “Decision of the Central Committee of the Communist Party of Chinaand the State Council on Accelerating Water Conservancy Reform andDevelopment” in 2011
This document demands that groundwater over-pumping should basically bestopped by 2020.
2. “Opinions of the State Council on Implementing the Strictest WaterResources Management System” in 2012
This document calls for strict groundwater management and protection to reacha balance between groundwater exploitation and recharge.
3. “Decisions of the Central Committee of the Communist Party of China onSeveral Major Issues of Comprehensively Deepening Reform” in 2013
This document proposes several measures for groundwater management,including the establishment of pre-warning mechanisms based on the moni-toring of resources and environmental carrying capacity and the implementationof restrictive measures for areas where water and soil resources are exploitedbeyond their capacities. The measures include adjustment of cropland area inregions with severe pollution and severe groundwater overexploitation, in orderto rehabilitate arable land, rivers and lakes.
4. “Opinions of the Central Committee of the Communist Party of Chinaand the State Council on Accelerating the Construction of EcologicalCivilization” in 2015
The document states that the balance between groundwater extraction andrecharge should gradually be reached by implementing groundwater protec-tion and comprehensive management of the over-exploited areas characterizedby groundwater depression cones.
5. “Outline of the 13th Five-Year Plan for the National Economic and SocialDevelopment of the People’s Republic of China” in 2016
The document states that groundwater management should focus on areas ofgroundwater depression cones, exploring pilot measures of farmland rotationand fallowing mechanisms, developing scientific methods for the conjunctiveuse of surface water and groundwater and various types of unconventional watersources, strictly controlling groundwater exploitation, improving the nationalgroundwater monitoring system, and comprehensively managing groundwaterover-exploitation areas.
All these documents prove that groundwater depletion has been paid great atten-tion to on the central government level since the beginning of the 2010s. This hasresulted in the deployment of the pilot program “Comprehensive Control of Ground-water Overdraft in North China Plain” in Hebei Province in 2014, which has beensupported by theMinistries of Finance, ofWater Resources, of Agriculture and RuralAreas, and of Land Resources (now Natural Resources). The pilot program startedin four prefectures (including Handan) in Hebei Province, covering 49 counties(including Guantao County in Handan Prefecture).
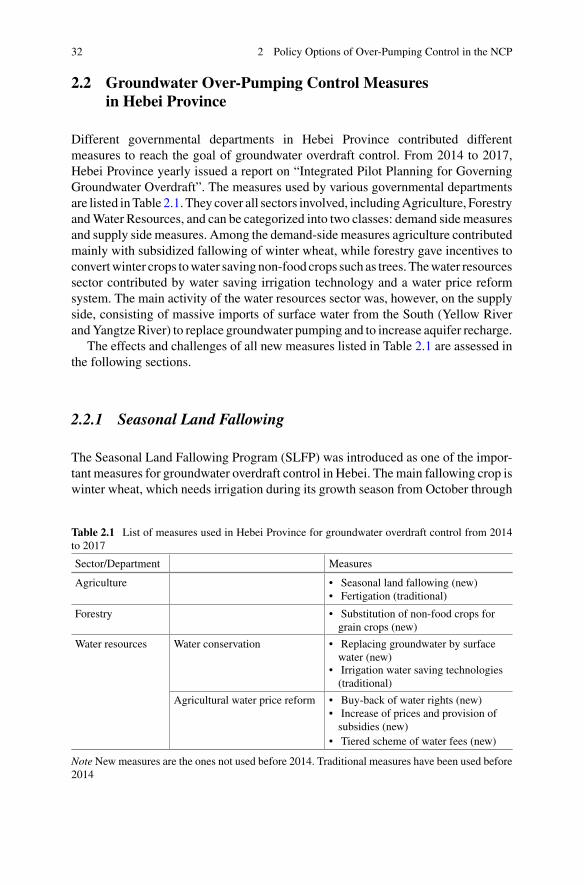
32 2 Policy Options of Over-Pumping Control in the NCP
2.2 Groundwater Over-Pumping Control Measuresin Hebei Province
Different governmental departments in Hebei Province contributed differentmeasures to reach the goal of groundwater overdraft control. From 2014 to 2017,Hebei Province yearly issued a report on “Integrated Pilot Planning for GoverningGroundwater Overdraft”. The measures used by various governmental departmentsare listed inTable 2.1. They cover all sectors involved, includingAgriculture, ForestryandWater Resources, and can be categorized into two classes: demand sidemeasuresand supply side measures. Among the demand-side measures agriculture contributedmainly with subsidized fallowing of winter wheat, while forestry gave incentives toconvertwinter crops towater savingnon-food crops such as trees. Thewater resourcessector contributed by water saving irrigation technology and a water price reformsystem. The main activity of the water resources sector was, however, on the supplyside, consisting of massive imports of surface water from the South (Yellow RiverandYangtze River) to replace groundwater pumping and to increase aquifer recharge.
The effects and challenges of all new measures listed in Table 2.1 are assessed inthe following sections.
2.2.1 Seasonal Land Fallowing
The Seasonal Land Fallowing Program (SLFP) was introduced as one of the impor-tant measures for groundwater overdraft control in Hebei. Themain fallowing crop iswinter wheat, which needs irrigation during its growth season from October through
Table 2.1 List of measures used in Hebei Province for groundwater overdraft control from 2014to 2017
Sector/Department Measures
Agriculture • Seasonal land fallowing (new)• Fertigation (traditional)
Forestry • Substitution of non-food crops forgrain crops (new)
Water resources Water conservation • Replacing groundwater by surfacewater (new)
• Irrigation water saving technologies(traditional)
Agricultural water price reform • Buy-back of water rights (new)• Increase of prices and provision ofsubsidies (new)
• Tiered scheme of water fees (new)
NoteNew measures are the ones not used before 2014. Traditional measures have been used before2014
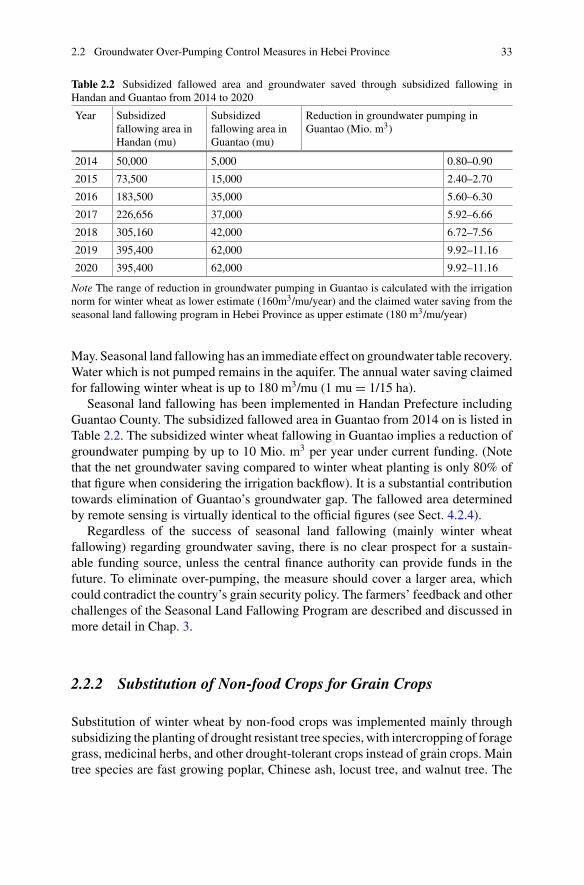
2.2 Groundwater Over-Pumping Control Measures in Hebei Province 33
Table 2.2 Subsidized fallowed area and groundwater saved through subsidized fallowing inHandan and Guantao from 2014 to 2020
Year Subsidizedfallowing area inHandan (mu)
Subsidizedfallowing area inGuantao (mu)
Reduction in groundwater pumping inGuantao (Mio. m3)
2014 50,000 5,000 0.80–0.90
2015 73,500 15,000 2.40–2.70
2016 183,500 35,000 5.60–6.30
2017 226,656 37,000 5.92–6.66
2018 305,160 42,000 6.72–7.56
2019 395,400 62,000 9.92–11.16
2020 395,400 62,000 9.92–11.16
Note The range of reduction in groundwater pumping in Guantao is calculated with the irrigationnorm for winter wheat as lower estimate (160m3/mu/year) and the claimed water saving from theseasonal land fallowing program in Hebei Province as upper estimate (180 m3/mu/year)
May. Seasonal land fallowing has an immediate effect on groundwater table recovery.Water which is not pumped remains in the aquifer. The annual water saving claimedfor fallowing winter wheat is up to 180 m3/mu (1 mu = 1/15 ha).
Seasonal land fallowing has been implemented in Handan Prefecture includingGuantao County. The subsidized fallowed area in Guantao from 2014 on is listed inTable 2.2. The subsidized winter wheat fallowing in Guantao implies a reduction ofgroundwater pumping by up to 10 Mio. m3 per year under current funding. (Notethat the net groundwater saving compared to winter wheat planting is only 80% ofthat figure when considering the irrigation backflow). It is a substantial contributiontowards elimination of Guantao’s groundwater gap. The fallowed area determinedby remote sensing is virtually identical to the official figures (see Sect. 4.2.4).
Regardless of the success of seasonal land fallowing (mainly winter wheatfallowing) regarding groundwater saving, there is no clear prospect for a sustain-able funding source, unless the central finance authority can provide funds in thefuture. To eliminate over-pumping, the measure should cover a larger area, whichcould contradict the country’s grain security policy. The farmers’ feedback and otherchallenges of the Seasonal Land Fallowing Program are described and discussed inmore detail in Chap. 3.
2.2.2 Substitution of Non-food Crops for Grain Crops
Substitution of winter wheat by non-food crops was implemented mainly throughsubsidizing the planting of drought resistant tree species, with intercropping of foragegrass, medicinal herbs, and other drought-tolerant crops instead of grain crops. Maintree species are fast growing poplar, Chinese ash, locust tree, and walnut tree. The
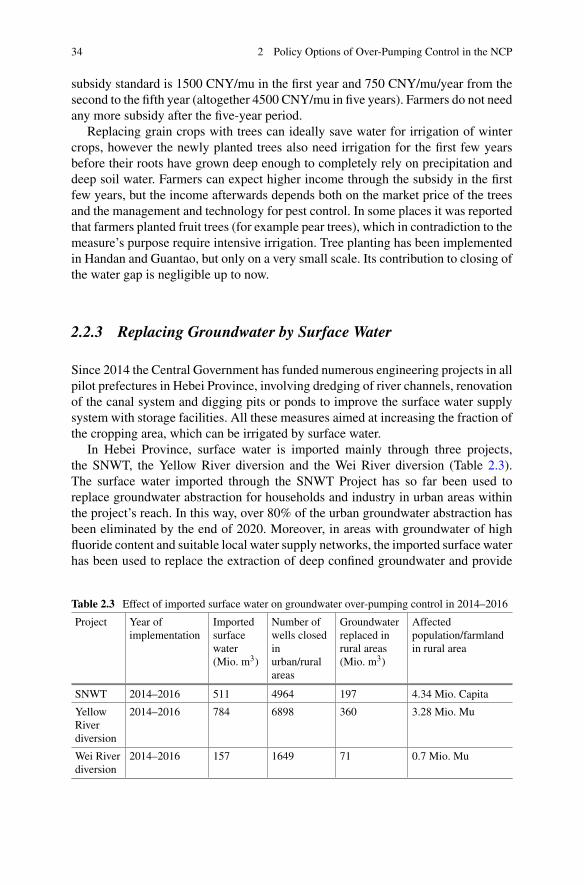
34 2 Policy Options of Over-Pumping Control in the NCP
subsidy standard is 1500 CNY/mu in the first year and 750 CNY/mu/year from thesecond to the fifth year (altogether 4500 CNY/mu in five years). Farmers do not needany more subsidy after the five-year period.
Replacing grain crops with trees can ideally save water for irrigation of wintercrops, however the newly planted trees also need irrigation for the first few yearsbefore their roots have grown deep enough to completely rely on precipitation anddeep soil water. Farmers can expect higher income through the subsidy in the firstfew years, but the income afterwards depends both on the market price of the treesand the management and technology for pest control. In some places it was reportedthat farmers planted fruit trees (for example pear trees), which in contradiction to themeasure’s purpose require intensive irrigation. Tree planting has been implementedin Handan and Guantao, but only on a very small scale. Its contribution to closing ofthe water gap is negligible up to now.
2.2.3 Replacing Groundwater by Surface Water
Since 2014 the Central Government has funded numerous engineering projects in allpilot prefectures in Hebei Province, involving dredging of river channels, renovationof the canal system and digging pits or ponds to improve the surface water supplysystem with storage facilities. All these measures aimed at increasing the fraction ofthe cropping area, which can be irrigated by surface water.
In Hebei Province, surface water is imported mainly through three projects,the SNWT, the Yellow River diversion and the Wei River diversion (Table 2.3).The surface water imported through the SNWT Project has so far been used toreplace groundwater abstraction for households and industry in urban areas withinthe project’s reach. In this way, over 80% of the urban groundwater abstraction hasbeen eliminated by the end of 2020. Moreover, in areas with groundwater of highfluoride content and suitable local water supply networks, the imported surface waterhas been used to replace the extraction of deep confined groundwater and provide
Table 2.3 Effect of imported surface water on groundwater over-pumping control in 2014–2016
Project Year ofimplementation
Importedsurfacewater(Mio. m3)
Number ofwells closedinurban/ruralareas
Groundwaterreplaced inrural areas(Mio. m3)
Affectedpopulation/farmlandin rural area
SNWT 2014–2016 511 4964 197 4.34 Mio. Capita
YellowRiverdiversion
2014–2016 784 6898 360 3.28 Mio. Mu
Wei Riverdiversion
2014–2016 157 1649 71 0.7 Mio. Mu
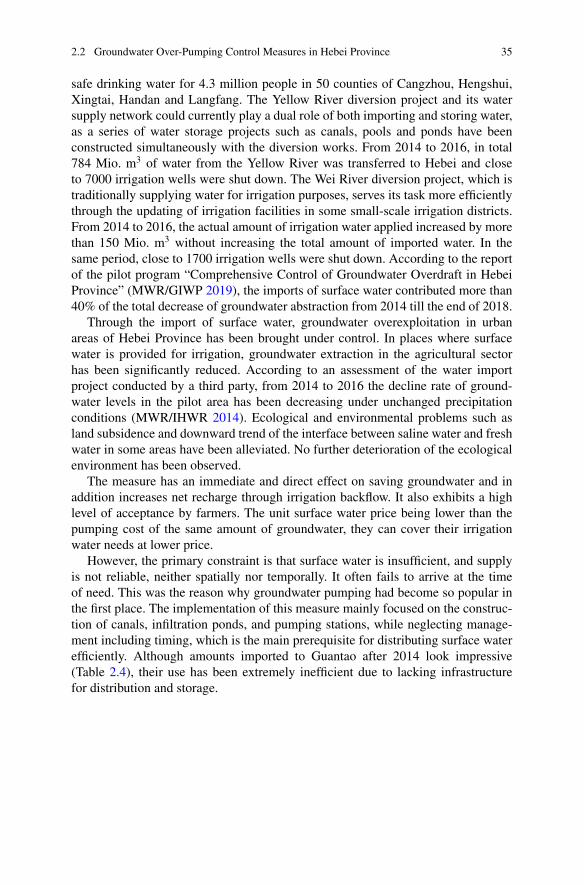
2.2 Groundwater Over-Pumping Control Measures in Hebei Province 35
safe drinking water for 4.3 million people in 50 counties of Cangzhou, Hengshui,Xingtai, Handan and Langfang. The Yellow River diversion project and its watersupply network could currently play a dual role of both importing and storing water,as a series of water storage projects such as canals, pools and ponds have beenconstructed simultaneously with the diversion works. From 2014 to 2016, in total784 Mio. m3 of water from the Yellow River was transferred to Hebei and closeto 7000 irrigation wells were shut down. The Wei River diversion project, which istraditionally supplying water for irrigation purposes, serves its task more efficientlythrough the updating of irrigation facilities in some small-scale irrigation districts.From 2014 to 2016, the actual amount of irrigation water applied increased by morethan 150 Mio. m3 without increasing the total amount of imported water. In thesame period, close to 1700 irrigation wells were shut down. According to the reportof the pilot program “Comprehensive Control of Groundwater Overdraft in HebeiProvince” (MWR/GIWP 2019), the imports of surface water contributed more than40% of the total decrease of groundwater abstraction from 2014 till the end of 2018.
Through the import of surface water, groundwater overexploitation in urbanareas of Hebei Province has been brought under control. In places where surfacewater is provided for irrigation, groundwater extraction in the agricultural sectorhas been significantly reduced. According to an assessment of the water importproject conducted by a third party, from 2014 to 2016 the decline rate of ground-water levels in the pilot area has been decreasing under unchanged precipitationconditions (MWR/IHWR 2014). Ecological and environmental problems such asland subsidence and downward trend of the interface between saline water and freshwater in some areas have been alleviated. No further deterioration of the ecologicalenvironment has been observed.
The measure has an immediate and direct effect on saving groundwater and inaddition increases net recharge through irrigation backflow. It also exhibits a highlevel of acceptance by farmers. The unit surface water price being lower than thepumping cost of the same amount of groundwater, they can cover their irrigationwater needs at lower price.
However, the primary constraint is that surface water is insufficient, and supplyis not reliable, neither spatially nor temporally. It often fails to arrive at the timeof need. This was the reason why groundwater pumping had become so popular inthe first place. The implementation of this measure mainly focused on the construc-tion of canals, infiltration ponds, and pumping stations, while neglecting manage-ment including timing, which is the main prerequisite for distributing surface waterefficiently. Although amounts imported to Guantao after 2014 look impressive(Table 2.4), their use has been extremely inefficient due to lacking infrastructurefor distribution and storage.
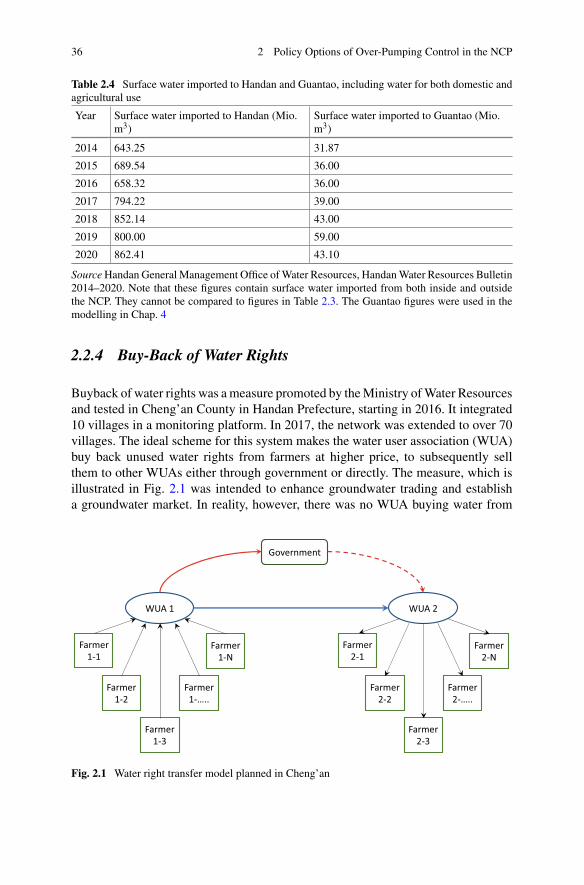
36 2 Policy Options of Over-Pumping Control in the NCP
Table 2.4 Surface water imported to Handan and Guantao, including water for both domestic andagricultural use
Year Surface water imported to Handan (Mio.m3)
Surface water imported to Guantao (Mio.m3)
2014 643.25 31.87
2015 689.54 36.00
2016 658.32 36.00
2017 794.22 39.00
2018 852.14 43.00
2019 800.00 59.00
2020 862.41 43.10
SourceHandan General Management Office ofWater Resources, HandanWater Resources Bulletin2014–2020. Note that these figures contain surface water imported from both inside and outsidethe NCP. They cannot be compared to figures in Table 2.3. The Guantao figures were used in themodelling in Chap. 4
2.2.4 Buy-Back of Water Rights
Buyback of water rights was ameasure promoted by theMinistry ofWater Resourcesand tested in Cheng’an County in Handan Prefecture, starting in 2016. It integrated10 villages in a monitoring platform. In 2017, the network was extended to over 70villages. The ideal scheme for this system makes the water user association (WUA)buy back unused water rights from farmers at higher price, to subsequently sellthem to other WUAs either through government or directly. The measure, which isillustrated in Fig. 2.1 was intended to enhance groundwater trading and establisha groundwater market. In reality, however, there was no WUA buying water from
Government
WUA 2
Farmer 2-N
Farmer 2-2
Farmer 2-…..
Farmer 2-3
Farmer 2-1
WUA 1
Farmer 1-N
Farmer 1-2
Farmer 1-…..
Farmer 1-3
Farmer 1-1
Fig. 2.1 Water right transfer model planned in Cheng’an
2.2 Groundwater Over-Pumping Control Measures in Hebei Province 37
another WUA. The government had to buy back the water rights at CNY 0.2 per m3.Farmers may trade informally among themselves, but they do not trade through thenetwork in order to avoid the higher water price.
A positive outcome is that farmers’ consciousness of water saving has beenimproved, once they got to know that saved water can be sold. Water sold to a WUAis not used as it is not traded to anotherWUA, which implies real water saving.Watertrading, on the other hand, only increases water value. While it may incentivize indi-vidual farmers to save water on their own field, it will not reduce regional pumpingas the traded water will also be used, only by users who can pay more.
The system in Cheng’an County had to be abandoned after a couple of years oftrial due to lack of adequate and stable government repurchasing funds. Only 100,000CNY available from the provincial government in 2016, were not enough to satisfythe sellers’ demand in 2017, which was so high that government had to suspend thebuy-back. A large number of informal water rights transactions exists within farmneighborhoods, who do not bother to go through the trouble of using the formal waterrights market for the small amount of water rights they can trade. There is no high-value-added agriculture or local industry water user who can buy additional waterrights at higher price from the government. Such users, however, have proven to be animportant prerequisite for a successful water market as established in NorthwesternChina.
2.2.5 “Increase Price and Provide Subsidy”
As part of the agricultural water pricing reform actions, “Increase price and providesubsidy” has been practiced in 14 counties in Hengshui prefecture, but not in Handanand the other two pilot prefectures. The mechanism of the reform measure is illus-trated in Fig. 2.2. The water fee is charged to the farmers every month by their wellmanagers by increasing the electricity price from 0.65 to 0.95 CNY/kWh. The priceincrease of 0.30 CNY/kWh together with an additional subsidy of 0.15 CNY/kWhfrom local government is collected in an account managed by the Water User Asso-ciation of the village. These funds are paid back to farmers according to their watersaving performance twice a year in order to give an incentive for water saving whileguaranteeing that farmers’ income is not affected by the additional water fee.
The field research in one of the pilot districts in Hengshui, Taocheng District,showed that the local farmers’ groundwater use for irrigating wheat and cottondecreased by 21% each. However, if no subsidies were granted, half of the region’sfarmers would lose money due to the increased electricity/water price. However,with the subsidy most farmers in the pilot villages were able to even earn some extramoney (Wang et al. 2016). In another pilot site, Anping County, the scheme was lesssuccessful: 33 villages conducted the reform in 2017 and many of them abandonedthe scheme in 2018. There was no obvious water-saving effect. The local governmentjust wanted to accomplish the task given by the higher government level of makinga reform, without the determination to have a real reform.
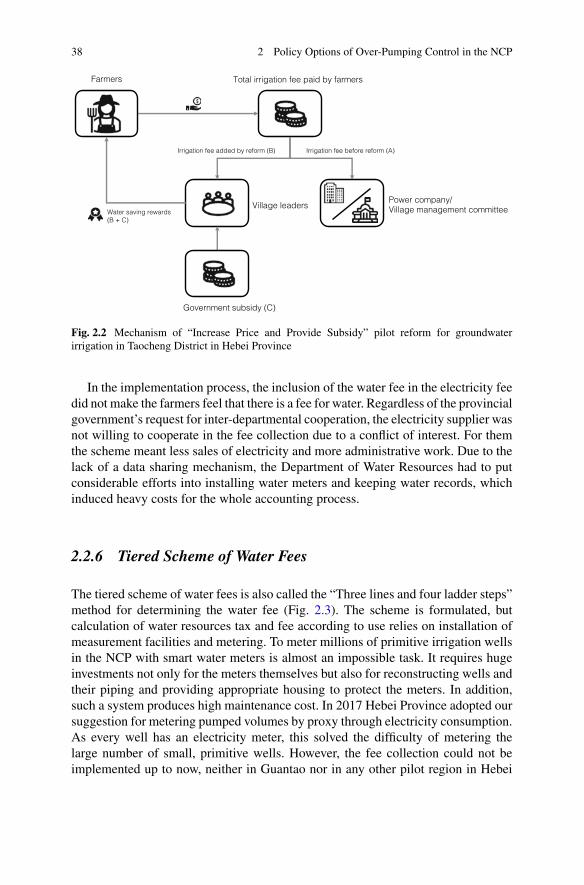
38 2 Policy Options of Over-Pumping Control in the NCP
Total irrigation fee paid by farmers
Irrigation fee added by reform (B) Irrigation fee before reform (A)
Village leaders
Farmers
Government subsidy (C)
Power company/Village management committeeWater saving rewards
(B + C)
Fig. 2.2 Mechanism of “Increase Price and Provide Subsidy” pilot reform for groundwaterirrigation in Taocheng District in Hebei Province
In the implementation process, the inclusion of the water fee in the electricity feedid not make the farmers feel that there is a fee for water. Regardless of the provincialgovernment’s request for inter-departmental cooperation, the electricity supplier wasnot willing to cooperate in the fee collection due to a conflict of interest. For themthe scheme meant less sales of electricity and more administrative work. Due to thelack of a data sharing mechanism, the Department of Water Resources had to putconsiderable efforts into installing water meters and keeping water records, whichinduced heavy costs for the whole accounting process.
2.2.6 Tiered Scheme of Water Fees
The tiered scheme of water fees is also called the “Three lines and four ladder steps”method for determining the water fee (Fig. 2.3). The scheme is formulated, butcalculation of water resources tax and fee according to use relies on installation ofmeasurement facilities and metering. To meter millions of primitive irrigation wellsin the NCP with smart water meters is almost an impossible task. It requires hugeinvestments not only for the meters themselves but also for reconstructing wells andtheir piping and providing appropriate housing to protect the meters. In addition,such a system produces high maintenance cost. In 2017 Hebei Province adopted oursuggestion for metering pumped volumes by proxy through electricity consumption.As every well has an electricity meter, this solved the difficulty of metering thelarge number of small, primitive wells. However, the fee collection could not beimplemented up to now, neither in Guantao nor in any other pilot region in Hebei
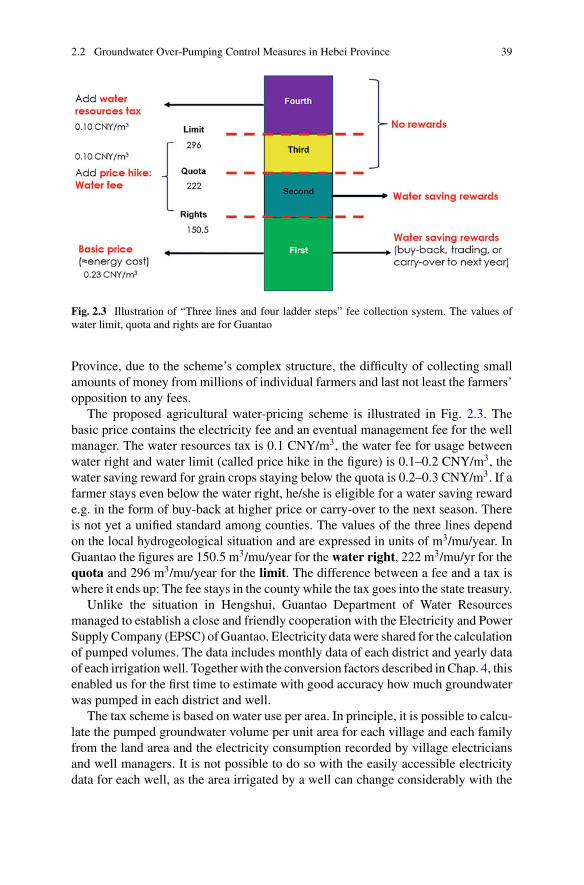
2.2 Groundwater Over-Pumping Control Measures in Hebei Province 39
Fig. 2.3 Illustration of “Three lines and four ladder steps” fee collection system. The values ofwater limit, quota and rights are for Guantao
Province, due to the scheme’s complex structure, the difficulty of collecting smallamounts of money frommillions of individual farmers and last not least the farmers’opposition to any fees.
The proposed agricultural water-pricing scheme is illustrated in Fig. 2.3. Thebasic price contains the electricity fee and an eventual management fee for the wellmanager. The water resources tax is 0.1 CNY/m3, the water fee for usage betweenwater right and water limit (called price hike in the figure) is 0.1–0.2 CNY/m3, thewater saving reward for grain crops staying below the quota is 0.2–0.3 CNY/m3. If afarmer stays even below the water right, he/she is eligible for a water saving rewarde.g. in the form of buy-back at higher price or carry-over to the next season. Thereis not yet a unified standard among counties. The values of the three lines dependon the local hydrogeological situation and are expressed in units of m3/mu/year. InGuantao the figures are 150.5 m3/mu/year for the water right, 222 m3/mu/yr for thequota and 296 m3/mu/year for the limit. The difference between a fee and a tax iswhere it ends up: The fee stays in the county while the tax goes into the state treasury.
Unlike the situation in Hengshui, Guantao Department of Water Resourcesmanaged to establish a close and friendly cooperation with the Electricity and PowerSupply Company (EPSC) of Guantao. Electricity data were shared for the calculationof pumped volumes. The data includes monthly data of each district and yearly dataof each irrigationwell. Together with the conversion factors described in Chap. 4, thisenabled us for the first time to estimate with good accuracy how much groundwaterwas pumped in each district and well.
The tax scheme is based on water use per area. In principle, it is possible to calcu-late the pumped groundwater volume per unit area for each village and each familyfrom the land area and the electricity consumption recorded by village electriciansand well managers. It is not possible to do so with the easily accessible electricitydata for each well, as the area irrigated by a well can change considerably with the
40 2 Policy Options of Over-Pumping Control in the NCP
season and from year to year. The flexibility is made possible by the undergroundpiping infrastructure created since the World-Bank-financed GEF project.
DWR is responsible for calculating each well’s specific water use. Since 2017,they report every well surpassing the limit to the tax department, which in turn isresponsible for collecting the tax. Although water tax has been due for a numberof wells, the tax department did not collect the tax, the amount generated in theirrigation sector being minor compared to the cost of organizing the tax collection.Water tax has, however, been collected from industrial users since 2016.
Water fees for wells surpassing the quota have been calculated by DWR, but feeswere not collected due to farmers’ opposition. Moreover, present fees for water useabove the quota are too low to make an impact. On average, no township exceedsthe limit of 294 m3/mu/year relevant for taxing. Average water use of the county as awhole does not exceed the quota of 222 m3/mu/year. In townships with exceedanceof the quota, the amounts are between 20 and 50 m3/mu/year, the fee for whichwould amount to insignificant 2–5 CNY/mu/yr. Only greenhouse farmers will havehigher water fees, which they, however, can easily pay due to higher profits fromtheir cultures. It has been suggested that present fees should be low to introduce thesystem smoothly. Once it is in place, fees can be increased. Only if fees lead to watersaving, they are justified. If they have no effect on water use, they should either beincreased to a level inducing water saving or be abandoned.
The option of automatic smart water metering was tried out in an experiment,collecting the water fee directly via smart cards, but the investment and maintenancecosts were both exceedingly high compared to the fees collected. Most meters werebroken within a couple of years of installation.
The fee according to the current scheme can only be calculated at the end of theirrigation season, involving all surface and groundwater use. By that time, mistakesof the past season can no longer be corrected. A price solutionmay have an immediateeffect on farmers’ irrigation practice. In addition, a price solution does not requirethe knowledge of the area irrigated by each well. We therefore proposed a directcollection of water fees together with and proportional to the electricity fees. Thiswould make an extra collection system for water fees obsolete. Up to now, GuantaoEPSC is not willing to provide this service. The water fee collection system haspromoted the consciousness among farmers that water is a valuable resource, butlacking the implementation in practice, it does not unfold its potential to promotewater saving.
When choosing the water price solution, the water price (added to present elec-tricity cost) should be at a level equal to farmers’ marginal earnings from agricul-tural production. For example, if marginal earnings in planting wheat amount to 100CNY/mu and 160 m3/mu/year are required for irrigation that means the water priceshould be at least 0.6 CNY/m3. At that level, farmers on the margin would abandonwheat planting.
2.2 Groundwater Over-Pumping Control Measures in Hebei Province 41
2.2.7 Import of Surface Water Versus Water Savingand Change of Cropping Structure
In 2019 the State Council approved the “Integrated action plan for groundwateroverdraft control inNorthChinaPlain” (or in short form:ActionPlan 2019). This planlists 18main control actions grouped in four categories of instruments. It is hoped thatthese allow to reach the target of reducing annual groundwater exploitation by 2.57Bio. m3/year (or about 70% of the remaining annual groundwater over-exploitation)in Beijing, Tianjin, and Hebei (BTH) region by 2022. Note that in this action planthe already existing annual surface water imports to BTH region are not included. In2018 they reached a total of 4.5 Bio. m3/year, basically eliminating the over-pumpingin Beijing and Tianjin.
The Action Plan 2019 lists the measures to be implemented in BTH region by2022 to further reduce groundwater pumping. They include water saving, changein cropping structure, and replacement of groundwater by surface water importedfrom the SNWT, the Yellow River and other local water resources. The targetedreductions of groundwater pumping each measure can achieve are listed in Table2.5. The long-term goal is to eliminate over-pumping completely by 2035.
The main measures recommended in the Action Plan 2019 are the ones, whichhave proven to be effective in the pilot projects. Figure 2.4 lists the implementationprogress in 2019 in terms of the main measures of the Action Plan 2019. To appre-ciate the tasks, a few comments are helpful. A reduction of pumping by 0.24 Bio.m3/year through water saving measures on 4.17 Mio. mu of farmland is ambitious.It averages to a saving of 57.6 m3/mu/year, which is equivalent to the amount of asingle irrigation event and probably overestimates the water saving capacity for graincrops. For greenhouses, savings of this order of magnitude are feasible through dripirrigation. Cropping structure change is mainly implemented through winter wheatfallowing and could save 0.60 Bio. m3/year through fallowing of 4.85 Mio. mu (or0.32 Mio. ha) by 2022. This amounts to 13.6% of the wheat planting area of Hebei(2.36 Mio. ha in 2018 according to China’s Statistical Yearbook) and might be diffi-cult to achieve. Importing surface water seems less difficult to accomplish. Using itto replace groundwater in irrigation still poses problems: The farmland infrastruc-ture, which is mainly based on groundwater irrigation, is not yet capable to receivesuch large amounts of surface water. The canal system is insufficient as are storagefacilities, which would allow to match the timing of surface water imports to theirrigation calendar. This is also the reason why a large percentage of surface waterimports accomplished by the end of 2019 (3.49 Bio. m3 out of 8 Bio. m3 shown inFig. 2.4) could only be used for artificial groundwater recharge through rivers andlakes. Note that the progress in the first two measures shown in Fig. 2.4 is expressedin area equipped. While the bars for the accomplished task look longer for watersaving than for change of cropping structure, the corresponding amounts of watersaved are clearly larger for the second item.
The groundwater saving capacity added through the newly implementedmeasuresin BTH area in 2019 is shown in Fig. 2.5. In total, only an additional 0.67 Bio. m3 of
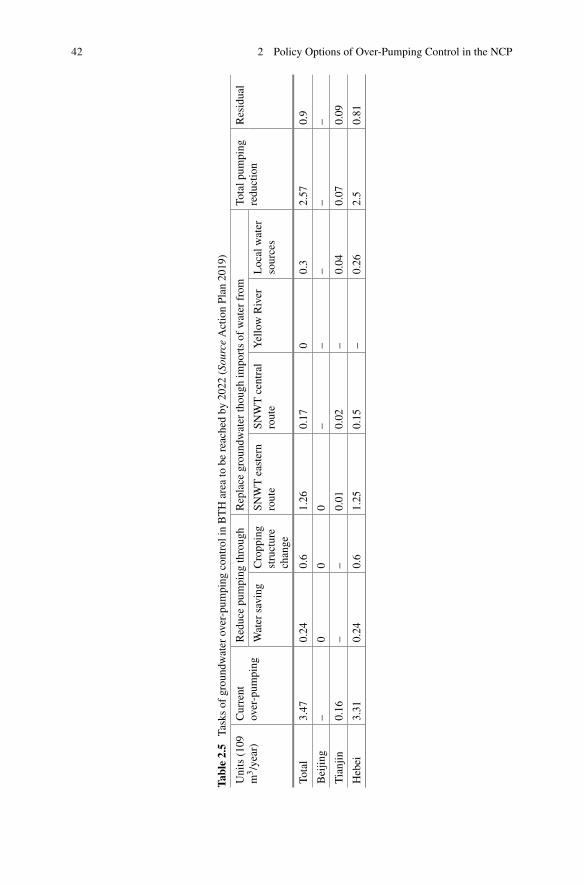
42 2 Policy Options of Over-Pumping Control in the NCP
Table2.5
Tasksof
groundwater
over-pum
ping
controlinBTHarea
tobe
reachedby
2022
(SourceActionPlan
2019)
Units(109
m3/year)
Current
over-pum
ping
Reducepumping
through
Replace
groundwater
though
importsof
water
from
Totalp
umping
reduction
Residual
Water
saving
Cropping
structure
change
SNWTeastern
route
SNWTcentral
route
YellowRiver
Localwater
sources
Total
3.47
0.24
0.6
1.26
0.17
00.3
2.57
0.9
Beijin
g–
00
0–
––
––
Tianjin
0.16
––
0.01
0.02
–0.04
0.07
0.09
Hebei
3.31
0.24
0.6
1.25
0.15
–0.26
2.5
0.81
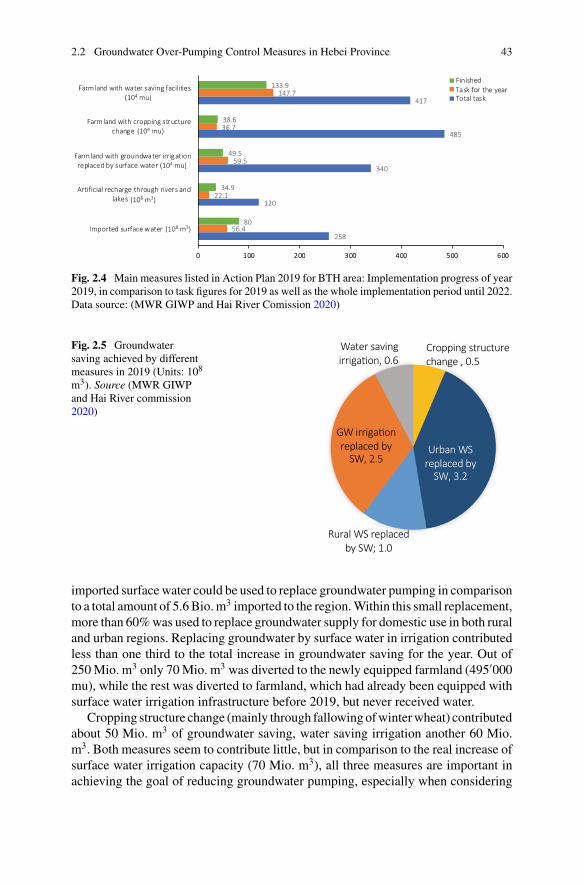
2.2 Groundwater Over-Pumping Control Measures in Hebei Province 43
Fig. 2.4 Main measures listed in Action Plan 2019 for BTH area: Implementation progress of year2019, in comparison to task figures for 2019 as well as the whole implementation period until 2022.Data source: (MWR GIWP and Hai River Comission 2020)
Fig. 2.5 Groundwatersaving achieved by differentmeasures in 2019 (Units: 108
m3). Source (MWR GIWPand Hai River commission2020)
Cropping structure change , 0.5
Urban WS replaced by
SW, 3.2
Rural WS replaced by SW; 1.0
GW irriga�on replaced by
SW, 2.5
Water saving irriga�on, 0.6
imported surfacewater could be used to replace groundwater pumping in comparisonto a total amount of 5.6Bio.m3 imported to the region.Within this small replacement,more than 60%was used to replace groundwater supply for domestic use in both ruraland urban regions. Replacing groundwater by surface water in irrigation contributedless than one third to the total increase in groundwater saving for the year. Out of250Mio. m3 only 70Mio. m3 was diverted to the newly equipped farmland (495′000mu), while the rest was diverted to farmland, which had already been equipped withsurface water irrigation infrastructure before 2019, but never received water.
Cropping structure change (mainly through fallowingofwinterwheat) contributedabout 50 Mio. m3 of groundwater saving, water saving irrigation another 60 Mio.m3. Both measures seem to contribute little, but in comparison to the real increase ofsurface water irrigation capacity (70 Mio. m3), all three measures are important inachieving the goal of reducing groundwater pumping, especially when considering
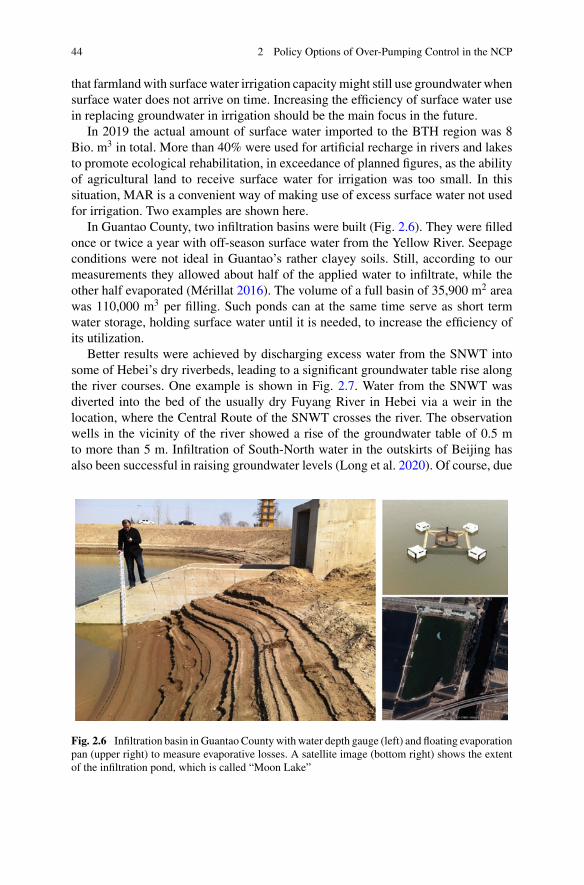
44 2 Policy Options of Over-Pumping Control in the NCP
that farmlandwith surfacewater irrigation capacitymight still use groundwater whensurface water does not arrive on time. Increasing the efficiency of surface water usein replacing groundwater in irrigation should be the main focus in the future.
In 2019 the actual amount of surface water imported to the BTH region was 8Bio. m3 in total. More than 40% were used for artificial recharge in rivers and lakesto promote ecological rehabilitation, in exceedance of planned figures, as the abilityof agricultural land to receive surface water for irrigation was too small. In thissituation, MAR is a convenient way of making use of excess surface water not usedfor irrigation. Two examples are shown here.
In Guantao County, two infiltration basins were built (Fig. 2.6). They were filledonce or twice a year with off-season surface water from the Yellow River. Seepageconditions were not ideal in Guantao’s rather clayey soils. Still, according to ourmeasurements they allowed about half of the applied water to infiltrate, while theother half evaporated (Mérillat 2016). The volume of a full basin of 35,900 m2 areawas 110,000 m3 per filling. Such ponds can at the same time serve as short termwater storage, holding surface water until it is needed, to increase the efficiency ofits utilization.
Better results were achieved by discharging excess water from the SNWT intosome of Hebei’s dry riverbeds, leading to a significant groundwater table rise alongthe river courses. One example is shown in Fig. 2.7. Water from the SNWT wasdiverted into the bed of the usually dry Fuyang River in Hebei via a weir in thelocation, where the Central Route of the SNWT crosses the river. The observationwells in the vicinity of the river showed a rise of the groundwater table of 0.5 mto more than 5 m. Infiltration of South-North water in the outskirts of Beijing hasalso been successful in raising groundwater levels (Long et al. 2020). Of course, due
Fig. 2.6 Infiltration basin in Guantao Countywith water depth gauge (left) and floating evaporationpan (upper right) to measure evaporative losses. A satellite image (bottom right) shows the extentof the infiltration pond, which is called “Moon Lake”
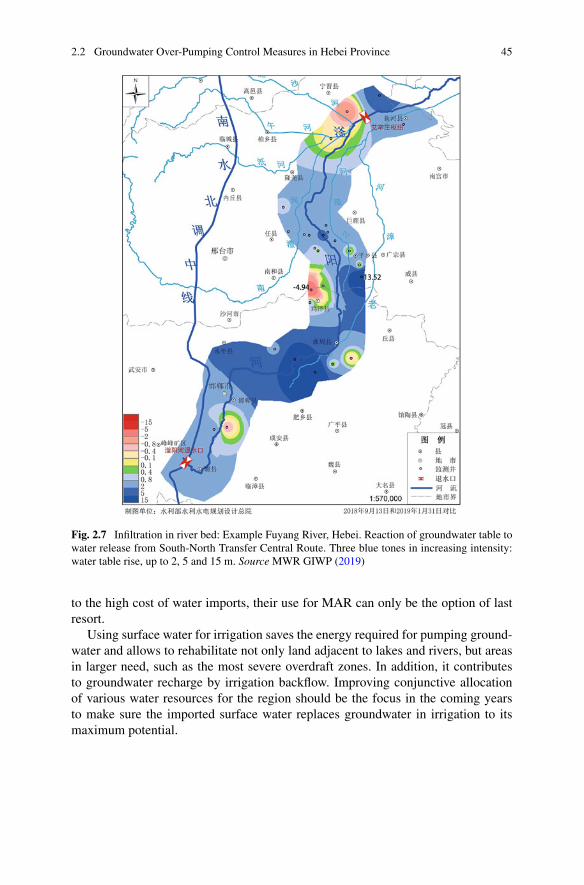
2.2 Groundwater Over-Pumping Control Measures in Hebei Province 45
Fig. 2.7 Infiltration in river bed: Example Fuyang River, Hebei. Reaction of groundwater table towater release from South-North Transfer Central Route. Three blue tones in increasing intensity:water table rise, up to 2, 5 and 15 m. Source MWR GIWP (2019)
to the high cost of water imports, their use for MAR can only be the option of lastresort.
Using surface water for irrigation saves the energy required for pumping ground-water and allows to rehabilitate not only land adjacent to lakes and rivers, but areasin larger need, such as the most severe overdraft zones. In addition, it contributesto groundwater recharge by irrigation backflow. Improving conjunctive allocationof various water resources for the region should be the focus in the coming yearsto make sure the imported surface water replaces groundwater in irrigation to itsmaximum potential.
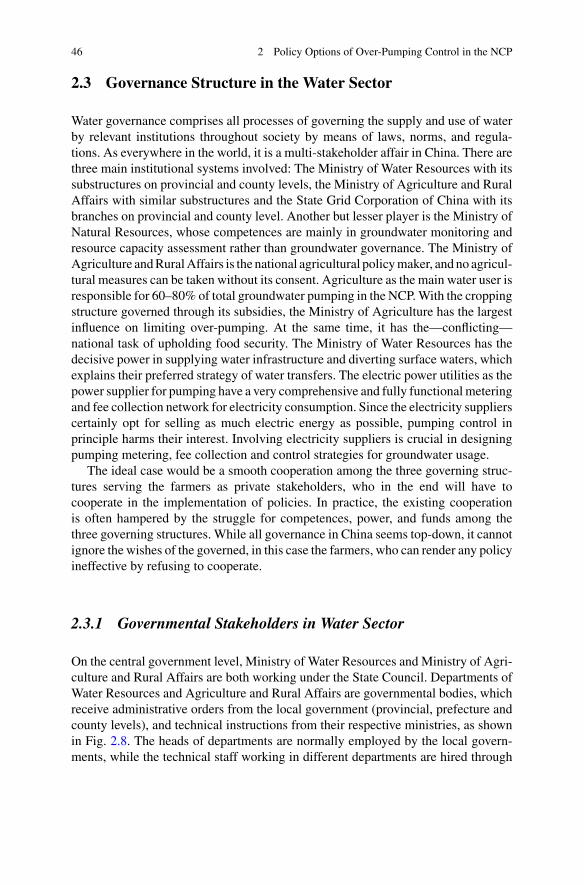
46 2 Policy Options of Over-Pumping Control in the NCP
2.3 Governance Structure in the Water Sector
Water governance comprises all processes of governing the supply and use of waterby relevant institutions throughout society by means of laws, norms, and regula-tions. As everywhere in the world, it is a multi-stakeholder affair in China. There arethree main institutional systems involved: The Ministry of Water Resources with itssubstructures on provincial and county levels, the Ministry of Agriculture and RuralAffairs with similar substructures and the State Grid Corporation of China with itsbranches on provincial and county level. Another but lesser player is the Ministry ofNatural Resources, whose competences are mainly in groundwater monitoring andresource capacity assessment rather than groundwater governance. The Ministry ofAgriculture andRuralAffairs is the national agricultural policymaker, and no agricul-tural measures can be taken without its consent. Agriculture as the main water user isresponsible for 60–80% of total groundwater pumping in the NCP.With the croppingstructure governed through its subsidies, the Ministry of Agriculture has the largestinfluence on limiting over-pumping. At the same time, it has the—conflicting—national task of upholding food security. The Ministry of Water Resources has thedecisive power in supplying water infrastructure and diverting surface waters, whichexplains their preferred strategy of water transfers. The electric power utilities as thepower supplier for pumping have a very comprehensive and fully functionalmeteringand fee collection network for electricity consumption. Since the electricity supplierscertainly opt for selling as much electric energy as possible, pumping control inprinciple harms their interest. Involving electricity suppliers is crucial in designingpumping metering, fee collection and control strategies for groundwater usage.
The ideal case would be a smooth cooperation among the three governing struc-tures serving the farmers as private stakeholders, who in the end will have tocooperate in the implementation of policies. In practice, the existing cooperationis often hampered by the struggle for competences, power, and funds among thethree governing structures. While all governance in China seems top-down, it cannotignore the wishes of the governed, in this case the farmers, who can render any policyineffective by refusing to cooperate.
2.3.1 Governmental Stakeholders in Water Sector
On the central government level, Ministry of Water Resources and Ministry of Agri-culture and Rural Affairs are both working under the State Council. Departments ofWater Resources and Agriculture and Rural Affairs are governmental bodies, whichreceive administrative orders from the local government (provincial, prefecture andcounty levels), and technical instructions from their respective ministries, as shownin Fig. 2.8. The heads of departments are normally employed by the local govern-ments, while the technical staff working in different departments are hired through
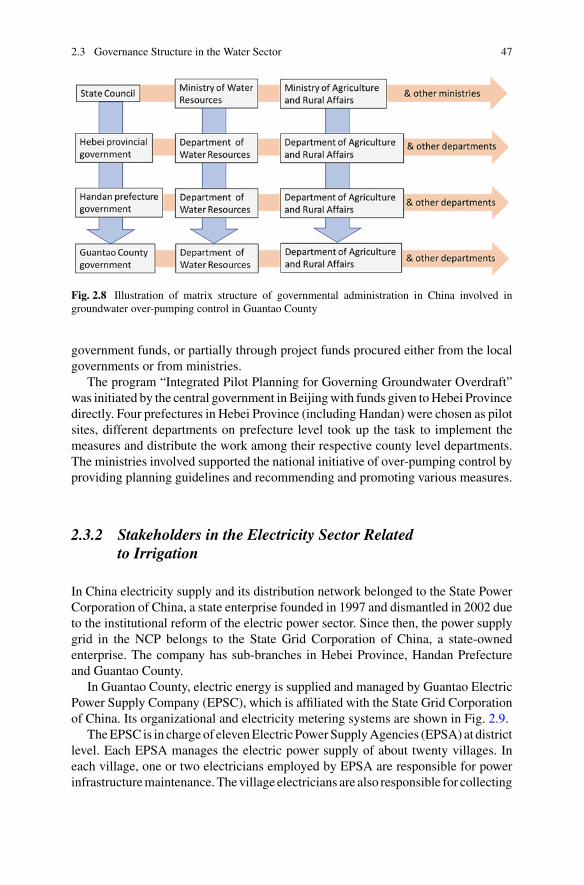
2.3 Governance Structure in the Water Sector 47
Fig. 2.8 Illustration of matrix structure of governmental administration in China involved ingroundwater over-pumping control in Guantao County
government funds, or partially through project funds procured either from the localgovernments or from ministries.
The program “Integrated Pilot Planning for Governing Groundwater Overdraft”was initiated by the central government in Beijingwith funds given toHebei Provincedirectly. Four prefectures in Hebei Province (including Handan) were chosen as pilotsites, different departments on prefecture level took up the task to implement themeasures and distribute the work among their respective county level departments.The ministries involved supported the national initiative of over-pumping control byproviding planning guidelines and recommending and promoting various measures.
2.3.2 Stakeholders in the Electricity Sector Relatedto Irrigation
In China electricity supply and its distribution network belonged to the State PowerCorporation of China, a state enterprise founded in 1997 and dismantled in 2002 dueto the institutional reform of the electric power sector. Since then, the power supplygrid in the NCP belongs to the State Grid Corporation of China, a state-ownedenterprise. The company has sub-branches in Hebei Province, Handan Prefectureand Guantao County.
In Guantao County, electric energy is supplied and managed by Guantao ElectricPower Supply Company (EPSC), which is affiliated with the State Grid Corporationof China. Its organizational and electricity metering systems are shown in Fig. 2.9.
TheEPSC is in chargeof elevenElectric PowerSupplyAgencies (EPSA) at districtlevel. Each EPSA manages the electric power supply of about twenty villages. Ineach village, one or two electricians employed by EPSA are responsible for powerinfrastructuremaintenance.Thevillage electricians are also responsible for collecting
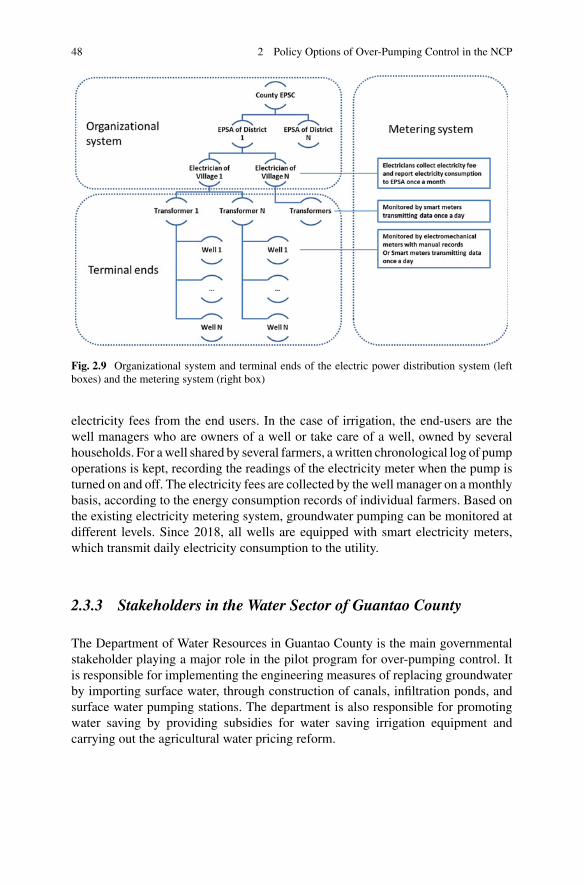
48 2 Policy Options of Over-Pumping Control in the NCP
Fig. 2.9 Organizational system and terminal ends of the electric power distribution system (leftboxes) and the metering system (right box)
electricity fees from the end users. In the case of irrigation, the end-users are thewell managers who are owners of a well or take care of a well, owned by severalhouseholds. For awell shared by several farmers, awritten chronological log of pumpoperations is kept, recording the readings of the electricity meter when the pump isturned on and off. The electricity fees are collected by the well manager on amonthlybasis, according to the energy consumption records of individual farmers. Based onthe existing electricity metering system, groundwater pumping can be monitored atdifferent levels. Since 2018, all wells are equipped with smart electricity meters,which transmit daily electricity consumption to the utility.
2.3.3 Stakeholders in the Water Sector of Guantao County
The Department of Water Resources in Guantao County is the main governmentalstakeholder playing a major role in the pilot program for over-pumping control. Itis responsible for implementing the engineering measures of replacing groundwaterby importing surface water, through construction of canals, infiltration ponds, andsurface water pumping stations. The department is also responsible for promotingwater saving by providing subsidies for water saving irrigation equipment andcarrying out the agricultural water pricing reform.
2.3 Governance Structure in the Water Sector 49
On one hand, theDepartment ofWater Resources inGuantaomade a huge effort toset up metering and fee collection for imported surface water. However, for ground-water pumping control, which involves individual farm households, they have to relyon the village administration. In 2007, a World Bank project tried to set up WaterUser Associations (WUA) in each village. Due to China’s strict control of the numberof non-governmental organizations within a county, eventually a WUA was set upin Guantao as one organization for the whole county, each village’s WUA being asub-branch of it. The village WUA therefore normally only comprises the villageleaders and part of the village administration, receiving governmental orders insteadof being the bottom-up initiative, as which it is known outside of China.
In recent years after our strong recommendation and also due to the fact thatgroundwater pumping has to be metered through pumping electricity, most of thevillages have integrated the village electricians as members into the WUAs. Ascontract employees of Guantao EPSC, village electricians are paid to collect elec-tricity fees from well managers, who themselves receive an additional irrigationservice fee from the well users according to the amount of pumping. The govern-mentally organized WUAs, however, exist in name only. They do not receive anyfunding, neither from villagers nor from the government. Therefore, their possiblyvery useful function in collecting water fees cannot be realized so far.
References
Calow RC, Howarth SE, Wang J (2009) Irrigation development and water rights reform in China.Int J Water Resour Dev 25(2):227–248. https://doi.org/10.1080/07900620902868653
Debaere P, Richter B, Davis K, Duvall M, Gephart, J, O’Bannon, et al. (2014). Water markets as aresponse to scarcity. Water Policy 16(4):625–649.https://doi.org/10.2166/wp.2014.165
Etchells T, Malano H, McMahon T (2006) Overcoming third party effects from water trading in theMurray-Darling Basin. Water Policy 8:69–80. https://doi.org/10.2166/wp.2006.0005
Frija A, Dhehibi B, Chebil A, Villholth KG (2015) Performance evaluation of groundwater manage-ment instruments: The case of irrigation sector in Tunisia. Groundw Sustain Dev 1:23–32. https://doi.org/10.1016/j.gsd.2015.12.001
Heaney A, Hafi A, Beare S, Wang J (2005) Water reallocation in Northern China: towards more-formal markets for water. In: Willet IR, Gao Z (eds) Agricultural water management in China.Australian Center for International Agricultural Research, pp 130–141
Howe C, Schurmeier D, ShawW (1986) Innovative approaches to water allocation: the potential forwater markets. Water Resour Res 22(4):439–445. https://doi.org/10.1029/WR022i004p00439
Huang Q, Wang J, Rozelle S, Polasky S, Liu Y (2013) The effects of well management and thenature of the aquifer on groundwater resources. Am J Agr Econ 95(1):94–116. https://doi.org/10.1093/ajae/aas076
Johansson R, Tsur Y, Roe T, Doukkali R, Dinar A (2002) Pricing irrigation water: a review of theoryand practice. Water Policy 4:173–199. https://doi.org/10.1016/S1366-7017(02)00026-0
KemperKE (2007) Instruments and institutions for groundwatermanagement. In: GiordanoM,Vill-holthKG (eds) The agricultural groundwater revolution: opportunities and threats to development.CABI, Wallingford, pp 153–172
Lewis D, Zheng H (2018) How could water markets like Australia’s work in China? Int J WaterResour Manag 34(3):1–21. https://doi.org/10.1080/07900627.2018.1457514
50 2 Policy Options of Over-Pumping Control in the NCP
LongD, YangW, Scanlon BR, Zhao J, Liu D, Burek P, PanY, You L,WadaY (2020) South-to-NorthWater Diversion stabilizing Beijing’s groundwater levels. Nat Commun 11:3665https://doi.org/10.1038/s41467-020-17428-6
Mérillat A (2016). Estimation of the infiltration rate from an artificial lake in Guantao County,China. Master thesis, Institute of Environmental Engineering, ETH Zurich.
Moore S (2015). The development of water markets in China: progress, peril, and prospects. WaterPolicy, 17(2). https://doi.org/10.2166/wp.2014.063
MWR (2010). Technical Code for Water Wells. Published byMinistry of Housing and Urban-RuralDevelopment and State Administration for Quality Supervision and Inspection and Quarantine.
MWR/IWHR (2014). The third-party evaluation report on the pilot project of comprehensivegroundwater overexploitation control in Hebei Province. Report of IWHR (in Chinese).
MWR/GIWP (2019). Comprehensive Control of Groundwater Overdraft in Hebei Province. Reportof GIWP (in Chinese).
MWRGIWP (2019). Final evaluation report on pilot project of artificial recharge through rivers andlakes of integrated action plan for groundwater overdraft control in North China Plain. Report ofthe GIWP (in Chinese).
MWR GIWP and Hai River Commission (2020). The summary and evaluation report of integratedaction plan for groundwater overdraft control in North China Plain in 2019. Report of the GIWP(in Chinese).
ShenD (2015)Groundwatermanagement inChina.Water Policy 17:61–82. https://doi.org/10.2166/wp.2014.135
Speed R (2009) A comparison of water rights systems in China and Australia. Int J Water ResourDev 25(2):389–405. https://doi.org/10.1080/07900620902868901
State Council (2012). Opinions on the implementation of the strictest water resources managementsystem. Retrieved from http://www.gov.cn/zwgk/2012-02/16/content_2067664.htm
Sun T, Wang J, Huang Q, Li Y (2016) Assessment of water rights and irrigation pricing reforms inHeihe River Basin in China. Water 8(3338). https://doi.org/10.3390/w8080333
Wang J, Zhang L, Huang J (2016) How could we realize a win–win strategy on irrigation pricepolicy? Evaluation of a pilot reform project in Hebei Province, China. J Hydrol 539:379–391.https://doi.org/10.1016/j.jhydrol.2016.05.036
Wang J, Li Y, Huang J, Yan T, Sun T (2017) Growing water scarcity, food security and governmentresponses in China. Glob Food Secur - Agric Policy Environ 14:9–17. https://doi.org/10.1016/j.gfs.2017.01.003
Wang J, Jiang Y, Wang H, Huang Q, Deng H (2020) Groundwater irrigation and management innorthern China: status, trends, and challenges. Int J Water Resour Dev 36(4):670–696. https://doi.org/10.1080/07900627.2019.1584094
Wang J, Zhu Y, Sun T, Huang J, Zhang L, Guan B, Huang Q (2020) Forty years of irrigationdevelopment and reform in China. Aust J Agric Resour Econ 64(1):126–149. https://doi.org/10.1111/1467-8489.12334
Yu X, Geng Y, Heck P, Xue B (2015) A review of China’s water management. Sustainability7:5773–5792. https://doi.org/10.3390/su7055773

References 51
Open Access This chapter is licensed under the terms of the Creative Commons Attribution 4.0International License (http://creativecommons.org/licenses/by/4.0/), which permits use, sharing,adaptation, distribution and reproduction in any medium or format, as long as you give appropriatecredit to the original author(s) and the source, provide a link to the Creative Commons license andindicate if changes were made.
The images or other third party material in this chapter are included in the chapter’s CreativeCommons license, unless indicated otherwise in a credit line to the material. If material is notincluded in the chapter’s Creative Commons license and your intended use is not permitted bystatutory regulation or exceeds the permitted use, you will need to obtain permission directly fromthe copyright holder.
Chapter 3Cropping Choices and Farmers’ Options
Irrigation being the main cause of aquifer depletion, agriculture is the first candidateto contribute to its solution. Options of agricultural planting structure in Beijing-Tianjin-Hebei region are analyzed using various planting scenarios. The analysisshows that when addressing only the region’s self-sufficiency in food, planted areacan be reduced by 26%, eradicating over-pumping but decreasing farmers’ revenueby 50%.No realistic agricultural strategy can eliminate over-pumping inNorth ChinaPlain without water transfers from the South. Farmers’ reaction to policies plays animportant role regarding their efficiency. The implementation status and effects ofseasonal land fallowing in Hebei Province were evaluated in a field survey of 560farm households showing that the subsidy is welcome, and farmers are eager toparticipate in the program. However, more than half of the farmers will go back towinter wheat growing if the subsidy is decreased or discontinued. The groundwatergame “Save theWater” was played with farmers in Guantao. Results showed that thefarmers are not so much led by profit optimization as by customs and inertia againstchange. They, however, reacted strongly to the visualized decline of groundwaterlevels, which indicates that appropriate information may induce behavioral change.
Electronic supplementary material The online version of this chapter(https://doi.org/10.1007/978-981-16-5843-3_3) contains supplementary material, which isavailable to authorized users.
© The Author(s) 2022W. Kinzelbach et al., Groundwater Overexploitation in the North China Plain:A path to Sustainability, Springer Water,https://doi.org/10.1007/978-981-16-5843-3_3
53
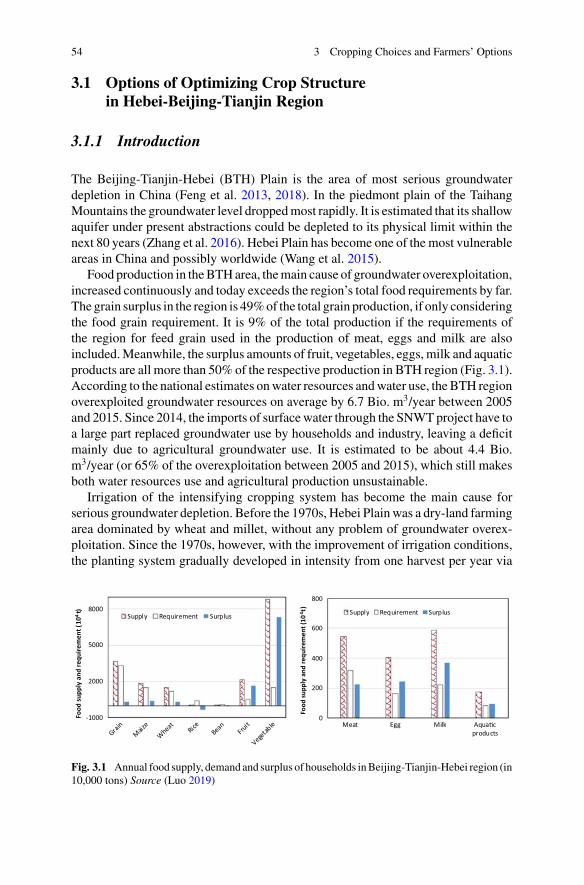
54 3 Cropping Choices and Farmers’ Options
3.1 Options of Optimizing Crop Structurein Hebei-Beijing-Tianjin Region
3.1.1 Introduction
The Beijing-Tianjin-Hebei (BTH) Plain is the area of most serious groundwaterdepletion in China (Feng et al. 2013, 2018). In the piedmont plain of the TaihangMountains the groundwater level droppedmost rapidly. It is estimated that its shallowaquifer under present abstractions could be depleted to its physical limit within thenext 80 years (Zhang et al. 2016). Hebei Plain has become one of the most vulnerableareas in China and possibly worldwide (Wang et al. 2015).
Food production in theBTHarea, themain cause of groundwater overexploitation,increased continuously and today exceeds the region’s total food requirements by far.The grain surplus in the region is 49%of the total grain production, if only consideringthe food grain requirement. It is 9% of the total production if the requirements ofthe region for feed grain used in the production of meat, eggs and milk are alsoincluded.Meanwhile, the surplus amounts of fruit, vegetables, eggs, milk and aquaticproducts are all more than 50% of the respective production in BTH region (Fig. 3.1).According to the national estimates onwater resources andwater use, the BTH regionoverexploited groundwater resources on average by 6.7 Bio. m3/year between 2005and 2015. Since 2014, the imports of surfacewater through the SNWTproject have toa large part replaced groundwater use by households and industry, leaving a deficitmainly due to agricultural groundwater use. It is estimated to be about 4.4 Bio.m3/year (or 65% of the overexploitation between 2005 and 2015), which still makesboth water resources use and agricultural production unsustainable.
Irrigation of the intensifying cropping system has become the main cause forserious groundwater depletion. Before the 1970s, Hebei Plainwas a dry-land farmingarea dominated by wheat and millet, without any problem of groundwater overex-ploitation. Since the 1970s, however, with the improvement of irrigation conditions,the planting system gradually developed in intensity from one harvest per year via
-1000
2000
5000
8000
Grain
Maize
Wheat Ric
eBean Fru
it
Vegetable
Supply Requirement Surplus
Food
supp
ly a
nd re
quire
men
t(10
4 t)
0
200
400
600
800
Meat Egg Milk Aqua�cproducts
Supply Requirement Surplus
Food
supp
ly a
nd re
quire
men
t(10
4 t)
Fig. 3.1 Annual food supply, demand and surplus of households inBeijing-Tianjin-Hebei region (in10,000 tons) Source (Luo 2019)
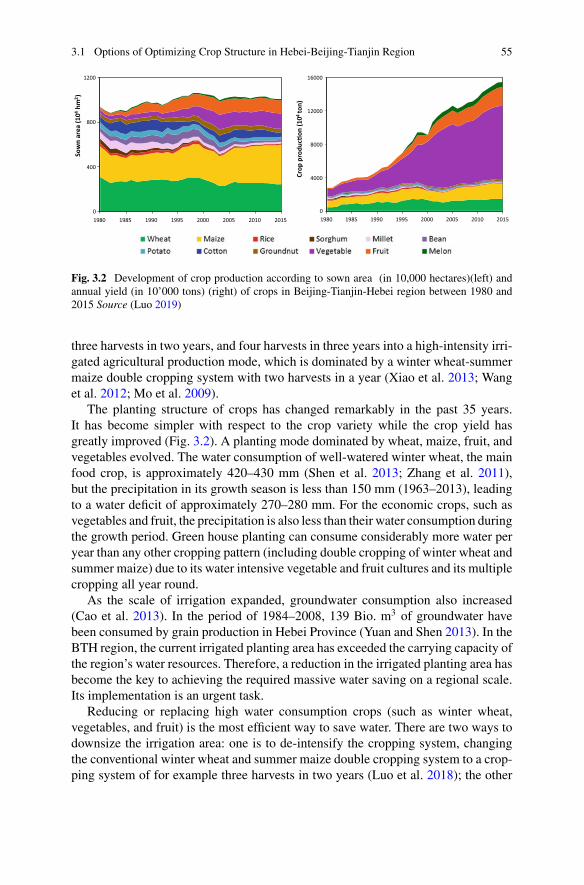
3.1 Options of Optimizing Crop Structure in Hebei-Beijing-Tianjin Region 55
0
400
800
1200
1980 1985 1990 1995 2000 2005 2010 2015
Sow
n ar
ea (1
04hm
2 )
0
4000
8000
12000
16000
1980 1985 1990 1995 2000 2005 2010 2015
Crop
pro
duc�
on (1
04to
n)
Fig. 3.2 Development of crop production according to sown area (in 10,000 hectares)(left) andannual yield (in 10’000 tons) (right) of crops in Beijing-Tianjin-Hebei region between 1980 and2015 Source (Luo 2019)
three harvests in two years, and four harvests in three years into a high-intensity irri-gated agricultural production mode, which is dominated by a winter wheat-summermaize double cropping system with two harvests in a year (Xiao et al. 2013; Wanget al. 2012; Mo et al. 2009).
The planting structure of crops has changed remarkably in the past 35 years.It has become simpler with respect to the crop variety while the crop yield hasgreatly improved (Fig. 3.2). A planting mode dominated by wheat, maize, fruit, andvegetables evolved. The water consumption of well-watered winter wheat, the mainfood crop, is approximately 420–430 mm (Shen et al. 2013; Zhang et al. 2011),but the precipitation in its growth season is less than 150 mm (1963–2013), leadingto a water deficit of approximately 270–280 mm. For the economic crops, such asvegetables and fruit, the precipitation is also less than their water consumption duringthe growth period. Green house planting can consume considerably more water peryear than any other cropping pattern (including double cropping of winter wheat andsummer maize) due to its water intensive vegetable and fruit cultures and its multiplecropping all year round.
As the scale of irrigation expanded, groundwater consumption also increased(Cao et al. 2013). In the period of 1984–2008, 139 Bio. m3 of groundwater havebeen consumed by grain production in Hebei Province (Yuan and Shen 2013). In theBTH region, the current irrigated planting area has exceeded the carrying capacity ofthe region’s water resources. Therefore, a reduction in the irrigated planting area hasbecome the key to achieving the required massive water saving on a regional scale.Its implementation is an urgent task.
Reducing or replacing high water consumption crops (such as winter wheat,vegetables, and fruit) is the most efficient way to save water. There are two ways todownsize the irrigation area: one is to de-intensify the cropping system, changingthe conventional winter wheat and summer maize double cropping system to a crop-ping system of for example three harvests in two years (Luo et al. 2018); the other
56 3 Cropping Choices and Farmers’ Options
is to optimize the planting structure in terms of economic output under differentconstraints (Luo 2019).
In this study, the bearing capacity of water resources, the food requirements ofBTH region and the self-sufficiency of the region in the main agricultural productswere considered as constraints. Four scenarios with different objectives for opti-mization were defined. Using the Elitist Non-dominated Sorting Genetic Algorithm(NSGA-II), the planting structure was optimized with respect to economic benefitsfor each of the four objectives, quantifying the optimal planting structure, its wateruse, and its crop production. The goal was to explore a sustainable planting struc-ture in a tradeoff between water resources requirements and agricultural production,providing a policy basis for the sustainable utilization of water resources and regionalfood security in the BTH region.
3.1.2 Optimization Scenarios
Four simulation scenarios for optimizing the planting structure were defined. Theresults are described in terms ofwater use, land use, and the value of economic output.Apart from the first scenario, which could be reached by 2030 given current trends,the scenarios are not predictions but rather benchmarks, against which actual policycan be calibrated. Therefore, no time scales for their implementation are given.
Scenario I (current development trend): This scenario assumes that the plantingstructure of crops will evolve according to current trends without being affected bya macro-control and management policy.
Scenario II (self-sufficiency in the main agricultural products): In this scenario,the planting structure of crops will depend on the needs defined by self-sufficiencyof BTH region in the main agricultural products (excluding rice).
Scenario III (maximum grain output under the constraints of water resources):In this scenario, the planting structure of crops aims at the maximum grain outputscale which can be supported by the water resources available in the area in view ofsatisfying national grain security requirements.
Scenario IV (coordination of grain crops, cash crops and water needs): In thisscenario, the optimized planting structure will be constrained by the scale neededto ensure grain self-sufficiency of the area (total amount of wheat and rice) whilemaximizing the economic output.
Detailed information on the formulation of the objectives can be found in (Luo2019; Luo et al. 2021). The following sections will discuss scenario by scenario theresults, which are summarized in Table 3.1.
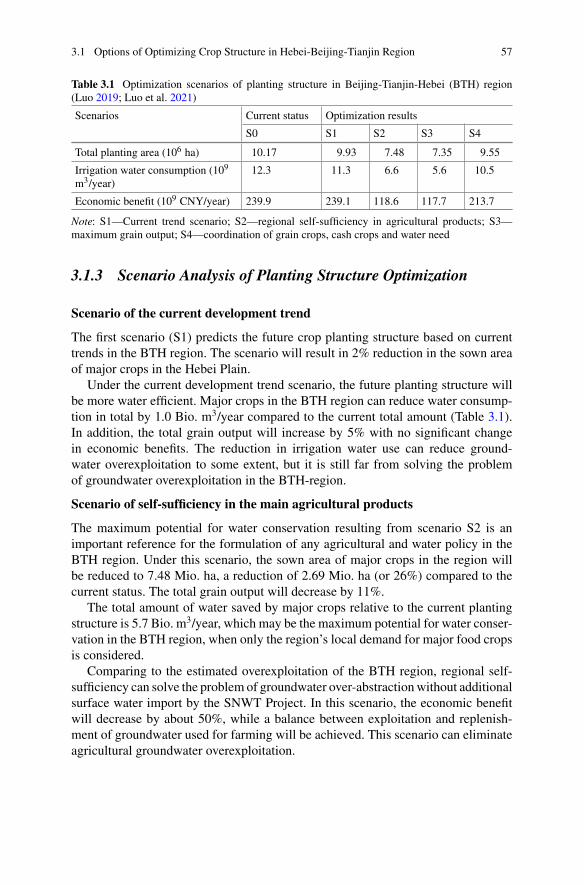
3.1 Options of Optimizing Crop Structure in Hebei-Beijing-Tianjin Region 57
Table 3.1 Optimization scenarios of planting structure in Beijing-Tianjin-Hebei (BTH) region(Luo 2019; Luo et al. 2021)
Scenarios Current status Optimization results
S0 S1 S2 S3 S4
Total planting area (106 ha) 10.17 9.93 7.48 7.35 9.55
Irrigation water consumption (109
m3/year)12.3 11.3 6.6 5.6 10.5
Economic benefit (109 CNY/year) 239.9 239.1 118.6 117.7 213.7
Note: S1—Current trend scenario; S2—regional self-sufficiency in agricultural products; S3—maximum grain output; S4—coordination of grain crops, cash crops and water need
3.1.3 Scenario Analysis of Planting Structure Optimization
Scenario of the current development trend
The first scenario (S1) predicts the future crop planting structure based on currenttrends in the BTH region. The scenario will result in 2% reduction in the sown areaof major crops in the Hebei Plain.
Under the current development trend scenario, the future planting structure willbe more water efficient. Major crops in the BTH region can reduce water consump-tion in total by 1.0 Bio. m3/year compared to the current total amount (Table 3.1).In addition, the total grain output will increase by 5% with no significant changein economic benefits. The reduction in irrigation water use can reduce ground-water overexploitation to some extent, but it is still far from solving the problemof groundwater overexploitation in the BTH-region.
Scenario of self-sufficiency in the main agricultural products
The maximum potential for water conservation resulting from scenario S2 is animportant reference for the formulation of any agricultural and water policy in theBTH region. Under this scenario, the sown area of major crops in the region willbe reduced to 7.48 Mio. ha, a reduction of 2.69 Mio. ha (or 26%) compared to thecurrent status. The total grain output will decrease by 11%.
The total amount of water saved by major crops relative to the current plantingstructure is 5.7 Bio. m3/year, which may be the maximum potential for water conser-vation in the BTH region, when only the region’s local demand for major food cropsis considered.
Comparing to the estimated overexploitation of the BTH region, regional self-sufficiency can solve the problem of groundwater over-abstractionwithout additionalsurface water import by the SNWT Project. In this scenario, the economic benefitwill decrease by about 50%, while a balance between exploitation and replenish-ment of groundwater used for farming will be achieved. This scenario can eliminateagricultural groundwater overexploitation.
58 3 Cropping Choices and Farmers’ Options
Scenario of maximum grain output under water resources constraints
Themaximumwheat production,which can be supported by regionalwater resources(S3), is an important basis for determining themaximum scale of agricultural produc-tion under a balanced groundwater budget. Based on the national data on currentwater resources, the mean regional water resources available in the BTH region are18.8 Bio. m3/year (average 2005–2015). Tomaximize wheat production, other majorcropswithwater deficits during the growth period (including vegetables, fruit, cotton,oil crops and potatoes) are constrained by the food consumption needs of the areato ensure that maximum water resources are left for wheat irrigation. Under thisscenario, the maximum wheat planting scale that can be supported by regional waterresources is 1.48 Mio. ha, equivalent to about 60% of the status quo wheat plantingscale.
In this scenario, regional water resources are used as the limit of water consump-tion to balance exploitation and replenishment of groundwater. The total sown areaof crops will decrease by 28% and the total grain output by 13%. The economicoutput will be reduced, while water saving will balance out the estimated regionaloverexploitation by agriculture, resulting in a sustainable use of regional agriculturalwater resources.
Scenario of coordination of grain crops, cash crops and water requirements
The coordinated development of grain crops, cash crops and water use (S4) has longbeen an issue of great concern in the optimization of planting structures. The scenariooptimizes the planting structure by demanding self-sufficiency in food crops for theregion (total demand for rice and wheat, where the rice deficit is converted intowheat), groundwater protection, and economic benefits as the critical criteria for thedevelopment. The results showa6%reduction in the crop planting scale relative to thecurrent cropping structure.Wheat, rice, vegetables, and fruit roughlymaintain a scalesimilar to the current planting structure, which can meet the regional requirement forfood (wheat and rice), save water and largely secure economic benefits. Therefore,the current planting structure is a relatively reasonable planting structure if one doesnot take restrictions on water resources into account.
The scenario can save 1.8 Bio. m3/year of water relative to the current plantingstructure. It can mitigate the problem of groundwater overexploitation, but the watersaved is much less than the estimated 4.4 Bio. m3/year of overexploitation. There-fore, other water sources are still required for a balanced groundwater budget, whilemeeting the demand for food crops and economic output.
3.1.4 Conclusion and Discussion
The water deficits of the major crops—wheat, vegetables, and fruit—account forabout 90% of the total groundwater consumption in farming. Different plantingstructure scenarios can alleviate groundwater overexploitation with the amount of
3.1 Options of Optimizing Crop Structure in Hebei-Beijing-Tianjin Region 59
water saved ranging from 1.0 Bio. m3/year to 6.7 Bio m3/year. The sown area ofmajor crops must be reduced by 2% to 28%, and the scale of winter wheat, a majorcrop of high groundwater consumption, by 8% to 41% of the current scale. Changesin food production over the scenarios range from 5% increase to 13% decrease, whilethe reduction in direct economic output in farming ranges from 0.3% to 51%.
Overall, self-sufficiency in the main agricultural products (S2) can meet theregional self-sufficiency in agricultural production and water saving under thisscenario is sufficient to achieve a balance between exploitation and replenishment inagricultural water use. Maximum food output under water resource constraints (S3)results in a planting structure scenario with a relatively high degree of sustainabilityin agricultural water use and a relatively high regional grain self-sufficiency. The twoscenarios (S2 and S3) are the preferred optimized planting structures for the BTHregion.
The above scenarios provide reference thresholds for restructuring of the plantingsystem to achieve sustainable use of agricultural water resources. They show howbig the contribution of agricultural restructuring to sustainable groundwater use cantheoretically be and what this means in terms of production and farmers’ income.Sustainability in groundwater resources could be reached by agricultural restruc-turing alone, but it would come with a high price tag regarding farmers’ income. Incomparison to an income loss on the order of 100 Bio. CNY/year, the cost of addi-tional 2–3 Bio. m3/year of SNWT-water at a price of 2–3 CNY/m3 seems affordable.It also must be noted that no scenario can achieve the national goals of grain secu-rity and a balanced groundwater budget at the same time without additional waterimports through the SNWT project.
In practice, the adoption of an optimized crop structure will depend on farmers’behavioral traits aswell as yield andmarket forces andwillingness to pay for thewaterresources. To a certain degree the process can be steered by the state through subsi-dies, be it on agricultural products, fallowing, water saving technology, or throughthe water price itself.
3.2 Farmers’ Feedback in a Household Survey on SeasonalLand Fallowing
A large-scale field survey was conducted in four prefectures in Southern HebeiProvince from April 2018 to September 2019 by the China Center for Agricul-tural Policy (CCAP) of Peking University. The four prefectures (Cangzhou, Handan,Hengshui, andXingtai) participated in the Seasonal Land Fallowing Program (SLFP)from the start and account for nearly 90% of the implementation area of SeasonalLand Fallowing (SLF). In addition, these four prefectures are themost serious regionsof groundwater overdraft in Hebei Province. Within these four prefectures, 7 coun-ties (Yanshan, Pingxiang, Qinghe, Gucheng, Jizhou, Qiuxian and Guantao, shown inFig. 3.3) were selected to conduct a field survey. Within each county, two townships
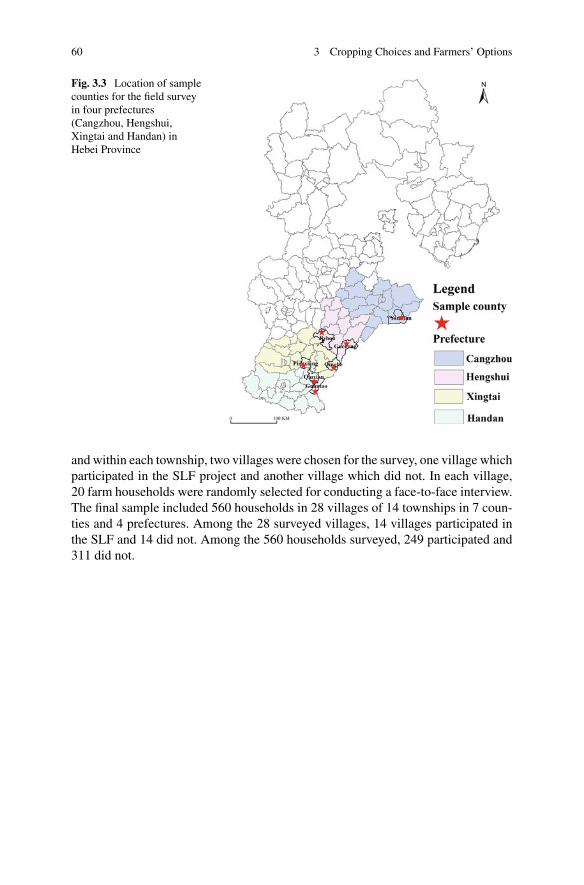
60 3 Cropping Choices and Farmers’ Options
Fig. 3.3 Location of samplecounties for the field surveyin four prefectures(Cangzhou, Hengshui,Xingtai and Handan) inHebei Province
and within each township, two villages were chosen for the survey, one village whichparticipated in the SLF project and another village which did not. In each village,20 farm households were randomly selected for conducting a face-to-face interview.The final sample included 560 households in 28 villages of 14 townships in 7 coun-ties and 4 prefectures. Among the 28 surveyed villages, 14 villages participated inthe SLF and 14 did not. Among the 560 households surveyed, 249 participated and311 did not.
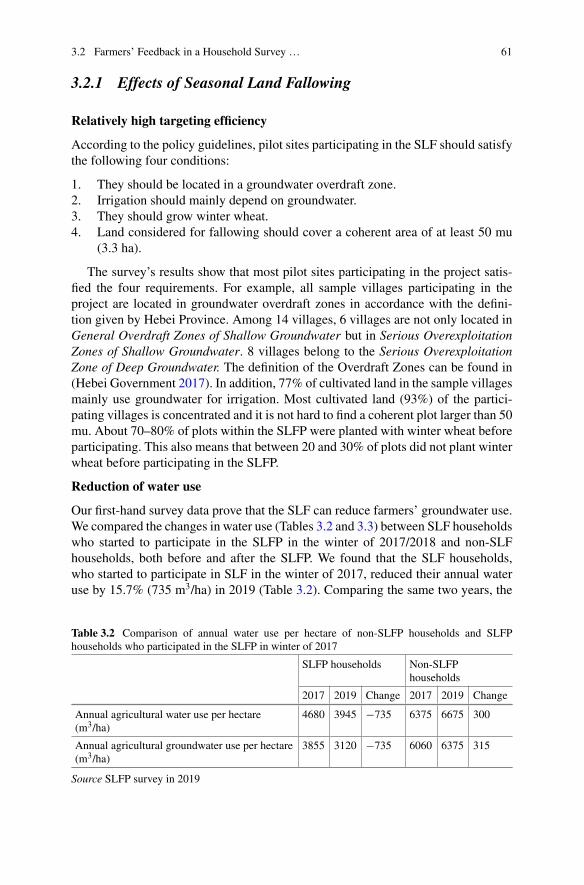
3.2 Farmers’ Feedback in a Household Survey … 61
3.2.1 Effects of Seasonal Land Fallowing
Relatively high targeting efficiency
According to the policy guidelines, pilot sites participating in the SLF should satisfythe following four conditions:
1. They should be located in a groundwater overdraft zone.2. Irrigation should mainly depend on groundwater.3. They should grow winter wheat.4. Land considered for fallowing should cover a coherent area of at least 50 mu
(3.3 ha).
The survey’s results show that most pilot sites participating in the project satis-fied the four requirements. For example, all sample villages participating in theproject are located in groundwater overdraft zones in accordance with the defini-tion given by Hebei Province. Among 14 villages, 6 villages are not only located inGeneral Overdraft Zones of Shallow Groundwater but in Serious OverexploitationZones of Shallow Groundwater. 8 villages belong to the Serious OverexploitationZone of Deep Groundwater. The definition of the Overdraft Zones can be found in(Hebei Government 2017). In addition, 77% of cultivated land in the sample villagesmainly use groundwater for irrigation. Most cultivated land (93%) of the partici-pating villages is concentrated and it is not hard to find a coherent plot larger than 50mu. About 70–80% of plots within the SLFP were planted with winter wheat beforeparticipating. This also means that between 20 and 30% of plots did not plant winterwheat before participating in the SLFP.
Reduction of water use
Our first-hand survey data prove that the SLF can reduce farmers’ groundwater use.We compared the changes in water use (Tables 3.2 and 3.3) between SLF householdswho started to participate in the SLFP in the winter of 2017/2018 and non-SLFhouseholds, both before and after the SLFP. We found that the SLF households,who started to participate in SLF in the winter of 2017, reduced their annual wateruse by 15.7% (735 m3/ha) in 2019 (Table 3.2). Comparing the same two years, the
Table 3.2 Comparison of annual water use per hectare of non-SLFP households and SLFPhouseholds who participated in the SLFP in winter of 2017
SLFP households Non-SLFPhouseholds
2017 2019 Change 2017 2019 Change
Annual agricultural water use per hectare(m3/ha)
4680 3945 −735 6375 6675 300
Annual agricultural groundwater use per hectare(m3/ha)
3855 3120 −735 6060 6375 315
Source SLFP survey in 2019
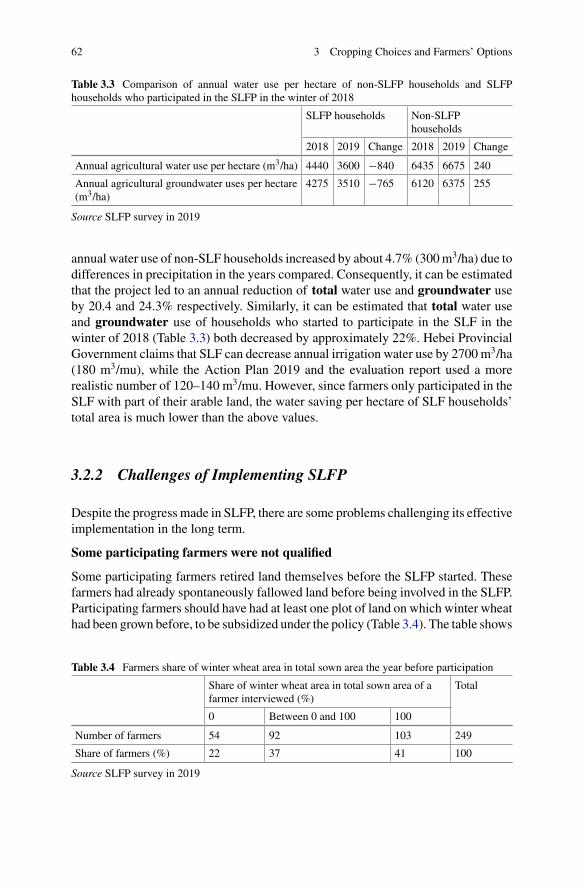
62 3 Cropping Choices and Farmers’ Options
Table 3.3 Comparison of annual water use per hectare of non-SLFP households and SLFPhouseholds who participated in the SLFP in the winter of 2018
SLFP households Non-SLFPhouseholds
2018 2019 Change 2018 2019 Change
Annual agricultural water use per hectare (m3/ha) 4440 3600 −840 6435 6675 240
Annual agricultural groundwater uses per hectare(m3/ha)
4275 3510 −765 6120 6375 255
Source SLFP survey in 2019
annual water use of non-SLF households increased by about 4.7% (300m3/ha) due todifferences in precipitation in the years compared. Consequently, it can be estimatedthat the project led to an annual reduction of total water use and groundwater useby 20.4 and 24.3% respectively. Similarly, it can be estimated that total water useand groundwater use of households who started to participate in the SLF in thewinter of 2018 (Table 3.3) both decreased by approximately 22%. Hebei ProvincialGovernment claims that SLF can decrease annual irrigation water use by 2700 m3/ha(180 m3/mu), while the Action Plan 2019 and the evaluation report used a morerealistic number of 120–140 m3/mu. However, since farmers only participated in theSLF with part of their arable land, the water saving per hectare of SLF households’total area is much lower than the above values.
3.2.2 Challenges of Implementing SLFP
Despite the progress made in SLFP, there are some problems challenging its effectiveimplementation in the long term.
Some participating farmers were not qualified
Some participating farmers retired land themselves before the SLFP started. Thesefarmers had already spontaneously fallowed land before being involved in the SLFP.Participating farmers should have had at least one plot of land on which winter wheathad been grown before, to be subsidized under the policy (Table 3.4). The table shows
Table 3.4 Farmers share of winter wheat area in total sown area the year before participation
Share of winter wheat area in total sown area of afarmer interviewed (%)
Total
0 Between 0 and 100 100
Number of farmers 54 92 103 249
Share of farmers (%) 22 37 41 100
Source SLFP survey in 2019
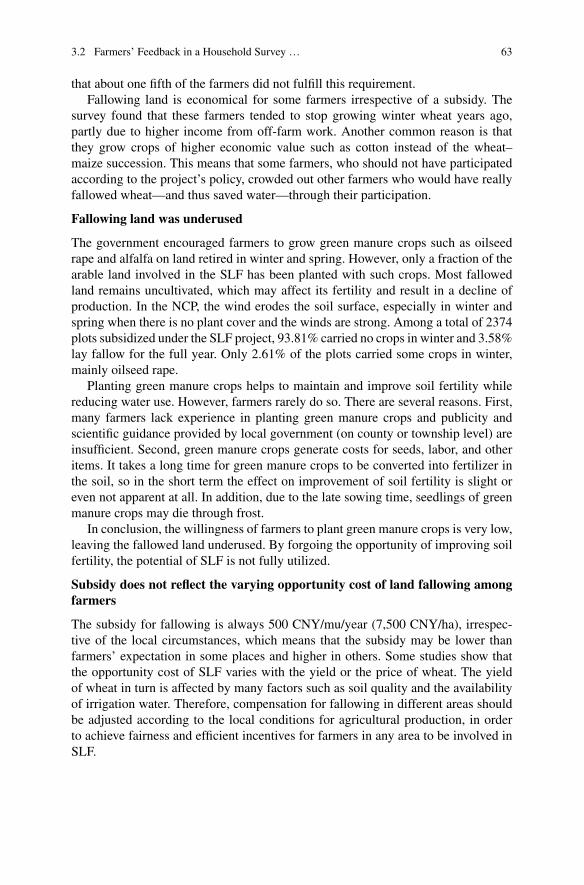
3.2 Farmers’ Feedback in a Household Survey … 63
that about one fifth of the farmers did not fulfill this requirement.Fallowing land is economical for some farmers irrespective of a subsidy. The
survey found that these farmers tended to stop growing winter wheat years ago,partly due to higher income from off-farm work. Another common reason is thatthey grow crops of higher economic value such as cotton instead of the wheat–maize succession. This means that some farmers, who should not have participatedaccording to the project’s policy, crowded out other farmers who would have reallyfallowed wheat—and thus saved water—through their participation.
Fallowing land was underused
The government encouraged farmers to grow green manure crops such as oilseedrape and alfalfa on land retired in winter and spring. However, only a fraction of thearable land involved in the SLF has been planted with such crops. Most fallowedland remains uncultivated, which may affect its fertility and result in a decline ofproduction. In the NCP, the wind erodes the soil surface, especially in winter andspring when there is no plant cover and the winds are strong. Among a total of 2374plots subsidized under the SLF project, 93.81% carried no crops in winter and 3.58%lay fallow for the full year. Only 2.61% of the plots carried some crops in winter,mainly oilseed rape.
Planting green manure crops helps to maintain and improve soil fertility whilereducing water use. However, farmers rarely do so. There are several reasons. First,many farmers lack experience in planting green manure crops and publicity andscientific guidance provided by local government (on county or township level) areinsufficient. Second, green manure crops generate costs for seeds, labor, and otheritems. It takes a long time for green manure crops to be converted into fertilizer inthe soil, so in the short term the effect on improvement of soil fertility is slight oreven not apparent at all. In addition, due to the late sowing time, seedlings of greenmanure crops may die through frost.
In conclusion, the willingness of farmers to plant green manure crops is very low,leaving the fallowed land underused. By forgoing the opportunity of improving soilfertility, the potential of SLF is not fully utilized.
Subsidy does not reflect the varying opportunity cost of land fallowing amongfarmers
The subsidy for fallowing is always 500 CNY/mu/year (7,500 CNY/ha), irrespec-tive of the local circumstances, which means that the subsidy may be lower thanfarmers’ expectation in some places and higher in others. Some studies show thatthe opportunity cost of SLF varies with the yield or the price of wheat. The yieldof wheat in turn is affected by many factors such as soil quality and the availabilityof irrigation water. Therefore, compensation for fallowing in different areas shouldbe adjusted according to the local conditions for agricultural production, in orderto achieve fairness and efficient incentives for farmers in any area to be involved inSLF.
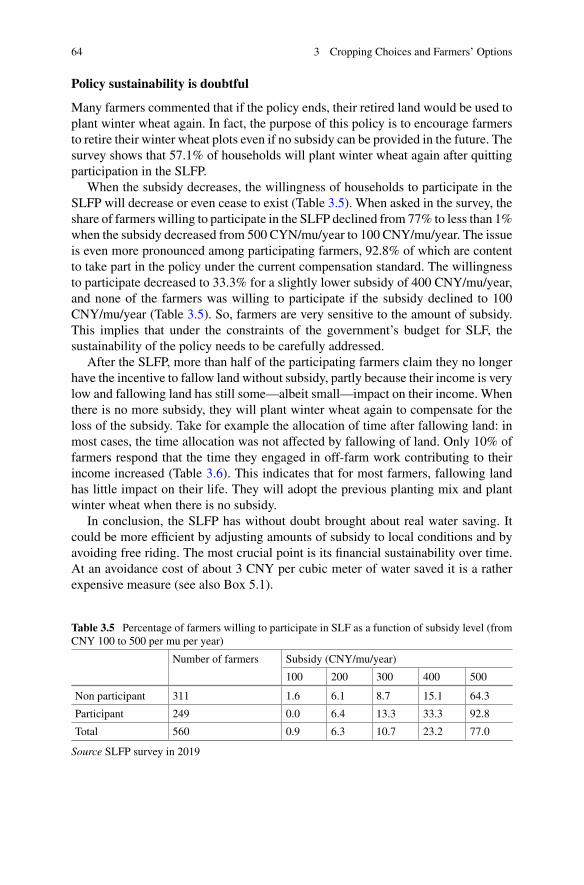
64 3 Cropping Choices and Farmers’ Options
Policy sustainability is doubtful
Many farmers commented that if the policy ends, their retired land would be used toplant winter wheat again. In fact, the purpose of this policy is to encourage farmersto retire their winter wheat plots even if no subsidy can be provided in the future. Thesurvey shows that 57.1% of households will plant winter wheat again after quittingparticipation in the SLFP.
When the subsidy decreases, the willingness of households to participate in theSLFP will decrease or even cease to exist (Table 3.5). When asked in the survey, theshare of farmers willing to participate in the SLFP declined from 77% to less than 1%when the subsidy decreased from 500 CYN/mu/year to 100 CNY/mu/year. The issueis even more pronounced among participating farmers, 92.8% of which are contentto take part in the policy under the current compensation standard. The willingnessto participate decreased to 33.3% for a slightly lower subsidy of 400 CNY/mu/year,and none of the farmers was willing to participate if the subsidy declined to 100CNY/mu/year (Table 3.5). So, farmers are very sensitive to the amount of subsidy.This implies that under the constraints of the government’s budget for SLF, thesustainability of the policy needs to be carefully addressed.
After the SLFP, more than half of the participating farmers claim they no longerhave the incentive to fallow land without subsidy, partly because their income is verylow and fallowing land has still some—albeit small—impact on their income. Whenthere is no more subsidy, they will plant winter wheat again to compensate for theloss of the subsidy. Take for example the allocation of time after fallowing land: inmost cases, the time allocation was not affected by fallowing of land. Only 10% offarmers respond that the time they engaged in off-farm work contributing to theirincome increased (Table 3.6). This indicates that for most farmers, fallowing landhas little impact on their life. They will adopt the previous planting mix and plantwinter wheat when there is no subsidy.
In conclusion, the SLFP has without doubt brought about real water saving. Itcould be more efficient by adjusting amounts of subsidy to local conditions and byavoiding free riding. The most crucial point is its financial sustainability over time.At an avoidance cost of about 3 CNY per cubic meter of water saved it is a ratherexpensive measure (see also Box 5.1).
Table 3.5 Percentage of farmers willing to participate in SLF as a function of subsidy level (fromCNY 100 to 500 per mu per year)
Number of farmers Subsidy (CNY/mu/year)
100 200 300 400 500
Non participant 311 1.6 6.1 8.7 15.1 64.3
Participant 249 0.0 6.4 13.3 33.3 92.8
Total 560 0.9 6.3 10.7 23.2 77.0
Source SLFP survey in 2019
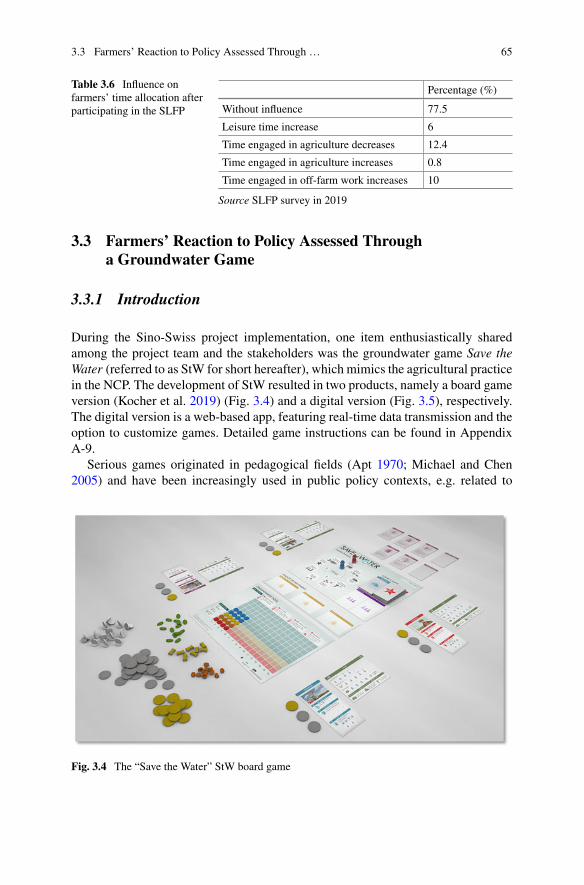
3.3 Farmers’ Reaction to Policy Assessed Through … 65
Table 3.6 Influence onfarmers’ time allocation afterparticipating in the SLFP
Percentage (%)
Without influence 77.5
Leisure time increase 6
Time engaged in agriculture decreases 12.4
Time engaged in agriculture increases 0.8
Time engaged in off-farm work increases 10
Source SLFP survey in 2019
3.3 Farmers’ Reaction to Policy Assessed Througha Groundwater Game
3.3.1 Introduction
During the Sino-Swiss project implementation, one item enthusiastically sharedamong the project team and the stakeholders was the groundwater game Save theWater (referred to as StW for short hereafter), which mimics the agricultural practicein the NCP. The development of StW resulted in two products, namely a board gameversion (Kocher et al. 2019) (Fig. 3.4) and a digital version (Fig. 3.5), respectively.The digital version is a web-based app, featuring real-time data transmission and theoption to customize games. Detailed game instructions can be found in AppendixA-9.
Serious games originated in pedagogical fields (Apt 1970; Michael and Chen2005) and have been increasingly used in public policy contexts, e.g. related to
Fig. 3.4 The “Save the Water” StW board game
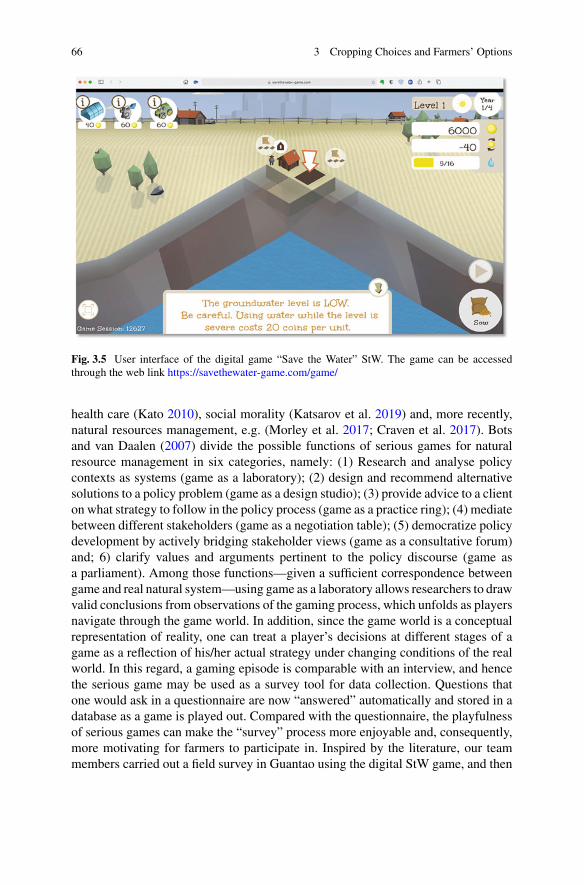
66 3 Cropping Choices and Farmers’ Options
Fig. 3.5 User interface of the digital game “Save the Water” StW. The game can be accessedthrough the web link https://savethewater-game.com/game/
health care (Kato 2010), social morality (Katsarov et al. 2019) and, more recently,natural resources management, e.g. (Morley et al. 2017; Craven et al. 2017). Botsand van Daalen (2007) divide the possible functions of serious games for naturalresource management in six categories, namely: (1) Research and analyse policycontexts as systems (game as a laboratory); (2) design and recommend alternativesolutions to a policy problem (game as a design studio); (3) provide advice to a clienton what strategy to follow in the policy process (game as a practice ring); (4) mediatebetween different stakeholders (game as a negotiation table); (5) democratize policydevelopment by actively bridging stakeholder views (game as a consultative forum)and; 6) clarify values and arguments pertinent to the policy discourse (game asa parliament). Among those functions—given a sufficient correspondence betweengame and real natural system—using game as a laboratory allows researchers to drawvalid conclusions from observations of the gaming process, which unfolds as playersnavigate through the game world. In addition, since the game world is a conceptualrepresentation of reality, one can treat a player’s decisions at different stages of agame as a reflection of his/her actual strategy under changing conditions of the realworld. In this regard, a gaming episode is comparable with an interview, and hencethe serious game may be used as a survey tool for data collection. Questions thatone would ask in a questionnaire are now “answered” automatically and stored in adatabase as a game is played out. Compared with the questionnaire, the playfulnessof serious games can make the “survey” process more enjoyable and, consequently,more motivating for farmers to participate in. Inspired by the literature, our teammembers carried out a field survey in Guantao using the digital StW game, and then
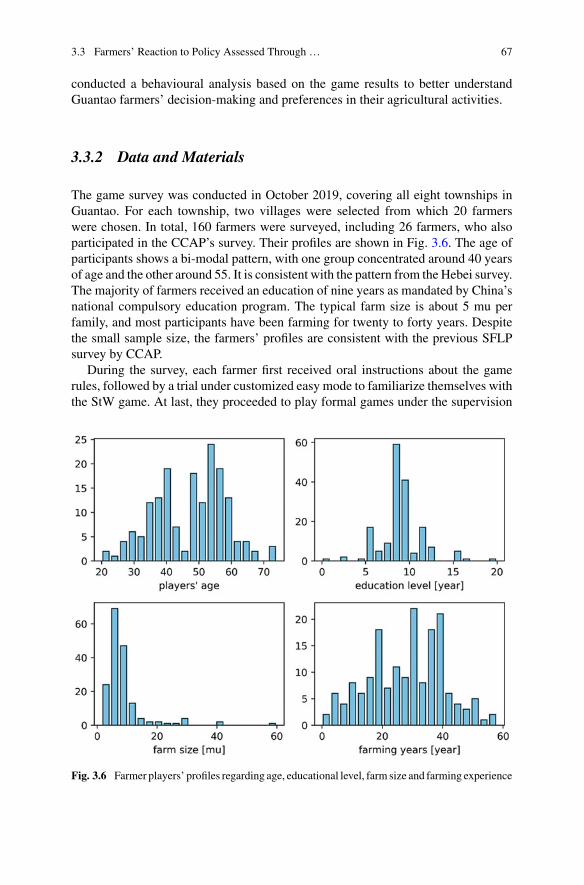
3.3 Farmers’ Reaction to Policy Assessed Through … 67
conducted a behavioural analysis based on the game results to better understandGuantao farmers’ decision-making and preferences in their agricultural activities.
3.3.2 Data and Materials
The game survey was conducted in October 2019, covering all eight townships inGuantao. For each township, two villages were selected from which 20 farmerswere chosen. In total, 160 farmers were surveyed, including 26 farmers, who alsoparticipated in the CCAP’s survey. Their profiles are shown in Fig. 3.6. The age ofparticipants shows a bi-modal pattern, with one group concentrated around 40 yearsof age and the other around 55. It is consistent with the pattern from the Hebei survey.The majority of farmers received an education of nine years as mandated by China’snational compulsory education program. The typical farm size is about 5 mu perfamily, and most participants have been farming for twenty to forty years. Despitethe small sample size, the farmers’ profiles are consistent with the previous SFLPsurvey by CCAP.
During the survey, each farmer first received oral instructions about the gamerules, followed by a trial under customized easy mode to familiarize themselves withthe StW game. At last, they proceeded to play formal games under the supervision
Fig. 3.6 Farmer players’ profiles regarding age, educational level, farm size and farming experience
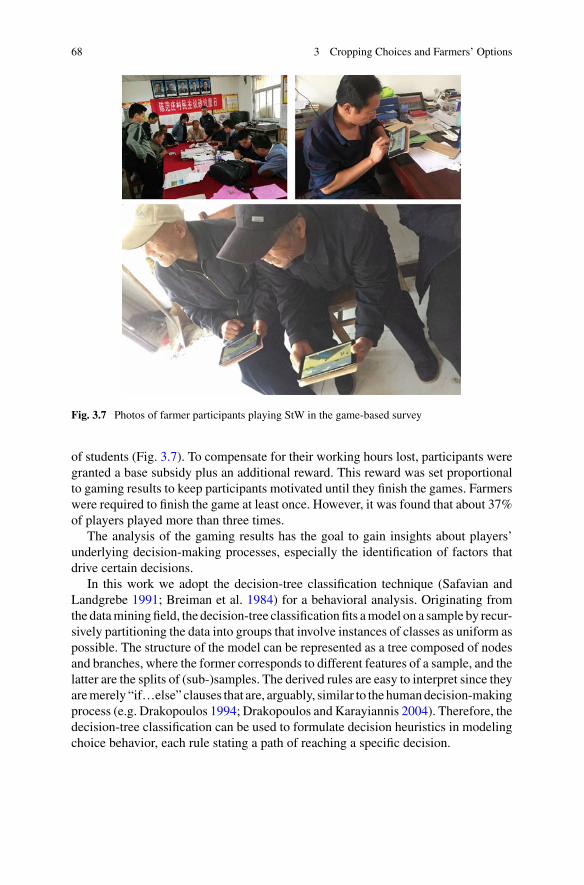
68 3 Cropping Choices and Farmers’ Options
Fig. 3.7 Photos of farmer participants playing StW in the game-based survey
of students (Fig. 3.7). To compensate for their working hours lost, participants weregranted a base subsidy plus an additional reward. This reward was set proportionalto gaming results to keep participants motivated until they finish the games. Farmerswere required to finish the game at least once. However, it was found that about 37%of players played more than three times.
The analysis of the gaming results has the goal to gain insights about players’underlying decision-making processes, especially the identification of factors thatdrive certain decisions.
In this work we adopt the decision-tree classification technique (Safavian andLandgrebe 1991; Breiman et al. 1984) for a behavioral analysis. Originating fromthe dataminingfield, the decision-tree classificationfits amodel on a sample by recur-sively partitioning the data into groups that involve instances of classes as uniform aspossible. The structure of the model can be represented as a tree composed of nodesand branches, where the former corresponds to different features of a sample, and thelatter are the splits of (sub-)samples. The derived rules are easy to interpret since theyaremerely “if…else” clauses that are, arguably, similar to the humandecision-makingprocess (e.g. Drakopoulos 1994; Drakopoulos and Karayiannis 2004). Therefore, thedecision-tree classification can be used to formulate decision heuristics in modelingchoice behavior, each rule stating a path of reaching a specific decision.
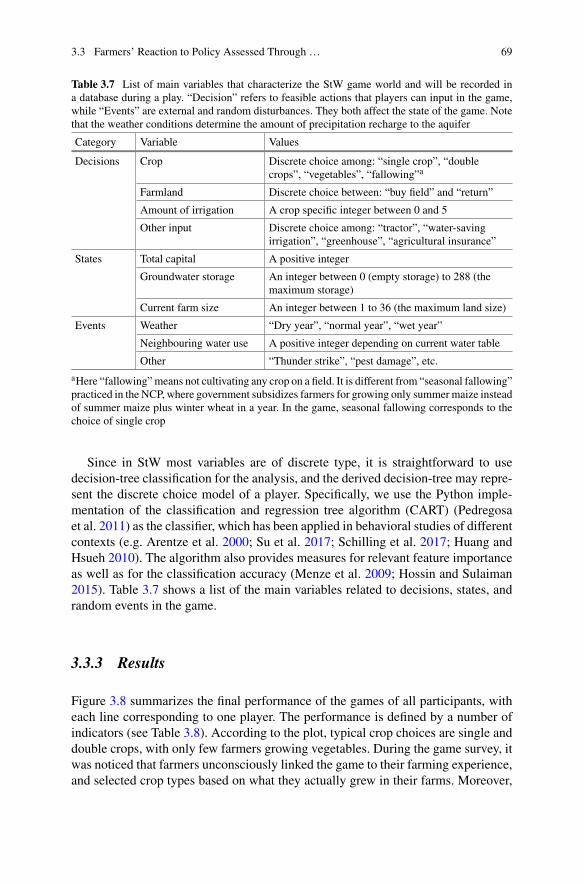
3.3 Farmers’ Reaction to Policy Assessed Through … 69
Table 3.7 List of main variables that characterize the StW game world and will be recorded ina database during a play. “Decision” refers to feasible actions that players can input in the game,while “Events” are external and random disturbances. They both affect the state of the game. Notethat the weather conditions determine the amount of precipitation recharge to the aquifer
Category Variable Values
Decisions Crop Discrete choice among: “single crop”, “doublecrops”, “vegetables”, “fallowing”a
Farmland Discrete choice between: “buy field” and “return”
Amount of irrigation A crop specific integer between 0 and 5
Other input Discrete choice among: “tractor”, “water-savingirrigation”, “greenhouse”, “agricultural insurance”
States Total capital A positive integer
Groundwater storage An integer between 0 (empty storage) to 288 (themaximum storage)
Current farm size An integer between 1 to 36 (the maximum land size)
Events Weather “Dry year”, “normal year”, “wet year”
Neighbouring water use A positive integer depending on current water table
Other “Thunder strike”, “pest damage”, etc.
aHere “fallowing”means not cultivating any crop on a field. It is different from “seasonal fallowing”practiced in the NCP, where government subsidizes farmers for growing only summermaize insteadof summer maize plus winter wheat in a year. In the game, seasonal fallowing corresponds to thechoice of single crop
Since in StW most variables are of discrete type, it is straightforward to usedecision-tree classification for the analysis, and the derived decision-tree may repre-sent the discrete choice model of a player. Specifically, we use the Python imple-mentation of the classification and regression tree algorithm (CART) (Pedregosaet al. 2011) as the classifier, which has been applied in behavioral studies of differentcontexts (e.g. Arentze et al. 2000; Su et al. 2017; Schilling et al. 2017; Huang andHsueh 2010). The algorithm also provides measures for relevant feature importanceas well as for the classification accuracy (Menze et al. 2009; Hossin and Sulaiman2015). Table 3.7 shows a list of the main variables related to decisions, states, andrandom events in the game.
3.3.3 Results
Figure 3.8 summarizes the final performance of the games of all participants, witheach line corresponding to one player. The performance is defined by a number ofindicators (see Table 3.8). According to the plot, typical crop choices are single anddouble crops, with only few farmers growing vegetables. During the game survey, itwas noticed that farmers unconsciously linked the game to their farming experience,and selected crop types based on what they actually grew in their farms. Moreover,
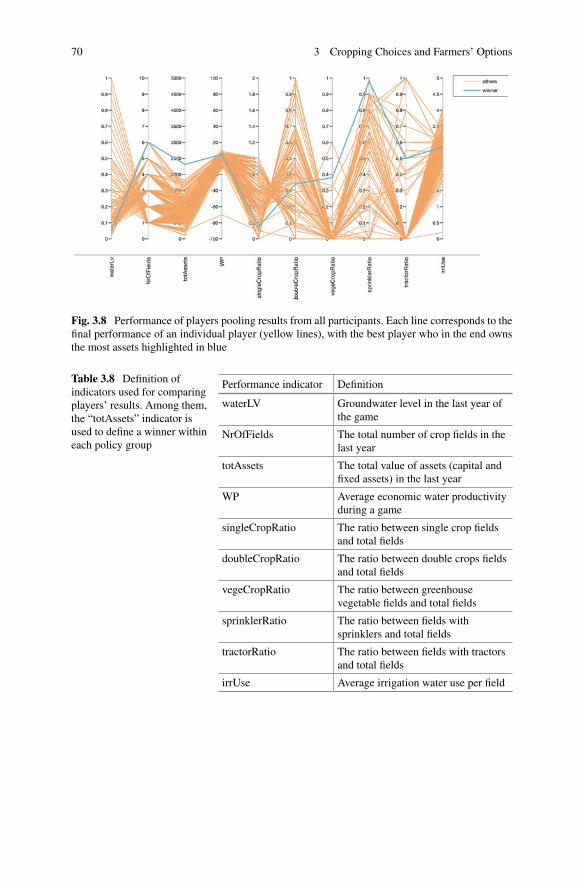
70 3 Cropping Choices and Farmers’ Options
Fig. 3.8 Performance of players pooling results from all participants. Each line corresponds to thefinal performance of an individual player (yellow lines), with the best player who in the end ownsthe most assets highlighted in blue
Table 3.8 Definition ofindicators used for comparingplayers’ results. Among them,the “totAssets” indicator isused to define a winner withineach policy group
Performance indicator Definition
waterLV Groundwater level in the last year ofthe game
NrOfFields The total number of crop fields in thelast year
totAssets The total value of assets (capital andfixed assets) in the last year
WP Average economic water productivityduring a game
singleCropRatio The ratio between single crop fieldsand total fields
doubleCropRatio The ratio between double crops fieldsand total fields
vegeCropRatio The ratio between greenhousevegetable fields and total fields
sprinklerRatio The ratio between fields withsprinklers and total fields
tractorRatio The ratio between fields with tractorsand total fields
irrUse Average irrigation water use per field
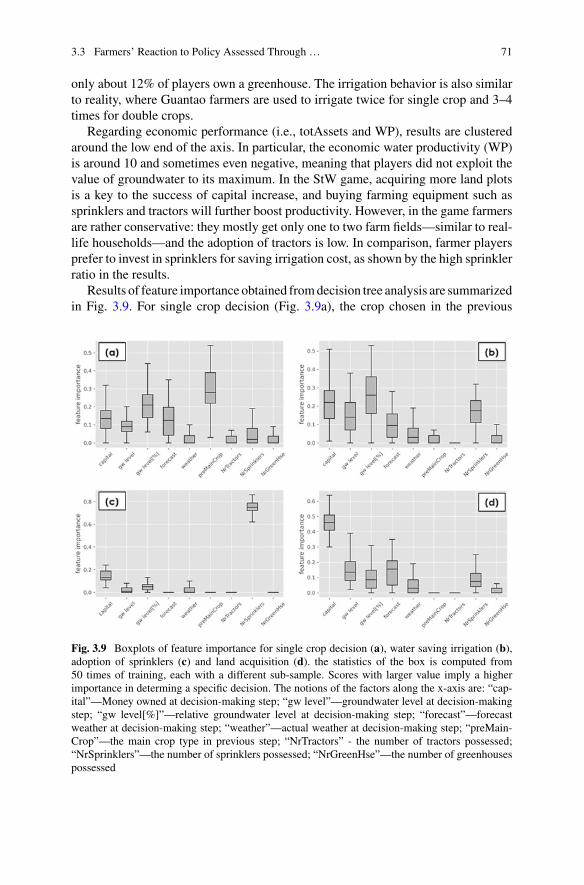
3.3 Farmers’ Reaction to Policy Assessed Through … 71
only about 12% of players own a greenhouse. The irrigation behavior is also similarto reality, where Guantao farmers are used to irrigate twice for single crop and 3–4times for double crops.
Regarding economic performance (i.e., totAssets and WP), results are clusteredaround the low end of the axis. In particular, the economic water productivity (WP)is around 10 and sometimes even negative, meaning that players did not exploit thevalue of groundwater to its maximum. In the StW game, acquiring more land plotsis a key to the success of capital increase, and buying farming equipment such assprinklers and tractors will further boost productivity. However, in the game farmersare rather conservative: they mostly get only one to two farm fields—similar to real-life households—and the adoption of tractors is low. In comparison, farmer playersprefer to invest in sprinklers for saving irrigation cost, as shown by the high sprinklerratio in the results.
Results of feature importance obtained fromdecision tree analysis are summarizedin Fig. 3.9. For single crop decision (Fig. 3.9a), the crop chosen in the previous
Fig. 3.9 Boxplots of feature importance for single crop decision (a), water saving irrigation (b),adoption of sprinklers (c) and land acquisition (d). the statistics of the box is computed from50 times of training, each with a different sub-sample. Scores with larger value imply a higherimportance in determing a specific decision. The notions of the factors along the x-axis are: “cap-ital”—Money owned at decision-making step; “gw level”—groundwater level at decision-makingstep; “gw level[%]”—relative groundwater level at decision-making step; “forecast”—forecastweather at decision-making step; “weather”—actual weather at decision-making step; “preMain-Crop”—the main crop type in previous step; “NrTractors” - the number of tractors possessed;“NrSprinklers”—the number of sprinklers possessed; “NrGreenHse”—the number of greenhousespossessed
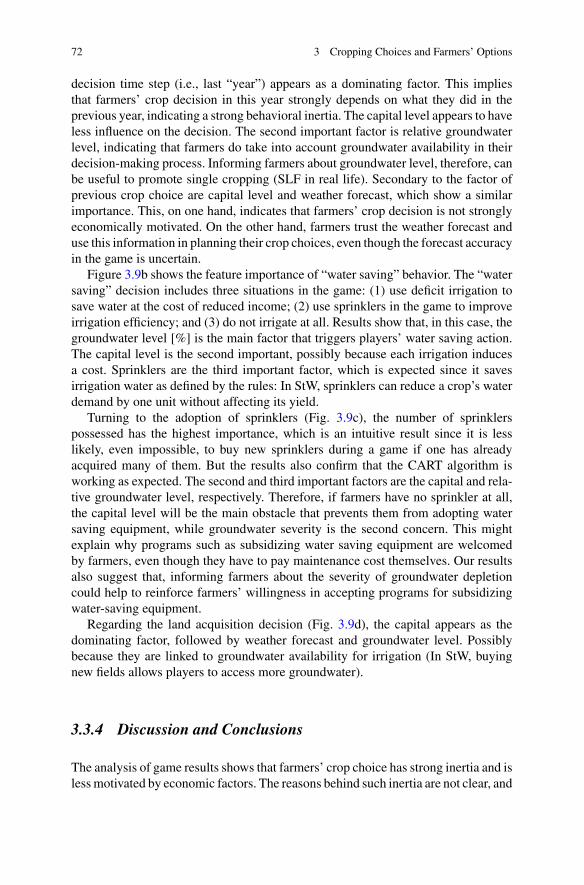
72 3 Cropping Choices and Farmers’ Options
decision time step (i.e., last “year”) appears as a dominating factor. This impliesthat farmers’ crop decision in this year strongly depends on what they did in theprevious year, indicating a strong behavioral inertia. The capital level appears to haveless influence on the decision. The second important factor is relative groundwaterlevel, indicating that farmers do take into account groundwater availability in theirdecision-making process. Informing farmers about groundwater level, therefore, canbe useful to promote single cropping (SLF in real life). Secondary to the factor ofprevious crop choice are capital level and weather forecast, which show a similarimportance. This, on one hand, indicates that farmers’ crop decision is not stronglyeconomically motivated. On the other hand, farmers trust the weather forecast anduse this information in planning their crop choices, even though the forecast accuracyin the game is uncertain.
Figure 3.9b shows the feature importance of “water saving” behavior. The “watersaving” decision includes three situations in the game: (1) use deficit irrigation tosave water at the cost of reduced income; (2) use sprinklers in the game to improveirrigation efficiency; and (3) do not irrigate at all. Results show that, in this case, thegroundwater level [%] is the main factor that triggers players’ water saving action.The capital level is the second important, possibly because each irrigation inducesa cost. Sprinklers are the third important factor, which is expected since it savesirrigation water as defined by the rules: In StW, sprinklers can reduce a crop’s waterdemand by one unit without affecting its yield.
Turning to the adoption of sprinklers (Fig. 3.9c), the number of sprinklerspossessed has the highest importance, which is an intuitive result since it is lesslikely, even impossible, to buy new sprinklers during a game if one has alreadyacquired many of them. But the results also confirm that the CART algorithm isworking as expected. The second and third important factors are the capital and rela-tive groundwater level, respectively. Therefore, if farmers have no sprinkler at all,the capital level will be the main obstacle that prevents them from adopting watersaving equipment, while groundwater severity is the second concern. This mightexplain why programs such as subsidizing water saving equipment are welcomedby farmers, even though they have to pay maintenance cost themselves. Our resultsalso suggest that, informing farmers about the severity of groundwater depletioncould help to reinforce farmers’ willingness in accepting programs for subsidizingwater-saving equipment.
Regarding the land acquisition decision (Fig. 3.9d), the capital appears as thedominating factor, followed by weather forecast and groundwater level. Possiblybecause they are linked to groundwater availability for irrigation (In StW, buyingnew fields allows players to access more groundwater).
3.3.4 Discussion and Conclusions
The analysis of game results shows that farmers’ crop choice has strong inertia and islessmotivated by economic factors. The reasons behind such inertia are not clear, and
3.3 Farmers’ Reaction to Policy Assessed Through … 73
can possibly be linked to the lack of experience with innovation, high age of farmers,risk averseness fearing failure when growing new crops or just to farmers’ plantinghabits, since in NCP the single/double cropping has a well-established routine usingmechanization. However, farmers in NCP do not buy but rather rent agriculturalmachinery from a company, which not only provides equipment but also service.Currently, smallholder farmers cannot afford to buy those machines themselves.One observation from the previous SLFP survey shows that farmers are willing togive up winter wheat for a subsidy of 500 CNY/mu, but few farmers take advantageof fallowed land to grow other permitted crops such as oilseed rape or alfalfa, eventhough such a practice can help to maintain the fertility of the soil. Therefore, unlesschanging crop structure is relatively cost-free (e.g., compensated by subsidy) andoperationally easy, it will require a stronger economic incentive to persuade farmersto adopt new crops.
Water-saving irrigating behavior strongly depends on the groundwater level.Moreover, the groundwater level plays an important role in affecting other decisionsin the game. Therefore, a proper communication with farmers about the severity ofgroundwater depletion can help to motivate water-saving behavior. In Guantao, thelocal water resource bureau has set up posters with historical records of ground-water head to show the declining trend. Also, the StW game can serve as such acommunication tool for awareness raising.
The capital level is the main influencing factor for farmers’ land acquisition andadoptionof sprinklers—if one excludes the number of sprinklers possessed as a candi-date determining factor. Therefore, if farmers have sufficient money, they are willingto invest on water-saving equipment. The higher capital level can also encouragefarmers to buy new land, but from the results it is found that the land expansionbehavior is rather conservative, with mostly only 1–2 new fields acquired during thegame.
Using the game as a survey and analysis tool is a new concept proposed in ourproject, and the field experiments also suggests that farmers’ decisions in the gameshow consistency with their real farming practice. Although the StW game omittedmany nuances seen in real agricultural activities, such as the influence of seed quality,extreme weather other than precipitation, time length of irrigation, etc., it is never-theless able to capture essential farmers’ behavioral traits, and to provide directionsfor further investigation with formal econometric methods.
References
AptCC (1970) Serious games: the art and science of games that simulate life in industry, governmentand education. Viking, New York
Arentze TA, Hofman F, Mourik H, Timmermans HJP, Wets G (2000) Using decision tree inductionsystems for modeling space-time behavior. Geogr Anal 32:330–350. https://doi.org/10.1111/j.1538-4632.2000.tb00431.x
Bots P, van Daalen E (2007) Functional design of games to support natural resource managementpolicy development. Simul Gaming 38:512–532. https://doi.org/10.1177/1046878107300674
74 3 Cropping Choices and Farmers’ Options
Breiman L, Friedman J, Stone CJ, Olshen RA (1984) Classification and regression trees. CRC PressCao G, Zheng C, Scanlon BR, Liu J, Li W (2013) Use of flow modeling to assess sustainability ofgroundwater resources in the North China Plain. Water Resour Res 49(1):159–175. https://doi.org/10.1029/2012WR011899
Craven J, Angarita H, Corzo Perez GA, Vasquez D (2017) Development and testing of a river basinmanagement simulation game for integrated management of the Magdalena-Cauca River Basin.Environ Model Softw 90:78–88. https://doi.org/10.1016/j.envsoft.2017.01.002
Drakopoulos SA (1994) Hierarchical choice in economics. J Econ Surv 8:133–153. https://doi.org/10.1111/j.1467-6419.1994.tb00097.x
Drakopoulos SA, Karayiannis AD (2004) The historical development of hierarchical behavior ineconomic thought. J Hist Econ Thought 26:363–378. https://doi.org/10.1080/1042771042000263849
Feng W, Zhong M, Lemoine JM, Biancale R, Hsu HT, Xia J (2013) Evaluation of groundwaterdepletion in North China using the Gravity Recovery and Climate Experiment (GRACE) dataand ground-basedmeasurements.Water Resour Res 49:2110–2118. https://doi.org/10.1002/wrcr.20192
Feng W, Shum CK, Zhong M et al (2018) Groundwater storage changes in China from satellitegravity: an overview. Remote Sens 10(5):674. https://doi.org/10.3390/rs10050674
Hebei Government (2017). Notice of the People’s Government of Hebei Province: announcementof Groundwater Overdraft Zones, Forbidden and Restricted Groundwater Exploitation Zones.Document Nr. 48 (In Chinese)
Hossin M, Sulaiman M (2015) A review on evaluation metrics for data classification evaluations.Int J Data Min Knowl Manag Process 5:1. https://doi.org/10.5121/ijdkp.2015.5201
Huang CF, Hsueh SL (2010) Customer behavior and decision making in the refurbishmentindustry—a data mining approach. J Civ Eng Manag 16:75–84. https://doi.org/10.3846/jcem.2010.07
Kato PM (2010) Video games in health care: closing the gap. Rev Gen Psychol 14:113–121. https://doi.org/10.1037/a0019441
Katsarov J, Christen M, Mauerhofer R, Schmocker D, Tanner C (2019) Training moral sensitivitythrough video games: a review of suitable game mechanisms. Games Cult 14:344–366. https://doi.org/10.1177/1555412017719344
KocherM,Martin-NiedeckenAL, LiY,KinzelbachW,Bauer R, Lunin L (2019) “Save theWater”—a China water management game project. In: Jonna Koivisto and Juho Hamari (Eds.) Proceedingsof the 3rd International GamiFINConference, Levi, Finland, pp 265--276. http://ceur-ws.org/Vol-2359/paper23.pdf
Luo JM (2019) Evaluating water saving effects due to planting structure optimization in the Beijing-Tianjin-Hebei plain. Ph. D. thesis. Institute of Genetics and Developmental Biology, CAS, 2019
Luo JM, Shen YJ, Qi YQ et al (2018) Evaluating water conservation effects due to cropping systemoptimization on the Beijing-Tianjin-Hebei plain China. Agric Syst 159:32–41. https://doi.org/10.1016/j.agsy.2017.10.002
Luo JM, Qi YQ, Huo YW, Dong W, Shen YJ (2021). Optimizing planting structure for ground-water sustainability in Beijing-Tianjin-Hebei region, China: 1. Food supply/demand and waterconsumption. Submitted to Agric. Water Manag
Menze BH, Kelm BM, Masuch R, Himmelreich U, Bachert P, Petrich W, Hamprecht FA (2009) Acomparison of random forest and its Gini importance with standard chemometric methods forthe feature selection and classification of spectral data. BMC Bioinform 10:213. https://doi.org/10.1186/1471-2105-10-213
Michael DR, Chen SL (2005) Serious games: games that educate, train, and inform. Muska &Lipman/Premier-Trade
Mo XG, Liu SX, Lin ZH et al (2009) Regional crop yield, water consumption and water useefficiency and their responses to climate change in the North China Plain. Agr Ecosyst Environ134(1):67–78. https://doi.org/10.1016/j.agee.2009.05.017
References 75
Morley MS, Khoury M, Savic DA (2017) Serious game approach to water distribution systemdesign and rehabilitation problems. Procedia Eng 186:76–83. https://doi.org/10.1016/j.proeng.2017.03.213
Pedregosa F, Varoquaux G, Gramfort A, Michel V, Thirion B, Grisel O, Blondel M, PrettenhoferP, Weiss R, Dubourg V, et al (2011) Scikit-learn: machine learning in python. J Mach Learn Res12:2825–2830. arXiv:1201.0490v4
Safavian S, Landgrebe D (1991) A survey of decision tree classifier methodology. IEEE Trans Syst,Man, Cybern 21:660–674. https://doi.org/10.1109/21.97458
Schilling C, Mortimer D, Dalziel K (2017) Using CART to Identify Thresholds and Hierarchiesin the Determinants of Funding Decisions. Med Decis Making 37:173–182. https://doi.org/10.1177/0272989X16638846
Shen YJ, Zhang YC, Scanlon BR et al (2013) Energy/water budgets and productivity of the typicalcroplands irrigated with groundwater and surface water in the North China Plain. Agric forMeteorol 181(01):133–142. https://doi.org/10.1016/j.agrformet.2013.07.013
Su P, Yang J, Li Z, LiuY (2017).Mining actionable behavioral rules based on decision tree classifier.In: 13th International conference on Semantics, Knowledge and Grids (SKG), IEEE, Beijing,China, pp 139–143. https://doi.org/10.1109/SKG.2017.00030
Wang J, Wang E, Yang XG et al (2012) Increased yield potential of wheat-maize cropping systemin the North China Plain by climate change adaptation. Climatic Change 113(3):825–840. https://doi.org/10.1007/s10584-011-0385-1
Wang X, Li XB, Tan MH et al (2015) Remote sensing monitoring of changes in winter wheat areain North China Plain from 2001 to 2011. Trans Chin Soc Agric Eng 31(8):190–199
Xiao DP, Tao FL, Liu YJ et al (2013) Observed changes in winter wheat phenology in the NorthChina Plain for 1981–2009. Int J Biometeorol 57(2):275–285. https://doi.org/10.1007/s00484-012-0552-8
Yuan ZJ, Shen YJ (2013) Estimation of agricultural water consumption from meteorological andyield data: a case study of Hebei North China. Plos ONE 8(3):e58685. https://doi.org/10.1371/journal.pone.0058685
ZhangXY, Chen SY, SunHY et al (2011) Changes in evapotranspiration over irrigated winter wheatandmaize in North China Plain over three decades. AgricWaterManag 98(6):1097–1104. https://doi.org/10.1016/j.agwat.2011.02.003
Zhang XL, Ren L, Kong XB (2016) Estimating spatiotemporal variability and sustainability ofshallow groundwater in a well-irrigated plain of the Haihe River basin using SWAT model. JHydrol 541:1221–1240. https://doi.org/10.1016/j.jhydrol.2016.08.030
Open Access This chapter is licensed under the terms of the Creative Commons Attribution 4.0International License (http://creativecommons.org/licenses/by/4.0/), which permits use, sharing,adaptation, distribution and reproduction in any medium or format, as long as you give appropriatecredit to the original author(s) and the source, provide a link to the Creative Commons license andindicate if changes were made.
The images or other third party material in this chapter are included in the chapter’s CreativeCommons license, unless indicated otherwise in a credit line to the material. If material is notincluded in the chapter’s Creative Commons license and your intended use is not permitted bystatutory regulation or exceeds the permitted use, you will need to obtain permission directly fromthe copyright holder.
Chapter 4Decision Support for Local WaterAuthorities in Guantao
Policy selection and implementation rely on monitoring data and technical decisionsupport tools. Monitoring data of Guantao County include groundwater levels at 55observation wells, pumping rates of 7600 wells, surface water flows, precipitation,and land use in monthly time steps. The most difficult task is to monitor pumpingof thousands of primitive irrigation wells. As all wells are powered by electricityin Guantao, monitoring via electricity consumption was chosen and shown to beeffective. The electricity-to-water conversion factor is established via pumping tests.Four different groundwatermodelswere developed serving different purposes: A boxmodel computing the groundwater balance and the water gap of Guantao County; Adistributed model of the shallow aquifer visualizing the spatial variation of ground-water levels and priority areas for pumping control; A real-time model updating andimproving the distributed model by assimilating monthly observation data; And anupscalable data driven model using machine learning algorithms to forecast ground-water levels. All these tools together with monitoring data and current pumpingcontrol options are integrated in a web-based decision support system with a user-friendly interface. It allows local water managers without specialized knowledge touse complex technical tools in their groundwater management practice.
Electronic supplementary material The online version of this chapter(https://doi.org/10.1007/978-981-16-5843-3_4) contains supplementary material, which isavailable to authorized users.
© The Author(s) 2022W. Kinzelbach et al., Groundwater Overexploitation in the North China Plain:A path to Sustainability, Springer Water,https://doi.org/10.1007/978-981-16-5843-3_4
77
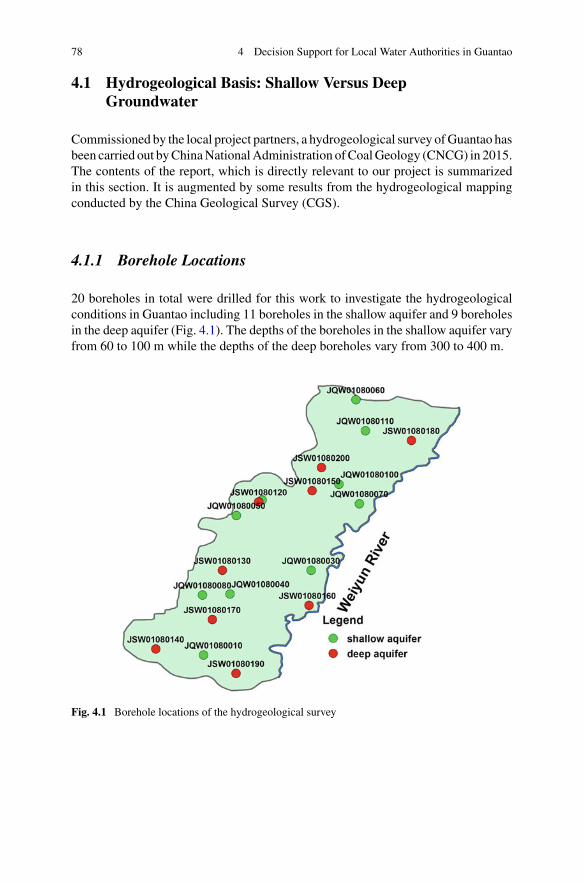
78 4 Decision Support for Local Water Authorities in Guantao
4.1 Hydrogeological Basis: Shallow Versus DeepGroundwater
Commissioned by the local project partners, a hydrogeological survey ofGuantao hasbeen carried out byChinaNationalAdministration ofCoalGeology (CNCG) in 2015.The contents of the report, which is directly relevant to our project is summarizedin this section. It is augmented by some results from the hydrogeological mappingconducted by the China Geological Survey (CGS).
4.1.1 Borehole Locations
20 boreholes in total were drilled for this work to investigate the hydrogeologicalconditions in Guantao including 11 boreholes in the shallow aquifer and 9 boreholesin the deep aquifer (Fig. 4.1). The depths of the boreholes in the shallow aquifer varyfrom 60 to 100 m while the depths of the deep boreholes vary from 300 to 400 m.
Fig. 4.1 Borehole locations of the hydrogeological survey
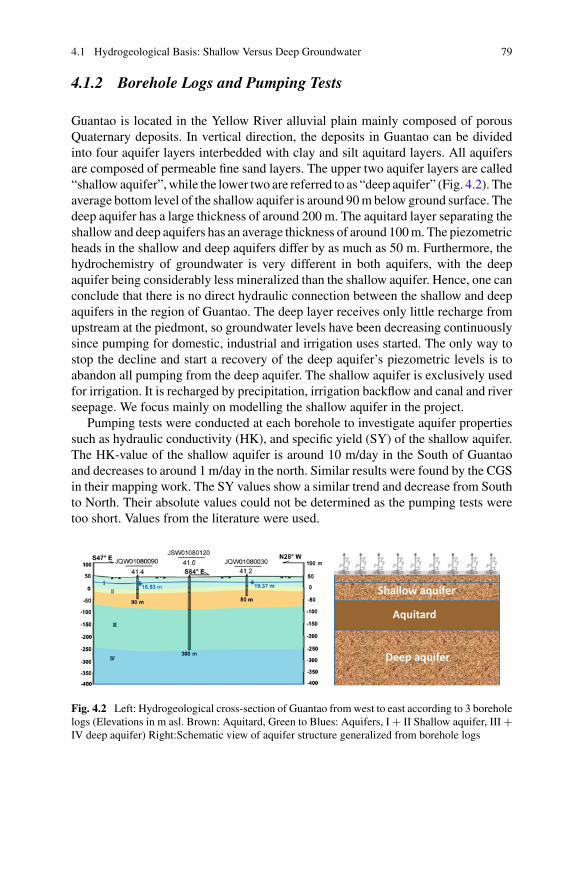
4.1 Hydrogeological Basis: Shallow Versus Deep Groundwater 79
4.1.2 Borehole Logs and Pumping Tests
Guantao is located in the Yellow River alluvial plain mainly composed of porousQuaternary deposits. In vertical direction, the deposits in Guantao can be dividedinto four aquifer layers interbedded with clay and silt aquitard layers. All aquifersare composed of permeable fine sand layers. The upper two aquifer layers are called“shallow aquifer”,while the lower two are referred to as “deep aquifer” (Fig. 4.2). Theaverage bottom level of the shallow aquifer is around 90mbelow ground surface. Thedeep aquifer has a large thickness of around 200 m. The aquitard layer separating theshallow and deep aquifers has an average thickness of around 100m. The piezometricheads in the shallow and deep aquifers differ by as much as 50 m. Furthermore, thehydrochemistry of groundwater is very different in both aquifers, with the deepaquifer being considerably less mineralized than the shallow aquifer. Hence, one canconclude that there is no direct hydraulic connection between the shallow and deepaquifers in the region of Guantao. The deep layer receives only little recharge fromupstream at the piedmont, so groundwater levels have been decreasing continuouslysince pumping for domestic, industrial and irrigation uses started. The only way tostop the decline and start a recovery of the deep aquifer’s piezometric levels is toabandon all pumping from the deep aquifer. The shallow aquifer is exclusively usedfor irrigation. It is recharged by precipitation, irrigation backflow and canal and riverseepage. We focus mainly on modelling the shallow aquifer in the project.
Pumping tests were conducted at each borehole to investigate aquifer propertiessuch as hydraulic conductivity (HK), and specific yield (SY) of the shallow aquifer.The HK-value of the shallow aquifer is around 10 m/day in the South of Guantaoand decreases to around 1 m/day in the north. Similar results were found by the CGSin their mapping work. The SY values show a similar trend and decrease from Southto North. Their absolute values could not be determined as the pumping tests weretoo short. Values from the literature were used.
Shallow aquifer
Aquitard
Deep aquifer
Fig. 4.2 Left: Hydrogeological cross-section of Guantao from west to east according to 3 boreholelogs (Elevations in m asl. Brown: Aquitard, Green to Blues: Aquifers, I+ II Shallow aquifer, III+IV deep aquifer) Right:Schematic view of aquifer structure generalized from borehole logs
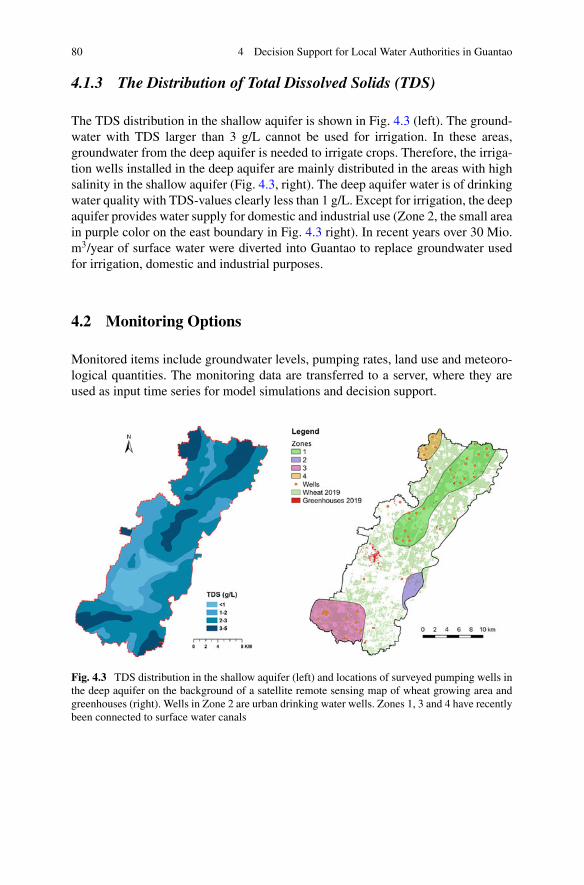
80 4 Decision Support for Local Water Authorities in Guantao
4.1.3 The Distribution of Total Dissolved Solids (TDS)
The TDS distribution in the shallow aquifer is shown in Fig. 4.3 (left). The ground-water with TDS larger than 3 g/L cannot be used for irrigation. In these areas,groundwater from the deep aquifer is needed to irrigate crops. Therefore, the irriga-tion wells installed in the deep aquifer are mainly distributed in the areas with highsalinity in the shallow aquifer (Fig. 4.3, right). The deep aquifer water is of drinkingwater quality with TDS-values clearly less than 1 g/L. Except for irrigation, the deepaquifer provides water supply for domestic and industrial use (Zone 2, the small areain purple color on the east boundary in Fig. 4.3 right). In recent years over 30 Mio.m3/year of surface water were diverted into Guantao to replace groundwater usedfor irrigation, domestic and industrial purposes.
4.2 Monitoring Options
Monitored items include groundwater levels, pumping rates, land use and meteoro-logical quantities. The monitoring data are transferred to a server, where they areused as input time series for model simulations and decision support.
Fig. 4.3 TDS distribution in the shallow aquifer (left) and locations of surveyed pumping wells inthe deep aquifer on the background of a satellite remote sensing map of wheat growing area andgreenhouses (right). Wells in Zone 2 are urban drinking water wells. Zones 1, 3 and 4 have recentlybeen connected to surface water canals
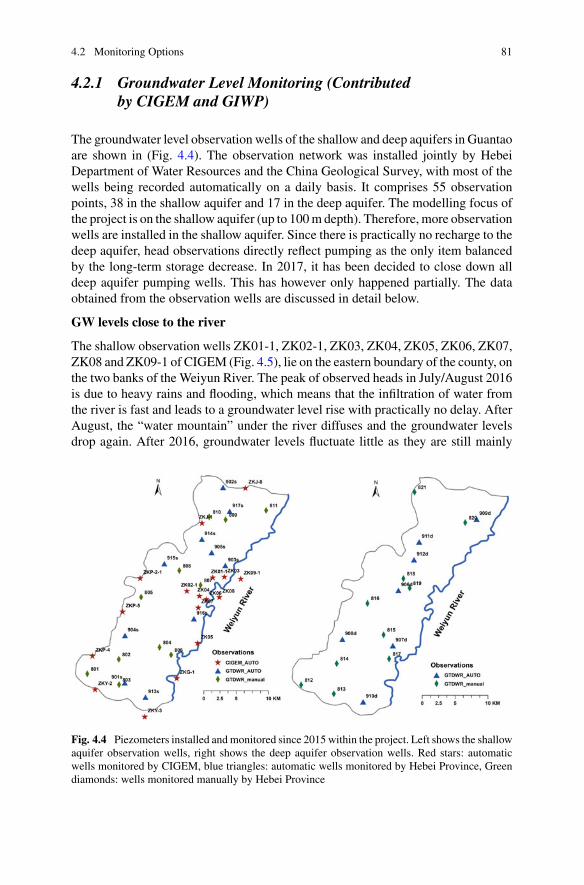
4.2 Monitoring Options 81
4.2.1 Groundwater Level Monitoring (Contributedby CIGEM and GIWP)
The groundwater level observation wells of the shallow and deep aquifers in Guantaoare shown in (Fig. 4.4). The observation network was installed jointly by HebeiDepartment of Water Resources and the China Geological Survey, with most of thewells being recorded automatically on a daily basis. It comprises 55 observationpoints, 38 in the shallow aquifer and 17 in the deep aquifer. The modelling focus ofthe project is on the shallow aquifer (up to 100m depth). Therefore, more observationwells are installed in the shallow aquifer. Since there is practically no recharge to thedeep aquifer, head observations directly reflect pumping as the only item balancedby the long-term storage decrease. In 2017, it has been decided to close down alldeep aquifer pumping wells. This has however only happened partially. The dataobtained from the observation wells are discussed in detail below.
GW levels close to the river
The shallow observation wells ZK01-1, ZK02-1, ZK03, ZK04, ZK05, ZK06, ZK07,ZK08 and ZK09-1 of CIGEM (Fig. 4.5), lie on the eastern boundary of the county, onthe two banks of the Weiyun River. The peak of observed heads in July/August 2016is due to heavy rains and flooding, which means that the infiltration of water fromthe river is fast and leads to a groundwater level rise with practically no delay. AfterAugust, the “water mountain” under the river diffuses and the groundwater levelsdrop again. After 2016, groundwater levels fluctuate little as they are still mainly
Fig. 4.4 Piezometers installed andmonitored since 2015 within the project. Left shows the shallowaquifer observation wells, right shows the deep aquifer observation wells. Red stars: automaticwells monitored by CIGEM, blue triangles: automatic wells monitored by Hebei Province, Greendiamonds: wells monitored manually by Hebei Province
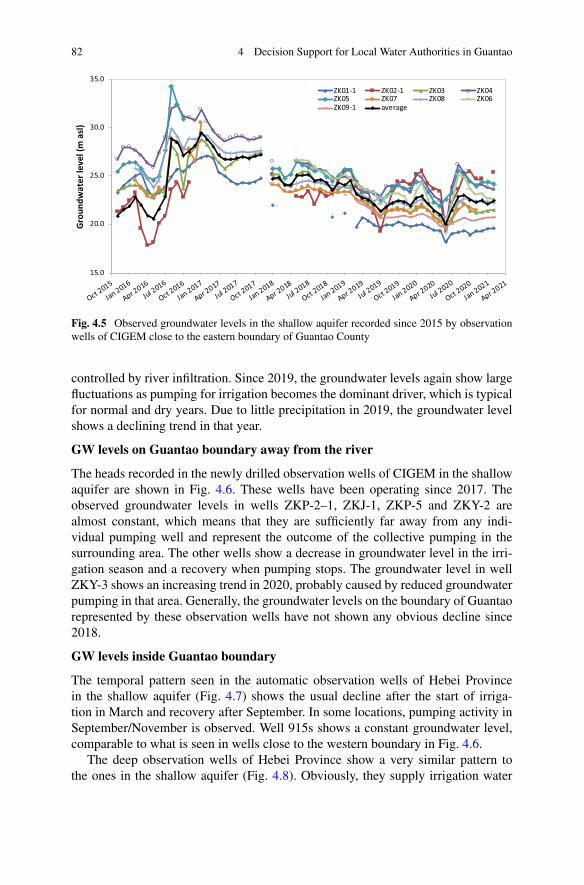
82 4 Decision Support for Local Water Authorities in Guantao
15.0
20.0
25.0
30.0
35.0
Oct 2015
Jan 2016
Apr 2016Jul 2016
Oct 2016
Jan 2017
Apr 2017Jul 2017
Oct 2017
Jan 2018
Apr 2018Jul 2018
Oct 2018
Jan 2019
Apr 2019Jul 2019
Oct 2019
Jan 2020
Apr 2020Jul 2020
Oct 2020
Jan 2021
Apr 2021
Grou
ndw
ater
leve
l (m
asl
)ZK01-1 ZK02-1 ZK03 ZK04ZK05 ZK07 ZK08 ZK06ZK09-1 average
Fig. 4.5 Observed groundwater levels in the shallow aquifer recorded since 2015 by observationwells of CIGEM close to the eastern boundary of Guantao County
controlled by river infiltration. Since 2019, the groundwater levels again show largefluctuations as pumping for irrigation becomes the dominant driver, which is typicalfor normal and dry years. Due to little precipitation in 2019, the groundwater levelshows a declining trend in that year.
GW levels on Guantao boundary away from the river
The heads recorded in the newly drilled observation wells of CIGEM in the shallowaquifer are shown in Fig. 4.6. These wells have been operating since 2017. Theobserved groundwater levels in wells ZKP-2–1, ZKJ-1, ZKP-5 and ZKY-2 arealmost constant, which means that they are sufficiently far away from any indi-vidual pumping well and represent the outcome of the collective pumping in thesurrounding area. The other wells show a decrease in groundwater level in the irri-gation season and a recovery when pumping stops. The groundwater level in wellZKY-3 shows an increasing trend in 2020, probably caused by reduced groundwaterpumping in that area. Generally, the groundwater levels on the boundary of Guantaorepresented by these observation wells have not shown any obvious decline since2018.
GW levels inside Guantao boundary
The temporal pattern seen in the automatic observation wells of Hebei Provincein the shallow aquifer (Fig. 4.7) shows the usual decline after the start of irriga-tion in March and recovery after September. In some locations, pumping activity inSeptember/November is observed. Well 915s shows a constant groundwater level,comparable to what is seen in wells close to the western boundary in Fig. 4.6.
The deep observation wells of Hebei Province show a very similar pattern tothe ones in the shallow aquifer (Fig. 4.8). Obviously, they supply irrigation water
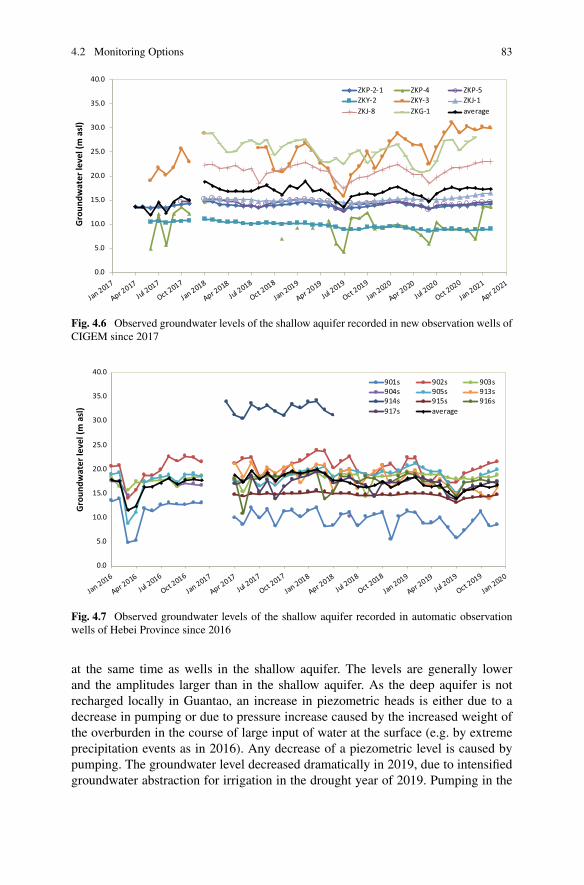
4.2 Monitoring Options 83
0.0
5.0
10.0
15.0
20.0
25.0
30.0
35.0
40.0
Jan 2017
Apr 2017Jul 2017
Oct 2017
Jan 2018
Apr 2018Jul 2018
Oct 2018
Jan 2019
Apr 2019Jul 2019
Oct 2019
Jan 2020
Apr 2020Jul 2020
Oct 2020
Jan 2021
Apr 2021
Grou
ndw
ater
leve
l (m
asl
)ZKP-2-1 ZKP-4 ZKP-5ZKY-2 ZKY-3 ZKJ-1ZKJ-8 ZKG-1 average
Fig. 4.6 Observed groundwater levels of the shallow aquifer recorded in new observation wells ofCIGEM since 2017
0.0
5.0
10.0
15.0
20.0
25.0
30.0
35.0
40.0
Jan 2016
Apr 2016Jul 2016
Oct 2016
Jan 2017
Apr 2017Jul 2017
Oct 2017
Jan 2018
Apr 2018Jul 2018
Oct 2018
Jan 2019
Apr 2019Jul 2019
Oct 2019
Jan 2020
Grou
ndw
ater
leve
l (m
asl
)
901s 902s 903s904s 905s 913s914s 915s 916s917s average
Fig. 4.7 Observed groundwater levels of the shallow aquifer recorded in automatic observationwells of Hebei Province since 2016
at the same time as wells in the shallow aquifer. The levels are generally lowerand the amplitudes larger than in the shallow aquifer. As the deep aquifer is notrecharged locally in Guantao, an increase in piezometric heads is either due to adecrease in pumping or due to pressure increase caused by the increased weight ofthe overburden in the course of large input of water at the surface (e.g. by extremeprecipitation events as in 2016). Any decrease of a piezometric level is caused bypumping. The groundwater level decreased dramatically in 2019, due to intensifiedgroundwater abstraction for irrigation in the drought year of 2019. Pumping in the
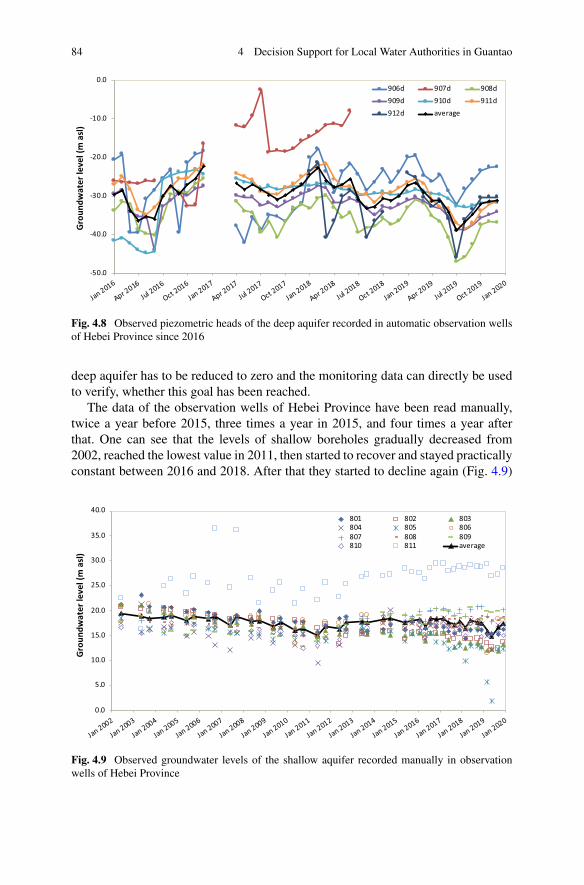
84 4 Decision Support for Local Water Authorities in Guantao
-50.0
-40.0
-30.0
-20.0
-10.0
0.0
Jan 2016
Apr 2016
Jul 2016
Oct 2016
Jan 2017
Apr 2017
Jul 2017
Oct 2017
Jan 2018
Apr 2018
Jul 2018
Oct 2018
Jan 2019
Apr 2019
Jul 2019
Oct 2019
Jan 2020
Grou
ndw
ater
leve
l (m
asl
)906d 907d 908d909d 910d 911d912d average
Fig. 4.8 Observed piezometric heads of the deep aquifer recorded in automatic observation wellsof Hebei Province since 2016
deep aquifer has to be reduced to zero and the monitoring data can directly be usedto verify, whether this goal has been reached.
The data of the observation wells of Hebei Province have been read manually,twice a year before 2015, three times a year in 2015, and four times a year afterthat. One can see that the levels of shallow boreholes gradually decreased from2002, reached the lowest value in 2011, then started to recover and stayed practicallyconstant between 2016 and 2018. After that they started to decline again (Fig. 4.9)
0.0
5.0
10.0
15.0
20.0
25.0
30.0
35.0
40.0
Jan 2002
Jan 2003
Jan 2004
Jan 2005
Jan 2006
Jan 2007
Jan 2008
Jan 2009
Jan 2010
Jan 2011
Jan 2012
Jan 2013
Jan 2014
Jan 2015
Jan 2016
Jan 2017
Jan 2018
Jan 2019
Jan 2020
Gro
undw
ater
leve
l (m
asl
)
801 802 803804 805 806807 808 809810 811 average
Fig. 4.9 Observed groundwater levels of the shallow aquifer recorded manually in observationwells of Hebei Province
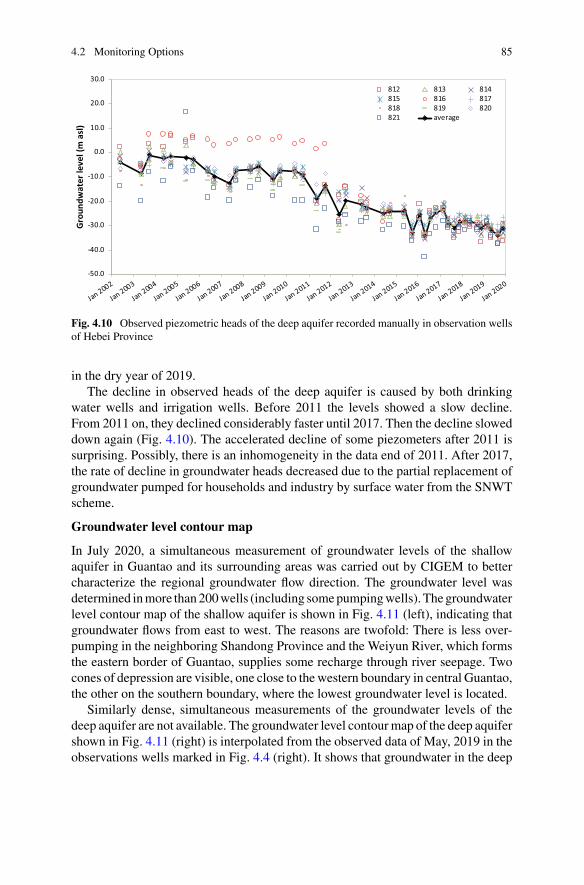
4.2 Monitoring Options 85
-50.0
-40.0
-30.0
-20.0
-10.0
0.0
10.0
20.0
30.0
Jan 2002
Jan 2003
Jan 2004
Jan 2005
Jan 2006
Jan 2007
Jan 2008
Jan 2009
Jan 2010
Jan 2011
Jan 2012
Jan 2013
Jan 2014
Jan 2015
Jan 2016
Jan 2017
Jan 2018
Jan 2019
Jan 2020
Grou
ndw
ater
leve
l (m
asl
)812 813 814815 816 817818 819 820821 average
Fig. 4.10 Observed piezometric heads of the deep aquifer recorded manually in observation wellsof Hebei Province
in the dry year of 2019.The decline in observed heads of the deep aquifer is caused by both drinking
water wells and irrigation wells. Before 2011 the levels showed a slow decline.From 2011 on, they declined considerably faster until 2017. Then the decline sloweddown again (Fig. 4.10). The accelerated decline of some piezometers after 2011 issurprising. Possibly, there is an inhomogeneity in the data end of 2011. After 2017,the rate of decline in groundwater heads decreased due to the partial replacement ofgroundwater pumped for households and industry by surface water from the SNWTscheme.
Groundwater level contour map
In July 2020, a simultaneous measurement of groundwater levels of the shallowaquifer in Guantao and its surrounding areas was carried out by CIGEM to bettercharacterize the regional groundwater flow direction. The groundwater level wasdetermined inmore than200wells (including somepumpingwells). Thegroundwaterlevel contour map of the shallow aquifer is shown in Fig. 4.11 (left), indicating thatgroundwater flows from east to west. The reasons are twofold: There is less over-pumping in the neighboring Shandong Province and the Weiyun River, which formsthe eastern border of Guantao, supplies some recharge through river seepage. Twocones of depression are visible, one close to thewestern boundary in central Guantao,the other on the southern boundary, where the lowest groundwater level is located.
Similarly dense, simultaneous measurements of the groundwater levels of thedeep aquifer are not available. The groundwater level contourmap of the deep aquifershown in Fig. 4.11 (right) is interpolated from the observed data of May, 2019 in theobservations wells marked in Fig. 4.4 (right). It shows that groundwater in the deep
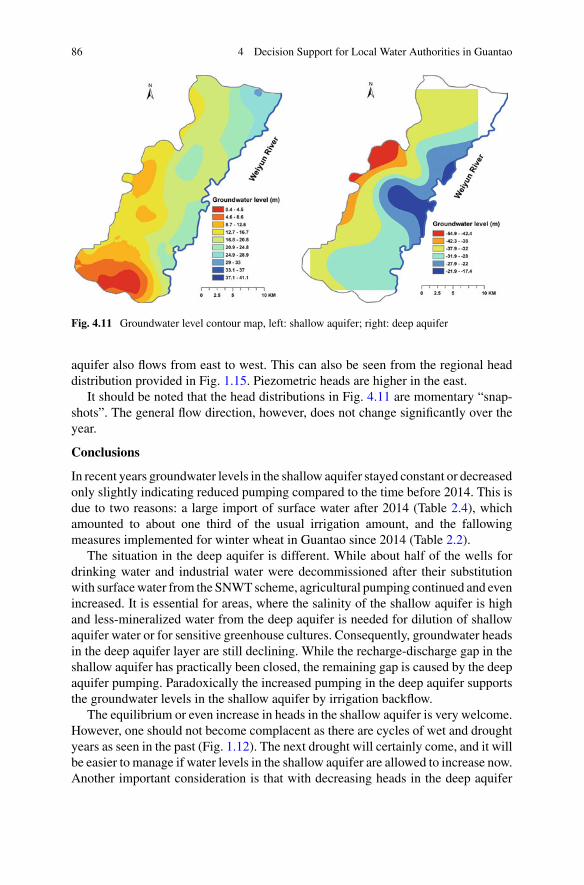
86 4 Decision Support for Local Water Authorities in Guantao
Fig. 4.11 Groundwater level contour map, left: shallow aquifer; right: deep aquifer
aquifer also flows from east to west. This can also be seen from the regional headdistribution provided in Fig. 1.15. Piezometric heads are higher in the east.
It should be noted that the head distributions in Fig. 4.11 are momentary “snap-shots”. The general flow direction, however, does not change significantly over theyear.
Conclusions
In recent years groundwater levels in the shallow aquifer stayed constant or decreasedonly slightly indicating reduced pumping compared to the time before 2014. This isdue to two reasons: a large import of surface water after 2014 (Table 2.4), whichamounted to about one third of the usual irrigation amount, and the fallowingmeasures implemented for winter wheat in Guantao since 2014 (Table 2.2).
The situation in the deep aquifer is different. While about half of the wells fordrinking water and industrial water were decommissioned after their substitutionwith surfacewater from the SNWTscheme, agricultural pumping continued and evenincreased. It is essential for areas, where the salinity of the shallow aquifer is highand less-mineralized water from the deep aquifer is needed for dilution of shallowaquifer water or for sensitive greenhouse cultures. Consequently, groundwater headsin the deep aquifer layer are still declining. While the recharge-discharge gap in theshallow aquifer has practically been closed, the remaining gap is caused by the deepaquifer pumping. Paradoxically the increased pumping in the deep aquifer supportsthe groundwater levels in the shallow aquifer by irrigation backflow.
The equilibrium or even increase in heads in the shallow aquifer is very welcome.However, one should not become complacent as there are cycles of wet and droughtyears as seen in the past (Fig. 1.12). The next drought will certainly come, and it willbe easier to manage if water levels in the shallow aquifer are allowed to increase now.Another important consideration is that with decreasing heads in the deep aquifer
4.2 Monitoring Options 87
and with stagnant or increasing heads in the shallow aquifer the head differencebetween the two aquifers is further increasing. This implies an increased possibilityof contamination of the high-quality water of the deep aquifer by leakage from thesaline aquifer and aquitard above (Fig. 1.13). Finally, the continued recycling ofirrigation water in a closed system such as a regional cone of depression in theshallow aquifer will inevitably lead to salt accumulation and thus deterioration ofwater quality. A sustainable system must provide an outlet for dissolved salts viadrainage. Such outlets arise naturally if the drainage function of rivers and streamsis revitalized by a sufficiently high water table.
4.2.2 Groundwater Pumping Monitoring
Awater meter is the most straightforward method to monitor groundwater pumping.However, direct water metering at irrigation wells is still absent in most of the NCPdespite huge investments by the local water authority. In comparison to the moni-toring of groundwater levels, monitoring of abstraction is much more difficult, giventhe large number of wells. There are 7300 shallow pumping wells and 300 deeppumping wells. A low-cost metering solution would use cheap mechanical meterson each well, which are read off once a year. However, this solution is not deemedfeasible by the water authorities. Previous experience shows that mechanical metersare unreliable and commonly tampered with. They often break under freezing condi-tions. They are not inseparably connected to pumps. They are removed when pumpsare repaired, moved to another well, or completely taken out of the wells in winter.
Amodernhigh-end solution is the smartwatermeter,which is offered for irrigationwells by several suppliers inChina.A smartwatermeter is operatedwith a swipe card,which carries a prepaid amount of water. The volume pumped is abstracted from theamount stored on the card. The protection against tampering comes with the wirelessconnection of the smart meter to a server, receiving in real time all relevant data fromthewell usually at an interval of one hour. The transmissionmakes sure that themeteris working properly. If this is not the case, service personnel have to be sent to thefield immediately to repair the meter. In China, such a system was first introduced inMinqin County, Gansu Province, in 2007 (Liu 2016). In the Sino-Swiss groundwaterproject’s Heihe pilot site in Luotuocheng, Gansu Province, a smart metering systemhas been installed on 700 wells of the irrigation district in 2015, which is functioningvery well up to today (Li et al. 2021b). The reasons for its functioning are fourfold:Wells have large capacities pumping around 150,000 m3/year. They provide fullirrigation under arid climate leading to a non-negligible water bill for the singleuser. The collection of a high water fee of 0.1 CNY for every cubic meter pumpedprovides sufficient funds for the maintenance of the system. Finally, smart metershave been classified as electrical equipment, making vandalism against them a crimepunishable by existing law. None of these conditions is fulfilled in the NCP.
Equipment of more than 1000 wells in Guantao with smart water meters hasbeen tried by Hebei Department of Water Resources with disappointing results. Of
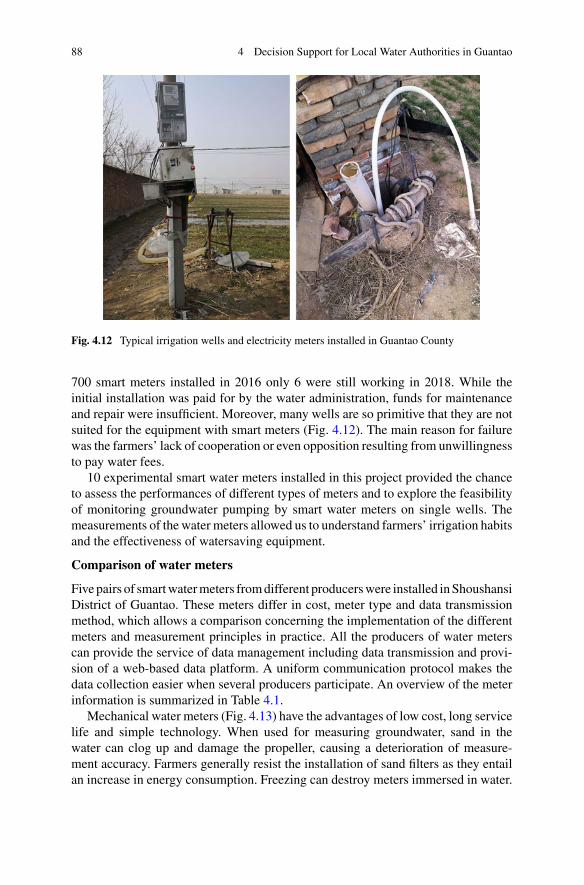
88 4 Decision Support for Local Water Authorities in Guantao
Fig. 4.12 Typical irrigation wells and electricity meters installed in Guantao County
700 smart meters installed in 2016 only 6 were still working in 2018. While theinitial installation was paid for by the water administration, funds for maintenanceand repair were insufficient. Moreover, many wells are so primitive that they are notsuited for the equipment with smart meters (Fig. 4.12). The main reason for failurewas the farmers’ lack of cooperation or even opposition resulting from unwillingnessto pay water fees.
10 experimental smart water meters installed in this project provided the chanceto assess the performances of different types of meters and to explore the feasibilityof monitoring groundwater pumping by smart water meters on single wells. Themeasurements of the water meters allowed us to understand farmers’ irrigation habitsand the effectiveness of watersaving equipment.
Comparison of water meters
Fivepairs of smartwatermeters fromdifferent producerswere installed inShoushansiDistrict of Guantao. These meters differ in cost, meter type and data transmissionmethod, which allows a comparison concerning the implementation of the differentmeters and measurement principles in practice. All the producers of water meterscan provide the service of data management including data transmission and provi-sion of a web-based data platform. A uniform communication protocol makes thedata collection easier when several producers participate. An overview of the meterinformation is summarized in Table 4.1.
Mechanical water meters (Fig. 4.13) have the advantages of low cost, long servicelife and simple technology. When used for measuring groundwater, sand in thewater can clog up and damage the propeller, causing a deterioration of measure-ment accuracy. Farmers generally resist the installation of sand filters as they entailan increase in energy consumption. Freezing can destroy meters immersed in water.
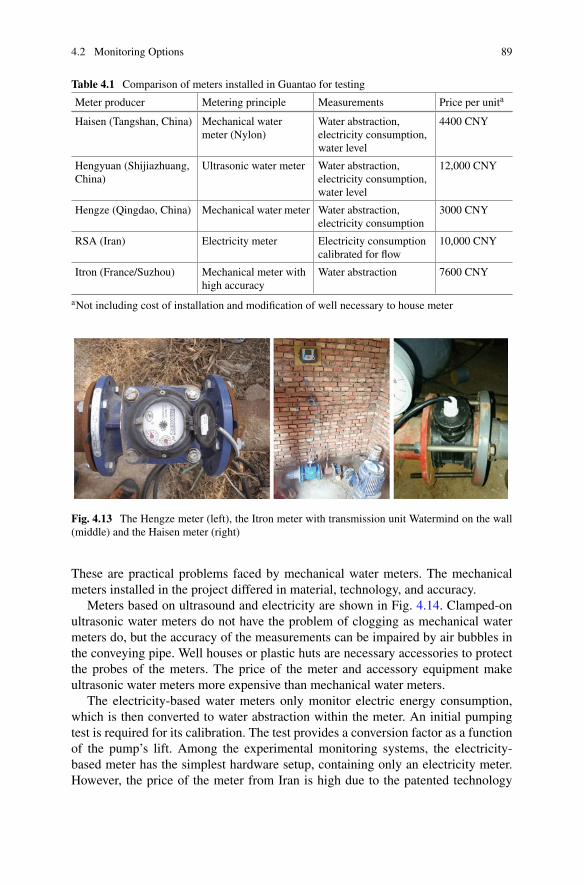
4.2 Monitoring Options 89
Table 4.1 Comparison of meters installed in Guantao for testing
Meter producer Metering principle Measurements Price per unita
Haisen (Tangshan, China) Mechanical watermeter (Nylon)
Water abstraction,electricity consumption,water level
4400 CNY
Hengyuan (Shijiazhuang,China)
Ultrasonic water meter Water abstraction,electricity consumption,water level
12,000 CNY
Hengze (Qingdao, China) Mechanical water meter Water abstraction,electricity consumption
3000 CNY
RSA (Iran) Electricity meter Electricity consumptioncalibrated for flow
10,000 CNY
Itron (France/Suzhou) Mechanical meter withhigh accuracy
Water abstraction 7600 CNY
aNot including cost of installation and modification of well necessary to house meter
Fig. 4.13 The Hengze meter (left), the Itron meter with transmission unit Watermind on the wall(middle) and the Haisen meter (right)
These are practical problems faced by mechanical water meters. The mechanicalmeters installed in the project differed in material, technology, and accuracy.
Meters based on ultrasound and electricity are shown in Fig. 4.14. Clamped-onultrasonic water meters do not have the problem of clogging as mechanical watermeters do, but the accuracy of the measurements can be impaired by air bubbles inthe conveying pipe. Well houses or plastic huts are necessary accessories to protectthe probes of the meters. The price of the meter and accessory equipment makeultrasonic water meters more expensive than mechanical water meters.
The electricity-based water meters only monitor electric energy consumption,which is then converted to water abstraction within the meter. An initial pumpingtest is required for its calibration. The test provides a conversion factor as a functionof the pump’s lift. Among the experimental monitoring systems, the electricity-based meter has the simplest hardware setup, containing only an electricity meter.However, the price of the meter from Iran is high due to the patented technology
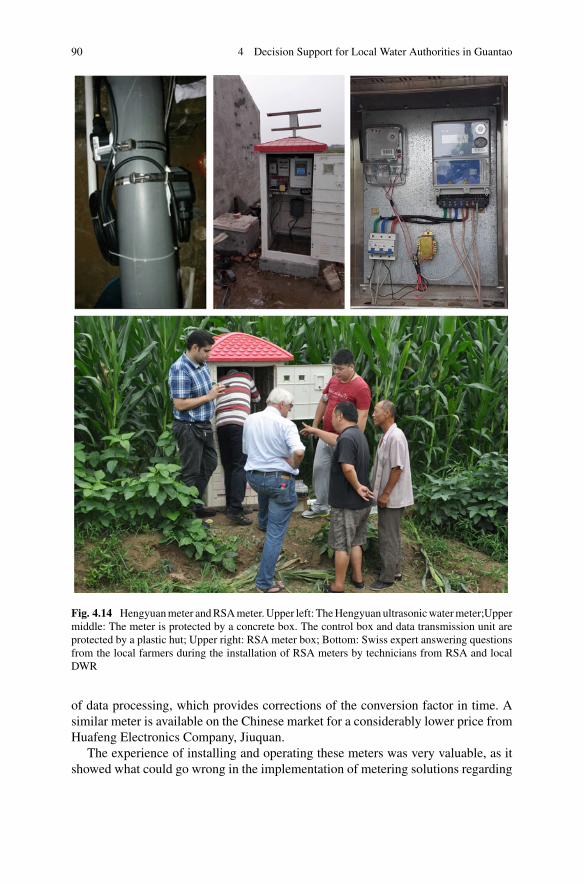
90 4 Decision Support for Local Water Authorities in Guantao
Fig. 4.14 Hengyuanmeter andRSAmeter.Upper left: TheHengyuanultrasonicwatermeter;Uppermiddle: The meter is protected by a concrete box. The control box and data transmission unit areprotected by a plastic hut; Upper right: RSA meter box; Bottom: Swiss expert answering questionsfrom the local farmers during the installation of RSA meters by technicians from RSA and localDWR
of data processing, which provides corrections of the conversion factor in time. Asimilar meter is available on the Chinese market for a considerably lower price fromHuafeng Electronics Company, Jiuquan.
The experience of installing and operating these meters was very valuable, as itshowed what could go wrong in the implementation of metering solutions regarding
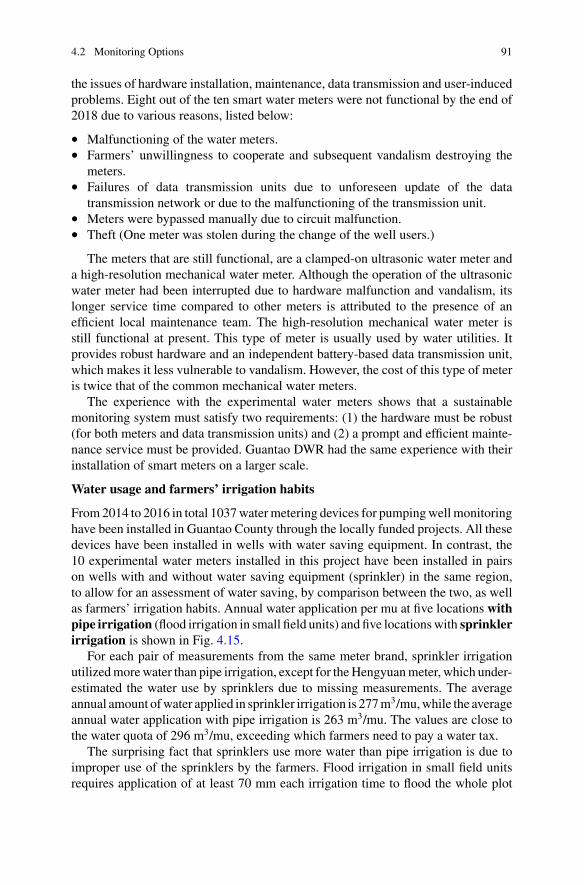
4.2 Monitoring Options 91
the issues of hardware installation, maintenance, data transmission and user-inducedproblems. Eight out of the ten smart water meters were not functional by the end of2018 due to various reasons, listed below:
• Malfunctioning of the water meters.• Farmers’ unwillingness to cooperate and subsequent vandalism destroying the
meters.• Failures of data transmission units due to unforeseen update of the data
transmission network or due to the malfunctioning of the transmission unit.• Meters were bypassed manually due to circuit malfunction.• Theft (One meter was stolen during the change of the well users.)
The meters that are still functional, are a clamped-on ultrasonic water meter anda high-resolution mechanical water meter. Although the operation of the ultrasonicwater meter had been interrupted due to hardware malfunction and vandalism, itslonger service time compared to other meters is attributed to the presence of anefficient local maintenance team. The high-resolution mechanical water meter isstill functional at present. This type of meter is usually used by water utilities. Itprovides robust hardware and an independent battery-based data transmission unit,which makes it less vulnerable to vandalism. However, the cost of this type of meteris twice that of the common mechanical water meters.
The experience with the experimental water meters shows that a sustainablemonitoring system must satisfy two requirements: (1) the hardware must be robust(for both meters and data transmission units) and (2) a prompt and efficient mainte-nance service must be provided. Guantao DWR had the same experience with theirinstallation of smart meters on a larger scale.
Water usage and farmers’ irrigation habits
From2014 to 2016 in total 1037watermetering devices for pumpingwellmonitoringhave been installed in Guantao County through the locally funded projects. All thesedevices have been installed in wells with water saving equipment. In contrast, the10 experimental water meters installed in this project have been installed in pairson wells with and without water saving equipment (sprinkler) in the same region,to allow for an assessment of water saving, by comparison between the two, as wellas farmers’ irrigation habits. Annual water application per mu at five locations withpipe irrigation (flood irrigation in small field units) and five locationswith sprinklerirrigation is shown in Fig. 4.15.
For each pair of measurements from the same meter brand, sprinkler irrigationutilizedmorewater than pipe irrigation, except for theHengyuanmeter, which under-estimated the water use by sprinklers due to missing measurements. The averageannual amount ofwater applied in sprinkler irrigation is 277m3/mu,while the averageannual water application with pipe irrigation is 263 m3/mu. The values are close tothe water quota of 296 m3/mu, exceeding which farmers need to pay a water tax.
The surprising fact that sprinklers use more water than pipe irrigation is due toimproper use of the sprinklers by the farmers. Flood irrigation in small field unitsrequires application of at least 70 mm each irrigation time to flood the whole plot
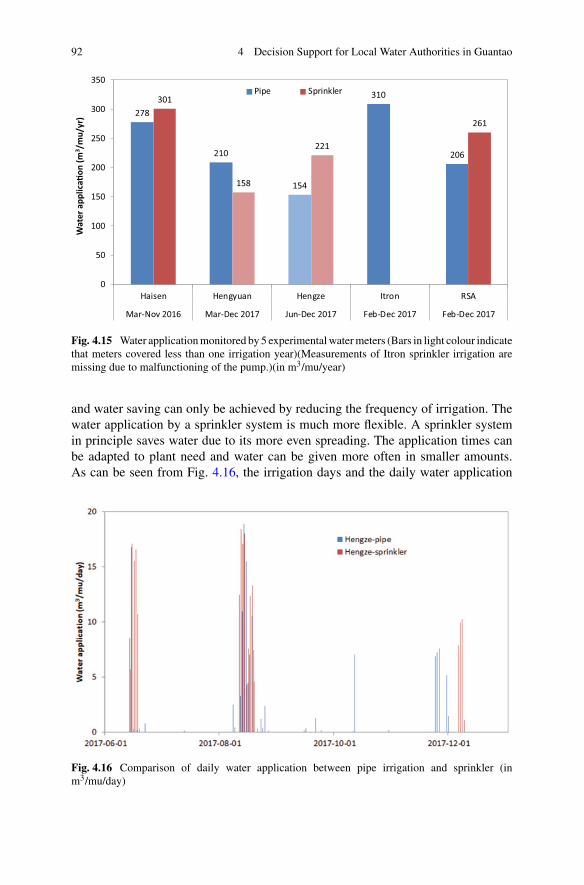
92 4 Decision Support for Local Water Authorities in Guantao
278
210
154
310
206
301
158
221
261
0
50
100
150
200
250
300
350
Haisen Hengyuan Hengze Itron RSA
Mar-Nov 2016 Mar-Dec 2017 Jun-Dec 2017 Feb-Dec 2017 Feb-Dec 2017
Wat
er a
pplic
a�on
(m3 /m
u/yr
)Pipe Sprinkler
Fig. 4.15 Water applicationmonitored by 5 experimentalwatermeters (Bars in light colour indicatethat meters covered less than one irrigation year)(Measurements of Itron sprinkler irrigation aremissing due to malfunctioning of the pump.)(in m3/mu/year)
and water saving can only be achieved by reducing the frequency of irrigation. Thewater application by a sprinkler system is much more flexible. A sprinkler systemin principle saves water due to its more even spreading. The application times canbe adapted to plant need and water can be given more often in smaller amounts.As can be seen from Fig. 4.16, the irrigation days and the daily water application
Fig. 4.16 Comparison of daily water application between pipe irrigation and sprinkler (inm3/mu/day)
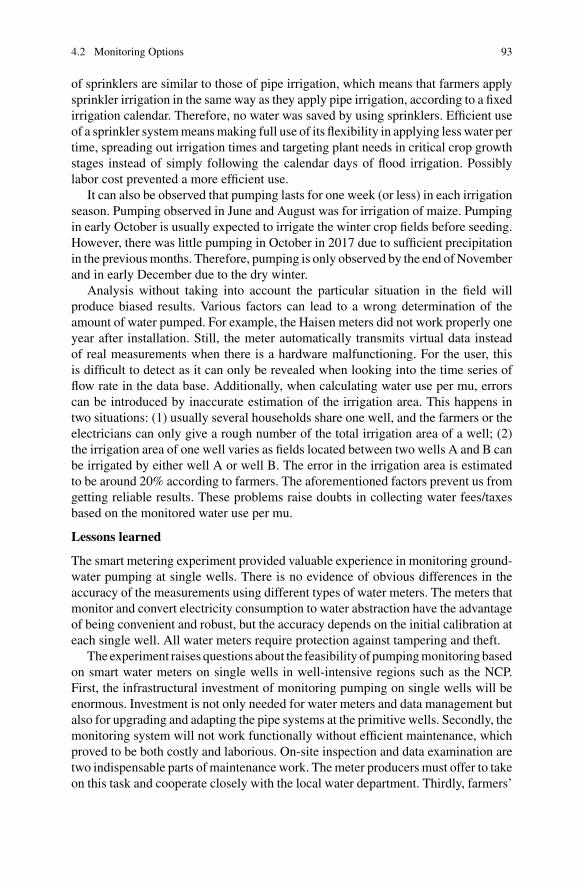
4.2 Monitoring Options 93
of sprinklers are similar to those of pipe irrigation, which means that farmers applysprinkler irrigation in the same way as they apply pipe irrigation, according to a fixedirrigation calendar. Therefore, no water was saved by using sprinklers. Efficient useof a sprinkler systemmeansmaking full use of its flexibility in applying lesswater pertime, spreading out irrigation times and targeting plant needs in critical crop growthstages instead of simply following the calendar days of flood irrigation. Possiblylabor cost prevented a more efficient use.
It can also be observed that pumping lasts for one week (or less) in each irrigationseason. Pumping observed in June and August was for irrigation of maize. Pumpingin early October is usually expected to irrigate the winter crop fields before seeding.However, there was little pumping in October in 2017 due to sufficient precipitationin the previousmonths. Therefore, pumping is only observed by the end ofNovemberand in early December due to the dry winter.
Analysis without taking into account the particular situation in the field willproduce biased results. Various factors can lead to a wrong determination of theamount of water pumped. For example, the Haisen meters did not work properly oneyear after installation. Still, the meter automatically transmits virtual data insteadof real measurements when there is a hardware malfunctioning. For the user, thisis difficult to detect as it can only be revealed when looking into the time series offlow rate in the data base. Additionally, when calculating water use per mu, errorscan be introduced by inaccurate estimation of the irrigation area. This happens intwo situations: (1) usually several households share one well, and the farmers or theelectricians can only give a rough number of the total irrigation area of a well; (2)the irrigation area of one well varies as fields located between two wells A and B canbe irrigated by either well A or well B. The error in the irrigation area is estimatedto be around 20% according to farmers. The aforementioned factors prevent us fromgetting reliable results. These problems raise doubts in collecting water fees/taxesbased on the monitored water use per mu.
Lessons learned
The smart metering experiment provided valuable experience in monitoring ground-water pumping at single wells. There is no evidence of obvious differences in theaccuracy of the measurements using different types of water meters. The meters thatmonitor and convert electricity consumption to water abstraction have the advantageof being convenient and robust, but the accuracy depends on the initial calibration ateach single well. All water meters require protection against tampering and theft.
The experiment raises questions about the feasibility of pumpingmonitoringbasedon smart water meters on single wells in well-intensive regions such as the NCP.First, the infrastructural investment of monitoring pumping on single wells will beenormous. Investment is not only needed for water meters and data management butalso for upgrading and adapting the pipe systems at the primitive wells. Secondly, themonitoring system will not work functionally without efficient maintenance, whichproved to be both costly and laborious. On-site inspection and data examination aretwo indispensable parts of maintenance work. Themeter producers must offer to takeon this task and cooperate closely with the local water department. Thirdly, farmers’
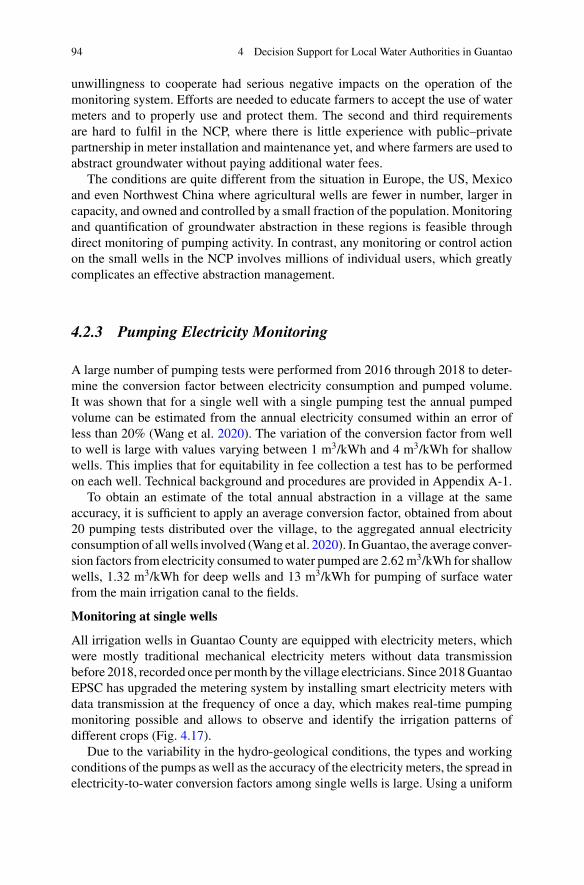
94 4 Decision Support for Local Water Authorities in Guantao
unwillingness to cooperate had serious negative impacts on the operation of themonitoring system. Efforts are needed to educate farmers to accept the use of watermeters and to properly use and protect them. The second and third requirementsare hard to fulfil in the NCP, where there is little experience with public–privatepartnership in meter installation and maintenance yet, and where farmers are used toabstract groundwater without paying additional water fees.
The conditions are quite different from the situation in Europe, the US, Mexicoand even Northwest China where agricultural wells are fewer in number, larger incapacity, and owned and controlled by a small fraction of the population. Monitoringand quantification of groundwater abstraction in these regions is feasible throughdirect monitoring of pumping activity. In contrast, any monitoring or control actionon the small wells in the NCP involves millions of individual users, which greatlycomplicates an effective abstraction management.
4.2.3 Pumping Electricity Monitoring
A large number of pumping tests were performed from 2016 through 2018 to deter-mine the conversion factor between electricity consumption and pumped volume.It was shown that for a single well with a single pumping test the annual pumpedvolume can be estimated from the annual electricity consumed within an error ofless than 20% (Wang et al. 2020). The variation of the conversion factor from wellto well is large with values varying between 1 m3/kWh and 4 m3/kWh for shallowwells. This implies that for equitability in fee collection a test has to be performedon each well. Technical background and procedures are provided in Appendix A-1.
To obtain an estimate of the total annual abstraction in a village at the sameaccuracy, it is sufficient to apply an average conversion factor, obtained from about20 pumping tests distributed over the village, to the aggregated annual electricityconsumption of all wells involved (Wang et al. 2020). InGuantao, the average conver-sion factors from electricity consumed towater pumped are 2.62m3/kWh for shallowwells, 1.32 m3/kWh for deep wells and 13 m3/kWh for pumping of surface waterfrom the main irrigation canal to the fields.
Monitoring at single wells
All irrigation wells in Guantao County are equipped with electricity meters, whichwere mostly traditional mechanical electricity meters without data transmissionbefore 2018, recorded once permonth by the village electricians. Since 2018GuantaoEPSC has upgraded the metering system by installing smart electricity meters withdata transmission at the frequency of once a day, which makes real-time pumpingmonitoring possible and allows to observe and identify the irrigation patterns ofdifferent crops (Fig. 4.17).
Due to the variability in the hydro-geological conditions, the types and workingconditions of the pumps as well as the accuracy of the electricity meters, the spread inelectricity-to-water conversion factors among single wells is large. Using a uniform
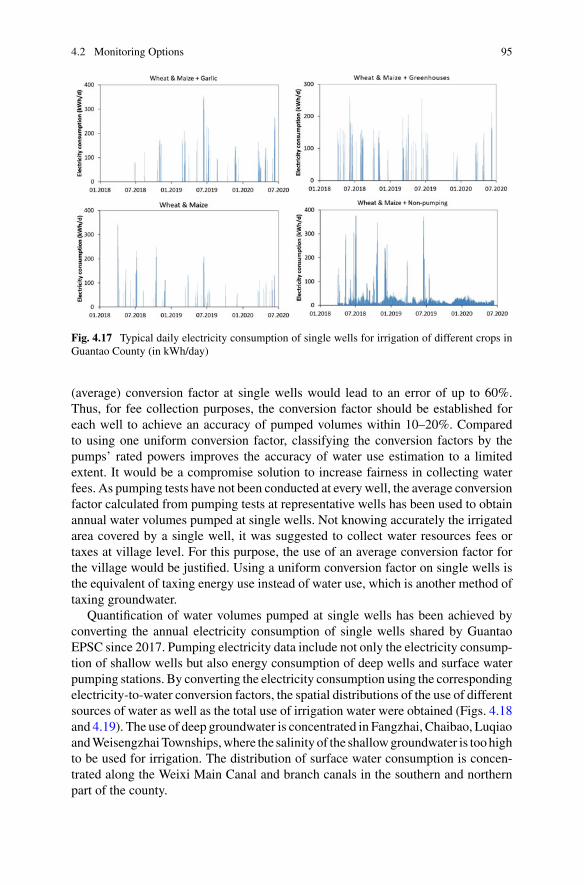
4.2 Monitoring Options 95
Fig. 4.17 Typical daily electricity consumption of single wells for irrigation of different crops inGuantao County (in kWh/day)
(average) conversion factor at single wells would lead to an error of up to 60%.Thus, for fee collection purposes, the conversion factor should be established foreach well to achieve an accuracy of pumped volumes within 10–20%. Comparedto using one uniform conversion factor, classifying the conversion factors by thepumps’ rated powers improves the accuracy of water use estimation to a limitedextent. It would be a compromise solution to increase fairness in collecting waterfees. As pumping tests have not been conducted at every well, the average conversionfactor calculated from pumping tests at representative wells has been used to obtainannual water volumes pumped at single wells. Not knowing accurately the irrigatedarea covered by a single well, it was suggested to collect water resources fees ortaxes at village level. For this purpose, the use of an average conversion factor forthe village would be justified. Using a uniform conversion factor on single wells isthe equivalent of taxing energy use instead of water use, which is another method oftaxing groundwater.
Quantification of water volumes pumped at single wells has been achieved byconverting the annual electricity consumption of single wells shared by GuantaoEPSC since 2017. Pumping electricity data include not only the electricity consump-tion of shallow wells but also energy consumption of deep wells and surface waterpumping stations. By converting the electricity consumption using the correspondingelectricity-to-water conversion factors, the spatial distributions of the use of differentsources of water as well as the total use of irrigation water were obtained (Figs. 4.18and 4.19). The use of deep groundwater is concentrated in Fangzhai, Chaibao, LuqiaoandWeisengzhaiTownships,where the salinity of the shallowgroundwater is toohighto be used for irrigation. The distribution of surface water consumption is concen-trated along the Weixi Main Canal and branch canals in the southern and northernpart of the county.
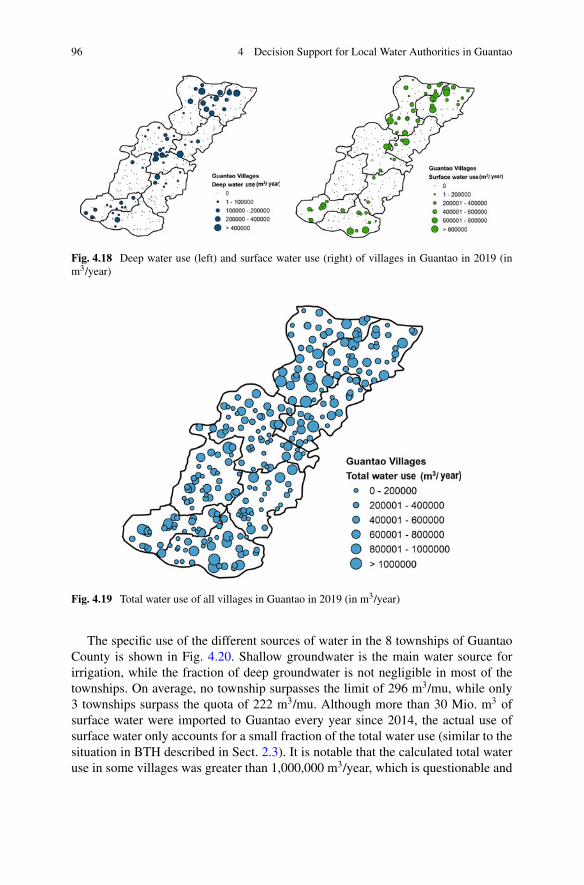
96 4 Decision Support for Local Water Authorities in Guantao
Fig. 4.18 Deep water use (left) and surface water use (right) of villages in Guantao in 2019 (inm3/year)
Fig. 4.19 Total water use of all villages in Guantao in 2019 (in m3/year)
The specific use of the different sources of water in the 8 townships of GuantaoCounty is shown in Fig. 4.20. Shallow groundwater is the main water source forirrigation, while the fraction of deep groundwater is not negligible in most of thetownships. On average, no township surpasses the limit of 296 m3/mu, while only3 townships surpass the quota of 222 m3/mu. Although more than 30 Mio. m3 ofsurface water were imported to Guantao every year since 2014, the actual use ofsurface water only accounts for a small fraction of the total water use (similar to thesituation in BTH described in Sect. 2.3). It is notable that the calculated total wateruse in some villages was greater than 1,000,000 m3/year, which is questionable and
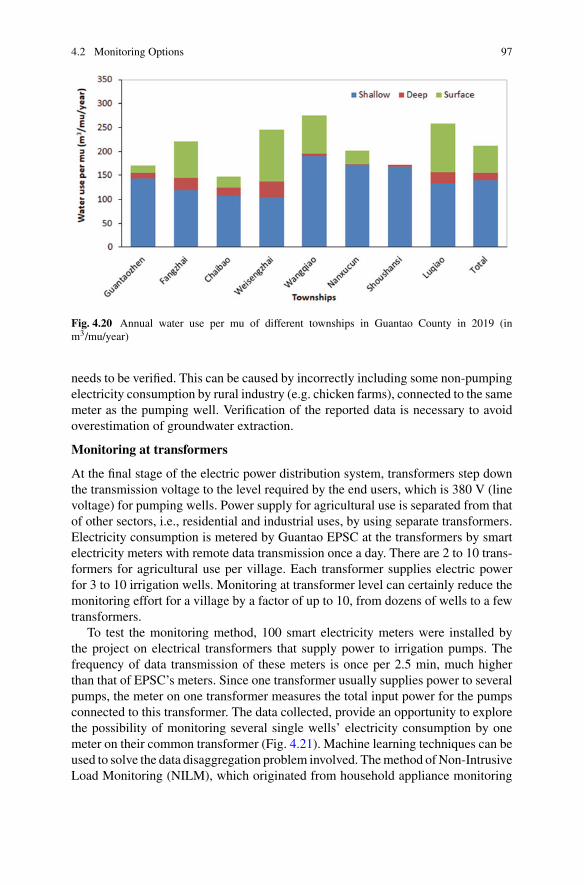
4.2 Monitoring Options 97
Fig. 4.20 Annual water use per mu of different townships in Guantao County in 2019 (inm3/mu/year)
needs to be verified. This can be caused by incorrectly including some non-pumpingelectricity consumption by rural industry (e.g. chicken farms), connected to the samemeter as the pumping well. Verification of the reported data is necessary to avoidoverestimation of groundwater extraction.
Monitoring at transformers
At the final stage of the electric power distribution system, transformers step downthe transmission voltage to the level required by the end users, which is 380 V (linevoltage) for pumping wells. Power supply for agricultural use is separated from thatof other sectors, i.e., residential and industrial uses, by using separate transformers.Electricity consumption is metered by Guantao EPSC at the transformers by smartelectricity meters with remote data transmission once a day. There are 2 to 10 trans-formers for agricultural use per village. Each transformer supplies electric powerfor 3 to 10 irrigation wells. Monitoring at transformer level can certainly reduce themonitoring effort for a village by a factor of up to 10, from dozens of wells to a fewtransformers.
To test the monitoring method, 100 smart electricity meters were installed bythe project on electrical transformers that supply power to irrigation pumps. Thefrequency of data transmission of these meters is once per 2.5 min, much higherthan that of EPSC’s meters. Since one transformer usually supplies power to severalpumps, the meter on one transformer measures the total input power for the pumpsconnected to this transformer. The data collected, provide an opportunity to explorethe possibility of monitoring several single wells’ electricity consumption by onemeter on their common transformer (Fig. 4.21). Machine learning techniques can beused to solve the data disaggregation problem involved. Themethod ofNon-IntrusiveLoad Monitoring (NILM), which originated from household appliance monitoring
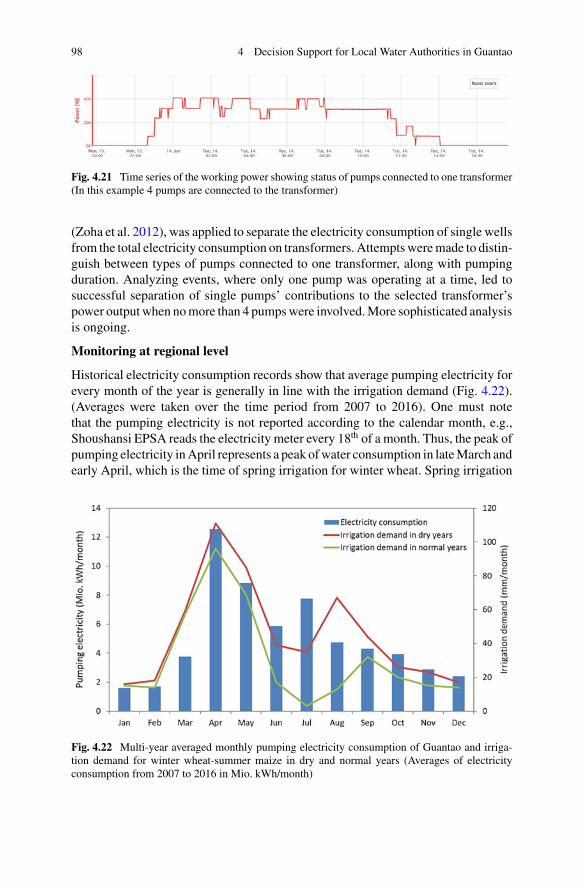
98 4 Decision Support for Local Water Authorities in Guantao
Fig. 4.21 Time series of the working power showing status of pumps connected to one transformer(In this example 4 pumps are connected to the transformer)
(Zoha et al. 2012), was applied to separate the electricity consumption of single wellsfrom the total electricity consumption on transformers. Attemptsweremade to distin-guish between types of pumps connected to one transformer, along with pumpingduration. Analyzing events, where only one pump was operating at a time, led tosuccessful separation of single pumps’ contributions to the selected transformer’spower outputwhen nomore than 4 pumpswere involved.More sophisticated analysisis ongoing.
Monitoring at regional level
Historical electricity consumption records show that average pumping electricity forevery month of the year is generally in line with the irrigation demand (Fig. 4.22).(Averages were taken over the time period from 2007 to 2016). One must notethat the pumping electricity is not reported according to the calendar month, e.g.,Shoushansi EPSA reads the electricity meter every 18th of a month. Thus, the peak ofpumping electricity inApril represents a peak ofwater consumption in lateMarch andearly April, which is the time of spring irrigation for winter wheat. Spring irrigation
Fig. 4.22 Multi-year averaged monthly pumping electricity consumption of Guantao and irriga-tion demand for winter wheat-summer maize in dry and normal years (Averages of electricityconsumption from 2007 to 2016 in Mio. kWh/month)
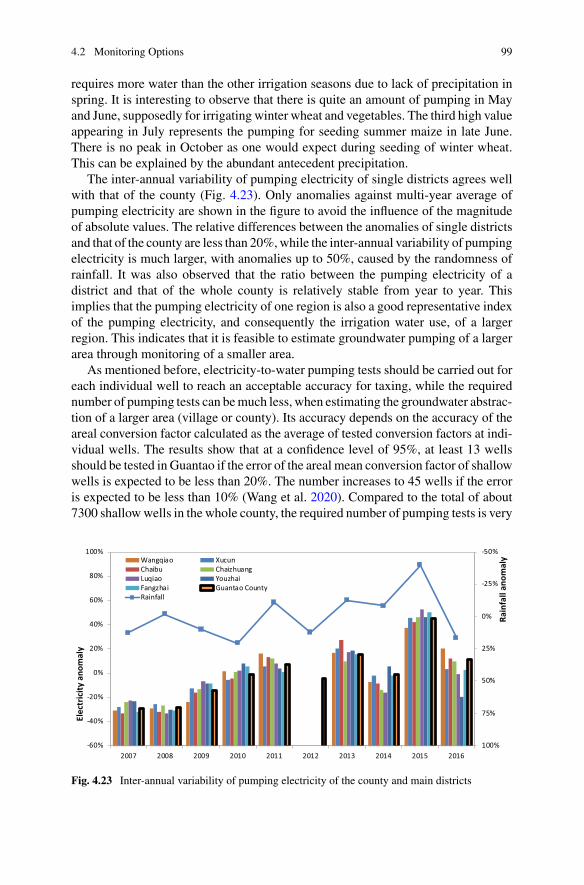
4.2 Monitoring Options 99
requires more water than the other irrigation seasons due to lack of precipitation inspring. It is interesting to observe that there is quite an amount of pumping in Mayand June, supposedly for irrigating winter wheat and vegetables. The third high valueappearing in July represents the pumping for seeding summer maize in late June.There is no peak in October as one would expect during seeding of winter wheat.This can be explained by the abundant antecedent precipitation.
The inter-annual variability of pumping electricity of single districts agrees wellwith that of the county (Fig. 4.23). Only anomalies against multi-year average ofpumping electricity are shown in the figure to avoid the influence of the magnitudeof absolute values. The relative differences between the anomalies of single districtsand that of the county are less than 20%,while the inter-annual variability of pumpingelectricity is much larger, with anomalies up to 50%, caused by the randomness ofrainfall. It was also observed that the ratio between the pumping electricity of adistrict and that of the whole county is relatively stable from year to year. Thisimplies that the pumping electricity of one region is also a good representative indexof the pumping electricity, and consequently the irrigation water use, of a largerregion. This indicates that it is feasible to estimate groundwater pumping of a largerarea through monitoring of a smaller area.
As mentioned before, electricity-to-water pumping tests should be carried out foreach individual well to reach an acceptable accuracy for taxing, while the requirednumber of pumping tests can bemuch less, when estimating the groundwater abstrac-tion of a larger area (village or county). Its accuracy depends on the accuracy of theareal conversion factor calculated as the average of tested conversion factors at indi-vidual wells. The results show that at a confidence level of 95%, at least 13 wellsshould be tested in Guantao if the error of the areal mean conversion factor of shallowwells is expected to be less than 20%. The number increases to 45 wells if the erroris expected to be less than 10% (Wang et al. 2020). Compared to the total of about7300 shallowwells in the whole county, the required number of pumping tests is very
-50%
-25%
0%
25%
50%
75%
100%-60%
-40%
-20%
0%
20%
40%
60%
80%
100%
2007 2008 2009 2010 2011 2012 2013 2014 2015 2016
Rain
fall
anom
aly
Elec
tric
ity a
nom
aly
Wangqiao XucunChaibu ChaizhuangLuqiao YouzhaiFangzhai Guantao CountyRainfall
Fig. 4.23 Inter-annual variability of pumping electricity of the county and main districts
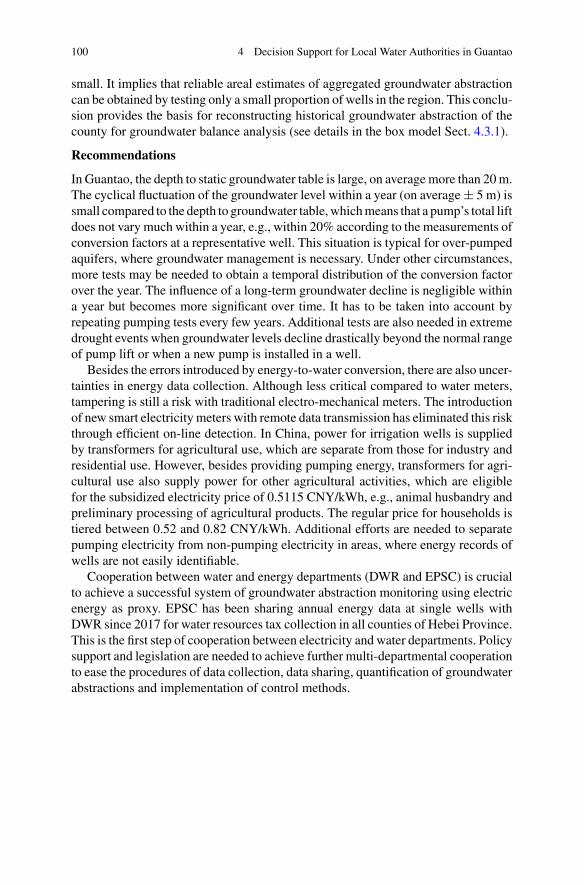
100 4 Decision Support for Local Water Authorities in Guantao
small. It implies that reliable areal estimates of aggregated groundwater abstractioncan be obtained by testing only a small proportion of wells in the region. This conclu-sion provides the basis for reconstructing historical groundwater abstraction of thecounty for groundwater balance analysis (see details in the box model Sect. 4.3.1).
Recommendations
In Guantao, the depth to static groundwater table is large, on averagemore than 20m.The cyclical fluctuation of the groundwater level within a year (on average± 5 m) issmall compared to the depth to groundwater table,whichmeans that a pump’s total liftdoes not vary much within a year, e.g., within 20% according to the measurements ofconversion factors at a representative well. This situation is typical for over-pumpedaquifers, where groundwater management is necessary. Under other circumstances,more tests may be needed to obtain a temporal distribution of the conversion factorover the year. The influence of a long-term groundwater decline is negligible withina year but becomes more significant over time. It has to be taken into account byrepeating pumping tests every few years. Additional tests are also needed in extremedrought events when groundwater levels decline drastically beyond the normal rangeof pump lift or when a new pump is installed in a well.
Besides the errors introduced by energy-to-water conversion, there are also uncer-tainties in energy data collection. Although less critical compared to water meters,tampering is still a risk with traditional electro-mechanical meters. The introductionof new smart electricity meters with remote data transmission has eliminated this riskthrough efficient on-line detection. In China, power for irrigation wells is suppliedby transformers for agricultural use, which are separate from those for industry andresidential use. However, besides providing pumping energy, transformers for agri-cultural use also supply power for other agricultural activities, which are eligiblefor the subsidized electricity price of 0.5115 CNY/kWh, e.g., animal husbandry andpreliminary processing of agricultural products. The regular price for households istiered between 0.52 and 0.82 CNY/kWh. Additional efforts are needed to separatepumping electricity from non-pumping electricity in areas, where energy records ofwells are not easily identifiable.
Cooperation between water and energy departments (DWR and EPSC) is crucialto achieve a successful system of groundwater abstraction monitoring using electricenergy as proxy. EPSC has been sharing annual energy data at single wells withDWR since 2017 for water resources tax collection in all counties of Hebei Province.This is the first step of cooperation between electricity and water departments. Policysupport and legislation are needed to achieve further multi-departmental cooperationto ease the procedures of data collection, data sharing, quantification of groundwaterabstractions and implementation of control methods.
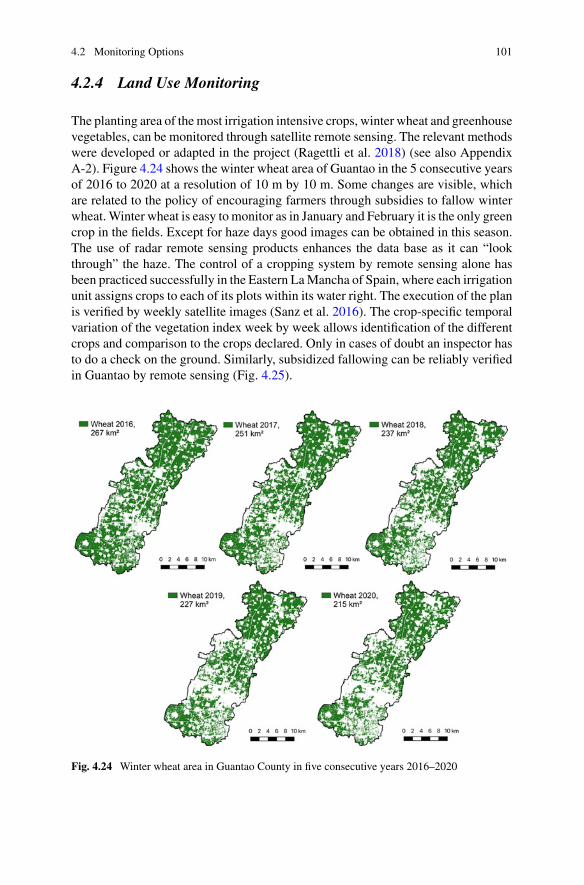
4.2 Monitoring Options 101
4.2.4 Land Use Monitoring
The planting area of themost irrigation intensive crops, winter wheat and greenhousevegetables, can be monitored through satellite remote sensing. The relevant methodswere developed or adapted in the project (Ragettli et al. 2018) (see also AppendixA-2). Figure 4.24 shows the winter wheat area of Guantao in the 5 consecutive yearsof 2016 to 2020 at a resolution of 10 m by 10 m. Some changes are visible, whichare related to the policy of encouraging farmers through subsidies to fallow winterwheat.Winter wheat is easy to monitor as in January and February it is the only greencrop in the fields. Except for haze days good images can be obtained in this season.The use of radar remote sensing products enhances the data base as it can “lookthrough” the haze. The control of a cropping system by remote sensing alone hasbeen practiced successfully in the Eastern LaMancha of Spain, where each irrigationunit assigns crops to each of its plots within its water right. The execution of the planis verified by weekly satellite images (Sanz et al. 2016). The crop-specific temporalvariation of the vegetation index week by week allows identification of the differentcrops and comparison to the crops declared. Only in cases of doubt an inspector hasto do a check on the ground. Similarly, subsidized fallowing can be reliably verifiedin Guantao by remote sensing (Fig. 4.25).
Fig. 4.24 Winter wheat area in Guantao County in five consecutive years 2016–2020
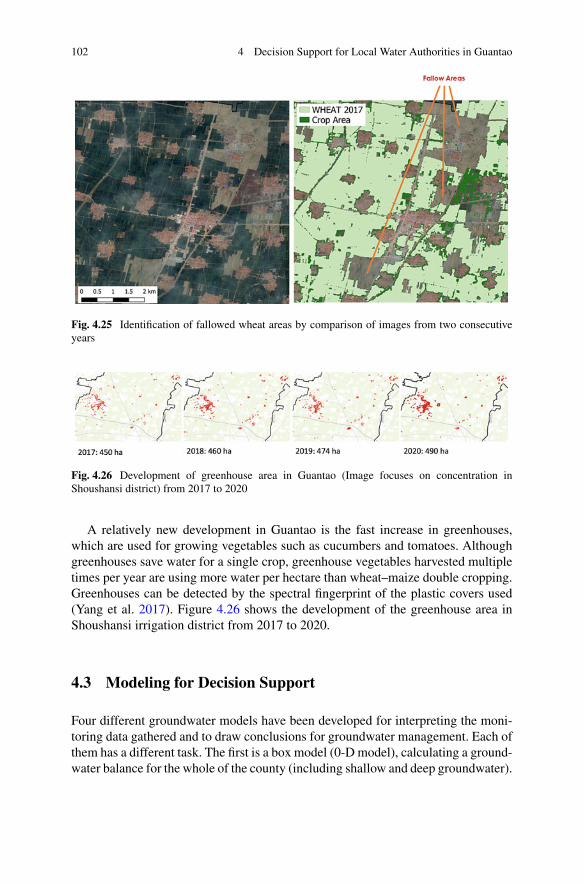
102 4 Decision Support for Local Water Authorities in Guantao
Fig. 4.25 Identification of fallowed wheat areas by comparison of images from two consecutiveyears
Fig. 4.26 Development of greenhouse area in Guantao (Image focuses on concentration inShoushansi district) from 2017 to 2020
A relatively new development in Guantao is the fast increase in greenhouses,which are used for growing vegetables such as cucumbers and tomatoes. Althoughgreenhouses save water for a single crop, greenhouse vegetables harvested multipletimes per year are using more water per hectare than wheat–maize double cropping.Greenhouses can be detected by the spectral fingerprint of the plastic covers used(Yang et al. 2017). Figure 4.26 shows the development of the greenhouse area inShoushansi irrigation district from 2017 to 2020.
4.3 Modeling for Decision Support
Four different groundwater models have been developed for interpreting the moni-toring data gathered and to draw conclusions for groundwater management. Each ofthem has a different task. The first is a box model (0-D model), calculating a ground-water balance for the whole of the county (including shallow and deep groundwater).
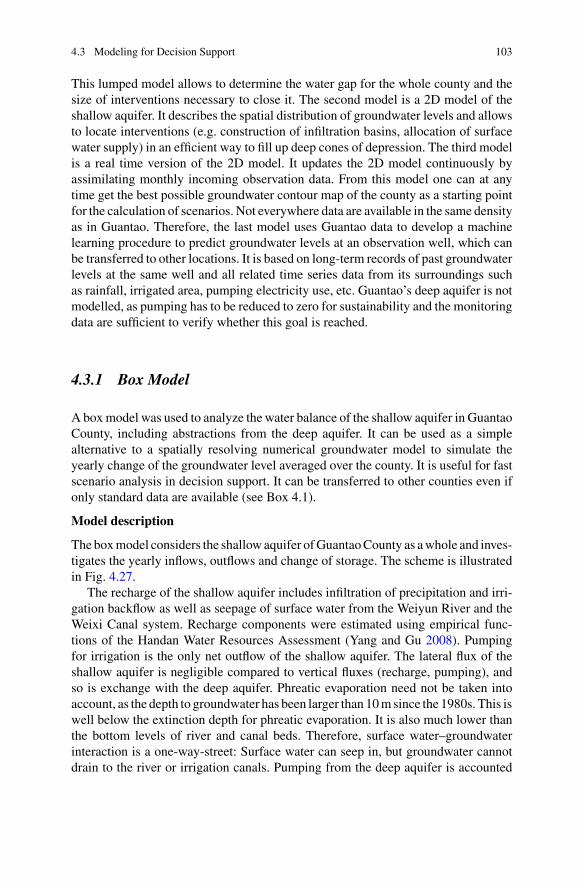
4.3 Modeling for Decision Support 103
This lumped model allows to determine the water gap for the whole county and thesize of interventions necessary to close it. The second model is a 2D model of theshallow aquifer. It describes the spatial distribution of groundwater levels and allowsto locate interventions (e.g. construction of infiltration basins, allocation of surfacewater supply) in an efficient way to fill up deep cones of depression. The third modelis a real time version of the 2D model. It updates the 2D model continuously byassimilating monthly incoming observation data. From this model one can at anytime get the best possible groundwater contour map of the county as a starting pointfor the calculation of scenarios. Not everywhere data are available in the same densityas in Guantao. Therefore, the last model uses Guantao data to develop a machinelearning procedure to predict groundwater levels at an observation well, which canbe transferred to other locations. It is based on long-term records of past groundwaterlevels at the same well and all related time series data from its surroundings suchas rainfall, irrigated area, pumping electricity use, etc. Guantao’s deep aquifer is notmodelled, as pumping has to be reduced to zero for sustainability and the monitoringdata are sufficient to verify whether this goal is reached.
4.3.1 Box Model
Aboxmodel was used to analyze the water balance of the shallow aquifer in GuantaoCounty, including abstractions from the deep aquifer. It can be used as a simplealternative to a spatially resolving numerical groundwater model to simulate theyearly change of the groundwater level averaged over the county. It is useful for fastscenario analysis in decision support. It can be transferred to other counties even ifonly standard data are available (see Box 4.1).
Model description
Theboxmodel considers the shallowaquifer ofGuantaoCounty as awhole and inves-tigates the yearly inflows, outflows and change of storage. The scheme is illustratedin Fig. 4.27.
The recharge of the shallow aquifer includes infiltration of precipitation and irri-gation backflow as well as seepage of surface water from the Weiyun River and theWeixi Canal system. Recharge components were estimated using empirical func-tions of the Handan Water Resources Assessment (Yang and Gu 2008). Pumpingfor irrigation is the only net outflow of the shallow aquifer. The lateral flux of theshallow aquifer is negligible compared to vertical fluxes (recharge, pumping), andso is exchange with the deep aquifer. Phreatic evaporation need not be taken intoaccount, as the depth to groundwater has been larger than 10msince the 1980s. This iswell below the extinction depth for phreatic evaporation. It is also much lower thanthe bottom levels of river and canal beds. Therefore, surface water–groundwaterinteraction is a one-way-street: Surface water can seep in, but groundwater cannotdrain to the river or irrigation canals. Pumping from the deep aquifer is accounted
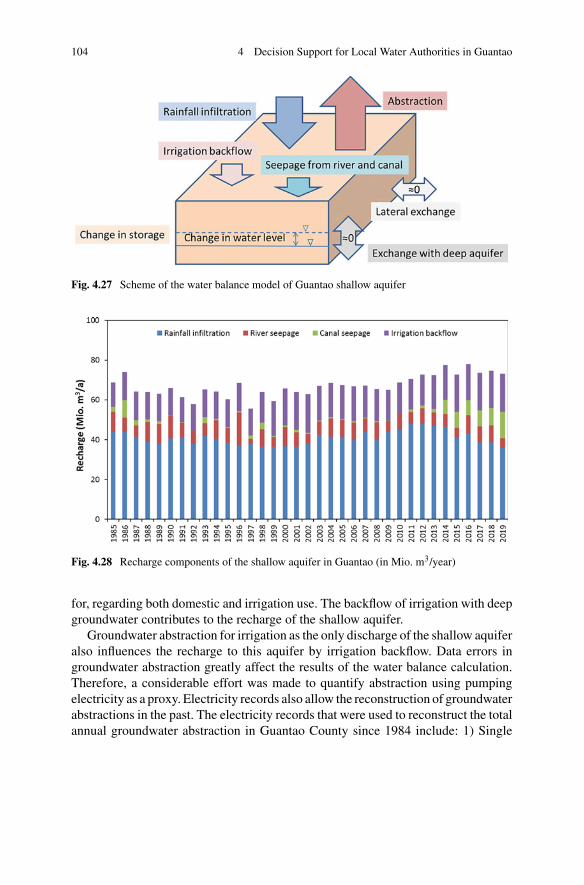
104 4 Decision Support for Local Water Authorities in Guantao
Fig. 4.27 Scheme of the water balance model of Guantao shallow aquifer
Fig. 4.28 Recharge components of the shallow aquifer in Guantao (in Mio. m3/year)
for, regarding both domestic and irrigation use. The backflow of irrigation with deepgroundwater contributes to the recharge of the shallow aquifer.
Groundwater abstraction for irrigation as the only discharge of the shallow aquiferalso influences the recharge to this aquifer by irrigation backflow. Data errors ingroundwater abstraction greatly affect the results of the water balance calculation.Therefore, a considerable effort was made to quantify abstraction using pumpingelectricity as a proxy. Electricity records also allow the reconstruction of groundwaterabstractions in the past. The electricity records that were used to reconstruct the totalannual groundwater abstraction in Guantao County since 1984 include: 1) Single
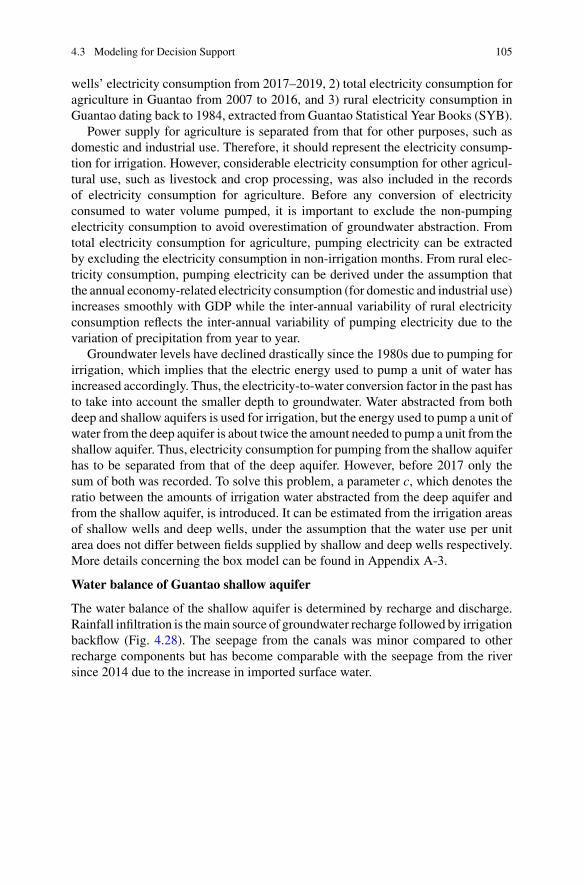
4.3 Modeling for Decision Support 105
wells’ electricity consumption from 2017–2019, 2) total electricity consumption foragriculture in Guantao from 2007 to 2016, and 3) rural electricity consumption inGuantao dating back to 1984, extracted from Guantao Statistical Year Books (SYB).
Power supply for agriculture is separated from that for other purposes, such asdomestic and industrial use. Therefore, it should represent the electricity consump-tion for irrigation. However, considerable electricity consumption for other agricul-tural use, such as livestock and crop processing, was also included in the recordsof electricity consumption for agriculture. Before any conversion of electricityconsumed to water volume pumped, it is important to exclude the non-pumpingelectricity consumption to avoid overestimation of groundwater abstraction. Fromtotal electricity consumption for agriculture, pumping electricity can be extractedby excluding the electricity consumption in non-irrigation months. From rural elec-tricity consumption, pumping electricity can be derived under the assumption thatthe annual economy-related electricity consumption (for domestic and industrial use)increases smoothly with GDP while the inter-annual variability of rural electricityconsumption reflects the inter-annual variability of pumping electricity due to thevariation of precipitation from year to year.
Groundwater levels have declined drastically since the 1980s due to pumping forirrigation, which implies that the electric energy used to pump a unit of water hasincreased accordingly. Thus, the electricity-to-water conversion factor in the past hasto take into account the smaller depth to groundwater. Water abstracted from bothdeep and shallow aquifers is used for irrigation, but the energy used to pump a unit ofwater from the deep aquifer is about twice the amount needed to pump a unit from theshallow aquifer. Thus, electricity consumption for pumping from the shallow aquiferhas to be separated from that of the deep aquifer. However, before 2017 only thesum of both was recorded. To solve this problem, a parameter c, which denotes theratio between the amounts of irrigation water abstracted from the deep aquifer andfrom the shallow aquifer, is introduced. It can be estimated from the irrigation areasof shallow wells and deep wells, under the assumption that the water use per unitarea does not differ between fields supplied by shallow and deep wells respectively.More details concerning the box model can be found in Appendix A-3.
Water balance of Guantao shallow aquifer
The water balance of the shallow aquifer is determined by recharge and discharge.Rainfall infiltration is themain source of groundwater recharge followed by irrigationbackflow (Fig. 4.28). The seepage from the canals was minor compared to otherrecharge components but has become comparable with the seepage from the riversince 2014 due to the increase in imported surface water.
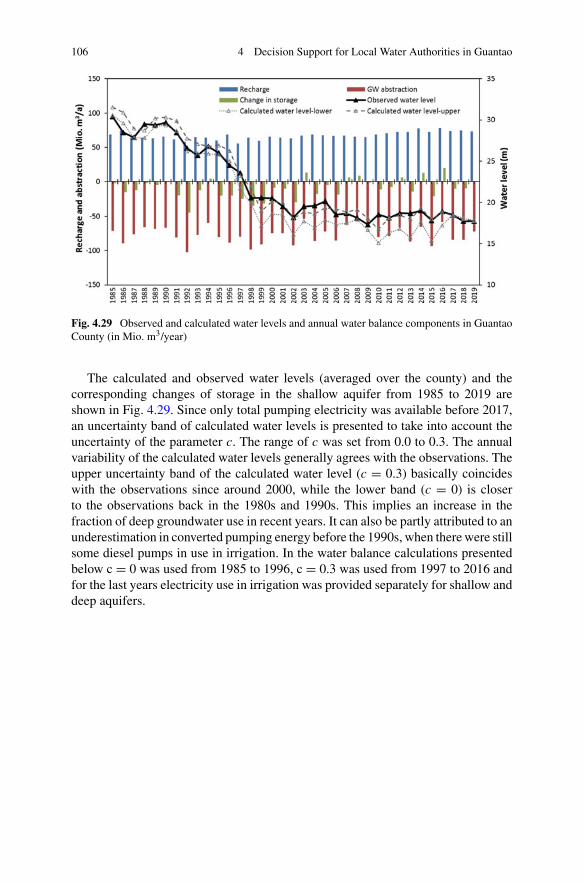
106 4 Decision Support for Local Water Authorities in Guantao
Fig. 4.29 Observed and calculated water levels and annual water balance components in GuantaoCounty (in Mio. m3/year)
The calculated and observed water levels (averaged over the county) and thecorresponding changes of storage in the shallow aquifer from 1985 to 2019 areshown in Fig. 4.29. Since only total pumping electricity was available before 2017,an uncertainty band of calculated water levels is presented to take into account theuncertainty of the parameter c. The range of c was set from 0.0 to 0.3. The annualvariability of the calculated water levels generally agrees with the observations. Theupper uncertainty band of the calculated water level (c = 0.3) basically coincideswith the observations since around 2000, while the lower band (c = 0) is closerto the observations back in the 1980s and 1990s. This implies an increase in thefraction of deep groundwater use in recent years. It can also be partly attributed to anunderestimation in converted pumping energy before the 1990s, when there were stillsome diesel pumps in use in irrigation. In the water balance calculations presentedbelow c = 0 was used from 1985 to 1996, c = 0.3 was used from 1997 to 2016 andfor the last years electricity use in irrigation was provided separately for shallow anddeep aquifers.
4.3 Modeling for Decision Support 107
Figure 4.29 indicates three periods of depletionof the shallowaquifer, a largewatertable decline rate between 1984 and 1999, a smaller one in the pre-project periodfrom 2000 to 2013 and a still smaller one between 2014 and 2019. The correspondingdepletion rates of the shallow aquifer are 15Mio. m3/year, 6Mio. m3/year and 1Mio.m3/year, respectively. The total gap between discharge and recharge including thedeep aquifer is shown in more detail for the periods 2000–2013 and 2014–2019 inFig. 4.30.
The components of recharge and discharge of the shallow aquifer for the twoperiods are shown in more detail in Fig. 4.31. In contrast to the relatively wet periodbetween 2000 and 2013, three out of six years between 2014 and 2019 were dryyears with annual rainfall less than 450 mm. This led to an increase in the abstractionfrom the shallow aquifer by 3%. However, the use of deep groundwater decreasedby 35%, mainly due to replacement by imported surface water and fallowing. Theincrease in surface water use led to a drastic increase in canal seepage and partlycontributed to the increase of irrigation backflow. Thus, the total recharge increasedby 11% despite the decrease in rainfall infiltration.
The development of aquifer depletion in both shallow and deep aquifers for thetwo periods is shown in Fig. 4.32. The total gap could almost be halved duringthe project period (2014–2019) compared to the pre-project period (2000–2013).The shallow aquifer’s recharge-discharge gap is down to 1.3 Mio. m3/year from 6.4Mio. m3/year. The deep aquifer’s gap is still 18.5 Mio. m3/year but compared tothe pre-project period it has been reduced by about 14 Mio. m3/year due to projectmeasures. If one takes the balance for the year 2019 only, the improvement is evenmore impressive. The total gap remaining in the deep aquifer is 11.2 Mio. m3/year,while the shallow aquifer water level even rose, equivalent to a storage increase of0.9 Mio. m3. A single year is, however, not as significant for comparison as a periodof several years due to the variability of meteorological conditions.
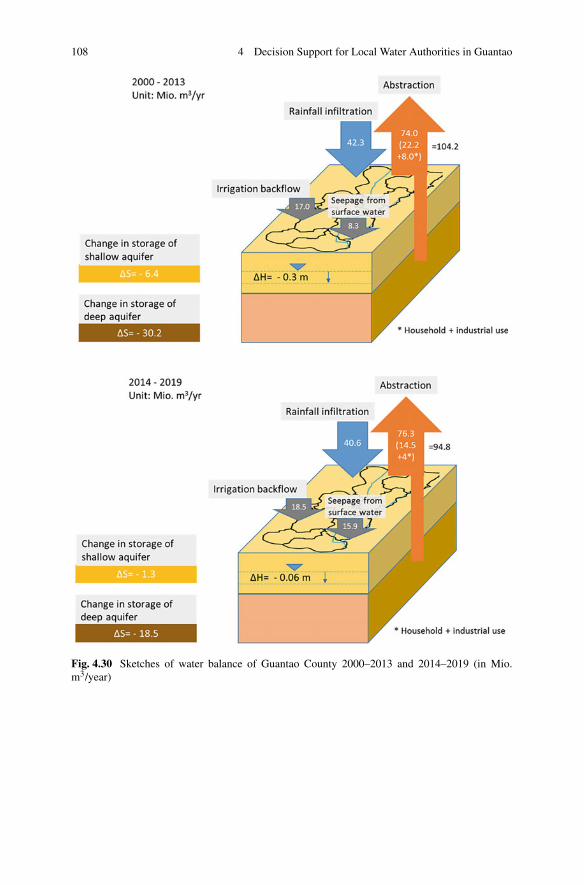
108 4 Decision Support for Local Water Authorities in Guantao
Fig. 4.30 Sketches of water balance of Guantao County 2000–2013 and 2014–2019 (in Mio.m3/year)
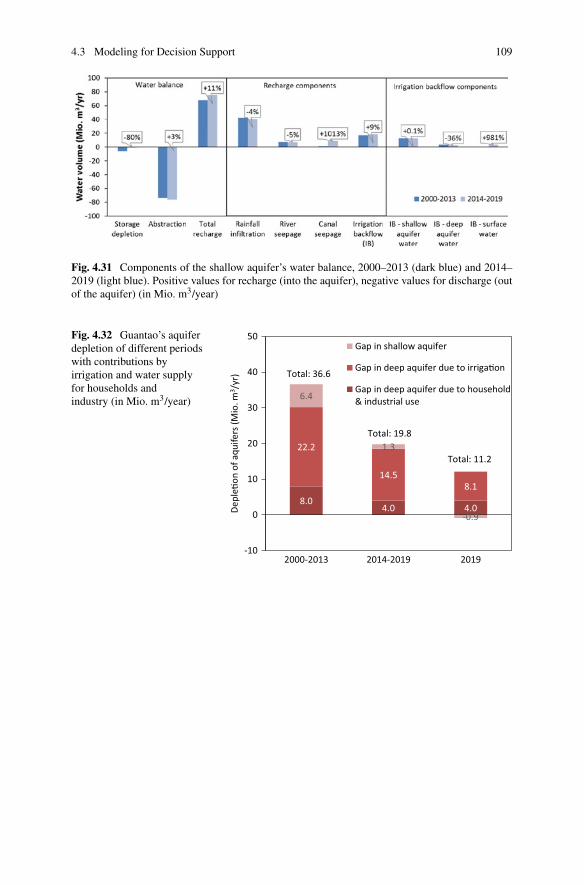
4.3 Modeling for Decision Support 109
Fig. 4.31 Components of the shallow aquifer’s water balance, 2000–2013 (dark blue) and 2014–2019 (light blue). Positive values for recharge (into the aquifer), negative values for discharge (outof the aquifer) (in Mio. m3/year)
Fig. 4.32 Guantao’s aquiferdepletion of different periodswith contributions byirrigation and water supplyfor households andindustry (in Mio. m3/year)
8.04.0 4.0
22.2
14.58.1
-10
0
10
20
30
40
50
2000-2013 2014-2019 2019
Depl
e�on
of a
quife
rs (M
io. m
3 /yr
)
Gap in shallow aquifer
Gap in deep aquifer due to irriga�on
Gap in deep aquifer due to household& industrial use
Total: 36.6
Total: 19.8
Total: 11.2
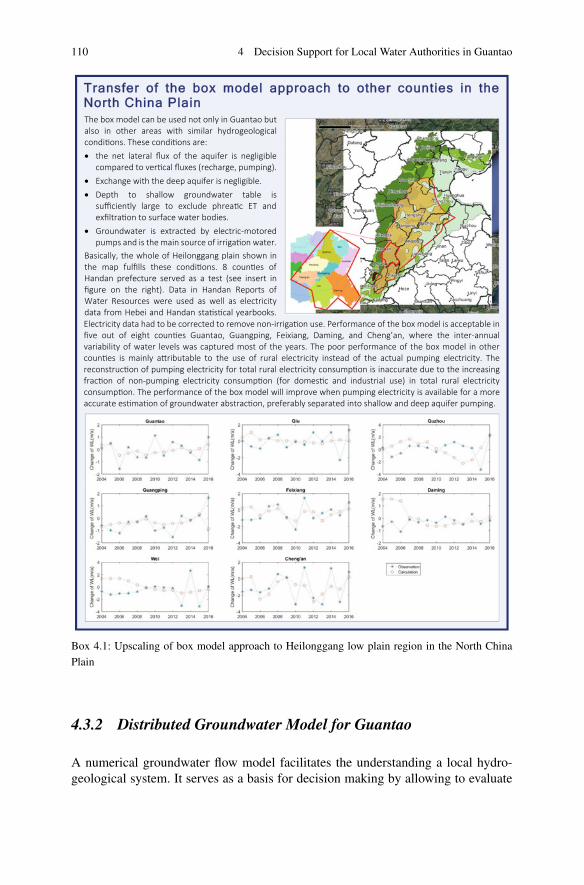
110 4 Decision Support for Local Water Authorities in Guantao
Transfer of the box model approach to other counties in theNorth China Plain
Electricity data had to be corrected to remove non-irriga on use. Performance of the box model is acceptable in five out of eight coun es Guantao, Guangping, Feixiang, Daming, and Cheng’an, where the inter-annual variability of water levels was captured most of the years. The poor performance of the box model in other coun es is mainly a ributable to the use of rural electricity instead of the actual pumping electricity. The reconstruc on of pumping electricity for total rural electricity consump on is inaccurate due to the increasing frac on of non-pumping electricity consump on (for domes c and industrial use) in total rural electricity consump on. The performance of the box model will improve when pumping electricity is available for a more accurate es ma on of groundwater abstrac on, preferably separated into shallow and deep aquifer pumping.
The box model can be used not only in Guantao but also in other areas with similar hydrogeological condi ons. These condi ons are:
the net lateral flux of the aquifer is negligible compared to ver cal fluxes (recharge, pumping). Exchange with the deep aquifer is negligible. Depth to shallow groundwater table is sufficiently large to exclude phrea c ET and exfiltra on to surface water bodies. Groundwater is extracted by electric-motored pumps and is the main source of irriga on water.
Basically, the whole of Heilonggang plain shown in the map fulfills these condi ons. 8 coun es of Handan prefecture served as a test (see insert in figure on the right). Data in Handan Reports of Water Resources were used as well as electricity data from Hebei and Handan sta s cal yearbooks.
Box 4.1: Upscaling of box model approach to Heilonggang low plain region in the North China
Plain
4.3.2 Distributed Groundwater Model for Guantao
A numerical groundwater flow model facilitates the understanding a local hydro-geological system. It serves as a basis for decision making by allowing to evaluate
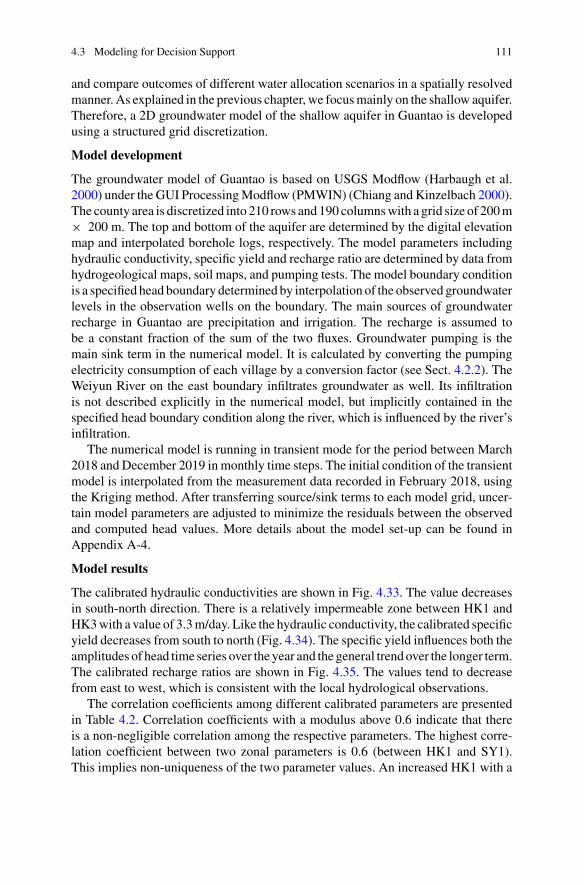
4.3 Modeling for Decision Support 111
and compare outcomes of different water allocation scenarios in a spatially resolvedmanner. As explained in the previous chapter, we focusmainly on the shallow aquifer.Therefore, a 2D groundwater model of the shallow aquifer in Guantao is developedusing a structured grid discretization.
Model development
The groundwater model of Guantao is based on USGS Modflow (Harbaugh et al.2000) under the GUI ProcessingModflow (PMWIN) (Chiang andKinzelbach 2000).The county area is discretized into 210 rows and 190 columnswith a grid size of 200m× 200 m. The top and bottom of the aquifer are determined by the digital elevationmap and interpolated borehole logs, respectively. The model parameters includinghydraulic conductivity, specific yield and recharge ratio are determined by data fromhydrogeological maps, soil maps, and pumping tests. The model boundary conditionis a specified head boundary determined by interpolation of the observed groundwaterlevels in the observation wells on the boundary. The main sources of groundwaterrecharge in Guantao are precipitation and irrigation. The recharge is assumed tobe a constant fraction of the sum of the two fluxes. Groundwater pumping is themain sink term in the numerical model. It is calculated by converting the pumpingelectricity consumption of each village by a conversion factor (see Sect. 4.2.2). TheWeiyun River on the east boundary infiltrates groundwater as well. Its infiltrationis not described explicitly in the numerical model, but implicitly contained in thespecified head boundary condition along the river, which is influenced by the river’sinfiltration.
The numerical model is running in transient mode for the period between March2018 and December 2019 in monthly time steps. The initial condition of the transientmodel is interpolated from the measurement data recorded in February 2018, usingthe Kriging method. After transferring source/sink terms to each model grid, uncer-tain model parameters are adjusted to minimize the residuals between the observedand computed head values. More details about the model set-up can be found inAppendix A-4.
Model results
The calibrated hydraulic conductivities are shown in Fig. 4.33. The value decreasesin south-north direction. There is a relatively impermeable zone between HK1 andHK3with a value of 3.3m/day. Like the hydraulic conductivity, the calibrated specificyield decreases from south to north (Fig. 4.34). The specific yield influences both theamplitudes of head time series over the year and the general trendover the longer term.The calibrated recharge ratios are shown in Fig. 4.35. The values tend to decreasefrom east to west, which is consistent with the local hydrological observations.
The correlation coefficients among different calibrated parameters are presentedin Table 4.2. Correlation coefficients with a modulus above 0.6 indicate that thereis a non-negligible correlation among the respective parameters. The highest corre-lation coefficient between two zonal parameters is 0.6 (between HK1 and SY1).This implies non-uniqueness of the two parameter values. An increased HK1 with a
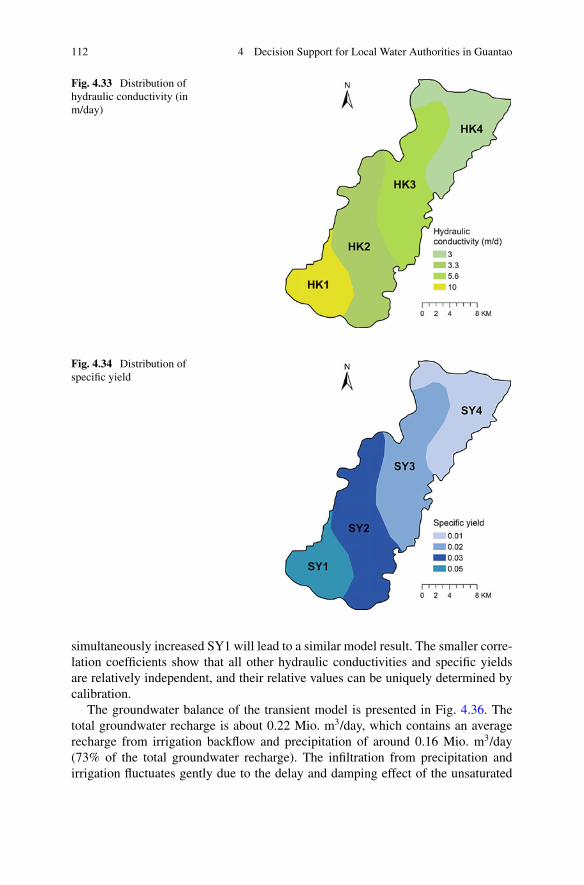
112 4 Decision Support for Local Water Authorities in Guantao
Fig. 4.33 Distribution ofhydraulic conductivity (inm/day)
Fig. 4.34 Distribution ofspecific yield
simultaneously increased SY1 will lead to a similar model result. The smaller corre-lation coefficients show that all other hydraulic conductivities and specific yieldsare relatively independent, and their relative values can be uniquely determined bycalibration.
The groundwater balance of the transient model is presented in Fig. 4.36. Thetotal groundwater recharge is about 0.22 Mio. m3/day, which contains an averagerecharge from irrigation backflow and precipitation of around 0.16 Mio. m3/day(73% of the total groundwater recharge). The infiltration from precipitation andirrigation fluctuates gently due to the delay and damping effect of the unsaturated
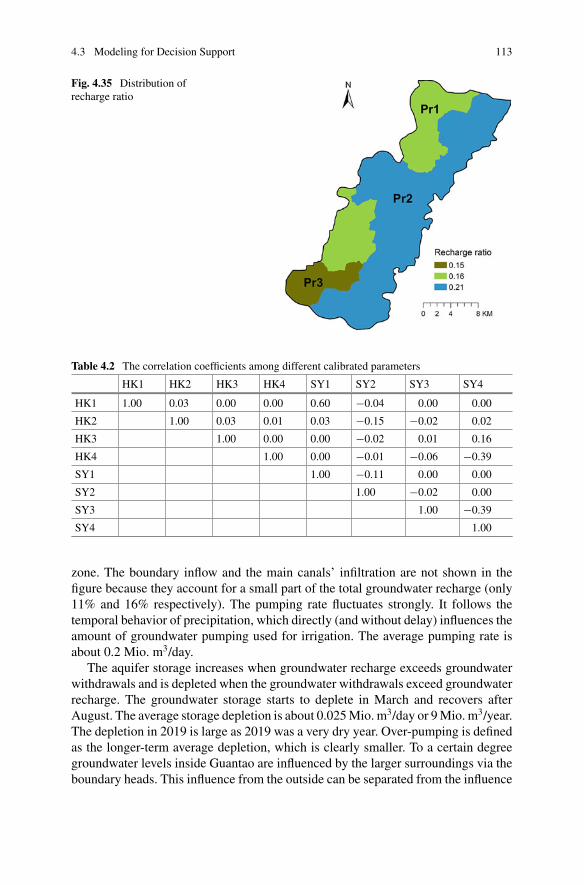
4.3 Modeling for Decision Support 113
Fig. 4.35 Distribution ofrecharge ratio
Table 4.2 The correlation coefficients among different calibrated parameters
HK1 HK2 HK3 HK4 SY1 SY2 SY3 SY4
HK1 1.00 0.03 0.00 0.00 0.60 −0.04 0.00 0.00
HK2 1.00 0.03 0.01 0.03 −0.15 −0.02 0.02
HK3 1.00 0.00 0.00 −0.02 0.01 0.16
HK4 1.00 0.00 −0.01 −0.06 −0.39
SY1 1.00 −0.11 0.00 0.00
SY2 1.00 −0.02 0.00
SY3 1.00 −0.39
SY4 1.00
zone. The boundary inflow and the main canals’ infiltration are not shown in thefigure because they account for a small part of the total groundwater recharge (only11% and 16% respectively). The pumping rate fluctuates strongly. It follows thetemporal behavior of precipitation, which directly (and without delay) influences theamount of groundwater pumping used for irrigation. The average pumping rate isabout 0.2 Mio. m3/day.
The aquifer storage increases when groundwater recharge exceeds groundwaterwithdrawals and is depleted when the groundwater withdrawals exceed groundwaterrecharge. The groundwater storage starts to deplete in March and recovers afterAugust. The average storage depletion is about 0.025Mio. m3/day or 9Mio. m3/year.The depletion in 2019 is large as 2019 was a very dry year. Over-pumping is definedas the longer-term average depletion, which is clearly smaller. To a certain degreegroundwater levels inside Guantao are influenced by the larger surroundings via theboundary heads. This influence from the outside can be separated from the influence
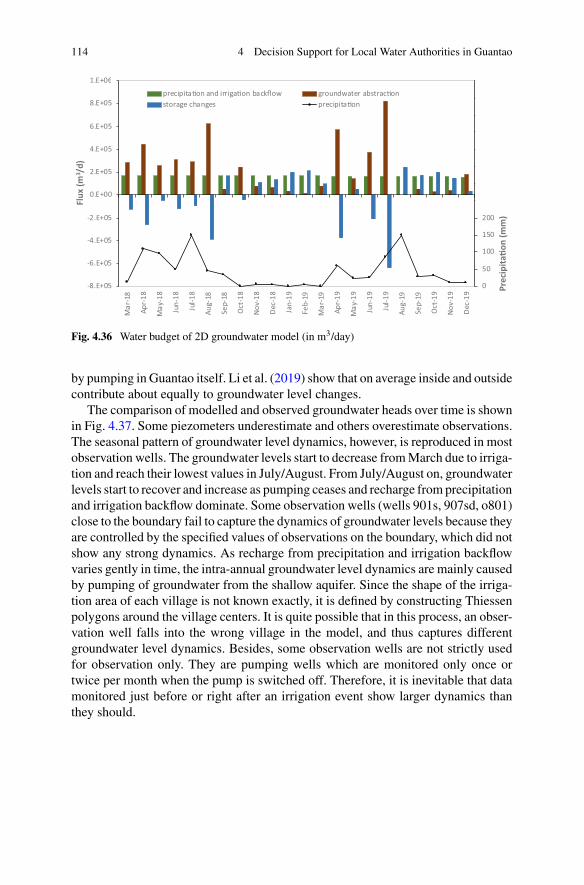
114 4 Decision Support for Local Water Authorities in Guantao
0
50
100
150
200
250
300
350
400
450
500
550
600
-8.E+05
-6.E+05
-4.E+05
-2.E+05
0.E+00
2.E+05
4.E+05
6.E+05
8.E+05
1.E+06
Mar
-18
Apr-
18
May
-18
Jun-
18
Jul-1
8
Aug-
18
Sep-
18
Oct
-18
Nov
-18
Dec
-18
Jan-
19
Feb-
19
Mar
-19
Apr-
19
May
-19
Jun-
19
Jul-1
9
Aug-
19
Sep-
19
Oct
-19
Nov
-19
Dec
-19 Pr
ecip
ita�o
n (m
m)
Flux
(m3 /
d)precipita�on and irriga�on backflow groundwater abstrac�onstorage changes precipita�on
Fig. 4.36 Water budget of 2D groundwater model (in m3/day)
by pumping in Guantao itself. Li et al. (2019) show that on average inside and outsidecontribute about equally to groundwater level changes.
The comparison of modelled and observed groundwater heads over time is shownin Fig. 4.37. Some piezometers underestimate and others overestimate observations.The seasonal pattern of groundwater level dynamics, however, is reproduced in mostobservation wells. The groundwater levels start to decrease fromMarch due to irriga-tion and reach their lowest values in July/August. From July/August on, groundwaterlevels start to recover and increase as pumping ceases and recharge from precipitationand irrigation backflow dominate. Some observation wells (wells 901s, 907sd, o801)close to the boundary fail to capture the dynamics of groundwater levels because theyare controlled by the specified values of observations on the boundary, which did notshow any strong dynamics. As recharge from precipitation and irrigation backflowvaries gently in time, the intra-annual groundwater level dynamics are mainly causedby pumping of groundwater from the shallow aquifer. Since the shape of the irriga-tion area of each village is not known exactly, it is defined by constructing Thiessenpolygons around the village centers. It is quite possible that in this process, an obser-vation well falls into the wrong village in the model, and thus captures differentgroundwater level dynamics. Besides, some observation wells are not strictly usedfor observation only. They are pumping wells which are monitored only once ortwice per month when the pump is switched off. Therefore, it is inevitable that datamonitored just before or right after an irrigation event show larger dynamics thanthey should.
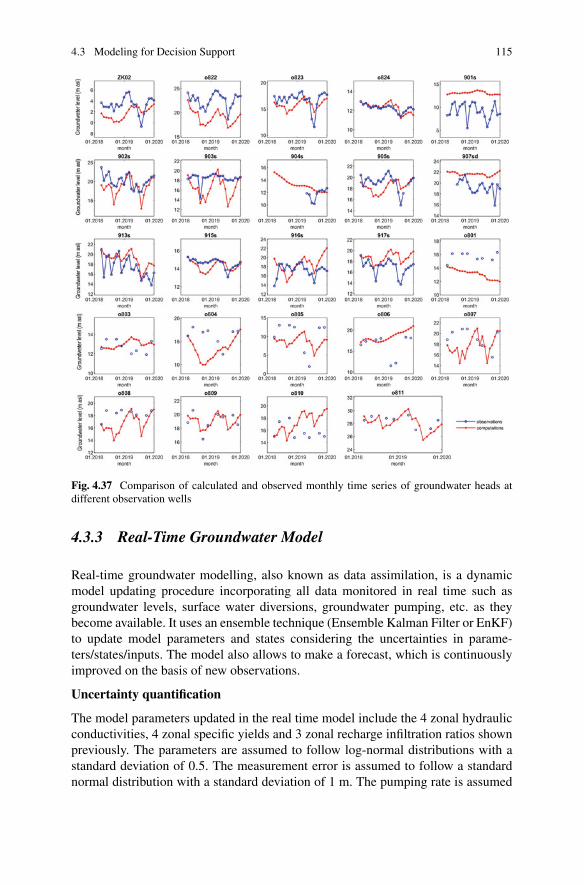
4.3 Modeling for Decision Support 115
Fig. 4.37 Comparison of calculated and observed monthly time series of groundwater heads atdifferent observation wells
4.3.3 Real-Time Groundwater Model
Real-time groundwater modelling, also known as data assimilation, is a dynamicmodel updating procedure incorporating all data monitored in real time such asgroundwater levels, surface water diversions, groundwater pumping, etc. as theybecome available. It uses an ensemble technique (Ensemble Kalman Filter or EnKF)to update model parameters and states considering the uncertainties in parame-ters/states/inputs. The model also allows to make a forecast, which is continuouslyimproved on the basis of new observations.
Uncertainty quantification
The model parameters updated in the real time model include the 4 zonal hydraulicconductivities, 4 zonal specific yields and 3 zonal recharge infiltration ratios shownpreviously. The parameters are assumed to follow log-normal distributions with astandard deviation of 0.5. The measurement error is assumed to follow a standardnormal distribution with a standard deviation of 1 m. The pumping rate is assumed
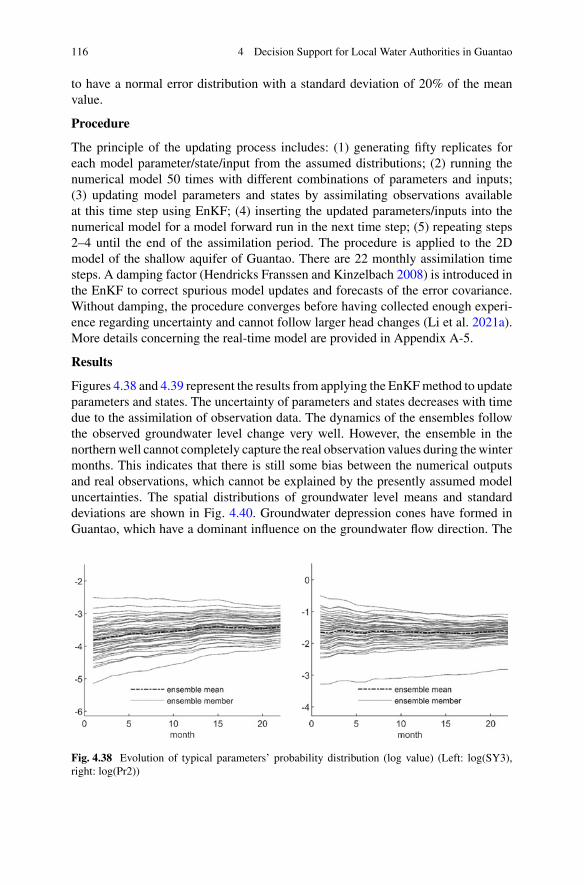
116 4 Decision Support for Local Water Authorities in Guantao
to have a normal error distribution with a standard deviation of 20% of the meanvalue.
Procedure
The principle of the updating process includes: (1) generating fifty replicates foreach model parameter/state/input from the assumed distributions; (2) running thenumerical model 50 times with different combinations of parameters and inputs;(3) updating model parameters and states by assimilating observations availableat this time step using EnKF; (4) inserting the updated parameters/inputs into thenumerical model for a model forward run in the next time step; (5) repeating steps2–4 until the end of the assimilation period. The procedure is applied to the 2Dmodel of the shallow aquifer of Guantao. There are 22 monthly assimilation timesteps. A damping factor (Hendricks Franssen and Kinzelbach 2008) is introduced inthe EnKF to correct spurious model updates and forecasts of the error covariance.Without damping, the procedure converges before having collected enough experi-ence regarding uncertainty and cannot follow larger head changes (Li et al. 2021a).More details concerning the real-time model are provided in Appendix A-5.
Results
Figures 4.38 and 4.39 represent the results from applying the EnKFmethod to updateparameters and states. The uncertainty of parameters and states decreases with timedue to the assimilation of observation data. The dynamics of the ensembles followthe observed groundwater level change very well. However, the ensemble in thenorthernwell cannot completely capture the real observation values during thewintermonths. This indicates that there is still some bias between the numerical outputsand real observations, which cannot be explained by the presently assumed modeluncertainties. The spatial distributions of groundwater level means and standarddeviations are shown in Fig. 4.40. Groundwater depression cones have formed inGuantao, which have a dominant influence on the groundwater flow direction. The
Fig. 4.38 Evolution of typical parameters’ probability distribution (log value) (Left: log(SY3),right: log(Pr2))
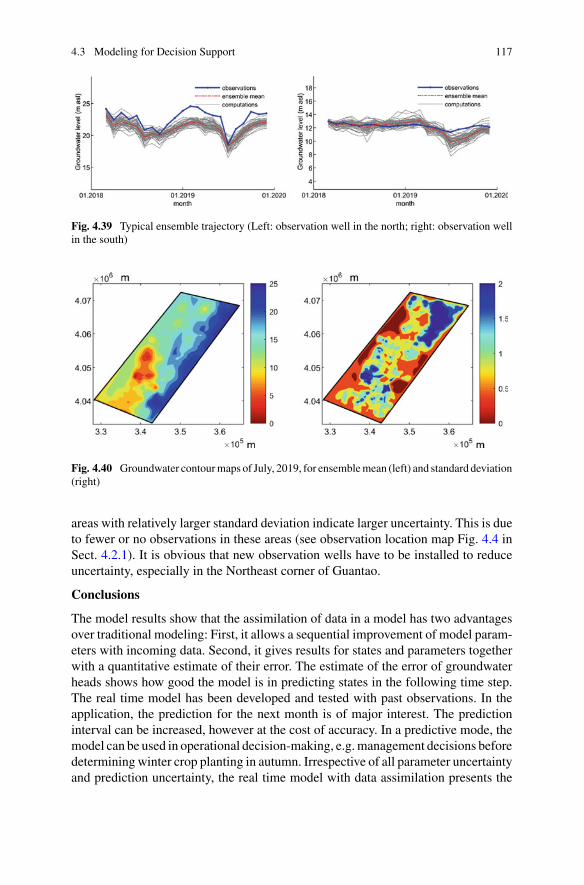
4.3 Modeling for Decision Support 117
Fig. 4.39 Typical ensemble trajectory (Left: observation well in the north; right: observation wellin the south)
Fig. 4.40 Groundwater contourmaps of July, 2019, for ensemblemean (left) and standard deviation(right)
areas with relatively larger standard deviation indicate larger uncertainty. This is dueto fewer or no observations in these areas (see observation location map Fig. 4.4 inSect. 4.2.1). It is obvious that new observation wells have to be installed to reduceuncertainty, especially in the Northeast corner of Guantao.
Conclusions
The model results show that the assimilation of data in a model has two advantagesover traditional modeling: First, it allows a sequential improvement of model param-eters with incoming data. Second, it gives results for states and parameters togetherwith a quantitative estimate of their error. The estimate of the error of groundwaterheads shows how good the model is in predicting states in the following time step.The real time model has been developed and tested with past observations. In theapplication, the prediction for the next month is of major interest. The predictioninterval can be increased, however at the cost of accuracy. In a predictive mode, themodel can be used in operational decision-making, e.g.management decisions beforedetermining winter crop planting in autumn. Irrespective of all parameter uncertaintyand prediction uncertainty, the real time model with data assimilation presents the
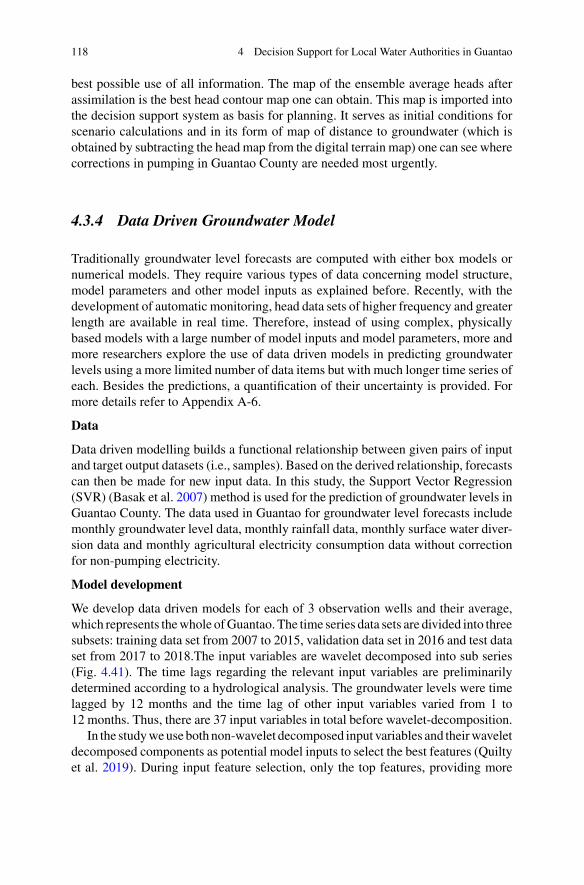
118 4 Decision Support for Local Water Authorities in Guantao
best possible use of all information. The map of the ensemble average heads afterassimilation is the best head contour map one can obtain. This map is imported intothe decision support system as basis for planning. It serves as initial conditions forscenario calculations and in its form of map of distance to groundwater (which isobtained by subtracting the head map from the digital terrain map) one can see wherecorrections in pumping in Guantao County are needed most urgently.
4.3.4 Data Driven Groundwater Model
Traditionally groundwater level forecasts are computed with either box models ornumerical models. They require various types of data concerning model structure,model parameters and other model inputs as explained before. Recently, with thedevelopment of automatic monitoring, head data sets of higher frequency and greaterlength are available in real time. Therefore, instead of using complex, physicallybased models with a large number of model inputs and model parameters, more andmore researchers explore the use of data driven models in predicting groundwaterlevels using a more limited number of data items but with much longer time series ofeach. Besides the predictions, a quantification of their uncertainty is provided. Formore details refer to Appendix A-6.
Data
Data driven modelling builds a functional relationship between given pairs of inputand target output datasets (i.e., samples). Based on the derived relationship, forecastscan then be made for new input data. In this study, the Support Vector Regression(SVR) (Basak et al. 2007) method is used for the prediction of groundwater levels inGuantao County. The data used in Guantao for groundwater level forecasts includemonthly groundwater level data, monthly rainfall data, monthly surface water diver-sion data and monthly agricultural electricity consumption data without correctionfor non-pumping electricity.
Model development
We develop data driven models for each of 3 observation wells and their average,which represents thewhole ofGuantao. The time series data sets are divided into threesubsets: training data set from 2007 to 2015, validation data set in 2016 and test dataset from 2017 to 2018.The input variables are wavelet decomposed into sub series(Fig. 4.41). The time lags regarding the relevant input variables are preliminarilydetermined according to a hydrological analysis. The groundwater levels were timelagged by 12 months and the time lag of other input variables varied from 1 to12 months. Thus, there are 37 input variables in total before wavelet-decomposition.
In the studyweuse both non-wavelet decomposed input variables and theirwaveletdecomposed components as potential model inputs to select the best features (Quiltyet al. 2019). During input feature selection, only the top features, providing more
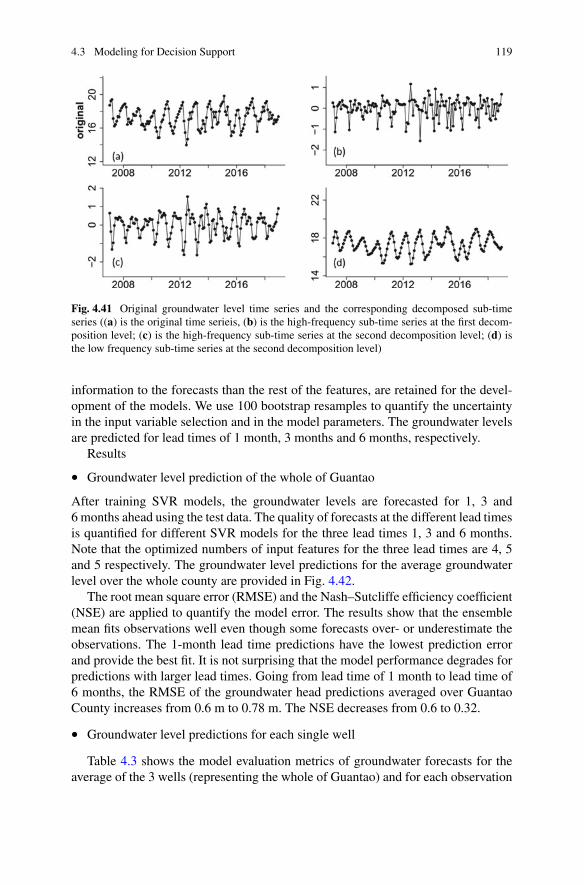
4.3 Modeling for Decision Support 119
Fig. 4.41 Original groundwater level time series and the corresponding decomposed sub-timeseries ((a) is the original time serieis, (b) is the high-frequency sub-time series at the first decom-position level; (c) is the high-frequency sub-time series at the second decomposition level; (d) isthe low frequency sub-time series at the second decomposition level)
information to the forecasts than the rest of the features, are retained for the devel-opment of the models. We use 100 bootstrap resamples to quantify the uncertaintyin the input variable selection and in the model parameters. The groundwater levelsare predicted for lead times of 1 month, 3 months and 6 months, respectively.
Results
• Groundwater level prediction of the whole of Guantao
After training SVR models, the groundwater levels are forecasted for 1, 3 and6 months ahead using the test data. The quality of forecasts at the different lead timesis quantified for different SVR models for the three lead times 1, 3 and 6 months.Note that the optimized numbers of input features for the three lead times are 4, 5and 5 respectively. The groundwater level predictions for the average groundwaterlevel over the whole county are provided in Fig. 4.42.
The root mean square error (RMSE) and the Nash–Sutcliffe efficiency coefficient(NSE) are applied to quantify the model error. The results show that the ensemblemean fits observations well even though some forecasts over- or underestimate theobservations. The 1-month lead time predictions have the lowest prediction errorand provide the best fit. It is not surprising that the model performance degrades forpredictions with larger lead times. Going from lead time of 1 month to lead time of6 months, the RMSE of the groundwater head predictions averaged over GuantaoCounty increases from 0.6 m to 0.78 m. The NSE decreases from 0.6 to 0.32.
• Groundwater level predictions for each single well
Table 4.3 shows the model evaluation metrics of groundwater forecasts for theaverage of the 3 wells (representing the whole of Guantao) and for each observation
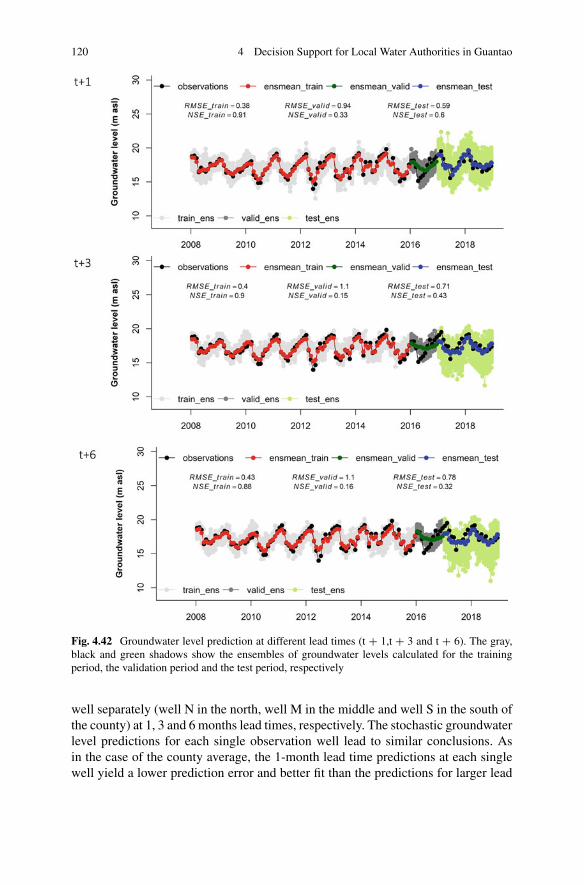
120 4 Decision Support for Local Water Authorities in Guantao
Fig. 4.42 Groundwater level prediction at different lead times (t + 1,t + 3 and t + 6). The gray,black and green shadows show the ensembles of groundwater levels calculated for the trainingperiod, the validation period and the test period, respectively
well separately (well N in the north, well M in the middle and well S in the south ofthe county) at 1, 3 and 6 months lead times, respectively. The stochastic groundwaterlevel predictions for each single observation well lead to similar conclusions. Asin the case of the county average, the 1-month lead time predictions at each singlewell yield a lower prediction error and better fit than the predictions for larger lead
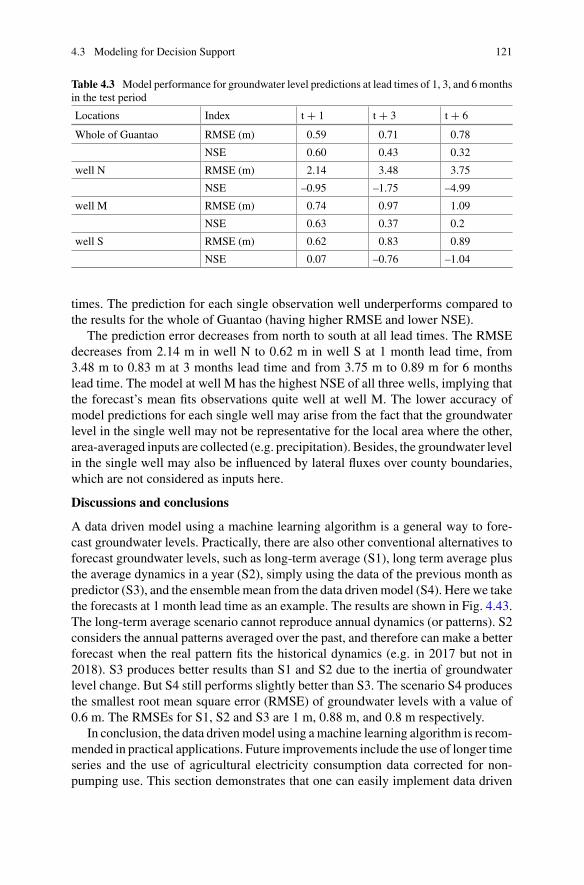
4.3 Modeling for Decision Support 121
Table 4.3 Model performance for groundwater level predictions at lead times of 1, 3, and 6monthsin the test period
Locations Index t + 1 t + 3 t + 6
Whole of Guantao RMSE (m) 0.59 0.71 0.78
NSE 0.60 0.43 0.32
well N RMSE (m) 2.14 3.48 3.75
NSE –0.95 –1.75 –4.99
well M RMSE (m) 0.74 0.97 1.09
NSE 0.63 0.37 0.2
well S RMSE (m) 0.62 0.83 0.89
NSE 0.07 –0.76 –1.04
times. The prediction for each single observation well underperforms compared tothe results for the whole of Guantao (having higher RMSE and lower NSE).
The prediction error decreases from north to south at all lead times. The RMSEdecreases from 2.14 m in well N to 0.62 m in well S at 1 month lead time, from3.48 m to 0.83 m at 3 months lead time and from 3.75 m to 0.89 m for 6 monthslead time. The model at well M has the highest NSE of all three wells, implying thatthe forecast’s mean fits observations quite well at well M. The lower accuracy ofmodel predictions for each single well may arise from the fact that the groundwaterlevel in the single well may not be representative for the local area where the other,area-averaged inputs are collected (e.g. precipitation). Besides, the groundwater levelin the single well may also be influenced by lateral fluxes over county boundaries,which are not considered as inputs here.
Discussions and conclusions
A data driven model using a machine learning algorithm is a general way to fore-cast groundwater levels. Practically, there are also other conventional alternatives toforecast groundwater levels, such as long-term average (S1), long term average plusthe average dynamics in a year (S2), simply using the data of the previous month aspredictor (S3), and the ensemblemean from the data drivenmodel (S4). Here we takethe forecasts at 1 month lead time as an example. The results are shown in Fig. 4.43.The long-term average scenario cannot reproduce annual dynamics (or patterns). S2considers the annual patterns averaged over the past, and therefore can make a betterforecast when the real pattern fits the historical dynamics (e.g. in 2017 but not in2018). S3 produces better results than S1 and S2 due to the inertia of groundwaterlevel change. But S4 still performs slightly better than S3. The scenario S4 producesthe smallest root mean square error (RMSE) of groundwater levels with a value of0.6 m. The RMSEs for S1, S2 and S3 are 1 m, 0.88 m, and 0.8 m respectively.
In conclusion, the data drivenmodel using amachine learning algorithm is recom-mended in practical applications. Future improvements include the use of longer timeseries and the use of agricultural electricity consumption data corrected for non-pumping use. This section demonstrates that one can easily implement data driven
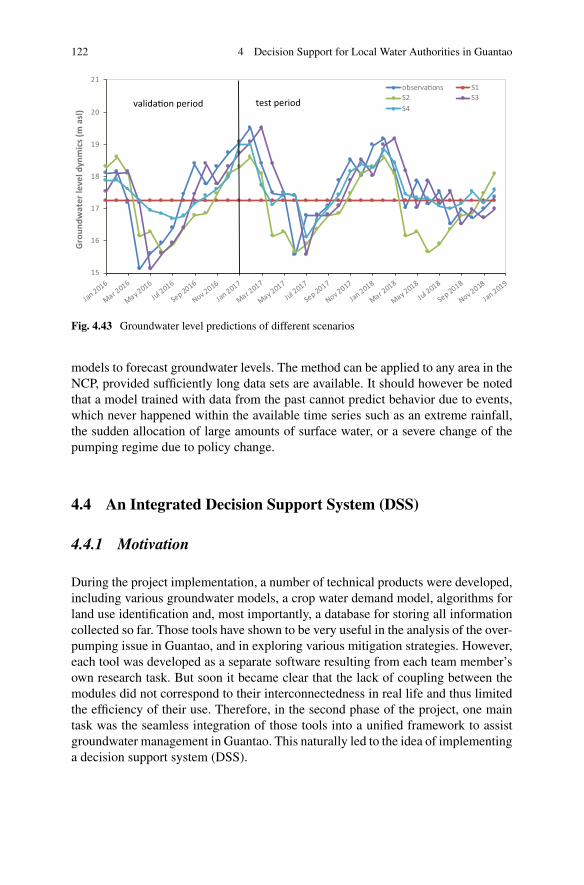
122 4 Decision Support for Local Water Authorities in Guantao
15
16
17
18
19
20
21
Jan 2016
Mar 2016
May 2016
Jul 2016
Sep 2016
Nov 2016
Jan 2017
Mar 2017
May 2017
Jul 2017
Sep 2017
Nov 2017
Jan 2018
Mar 2018
May 2018
Jul 2018
Sep 2018
Nov 2018
Jan 2019
Gro
undw
ater
leve
l dyn
mic
s (m
asl
)observa�ons S1S2 S3S4
test periodvalida�on period
Fig. 4.43 Groundwater level predictions of different scenarios
models to forecast groundwater levels. The method can be applied to any area in theNCP, provided sufficiently long data sets are available. It should however be notedthat a model trained with data from the past cannot predict behavior due to events,which never happened within the available time series such as an extreme rainfall,the sudden allocation of large amounts of surface water, or a severe change of thepumping regime due to policy change.
4.4 An Integrated Decision Support System (DSS)
4.4.1 Motivation
During the project implementation, a number of technical products were developed,including various groundwater models, a crop water demand model, algorithms forland use identification and, most importantly, a database for storing all informationcollected so far. Those tools have shown to be very useful in the analysis of the over-pumping issue in Guantao, and in exploring various mitigation strategies. However,each tool was developed as a separate software resulting from each team member’sown research task. But soon it became clear that the lack of coupling between themodules did not correspond to their interconnectedness in real life and thus limitedthe efficiency of their use. Therefore, in the second phase of the project, one maintask was the seamless integration of those tools into a unified framework to assistgroundwater management in Guantao. This naturally led to the idea of implementinga decision support system (DSS).
4.4 An Integrated Decision Support System (DSS) 123
Decision support systems (DSSs) refer to computer aided programs that helpdecision makers to solve unstructured or semi-structured problems using data andmodels (Morton 1971). They are widely used in different fields nowadays. Amongthem, environmental decision support systems (EDSS) specialize in tackling envi-ronmental problems and have attracted a growing attention from researchers, e.g.(Matthies et al. 2005;Hadded et al. 2013;McDonald et al. 2019;Whateley et al. 2015;Shao et al. 2017). The popularity of EDSS, on one hand, is due to the increasing diffi-culties in solving environmental problems, which are often entangled with humansociety, turning them into complex coupled human-nature systems (Liu et al. 2007).The complexity is further amplified by global change which imposes extra uncertain-ties concerning the future state of the world (Pachauri et al. 2014; Walker et al. 2013;Milly et al. 2008). On the other hand, the improvement of computer and monitoringtechnologies have enabled researchers to produce/access vast amounts of informa-tion and to develop more advanced analytic tools. However, those trends not onlyincrease the potential of EDSS, but also demand modern EDSS implementation tobe more democratic, user-friendly, and flexible (Mir and Quadri 2009; Hewitt andMacleod 2017; Loucks 1995; Zulkafli et al. 2017). The democratisation implies theparticipation of stakeholders in data collection, development of EDSS as well astheir final operation. The user-friendliness aims at lowering of technical barriersso that policy makers lacking specific knowledge can still themselves apply thoseanalytic tools for their decision making. The flexibility requires EDSS to be ableto include new information/functionalities with ease but also to allow integrationwith legacy models, which were built with state-of-the-art science but not designedfor the Internet context (Kumar et al. 2015). Web-based applications have become apopular solution that overcomes many of the challenges such as accessibility: Userscan easily visit applications on their computers or smart devices (Swain et al. 2015).The benefit can be further leveraged via cloud computing to remove computationlimits, and to provide on-demand load balancing in the face of high numbers ofsimultaneous users.
In this project, we implement such a web based DSS, named Guantao Deci-sion Support System (GTDSS), using modern information and communicationtechnology (ICT). The GTDSS aims to achieve two goals in particular, as shownbelow:
(1) Monitoring: Informing decision makers about states of the system based onobservation data and model estimates, where the states include groundwaterlevel, cropping area, water use and hydro-climatic conditions, etc.
(2) Planning: Designing management strategies according to sustainabilitycriteria and the target performance specified by decision makers.
The target users are officers from Guantao local water bureau, which is a smalldepartment. In addition, they have limited experience in using professionalmodellingtools, and poor access to ICT technical support—usually outsourced to 3rd partycompanies. To reduce the technical burden in using our system, the GTDSS is co-designed with stakeholders, implementing a user-friendly operability by adoptinginteractive visualization and adapting the model configuration to their needs. In
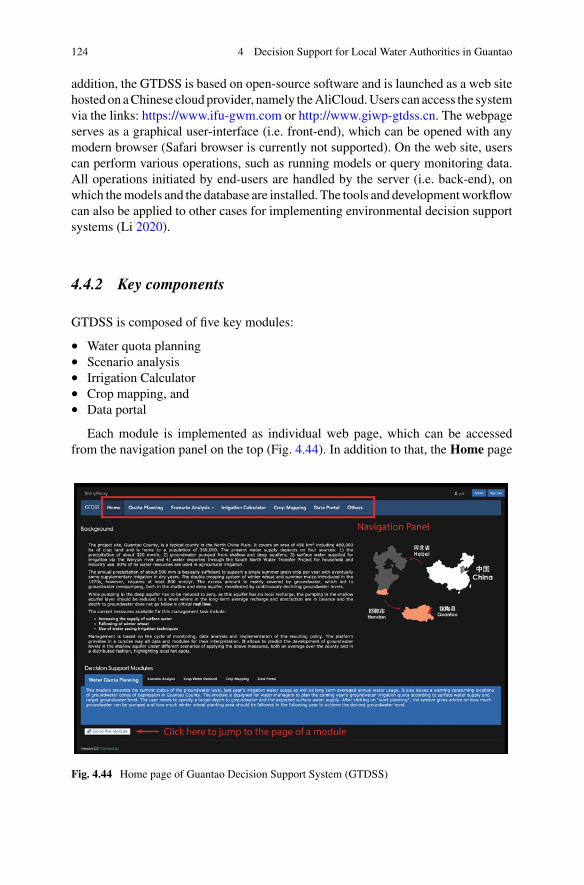
124 4 Decision Support for Local Water Authorities in Guantao
addition, the GTDSS is based on open-source software and is launched as a web sitehostedon aChinese cloudprovider, namely theAliCloud.Users can access the systemvia the links: https://www.ifu-gwm.com or http://www.giwp-gtdss.cn. The webpageserves as a graphical user-interface (i.e. front-end), which can be opened with anymodern browser (Safari browser is currently not supported). On the web site, userscan perform various operations, such as running models or query monitoring data.All operations initiated by end-users are handled by the server (i.e. back-end), onwhich themodels and the database are installed. The tools and developmentworkflowcan also be applied to other cases for implementing environmental decision supportsystems (Li 2020).
4.4.2 Key components
GTDSS is composed of five key modules:
• Water quota planning• Scenario analysis• Irrigation Calculator• Crop mapping, and• Data portal
Each module is implemented as individual web page, which can be accessedfrom the navigation panel on the top (Fig. 4.44). In addition to that, the Home page
Fig. 4.44 Home page of Guantao Decision Support System (GTDSS)
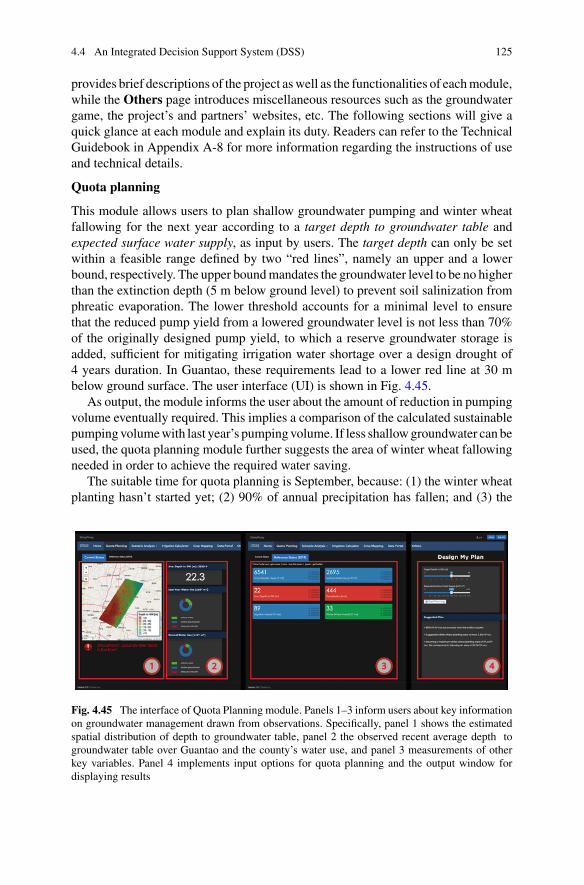
4.4 An Integrated Decision Support System (DSS) 125
provides brief descriptions of the project aswell as the functionalities of eachmodule,while the Others page introduces miscellaneous resources such as the groundwatergame, the project’s and partners’ websites, etc. The following sections will give aquick glance at each module and explain its duty. Readers can refer to the TechnicalGuidebook in Appendix A-8 for more information regarding the instructions of useand technical details.
Quota planning
This module allows users to plan shallow groundwater pumping and winter wheatfallowing for the next year according to a target depth to groundwater table andexpected surface water supply, as input by users. The target depth can only be setwithin a feasible range defined by two “red lines”, namely an upper and a lowerbound, respectively. The upper boundmandates the groundwater level to be no higherthan the extinction depth (5 m below ground level) to prevent soil salinization fromphreatic evaporation. The lower threshold accounts for a minimal level to ensurethat the reduced pump yield from a lowered groundwater level is not less than 70%of the originally designed pump yield, to which a reserve groundwater storage isadded, sufficient for mitigating irrigation water shortage over a design drought of4 years duration. In Guantao, these requirements lead to a lower red line at 30 mbelow ground surface. The user interface (UI) is shown in Fig. 4.45.
As output, the module informs the user about the amount of reduction in pumpingvolume eventually required. This implies a comparison of the calculated sustainablepumping volumewith last year’s pumping volume. If less shallowgroundwater can beused, the quota planning module further suggests the area of winter wheat fallowingneeded in order to achieve the required water saving.
The suitable time for quota planning is September, because: (1) the winter wheatplanting hasn’t started yet; (2) 90% of annual precipitation has fallen; and (3) the
Fig. 4.45 The interface of Quota Planning module. Panels 1–3 inform users about key informationon groundwater management drawn from observations. Specifically, panel 1 shows the estimatedspatial distribution of depth to groundwater table, panel 2 the observed recent average depth togroundwater table over Guantao and the county’s water use, and panel 3 measurements of otherkey variables. Panel 4 implements input options for quota planning and the output window fordisplaying results
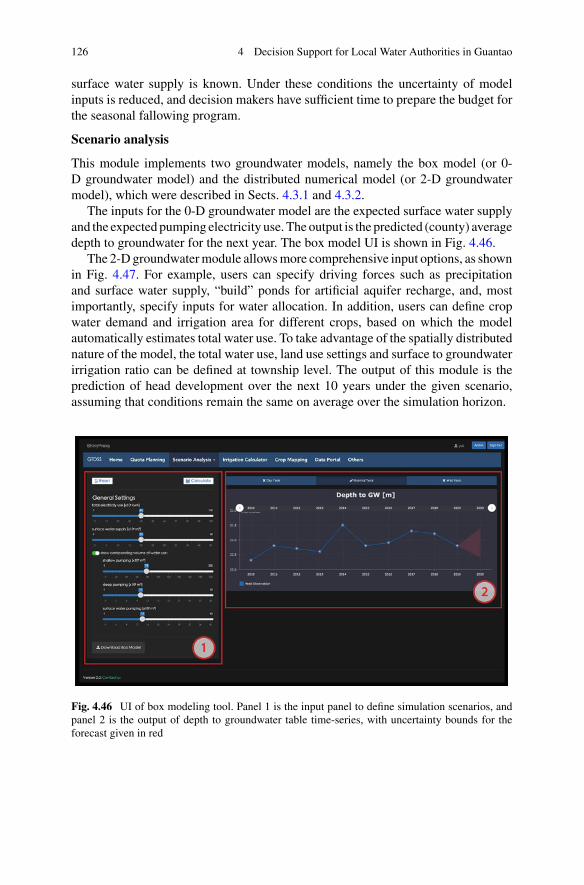
126 4 Decision Support for Local Water Authorities in Guantao
surface water supply is known. Under these conditions the uncertainty of modelinputs is reduced, and decision makers have sufficient time to prepare the budget forthe seasonal fallowing program.
Scenario analysis
This module implements two groundwater models, namely the box model (or 0-D groundwater model) and the distributed numerical model (or 2-D groundwatermodel), which were described in Sects. 4.3.1 and 4.3.2.
The inputs for the 0-D groundwater model are the expected surface water supplyand the expected pumping electricity use. The output is the predicted (county) averagedepth to groundwater for the next year. The box model UI is shown in Fig. 4.46.
The 2-D groundwatermodule allowsmore comprehensive input options, as shownin Fig. 4.47. For example, users can specify driving forces such as precipitationand surface water supply, “build” ponds for artificial aquifer recharge, and, mostimportantly, specify inputs for water allocation. In addition, users can define cropwater demand and irrigation area for different crops, based on which the modelautomatically estimates total water use. To take advantage of the spatially distributednature of the model, the total water use, land use settings and surface to groundwaterirrigation ratio can be defined at township level. The output of this module is theprediction of head development over the next 10 years under the given scenario,assuming that conditions remain the same on average over the simulation horizon.
Fig. 4.46 UI of box modeling tool. Panel 1 is the input panel to define simulation scenarios, andpanel 2 is the output of depth to groundwater table time-series, with uncertainty bounds for theforecast given in red
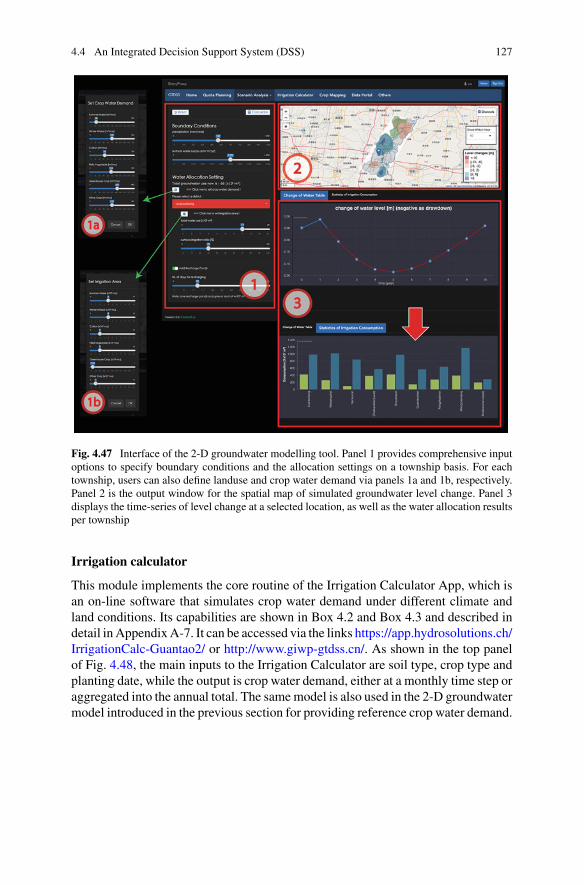
4.4 An Integrated Decision Support System (DSS) 127
Fig. 4.47 Interface of the 2-D groundwater modelling tool. Panel 1 provides comprehensive inputoptions to specify boundary conditions and the allocation settings on a township basis. For eachtownship, users can also define landuse and crop water demand via panels 1a and 1b, respectively.Panel 2 is the output window for the spatial map of simulated groundwater level change. Panel 3displays the time-series of level change at a selected location, as well as the water allocation resultsper township
Irrigation calculator
This module implements the core routine of the Irrigation Calculator App, which isan on-line software that simulates crop water demand under different climate andland conditions. Its capabilities are shown in Box 4.2 and Box 4.3 and described indetail inAppendixA-7. It can be accessed via the links https://app.hydrosolutions.ch/IrrigationCalc-Guantao2/ or http://www.giwp-gtdss.cn/. As shown in the top panelof Fig. 4.48, the main inputs to the Irrigation Calculator are soil type, crop type andplanting date, while the output is crop water demand, either at a monthly time step oraggregated into the annual total. The samemodel is also used in the 2-D groundwatermodel introduced in the previous section for providing reference crop water demand.
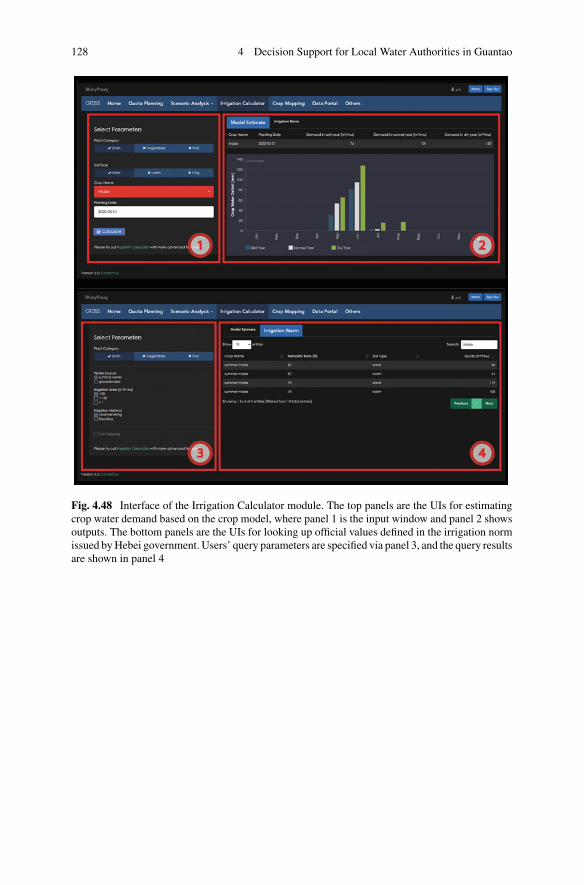
128 4 Decision Support for Local Water Authorities in Guantao
Fig. 4.48 Interface of the Irrigation Calculator module. The top panels are the UIs for estimatingcrop water demand based on the crop model, where panel 1 is the input window and panel 2 showsoutputs. The bottom panels are the UIs for looking up official values defined in the irrigation normissued byHebei government. Users’ query parameters are specified via panel 3, and the query resultsare shown in panel 4
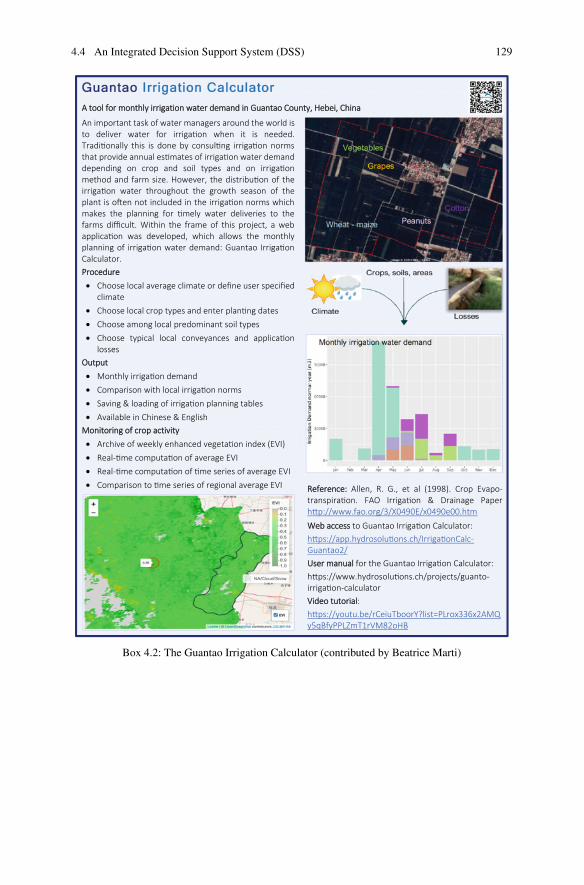
4.4 An Integrated Decision Support System (DSS) 129
Guantao Irrigation CalculatorAA tool for monthly irrigation water demand in Guantao County, Hebei, China
An important task of water managers around the world is to deliver water for irriga on when it is needed. Tradi onally this is done by consul ng irriga on norms that provide annual es mates of irriga on water demand depending on crop and soil types and on irriga on method and farm size. However, the distribu on of the irriga on water throughout the growth season of the plant is o en not included in the irriga on norms which makes the planning for mely water deliveries to the farms difficult. Within the frame of this project, a web applica on was developed, which allows the monthly planning of irriga on water demand: Guantao Irriga on Calculator. Procedure
Choose local average climate or define user specified climate Choose local crop types and enter plan ng dates Choose among local predominant soil types Choose typical local conveyances and applica on losses
OutputMonthly irriga on demand Comparison with local irriga on norms Saving & loading of irriga on planning tables Available in Chinese & English
Monitoring of crop activityArchive of weekly enhanced vegeta on index (EVI) Real- me computa on of average EVI Real- me computa on of me series of average EVI Comparison to me series of regional average EVI Reference: Allen, R. G., et al (1998). Crop Evapo-
transpira on. FAO Irriga on & Drainage Paper h p://www.fao.org/3/X0490E/x0490e00.htmWeb access to Guantao Irriga on Calculator: h ps://app.hydrosolu ons.ch/Irriga onCalc-Guantao2/User manual for the Guantao Irriga on Calculator: h ps://www.hydrosolu ons.ch/projects/guanto-irriga on-calculator Video tutorial: h ps://youtu.be/rCeiuTboorY?list=PLrox336x2AMQy5qBfyPPLZmT1rVM82oHB
Box 4.2: The Guantao Irrigation Calculator (contributed by Beatrice Marti)
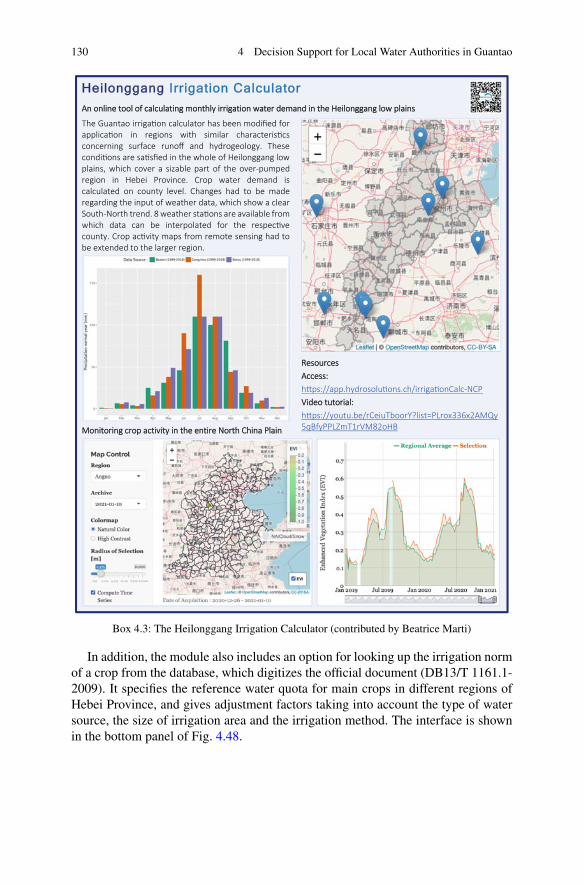
130 4 Decision Support for Local Water Authorities in Guantao
Heilonggang Irrigation CalculatorAAn online tool of calculating monthly irrigation water demand in the Heilonggang low plains
The Guantao irriga on calculator has been modified for applica on in regions with similar characteris cs concerning surface runoff and hydrogeology. These condi ons are sa sfied in the whole of Heilonggang low plains, which cover a sizable part of the over-pumped region in Hebei Province. Crop water demand is calculated on county level. Changes had to be made regarding the input of weather data, which show a clear South-North trend. 8 weather sta ons are available from which data can be interpolated for the respec ve county. Crop ac vity maps from remote sensing had to be extended to the larger region.
Monitoring crop activity in the entire North China Plain
ResourcesAccess:h ps://app.hydrosolu ons.ch/irriga onCalc-NCPVideo tutorial:h ps://youtu.be/rCeiuTboorY?list=PLrox336x2AMQy5qBfyPPLZmT1rVM82oHB
Box 4.3: The Heilonggang Irrigation Calculator (contributed by Beatrice Marti)
In addition, the module also includes an option for looking up the irrigation normof a crop from the database, which digitizes the official document (DB13/T 1161.1-2009). It specifies the reference water quota for main crops in different regions ofHebei Province, and gives adjustment factors taking into account the type of watersource, the size of irrigation area and the irrigation method. The interface is shownin the bottom panel of Fig. 4.48.
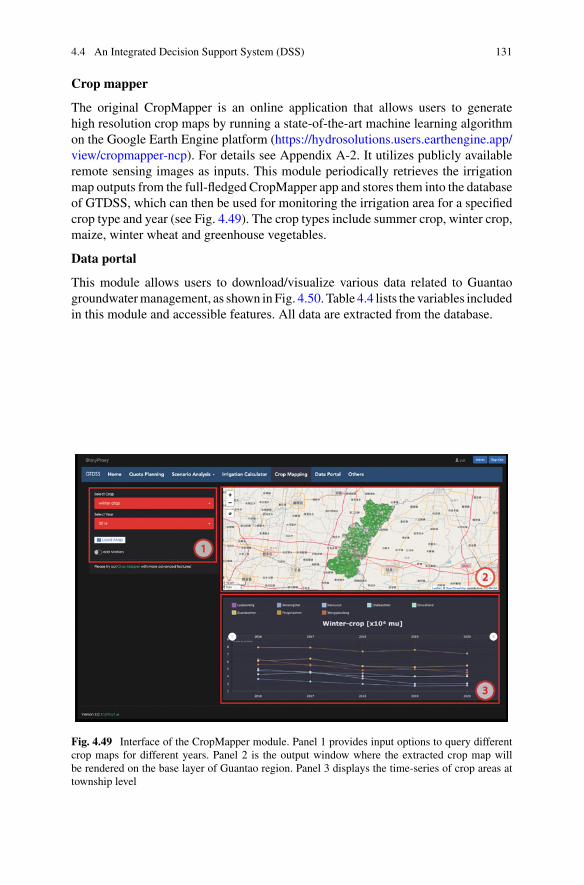
4.4 An Integrated Decision Support System (DSS) 131
Crop mapper
The original CropMapper is an online application that allows users to generatehigh resolution crop maps by running a state-of-the-art machine learning algorithmon the Google Earth Engine platform (https://hydrosolutions.users.earthengine.app/view/cropmapper-ncp). For details see Appendix A-2. It utilizes publicly availableremote sensing images as inputs. This module periodically retrieves the irrigationmap outputs from the full-fledged CropMapper app and stores them into the databaseof GTDSS, which can then be used for monitoring the irrigation area for a specifiedcrop type and year (see Fig. 4.49). The crop types include summer crop, winter crop,maize, winter wheat and greenhouse vegetables.
Data portal
This module allows users to download/visualize various data related to Guantaogroundwatermanagement, as shown inFig. 4.50. Table 4.4 lists the variables includedin this module and accessible features. All data are extracted from the database.
Fig. 4.49 Interface of the CropMapper module. Panel 1 provides input options to query differentcrop maps for different years. Panel 2 is the output window where the extracted crop map willbe rendered on the base layer of Guantao region. Panel 3 displays the time-series of crop areas attownship level
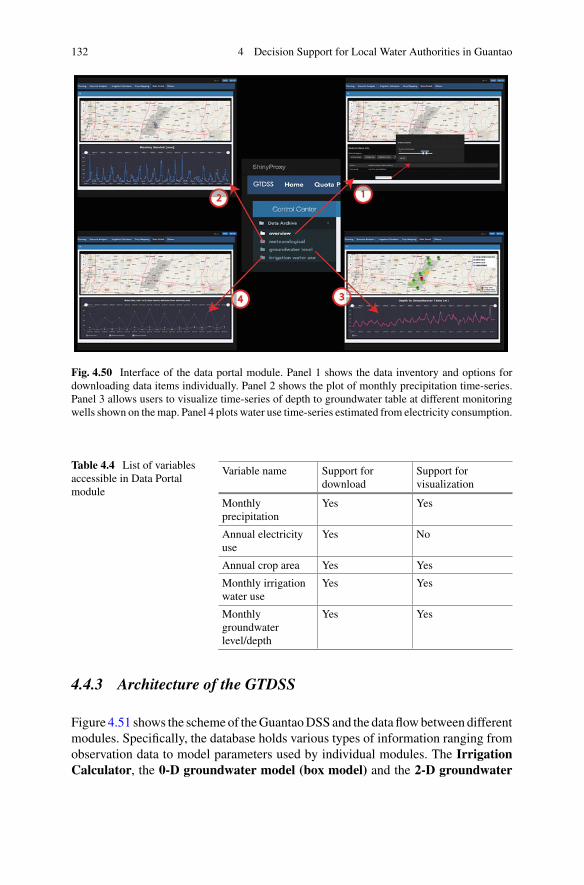
132 4 Decision Support for Local Water Authorities in Guantao
Fig. 4.50 Interface of the data portal module. Panel 1 shows the data inventory and options fordownloading data items individually. Panel 2 shows the plot of monthly precipitation time-series.Panel 3 allows users to visualize time-series of depth to groundwater table at different monitoringwells shown on themap. Panel 4 plots water use time-series estimated from electricity consumption.
Table 4.4 List of variablesaccessible in Data Portalmodule
Variable name Support fordownload
Support forvisualization
Monthlyprecipitation
Yes Yes
Annual electricityuse
Yes No
Annual crop area Yes Yes
Monthly irrigationwater use
Yes Yes
Monthlygroundwaterlevel/depth
Yes Yes
4.4.3 Architecture of the GTDSS
Figure 4.51 shows the schemeof theGuantaoDSS and the data flowbetween differentmodules. Specifically, the database holds various types of information ranging fromobservation data to model parameters used by individual modules. The IrrigationCalculator, the 0-D groundwater model (box model) and the 2-D groundwater
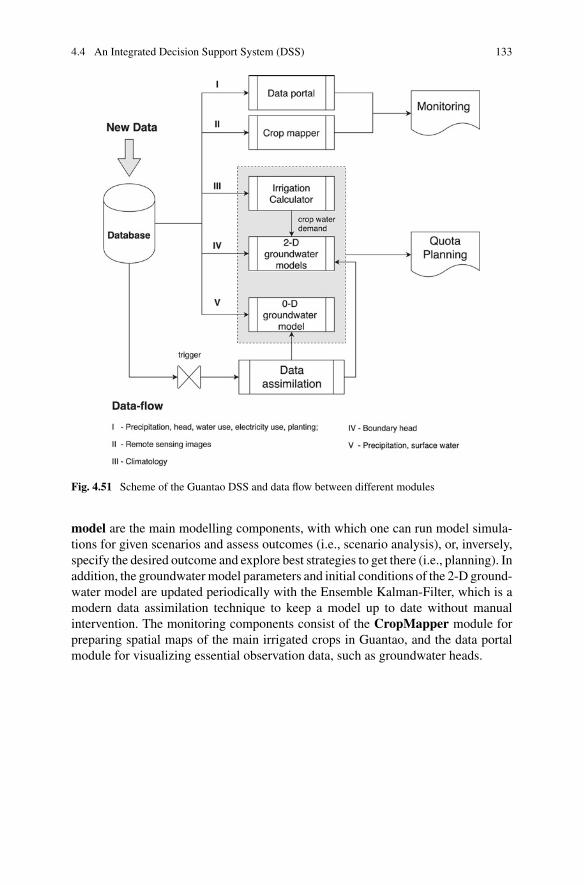
4.4 An Integrated Decision Support System (DSS) 133
Fig. 4.51 Scheme of the Guantao DSS and data flow between different modules
model are the main modelling components, with which one can run model simula-tions for given scenarios and assess outcomes (i.e., scenario analysis), or, inversely,specify the desired outcome and explore best strategies to get there (i.e., planning). Inaddition, the groundwater model parameters and initial conditions of the 2-D ground-water model are updated periodically with the Ensemble Kalman-Filter, which is amodern data assimilation technique to keep a model up to date without manualintervention. The monitoring components consist of the CropMapper module forpreparing spatial maps of the main irrigated crops in Guantao, and the data portalmodule for visualizing essential observation data, such as groundwater heads.
134 4 Decision Support for Local Water Authorities in Guantao
References
ADB (2013). Climate Change Adaptation through Groundwater Management of Shanxi Province,People’s Republic of China. Asian Development Bank, Loan Project ‘Shanxi integratedAgricultural Development Project’. Final Report 0188. PRC ADB Grant Project
Allen RG, Pereira LS, Raes D, SmithM (1998). Crop Evapotranspiration (guidelines for computingcrop water requirements). FAO Irrigation and Drainage Paper. http://www.fao.org/3/x0490e/x0490e00.htm
Basak D, Pal S, Patranabis DC (2007) Support vector regression. Neural Inf Process Lett Rev11:203–224
ChiangWH, KinzelbachW (2000) 3D-Groundwater modeling with PMWIN—a simulation systemfor modeling groundwater flow and pollution. Springer, Berlin Heidelberg New York, p 346p
Hadded R, Nouiri I, Alshihabi O, Maßmann J, Huber M, Laghouane A, Yahiaoui H, Tarhouni J(2013) A decision support system to manage the groundwater of the Zeuss Koutine aquifer usingtheWEAP-MODFLOW framework. Water Resour Manage 27(7):1981–2000. https://doi.org/10.1007/s11269-013-0266-7
Harbaugh AW, Banta ER, Hill MC, McDonald MG (2000) MODFLOW-2000, the U. S. GeologicalSurvey modular groundwater model—user guide to modularization concepts and the ground-water flow process, Open-File Rep. 00-92, U.S. Geol. Survey, Reston, Va
Hendricks Franssen HJ, Kinzelbach W (2008) Real-time groundwater flow modeling with theEnsemble Kalman Filter: Joint estimation of states and parameters and the filter inbreedingproblem. Water Resour Res 44:W09408. https://doi.org/10.1029/2007WR006505
Hewitt RJ, Macleod CJA (2017) What do users really need? Participatory development of decisionsupport tools for environmental management based on outcomes. Environments 4(4):88. https://doi.org/10.3390/environments4040088
Kumar S, Godrej AN, Grizzard TJ (2015) A web-based environmental decision support system forlegacy models. J Hydroinf 17(6):874–890. https://doi.org/10.2166/hydro.2018.088
Li Y (2020). Towards fast prototyping of cloud-based environmental decision support systems forenvironmental scientists using R Shiny and Docker. Environ Model Softw 132:0–9https://doi.org/10.1016/j.envsoft.2020.104797
Li N, Kinzelbach W, Li HT, Li WP, Chen F (2019) Decomposition technique for contributionsto groundwater heads from inside and outside of an arbitrary boundary: application to GuantaoCounty, North China Plain. Hydrol Earth Syst Sci 23:2823–2840. https://doi.org/10.5194/hess-23-2823-2019
Li N, Kinzelbach W, Li HT, Li WP, Chen F (2021) Improving parameter and state estimation of ahydrological model with the ensemble square root filter. Adv Water Resour 147:103813.https://doi.org/10.1016/j.advwatres.2020.103813
Li Y, KinzelbachW,WangH, Ragettli S, Lei ZX, LiWP, Pan H (2021)Management of groundwateroverpumping in arid regions: Lessons from Luotuocheng irrigation district, China. (Submittedfor publication)
Liu J, Dietz T, Carpenter SR, Alberti M, Folke C, Moran E, Pell AN, Deadman P, Kratz T,Lubchenco J,OstromE,OuyangZ, ProvencherW,RedmanCL, Schneider SH,TaylorWW(2007)Complexity of coupled human and natural systems. Science 317(5844):1513–1516. https://doi.org/10.1126/science.1144004
Liu Z (2016) Analysis on the reform of water resources management in Minqin county. Gansu SciTechnol 32:10–13 (in Chinese)
Loucks DP (1995) Developing and implementing decision support systems: a critique and a chal-lenge. J Am Water Resour Assoc 31(4):571–582. https://doi.org/10.1111/j.1752-1688.1995.tb03384.x
References 135
Matthies M, Giupponi C, Ostendorf B (2005) Environmental decision support systems: currentissues, methods and tools. Environ Model Softw 22(2):123–127. https://doi.org/10.1016/j.envsoft.2005.09.005
McDonald S,Mohammed IN,Bolten JD, Pulla S,MeechaiyaC,Markert A,NelsonEJ, SrinivasanR,LakshmiV (2019).Web-based decision support system tools: the Soil andWater Assessment ToolOnline visualization and analyses (SWATOnline) and NASA earth observation data downloadingand reformatting tool (NASAaccess). EnvironModel Softw 120:104499. https://doi.org/10.1016/j.envsoft.2019.104499
Milly PCD, Betancourt J, Falkenmark M, Hirsch RM, Kundzewicz ZW, Lettenmaier DP, StoufferRJ (2008) Stationarity is dead: whither water management? Science 319(5863):573–574. https://doi.org/10.1126/science.1151915
Mir SA, Quadri SMK (2009) Decision support systems: concepts, progress and issues a review.In: Lichtfouse E (ed) Climate change, intercropping, pest control and beneficial microorganisms.Springer, Netherlands, Dordrecht, pp 373–399
Morton MSS (1971) Management decision systems: computer-based support for decision making.Graduate School of Business Administration, Harvard University, Division of Research
Pachauri RK, Allen MR, Barros VR Broome J, Cramer W, Christ R, Church JA, Clarke L, DaheQ, Dasgupta P, et al. (2014). Climate Change 2014: Synthesis Report. Contribution of WorkingGroups I, II and III to the Fifth Assessment Report of the Intergovernmental Panel on ClimateChange
Quilty J, Adamowski J, Boucher MA (2019) A stochastic data-driven ensemble forecasting frame-work for water resources: a case study using ensemble members derived from a database ofdeterministic wavelet-based models. Water Resour Res 55(1):175–202. https://doi.org/10.1029/2018WR023205
Ragettli S, Herberz T, Siegfried T (2018) An unsupervised classification algorithm for multi-temporal irrigated area mapping in Central Asia. Remote Sens 10(11):1823. https://doi.org/10.3390/rs10111823
Sanz D, Calera A, Castano S, Gomez-Alday JJ (2016) Knowledge, participation and transparencyin groundwater management. Water Policy 18:111–125. https://doi.org/10.2166/wp.2015.024
Shao H, Yang W, Lindsay J, Liu Y, Yu Z, Oginskyy A (2017) An open source gis-based decisionsupport system for watershed evaluation of best management practices. J AmWater Resour Assoc53(3):521–531. https://doi.org/10.1111/1752-1688.12521
SwainNR, LatuK,Christensen SD, JonesNL.NelsonEJ,Ame,DP,WilliamsGP (2015)A reviewofopen source software solutions for developing water resources web applications. Environ ModelSoftw 67:108–117. https://doi.org/10.1016/j.envsoft.2015.01.014
Walker WE, Lempert RJ, Kwakkel JH (2013) Deep uncertainty. In: Gass SI, Fu MC (eds)Encyclopedia of operations research and management science. Springer, US, pp 395–402
Wang XW, Shao JL, Van Steenbergen F, Zhang QL (2017) Implementing the prepaid smart metersystem for irrigated groundwater production in northern china: status and problems. Water9(6):379. https://doi.org/10.3390/w9060379
Wang L, Kinzelbach W, Yao HX, Steiner J, Wang H (2020) How to meter agricultural pumpingat numerous small-scale wells? An indirect monitoring method using electric energy as proxy.Water 12(9):2477. https://doi.org/10.3390/w12092477
Whateley S, Walker JD, Brown C (2015) A web-based screening model for climate risk to watersupply systems in the north-eastern United States. Environ Model Softw 73:64–75. https://doi.org/10.1016/j.envsoft.2015.08.001
Yang GY, Gu JF (2008) Handan water resources assessment. Xueyuan Press, Handan (In Chinese)Yang D, Chen J, Zhou Y, Chen X, Chen X, Cao X (2017) Mapping plastic greenhouse with mediumspatial resolution satellite data: Development of a new spectral index. J Photogramm. RemoteSens 128:47–60. https://doi.org/10.1016/j.isprsjprs.2017.03.002
Zoha A, Gluhak A, Imran MA, Rajasegarar S (2012) Non-intrusive load monitoring approachesfor disaggregated energy sensing: a survey. Sensors 12:16838–16866. https://doi.org/10.3390/s121216838
136 4 Decision Support for Local Water Authorities in Guantao
Zulkafli Z, Perez K, Vitolo C, Buytaert W, Karpouzoglou T, Dewulf A, De Bièvre B, Clark J,Hannah DM, Shaheed S (2017) User-driven design of decision support systems for polycentricenvironmental resources management. Environ Model Softw 88:58–73. https://doi.org/10.1016/j.envsoft.2016.10.012
Open Access This chapter is licensed under the terms of the Creative Commons Attribution 4.0International License (http://creativecommons.org/licenses/by/4.0/), which permits use, sharing,adaptation, distribution and reproduction in any medium or format, as long as you give appropriatecredit to the original author(s) and the source, provide a link to the Creative Commons license andindicate if changes were made.
The images or other third party material in this chapter are included in the chapter’s CreativeCommons license, unless indicated otherwise in a credit line to the material. If material is notincluded in the chapter’s Creative Commons license and your intended use is not permitted bystatutory regulation or exceeds the permitted use, you will need to obtain permission directly fromthe copyright holder.
Chapter 5Way Forward
The combination of fallowing and substituting groundwater by surface water waseffective in reducing aquifer depletion in Guantao. The average annual depletionrate after 2014 was about half the value of the pre-project period 2000–2013 andbasically limited to the deep aquifer. The goal of closing all deep aquifer wells hasonly been reached partially, their use being necessary in locations where the shallowaquifer is too saline. Ending unsustainable groundwater use in Guantao and the NCPis feasible with presently available options. It involves a set of measures, large andsmall, which are all needed. Uncertainty in the future role of groundwater resourcesis introduced by climate change and socio-economic development. The transitionfrom small family farms to large industrial farms will increase the overall efficiencyof farming including water use efficiency. Population decrease and diet change bothaffect food demand and thus future agricultural structure and irrigation demand. Newcultivars may increase yield without increasing water needs. While the current over-pumping control heavily depends on surface water imports from the South, climatechange induces uncertainty by both reducing water availability in the South andincreasing water deficits of double cropping in the NCP.
5.1 Recommendations for Guantao
The situation of groundwater over-pumping in Guantao has improved since 2014.The groundwater gap of about 37 Mio. m3/year before 2014 has been reduced toalmost one half during the project. The shallow aquifer is basically in equilibriumbetween recharge and discharge. The remaining task is stopping the decline of piezo-metric levels in the deep aquifer, which implies the abandoning of all deep wells.The corresponding reduction of pumping from the deep aquifer of approximately20 Mio. m3/year can be implemented either by decreasing demand or increasingsupply. Further fallowing of winter wheat, making better use of present surface water
© The Author(s) 2022W. Kinzelbach et al., Groundwater Overexploitation in the North China Plain:A path to Sustainability, Springer Water,https://doi.org/10.1007/978-981-16-5843-3_5
137
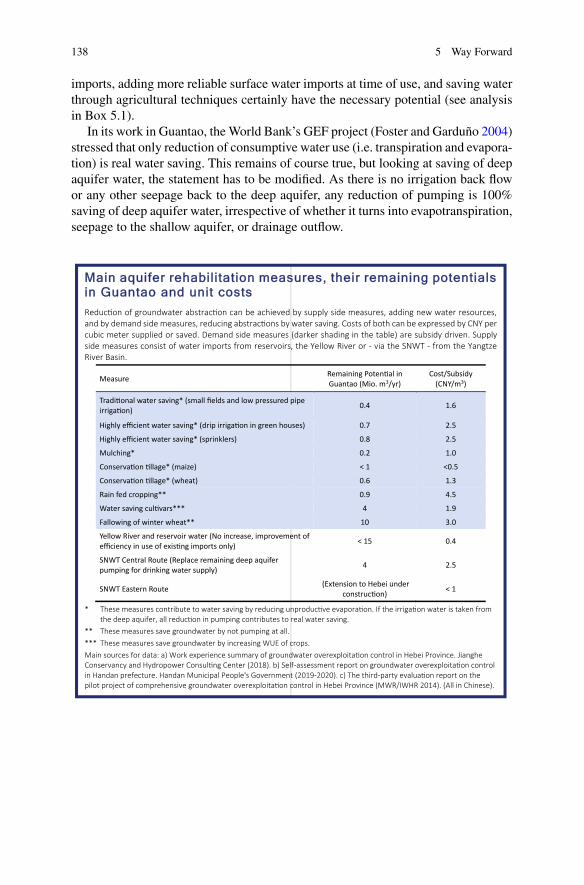
138 5 Way Forward
imports, adding more reliable surface water imports at time of use, and saving waterthrough agricultural techniques certainly have the necessary potential (see analysisin Box 5.1).
In its work in Guantao, theWorld Bank’s GEF project (Foster and Garduño 2004)stressed that only reduction of consumptive water use (i.e. transpiration and evapora-tion) is real water saving. This remains of course true, but looking at saving of deepaquifer water, the statement has to be modified. As there is no irrigation back flowor any other seepage back to the deep aquifer, any reduction of pumping is 100%saving of deep aquifer water, irrespective of whether it turns into evapotranspiration,seepage to the shallow aquifer, or drainage outflow.
MMain aquifer rehabilitation measures, their remaining potentials in Guantao and unit costs Reduc on of groundwater abstrac on can be achieved by supply side measures, adding new water resources, and by demand side measures, reducing abstrac ons by water saving. Costs of both can be expressed by CNY per cubic meter supplied or saved. Demand side measures (darker shading in the table) are subsidy driven. Supply side measures consist of water imports from reservoirs, the Yellow River or - via the SNWT - from the Yangtze River Basin.
Measure Remaining Poten al in Guantao (Mio. m3/yr)
Cost/Subsidy (CNY/m3)
Tradi onal water saving* (small fields and low pressured pipe irriga on) 0.4 1.6
Highly efficient water saving* (drip irriga on in green houses) 0.7 2.5
Highly efficient water saving* (sprinklers) 0.8 2.5
Mulching* 0.2 1.0
Conserva on llage* (maize) < 1 <0.5
Conserva on llage* (wheat) 0.6 1.3
Rain fed cropping** 0.9 4.5
Water saving cul vars*** 4 1.9
Fallowing of winter wheat** 10 3.0
Yellow River and reservoir water (No increase, improvement of efficiency in use of exis ng imports only) < 15 0.4
SNWT Central Route (Replace remaining deep aquifer pumping for drinking water supply) 4 2.5
SNWT Eastern Route (Extension to Hebei under construc on) < 1
* These measures contribute to water saving by reducing unproduc ve evapora on. If the irriga on water is taken from the deep aquifer, all reduc on in pumping contributes to real water saving.
** These measures save groundwater by not pumping at all. *** These measures save groundwater by increasing WUE of crops. Main sources for data: a) Work experience summary of groundwater overexploita on control in Hebei Province. Jianghe Conservancy and Hydropower Consul ng Center (2018). b) Self-assessment report on groundwater overexploita on control in Handan prefecture. Handan Municipal People's Government (2019-2020). c) The third-party evalua on report on the pilot project of comprehensive groundwater overexploita on control in Hebei Province (MWR/IWHR 2014). (All in Chinese).
5.1 Recommendations for Guantao 139
Box 5.1: Aquifer rehabilitation measures: remaining potential in Guantao and specific costs. The
box shows two prominent items, improved used of water imports from the south and increased
fallowing of winter wheat, which taken together are sufficient to close a gap of 20 Mio. m3/year.
They are followed in size by water saving through new cultivars (4 Mio. m3/year) and numerous
“small” measures of water conservation, also adding up to a potential of about 4 Mio. m3/year.
Deep aquifer pumping by households and industry should be completely substituted by additional
imports of 4 Mio. m3/year of SNWT water. All measures together (30 Mio. m3/year) should be
sufficient to fill the deep aquifer gap in the coming years provided the continued commitment of
the administration.
The success of the last 7 years is mainly due to the fallowing measures and theimport of surface water. It does not mean that no more management of the shallowaquifer is necessary. On the contrary, only from this situation as a starting pointthe storage of the shallow aquifer can be managed actively, hopefully increased,as a storage device to overcome future drought years. The system in place is alsoimportant to react to more systematic changes in the future, be it a change in cropwater demand due to rising temperatures or changes in recharge due to changes inrainfall and rainfall patterns. The decision support system can keep track and help indesigning the right answers in an adaptive management approach charted out by thered line concept.
The metering of water use and the collection of fees either for amounts overstep-ping quota or for every cubic meter of water pumped certainly serves the purpose ofensuring general discipline in water use. It is however only justified if the fees leadto a reduction of pumping. This can happen either directly or indirectly by using thecollected fees to subsidize water saving measures.
Metering by electricity consumption is practicable and makes economic sense. Itshould be developed further with the electricity company using their daily available“big data”. It would be ideal if the water fee could be collected automatically togetherwith the electricity fee saving the effort for a second fee collection system.
Much has been achieved in the last years and a combination of crop systemchange and South-North Water Transfer (SNWT) clearly has sufficient potential tostop aquifer depletion, not only in Guantao but in the whole of the NCP. But stoppingthe depletion is not enough. Even if a cone of depression is stabilized by surfacewaterimports and a hydraulic quasi-steady state can be reached, such a closed system willsalinize with time. Only if drainage outflows to the sea via canals, streams, riversand the aquifer are restored one can truly speak of a sustainable solution. In future,the focus should turn to groundwater quality. The salinity of pumped water shouldbe monitored at least once per year. The increased agricultural pumping in the deepaquifer of the last few years is probably already related to an increase in salinity inthe shallow aquifer’s cones of depression. While the end of over-pumping is withinreach, the salinity problemwill not go away and requires further carefulmanagement.
140 5 Way Forward
5.2 Agriculture and Future Groundwater Managementin the NCP
Groundwater depletion in the NCP was a consequence of the governments’ will tobattle famine in the early 1980s. Hebei Province played an important role in feedingthe country since then. It increased its yield by 2–3 times over the past 3 decades.The intensification of food production coincided with a time of decreasing rainfall,which magnified the consequences regarding groundwater levels.
The centralized governmental structure in China usually allows the Chineseleaders to mobilize a vast amount of resources to pursue a goal or solve any problemin a determined manner once an issue is confirmed as extremely important. If aproblem is perceived as in conflict with other objectives of interest, any decisionis essentially a trade-off. This is the case for groundwater management in the NCPbecause mitigating groundwater over-pumping may hurt national food security andfarmers’ income, which are both considered at least as important as environmentalprotection, if not more important. In 2021, the agricultural department again receivedthe task of increasing crop production (http://www.xinhuanet.com/2021-01/03/c_1126940702.htm).
Population will peak between 2025 and 2030 at about 1.5 billion (Chen et al.2020), who want to have an ever-richer diet with more meat, vegetables, and fruit.Climate change will decrease the yield of some of today’s cultivars due to highertemperature and increase the water demand of crops due to higher ET (see Sect. 5.5).Water scarcity is exacerbated by deteriorating soil and water quality. Climate changemay also put a question mark to the water transfers from the South, which mustmaintain a reserve for its own growth. So, will the solutions envisaged today stillhold in 2050 or does it take more? To approach this question, a look at some trendsof today is helpful.
5.2.1 Transition from Smallholder Agriculture to LargerFarms
Thefirst trend is the transition from the present smallholder agriculture tomodernizedlarger-scale farming in the NCP. The smallholder family farms with a cropping areaof a third of a hectare, are economically unattractive and have no future. The annualincome from a winter wheat and a summer maize crop on that area is less than 3000CNY per person , which compares unfavorably with the average annual income inChina of about 30′000 CNY per person. Young people leave the countryside andlook for jobs in the cities. Their support of their parents is usually more significantthan the parents’ own income from farming. Most people working in the fields areabove 45 and the question must be asked, who will produce China’s food in 2050(see Box 5.2). The situation is expected to change dramatically in the next decade(s)due to the fast change in rural population structure. With it, agricultural production
5.2 Agriculture and Future Groundwater Management in the NCP 141
activities and organization forms will change substantially too, from smallholderfarming to larger farms through land aggregation.
Take Switzerland for example: For an economically viable farm of 4 persons inSwitzerland a farm area of about 100 ha (300 times the area of a Chinese family farmor almost the size of the whole cropland of a village in the NCP) is necessary. It istypically managed by the family plus one additional farm hand, which is feasible dueto a high degree of mechanization, applying modern technology both for remotelycontrollable hardware, including machinery and irrigation equipment, and for infor-mation technology harnessing information on plant health, weather and markets forexample.
Chinese farming is developing in the same direction. Farm sizes in the NCP arealready increasing. Big entrepreneurs lease land from individual farmers, sometimesof whole villages, to practice a larger scale and more efficient style of farming. Thisopens up new opportunities also for increased efficiency in water use. However, it isunclear how grain production can eventually become profitable for big farms relyingon land leased from small farm households. With the current leasing cost (800–1000CNY/mu/year), planting grain crops (wheat and maize) is not sufficiently profitableto attract farming enterprises to take over. Agricultural land ownership and the rightto trade ownership in a more permanent way will become more and more a criticalissue in this transition process.
Using engineering and agronomic approaches, larger farm units can fully exploitthe potential for improving water use efficiency beyond today’s level. While highlyefficient center-pivot sprinklers are neither applicable nor affordable for today’s smallfamily farms, they can unfold their full water saving potential on farms of at least100 ha in size. A large farm can also afford to fallow a certain percentage of its areain order to let the soil rest or to plant green manure without having to be pushed bygovernment. Today’s pioneers of big farming go into niche products such as plantseeds, health foods, medicinal plants, or farm tourism to optimize income. At thenext stage, grain production should be considered for scale-up to a more efficientand profitable operation.
Greenhouses are the most profitable production units, even at the scale of a familyfarm. When equipped with soil moisture sensors and automatic drip- or micro-sprinkling equipment they can save significant amounts of water compared to thetraditional green houses. At the same time, they can save labor, which meanwhile hasbecome expensive in China. In the US, vertical farms are quickly expanding. Theyproduce vegetables in hydroponic cultures close to the consumer. Their water use isminimal as most of the transpired water can be recycled. And they do not need anyagrochemicals except nutrients. Economic viability relies on the consumers’ demandfor healthy food. China’s urban elite is also conscious of food quality, which showsin collective ordering or “crowd farming” of farm products from trusted producersin the periphery.
Bigger farms allow a more scientific approach to crop production, often termed“precision agriculture”, which benefits the quality of the produce as well as theenvironment. Drones already today apply crop protection products. In future theywill be able to deposit those products on plants in need only. Similar technology
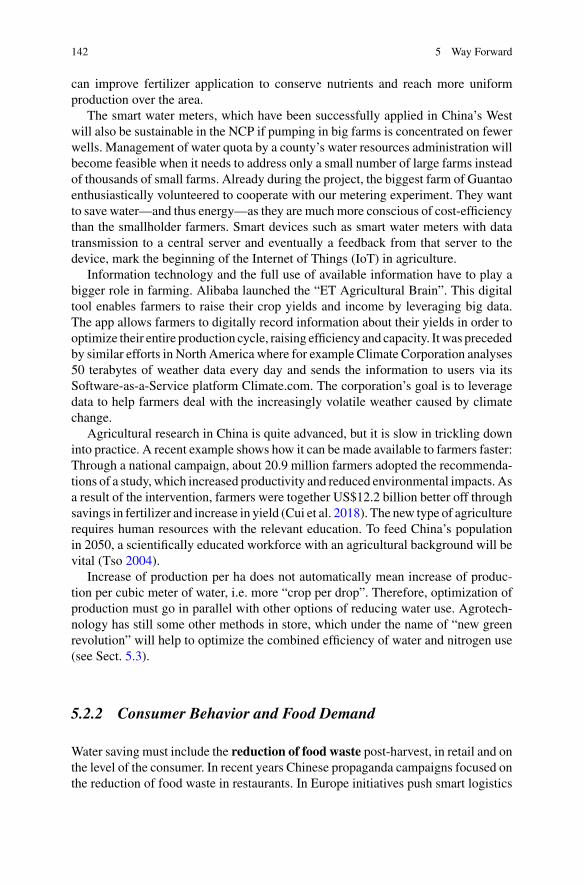
142 5 Way Forward
can improve fertilizer application to conserve nutrients and reach more uniformproduction over the area.
The smart water meters, which have been successfully applied in China’s Westwill also be sustainable in the NCP if pumping in big farms is concentrated on fewerwells. Management of water quota by a county’s water resources administration willbecome feasible when it needs to address only a small number of large farms insteadof thousands of small farms. Already during the project, the biggest farm of Guantaoenthusiastically volunteered to cooperate with our metering experiment. They wantto save water—and thus energy—as they are muchmore conscious of cost-efficiencythan the smallholder farmers. Smart devices such as smart water meters with datatransmission to a central server and eventually a feedback from that server to thedevice, mark the beginning of the Internet of Things (IoT) in agriculture.
Information technology and the full use of available information have to play abigger role in farming. Alibaba launched the “ET Agricultural Brain”. This digitaltool enables farmers to raise their crop yields and income by leveraging big data.The app allows farmers to digitally record information about their yields in order tooptimize their entire production cycle, raising efficiency and capacity. Itwas precededby similar efforts in North America where for example Climate Corporation analyses50 terabytes of weather data every day and sends the information to users via itsSoftware-as-a-Service platform Climate.com. The corporation’s goal is to leveragedata to help farmers deal with the increasingly volatile weather caused by climatechange.
Agricultural research in China is quite advanced, but it is slow in trickling downinto practice. A recent example shows how it can be made available to farmers faster:Through a national campaign, about 20.9 million farmers adopted the recommenda-tions of a study, which increased productivity and reduced environmental impacts. Asa result of the intervention, farmers were together US$12.2 billion better off throughsavings in fertilizer and increase in yield (Cui et al. 2018). The new type of agriculturerequires human resources with the relevant education. To feed China’s populationin 2050, a scientifically educated workforce with an agricultural background will bevital (Tso 2004).
Increase of production per ha does not automatically mean increase of produc-tion per cubic meter of water, i.e. more “crop per drop”. Therefore, optimization ofproduction must go in parallel with other options of reducing water use. Agrotech-nology has still some other methods in store, which under the name of “new greenrevolution” will help to optimize the combined efficiency of water and nitrogen use(see Sect. 5.3).
5.2.2 Consumer Behavior and Food Demand
Water saving must include the reduction of food waste post-harvest, in retail and onthe level of the consumer. In recent years Chinese propaganda campaigns focused onthe reduction of food waste in restaurants. In Europe initiatives push smart logistics
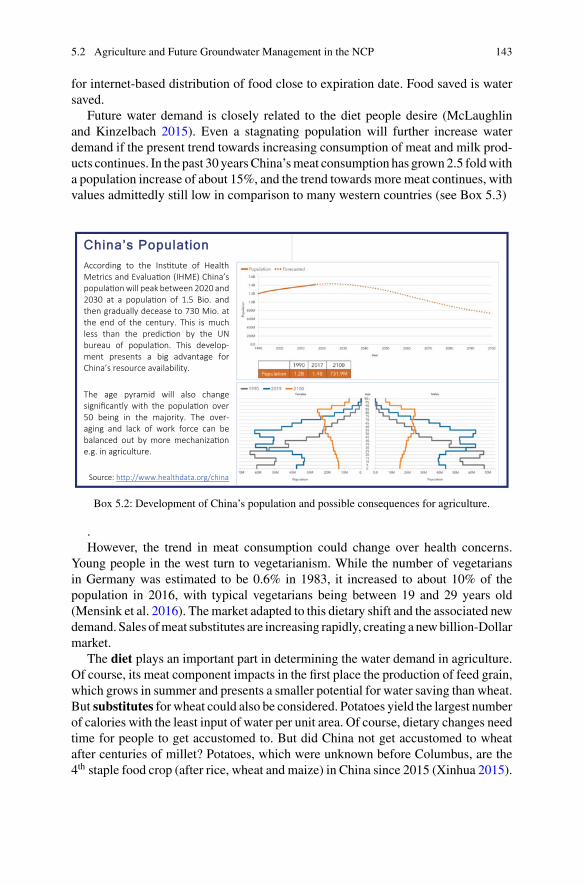
5.2 Agriculture and Future Groundwater Management in the NCP 143
for internet-based distribution of food close to expiration date. Food saved is watersaved.
Future water demand is closely related to the diet people desire (McLaughlinand Kinzelbach 2015). Even a stagnating population will further increase waterdemand if the present trend towards increasing consumption of meat and milk prod-ucts continues. In the past 30 yearsChina’smeat consumption has grown2.5 foldwitha population increase of about 15%, and the trend towards more meat continues, withvalues admittedly still low in comparison to many western countries (see Box 5.3)
CChina’s PopulationAccording to the Ins tute of Health Metrics and Evalua on (IHME) China’s popula on will peak between 2020 and 2030 at a popula on of 1.5 Bio. and then gradually decease to 730 Mio. at the end of the century. This is much less than the predic on by the UN bureau of popula on. This develop-ment presents a big advantage for China’s resource availability.
The age pyramid will also change significantly with the popula on over 50 being in the majority. The over-aging and lack of work force can be balanced out by more mechaniza on e.g. in agriculture.
Source: h p://www.healthdata.org/china
Box 5.2: Development of China’s population and possible consequences for agriculture.
.However, the trend in meat consumption could change over health concerns.
Young people in the west turn to vegetarianism. While the number of vegetariansin Germany was estimated to be 0.6% in 1983, it increased to about 10% of thepopulation in 2016, with typical vegetarians being between 19 and 29 years old(Mensink et al. 2016). Themarket adapted to this dietary shift and the associated newdemand. Sales ofmeat substitutes are increasing rapidly, creating a newbillion-Dollarmarket.
The diet plays an important part in determining the water demand in agriculture.Of course, its meat component impacts in the first place the production of feed grain,which grows in summer and presents a smaller potential for water saving than wheat.But substitutes for wheat could also be considered. Potatoes yield the largest numberof calories with the least input of water per unit area. Of course, dietary changes needtime for people to get accustomed to. But did China not get accustomed to wheatafter centuries of millet? Potatoes, which were unknown before Columbus, are the4th staple food crop (after rice, wheat and maize) in China since 2015 (Xinhua 2015).
144 5 Way Forward
Possibly China may also get used to Quinoa, which is advocated by the UN in itsefforts to enhance the globe’s food security while saving water (FAO 2011).
CChina’s DietIn 2026 an average Chineseci zen will consume about 53 kg of meat per year, 10% more than in 2017. Pork is the favorite Chinese meatmaking up about 60% of allmeat consump on. It is fol-lowed by poultry, beef andveal, and mu on and lamb. Due to the African Swine Fever epidemic, the con-sump on of pork declineda er 2018 and rebuildingthe swine herd will s ll takesome years. Data source: h ps://data.oecd.org/agroutput/meat-consump on.htm
China is s ll ea ng less meat than others, such as the USA with an average yearly meat consump on of 100 kg/capita or the OECD countries with an average of about 70 kg/capita. This indicates that there is room for expansion.
0
10
20
30
40
50
60
70
80
Pork Poultry Beef & veal Sheep OECD totalKg/capita
Forecast
Box 5.3: Development of China’s meat consumption
5.3 Drought Resistant and High Yield Wheat Varieties
Managing groundwater sustainably depends to a high degree on agricultural strate-gies adopted in theNCP. Pursuing high yield to feed peoplewas themajor agriculturaltarget pursued during the past 4 to 5 decades. The NCP played an important role inimproving grain production during this period, when numerous high yield varietieswere bred and widely cultivated. The yields of wheat and maize increased consid-erably from 1980 to 2010 (Fig. 5.1). They can reach 9 t/ha for wheat and 10.5 t/hafor maize today. This is much higher than the respective national average yields of6.2 t/ha and 5.4 t/ha (2019 data) and opens up a yield gap. While the development ofcrop varieties has helped to achieve the goal of self-sufficiency in agricultural goods,the yield gap still presents a reserve to be activated.
The achievements in grain production were accompanied by a tremendousincrease in fertilizer and irrigation water inputs, with the well-known consequencesfor groundwater depletion.While over the last 40 years yield increasewas the primaryobjective, now the reduction of agricultural intensity has become an essential optionto mitigate groundwater level decline.
Increasing attention has been given to the applications of biologic approaches,such as breeding of drought resistant varieties, or genetic modification and geneediting to largely improve photosynthetic efficiency. According to 30-year fieldexperiments at the Center for Agricultural Resources Research, Institute of Genetics
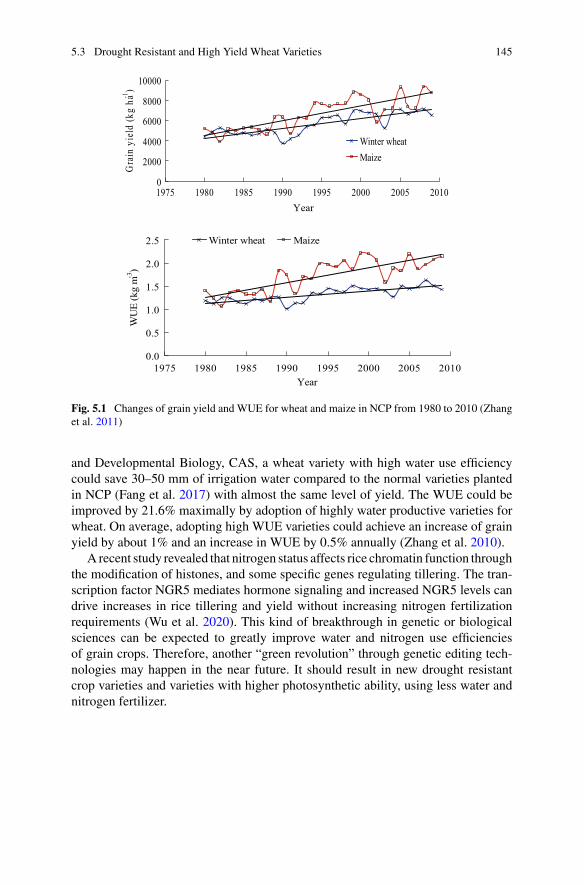
5.3 Drought Resistant and High Yield Wheat Varieties 145
0
2000
4000
6000
8000
10000
1975 1980 1985 1990 1995 2000 2005 2010
Year
Gra
in y
ield
(k
g h
a-1)
Winter wheat
Maize
0.0
0.5
1.0
1.5
2.0
2.5
1975 1980 1985 1990 1995 2000 2005 2010
Year
WU
E (
kg
m-3
)
Winter wheat Maize
Fig. 5.1 Changes of grain yield and WUE for wheat and maize in NCP from 1980 to 2010 (Zhanget al. 2011)
and Developmental Biology, CAS, a wheat variety with high water use efficiencycould save 30–50 mm of irrigation water compared to the normal varieties plantedin NCP (Fang et al. 2017) with almost the same level of yield. The WUE could beimproved by 21.6% maximally by adoption of highly water productive varieties forwheat. On average, adopting high WUE varieties could achieve an increase of grainyield by about 1% and an increase in WUE by 0.5% annually (Zhang et al. 2010).
A recent study revealed that nitrogen status affects rice chromatin function throughthe modification of histones, and some specific genes regulating tillering. The tran-scription factor NGR5 mediates hormone signaling and increased NGR5 levels candrive increases in rice tillering and yield without increasing nitrogen fertilizationrequirements (Wu et al. 2020). This kind of breakthrough in genetic or biologicalsciences can be expected to greatly improve water and nitrogen use efficienciesof grain crops. Therefore, another “green revolution” through genetic editing tech-nologies may happen in the near future. It should result in new drought resistantcrop varieties and varieties with higher photosynthetic ability, using less water andnitrogen fertilizer.
146 5 Way Forward
5.4 Importing Surface Water: Benefit and Risk
For regions lacking large rivers while suffering from severe water shortage, ground-water overdraft seems to be inevitable and importing surface water from outside ofthe region is the most direct and effective way to alleviate the decline of groundwaterlevels. Based on the experience from groundwater overdraft control in the NCP sofar, importing surface water should not only increase the availability of water butalso the efficiency of its use. Present use of surface water imports is extremely inef-ficient as the timing of water transfers depends on flows in the upstream, which arenot synchronous with the irrigation calendar. Storage capacity available in the plainarea is by far not sufficient to allow more efficient use of the imports. Improve-ment requires further updating of water infrastructure including the water system’sconnectivity and maintenance, e.g. by dredging river channels, renovating pools andponds, as well as using imported water for MAR.
Import of surface water has been planned, designed, and implemented rather wellcompared to other methods of groundwater over-pumping control so far. Althoughit seems irreplaceable in the struggle to end groundwater depletion in the NCP, it isstill facing considerable risks and uncertainties.
The surface water quota from the Yellow River will still be strictly limited in thenear future. Due to constraints on water quota, after three years of groundwater over-pumping governance, almost all cities and counties have used up their quota ofYellowRiverwater.However, some counties’ task of cutting downongroundwater extractionhas not been achieved. InHebei ProvinceYellowRiverwater hasmainly been used foragricultural irrigation. If no further imports are possible, groundwater over-pumpinggovernance can only rely on optimization of the cropping structure, which dependsheavily on government subsidies. With the decline of these, the further promotion ofover-pumping control action in these mainly rural areas remains challenging.
The high cost of water supply from the SNWT project brings risk and uncer-tainty to the groundwater over-pumping control system. One important reason is thatHebei provincial government can only spend a small portion of its whole budgetfor projects supporting the SNWT. 78% of the investment relies on bank loans.The construction of water treatment plants and connecting water supply pipelines ismainly supported by financing through non-governmental investors. These investorsexpect high returns on their investments. The above two factors result in high watersupply and transfer costs for the SNWT. The water price at the entrance of the maincanal of the SNWT Project into Hebei Province is 0.97 CNY/m3, the price of waterentering the surface water treatment plant is 2.76 CNY/m3, and the water price forthe consumers is 7.43 CNY/m3, which is 24% higher than in Beijing, and 34% higherthan in Tianjin. It amounts to 155% of the current average water price in urban areas,and to 210% of the current county average water price of Hebei Province.
Due to its high price, water of the SNWT Project is not affordable for agriculturaland ecological purposes. Even redundant SNWT water is too expensive to replacegroundwater in agricultural irrigation and preserve the groundwater system.
5.4 Importing Surface Water: Benefit and Risk 147
If the presentwater price of the SNWT’sCentral Route of 2.5CNY/m3 is assumed,the water needed for irrigation of winter wheat would cost about 6′000 CNY/ha. Thisamount is close to the present input cost for planting one ha of winter wheat andwould make wheat planting with SNWT water economically infeasible. Today, theirrigation cost of wheat with groundwater (includingmaintenance and labor) is about1000 CNY/ha or 1/6th of the total input cost. The cost of water of the Eastern Routewill be less than that of the Central Route, but it cannot be cheaper than groundwateras it has to be pumped up by about 100 m from the Yangtze River, about twice thelift presently necessary for deep aquifer groundwater in the NCP. If the managementof all irrigation water would be put into the responsibility of one big company, theycouldmake an average price,whichwould dilute the highmarginal cost of the transferwater to an acceptable prize for food production.
5.5 Climate Change in the NCP
Climate change influences the fate of groundwater resources in the NCP in manyways. Precipitation determines not only groundwater recharge. It also determines theneed of supplementary irrigation and therefore groundwater abstraction. Its distribu-tion in time, extreme rain events or drought events can be as important for agriculturalproduction as the annual total precipitation. Temperature, wind speed and radiationinfluence the potential evaporation, which finally determines the evapotranspirationpotential of the crops and thus the water requirements. Finally, climate change mayaffect the flow of rivers, which are now the source of water transfers to the NCP.
TheNCPhas seen climate change in the past.Observations since themid-twentiethcentury show that it has become warmer and drier. Most observed downward trendsin annual precipitation amount were statistically significant (Chen et al. 2010; Fuet al. 2009; Liu et al. 2005; Sun et al. 2017;Wang et al. 2012). Summer precipitation,which accounts for 50–75% of the total annual rainfall in NCP, also has decreasedsignificantly (Fan et al. 2012; Sun et al. 2020; Wang et al. 2012; Ye 2014), whileprecipitation in other seasons has shown contrasting trends (Fan et al. 2012; Sun et al.2020). The decrease in rainfall led to a decrease in groundwater recharge. Signif-icant increase was not only observed in the mean annual temperature but also intemperature during both wheat and maize seasons (Chen et al. 2010; Liu et al. 2014;Zhang et al. 2015). Surprisingly, a long-term decreasing trend has been observed inactual evapotranspiration, which can be explained by decreasing trends in precip-itation, sunshine duration and wind speed which overcompensated the increase inET due to temperature rise alone (Cao et al. 2014; Chen et al. 2010; Fan et al.2012; Liu et al. 2014; Song et al. 2010). A recent study based on remote sensingand physical modeling found that actual evapotranspiration increased slightly since2000, but concluded that the contribution of climate change was less than that ofhuman activities (Chen et al. 2017). The result agrees with the measurement dataof Luancheng Agro-Eco-Experimental Station of the Chinese Academy of Sciences
148 5 Way Forward
showing that the actual seasonal ET of winter wheat and summer maize under well-watered conditions gradually increased from the 1980s to the 2000s possibly causedby the increase in leaf stomatal conductance associated with the introduction ofnew cultivars (Zhang et al. 2011). With global warming, more crops can be grownin Northeast China, which has better rainfall, and the recent decades already haveshown some shift in production from the NCP towards the Northeast, reducing thepressure on the NCP.
The Fifth Assessment Report by the Intergovernmental Panel on Climate Change(Pachauri et al. 2014) provides the analysis ofmodel outputs from thefifth phase of theCoupled Model Intercomparison Project (CMIP5). CMIP5 produced a state-of-the-art multi-model dataset designed to advance our knowledge of climate variability andclimate change including “long term” simulations of twentieth-century climate andprojections for the twenty-first century and beyond for a number of RepresentativeConcentration Pathways (RCPs) for atmospheric greenhouse gas (GHG) concentra-tions (Van Vuuren et al. 2011). Annual averages of temperature and precipitationfor two RCPS and a time interval at the end of the century are shown in Fig. 5.2.Looking at Eastern China for the more pessimistic RCP8.5, one can find a strongincrease in yearly average temperature (5–7 °C) and an increase in annual rainfall(10–20%) compared to the baseline of 1986–2005. For a lower emission scenario,annual rainfall hardly changes, while average temperature increase is about 1 °C.
To adapt these global projections to regions, a process called downscaling isrequired to obtain a higher spatial resolution suited for the scale of the region. Theproblem with the projections is their uncertainty. While different models usuallyagree well as far as the projected temperature rise is concerned, predictions of rainfallare extremely uncertain reaching from increase to decrease of rainfall. This is alsotrue for the NCP, where the ensemble of climate models shows discrepancies amongGCMs and downscaling methods, concerning the projected mean and extremes ofprecipitation. Some studies show a likely increase in annual precipitation but atvarying rates (Fu et al. 2009; Tao and Zhang 2013), while others project a decline inannual precipitation (Liu et al. 2013). Being influenced by several climate variables,evapotranspiration estimates turn out to be very uncertain, making it difficult to drawconclusions about future trends. The projected changes of evapotranspiration duringthewheat or wheat–maize growth period in theNCP could either increase or decreasewithin a range of around± 10%depending on theGCMand greenhouse gas emissionscenario employed (Guo et al., 2010; Lv et al. 2013; Mo et al. 2013; Tao and Zhang2013).
We can distinguish direct and indirect impacts of climate change on groundwaterresources. Changes in the amount, intensity and frequency of precipitation directlydetermine groundwater recharge and indirectly influence the demand of groundwaterpumping for irrigation. The direct impacts of changes in precipitation on groundwaterrecharge havebeen found to contribute less to groundwater resources than the changesin pumping, not only in the NCP but also in other regions (Larocque et al. 2019; Liet al. 2014). However, it should be noted that studies on climate change assessmentsusually ignore the indirect impacts of precipitation on groundwater pumping, and
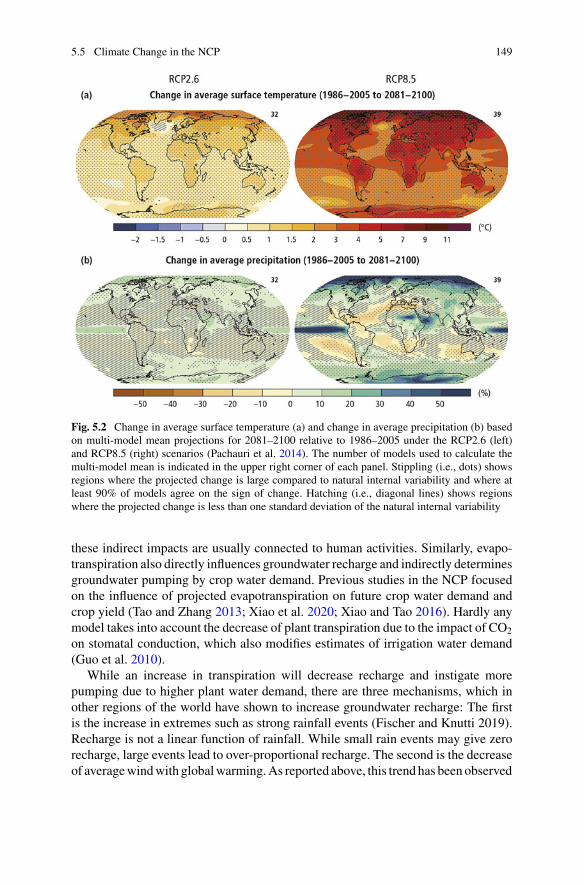
5.5 Climate Change in the NCP 149
Fig. 5.2 Change in average surface temperature (a) and change in average precipitation (b) basedon multi-model mean projections for 2081–2100 relative to 1986–2005 under the RCP2.6 (left)and RCP8.5 (right) scenarios (Pachauri et al. 2014). The number of models used to calculate themulti-model mean is indicated in the upper right corner of each panel. Stippling (i.e., dots) showsregions where the projected change is large compared to natural internal variability and where atleast 90% of models agree on the sign of change. Hatching (i.e., diagonal lines) shows regionswhere the projected change is less than one standard deviation of the natural internal variability
these indirect impacts are usually connected to human activities. Similarly, evapo-transpiration also directly influences groundwater recharge and indirectly determinesgroundwater pumping by crop water demand. Previous studies in the NCP focusedon the influence of projected evapotranspiration on future crop water demand andcrop yield (Tao and Zhang 2013; Xiao et al. 2020; Xiao and Tao 2016). Hardly anymodel takes into account the decrease of plant transpiration due to the impact of CO2
on stomatal conduction, which also modifies estimates of irrigation water demand(Guo et al. 2010).
While an increase in transpiration will decrease recharge and instigate morepumping due to higher plant water demand, there are three mechanisms, which inother regions of the world have shown to increase groundwater recharge: The firstis the increase in extremes such as strong rainfall events (Fischer and Knutti 2019).Recharge is not a linear function of rainfall. While small rain events may give zerorecharge, large events lead to over-proportional recharge. The second is the decreaseof averagewindwith globalwarming.As reported above, this trend has been observed
150 5 Way Forward
in China over the last decades. If it continues, it will reduce the expected increase inevapotranspiration due to temperature increase. The third mechanism is due to theincrease of winter precipitation also quoted from literature above. At warmer wintertemperatures, the soil freezing depth will be reduced and more recharge will occurin the cold season when evaporation is low, especially when there is thawing snow.
To get a coherent picture for the trends in evapotranspiration and the resultingcrop water demand, we did our own assessment. The results presented in Box 5.4show that overall, the crop water deficit will increase by mid-century and increaseeven further by late century. The compensation by decreasing wind speed as in thepast decades is not seen anymore. That means the second mechanism mentionedabove will most probably not be available.
Given all the interactions and assuming that total annual precipitation will notdecrease, recharge will most probably not change much compared to today. But, dueto more extremes both wet and dry, the use of the aquifer as a buffering device is ofgrowing importance in the future.
The water resources availability in the NCP is not only determined by the devel-opment in the NCP itself. As the North in recent years relies increasingly on waterimports from the South, the influence of climate change on the water availability inthe catchment of the Han River and the Yangtze River in general is also a relevantinfluence factor.
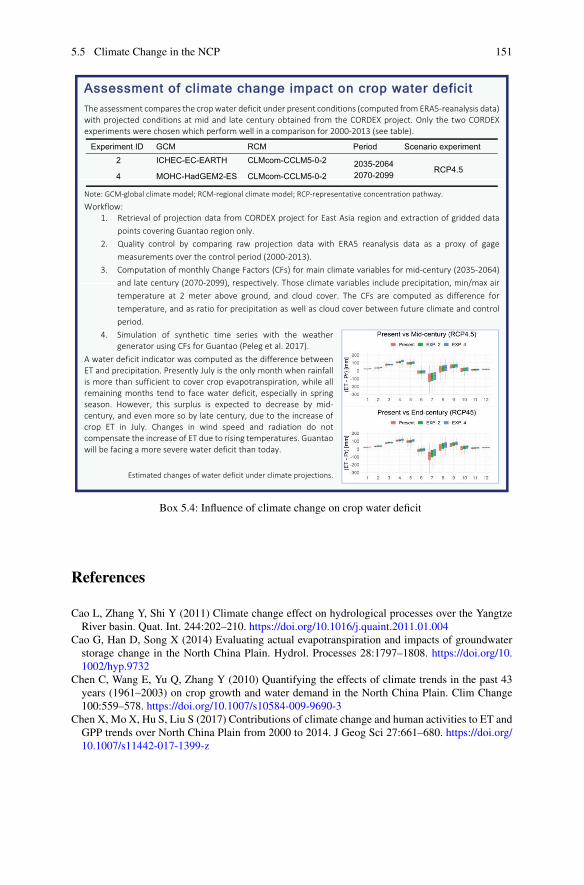
5.5 Climate Change in the NCP 151
Box 5.4: Influence of climate change on crop water deficit
References
Cao L, Zhang Y, Shi Y (2011) Climate change effect on hydrological processes over the YangtzeRiver basin. Quat. Int. 244:202–210. https://doi.org/10.1016/j.quaint.2011.01.004
Cao G, Han D, Song X (2014) Evaluating actual evapotranspiration and impacts of groundwaterstorage change in the North China Plain. Hydrol. Processes 28:1797–1808. https://doi.org/10.1002/hyp.9732
Chen C, Wang E, Yu Q, Zhang Y (2010) Quantifying the effects of climate trends in the past 43years (1961–2003) on crop growth and water demand in the North China Plain. Clim Change100:559–578. https://doi.org/10.1007/s10584-009-9690-3
Chen X, Mo X, Hu S, Liu S (2017) Contributions of climate change and human activities to ET andGPP trends over North China Plain from 2000 to 2014. J Geog Sci 27:661–680. https://doi.org/10.1007/s11442-017-1399-z
152 5 Way Forward
Chen Y, Guo F, Wang J et al (2020) Provincial and gridded population projection for China undershared socioeconomic pathways from 2010 to 2100. Sci Data 7:83. https://doi.org/10.1038/s41597-020-0421-y
Cui Z et al (2018) Pursuing sustainable productivity with millions of smallholder farmers. Nature555:363–366. https://doi.org/10.1038/nature25785
Fan L, Lu C, Yang B, Chen Z (2012) Long-term trends of precipitation in the North China Plain. JGeog Sci 22:989–1001. https://doi.org/10.1007/s11442-012-0978-2
Fang Q, Zhang XY, Chen SY, Shao LW, Sun HY (2017) Selecting traits to increase winter wheatyield under climate change in the North China Plain. Field Crops Research 207:30–41. https://doi.org/10.1016/j.fcr.2017.03.005
FAO (2011). Quinoa: An ancient crop to contribute to world food security. Technical Report of theFAO Regional Office for Latin America and the Caribbean, 55 p. http://www.fao.org/3/aq287e/aq287e.pdf
Fischer EM, Knutti R (2016) Observed heavy precipitation increase confirms theory and earlymodels. Nature Clim. Change 6:986–991. https://doi.org/10.1038/nclimate3110
Foster S, Garduño H (2004). China: Towards Sustainable Groundwater Resource Use for Irri-gated Agriculture on the North China Plain.World Bank. Sustainable GroundwaterManagement:Lessons from Practice. GW-MATE Case Profile Collection Number 8
Fu G, Charles SP, Yu J, Liu C (2009) Decadal climatic variability, trends, and future scenarios forthe North China Plain. J Clim 22:2111–2123. https://doi.org/10.1175/2008JCLI2605.1
Guo R, Lin Z, Mo X, Yang C (2010) Responses of crop yield and water use efficiency to climatechange in the North China Plain. Agric Water Manage 97:1185–1194. https://doi.org/10.1016/j.agwat.2009.07.006
Handan Municipal People’s Government (2020). Self-assessment report on groundwater overex-ploitation control in Handan prefecture (in Chinese).
Jianghe Conservancy and Hydropower Consulting Center (2018). Work experience summary ofgroundwater overexploitation control in Hebei Province (in Chinese)
Larocque M, Levison J, Martin A, Chaumont D (2019) A review of simulated climate changeimpacts on groundwater resources in Eastern Canada. Canadian Water Resources Journal/revueCanadienne Des Ressources Hydriques 44:22–41. https://doi.org/10.1080/07011784.2018.1503066
Li X, L, G, Zhang Y, (2014) Identifying major factors affecting groundwater change in the NorthChina Plain with grey relational analysis.Water 6:1581–1600. https://doi.org/10.3390/w6061581
Liu B, Xu M, Henderson M, Qi Y (2005). Observed trends of precipitation amount, frequency, andintensity in China, 1960–2000. Journal of Geophysical Research: Atmospheres 110https://doi.org/10.1029/2004JD004864
LiuW, FuG, Liu C, SongX, Ouyang R (2013) Projection of future rainfall for the North China Plainusing two statistical downscaling models and its hydrological implications. Stochastic Environ.Res. Risk Assess. 27:1783–1797. https://doi.org/10.1007/s00477-013-0714-1
Liu Y, Yang X, Wang E, Xue C (2014) Climate and crop yields impacted by ENSO episodes on theNorth China Plain: 1956–2006. Reg Environ Change 14:49–59. https://doi.org/10.1007/s10113-013-0455-1
Lv Z, Liu X, Cao W, Zhu Y (2013) Climate change impacts on regional winter wheat production inmain wheat production regions of China. Agric for Meteorol 171–172:234–248. https://doi.org/10.1016/j.agrformet.2012.12.008
McLaughlin D, KinzelbachW (2015) Food Security and Sustainable ResourceManagement. WaterResour Res 51(7):4966–4985. https://doi.org/10.1002/2015WR017053
Mensink GBM, Lage Barbosa C, Brettschneider AK (2016). Verbreitung der vegetarischenErnährungsweise in Deutschland. Journal of Health Monitoring 1(2). https://doi.org/10.17886/RKI-GBE-2016-033
Mo X, Guo R, Liu S, Lin Z, Hu S (2013) Impacts of climate change on crop evapotranspirationwith ensemble GCM projections in the North China Plain. Clim Change 120:299–312. https://doi.org/10.1007/s10584-013-0823-3
References 153
MWR/GIWP (2019) Comprehensive Control of Groundwater Overdraft in Hebei Province. Reportof GIWP (in Chinese)
MWR/IWHR (2014). The third-party evaluation report on the pilot project of comprehensivegroundwater overexploitation control in Hebei Province. Report of IWHR (in Chinese)
Pachauri RK, Allen MR, Barros VR, Broome J, Cramer W, Christ R, Church JA, Clarke L, DaheQ, Dasgupta P, et al. (2014). Climate Change 2014: Synthesis Report. Contribution of WorkingGroups I, II and III to the Fifth Assessment Report of the Intergovernmental Panel on ClimateChange.
Peleg N, Fatichi S, Paschalis A, Molnar P, Burlando P (2017) An advanced stochastic weathergenerator for simulating 2-D high-resolution climate variables: AWE-GEN-2d. J Adv ModelEarth Syst 9:1595–1627. https://doi.org/10.1002/2016MS000854
Song Z, Zhang H, Snyder RL, Anderson F, Chen F (2010) Distribution and trends in referenceevapotranspiration in the North China Plain. J Irrig Drain Eng 136:240–247. https://doi.org/10.1061/(ASCE)IR.1943-4774.0000175
Sun J, Lei X, Tian Y, Liao W, Wang Y (2013) Hydrological impacts of climate change in the upperreaches of the Yangtze River Basin. Quat Int 304:62–74. https://doi.org/10.1016/j.quaint.2013.02.038
Sun J, Wang X, Shahid S (2020) Precipitation and runoff variation characteristics in typical regionsof North China Plain: a case study of Hengshui City. Theor Appl Climatol 142:971–985. https://doi.org/10.1007/s00704-020-03344-8
Sun Q, Miao C, Duan Q (2017) Changes in the spatial heterogeneity and annual distribution ofobserved precipitation across China. J Clim 30:9399–9416. https://doi.org/10.1175/JCLI-D-17-0045.1
Tao F, Zhang Z (2013) Climate change, wheat productivity and water use in the North China Plain:a new super-ensemble-based probabilistic projection. Agric for Meteorol 170:146–165. https://doi.org/10.1016/j.agrformet.2011.10.003
Tso TC (2004) Agriculture of the future. Nature 428:215–217. https://doi.org/10.1038/428215aVanVuuren DP, Edmonds J, KainumaM, Riahi K, Thomson A, Hibbard K, Hurtt GC, Kram T, KreyV, Lamarque JF (2011) The representative concentration pathways: an overview. Clim Change109:5–31. https://doi.org/10.1007/s10584-011-0148-z
Wang HJ, Sun JQ, Chen HP, Zhu YL, Zhang Y, Jiang DB, Lang XM, Fan K, Yu ET, Yang S (2012)Extreme climate in China: Facts, simulation and projection. Meteorol Z 21:279–304. https://doi.org/10.1127/0941-2948/2012/0330
Wang Y, Liao W, Ding Y, Wang X, Jiang Y, Song X, Lei X (2015) Water resource spatiotemporalpattern evaluation of the upstream Yangtze River corresponding to climate changes. Quat. Int.380–381:187–196. https://doi.org/10.1016/j.quaint.2015.02.023
Wu K, Wang S, Song W, Zhang J, Wang Y, Liu Q, Yu J, Ye Y, Li S, Chen J, Zhao Y, Wang J, Wu X,WangM, ZhangY, Liu B,WuY,Harberd NP, FuX (2020). Enhanced sustainable green revolutionyield via nitrogen-responsive chromatin modulation in rice. Science 367(6478):eaaz2046. https://doi.org/10.1126/science.aaz2046
Xiao D, Tao F (2016) Contributions of cultivar shift, management practice and climate change tomaize yield in North China Plain in 1981–2009. Int J Biometeorol 60:1111–1122. https://doi.org/10.1007/s00484-015-1104-9
Xiao D, Liu D, Wang B, Feng P, Bai H, Tang J (2020). Climate change impact on yields and wateruse of wheat and maize in the North China Plain under future climate change scenarios. Agric.Water Manage. 238:106238https://doi.org/10.1016/j.agwat.2020.106238
Xinhua (2015). Potato upgraded as new staple crop. China Daily 2015-01-08. https://www.chinadaily.com.cn/china/2015-01/08/content_19269910.htm
Xu Y, Xu C, Gao X, Luo Y (2009) Projected changes in temperature and precipitation extremesover the Yangtze River Basin of China in the 21st century. Quat Int 208:44–52. https://doi.org/10.1016/j.quaint.2008.12.020
Yang W, Di L, Sun Z (2021) Groundwater variations in the North China Plain: monitoring andmodeling under climate change and human activities toward better groundwater sustainability.
154 5 Way Forward
Chapter 5 in:Mukherjee A, Scanlon BR, Aureli A, Langan S, GuoH,McKenzie AA (eds), GlobalGroundwater. Elsevier, pp 65–71
Ye JS (2014)Trend andvariability ofChina’s summer precipitation during 1955–2008. Int JClimatol34:559–566. https://doi.org/10.1002/joc.3705
Zhang XY, Chen SY, Sun HY,WangYM, Shao LW (2010)Water use efficiency and associated traitsin winter wheat cultivars in the North China Plain. Agric Water Manag 97:1117–1125. https://doi.org/10.1016/j.agwat.2009.06.003
ZhangX,ChenS, SunH,ShaoL,WangY (2011)Changes in evapotranspiration over irrigatedwinterwheat and maize in North China Plain over three decades. Agric Water Manage 98:1097–1104.https://doi.org/10.1016/j.agwat.2011.02.003
Zhang HL, Zhao X, Yin XG, Liu SL, Xue JF, Wang M, Pu C, Lal R, Chen F (2015) Challenges andadaptations of farming to climate change in the North China Plain. Clim Change 129:213–224.https://doi.org/10.1007/s10584-015-1337-y
ZouY,YangX, PanZ, SunX, Fang J, LiaoY (2008) Effect of CO2 doubling on extreme precipitationin Eastern China. Adv Clim Change Res (Chinese Edition) 4(2):84–91
Open Access This chapter is licensed under the terms of the Creative Commons Attribution 4.0International License (http://creativecommons.org/licenses/by/4.0/), which permits use, sharing,adaptation, distribution and reproduction in any medium or format, as long as you give appropriatecredit to the original author(s) and the source, provide a link to the Creative Commons license andindicate if changes were made.
The images or other third party material in this chapter are included in the chapter’s CreativeCommons license, unless indicated otherwise in a credit line to the material. If material is notincluded in the chapter’s Creative Commons license and your intended use is not permitted bystatutory regulation or exceeds the permitted use, you will need to obtain permission directly fromthe copyright holder.
Final Remarks
The solution of the NCP’s water problems is determined by the balance of threebig forces: the national requirement of grain security, the water resources system,and the agricultural system. Water authorities are in favor of water transfers whileagricultural authorities are in favor of subsidized adaptation of the cropping system.However, there is no silver bullet. The solution of the NCP’s water problems until2050 and beyond consists of a mosaic of measures, which needs all available piecesto complete the puzzle. Some pieces are not easily recognized as contributors. Chinarightfully relaxed its requirements of grain self-sufficiency in recent years. Importedgrain is imported virtual water. Grain imports of 99Mio. tons in 2020were at a recordhigh compared to the local production of 670Mio. tons. They make a non-negligiblecontribution to the alleviation of water scarcity as do the imports of meat of all kinds.Other pieces of the puzzle are for example irrigation with wastewater—after propertreatment—and seawater desalinization.
Actors should be encouraged to contribute their inventive share, hopefullyavoiding the pitfalls existing in every method. They can all be guided by the value ofirrigation water expressed in terms of a stiff water price. The government need notmake people pay that price in every case. A tax and fee system makes only sense if itleads to a reduction of pumping, if not directly via farmers’ profit optimization thenby turning the revenue into subsidies to incentivize proven water saving methods inagriculture.
When discussing climate change, we looked at scenarios for 2035–2064 and for2070–2099 (Sect. 5.5). If we look that far ahead, we also must look at other societaldevelopments. Towards the end of the century, China’s population will be half of thatof today (see Box 5.2). Then water resources will easily get into equilibrium withdemand, and management can concentrate on issues of water quality, for examplesalinity and pollution, which are probably the more serious long-term problems.For the coming 30 years, however, China still has to sustain or even increase thefood production of today to satisfy the demands of her people. That implies thatgroundwater management in the NCP as outlined in this book will still be needed
© The Editor(s) (if applicable) and The Author(s) 2022W. Kinzelbach et al., Groundwater Overexploitation in the North China Plain:A path to Sustainability, Springer Water,https://doi.org/10.1007/978-981-16-5843-3
155

156 Final Remarks
for a while to see China over the population peak before stress on water resourcesceases towards the end of the century.
To conclude, we see the continued need of managing groundwater sustain-ably, avoiding not only over-pumping but increasingly deterioration of groundwaterquality. If suitably managed, groundwater resources are cheap, readily accessible,and more importantly, provide a safeguard to buffer extremes under climate change.
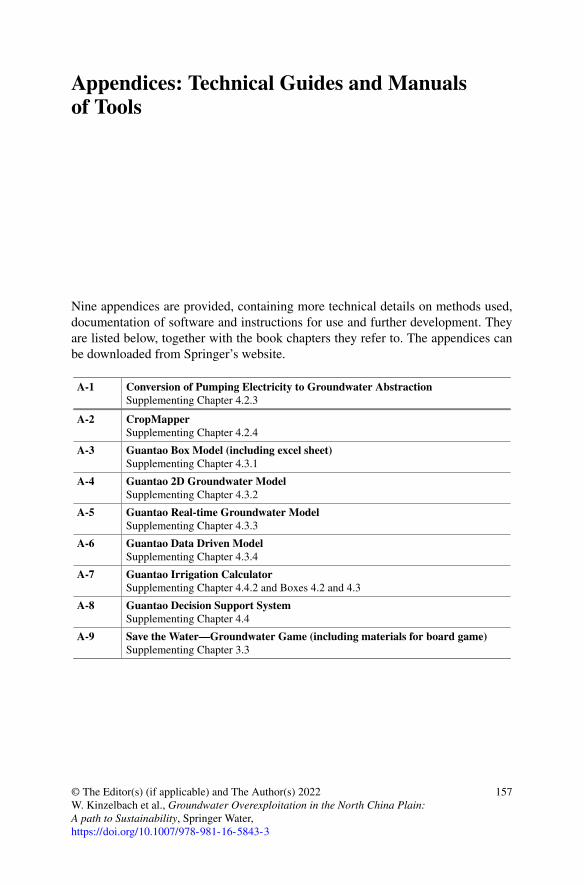
Appendices: Technical Guides and Manualsof Tools
Nine appendices are provided, containing more technical details on methods used,documentation of software and instructions for use and further development. Theyare listed below, together with the book chapters they refer to. The appendices canbe downloaded from Springer’s website.
A-1 Conversion of Pumping Electricity to Groundwater AbstractionSupplementing Chapter 4.2.3
A-2 CropMapperSupplementing Chapter 4.2.4
A-3 Guantao Box Model (including excel sheet)Supplementing Chapter 4.3.1
A-4 Guantao 2D Groundwater ModelSupplementing Chapter 4.3.2
A-5 Guantao Real-time Groundwater ModelSupplementing Chapter 4.3.3
A-6 Guantao Data Driven ModelSupplementing Chapter 4.3.4
A-7 Guantao Irrigation CalculatorSupplementing Chapter 4.4.2 and Boxes 4.2 and 4.3
A-8 Guantao Decision Support SystemSupplementing Chapter 4.4
A-9 Save the Water—Groundwater Game (including materials for board game)Supplementing Chapter 3.3
© The Editor(s) (if applicable) and The Author(s) 2022W. Kinzelbach et al., Groundwater Overexploitation in the North China Plain:A path to Sustainability, Springer Water,https://doi.org/10.1007/978-981-16-5843-3
157