Evaluation of groundwater resources in the Southern Tihama plain, Saudi Arabia
12
ORIGINAL PAPER Evaluation of groundwater resources in the Southern Tihama plain, Saudi Arabia Fathy Abdalla & Ali Al-Turki & Abdullah Al Amri Received: 31 October 2013 /Accepted: 31 March 2014 # Saudi Society for Geosciences 2014 Abstract In the absence of permanent rivers, groundwater is one of the major water resources in Southern Tihama plain, in the Southwestern Saudi Arabia. Hydrogeological investiga- tion, as well as hydrogeochemical analyses, of 272 ground- water samples was performed to evaluate groundwater re- sources of shallow alluvial aquifer and their quality for differ- ent purposes in the Southern Tihama plain. Hydrogeological investigation revealed that groundwater occurs mainly in al- luvium deposits under free water table conditions that range between 9 and 33 m. The calculated hydraulic gradient is inclined towards the west and southwest direction, ranging from 0.001 to 0.005, and soil infiltration rate of coastal plain soils is higher than other soil types. Hydrochemical analysis results indicate that groundwater type is mainly sodium chlo- ride reflecting high amount of minerals. Groundwater in Tihama plain is not suitable for direct drinking and domestic purposes; therefore, it needs a proper treatment to remove high salinity and chloride concentrations. Result also shows that most of the groundwater has high salinity and low sodium hazard, suggesting little danger of exchangeable sodium. Other quality indices such as salinity, chloride, sulfate, and alkalinity range from suitable to high restricting water suit- ability for some industrial purposes without special treatment or mixing with low saline water. Keywords Tihama plain . Groundwater . Hydrochemical analysis . Hydraulic gradient . Infiltration rate . Drinking . Saudi Arabia Introduction The Kingdom of Saudi Arabia is classified as a water scarce country, where about 90 % of the total amount of water is lost by evaporation annually. The primary sources of water in Saudi Arabia are groundwater of continental basins that re- ceive water from annual rainfall. The relative uses of ground- water vary significantly between different countries (Perttu 2008; Khaled and Abdalla 2013). Groundwater provides about 50 % of the potable water supplies, 30 % of the indus- trial water, and 20 % of the irrigation water worldwide. In Saudi Arabia, groundwater contributes to nearly 79 % of the total water supply. It is considered as the main source of irrigation water where about 90 % is consumed in agricultural activity (Al-Turki et al. 2011). In the study area, groundwater is the most important resource used for drinking by many people especially in rural areas. Assessments of groundwater resources are of utmost importance in the arid region, such as Saudi Arabia, where groundwater has critical economical and social significance. The southwestern region of Saudi Arabia is characterized by suitable soils for agricultural investments and sustainable development. In the last few decades, rapid economic growth, intensive agricultural activities, and urban development in the Southern Tihama plain have resulted in decline of groundwater levels, a reduction of well productiv- ity, and quality deterioration. F. Abdalla (*) Geology Department, Faculty of Science, South Valley University, Qena, Egypt e-mail: [email protected] A. Al-Turki Soil Science Department, Faculty of Food and Agricultural Sciences, King Saud University, Riyadh, Saudi Arabia A. Al Amri Geology Department, Faculty of Science, King Saud University, Riyadh, Saudi Arabia Present Address: F. Abdalla Academic Publishing and Press, King Saud University, Riyadh, Saudi Arabia Arab J Geosci DOI 10.1007/s12517-014-1401-3
Transcript of Evaluation of groundwater resources in the Southern Tihama plain, Saudi Arabia

ORIGINAL PAPER
Evaluation of groundwater resources in the Southern Tihamaplain, Saudi Arabia
Fathy Abdalla & Ali Al-Turki & Abdullah Al Amri
Received: 31 October 2013 /Accepted: 31 March 2014# Saudi Society for Geosciences 2014
Abstract In the absence of permanent rivers, groundwater isone of the major water resources in Southern Tihama plain, inthe Southwestern Saudi Arabia. Hydrogeological investiga-tion, as well as hydrogeochemical analyses, of 272 ground-water samples was performed to evaluate groundwater re-sources of shallow alluvial aquifer and their quality for differ-ent purposes in the Southern Tihama plain. Hydrogeologicalinvestigation revealed that groundwater occurs mainly in al-luvium deposits under free water table conditions that rangebetween 9 and 33 m. The calculated hydraulic gradient isinclined towards the west and southwest direction, rangingfrom 0.001 to 0.005, and soil infiltration rate of coastal plainsoils is higher than other soil types. Hydrochemical analysisresults indicate that groundwater type is mainly sodium chlo-ride reflecting high amount of minerals. Groundwater inTihama plain is not suitable for direct drinking and domesticpurposes; therefore, it needs a proper treatment to remove highsalinity and chloride concentrations. Result also shows thatmost of the groundwater has high salinity and low sodiumhazard, suggesting little danger of exchangeable sodium.Other quality indices such as salinity, chloride, sulfate, and
alkalinity range from suitable to high restricting water suit-ability for some industrial purposes without special treatmentor mixing with low saline water.
Keywords Tihama plain . Groundwater . Hydrochemicalanalysis . Hydraulic gradient . Infiltration rate . Drinking .
Saudi Arabia
Introduction
The Kingdom of Saudi Arabia is classified as a water scarcecountry, where about 90 % of the total amount of water is lostby evaporation annually. The primary sources of water inSaudi Arabia are groundwater of continental basins that re-ceive water from annual rainfall. The relative uses of ground-water vary significantly between different countries (Perttu2008; Khaled and Abdalla 2013). Groundwater providesabout 50 % of the potable water supplies, 30 % of the indus-trial water, and 20 % of the irrigation water worldwide. InSaudi Arabia, groundwater contributes to nearly 79 % of thetotal water supply. It is considered as the main source ofirrigation water where about 90 % is consumed in agriculturalactivity (Al-Turki et al. 2011). In the study area, groundwateris the most important resource used for drinking by manypeople especially in rural areas. Assessments of groundwaterresources are of utmost importance in the arid region, such asSaudi Arabia, where groundwater has critical economical andsocial significance. The southwestern region of Saudi Arabiais characterized by suitable soils for agricultural investmentsand sustainable development. In the last few decades, rapideconomic growth, intensive agricultural activities, and urbandevelopment in the Southern Tihama plain have resulted indecline of groundwater levels, a reduction of well productiv-ity, and quality deterioration.
F. Abdalla (*)Geology Department, Faculty of Science, South Valley University,Qena, Egypte-mail: [email protected]
A. Al-TurkiSoil Science Department, Faculty of Food and Agricultural Sciences,King Saud University, Riyadh, Saudi Arabia
A. Al AmriGeology Department, Faculty of Science, King Saud University,Riyadh, Saudi Arabia
Present Address:F. AbdallaAcademic Publishing and Press, King Saud University, Riyadh,Saudi Arabia
Arab J GeosciDOI 10.1007/s12517-014-1401-3
The hydrogeology study aims to define aquifer formation,soil infiltration characteristics, and groundwater flow direc-tions in the shallow alluvial aquifer. The hydrochemical in-vestigation aims to evaluate groundwater usability for domes-tic, irrigation, and industrial purposes.
Study area
The study area is located in southwestern part of the Kingdomof Saudi Arabia, in an arid zone characterized by humid andhot weather conditions, known as Tihama coastal plain. Itextends 30 km between latitude 16° 24′ 26″ and 17° 48′29.9″ N and 170 km between longitude 42° 15′ and 43° 00′E (Fig. 1). The average temperature of the region ranges from21 °C in winter to 40 °C in summer, and humidity rangesbetween 89.1 % in winter and 69.4 % in summer. The Tihamacoastal plain is separated from Hijaz-Asir highlands by animposing scarp wall that runs parallel to the Red Sea along700 km. The Hijaz-Asir highlands rise up abruptly 1.500–3.000 m to the east of the Tihama coastal plain and dip gentlytowards Najd in the east.
Geological and hydrogeological setting
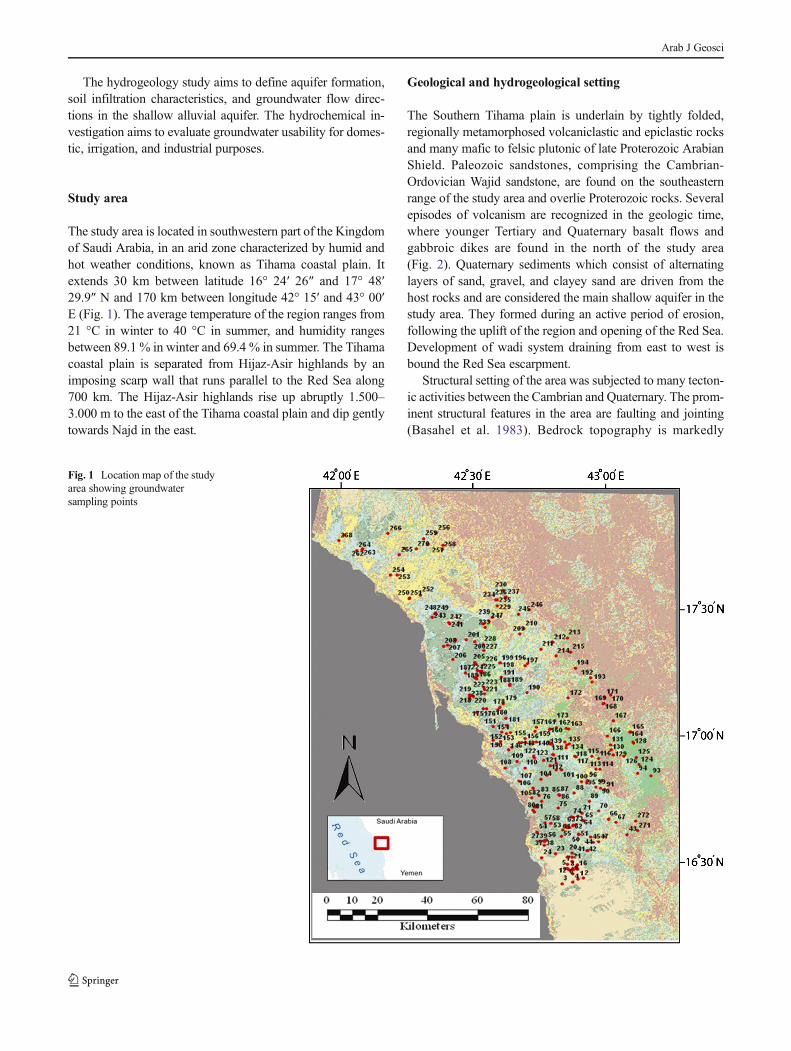
The Southern Tihama plain is underlain by tightly folded,regionally metamorphosed volcaniclastic and epiclastic rocksand many mafic to felsic plutonic of late Proterozoic ArabianShield. Paleozoic sandstones, comprising the Cambrian-Ordovician Wajid sandstone, are found on the southeasternrange of the study area and overlie Proterozoic rocks. Severalepisodes of volcanism are recognized in the geologic time,where younger Tertiary and Quaternary basalt flows andgabbroic dikes are found in the north of the study area(Fig. 2). Quaternary sediments which consist of alternatinglayers of sand, gravel, and clayey sand are driven from thehost rocks and are considered the main shallow aquifer in thestudy area. They formed during an active period of erosion,following the uplift of the region and opening of the Red Sea.Development of wadi system draining from east to west isbound the Red Sea escarpment.
Structural setting of the area was subjected to many tecton-ic activities between the Cambrian and Quaternary. The prom-inent structural features in the area are faulting and jointing(Basahel et al. 1983). Bedrock topography is markedly
Fig. 1 Location map of the studyarea showing groundwatersampling points
Arab J Geosci
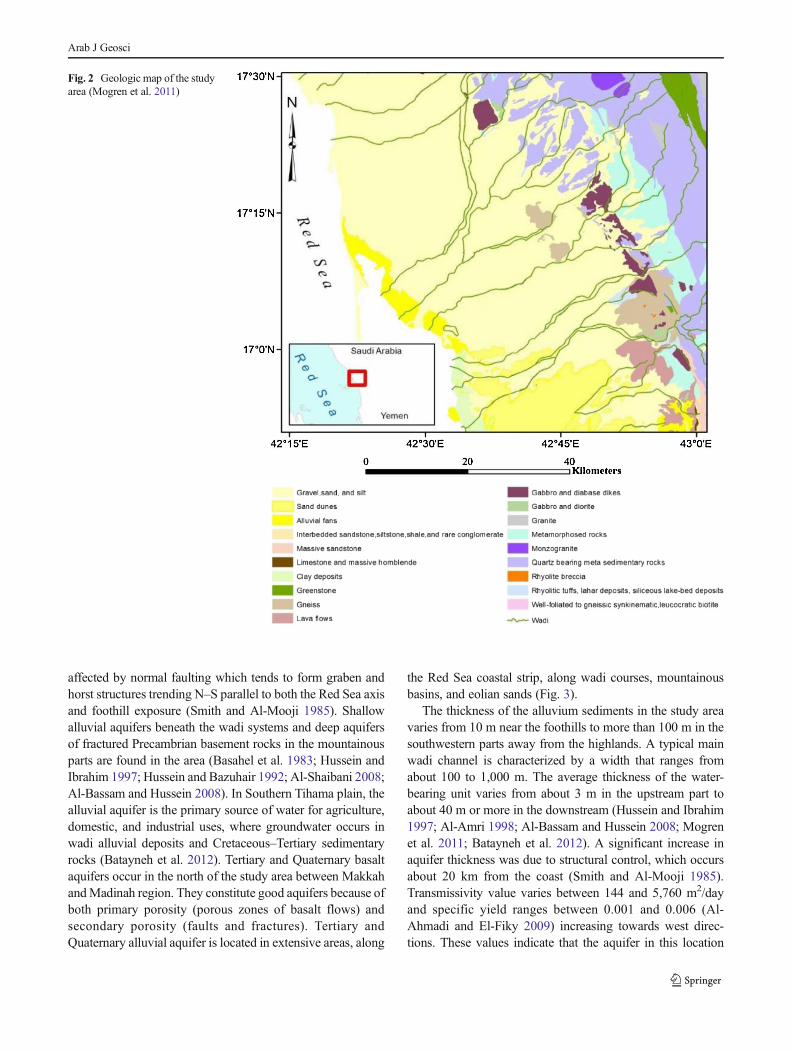
affected by normal faulting which tends to form graben andhorst structures trending N–S parallel to both the Red Sea axisand foothill exposure (Smith and Al-Mooji 1985). Shallowalluvial aquifers beneath the wadi systems and deep aquifersof fractured Precambrian basement rocks in the mountainousparts are found in the area (Basahel et al. 1983; Hussein andIbrahim 1997; Hussein and Bazuhair 1992; Al-Shaibani 2008;Al-Bassam and Hussein 2008). In Southern Tihama plain, thealluvial aquifer is the primary source of water for agriculture,domestic, and industrial uses, where groundwater occurs inwadi alluvial deposits and Cretaceous–Tertiary sedimentaryrocks (Batayneh et al. 2012). Tertiary and Quaternary basaltaquifers occur in the north of the study area between MakkahandMadinah region. They constitute good aquifers because ofboth primary porosity (porous zones of basalt flows) andsecondary porosity (faults and fractures). Tertiary andQuaternary alluvial aquifer is located in extensive areas, along
the Red Sea coastal strip, along wadi courses, mountainousbasins, and eolian sands (Fig. 3).
The thickness of the alluvium sediments in the study areavaries from 10 m near the foothills to more than 100 m in thesouthwestern parts away from the highlands. A typical mainwadi channel is characterized by a width that ranges fromabout 100 to 1,000 m. The average thickness of the water-bearing unit varies from about 3 m in the upstream part toabout 40 m or more in the downstream (Hussein and Ibrahim1997; Al-Amri 1998; Al-Bassam and Hussein 2008; Mogrenet al. 2011; Batayneh et al. 2012). A significant increase inaquifer thickness was due to structural control, which occursabout 20 km from the coast (Smith and Al-Mooji 1985).Transmissivity value varies between 144 and 5,760 m2/dayand specific yield ranges between 0.001 and 0.006 (Al-Ahmadi and El-Fiky 2009) increasing towards west direc-tions. These values indicate that the aquifer in this location
Fig. 2 Geologic map of the studyarea (Mogren et al. 2011)
Arab J Geosci
is very good in both productivity and accessibility of water tothe well.
The main recharge of the alluvial aquifer is local rainfallinfiltration where the southwestern region is rich in rainfallcompared to other regions of the Kingdom of Saudi Arabia.Groundwater recharge exclusively occurs during floods in thewinter season. An effective use of recharging facilities such asrecharge dams and trenches to promote water infiltration intothe aquifer is necessary to improve recharge efficiency and tosave water from discharging into the Red Sea. The soil infil-tration rates obtained from the field infiltration tests revealedthat their values in coastal plain soils are higher than these inpediplain and lava field volcanic hill soils. This is because ofthe coastal plain soils that are mostly sandy textures while thepediplain and lava field volcanic hill soils are mostly finetextures with a high proportion of pebbles and stones thatimpede the movement of water in the soil. Discharge fromthe aquifer takes place through artificially withdrawn uncon-trolled pumping for different purposes. The natural dischargeof groundwater is by evapotranspirational losses in placeswhere the water table is close to the ground surface and baseflow.
Methodology
Detailed hydrogeological investigation was conducted to in-vestigate the hydrogeological conditions in the study areaincluding water level measurements. The fieldwork was car-ried out in the framework of the land resource assessment and
water quality evaluation in Southern Tihama plain. The workincluded a collection of 272 groundwater samples from wellstapping the alluvial aquifer. Ten water infiltration tests underfield conditions using disk infiltrometer were carried out indifferent soil types to determine the infiltration rate throughthe soil layer into the aquifer. Computer program “Rosetta”v1.2 (Schaap 2000) was used to calculate the best fit of theinfiltration curve. This was done by automatically fittingexperimental infiltration test data to the van Genuchten equa-tion (van Genuchten 1980) in a least square method with thehelp of mechanical analysis data (ratio of sand, silt, and clay)in the soil sample.
Protocol for sample collection and preservation is essen-tially as given by the standard methods of APHA (2005).Most of these wells are used for drinking, domestic, as wellas agricultural purposes. Geographical coordinates and eleva-tion of each sampling location were recorded using GPS(Fig. 1). Laboratory work included chemical analysis of thecollected groundwater samples for pH, electrical conductivity(EC), major cations (Ca2+, Mg2+, Na+, K+), and major anions(HCO3
−, SO42−, Cl−, CO3
2−, NO3−). It was followed by data
analyses using, e.g., Surfer 8 (Golden Software, Inc., 2002),ERDAS Imaging 8.7, and ArcView 9.2. The following pa-rameters were calculated to evaluate the suitability of thegroundwater quality for domestic purposes (Table 1):
Total dissolved solids (TDS) for the analyzed samples werecalculated in milligrams per liter according to this equation:
TDS ¼ SUM Ca2þ þMg2þ þ Naþ þ Kþ þ Cl− þ SO42−4þ HCO3
−3þ CO32−3
� �
ð1Þ
Fig. 3 Main aquifers croppingout in the study area modifiedafter Japan InternationalCooperation Agency (2010)
Arab J Geosci

Total hardness (TH) was calculated as CaCO3 in milli-grams per liter by the following equation (Todd 1980):
TH ¼ 2:497Ca2þ þ 4:115Mg2þ ð2Þ
Soil cumulative infiltration rate I (cm) was calculated ac-cording to Zhang (1997) as follows:
I ¼ C1T1þ C2
ffiffiffiffiT
p2 ð3Þ
WhereC1 is an empirical constant factor related to soil hydraulic
conductivity, in centimeters per secondC2 is an imperial constant factor related to soil sorptivity, in
centimeters per second0.5.T is time in secondsSodium adsorption ratio (SAR) in milliequivalents per liter
was calculated according to the US Salinity Laboratory Staff(USSL 1954) as follows:
SAR ¼ Naffiffiffiffiffiffiffiffiffiffiffiffiffiffiffiffiffiffiffiffiffiffiffiffiffiffi1
2CaþMgð Þ
r ð4Þ
Results
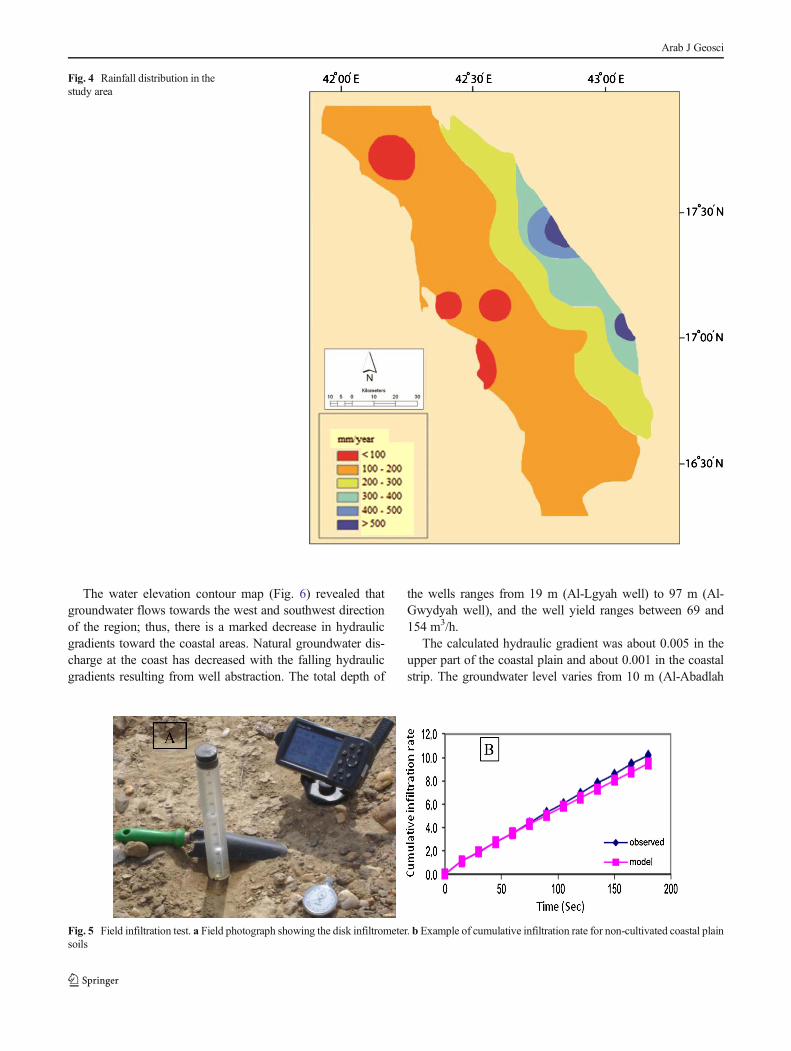
Based on the collected climatological data from Sabya,Malaki, and Jyzan meteorological stations, records cover aperiod of 25 years (1980–2004); the mean annual rainfalldistribution in the study area is presented in Fig. 4. Rainfallgenerally occurs fromMay to September. The spatial variationof precipitation strongly reflects the effect of topography,where the annual rainfall generally increases in the eastern
parts, which receives a considerably higher amount of rainfall(>500 mm/year) as compared to the western part of the studyarea (<200 mm/year) near the Red Sea coast.
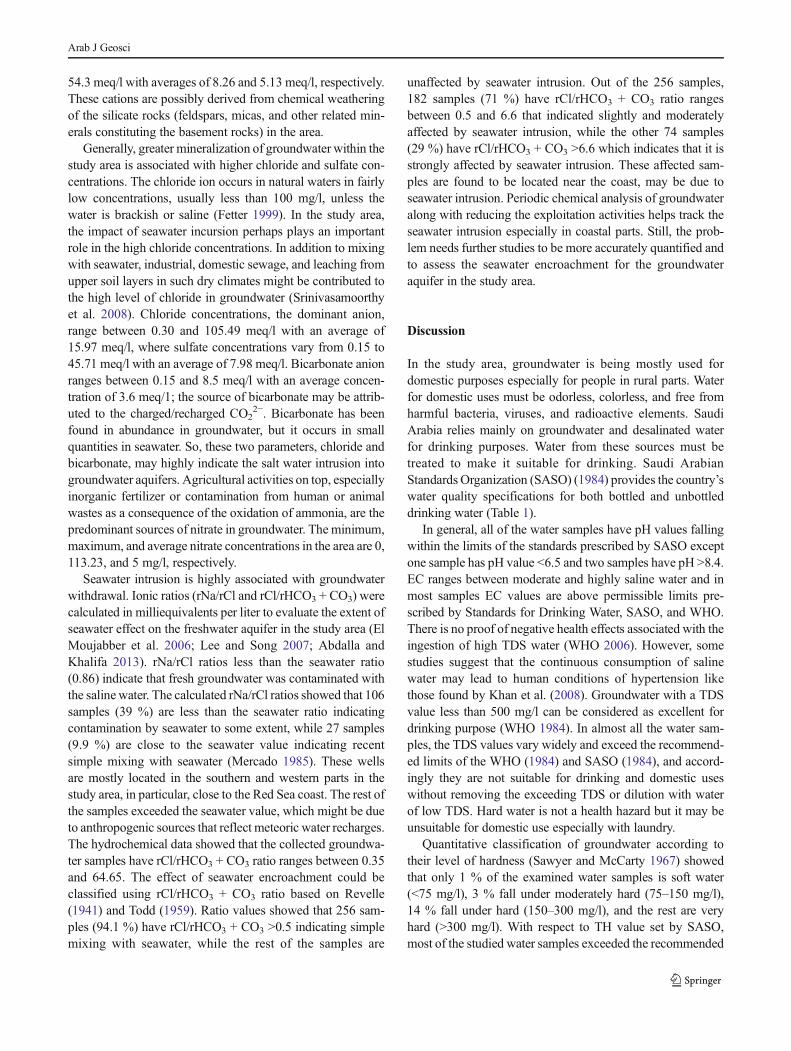
Field infiltration tests (Fig. 5a) were used to determine thequantity of precipitation that will enter the soil for rechargingthe shallow groundwater aquifer. The cumulative infiltrationrate versus time (Fig. 5b) is calculated according to Zhang(1997) under field condition. The minimum cumulative infil-tration rate value of I30 was with cultivated pediplain ofshallow soils (10.30 cm) and the maximum value with non-cultivated coastal plain soils (157.33 cm) with an average of49.4 cm. Soil permeability coefficient K ranges between0.61 cm/h (cultivated pediplain with shallow soils) and20.35 cm/h (non-cultivated coastal plain soils) with an aver-age of 6.29 cm/h, while soil sorpitivity coefficient S rangesbetween 0.0205 m/s0.5 (cultivated pediplain with shallowsoils) and 0.36 m/s0.5 (cultivated lava field volcanic hill soils)with an average of 0.972 m/s0.5. The minimum cumulativeinfiltration rate value of I30 was with cultivated pediplain ofshallow soils (10.30 cm) and the maximum value withnon-cultivated coastal plain soils (157.33 cm) with anaverage of 49.4 cm. Soil permeability coefficient Kranges between 0.61 cm/h (cultivated pediplain withshallow soils) and 20.35 cm/h (non-cultivated coastalplain soils) with an average of 6.29 cm/h, while soilsorpitivity coefficient S ranges between 0.0205 m/s0.5
(cultivated pediplain with shallow soils) and 0.36 m/s0.5
(cultivated lava field volcanic hill soils) with an averageof 0.972 m/s0.5. The results showed clear variability ofsoil infiltration properties according to landforms due tosoil texture where there were large grain size in theupstream part of the wadi and fine grain size in thedownstream part of the wadi.
Table 1 Statistical details ofchemical parameters for the ana-lyzed samples (n=272) and waterquality parameters for domesticuses according to the Saudi Ara-bian Standards Organization(SASO 1984)
STDEV standard deviation, CVcoefficient of variation, TDS totaldissolved solids, EC electricalconductivity, TH total hardness,SAR sodium adsorption ratio
SASO CV (%) STDEV Average Max Min Parameter
6.5–8.5 3.93 0.30 7.64 8.68 6.33 pH
1,500 90.17 1,561.7 1,731.5 10,022.2 36.0 TDS (mg/l)
0.16–1.60 76.70 2.14 2.79 13.73 0.20 EC (dS/m)
500 108.00 293 270.00 2,817.00 60.00 TH (mg/l)
– 46.26 103.70 224.21 605.13 9.15 Alkalinity (mg/l)
9.98 83.66 6.91 8.26 52.89 0.28 Ca 2+ (meq/l)
12.49 109.74 5.63 5.13 54.30 0.11 Mg2+ (meq/l)
8.69 89.20 12.48 13.99 69.54 0.07 Na+ (meq/l)
– 204.17 0. 49 0.24 4.33 0.01 K2 (meq/l)
8.33 86.97 6.94 7.98 45.71 0.15 SO42− (meq/l)
7.04 107.76 17.21 15.97 105.49 0.30 Cl− (meq/l)
– 40.11 1.44 3.59 8.50 0.15 HCO3− meq/l)
– 300.00 0.27 0.09 1.47 0.00 CO32− (meq/l)
50 298.19 14.79 4.96 113.23 0.00 NO3− (mg/l)
– 89.04 4.04 5.66 53.35 0.07 SAR
Arab J Geosci
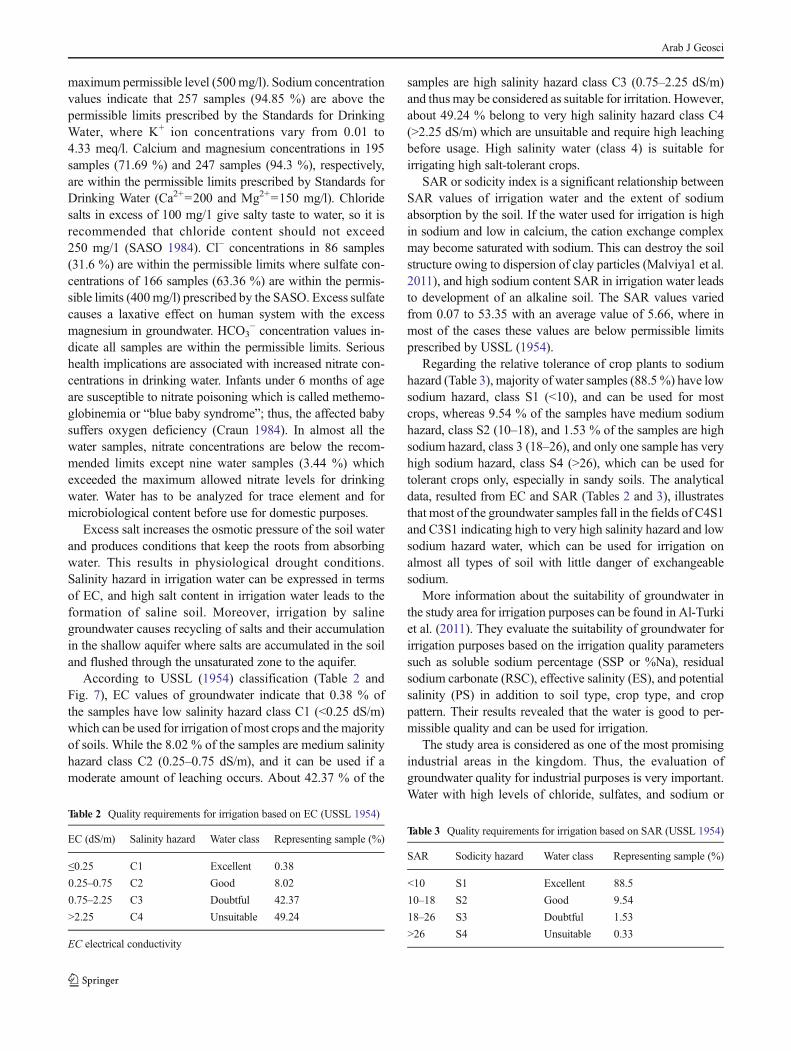
The water elevation contour map (Fig. 6) revealed thatgroundwater flows towards the west and southwest directionof the region; thus, there is a marked decrease in hydraulicgradients toward the coastal areas. Natural groundwater dis-charge at the coast has decreased with the falling hydraulicgradients resulting from well abstraction. The total depth of
the wells ranges from 19 m (Al-Lgyah well) to 97 m (Al-Gwydyah well), and the well yield ranges between 69 and154 m3/h.
The calculated hydraulic gradient was about 0.005 in theupper part of the coastal plain and about 0.001 in the coastalstrip. The groundwater level varies from 10 m (Al-Abadlah
Fig. 4 Rainfall distribution in thestudy area
Fig. 5 Field infiltration test. a Field photograph showing the disk infiltrometer. b Example of cumulative infiltration rate for non-cultivated coastal plainsoils
Arab J Geosci

well) to 33.5 m (Al-Gwydyah well) above mean sea level, andin general, the groundwater level rises eastward towards thehighlands.
These variations in the water table might be attributed tothe variations of bedrock surface in the study area. A compar-ison of the water levels measured in 1993 with the presentsituation shows that the water level during the last 20 years hasrisen in the eastern parts in the coastal plain and fell in thewestern part of the area.
It may be inferred from the data presented in Table 1 thatthere is a wide range of salinities and chemical compositionsas shown from the values of standard deviation with respect tothe EC, Na+, Mg2+, Ca2+, Cl−, and SO4
2− contents. Such wideranges of chemical compositions suggest that multiple sourcesand/or complex hydrochemical processes regulate the chem-ical composition. Generally, groundwater chemistry mostlyarises from the source and circulation of the water itself intothe aquifer media, where geology imposes its chemistry on thegroundwater composition.
The pH value ranges between 6.33 and 8.68 with anaverage of 7.64 mg/l indicating mildly acidic to alkalinenature of the water. The EC is a useful tool to evaluate thepurity of water, and its value is related to total dissolved solids.In the study area, EC value ranges between 0.20 and 13.73 dS/m with an average of 2.79 dS/m indicating moderate andhighly saline water.
The EC values increased significantly, perhaps due to theimpact of seawater incursion (Fig. 7). Other sources whichmight have contributed to this high salinity values, includingthe flushing of the accumulated soluble salts in the top soil tothe aquifer (the measured soil salinity at Al-Lkbasay rangesbetween 0.5 and 21 dS/m) and/or agricultural return flows intothe alluvial aquifer. In the study area, salinity increases to-wards south direction which may indicate the possibility of ahigh rate of intrusion of saline water due to overexploitation ofthe wells. Overexploitation by excessive and unregulatedpumping (most of the wells are concentrated in southern partsof the study area) has resulted in a high withdrawal of
Fig. 6 Water table contour mapof the study area showing the flowdirections
Arab J Geosci

groundwater in such a way that it crossed the sustainablelimits. This causes a decline of groundwater levels; thus,seawater intrudes into the aquifer and contaminatesgroundwater.
TDS measurements denote the various types of mineralspresent in water in the dissolved form. In natural water,dissolved solids include mainly carbonates, bicarbonates,chloride, sulfate, phosphate, silica, calcium, magnesium, so-dium, and potassium. The high positive correlation supportsthe fact that Na+, Ca2+, Cl−, SO4
2−, and HCO3− constituted the
bulk of the ion concentrations. TDS values reflect the level ofminerals that are present in water in dissolved form, and itvaries considerably in different geological formations owingto differences in the solubility of minerals. In the analyzedgroundwater samples, TDS values range between 36.0 and10,022 mg/1 with an average of 1,731.5 mg/l reflecting brack-ish to saline groundwater character. Water hardness is causedprimarily by the presence of cations such as calcium andmagnesium for TH and anions such as carbonate and bicar-bonate for carbonate or temporary hardness (CH). In the studyarea, TH varies between 1.2 to 355 mg/l; high values of total
hardness may be due to marine salt contamination and theoccurrence of some gypsum deposits in sabkha.
Chemical analysis of water samples indicated that the mostdominant cation chemistry shows the dominance of Na+
(50.23 %) followed by Ca2+ (29.46 %) and Mg2+ (18.33 %),while the anion is Cl− (57.19%) followed by SO4
2− (28.56%)and HCO3
− (12.84 %), with minor contribution from CO32−
and NO3−. Thus, groundwater type is sodium chloride
reflecting high amount of minerals. Sodium concentrations,the dominant cation, range between 0.07 and 69.54 meq/l withan average of 13.99 meq/l, where K+ ion concentrations varyfrom 0.01 to 4.33 meq/l. The elevated level of Na+ might bedue to the long residence time of water, dissolution ofmineralsfrom lithological composition (weathering of feldspar), possi-ble ion exchange processes which withdraws Ca2+ and givesNa+ to the solution, and also due to overexploitation ofgroundwater as well as the addition from the irrigation waters.The low levels of K+ in natural waters are a consequence of itstendency to be fixed by clay minerals and to participate in theformation of secondary minerals (Mathess 1982). The Ca2+
and Mg2+ concentrations vary from 0.28 to 52.89 and 0.11 to
Fig. 7 EC distributions map thestudy area
Arab J Geosci
54.3 meq/l with averages of 8.26 and 5.13 meq/l, respectively.These cations are possibly derived from chemical weatheringof the silicate rocks (feldspars, micas, and other related min-erals constituting the basement rocks) in the area.
Generally, greater mineralization of groundwater within thestudy area is associated with higher chloride and sulfate con-centrations. The chloride ion occurs in natural waters in fairlylow concentrations, usually less than 100 mg/l, unless thewater is brackish or saline (Fetter 1999). In the study area,the impact of seawater incursion perhaps plays an importantrole in the high chloride concentrations. In addition to mixingwith seawater, industrial, domestic sewage, and leaching fromupper soil layers in such dry climates might be contributed tothe high level of chloride in groundwater (Srinivasamoorthyet al. 2008). Chloride concentrations, the dominant anion,range between 0.30 and 105.49 meq/l with an average of15.97 meq/l, where sulfate concentrations vary from 0.15 to45.71 meq/l with an average of 7.98 meq/l. Bicarbonate anionranges between 0.15 and 8.5 meq/l with an average concen-tration of 3.6 meq/1; the source of bicarbonate may be attrib-uted to the charged/recharged CO2
2−. Bicarbonate has beenfound in abundance in groundwater, but it occurs in smallquantities in seawater. So, these two parameters, chloride andbicarbonate, may highly indicate the salt water intrusion intogroundwater aquifers. Agricultural activities on top, especiallyinorganic fertilizer or contamination from human or animalwastes as a consequence of the oxidation of ammonia, are thepredominant sources of nitrate in groundwater. The minimum,maximum, and average nitrate concentrations in the area are 0,113.23, and 5 mg/l, respectively.
Seawater intrusion is highly associated with groundwaterwithdrawal. Ionic ratios (rNa/rCl and rCl/rHCO3 + CO3) werecalculated in milliequivalents per liter to evaluate the extent ofseawater effect on the freshwater aquifer in the study area (ElMoujabber et al. 2006; Lee and Song 2007; Abdalla andKhalifa 2013). rNa/rCl ratios less than the seawater ratio(0.86) indicate that fresh groundwater was contaminated withthe saline water. The calculated rNa/rCl ratios showed that 106samples (39 %) are less than the seawater ratio indicatingcontamination by seawater to some extent, while 27 samples(9.9 %) are close to the seawater value indicating recentsimple mixing with seawater (Mercado 1985). These wellsare mostly located in the southern and western parts in thestudy area, in particular, close to the Red Sea coast. The rest ofthe samples exceeded the seawater value, which might be dueto anthropogenic sources that reflect meteoric water recharges.The hydrochemical data showed that the collected groundwa-ter samples have rCl/rHCO3 + CO3 ratio ranges between 0.35and 64.65. The effect of seawater encroachment could beclassified using rCl/rHCO3 + CO3 ratio based on Revelle(1941) and Todd (1959). Ratio values showed that 256 sam-ples (94.1 %) have rCl/rHCO3 + CO3 >0.5 indicating simplemixing with seawater, while the rest of the samples are
unaffected by seawater intrusion. Out of the 256 samples,182 samples (71 %) have rCl/rHCO3 + CO3 ratio rangesbetween 0.5 and 6.6 that indicated slightly and moderatelyaffected by seawater intrusion, while the other 74 samples(29 %) have rCl/rHCO3 + CO3 >6.6 which indicates that it isstrongly affected by seawater intrusion. These affected sam-ples are found to be located near the coast, may be due toseawater intrusion. Periodic chemical analysis of groundwateralong with reducing the exploitation activities helps track theseawater intrusion especially in coastal parts. Still, the prob-lem needs further studies to be more accurately quantified andto assess the seawater encroachment for the groundwateraquifer in the study area.
Discussion
In the study area, groundwater is being mostly used fordomestic purposes especially for people in rural parts. Waterfor domestic uses must be odorless, colorless, and free fromharmful bacteria, viruses, and radioactive elements. SaudiArabia relies mainly on groundwater and desalinated waterfor drinking purposes. Water from these sources must betreated to make it suitable for drinking. Saudi ArabianStandards Organization (SASO) (1984) provides the country’swater quality specifications for both bottled and unbottleddrinking water (Table 1).
In general, all of the water samples have pH values fallingwithin the limits of the standards prescribed by SASO exceptone sample has pH value <6.5 and two samples have pH >8.4.EC ranges between moderate and highly saline water and inmost samples EC values are above permissible limits pre-scribed by Standards for Drinking Water, SASO, and WHO.There is no proof of negative health effects associated with theingestion of high TDS water (WHO 2006). However, somestudies suggest that the continuous consumption of salinewater may lead to human conditions of hypertension likethose found by Khan et al. (2008). Groundwater with a TDSvalue less than 500 mg/l can be considered as excellent fordrinking purpose (WHO 1984). In almost all the water sam-ples, the TDS values vary widely and exceed the recommend-ed limits of the WHO (1984) and SASO (1984), and accord-ingly they are not suitable for drinking and domestic useswithout removing the exceeding TDS or dilution with waterof low TDS. Hard water is not a health hazard but it may beunsuitable for domestic use especially with laundry.
Quantitative classification of groundwater according totheir level of hardness (Sawyer and McCarty 1967) showedthat only 1 % of the examined water samples is soft water(<75 mg/l), 3 % fall under moderately hard (75–150 mg/l),14 % fall under hard (150–300 mg/l), and the rest are veryhard (>300 mg/l). With respect to TH value set by SASO,most of the studied water samples exceeded the recommended
Arab J Geosci
maximum permissible level (500mg/l). Sodium concentrationvalues indicate that 257 samples (94.85 %) are above thepermissible limits prescribed by the Standards for DrinkingWater, where K+ ion concentrations vary from 0.01 to4.33 meq/l. Calcium and magnesium concentrations in 195samples (71.69 %) and 247 samples (94.3 %), respectively,are within the permissible limits prescribed by Standards forDrinking Water (Ca2+=200 and Mg2+=150 mg/l). Chloridesalts in excess of 100 mg/1 give salty taste to water, so it isrecommended that chloride content should not exceed250 mg/1 (SASO 1984). Cl− concentrations in 86 samples(31.6 %) are within the permissible limits where sulfate con-centrations of 166 samples (63.36 %) are within the permis-sible limits (400mg/l) prescribed by the SASO. Excess sulfatecauses a laxative effect on human system with the excessmagnesium in groundwater. HCO3
− concentration values in-dicate all samples are within the permissible limits. Serioushealth implications are associated with increased nitrate con-centrations in drinking water. Infants under 6 months of ageare susceptible to nitrate poisoning which is called methemo-globinemia or “blue baby syndrome”; thus, the affected babysuffers oxygen deficiency (Craun 1984). In almost all thewater samples, nitrate concentrations are below the recom-mended limits except nine water samples (3.44 %) whichexceeded the maximum allowed nitrate levels for drinkingwater. Water has to be analyzed for trace element and formicrobiological content before use for domestic purposes.
Excess salt increases the osmotic pressure of the soil waterand produces conditions that keep the roots from absorbingwater. This results in physiological drought conditions.Salinity hazard in irrigation water can be expressed in termsof EC, and high salt content in irrigation water leads to theformation of saline soil. Moreover, irrigation by salinegroundwater causes recycling of salts and their accumulationin the shallow aquifer where salts are accumulated in the soiland flushed through the unsaturated zone to the aquifer.
According to USSL (1954) classification (Table 2 andFig. 7), EC values of groundwater indicate that 0.38 % ofthe samples have low salinity hazard class C1 (<0.25 dS/m)which can be used for irrigation ofmost crops and the majorityof soils. While the 8.02 % of the samples are medium salinityhazard class C2 (0.25–0.75 dS/m), and it can be used if amoderate amount of leaching occurs. About 42.37 % of the
samples are high salinity hazard class C3 (0.75–2.25 dS/m)and thusmay be considered as suitable for irritation. However,about 49.24 % belong to very high salinity hazard class C4(>2.25 dS/m) which are unsuitable and require high leachingbefore usage. High salinity water (class 4) is suitable forirrigating high salt-tolerant crops.
SAR or sodicity index is a significant relationship betweenSAR values of irrigation water and the extent of sodiumabsorption by the soil. If the water used for irrigation is highin sodium and low in calcium, the cation exchange complexmay become saturated with sodium. This can destroy the soilstructure owing to dispersion of clay particles (Malviya1 et al.2011), and high sodium content SAR in irrigation water leadsto development of an alkaline soil. The SAR values variedfrom 0.07 to 53.35 with an average value of 5.66, where inmost of the cases these values are below permissible limitsprescribed by USSL (1954).
Regarding the relative tolerance of crop plants to sodiumhazard (Table 3), majority of water samples (88.5 %) have lowsodium hazard, class S1 (<10), and can be used for mostcrops, whereas 9.54 % of the samples have medium sodiumhazard, class S2 (10–18), and 1.53 % of the samples are highsodium hazard, class 3 (18–26), and only one sample has veryhigh sodium hazard, class S4 (>26), which can be used fortolerant crops only, especially in sandy soils. The analyticaldata, resulted from EC and SAR (Tables 2 and 3), illustratesthat most of the groundwater samples fall in the fields of C4S1and C3S1 indicating high to very high salinity hazard and lowsodium hazard water, which can be used for irrigation onalmost all types of soil with little danger of exchangeablesodium.
More information about the suitability of groundwater inthe study area for irrigation purposes can be found in Al-Turkiet al. (2011). They evaluate the suitability of groundwater forirrigation purposes based on the irrigation quality parameterssuch as soluble sodium percentage (SSP or %Na), residualsodium carbonate (RSC), effective salinity (ES), and potentialsalinity (PS) in addition to soil type, crop type, and croppattern. Their results revealed that the water is good to per-missible quality and can be used for irrigation.
The study area is considered as one of the most promisingindustrial areas in the kingdom. Thus, the evaluation ofgroundwater quality for industrial purposes is very important.Water with high levels of chloride, sulfates, and sodium or
Table 2 Quality requirements for irrigation based on EC (USSL 1954)
EC (dS/m) Salinity hazard Water class Representing sample (%)
≤0.25 C1 Excellent 0.38
0.25–0.75 C2 Good 8.02
0.75–2.25 C3 Doubtful 42.37
>2.25 C4 Unsuitable 49.24
EC electrical conductivity
Table 3 Quality requirements for irrigation based on SAR (USSL 1954)
SAR Sodicity hazard Water class Representing sample (%)
<10 S1 Excellent 88.5
10–18 S2 Good 9.54
18–26 S3 Doubtful 1.53
>26 S4 Unsuitable 0.33
Arab J Geosci

other ions will increase the water conductivity and may pro-mote corrosion (Wilkes University 2002), where chloridecombines with calcium and magnesium, and increase thecorrosive activity of water, depending on the alkalinity ofthe water. This can increase the concentrations of metals inthe water supply. With respect to water hardness, water oflevels above 300 mg/l is considered excessive for a publicwater supply and results in a high soap consumption as well asobjectionable scale in heating vessels and pipes; most of thetested samples do not comply with the range of TH values setby SASO and National Academy of Science (1972) for allindustries except petroleum industries. On the other hand,TDS, chloride, sulfate, and alkalinity values, in most of testedsamples in the study area, are not suitable for fruit, vegetablepaper, and textile industry (Table 4). This indicates the needfor special treatment or mixing with some distilled water priorto use.
Conclusion
Based on the hydrogeological investigation, groundwater ex-ists under unconfined conditions with water level rangingbetween 9 and 33 m, influenced by percolation from precip-itation. The calculated hydraulic gradient within the aquiferranges from 0.005 to 0.001 towards the coastal zone. Theresult of the infiltration tests showed a clear variability of soilinfiltration properties which may be attributed to the nature ofthe soil mechanical composition and soil texture, where thecoastal plain soils are mostly sandy textures while thepediplain and lava field volcanic hill soils are mostly finetextures with high proportion of pebbles and stones that im-pede the movement of water in the soil.
On the other hand, the chemical analysis results as well theassessment of waterquality revealed that the abundance ofthe major ions is in the following order: Na+ > Ca2+ >
Mg2+ >K+ = Cl− > SO42− >HCO3
− reflecting sodium chloridewater type. The ionic ratios (rNa/rCl and rCl/rHCO3 + CO3)and EC values indicate that the groundwater in the study areahas a mixed origin that is possibly infiltration of pure meteoricwater affected by seawater intrusion. Further, it was clear thatthe higher values of TDS and EC observed in the southern andwestern parts, in particular, close to the Red Sea coastreflecting are a gradual increase from upstream to downstreamwhich coincides with the groundwater flow direction. From acareful examination of these data, it was clear that the Na+,Mg2+, Cl−, and SO4
2− ions showed a wide range of distribu-tions and high standard deviations which may suggest apossible incursion of nearby saline water. Chemicalweathering and dissolution of minerals within a geologicformation through which water flows also play an importantrole in the water chemistry. The study revealed that ground-water reflects the brackish to saline water category according-ly. It mostly does not suit domestic uses due to the highsalinity and chloride concentrations particularly in the coastalareas; meanwhile, it could be used for industrial purposes withsome restrictions. TH values revealed that more than 80 % ofthe studied water samples are very hard water (>300 mg/l)based on Sawyer and McCarty’s (1967) classification. Foragricultural purposes, special management of salinity controland certain kinds of plants with good salt tolerance should beconsidered. According to the criteria of the National Academyof Science (1972), most water in the study area is not suitablefor many industrial purposes without special treatment ormixing with low saline water. From a strategic vision and planfor the development and management of water resources insouthwestern region of the kingdom, it is necessary to estab-lish a number of multifunctional dams. These dams must beaccompanied by a number of studies that have managed toexploit the amount of water that is wasted without the possi-bility of feeding groundwater aquifers. The best locations ofthese dams are the upper parts of valleys where the region
Table 4 Water quality require-ments for some industries (Na-tional Academy of Science 1972)
All chemical parameters in milli-grams per liter except pH
TDS total dissolved solids
Chemical parameter Type of industry Average measured value
Food Petroleum Paper Textile
pH 6.5–8.5 6–9 – – 7.64
TDS 500 3,500 200–500 100–200 1,731
Na+ + K+ – 230 – – 331
Ca2+ 100 – – – 165
Mg2+ – 85 – – 62
HCO3− + CO3
2− 480 224
SO4−2 250 900 100 383
Cl− 250 0–200 100 566
Alkalinity 250 500 75–150 50–200 224.21
Hardness 250 900 100–200 0–50 270
Arab J Geosci

accounts for Jazan and Tihama plains by more than 60 % ofthe quantities of floods in the kingdom as the total volume ofwater floods annually is 1,250 million cubic meters. Thiscould increase the amount of surface water and recharge ofthe groundwater through recharge dams.
Since the study area is relatively vulnerable to the contam-ination by seawater intrusion, further detailed studies arerecommended to examine closely and regularly the ground-water characteristics especially in the coastal area to avoidmore seawater encroachment into the aquifer.
Acknowledgments The authors are grateful to the reviewers for theirsuggestions and comments. The authors also thank the laboratory staff atthe Faculty of Food and Agricultural Sciences, King Saud University foranalyzing the groundwater samples.
References
Abdalla F, Khalifa I (2013) Effects of phosphate mining activities ongroundwater quality at Wadi Queh, Red Sea, Egypt. Arab J Geosci6:1273–1282
Al-Ahmadi E, El-Fiky A (2009) Hydrogeochemical evaluation of shal-low alluvial aquifer ofWadi Marwani, western Saudi Arabia. J KingSaud Univ (Sci) 21:179–190
Al-Amri A (1998) The application of geoelectrical vertical soundingsindelineating the hydrostratigraphy of the Southern Red Sea coastalarea, Saudi Arabia. J King Abdul Aziz Univ 10:73–90
Al-Bassam A, Hussein M (2008) Combined geo-electrical andhydrochemical methods to detect salt-water intrusions: a case studyfrom southwestern Saudi Arabia. Manag Environ Qual 19:179–193
Al-Shaibani A (2008) Hydrogeology and hydrochemistry of a shallowalluvial aquifer, western Saudi Arabia. Hydrogeol J 16:155–165
Al-Turki A, Abdel-Nasser G, Al-Faraj A, Shahwan A, Al-Malik A (2011)Evaluation of well water quality in Southern Tihama plain, SaudiArabia. Resources Bulletin No (172), 5–47. Food Science andAgricultural Resources Center, King Saud University (in Arabic).
APHA (2005) Standard methods for the examination of water and waste-water, 2nd edn. American Public Health Association, Washington,DC
Basahel A, Bahafzalla A,Mansour H, Omara S (1983) Primary structuresand depositional environ of the Haddat Ash Sham sedimentarysequence, northwest of Jeddah, Saudi Arabia. Arab Gulf J Sci Res1:143–155
Batayneh A, Elawadi E, Mogren S, Ibrahim E, Qaisy S (2012)Groundwater quality of the shallow alluvial aquifer of Wadi Jazan(Southwest Saudi Arabia) and its suitability for domestic and irriga-tion purpose. Sci Res Essays 7(3):352–364
Craun F (1984) Health aspects of groundwater pollution. In: Bitton G,Gerber C (eds) Groundwater pollution microbiology. John Wiley,New York, pp 135–179
ElMoujabberM, Bou Samra B, Darwish T, Atallah T (2006) Comparisonof different indicators for groundwater contamination by seawaterintrusion on the Lebanese coast. Water Resour Manag 20:161–180
Fetter W (1999) Contaminant hydrogeology. Prentice Hall, USA, p 500Golden Software, Inc (2002) Surfer 8, contouring and 3D surface map-
ping for scientists and engineers. Golden Software, Inc., Golden,Colorado, USA
Hussein M, Bazuhair A (1992) Groundwater in Haddat Al Sham-AlBayada area, eastern Saudi Arabia. Arab Gulf J Sci Res 1:23–43
Hussein M, Ibrahim K (1997) Electric resistivity, geochemical andhydrogeologyical of wadi deposits, Western Saudi Arabia. J KingAbdul Aziz Univ 9:55–72
Japan International Cooperation Agency (2010): The study on masterplan on renewable water resources development in the southwestregion in the Kingdom of Saudi Arabia, final report (unpublished)
Khaled M, Abdalla F (2013) Hydrogeophysical study for additionalgroundwater supplies in El Heiz Area, Southern part of ElBahariya Oasis, Western Desert, Egypt. Arab J Geosci 6:761–774
Khan A,Mojumder K, Kovats S, Vineis P (2008) Saline contamination ofdrinking water in Bangladesh. Lancet 371(9610):385
Lee J, Song S (2007) Evaluation of groundwater quality in coastal areas:implications for sustainable agriculture. Environ Geol 52:1231–1242
Malviya N, Deo S, Inam F (2011) Determination of water quality index toassess water quality for drinking and agricultural purposes. Int JBasic Appl Chem Sci 1(1):79–88
Matthess G (1982) The properties of groundwater. Wiley, New YorkMercado A (1985) The use of hydrogeochemical patterns in carbonate
sand and sandstone aquifers to identify intrusion and flushing ofsaline waters. Groundwater 23:635–645
Mogren S, Batayneh A, Elawadi E, Al-Bassam A, Ibrahim E, Qaisy S(2011) Aquifer boundaries explored by geoelectrical measurementsin the Red Sea coastal plain of Jazan area, Southwest Saudi Arabia.Int J Phys Sci 15:3768–3776
National Academy of Science (1972) Water quality criteria; ProtectionAgency, Washington DC, pp 1–594
Perttu N (2008) Assessment of hydrogeological and water quality param-eters, using MRS and VES in the Vientiane Basin. Department ofChemical Engineering and Geosciences, Lulea University ofTechnology, Sweden, Laos
Revelle R (1941) Criteria for recognition of sea water in groundwaters.Trans Am Geophys Union 22:593–597
Saudi Arabian Standards Organization (SASO) (1984) Bottled andunbott1ed drinking water, SSA 409/1984, 2nd ed., 1996-03-13,ISSN: 1319–2302, Available from: SASO information center, P.O.Box. 3437, Riyadh, 11471, Saudi Arabia, pp. 1–8.
Sawyer G, McCarthy L (1967) Chemistry of sanitary engineers, 2nd ed.McGraw Hill, New York, p-518.
Schaap M G (2000) Rosetta. Version 1.2. United States SalinityLaboratory, ARSUSDA. Riverside, California 92507.
Smith V, Al-Mooji A (1985) Groundwater development in the Tihamacoastal plain. Tech Background Pap: Int 11:151–161
Srinivasamoorthy K, Chidambaram S, Vasanthavigar M (2008)Geochemistry of fluorides in groundwater: Salem District,Tamilnadu, India. J Environ Hydrol 1:16–25
Todd K (1959) Ground water hydrology. Chapman & Hall, LondonTodd K (1980) Ground water hydrology, 2nd edn. John Wiley & Sons,
New YorkUS Salinity Laboratory Staff (USSL) (1954) Diagnosis and improvement
of saline and alkali soils, Agric, handbook 60, USDA. USGovernment printing office, Washington, DC
van Genuchten MT (1980) A closed-form equation for predicting thehydraulic conductivity of unsaturated soils. Soil Sci Soc Am J 44:892–898
Wilkes University Center of Environmental Quality, GeoenvironmentalScience and Engineering Department (2002) Corrosion, saturationindex, balanced water in drinking water systems—source and causeof corrosion
World Health Organization (WHO) (1984) Guidelines for drinking-waterquality 3rd ed. Incorporating the first and second addenda, volume 1Geneva
World Health Organization WHO (2006) Guidelines for drinking-waterquality, incorporating first addendum, Vol. 1, Recommendations,3rd edition
Zhang R (1997) Determination of soil sorptivity and hydraulic conduc-tivity from the disk infiltrometer. Soil Sci Soc Am J 61:1024–1030
Arab J Geosci