Saudi Arabia: Macroeconomic Forecast Update - Amazon AWS
21
September 2020 Report Series James Reeve Group Chief Economist Samba Financial Group P.O. Box 6038, Dubai U.A.E +971 (0) 547772151 [email protected] This and other publications can be Downloaded from www.samba.com Saudi Arabia: Macroeconomic Forecast Update Executive Summary The global economy is still coming to terms with the ravages of the Covid- 19 pandemic. There has recently been some rebound in industrial production and retail sales, but services firms around the world are suffering from severely reduced cashflow, and unemployment is rising sharply. Government support has helped, and furlough schemes are being rolled over in many Eurozone economies. Public sector debt loads are set to increase substantially, but rock bottom policy rates should keep debt servicing manageable in most cases. Yet Covid has not been fully contained and countries such as India and some Eurozone states are experiencing new surges of infections, while the virus is still working its way through many US states. Activity should be much firmer in 2021, thanks in part to the enormous fiscal and monetary response. But with unemployment in many countries likely to remain high, households (and firms) are likely to conserve cash where possible. Lingering fears around Covid may also restrain activity, even if—as we expect—a vaccine is developed and distributed during the year. Financial markets certainly do not reflect this acute underlying weakness. Equity markets in particular are surging ahead, helped by the flood of liquidity that has reduced sovereign yields and raised the equity risk premium. A weaker US dollar has eased pressure on Emerging Markets by reducing dollar funding costs and supporting demand for some commodities. Oil prices are under pressure again. OPEC Plus production discipline has been surprisingly good, but the fact remains that August saw an additional 950,000 b/d of OPEC Plus output in line with its April agreement, and there are clear signs that the market is struggling to absorb this. China appears to have reached the end of its opportunistic re-stocking and demand in India is withering. Meanwhile, US shale output is edging higher as firms release locked-in crude. This suggests that OPEC Plus might need to reset its production plans, possibly deferring its scheduled December increase until Q1-21. We continue to expect near- term price weakness and expect Brent to average $40/b this year. Prices should shift higher in 2021 in line with the broad recovery of global activity, but shale will keep a lid on price growth and we expect Brent to average $46/b. The Saudi economy appears to be regaining some poise as the lockdown is eased and general government capital spending picks up. Recent retail sales data show that shoppers appear to have shrugged off the tripling of VAT in July, though it is too soon to draw firm conclusions about the rest of the year. Other sectors, such as Petrochemicals, Travel, and Hospitality are under pressure and with central government spending also set to be cut by around 11%, we think the nonoil economy will contract by around 2.3% this year (better than consensus). A cautious rebound in government spending should pave the way for a 4%-plus bounce in nonoil activity in 2021, though this in part reflects the weak base.
-
Upload
khangminh22 -
Category
Documents
-
view
2 -
download
0
Transcript of Saudi Arabia: Macroeconomic Forecast Update - Amazon AWS

Public
PUBLIC
September 2020
Report Series
James Reeve Group Chief Economist Samba Financial Group P.O. Box 6038, Dubai U.A.E +971 (0) 547772151 [email protected] This and other publications can be Downloaded from www.samba.com
Saudi Arabia:
Macroeconomic Forecast Update
Executive Summary
The global economy is still coming to terms with the ravages of the Covid-19 pandemic. There has recently been some rebound in industrial production and retail sales, but services firms around the world are suffering from severely reduced cashflow, and unemployment is rising sharply. Government support has helped, and furlough schemes are being rolled over in many Eurozone economies. Public sector debt loads are set to increase substantially, but rock bottom policy rates should keep debt servicing manageable in most cases. Yet Covid has not been fully contained and countries such as India and some Eurozone states are experiencing new surges of infections, while the virus is still working its way through many US states.
Activity should be much firmer in 2021, thanks in part to the enormous fiscal and monetary response. But with unemployment in many countries likely to remain high, households (and firms) are likely to conserve cash where possible. Lingering fears around Covid may also restrain activity, even if—as we expect—a vaccine is developed and distributed during the year.
Financial markets certainly do not reflect this acute underlying weakness. Equity markets in particular are surging ahead, helped by the flood of liquidity that has reduced sovereign yields and raised the equity risk premium. A weaker US dollar has eased pressure on Emerging Markets by reducing dollar funding costs and supporting demand for some commodities.
Oil prices are under pressure again. OPEC Plus production discipline has been surprisingly good, but the fact remains that August saw an additional 950,000 b/d of OPEC Plus output in line with its April agreement, and there are clear signs that the market is struggling to absorb this. China appears to have reached the end of its opportunistic re-stocking and demand in India is withering. Meanwhile, US shale output is edging higher as firms release locked-in crude. This suggests that OPEC Plus might need to reset its production plans, possibly deferring its scheduled December increase until Q1-21. We continue to expect near-term price weakness and expect Brent to average $40/b this year. Prices should shift higher in 2021 in line with the broad recovery of global activity, but shale will keep a lid on price growth and we expect Brent to average $46/b.
The Saudi economy appears to be regaining some poise as the lockdown is eased and general government capital spending picks up. Recent retail sales data show that shoppers appear to have shrugged off the tripling of VAT in July, though it is too soon to draw firm conclusions about the rest of the year. Other sectors, such as Petrochemicals, Travel, and Hospitality are under pressure and with central government spending also set to be cut by around 11%, we think the nonoil economy will contract by around 2.3% this year (better than consensus). A cautious rebound in government spending should pave the way for a 4%-plus bounce in nonoil activity in 2021, though this in part reflects the weak base.

September 2020
PUBLIC
2
Global economy and markets
The world economy is slowly regaining some equilibrium
The global economy is slowly finding its feet again in the face of the Covid-19 pandemic, with retail sales and industrial production bouncing back from April’s lows. But the recovery is far from complete, and there have been renewed Covid outbreaks across the globe. Households and firms remain extremely cautious (both for health and financial reasons) and a return to normality will probably require the roll-out of an effective vaccine.
Eurozone countries look to extend furlough schemes, unlike US and UK
Looking at recent economic data, all developed countries saw sharp declines in GDP in Q2, driven primarily by slumps in consumer spending. Services-heavy economies such as the US, UK and Spain suffered more than most. April was the nadir, and retail sales and industrial output generally sprang back in May and June. Yet this largely reflects a combination of pent-up demand and the easing of restrictions. The next few months will be much more testing as unemployment begins to bite. In the Eurozone, where fiscal straitjackets have recently been loosened, countries appear to be opting to extend furlough schemes for a year or more. In the US, with a Presidential election looming, further fiscal support appears unlikely before the beginning of 2021 at the earliest. In the UK too, the Conservative government appears unwilling to extend the current scheme beyond October. But even if governments continue to support households, the resurgence of Covid cases suggests that shoppers will remain cautious.
EM governments have offered less fiscal support to their economies
Emerging Markets are generally in worse shape than developed ones. The authorities were slow to react to the virus in Brazil and India, while many EMs do not have the fiscal resources to support their economies—Argentina, South Africa, Turkey and Egypt are all good examples of this. East Asia has fared better, with tech-centred Korea and Taiwan rebounding quite quickly. The biggest positive is that China is now well into its recovery: industrial production has risen sharply there (though retail sales have lagged) and this should provide an important growth engine for other EMs in the region and beyond.
An associated threat to the global recovery is the fate of firms who have struggled with reduced business and/or heavy debt loads. Tight liquidity in the early part of the crisis pushed many small firms (and some big ones) out of business. A flood of central bank liquidity has helped to soothe the situation. But firms in
2017 2018 2019 2020f 2021f
Real GDP (percent change, PPP)
World 3.7 3.6 3.1 -2.8 4.4
US 2.3 2.9 2.3 -4.1 2.5
China 6.8 6.5 6.0 1.7 9.4
Eurozone 2.4 2.0 1.2 -8.5 3.2
Japan 2.2 0.3 0.9 -3.5 5.6
Emerging Markets 5.0 4.5 4.0 -2.8 5.0
Official policy rates (end period)
US (FFTR) 1.50 2.50 1.75 0.25 0.25
Japan (UOCR) -0.10 -0.10 -0.10 -0.10 -0.10
ECB deposit rate -0.40 -0.40 -0.50 -0.50 -0.50
Exchange rates (end period)
USD/EUR 1.20 1.15 1.12 1.22 1.27
Oil Price ($/b avg.)
Brent 54 71 64 41 46
Bloomberg; Samba estimates and forecasts
World Economic Outlook
0
2
4
6
8
10
12
14
Mar
-17
May
-17
Jul-
17
Sep
-17
No
v-17
Jan
-18
Mar
-18
May
-18
Jul-
18
Sep
-18
No
v-18
Jan
-19
Mar
-19
May
-19
Jul-
19
Sep
-19
No
v-19
Jan
-20
Mar
-20
May
-20
Unemployment: US, UK and Eurozone (% of workforce, SA; Bloomberg)
Eurozone US UK
-
7,500
15,000
22,500
30,000
-
500
1,000
1,500
2,000
6-J
an
20
-Jan
3-F
eb
17
-Fe
b
2-M
ar
16
-Mar
30
-Mar
13
-Ap
r
27
-Ap
r
11
-May
25
-May
8-J
un
22
-Ju
n
6-J
ul
20
-Ju
l
3-A
ug
17
-Au
g
31
-Au
g
Global Covid-19 Cases:(000's; WHO)
New Cumulative (RHS)

September 2020
Public
3
tourism, hospitality and many retail segments will continue to suffer until a vaccine is found and distributed.
A return to normality hinges on a successful vaccine
There appear to be nine serious vaccine contenders in development, with hopes that a fully-tested and approved vaccine could be available for global distribution in H1-21. A vaccine might not be a panacea—social distancing measures would likely remain in place for a while and sectors such as tourism will probably continue to struggle—but it would go a long way to restoring household and business confidence, and allowing a fresh wave of consumption and investment.
Central banks will provide the liquidity backstop for financial markets
Covid’s impact on financial markets is likely to be longer-lasting than on the real economy. The main central banks have all committed (explicitly or implicitly) to provide as much monetary accommodation as possible to secure the recovery. The US Ten Year yield has collapsed by some 120bps since the beginning of the year as the US Fed has slashed policy rates and hoovered up ever more government (and corporate) debt. While helping distressed firms, this liquidity has also spurred on the equity market. The equity risk premium, which is a measure of the extra return one can expect from shares over government bonds, has risen even as average corporate earnings on the S&P 500 have fallen.
We do not see inflation as a significant threat…
Some worry that this wall of liquidity will push up consumer prices; indeed, the US Fed is hedging its bets by reformulating its policy framework to allow a greater tolerance of inflation. Economic orthodoxy does indeed point to higher inflation—and there has recently been an uptick. Yet households are cautious and have built up precautionary savings where they can. With the velocity of money also slowing, our view is that core inflation is unlikely to make a strong showing in the next couple of years.
…but the USD is set to remain under pressure
The steep fall in US Treasury yields goes a long way to explain why the USD has weakened against the EUR (and other currencies). With the US budget deficit set to surge to around 18% of GDP this year, and the Democrats eyeing a clean sweep of Congress and the White House in November, the greenback seems likely to remain under pressure. This is in contrast with our April assumptions when we thought that the dollar would be in vogue given the uncertainty around Covid.
86
88
90
92
94
96
98
100
102
104
US: USD Trade-Weighted Index (Bloomberg)
0
5
10
15
20
25
30
1500
2000
2500
3000
3500
4000
US: S&P 500, Index vs Price/Earnings Ratio (Bloomberg)
S&P 500 index Price Earnings Ratio (RHS)
0
5
10
15
20
25
30
35
40
Au
g-0
8
Ap
r-09
Dec
-09
Au
g-1
0
Ap
r-11
Dec
-11
Au
g-1
2
Ap
r-13
Dec
-13
Au
g-1
4
Ap
r-15
Dec
-15
Au
g-1
6
Ap
r-17
Dec
-17
Au
g-1
8
Ap
r-19
Dec
-19
Au
g-2
0
US: Federal Reserve Balance Sheet (% GDP; USFR System)
September 2020
Public
4
Oil markets
Oil prices stabilise…
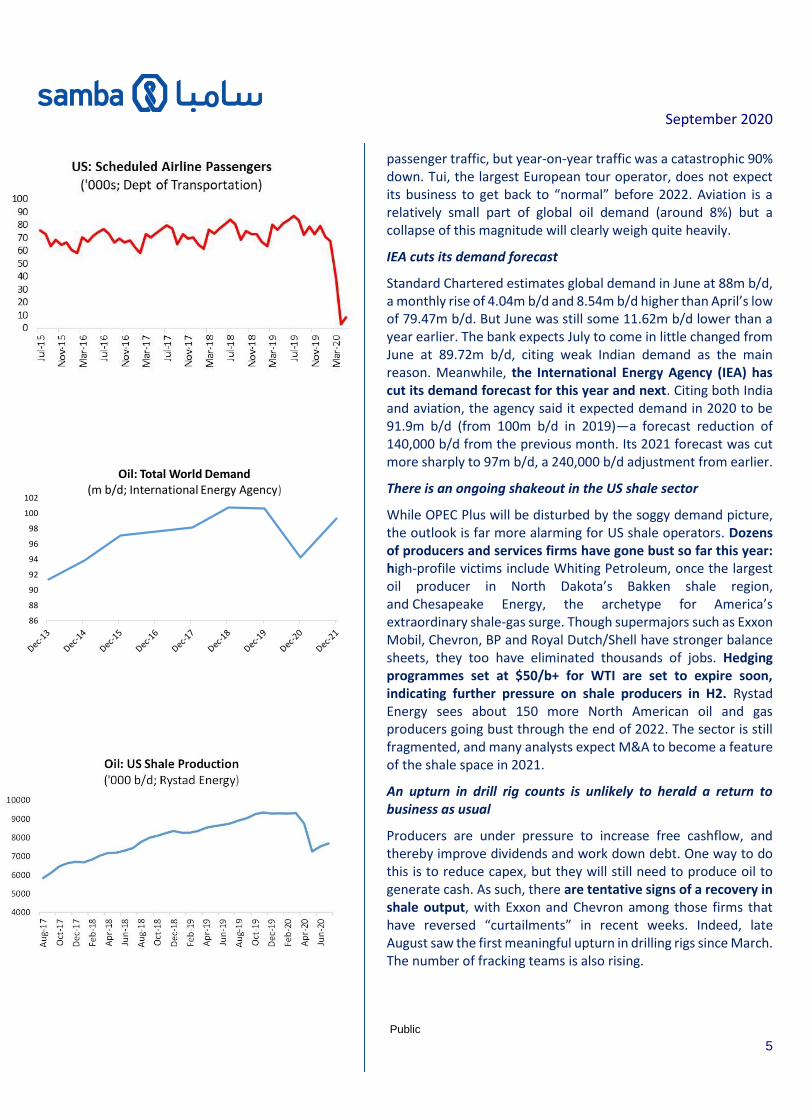
The weaker dollar—and the broader “reflation” theme—has given support to oil prices, with Brent recovering from its $20/barrel April lows to trade in a narrow band of $40-$46/b. The price recovery also owes much to the efforts of OPEC Plus to reduce global supply by almost 10% since April. OPEC has shown fairly good production discipline, with 95% compliance in July. Notably, Iraq and Nigeria both achieved 85% of their targeted production—unheard of in recent years.
…but demand picture seems to be weakening again
Nevertheless, in line with the agreement, the coalition pumped an additional 950,000 b/d in August, compared with July, and there are signs that the market is struggling to digest this additional oil. The spread between prompt and six-month pricing is at its widest since late May. Russia’s Urals benchmark is some $3/b below its June high, while West African crudes have fallen sharply. Both Saudi Arabia and Iraq have cut their official selling prices for September deliveries.
The proximate cause of this is a marked slowdown in Chinese buying. China took advantage of extremely low oil prices in April and May to boost oil stocks, a dynamic that helped to clear at least some of the globe’s huge glut of crude. But China appears to have had its fill for now, and is struggling to digest all of this oil: as of early September there was some 90m barrels of crude and condensate in floating storage in China’s ports.
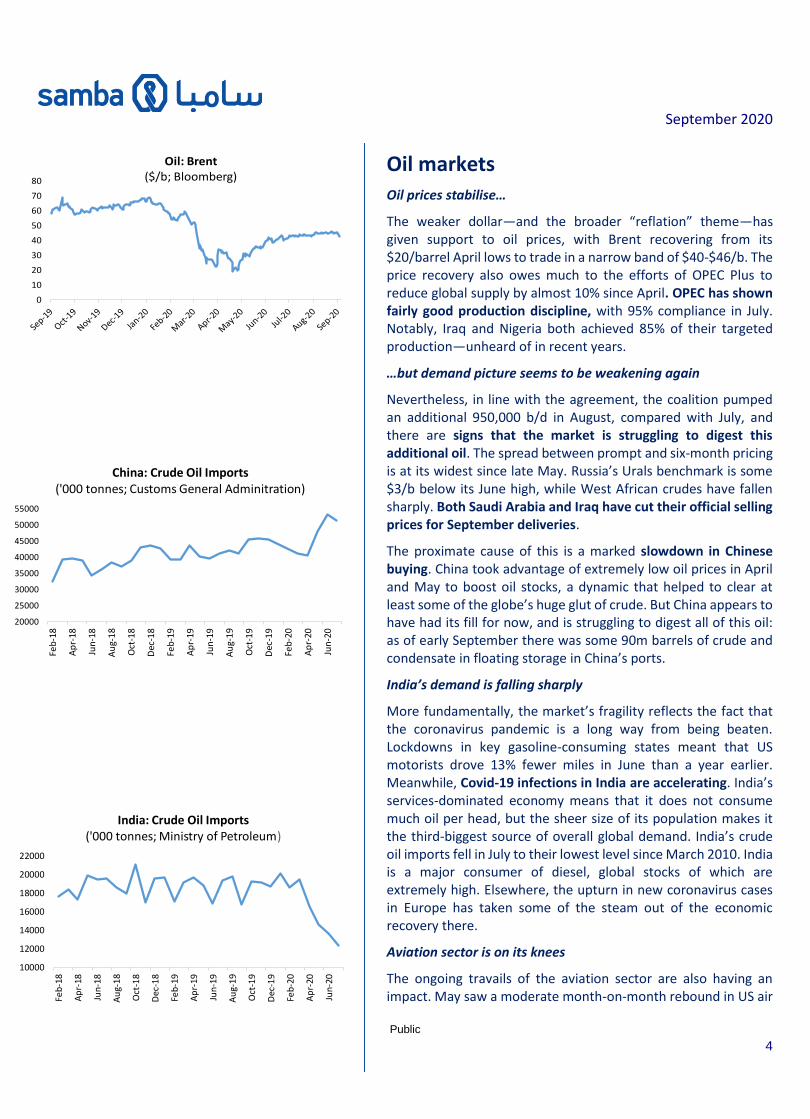
India’s demand is falling sharply
More fundamentally, the market’s fragility reflects the fact that the coronavirus pandemic is a long way from being beaten. Lockdowns in key gasoline-consuming states meant that US motorists drove 13% fewer miles in June than a year earlier. Meanwhile, Covid-19 infections in India are accelerating. India’s services-dominated economy means that it does not consume much oil per head, but the sheer size of its population makes it the third-biggest source of overall global demand. India’s crude oil imports fell in July to their lowest level since March 2010. India is a major consumer of diesel, global stocks of which are extremely high. Elsewhere, the upturn in new coronavirus cases in Europe has taken some of the steam out of the economic recovery there.
Aviation sector is on its knees
The ongoing travails of the aviation sector are also having an impact. May saw a moderate month-on-month rebound in US air
20000
25000
30000
35000
40000
45000
50000
55000
Feb
-18
Ap
r-18
Jun
-18
Au
g-1
8
Oct
-18
Dec
-18
Feb
-19
Ap
r-19
Jun
-19
Au
g-1
9
Oct
-19
Dec
-19
Feb
-20
Ap
r-20
Jun
-20
China: Crude Oil Imports ('000 tonnes; Customs General Adminitration)
10000
12000
14000
16000
18000
20000
22000
Feb
-18
Ap
r-18
Jun
-18
Au
g-1
8
Oct
-18
Dec
-18
Feb
-19
Ap
r-19
Jun
-19
Au
g-1
9
Oct
-19
Dec
-19
Feb
-20
Ap
r-20
Jun
-20
India: Crude Oil Imports ('000 tonnes; Ministry of Petroleum)
0
10
20
30
40
50
60
70
80
Oil: Brent ($/b; Bloomberg)
September 2020
Public
5
passenger traffic, but year-on-year traffic was a catastrophic 90% down. Tui, the largest European tour operator, does not expect its business to get back to “normal” before 2022. Aviation is a relatively small part of global oil demand (around 8%) but a collapse of this magnitude will clearly weigh quite heavily.
IEA cuts its demand forecast
Standard Chartered estimates global demand in June at 88m b/d, a monthly rise of 4.04m b/d and 8.54m b/d higher than April’s low of 79.47m b/d. But June was still some 11.62m b/d lower than a year earlier. The bank expects July to come in little changed from June at 89.72m b/d, citing weak Indian demand as the main reason. Meanwhile, the International Energy Agency (IEA) has cut its demand forecast for this year and next. Citing both India and aviation, the agency said it expected demand in 2020 to be 91.9m b/d (from 100m b/d in 2019)—a forecast reduction of 140,000 b/d from the previous month. Its 2021 forecast was cut more sharply to 97m b/d, a 240,000 b/d adjustment from earlier.
There is an ongoing shakeout in the US shale sector
While OPEC Plus will be disturbed by the soggy demand picture, the outlook is far more alarming for US shale operators. Dozens of producers and services firms have gone bust so far this year: high-profile victims include Whiting Petroleum, once the largest oil producer in North Dakota’s Bakken shale region, and Chesapeake Energy, the archetype for America’s extraordinary shale-gas surge. Though supermajors such as Exxon Mobil, Chevron, BP and Royal Dutch/Shell have stronger balance sheets, they too have eliminated thousands of jobs. Hedging programmes set at $50/b+ for WTI are set to expire soon, indicating further pressure on shale producers in H2. Rystad Energy sees about 150 more North American oil and gas producers going bust through the end of 2022. The sector is still fragmented, and many analysts expect M&A to become a feature of the shale space in 2021.
An upturn in drill rig counts is unlikely to herald a return to business as usual
Producers are under pressure to increase free cashflow, and thereby improve dividends and work down debt. One way to do this is to reduce capex, but they will still need to produce oil to generate cash. As such, there are tentative signs of a recovery in shale output, with Exxon and Chevron among those firms that have reversed “curtailments” in recent weeks. Indeed, late August saw the first meaningful upturn in drilling rigs since March. The number of fracking teams is also rising.
86
88
90
92
94
96
98
100
102
Oil: Total World Demand (m b/d; International Energy Agency)

September 2020
Public
6
Nevertheless, we doubt that this heralds a return to business as usual for shale. WTI has slid back beneath $40/b, and even if it stages a recovery (which seems unlikely given the demand situation) the pressure on shale firms to return more capital to shareholders, rather than just plough it back into drilling activity, is not going to go away.
Prices likely to come under downward pressure as shut-in shale is released
In the near term we think that prices are likely to come under pressure again as more shut-in shale is released and as demand in China and India continues to soften. OPEC Plus discipline will therefore be key, and we think the cartel will need to rethink its planned output increases. This should lend some support to prices and we think that Brent will be back to around $45/b by the end of the year, giving a 2020 average of around $40/b. This is an upward revision to our April forecast, reflecting the fact that the collapse in Q2 demand was not as large as seemed possible at the time.
Firmer demand will lift prices in Q4-20 and 2021, but we see prices remaining below $50/b next year
In 2021 as global economic activity strengthens and stocks continue to be drawn down (even in the face of higher OPEC Plus output) so we expect WTI to push past $45/b. This will spur a revival of shale drilling, but this is likely to be hesitant and patchy, and it may not be until H2-21 before shale makes a meaningful recovery in output. Still, this additional shale production will cap price growth and we expect Brent to average $46/b in 2021.
The main risk is to demand, with the potential for renewed lockdowns across the globe eating into gasoline demand. Additional risk is from the production side, namely the adherence of Iraq and Nigeria—and even the UAE—to pledged cuts, particularly in a context of growing socio-economic pressures. Russia’s production will also need watching given rising popular discontent there.
Longer-term dynamics suggest that prices will struggle to stay above $55/b
The 2022-24 price outlook will be governed in part by an inevitable slump in oil exploration in 2020-21. This lack of investment might well begin to weigh on traders’ minds in 2022, and with stocks also assumed to be much lower, prices could well breach $50/b in 2023. Yet the shift towards greater energy efficiency, and indeed electric vehicles, is not going to go into reverse. And with big, cheap producers (such as Saudi Arabia) keen to monetise their oil, we doubt that prices can be sustained above $55/b for long.
43
54
71
64
4146
5054
51
2016 2017 2018 2019 2020 2021 2022 2023 2024
Oil: Brent($/b; Bloomberg, Samba)
100
200
300
400
500
600
Apr-20 May-20 Jun-20 Jul-20 Aug-20 Sep-20
Oil: US Rotary Rig Count (Baker Hughes)
-
1,000
2,000
3,000
4,000
5,000
-
100
200
300
400
500
9-M
ar
23
-Ma
r
6-A
pr
20-A
pr
4-M
ay
18-M
ay
1-Ju
n
15-J
un
29-J
un
13-J
ul
27-J
ul
10-A
ug
24-A
ug
Covid-19 Cases: India(000's; WHO)
New Cumulative (RHS)

September 2020
Public
7
The Outlook for Saudi Arabia
Background
The economic challenges are serious, but the Kingdom is in a better position than many EMs
Saudi Arabia, like many Emerging Markets, continues to deal with the fallout from the coronavirus pandemic, though it has managed the health threat better than most. In the Kingdom’s case, the main pressure points have been lower oil revenue and the restrictions around movement of goods and people, both of which have dampened domestic consumption. Reduced tourism inflows have also had an impact.
Nevertheless, the Kingdom confronts these headwinds from a comparatively strong position. The government has sizeable savings and net foreign assets are substantial. External debt, while rising, remains low. The local banking system is well-capitalised and liquid, and also has a strong NFA position. This is in contrast to a number of other EMs where reduced export earnings and foreign capital outflows have exposed funding challenges and contributed to exchange rate weaknesses. In addition, the government has boosted nonoil revenue sources, especially by raising the rate of VAT to 15%. This is an important development in terms of long-term nonoil revenue generation.
This is not to downplay the challenges. The economy is facing a deep recession this year, and the government’s fiscal deficit will be large (see below). The pandemic has also checked progress in nascent sectors such as tourism that had been showing great promise, while simultaneously encouraging firms and households to conserve cash. Many SMEs are also struggling, despite the authorities’ best efforts to support them.
Fiscal outlook
Government spending is being reprioritised
The fiscal position is under strain and is likely to remain so for the rest of this year. Results for Q1 and Q2 have now been published, with the latter laying bare the impact of weak oil prices and limited consumption. Oil earnings were down 45% in the second quarter, year-on-year, while the take from taxes on goods and services (essentially VAT and excise duties) fell by 74%. Overall revenue for the quarter was almost half that of a year earlier.
Expenditure also declined. The most striking element was a 4% year-on-year reduction in public sector remuneration in Q2. This is encouraging because getting a grip on public sector wages and
317 294
23
134
243
-109
Revenue Spending Balance
Saudi Arabia: Fiscal Performance (SRbn; MoF)
Q2-19 Q2-20
68
70
72
74
76
78
80
82
84
86
0.0
2.0
4.0
6.0
8.0
10.0
12.0
14.0
16.0
Saudi Arabia: Banks' Capital Adequacy vs Loan-Deposit Ratio (%; SAMA)
CAR LDR (RHS)
As in most countries, Saudi Arabia’s budget and economy are under pressure. But the Kingdom is better-placed than most EMs to deal with the challenges.
-
100
200
300
400
-
10
20
30
40
2-M
ar
16
-Mar
30
-Mar
13
-Ap
r
27
-Ap
r
11
-May
25
-May
8-J
un
22
-Ju
n
6-J
ul
20
-Ju
l
3-A
ug
17
-Au
g
31
-Au
g
Covid-19 Cases: Saudi Arabia(000's; WHO)
New Cumulative (RHS)

September 2020
Public
8
salaries has long been seen as vital – not only for the budget, but also to make private sector employment relatively more attractive (average private sector remuneration was just 63% of public sector pay in Q1). Capital spending took a much bigger hit, down by more than half in the second quarter, or 36% for the first half. Part of this reduction was “natural” owing to Covid-related restrictions on movement, though much would have been deliberate policy. Capital outlays are often reduced when revenues fall (a world-wide phenomenon) while in the Kingdom’s case the Public Investment Fund is increasingly taking up the slack of public sector investment. Spending on procurement is also often reduced when times get tough, though this was not the case in H1: procurement spending leapt by 20%, reflecting mainly the import of medical equipment to combat the coronavirus.
Social benefits, which are primarily Citizens’ Account payments aimed at low and middle-income households, also saw sharp year-on-year falls in the first and second quarters (H1 outlays on this item were down 36%). There are ongoing attempts to “rationalise” the Citizens’ Account, something that the authorities say was underway well before the pandemic. Still, the fall in spending is eye-catching and suggests that great efforts have been made to ensure that those claiming the payments are entitled to them. Finally, military spending fell by 8% in the first half, though it remained slightly over budget.
There was a large budget deficit in H1-20
The net effect of these trends was a deficit of SR143bn in H1, most of which was generated in Q2. Financing was provided by the full mix of domestic and external borrowing and a drawdown of savings, with a more or less even split between these sources.
We hope and expect that Q2 represents the nadir for government finances, and that the second half will see an improvement. Oil prices are expected to grind higher (at least in Q4), and there will also be help from weaker domestic oil consumption (we estimate a 20% downturn).
Nonoil revenue sources have been expanded
The tripling of VAT and higher excise charges will also support the fiscal position. The VAT take took a hammering in Q2 with the impact of restrictions lowering the yield to just SR7bn according to our estimates, from SR22bn in the first quarter. There will clearly be some recovery in H2 as restrictions are eased and pent-up demand is released. Yet households are likely to be cautious (for both physical and financial reasons), and on balance, it seems likely that the VAT yield in 2020 is likely to be much the same as in 2019.
562512
50
326
469
-143Revenue Spending Balance
Saudi Arabia: Fiscal Performance (SRbn; MoF)
H1-19 H1-20
127
166186
256
298
332
2014 2015 2016 2017 2018 2019
Saudi Arabia: Government Nonoil Revenue (SRbn; MoF)
0
50
100
150
200
250
300
350
400
Q3-17 Q4-17 Q1-18 Q2-18 Q3-18 Q4-18 Q1-19 Q2-19 Q3-19 Q4-19 Q1-20 Q2-20
Saudi Arabia: Government Spending (SR bn; MoF)
Current Capital
September 2020
Public
9
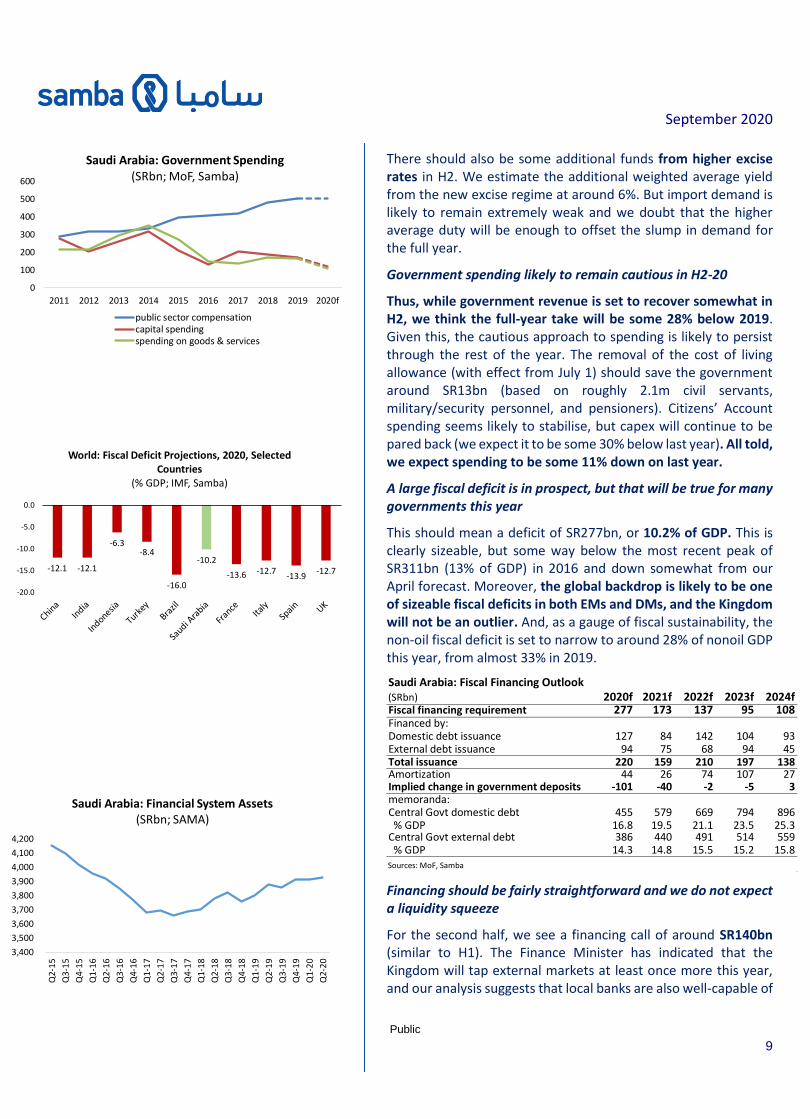
There should also be some additional funds from higher excise rates in H2. We estimate the additional weighted average yield from the new excise regime at around 6%. But import demand is likely to remain extremely weak and we doubt that the higher average duty will be enough to offset the slump in demand for the full year.
Government spending likely to remain cautious in H2-20
Thus, while government revenue is set to recover somewhat in H2, we think the full-year take will be some 28% below 2019. Given this, the cautious approach to spending is likely to persist through the rest of the year. The removal of the cost of living allowance (with effect from July 1) should save the government around SR13bn (based on roughly 2.1m civil servants, military/security personnel, and pensioners). Citizens’ Account spending seems likely to stabilise, but capex will continue to be pared back (we expect it to be some 30% below last year). All told, we expect spending to be some 11% down on last year.
A large fiscal deficit is in prospect, but that will be true for many governments this year
This should mean a deficit of SR277bn, or 10.2% of GDP. This is clearly sizeable, but some way below the most recent peak of SR311bn (13% of GDP) in 2016 and down somewhat from our April forecast. Moreover, the global backdrop is likely to be one of sizeable fiscal deficits in both EMs and DMs, and the Kingdom will not be an outlier. And, as a gauge of fiscal sustainability, the non-oil fiscal deficit is set to narrow to around 28% of nonoil GDP this year, from almost 33% in 2019.
Financing should be fairly straightforward and we do not expect a liquidity squeeze
For the second half, we see a financing call of around SR140bn (similar to H1). The Finance Minister has indicated that the Kingdom will tap external markets at least once more this year, and our analysis suggests that local banks are also well-capable of
Saudi Arabia: Fiscal Financing Outlook(SRbn) 2020f 2021f 2022f 2023f 2024fFiscal financing requirement 277 173 137 95 108Financed by:Domestic debt issuance 127 84 142 104 93External debt issuance 94 75 68 94 45Total issuance 220 159 210 197 138Amortization 44 26 74 107 27Implied change in government deposits -101 -40 -2 -5 3memoranda:Central Govt domestic debt 455 579 669 794 896 % GDP 16.8 19.5 21.1 23.5 25.3Central Govt external debt 386 440 491 514 559 % GDP 14.3 14.8 15.5 15.2 15.8Sources: MoF, Samba
3,400
3,500
3,600
3,700
3,800
3,900
4,000
4,100
4,200
Q2-
15
Q3-
15
Q4-
15
Q1-
16
Q2-
16
Q3-
16
Q4-
16
Q1-
17
Q2-
17
Q3-
17
Q4-
17
Q1-
18
Q2-
18
Q3-
18
Q4-
18
Q1-
19
Q2-
19
Q3-
19
Q4-
19
Q1-
20
Q2-
20
Saudi Arabia: Financial System Assets (SRbn; SAMA)
0
100
200
300
400
500
600
2011 2012 2013 2014 2015 2016 2017 2018 2019 2020f
Saudi Arabia: Government Spending (SRbn; MoF, Samba)
public sector compensationcapital spendingspending on goods & services
-12.1 -12.1
-6.3-8.4
-16.0
-10.2
-13.6 -12.7-13.9
-12.7
-20.0
-15.0
-10.0
-5.0
0.0
World: Fiscal Deficit Projections, 2020, Selected Countries
(% GDP; IMF, Samba)

September 2020
Public
10
absorbing government debt without squeezing out private credit. If one assumes private credit growth of 8% this year, and deposit growth of 4% (and no change to the loan-deposit ceiling of 0.9) then banks would be able to provide some SR85bn of funding to the government (they bought SR41bn of debt in the first half). But even if one assumes that July’s double-digit rate of private sector credit growth is sustained for the rest of the year, banks also have SR135bn in non-KSA government debt securities and SR88bn in repo facilities that they could liquidate if needs be. With SOEs also absorbing some debt—and the recent announcement that non-resident foreigners will be able to buy domestic government debt directly—we do not see the sort of funding tightness this year that characterised 2016.
The fiscal financing outlook should improve over the medium term. We assume that consumer confidence, while brittle, will be a bit firmer in 2021, and consumer spending will edge back up as oil prices shift higher and the Covid-19 restrictions are rolled back. The higher VAT rate will be a headwind for consumption but we expect the government’s VAT and excise take to rise to some SR240bn, around SR100bn higher than the 2020 take. The full-year impact of the cost of living payment’s suspension indicates a further saving of SR9bn compared to 2020. However, population growth means that overall public sector remuneration outlays will still creep up by around 2% (to around SR500bn).
We assume some recovery in capex next year (from a very weak SR120bn in 2020 to SR148bn in 2021) and overall spending is set to rise by just under 7% to around SR1,006bn (still some way below the 2019 figure). We expect a deficit of some SR173bn, or 5.8% of GDP. This is considerably smaller than our April forecast and reflects both the improved oil price assumption and the higher VAT rate.
Banking Sector: Capacity to Absorb Additional Government Debt
SRm Dec-19 Dec-20 % change
Total assets 2,445,050 2,587,170 5.8
Private credit 1,507,725 1,628,343 8.0
Investments 538,828 548,375 1.8
of which, foreign 97,612 100,540 3.0
domestic 441,216 447,834 1.5
Other 398,497 410,452 3.0
Deposits (plus LT debt) 1,830,449 1,903,667 4.0
ADR 1.34 1.36
LDR 0.82 0.86
Space for lending based on LDR limit of 90 84,957
LDR 0.90
ADR 1.40
Include sale of non-KSA govt. debt investments 134,707
Include repos 88,400
TOTAL 308,064
Sources: MoF, Samba
98 9759 49 70
97
-25.8 -12.4 -3.3 -2
142
214260
305
373
470
2015 2016 2017 2018 2019 H1-20
Saudi Arabia Central Government Domestic Debt (SRbn; National Debt Management Centre)
New bonds issued Amortisation Outstanding domestic debt
We think that the banking system is well capable of absorbing additional government debt without squeezing private credit.
-133-277
-165 -137 -95 -108-500
-100
300
700
1100
1500
2019 2020 2021 2022 2023 2024
Saudi Arabia: Fiscal Outlook (SRbn; Ministry of Finance, Samba)
Government revenue Government spending Balance

September 2020
Public
11
Higher VAT rate will help to support long-term fiscal position
Beyond 2021, the higher rate of VAT should bolster government nonoil revenue as the economy continues to shift away from investment and towards consumption. Oil revenue gains are likely to be steady rather than spectacular, and indeed we doubt that oil revenue will reach 2019 levels in the next five years. Spending will therefore need to be well-targeted, and we are fairly confident that there will be no return to the free-spending ways that were a feature of pre-2015 Saudi Arabia. A gradual recovery in capex can be expected, but is only likely to reach 2019 levels by the end of the forecast period (with the PIF taking on a much bigger share). We expect current spending commitments to rise only gradually, though this is premised in part on private sector employment picking up and the state slowly reducing its role in the economy (the basis of the Vision 2030 plan). By 2024 the fiscal deficit should have narrowed to 3.1% of GDP.
We project the total fiscal financing requirement for 2021-24 at SR790bn. We see no financing challenges given sustained monetary accommodation in the US, Eurozone and Japan (with attendant financial repression). By 2022 total central government debt is expected to be around 41% of GDP, with just under two thirds in domestic paper. We think this ratio will appear moderate in a global context, and servicing costs are expected to remain low (around SR15bn in 2024).
Monetary policy and liquidity
Global interest rates set to remain low for long
There is no change to our interest rate outlook compared to our April Outlook. The US Fed has restated its commitment to keep policy rates low and we think that the Fed Funds Target Rate will remain at just 0.25% for the upper bound for an extended period (probably for the forecast period). The reason for this is the outsized build up in US government debt resulting from the pandemic, and the fragility of a highly-levered corporate sector, which underscores the need for a low interest rate environment. The main risk lies with any resurgence of inflation, but we consider the chances of this to be moderate given that inflationary pressures remained subdued despite multiple phases of quantitative easing. In fact, a period of above-target inflation would not necessarily be a bad thing, since it would help to erode debt burdens. Similar policies are likely to be maintained in the Eurozone and Japan.
Saibor has settled down at a very low level
In the Kingdom, the benchmark interbank rate, three month Saibor, has followed policy rates down. We had some concerns that Saibor might diverge from the Reverse Repo rate, as it did
0
0.5
1
1.5
2
2.5
3
Saudi Arabia: Saibor(%, 3 mo.; Bloomberg)
0
5
10
15
20
25
30
35
40
45
2019 2020 2021 2022 2023 2024
Saudi Arabia: Central Government Debt Outlook
(total stock, % GDP; Samba)
Domestic External
-
50
100
150
200
250
300
2018 2019 2020 2021 2022 2023 2024
Saudi Arabia: Government Take from VAT and Excise Duties
(SR bn; MoF, Samba)

September 2020
Public
12
during 2016, but following a short-lived upturn in March and April, Saibor has eased to less than 1 percent. This reflects the authorities’ efforts to mitigate the financial impact on businesses, along with subdued private investment demand (see our April report for a consideration of the authorities’ financial policies).
Other indicators point to macro-financial stability. Deposits are growing by around 9% year-on-year, and while private demand deposits have increased their share of total private deposits, the need to keep cash on hand is understandable in the current climate; in any case the ratio is not out of sync with historical trends. Meanwhile, the authorities have been able to tap external debt markets periodically for large amounts to support net foreign assets, and as noted above local commercial banks have ample liquidity to both absorb government debt and provide adequate private sector credit (which is currently growing at 13%). Foreign views of the Kingdom are broadly sanguine, with the government’s sovereign bond spreads reasonably compressed, and speculation in the currency market also subdued by historical standards.
Domestic economic activity and prices
Reduced central government spending is a challenge for the economy, but PIF investments continue
Our assessment of the domestic economy is broadly unchanged from April. The fundamentals are clearly challenging, with lower oil prices—and hence lower government spending—combining with a hesitant private sector to suppress both investment and consumption. However, investment by the Public Investment Fund is proceeding.
The recent fiscal measures are positive from a budgetary perspective, but they constitute another serious blow to domestic demand. The measures are pro-cyclical (that is, they will accentuate the downturn). The main impact is on household income, which comes in two ways: 1) through the suspension of the cost of living allowance, which on average constitutes some 10% of Saudi nationals’ earnings, and 2) through the increase in VAT, which has also eroded real earnings. The increase in excise duties will also have some impact on prices, but this is less important.
VAT impact varies by retail segment
The impact of the VAT increase varies by retail segment. Most of the increase appears to have been passed on to consumers in the food and beverage sector, while in consumer durables the impact has varied by outlet. In clothing and footwear, most sellers have opted to absorb the additional cost. Discretionary purchases such as cars, appear to have taken the full VAT hit.
72
74
76
78
80
82
84
86
`Saudi Arabia: Private Demand Deposits as a Share of Total Private Deposits
(%; SAMA)
100
120
140
160
180
200
220
6/8 6/15 6/22 6/29 7/6 7/13 7/20 7/27 8/3 8/10 8/17 8/24 8/31
Saudi Arabia: (USD) 10Y vs United States 10Y (basis points; Bloomberg)
35
40
45
50
55
60
De
c-1
8
Jan
-19
Feb
-19
Mar
-19
Ap
r-19
May
-19
Jun
-19
Jul-
19
Au
g-1
9
Sep
-19
Oct
-19
No
v-1
9
De
c-1
9
Jan
-20
Feb
-20
Mar
-20
Ap
r-20
May
-20
Jun
-20
Jul-
20
Au
g-2
0
Saudi Arabia PMI: Output Index (50+ denotes expansion; IHS/Markit)
-10.0
-5.0
0.0
5.0
Saudi Arabia: Public Sector Real Wages(deflated by CPI, % change q-o-q; GASTAT, Samba)
samba forecast
September 2020
Public
13
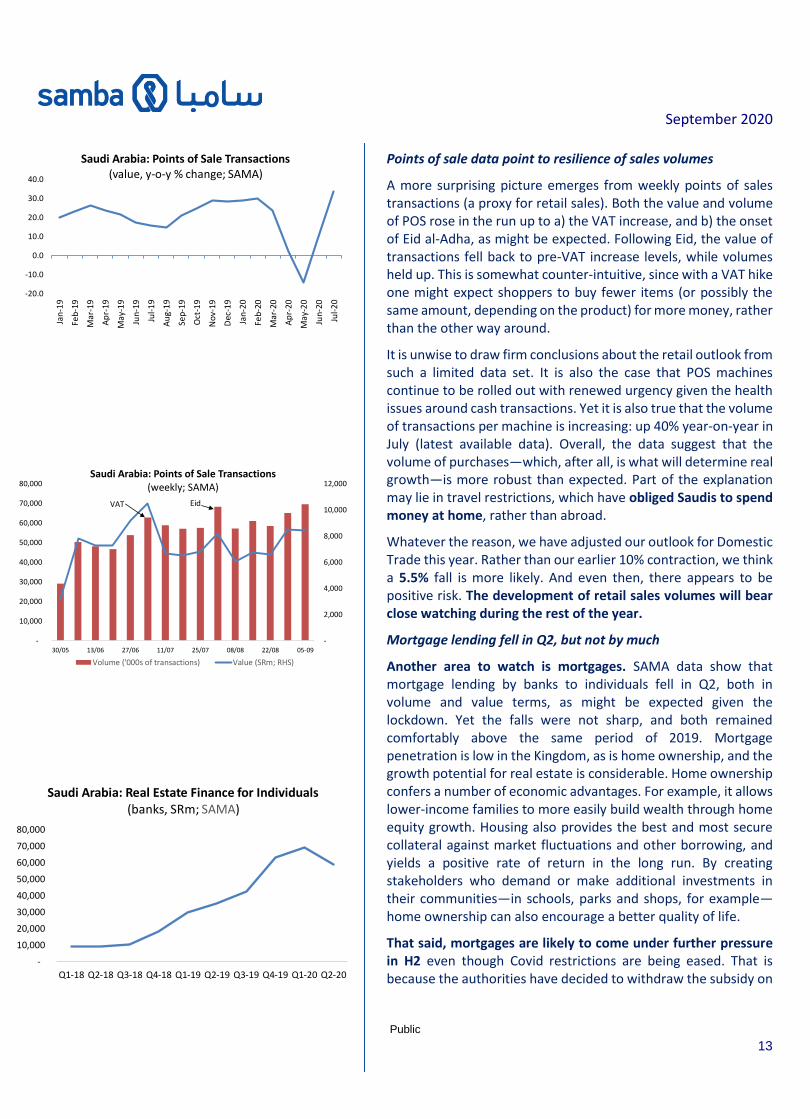
Points of sale data point to resilience of sales volumes
A more surprising picture emerges from weekly points of sales transactions (a proxy for retail sales). Both the value and volume of POS rose in the run up to a) the VAT increase, and b) the onset of Eid al-Adha, as might be expected. Following Eid, the value of transactions fell back to pre-VAT increase levels, while volumes held up. This is somewhat counter-intuitive, since with a VAT hike one might expect shoppers to buy fewer items (or possibly the same amount, depending on the product) for more money, rather than the other way around.
It is unwise to draw firm conclusions about the retail outlook from such a limited data set. It is also the case that POS machines continue to be rolled out with renewed urgency given the health issues around cash transactions. Yet it is also true that the volume of transactions per machine is increasing: up 40% year-on-year in July (latest available data). Overall, the data suggest that the volume of purchases—which, after all, is what will determine real growth—is more robust than expected. Part of the explanation may lie in travel restrictions, which have obliged Saudis to spend money at home, rather than abroad.
Whatever the reason, we have adjusted our outlook for Domestic Trade this year. Rather than our earlier 10% contraction, we think a 5.5% fall is more likely. And even then, there appears to be positive risk. The development of retail sales volumes will bear close watching during the rest of the year.
Mortgage lending fell in Q2, but not by much
Another area to watch is mortgages. SAMA data show that mortgage lending by banks to individuals fell in Q2, both in volume and value terms, as might be expected given the lockdown. Yet the falls were not sharp, and both remained comfortably above the same period of 2019. Mortgage penetration is low in the Kingdom, as is home ownership, and the growth potential for real estate is considerable. Home ownership confers a number of economic advantages. For example, it allows lower-income families to more easily build wealth through home equity growth. Housing also provides the best and most secure collateral against market fluctuations and other borrowing, and yields a positive rate of return in the long run. By creating stakeholders who demand or make additional investments in their communities—in schools, parks and shops, for example—home ownership can also encourage a better quality of life.
That said, mortgages are likely to come under further pressure in H2 even though Covid restrictions are being eased. That is because the authorities have decided to withdraw the subsidy on
-
10,000
20,000
30,000
40,000
50,000
60,000
70,000
80,000
Q1-18 Q2-18 Q3-18 Q4-18 Q1-19 Q2-19 Q3-19 Q4-19 Q1-20 Q2-20
Saudi Arabia: Real Estate Finance for Individuals (banks, SRm; SAMA)
-20.0
-10.0
0.0
10.0
20.0
30.0
40.0
Jan
-19
Feb
-19
Mar
-19
Ap
r-19
May
-19
Jun
-19
Jul-
19
Au
g-1
9
Sep
-19
Oct
-19
No
v-19
Dec
-19
Jan
-20
Feb
-20
Mar
-20
Ap
r-20
May
-20
Jun
-20
Jul-
20
Saudi Arabia: Points of Sale Transactions (value, y-o-y % change; SAMA)
-
2,000
4,000
6,000
8,000
10,000
12,000
-
10,000
20,000
30,000
40,000
50,000
60,000
70,000
80,000
30/05 13/06 27/06 11/07 25/07 08/08 22/08 05-09
Saudi Arabia: Points of Sale Transactions (weekly; SAMA)
Volume ('000s of transactions) Value (SRm; RHS)
VAT Eid

September 2020
Public
14
down-payments for certain customers, while simultaneously introducing interest rate caps on subsidised mortgages. These subsidies (along with pent-up demand) were the main driver of mortgage growth. There is still a good growth story around home ownership: the Vision 2030 target is for homeownership of 70%, from the current 62%. And subsidies could well be re-introduced if budgetary conditions allow. But for now, they have been deemed too expensive.
We still think that there was enough first half momentum in mortgages—and private credit growth—to suggest that the Finance sector will see positive growth this year of about 1%.
PIF spending to support a weak Contracting sector
The H1 build-up in mortgage demand has not, so far at least, had much positive impact on the Construction sector. Imports of building materials have slid back into negative territory (down 41% in July, year-on-year). Naturally, the sector has been hit hard by the Covid-related restrictions, as well as a more general scaling back of central government investment. Reduced investment by Saudi Aramco constitutes a further headwind, particularly for the ecosystem of firms in the Eastern Province. The main positive is that the so-called giga-projects that are being developed by the PIF are proceeding as planned. These include the Qiddiya entertainment complex near Riyadh, the Red Sea tourism development, and the Neom city project in the north west of the country. Qiddiya recently awarded a contract for roads and bridges—one of about $2.6bn in contracts planned for this year, and there has recently been an upturn in local cements sales (26% year-on-year growth in July).
Both Qiddiya and the Red Sea project are due to be completed in 2023. These projects will provide some underpinning to the Construction sector, but this year is likely to be a tough one. We expect a real-terms contraction of 6%.
One “wildcard” in the GDP equation is Government Services. This happens to be the largest element of nonoil GDP, accounting for 23% last year, and is also one of the hardest to predict. Government Services is not the same as government current spending, but theoretically it should move in tandem with current spending. However, Government Services’ contribution to GDP has increased even when current spending has been cut, such as in 2015 and 2016. Thus, even though we are expecting government current spending to fall this year, we are reluctant to assume the same of Government Services, and have instead projected it to remain flat.
-80
-60
-40
-20
0
20
40
60
80
Saudi Arabia: Private Sector Imports of Building Materials
(new letters of credit, value, y-o-y, 3 mo rolling avg; SAMA)
-90%-60%-30%0%30%60%90%
-
2,000
4,000
6,000
Jan
-15
Ap
r-15
Jul-
15
Oct
-15
Jan
-16
Ap
r-16
Jul-
16
Oct
-16
Jan
-17
Ap
r-17
Jul-
17
Oct
-17
Jan
-18
Ap
r-18
Jul-
18
Oct
-18
Jan
-19
Ap
r-19
Jul-
19
Oct
-19
Jan
-20
Ap
r-20
Jul-
20
Saudi Arabia: Monthly Cement Sales('000 tonnes; Yamama Cement Co.)
Sales Volume YoY Chg (RHS)
-6.0 -5.5-4.0
1.1
-10.0
-5.0
0.0
5.0
10.0
2015 2016 2017 2018 2019 2020f
Saudi Arabia: Real GDP by Sector(% change, 2010 prices; GASTAT, Samba)
Construction Trade Petrochemicals Finance
-10.0
0.0
10.0
20.0
30.0
40.0
-4.0
-2.0
0.0
2.0
4.0
6.0
Q1-17 Q3-17 Q1-18 Q3-18 Q1-19 Q3-19 Q1-20
Saudi Arabia: Government Services (GDP) vs Current Spending
(y-o-y % change; MoF, GASTAT)
Government services Current spending (RHS)
September 2020
Public
15
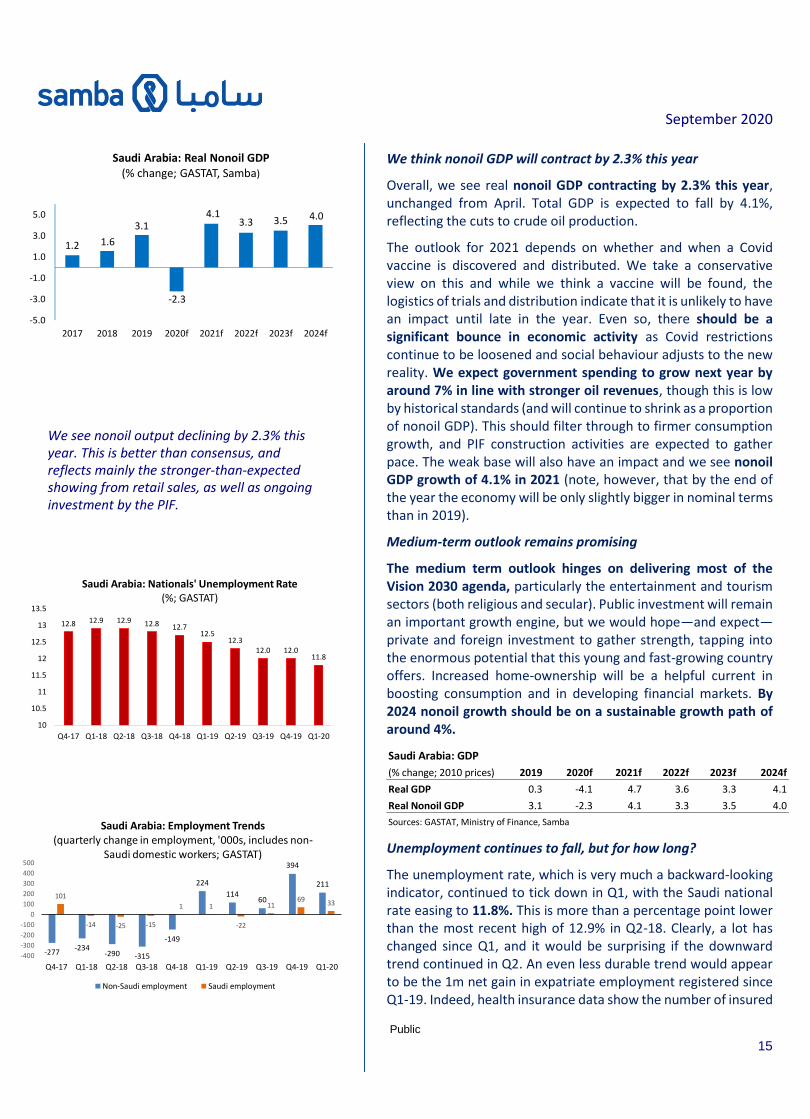
We think nonoil GDP will contract by 2.3% this year
Overall, we see real nonoil GDP contracting by 2.3% this year, unchanged from April. Total GDP is expected to fall by 4.1%, reflecting the cuts to crude oil production.
The outlook for 2021 depends on whether and when a Covid vaccine is discovered and distributed. We take a conservative view on this and while we think a vaccine will be found, the logistics of trials and distribution indicate that it is unlikely to have an impact until late in the year. Even so, there should be a significant bounce in economic activity as Covid restrictions continue to be loosened and social behaviour adjusts to the new reality. We expect government spending to grow next year by around 7% in line with stronger oil revenues, though this is low by historical standards (and will continue to shrink as a proportion of nonoil GDP). This should filter through to firmer consumption growth, and PIF construction activities are expected to gather pace. The weak base will also have an impact and we see nonoil GDP growth of 4.1% in 2021 (note, however, that by the end of the year the economy will be only slightly bigger in nominal terms than in 2019).
Medium-term outlook remains promising
The medium term outlook hinges on delivering most of the Vision 2030 agenda, particularly the entertainment and tourism sectors (both religious and secular). Public investment will remain an important growth engine, but we would hope—and expect—private and foreign investment to gather strength, tapping into the enormous potential that this young and fast-growing country offers. Increased home-ownership will be a helpful current in boosting consumption and in developing financial markets. By 2024 nonoil growth should be on a sustainable growth path of around 4%.
Unemployment continues to fall, but for how long?
The unemployment rate, which is very much a backward-looking indicator, continued to tick down in Q1, with the Saudi national rate easing to 11.8%. This is more than a percentage point lower than the most recent high of 12.9% in Q2-18. Clearly, a lot has changed since Q1, and it would be surprising if the downward trend continued in Q2. An even less durable trend would appear to be the 1m net gain in expatriate employment registered since Q1-19. Indeed, health insurance data show the number of insured
Saudi Arabia: GDP
(% change; 2010 prices) 2019 2020f 2021f 2022f 2023f 2024f
Real GDP 0.3 -4.1 4.7 3.6 3.3 4.1
Real Nonoil GDP 3.1 -2.3 4.1 3.3 3.5 4.0
Sources: GASTAT, Ministry of Finance, Samba
We see nonoil output declining by 2.3% this year. This is better than consensus, and reflects mainly the stronger-than-expected showing from retail sales, as well as ongoing investment by the PIF.
1.2 1.6
3.1
-2.3
4.13.3 3.5 4.0
-5.0
-3.0
-1.0
1.0
3.0
5.0
2017 2018 2019 2020f 2021f 2022f 2023f 2024f
Saudi Arabia: Real Nonoil GDP (% change; GASTAT, Samba)
-277-234
-290 -315
-149
224
11460
394
211
101
-14 -25 -15
1 1
-22
1169 33
-400
-300
-200
-100
0
100
200
300
400
500
Q4-17 Q1-18 Q2-18 Q3-18 Q4-18 Q1-19 Q2-19 Q3-19 Q4-19 Q1-20
Saudi Arabia: Employment Trends (quarterly change in employment, '000s, includes non-
Saudi domestic workers; GASTAT)
Non-Saudi employment Saudi employment
12.8 12.9 12.9 12.8 12.712.5
12.312.0 12.0
11.8
10
10.5
11
11.5
12
12.5
13
13.5
Q4-17 Q1-18 Q2-18 Q3-18 Q4-18 Q1-19 Q2-19 Q3-19 Q4-19 Q1-20
Saudi Arabia: Nationals' Unemployment Rate (%; GASTAT)

September 2020
Public
16
expatriates falling by a substantial 700,000 in H1, virtually all of which occurred in Q2.
Inflation spikes in July in line with VAT increase
Inflationary pressures have spiked up in line with the tripling of VAT on July 1. Official data show consumer price inflation rising to 6.1% year-on-year in July, from just 0.5% in June. The month-on-month change was 5.9%. The latter indicates that not all of the VAT increase has been passed on to consumers. In general, food and beverage prices have risen broadly in line with the VAT rise, while clothing and consumer durables have not –see above.
There had been month-on-month deflation in the three months prior to July, and we expect this trend to resume in the final months of the year. However, at the moment, the effects of the price rise are still rippling through the economy, with PMI input and output prices for the nonoil sector rising at a record rate in August.
In broad terms, the economy has plenty of excess capacity, and the exodus of many expatriates this year will also suppress demand. This is visible in the rental component of the CPI which has declined steadily throughout the year. Thus, while we expect average consumer price inflation to spike up to 4.4% this year, this largely reflects the VAT increase; absent that, and inflation would have been sub-0.5%. Month-on-month inflation can be expected to resume in 2021 as domestic demand begins to firm, but with VAT falling out of the comparison in mid-year, the annual rate is likely to ease to under 4%. A return to 2% inflation seems the most likely medium-term path.
Residential and commercial real estate prices diverge
In terms of asset prices, there is a divergence between residential and commercial property. Residential prices, while still weak in historical terms, have been supported by the burgeoning mortgage market. This contrasts with the commercial sector, which is suffering from over-capacity and generally weak trading conditions.
Saudi Arabia: Consumer Prices
(2018=100) 2019 2020f 2021f 2022f 2023f 2024f
General index 97.9 102.2 106.2 108.2 110.3 112.6
% change -2.1 4.4 3.8 1.9 2.0 2.0
Sources: General Authority for Statistics, Samba.
45
50
55
60
Saudi Arabia: PMI - Input Prices vs Output Prices
(50+ denotes increase, Markit)
Input prices Output prices
-16.0
-12.0
-8.0
-4.0
0.0
4.0
Saudi Arabia: Real Estate Price Indices (national averages, y-o-y % change; GASTAT)
Residential Commercial
-6.0
-4.0
-2.0
0.0
2.0
4.0
6.0
8.0
10.0
Saudi Arabia: Consumer Prices (y-o-y % change; GASTAT, Samba)

September 2020
Public
17
External sector
Visible trade balance under pressure
The current account is under some pressure, and is likely to return a deficit this year, albeit small. The main pressure point is visible trade, where the oil price correction and reduced crude output have taken a heavy toll on export earnings. Trade data show that monthly export earnings collapsed from an average $19bn in the first quarter, to just $10.4bn in the second quarter. Import spending has also adjusted, but not by enough to stave off a small trade deficit in April, the first in many years. Although the position shifted back to surplus in May, a further, slightly larger deficit was recorded in June as import spending unexpectedly rebounded.
We expect to see import spending falling again before long (accentuated by a weaker USD) and with a gradual recovery in oil export earnings in prospect, a full-year visible trade surplus is not in doubt. Yet it is likely to be much reduced, at around $65bn (half last year’s level).
The question is whether this is enough to offset outflows on the invisibles account. Weaker demand for services will be helpful, but the wildcard on the invisibles account is remittances flows. There was an unexpected upturn in these outflows in Q1, which correlated with an equally unexpected gain in expatriate employment (more than 200,000). We expect this trend to have reversed during the lockdown-affected second quarter, and it seems likely that expatriate outflows will be the theme for the rest of the year. Nevertheless, this might not automatically mean a collapse in remittances outflows, since departing foreigners will no doubt take savings with them (though such flows should technically be recorded on the financial account). Thus, while we see weaker remittances outflows in 2020, we think the decline will be modest, at around 2%.
Current account set to record small deficit
This means that the current account is likely to record a small deficit in 2020—we think around $5bn or 0.7% of GDP. This is not a material amount, but the fact that a deficit is expected is indicative of the deterioration in the country’s terms of trade (a 9%/GDP surplus was recorded as recently as 2018). The current account should return to balance next year: higher oil export earnings should outstrip any recovery in import spending given fragile household confidence, while expatriates are unlikely to return to the Kingdom in any great numbers.
In the medium term, oil export earnings are expected to rise as the Kingdom seeks to boost output and monetise its oil reserves.
-10.0
-5.0
0.0
5.0
10.0
15.0
-400
-200
0
200
400
600
Saudi Arabia: Workers' Remittances vs Non-Saudi Employment
(quarterly change; SAMA, GASTAT)
Non-Saudi Employment Workers' remittances outflows (RHS)
-120.0
-80.0
-40.0
0.0
40.0
2014 2015 2016 2017 2018 2019 2020f
Saudi Arabia: Current Account vs Fiscal (SRbn; SAMA, Samba)
fiscal balance current account balance
-1500
500
2500
4500
6500
8500
10500
12500
Jun
-19
Jul-
19
Au
g-1
9
Sep
-19
Oct
-19
No
v-19
Dec
-19
Jan
-20
Feb
-20
Mar
-20
Ap
r-20
May
-20
Jun
-20
Saudi Arabia: Visible Trade Balance($m; GASTAT)
September 2020
Public
18
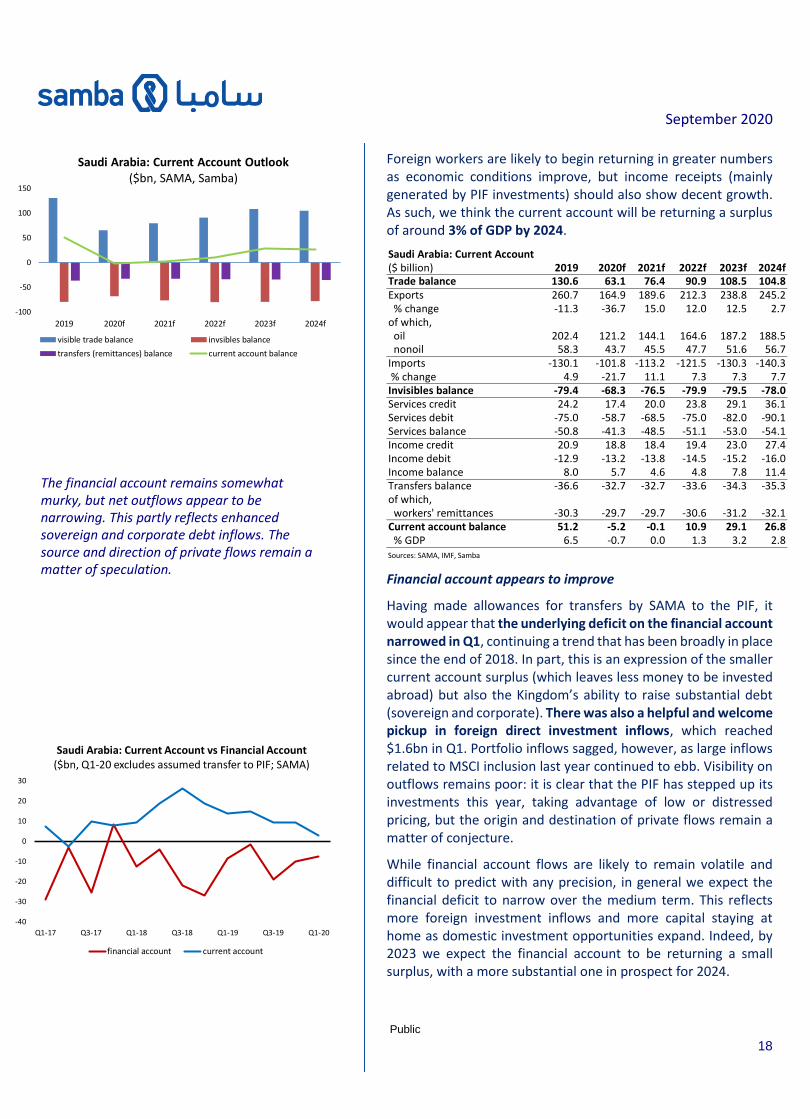
Foreign workers are likely to begin returning in greater numbers as economic conditions improve, but income receipts (mainly generated by PIF investments) should also show decent growth. As such, we think the current account will be returning a surplus of around 3% of GDP by 2024.
Financial account appears to improve
Having made allowances for transfers by SAMA to the PIF, it would appear that the underlying deficit on the financial account narrowed in Q1, continuing a trend that has been broadly in place since the end of 2018. In part, this is an expression of the smaller current account surplus (which leaves less money to be invested abroad) but also the Kingdom’s ability to raise substantial debt (sovereign and corporate). There was also a helpful and welcome pickup in foreign direct investment inflows, which reached $1.6bn in Q1. Portfolio inflows sagged, however, as large inflows related to MSCI inclusion last year continued to ebb. Visibility on outflows remains poor: it is clear that the PIF has stepped up its investments this year, taking advantage of low or distressed pricing, but the origin and destination of private flows remain a matter of conjecture.
While financial account flows are likely to remain volatile and difficult to predict with any precision, in general we expect the financial deficit to narrow over the medium term. This reflects more foreign investment inflows and more capital staying at home as domestic investment opportunities expand. Indeed, by 2023 we expect the financial account to be returning a small surplus, with a more substantial one in prospect for 2024.
Saudi Arabia: Current Account($ billion) 2019 2020f 2021f 2022f 2023f 2024fTrade balance 130.6 63.1 76.4 90.9 108.5 104.8Exports 260.7 164.9 189.6 212.3 238.8 245.2 % change -11.3 -36.7 15.0 12.0 12.5 2.7of which, oil 202.4 121.2 144.1 164.6 187.2 188.5 nonoil 58.3 43.7 45.5 47.7 51.6 56.7Imports -130.1 -101.8 -113.2 -121.5 -130.3 -140.3 % change 4.9 -21.7 11.1 7.3 7.3 7.7Invisibles balance -79.4 -68.3 -76.5 -79.9 -79.5 -78.0Services credit 24.2 17.4 20.0 23.8 29.1 36.1Services debit -75.0 -58.7 -68.5 -75.0 -82.0 -90.1Services balance -50.8 -41.3 -48.5 -51.1 -53.0 -54.1Income credit 20.9 18.8 18.4 19.4 23.0 27.4Income debit -12.9 -13.2 -13.8 -14.5 -15.2 -16.0Income balance 8.0 5.7 4.6 4.8 7.8 11.4Transfers balance -36.6 -32.7 -32.7 -33.6 -34.3 -35.3of which, workers' remittances -30.3 -29.7 -29.7 -30.6 -31.2 -32.1Current account balance 51.2 -5.2 -0.1 10.9 29.1 26.8 % GDP 6.5 -0.7 0.0 1.3 3.2 2.8Sources: SAMA, IMF, Samba
-40
-30
-20
-10
0
10
20
30
Q1-17 Q3-17 Q1-18 Q3-18 Q1-19 Q3-19 Q1-20
Saudi Arabia: Current Account vs Financial Account($bn, Q1-20 excludes assumed transfer to PIF; SAMA)
financial account current account
The financial account remains somewhat murky, but net outflows appear to be narrowing. This partly reflects enhanced sovereign and corporate debt inflows. The source and direction of private flows remain a matter of speculation.
-100
-50
0
50
100
150
2019 2020f 2021f 2022f 2023f 2024f
Saudi Arabia: Current Account Outlook ($bn, SAMA, Samba)
visible trade balance invsibles balance
transfers (remittances) balance current account balance

September 2020
Public
19
s
Official NFA set to fall to around $445bn in 2021
Official net foreign assets are set to dip this year, to about $463bn, partly reflecting transfers to the PIF. Sovereign debt inflows are likely to be substantial given the size of the fiscal deficit, but the government will also draw on its savings to bridge the gap, and much of this will create a draw on forex reserves. There should be a much smaller fiscal deficit in 2021, but this in turn will mean weaker debt inflows, and we think there will be a further draw on forex reserves to about $437bn (55% of GDP or 46 months of import cover). From there, with the fiscal deficit continuing to narrow, the current account back in surplus, and foreign investment inflows gaining traction, reserves should grow again. By 2024 we expect NFA to be around $535bn (57% of GDP).
SAR peg to be comfortably defended
There has been some pressure on the SAR-USD peg, but this has been mild by historical standards, and has eased in recent months as oil prices have stabilised. There could well be further bouts of pressure, depending on fiscal and current account data releases as the year progresses, but we are confident that the authorities will successfully defend the peg: official forex reserves might continue to ease, but the country’s overall net investment position has other liquid assets, most of which are in public hands. These could be mobilised to defend the peg if needed.
Saudi Arabia: Balance of Payments($ billion) 2019 2020f 2021f 2022f 2023f 2024fCurrent account balance 51.2 -5.2 -0.1 10.9 29.1 26.8Direct investment -8.6 -4.6 4.9 4.8 5.7 7.6Abroad (net) -13.2 -10.6 -2.1 -2.2 -2.3 -2.4in KSA (net) 4.6 6.0 7.0 7.0 8.0 10.0Portfolio investment 12.7 40.6 14.3 16.6 13.3 24.2Abroad (net) -33.5 -13.4 -12.1 -10.9 -9.8 -8.8in KSA (net)* 46.2 54.0 26.4 27.5 23.1 33.0Other investment -46.8 -64.6 -44.3 -23.0 -10.9 -7.8Abroad (net) -67.0 -64.6 -48.3 -30.0 -19.9 -18.8in KSA (net) 20.2 0.0 4.0 7.0 9.0 11.0Financial account balance -42.7 -28.6 -25.1 -1.6 8.0 24.0Net errors and omissions -1.8 0.0 0.0 0.0 0.0 0.0Overall balance 6.7 -33.8 -25.1 9.3 37.1 50.8Change in reserves (- = increase) -6.7 33.8 25.1 -9.3 -37.1 -50.8Official NFA ($bn) 496.3 462.5 437.4 446.7 483.8 534.6
percent GDP 62.6 64.1 55.2 52.8 53.6 56.7
import cover (months) 45.8 54.5 46.4 44.1 44.6 45.7
* includes sov and corp debt inflows
Sources: SAMA, IMF, Samba
-
200
400
600
800
1,000
1,200
1,400
2014 2015 2016 2017 2018 2019 Mar-20
Saudi Arabia: Gross International Investments($bn, end period; SAMA)
Portfolio Currency & deposits Reserve assets Other
0
100
200
300
400
500
600
-60
-40
-20
0
20
40
60
2019 2020f 2021f 2022f 2023f 2024f
Saudi Arabia: Balance of Payments and NFA Outlook ($bn; SAMA, Samba)
Current account balance Financial account balance
Offical NFA (rhs)
Official net foreign assets are expected to fall to around 55% of GDP next year. But the government can call on other liquid foreign assets and we are confident that the exchange rate peg will be successfully defended.

September 2020
PUBLIC
20
Saudi Arabia: Baseline Macroeconomic Forecast 2019 2020f 2021f 2022f 2023f 2024f
Nominal GDP ($ bn) 793 722 793 847 902 942
GDP per capita ($) 23,805 21,896 23,412 24,362 25,295 25,766
Real GDP (% change) 0.3 -4.1 4.7 3.6 3.3 4.1
Hydrocarbon GDP -3.3 -7.2 5.7 4.0 3.0 4.3
Non-hydrocarbon GDP 3.1 -2.3 4.1 3.3 3.5 4.0
Money supply, M3 (SR bn) 1985 2064 2147 2233 2344 2485
% change 7.1 4.0 4.0 4.0 5.0 6.0
Commercial bank loans to private sector (SR bn) 1478 1552 1645 1744 1866 2015
% change 8.2 5.0 6.0 6.0 7.0 8.0
3 month interbank rate (end year, %) 2.3 0.7 0.9 1.1 1.3 1.5
CPI inflation (% change, average) -2.1 4.4 3.8 1.9 2.0 2.0
Hydrocarbon exports ($ bn) 202.4 121.2 144.1 164.6 187.2 188.5
% change -12.6 -40.1 18.9 14.2 13.8 0.7
Current account balance ($ bn) 51.2 -5.2 -0.1 10.9 29.1 26.8
(% GDP) 6.5 -0.7 0.0 1.3 3.2 2.8
Fiscal revenue (SR bn) 926.0 664.4 833.0 911.7 996.7 1023.2
(% change) 2.2 -28.3 25.4 9.4 9.3 2.7
Fiscal spending (SR bn) 1059.0 941.7 1006.4 1048.8 1092.2 1131.2 (% change) -1.9 -11.1 6.9 4.2 4.1 3.6
of which, capital 172.0 120.4 148.1 158.5 171.1 178.0
(% change) -8.5 -30.0 23.0 7.0 8.0 4.0
current 887.0 821.3 858.3 890.4 921.0 953.2 (% change) 1.4 -7.4 4.5 3.7 3.4 3.5Fiscal balance (SR bn) -133.0 -277.3 -173.4 -137.1 -95.4 -108.0 (% GDP) -4.5 -10.2 -5.8 -4.3 -2.8 -3.1Public sector gross deposits with banking system (SR bn) 622.9 522.0 481.9 480.4 475.5 478.8
(% GDP) 20.9 19.3 16.2 15.1 14.1 13.5
Other public sector domestic deposits (SR bn) 1306.8 1306.8 1306.8 1306.8 1306.8 1306.8 (% GDP) 43.9 48.3 43.9 41.2 38.6 37.0
Total public sector gross deposits with banking system (SR bn) 1929.7 1828.8 1788.7 1787.2 1782.3 1785.6 (% GDP) 64.9 67.5 60.2 56.3 52.7 50.5Total public sector net deposits with banking system (SR bn) 1508.6 1323.5 1160.6 1069.5 940.3 842.0 (% GDP) 50.7 48.9 39.0 33.7 27.8 23.8Memoranda:
Oil price (Brent; $/barrel) 64 40 46 50 54 51
Crude oil production ('000 b/d) 9,897 9,188 9,708 10,100 10,400 10,850 Official net foreign assets ($ bn) 496.3 462.5 437.4 446.7 483.8 534.6 (% GDP) 62.6 64.1 55.2 52.8 53.6 56.7
Central government domestic debt (SR bn) 370.7 455.4 578.7 668.7 793.5 895.6
(% GDP) 12.5 16.8 19.5 21.1 23.5 25.3 Central government external debt ($ bn) 78.0 103.0 117.4 130.9 136.9 148.9 (% GDP) 9.8 14.3 14.8 15.5 15.2 15.8Sources: SAMA, Ministry of Finance, General Statistics Authority, IMF, Samba.

September 2020
Public
PUBLIC
21
Disclaimer This publication is based on information generally available to the public from sources believed to be reliable and up to date at the time of publication. However, SAMBA is unable to accept any liability whatsoever for the accuracy or completeness of its contents or for the consequences of any reliance which may be place upon the information it contains. Additionally, the information and opinions contained herein: 1. Are not intended to be a complete or comprehensive study or to
provide advice and should not be treated as a substitute for specific advice and due diligence concerning individual situations;
2. Are not intended to constitute any solicitation to buy or sell any instrument or engage in any trading strategy; and/or
3. Are not intended to constitute a guarantee of future performance. Accordingly, no representation or warranty is made or implied, in fact or in law, including but not limited to the implied warranties of merchantability and fitness for a particular purpose notwithstanding the form (e.g., contract, negligence or otherwise), in which any legal or equitable action may be brought against SAMBA. Samba Financial Group P.O. Box 833, Riyadh 11421, Saudi Arabia