Migration Macroeconomic Survey; Prioritisation of Sectors
34
Migration Macroeconomic Survey; Prioritisation of Sectors November 2018
-
Upload
khangminh22 -
Category
Documents
-
view
1 -
download
0
Transcript of Migration Macroeconomic Survey; Prioritisation of Sectors
Migration Macroeconomic Survey; Prioritisation of Sectors
November 2018
DISCLAIMER
Nepal Skills for Employment Programme is funded by UK aid from the British government; however the views expressed in this report do not necessarily reflect the UK government’s official Policies. This report, including any attachments hereto, may contain privileged and/or confidential information and is intended solely for the attention and use of the intended addressee(s). If you are not the intended addressee, you may neither use, copy, nor deliver to anyone this report or any of its attachments. In such case, you should immediately destroy this report and its attachments and kindly notify Louis Berger. Unless made by a person with actual authority, the information and statements herein do not constitute a binding commitment or warranty by Louis Berger. Louis Berger assumes no responsibility for any misperceptions, errors or misunderstandings. You are urged to verify any information that is confusing and report any errors/concerns to us in writing.
Contents 1. Market Failures and migration .............................................................................................................. 3
2. Macroeconomic survey ......................................................................................................................... 4
2.1 Poverty ........................................................................................................................................... 4
2.2 Poverty and Gender ...................................................................................................................... 4
2.3 Domestic and foreign employment wages and economic sectors............................................ 5
2.4 Disadvantaged groups (DAG) ...................................................................................................... 7
2.5 Literacy, poverty, skill mismatch and migration. ......................................................................... 7
2.6 The absence of a favourable investment environment. ............................................................. 8
2.7 The economic importance of migration and remittances ........................................................ 10
Source: DoFE, MoLESS, World Bank reworked by author. ................................................................... 11
2.8 Productive use of remittances .................................................................................................... 11
3. Nepal Migration characteristics and Corridors .................................................................................. 15
3.1 Destination countries, most frequent migration corridors. ...................................................... 15
3.2 Destination countries and women migration ............................................................................ 15
3.3 Migration by skills and sectors ................................................................................................... 16
3.4 Migration by province ................................................................................................................. 18
3.5 New migration corridors, G2G strategy .................................................................................... 18
3.6 India -Nepal corridor .................................................................................................................. 21
4. M4P and migration .............................................................................................................................. 23
4.1 market system important to the poor ........................................................................................ 23
4.2 How is migration working for the migrants? ............................................................................. 23
4.3 Market Failures affecting migration and points of intervention ............................................... 23
Caveats ................................................................................................................................................. 25
5. Conclusions .......................................................................................................................................... 27

Acronyms CBS Central Bureau of Statistics CP Colombo Process CSR Corporate Social Responsibility CTEVT Council for Technical Education and Vocational Training DAO District Administration Office DAG Disadvantaged groups DFID Department for International Development DoFE Department of Foreign Employment EPS Employment Permit System EWHA Ewha Woman’s University FEA Foreign Employment Act FEP Foreign Employment Policy FET Foreign Employment Tribunal FEPB Foreign Employment Promotion Board GAMCA Gulf Cooperation Council Approved Medical Centres Association GCC Gulf Cooperation Council (including Bahrain, Kuwait, Oman, Qatar, Saudi Arabia and
the United Arab Emirates) GDP Gross Domestic Product GoN Government of Nepal G2G Government to government HORECA Hotel Restaurant Café sectors IASCI International Agency for Source Country Information ICC Information and Counselling Centres IIDS Institute for Integrated Development Studies ILO International Labour Organization INGO International Nongovernmental Organization IOM International Organization for Migration JITCO Japan International Training Cooperation Organization KOIKA Korea International Cooperation Agency LTM Long term migrant M4P Making Markets Work for the Poor MoFA Ministry of Foreign Affairs MoLESS Ministry of Labour, Employment and Social Security MoU Memorandum of Understanding MRC Migrant Resource Centre NLSS Nepal Living Standard Survey NRB Nepal Rastra Bank (central bank of Nepal) NRNA Non- resident Nepali Association NAFEA Nepal Association of Foreign Employment agencies NPR Nepalese Rupee PDO Pre-departure Orientation PNCC Pravasi Nepali Coordination Committee RAs Recruitment Agencies SAARC South Asian Association for Regional Cooperation SDG Sustainable Development Goals
सीप Skills for Employment Program UN United Nations VDC Village Development Committee VET Vocational education and training MWWF Migrant Workers’ Welfare Fund
Executive Summary
DFID has designed the Nepal Skills for Employment Programme (सीप) and has competitively selected Louis Berger, Inc., a global consulting firm, to deliver the £17 million technical assistance project to better train and place Nepalese in both domestic and international jobs. By primarily using a Challenge
Fund mechanism, सीप will partner with the private sector to bring in innovative training models to address market failures and key skill gaps while also leveraging private sector resources. Models will focus on solutions for training and job placement in the ICT, tourism, commercial agriculture, light manufacturing, and hydropower sectors, all of which are key economic drivers for Nepal.
The migration piece of सीप will focus on harnessing the benefits of migration for Nepal’s workforce and
economic development. सीप will demonstrate a number of cost-effective models to increase migrants’ skills and incomes; lower financing and other costs of travelling abroad; and, increase savings and
investment of remittances. Cross-cutting will be financial literacy. सीप will work in tandem with efforts by the International Labour Organization (ILO) and other key counterparts in Nepal and Asia, which depends heavily on Nepali migrants. As a result, the project will help reduce the skills mismatch, reaching over 90,000 (45,000 from the Skills Strengthening Component and 45,000 from the Migration Component) Nepalese with an increase in income attributed to the project (see figure 1). Through more productive and equitable vocational skills and functional migration systems, the project’s recipients should be gainfully employed abroad or in Nepal, with higher wages, improved working conditions and higher living standards. Persons with disability (PWD) will also be covered though as we write, their access to foreign employment is totally precluded. Figure1. Migration Component Beneficiaries
Beneficiaries Women Men
45,000 33.33% 66.66%
15,000 30,000
Of which 40%DAG 6,000 12,000
Total DAG 18,000
Source: सीप ToR migration component reworked by MEL
In an earlier report (Stakeholder Mapping), UKaid सीप found several gaps and inefficiencies while mapping the various stakeholders intervening in the migration process which lead to market failure. These have a direct negative contribution to the overall cost a Nepali migrant has to pay when looking for an employment abroad. Following a “Making Markets Work for the Poor” (M4P) approach, this report has undertaken a closer look at the market failures negatively affecting migration and to what extent these failures are part of the push factors of Nepal’s migration. Through this work, we have endeavoured to locate
geographically सीप’s recipients, describe and understand their socio-economical background, their needs and to what extent the latter are not satisfied. We have described how Nepali workers have been using foreign employment as one solution in addressing the issues they have confronted with and give some depth to our analysis by comparing first-time migrants’ experience with medium to long term migrants’. Returnees are also confronted with difficulties when they want to reintegrate into Nepal’s economy. The lack of managerial knowhow, access to credit, conducive economic environment affects their willingness to invest their savings in productive ways. Finally, we have looked look at the new migration corridors, the new migration destinations promoted through MOUs, G2G agreements and the recruitment agencies. This report understands targeted beneficiaries needs, how market failures have been affecting them and which solutions we can recommend within a M4P framework.
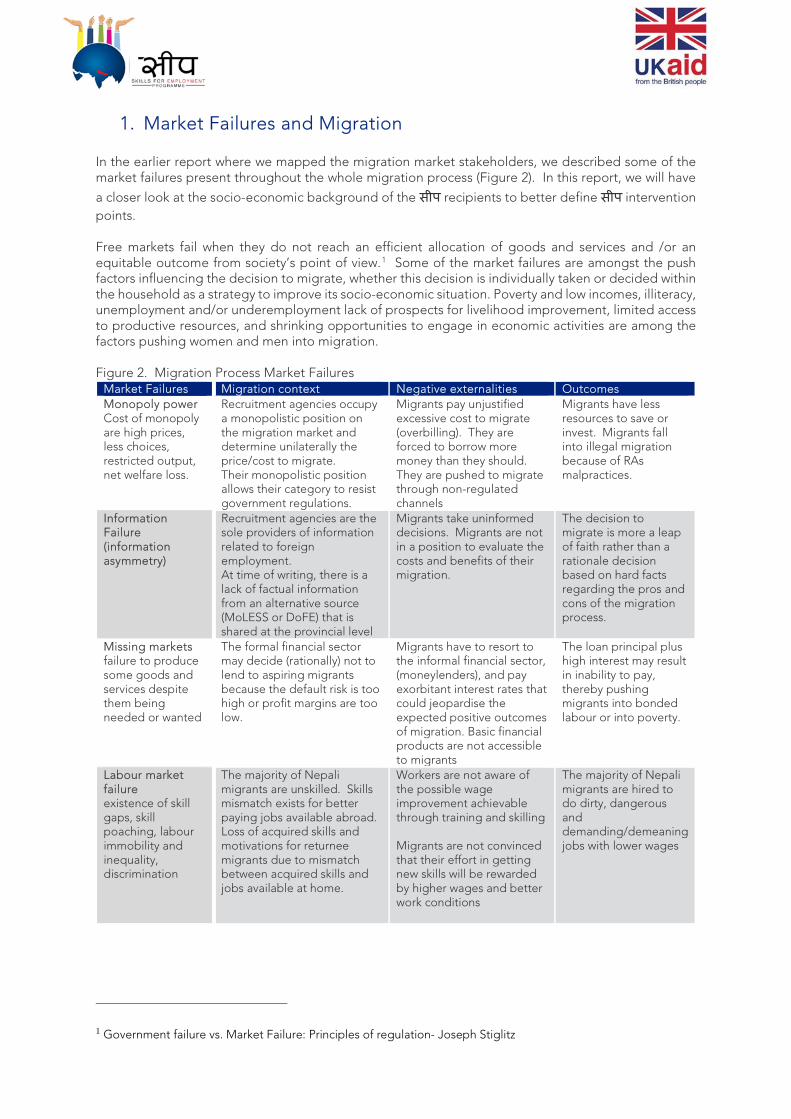
1. Market Failures and Migration In the earlier report where we mapped the migration market stakeholders, we described some of the market failures present throughout the whole migration process (Figure 2). In this report, we will have
a closer look at the socio-economic background of the सीप recipients to better define सीप intervention points. Free markets fail when they do not reach an efficient allocation of goods and services and /or an equitable outcome from society’s point of view.1 Some of the market failures are amongst the push factors influencing the decision to migrate, whether this decision is individually taken or decided within the household as a strategy to improve its socio-economic situation. Poverty and low incomes, illiteracy, unemployment and/or underemployment lack of prospects for livelihood improvement, limited access to productive resources, and shrinking opportunities to engage in economic activities are among the factors pushing women and men into migration. Figure 2. Migration Process Market Failures
Market Failures Migration context Negative externalities Outcomes Monopoly power Cost of monopoly are high prices, less choices, restricted output, net welfare loss.
Recruitment agencies occupy a monopolistic position on the migration market and determine unilaterally the price/cost to migrate. Their monopolistic position allows their category to resist government regulations.
Migrants pay unjustified excessive cost to migrate (overbilling). They are forced to borrow more money than they should. They are pushed to migrate through non-regulated channels
Migrants have less resources to save or invest. Migrants fall into illegal migration because of RAs malpractices.
Information Failure (information asymmetry)
Recruitment agencies are the sole providers of information related to foreign employment. At time of writing, there is a lack of factual information from an alternative source (MoLESS or DoFE) that is shared at the provincial level
Migrants take uninformed decisions. Migrants are not in a position to evaluate the costs and benefits of their migration.
The decision to migrate is more a leap of faith rather than a rationale decision based on hard facts regarding the pros and cons of the migration process.
Missing markets failure to produce some goods and services despite them being needed or wanted
The formal financial sector may decide (rationally) not to lend to aspiring migrants because the default risk is too high or profit margins are too low.
Migrants have to resort to the informal financial sector, (moneylenders), and pay exorbitant interest rates that could jeopardise the expected positive outcomes of migration. Basic financial products are not accessible to migrants
The loan principal plus high interest may result in inability to pay, thereby pushing migrants into bonded labour or into poverty.
Labour market failure existence of skill gaps, skill poaching, labour immobility and inequality, discrimination
The majority of Nepali migrants are unskilled. Skills mismatch exists for better paying jobs available abroad. Loss of acquired skills and motivations for returnee migrants due to mismatch between acquired skills and jobs available at home.
Workers are not aware of the possible wage improvement achievable through training and skilling Migrants are not convinced that their effort in getting new skills will be rewarded by higher wages and better work conditions
The majority of Nepali migrants are hired to do dirty, dangerous and demanding/demeaning jobs with lower wages
1 Government failure vs. Market Failure: Principles of regulation- Joseph Stiglitz
2. Macroeconomic survey 2.1 Poverty
Poverty in Nepal is measured by a monetary indicator, its estimation follows the Cost of Basic Needs (CBN) approach2. The method estimates the costs of acquiring enough food for adequate nutrition (2100 Calories per person) and then adds the costs of essential items such as clothing and shelter. In Nepal the Centre Bureau of Statistics (CBS) has estimated the poverty line for Nepal at NPR 19,2613 at 2010/11 average prices. In 2011 about 25. % (6.6 million) of the population in Nepal lived below this poverty line (less than a dollar a day in 2011 exchange rate)4. Province 6 and 7 are the poorest (Figure 3) with respectively 38.6 and 45.6% of the population living below the national poverty line. As we’ll see, the majority of the migrants of these two provinces migrate to India or internally within Nepal. 2.2 Poverty and Gender
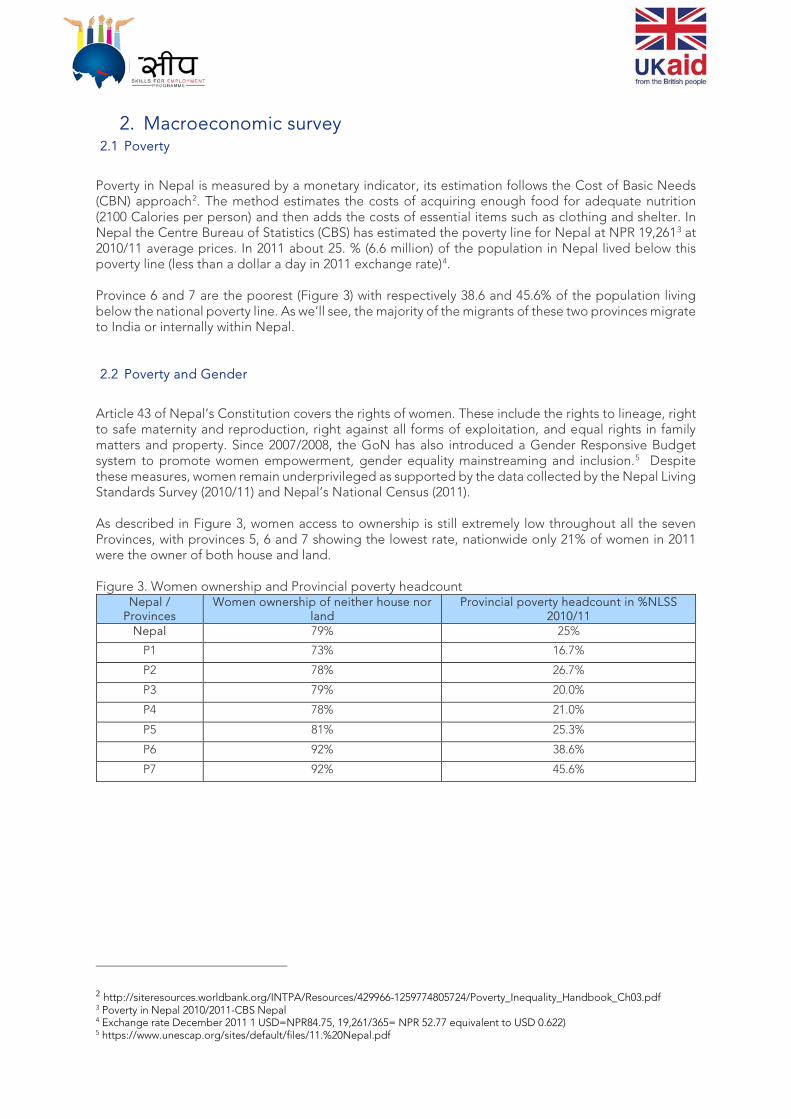
Article 43 of Nepal’s Constitution covers the rights of women. These include the rights to lineage, right to safe maternity and reproduction, right against all forms of exploitation, and equal rights in family matters and property. Since 2007/2008, the GoN has also introduced a Gender Responsive Budget system to promote women empowerment, gender equality mainstreaming and inclusion.5 Despite these measures, women remain underprivileged as supported by the data collected by the Nepal Living Standards Survey (2010/11) and Nepal’s National Census (2011). As described in Figure 3, women access to ownership is still extremely low throughout all the seven Provinces, with provinces 5, 6 and 7 showing the lowest rate, nationwide only 21% of women in 2011 were the owner of both house and land. Figure 3. Women ownership and Provincial poverty headcount
Nepal / Provinces
Women ownership of neither house nor land
Provincial poverty headcount in %NLSS 2010/11
Nepal 79% 25%
P1 73% 16.7%
P2 78% 26.7%
P3 79% 20.0%
P4 78% 21.0%
P5 81% 25.3%
P6 92% 38.6%
P7 92% 45.6%
2 http://siteresources.worldbank.org/INTPA/Resources/429966-1259774805724/Poverty_Inequality_Handbook_Ch03.pdf 3 Poverty in Nepal 2010/2011-CBS Nepal 4 Exchange rate December 2011 1 USD=NPR84.75, 19,261/365= NPR 52.77 equivalent to USD 0.622) 5 https://www.unescap.org/sites/default/files/11.%20Nepal.pdf
2.3 Domestic and foreign employment wages and economic sectors
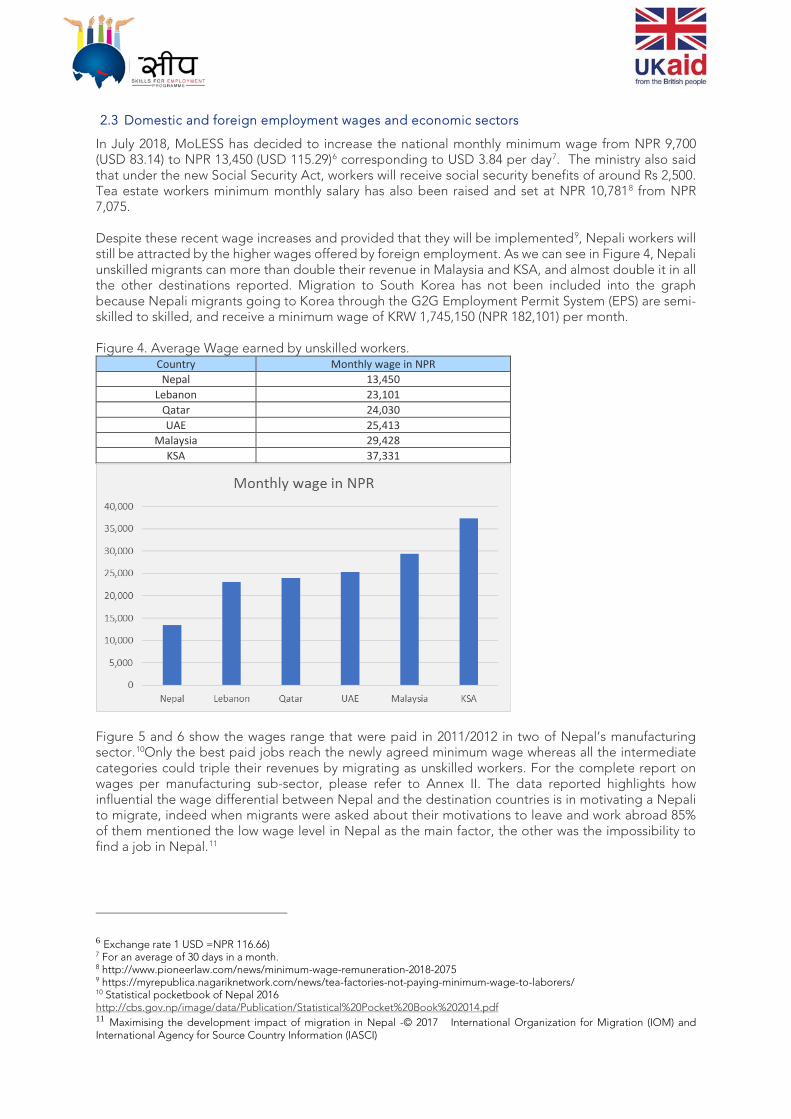
In July 2018, MoLESS has decided to increase the national monthly minimum wage from NPR 9,700 (USD 83.14) to NPR 13,450 (USD 115.29)6 corresponding to USD 3.84 per day7. The ministry also said that under the new Social Security Act, workers will receive social security benefits of around Rs 2,500. Tea estate workers minimum monthly salary has also been raised and set at NPR 10,7818 from NPR 7,075. Despite these recent wage increases and provided that they will be implemented9, Nepali workers will still be attracted by the higher wages offered by foreign employment. As we can see in Figure 4, Nepali unskilled migrants can more than double their revenue in Malaysia and KSA, and almost double it in all the other destinations reported. Migration to South Korea has not been included into the graph because Nepali migrants going to Korea through the G2G Employment Permit System (EPS) are semi-skilled to skilled, and receive a minimum wage of KRW 1,745,150 (NPR 182,101) per month. Figure 4. Average Wage earned by unskilled workers.
Country Monthly wage in NPR Nepal 13,450
Lebanon 23,101 Qatar 24,030 UAE 25,413
Malaysia 29,428 KSA 37,331
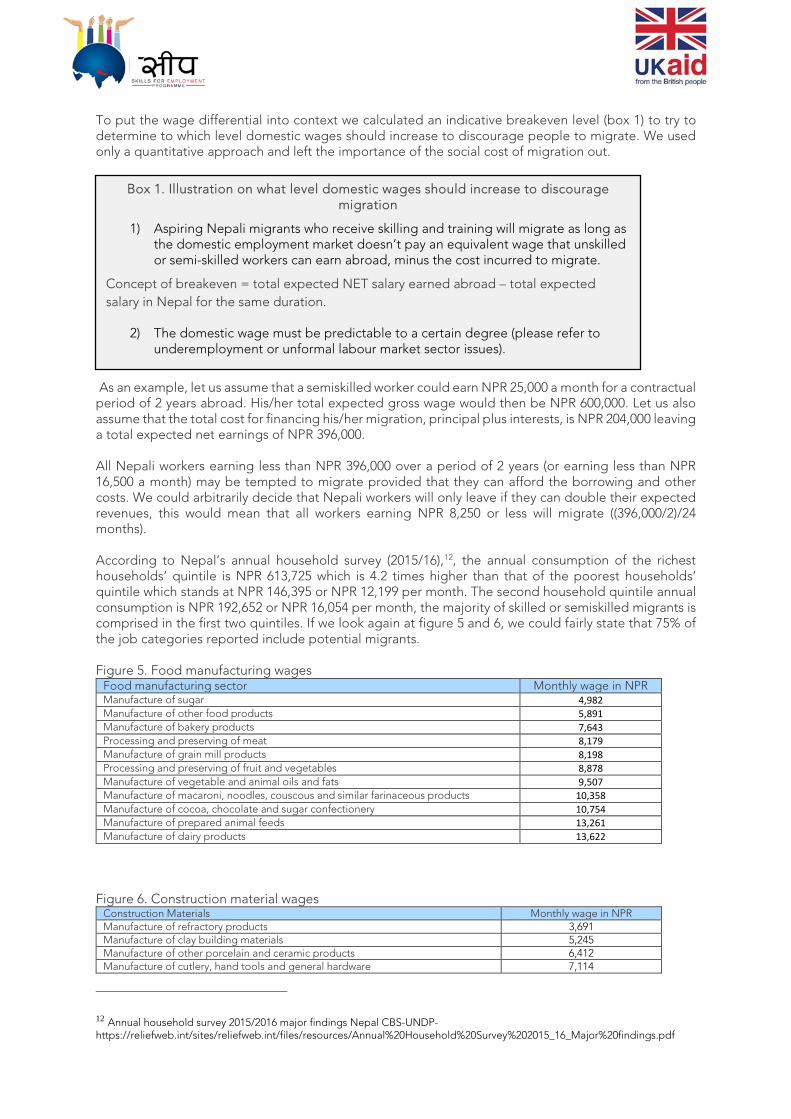
Figure 5 and 6 show the wages range that were paid in 2011/2012 in two of Nepal’s manufacturing sector.10Only the best paid jobs reach the newly agreed minimum wage whereas all the intermediate categories could triple their revenues by migrating as unskilled workers. For the complete report on wages per manufacturing sub-sector, please refer to Annex II. The data reported highlights how influential the wage differential between Nepal and the destination countries is in motivating a Nepali to migrate, indeed when migrants were asked about their motivations to leave and work abroad 85% of them mentioned the low wage level in Nepal as the main factor, the other was the impossibility to find a job in Nepal.11
6 Exchange rate 1 USD =NPR 116.66) 7 For an average of 30 days in a month. 8 http://www.pioneerlaw.com/news/minimum-wage-remuneration-2018-2075 9 https://myrepublica.nagariknetwork.com/news/tea-factories-not-paying-minimum-wage-to-laborers/ 10 Statistical pocketbook of Nepal 2016 http://cbs.gov.np/image/data/Publication/Statistical%20Pocket%20Book%202014.pdf 11 Maximising the development impact of migration in Nepal -© 2017 International Organization for Migration (IOM) and International Agency for Source Country Information (IASCI)
To put the wage differential into context we calculated an indicative breakeven level (box 1) to try to determine to which level domestic wages should increase to discourage people to migrate. We used only a quantitative approach and left the importance of the social cost of migration out.
As an example, let us assume that a semiskilled worker could earn NPR 25,000 a month for a contractual period of 2 years abroad. His/her total expected gross wage would then be NPR 600,000. Let us also assume that the total cost for financing his/her migration, principal plus interests, is NPR 204,000 leaving a total expected net earnings of NPR 396,000. All Nepali workers earning less than NPR 396,000 over a period of 2 years (or earning less than NPR 16,500 a month) may be tempted to migrate provided that they can afford the borrowing and other costs. We could arbitrarily decide that Nepali workers will only leave if they can double their expected revenues, this would mean that all workers earning NPR 8,250 or less will migrate ((396,000/2)/24 months). According to Nepal’s annual household survey (2015/16),12, the annual consumption of the richest households’ quintile is NPR 613,725 which is 4.2 times higher than that of the poorest households’ quintile which stands at NPR 146,395 or NPR 12,199 per month. The second household quintile annual consumption is NPR 192,652 or NPR 16,054 per month, the majority of skilled or semiskilled migrants is comprised in the first two quintiles. If we look again at figure 5 and 6, we could fairly state that 75% of the job categories reported include potential migrants. Figure 5. Food manufacturing wages
Food manufacturing sector Monthly wage in NPR Manufacture of sugar 4,982 Manufacture of other food products 5,891 Manufacture of bakery products 7,643 Processing and preserving of meat 8,179 Manufacture of grain mill products 8,198 Processing and preserving of fruit and vegetables 8,878 Manufacture of vegetable and animal oils and fats 9,507 Manufacture of macaroni, noodles, couscous and similar farinaceous products 10,358 Manufacture of cocoa, chocolate and sugar confectionery 10,754 Manufacture of prepared animal feeds 13,261 Manufacture of dairy products 13,622
Figure 6. Construction material wages
Construction Materials Monthly wage in NPR Manufacture of refractory products 3,691 Manufacture of clay building materials 5,245 Manufacture of other porcelain and ceramic products 6,412 Manufacture of cutlery, hand tools and general hardware 7,114
12 Annual household survey 2015/2016 major findings Nepal CBS-UNDP- https://reliefweb.int/sites/reliefweb.int/files/resources/Annual%20Household%20Survey%202015_16_Major%20findings.pdf
Box 1. Illustration on what level domestic wages should increase to discourage migration
1) Aspiring Nepali migrants who receive skilling and training will migrate as long as the domestic employment market doesn’t pay an equivalent wage that unskilled or semi-skilled workers can earn abroad, minus the cost incurred to migrate.
Concept of breakeven = total expected NET salary earned abroad – total expected salary in Nepal for the same duration.
2) The domestic wage must be predictable to a certain degree (please refer to underemployment or unformal labour market sector issues).
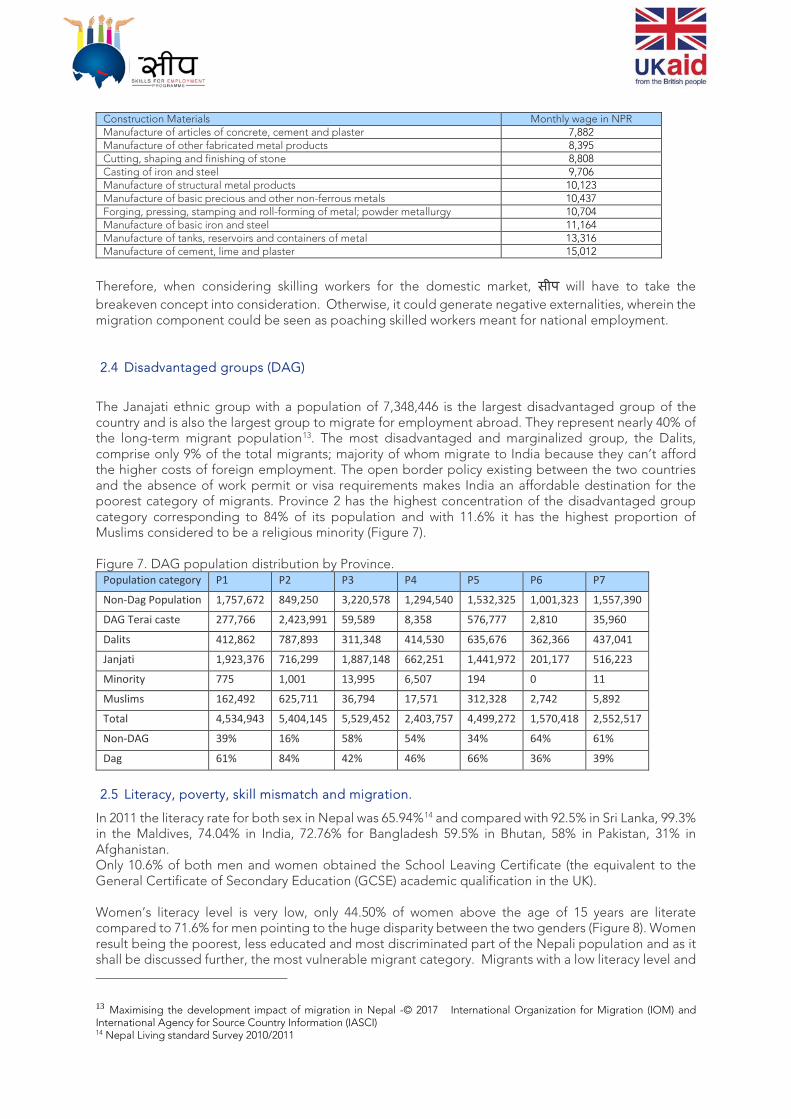
Construction Materials Monthly wage in NPR Manufacture of articles of concrete, cement and plaster 7,882 Manufacture of other fabricated metal products 8,395 Cutting, shaping and finishing of stone 8,808 Casting of iron and steel 9,706 Manufacture of structural metal products 10,123 Manufacture of basic precious and other non-ferrous metals 10,437 Forging, pressing, stamping and roll-forming of metal; powder metallurgy 10,704 Manufacture of basic iron and steel 11,164 Manufacture of tanks, reservoirs and containers of metal 13,316 Manufacture of cement, lime and plaster 15,012
Therefore, when considering skilling workers for the domestic market, सीप will have to take the breakeven concept into consideration. Otherwise, it could generate negative externalities, wherein the migration component could be seen as poaching skilled workers meant for national employment. 2.4 Disadvantaged groups (DAG)
The Janajati ethnic group with a population of 7,348,446 is the largest disadvantaged group of the country and is also the largest group to migrate for employment abroad. They represent nearly 40% of the long-term migrant population13. The most disadvantaged and marginalized group, the Dalits, comprise only 9% of the total migrants; majority of whom migrate to India because they can’t afford the higher costs of foreign employment. The open border policy existing between the two countries and the absence of work permit or visa requirements makes India an affordable destination for the poorest category of migrants. Province 2 has the highest concentration of the disadvantaged group category corresponding to 84% of its population and with 11.6% it has the highest proportion of Muslims considered to be a religious minority (Figure 7). Figure 7. DAG population distribution by Province.
Population category P1 P2 P3 P4 P5 P6 P7
Non-Dag Population 1,757,672 849,250 3,220,578 1,294,540 1,532,325 1,001,323 1,557,390
DAG Terai caste 277,766 2,423,991 59,589 8,358 576,777 2,810 35,960
Dalits 412,862 787,893 311,348 414,530 635,676 362,366 437,041
Janjati 1,923,376 716,299 1,887,148 662,251 1,441,972 201,177 516,223
Minority 775 1,001 13,995 6,507 194 0 11
Muslims 162,492 625,711 36,794 17,571 312,328 2,742 5,892
Total 4,534,943 5,404,145 5,529,452 2,403,757 4,499,272 1,570,418 2,552,517
Non-DAG 39% 16% 58% 54% 34% 64% 61%
Dag 61% 84% 42% 46% 66% 36% 39%
2.5 Literacy, poverty, skill mismatch and migration.
In 2011 the literacy rate for both sex in Nepal was 65.94%14 and compared with 92.5% in Sri Lanka, 99.3% in the Maldives, 74.04% in India, 72.76% for Bangladesh 59.5% in Bhutan, 58% in Pakistan, 31% in Afghanistan. Only 10.6% of both men and women obtained the School Leaving Certificate (the equivalent to the General Certificate of Secondary Education (GCSE) academic qualification in the UK). Women’s literacy level is very low, only 44.50% of women above the age of 15 years are literate compared to 71.6% for men pointing to the huge disparity between the two genders (Figure 8). Women result being the poorest, less educated and most discriminated part of the Nepali population and as it shall be discussed further, the most vulnerable migrant category. Migrants with a low literacy level and
13 Maximising the development impact of migration in Nepal -© 2017 International Organization for Migration (IOM) and International Agency for Source Country Information (IASCI) 14 Nepal Living standard Survey 2010/2011

without the appropriate skills requested for the jobs offered abroad have limited options to compete for higher paid occupations. Figure 8. Literacy and poverty figures for Nepalese women and men.
Nepal / Provinces
Women ownership of neither house nor land
Women literacy rate 5years and above
Men literacy rate 5 years and above
Women literacy rate 15years and above
Men literacy rate 15 years and above
S.L.C. & equiv. women
S.L.C. & equiv. men
Youth population (>15<40)
Provincial poverty headcount in %NLSS 2010/11
Nepal 79% 57% 75.14% 44.50% 71.60% 9.68% 10.50% 40.4 25%
P1 73% 69.34% 72.97% 53.77% 69.53% 12.00% 11.00% 40.4 16.7%
P2 78% 38.88% 60.09% 30.15% 57.26% 8.00% 10.00% 37.80% 26.7%
P3 79% 67.04% 82.82% 51.98% 78.92% 11.90% 12.70% 45.40% 20.0%
P4 78% 67.72% 83.54% 52.51% 79.60% 10.10% 11.40% 39.10% 21.0%
P5 81% 58.33% 75.50% 45.23% 71.94% 8.10% 8.50% 39.90% 25.3%
P6 92% 53.21% 72.88% 41.26% 69.45% 5.60% 8.00% 38.00% 38.6%
P7 92% 51.93% 76.37% 40.27% 72.77% 5.60% 7.50% 38.70% 45.6%
As mentioned previously a high proportion of Nepal’s population is illiterate and poor. Its revenues are on average lower than the official minimum wage and, in the manufacturing sector, some occupation pay less than or just USD 1.9 a day, the international poverty line threshold. There is an existing mismatch between Nepal’s domestic labour market demand and the lack of skills on offer being the outcome of the educational system. Most Nepali migrant workers migrate because they are underemployed or unemployed. The underemployment situation in the country15where 54% of the population (in 2011) worked less than 40 hours per week highlights the precarity of job occupation in the country and the irregularity of work revenues. Uncertainty about one’s expected flow of revenue prevent all long-term socio-economic planning. 2.6 The absence of a favourable investment environment.
Among the push factors of migration, we find poverty, low income, high unemployment rate, and lack of prospect for livelihood improvement. Nepal GDP per capita in 2016 was USD 732, the lowest in South Asia16, and as we mentioned before though the unemployment rate is low (3% in 2011)17 the underemployment situation in the country combined with the corresponding irregularity of income are also major push factors for the migration of young Nepali. Moreover, the absence of a favourable investment environment and the lack of prospect for livelihood improvement are the consequence of the low level of capital spending witnessed over the last 10 years and the persistent low GDP growth measured for the same period. The low level of capital expenditure18 as a percentage GDP and the inability of spending the allocated budget by the GoN (figure 9) best describe this situation. In Nepal the allocated budget for capital expenditures remained very low from 2012 until 2015 (around an average of 4.5% of GDP). Furthermore, since 2009 the GoN was unable to spend the entire allocated budget, and though the budget execution has improved in 2015/16, it still doesn’t reach 100% of the allocated budget. The implications are that bridges, roads, schools are not built or at best their construction is delayed. Migrants who were interviewed for the IOM/IASCI survey said that they were
15 Nepal Living Standard Survey 2010/11 vol 1 pg. 12 “Underemployment is defined as a person who works less than 40 hours per week.” 16 World Bank data 2016 17 Nepal living Standard Report 2010/11 vol 2 table 12:3 18 Capital Expenditures or fixed capital formation (or government investment) - government spending on goods and services intended to create future benefits, such as infrastructure investment in transport (roads, rail airports), health (water collection and distribution, sewage systems, communication (telephone, radio and tv) and research spending (defence, space, genetics).
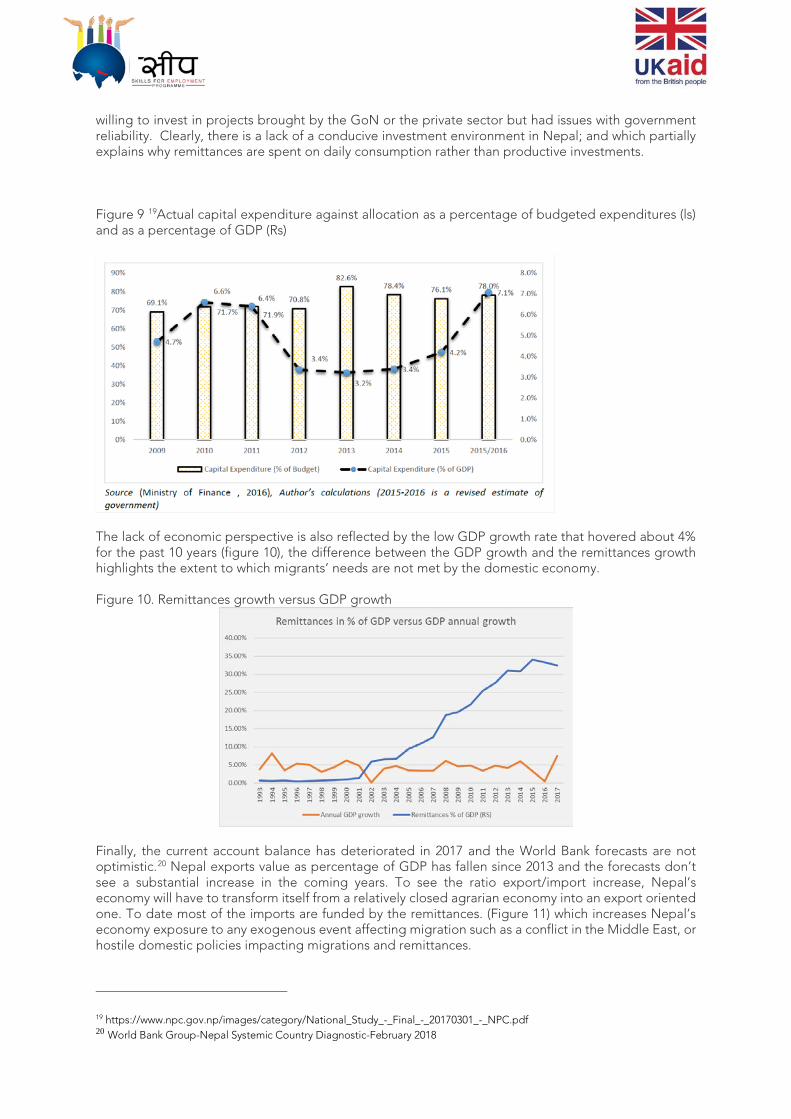
willing to invest in projects brought by the GoN or the private sector but had issues with government reliability. Clearly, there is a lack of a conducive investment environment in Nepal; and which partially explains why remittances are spent on daily consumption rather than productive investments. Figure 9 19Actual capital expenditure against allocation as a percentage of budgeted expenditures (ls) and as a percentage of GDP (Rs)
The lack of economic perspective is also reflected by the low GDP growth rate that hovered about 4% for the past 10 years (figure 10), the difference between the GDP growth and the remittances growth highlights the extent to which migrants’ needs are not met by the domestic economy. Figure 10. Remittances growth versus GDP growth
Finally, the current account balance has deteriorated in 2017 and the World Bank forecasts are not optimistic.20 Nepal exports value as percentage of GDP has fallen since 2013 and the forecasts don’t see a substantial increase in the coming years. To see the ratio export/import increase, Nepal’s economy will have to transform itself from a relatively closed agrarian economy into an export oriented one. To date most of the imports are funded by the remittances. (Figure 11) which increases Nepal’s economy exposure to any exogenous event affecting migration such as a conflict in the Middle East, or hostile domestic policies impacting migrations and remittances.
19 https://www.npc.gov.np/images/category/National_Study_-_Final_-_20170301_-_NPC.pdf 20 World Bank Group-Nepal Systemic Country Diagnostic-February 2018
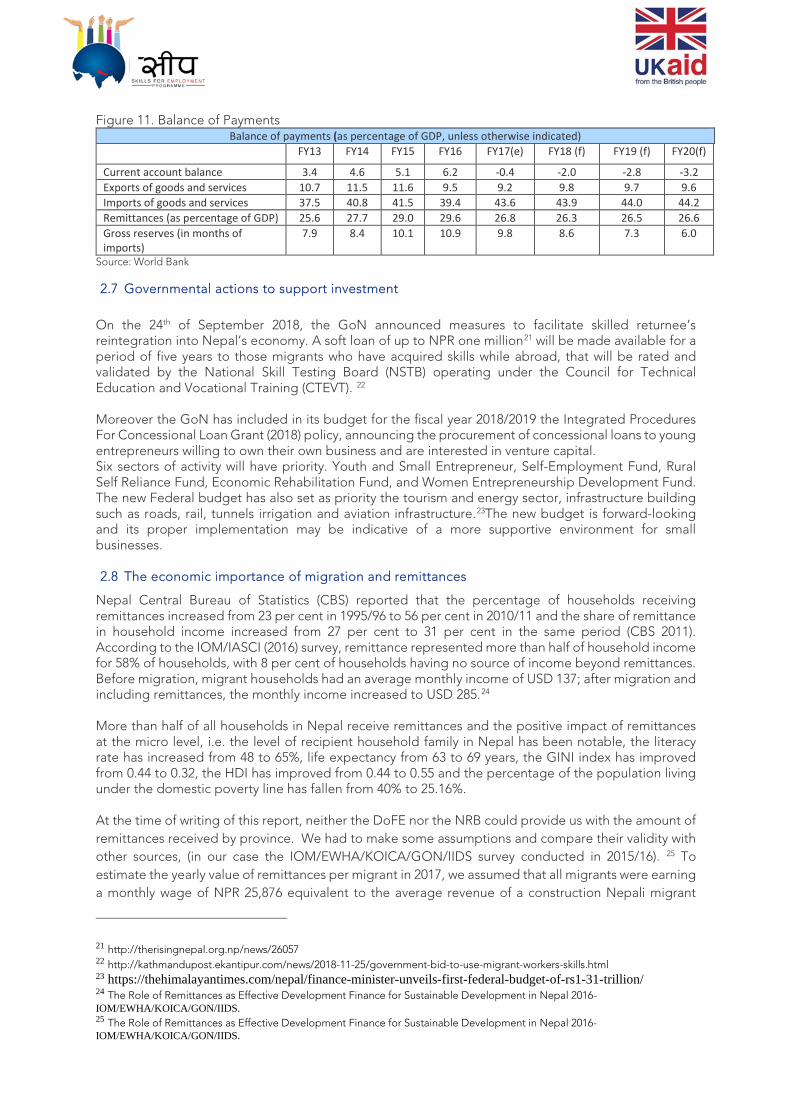
Figure 11. Balance of Payments Balance of payments (as percentage of GDP, unless otherwise indicated)
FY13 FY14 FY15 FY16 FY17(e) FY18 (f) FY19 (f) FY20(f)
Current account balance 3.4 4.6 5.1 6.2 -0.4 -2.0 -2.8 -3.2 Exports of goods and services 10.7 11.5 11.6 9.5 9.2 9.8 9.7 9.6 Imports of goods and services 37.5 40.8 41.5 39.4 43.6 43.9 44.0 44.2 Remittances (as percentage of GDP) 25.6 27.7 29.0 29.6 26.8 26.3 26.5 26.6 Gross reserves (in months of imports)
7.9 8.4 10.1 10.9 9.8 8.6 7.3 6.0
Source: World Bank 2.7 Governmental actions to support investment
On the 24th of September 2018, the GoN announced measures to facilitate skilled returnee’s reintegration into Nepal’s economy. A soft loan of up to NPR one million21 will be made available for a period of five years to those migrants who have acquired skills while abroad, that will be rated and validated by the National Skill Testing Board (NSTB) operating under the Council for Technical Education and Vocational Training (CTEVT). 22 Moreover the GoN has included in its budget for the fiscal year 2018/2019 the Integrated Procedures For Concessional Loan Grant (2018) policy, announcing the procurement of concessional loans to young entrepreneurs willing to own their own business and are interested in venture capital. Six sectors of activity will have priority. Youth and Small Entrepreneur, Self-Employment Fund, Rural Self Reliance Fund, Economic Rehabilitation Fund, and Women Entrepreneurship Development Fund. The new Federal budget has also set as priority the tourism and energy sector, infrastructure building such as roads, rail, tunnels irrigation and aviation infrastructure.23The new budget is forward-looking and its proper implementation may be indicative of a more supportive environment for small businesses. 2.8 The economic importance of migration and remittances
Nepal Central Bureau of Statistics (CBS) reported that the percentage of households receiving remittances increased from 23 per cent in 1995/96 to 56 per cent in 2010/11 and the share of remittance in household income increased from 27 per cent to 31 per cent in the same period (CBS 2011). According to the IOM/IASCI (2016) survey, remittance represented more than half of household income for 58% of households, with 8 per cent of households having no source of income beyond remittances. Before migration, migrant households had an average monthly income of USD 137; after migration and including remittances, the monthly income increased to USD 285.24 More than half of all households in Nepal receive remittances and the positive impact of remittances at the micro level, i.e. the level of recipient household family in Nepal has been notable, the literacy rate has increased from 48 to 65%, life expectancy from 63 to 69 years, the GINI index has improved from 0.44 to 0.32, the HDI has improved from 0.44 to 0.55 and the percentage of the population living under the domestic poverty line has fallen from 40% to 25.16%. At the time of writing of this report, neither the DoFE nor the NRB could provide us with the amount of remittances received by province. We had to make some assumptions and compare their validity with other sources, (in our case the IOM/EWHA/KOICA/GON/IIDS survey conducted in 2015/16). 25 To estimate the yearly value of remittances per migrant in 2017, we assumed that all migrants were earning a monthly wage of NPR 25,876 equivalent to the average revenue of a construction Nepali migrant
21 http://therisingnepal.org.np/news/26057 22 http://kathmandupost.ekantipur.com/news/2018-11-25/government-bid-to-use-migrant-workers-skills.html 23 https://thehimalayantimes.com/nepal/finance-minister-unveils-first-federal-budget-of-rs1-31-trillion/ 24 The Role of Remittances as Effective Development Finance for Sustainable Development in Nepal 2016-IOM/EWHA/KOICA/GON/IIDS. 25 The Role of Remittances as Effective Development Finance for Sustainable Development in Nepal 2016-IOM/EWHA/KOICA/GON/IIDS.
worker in the GCC. We then assumed that around 75% of the annual amount earned was remitted and obtained an estimate of USD 1,981 annual remittance per migrant, the final result is reported in figure 12. 26 When we compare the remittances inflow to the budget by Province, we can see that remittances are several times higher than the respective Provincial budget. Provinces 1and 5 receive most of the remittances followed by province 3 and 5.
Figure 12. Estimate of the amount of remittances per province.
Remittances per Provinces (estimate) 2017
Provinces Work permits per province in % of
total permits (DoFE)
Work permits released since
2008
Remittances in USD (2017)
Remittances in NPR (2017)
Provinces budget 2018 (Himalayan Times)
P1 25.51% 895,307 1,767,366,986 205,014,570,429 35,936,000,000 P2 24.10% 845,822 1,669,680,297 193,682,914,439 29,783,800,000 P3 16.07% 563,998 1,113,351,136 129,148,731,744 35,610,000,000 P4 13.01% 456,603 901,350,235 104,556,627,255 24,000,000,000 P5 16.26% 570,666 1,126,514,590 130,675,692,481 29,900,000,000 P6 3.41% 119,678 236,249,370 27,404,926,898 28,282,000,000 P7 1.64% 57,558 113,621,398 13,180,082,144 26,600,000,000 Totals 3,509,633 6,928,134,012 803,663,545,392 210,111,800,000
Source: DoFE, MoLESS, World Bank reworked by author.
2.9 Productive use of remittances
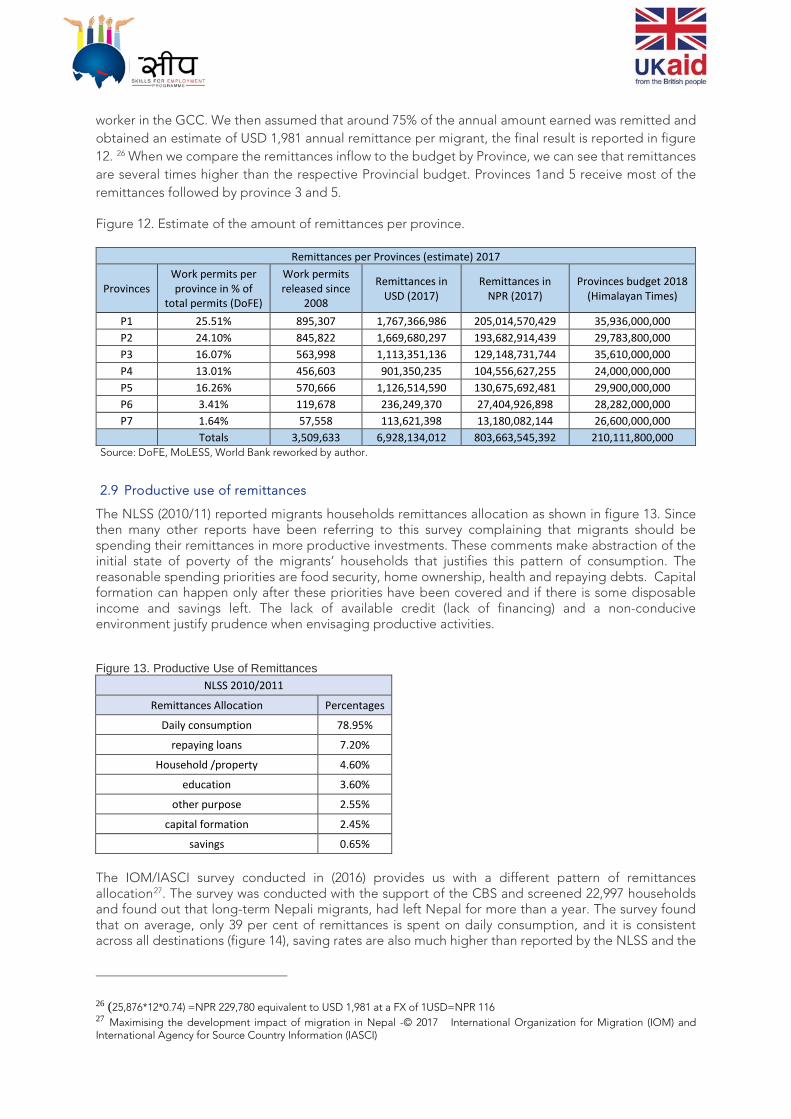
The NLSS (2010/11) reported migrants households remittances allocation as shown in figure 13. Since then many other reports have been referring to this survey complaining that migrants should be spending their remittances in more productive investments. These comments make abstraction of the initial state of poverty of the migrants’ households that justifies this pattern of consumption. The reasonable spending priorities are food security, home ownership, health and repaying debts. Capital formation can happen only after these priorities have been covered and if there is some disposable income and savings left. The lack of available credit (lack of financing) and a non-conducive environment justify prudence when envisaging productive activities. Figure 13. Productive Use of Remittances
NLSS 2010/2011
Remittances Allocation Percentages
Daily consumption 78.95%
repaying loans 7.20%
Household /property 4.60%
education 3.60%
other purpose 2.55%
capital formation 2.45%
savings 0.65% The IOM/IASCI survey conducted in (2016) provides us with a different pattern of remittances allocation27. The survey was conducted with the support of the CBS and screened 22,997 households and found out that long-term Nepali migrants, had left Nepal for more than a year. The survey found that on average, only 39 per cent of remittances is spent on daily consumption, and it is consistent across all destinations (figure 14), saving rates are also much higher than reported by the NLSS and the
26 (25,876*12*0.74) =NPR 229,780 equivalent to USD 1,981 at a FX of 1USD=NPR 116 27 Maximising the development impact of migration in Nepal -© 2017 International Organization for Migration (IOM) and International Agency for Source Country Information (IASCI)
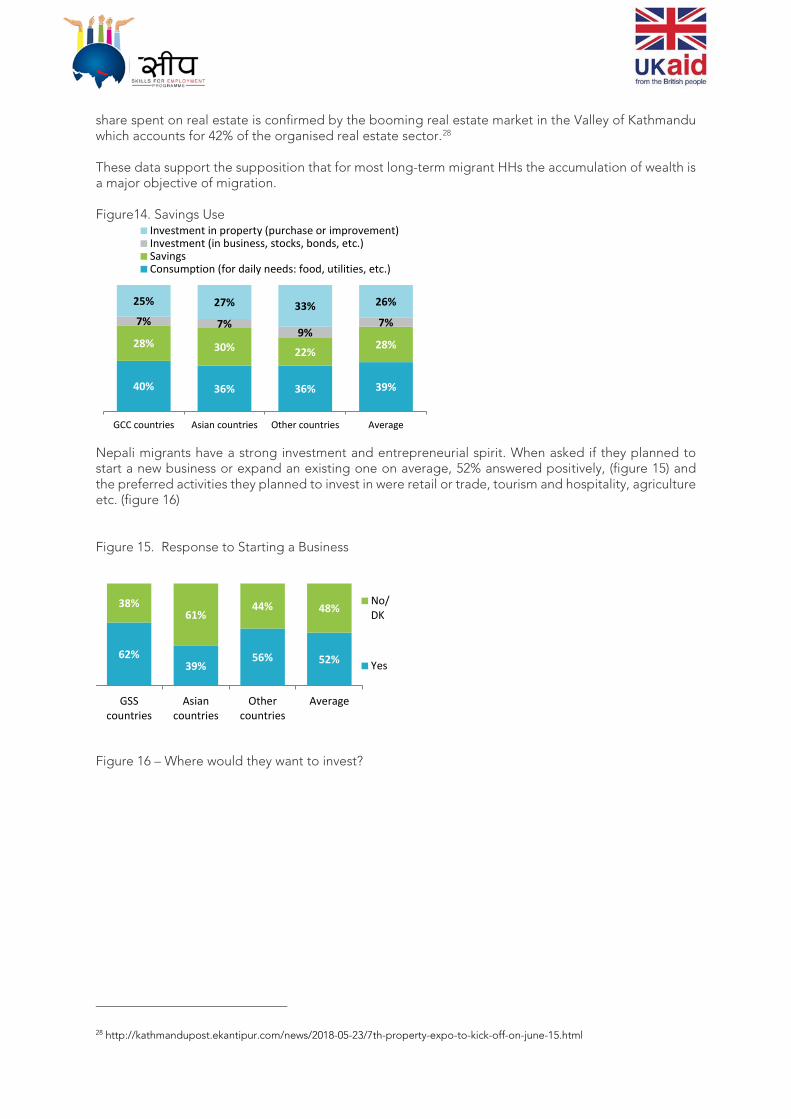
share spent on real estate is confirmed by the booming real estate market in the Valley of Kathmandu which accounts for 42% of the organised real estate sector.28 These data support the supposition that for most long-term migrant HHs the accumulation of wealth is a major objective of migration. Figure14. Savings Use
Nepali migrants have a strong investment and entrepreneurial spirit. When asked if they planned to start a new business or expand an existing one on average, 52% answered positively, (figure 15) and the preferred activities they planned to invest in were retail or trade, tourism and hospitality, agriculture etc. (figure 16) Figure 15. Response to Starting a Business
Figure 16 – Where would they want to invest?
28 http://kathmandupost.ekantipur.com/news/2018-05-23/7th-property-expo-to-kick-off-on-june-15.html
40% 36% 36% 39%
28% 30% 22%28%
7% 7%9%
7%
25% 27% 33% 26%
GCC countries Asian countries Other countries Average
Investment in property (purchase or improvement)Investment (in business, stocks, bonds, etc.)SavingsConsumption (for daily needs: food, utilities, etc.)
62%39%
56% 52%
38%61%
44% 48%
GSScountries
Asiancountries
Othercountries
Average
No/DK
Yes
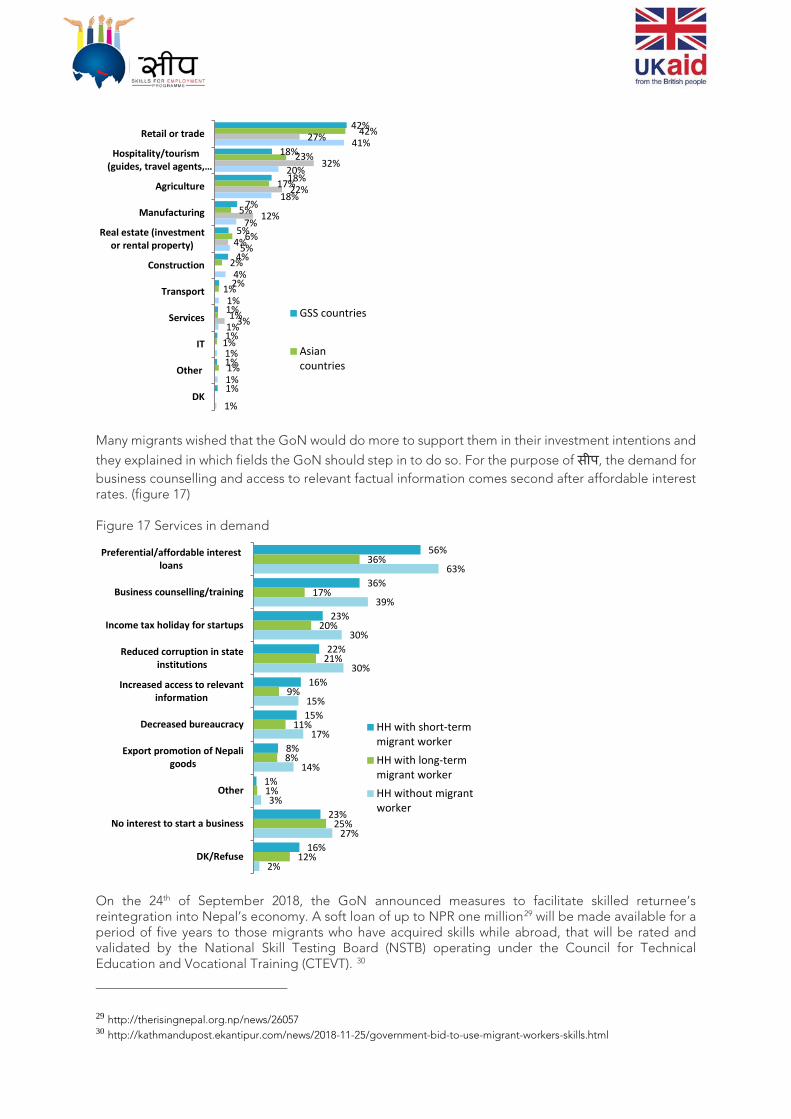
Many migrants wished that the GoN would do more to support them in their investment intentions and
they explained in which fields the GoN should step in to do so. For the purpose of सीप, the demand for business counselling and access to relevant factual information comes second after affordable interest rates. (figure 17) Figure 17 Services in demand
On the 24th of September 2018, the GoN announced measures to facilitate skilled returnee’s reintegration into Nepal’s economy. A soft loan of up to NPR one million29 will be made available for a period of five years to those migrants who have acquired skills while abroad, that will be rated and validated by the National Skill Testing Board (NSTB) operating under the Council for Technical Education and Vocational Training (CTEVT). 30
29 http://therisingnepal.org.np/news/26057 30 http://kathmandupost.ekantipur.com/news/2018-11-25/government-bid-to-use-migrant-workers-skills.html
42%
18%
18%
7%
5%
4%
2%
1%
1%
1%
1%
42%
23%
17%
5%
6%
2%
1%
1%
1%
1%
27%
32%
22%
12%
4%
3%
41%
20%
18%
7%
5%
4%
1%
1%
1%
1%
1%
Retail or trade
Hospitality/tourism(guides, travel agents,…
Agriculture
Manufacturing
Real estate (investmentor rental property)
Construction
Transport
Services
IT
Other
DK
GSS countries
Asiancountries
56%
36%
23%
22%
16%
15%
8%
1%
23%
16%
36%
17%
20%
21%
9%
11%
8%
1%
25%
12%
63%
39%
30%
30%
15%
17%
14%
3%
27%
2%
Preferential/affordable interestloans
Business counselling/training
Income tax holiday for startups
Reduced corruption in stateinstitutions
Increased access to relevantinformation
Decreased bureaucracy
Export promotion of Nepaligoods
Other
No interest to start a business
DK/Refuse
HH with short-termmigrant workerHH with long-termmigrant workerHH without migrantworker
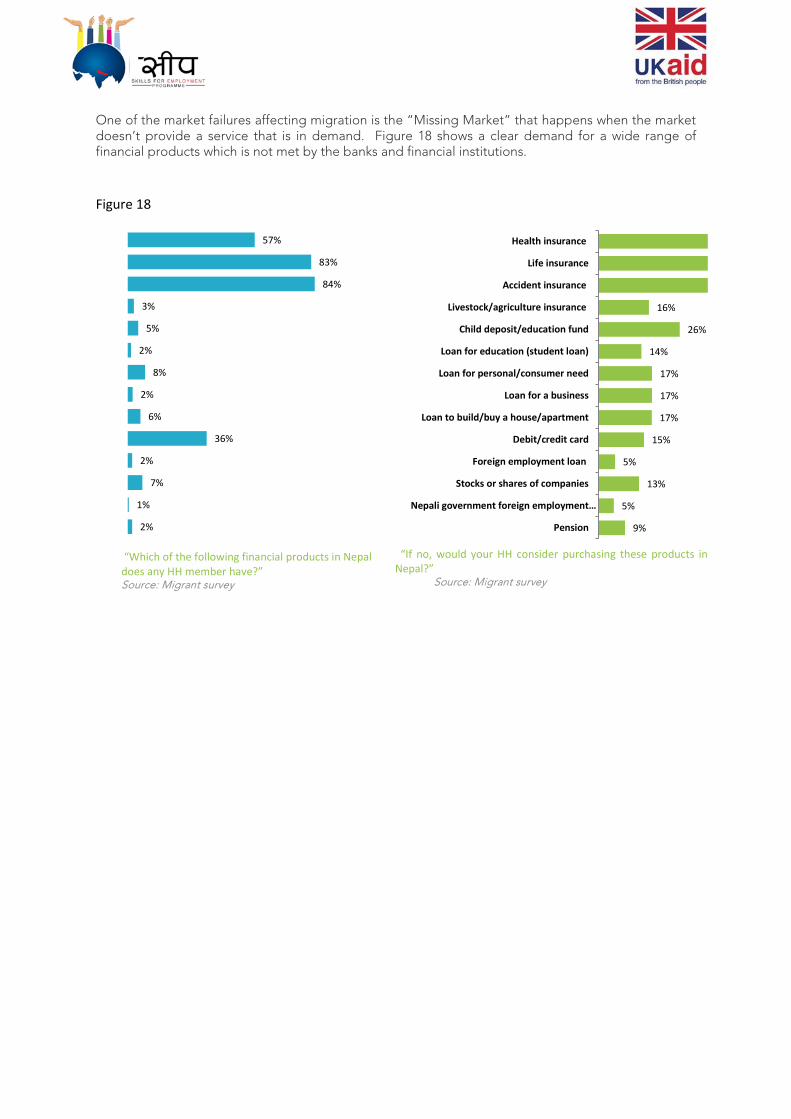
One of the market failures affecting migration is the “Missing Market” that happens when the market doesn’t provide a service that is in demand. Figure 18 shows a clear demand for a wide range of financial products which is not met by the banks and financial institutions. Figure 18
“Which of the following financial products in Nepal does any HH member have?” Source: Migrant survey
57%
83%
84%
3%
5%
2%
8%
2%
6%
36%
2%
7%
1%
2%
“If no, would your HH consider purchasing these products in Nepal?” Source: Migrant survey
16%
26%
14%
17%
17%
17%
15%
5%
13%
5%
9%
Health insurance
Life insurance
Accident insurance
Livestock/agriculture insurance
Child deposit/education fund
Loan for education (student loan)
Loan for personal/consumer need
Loan for a business
Loan to build/buy a house/apartment
Debit/credit card
Foreign employment loan
Stocks or shares of companies
Nepali government foreign employment…
Pension
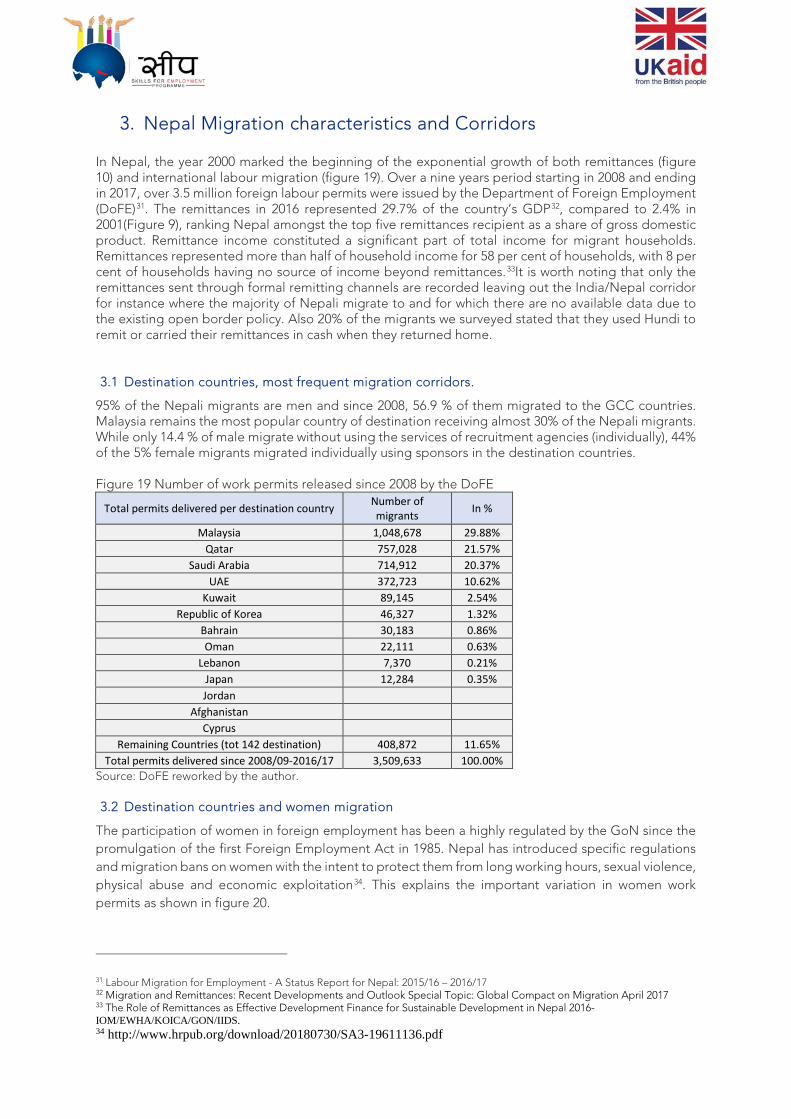
3. Nepal Migration characteristics and Corridors In Nepal, the year 2000 marked the beginning of the exponential growth of both remittances (figure 10) and international labour migration (figure 19). Over a nine years period starting in 2008 and ending in 2017, over 3.5 million foreign labour permits were issued by the Department of Foreign Employment (DoFE)31. The remittances in 2016 represented 29.7% of the country’s GDP32, compared to 2.4% in 2001(Figure 9), ranking Nepal amongst the top five remittances recipient as a share of gross domestic product. Remittance income constituted a significant part of total income for migrant households. Remittances represented more than half of household income for 58 per cent of households, with 8 per cent of households having no source of income beyond remittances.33It is worth noting that only the remittances sent through formal remitting channels are recorded leaving out the India/Nepal corridor for instance where the majority of Nepali migrate to and for which there are no available data due to the existing open border policy. Also 20% of the migrants we surveyed stated that they used Hundi to remit or carried their remittances in cash when they returned home. 3.1 Destination countries, most frequent migration corridors.
95% of the Nepali migrants are men and since 2008, 56.9 % of them migrated to the GCC countries. Malaysia remains the most popular country of destination receiving almost 30% of the Nepali migrants. While only 14.4 % of male migrate without using the services of recruitment agencies (individually), 44% of the 5% female migrants migrated individually using sponsors in the destination countries. Figure 19 Number of work permits released since 2008 by the DoFE
Total permits delivered per destination country Number of migrants In %
Malaysia 1,048,678 29.88% Qatar 757,028 21.57%
Saudi Arabia 714,912 20.37% UAE 372,723 10.62%
Kuwait 89,145 2.54% Republic of Korea 46,327 1.32%
Bahrain 30,183 0.86% Oman 22,111 0.63%
Lebanon 7,370 0.21% Japan 12,284 0.35% Jordan
Afghanistan Cyprus
Remaining Countries (tot 142 destination) 408,872 11.65% Total permits delivered since 2008/09-2016/17 3,509,633 100.00%
Source: DoFE reworked by the author. 3.2 Destination countries and women migration
The participation of women in foreign employment has been a highly regulated by the GoN since the promulgation of the first Foreign Employment Act in 1985. Nepal has introduced specific regulations and migration bans on women with the intent to protect them from long working hours, sexual violence, physical abuse and economic exploitation34. This explains the important variation in women work permits as shown in figure 20.
31 Labour Migration for Employment - A Status Report for Nepal: 2015/16 – 2016/17 32 Migration and Remittances: Recent Developments and Outlook Special Topic: Global Compact on Migration April 2017 33 The Role of Remittances as Effective Development Finance for Sustainable Development in Nepal 2016-IOM/EWHA/KOICA/GON/IIDS. 34 http://www.hrpub.org/download/20180730/SA3-19611136.pdf
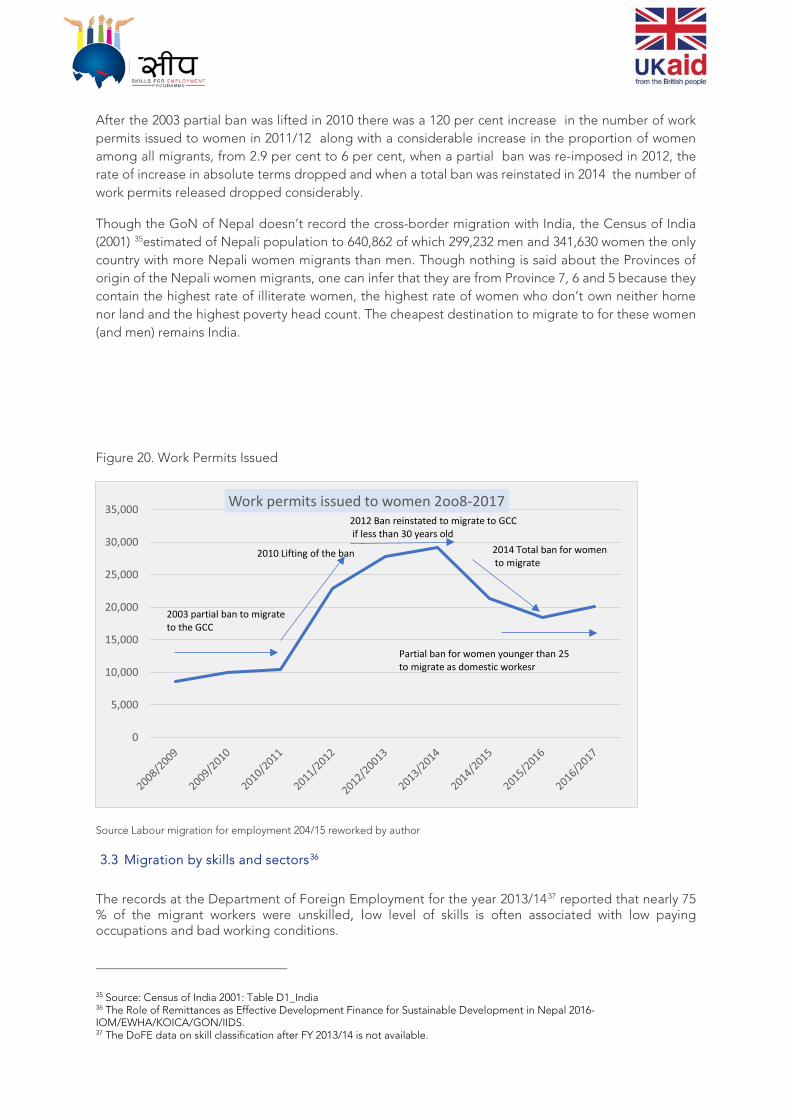
After the 2003 partial ban was lifted in 2010 there was a 120 per cent increase in the number of work permits issued to women in 2011/12 along with a considerable increase in the proportion of women among all migrants, from 2.9 per cent to 6 per cent, when a partial ban was re-imposed in 2012, the rate of increase in absolute terms dropped and when a total ban was reinstated in 2014 the number of work permits released dropped considerably.
Though the GoN of Nepal doesn’t record the cross-border migration with India, the Census of India (2001) 35estimated of Nepali population to 640,862 of which 299,232 men and 341,630 women the only country with more Nepali women migrants than men. Though nothing is said about the Provinces of origin of the Nepali women migrants, one can infer that they are from Province 7, 6 and 5 because they contain the highest rate of illiterate women, the highest rate of women who don’t own neither home nor land and the highest poverty head count. The cheapest destination to migrate to for these women (and men) remains India.
Figure 20. Work Permits Issued
Source Labour migration for employment 204/15 reworked by author
3.3 Migration by skills and sectors36
The records at the Department of Foreign Employment for the year 2013/1437 reported that nearly 75 % of the migrant workers were unskilled, low level of skills is often associated with low paying occupations and bad working conditions.
35 Source: Census of India 2001: Table D1_India 36 The Role of Remittances as Effective Development Finance for Sustainable Development in Nepal 2016-IOM/EWHA/KOICA/GON/IIDS. 37 The DoFE data on skill classification after FY 2013/14 is not available.
0
5,000
10,000
15,000
20,000
25,000
30,000
35,000 Work permits issued to women 2oo8-2017
2003 partial ban to migrate to the GCC
2010 Lifting of the ban
2012 Ban reinstated to migrate to GCCif less than 30 years old
2014 Total ban for womento migrate
Partial ban for women younger than 25 to migrate as domestic workesr
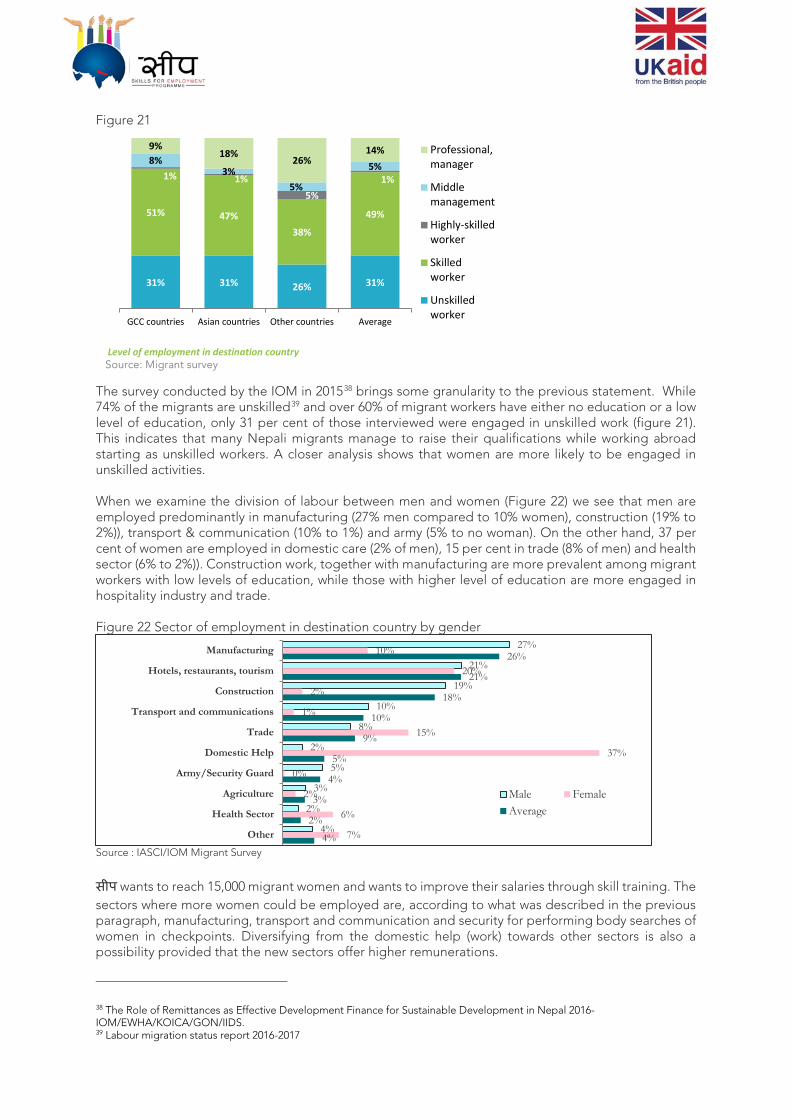
Figure 21
The survey conducted by the IOM in 201538 brings some granularity to the previous statement. While 74% of the migrants are unskilled39 and over 60% of migrant workers have either no education or a low level of education, only 31 per cent of those interviewed were engaged in unskilled work (figure 21). This indicates that many Nepali migrants manage to raise their qualifications while working abroad starting as unskilled workers. A closer analysis shows that women are more likely to be engaged in unskilled activities. When we examine the division of labour between men and women (Figure 22) we see that men are employed predominantly in manufacturing (27% men compared to 10% women), construction (19% to 2%)), transport & communication (10% to 1%) and army (5% to no woman). On the other hand, 37 per cent of women are employed in domestic care (2% of men), 15 per cent in trade (8% of men) and health sector (6% to 2%)). Construction work, together with manufacturing are more prevalent among migrant workers with low levels of education, while those with higher level of education are more engaged in hospitality industry and trade. Figure 22 Sector of employment in destination country by gender
Source : IASCI/IOM Migrant Survey
सीप wants to reach 15,000 migrant women and wants to improve their salaries through skill training. The sectors where more women could be employed are, according to what was described in the previous paragraph, manufacturing, transport and communication and security for performing body searches of women in checkpoints. Diversifying from the domestic help (work) towards other sectors is also a possibility provided that the new sectors offer higher remunerations.
38 The Role of Remittances as Effective Development Finance for Sustainable Development in Nepal 2016-IOM/EWHA/KOICA/GON/IIDS. 39 Labour migration status report 2016-2017
27%
21%
19%
10%
8%
2%
5%
3%
2%
4%
10%
20%
2%
1%
15%
37%
0%
2%
6%
7%
26%
21%
18%
10%
9%
5%
4%
3%
2%
4%
Manufacturing
Hotels, restaurants, tourism
Construction
Transport and communications
Trade
Domestic Help
Army/Security Guard
Agriculture
Health Sector
Other
Male FemaleAverage
Level of employment in destination country Source: Migrant survey
31% 31% 26% 31%
51% 47%38%
49%
1% 1%5%
1%
8%3%
5%
5%
9%18%
26%14%
GCC countries Asian countries Other countries Average
Professional,manager
Middlemanagement
Highly-skilledworker
Skilledworker
Unskilledworker
3.4 Migration by province
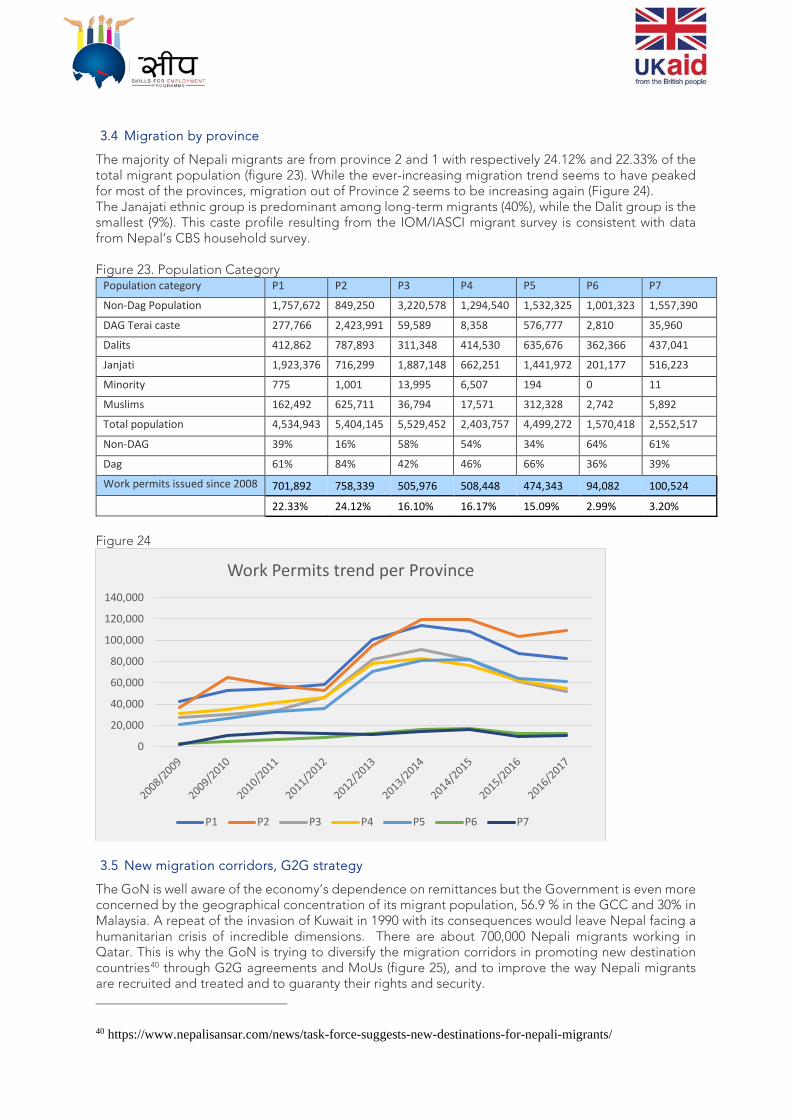
The majority of Nepali migrants are from province 2 and 1 with respectively 24.12% and 22.33% of the total migrant population (figure 23). While the ever-increasing migration trend seems to have peaked for most of the provinces, migration out of Province 2 seems to be increasing again (Figure 24). The Janajati ethnic group is predominant among long-term migrants (40%), while the Dalit group is the smallest (9%). This caste profile resulting from the IOM/IASCI migrant survey is consistent with data from Nepal’s CBS household survey. Figure 23. Population Category
Population category P1 P2 P3 P4 P5 P6 P7
Non-Dag Population 1,757,672 849,250 3,220,578 1,294,540 1,532,325 1,001,323 1,557,390
DAG Terai caste 277,766 2,423,991 59,589 8,358 576,777 2,810 35,960
Dalits 412,862 787,893 311,348 414,530 635,676 362,366 437,041
Janjati 1,923,376 716,299 1,887,148 662,251 1,441,972 201,177 516,223
Minority 775 1,001 13,995 6,507 194 0 11
Muslims 162,492 625,711 36,794 17,571 312,328 2,742 5,892
Total population 4,534,943 5,404,145 5,529,452 2,403,757 4,499,272 1,570,418 2,552,517
Non-DAG 39% 16% 58% 54% 34% 64% 61%
Dag 61% 84% 42% 46% 66% 36% 39%
Work permits issued since 2008 701,892 758,339 505,976 508,448 474,343 94,082 100,524 22.33% 24.12% 16.10% 16.17% 15.09% 2.99% 3.20%
Figure 24
3.5 New migration corridors, G2G strategy
The GoN is well aware of the economy’s dependence on remittances but the Government is even more concerned by the geographical concentration of its migrant population, 56.9 % in the GCC and 30% in Malaysia. A repeat of the invasion of Kuwait in 1990 with its consequences would leave Nepal facing a humanitarian crisis of incredible dimensions. There are about 700,000 Nepali migrants working in Qatar. This is why the GoN is trying to diversify the migration corridors in promoting new destination countries40 through G2G agreements and MoUs (figure 25), and to improve the way Nepali migrants are recruited and treated and to guaranty their rights and security.
40 https://www.nepalisansar.com/news/task-force-suggests-new-destinations-for-nepali-migrants/
0
20,000
40,000
60,000
80,000
100,000
120,000
140,000
Work Permits trend per Province
P1 P2 P3 P4 P5 P6 P7

Figure 25 G2G agreements and MoUs signed by the GoN since 2005 regarding migration
Destination Country
Year of Agreement
Nature of Agreement Skills required Capped fees and
costs
Salary quota
Qatar 2005 new proposal for a G2G 2018
General Agreement on recruitment procedures,
None (housemaids high in demand)
N/a N/a none
UAE 2007 MOU Republic of Korea
2007 MOU EPS (employment Permit System)
TOPIK Korean language proficiency exam
USD 1.000
USD 1,500
7,000migrants a year (2019)
Bahrain 2008 MOU Japan 2009 Directive (technical
internship) 2-year experience
USD 500 (NPR 50,000)
USD 1,100-1,500
Israel 2015 Joint Pilot Program 10 year of schooling proficiency in English
USD 1,000
USD 1,270
According to specific needs
Jordan 2017 General Agreement employer pays costs
Malaysia 2018 MOU No details to date
None
The Minister for Labour and Employment Gokarna Bista met with the Qatari ambassador Yousef Bin Mohamed Al-Hail and discussed the possibility of a G2G agreement between the two countries. Bista said during the meeting “we are ready to send workers of your choice but there should not be any sort of cheating while sending them to Qatar. They should not be exploited during their stay there,” adding, “That's why we all should adopt G2G agreement so that anomalies will be checked.”41 Nepal is also proposing a regional policy within the Colombo process and at the SAARC aiming at the streamlining of recruitment procedures and migrants’ rights protection. The ILO is also actively promoting fair recruitment agreements and procedures, namely between Nepal and Jordan, involving apparel skill training programme, collaboration with recruitment agencies that have a proven model of fair recruitment, foreign employers and the destination country’s government.42 Finally, new migration trends are emerging and new corridors are being opened particularly by women. In Nepal men seeking migration permits fell by 5.83% in 2016/17, confirming an existing trend, while women’s permit demand grew by 8.95%43after the dramatic fall seen in 2014. The multiple ban imposed by the GoN on women migration are partially responsible for this evolution, and so we can see that corridors (destination countries) such as Lebanon, Jordan, Cyprus are exclusively used by women (figure 26). Men in new destination countries are Afghanistan with 6,681 permits released, Poland which delivered 7,000 work permits to Nepalese in 2017,44Sri Lanka where 2,500 Nepalese have migrated to work in the construction sector, China where 16,000 Nepali migrants were working as per China’s 2006 census. Figure 26. Destination Countries for Migrants
41 https://myrepublica.nagariknetwork.com/news/nepal-proposes-g2g-deal-with-qatar-for-sending-workers/ 42https://www.ilo.org/wcmsp5/groups/public/---ed_protect/---protrav/---migrant/documents/meetingdocument/wcms_464656.pdf 43 Labour migration status report 2016/17 44https://visegradpost.com/en/2018/08/24/lacking-manpower-poland-relies-on-asian-immigration-besides-ukrainians-and-belorussians/
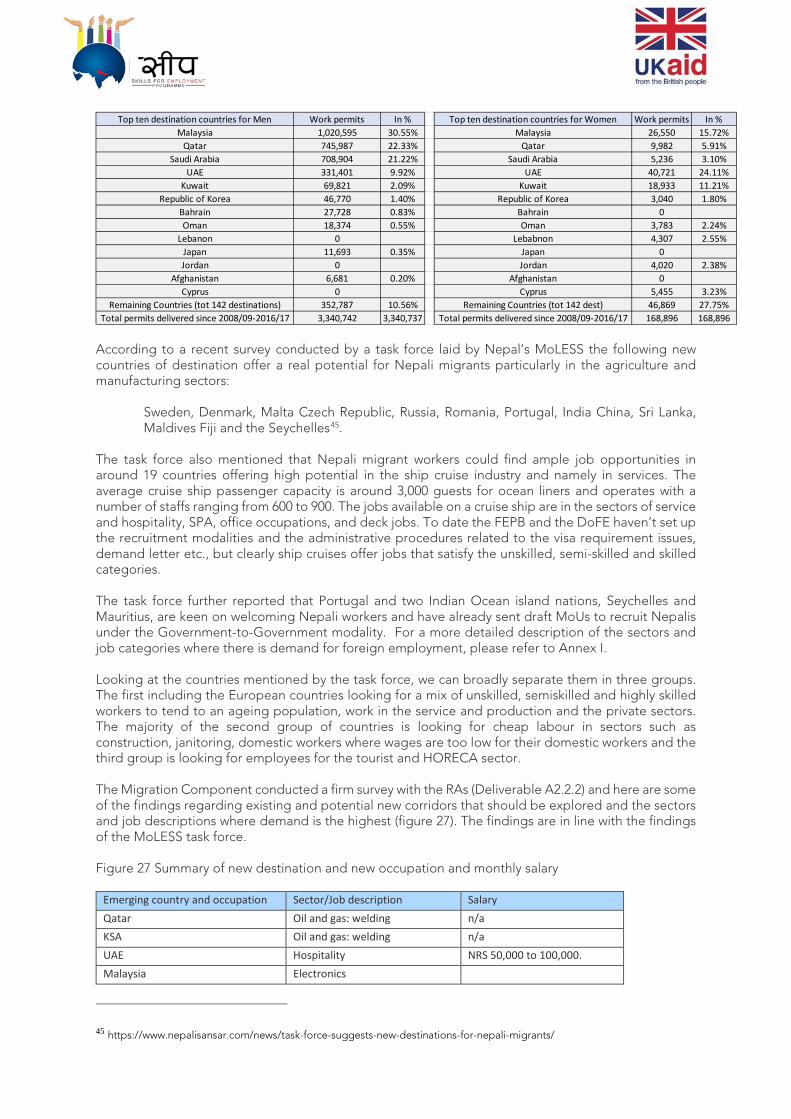
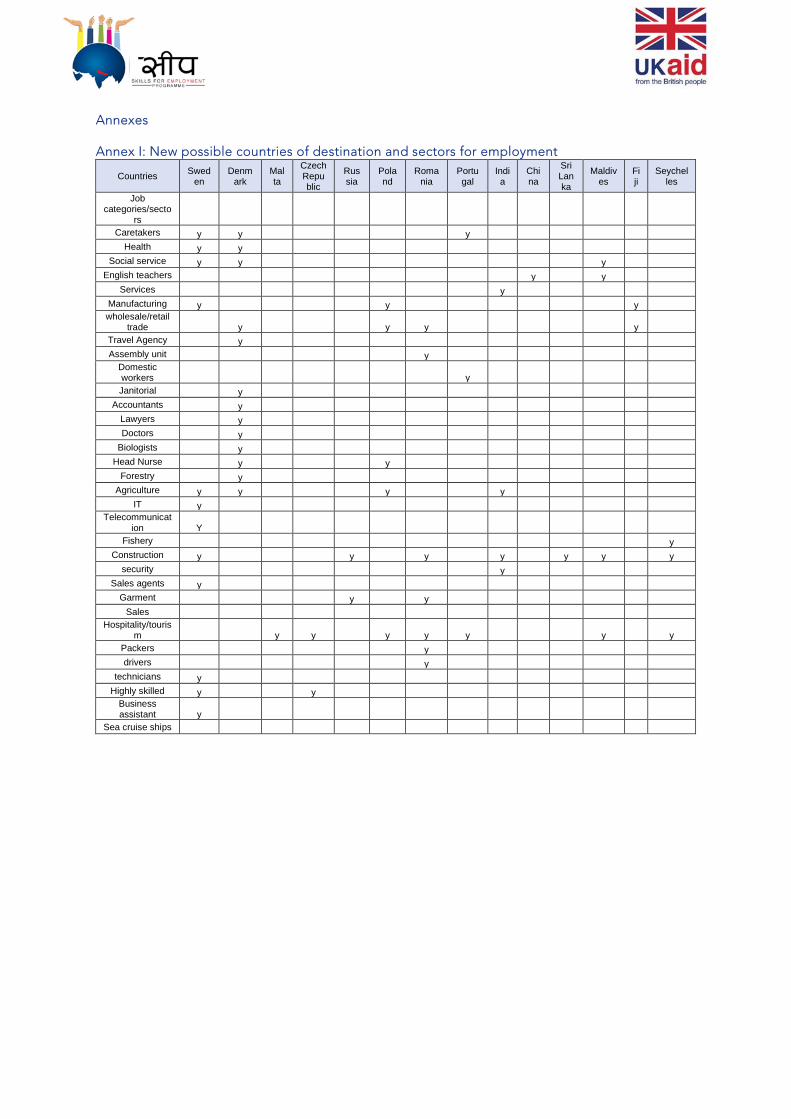
According to a recent survey conducted by a task force laid by Nepal’s MoLESS the following new countries of destination offer a real potential for Nepali migrants particularly in the agriculture and manufacturing sectors:
Sweden, Denmark, Malta Czech Republic, Russia, Romania, Portugal, India China, Sri Lanka, Maldives Fiji and the Seychelles45.
The task force also mentioned that Nepali migrant workers could find ample job opportunities in around 19 countries offering high potential in the ship cruise industry and namely in services. The average cruise ship passenger capacity is around 3,000 guests for ocean liners and operates with a number of staffs ranging from 600 to 900. The jobs available on a cruise ship are in the sectors of service and hospitality, SPA, office occupations, and deck jobs. To date the FEPB and the DoFE haven’t set up the recruitment modalities and the administrative procedures related to the visa requirement issues, demand letter etc., but clearly ship cruises offer jobs that satisfy the unskilled, semi-skilled and skilled categories. The task force further reported that Portugal and two Indian Ocean island nations, Seychelles and Mauritius, are keen on welcoming Nepali workers and have already sent draft MoUs to recruit Nepalis under the Government-to-Government modality. For a more detailed description of the sectors and job categories where there is demand for foreign employment, please refer to Annex I. Looking at the countries mentioned by the task force, we can broadly separate them in three groups. The first including the European countries looking for a mix of unskilled, semiskilled and highly skilled workers to tend to an ageing population, work in the service and production and the private sectors. The majority of the second group of countries is looking for cheap labour in sectors such as construction, janitoring, domestic workers where wages are too low for their domestic workers and the third group is looking for employees for the tourist and HORECA sector. The Migration Component conducted a firm survey with the RAs (Deliverable A2.2.2) and here are some of the findings regarding existing and potential new corridors that should be explored and the sectors and job descriptions where demand is the highest (figure 27). The findings are in line with the findings of the MoLESS task force. Figure 27 Summary of new destination and new occupation and monthly salary
Emerging country and occupation Sector/Job description Salary Qatar Oil and gas: welding n/a KSA Oil and gas: welding n/a UAE Hospitality NRS 50,000 to 100,000. Malaysia Electronics
45 https://www.nepalisansar.com/news/task-force-suggests-new-destinations-for-nepali-migrants/
Top ten destination countries for Men Work permits In % Top ten destination countries for Women Work permits In %Malaysia 1,020,595 30.55% Malaysia 26,550 15.72%
Qatar 745,987 22.33% Qatar 9,982 5.91%Saudi Arabia 708,904 21.22% Saudi Arabia 5,236 3.10%
UAE 331,401 9.92% UAE 40,721 24.11%Kuwait 69,821 2.09% Kuwait 18,933 11.21%
Republic of Korea 46,770 1.40% Republic of Korea 3,040 1.80%Bahrain 27,728 0.83% Bahrain 0Oman 18,374 0.55% Oman 3,783 2.24%
Lebanon 0 Lebabnon 4,307 2.55%Japan 11,693 0.35% Japan 0Jordan 0 Jordan 4,020 2.38%
Afghanistan 6,681 0.20% Afghanistan 0Cyprus 0 Cyprus 5,455 3.23%
Remaining Countries (tot 142 destinations) 352,787 10.56% Remaining Countries (tot 142 dest) 46,869 27.75%Total permits delivered since 2008/09-2016/17 3,340,742 3,340,737 Total permits delivered since 2008/09-2016/17 168,896 168,896
Emerging country and occupation Sector/Job description Salary Japan Agriculture: farmer,
Services: caregiver Construction Manufacturing: factory worker
NRS 150,000 for factory worker
Poland Construction: welder General labour Agriculture: Slaughter house
NRS 50,000 for general labour NRS 80,000 for welding
Malta General labour NRS 100,000 Europe Hospitality NRS 100,000 Portugal Manufacturing: factory worker
Agriculture: labour n/a
Chez Republic Services: care giver n/a Fiji Hospitality n/a Brunei Security n/a
Source: सीप Migration Component Recruitment Agencies Survey 2018
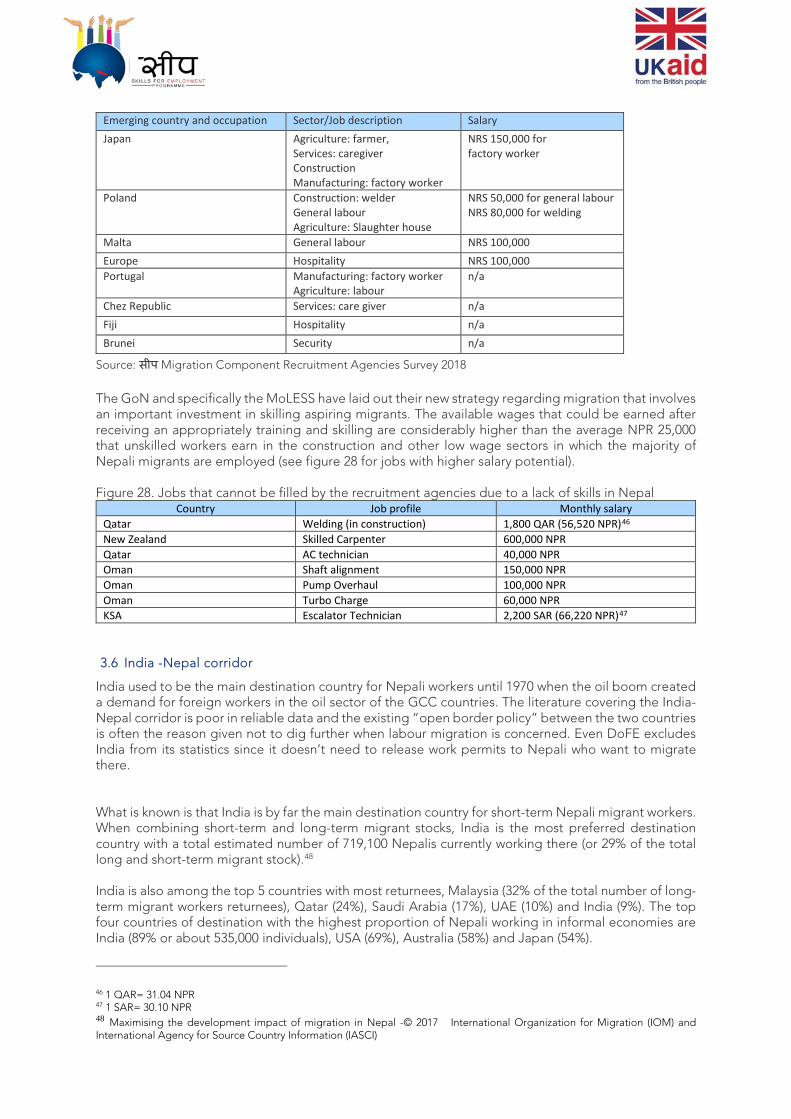
The GoN and specifically the MoLESS have laid out their new strategy regarding migration that involves an important investment in skilling aspiring migrants. The available wages that could be earned after receiving an appropriately training and skilling are considerably higher than the average NPR 25,000 that unskilled workers earn in the construction and other low wage sectors in which the majority of Nepali migrants are employed (see figure 28 for jobs with higher salary potential). Figure 28. Jobs that cannot be filled by the recruitment agencies due to a lack of skills in Nepal
Country Job profile Monthly salary Qatar Welding (in construction) 1,800 QAR (56,520 NPR)46 New Zealand Skilled Carpenter 600,000 NPR Qatar AC technician 40,000 NPR Oman Shaft alignment 150,000 NPR Oman Pump Overhaul 100,000 NPR Oman Turbo Charge 60,000 NPR KSA Escalator Technician 2,200 SAR (66,220 NPR)47
3.6 India -Nepal corridor
India used to be the main destination country for Nepali workers until 1970 when the oil boom created a demand for foreign workers in the oil sector of the GCC countries. The literature covering the India-Nepal corridor is poor in reliable data and the existing “open border policy” between the two countries is often the reason given not to dig further when labour migration is concerned. Even DoFE excludes India from its statistics since it doesn’t need to release work permits to Nepali who want to migrate there. What is known is that India is by far the main destination country for short-term Nepali migrant workers. When combining short-term and long-term migrant stocks, India is the most preferred destination country with a total estimated number of 719,100 Nepalis currently working there (or 29% of the total long and short-term migrant stock).48 India is also among the top 5 countries with most returnees, Malaysia (32% of the total number of long-term migrant workers returnees), Qatar (24%), Saudi Arabia (17%), UAE (10%) and India (9%). The top four countries of destination with the highest proportion of Nepali working in informal economies are India (89% or about 535,000 individuals), USA (69%), Australia (58%) and Japan (54%).
46 1 QAR= 31.04 NPR 47 1 SAR= 30.10 NPR 48 Maximising the development impact of migration in Nepal -© 2017 International Organization for Migration (IOM) and International Agency for Source Country Information (IASCI)
Moreover, historically, Nepali workers, mostly from Province 7 (previously Far-Western region) and Province 5 (previously Mid-Western region of Nepal) migrated to India to work as daily wage labourers or as security guards or in restaurants in Indian cities. Women went to work as domestic workers. Because of the recurrent nature of migration to India over so many years, there are well-established migration “corridors” or networks between districts in Nepal and Indian cities that help new Nepali migrants to find work without the intervention of recruitment agencies. India remains by far the most preferred country of destination for short-term migrant workers. 95 % or about 430,900 people choose India as their destination country and it will probably continue to be so when we consider the poverty level of the provinces of origin and the migration cost to migrate in other international destinations. A bus fare from Dhangarhi (Province 7) to Delhi (390km) will take 10 hours and cost USD 70, migrating to GCC will cost on average USD 1,400. There is an important demand for Nepalese workers in the following sectors: services, agriculture, construction and security, a relatively good match between Nepali owned skills and the Indian job market. The GoN may be interested into formalising Nepali recruitment by Indian employers so to increase their wages and security. Maybe, the DoFE should start releasing work permits to go to India but this would require amending the Foreign Employment Act or maybe the GoN could sign an MOU not compromising the open border policy but bringing more order to the labour migration market. In conclusion, India is the destination where the poorest segment of Nepali population migrates to, where the proportion of male/female migrants is inverted (more women than men) and with the highest concentration of Dalit migrants, whereas migrants of other social groups such as Janajati, Muslims and other minorities, the preferred destinations are the GCC. Malaysia is mostly preferred by the Madhesi middle-class.49
49 Analysis of Labour Market and Migration Trends in Nepal, GIZ, ILO, 2015.
4. M4P and migration 4.1 market system important to the poor
What matters to every individual and particularly to the poor is
• to have access to predictable and sufficient income and productive resources • to ensure sustainable livelihoods • to have access to affordable education • Access to affordable health care • Access to adequate housing • Functional public institutions • Access to a social safety net
4.2 How is migration working for the migrants?
Remittance income constituted a significant part of total income for migrant households. Remittances represented more than half of household income for 58 per cent of households, with 8 per cent of households having no source of income beyond remittances. Nepal Central Bureau of Statistics (CBS) reported that the percentage of households receiving remittances increased from 23 per cent in 1995/96 to 56 per cent in 2010/11 and the share of remittance in household income increased from 27 per cent to 31 per cent in the same period (CBS 2011). More than half of all households in Nepal receive remittances and the positive impact of remittances at the micro level, i.e. the level of recipient household family in Nepal has been notable, the literacy rate has increased from 48 to 65%, life expectancy from 63 to 69 years, the GINI index has improved from 0.44 to o.32, the HDI has improved from 0.44 to 0.55 and the percentage of the population living under the domestic poverty line has fallen from 40% to 25.16%. In 2016, a Nepali long-term migrant HH had an average annual income of USD 7,188 (or about USD 600 monthly, as compared to about USD 200 for short-term migrants), of which USD 5,316 was saved.50 4.3 Market Failures affecting migration and points of intervention
Figure 29 sums up the market failures that we’ve been describing in detail. Our proposition is to
address these through three सीप Challenge Fund windows or points of intervention for the Migration component. They are: 9) Financial products for lowering the cost of migration 10) Migrant Skilling ethical recruitment,11) Access to factual information (innovative technology ,12) Financial products for savings and investments, 13) Financial literacy . For instance through the model 9) the project will be able to procure loans to migration at market rates, about 17% per annum cheaper. The model 10) will promote the transition between job categories, namely from unskilled to semiskilled and therefore increase a migrant’s revenue by an estimated 40%. Model 11) will promote the access to factual information that will help migrants in making informed decisions about migration. By providing migrants with a cost and benefit analysis, information on the skill requirements abroad and the real wages corresponding to their skills MRC will implement the migration management policies at the provincial and or municipal level if so decided by the new Federal Government. Module 12) will cover the provision of financial products to households by the BFIs, MFIs and MTOs. Finally the model 13 will provide tailored financial literacy at both the departing migrants and their family members. Since financial literacy is cross-cutting it may well be that one participant may attend two or more training modules, for instance the modules for model 13 and model 9. The financial literacy provider will make sure that the candidate will be only counted once in the final attendants tally. On the other hand if a member of the household (non-migrant) attends the module under model 12 and the departing migrant of the same household follows another module for instance under model 9, they will be counted as distinct (different) attendees. Finally if the financial literacy course provider procures all
50 Ibidem

the modules under all the models, the Challenge Fund participation will be reduced and shall not exceed 50% of the cost. To better illustrate how the M4P approach has been used for determining the intervention points through all the market failures please refer to figure 30. Figure 29 Market failures affecting the migration process in Nepal.
Market Failures
Capital Market Failure (missing market)
Labour Market Failure
Information failure (Information asymmetry)
Inequitable Access cross cutting
BFIs fail to produce financial products requested and needed
by Migrants
Majority of Nepali migrants is
unskilled, skill mismatch for better paying jobs abroad,
loss of acquired skills and
motivation for returnee migrants due to mismatch
between acquired skills and jobs
available in Nepal
RAs are the sole providers of
information on job availability abroad. Migration decision
is based on hearsay,
migrants households don't have access to financial
products that could increase
their propensity to
save
Migrants/returnees and migrants
households lack the skills to understand the opportunities
offered by financial products.
Model 9 Model 10 model 11 Model 12 Model 13
Financial products for lowering the cost of migration Migrant Skilling
Access to factual information (innovative technology)
Financial products for savings and investments
Financial literacy
BFIs and MTOs offer loans, remittance and other products
relevant to migration
Fair recruitment Agencies and other
stakeholders provide training for the most requested
sectors
Migrants access innovative
technology for factual
information on job opportunities and skills required for
higher income
1) BFIs make savings
schemes and insurance products
more accessible to
migrant households 2) BFIs and MFIs make
microfinance loans more
accessible to migrant
households
Organisations deliver tailored financial
literacy to migrant households, women
and DAGs
Figure 30 Example of M4P addressing the Monopoly Power.
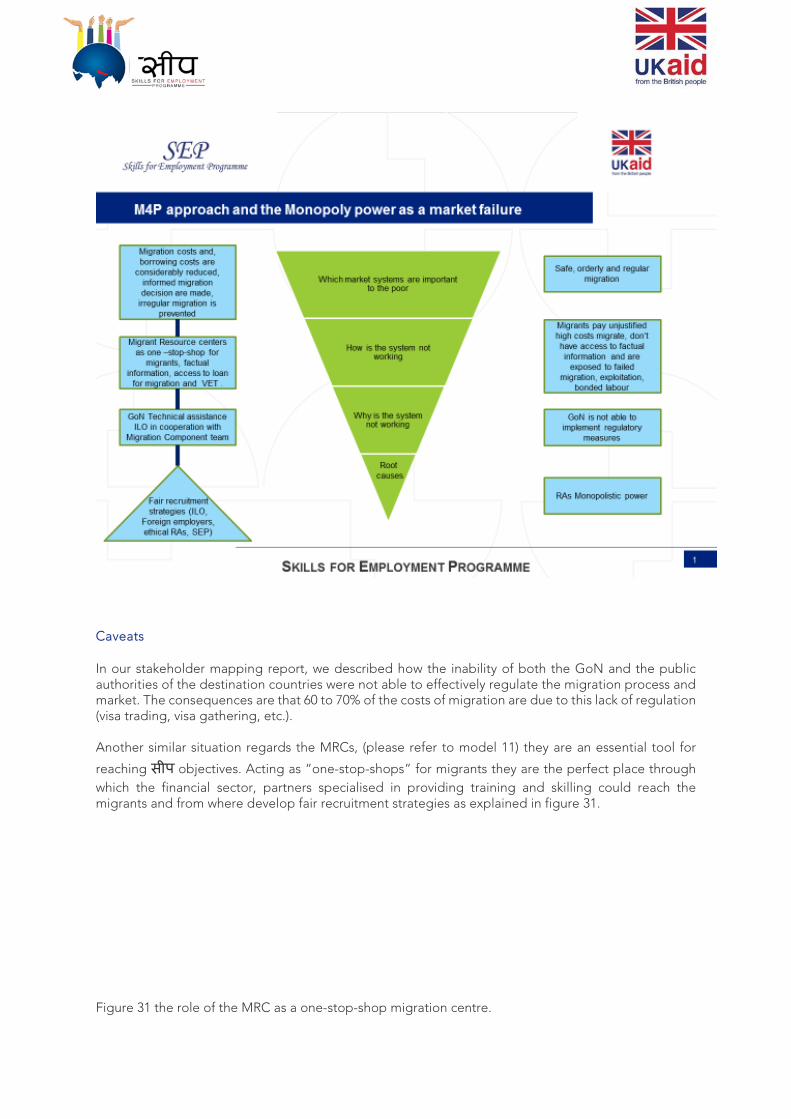
Caveats In our stakeholder mapping report, we described how the inability of both the GoN and the public authorities of the destination countries were not able to effectively regulate the migration process and market. The consequences are that 60 to 70% of the costs of migration are due to this lack of regulation (visa trading, visa gathering, etc.). Another similar situation regards the MRCs, (please refer to model 11) they are an essential tool for
reaching सीप objectives. Acting as “one-stop-shops” for migrants they are the perfect place through which the financial sector, partners specialised in providing training and skilling could reach the migrants and from where develop fair recruitment strategies as explained in figure 31. Figure 31 the role of the MRC as a one-stop-shop migration centre.
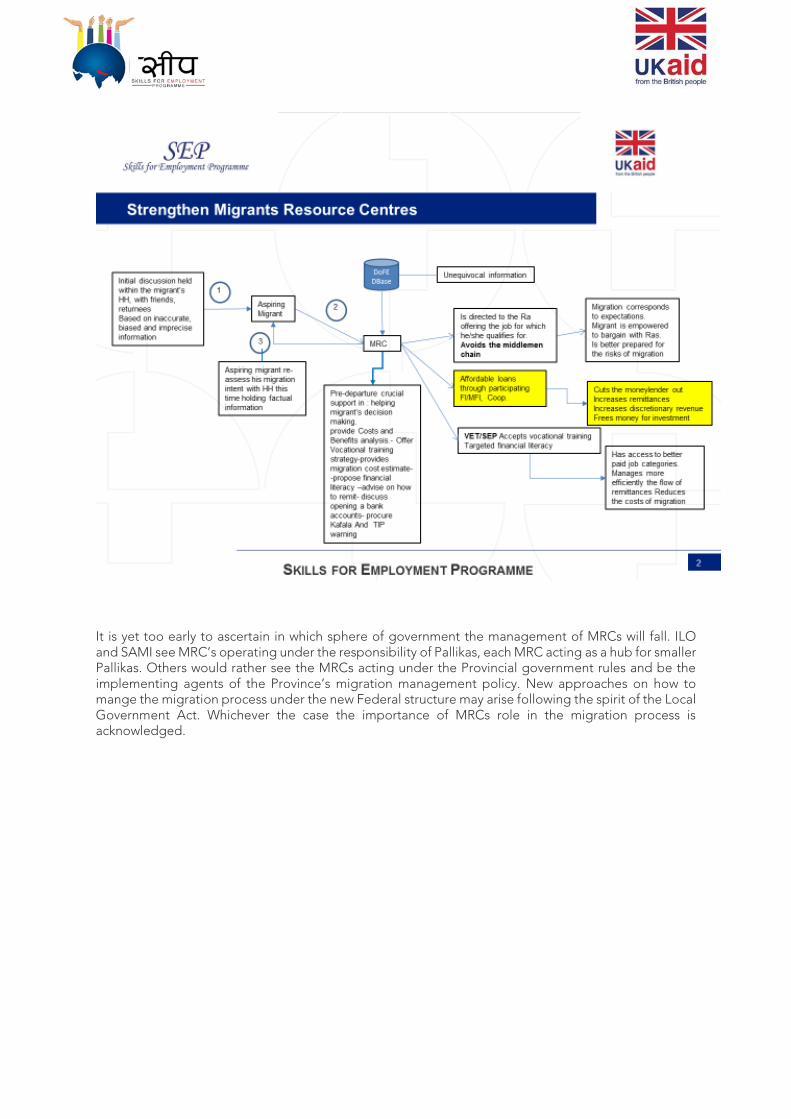
It is yet too early to ascertain in which sphere of government the management of MRCs will fall. ILO and SAMI see MRC’s operating under the responsibility of Pallikas, each MRC acting as a hub for smaller Pallikas. Others would rather see the MRCs acting under the Provincial government rules and be the implementing agents of the Province’s migration management policy. New approaches on how to mange the migration process under the new Federal structure may arise following the spirit of the Local Government Act. Whichever the case the importance of MRCs role in the migration process is acknowledged.
5. Conclusions The beneficiaries
The potential beneficiaries of the सीप are to be found in province 7, 5, and 2. These are the provinces with the highest concentration of poor young illiterate Nepali and DAG’s group. They earn a daily remuneration which ranges between the national extreme poverty line and Nepal’s minimum wage equivalent to USD 3.84 per day, women are the poorest members of this category. Short term migrants and long-term migrants are two distinct groups with different socio-economic background. The poorest migrants constitute the absolute majority of the short-term category and migrate to India, where according to the 2001 Indian census Nepali women exceeded the number of men. First-time long-term migrants represent the category most exposed to the market failures affecting migration. Elevating migrants from the unskilled to semi-skilled category can increase their
revenues substantially. There is a negative externality that needs to be addressed, सीप needs to support domestic skills market substantially if it wants to prevent skilled Nepali from migrating. Remittances and productive investment When we looked at the allocation of the remittances per group, we found that the share of remittances spent on daily consumption is determined by the initial asset amounts of the household. For the poorest households, the allocation will be prioritised by the satisfaction of urgent needs: food security, housing security, health and education. Long term migrants who could afford more expensive migration corridors and higher salaries have a substantially different consumption pattern spending only 40% of their remittances for daily consumption and 25% in purchasing real estate. Both categories of migrants are willing to invest their savings and remittances into productive investments but are prevented from doing so specifically by the absence of markets, namely credits and financial products targeted to their needs, the lack of an investment conducive environment will likely be solved by the new measure the GoN has announced in its first Federal Budget Plan (208-2019). . Corridors India remains the favourite destination for Nepali migrants, the following corridors: Province 5/India, Province 2/India (and Province 7) should be considered as priority corridors for short term migrants
since they contain the highest proportion of सीप targeted beneficiaries. The same provinces should be prioritized for other corridors, particularly Province 2 and 5 from where the majority of migrants going abroad originate from. The GoN diversification strategy is opening up new migration corridors. The sectors for which the demand for foreign workers is high vary according to the destination country. The skilling and training aspiring migrants should be receiving will also depend on their initial literacy level and the destination countries conditionalities. For example, European countries like Sweden and Denmark with ageing population and Israel need caregivers who are requested to be proficient in English, the Korea EPS system requires migrants to pass the TOPIK test to prove their familiarity with the Korean language. Skilling and training
सीप is based on a demand driven model and so skilling must be used to match the foreign employment market demand with the Nepali migrants’ skills. According to existing and new potential corridors and the Firm Survey the Migration Component team as conducted with RAs, the sectors for which trainings and skilling should be provided are: Health, Horeca, Hospitality and Tourism, Construction, Manufacturing, and Agriculture. In a follow-on report, we will discuss the windows of intervention (the models) that respond to the market failures addressed and select those that could be used as pilots.
Annexes Annex I: New possible countries of destination and sectors for employment
Countries Sweden
Denmark
Malta
Czech Republic
Russia
Poland
Romania
Portugal
India
China
Sri Lanka
Maldives
Fiji
Seychelles
Job categories/secto
rs
Caretakers y y y Health y y
Social service y y y English teachers y y
Services y Manufacturing y y y wholesale/retail
trade y y y y Travel Agency y Assembly unit y
Domestic workers y Janitorial y
Accountants y Lawyers y Doctors y
Biologists y Head Nurse y y
Forestry y Agriculture y y y y
IT y Telecommunicat
ion Y Fishery y
Construction y y y y y y y security y
Sales agents y Garment y y
Sales Hospitality/touris
m y y y y y y y Packers y drivers y
technicians y Highly skilled y y
Business assistant y
Sea cruise ships
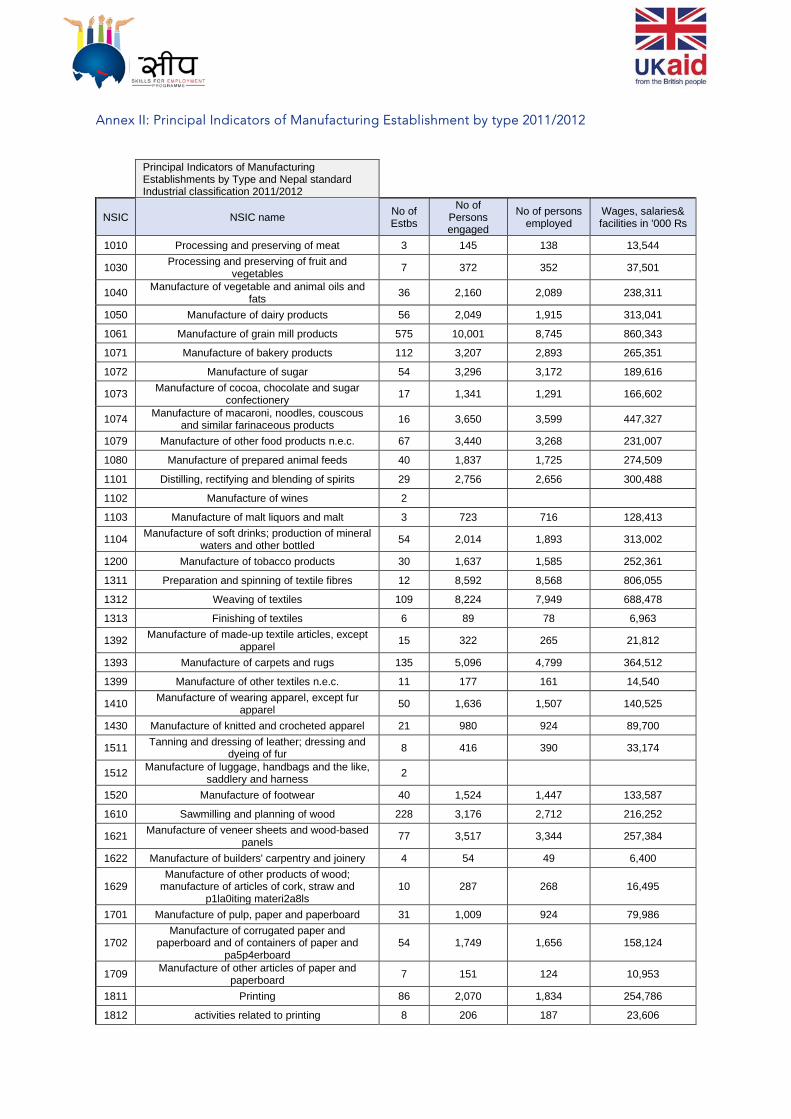
Annex II: Principal Indicators of Manufacturing Establishment by type 2011/2012
Principal Indicators of Manufacturing Establishments by Type and Nepal standard Industrial classification 2011/2012
NSIC NSIC name No of Estbs
No of Persons engaged
No of persons employed
Wages, salaries& facilities in '000 Rs
1010 Processing and preserving of meat 3 145 138 13,544
1030 Processing and preserving of fruit and vegetables 7 372 352 37,501
1040 Manufacture of vegetable and animal oils and fats 36 2,160 2,089 238,311
1050 Manufacture of dairy products 56 2,049 1,915 313,041
1061 Manufacture of grain mill products 575 10,001 8,745 860,343
1071 Manufacture of bakery products 112 3,207 2,893 265,351
1072 Manufacture of sugar 54 3,296 3,172 189,616
1073 Manufacture of cocoa, chocolate and sugar confectionery 17 1,341 1,291 166,602
1074 Manufacture of macaroni, noodles, couscous and similar farinaceous products 16 3,650 3,599 447,327
1079 Manufacture of other food products n.e.c. 67 3,440 3,268 231,007
1080 Manufacture of prepared animal feeds 40 1,837 1,725 274,509
1101 Distilling, rectifying and blending of spirits 29 2,756 2,656 300,488
1102 Manufacture of wines 2 1103 Manufacture of malt liquors and malt 3 723 716 128,413
1104 Manufacture of soft drinks; production of mineral waters and other bottled 54 2,014 1,893 313,002
1200 Manufacture of tobacco products 30 1,637 1,585 252,361
1311 Preparation and spinning of textile fibres 12 8,592 8,568 806,055
1312 Weaving of textiles 109 8,224 7,949 688,478
1313 Finishing of textiles 6 89 78 6,963
1392 Manufacture of made-up textile articles, except apparel 15 322 265 21,812
1393 Manufacture of carpets and rugs 135 5,096 4,799 364,512
1399 Manufacture of other textiles n.e.c. 11 177 161 14,540
1410 Manufacture of wearing apparel, except fur apparel 50 1,636 1,507 140,525
1430 Manufacture of knitted and crocheted apparel 21 980 924 89,700
1511 Tanning and dressing of leather; dressing and dyeing of fur 8 416 390 33,174
1512 Manufacture of luggage, handbags and the like, saddlery and harness 2
1520 Manufacture of footwear 40 1,524 1,447 133,587
1610 Sawmilling and planning of wood 228 3,176 2,712 216,252
1621 Manufacture of veneer sheets and wood-based panels 77 3,517 3,344 257,384
1622 Manufacture of builders' carpentry and joinery 4 54 49 6,400
1629 Manufacture of other products of wood;
manufacture of articles of cork, straw and p1la0iting materi2a8ls
10 287 268 16,495
1701 Manufacture of pulp, paper and paperboard 31 1,009 924 79,986
1702 Manufacture of corrugated paper and
paperboard and of containers of paper and pa5p4erboard
54 1,749 1,656 158,124
1709 Manufacture of other articles of paper and paperboard 7 151 124 10,953
1811 Printing 86 2,070 1,834 254,786
1812 activities related to printing 8 206 187 23,606
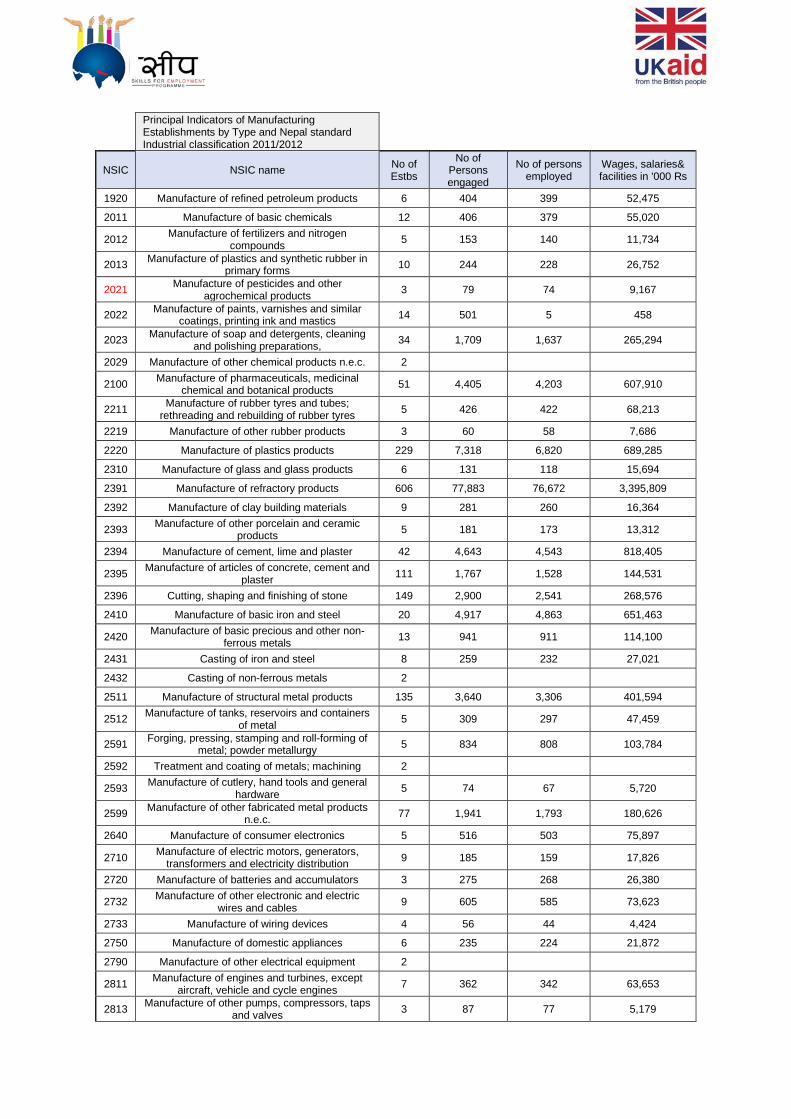
Principal Indicators of Manufacturing Establishments by Type and Nepal standard Industrial classification 2011/2012
NSIC NSIC name No of Estbs
No of Persons engaged
No of persons employed
Wages, salaries& facilities in '000 Rs
1920 Manufacture of refined petroleum products 6 404 399 52,475
2011 Manufacture of basic chemicals 12 406 379 55,020
2012 Manufacture of fertilizers and nitrogen compounds 5 153 140 11,734
2013 Manufacture of plastics and synthetic rubber in primary forms 10 244 228 26,752
2021 Manufacture of pesticides and other agrochemical products 3 79 74 9,167
2022 Manufacture of paints, varnishes and similar coatings, printing ink and mastics 14 501 5 458
2023 Manufacture of soap and detergents, cleaning and polishing preparations, 34 1,709 1,637 265,294
2029 Manufacture of other chemical products n.e.c. 2
2100 Manufacture of pharmaceuticals, medicinal chemical and botanical products 51 4,405 4,203 607,910
2211 Manufacture of rubber tyres and tubes; rethreading and rebuilding of rubber tyres 5 426 422 68,213
2219 Manufacture of other rubber products 3 60 58 7,686
2220 Manufacture of plastics products 229 7,318 6,820 689,285
2310 Manufacture of glass and glass products 6 131 118 15,694
2391 Manufacture of refractory products 606 77,883 76,672 3,395,809
2392 Manufacture of clay building materials 9 281 260 16,364
2393 Manufacture of other porcelain and ceramic products 5 181 173 13,312
2394 Manufacture of cement, lime and plaster 42 4,643 4,543 818,405
2395 Manufacture of articles of concrete, cement and plaster 111 1,767 1,528 144,531
2396 Cutting, shaping and finishing of stone 149 2,900 2,541 268,576
2410 Manufacture of basic iron and steel 20 4,917 4,863 651,463
2420 Manufacture of basic precious and other non-ferrous metals 13 941 911 114,100
2431 Casting of iron and steel 8 259 232 27,021
2432 Casting of non-ferrous metals 2
2511 Manufacture of structural metal products 135 3,640 3,306 401,594
2512 Manufacture of tanks, reservoirs and containers of metal 5 309 297 47,459
2591 Forging, pressing, stamping and roll-forming of metal; powder metallurgy 5 834 808 103,784
2592 Treatment and coating of metals; machining 2
2593 Manufacture of cutlery, hand tools and general hardware 5 74 67 5,720
2599 Manufacture of other fabricated metal products n.e.c. 77 1,941 1,793 180,626
2640 Manufacture of consumer electronics 5 516 503 75,897
2710 Manufacture of electric motors, generators, transformers and electricity distribution 9 185 159 17,826
2720 Manufacture of batteries and accumulators 3 275 268 26,380
2732 Manufacture of other electronic and electric wires and cables 9 605 585 73,623
2733 Manufacture of wiring devices 4 56 44 4,424
2750 Manufacture of domestic appliances 6 235 224 21,872
2790 Manufacture of other electrical equipment 2
2811 Manufacture of engines and turbines, except aircraft, vehicle and cycle engines 7 362 342 63,653
2813 Manufacture of other pumps, compressors, taps and valves 3 87 77 5,179
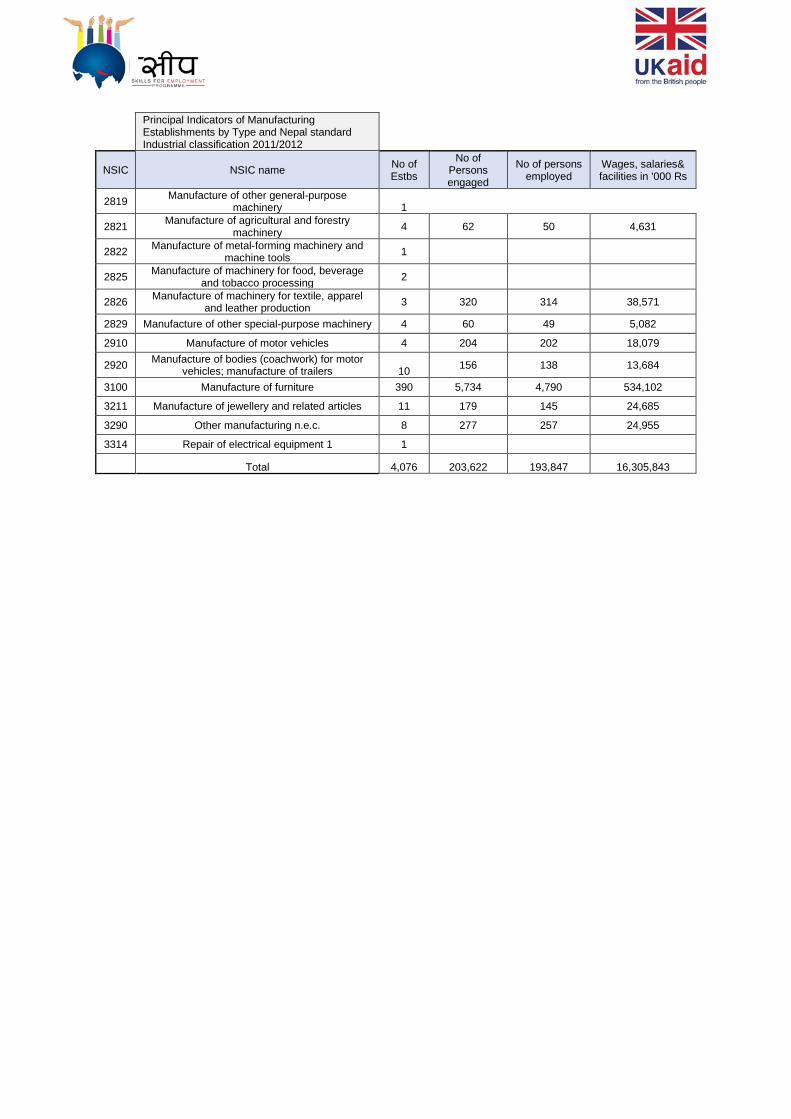
Principal Indicators of Manufacturing Establishments by Type and Nepal standard Industrial classification 2011/2012
NSIC NSIC name No of Estbs
No of Persons engaged
No of persons employed
Wages, salaries& facilities in '000 Rs
2819 Manufacture of other general-purpose machinery 1
2821 Manufacture of agricultural and forestry machinery 4 62 50 4,631
2822 Manufacture of metal-forming machinery and machine tools 1
2825 Manufacture of machinery for food, beverage and tobacco processing 2
2826 Manufacture of machinery for textile, apparel and leather production 3 320 314 38,571
2829 Manufacture of other special-purpose machinery 4 60 49 5,082
2910 Manufacture of motor vehicles 4 204 202 18,079
2920 Manufacture of bodies (coachwork) for motor vehicles; manufacture of trailers 10 156 138 13,684
3100 Manufacture of furniture 390 5,734 4,790 534,102
3211 Manufacture of jewellery and related articles 11 179 145 24,685
3290 Other manufacturing n.e.c. 8 277 257 24,955
3314 Repair of electrical equipment 1 1 Total 4,076 203,622 193,847 16,305,843