
Macroeconomic Indicators and Stock Market Development
12
Developing Country Studies www.iiste.org ISSN 2224-607X (Paper) ISSN 2225-0565 (Online) Vol.5, No.9, 2015 139 Macroeconomic Indicators and Stock Market Development Rafaqat Ali M. Phil Scholar, Department of Economic, The Islamia University of Bahawalpur E -mail: [email protected] Muhammad Abrar ul haq Ph.D Scholar, School of Economics, Finance and Banking, University Utara Malaysia Email: [email protected] Shafqut Ullah Ph.D scholar, Department of Economics, Quaid-e-Azam University Islamabad, Pakistan Email: [email protected] Abstract The stock markets play a key role in both developing and advanced countries because it channelize idle money into productive investment and generate capital for businesses which boosts the economy up. Pakistan’s stock market is an emerging stock market. The main objective of the study is to check the contribution of macroeconomic indicator to the stock market development. In this study, an attempt is made to capture the macroeconomic determinants that effect more or less in stock market development. Karachi Stock Exchange (KSE) is taken as a representative stock exchange of Pakistan. This study considered Gross Domestic Saving (GDS), Money Supply (MS) and Foreign Remittances (FR) as explanatory variables and stock market development (SMD) takes as dependent variable. The study employed Phillips and Perron (PP) test for Stationarity. Finally the study utilized the ARDL to co-integration approach because it is more dominant and robust procedure to examine the short run and long run dynamic relationship. Autoregressive distributed lag (ARDL) and Error Correction Model used to find the relationship between the variables of selected econometric model. The ARDL to Co-integration results showed that Gross domestic savings ,money supply positively contribute to the development of stock market in Pakistan in both short run and long run that are consistent with theoretical and conceptual framework and literature (See also; Raza et al., 2012; Adam and Tweneboah, 2009). Foreign remittances have insignificant effect in both short run and long run on stock market because most of the foreign remittances are used in consumption. CUSUM lines remained inside the critical bound at 5 percent significance level that guaranteed the stability of model. Keywords: Stock Market development, Money Supply, Gross Domestic Saving, Foreign Remittances Introduction We cannot reject the role of stock market in an economy. It plays a central role in an economy because it is a source of long term funding to the firms which means more investment, more employment opportunities and more output and economic growth and development of the economy. It encourages savings which generate more capital through the use of idle money. So it is not be wrong to say that development of stock market is actually a development of an economy. In this respect it is very important to give the confidence to the investors of stock market. Investor’s confidence can be built by many firm related variables as well as many external variables like inflation etc. In this research paper, an attempt is made to capture some major macroeconomic factors that may affect to the stock market. The main objective of the study is to measure the effect of macroeconomic indicators on the development of stock market in Pakistan. Selected macroeconomic indicators are money supply, exchange rate, gross domestic savings, and foreign remittance. There is no any doubt that economic activity has substantial role in the improvement of stock market. So here we focused on some macroeconomic indicators as gross domestic savings, money supply, and foreign remittances. Now the question is why we choose these variables? Because money supply is associated with the money in circulation and it is also one of the tools of monetary policy. Gross domestic savings promotes capital formation in an economy that leads to aggregate capitalization so called stock market development. Foreign remittances 1 play crucial role in developing countries like Pakistan. It improves economy’s foreign exchange reserve that is one of the causes of investment in Pakistan. Due to these reasons we tried to check the existence 1 After 9/11 attack on World Trade Center, Pakistan’s stock market moves towards the growth because of the inflow of capital from developed countries in the form of remittances. The reason behind this is the uncertainty of survival among Muslims especially among Pakistanis in all over the world. Due to the uncertainty and instability factors, they shifted their assets in bulks forms to their domestic countries.
-
Upload
independent -
Category
Documents
-
view
0 -
download
0
Transcript of Macroeconomic Indicators and Stock Market Development

Developing Country Studies www.iiste.org
ISSN 2224-607X (Paper) ISSN 2225-0565 (Online)
Vol.5, No.9, 2015
139
Macroeconomic Indicators and Stock Market Development
Rafaqat Ali
M. Phil Scholar, Department of Economic, The Islamia University of Bahawalpur
E -mail: [email protected]
Muhammad Abrar ul haq
Ph.D Scholar, School of Economics, Finance and Banking, University Utara Malaysia
Email: [email protected]
Shafqut Ullah
Ph.D scholar, Department of Economics, Quaid-e-Azam University Islamabad, Pakistan
Email: [email protected]
Abstract
The stock markets play a key role in both developing and advanced countries because it channelize idle money
into productive investment and generate capital for businesses which boosts the economy up. Pakistan’s stock
market is an emerging stock market. The main objective of the study is to check the contribution of
macroeconomic indicator to the stock market development. In this study, an attempt is made to capture the
macroeconomic determinants that effect more or less in stock market development. Karachi Stock Exchange
(KSE) is taken as a representative stock exchange of Pakistan. This study considered Gross Domestic Saving
(GDS), Money Supply (MS) and Foreign Remittances (FR) as explanatory variables and stock market
development (SMD) takes as dependent variable. The study employed Phillips and Perron (PP) test for
Stationarity. Finally the study utilized the ARDL to co-integration approach because it is more dominant and
robust procedure to examine the short run and long run dynamic relationship. Autoregressive distributed lag
(ARDL) and Error Correction Model used to find the relationship between the variables of selected econometric
model. The ARDL to Co-integration results showed that Gross domestic savings ,money supply positively
contribute to the development of stock market in Pakistan in both short run and long run that are consistent with
theoretical and conceptual framework and literature (See also; Raza et al., 2012; Adam and Tweneboah, 2009).
Foreign remittances have insignificant effect in both short run and long run on stock market because most of the
foreign remittances are used in consumption. CUSUM lines remained inside the critical bound at 5 percent
significance level that guaranteed the stability of model.
Keywords: Stock Market development, Money Supply, Gross Domestic Saving, Foreign Remittances
Introduction
We cannot reject the role of stock market in an economy. It plays a central role in an economy because it is a
source of long term funding to the firms which means more investment, more employment opportunities and
more output and economic growth and development of the economy. It encourages savings which generate more
capital through the use of idle money. So it is not be wrong to say that development of stock market is actually a
development of an economy. In this respect it is very important to give the confidence to the investors of stock
market. Investor’s confidence can be built by many firm related variables as well as many external variables like
inflation etc. In this research paper, an attempt is made to capture some major macroeconomic factors that may
affect to the stock market.
The main objective of the study is to measure the effect of macroeconomic indicators on the
development of stock market in Pakistan. Selected macroeconomic indicators are money supply, exchange rate,
gross domestic savings, and foreign remittance. There is no any doubt that economic activity has substantial role
in the improvement of stock market. So here we focused on some macroeconomic indicators as gross domestic
savings, money supply, and foreign remittances.
Now the question is why we choose these variables? Because money supply is associated with the
money in circulation and it is also one of the tools of monetary policy. Gross domestic savings promotes capital
formation in an economy that leads to aggregate capitalization so called stock market development. Foreign
remittances1 play crucial role in developing countries like Pakistan. It improves economy’s foreign exchange
reserve that is one of the causes of investment in Pakistan. Due to these reasons we tried to check the existence
1 After 9/11 attack on World Trade Center, Pakistan’s stock market moves towards the growth because of the inflow of
capital from developed countries in the form of remittances. The reason behind this is the uncertainty of survival among
Muslims especially among Pakistanis in all over the world. Due to the uncertainty and instability factors, they shifted their
assets in bulks forms to their domestic countries.

Developing Country Studies www.iiste.org
ISSN 2224-607X (Paper) ISSN 2225-0565 (Online)
Vol.5, No.9, 2015
140
of the relationship between macroeconomic variable and stock market development in Pakistan.
Financial sector reforms and stock market openness in Pakistan started in 1991. But since 1991 after the
period of liberalization of stock market, the stock market has developed very fast with remarkable notion. During
1991 the stock market of Pakistan witnessed a boom. Large number of developments has being done in this era.
The firstly, the process of financial liberalization results in an inflow of foreign investment which increases the
trading volume of stock market. Secondly, the process of privatization and offering of new shares that leads to
high growth in stock market, thirdly, political stability which increases the investors’ confidence. A rapid
development has been shown in last few years in which KSE-100 index goes up to its highest psychological
height which shows the attraction of investors and well functioning of stock market in Pakistan.
Suleman et al. (2009) found a significant impact of exchange rate and exchange reserves on stock
market after financial reforms in 1991. Consecutively, Pakistan stock market is said the best performing stock
market in emerging stock exchanges of the world in 2002. All this shows that Pakistan’s stock market is now a
prominent stock market in the world. But there are some issues and problems facing Pakistan economy such as
energy crisis, terrorism and political instability that affect investor’s decision making and can affect the stock
market performance in adverse manners. This study is conducted to check this question that is there any co-
integration relation exist between economic activity i-e money expansion, domestic saving and foreign
remittances on stock market development.
Literature Review
Grossman and Shiller (1980) worked on the determinants that cause the volatility in stock prices. They did not
go beyond the discount factor analysis. The study also documented the positive functional relation among stock
returns and real variables like capital investment and output growth. Finally, the results confirmed the negative
statistically significant relationship between inflation and stock return. Fama (1981) resulted negative significant
relationship between consumer prices and real economic activity which induced inverse relation between
inflation and stock returns by taking monthly, quarterly and annually data and applied capital regression on each
data set separately.
Abdullah and Hyworth (1993) identified a group of macroeconomic indicators which has granger causal
to the share prices in USA. The study employed Granger Causality and Vector Autoregressive model for analysis.
Money growth, budget deficit and long run interest rate had granger cause to the stock prices. The study also
established a direct link between money growth, inflation and stock prices.
Mukherjee et al. (1995) found negative relationship between inflation, government bond and stock
prices in Japan. Interest rates on the Tokyo Stock Exchange were found to move in opposite directions. Humpe
and Macmillan (2007) analyzed the response of many macro variable on stock index in United States and Japan.
The study compared the American and Japan stock exchanges for the period of 1965 until 2005. They found that
industrial production had positive impact on stock price. Long run interest rate and money growth were found a
negative effect with stock market.
Adam and Tweneboah (2008) analyzed relationships between the stock prices and some economic
indicators by selecting the period from 1991 to 2006 and used Johansen's Multivariate cointegration approach for
Ghana. The findings of Impulse Response Function (IRF) demonstrated that FDI and interest rate were the major
estimators of the stock index in Ghana.
Mohammad et al. (2009) found that foreign exchange reserve was positively associated with stock price
index in Pakistan. Wisnieweski (2009) tried to explain the political factor that explains the behavior of stock
price variability. Pilinkus (2009) attempted to explain the behavior of stock prices in Lithuania. He found that
stock prices are directly affected by GDP and money supply. Asaolu et al. (2010) analyzed the impact of
macroeconomic variables on stock market in Nigeria. Results explained that only exchange rate had Granger
caused to share prices. Gross domestic product growth rate and monetary expansion affect stock market prices.
Singh et al (2011) empirically found that GDP has positive but inflation, exchange rate, and money supply were
negatively related with stock returns.
Micro and macro level study of stock market had been done by Ali (2011) in Bangladesh. Inflation,
foreign remittance used as macro level and market price earnings, growth in market capitalization micro level
variables. Multivariate Regression Model was employed and found that inflation and foreign remittance
negatively related to stock prices. Industrial production index, market earning per share and growth in market
capitalization had positive impact on stock market. Rukh et al.(2011) found that changes in discount rate had
involvement in the trading volume at KSE, while the CPI and Treasury bill had inconsequential effect on the
trading volume of KSE- 100 index.
Azam (2011) attempted to explain the behavior of stock price variability by analyzing both internal and
external variables in Pakistan. He focused on variables that are known good estimator from investor’s point of
view. Empirical findings showed that the stock prices had positive effect on GDP growth. But interest rate was
found to be negative.

Developing Country Studies www.iiste.org
ISSN 2224-607X (Paper) ISSN 2225-0565 (Online)
Vol.5, No.9, 2015
141
Raza et al. (2012) made an attempt to investigate the behavior of foreign direct investment towards
stock market growth in Pakistan by taking annual data from 1988 to 2009. Domestic savings also positively
related but exchange rate and inflation had a negative effect. The study suggested that foreign direct investment
can boosts up by providing adequate facility of infrastructure. Raimony et al. (2012) found macroeconomic
variable had unfavorable effect on stock returns except GDP that had positive impact on return.
Theoretical and Conceptual Framework
The study is based on “Efficient Market Hypothesis” presented by Fama in 1965. It explains that no one can
achieve benefit from stock market constantly if it does not use the current information. Now we will give
theoretical explanation of econometric model with respect to stock market.
Money Supply and Stock Market Development
In current study, we use M1 as proxy for money supply. It is narrow money which is equal to currency in market
plus demand deposits. In literature most researchers used M2 as a measure of money supply? Now the question
is: Why we choose M1 instead of M2? Because M1 is money that is most associated to money as men in streets
because it covers most frequently used means of payments of cash and cheques drawn on banks current accounts.
So that’s why, we are concerned to the information of current circulation and demand deposits. Monetary policy
of the economy plays a significant role through its tools to control the situation like interest rate, bank rate and
open market operation. Easy or expansionary and tight monetary policy has two sided effects.
By adopting easy monetary policy, there is a possibility of excess liquidity through open market
operation. People will sale bonds for high return which results in a rise in money supply. It will rise bond prices
and interest rate goes down which leads high stock prices. Money supply may affect stock prices in two ways:
First, money supply behaves negatively with stock market development as an expansion in money growth in
market will increase unanticipated inflation. Consequently in this way uncertainty among the investor rise
which will lead to decrease to the stock price.
Second, money supply shows positive influence on stock price. A rise in money supply may stimulate
the economic growth and economic activity that will increase the corporate earnings of the firms as a result
future cash flow will increase and consequently stock prices goes up. Akbar etal (2012), Suleman et al (2009),
Pilinkus (2009), Humpe and Macmillan (2007) and Mukherjee and Naka (1995) empirically established direct
relationship between money expansion and stock prices. Negative effect of money supply has been found by
Raza et al. (2012), Singh et al. (2011), Gan et al (2006).
Stock Market Development and Consumer Price Index (CPI)
Inflation can be described as the persistence and consistence raise in general price level. Inflation is measured in
term of consumer price index (CPI) and GDP deflator. But most common measure of inflation is consumer price
index. In literature most researchers use consumer price index to measure inflation rate. CPI measures changes in
the prices of basket of consumer goods in a given time period. When there is a rise in the consumer price index it
means the general price level goes up so inflation at consumer end. CPI is calculated for given set of goods and
services in turn to find out the changes in the index on monthly or annually basis. Here we try to find the
relationship between inflation and stock price variability. Inflation may affect stock prices in negative manners.
As inflation increases stock prices will decrease because of purchasing power reduced than before. High
inflation leads to tight monetary and fiscal policies. On contrary it may affect stock market index in a positive
way also. As inflation is there it can stimulate the economy so in this way stock prices move in upward because
it increases the profits of firms so future cash flow generated as a result stock prices increases. In literature
Rashid et al (2011), Hosseini et al (2011) and Akmal (2007) found positive relation of CPI with stock price
indices. But Akbar etal (2012), Raza et al.(2012), Singh et al.(2011), Ali (2011), Butt et al.(2010), Humpe and
Macmillan (2007).
Stock Market Development and Gross Domestic Savings (GDS) Gross domestic savings is equal to the difference between GDP and total final consumption expenditures. Stock
market provides us a platform to channelize the domestic saving into productive investment. Household savings
generates investment and capital formation which leads to stimulate economic growth. Household savings also
become cause of inflow of capital throughout the stock markets in the economy. Raza et al (2012) found
positive relationship between gross domestic savings and stock price index in Pakistan. Expected functional
relationship is positive between Domestic Savings on stock market.
Foreign Remittances and Stock Market Development
Foreign remittances are the income which is transferred by immigrants who are employed in foreign country.
Money sent to home by migrants constitutes one of the largest financial inflows to Pakistan. The share of

Developing Country Studies www.iiste.org
ISSN 2224-607X (Paper) ISSN 2225-0565 (Online)
Vol.5, No.9, 2015
142
Foreign remittances increases than international aid to Pakistan. Foreign remittances are one of the major sources
of inflow of capital from developed to developing countries. This inflow boosts up the economy. In this respect,
the theory established positive link between stock prices and workers’ remittances because a rise in foreign
remittances generates income level which leads to increase saving and do investment in stock market.
In this way, shares demand increases and the stock prices moves upward. Theory suggests positive
association between stock market and remittances. Ali et al.(2011) found negative relation between them for
Bangladesh. In Pakistan no any study found which tried to check the dynamic relationship between worker’s
remittances and stock market development.
Data and Methodology
The data is collected from State Bank of Pakistan (SBP), Pakistan economic survey and World Bank official
website. The study use annual data from 1973 to 2012. The study employed Philips and Perron Test for
stationary measures. After that ARDL to co-integration technique is employed to measure relationship in short
run and in long run in our analysis.
Econometric model is as under:
Where,
SMD = Stock Market Development
GDS = Gross Domestic Savings
MS = Money Supply
FR = Foreign Remittances
Measurement of the variables
Stock Market Development
Development of Stock market is measured by using a proxy aggregate market capitalization growth at KSE.
Aggregate market capitalization is the overall value of all ordinary shares in Karachi stock exchange (Pakistan
Economic Survey). Data is taken from state bank of Pakistan. This study use market capitalization as a proxy to
measure stock market development.
Gross Domestic Saving
Gross domestic saving is obtained after deducting final consumption expenditure from Gross domestic
expenditure. Data is taken from World Bank.
Money Supply
M1 is taken as proxy for money supply which is considered as narrow money which consists of currency plus
demand deposits. M1 is money that is most associated to money as men in streets because it covers most
frequently used means of payments of cash and cheques drawn on banks current accounts. Data source is world
development indicator (World Bank).
Foreign Remittances Foreign remittances are the income which is transferred by immigrants who are employed in foreign country.
Money sent to home by migrants constitutes one of the largest financial inflows to Pakistan. Data source is world
development indicator (World Bank).
Brief Description of Estimation Techniques:
Phillips and Perron Test of Unit Root (PP test)
For unit root test PP test is employed because it is non parametric in nature and corrects problem of serial
correlation and problem of heteroscedasticity in error term. The mathematically PP test has approximately same
as augmented dickey fuller (ADF) that is constant and trend which is represented as in:
∆Xt= β1 + βt2 + γ Mt-1 + ᶓ
∆Xt= β1 + γ Mt-1 + ᶓ
In above equations, β1 is constant and β2t trend and second equation consist of only constant term (β1).
Here the null hypothesis (H0) is γ = 0 (the variable has a unit root) which is less restricted as ADF. Normally
ADF and PP tests provide the same results concerning to the order of integration. If the Ho is rejected, then the
variable is said stationary or independent of time. If the Ho not to be rejected then the variable is said non-
stationary or have time effect.

Developing Country Studies www.iiste.org
ISSN 2224-607X (Paper) ISSN 2225-0565 (Online)
Vol.5, No.9, 2015
143
ARDL to Co integration
The present study employs Auto Regressive Distributed Lag (ARDL) model to co-integration that was
projected by Pearson et al. (2001). Lagged independent variables through auto time alteration process is taken by
ARDL approach which is one of the main features of this approach. This approach estimates the conditional
ARDL model for dependent variable and explanatory variables. The model can have the following form.
Z t = αo P t+α1Pt-1+α2Pt-2 +…..+£k P t-k+µt ………………………………….. (I)
In above model, independent variable P i changes in t- period and it occurs αi change in Y t by (α0,
α1…αk ) is the effect on Y after one period.
Another effect on Y is αk and this changes after k periods. So we can say, it takes k periods for the full effects of
the impulse to be recognized. The coefficients α0, α1…. αk made the impulse response function of plotting from
Pt to Zt.
Another way to confine the dynamic elements of this behavior is to add lagged values of the responded
variable and on the explanatory side of the regression model with the independent variable. In time series
analysis we usually include lag on both sides of explained and explanatory variables.
Z t= δo+δ1Zt-1+δ2Zt-2+………+δ n Z t-n +αo P t+α1Pt-1+α2Pt-2 +…..+αk P t-k+µt ……… (II)
The equation (II) describes the Autoregressive Distributed Lag Model (ARDL) (n, k). Here n and k
means the quantity of lags of Z and P can be used. Length of lags is selected on the ground of the statistical
significance of lagged variables. Finally, resulting model is soundly précised which shows that the model is free
from the problem of serial correlation.
Operations in ARDL Model
To check the dynamics relationship, it is constructive to employ lag operator (L) which is also identified as the
toward the back shift of (II) operator. It can be written in the form of algebra as
LZ t == Z t-1, L
2Z t ==
Z t-2… L
k Z t
==
Z t-k
Z t -Z t-1 == (1-L) Z t
Z t -Z t-1- Z t-2== (1-L-L2) Z t
Z t +δ Z t-1+ δ2Z t-2 + ……….+δ
k Z t-k == (1+ δ L+ δ
2L
2 ………+δ
k L
k) Z t
1+ δ L+ δ2L
2 + δ
3L
3+……….
= 1/1- δL if | δ| < 1
First Order ARDL Model (1, 1)
The first order ARDL linear regression model form,
Z t= δo+δ1Zt-1 +α o P t+α1Pt-1 +µt t=1, 2, 3……….n ………………... (III)
Here a notable thing is that Z t is stable which means it converges to its equilibrium level
if -1 < δ < 1.
When Z t becomes stable then long run equilibrium equation (III) becomes as
Z t= ( δo /1-δ1)+(αo+α1/ 1-δ1) P t+µt/1-δ1
=WO+W1 P t +ƹt/1-δ1 ……………………………………………………………………… (IV)
Where Wo= ( δo /1-δ1) and W1= (αo+α1/ 1-δ1)
Equation (IV) is enquired with the supposition of Z t=Zt-1 and P t=P t-1
So objective value is
Z*
t= WO+W1 P t
General form of ARDL equation is as under:
There are two major steps of ARDL approach. First one is to test the long run relationship among the
dependent and independent variables. For this purpose F-test is used. Pesaran et al. (2001) found two set of
critical values: first set assumes that all variables are co-integrated at order I (1). The second set assumes the
variables are integrated at I (0) at given level of significance. These two sets are said upper critical bound (UCB)
and lower critical bound (LCB). If F-statistic is greater than upper critical bounds than co-integration
relationship exists. And if F statics is lower than lower critical bound than there is no co integration. And if F-
static is between upper and lower critical bound then the results are inconclusive.
The second step occupies long run and short run estimation. For short run analysis following model of
ECM is taken into consideration.
ECM equation is given below:

Developing Country Studies www.iiste.org
ISSN 2224-607X (Paper) ISSN 2225-0565 (Online)
Vol.5, No.9, 2015
144
By taking lag of our dependent variable and take it as an independent variable, we measure the short run
relationship as
To determine the goodness of fit of the ARDL model, diagnostic tests are constructed. Problems of
regression are checked by using diagnostic test. This test used CUSUM and CUSUMSQ to measure whether
model is stable or not. If the estimated line of CUSUM and CUSUM square remain inside the critical bounds
(upper bound and lower bound) of 5 %, then the model is called statistically stable otherwise instable.
Results and Discussions
Table 1: Results of Phillips Perron Test of unit root
Variables
Intercept Trend and Intercept
Co
nclu
sion
Null Hypothesis: The variable has a unit root or non-stationary
Coefficient
Standard
Error
Test
statistics
(t-value)
Coefficient Standard
Errors
Test -
statistics
(t-value)
WR
Level 0.134 0.044 3.048 0.099 0.061 1.621
I(1)
1st
Difference -0.532 0.155 -3.421 -0.635 0.163 -3.893
MS
Level 0.050 0.0390 1.293 -0.047 0.073 -0.635 I(1)
1st
Difference -0.771 0.1719 -4.483 -0.842 0.174 -4.826
GDS
Level 0.070 0.030 2.303 -0.034 0.067 -0.512 I(1)
1st
Difference -1.285 0.1682 -7.644 -1.562 0.144 -10.78
SMD
Level -0.013 0.0613 -0.212 0.160502 0.092699 -
1.731431 I(1)
1st
Difference -0.739 0.164 -4.505 0.758 0.166 -4.569
ARDL to Co-integration Results
ARDL model is as under:
The estimates of ARDL are obtained on the basis of Schwarz Bayesian Criterion (SBC). Regression
estimates of above econometric model are given in the following tables.
Table 2: Results of ARDL (1 0 0 0) Model conducted on SBC: Stock Market Development [dependent variable]
Variables Coefficients t-statistics p-values
SMD(-1) 0.61801 5.7675 0.000
MS 0.19599 3.6621 0.001
GDS 0.01222 3.9262 0.000
FR -1.2297 -1.7298 .092
R-Squared (LM) = 0.921 R-BAR-Squared (LM) = 0.915
DW- Statistic (LM) = 1.9842 F-statistics (LM) = 137.50
Probability (LM) = 0.000
* indicates significance level at 1%
** indicates significance level at 5 %
The above table results illustrate that there exist a strong co-integration between money supply (MS),
gross domestic savings (GDS) and stock market development. The result shows that there exist a significant
positive or direct relationship between gross domestic savings and money supply which means that GDS and MS
play significant role in the development of stock market. Further we can interpret it as one unit increase in GDS
and MS will lead to increase the market capitalization by 0.01222 and 0.19599 respectively. Foreign remittance
is rejected at 5 percent level of significant yet it becomes significant at 10 percent level. It is negatively related to
the stock market development. R-square value is 0.92 which shows that 92 percent variation in the stock prices is
determined by independent variables of the model. F-statistic value is highly significant at 1 percent level of
Developing Country Studies www.iiste.org
ISSN 2224-607X (Paper) ISSN 2225-0565 (Online)
Vol.5, No.9, 2015
145
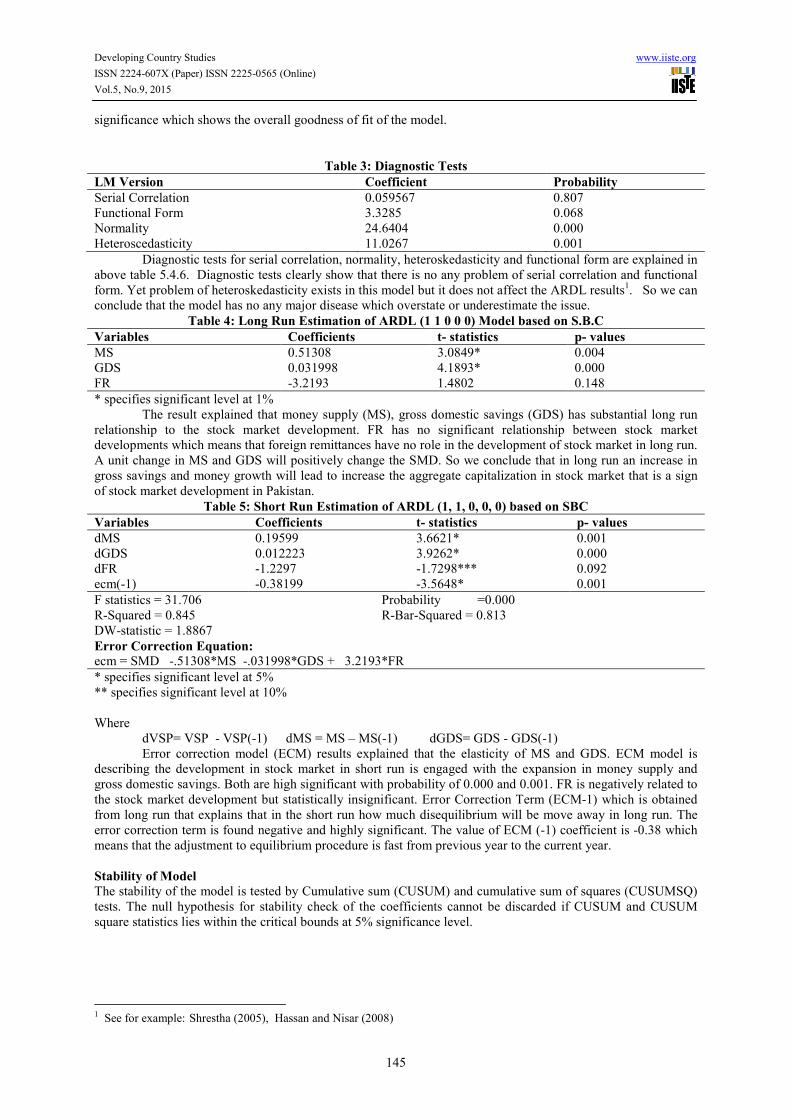
significance which shows the overall goodness of fit of the model.
Table 3: Diagnostic Tests
LM Version Coefficient Probability
Serial Correlation 0.059567 0.807
Functional Form 3.3285 0.068
Normality 24.6404 0.000
Heteroscedasticity 11.0267 0.001
Diagnostic tests for serial correlation, normality, heteroskedasticity and functional form are explained in
above table 5.4.6. Diagnostic tests clearly show that there is no any problem of serial correlation and functional
form. Yet problem of heteroskedasticity exists in this model but it does not affect the ARDL results1. So we can
conclude that the model has no any major disease which overstate or underestimate the issue.
Table 4: Long Run Estimation of ARDL (1 1 0 0 0) Model based on S.B.C
Variables Coefficients t- statistics p- values
MS 0.51308 3.0849* 0.004
GDS 0.031998 4.1893* 0.000
FR -3.2193 1.4802 0.148
* specifies significant level at 1%
The result explained that money supply (MS), gross domestic savings (GDS) has substantial long run
relationship to the stock market development. FR has no significant relationship between stock market
developments which means that foreign remittances have no role in the development of stock market in long run.
A unit change in MS and GDS will positively change the SMD. So we conclude that in long run an increase in
gross savings and money growth will lead to increase the aggregate capitalization in stock market that is a sign
of stock market development in Pakistan.
Table 5: Short Run Estimation of ARDL (1, 1, 0, 0, 0) based on SBC
Variables Coefficients t- statistics p- values
dMS 0.19599 3.6621* 0.001
dGDS 0.012223 3.9262* 0.000
dFR -1.2297 -1.7298*** 0.092
ecm(-1) -0.38199 -3.5648* 0.001
F statistics = 31.706 Probability =0.000
R-Squared = 0.845 R-Bar-Squared = 0.813
DW-statistic = 1.8867
Error Correction Equation:
ecm = SMD -.51308*MS -.031998*GDS + 3.2193*FR
* specifies significant level at 5%
** specifies significant level at 10%
Where
dVSP= VSP - VSP(-1) dMS = MS – MS(-1) dGDS= GDS - GDS(-1)
Error correction model (ECM) results explained that the elasticity of MS and GDS. ECM model is
describing the development in stock market in short run is engaged with the expansion in money supply and
gross domestic savings. Both are high significant with probability of 0.000 and 0.001. FR is negatively related to
the stock market development but statistically insignificant. Error Correction Term (ECM-1) which is obtained
from long run that explains that in the short run how much disequilibrium will be move away in long run. The
error correction term is found negative and highly significant. The value of ECM (-1) coefficient is -0.38 which
means that the adjustment to equilibrium procedure is fast from previous year to the current year.
Stability of Model
The stability of the model is tested by Cumulative sum (CUSUM) and cumulative sum of squares (CUSUMSQ)
tests. The null hypothesis for stability check of the coefficients cannot be discarded if CUSUM and CUSUM
square statistics lies within the critical bounds at 5% significance level.
1 See for example: Shrestha (2005), Hassan and Nisar (2008)

Developing Country Studies www.iiste.org
ISSN 2224-607X (Paper) ISSN 2225-0565 (Online)
Vol.5, No.9, 2015
146
Figure 1: Graph of Cumulative Sum of Recursive Residual
Figure 2: Graph of Cumulative Sum of Square Recursive Residual
Figure 2 represents CUSUM square of residuals which shows that the estimated line remained within
the upper and lower critical bounds at 5 percent significance level. The results cleared that required lines move
insides of upper and lower bounds which evidently show that the concerned model is stable within constraints.
Conclusion
The stock markets play a key role in Pakistan because it channelize idle money into productive investment and
generate capital for businesses which boosts the economy up. Pakistan’s stock market is one of emerging stock
markets in the world. The ARDL to Co-integration results proved that Gross domestic savings ,money supply
have positive impact on stock market development in Pakistan in both short run and long run that are consistent
with theoretical and conceptual framework and literature [See also: Raza et al.(2012) and Adam and Tweneboah
(2009)].
Foreign remittances have an insignificant effect on stock market development in short run. But the
-0.4
-0.2
0.0
0.2
0.4
0.6
0.8
1.0
1.2
1.4
1974 1983 1992 2002 2012
The straight lines represent critical bounds at 5% significance level
Plot of Cumulative Sum of Squares of Recursive Residuals
-20
-10
0
10
20
1974 1983 1993 2002 2012
The straight lines represent critical bounds at 5% significance level
Plot of Cumulative Sum of Recursive Residuals

Developing Country Studies www.iiste.org
ISSN 2224-607X (Paper) ISSN 2225-0565 (Online)
Vol.5, No.9, 2015
147
study found no any affect on stock market in long run. F-static is greater than upper bound in both models that
confirms the co-integration relationship between dependent and independent variables. CUSUM line remain
between the upper and lower critical bound at 5 percent level of significance that guaranteed the stability of the
model.
The study proposed that macroeconomic information like inflation; money supply etc can be used to
forecast the stock market prices by rational investors. Monetary authorities should use their tools by keeping in
view the response effect of them within the context of stock market development and variability of stock prices.
The higher the rate of savings, higher will be the capital stock and then higher will be the economic growth. By
keeping in view that Savings behavior must be encouraged in the country through appropriate savings schemes
by the government.
References
Adam, A. M. and Tweneboah, G. (2008) “Macroeconomic Factors and Stock Market Movement: Evidence from
Ghana”. Available at SSRN.
Aggarwal, G. (2010). “A study of exchange rates movements and stock Market volatility” International Journal
of Business and Management Vol. 5, No. 12.
Ajayi, R. A., & Mougoue, M. (1996). On the dynamic relation between stock prices and exchange Rates.
Journal of Financial Research, 19 , 193-207.
Akbar,M, Ali,S and Khan,M.F (2012), The relationship of stock prices and macroeconomic variables revisited:
Evidence from Karachi stock exchange, African Journal of Business Management, 6(4):1315-1322.
Asaolu, T.O and M.S. Ogunmuyiwa (2011), An Econometric Analysis of the Impact of Macroecomomic
Variables on Stock Market Movement in Nigeria, Asian Journal of Business Management 3(1): 72-78,
ISSN: 2041-8752
Ali, M.B. (2011), Impact of Micro and Macroeconomic Variables on Emerging Stock Market Return: A Case on
Dhaka Stock Exchange (DSE), Interdisciplinary Journal of Research in Business 1(5):08-16.
Ali. R. C., (1995) “Is the Dhaka Stock Exchange Informationally Efficient?” The Bangladesh Development
Studies, 23(1/2) : 89-104.
Asaolu, T. O. and Ogunmuyiwa, M.S. (2011), An Econometric Analysis of the Impact of Macroeconomic
Variables on Stock Market Movement in Nigeria, Asian Journal of Business Management 3(1): 72-78
Azam, M (2011) “Stock Price Variation Regarding Macro-Economic and Firm-Specific accounting Variables:
Evidence from Karachi Stock Exchange”, International Research Journal of Finance and Economics,
(81):1450-2887
Azam, M and Kumar, D (2011), Factors Influencing the Individual Investor and Stock Price Variation: Evidence
from Karachi Stock Exchange, Australian Journal of Basic and Applied Sciences, 5(12): 3040-3043
Bahdur, S. G. C and Neupane (2006), Stock market and economic development: A causality Test, The journal of
Nepalese Business studies, III (I): 36 – 44
Barsky , Robert B. and De Long , J. Bradford (1993) “Why Does the Stock Market Fluctuate?, The Quarterly
Journal of Economics, Vol. 108, No. 2, pp. 291-31, Oxford University Press.
Beaulieu, M.C , Cosset, J.C and Essaddam, N. (2005), The Impact of Political Risk on the Volatility of Stock
Returns: The Case of Canada. Journal of International Business Studies, 36(6): 701-718
Butt, B. Z., Rehman K.U., Khan, M. A., and safwan, N (2010), Do economic factors influence stock returns? A
firm and industry level analysis, African Journal of Business Management, 4(5): 583-593
Economic Survey of Pakistan various editions from 1980 to 2010, Ministry of Finance.
Engle, Lilien and Robins (1987) “Estimating Time- Varying Risk Premia in the Term Structure: The ARCH-M
Model”, Econometrica, 55, 391-407.
Fama, E. F. (1981), Stock Returns, Real Activity, Inflation and Money. American Economic Review 71(4): 545–
565.
Fazal, H.and Mahmood, T (2001), The Stock Market and the Economy in Pakistan. The Pakistan Development
Review 40 :( 2):107–114.
Gan, C., Lee, M., Yong, H.H.A. and Zhang, J (2006) “Macroeconomic variables and stock market interactions:
New Zealand evidence”, Investment Management and Financial Innovation, 3(4): 89-101.
Genctruk, M., Celik, I. and Binici, O. (2012), Causal relationship between macroeconomic variables and stock
price index in emerging economies: An empirical application for Turkey, African journal of business
management, 6(20): 6177 – 6182
Granger C.W.J. (1988). Some recent developments in the concept of causality. Journal of Econometrics, 39:
199-221.
Grossman ,S.J and Shiller,R.J(1981), The Determinants of The Variability of Stock Market Price, The
American economic review 71(2), :.222-227.
Gujrati,N. Damodar and Porter,C.Dawn (2005), Basic Econometrics. 5th
edition. McGraw Hill.
Developing Country Studies www.iiste.org
ISSN 2224-607X (Paper) ISSN 2225-0565 (Online)
Vol.5, No.9, 2015
148
Hasan, A and Nasir,Z.M (2008), Macroeconomic Factors and Equity Prices: An Empirical Investigation
by :Using ARDL Approach, The Pakistan Development Review 47: 4 .501–513
Haugen, R.A (1970)”Expected Growth, required return and variability of stock prices, The journal of financial
and quantitative analysis, 5(3): 297-307.
Heins, A James and Allison, S.L (1996), Some factors affecting stock price variability, The Journal of Business,
39(1): 19-23.
Hosseini, S. M, Ahmed, Z., and Lai, Y. W. (2011), The Role of Macroeconomic Variables on Stock Market
Index in China and India, International Journal of Economics and Finance, 3(6): 233 – 243
Humpe, A and Macmillan, P (2007), Can Macroeconomic Variables Explain Long Term Stock Market
Movements? A Comparison of the US and Japan. Centre for dynamic macroeconomic analysis
Working paper series CDMA 07/20
Husain, F and Mahmood, T (2001) “The Stock Market and the Economy in Pakistan”, The Pakistan
Development Review 40: 2 : 107–114.
Hussainey K, Ngoc L.K. (2009), The Impact of Macroeconomic Indicators on Vietnamese Stock Prices. Journal
of Risk Finance, 10(4): 321-332
Ibrahim, M.H (2011), Level and Volatility of stock Prices and Aggregate Investment: The case of Thailand.
Global Economic Review, Tylor and Francis Jouranals, 40(4):445-46.
Iqbal, Z and Sattar,A (2005), Contributions To Worker,S Remittances To Economic Growth in Pakistan. PIDE
working paper.
Irfan, M.C, M Nishat and H. Sharif(2000), Key Fundamental Factors and Long-run Price Changes in an
Emerging Market—A Case Study of Karachi Stock Exchange (KSE), The Pakistan Development
Review, 41(4): 517-533.
Johansen S (1988). Statistical Analysis of Co-integration Vectors. J. Econ. Dyn. Control. 12: 231-254.
Johansen S (1991). Estimation and hypotheses testing of co-integrating vectors in Gaussian vector auto-
regressive models. Econometrica 59: 1551-1580.
Kaul, G and H. N. Seyhun (1990), Relative Price Variability, Real Shocks, and the Stock Market, The Journal of
Finance, 45(2) : 479-496. Published by: Wileyfor the American Finance Association
Kiley, Michael T. (2004), Stock Prices and Fundamentals: A Macroeconomic Perspective, The Journal of
Business, The University of Chicago Press,77(4):909-936.
http://www.jstor.org/stable/10.1086/422629.
Lee, Bong-Soo (1998), Permanent, Temporary, and Non-Fundamental Components of Stock Prices, The
Journal of Financial and Quantitative Analysis, 33(1) : 1-32.
Menike L.M.C (2003), The Effect of Macroeconomic Variables on Stock Prices in Emerging Sri Lankan Stock
Market, Sabaragamuwa University Journal, 6(1): 50-67
Mohammad, S. D., Hussain, A., and Ali, A. (2009), Impact of Macroeconomics Variables on Stock Prices
Empirical Evidence in Case of Karachi Stock Exchange, European Journal of Scientific Research,
38(1): 96-103.
Mohammad, S.D, Adnan.H, M. A. Jalil and Adnan, A. (2009), Impact of Macroeconomics Variables on Stock
Prices: Emperical Evidance in Case of KSE (Karachi Stock Exchange), European Journal of Scientific
Research, 38(1): 96-103
Mukherjee,T. K. and Naka, A. (1995), Dynamic relations between macroeconomic variables and the Japanese
stock market: an application of a vector error correction model, The Journal of Financial Research.
18(2): 223–237.
Nishat M. and Shaheen R. (2004). Macroeconomic factors and Pakistani equity market, Pakistan Development
Review, 43(4): 619-637.
Pearce, Douglas K. and V. V. Roley (1985), Stock Prices and Economic News, The Journal of Business, 58( 1 ):
49-67.
Pesaran and Shin (1995, 1998) An Autoregressive Distributed Lag Modeling Approach to Co-integration
Analysis. (DAE Working Papers, No. 9514).
Pethe ,A. and A. Karnik (2000), Do Indian Stock Markets Matter? Stock Market Indices and Macro-Economic
Variables, Quarterly Journal of Business and Economics, l( 32): 50-67.
Phillips P.C.B., Perron P (1988). Testing for a unit root in a time series. Biometrica, 75: 335-436
Pilinkus, D. and Boguslauskas, V. (2009), The Short-Run Relationship between Stock Market Prices and
Macroeconomic Variables in Lithuania: An Application of the Impulse Response Function, Inzinerine
Ekonomika-Engineering Economics (5).
Raimony, A.D and El-Nader, H. M. (2012), The Sources of Stock Market Volatility in Jordan, International
Journal of Economics and Finance; 4(11): 108-121
Rashid, M.T., Ahmed, K., Azim, P. and Rehman, H. (2011), Measuring the Impact of Inflation on Conditional
Stock Market Volatility in Pakistan: An Application of IGARCH Model, Middle Eastern Finance and

Developing Country Studies www.iiste.org
ISSN 2224-607X (Paper) ISSN 2225-0565 (Online)
Vol.5, No.9, 2015
149
Economics , 1450-2889.
Raza, A., Iqbal, N., Ahmed Z., Ahmed M., and Ahmed, T (2012), The Role of FDI on Stock Market
Development: The Case of Pakistan, Journal of Economics and Behavioral Studies. 4(1): 26-33
Singh, T., Mehta S. and Varsha M,S (2011), Macroeconomic factors and stock returns: Evidence from Taiwan,
Journal of Economics and International Finance, 2(4):217-227.
Sohail N, Hussain Z (2009). Long-run and short-run relationship between macroeconomic variables and stock
prices inPakistan: The case of Lahore Stock Exchange, Pakistan Economic Social Review, 47(2): 183-
198.
Wisniewski,T.P (2009), Can political factors explain the behavior of stock prices beyond the standard Present
value models? , Applied Financial Economics, 19(23):1873-1884.ISSN 1392 – 2785
Yartey CA (2008). The determinnats of stock market development in emerging economies: Is South Africa
different? IMF Working Paper , WP/08/32
Yuhn, K.H (1996), Stock price volatility test for linear and non linear integration in the present value model of
stock prices, Applied financial economics, 6(6): 487-494.
Zaidi S.Akbar,(2010), Issues in Pakistan’s Economy. Pp 457-460, Oxford University Press, Karachi.

The IISTE is a pioneer in the Open-Access hosting service and academic event management.
The aim of the firm is Accelerating Global Knowledge Sharing.
More information about the firm can be found on the homepage:
http://www.iiste.org
CALL FOR JOURNAL PAPERS
There are more than 30 peer-reviewed academic journals hosted under the hosting platform.
Prospective authors of journals can find the submission instruction on the following
page: http://www.iiste.org/journals/ All the journals articles are available online to the
readers all over the world without financial, legal, or technical barriers other than those
inseparable from gaining access to the internet itself. Paper version of the journals is also
available upon request of readers and authors.
MORE RESOURCES
Book publication information: http://www.iiste.org/book/
Academic conference: http://www.iiste.org/conference/upcoming-conferences-call-for-paper/
IISTE Knowledge Sharing Partners
EBSCO, Index Copernicus, Ulrich's Periodicals Directory, JournalTOCS, PKP Open
Archives Harvester, Bielefeld Academic Search Engine, Elektronische Zeitschriftenbibliothek
EZB, Open J-Gate, OCLC WorldCat, Universe Digtial Library , NewJour, Google Scholar