The Impact of Macroeconomic Variables on Stock Returns
18
Romanian Statistical Review nr. 2 / 2018 87 The Impact of Macroeconomic Variables on Stock Returns: A Case of the Johannesburg Stock Exchange Mr. Boldwin Ndlovu ([email protected]) Near East University, Nicosia Dr. Faisal Faisal ([email protected]) Lecturer, Institute of Business Studies and Leadership, Pakistan Near East University, Nicosia Assist. Prof. Dr. Nil Gunsel Resatoglu ([email protected]) Near East University, Nicosia Associate Prof. Dr. Turgut Türsoy ([email protected]) Near East University, Nicosia ABSTRACT The study assessed association of macroeconomic variables: inflation (INF), Money supply growth (M3), Interest rates (IR) and USD ZAR exchange rate (EX) using quarterly data from the year 1981Q1 to 2016 Q4 on stock price for the Johannesburg Stock Exchange South Africa. The study employed co-integration tests, vector error correction model, a variance decomposition and an impulse response function to un- derstand the relationship of the variables. In the long run, interest rates, money supply and inflation have a positive relationship with the share price while the exchange rate have a negative effect to the stock prices. Unidirectional causality was found running from exchange rates and interest rates to the share price and also the interest rates and the exchange rates have a causality to the money supply. The variance decompo- sitions established that shocks to the share price account for majority of the changes in itself for all periods during the shortrun and long-run while also cementing results of the causality shocks in the stock price and exchange rate shocks have an impact on changes in themselves, also the impulse response function further confirmed causal relationships between the variables and the stock price. Keywords: macroeconomic variables, Johansen cointegration, VECM, Im- pulse response. JEL Classification Codes: C32, C58, F36, G1, G12.
-
Upload
khangminh22 -
Category
Documents
-
view
1 -
download
0
Transcript of The Impact of Macroeconomic Variables on Stock Returns
Romanian Statistical Review nr. 2 / 2018 87
The Impact of Macroeconomic Variables on Stock Returns: A Case of the Johannesburg Stock ExchangeMr. Boldwin Ndlovu ([email protected])
Near East University, Nicosia
Dr. Faisal Faisal ([email protected])
Lecturer, Institute of Business Studies and Leadership, Pakistan
Near East University, Nicosia
Assist. Prof. Dr. Nil Gunsel Resatoglu ([email protected])
Near East University, Nicosia
Associate Prof. Dr. Turgut Türsoy ([email protected])
Near East University, Nicosia
ABSTRACT The study assessed association of macroeconomic variables: infl ation (INF),
Money supply growth (M3), Interest rates (IR) and USD ZAR exchange rate (EX) using
quarterly data from the year 1981Q1 to 2016 Q4 on stock price for the Johannesburg
Stock Exchange South Africa. The study employed co-integration tests, vector error
correction model, a variance decomposition and an impulse response function to un-
derstand the relationship of the variables. In the long run, interest rates, money supply
and infl ation have a positive relationship with the share price while the exchange rate
have a negative effect to the stock prices. Unidirectional causality was found running
from exchange rates and interest rates to the share price and also the interest rates
and the exchange rates have a causality to the money supply. The variance decompo-
sitions established that shocks to the share price account for majority of the changes
in itself for all periods during the shortrun and long-run while also cementing results of
the causality shocks in the stock price and exchange rate shocks have an impact on
changes in themselves, also the impulse response function further confi rmed causal
relationships between the variables and the stock price.
Keywords: macroeconomic variables, Johansen cointegration, VECM, Im-
pulse response.
JEL Classifi cation Codes: C32, C58, F36, G1, G12.
Romanian Statistical Review nr. 2 / 201888
1. INTRODUCTION
The relationship between the stock market and macroeconomic
forces has been widely analyzed in the fi nance and macroeconomic literature.
The relationship between equity prices and variables such as money supply,
infl ation and industrial production are of crucial importance not only in
analyzing equity returns, but also in understanding how expected returns
affect the economy.
This study seeks to understand the relationship between macroeconomic
variables and the South African stocks listed on the Johannesburg Stock
Exchange by deriving a multi-factor model that will make easy to understand
future association. Employing 4 macroeconomic variables: Infl ation, Money
Supply Growth, Interest rates, US Dollar SA Rand exchange rate. Thus in a
way results help provide a way to re-engage and correct disequilibrium’s in
case of shocks in the economy.
The study will provide reference and a clear sıgnal to equıty fund
ınvestors on how to allocate funds and restoring equilibrium. The strategy
employed here is one known as the active portfolio management strategy and
will help portfolio managers optimize returns in a volatile market like that of
South Africa.
The APT has survived several years of fairly intense scrutiny and thus
gradually has gained appreciation from the investing community and will be
adopted in the near future as the logical appeal and also of most importance
its implications will practically become apparent. The APT was developed
by Ross (1976) as an alternative to the Capital Asset Pricing Model (CAPM)
which he condemned of its dependency on the market index of risky assets
that are currently unavailable.
According to CR&R (1986) individual asset prices tend to be affected
by different types of events of which some largely impact assets prices much
better compared to the latter. Also from their papers they did provide evidence
supporting APT and also most cases established results from APT that are
better than those provided by CAPM.
2. LITERATURE REVIEW
Studies have been done for the South African stock market,
relationship with macroeconomic variables. Among those included are
Shawtari et al. (2015) found a relationship between macroeconomic factors:
industrial production, money supply, infl ation, and exchange rates and the
stock price using monthly data from 1998 to the year 2010 and established
Romanian Statistical Review nr. 2 / 2018 89
that among the variables industrial production had much impact in the stock
returns. Gupta and Reid (2012) looked at monetary policy and macroeconomic
news using daily data from 2002 to 2011 and established that the CPI and PPI
had a negative impact on stock returns. Coovadia (2014) derived a long run
relationship between macroeconomic variables: short and long term interest
rates, infl ation, the dollar exchange rate, industrial production money supply
growth, GDP, gold and oil prices using quarterly data from 1994 to 2012 and
established a positive relationship for infl ation and GDP while a negative
relationship was found for money supply. On the other hand this research
looked at a broader scope and covered recent trends encompassing the period
of the falling rand against the dollar, triggering the infl ationary pressures and
volatilities in interest rates and how also money supply has played a role
recently given the current trends taking place.
In a comparative analysis by Jugu and Amodu (2014) results obtained
from APT were superior to those of CAPM since APT encompasses all
relevant details which the classical CAPM has failed to capture.
A recent study conducted done by Rjoub et al. (2017) rather a case
of how micro and macro variables impact stock returns major concentration
made on the Turkish banking sector using quarterly data from 1995 3rd quarter
to 2015 4th quarter. Applying the fi xed panel data analysis and a Pairwise
Dumitrescu-Hurlin Panel Granger causality tests they established that the
variables are relevant in pricing the stocks also a negative reaction to economic
shocks was found.
On the other hand also Türsoy (2017) studied causality between
the stock price and exchange rate for Turkey using ARDL bounds test and
combined cointegration. Using monthly data from 2001-2016 the study found
a long-run bidirectional causality and a short-run unidirectional causality while
the error correction mechanism indicated a long-run relationship between the
two.
Barakat et al. (2015) studied the relationship between macroeconomic
variables and stock returns for Egypt and Tunisia using VAR and Granger
causality tests for period 1998- 2014. Findings from the study indicated a causal
relationship between the macroeconomic variables and share price for Egypt
while for Tunisia only consumer price index which had no causal relationship
with stock returns. Results also revealed that the four macroeconomic are co-
integrated with the stock market in both countries.
Mahmood et al. (2015) examined the relationship between infl ation
and stock returns for Pakistan using 6year data from 2005 to 2010. They
applied VAR in estimating the results and found a negative relationship
between the two.
Romanian Statistical Review nr. 2 / 201890
Chen and Hu (2015) analysed the relationship between monetary
policy and share price for China using structural autoregressive model (SVAR)
comparing with the US. They study found that interest rates have a negative
impact on the share price.
Barnor (2014) used data from 2000 to 2013 to examine the impact of
macroeconomic variables on stock returns using time series data analysis for
Ghana. Findings from his study suggested that interest rates and money supply
affected stock returns negatively while exchange rate had a positive relationship
with share price while infl ation had no signifi cant effect on stock returns.
For Pakistan Kibria et al. (2014) used descriptive analysis, regression
analysis correlation analysis and Granger Causality tests using annual data
from 1991 to 2013 to examine the impact of macroeconomic variables on
stock returns. Their regression results established a positive relationship
between macroeconomic variables and stock returns while Exchange rate and
GDP were found to unidirectional granger cause money supply on the other
hand GDP savings unidirectional granger caused the stock market index.
Vena (2014) analyzed the effect of infl ation on stock returns for the
Kenyan Nairobi stock exchange for the period 1998 to 2013 using GARCH
to analyze the impact of infl ation and EGARCH to analyze the effect of
asymmetric shocks. From the study it was established that infl ation has a
negative impact on share price.
Talla (2013) studied the impact of macroeconomic variables on share
price for Stockholm stock exchange using monthly data for the period from
1993 to 2012. The study estimated using the ordinary least squares method, and
Granger causality tests and found that of the variables infl ation, interest rate and
exchange rate negatively affected returns while money supply was positively
related though not signifi cant in the study. Furthermore the study found
unidirectional Granger causality between all the variables except infl ation.
Naik and Padhi (2012) examined the impact of macroeconomic
variables on share price for period 1994 to 2011 using Johansen Co-
integration tests and Vector Error Correction Model. Their results suggested
that the macroeconomic variables were co-integrated and thus have a long run
relationship and also there exist a positive relationship between money supply
and share price while there is a negative relationship with infl ation.
Jawaid and Haq (2012) in their research paper using GARCH model
and monthly data from 2004 to 2010 for Pakistan studied effects of volatility
in interest rate and exchanges rate on share price. They discovered that the
exchange rate effect was more complex than that of interest rates.
Hamrita and Trifi (2011) using 3 months American Treasury securities
and S&P 500 index used wavelet analysis with monthly data from 1990 to
Romanian Statistical Review nr. 2 / 2018 91
2008 and in conclusion established that stockreturns and interest rates were
independent of each other while exchange rate have a bidirectional relationship
with stock returns.
3. METHODOLOGY
3.1 Data
Under study the research considered the impact of the macroeconomic
variables: Money supply growth, Infl ation, Interest Rates and the Dollar Rand
exchange rate on Stock Prices. The study used quarterly data from fi rst quarter
1981 to last quarter 2016 for analysis. As a proxy for interest rates the research
used 3 month Treasury bill rate, while the exchange rate represents the value
of one Dollar to the South African Rand. Quarterly data was obtained from the
Economic Co-operation and Development (OECD) data website. The study
analyzed in any given year stocks that will be listed encompassing all details
there available in prior periods.
The study adopted the Ross model but rather than daily this research
used quarterly data and also the research established sectorial sensitivities
(factor loadings) by regression analysis.The study employed macroeconomic
factor models as a mode of inquiry since from the literature most studies as
will be discussed.
3.2 Unit root test
In most cases regression variables is at all cases not stationary and
thus does not give true refl ection of the behavior between variables as such it
is important to convert the variables to stationary before conducting the tests.
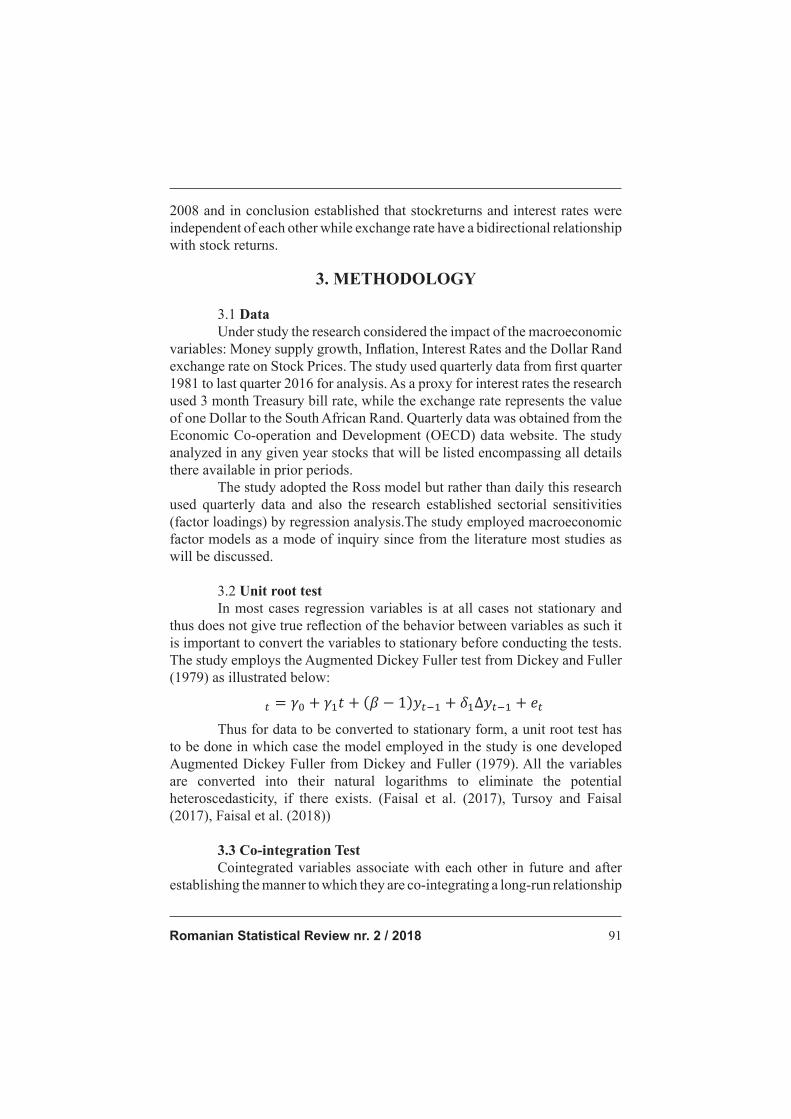
The study employs the Augmented Dickey Fuller test from Dickey and Fuller
(1979) as illustrated below:
Thus for data to be converted to stationary form, a unit root test has
to be done in which case the model employed in the study is one developed
Augmented Dickey Fuller from Dickey and Fuller (1979). All the variables
are converted into their natural logarithms to eliminate the potential
heteroscedasticity, if there exists. (Faisal et al. (2017), Tursoy and Faisal
(2017), Faisal et al. (2018))
3.3 Co-integration Test
Cointegrated variables associate with each other in future and after
establishing the manner to which they are co-integrating a long-run relationship
Romanian Statistical Review nr. 2 / 201892
is crafted for the variables share price and the four explanatory variables in
the study. When the variables are then converted to stationary a test for Co-
integration is done and this study employed the Johansen Co-integration test.
It must be ensured that all the variables must be I(1) (Faisal et al. (2018),
Tursoy and Faisal (2017), Faisal et al.(2016))
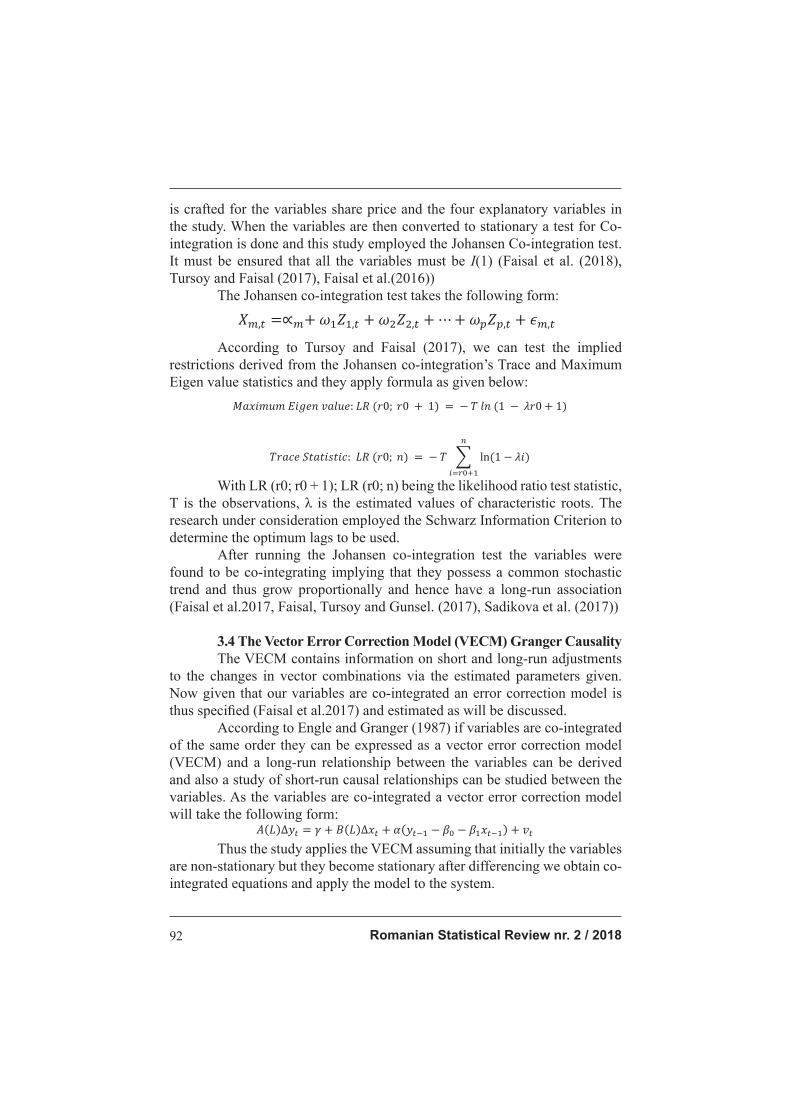
The Johansen co-integration test takes the following form:
According to Tursoy and Faisal (2017), we can test the implied
restrictions derived from the Johansen co-integration’s Trace and Maximum
Eigen value statistics and they apply formula as given below:
With LR (r0; r0 + 1); LR (r0; n) being the likelihood ratio test statistic,
T is the observations, λ is the estimated values of characteristic roots. The
research under consideration employed the Schwarz Information Criterion to
determine the optimum lags to be used.
After running the Johansen co-integration test the variables were
found to be co-integrating implying that they possess a common stochastic
trend and thus grow proportionally and hence have a long-run association
(Faisal et al.2017, Faisal, Tursoy and Gunsel. (2017), Sadikova et al. (2017))
3.4 The Vector Error Correction Model (VECM) Granger Causality
The VECM contains information on short and long-run adjustments
to the changes in vector combinations via the estimated parameters given.
Now given that our variables are co-integrated an error correction model is
thus specifi ed (Faisal et al.2017) and estimated as will be discussed.
According to Engle and Granger (1987) if variables are co-integrated
of the same order they can be expressed as a vector error correction model
(VECM) and a long-run relationship between the variables can be derived
and also a study of short-run causal relationships can be studied between the
variables. As the variables are co-integrated a vector error correction model
will take the following form:
Thus the study applies the VECM assuming that initially the variables
are non-stationary but they become stationary after differencing we obtain co-
integrated equations and apply the model to the system.
Romanian Statistical Review nr. 2 / 2018 93
3.5 Variance Decomposition (VDC)
The study developed a variance decomposition analysis under the
VECM model for the variables under consideration for quarterly data from
1981 to 2016. Also assuming that the variables are stationary and using the lag
selection criterion for the optimal lags we understand how shocks in variables
explain for the changes in the respective variables over time, short and long
run.
3.6 Impulse Response Function (IRF)
The IRF explains a shock to a VECM system and it identifi es the
responses of dependent variable in a model when shocks are applied to
the error terms as given below. Applying unit shocks to each variable it is
determined how the shocks affect the VECM system.
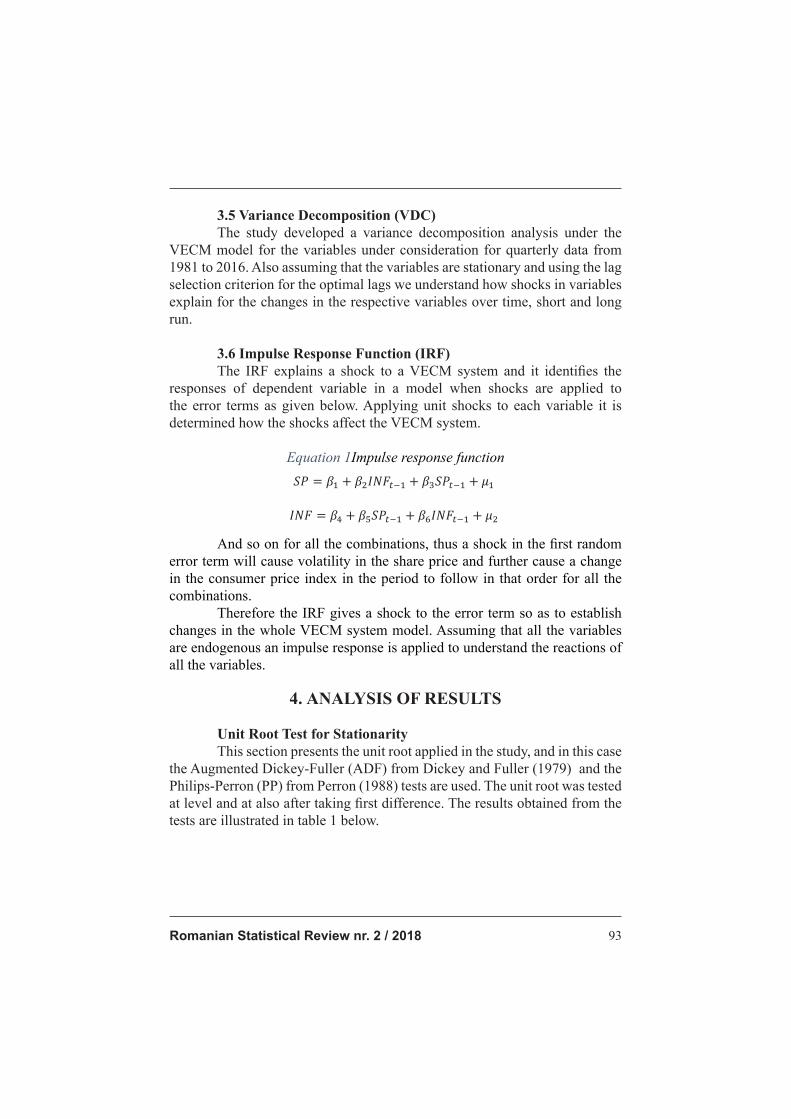
Equation 1Impulse response function
And so on for all the combinations, thus a shock in the fi rst random
error term will cause volatility in the share price and further cause a change
in the consumer price index in the period to follow in that order for all the
combinations.
Therefore the IRF gives a shock to the error term so as to establish
changes in the whole VECM system model. Assuming that all the variables
are endogenous an impulse response is applied to understand the reactions of
all the variables.
4. ANALYSIS OF RESULTS
Unit Root Test for Stationarity
This section presents the unit root applied in the study, and in this case
the Augmented Dickey-Fuller (ADF) from Dickey and Fuller (1979) and the
Philips-Perron (PP) from Perron (1988) tests are used. The unit root was tested
at level and at also after taking fi rst difference. The results obtained from the
tests are illustrated in table 1 below.
Romanian Statistical Review nr. 2 / 201894
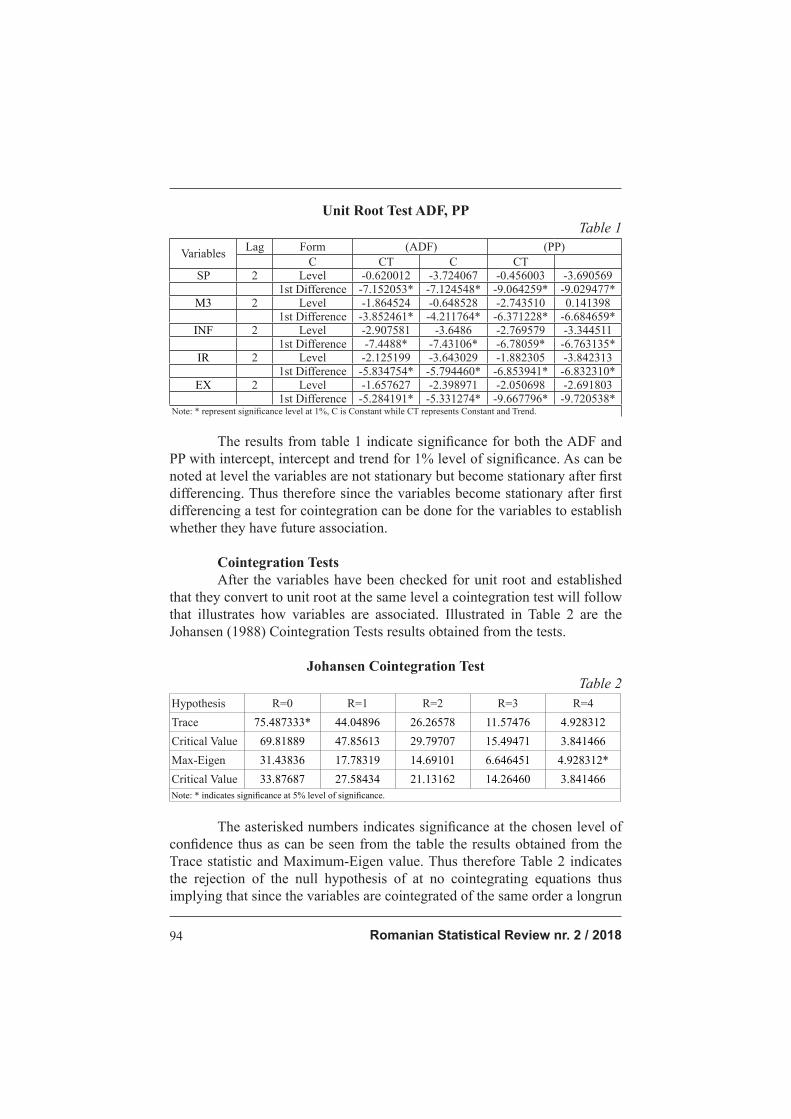
Unit Root Test ADF, PP
Table 1
VariablesLag Form (ADF) (PP)
C CT C CT
SP 2 Level -0.620012 -3.724067 -0.456003 -3.690569
1st Difference -7.152053* -7.124548* -9.064259* -9.029477*
M3 2 Level -1.864524 -0.648528 -2.743510 0.141398
1st Difference -3.852461* -4.211764* -6.371228* -6.684659*
INF 2 Level -2.907581 -3.6486 -2.769579 -3.344511
1st Difference -7.4488* -7.43106* -6.78059* -6.763135*
IR 2 Level -2.125199 -3.643029 -1.882305 -3.842313
1st Difference -5.834754* -5.794460* -6.853941* -6.832310*
EX 2 Level -1.657627 -2.398971 -2.050698 -2.691803
1st Difference -5.284191* -5.331274* -9.667796* -9.720538*Note: * represent signifi cance level at 1%, C is Constant while CT represents Constant and Trend.
The results from table 1 indicate signifi cance for both the ADF and
PP with intercept, intercept and trend for 1% level of signifi cance. As can be
noted at level the variables are not stationary but become stationary after fi rst
differencing. Thus therefore since the variables become stationary after fi rst
differencing a test for cointegration can be done for the variables to establish
whether they have future association.
Cointegration Tests
After the variables have been checked for unit root and established
that they convert to unit root at the same level a cointegration test will follow
that illustrates how variables are associated. Illustrated in Table 2 are the
Johansen (1988) Cointegration Tests results obtained from the tests.
Johansen Cointegration Test
Table 2
Hypothesis R=0 R=1 R=2 R=3 R=4
Trace 75.487333* 44.04896 26.26578 11.57476 4.928312
Critical Value 69.81889 47.85613 29.79707 15.49471 3.841466
Max-Eigen 31.43836 17.78319 14.69101 6.646451 4.928312*
Critical Value 33.87687 27.58434 21.13162 14.26460 3.841466
Note: * indicates signifi cance at 5% level of signifi cance.
The asterisked numbers indicates signifi cance at the chosen level of
confi dence thus as can be seen from the table the results obtained from the
Trace statistic and Maximum-Eigen value. Thus therefore Table 2 indicates
the rejection of the null hypothesis of at no cointegrating equations thus
implying that since the variables are cointegrated of the same order a longrun
Romanian Statistical Review nr. 2 / 2018 95
relationship exist for the variables.Therefore from the Trace and Max Eigen
value one cointergating equation exist and since the variables are cointegrated
of the same order they can be expressed as a Vector Error Correction Model
(VECM) which will be discussed.
Since the variables were found to be cointegrated of the same order
Table 3 represents their long-run relationship a Vector Error Correction Model
describing the behaviour of the variables in future and how they continue to
affect each other.
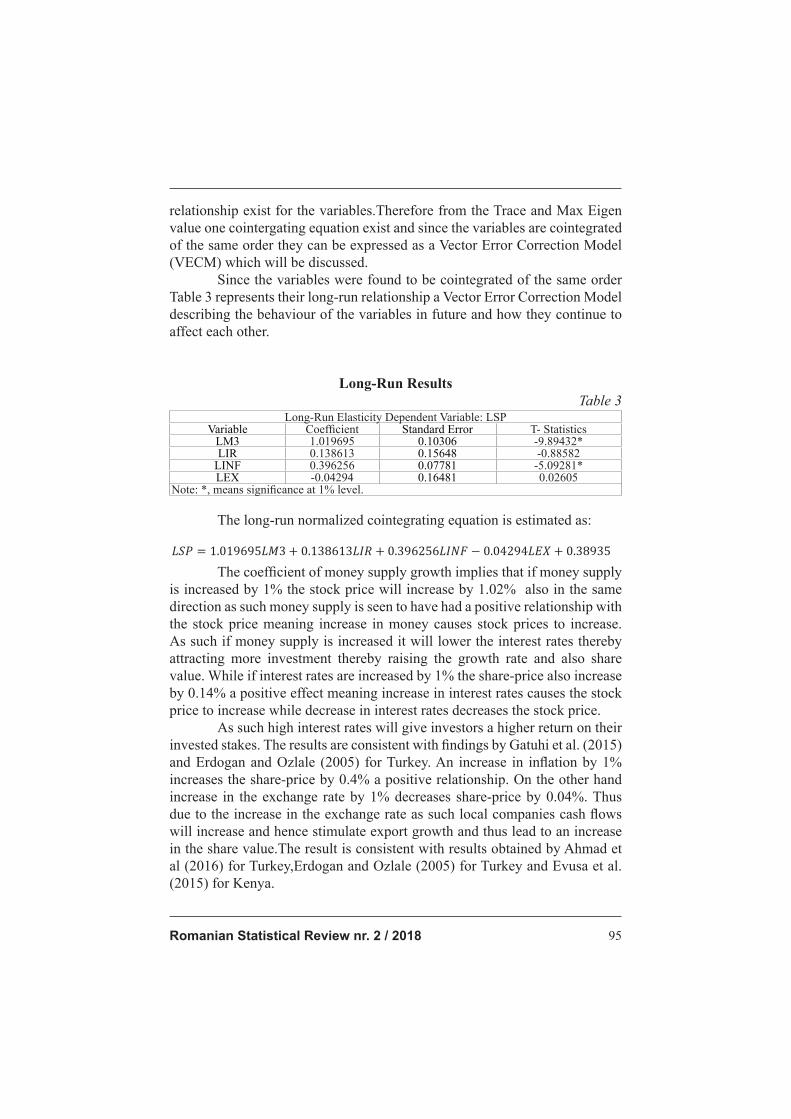
Long-Run Results
Table 3Long-Run Elasticity Dependent Variable: LSP
Variable Coeffi cient Standard Error T- StatisticsLM3 1.019695 0.10306 -9.89432*LIR 0.138613 0.15648 -0.88582
LINF 0.396256 0.07781 -5.09281*LEX -0.04294 0.16481 0.02605
Note: *, means signifi cance at 1% level.
The long-run normalized cointegrating equation is estimated as:
The coeffi cient of money supply growth implies that if money supply
is increased by 1% the stock price will increase by 1.02% also in the same
direction as such money supply is seen to have had a positive relationship with
the stock price meaning increase in money causes stock prices to increase.
As such if money supply is increased it will lower the interest rates thereby
attracting more investment thereby raising the growth rate and also share
value. While if interest rates are increased by 1% the share-price also increase
by 0.14% a positive effect meaning increase in interest rates causes the stock
price to increase while decrease in interest rates decreases the stock price.
As such high interest rates will give investors a higher return on their
invested stakes. The results are consistent with fi ndings by Gatuhi et al. (2015)
and Erdogan and Ozlale (2005) for Turkey. An increase in infl ation by 1%
increases the share-price by 0.4% a positive relationship. On the other hand
increase in the exchange rate by 1% decreases share-price by 0.04%. Thus
due to the increase in the exchange rate as such local companies cash fl ows
will increase and hence stimulate export growth and thus lead to an increase
in the share value.The result is consistent with results obtained by Ahmad et
al (2016) for Turkey,Erdogan and Ozlale (2005) for Turkey and Evusa et al.
(2015) for Kenya.
Romanian Statistical Review nr. 2 / 201896
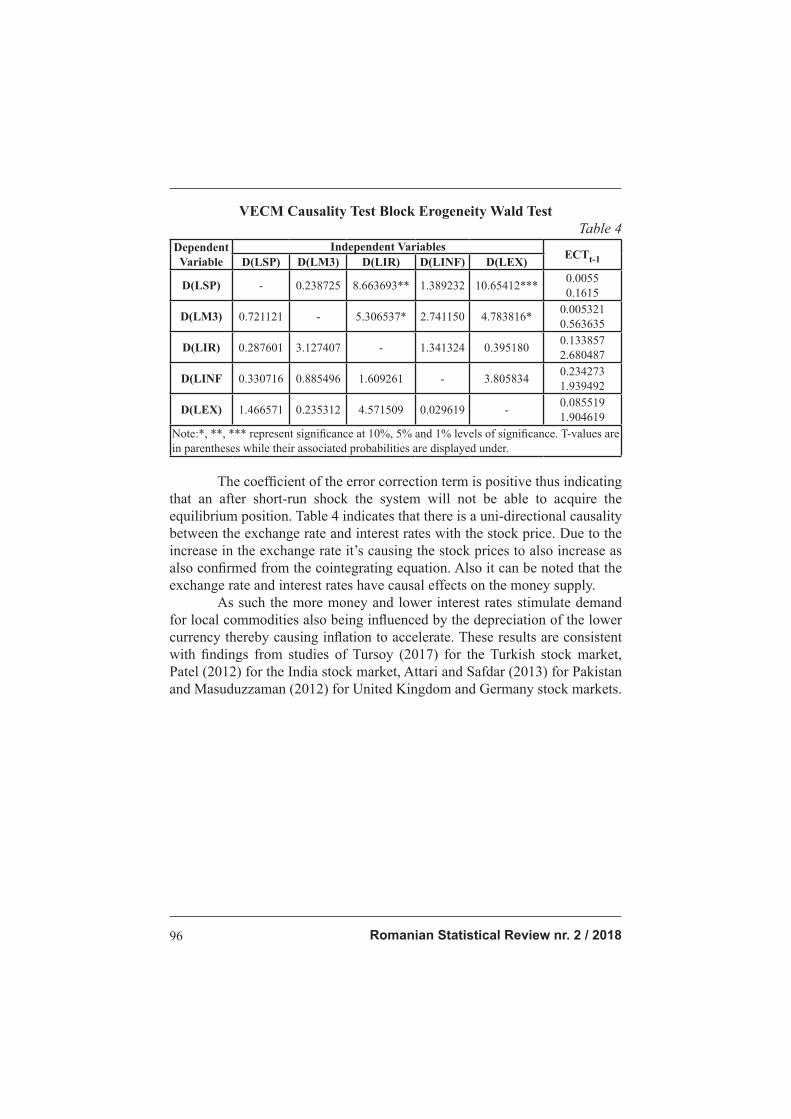
VECM Causality Test Block Erogeneity Wald Test
Table 4
Dependent
Variable
Independent VariablesECTt-1D(LSP) D(LM3) D(LIR) D(LINF) D(LEX)
D(LSP) - 0.238725 8.663693** 1.389232 10.65412***0.0055
0.1615
D(LM3) 0.721121 - 5.306537* 2.741150 4.783816*0.005321
0.563635
D(LIR) 0.287601 3.127407 - 1.341324 0.3951800.133857
2.680487
D(LINF 0.330716 0.885496 1.609261 - 3.8058340.234273
1.939492
D(LEX) 1.466571 0.235312 4.571509 0.029619 -0.085519
1.904619
Note:*, **, *** represent signifi cance at 10%, 5% and 1% levels of signifi cance. T-values are
in parentheses while their associated probabilities are displayed under.
The coeffi cient of the error correction term is positive thus indicating
that an after short-run shock the system will not be able to acquire the
equilibrium position. Table 4 indicates that there is a uni-directional causality
between the exchange rate and interest rates with the stock price. Due to the
increase in the exchange rate it’s causing the stock prices to also increase as
also confi rmed from the cointegrating equation. Also it can be noted that the
exchange rate and interest rates have causal effects on the money supply.
As such the more money and lower interest rates stimulate demand
for local commodities also being infl uenced by the depreciation of the lower
currency thereby causing infl ation to accelerate. These results are consistent
with fi ndings from studies of Tursoy (2017) for the Turkish stock market,
Patel (2012) for the India stock market, Attari and Safdar (2013) for Pakistan
and Masuduzzaman (2012) for United Kingdom and Germany stock markets.
Romanian Statistical Review nr. 2 / 2018 97
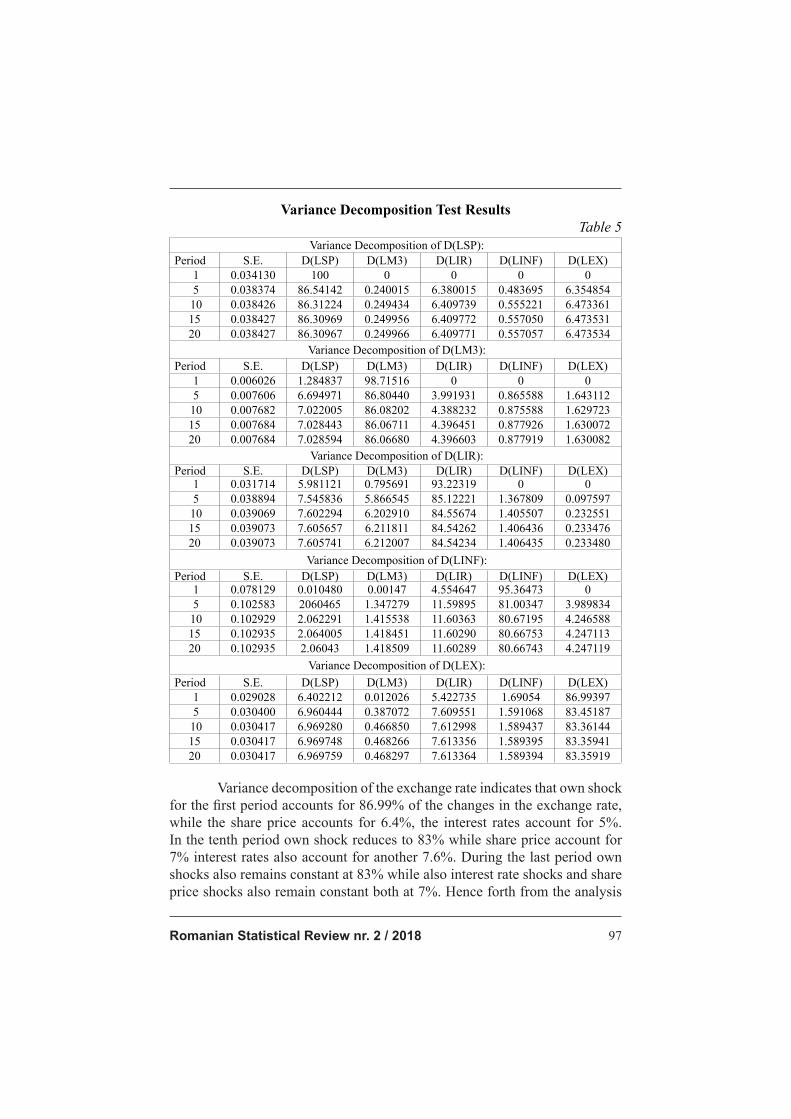
Variance Decomposition Test Results
Table 5
Variance Decomposition of D(LSP):
Period S.E. D(LSP) D(LM3) D(LIR) D(LINF) D(LEX)
1 0.034130 100 0 0 0 0
5 0.038374 86.54142 0.240015 6.380015 0.483695 6.354854
10 0.038426 86.31224 0.249434 6.409739 0.555221 6.473361
15 0.038427 86.30969 0.249956 6.409772 0.557050 6.473531
20 0.038427 86.30967 0.249966 6.409771 0.557057 6.473534
Variance Decomposition of D(LM3):
Period S.E. D(LSP) D(LM3) D(LIR) D(LINF) D(LEX)
1 0.006026 1.284837 98.71516 0 0 0
5 0.007606 6.694971 86.80440 3.991931 0.865588 1.643112
10 0.007682 7.022005 86.08202 4.388232 0.875588 1.629723
15 0.007684 7.028443 86.06711 4.396451 0.877926 1.630072
20 0.007684 7.028594 86.06680 4.396603 0.877919 1.630082
Variance Decomposition of D(LIR):
Period S.E. D(LSP) D(LM3) D(LIR) D(LINF) D(LEX) 1 0.031714 5.981121 0.795691 93.22319 0 0
5 0.038894 7.545836 5.866545 85.12221 1.367809 0.097597
10 0.039069 7.602294 6.202910 84.55674 1.405507 0.232551
15 0.039073 7.605657 6.211811 84.54262 1.406436 0.233476
20 0.039073 7.605741 6.212007 84.54234 1.406435 0.233480
Variance Decomposition of D(LINF):
Period S.E. D(LSP) D(LM3) D(LIR) D(LINF) D(LEX) 1 0.078129 0.010480 0.00147 4.554647 95.36473 0
5 0.102583 2060465 1.347279 11.59895 81.00347 3.989834
10 0.102929 2.062291 1.415538 11.60363 80.67195 4.246588
15 0.102935 2.064005 1.418451 11.60290 80.66753 4.247113
20 0.102935 2.06043 1.418509 11.60289 80.66743 4.247119
Variance Decomposition of D(LEX):
Period S.E. D(LSP) D(LM3) D(LIR) D(LINF) D(LEX)
1 0.029028 6.402212 0.012026 5.422735 1.69054 86.99397
5 0.030400 6.960444 0.387072 7.609551 1.591068 83.45187
10 0.030417 6.969280 0.466850 7.612998 1.589437 83.36144
15 0.030417 6.969748 0.468266 7.613356 1.589395 83.35941
20 0.030417 6.969759 0.468297 7.613364 1.589394 83.35919
Variance decomposition of the exchange rate indicates that own shock
for the fi rst period accounts for 86.99% of the changes in the exchange rate,
while the share price accounts for 6.4%, the interest rates account for 5%.
In the tenth period own shock reduces to 83% while share price account for
7% interest rates also account for another 7.6%. During the last period own
shocks also remains constant at 83% while also interest rate shocks and share
price shocks also remain constant both at 7%. Hence forth from the analysis
Romanian Statistical Review nr. 2 / 201898
the exchange rate is affected mainly by interest rate shocks and the share price
shocks. The results also confi rms those obtained from the VECM causality
test which suggested a causality running from the stated variables, thereby re-
enforcing the fi ndings of the study.
The table indicates that for the fi rst period shocks in the stock price
accounts for 100% of the changes in itself (own shock) while shocks in other
variables account for nothing on changes in share price, thus in the very short
run shocks in other variables have no impact on changes in the share price.
During the fi fth period own shocks accounts for 86.5% of the changes
in share price, while shocks in the exchange rate account for 6.35% of the
changes in stock price and interest rate shocks account for 6.38% of the
changes. In the long run the 20th period own shock accounts for 86.31% of
the changes in the share price, while the interest rate shocks account for 6.40%
of the changes and the exchange rate accounts for 6.47% of the changes in
the stock price. In short it can be noted therefore that changes in the stock
price are to some extent infl uenced by shocks in the exchange rate, cementing
also the causality results that suggested that exchange rate and he interest rate
cause the stock price.
Variance decomposition of money supply growth suggests that for the
fi rst period money supply shocks account for majority of its changes 98.72%
while the other variables have insignifi cant effect. In the tenth period it can be
noted also that majority of changes in money supply are infl uenced by own
shock 86.08% while the share price shocks account for 7% of the changes also
the interest rates account for 4% of the changes in money. Also in the long run
the 20th period own shock accounts for 86.07% of the changes in share price
while the share price shocks account for 7% the interest rates account for 4%
while infl ation and the exchange rate account for 1.6% and 0.9% respectively.
It can be noted thereof that money supply is affected by the shocks in stock
prices and interest rates from the above observation.
The variance decomposition of infl ation indicates that during the fi rst
period own shock accounts for 95% of the changes in Infl ation while other
variables have insignifi cant effect on stock. In the fi fth period own shock
reduces to 81% impact while interest rates account for 12% of the changes
2% is accounted for in share price shocks while 1.3% and 4% are accounted
for by money supply and the exchange rate respectively. Therefore the results
suggest that interest rate shocks do have a noticeable impact on the swings in
infl ation.
The variance decomposition of the interest rates indicates that for the
fi rst period own shock accounts for 93.2% of the changes in interest rates
while shocks in share price accounts for 6%. During the tenth period own
Romanian Statistical Review nr. 2 / 2018 99
shock decreases to 84.5% while share price shocks increase to 7.6% also
money supply accounts for 6.2% of the changes in the interest rates. In the
long run own shock accounts for 84.5% also while share price accounts for
7.6% and money supply account for 6% while infl ation and the exchange rate
account jointly for 1.4%. Thus in a nutshell it can be deduced that the share
price and money supply have some effect on the interest rates.
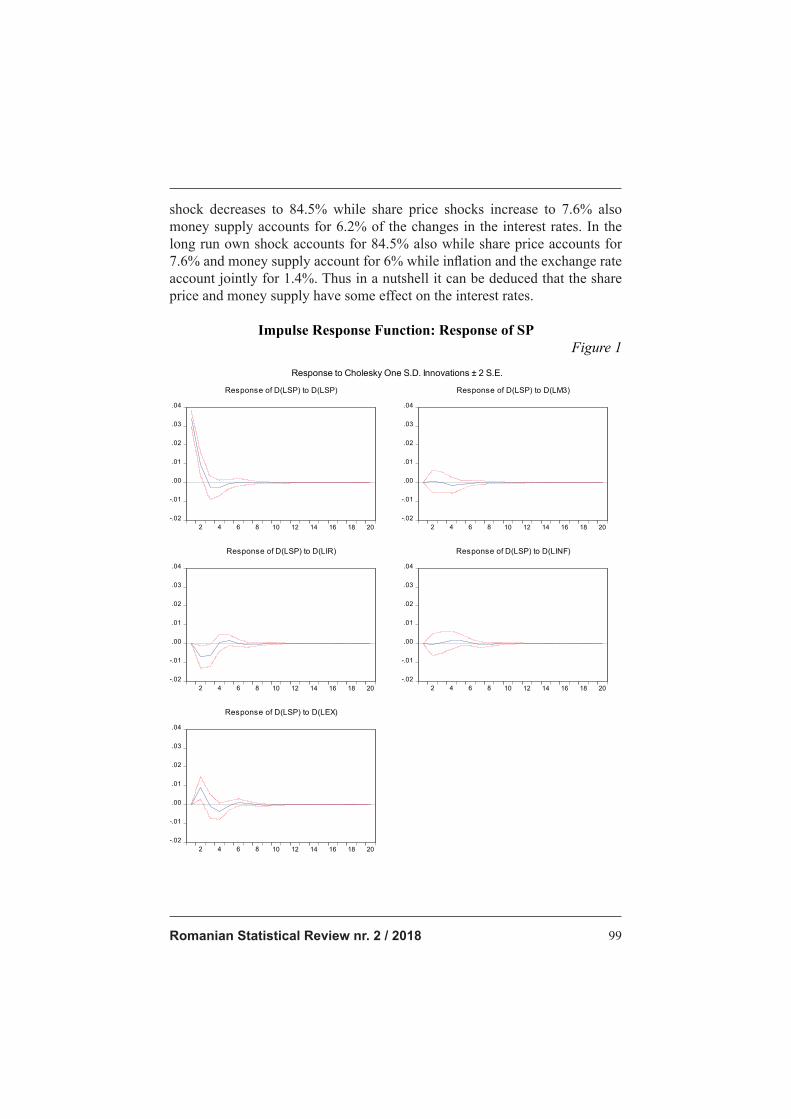
Impulse Response Function: Response of SP
Figure 1
-.02
-.01
.00
.01
.02
.03
.04
2 4 6 8 10 12 14 16 18 20
Response of D(LSP) to D(LSP)
-.02
-.01
.00
.01
.02
.03
.04
2 4 6 8 10 12 14 16 18 20
Response of D(LSP) to D(LM3)
-.02
-.01
.00
.01
.02
.03
.04
2 4 6 8 10 12 14 16 18 20
Response of D(LSP) to D(LIR)
-.02
-.01
.00
.01
.02
.03
.04
2 4 6 8 10 12 14 16 18 20
Response of D(LSP) to D(LINF)
-.02
-.01
.00
.01
.02
.03
.04
2 4 6 8 10 12 14 16 18 20
Response of D(LSP) to D(LEX)
Response to Cholesky One S.D. Innovations ± 2 S.E.
Romanian Statistical Review nr. 2 / 2018100
The Figure shows response of share-price to impulses in the given
variables over 20 periods. It can be noted for the fi rst 3 periods own shock is
signifi cant and positive while it will die out in the sixth period.
Response to money supply shocks is constant and also dies out during
the sixth period again while response to interest rates is signifi cant and negative
for the fi rst 4 periods, response to infl ation shocks is signifi cant and positive
up to the seventh period while response to the exchange rate is positive for the
fi rst 3 periods and negative for periods 4 and 5.
5. CONCLUSION AND POLICY IMPLICATIONS
The study aim was to establish association of macro-economic
variables with stock price for the period from year 1981 to 2016 using quarterly
data. From the fi ndings it was established that the macroeconomic variables
(Infl ation, Exchange rate, Money Supply and Interest rates) have a long run
association with the stock price as confi rmed by the cointegration tests and
also by the error correction model causality tests thus indicating robustness of
the results obtained.
The variables money supply, interest rates and infl ation were found to
be positively related to the stock price while the exchange rate have a negative
relationship with the stock price in the long run. Infl ation is having a positive
relationship. While on the other hand we found a negative relationship between
the exchange rate and the stock price
The Vector Error Correction Model (VECM) Causality Test
Block Exogeneity Wald Test indicated a unidirectional causality between
the stock price and exchange rate and also between the interest rates and
shareprice. The causality results were also further cemented by the Variance
Decomposition function indicating that changes in the stock price are
infl uenced by shocks in the exchange rate and from that from the interest
rates. The impulse responses indicated that own shock causes the stock price
to drop in the short run but it maintains stable state in the long run, while
also exchange rate shocks causes it to increase in the short run, infl ation
shocks causes a decrease in the short run. The same results were found by
Tursoy (2017) for the Turkish stock market. Patel (2012) for the India stock
market and Masuduzzaman (2012) for United Kingdom and Germany stock
markets. Also it was found that the exchange rate is a leading indicator for
shareprice and money supply. This implies that the declining rand value is
stimulating growth in the economy thereby infl uencing more exports and
making domestic companies more competitive thus attracting investment
and increasing the share value thereof.
Romanian Statistical Review nr. 2 / 2018 101
Therefore it can be noted that the results suggest how relevant the
exchange rate and the stock price are in the South African economy and
thus can help predict accurate forecasts to rejuvenate the economy in case of
unanticipated shocks in the economy.
Hence the policy makers can thus make use of stock price information
together with exchange rate fl uctuations past data and make correct estimates
of future economic crises and use the mechanism derived from the research to
hedge and help insulate the economy. Similar implications were suggested by
studies of Tursoy and Faisal (2016) for Turkey.
References 1. Andreas Humpe, Peter Macmillan, 2007. “Can macroeconomic variables explain
long term stock market movements? A comparison of the US and Japan” Centre for
Dynamic Macroeconomic Analysis Working Paper Series
2. Attari M.I.J, Safdar L, 2013, “The Relationship between Macroeconomic Volatility
and the Stock Market Volatility: Empirical Evidence from Pakistan” Pakistan Journal
of Commerce and Social Sciences Vol. 7 (2), 309-320.
3. Barakat M.R, Elgazzar S.H, Hanfy K.M, 2016, “Impact of Macroeconomic Variables
on Stock Markets: Evidence from Emerging Markets” International Journal of
Economics and Finance; Vol. 8, No. 1; (2016).
4. Barnor C, 2014, “The Effect of Macroeconomic Variables on Stock Market Returns
in Ghana (2000-2013)” Walden University Scholar Works.
5. Celov D, Grigaliuniene Z, 2010, “Economic Forces, Sentiment and Emerging
Eastern European Stock Markets” Research In Economics and Business: Central
and Eastern Europe, (2010): Vol. 2, No. 2.
6. Chen H & Hu D, 2015, “The Interaction between Interest Rates and Stock Returns: A
Comparison between China and US” Lund University School of Economics and Management.
7. Chen, N., Roll, R and Ross, S., 1986. “Economic Forces and the Stock Market”,
Journal of Business. Vol.59, No3, pp383-403.
8. Chude D.I, Ifurueze M.S, Chude N.P, 2015, “Impact of some selected
macroeconomic variables on Stock Market returns in Nigeria” EPRA International
Journal of Economic and Business Review, Vol 3 issue 12 (December 2015).
9. Coovadia M., 2014, “The dynamic relationship between economic factors and the
South African stock market” University of the Witwatersrand, Johannesburg.
10. Dickey, D. A., and W. A. Fuller, 1979, “Distributions of the Estimators for
Autoregressive Time Series with a Unit Root.” Journal of American Statistical
Association 74 (366a): 427–481.
11. Durga Prasad Samontaray, Sultan Nugali, BokkasamSasidhar, 2014, “A Study
of the Effect of Macroeconomic Variables on Stock Market: Saudi Perspective”
International Journal of Financial Research Vol. 5, No. 4; (2014).
12. Erdogan E, Ozlale U, 2005, “Effect of macroeconomic dynamics on stock returns: The
case of Turkish Stock Exchange” Journal of economic corporation 26, 2 (2005): 69-70.
13. Evusa, Z., Kitati, E. M., & Maithya, H. S., 2015, Effect of Macro-Economic
Variables on Stock Market Prices for the Companies Quoted on the Nairobi
Securities Exchange in Kenya.
14. Faisal, F., Muhammad, P. M., & Tursoy, T., 2017),Impact of economic growth,
foreign direct investment and fi nancial development on stock prices in China:
Empirical evidence from time series analysis. International Journal of Economics
and Financial Issues, 7(1).
Romanian Statistical Review nr. 2 / 2018102
15. Faisal, F., Tursoy, T., Gunsel Resatoglu, N., & Berk, N., 2018, Electricity
consumption, economic growth, urbanisation and trade nexus: empirical evidence
from Iceland. Economic Research-Ekonomska Istraživanja, 31(1), 664-680.
16. Faisal, F., Tursoy, T., & Berk, N., 2018, Linear and non-linear impact of Internet
usage and fi nancial deepening on electricity consumption for Turkey: empirical
evidence from asymmetric causality. Environmental Science and Pollution
Research, 25(12), 11536-11555.
17. Faisal, Tursoy, T., & Resatoglu, N. G., 2016, Energy Consumption, Electricity,
and GDP Causality; The Case of Russia, 1990-2011. Procedia Economics and
Finance, 39, 653-659.
18. Faisal, F., Tursoy, T., & Resatoglu, N. G., 2017, Is Export-Led Growth Hypothesis
Exist in Saudi Arabia? Evidence from an ARDL Bounds Testing Approach. Asian
Journal of Economic Modelling, 5(1), 110-117.
19. FAISAL, F., TÜRSOY, T., & REŞATOĞLU, N. G., 2017, Is there any Causality
between Financial Development, Energy Consumption and Economic Growth
in Pakistan? Evidence from ARDL Bounds Testing Approach and Vector
Error Correction Model. International Journal of Ecological Economics and
Statistics™, 38(2), 33-48.
20. Faisal, F., Tursoy, T., & Ercantan, O., 2017, The relationship between energy
consumption and economic growth: Evidence from non-Granger causality
test. Procedia Computer Science, 120, 671-675.
21. Gatuhi S, Gekara M, Muturi W, 2015, “Effect of Macroeconomic Environment on
Stock Market Returns of Firms in the Agricultural Sector in Kenya” International
Journal of Management & Business Studies (July - September 2015): 31-63
22. Gupta R & Reid M., 2012, “Macroeconomic Surprises and Stock Returns in South
Africa” Stellenbosch Economic Working Papers: 05/12.
23. Hamrita M E & Trifi A, 2011, “The Relationship between Interest Rate, Exchange
Rate and Stock Price: A Wavelet Analysis” International Journal of Economics and
Financial Issues Vol. 1, No. 4, 2011, pp.220-228 ISSN: 2146-4138.
24. Husam R, Civcir I, Resatoglu N G., 2017, “Micro and Macroeconomic
Determinants of Stock Prices: The case of Turkish Banking Sector” Romanian
Journal of Economic Forecasting –XX (1) 2017.
25. Izedonmi P.Z, Abdullahi I.B, 2011, “The Effects of Macroeconomic Factors on the
Nigerian Stock Returns: A Sectoral Approach” Global Journal of Management and
Business Research Volume 11 Issue 7 Version 1.0 (July 2011).
26. Jawaid S T & Haq A U, 2012, “Effects of interest rate, exchange rate and their
volatilities on stock prices: evidence from banking industry of Pakistan” Theoretical
and Applied Economics Volume XIX (2012), No. 8(573), pp. 153-166.
27. Johansen, S., 1988, Statistical analysis of cointegration vectors. Journal of
economic dynamics and control, 12(2-3), 231-254.
28. Jugu Y, G & Amodu Y S., 2014, “Capital Asset Pricing Model and Arbitrage
Pricing Theory: A Comparative Analysis” Department of Accounting, Faculty of
Management Sciences, University of Jos.
29. Kibria U, Mehmood Y, Arshad M U & Sajid M, 2014, “The Impact of Macroeconomic
Variables on Stock Market Returns: A Case of Pakistan” Research Journal of
Management Sciences ISSN 2319–1171 Vol. 3(8), 1-7, August (2014).
30. Kitatia E, Zablonb E, Maithyac H, 2015, “Effect of Macro-Economic Variables on Stock
Market Prices for the Companies Quoted on the Nairobi Securities Exchange in Kenya”
International Journal of Sciences: Basic and Applied Research (2015): 235-263.
31. Mahedi Masuduzzaman, 2012, “Impact of the Macroeconomic Variables on the
Stock Market Returns: The Case of Germany and the United Kingdom” Global
Journal of Management and Business Research Volume 12 Issue 16 Version 1.0
Romanian Statistical Review nr. 2 / 2018 103
32. Mahmood I, Nazir F and Junid M, 2015, “Stock Prices and Infl ation: A Case Study
of Pakistan” Journal of Asian Business Strategy, 4(12)2014: 217-223.
33. Muazu Ibrahim, AlhassanMusah, 2014, “An Econometric Analysis of the Impact
of Macroeconomic Fundamentals on Stock Market Returns in Ghana” Research in
Applied Economics ISSN 1948-5433 Vol. 6, No. 2.
34. Naik P K, Padhi P, 2012, “The Impact of Macroeconomic Fundamentals on Stock
Prices Revisited: Evidence from Indian Data” Eurasian Journal of Business and
Economics 2012, 5 (10), 25-44.
35. NalinipravaTripathy, 2011, “Causal Relationship between Macro-Economic
Indicators and Stock Market in India” Asian Journal of Finance & Accounting
ISSN 1946-052X (2011), Vol. 3, No. 1: E13.
36. Özlen S, Ergun U, 2012, “Macroeconomic Factors and Stock Returns” International
Journal of Academic Research in Business and Social Sciences (September 2012):
Vol. 2, No. 9.
37. Ozcan, A., 2012, The relationship between macroeconomic variables and ISE
industry index. International Journal of Economics and Financial Issues, 2(2), 184.
38. Patel S, 2012, “The effect of Macroeconomic Determinants on the Performance of
the Indian Stock Market” NMIMS Management Review Volume XXII (August 2012).
39. Phillips, P. C., & Perron, P., 1988, Testing for a unit root in time series
regression. Biometrika, 75(2), 335-346.
40. Resatoglu N.G, Çukur S, 2007, “The effects of macroeconomic factors on the
London stock returns: a sectoral approach” International Research Journal of
Finance and Economics 10, (2007): 140-152.
41. Rjoub, H., Civcir, I., & Resatoglu, N. G., 2017, “Micro and Macroeconomic
Determinants of Stock Prices: The Case of Turkish Banking Sector”. Journal for
Economic Forecasting, (1), 150-166.
42. Rjoub, H., Türsoy, T., & Günsel, N., 2009, “The effects of macroeconomic factors
on stock returns: Istanbul Stock Market”. Studies in Economics and Finance, 26(1),
36-45.
43. Ross, S. A., 2013, “The arbitrage theory of capital asset pricing”. In Handbook of
the Fundamentals of Financial Decision Making: Part I (pp. 11-30).
44. Sadikova, M., Faisal, F., & Resatoglu, N. G., 2017, Infl uence of energy use,
foreign direct investment and population growth on unemployment for Russian
Federation. Procedia Computer Science, 120, 706-711.
45. Shawtari F & Salem M A., 2015, “Long Run Relationship between Macroeconomic
Indicators and Stock Price: The Case of South Africa” Journal of Internet Banking
and Commerce 01(s2).
46. Talla J T, 2013, “Impact of Macroeconomic Variables on the Stock Market Prices
of the Stockholm Stock Exchange (OMXS30)” Jönköping International Business
School Jönköping University.
47. Tursoy T, Faisal F, 2016, “Causality between stock price and GDP in Turkey: An
ARDL Bounds Testing Approach” Romanian Statistical Review nr. 4 / (2016)
48. Tursoy T, Gunsel N, Rjoub H, “Macroeconomic factors, the APT and the Istanbul
stock market” International Research Journal of Finance and Economics 22,
(2008): 49-57.
49. Türsoy, T., 2017, “Causality between stock prices and exchange rates in Turkey:
Empirical evidence from the ARDL bounds test and a combined cointegration
approach” International Journal of Financial Studies. 2017, 5, 8; doi:10.3390/
ijfs5010008.
50. Tursoy, T., & Faisal, F., 2017, The impact of gold and crude oil prices on stock
market in Turkey: Empirical evidences from ARDL bounds test and combined
cointegration. Resources Policy.
Romanian Statistical Review nr. 2 / 2018104
51. Tursoy, T., & Faisal, F., 2017, Re-testing for fi nancial integration of the Turkish
Stock Market and the US Stock Market: An Evidence from co-integration and error
correction models. Romanian Statistical Review, (2).
52. Tursoy, T., & Faisal, F., 2017, Validity of FH hypothesis in small isolated island
economy: an application of the combined cointegration approach. Asia-Pacifi c
Journal of Accounting & Economics, 1-11.
53. Vena H, 2014, “The effect of Infl ation on the Stock Market Returns of the Nairobi
Securities Exchange” Master of Science in Finance, School of Business, University
of Nairobi.