Subjective Economic Well-being in Transition Countries: Investigating the Relative Importance of...
19
519 SUBJECTIVE ECONOMIC WELL-BEING IN TRANSITION COUNTRIES: INVESTIGATING THE RELATIVE IMPORTANCE OF MACROECONOMIC VARIABLES Lena MALEŠEVIĆ PEROVIĆ, PhD* Article** Faculty of Economics, Split UDC 338.24(4-11) JEL C33 Abstract In this paper we combine the data from surveys about life-satisfaction and macro- economic data and analyse the (order of) importance of macroeconomic variables for one’s subjective economic well-being. This approach allows an analysis from a subjecti- ve view – that of the public, in contrast to the usually used objective view, whereby policy goals are assumed to reflect public opinion. We find that the key macroeconomic varia- bles of inflation, unemployment and GDP (growth) matter for the public’s sense of eco- nomic well-being in transition countries. Moreover, improvements in national income lead to both temporary and permanent gains in subjective economic well-being in transi- tion countries. Habituation effects are present, indicating that individuals become accu- stomed to an increase in national income, but not all the benefits of this increase dissipa- te over time. Furthermore, GDP growth and unemployment are found to be more impor- tant than inflation in transition countries. This suggests that achieving GDP growth is an important goal of economic policy not only from the point of view of policy-makers but also from that of the public, and that it should be pursued. On the other hand, given that unemployment is more important than inflation for the public’s economic well-being, po- licy-makers in transition countries might need to revise their exclusive focus on inflation. This is to say that more effort should be put into decreasing unemployment (which might have an adverse effect on inflation) rather than into restraining inflation. Keywords: subjective economic well-being, surveys, transition countries, Croatia, macroeconomic variables * Author would like to thank two anonymous referees for useful comments and suggestions. ** Recived: June 1, 2008 Accepted: December 1, 2008
-
Upload
independent -
Category
Documents
-
view
0 -
download
0
Transcript of Subjective Economic Well-being in Transition Countries: Investigating the Relative Importance of...
519
SUBJECTIVE ECONOMIC WELL-BEING IN TRANSITION COUNTRIES: INVESTIGATING THE RELATIVE IMPORTANCE OF MACROECONOMIC VARIABLES
Lena MALEŠEVIĆ PEROVIĆ, PhD* Article**Faculty of Economics, Split UDC 338.24(4-11) JEL C33
Abstract
In this paper we combine the data from surveys about life-satisfaction and macro-economic data and analyse the (order of) importance of macroeconomic variables for one’s subjective economic well-being. This approach allows an analysis from a subjecti-ve view – that of the public, in contrast to the usually used objective view, whereby policy goals are assumed to reflect public opinion. We find that the key macroeconomic varia-bles of inflation, unemployment and GDP (growth) matter for the public’s sense of eco-nomic well-being in transition countries. Moreover, improvements in national income lead to both temporary and permanent gains in subjective economic well-being in transi-tion countries. Habituation effects are present, indicating that individuals become accu-stomed to an increase in national income, but not all the benefits of this increase dissipa-te over time. Furthermore, GDP growth and unemployment are found to be more impor-tant than inflation in transition countries. This suggests that achieving GDP growth is an important goal of economic policy not only from the point of view of policy-makers but also from that of the public, and that it should be pursued. On the other hand, given that unemployment is more important than inflation for the public’s economic well-being, po-licy-makers in transition countries might need to revise their exclusive focus on inflation. This is to say that more effort should be put into decreasing unemployment (which might have an adverse effect on inflation) rather than into restraining inflation.
Keywords: subjective economic well-being, surveys, transition countries, Croatia, macroeconomic variables
* Author would like to thank two anonymous referees for useful comments and suggestions.** Recived: June 1, 2008 Accepted: December 1, 2008

520
L. Malešević Perović: Subjective Economic Well-being in Transition Countries: Investigating the Relative Importance of Macroeconomic VariablesFinancial Theory and Practice 32 (4) 519-537 (2008)
1 Introduction
It is generally presumed by policy-makers that achieving GDP growth is the ulti-mate goal of economic policy and that this is what the public values and rewards by re-election. However, from the public’s, rather than policy-makers’, standpoint the situation might seem a bit different. Namely, why should we presuppose that an increase in GDP increases life-satisfaction? After all, it is happiness that should be the ultimate goal in life, not increasing GDP! It is possible, therefore, that the public might view GDP growth and other key macroeconomic variables, like inflation and unemployment, in a way dif-ferent from economists or policy-makers. Naturally, people “dislike” unemployment and inflation, but “like” GDP growth. However, since policy-makers (should) follow polici-es that try to help the economy and reduce economic “evils”, the question of exactly how much people dislike unemployment and inflation or like GDP growth is of central interest. Among these three variables, policy-makers often put most weight on (fighting) inflation. However, in our opinion it is important to analyse how important these variables really are from the point of view of the public, i.e. from a subjective point of view. Economi-sts often use objective economic data to describe well-being, for example, real GDP per capita. In this paper, by contrast, we use so-called happiness functions in order to assess well-being subjectively. Our main goal will be to analyse the relative importance of ma-croeconomic variables with respect to economic well-being. This is to say that we want to determine which variable (inflation, unemployment or GDP (growth)) matters more to the public, i.e. to establish the order of importance of these variables in affecting the eco-nomic well-being of an individual. To the best of our knowledge, no similar analysis exi-sts for a set of transition countries.
This paper is organised as follows. Section 2 gives a brief overview of happiness fun-ctions; Section 3 provides a literature review of those happiness studies that either analyse countries in transition or deal with the macroeconomic determinants of happiness; Section 4 explains our choice of macroeconomic variables in the happiness equation, while Secti-on 5 contains our own empirical investigation of the relative importance of key macroeco-nomic variables for economic well-being in transition countries. Section 6 concludes.
2 Introduction to happiness analysis
In order to assess the importance of macro variables from a subjective point of view we use the happiness analysis. In happiness studies, via surveys, people are asked directly about their subjective well-being. The most commonly asked question in these types of surveys is “how satisfied are you with your life taken as a whole?”1, with possible answers “very satisfied”, “fairly satisfied”, “not very satisfied”, and “very unsatisfied”2. These an-swers are then used as the dependent variable in happiness equations. Therefore, given that the dependent variable can have more than one value, and given that the answers are ordi-nal rather than cardinal, these kinds of models are usually estimated through ordered probit
1 The question might differ slightly depending on the country where it is asked, but the substantive meaning of the question is the same.
2 Sometimes there are more and sometimes fewer than four possible answers, depending on the survey.

521
L. Malešević Perović: Subjective Economic Well-being in Transition Countries: Investigating the Relative Importance of Macroeconomic Variables
Financial Theory and Practice 323 (4) 519-537 (2008)
or logit models. In terms of econometric analysis, happiness as the dependent variable is analysed against a set of micro and macro factors. A typical micro-econometric happiness equation has the standard form: Wit = α + βXi + εit, where W is the reported well-being of individual i in time t, and X is a vector of socio-demographic and socio-economic charac-teristics hypothesised to affect well-being. The error term captures unobserved characteri-stics and measurement errors. The socio-demographic variables, sometimes referred to as micro variables, usually include gender, age, marital status, employment status, education and the income quartile of the respondent. Among the macro factors the variables usually included comprise the unemployment rate, inflation, GDP per capita and/or growth, and sometimes unemployment benefits or a measure of income inequality.
3 Literature review
The literature on the “economics of happiness” has been steadily growing during the last few years. In what follows we make no attempt to survey the vast literature but rat-her analyse only those papers that analyse countries in transition as well as those that deal with macroeconomic determinants of happiness. The microeconomic variables used in much of the existing literature are the same and, as noted above, include: gender, marital status, income group, employment status, education and age variables. The impact of ma-croeconomic variables on happiness is rarely analysed (though most papers do control for country-specific fixed effects) and few papers focus on transition countries. Furthermore, among the papers that do include macroeconomic variables, only the minority assesses the relative importance of these variables and, to the best of our knowledge, no such analysis exists for countries in transition. Therefore, in that sense this paper is distinctive.
Hayo and Seifert (2003) analyse subjective economic well-being in Eastern Europe from 1991 to 1995. This means that the dependent variable in the regression is not life-satisfaction in general, but rather satisfaction with one’s economic situation. This investi-gation is of special interest for our empirical assessment of welfare in transition countri-es, including Croatia, since it uses the database and the dependent variable we have cho-sen for our own empirical analysis (as explained in more detail below). When subjective economic well-being is regressed against a common set of socio-demographic variables, the findings are similar to those in regressions that use life-satisfaction as the dependent variable. Hayo and Seifert find that age, education, relative income position and unem-ployment exert a significant influence on economic well-being, whereas gender and ma-rital status seem not to be important. Macroeconomic variables are not tested for their impact on happiness.
Di Tella, MacCulloch and Oswald (2003) do not investigate countries in transition but they do analyse the impact of macroeconomic variables on happiness in Europe, and in that respect their findings are of interest to us. The main finding of their paper is that both the level of GDP and the change in GDP3 affected the happiness of nations in Eu-rope in the period 1975-1992. As for the other macro variables, the authors additionally incorporate unemployment rate, inflation rate and an indicator of the generosity of the
3 Included in the regression one at a time, not together.

522
L. Malešević Perović: Subjective Economic Well-being in Transition Countries: Investigating the Relative Importance of Macroeconomic VariablesFinancial Theory and Practice 32 (4) 519-537 (2008)
welfare state. All these variables are found to be significant at conventional levels, and of expected signs.
Sanfey and Teksoz (2007) analyse the impact of individual-specific and economy-wide variables on self-reported satisfaction. They analyse both transition and non-tran-sition countries in the period 1999-2002 (the fourth wave of the World Values Survey), but here we report only the findings for the transition sub-sample. Inflation, GDP per ca-pita and the Gini coefficient are found to exert a significant effect on the dependent va-riable. An unexpected finding is that inflation seems to influence life-satisfaction posi-tively. GDP per capita also has a positive impact, whereas the Gini coefficient exerts a negative impact. The unemployment variable is not statistically significant. Sanfey and Teksoz, however, stress that the size and statistical significance of the results depends on the specification used (not all of the macro variables are included in the regression at the same time, but rather different combinations are tested). Hence, the conclusions drawn about the significance of certain macro variables differ depending on the variables inclu-ded in the model.
Since we are especially interested in assessing the relative importance of macroeco-nomic variables for well-being, we next present two papers that explicitly compare the importance of inflation and unemployment in their influence on happiness.
Di Tella, MacCulloch and Oswald (2001) find that, in twelve European countries over the period 1975 to 1991, people would trade-off a 1 percentage point increase in the unemployment rate for a 1.7 percentage point decrease in the inflation rate. They use a two-step procedure whereby first they use OLS estimation to assess the impact of micro variables on life satisfaction. They then calculate the mean residual for each country and each year and use this as the dependent variable in the second step. The explanatory vari-ables in the second step are inflation and unemployment. Their finding is that, unlike the “misery index” that attaches equal weight to both inflation and unemployment, the coef-ficient on inflation is smaller; hence unemployment is more important, given the prevai-ling unemployment and inflation rates.
Wolfers (2003) investigates the link between happiness and business cycle variati-ons in unemployment and inflation. He uses the Eurobarometer survey for 16 countries in the years 1973-1998. He uses different dependent variables and regresses them on annual measures of inflation and unemployment. The dependent variables he uses are: the ave-rage levels of happiness in each country-year; the proportion of the population in a coun-try-year who reported being “very satisfied”; the value of an estimated happiness index derived from an ordered probit regression of satisfaction on a full set of interacted coun-try and year fixed effects and, finally, ordered probit regression analysing individual-level data on reported satisfaction. In each case both inflation and unemployment exert a signi-ficant negative impact on the dependent variable. The results suggest that the inflation-unemployment trade-off is one to five; i.e. that people would be indifferent as to a rise in unemployment by 1 percentage point and a rise in inflation by 5 percentage points. Once again, therefore, unemployment is found to be more important than inflation.

523
L. Malešević Perović: Subjective Economic Well-being in Transition Countries: Investigating the Relative Importance of Macroeconomic Variables
Financial Theory and Practice 323 (4) 519-537 (2008)
4 Macroeconomic variables in happiness analysis
The micro variables usually included in happiness equations are relatively well inve-stigated, while the choice of macroeconomic variables has been neither thoroughly inve-stigated nor theoretically guided. We now present an analysis of the three variables that will be included in our happiness equation. These are unemployment, inflation and GDP. As noted by Frey and Stutzer (2002a), these variables have proved to be the main deter-minants of citizens’ satisfaction with the government in election and popularity functi-ons. They are, furthermore, particularly interesting to study since they can be influenced by economic policy.
4.1 Unemployment
In the studies that do include macroeconomic variables when explaining subjective well-being, the variable most commonly used is the unemployment rate in the country of interest. It affects both the employed and the unemployed. As noted by Frey and Stu-tzer (2002), unemployment can affect the happiness of the employed because they may feel bad about the unfortunate fate of those unemployed, may fear that they themselves will become unemployed, or may dislike the increase in their unemployment contributi-ons and taxes. Increased taxes directly lower the well-being of tax-payers, i.e. those em-ployed. The employed take into consideration labour market conditions when assessing their chances of becoming unemployed. It could be argued, therefore, that the greater the level of aggregate unemployment in a country, the more insecure the workers feel. Green et al. (2000) find that the fear of unemployment is not confined to a small proportion of the population, but that it exists among a considerable number of different workers wor-king in different industries. We theorise that the satisfaction of individuals that have in-secure jobs might be reduced because of the fear of potentially losing their job. In other words the unemployment rate affects their average level of happiness indirectly; throu-gh increasing this fear.
The main fear of the unemployed, on the other hand, is that of not becoming em-ployed. Winkelmann and Winkelmann (1998) note that the non-pecuniary effect of unem-ployment is much larger that the effect that stems from the associated loss of current in-come. Paul (2001) observes that unemployment, besides reducing income, also degrades human skills and causes social isolation. All this, as a result, reduces welfare. Therefo-re, we can justifiably assume that unemployment impacts both on the unemployed and the employed.
It should be stressed, however, that the official registered unemployment rates in tran-sition countries overestimate the true unemployment due to the large and omnipresent uno-fficial economy. Furthermore, given the low employment rate, high non-participation and high long-term unemployment in transition countries, the unemployment rate may not be the best proxy for the probability of becoming unemployed or finding employment. The-refore, in this situation it would make more sense to use flow measures of unemployment. For transition countries, however, this is not feasible, since unemployment flows data were collected only in 1996 and 1997 (as part of the Labour Force Survey). Therefore, we will proceed using the unemployment rate to account for the impact of labour market dynami-

524
L. Malešević Perović: Subjective Economic Well-being in Transition Countries: Investigating the Relative Importance of Macroeconomic VariablesFinancial Theory and Practice 32 (4) 519-537 (2008)
cs on subjective well-being. We do realise, however, that the measures mentioned above would be better in this setting, and that they should be used when available.
4.2 Inflation
As observed by Frey and Stutzer (2002a), the commonly held opinion of academic economists is that very high inflation is dangerous for the economy, while steady and pre-dictable low inflation (1 to 5 percent annually) is not considered to cause any major pro-blems, and may even be beneficial. The population, however, may perceive inflation di-fferently, as implied by Shiller’s (1996) survey. Namely, Shiller conducted a survey in 1996 to investigate public attitudes towards inflation. The results from 677 people indica-ted that people have explicit opinions about the mechanisms and consequences of infla-tion, and that these opinions differ across countries, and between generations in both the US and Germany. Among non-economists in all countries the largest concern with infla-tion refers to the fact that it lowers people’s standard of living. Other perceived costs are connected with issues of exploitation, political instability, loss of morale, and damage to national prestige. Striking differences in opinion were found between economists and non-economists. Therefore it is crucial that we include inflation as one of the macroeconomic determinants of happiness, since it plays an important role in the public’s view.
In people’s perception, the impact of inflation may not be the same at all inflation rates. As inflation increases and exceeds some psychological threshold, people may not only start taking it into account more in everyday decisions, but might even unduly exag-gerate the effect of inflation because of their fear of hyperinflation. This is true especially for people in transition countries who have had previous negative experience with high inflation rates. Thus, we might argue that it is fear of hyperinflation and not aversion to stable inflation that matters for happiness. It seems likely then that inflation would play a more important role in the analyses of those countries that have experienced a period of hyperinflation. It is this level that illustrates inflation’s effect on well-being most profo-undly, because of its psychological effect. Hence, an analysis of the impact of macro va-riables on welfare should ideally also include periods of high inflation in order to assess its effect on well-being.
4.3 Gross domestic product
Most economists normally assume that higher real GDP increases happiness. The im-pact of GDP on happiness is usually observed between countries, over time and between individuals within the same country. People in rich countries are usually found to be hap-pier than people in poor countries. However, it should be emphasised that, although the literature has established that happiness rises with GDP for low-income countries, there is much less consensus on whether there is a point beyond which additional increases in GDP per capita are associated with no change in aggregate happiness. In addition, the positive correlation between GDP and happiness across countries might not all be due to an increased income. There are other factors such as democracy, human rights, health and distributional equity that may make happiness increase with income. If we observe the relationship between happiness and GDP over time, as in Easterlin’s (1974) seminal paper, GDP does not seem to influence happiness. Indeed, in the period 1946-1991 real

525
L. Malešević Perović: Subjective Economic Well-being in Transition Countries: Investigating the Relative Importance of Macroeconomic Variables
Financial Theory and Practice 323 (4) 519-537 (2008)
per capita GDP increased in the United States, whereas average happiness actually dro-pped (Frey and Stutzer, 2002a). This is usually explained through changing aspirations, whereby people change their aspirations as their income increases, hence an increase in income does not result in a proportionate increase in happiness. Finally, rich people need not necessarily be happier than the poor ones within the same country. What is found to matter the most from an individual’s perspective is his/her relative income position. Na-mely, individuals do not value absolute income, but rather compare it to the income of relevant others (their reference group) (Frey and Stutzer, 2002a). This is the reason inco-me quartile is typically included as a micro variable in happiness equations – as a mea-sure of relative income.
Taken all together, GDP variable should be included in the happiness equation in two ways. Firstly, we will account for the impact of relative position, by including the inco-me quartile of a particular individual. We should also account for a general level of in-come of the population. Here our strategy is to include (in turn) GDP growth and GDP per capita. The impact of GDP growth on happiness is consistent with adaptation theori-es according to which the benefits of real income diminish over time (see above). Addi-tionally, in some specifications we will include GDP per capita instead of GDP growth. Since we will already be controlling for the quartile to which the respondent’s family be-longs, the coefficient on GDP per capita will reflect the effect of an absolute increase in national income on individual well-being, while keeping constant the relative position of the respondent.
5 Empirical analysis of the relative importance of macroeconomic variables
In this section we empirically investigate the determinants of subjective economic well-being in a set of 8 transition countries (Bulgaria, Hungary, Croatia, Czech Repu-blic, Poland, Romania, Slovakia and Slovenia) with special emphasis on the macroeco-nomic determinants.
5.1 Data description
The data used is from the New Democracies Barometer provided by the Austrian Data Archive – WISDOM (Wiener Institut für Sozialwissenschaftliche Dokumentation und Metodik). The surveys were conducted in 1991, 1992, 1994, 1996 and 1998. We de-cided to use this database since the surveys in transition countries were conducted more often than in the usually used database for this sort of analysis - the World Values Survey. This means that we can observe the impact of macro variables on happiness in more years. Furthermore, this database includes the early transition period, which has rarely been in-vestigated, and which allows us to analyse the impact of inflation on happiness in hype-rinflationary periods as well. We will be using only four surveys (1991, 1992, 1994 and 1998), however, since the 1996 survey does not have data on income quartiles, and this is an important micro variable in our model. Before proceeding, a further caveat regarding the data is needed. Namely, the question about life-satisfaction4 was asked only in 1991. For the remaining years the only question that has to do with well-being is the question
4 “On the whole, are you very satisfied, not very satisfied, or not at all satisfied with the life you lead?“

526
L. Malešević Perović: Subjective Economic Well-being in Transition Countries: Investigating the Relative Importance of Macroeconomic VariablesFinancial Theory and Practice 32 (4) 519-537 (2008)
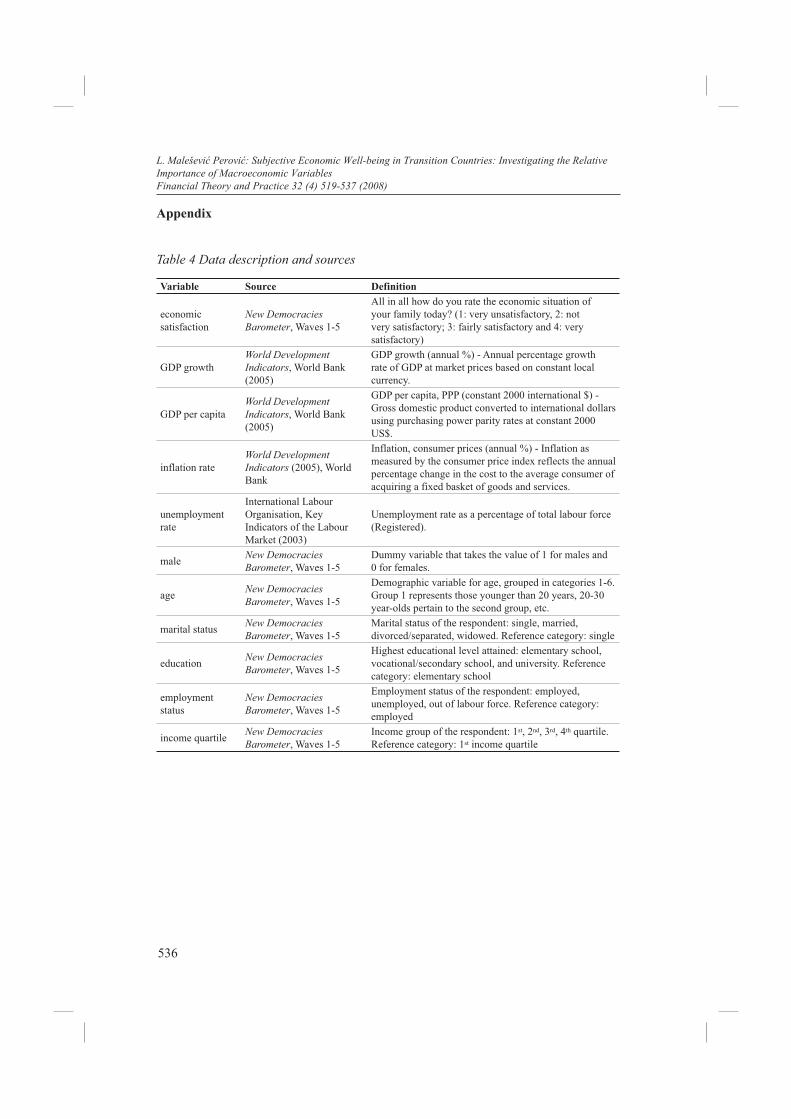
on economic well-being; i.e. the question that asks: “All in all, how do you rate the eco-nomic situation of your family today?”, with possible answers “very unsatisfactory”, “not very satisfactory”, “fairly satisfactory” and “very satisfactory”. We will use these answers as our dependent variable, by assigning each of them a number on a one to four scale. In using this question we follow Hayo and Seifert (2003), and analyse economic well-being as a part of overall well-being. This subjective measure of economic well-being had a re-latively strong correlation with life satisfaction in the first wave of the New Democracies Barometer Survey in 1991, which was the only year when both questions were asked. In addition, as already observed above, Hayo and Seifert find that the findings on socio-de-mographic variables in regressions that use life-satisfaction as the dependent variable are similar to those that use subjective economic well-being as the dependent variable. Fur-thermore, even if the life-satisfaction data were available, from the point of view of our empirical analysis, it would still make more sense to use economic well-being as the de-pendent variable. For example, as observed by Hayo and Seifert, economic effects may be overshadowed by non-economic effects. Using economic well-being, consequently, reduces the omitted variable bias compared to an analysis of the effect of economic va-riables on overall happiness. The use of “economic happiness” actually makes our anal-ysis easier, since it allows us to concentrate mainly upon economic variables and their impact on economic well-being. Description of the data sources and data definitions are given in Table 4 in the Appendix.
We control for country and time fixed effects by including dummies for each country and each year under investigation (the reference country is Hungary; and the year 1991). Country dummies capture various unchanging influences on reported economic well-being within nations, while the year dummies capture any global shocks that are common to all countries in each year. We pool repeated randomly selected samples from four years into a single dataset, so that for each year we have eight countries and eight values of the ma-croeconomic variables, resulting overall in 32 values of each macroeconomic variable. The total sample size is approximately 25000. However, there are some missing variables. Firstly, income quartile is missing for Bulgaria (1992), Croatia (1994) and the Czech Re-public (1998), so we exclude these countries in the year when the data are missing but ot-herwise include all the variables and all the countries. In addition, surveys were not con-ducted in Croatia in 1991, so we omit Croatia for this year. This results in 28 [32-3-1]5 macroeconomic observations altogether. The model we use is given below:
Yijt = Intercept + Xijt α + MAKROjt β + εi + λt + µijt
gender age inflation marital status unemployment X = employment status ; MACRO = GDP growth education status (GDP per capita) income quartile
5 32 (8 countries 4 years)-3 (Bulgaria (1992), Croatia (1994) and Czech Republic (1998))-1 (Croatia (1991))
(1)

527
L. Malešević Perović: Subjective Economic Well-being in Transition Countries: Investigating the Relative Importance of Macroeconomic Variables
Financial Theory and Practice 323 (4) 519-537 (2008)
where Yijt is the economic well-being level reported by individual i in country j in year t, Xijt is a vector of personal characteristics of the respondents, MACROjt is a vector of ma-croeconomic variables that vary only by country j and time t, not by individuals i. a and β are matrices of coefficients on personal characteristics and macroeconomic variables, respectively. Depending on our model specification this vector includes inflation, unem-ployment, and GDP growth (or GDP per capita). εi represents a country fixed effect, while λt stands for a year fixed effect. Finally, µijt is a vector of errors.
5.2 The results
We use both binomial and ordered probit. In practice this means that in ordered probit the dependent variable (answer to the question about economic well-being) has four po-ssible values: 1 - very unsatisfactory, 2 - not very satisfactory; 3 - fairly satisfactory and 4 - very satisfactory, while for the binomial probit we join groups 1 and 2, on the one side, and 3 and 4 on the other, thus resulting in two possible answers 1 - unsatisfactory and 2 - satisfactory. It might be argued that we should use as much information as possible, hence use ordered probit only. However, we believe that since we are mainly interested in the macroeconomic determinants of economic well-being, the difference between, say, very satisfactory and fairly satisfactory is of no great concern. What we want to observe for a start is whether a variable significantly positively or negatively affects well-being. All in all, in what follows we present the results from both binomial and ordered probit. We feel that this results in a more thorough investigation as we can observe whether both proce-dures point towards the same conclusions, i.e. whether macro variables affect in the same way the probability of one reporting to be satisfied in general and “very satisfied”.
Table 1 presents the results on personal characteristics of the respondents as well as on the macro variables (inflation, unemployment and GDP growth). Before proceeding, let us first discuss some issues that are important in this sort of analysis. As noted by San-fey and Teksoz (2007), it is problematic when variables on the right-hand side of the equ-ation are at a higher level of aggregation than the left-hand side variable. Moulton (1990) points out that there is a danger in merging micro unit data and public policy (macro) va-riables. Namely, the methods that are used in this case are usually based upon an assump-tion of independent disturbances. However, it is reasonable to expect that units sharing a policy observation also share unobservable characteristics, meaning that disturbances are correlated within these groups. Ignoring this leads to a downward bias of standard errors. This bias in the standard errors can result in spurious findings of statistical signi-ficance and the resulting inflation of test statistics on the effects of policy variables. This is the reason for using the clustering option. This option assumes independence across clusters, but not across observations within clusters (i.e. groupings of observations). The “clustering option” computes standard errors that are robust to this type of dependence (Sanfey and Teksoz, 2007). In our case we have 28 independent observations on macro variables (country*year, as explained in more detail above). We, therefore, cluster aro-und country*year because our policy (macro) observations are at the country*year level. However, there are also reasons against the use of clustering option in the type of sample that we have at hand. Namely, as noted by Leoni (2005), cluster robust standard errors are designed to handle data structures with many units and a relatively small number of obser-

528
L. Malešević Perović: Subjective Economic Well-being in Transition Countries: Investigating the Relative Importance of Macroeconomic VariablesFinancial Theory and Practice 32 (4) 519-537 (2008)
Table 1 Marginal effects in binomial and ordered probit
Binomial probit Ordered probita
a b a b
inflation -0.0002***(0.000)
-0.0002*(0.072)
-0.00001***(0.000)
-0.00001**(0.021)
unemployment -0.0051**(0.024)
-0.0051(0.588)
-0.00004(0.811)
-0.00004 (0.952)
GDP growth 0.0045***(0.001)
0.0045(0.223)
0.0003***(0.001)
0.0003(0.194)
Demographic variables
male dummy 0.0165***(0.010)
0.0165***(0.005)
0.0012**(0.012)
0.0012**(0.026)
age 0.0052**(0.032)
0.0052(0.290)
0.0005***(0.007)
0.0005(0.198)
Marital statussingle Reference Reference
married -0.0627***(0.000)
-0.0627***(0.000)
-0.0053***(0.000)
-0.0053***(0.000)
divorced/Separated -0.1016***(0.000)
-0.1016***(0.000)
-0.0072***(0.000)
-0.0072***(0.000)
widowed -0.0897***(0.000)
-0.0897***(0.000)
-0.0064***(0.000)
-0.0064***(0.000)
Educationelementary Reference Reference
vocational/Secondary 0.0414***(0.000)
0.0414***(0.001)
0.0048***(0.000)
0.0048***(0.000)
university 0.1438***(0.000)
0.1438***(0.000)
0.0155***(0.000)
0.0155***(0.000)
Employment statusemployed Reference Reference
unemployed -0.1008***(0.000)
-0.1008***(0.000)
-0.0091***(0.000)
-0.0091***(0.000)
out of labour force 0.0276***(0.000)
0.0276***(0.009)
0.0013**(0.023)
0.0013(0.115)
Income quartileQ1 Reference Reference
Q2 0.0647***(0.000)
0.0647***(0.000)
0.0071***(0.000)
0.0071***(0.001)
Q3 0.1434***(0.000)
0.1434***(0.000)
0.0163***(0.000)
0.0163***(0.000)
Q4 0.2790***(0.000)
0.2790***(0.000)
0.0397***(0.000)
0.0397***(0.000)
Year dummies1991 Reference Reference
1992 0.0347**(0.024)
0.0347(0.559)
0.0008(0.463)
0.0008(0.847)
1994 -0.0107(0.611)
-0.0107(0.887)
-0.0021(0.158)
-0.0021(0.690)
1998 -0.0212(0.290)
-0.0212(0.765)
-0.0006(0.675)
-0.0006(0.898)
Cluster option no yes no yes
529
L. Malešević Perović: Subjective Economic Well-being in Transition Countries: Investigating the Relative Importance of Macroeconomic Variables
Financial Theory and Practice 323 (4) 519-537 (2008)
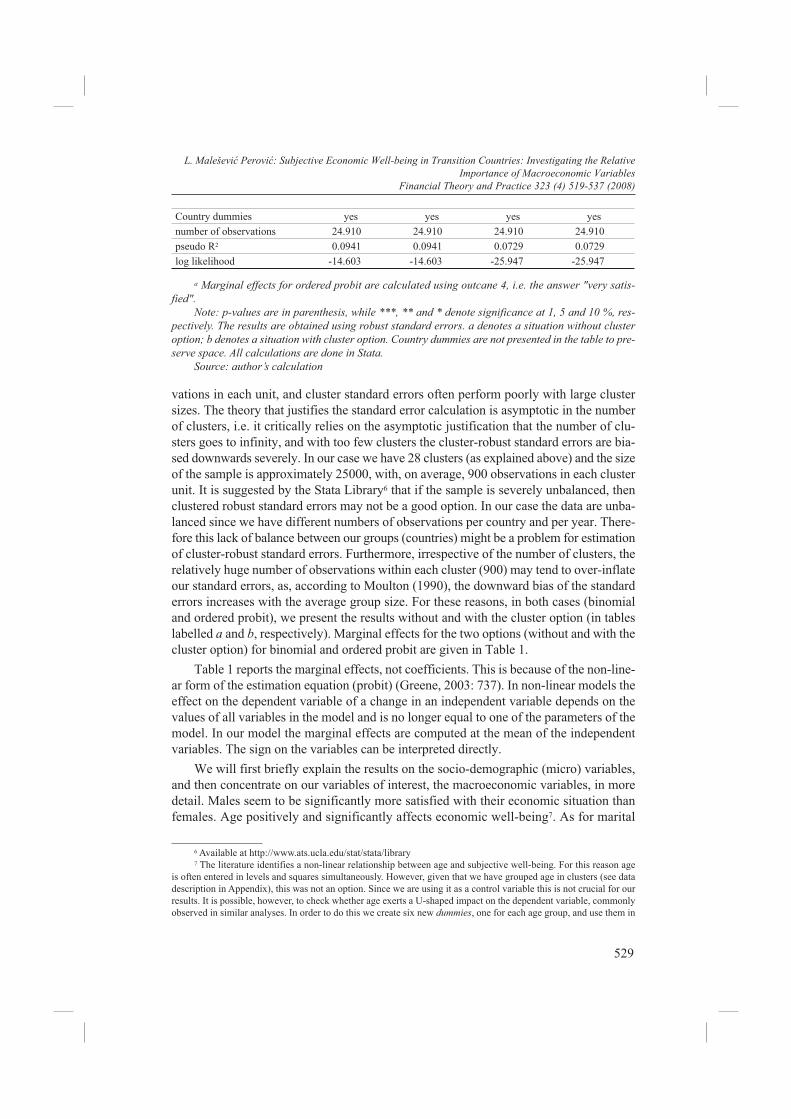
vations in each unit, and cluster standard errors often perform poorly with large cluster sizes. The theory that justifies the standard error calculation is asymptotic in the number of clusters, i.e. it critically relies on the asymptotic justification that the number of clu-sters goes to infinity, and with too few clusters the cluster-robust standard errors are bia-sed downwards severely. In our case we have 28 clusters (as explained above) and the size of the sample is approximately 25000, with, on average, 900 observations in each cluster unit. It is suggested by the Stata Library6 that if the sample is severely unbalanced, then clustered robust standard errors may not be a good option. In our case the data are unba-lanced since we have different numbers of observations per country and per year. There-fore this lack of balance between our groups (countries) might be a problem for estimation of cluster-robust standard errors. Furthermore, irrespective of the number of clusters, the relatively huge number of observations within each cluster (900) may tend to over-inflate our standard errors, as, according to Moulton (1990), the downward bias of the standard errors increases with the average group size. For these reasons, in both cases (binomial and ordered probit), we present the results without and with the cluster option (in tables labelled a and b, respectively). Marginal effects for the two options (without and with the cluster option) for binomial and ordered probit are given in Table 1.
Table 1 reports the marginal effects, not coefficients. This is because of the non-line-ar form of the estimation equation (probit) (Greene, 2003: 737). In non-linear models the effect on the dependent variable of a change in an independent variable depends on the values of all variables in the model and is no longer equal to one of the parameters of the model. In our model the marginal effects are computed at the mean of the independent variables. The sign on the variables can be interpreted directly.
We will first briefly explain the results on the socio-demographic (micro) variables, and then concentrate on our variables of interest, the macroeconomic variables, in more detail. Males seem to be significantly more satisfied with their economic situation than females. Age positively and significantly affects economic well-being7. As for marital
6 Available at http://www.ats.ucla.edu/stat/stata/library7 The literature identifies a non-linear relationship between age and subjective well-being. For this reason age
is often entered in levels and squares simultaneously. However, given that we have grouped age in clusters (see data description in Appendix), this was not an option. Since we are using it as a control variable this is not crucial for our results. It is possible, however, to check whether age exerts a U-shaped impact on the dependent variable, commonly observed in similar analyses. In order to do this we create six new dummies, one for each age group, and use them in
Country dummies yes yes yes yesnumber of observations 24.910 24.910 24.910 24.910pseudo R2 0.0941 0.0941 0.0729 0.0729log likelihood -14.603 -14.603 -25.947 -25.947
a Marginal effects for ordered probit are calculated using outcane 4, i.e. the answer "very satis-fied".
Note: p-values are in parenthesis, while ***, ** and * denote significance at 1, 5 and 10 %, res-pectively. The results are obtained using robust standard errors. a denotes a situation without cluster option; b denotes a situation with cluster option. Country dummies are not presented in the table to pre-serve space. All calculations are done in Stata.
Source: author’s calculation

530
L. Malešević Perović: Subjective Economic Well-being in Transition Countries: Investigating the Relative Importance of Macroeconomic VariablesFinancial Theory and Practice 32 (4) 519-537 (2008)
status, all three groups listed (married, divorced/separated and widowed) seem to be less economically satisfied than the reference category, singles. The results are significant for all three groups. The results, furthermore, imply that those divorced or separated are the least satisfied, followed by the widowed. Happiness studies typically find married respon-dents are happier than singles. Our results, however, suggest that singles are more satis-fied with their economic well-being than the married. This would suggest that although general well-being is raised by marriage, economic well-being is not. As far as education is concerned, the higher the education level the more satisfied an individual is with his/her economic situation. People with a university degree are the most satisfied, followed by those with vocational or secondary education. Both groups are significantly more sa-tisfied economically than those with only elementary education. The same was found by Hayo and Seifert (2003) who also use economic well-being as their dependent variable. The unemployed are, expectedly, less economically satisfied than the employed. The out of the labour force are more satisfied than the employed, and consequently, than the unemployed. This is a surprising finding, given that most studies find that the employed are the “happiest” group among the three groups. Interestingly, however, Namazie and Sanfey (1999) similarly find that those out of the labour force are more satisfied with life than those employed and unemployed in Kyrgyzstan. We should bear in mind, however, that our dependent variable is not happiness but rather economic well-being. Finally, as for the income quartiles, those in the upper income quartiles are, as expected, more eco-nomically satisfied than those in the lower quartiles. All the results are significant at the 1 percent level. As the income quartile increases so does economic satisfaction. As far as micro variables are concerned, almost all the results are significant at conventional levels and all the signs are, on the whole, as expected. In terms of precise interpretation of the marginal effects in binomial probit, the marginal effect on married people, for example, of –0.0627 (Column 2), means that the proportion of married people who report being satisfied with their economic situation is 6.27 percentage points lower than proportion of singles (reference group). As for the ordered probit results, the marginal effect on marri-ed people of –0.0053 (Column 4), means that the probability that a married person reports himself/herself as being “very satisfied” with his/her economic situation is 0.53 percenta-ge points lower than that for a single person.
Let us now concentrate on the impact of macro variables. In Table 1 we included in-flation, unemployment and GDP growth together. This is often done in papers that deal with similar issues. However, we think that there are grounds for believing that unem-ployment and GDP growth should not be included in the regression together. Namely, they are linked via Okun’s Law according to which, if the number of workers in the la-bour force is fixed and hours worked per worker are unchanged, an increase in output is possible only by putting unemployed workers to work, and hence a decline in unem-ployment is a natural consequence of increasing output (Burda and Wyplosz, 2005). If this is so, these two variables are likely to be (negatively) correlated and collinear by de-
our equation instead of the joint age variable. The results indicate that age does indeed exert a U-shaped effect in our sample. Namely, all age groups are “less happy” than the first group (less than 20 years old); among them the “unhap-piest” group is group 4 (it has the largest coefficient and marginal effect). This implies a U-shape, where group 1 is the happiest, followed by groups 2, 3 and 4. At group four the inflexion point occurs and happiness starts to rise, group 5 being happier than group 4, and group 6 than group 5.
531
L. Malešević Perović: Subjective Economic Well-being in Transition Countries: Investigating the Relative Importance of Macroeconomic Variables
Financial Theory and Practice 323 (4) 519-537 (2008)
finition. This is likely to be a particularly serious problem with only 28 macroeconomic observations, and therefore we think that only one of these two variables should be inclu-ded in the regression at a time. This might also be a reason why some of these variables turn out to be insignificant.
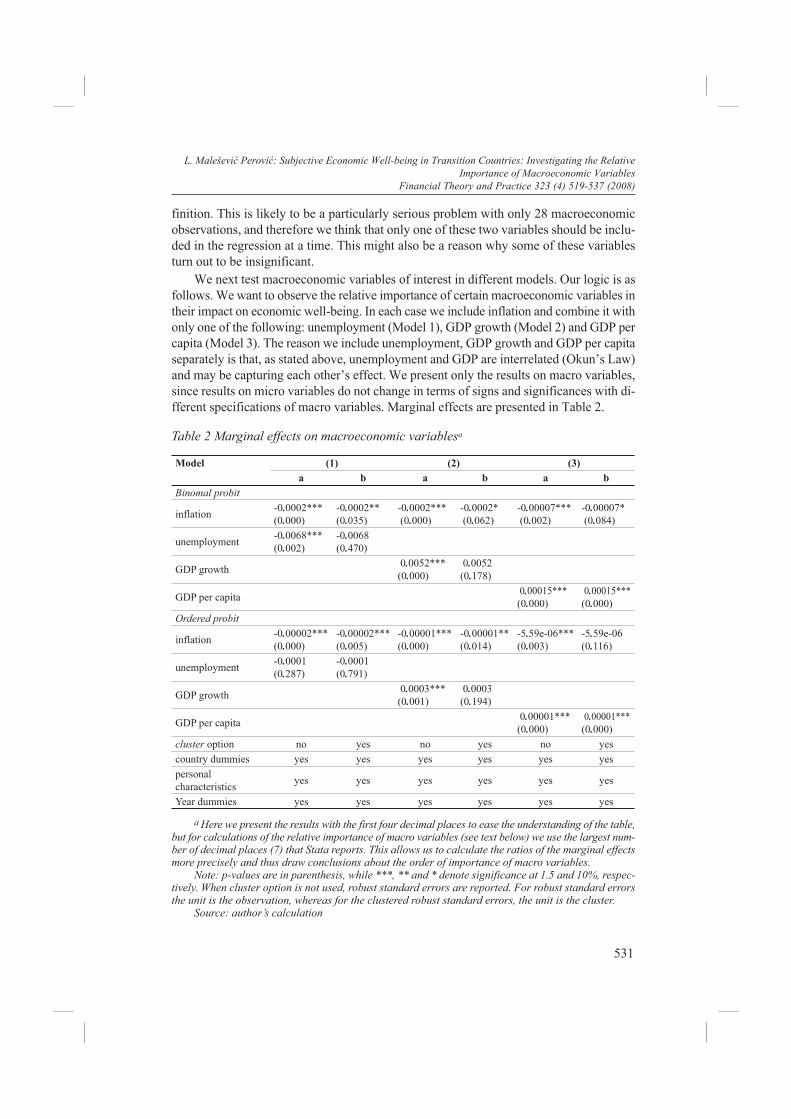
We next test macroeconomic variables of interest in different models. Our logic is as follows. We want to observe the relative importance of certain macroeconomic variables in their impact on economic well-being. In each case we include inflation and combine it with only one of the following: unemployment (Model 1), GDP growth (Model 2) and GDP per capita (Model 3). The reason we include unemployment, GDP growth and GDP per capita separately is that, as stated above, unemployment and GDP are interrelated (Okun’s Law) and may be capturing each other’s effect. We present only the results on macro variables, since results on micro variables do not change in terms of signs and significances with di-fferent specifications of macro variables. Marginal effects are presented in Table 2.
Table 2 Marginal effects on macroeconomic variablesa
Model (1) (2) (3)a b a b a b
Binomal probit
inflation -0.0002***(0.000)
-0.0002**(0.035)
-0.0002*** (0.000)
-0.0002* (0.062)
-0.00007*** (0.002)
-0.00007* (0.084)
unemployment -0.0068***(0.002)
-0.0068(0.470)
GDP growth 0.0052***(0.000)
0.0052(0.178)
GDP per capita 0.00015***(0.000)
0.00015***(0.000)
Ordered probit
inflation -0.00002***(0.000)
-0.00002***(0.005)
-0.00001***(0.000)
-0.00001**(0.014)
-5.59e-06***(0.003)
-5.59e-06(0.116)
unemployment -0.0001(0.287)
-0.0001(0.791)
GDP growth 0.0003***(0.001)
0.0003(0.194)
GDP per capita 0.00001***(0.000)
0.00001***(0.000)
cluster option no yes no yes no yescountry dummies yes yes yes yes yes yespersonal characteristics yes yes yes yes yes yes
Year dummies yes yes yes yes yes yes
a Here we present the results with the first four decimal places to ease the understanding of the table, but for calculations of the relative importance of macro variables (see text below) we use the largest num-ber of decimal places (7) that Stata reports. This allows us to calculate the ratios of the marginal effects more precisely and thus draw conclusions about the order of importance of macro variables.
Note: p-values are in parenthesis, while ***, ** and * denote significance at 1.5 and 10%, respec-tively. When cluster option is not used, robust standard errors are reported. For robust standard errors the unit is the observation, whereas for the clustered robust standard errors, the unit is the cluster.
Source: author’s calculation

532
L. Malešević Perović: Subjective Economic Well-being in Transition Countries: Investigating the Relative Importance of Macroeconomic VariablesFinancial Theory and Practice 32 (4) 519-537 (2008)
Within each model in Table 2 we present two options (a and b) depending on whet-her the cluster option is used or not. The first thing we note is that, as expected, the cluster option makes no difference with respect to the marginal effects, but it does make a huge difference with respect to statistical significance in some cases. As expected, using this option diminishes the significance on certain variables. The upper part of Table 2 presents the binomial probit results, whereas the lower part refers to ordered probit results. Model 1 includes the inflation rate and the unemployment rate, Model 2 inflation and GDP growth and Model 3 inflation and GDP per capita. We expected to find negative signs on infla-tion and unemployment, and positive ones on GDP growth and GDP per capita. All the signs in Table 2 are in line with our expectations. When we do not use the cluster opti-on (option a) all the variables are significant at the 1 percent level of significance, except unemployment when an ordered probit is used. As expected, when the cluster option is used (option b), the significance of certain variables diminishes. In this case only infla-tion is significant in Models 1 and 2. In Model 3 both macro variables are significant in the binomial probit model (although inflation only at the 10 percent level), but only GDP per capita is significant in the ordered probit. We report both options, a and b, because, as discussed above, there are pros and cons of using the cluster option in our sample. The results overall suggest that, other things being equal, the higher the unemployment rate the lower the probability that a person would report that he/she is satisfied with his/her economic situation. Similarly, the higher the inflation rate, ceteris paribus, the lower the probability that a person will be satisfied. As for GDP growth and GDP per capita, the hi-gher they are the higher the probability that a person would report that he/she is satisfied with his/her economic situation (or very satisfied in the case of ordered probit).
Now turning to our main goal, we want to analyse the relative importance of macro-economic variables in affecting happiness. In other words, we want to observe what in-fluences happiness more; inflation, unemployment or GDP (growth or per capita) and in what order. In our Model 1 (binomial probit) we divide the marginal effects on unem-ployment and inflation, and obtain [(-0.00687578)/(-0.0002821)]= 24.37, meaning that unemployment is 24 times more important than inflation. In addition, when analysing the impact of unemployment we should also look at the unemployed variable among the set of micro variables. Namely, we consider the marginal effect of inflation and unemployment as a macro regressor for the two possible values of micro unemployment (i.e. unemployed and employed). We keep the marginal effect on the out of the labour force dummy equal to zero, and in this way consider only those people that are in the labour force. This allows us to differ between those who are unemployed and those who are employed by calcula-ting marginal effect for dummy_unemployed=1, and dummy_unemployed=0, respective-ly9. The results (not reported) indicate that for the unemployed person unemployment (as a macro variable) is 24.38 times more important than inflation, while for the employed person unemployment (as a macro variable) is 24.37 times more important than inflati-on, thus indicating that rate of unemployment in a country is slightly more important to those unemployed. In Model 2 (binomial probit) it is implied that GDP growth is more
8 Full number of decimal places is not reported. See footnotea in Table 2.9 We have to approach the problem in this way, as the dummy employed is our reference category and, hence,
incalculable in its marginal effect.
533
L. Malešević Perović: Subjective Economic Well-being in Transition Countries: Investigating the Relative Importance of Macroeconomic Variables
Financial Theory and Practice 323 (4) 519-537 (2008)
important than inflation. More precisely it seems to be 23.2210 times more important. The results on GDP per capita indicate that it is 2.0111 times more important than inflation. Above we have presented the results from binomial probit. The results from ordered pro-bit, similarly, indicate that all three tested variables are more important than inflation. As for the quantification of this importance, however, the results in ordered probit are so-mewhat different. They imply that GDP growth is 21.28, unemployment 8.79 and GDP per capita 1.81 times more important than inflation. We should bear in mind that these results show how each of the macroeconomic variables influences the probability that a person would report himself/herself to be “very satisfied”, whereas in binomial probit the results referred to the probability that a person would report himself/herself to be “satis-fied” (which includes categories “very satisfied” and “fairly satisfied”).
Finally, as robustness check of our results, following Sanfey and Teksoz (2007), we also run regressions without the country dummies, but with all three macroeconomic va-riables included. It could be argued that Okun’s Law might not hold in transition countri-es (especially in the beginning of transition) because of the less regulated overtime work or because of the technological change in the production process12. If this is the case, pro-ductivity rises need not be accompanied by a fall in unemployment, and it makes sense to include unemployment and GDP in the regression together. In addition, we also test whether exclusion of year dummies influences our results. The logic is that country and time dummies may be capturing part of the significance that would otherwise be captured by the macro variables. The results are presented in Table 3.
All the results are in line with expectations in terms of signs; namely inflation and unemployment affect economic well-being negatively, while GDP growth and GDP per capita affect it positively. As before, the use of cluster option drastically influences the significances of the variables, suggesting in most cases that only unemployment has a si-gnificant impact on economic well-being. At the ten percent significance GDP per capita is also significant. In terms of the sizes of marginal effects, the results suggest that unem-ployment matters the most for economic well-being, followed by GDP growth and infla-tion. The conclusions are the same irrespective of whether year dummies are included in the regression or not. The marginal effect on GDP per capita is extremely small (especi-ally in ordered probit). In addition, when we included only GDP per capita and inflation together (Table 2, column 4), the results suggested that GDP per capita is more impor-tant than inflation, whereas now it seems to be less important than inflation. This might be due to collinearity between GDP and unemployment given that they are now included in the regression together. This is another reason why we feel that only two of the macro-economic variables should be included in the regression at a time.
Overall, our results indicating that unemployment is more important than inflation are in line with the findings of other papers on the topic (see Di Tella et al., 2001 and Wolfers, 2003). The magnitude is different though, suggesting the higher importance of unemployment, compared to inflation, in transition countries than in European countri-es. As for the results on GDP variables, similar to findings on European countries in Di
10 0.0052888/0.0002278 (not all 7 decimal places are reported in Table 2)11 0.000155/0.000077 (not all 7 decimal places are reported in Table 2)12 I am thankful to an anonymous referee who suggested this.

534
L. Malešević Perović: Subjective Economic Well-being in Transition Countries: Investigating the Relative Importance of Macroeconomic VariablesFinancial Theory and Practice 32 (4) 519-537 (2008)
Tella et al. (2003), we find that both the level and the growth of GDP are significant in their impact on economic well-being. These two variables have not been, to the best of our knowledge, previously compared in their importance to inflation, so we cannot com-pare our results to previous research.
6 Conclusion
This paper shows that macroeconomic variables strongly and significantly influence economic well-being in transition countries. Our goal was not only to determine whether macro variables influence well-being, but also to assess their relative importance. More precisely, we wanted to determine which variables matter more to the public in transition countries: inflation, unemployment, GDP growth or GDP level. Through the use of hap-piness surveys we approached the matter of relative importance of these variables from a subjective aspect, rather than the usually used objective aspect, whereby policy goals are assumed to reflect public opinion.
Table 3 Marginal effects on all three macro variables without the country dummies and with and without the year dummies
Binomial probit
inflation -0.00013***(0.000)
-0.00013***(0.000)
-0.00013(0.352)
-0.00013(0.383)
-0.00009***(0.000)
-0.00011***(0.000)
-0.00009(0.431)
-0.00011(0.377)
unemployment -0.01765***(0.000)
-0.01598***(0.000)
-0.01765***(0.001)
-0.01598**(0.018)
-0.01286***(0.000)
-0.00922***(0.000)
-0.01286***(0.007)
-0.00922*(0.084)
GDP growth 0.00243**(0.019)
0.00394**(0.000)
0.00243(0.677)
0.00394(0.325)
GDP per capita 0.00001***(0.000)
0.00001***(0.000)
0.00001*(0.074)
0.00001*(0.064)
Ordered probit
inflation -0.00001***(0.000)
-0.00001***(0.000)
-0.00001(0.197)
-0.00001(0.245)
-9.66e-06***(0.000)
-0.00001***(0.000)
-9.66e-06(0.265)
-0.00001(0.198)
unemployment -0.00168***(0.000)
-0.0015***(0.000)
-0.00168***(0.000)
-0.00155***(0.002)
-0.00122***(0.000)
-0.0009***(0.000)
-0.00122***(0.003)
-0.0009**(0.037)
GDP growth 0.00018**(0.036)
0.00042***(0.000)
0.00018 (0.696)
0.00042(0.210)
GDP per capita 1.04e-06***(0.000)
1.35e-06***(0.000)
1.04e-06*(0.065)
1.35e-06**(0.046)
cluster option yes no yes yes no no yes yescountry dummies no no no no no no no nopersonal characteristics yes yes yes yes yes yes yes yes
year dummies yes No yes no yes no yes no
Note: p-values are in parenthesis, while ***, ** and * denote significance at 1, 5 and 10 percent, res-pectively.
Source: author’s calculation

535
L. Malešević Perović: Subjective Economic Well-being in Transition Countries: Investigating the Relative Importance of Macroeconomic Variables
Financial Theory and Practice 323 (4) 519-537 (2008)
Our results indicated that unemployment is an important variable from the public’s point of view, i.e. that it significantly (and negatively) influences economic well-being in transition countries. Furthermore, it was shown that it is more important than inflati-on. It seems, therefore, that the public are not as concerned about inflation as politicians, and that it is unemployment that is of more interest to them. As for the other results, there is evidence in the data of the existence of both level and change effects of GDP on nati-ons’ economic well-being. First, compatible with standard economic theory, well-being in transition countries seems to be (positively) influenced by GDP per capita. Second, re-ported well-being is also (positively) influenced by GDP growth, which is consistent with adaptation theories in which the benefits of real income diminish over time. Therefore, improvements in national income lead to both temporary and permanent gains in national happiness in transition countries. Taking the two findings together we conclude that ha-bituation effects are present, indicating that individuals become accustomed to an incre-ase in national income, but not all the benefits of this increase dissipate over time. When these two variables are, in turn, put into the model, there is evidence that both GDP per capita and GDP growth are more important than inflation. Inflation also influences eco-nomic well-being significantly, and, as expected, negatively.
All in all, our conclusion is that there is evidence that the public’s sense of econo-mic well-being is most affected by unemployment and GDP growth. Moreover, since hi-gher GDP growth also facilitates more employment, these two goals are compatible and in line with the wishes of the populace. Therefore, GDP growth is an important goal of economic policy not only from the point of view of policy-makers, but also from that of the public. This does not come as a surprise, given that transition countries have (relati-vely) low GDP levels and, as mentioned earlier, happiness rises with GDP for low-inco-me countries. GDP per capita and inflation also significantly influence one’s economic well-being, although to a lesser extent. Inflation, therefore, seems not to be the main con-cern of the population.
536
L. Malešević Perović: Subjective Economic Well-being in Transition Countries: Investigating the Relative Importance of Macroeconomic VariablesFinancial Theory and Practice 32 (4) 519-537 (2008)
Appendix
Table 4 Data description and sources
Variable Source Definition
economic satisfaction
New Democracies Barometer, Waves 1-5
All in all how do you rate the economic situation of your family today? (1: very unsatisfactory, 2: not very satisfactory; 3: fairly satisfactory and 4: very satisfactory)
GDP growthWorld Development Indicators, World Bank (2005)
GDP growth (annual %) - Annual percentage growth rate of GDP at market prices based on constant local currency.
GDP per capitaWorld Development Indicators, World Bank (2005)
GDP per capita, PPP (constant 2000 international $) - Gross domestic product converted to international dollars using purchasing power parity rates at constant 2000 US$.
inflation rateWorld Development Indicators (2005), World Bank
Inflation, consumer prices (annual %) - Inflation as measured by the consumer price index reflects the annual percentage change in the cost to the average consumer of acquiring a fixed basket of goods and services.
unemployment rate
International Labour Organisation, Key Indicators of the Labour Market (2003)
Unemployment rate as a percentage of total labour force (Registered).
male New Democracies Barometer, Waves 1-5
Dummy variable that takes the value of 1 for males and 0 for females.
age New Democracies Barometer, Waves 1-5
Demographic variable for age, grouped in categories 1-6. Group 1 represents those younger than 20 years, 20-30 year-olds pertain to the second group, etc.
marital status New Democracies Barometer, Waves 1-5
Marital status of the respondent: single, married, divorced/separated, widowed. Reference category: single
education New Democracies Barometer, Waves 1-5
Highest educational level attained: elementary school, vocational/secondary school, and university. Reference category: elementary school
employment status
New Democracies Barometer, Waves 1-5
Employment status of the respondent: employed, unemployed, out of labour force. Reference category: employed
income quartile New Democracies Barometer, Waves 1-5
Income group of the respondent: 1st, 2nd, 3rd, 4th quartile. Reference category: 1st income quartile
537
L. Malešević Perović: Subjective Economic Well-being in Transition Countries: Investigating the Relative Importance of Macroeconomic Variables
Financial Theory and Practice 323 (4) 519-537 (2008)
LITERATURE
Burda, M. and Wyplosz, C., 2005. Macroeconomics. Oxford: Oxford Universi-ty Press.
Di Tella, R., MacCulloch, R. and Oswald, A., 2001. ”Preferences over Inflation and Unemployment: Evidence from Surveys of Happiness”. The American Economic Re-view, 91 (1), 335-341.
Di Tella, R., MacCulloch, R. and Oswald, A., 2003. ”The Macroeconomics of Hap-piness”. Review of Economics and Statistics, 85, 809-827.
Easterlin, R., 1974. ”Does Economic Growth Improve the Human Lot? Some Em-pirical Evidence” in P. David and M. Reder, eds. Nations and Households in Economic Growth: Essays in Honour of Moses Abramovitz. New York; London: Academic Press.
Frey, B. and Stutzer, A., 2002. ”What can Economists Learn from Happiness Re-search?” Journal of Economic Literature, 40 (2), 520-578.
Frey, B. and Stutzer, A., 2002a. Happiness and Economics. How the Economy and Institutions Affect Human Well-being. Princeton; Oxford: Princeton University Press.
Green, F., Felstead, A. and Burchell, B., 2000. ”Job Insecurity and the Difficulty of Regaining Employment: An Empirical Study of Unemployment Expectations”. Oxford Bulletin of Economics and Statistics, No. 62.
Greene, W., 2003. Econometric Analysis. New York: Prentice Hall
Hayo, B. and Seifert, W., 2003. ”Subjective Economic Well-being in Eastern Euro-pe”. Journal of Economic Psychology, 24 (3), 329-348.
Leoni, E., 2005. ”Analysing Multi-Country Survey Data: Results from Monte Carlo Expe-riments” [online]. Dostupno na: [http://www.allacademic.com/meta/p84506_index.html].
Moulton, B., 1990. ”An Illustration of a Pitfall in Estimating the Effects of Aggregate Variables on Micro Units”. The Review of Economics and Statistics, 72 (2), 334-338.
Namazie, C. and Sanfey, P. 1999. ”Happiness in Transition: the Case of Kyrgyzstan”. Studies in Economics, No. 9808.
Paul, S., 2001. ”A Welfare Loss Measure of Unemployment with an Empirical Illu-stration”. The Manchester School, 69 (2), 148-163.
Sanfey, P. and Teksoz, U., 2007. ”Does Transition Make You Happy?”. Economics of Transition, 15 (4), 707-731.
Shiller, R., 1996. ”Why Do People Dislike Inflation?” NBER Working Paper, No. 5539.
Winkelmann, L. and Winkelmann, R., 1997. ”Why Are the Unemployed So Un-happy? Evidence from Panel Data”. Economica, 65, 1-15.
Wolfers, J., 2003. ”Is Business Cycle Volatility Costly? Evidence from Surveys of Subjective Wellbeing”. International Finance, 6 (1), 1-26.