the influence of macroeconomic variables to stock market ...
19
THE INFLUENCE OF MACROECONOMIC VARIABLES TO STOCK MARKET RETURNS OF THREE SECTORS (AGRICULTURE, PROPERTY, AND MINING) IN INDONESIA Ihwanul muslimin department of economics development, faculty of economics and business, brawijaya university ABSTRACT The objective of this research was to determine the effect of macroeconomic variables such as inflation (CPI), exchange rate (ER), money supply (M2) and additional dummy variables to distinguish stock prices of 5000 and stock prices above 5000 on stock returns in three sectors such as agriculture, mining and property on the Indonesia Stock Exchange and the data used is panel data consisting of monthly data from 2008 to 2018. Based on the research, it was found that there was no significant effect between inflation (CPI) and stock market returns and also The exchange rate variable (ER) has no significant effect on stock market returns. Furthermore, The money supply (M2) variable has a significant influence on stock market returns. An increased in money supply (M2) has an impact on increasing stock returns and simultaneously inflation (CPI), Exchange rate (ER) and money supply (M2) have a significant influence on stock market returns in the three sectors of agriculture, mining and property. Keyword:Macroeconomic Variable, Stock Market Returns, Indonesia,Panel analysis Macroeconomic variables play an important role in the performance of stock market returns. Numerous studies document that there are link between macroeconomic variables and stock market returns. It is found that changes in the macroeconomic environment affect the price of share.. According to the Miseman et al. (2013) studied the impact of macroeconomic forces on five ASEAN stock market movement, including used as a proxy for stock market
-
Upload
khangminh22 -
Category
Documents
-
view
0 -
download
0
Transcript of the influence of macroeconomic variables to stock market ...
THE INFLUENCE OF MACROECONOMIC VARIABLES TO STOCK MARKET RETURNS OF THREE SECTORS (AGRICULTURE, PROPERTY, AND MINING) IN INDONESIA
Ihwanul muslimin
department of economics development, faculty of economics and business, brawijaya university
ABSTRACT
The objective of this research was to determine the effect of macroeconomic variables such as
inflation (CPI), exchange rate (ER), money supply (M2) and additional dummy variables to
distinguish stock prices of 5000 and stock prices above 5000 on stock returns in three sectors
such as agriculture, mining and property on the Indonesia Stock Exchange and the data used is
panel data consisting of monthly data from 2008 to 2018. Based on the research, it was found
that there was no significant effect between inflation (CPI) and stock market returns and also
The exchange rate variable (ER) has no significant effect on stock market returns. Furthermore,
The money supply (M2) variable has a significant influence on stock market returns. An
increased in money supply (M2) has an impact on increasing stock returns and simultaneously
inflation (CPI), Exchange rate (ER) and money supply (M2) have a significant influence on stock
market returns in the three sectors of agriculture, mining and property.
Keyword:Macroeconomic Variable, Stock Market Returns, Indonesia,Panel analysis
Macroeconomic variables play an important role in the performance of stock market
returns. Numerous studies document that there are link between macroeconomic variables and
stock market returns. It is found that changes in the macroeconomic environment affect the
price of share.. According to the Miseman et al. (2013) studied the impact of macroeconomic
forces on five ASEAN stock market movement, including used as a proxy for stock market
returns and are considered as the dependent variable. Since it is quite impossible to investigate
every potential macroeconomic determinant to explain the variation in stock market return, the
choice of determinants are based on the previous studies, and three macroeconomic
determinants have been chosen to be independent variables in this study namely MS, ER and
CPI.
Geetha et al. (2011) investigated the relationship between the stock market, expected
inflation rate, unexpected inflation rate, exchange rate, interest rate and GDP in the case of
Malaysia, US and China. They used cointegration test to determine the number of cointegrating
vectors, which shows the long-run relationship between the variables. In contrast, the short-run
relationship was determined using the Vector Error Correction model. Their results indicate that
there is a long-run cointegration relationship between stock markets and those variables in
Malaysia, US and China. On the other hand, there is no short-run relationship between the
stock market, unexpected inflation, expected inflation, interest rate, exchange rate and GDP for
Malaysia and US using VEC. However, China’s VEC result shows that there is a short-run
relationship between expected inflation rates and China’s stock market
Over the past few decades in indonesia , the interaction of share returns and the
macroeconomic vari- ables has been a subject of interest among academics and practitioners. It
is often argued that stock prices are determined by some fundamental macroeconomic
variables such as the interest rate, the exchange rate and the inflation. Anecdotal evidence from
the financial press indicates that inves- tors generally believe that monetary policy and
macroeconomic events have a large influence on the volatility of the stock price. This implies
that macroeconomic variables can influence investors’ investment decision and motivates many
researchers to investigate the relationships between share returns and macroeconomic
variables. An accurate estimation of the relationship between macroeconomic variables and
performances of the stock market can enable investors to make better investment decisions. At
the same time, it might help policy makers to make effective decisions and encourage more
capital inflows into the capital market of the country.
this research aims to perform a comparative analysis about the impact of macroeconomic
variables MS, ER, inflation to stock market return of three sectors agriculture, property and
mining in indonesia. Such as the research conducted by Wongbangpo & Sharma (2002) that
investigated the role of selected macroeconomic determinants namely the MS, the ER and the
consumer price index (CPI) on the stock prices in five selected ASEAN countries (Malaysia,
Philippines, Thailand, Indonesia and Singapore). Overall, the Granger causality test detected
the connection between selected macroeconomic determinants toward the stock prices in all
five ASEAN stock market. The results suggested that stock prices in Malaysia, Thailand and
Singapore positively related to MS, yet negative in Philippines and Indonesia. In terms of ER,
stock prices in Indonesia, Malaysia and Philippines were positively related to ER, yet negative in
Singapore and Thailand.
LITERATURE REVIEW AND HYPOTHESIS DEVELOPMENT
The relationship between macroeconomic fundamentals and stock market returns have been a
major topic of engagement within the financial economics circus. This relationship is an object of
on-going interest of investors, academics and policymakers. Several theories and empirical
evidence alike have shown much detail on this subject of concern to economies. Literature,
such as that by Markowitz (1959) Sharpe ( 1964), Lintner (1969), Ross (1976), Fama & French
(1995) has provided a theoretical basis by which stocks may be valued. However, the
simplifying assumptions, upon which many of these models are derived and based present key
weaknesses. These weaknesses become increasingly evident in the implementation and
practical application of the model in reality. Nonetheless, from a theoretical point of view, these
models present a sound theoretical foundation on which stock market movement may be
attributed to the influences of the macroeconomic factors.The Capital Asset Pricing Model
(CAPM) and Asset Pricing Theory (APT) are be reference in this study to underpin the
relationship between the stock market and the economic activities
The Capital Asset Pricing Model: Theory and Evidence written by Fama and French, the
theory and evidence for the Capital Asset Pricing Model (CAPM), and the development of the
Fama-French Three-Factor Model (FF3). Behaviorist is critical to the Capital Asset Pricing
Model’s ability to explain the true covariance of market return according to Fama and French.
They argue that the average return premium related to the FF3 model is misleading in terms of
pricing. They explain the empirical evidence for the weak explanatory power of the CAPM,
developed by Sharpe (1964) and Lintner (1969). In the late 1970s, the new variables price-
ratios and size were found to have explanatory power on the return of portfolios. The work of
Fama and French is a significant part of finance and the two models CAPM and FF3.
Fundamentals of Fama and French findings influenced the current global research when they
showed that FF3 produced a better result of estimating average returns on portfolios than
CAPM used on the international market by Fama & French (2004).
Bartholdy & Peare (2005) compared expected returns between the performance of
estimating individual stock returns using CAPM and FF3. The result of the study was shown to
be limited in its explanatory power of the expected returns. On average CAPM explained 3% of
the differences in return and the Fama-French model on average 5%. Testing different intervals
of data frequencies and indexes to see what resulted in the best estimation, it was found that
monthly observations over five years were the best fit. Bartholdy and Peare (2005) found in their
research that the models performed differently using different indexes. They identified that the
best type of index used was the equal-weighted and not the more common value-weighted
index. The analysis in their study was made on the New York Stock Exchange, the U.S. stock
market. In conclusion, the author presents that none of the models produced high significance
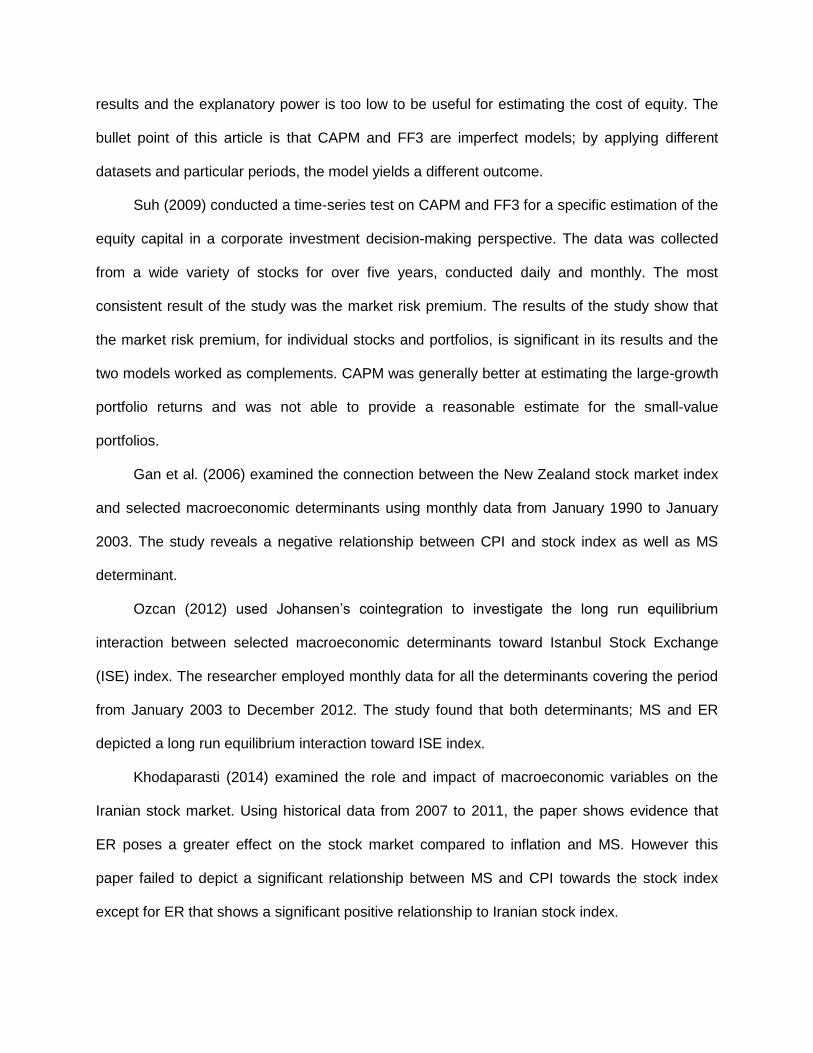
results and the explanatory power is too low to be useful for estimating the cost of equity. The
bullet point of this article is that CAPM and FF3 are imperfect models; by applying different
datasets and particular periods, the model yields a different outcome.
Suh (2009) conducted a time-series test on CAPM and FF3 for a specific estimation of the
equity capital in a corporate investment decision-making perspective. The data was collected
from a wide variety of stocks for over five years, conducted daily and monthly. The most
consistent result of the study was the market risk premium. The results of the study show that
the market risk premium, for individual stocks and portfolios, is significant in its results and the
two models worked as complements. CAPM was generally better at estimating the large-growth
portfolio returns and was not able to provide a reasonable estimate for the small-value
portfolios.
Gan et al. (2006) examined the connection between the New Zealand stock market index
and selected macroeconomic determinants using monthly data from January 1990 to January
2003. The study reveals a negative relationship between CPI and stock index as well as MS
determinant.
Ozcan (2012) used Johansen’s cointegration to investigate the long run equilibrium
interaction between selected macroeconomic determinants toward Istanbul Stock Exchange
(ISE) index. The researcher employed monthly data for all the determinants covering the period
from January 2003 to December 2012. The study found that both determinants; MS and ER
depicted a long run equilibrium interaction toward ISE index.
Khodaparasti (2014) examined the role and impact of macroeconomic variables on the
Iranian stock market. Using historical data from 2007 to 2011, the paper shows evidence that
ER poses a greater effect on the stock market compared to inflation and MS. However this
paper failed to depict a significant relationship between MS and CPI towards the stock index
except for ER that shows a significant positive relationship to Iranian stock index.
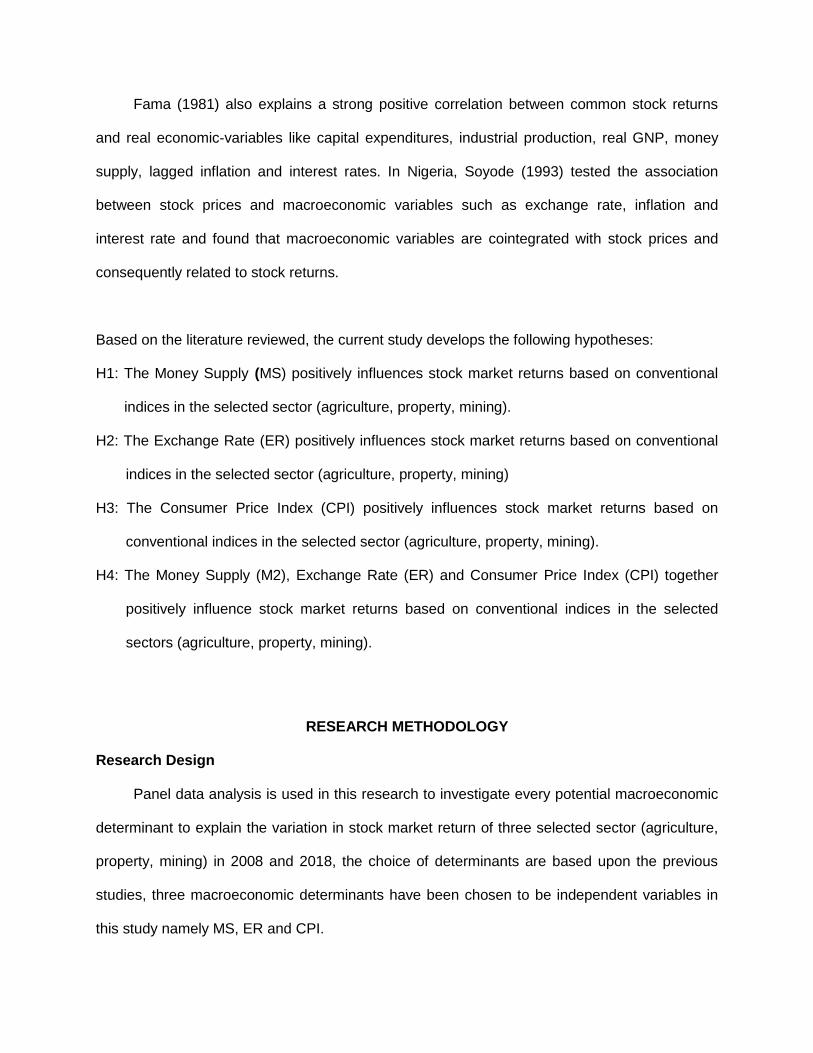
Fama (1981) also explains a strong positive correlation between common stock returns
and real economic-variables like capital expenditures, industrial production, real GNP, money
supply, lagged inflation and interest rates. In Nigeria, Soyode (1993) tested the association
between stock prices and macroeconomic variables such as exchange rate, inflation and
interest rate and found that macroeconomic variables are cointegrated with stock prices and
consequently related to stock returns.
Based on the literature reviewed, the current study develops the following hypotheses:
H1: The Money Supply (MS) positively influences stock market returns based on conventional
indices in the selected sector (agriculture, property, mining).
H2: The Exchange Rate (ER) positively influences stock market returns based on conventional
indices in the selected sector (agriculture, property, mining)
H3: The Consumer Price Index (CPI) positively influences stock market returns based on
conventional indices in the selected sector (agriculture, property, mining).
H4: The Money Supply (M2), Exchange Rate (ER) and Consumer Price Index (CPI) together
positively influence stock market returns based on conventional indices in the selected
sectors (agriculture, property, mining).
RESEARCH METHODOLOGY
Research Design
Panel data analysis is used in this research to investigate every potential macroeconomic
determinant to explain the variation in stock market return of three selected sector (agriculture,
property, mining) in 2008 and 2018, the choice of determinants are based upon the previous
studies, three macroeconomic determinants have been chosen to be independent variables in
this study namely MS, ER and CPI.
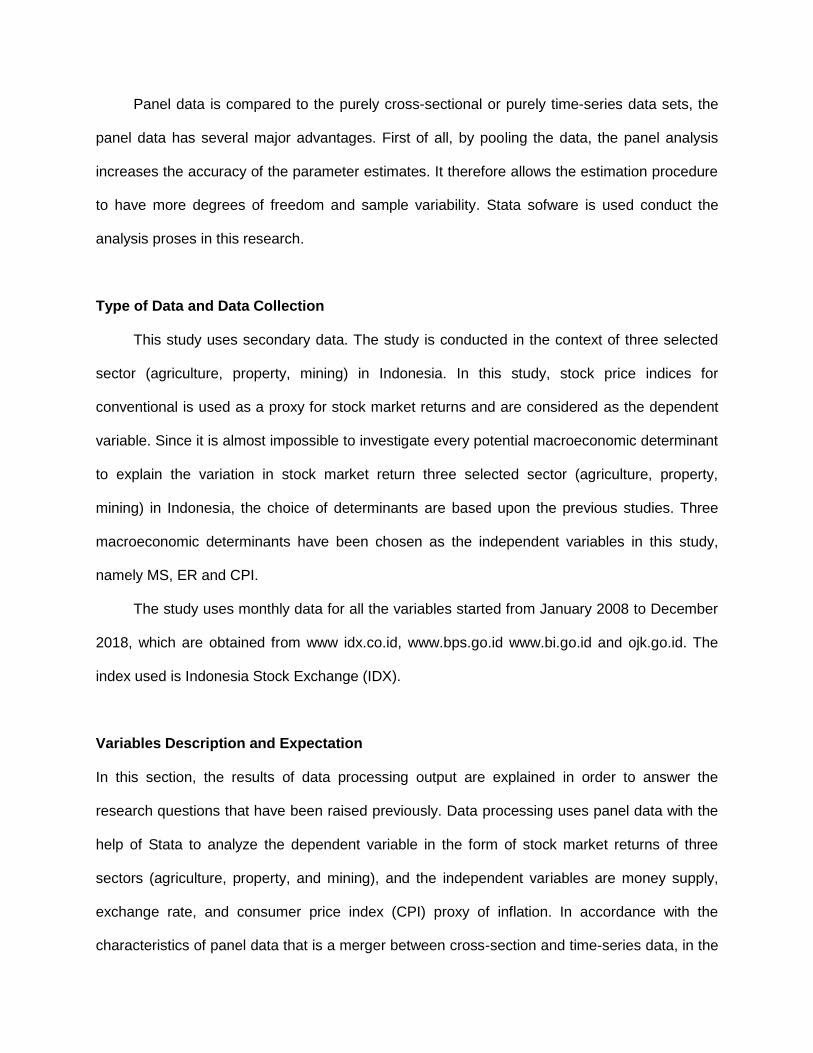
Panel data is compared to the purely cross-sectional or purely time-series data sets, the
panel data has several major advantages. First of all, by pooling the data, the panel analysis
increases the accuracy of the parameter estimates. It therefore allows the estimation procedure
to have more degrees of freedom and sample variability. Stata sofware is used conduct the
analysis proses in this research.
Type of Data and Data Collection
This study uses secondary data. The study is conducted in the context of three selected
sector (agriculture, property, mining) in Indonesia. In this study, stock price indices for
conventional is used as a proxy for stock market returns and are considered as the dependent
variable. Since it is almost impossible to investigate every potential macroeconomic determinant
to explain the variation in stock market return three selected sector (agriculture, property,
mining) in Indonesia, the choice of determinants are based upon the previous studies. Three
macroeconomic determinants have been chosen as the independent variables in this study,
namely MS, ER and CPI.
The study uses monthly data for all the variables started from January 2008 to December
2018, which are obtained from www idx.co.id, www.bps.go.id www.bi.go.id and ojk.go.id. The
index used is Indonesia Stock Exchange (IDX).
Variables Description and Expectation
In this section, the results of data processing output are explained in order to answer the
research questions that have been raised previously. Data processing uses panel data with the
help of Stata to analyze the dependent variable in the form of stock market returns of three
sectors (agriculture, property, and mining), and the independent variables are money supply,
exchange rate, and consumer price index (CPI) proxy of inflation. In accordance with the
characteristics of panel data that is a merger between cross-section and time-series data, in the
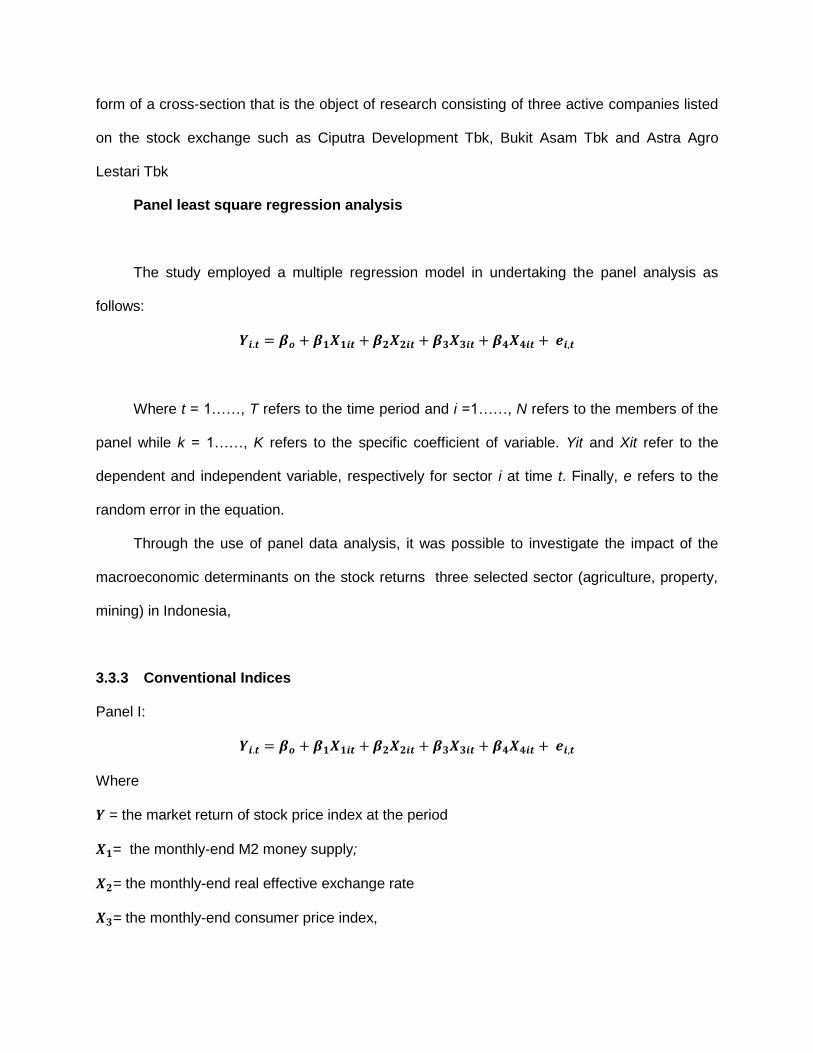
form of a cross-section that is the object of research consisting of three active companies listed
on the stock exchange such as Ciputra Development Tbk, Bukit Asam Tbk and Astra Agro
Lestari Tbk
Panel least square regression analysis
The study employed a multiple regression model in undertaking the panel analysis as
follows:
𝒀𝒊.𝒕 = 𝜷𝒐 + 𝜷𝟏𝑿𝟏𝒊𝒕 + 𝜷𝟐𝑿𝟐𝒊𝒕 + 𝜷𝟑𝑿𝟑𝒊𝒕 + 𝜷𝟒𝑿𝟒𝒊𝒕 + 𝒆𝒊,𝒕
Where t = 1……, T refers to the time period and i =1……, N refers to the members of the
panel while k = 1……, K refers to the specific coefficient of variable. Yit and Xit refer to the
dependent and independent variable, respectively for sector i at time t. Finally, e refers to the
random error in the equation.
Through the use of panel data analysis, it was possible to investigate the impact of the
macroeconomic determinants on the stock returns three selected sector (agriculture, property,
mining) in Indonesia,
3.3.3 Conventional Indices
Panel I:
𝒀𝒊.𝒕 = 𝜷𝒐 + 𝜷𝟏𝑿𝟏𝒊𝒕 + 𝜷𝟐𝑿𝟐𝒊𝒕 + 𝜷𝟑𝑿𝟑𝒊𝒕 + 𝜷𝟒𝑿𝟒𝒊𝒕 + 𝒆𝒊,𝒕
Where
𝒀 = the market return of stock price index at the period
𝑿𝟏= the monthly-end M2 money supply;
𝑿𝟐= the monthly-end real effective exchange rate
𝑿𝟑= the monthly-end consumer price index,
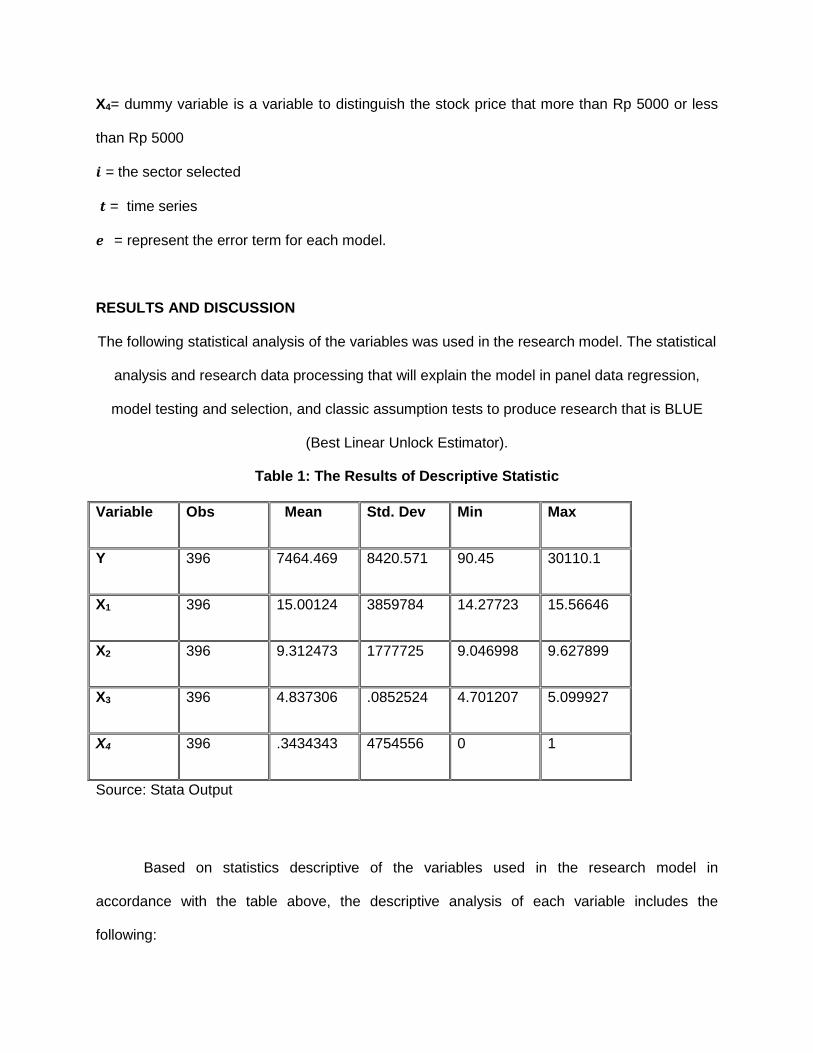
X4= dummy variable is a variable to distinguish the stock price that more than Rp 5000 or less
than Rp 5000
𝒊 = the sector selected
𝒕 = time series
𝒆 = represent the error term for each model.
RESULTS AND DISCUSSION
The following statistical analysis of the variables was used in the research model. The statistical
analysis and research data processing that will explain the model in panel data regression,
model testing and selection, and classic assumption tests to produce research that is BLUE
(Best Linear Unlock Estimator).
Table 1: The Results of Descriptive Statistic
Variable Obs Mean Std. Dev Min Max
Y 396 7464.469 8420.571 90.45 30110.1
X1 396 15.00124 3859784 14.27723 15.56646
X2 396 9.312473 1777725 9.046998 9.627899
X3 396 4.837306 .0852524 4.701207 5.099927
X4 396 .3434343 4754556 0 1
Source: Stata Output
Based on statistics descriptive of the variables used in the research model in
accordance with the table above, the descriptive analysis of each variable includes the
following:
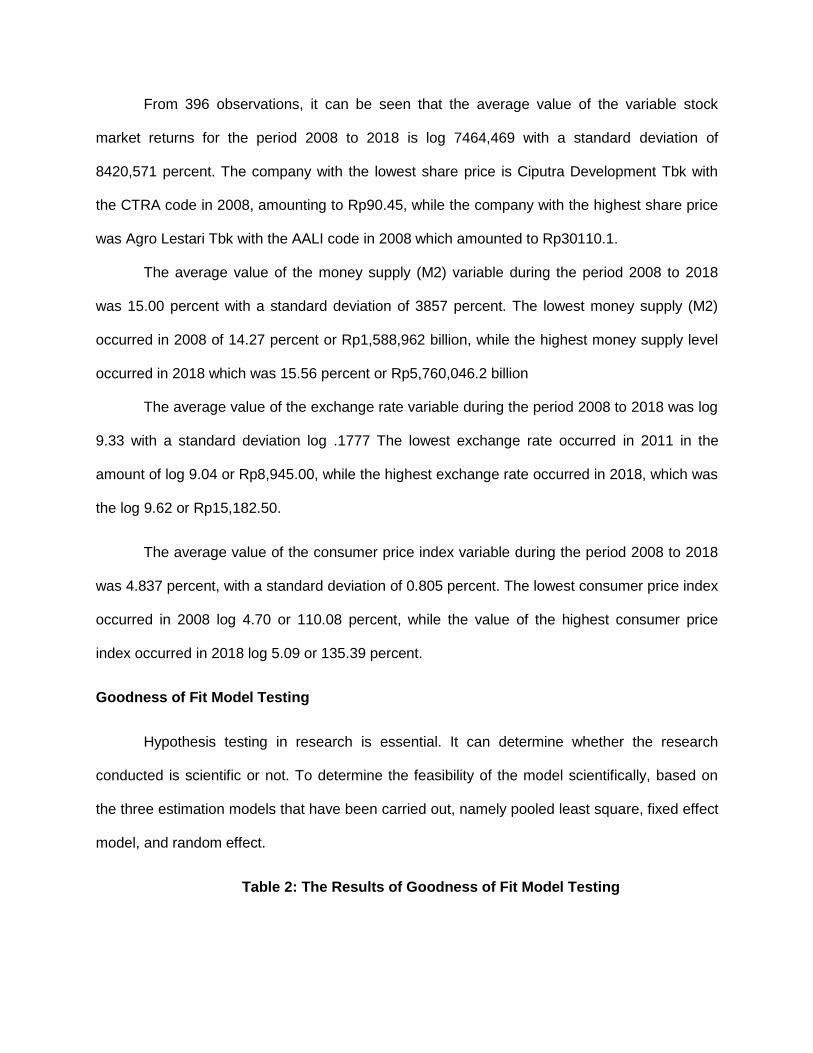
From 396 observations, it can be seen that the average value of the variable stock
market returns for the period 2008 to 2018 is log 7464,469 with a standard deviation of
8420,571 percent. The company with the lowest share price is Ciputra Development Tbk with
the CTRA code in 2008, amounting to Rp90.45, while the company with the highest share price
was Agro Lestari Tbk with the AALI code in 2008 which amounted to Rp30110.1.
The average value of the money supply (M2) variable during the period 2008 to 2018
was 15.00 percent with a standard deviation of 3857 percent. The lowest money supply (M2)
occurred in 2008 of 14.27 percent or Rp1,588,962 billion, while the highest money supply level
occurred in 2018 which was 15.56 percent or Rp5,760,046.2 billion
The average value of the exchange rate variable during the period 2008 to 2018 was log
9.33 with a standard deviation log .1777 The lowest exchange rate occurred in 2011 in the
amount of log 9.04 or Rp8,945.00, while the highest exchange rate occurred in 2018, which was
the log 9.62 or Rp15,182.50.
The average value of the consumer price index variable during the period 2008 to 2018
was 4.837 percent, with a standard deviation of 0.805 percent. The lowest consumer price index
occurred in 2008 log 4.70 or 110.08 percent, while the value of the highest consumer price
index occurred in 2018 log 5.09 or 135.39 percent.
Goodness of Fit Model Testing
Hypothesis testing in research is essential. It can determine whether the research
conducted is scientific or not. To determine the feasibility of the model scientifically, based on
the three estimation models that have been carried out, namely pooled least square, fixed effect
model, and random effect.
Table 2: The Results of Goodness of Fit Model Testing
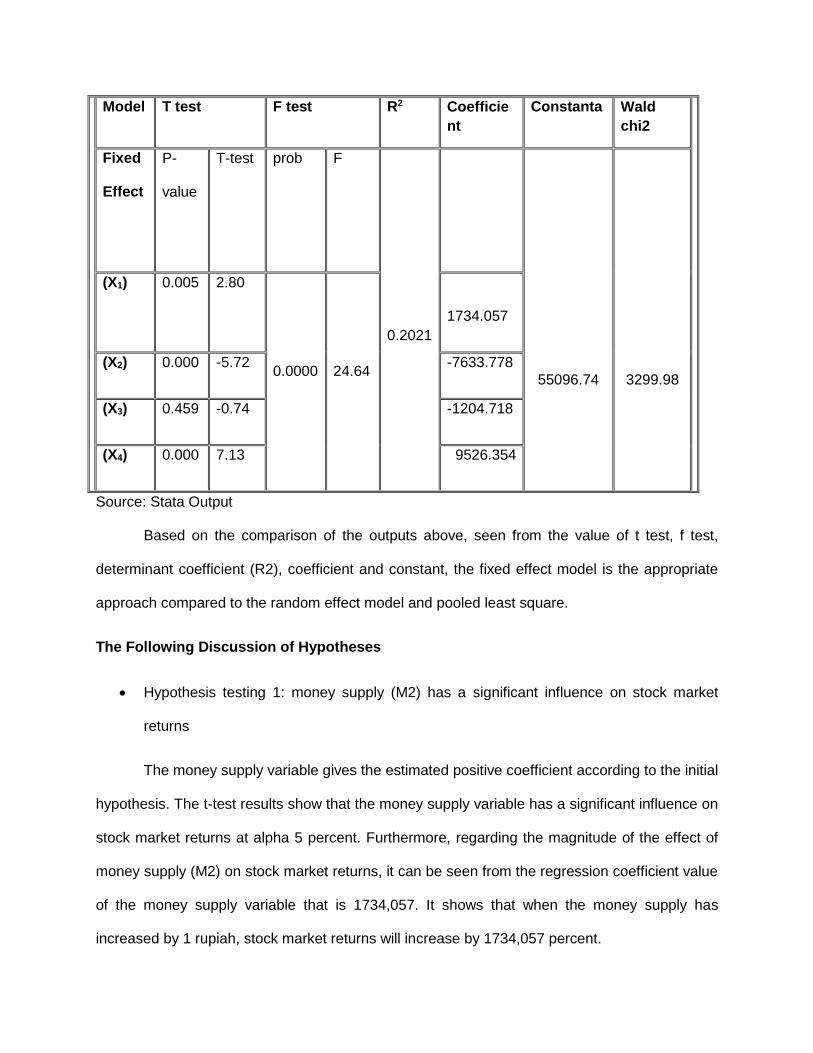
Model T test F test R2 Coefficie
nt
Constanta Wald
chi2
Fixed
Effect
P-
value
T-test prob F
0.2021
55096.74
3299.98
(X1) 0.005 2.80
0.0000
24.64
1734.057
(X2) 0.000 -5.72 -7633.778
(X3) 0.459 -0.74 -1204.718
(X4) 0.000 7.13 9526.354
Source: Stata Output
Based on the comparison of the outputs above, seen from the value of t test, f test,
determinant coefficient (R2), coefficient and constant, the fixed effect model is the appropriate
approach compared to the random effect model and pooled least square.
The Following Discussion of Hypotheses
Hypothesis testing 1: money supply (M2) has a significant influence on stock market
returns
The money supply variable gives the estimated positive coefficient according to the initial
hypothesis. The t-test results show that the money supply variable has a significant influence on
stock market returns at alpha 5 percent. Furthermore, regarding the magnitude of the effect of
money supply (M2) on stock market returns, it can be seen from the regression coefficient value
of the money supply variable that is 1734,057. It shows that when the money supply has
increased by 1 rupiah, stock market returns will increase by 1734,057 percent.
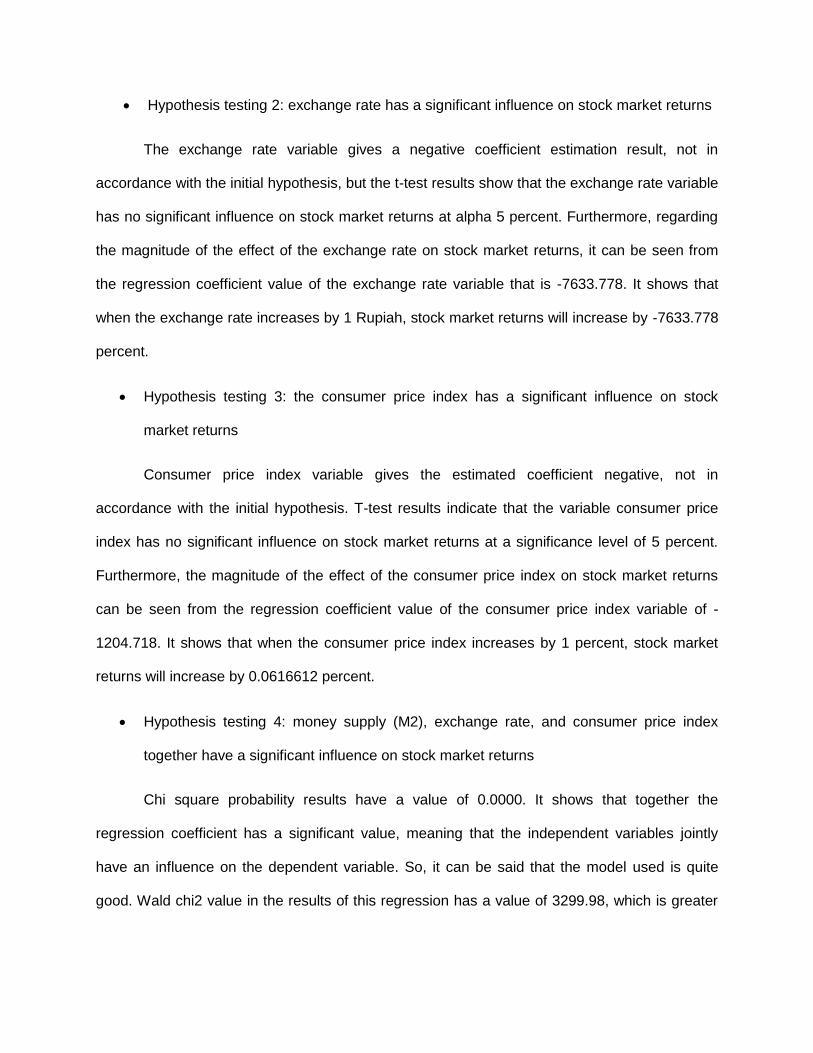
Hypothesis testing 2: exchange rate has a significant influence on stock market returns
The exchange rate variable gives a negative coefficient estimation result, not in
accordance with the initial hypothesis, but the t-test results show that the exchange rate variable
has no significant influence on stock market returns at alpha 5 percent. Furthermore, regarding
the magnitude of the effect of the exchange rate on stock market returns, it can be seen from
the regression coefficient value of the exchange rate variable that is -7633.778. It shows that
when the exchange rate increases by 1 Rupiah, stock market returns will increase by -7633.778
percent.
Hypothesis testing 3: the consumer price index has a significant influence on stock
market returns
Consumer price index variable gives the estimated coefficient negative, not in
accordance with the initial hypothesis. T-test results indicate that the variable consumer price
index has no significant influence on stock market returns at a significance level of 5 percent.
Furthermore, the magnitude of the effect of the consumer price index on stock market returns
can be seen from the regression coefficient value of the consumer price index variable of -
1204.718. It shows that when the consumer price index increases by 1 percent, stock market
returns will increase by 0.0616612 percent.
Hypothesis testing 4: money supply (M2), exchange rate, and consumer price index
together have a significant influence on stock market returns
Chi square probability results have a value of 0.0000. It shows that together the
regression coefficient has a significant value, meaning that the independent variables jointly
have an influence on the dependent variable. So, it can be said that the model used is quite
good. Wald chi2 value in the results of this regression has a value of 3299.98, which is greater
than the value of Ftable 2.97. It has the same meaning that all the independent variables
together have a significant effect on the dependent variable namely stock market returns.
CONCLUSION AND IMPLICATIONS
The findings of this research seem to give the same result that the conventional index is
influenced by macroeconomic variables with a similar pattern. However, as expected, variable
macroeconomics had an even bigger effect. As illustrated in Table 2, the results show that
conventional stock indeces are more responsive to macroeconomic changes. The results also
show evidence that M2 as a proxy has a greater effect on stock market returns compared to ER
and CPI. The positive correlation between the M2 rand the stock market returns can be
explained by the fact that the excess money supply will have a direct effect on capital market
returns
when the money supply is increasing, there is a tendency for increased overall economic
activity, this is because companies get more supply than before. When the money supply
increases, profit oriented operational activities will increase, and it will also increase stock
returns to the company. Macroeconomic factors are factors outside the company that affect the
increase or decrease of company performance. The effect of economic factor conditions is the
basis of securities analysis, where if economic conditions are bad, then the rate of return of
shares in circulation might reflect a comparable decline. If a country's economy grows
sustainably, with reasonable good macro variables, such as controlled inflation and an attractive
monetary situation, investors will be interested in investing their money in the stock exchange.
Conversely, if the country's economy deteriorates, the political situation is unstable, there are
many economic and monetary scandals, then investors will immediately prepare to withdraw
funds invested in these exchanges. Investors always want to maximize expected returns based
on their tolerance level to risk.
because the results will be able to bring impact on capital markets in indonesia . On at the
same time, policymakers must take timely action to minimize any vulnerability due to inequality
in terms of markets capitalization. Any strategy that doesn't make sense will dwarf the other
stocks exchanges in indonesia
Research Limitations
This research has been done as well as possible, but due to the limitations of
researchers, this study still has some weaknesses, including the following:
Many factors influence the stock market returns, but this study only uses three variables,
namely money supply, exchange rate, and consumer price index. So, the results
obtained are less able to explain variations in the stock market return variable.
This research only limits the proxy for share developments in Indonesia through sub-
sectors listed at LQ45, even though there are many other stock indices.
The research period is only ten years, so the results obtained may not be consistent with
the results of previous studies.
All significant variables should be high R2, but in this study low R2 is equal to 20.21%. It
is because there are still many other factors that influence the stock market returns,
which have not been included in the model.
Suggestion
Based on the conclusions and limitations of this study, the following suggestions can be
submitted:
The government must maintain the stability of the Indonesian currency exchange rate by
reducing the trade balance deficit. The government must reduce oil and gas imports and
increase oil production capacity at domestic refineries and increase the production of
Crude Palm Oil (CPO) to support the energy mix target renewable by 23% in 2025. The
government must gradually increase the content of palm oil in biodiesel or biodiesel from
10% (B10) to 20% (B20) in accordance with Decree of the Director General of Oil and
Gas No. 28 in 2016. Also, pushes up to B100 or 100 percent fuel from biodiesel. In the
non-oil and gas sector, the government must open of investment in the Minera sector
because Indonesia is a country with abundant natural resources, especially mineral
mining which has been one of the largest mineral production in the world. The mineral
and coal sub-sector are still a significant contributor to state revenues. As of June 2018,
Rp20.1 trillion flowed into the state treasury which came from royalties, mining product
sales, and fixed mineral contributions. Knowing the wealth of our mineral and coal
resources has become an important task of the Government, so that development
planning and policy development involving the mineral and coal sector can take place
better. Moreover, the government must expand access and reach non-traditional export
markets. With ongoing down streaming and connectivity through market identification,
trade attaches are left to promote.
When Indonesian exports increase and imports decrease, it will directly influence
the decrease Current Account Deficit (CAD) and finally will strengthen the Indonesian
currency Exchange rate.
The government and Indonesia central bank must coordinate fiscal and monetary
policies to maintain economic conditions. Good supervision and banking arrangements
are needed so that macroeconomic stability and economic development can be
maintained. Because further coordination is needed for institutions such as the Financial
Services Authority (OJK) so that coordination can be better maintained, and also
maintain inflation stability and cash on hand.
Investors should understand the stability of fiscal and monetary policies in a country
before investing. The most important thing is political stability because it can directly
affect the movement of the composite stock price index on the IDX so that it can be used
as part of the consideration to predict stock market returns, and then it can make
investment decisions.
Investors should use fundamental analysis and technical analysis to calculate stock
market returns and trading volume before making an investment decision. This
information has been shown to influence the movement of the composite stock price
index on the IDX both simultaneously and partially.
As an alternative financing institution, the government must encourage the capital
market by providing incentives for businesses to become listed companies in the capital
market, and the government must make policies to increase Gross Domestic Product
(GDP). In the end, it will influence the sectoral stock price index.
We recommend that investors also use other information that can be used as a
reference in making investment decisions because there are many other factors that
influence the movement of stock price indexes besides the three variables used in this
study.
The government must be wise in controlling macroeconomic conditions so that the
economy remains stable and healthy so that it can increase the passion for investment
in the country.
This study only uses three variables as factors that influence the stock market returns,
while the factors that influence stock market returns are certainly more than those used
in this study. Therefore, for further research it is expected to use a combination with
other independent variables.
This study uses a long-term estimate. Short-term estimation or dynamic estimation is
suggested to be done for the future research.
REFFERENCES
Abugri, B. A. (2008). Empirical relationship between macroeconomic volatility and stock returns : Evidence from Latin American markets. International Review of Financial Analysis, 17, 396–410. https://doi.org/10.1016/j.irfa.2006.09.002
ALAM, Z., & RASHID, K. (2015). Time Series Analysis of the Relationship between Macroeconomic Factors and the Stock Market Returns in Pakistan. Journal of Yaşar University, 9(36), 10. https://doi.org/10.19168/jyu.55431
Anam Gul, A. G. (2013). An application of Arbitrage Pricing Theory on KSE-100 Index; A study from Pakistan (2000-2005). IOSR Journal of Business and Management, 7(6), 78–84. https://doi.org/10.9790/487x-0767884
Bailey, R. E. (2005). The Economics of Financial Markets (5th ed.). New York: Cambridge University Press. In Cambridge University Press.
Barakat, M. R., Elgazzar, S. H., & Hanafy, K. M. (2016). Impact of Macroeconomic Variables on Stock Markets : Evidence from Emerging Markets. International Journal of Economics and Finance, 8(1), 195–207. https://doi.org/10.5539/ijef.v8n1p195
Bartholdy, J., & Peare, P. (2005). Estimation of expected return: CAPM vs. Fama and French. International Review of Financial Analysis, 14(4), 407–427. https://doi.org/10.1016/j.irfa.2004.10.009
Bilson, C. M., Brailsford, T. J., & Hooper, V. J. (2001). Selecting macroeconomic variables as explanatory factors of emerging stock market returns. Pacific Basin Finance Journal, 9(4), 401–426. https://doi.org/10.1016/S0927-538X(01)00020-8
Chen, N.-F., Roll, R., & Ross, S. A. (1986). Economic forces and the stock market revisited. Journal of Business, 13(2), 383–403. https://doi.org/10.1016/j.jempfin.2005.09.001
Fama, eugene f., & French, kenneth r. (1995). Size and Book-to-Market Factors in Earnings and Returns. JOURNAL OF FINANCE *, (1), 1–25.
Fama, B. E. F. (1981). Stock Returns , Real Activity , Inflation , and Money. The American Economic Review, Vol., 71(4), 545–565.
Fama, E. F., & French, K. R. (2004). The Capital Asset Pricing Model: Theory and evidence. Journal of Economic Perspectives, 18(3), 25–46. https://doi.org/10.1257/0895330042162430
Ferson, W. E., & Harvey, C. R. (1998). Fundamental determinants of national equity market returns: A perspective on conditional asset pricing. Journal of Banking and Finance, 21(11–12), 1–41. https://doi.org/10.1016/S0378-4266(97)00044-7
Gan, C., Lee, M., Au Yong, H. H., & Zhang, J. (2006). Macroeconomic variables and stock market interactions: New Zealand evidence. Investment Management and Financial Innovations, 3(4), 89–101.
Geetha, C., Chong, V., Mohidin, R., & Chandran, V. V. (2011). The Relationship Between Inflation And Stock Market : Evidence From Malaysia , United States And China. International Journal of Economics and Management Sciences, 1(2), 1–16.
Grauer, R. R., & Janmaat, J. A. (2010). Cross-sectional tests of the CAPM and Fama-French three-factor model. Journal of Banking and Finance, 34(2), 457–470.
https://doi.org/10.1016/j.jbankfin.2009.08.011
Gruodis, D., & Kahraman, B. (2015). The Fama-French Five-Factor Asset Pricing Model for the Swedish Stock Market.
Khan, H., Wong, W.-K., & Du, J. (2005). Money, interest rate and stock prices: New evidence from Singapore and United States. Department of Economics, National University of Singapore, (0601), 2–30. Retrieved from http://nt2.fas.nus.edu.sg/ecs/pub/wp/wp0601.pdf%0AMONEY,
Khodaparasti, R. B. (2014). THE ROLE OF MACROECONOMIC VARIABLES IN THE STOCK MARKET IN IRAN. PolishJournal of Management Studies, 10, 54–64.
Kilsgård, D., & Wittorf, F. (2010). The Fama and French Three-Factor Model - Evidence from the Swedish Stock Market.
Lintner, J. (1969). The Valuation of Risk Assets and the Selection of Risky Investments in Stock Portfolios and Capital Budgets: A Reply. The Review of Economics and Statistics, 51(2), 222. https://doi.org/10.2307/1926735
Markowitz, H. M. (1959). Portfolio selection: efficient diversification of investments. Global Journal of Business Research, 7(1), 77--91.
Masuduzzaman, M. (2012). Impact of the Macroeconomic Variables on the Stock Market Returns: The Case of Germany and the United Kingdom. Global Journal of Management and Business Research, 12(16), 1–13.
Miseman, M. R., Ismail, F., Ahmad, W., Akit, F. M., Mohamad, R., & Mahmood, W. M. W. (2013). The Impact of Macroeconomic Forces on the ASEAN Stock Market Movements. World Applied Sciences Journal 23, 23, 61–66. https://doi.org/10.5829/idosi.wasj.2013.23.eemcge.22012
Mosley, L., & Singer, D. A. (2008). Taking stock seriously: Equity-market performance, government policy, and financial globalization. International Studies Quarterly, 52(2), 405–425. https://doi.org/10.1111/j.1468-2478.2008.00507.x
Muhammad Akbar. (2012). The relationship of stock prices and macroeconomic variables revisited: Evidence from Karachi stock exchange. African Journal of Business Management, 6(4), 1315–1322. https://doi.org/10.5897/ajbm11.1043
Mukherjee, T. K., & Naka, A. (1995). Dynamic Relations Between Macroeconomic Variables and the Japanese Stock Market: an Application of a Vector Error Correction Model. Journal of Financial Research, 18(2), 223–237. https://doi.org/10.1111/j.1475-6803.1995.tb00563.x
Östermark, R. (1991). Empirical evidence on the capital asset pricing model (CAPM) in two Scandinavian stock exchanges. Omega, 19(4), 223–234. https://doi.org/10.1016/0305-0483(91)90041-Q
Ozcan, A. (2012). The relationship between macroeconomic variables and ISE industry index. International Journal of Economics and Financial Issues, 2(2), 184–189.
Ratanapakorn, O., & Sharma, S. C. (2007). Dynamic analysis between the US stock returns and the macroeconomic variables. Applied Financial Economics, 17(5), 1–10. https://doi.org/10.1080/09603100600638944
Ross, S. A. (1976). The arbitrage theory of capital asset pricing. Journal of Economic Theory,
13(3), 341–360. https://doi.org/10.1016/0022-0531(76)90046-6
Sattar, M., & -, J. (2017). CAPM Vs Fama-French Three-Factor Model: An Evaluation of Effectiveness in Explaining Excess Return in Dhaka Stock Exchange. International Journal of Business and Management, 12(5), 119. https://doi.org/10.5539/ijbm.v12n5p119
Shafana, M. (2014). Macroeconomic Variables Effect on Financial Sector Performance in Emerging Sri Lankan Stock Market. International Journal of Science and Research, 3(10), 227–231.
Sharpe, W. F. (1964). Capital Asset Prices: a Theory of Market Equilibrium Under Conditions of Risk. The Journal of Finance, 19(3), 425–442. https://doi.org/10.1111/j.1540-6261.1964.tb02865.x
Sieng, C., & Leng, G. (2005). Linkages of economic activity, stock price and monetary policy:The case of Malaysia. The Asia Pacific Journal of Economic and Business, 9(1), 1–18.
Suh, D. (2009). Stock Returns , Risk Factor Loadings , and Model Predictions : A Test of the CAPM and the Fama-French 3-factor Model College of Business and Economics Economics Department of Economics.
talla tagne josep. (2013). Impact of Macroeconomic Variables on the Stock Market Prices of the Stockholm Stock Exchange ( OMXS30 ). Jonkoping International Business School, (May), 3–48.
Wongbangpo, P., & Sharma, S. C. (2002). Stock market and macroeconomic fundamental dynamic interactions: ASEAN-5 countries. Journal of Asian Economics, 13(1), 27–51. https://doi.org/10.1016/S1049-0078(01)00111-7
Zhang, J., & Wihlborg, C. (2010). Capm in up and down markets: Evidence from six European emerging markets. Journal of Emerging Market Finance, 9(2), 229–255. https://doi.org/10.1177/097265271000900205