Total factor productivity and macroeconomic instability
27
This article was downloaded by: [Bilkent University] On: 07 September 2011, At: 22:28 Publisher: Routledge Informa Ltd Registered in England and Wales Registered Number: 1072954 Registered office: Mortimer House, 37-41 Mortimer Street, London W1T 3JH, UK The Journal of International Trade & Economic Development Publication details, including instructions for authors and subscription information: http://www.tandfonline.com/loi/rjte20 Total factor productivity and macroeconomic instability Hakan Berument a , N. Nergiz Dincer b & Zafer Mustafaoglu c a Department of Economics, Bilkent University, Ankara, Turkey b Economic Modeling Department, State Planning Organization, Ankara, Turkey c The World Bank, Washington, DC, USA Available online: 24 May 2011 To cite this article: Hakan Berument, N. Nergiz Dincer & Zafer Mustafaoglu (2011): Total factor productivity and macroeconomic instability, The Journal of International Trade & Economic Development, 20:5, 605-629 To link to this article: http://dx.doi.org/10.1080/09638190903365930 PLEASE SCROLL DOWN FOR ARTICLE Full terms and conditions of use: http://www.tandfonline.com/page/terms- and-conditions This article may be used for research, teaching and private study purposes. Any substantial or systematic reproduction, re-distribution, re-selling, loan, sub-licensing, systematic supply or distribution in any form to anyone is expressly forbidden. The publisher does not give any warranty express or implied or make any representation that the contents will be complete or accurate or up to date. The accuracy of any instructions, formulae and drug doses should be independently verified with primary sources. The publisher shall not be liable
Transcript of Total factor productivity and macroeconomic instability
This article was downloaded by: [Bilkent University]On: 07 September 2011, At: 22:28Publisher: RoutledgeInforma Ltd Registered in England and Wales Registered Number: 1072954Registered office: Mortimer House, 37-41 Mortimer Street, London W1T 3JH,UK
The Journal of InternationalTrade & Economic DevelopmentPublication details, including instructions for authorsand subscription information:http://www.tandfonline.com/loi/rjte20
Total factor productivity andmacroeconomic instabilityHakan Berument a , N. Nergiz Dincer b & ZaferMustafaoglu ca Department of Economics, Bilkent University, Ankara,Turkeyb Economic Modeling Department, State PlanningOrganization, Ankara, Turkeyc The World Bank, Washington, DC, USA
Available online: 24 May 2011
To cite this article: Hakan Berument, N. Nergiz Dincer & Zafer Mustafaoglu (2011): Totalfactor productivity and macroeconomic instability, The Journal of International Trade &Economic Development, 20:5, 605-629
To link to this article: http://dx.doi.org/10.1080/09638190903365930
PLEASE SCROLL DOWN FOR ARTICLE
Full terms and conditions of use: http://www.tandfonline.com/page/terms-and-conditions
This article may be used for research, teaching and private study purposes.Any substantial or systematic reproduction, re-distribution, re-selling, loan,sub-licensing, systematic supply or distribution in any form to anyone isexpressly forbidden.
The publisher does not give any warranty express or implied or make anyrepresentation that the contents will be complete or accurate or up todate. The accuracy of any instructions, formulae and drug doses should beindependently verified with primary sources. The publisher shall not be liable

for any loss, actions, claims, proceedings, demand or costs or damageswhatsoever or howsoever caused arising directly or indirectly in connectionwith or arising out of the use of this material.
Dow
nloa
ded
by [
Bilk
ent U
nive
rsity
] at
22:
28 0
7 Se
ptem
ber
2011
Total factor productivity and macroeconomic instability
Hakan Berumenta*, N. Nergiz Dincerb and Zafer Mustafaogluc
aDepartment of Economics, Bilkent University, Ankara, Turkey; bEconomic ModelingDepartment, State Planning Organization, Ankara, Turkey; cThe World Bank,
Washington, DC, USA
(Received 21 December 2008; final version received 24 September 2009)
Total factor productivity (TFP) is an important component of growthfor most countries. This article assesses the role of macroeconomicinstability on TFP growth. We consider volatility in inflation, opennessof an economy and financial market deepness as measures of macro-economic instability. Empirical evidence provided from Turkey suggeststhat volatility of openness and financial market deepness reduce TFPgrowth, whereas volatility of inflation increases TFP growth.
Keywords: macroeconomic instability; TFP growth; VAR-GARCHmodels
JEL Classifications: D24; E22
1. Introduction
Total factor productivity (TFP) has long been a variable of interest ineconomics growth literature. Empirical evidence suggests that it is TFP, ratherthan the accumulation of production factors, that accounts for most cross-country differences in the level and growth rate of per capita income.Abromovitz (1956) and Solow (1957) both argue that only a small fraction ofoutput growth can be attributed to factor input accumulation, but that 88–90%of growth is attributed to TFP increases.1 Finding an answer to the question ofwhat determines TFP has become the main goal of a growing body of research.
Subsequent studies have argued that it is important to account forchanges in the quality of factors of production that are otherwise attributedto TFP. There is a set of studies that suggests that TFP is affected by factorssuch as investments in education, training and human capital development,2
the openness of the economy to international trade and foreign directinvestment (FDI),3 lower inflation rate,4 financial development5 andinvestments in machinery and equipment.6 The investigation of thedeterminants of TFP is not limited to the studies mentioned above. Table 1
*Corresponding author. Email: [email protected]
The Journal of International Trade & Economic DevelopmentVol. 20, No. 5, October 2011, 605–629
ISSN 0963-8199 print/ISSN 1469-9559 online
� 2011 Taylor & Francis
DOI: 10.1080/09638190903365930
http://www.informaworld.com
Dow
nloa
ded
by [
Bilk
ent U
nive
rsity
] at
22:
28 0
7 Se
ptem
ber
2011
Table
1.
Summary
oftheliterature.
Subject
Directionofeff
ects
Studies
TFP-growth
accounting
methodology
Positive
Kendrick
(1961);Denison(1985);Jorgenson,Gollop
andFraumeni(1987);Maddison(1995);Klenow
and
Rodriguez-C
lare
(1997);Jones
(1997);Abramovitz
andDavid
(2000);Solow(1957);JeongandTownsend
(2004).
Determ
inantsofTFPgrowth
Humancapital
development
Positive
Harris(1999);AiyarandFeyrer(2002);Black
and
Lynch
(1996);Schultz(1961);Becker
(1962),Becker,
MurphyandTamura
(1990)
Conditiononopenness:forlowlevels
ofopenness,therelationbetween
humancapitaldevelopmentand
TFPgrowth
isnegative.
Itreverses
when
opennessislarger.
MillerandUpadhyay(2000)
Opennessoftheeconomy
Positive
Harris(1999);CororatonandZingapan(1999);Miller
andUpadhyay(2000);Edwards(1998);Alcala
and
Ciccone(2004).
Volatility
ofexports
Negative
MillerandUpadhyay(2000)
Exchangerate
aPositive
MillerandUpadhyay(2000)
Inflation
Negative
Harris(1999);MillerandUpadhyay(2000);Clark
(1982).
Taxes
Negative
Harris(1999)
Labormarket
flexibility
Positive
Harris(1999);Scarpetta
andTressel
(2002)
Unionization
Negative
Warren
(1985);WilliamsandMoomaw
(1989);Haskel
(2005).
(continued)
606 H. Berument et al.
Dow
nloa
ded
by [
Bilk
ent U
nive
rsity
] at
22:
28 0
7 Se
ptem
ber
2011

Table
1.
(Continued).
Subject
Directionofeff
ects
Studies
Researchanddevelopment
Positiveornegative,
dependingon
market
structure
andtechnology
regim
es.
CororatonandZingapan(1999);MillerandUpadhyay
(2000);SinghandTrieu
(1996);Scarpetta
andTressel
(2002)
Institutionalsettings
Oneofthefactors
explainingTFP
growth
differencesisinstitutional
differences.
Scarpetta
andTressel
(2002)
Foreigndirectinvestm
ent
Positive
CororatonandZingapan(1999);Ferrett
(2004);De
Mello
(1999);Sadik
andBolbol(2001);Liu
andWang
(2003);Aitken
andHarrison(2004).
Financialdeepening
Positive
KuglerandNeusser
(1998);Tadesse
(2005);Jeongand
Townsend(2004);Beck,LevineandLoayza
(2000).
Innovation
Positive
Harris(1999).
Note:aExchangerate
isthedomesticcurrency
valueofforeigncurrency.Thus,anincrease
inexchangerate
equalsdepreciation.
The Journal of International Trade & Economic Development 607
Dow
nloa
ded
by [
Bilk
ent U
nive
rsity
] at
22:
28 0
7 Se
ptem
ber
2011
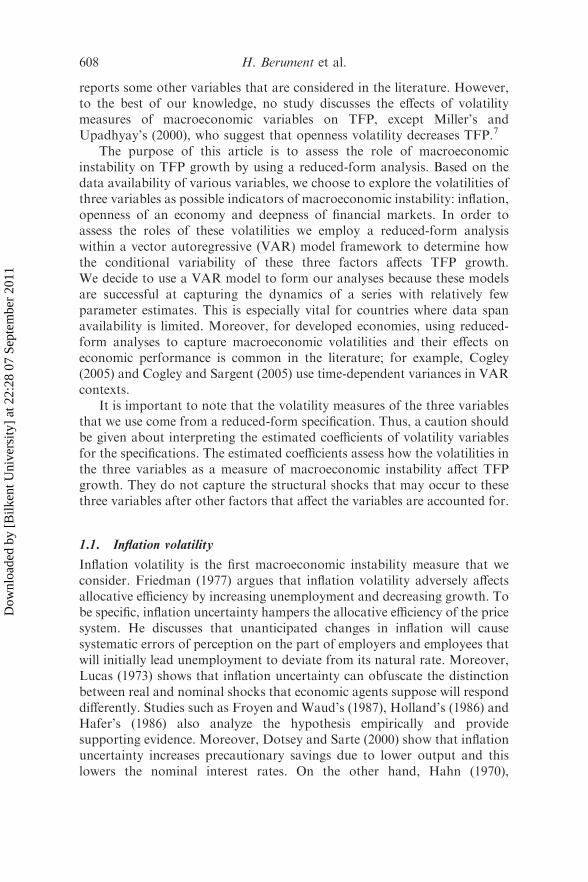
reports some other variables that are considered in the literature. However,to the best of our knowledge, no study discusses the effects of volatilitymeasures of macroeconomic variables on TFP, except Miller’s andUpadhyay’s (2000), who suggest that openness volatility decreases TFP.7
The purpose of this article is to assess the role of macroeconomicinstability on TFP growth by using a reduced-form analysis. Based on thedata availability of various variables, we choose to explore the volatilities ofthree variables as possible indicators of macroeconomic instability: inflation,openness of an economy and deepness of financial markets. In order toassess the roles of these volatilities we employ a reduced-form analysiswithin a vector autoregressive (VAR) model framework to determine howthe conditional variability of these three factors affects TFP growth.We decide to use a VAR model to form our analyses because these modelsare successful at capturing the dynamics of a series with relatively fewparameter estimates. This is especially vital for countries where data spanavailability is limited. Moreover, for developed economies, using reduced-form analyses to capture macroeconomic volatilities and their effects oneconomic performance is common in the literature; for example, Cogley(2005) and Cogley and Sargent (2005) use time-dependent variances in VARcontexts.
It is important to note that the volatility measures of the three variablesthat we use come from a reduced-form specification. Thus, a caution shouldbe given about interpreting the estimated coefficients of volatility variablesfor the specifications. The estimated coefficients assess how the volatilities inthe three variables as a measure of macroeconomic instability affect TFPgrowth. They do not capture the structural shocks that may occur to thesethree variables after other factors that affect the variables are accounted for.
1.1. Inflation volatility
Inflation volatility is the first macroeconomic instability measure that weconsider. Friedman (1977) argues that inflation volatility adversely affectsallocative efficiency by increasing unemployment and decreasing growth. Tobe specific, inflation uncertainty hampers the allocative efficiency of the pricesystem. He discusses that unanticipated changes in inflation will causesystematic errors of perception on the part of employers and employees thatwill initially lead unemployment to deviate from its natural rate. Moreover,Lucas (1973) shows that inflation uncertainty can obfuscate the distinctionbetween real and nominal shocks that economic agents suppose will responddifferently. Studies such as Froyen and Waud’s (1987), Holland’s (1986) andHafer’s (1986) also analyze the hypothesis empirically and providesupporting evidence. Moreover, Dotsey and Sarte (2000) show that inflationuncertainty increases precautionary savings due to lower output and thislowers the nominal interest rates. On the other hand, Hahn (1970),
608 H. Berument et al.
Dow
nloa
ded
by [
Bilk
ent U
nive
rsity
] at
22:
28 0
7 Se
ptem
ber
2011
Juster and Wachtel (1972a, 1972b), Juster and Taylor (1975) and Cukiermanand Meltzer (1986) argue that inflation variability increases savings andcreates the incentive to loosen monetary policy and thus decrease interestrates, which stimulates investment. If new investment is likely to increasecapital stock that uses more advanced technologies, TFP will then increase.
1.2. Openness volatility
We use openness volatility, which captures the instability of a country’svolume of transactions with the rest of the world, as a secondmacroeconomic instability measure. To be specific, openness volatilitycaptures the ability of the economy to provide imported raw materials forthe production process as well as machines and equipment for investmentpurposes and spare equipment for existing capital stock. Higher opennessvariability may discourage firms from adopting more efficient foreigntechnologies due to the difficulties they might experience in the futureregarding spare parts or input requirements; instead, they adopt lower,domestically available technologies; this decreases TFP. Rodrick (1998) setsa macroeconomic model where an increase in the riskiness of exports callsfor a reallocation of the economy’s resources toward the safe activity, evenwhen the return to safer activities lies below the (mean) return of otheractivities. This ultimately decreases TFP growth. Montalbano et al. (2005)provide empirical evidence that trade vulnerability in 1990s adverselyaffected the well-being of Eastern European countries.
1.3. Financial market deepness volatility
Lastly, volatility of the deepness of financial markets measures instability inthe financial sector. The perception of higher vulnerability affects thebehavior of financial intermediaries as well as firms that may claim credit.To be specific, higher vulnerability in the financial system discouragesfinancial intermediaries from giving long-term loans despite that doing somight enhance TFP; they tend to concentrate on giving short-term loans.Firms also are less willing to receive credit from financial intermediaries,which decreases new investments. Moreover, in times of higher vulnerability(or the perception of it), companies tend to use internal resources to financetheir investments. Lower external financing may also suggest that withoutfinancial intermediaries, investments are allocated less efficiently. Hence,productivity enhancement is lower at a given level of investment.
Angeletos (2006) argues that incomplete markets, which are associatedwith a lack of financial intermediation, reduces TFP by shifting resourcesfrom more risky but also more productive projects. However, Evers,Niemann and Schiffbauer (2008) argue that financial intermediationincreases the qualitative composition of investment rather than the amount
The Journal of International Trade & Economic Development 609
Dow
nloa
ded
by [
Bilk
ent U
nive
rsity
] at
22:
28 0
7 Se
ptem
ber
2011
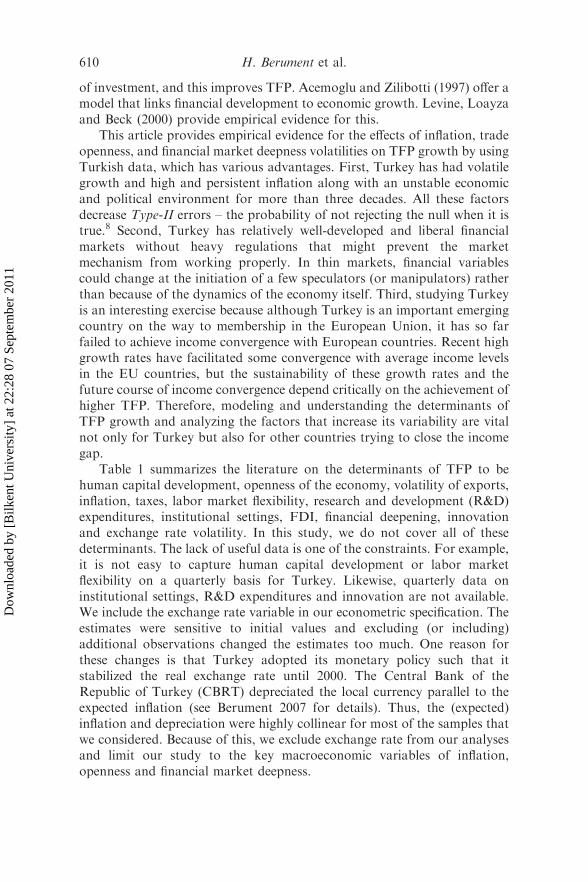
of investment, and this improves TFP. Acemoglu and Zilibotti (1997) offer amodel that links financial development to economic growth. Levine, Loayzaand Beck (2000) provide empirical evidence for this.
This article provides empirical evidence for the effects of inflation, tradeopenness, and financial market deepness volatilities on TFP growth by usingTurkish data, which has various advantages. First, Turkey has had volatilegrowth and high and persistent inflation along with an unstable economicand political environment for more than three decades. All these factorsdecrease Type-II errors – the probability of not rejecting the null when it istrue.8 Second, Turkey has relatively well-developed and liberal financialmarkets without heavy regulations that might prevent the marketmechanism from working properly. In thin markets, financial variablescould change at the initiation of a few speculators (or manipulators) ratherthan because of the dynamics of the economy itself. Third, studying Turkeyis an interesting exercise because although Turkey is an important emergingcountry on the way to membership in the European Union, it has so farfailed to achieve income convergence with European countries. Recent highgrowth rates have facilitated some convergence with average income levelsin the EU countries, but the sustainability of these growth rates and thefuture course of income convergence depend critically on the achievement ofhigher TFP. Therefore, modeling and understanding the determinants ofTFP growth and analyzing the factors that increase its variability are vitalnot only for Turkey but also for other countries trying to close the incomegap.
Table 1 summarizes the literature on the determinants of TFP to behuman capital development, openness of the economy, volatility of exports,inflation, taxes, labor market flexibility, research and development (R&D)expenditures, institutional settings, FDI, financial deepening, innovationand exchange rate volatility. In this study, we do not cover all of thesedeterminants. The lack of useful data is one of the constraints. For example,it is not easy to capture human capital development or labor marketflexibility on a quarterly basis for Turkey. Likewise, quarterly data oninstitutional settings, R&D expenditures and innovation are not available.We include the exchange rate variable in our econometric specification. Theestimates were sensitive to initial values and excluding (or including)additional observations changed the estimates too much. One reason forthese changes is that Turkey adopted its monetary policy such that itstabilized the real exchange rate until 2000. The Central Bank of theRepublic of Turkey (CBRT) depreciated the local currency parallel to theexpected inflation (see Berument 2007 for details). Thus, the (expected)inflation and depreciation were highly collinear for most of the samples thatwe considered. Because of this, we exclude exchange rate from our analysesand limit our study to the key macroeconomic variables of inflation,openness and financial market deepness.
610 H. Berument et al.
Dow
nloa
ded
by [
Bilk
ent U
nive
rsity
] at
22:
28 0
7 Se
ptem
ber
2011
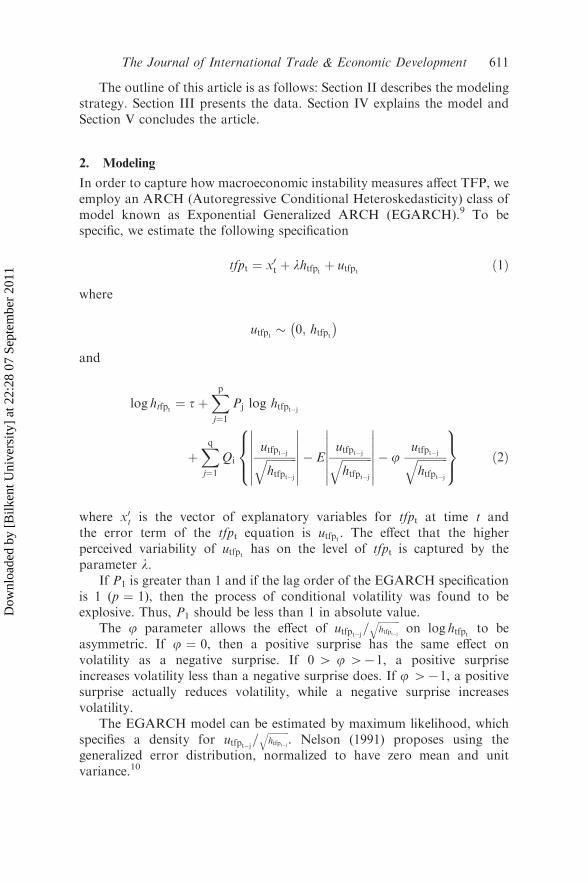
The outline of this article is as follows: Section II describes the modelingstrategy. Section III presents the data. Section IV explains the model andSection V concludes the article.
2. Modeling
In order to capture how macroeconomic instability measures affect TFP, weemploy an ARCH (Autoregressive Conditional Heteroskedasticity) class ofmodel known as Exponential Generalized ARCH (EGARCH).9 To bespecific, we estimate the following specification
tfpt ¼ x0t þ lhtfpt þ utfpt ð1Þ
where
utfpt � 0; htfpt� �
and
log htfpt ¼ tþXpj¼1
Pj log htfpt�j
þXqj¼1
Qi
utfpt�jffiffiffiffiffiffiffiffiffiffiffihtfpt�j
q�������
�������� E
utfpt�jffiffiffiffiffiffiffiffiffiffiffihtfpt�j
q�������
�������� j
utfpt�jffiffiffiffiffiffiffiffiffiffiffihtfpt�j
q8><>:
9>=>;
ð2Þ
where x0t is the vector of explanatory variables for tfpt at time t andthe error term of the tfpt equation is utfpt . The effect that the higherperceived variability of utfpt has on the level of tfpt is captured by theparameter l.
If P1 is greater than 1 and if the lag order of the EGARCH specificationis 1 (p ¼ 1), then the process of conditional volatility was found to beexplosive. Thus, P1 should be less than 1 in absolute value.
The j parameter allows the effect of utfpt�j=ffiffiffiffiffiffiffiffiffiffiffihtfpt�j
qon log htfpt to be
asymmetric. If j ¼ 0, then a positive surprise has the same effect onvolatility as a negative surprise. If 0 4 j 471, a positive surpriseincreases volatility less than a negative surprise does. If j 471, a positivesurprise actually reduces volatility, while a negative surprise increasesvolatility.
The EGARCH model can be estimated by maximum likelihood, whichspecifies a density for utfpt�j=
ffiffiffiffiffiffiffiffiffiffiffihtfpt�j
q. Nelson (1991) proposes using the
generalized error distribution, normalized to have zero mean and unitvariance.10
The Journal of International Trade & Economic Development 611
Dow
nloa
ded
by [
Bilk
ent U
nive
rsity
] at
22:
28 0
7 Se
ptem
ber
2011
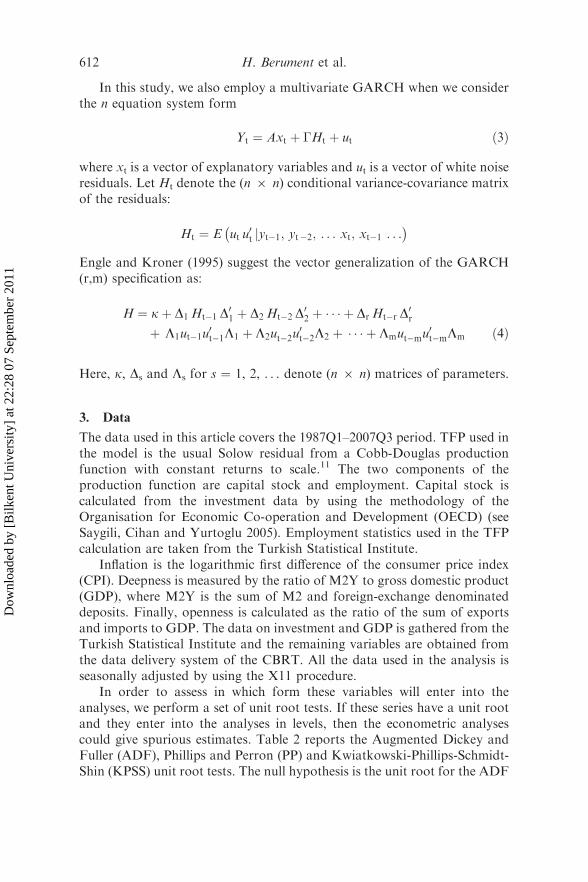
In this study, we also employ a multivariate GARCH when we considerthe n equation system form
Yt ¼ Axt þ �Ht þ ut ð3Þ
where xt is a vector of explanatory variables and ut is a vector of white noiseresiduals. Let Ht denote the (n 6 n) conditional variance-covariance matrixof the residuals:
Ht ¼ E ut u0t jyt�1; yt�2; . . . xt; xt�1 . . .
� �
Engle and Kroner (1995) suggest the vector generalization of the GARCH(r,m) specification as:
H ¼ kþ D1 Ht�1 D01 þ D2 Ht�2 D
02 þ � � � þ Dr Ht�r D
0r
þ L1ut�1u0t�1L1 þ L2ut�2u
0t�2L2 þ � � � þ Lmut�mu
0t�mLm ð4Þ
Here, k, Ds and Ls for s ¼ 1, 2, . . . denote (n 6 n) matrices of parameters.
3. Data
The data used in this article covers the 1987Q1–2007Q3 period. TFP used inthe model is the usual Solow residual from a Cobb-Douglas productionfunction with constant returns to scale.11 The two components of theproduction function are capital stock and employment. Capital stock iscalculated from the investment data by using the methodology of theOrganisation for Economic Co-operation and Development (OECD) (seeSaygili, Cihan and Yurtoglu 2005). Employment statistics used in the TFPcalculation are taken from the Turkish Statistical Institute.
Inflation is the logarithmic first difference of the consumer price index(CPI). Deepness is measured by the ratio of M2Y to gross domestic product(GDP), where M2Y is the sum of M2 and foreign-exchange denominateddeposits. Finally, openness is calculated as the ratio of the sum of exportsand imports to GDP. The data on investment and GDP is gathered from theTurkish Statistical Institute and the remaining variables are obtained fromthe data delivery system of the CBRT. All the data used in the analysis isseasonally adjusted by using the X11 procedure.
In order to assess in which form these variables will enter into theanalyses, we perform a set of unit root tests. If these series have a unit rootand they enter into the analyses in levels, then the econometric analysescould give spurious estimates. Table 2 reports the Augmented Dickey andFuller (ADF), Phillips and Perron (PP) and Kwiatkowski-Phillips-Schmidt-Shin (KPSS) unit root tests. The null hypothesis is the unit root for the ADF
612 H. Berument et al.
Dow
nloa
ded
by [
Bilk
ent U
nive
rsity
] at
22:
28 0
7 Se
ptem
ber
2011
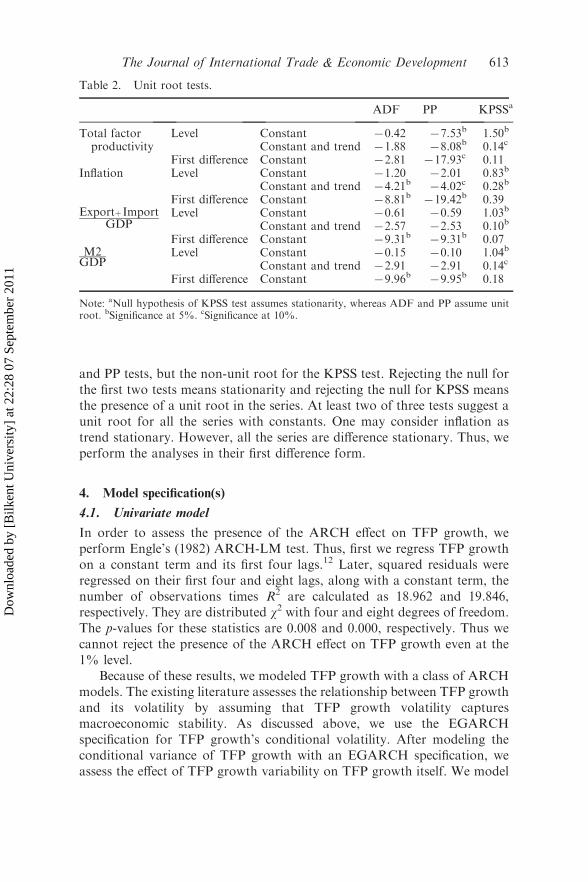
and PP tests, but the non-unit root for the KPSS test. Rejecting the null forthe first two tests means stationarity and rejecting the null for KPSS meansthe presence of a unit root in the series. At least two of three tests suggest aunit root for all the series with constants. One may consider inflation astrend stationary. However, all the series are difference stationary. Thus, weperform the analyses in their first difference form.
4. Model specification(s)
4.1. Univariate model
In order to assess the presence of the ARCH effect on TFP growth, weperform Engle’s (1982) ARCH-LM test. Thus, first we regress TFP growthon a constant term and its first four lags.12 Later, squared residuals wereregressed on their first four and eight lags, along with a constant term, thenumber of observations times R2 are calculated as 18.962 and 19.846,respectively. They are distributed w2 with four and eight degrees of freedom.The p-values for these statistics are 0.008 and 0.000, respectively. Thus wecannot reject the presence of the ARCH effect on TFP growth even at the1% level.
Because of these results, we modeled TFP growth with a class of ARCHmodels. The existing literature assesses the relationship between TFP growthand its volatility by assuming that TFP growth volatility capturesmacroeconomic stability. As discussed above, we use the EGARCHspecification for TFP growth’s conditional volatility. After modeling theconditional variance of TFP growth with an EGARCH specification, weassess the effect of TFP growth variability on TFP growth itself. We model
Table 2. Unit root tests.
ADF PP KPSSa
Total factorproductivity
Level Constant 70.42 77.53b 1.50b
Constant and trend 71.88 78.08b 0.14c
First difference Constant 72.81 717.93c 0.11Inflation Level Constant 71.20 72.01 0.83b
Constant and trend 74.21b 74.02c 0.28b
First difference Constant 78.81b 719.42b 0.39Exportþ Import
GDPLevel Constant 70.61 70.59 1.03b
Constant and trend 72.57 72.53 0.10b
First difference Constant 79.31b 79.31b 0.07M2GDP
Level Constant 70.15 70.10 1.04b
Constant and trend 72.91 72.91 0.14c
First difference Constant 79.96b 79.95b 0.18
Note: aNull hypothesis of KPSS test assumes stationarity, whereas ADF and PP assume unitroot. bSignificance at 5%. cSignificance at 10%.
The Journal of International Trade & Economic Development 613
Dow
nloa
ded
by [
Bilk
ent U
nive
rsity
] at
22:
28 0
7 Se
ptem
ber
2011

the TFP growth equation with a constant term, four lag values of thedependent variable and the conditional variance of TFP growth. Theestimates are reported in Table 3.
Panel A of Table 3 reports the estimates of the mean equation (equation(1)). The table suggests that the estimated coefficient for the conditionalvariance of TFP growth for TFP growth is negative but not statistically
Table 3. EGARCH in mean specification for the TFP growth.a
CoefficientsDependent variable tfpt
Panel A: mean equationExplanatory variables Constant 1.8072
(0.00)tfpt71 70.0449
(0.72)tfpt72 0.0177
(0.82)tfpt73 70.1407
(0.08)tfpt74 70.2681
(0.01)
htfpt 70.2196
(0.08)Panel B: conditional varianceExplanatory variables ofconditional variance
Constant 1.2035(0.00)
Log htfpt�170.1515(0.43)
jVtfpt�1j � EjVtfp
t�1j � fVtfpt�1
0.9326
(0.01)‘’’j 70.1077
(0.59)
Panel C: specification tests: p-valuesThe sign bias test (0.76)Ljung-Box Q-Stat. [4] (0.61)Ljung-Box Q-Stat. [8] (0.88)ARCH-LM [4] (0.90)ARCH-LM [8] (0.78)
Note: ap-values are reported under estimated coefficients in parentheses for the correspondingvariables. The lag orders for the specifications are reported in brackets next to the specificationtests.
Note: tfpt denotes total factor productivity growth, inft denotes inflation, opennesst denotes the
ratio of sum of export and imports to GDP, and deept is for M2Y to GDP ratio. Vtfpt�1 denotes
for utfpt�1=
ffiffiffiffiffiffiffiffiffihtfpt�1
q.
Sample includes quarterly observations from 1987Q1 to 2007Q3 for a total of 83observations.
614 H. Berument et al.
Dow
nloa
ded
by [
Bilk
ent U
nive
rsity
] at
22:
28 0
7 Se
ptem
ber
2011

significant.13 We could not find statistically significant evidence that TFPgrowth variability adversely affects TFP growth itself.14 Second, in Panel Bof Table 3, we observe a negative leverage effect, j, and the effect is less than1 in absolute value. This suggests that a negative shock to TFP growthincreases its variability more than a positive shock, reflecting the asymmetryof the effects of positive and negative shocks on TFP growth’s conditionalvolatility. Moreover, the estimated coefficient for the lag value of thelogarithm of the conditional variance is less than 1. This satisfies the non-explosiveness of the conditional variance requirement.
Panel C of Table 3 reports the p-values of the specification tests. Weconsider a non-parametric sign-biased test, Ljung-Box Q, at four and eightlags for autocorrelation on squared standardized residuals and ARCH-LMtests at four and eight lags for heteroskedasticity on the standardizedresiduals (see Berument, Ceylan and Olgun 2007 for the calculations of andelaborations on these tests). None of the test statistics was statisticallysignificant; this supports the TFP growth specification.
Various reasons can be postulated as to why we could not findstatistically significant relationships. The first one is that TFP growth isaffected by factors other than its history. Including other sets of variablesmay help to explain the behavior of TFP growth and its own innovations.Second, TFP growth might be affected by macroeconomic instability butTFP growth volatility may not capture the macroeconomic instability.
Note that the specification we use to measure macroeconomic instabilityis of a non-linear system. It is possible that the inclusion of a large numberof statistically insignificant coefficients will increase the variability of themodel’s forecast. Therefore, our concern is to fit a parsimonious model anduse a nonstructural approach such as VAR to capture the dynamicrelationship among these variables. VAR models are often used in reduced-form specifications and are considered successful in capturing a rich array ofdynamic relationships among a set of variables with relatively few parameterestimates. Here, we also assume that the conditional variance of TFPgrowth is constant, because we could not detect the effect of TFP growthvariability on TFP growth. Introducing TFP growth volatility to the systemwould create more difficulties for convergence and the estimates would bemore sensitive to initial values.
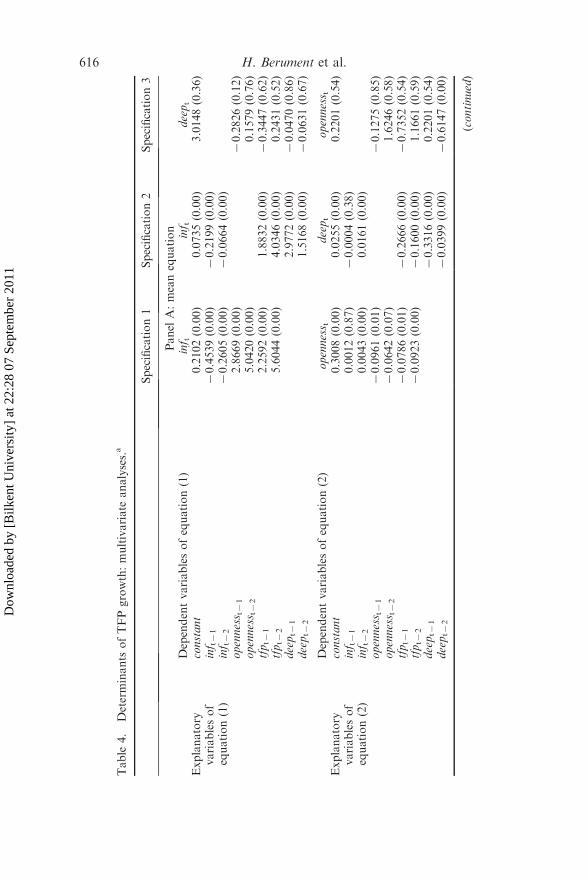
4.2. The multivariate model specification(s)
Table 4 reports the estimates of three different VAR-GARCH specifications.Specification 1 includes three variables: inflation, openness and tfp. Equation(1) of Specification 1 in the table models inflation with its two lags, two lagsof openness, two lags of tfp, and the constant term. Equation (2) is foropenness, which is modeled with two lags of inflation, openness, and tfp. Thelast one (equation (3)) is for the tfp, which is modeled as a function of two
The Journal of International Trade & Economic Development 615
Dow
nloa
ded
by [
Bilk
ent U
nive
rsity
] at
22:
28 0
7 Se
ptem
ber
2011
Table
4.
Determinants
ofTFPgrowth:multivariate
analyses.a
Specification1
Specification2
Specification3
Panel
A:meanequation
Dependentvariablesofequation(1)
inf t
inf t
deept
Explanatory
variablesof
equation(1)
constant
0.2102(0.00)
0.0735(0.00)
3.0148(0.36)
inf t7
170.4539(0.00)
70.2199(0.00)
inf t7
270.2605(0.00)
70.0664(0.00)
openness t7
12.8669(0.00)
70.2826(0.12)
openness t7
25.0420(0.00)
0.1579(0.76)
tfpt7
12.2592(0.00)
1.8832(0.00)
70.3447(0.62)
tfpt7
25.6044(0.00)
4.0346(0.00)
0.2431(0.52)
deept7
12.9772(0.00)
70.0470(0.86)
deept7
21.5168(0.00)
70.0631(0.67)
Dependentvariablesofequation(2)
openness t
deept
openness t
Explanatory
variablesof
equation(2)
constant
0.3008(0.00)
0.0255(0.00)
0.2201(0.54)
inf t7
10.0012(0.87)
70.0004(0.38)
inf t7
20.0043(0.00)
0.0161(0.00)
openness t7
170.0961(0.01)
70.1275(0.85)
openness t7
270.0642(0.07)
1.6246(0.58)
tfpt7
170.0786(0.01)
70.2666(0.00)
70.7352(0.54)
tfpt7
270.0923(0.00)
70.1600(0.00)
1.1661(0.59)
deept7
170.3316(0.00)
0.2201(0.54)
deept7
270.0399(0.00)
70.6147(0.00)
(continued)
616 H. Berument et al.
Dow
nloa
ded
by [
Bilk
ent U
nive
rsity
] at
22:
28 0
7 Se
ptem
ber
2011
Table
4.
(Continued).
Specification1
Specification2
Specification3
Dependentvariablesofequation(3)
tfpt
tfpt
tfpt
Explanatory
variablesof
equation(3)
constant
0.0110(0.00)
0.0088(0.00)
1.2410(0.00)
inf t7
17
0.0023(0.00)
70.0467(0.00)
inf t7
20.0030(0.00)
0.0170(0.00)
openness t7
17
0.2911(0.00)
70.0185(0.46)
openness t7
27
0.0400(0.00)
70.0381(0.15)
tfpt7
10.0749(0.00)
71.3281(0.00)
70.0317(0.20)
tfpt7
20.0061(0.00)
70.8402(0.00)
70.0415(0.00)
deept7
170.6936(0.00)
70.0935(0.00)
deept7
270.1540(0.00)
70.0571(0.00)
hinf t
0.0967(0.00)
0.0580(0.00)
hopen
t7
0.4039(0.00)
70.0085(0.79)
hdeept
70.7956(0.00)
70.6060(0.00)
Panel
B:conditionalvariances
Dependentvariablesof(conditional)variance
hinf t
hinf t
Explanatory
variablesof
CV
Constant
0.0299(0.00)
0.3204(0.00)
u2 inf t�1
0.0001(0.98)
0.2109(0.00)
hinf t�1
0.9648(0.00)
0.0100(0.00)
Dependentvariablesof(conditional)variance
hopen
thopen
t
Explanatory
variablesof
CV
Constant
0.1570(0.00)
0.1853(0.00)
u2 open
t�1
0.0078(0.00)
70.5870(0.00)
hopen
t�1
0.2437(0.00)
0.2882(0.00)
(continued)
The Journal of International Trade & Economic Development 617
Dow
nloa
ded
by [
Bilk
ent U
nive
rsity
] at
22:
28 0
7 Se
ptem
ber
2011
Table
4.
(Continued).
Specification1
Specification2
Specification3
Dependentvariablesof(conditional)variance
hdeept
hdeept
Explanatory
variablesof
CV
Constant
0.7467(0.00)
0.7807(0.42)
u2 deept�
10.0112(0.00)
0.1769(0.58)
hdeept�
10.1003(0.00)
70.1378(0.16)
Var(tfpt)
4.0725(0.00)
7.4912(0.00)
4.6590(0.00)
Panel
C:time-independentcovariances
covðu
inf t;u
open
tÞ
1536.67(0.00)
covðu
inf t;udeeptÞ
21.8605(0.00)
covðu
deept;u
tfptÞ
20.2241(0.00)
75.0514(0.00)
covðu
inf t;u
tfptÞ
73.5370(0.00)
74.4942(0.00)
covðu
deept;u
open
tÞ
341.66(0.46)
covðu
tfpt;u
open
tÞ
77.7569(0.19)
70.5766(0.98)
Note:Sampleincludes
quarterly
observationsfrom
1987Q1to
2007Q3foratotalof83observations.hinf t�1,hdeept�
1andhopen
t�1theconditionalvariancesof
inflation,deepnessandopennessvariables,respectively.tfpt,totalfactorproductivitygrowth;inf t,inflationgrowth;openness t,thegrowth
rate
oftheratioof
sum
ofexport
andim
portsto
GDP;deept,M2Y
toGDPratiogrowth.
ap-values
are
nextto
estimatedcoeffi
cients
forthecorrespondingvariables.
618 H. Berument et al.
Dow
nloa
ded
by [
Bilk
ent U
nive
rsity
] at
22:
28 0
7 Se
ptem
ber
2011
lags of inflation, openness, and tfp; tfp is also explained by the conditionalvariances of inflation and openness to assess the role of these instabilities inexplaining the behavior of tfp.15 Moreover, we model the conditionalvariances of inflation and openness with a GARCH (1,1) specification.16
Specifically, we estimate the following set of equations:
Inft ¼ ainf0 þX2i¼1
ainfi inft�i þX2i¼1
binfi opent�i þX2i¼ 1
ginfi tfpt�i þ uinft ð5aÞ
where uinft � 0; hinftð Þ;
hinft ¼ kinf þ dinfhinft�1 þ minfu2inft�1
ð5bÞ
and
opent ¼ aopen0 þX2i¼1
aopeni inft�i þX2i¼1
bopeni opent�i
þX2i¼ 1
gopeni tfpt�i þ uopent ð6aÞ
where uopent � 0; hopent� �
;
hopent ¼ kopen þ dopenhopent�1 þ mopenu2opent�1
ð6bÞ
and
tfpt ¼ atfp0 þX2i¼1
atfpi inft�i þX2i¼1
btfpi opent�i þX2i¼ 1
gtfpi tfpt�i
þ finfthinft þ fopenhopent þ utfpt ð7Þ
where utfpt � N 0; htfpt� �
and
htfpt ¼ ktfp
The covariances of the equations are presented as follows:
kinf;open ¼ cov ðuinft ; uopentÞ
kinf;tfp ¼ cov ðuinft ; utfptÞkopen;tfp ¼ covðuopent ; utfptÞ
The estimated coefficient for the inflation variability (htfpt ) in the tfpspecification is positive and statistically significant, as reported in the
The Journal of International Trade & Economic Development 619
Dow
nloa
ded
by [
Bilk
ent U
nive
rsity
] at
22:
28 0
7 Se
ptem
ber
2011
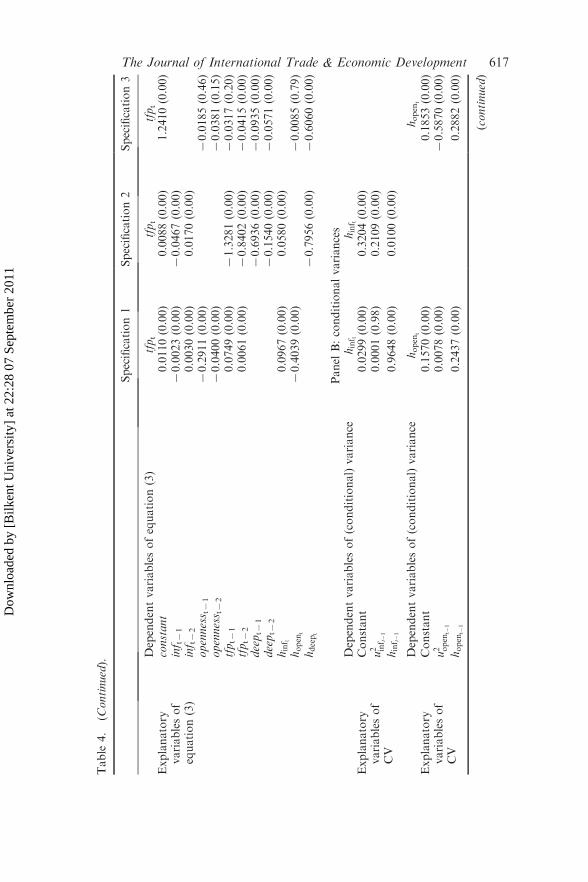
equation (3) section of Table 4. This suggests that inflation volatilityincreases TFP growth. The estimated coefficient for the openness variabilityis negative and statistically significant. It is plausible that exports and importscould be affected by different factors and have different dynamics. Thus, inorder to partially account for this, we define two new openness measures:export-GDP ratio and import-GDP ratio. When these two opennessmeasures are included jointly in the econometric specification withoutincluding any other volatility measures, the estimated coefficients of opennessvolatility measures were jointly statistically significant and negative.
Next, we examine the validity of the variance specification estimates inPanel B. Note that all the estimated coefficients for the VAR-GARCHspecifications for the inflation and openness variabilities are positive. Thissatisfies the non-negativity of the conditional variance specification. It is alsoimportant to highlight that the sum of the coefficients of htfpt�1 and u2tfpt�1 , aswell as the sum of the coefficients of hopen
t�1and u2open
t�1, are less than 1. This
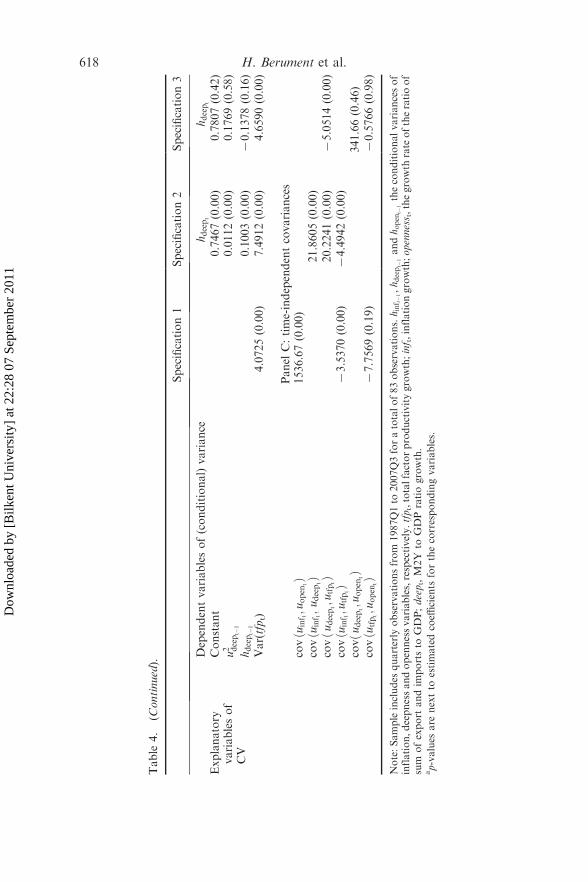
also satisfies the non-explosiveness property of the conditional variances.Lastly, covðuinft ; utfptÞ, covðuinft ; uopentÞ, and covðutfpt ; uopentÞ are the time-independent covariances.
The deepness volatility of the financial market is an additional potentialdeterminant of TFP growth. Thus, we perform the analyses by incorporat-ing deepness and its volatility into the VAR-GARCH specification. Here,we do not include deepness as an additional variable of the three-variableVAR-GARCH specification, but rather substitute it with openness orinflation to avoid overparameterization.
Column 2 of Table 4 presents the coefficients of the VAR-GARCHmodel that is composed of inflation, financial deepness, and TFP growth.The sign of inflation variability in the tfpt equation is positive andstatistically significant. This result is consistent with the former specification.Financial deepness variability negatively affects TFP and this effect is alsostatistically significant.
The last set of estimates, shown in column 3 of Table 4, is for analyzingwhether the openness and deepness volatilities affect TFP. The resultssupport our previous analyses: both variables decrease TFP growth.However, the negative effect of the openness variable on TFP growth isnot statistically significant, which may suggest that these two volatilitiesmight be working from the same channel or that a high colinearity of thesetwo variables exists.17
Lastly, the estimated coefficients for the VAR-GARCH specifi-cations reported in Panel B are all positive. This satisfies the non-negativitycondition of the conditional variances. Moreover, the sums of the slopecoefficients for each of the VAR-GARCH specifications are all less than one.This supports the non-explosiveness of the conditional variances.18
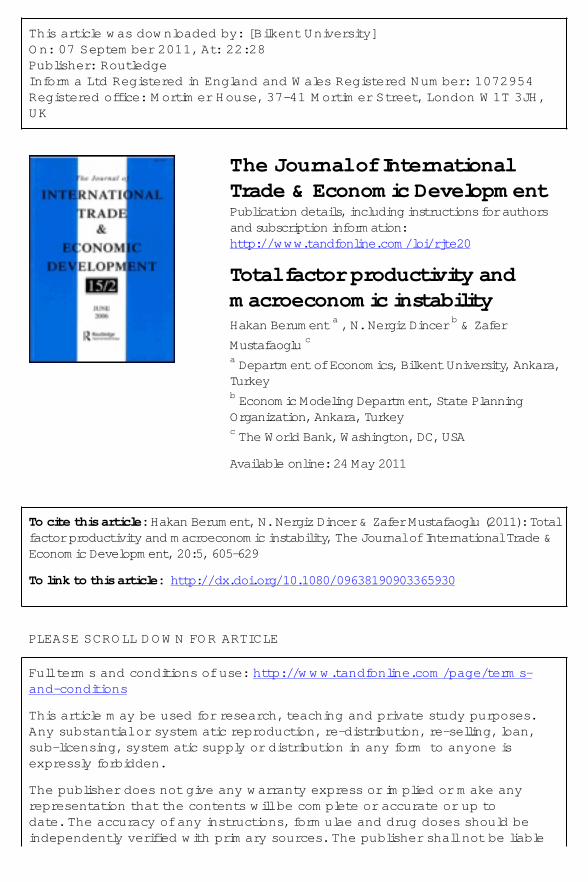
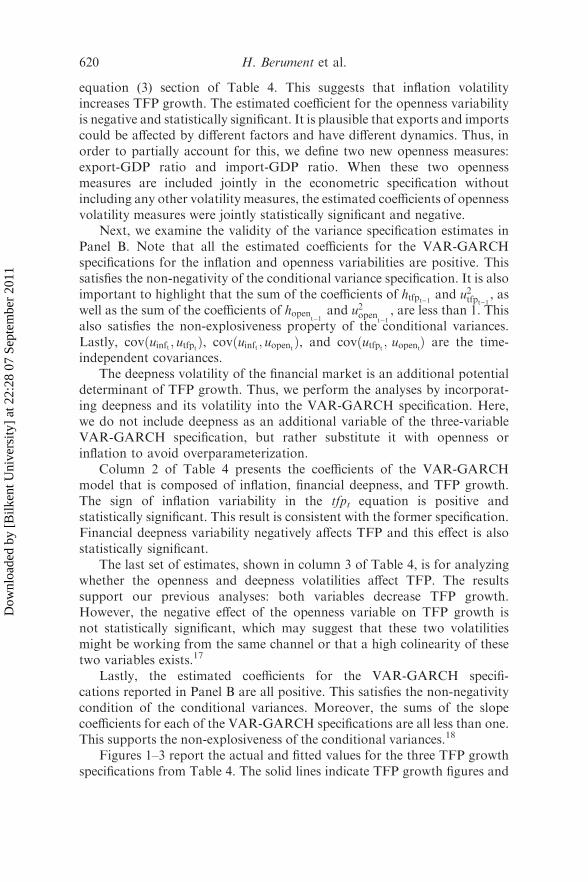
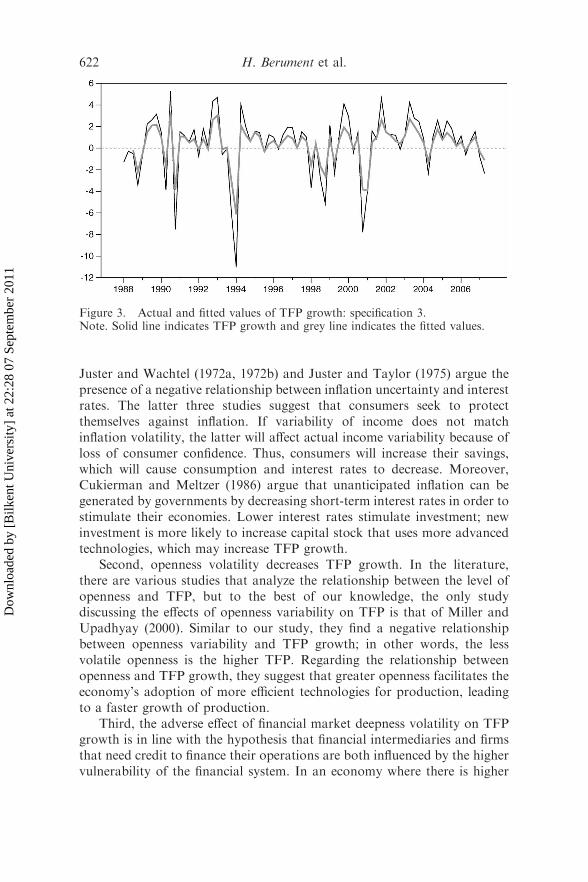
Figures 1–3 report the actual and fitted values for the three TFP growthspecifications from Table 4. The solid lines indicate TFP growth figures and
620 H. Berument et al.
Dow
nloa
ded
by [
Bilk
ent U
nive
rsity
] at
22:
28 0
7 Se
ptem
ber
2011
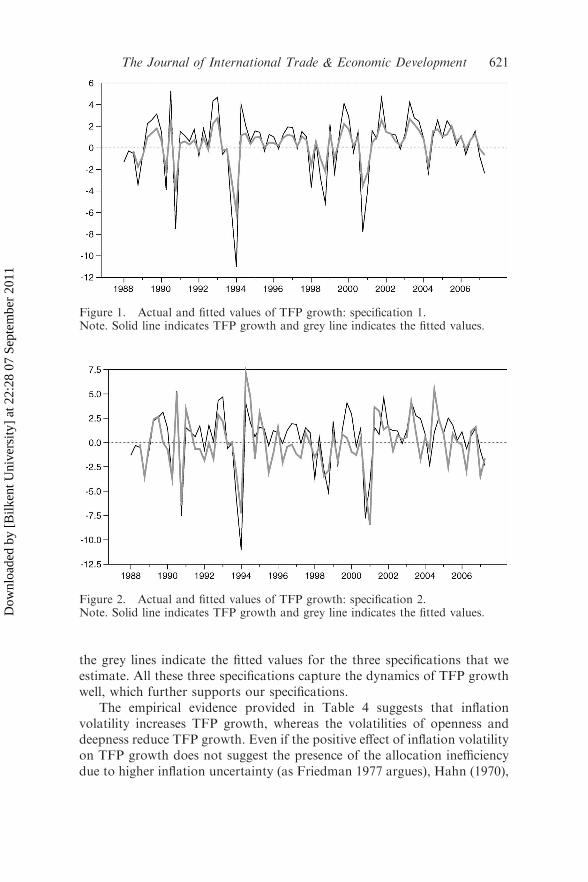
the grey lines indicate the fitted values for the three specifications that weestimate. All these three specifications capture the dynamics of TFP growthwell, which further supports our specifications.
The empirical evidence provided in Table 4 suggests that inflationvolatility increases TFP growth, whereas the volatilities of openness anddeepness reduce TFP growth. Even if the positive effect of inflation volatilityon TFP growth does not suggest the presence of the allocation inefficiencydue to higher inflation uncertainty (as Friedman 1977 argues), Hahn (1970),
Figure 1. Actual and fitted values of TFP growth: specification 1.Note. Solid line indicates TFP growth and grey line indicates the fitted values.
Figure 2. Actual and fitted values of TFP growth: specification 2.Note. Solid line indicates TFP growth and grey line indicates the fitted values.
The Journal of International Trade & Economic Development 621
Dow
nloa
ded
by [
Bilk
ent U
nive
rsity
] at
22:
28 0
7 Se
ptem
ber
2011
Juster and Wachtel (1972a, 1972b) and Juster and Taylor (1975) argue thepresence of a negative relationship between inflation uncertainty and interestrates. The latter three studies suggest that consumers seek to protectthemselves against inflation. If variability of income does not matchinflation volatility, the latter will affect actual income variability because ofloss of consumer confidence. Thus, consumers will increase their savings,which will cause consumption and interest rates to decrease. Moreover,Cukierman and Meltzer (1986) argue that unanticipated inflation can begenerated by governments by decreasing short-term interest rates in order tostimulate their economies. Lower interest rates stimulate investment; newinvestment is more likely to increase capital stock that uses more advancedtechnologies, which may increase TFP growth.
Second, openness volatility decreases TFP growth. In the literature,there are various studies that analyze the relationship between the level ofopenness and TFP, but to the best of our knowledge, the only studydiscussing the effects of openness variability on TFP is that of Miller andUpadhyay (2000). Similar to our study, they find a negative relationshipbetween openness variability and TFP growth; in other words, the lessvolatile openness is the higher TFP. Regarding the relationship betweenopenness and TFP growth, they suggest that greater openness facilitates theeconomy’s adoption of more efficient technologies for production, leadingto a faster growth of production.
Third, the adverse effect of financial market deepness volatility on TFPgrowth is in line with the hypothesis that financial intermediaries and firmsthat need credit to finance their operations are both influenced by the highervulnerability of the financial system. In an economy where there is higher
Figure 3. Actual and fitted values of TFP growth: specification 3.Note. Solid line indicates TFP growth and grey line indicates the fitted values.
622 H. Berument et al.
Dow
nloa
ded
by [
Bilk
ent U
nive
rsity
] at
22:
28 0
7 Se
ptem
ber
2011
deepness volatility, financial intermediaries prefer short-term lending tolong-term credit, which ultimately affects a country’s TFP growth. More-over, there are lower levels of new investment as financial firms are lesswilling to provide credit regardless of credit maturity. Furthermore, firmsuse more of their internal resources for investment. This likely decreasesTFP growth because the liquidity provided by financial intermediariesallows for more efficient allocation of resources.
5. Conclusion
This article assesses how a set of macroeconomic instability measures con-tributes to TFP growth. The results suggest that inflation volatility increasesTFP growth, and that openness and deepness volatilities reduce TFPgrowth.
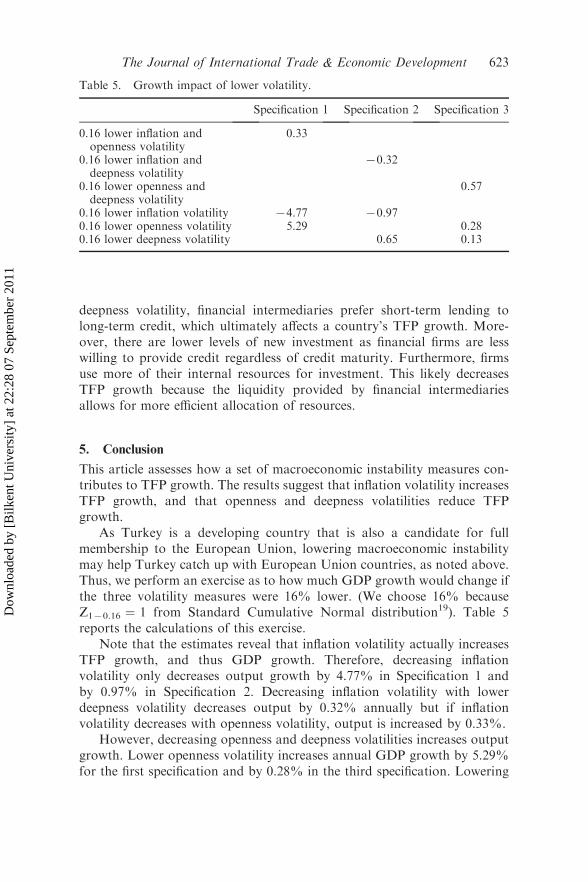
As Turkey is a developing country that is also a candidate for fullmembership to the European Union, lowering macroeconomic instabilitymay help Turkey catch up with European Union countries, as noted above.Thus, we perform an exercise as to how much GDP growth would change ifthe three volatility measures were 16% lower. (We choose 16% becauseZ170.16 ¼ 1 from Standard Cumulative Normal distribution19). Table 5reports the calculations of this exercise.
Note that the estimates reveal that inflation volatility actually increasesTFP growth, and thus GDP growth. Therefore, decreasing inflationvolatility only decreases output growth by 4.77% in Specification 1 andby 0.97% in Specification 2. Decreasing inflation volatility with lowerdeepness volatility decreases output by 0.32% annually but if inflationvolatility decreases with openness volatility, output is increased by 0.33%.
However, decreasing openness and deepness volatilities increases outputgrowth. Lower openness volatility increases annual GDP growth by 5.29%for the first specification and by 0.28% in the third specification. Lowering
Table 5. Growth impact of lower volatility.
Specification 1 Specification 2 Specification 3
0.16 lower inflation andopenness volatility
0.33
0.16 lower inflation anddeepness volatility
70.32
0.16 lower openness anddeepness volatility
0.57
0.16 lower inflation volatility 74.77 70.970.16 lower openness volatility 5.29 0.280.16 lower deepness volatility 0.65 0.13
The Journal of International Trade & Economic Development 623
Dow
nloa
ded
by [
Bilk
ent U
nive
rsity
] at
22:
28 0
7 Se
ptem
ber
2011
deepness volatility increases growth by 0.65% in the second specificationand 0.13% in the third specification.
When both openness and deepness volatility are lowered by 16% each,output growth increases by 0.57%. One needs to be cautious about 4.77%lower growth for lower inflation volatility or 5.29% higher growth for loweropenness volatility from Specification 1, because these magnitudes are quitehigh, but consider them simultaneously. Thus, we may claim that 0.33–0.57% higher annual growth is feasible, which means 7–11% higher growthfor the 19-year period that we consider. Turkey has failed to achieveconvergence with EU per capita income levels in the past. The low per capitaincome growth (at about 2.25% between 1988 and 2006) was not sufficientto allow for income convergence since it was just above the growth of percapita income in the EU. However, our estimations indicate that a 16%decline in the volatility of openness and financial deepness would increasethe annual average GDP growth by around 0.33–0.57%.20 Such an increasein the GDP growth rate would result in a meaningful difference between percapita income growth rates in Turkey and the EU, and thereby significantlyaccelerate income convergence. Based on historical averages on populationand GDP growths, a simulation exercise shows that Turkey could reachabout 34–35% of the EU25 per capita income levels in 15 years from a baseof 29% with a 16% reduction in the volatility of openness and financialdeepness. Furthermore, without any decline in volatility, Turkey couldreach 32% of the EU25 income level, which would be almost 10%lower, without changing the historical growth rates. Note that thesecalculations are based on real incomes and do not take into account any realexchange rate appreciation. However, the increase in TFP would also lead toan appreciation in the currency and therefore accelerate the convergence.
Acknowledgments
The authors thank Anita Akkas and Rana Nelson for their helpful comments. Theviews presented here are those of the authors; they do not necessarily reflect theofficial position of the State Planning Organization of Turkey or of The World Bank.
Notes
1. Although later work has indicated a lesser role of TFP in growth, it still remainsthe major factor accounting for growth (see, for example, Kendrick 1961;Denison 1985; Jorgenson, Gollop and Fraumeni, 1987; Maddison 1995;Mankiw, Phelps and Romer 1995; Klenow and Rodriguez-Clare 1997; Jones1997; Abramovitz and David 2000).
2. Schultz (1961); Becker (1962); Becker Murphy and Tamura (1990); Black andLynch (1996); Miller and Upadhyay (2000); Aiyar and Feyrer (2002).
3. Edwards (1998); Harris (1999); Cororatan and Zingapan (1999); Miller andUpadhyay (2000); Alcala and Ciccone (2004).
4. Miller and Upadhyay (2000); Clark (1982).
624 H. Berument et al.
Dow
nloa
ded
by [
Bilk
ent U
nive
rsity
] at
22:
28 0
7 Se
ptem
ber
2011
5. Kugler and Neusser (1998); Levine (2003); Tadesse (2005); Jeong andTownsend (2004); Beck, Levine and Loayza (2000).
6. Harris 1999.7. Volatility measures are the proxy of second moments such as moving variance
or conditional variance of macroeconomic variables.8. Type-II error is defined as not rejecting the null although it is false. The way to
reduce Type-II errors would be to either increase the level of significancedenoted by (a) or decrease the confidence coefficient denoted by (1 7 a). Apartfrom these conventional methods, another suggestion is to increase thedispersion of the collected data as per Netter, Wasserman and Kutner (1985),p. 71. They argue that increasing spacing results in an increase in the t-statisticsof a given estimated parameter, the sample size and the variance of the errors.In addition, increasing spacing also decreases the standard errors of theparameters of interest. Concerning the fact that Turkey is the only countryexperiencing high and sustainable inflation, the result is that spacing is higherand Type-II error is lower (see also Berument, Akdi and Atakan 2005 forfurther discussion).
9. This article assesses the determinants of TFP growth; however, we will call thisTFP in the text.
10. See Hamilton (1994, pp. 668–70) and Berument, Coskun and Sahin (2007) forthe advantages of EGARCH specifications against other types of ARCHmodels and estimation using general error distribution.
11. The estimated coefficients of the Cobb-Douglas production function for capitalis 0.42 and for labor is 0.58.
12. The lag order of 4 is determined by the final prediction error (FPE) criteria thatset the lag length such that the residuals are no longer autocorrelated.Casimano and Jansen (1988) suggest that autocorrelated errors imply thepresence of the ARCH effect even if the ARCH effect is not present.
13. The level of significance is at 5% unless otherwise mentioned.14. We used various ARCH and GARCH specifications but the basic evidence on
the mean effect is robust.15. The lag order of 2 is selected by the final prediction error criteria when we
consider a class of models with the same lag order across equations.16. We also estimate the model with the EGARCH specification. The estimated
coefficient for the leverage effect and the estimated coefficient for theconditional variances were not statistically significant (possibly due to over-parameterization), thus we did not elaborate on them here.
17. In this article, we explore the behavior of TFP growth by using three-equationVAR-GARCH specifications. We also estimate a model that incorporateddeepness, TFP, openness and inflation simultaneously: a four-variable VAR-GARCH specification. The estimated coefficients for inflation volatility,openness volatility, and deepness volatility were too small, even if they werestatistically significant, and the results were sensitive to initial values. This mightbe due to the highly nonlinear nature of the specification and the high collinearityof deepness, TFP and openness measures. We did not report and elaborate onthese estimates here, but they are available for interested readers on request.
18. Conducting specification tests on the multivariate GARCH models is not aneasy task, and we tried various classes of them. Since the tests are so extensive,we did not report them all; however, sign-biased, Ljung-Box-Q and ARCH-LMtests mostly passed for the tfpt specification equation (3) of Table 4.
19. Introducing one-standard deviation shocks is a common exercise in empiricalsimulation. See for example, Sims and Zha (1999).
The Journal of International Trade & Economic Development 625
Dow
nloa
ded
by [
Bilk
ent U
nive
rsity
] at
22:
28 0
7 Se
ptem
ber
2011
20. Since increasing inflation volatility may have other adverse effects, we did notpursue this avenue further.
References
Abramovitz, Moses. 1956. Resource and output trends in the United States since1870. American Economic Review Papers and Proceedings 46: 5–23.
Abramovitz, Moses, and Paul A. David. 2000. American macroeconomic growth inthe era of knowledge-based progress: The long-run perspective. In EconomicHistory of the United States, ed. Stanley L. Engerman, and Robert E. Gallman.Vol. III. The Twentieth Century. Cambridge: Cambridge University Press.
Acemoglu, Daron, and Fabrizio Zilibotti. 1997. Was Prometheus unbound bychance? Risk, diversification, and growth. Journal of Political Economy 105, no.4: 709–51.
Aitken, Brian, and Ann Harrison. 2004. Do domestic firms benefit from foreigndirect investment? Evidence from panel data. World Bank Policy ResearchWorking Paper Series, 1248.
Aiyar, Shekhar, and James Feyrer. 2002. A contribution to the empirics of TFP.Dartmouth College Working Paper no. 02–09.
Alcala, Francisco, and Antonio Ciccone. 2004. Trade and productivity. QuarterlyJournal of Economics 119, no. 2: 613–46.
Angeletos, G.-M. 2006. Uninsured idiosyncratic investment risk and aggregatesaving. Review of Economic Dynamics 10, no. 1: 1–30.
Beck, Thorsten, Ross Levine, and Norman Loayza. 2000. Finance and the sources ofgrowth. Journal of Financial Economics 58, no. 1–2: 261–300.
Becker, S. Gary. 1962. Investment in human capital: A theoretical analysis. TheJournal of Political Economy 70, no. S5: 9–49.
Becker, S. Gary, Kevin M. Murphy, and Robert Tamura. 1990. Human capital,fertility, and economic growth. The Journal of Political Economy 98, no. 5:S12–37.
Berument, Hakan. 2007. Measuring monetary policy for a small open economy:Turkey. Journal of Macroeconomics 29: 411–30.
Berument, Hakan, Nildag Ceylan, and Hasan Olgun. 2007. Inflation uncertainty andinterest rates: Is Fisher equation universal? Applied Economics 39: 53–68.
Berument, Hakan, Yilmaz Akdi, and Cemal Atakan. 2005. An empirical analysis ofIstanbul stock exchange sub-indexes. Studies Nonlinear Dynamics and Econo-metrics 9, no. 3. Article 5.
Berument, Hakan, Nejat Coskun, and Afsin Sahin. 2007. Day of the week effecton foreign exchange market volatility: Evidence from Turkey. Research inInternational Business and Finance 21: 87–97.
Black, Sandra, and Lisa Lynch. 1996. Human capital investments and productivity.American Economic Review 86, no. 2: 263–7.
Casimano, T., and D. Jansen. 1988. Estimates of the variance of US inflation basedupon the ARCH model. Journal of Money, Credit and Banking 20, no. 3: 409–23.
Clark, Peter. 1982. Inflation and the productivity decline. Papers and proceedings ofthe 94th annual meeting of the American Economic Association, May. TheAmerican Economic Review, 72, no. 2: 149–54.
Cororaton, Caesar, and Socorro Zingapan. 1999. Recent TFP policy agenda for thePhilippines. Discussion Paper Series 99–07.
Cogley, Timothy. 2005. How fast can economy grow? A Bayesian analysis of theevolution of trend growth. Journal of Macroeconomics 27: 179–207.
626 H. Berument et al.
Dow
nloa
ded
by [
Bilk
ent U
nive
rsity
] at
22:
28 0
7 Se
ptem
ber
2011
Cogley, Timothy, and Thomas Sargent. 2005. Drift and volatilities: Monetarypolicies and outcome in the post WWII. US. Review of Economic Dynamics 8, no.2: 262–302.
Cukierman, Alex, and Allan Meltzer. 1986. A theory of ambiguity, credibility, andinflation under discretion and asymmetric information. Econometrica 17:1099–128.
De Mello, Luiz. 1999. Foreign direct investment-led growth: Evidence from timeseries and panel data. Oxford Economic Papers 51: 133–51.
Denison, Edward. 1985. Trends in American economic growth, 1929–1982,Washington, DC: Brookings Institution.
Dotsey, Micheal, and Pierre D. Sarte. 2000. Inflation uncertainty and growth ina cash-in-advance economy. Journal of Monetary Economics 45, no. 3:631–55.
Edwards, Sebastian. 1998. Openness, productivity and growth: What do we reallyknow? Economic Journal 108, no. 447: 383–98.
Engle, Robert F. 1982. Autoregressive conditional heteroskedasticity with estimatesof the variance of UK inflation. Econometrica 50: 987–1008.
Engle, Robert F., and Kenneth F. Kroner. 1995. Multivariate simultaneousGARCH. Econometric Theory 11, no. 1: 122–50.
Evers, M., S. Niemann, and M. Schiffbauer. 2008. Inflation, financial market in-completeness and long-run TFP-growth. Working Paper, Bonn Graduate Schoolof Economics.
Ferrett, Ben. 2004. Foreign direct investment and productivity growth: A survey oftheory. University of Nottingham Working Paper 15.
Friedman, Milton. 1977. Time perspective in demand for money. ScandinavianJournal of Economics 79, no. 4: 397–416.
Froyen, Richard T., and Roger N. Waud. 1987. An examination of aggregate priceuncertainty in four countries and some implications for real output. InternationalEconomic Review 28, no. 2: 353–72.
Hafer, Rik W. 1986. Inflation uncertainty and a test of the Friedman hypothesis.Journal of Macroeconomics 8, no. 3: 365–72.
Hahn, Frank. 1970. Savings and uncertainty. Review of Economic Studies 37:21–4.
Hamilton, James. 1994. Time series analysis. Princeton, NJ: Princeton UniversityPress.
Harris, Richard. 1999. Determinants of Canadian productivity growth: issues andprospects. Industry Canada Discussion Paper 8.
Haskel, Jonothan. 2005. Unions and productivity again: New evidence frommatched WERS and business census data. Unpublished manuscript.
Holland, Steven. 1986. Wage indexation and the effect of inflation uncertainty onemployment: An empirical analysis. The American Economic Review 76, no. 1:235–43.
Jeong, Hyeok, and Robert Townsend. 2004. Discovering the sources of TFP growth:Occupational choice and financial deepening. Mimeo.
Jones, Charles I. 1997. On the evolution of the world income distribution. Journal ofEconomic Perspectives 11: 19–36.
Jorgenson, Dale W., Frank M. Gollop, and Barbara M. Fraumeni. 1987.Productivity and US economic growth. Harvard Economic Studies 159.
Juster, F. Thomas, and Lester Taylor. 1975. Towards a theory of saving behavior.American Economic Review 65: 203–9.
Juster, F. Thomas, and Paul Wachtel. 1972a. Inflation and the consumer. BrookingsPapers on Economic Activity 1: 71–114.
The Journal of International Trade & Economic Development 627
Dow
nloa
ded
by [
Bilk
ent U
nive
rsity
] at
22:
28 0
7 Se
ptem
ber
2011
Juster, F. Thomas, and Paul Wachtel. 1972b. A note on inflation and the saving rate.Brookings Papers on Economic Activity 3: 765–78.
Kendrick, John. 1961. Productivity trends in the United States. New York: PrincetonUniversity Press for the National Bureau of Economic Research.
Kugler, Maurice, and Klaus Neusser. 1998. Manufacturing growth and financialdevelopment: Evidence from OECD countries. Review of Economics andStatistics 80: 638–46.
Klenow, Peter J., and Andres Rodriguez-Clare. 1997. The neoclassical revival ingrowth economics: Has it gone too far? In NBER Macroeconomics Annual 1997,ed. Bernanke, Ben S., and Julio J. Rotemberg. Cambridge, MA: MIT Press.
Levine, Ross. 2003. Bank-based or market-based financial systems: Which is better?Journal of Financial Intermediation 11: 398–428.
Levine, Ross, Norman Loayza, and Thorsten Beck. 2000. Financial intermediationand growth: Causality and causes. Journal of Monetary Economics 46: 31–77.
Liu, Xiaming, and Chengqi Wang. 2003. Does foreign direct investment facilitatetechnological progress? Evidence from Chinese industries. Research Policy 32:945–53.
Lucas, Robert. 1973. Some international evidence on output-inflation tradeoffs. TheAmerican Economic Review 63, no. 3: 326–34.
Maddison, Angus. 1995. Monitoring the world economy, 1820–1992. Paris: Develop-ment Centre of the Organization for Economic Co-operation and Development.
Mankiw, N.Gregory, Edmund Phelps, and Paul Romer. 1995. The growth ofnations. Brookings Papers on Economic Activity 1: 275–310.
Miller, Stephen, and Mukti Upadhyay. 2000. The effect of openness, trade orienta-tion and human capital on total factor productivity. Journal of DevelopmentEconomics 63: 399–423.
Montalbano, Pierluigi, Alessandro Federici, Umberto Triulzi, and Carlo Pietrobelli.2005. Trade openness and vulnerability in Central and Eastern Europe. WIDERResearch Paper 2005/43.
Nelson, Daniel. 1991. Conditional heteroskedasticity in asset returns: A newapproach. Econometrica 59: 347–70.
Neter, J., W. Wasserman, and M. Kutner. 1985. Applied linear statistical models.Homewood, IL: Richard D. Irwin.
Rodrik, Dani. 1998. Why do more open economies have bigger governments?Journal of Political Economy 106, no. 5: 997–1032.
Sadik, Ali, and Ali Bolbol. 2001. Capital flows, FDI and technology spillovers:evidence from Arab countries. World Development 12: 2111–25.
Saygili, Seref, Cengiz Cihan, and Hasan Yurtoglu. 2005. Turkiye EkonomisindeSermaye Birikimi, Buyume ve Verimlilik: 1972–2003. Ankara: Devlet PlanlamaTeskilati.
Scarpetta, Stefano, and Thierry Tressel. 2002. Productivity and convergence in apanel of OECD industries: Do regulations and institutions matter? OECDEconomics Department Working Paper no. 342.
Schultz, Theodore W. 1961. Investment in human capital. The American EconomicReview 51, no. 1: 1–17.
Sims, Christopher, and Tao Zha. 1999. Error bands for impulse responses.Econometrica 67, no. 5: 1113–55.
Solow, Robert. 1957. Technical change and the aggregate production function.Review of Economics and Statistics 39: 312–20.
Singh, Nirvikar, and Hung Trieu. 1996. Total factor productivity growth in Japan,South Korea, and Taiwan. University of California at Santa Cruz WorkingPaper no. 361.
628 H. Berument et al.
Dow
nloa
ded
by [
Bilk
ent U
nive
rsity
] at
22:
28 0
7 Se
ptem
ber
2011
Tadesse, Solomon. 2005. Financial development and technology. The WilliamDavidson Institute Working Paper no. 749.
Warren, Ronald. 1985. The effect of unionization on labor productivity: Some time-series evidence. Journal of Labor Research 6, no. 5: 199–207.
Williams, Martin, and Ronald Moomaw. 1989. Capital and labor efficiencies: Aregional analysis financial development and technology. Urban Studies 26, no. 6:573–85.
The Journal of International Trade & Economic Development 629
Dow
nloa
ded
by [
Bilk
ent U
nive
rsity
] at
22:
28 0
7 Se
ptem
ber
2011