Presidential approval and macroeconomic conditions
15
Presidential approval and macroeconomic conditions: evidence from a nonlinear model Seung-Whan Choi a , Patrick James b , Yitan Li c and Eric Olson d a Department of Political Science, University of Illinois at Chicago, Chicago, IL, USA; b School of International Relations, University of Southern California, Los Angeles, CA, USA; c Political Science, Seattle University, Seattle, WA, USA; d College of Business and Economics, West Virginia University, Morgantown, WV, USA ABSTRACT Contrary to previous empirical studies that find a linear link between economic conditions and presidential approval, this study argues for and finds a nonlinear relationship. A threshold regression is used to assess potential nonlinear relationships between macroeconomic variables and presidential popularity. A quarterly data analysis for the 1960Q1–2012Q2 time period reveals that domestic factors prevail in shaping presidential approval. Most compelling is evidence of a threshold relationship involving economic conditions: When unemployment is slightly over 7%, its decline impacts significantly and favourably on presidential approval, an effect that virtually disappears below the threshold value. Change in consumer sentiment affects presidential approval in a limited way, while inflation shows no association at all. These results combine to encourage further investigation of nonlinear processes in the nexus of economics and politics. KEYWORDS Presidential approval; nonlinear; inflation; unemployment JEL CLASSIFICATION B22; C22; A12 I. Overview Public opinion is important in substantive terms, but also capable of rapid change. Thus, the ability to anticipate its collective impact on presidential approval is not a trivial matter. The White House obviously cares about public opinion – witness the persistent efforts of respective administrations to promote presidential popularity through media manipulation (Edwards 2004, 28). But why are some presidents more popular than others? How is it that a president’s approval rate can rise and fall dramatically in a matter of months or even weeks? These questions are important to students of American politics and policy. The president’s public standing, as observed in the classic exposition from Neustadt (1990 [1960]), affects the all-important ‘power to persuade’. Thus, popularity can impact upon the president’s prospects for passing sponsored legislation (for nuances on this, see Edwards 2009) and may even mean life or death regarding matters of national security (Rockman 1988, 32; James and Oneal 1991). For an incumbent president, good standing with the public also could help to discourage the potential threat posed by nominees from the other party, i.e. the ‘best and the brightest’ are more likely to sit out a cycle if they anticipate the president being re-elected easily. Steger’s (2003) expected utility model, for instance, focuses on whether presidents will experience re-nomination challenges. The chal- lenge from Senator Ted Kennedy to President Jimmy Carter, for example, came from inside the Democratic Party and reflected – at least in part – perceived weakness of the incumbent as a candidate in the general election (Stanley 2010). What drives presidential approval ratings? Scholars and policy-makers have produced a plethora of empirical research to address the ques- tion. Their studies have incorporated both domestic and international factors in increasingly sophisti- cated frameworks of analysis (examples include Edwards, Mitchell, and Welch 1995; James and Rioux 1998; Nadeau et al. 1999; DeRouen 2000; Nadeau and Lewis-Beck 2001). Despite the range of sophisticated research designs (all of which employ statistical models assuming linearity), empirical results are inconsistent. So the basic question remains unresolved. CONTACT Eric Olson [email protected] College of Business and Economics, West Virginia University, 1601 University Ave., PO Box 6025, Morgantown, WV 26506-6025, USA APPLIED ECONOMICS, 2016 VOL. 48, NO. 47, 4558–4572 http://dx.doi.org/10.1080/00036846.2016.1161718 © 2016 Informa UK Limited, trading as Taylor & Francis Group Downloaded by [71.57.75.222] at 14:36 08 August 2016
-
Upload
khangminh22 -
Category
Documents
-
view
0 -
download
0
Transcript of Presidential approval and macroeconomic conditions

Presidential approval and macroeconomic conditions: evidence from anonlinear modelSeung-Whan Choia, Patrick Jamesb, Yitan Lic and Eric Olsond
aDepartment of Political Science, University of Illinois at Chicago, Chicago, IL, USA; bSchool of International Relations, University of SouthernCalifornia, Los Angeles, CA, USA; cPolitical Science, Seattle University, Seattle, WA, USA; dCollege of Business and Economics, West VirginiaUniversity, Morgantown, WV, USA
ABSTRACTContrary to previous empirical studies that find a linear link between economic conditions andpresidential approval, this study argues for and finds a nonlinear relationship. A thresholdregression is used to assess potential nonlinear relationships between macroeconomic variablesand presidential popularity. A quarterly data analysis for the 1960Q1–2012Q2 time period revealsthat domestic factors prevail in shaping presidential approval. Most compelling is evidence of athreshold relationship involving economic conditions: When unemployment is slightly over 7%,its decline impacts significantly and favourably on presidential approval, an effect that virtuallydisappears below the threshold value. Change in consumer sentiment affects presidentialapproval in a limited way, while inflation shows no association at all. These results combine toencourage further investigation of nonlinear processes in the nexus of economics and politics.
KEYWORDSPresidential approval;nonlinear; inflation;unemployment
JEL CLASSIFICATIONB22; C22; A12
I. Overview
Public opinion is important in substantive terms, butalso capable of rapid change. Thus, the ability toanticipate its collective impact on presidentialapproval is not a trivial matter. The White Houseobviously cares about public opinion – witness thepersistent efforts of respective administrations topromote presidential popularity through mediamanipulation (Edwards 2004, 28). But why aresome presidents more popular than others? How isit that a president’s approval rate can rise and falldramatically in a matter of months or even weeks?
These questions are important to students ofAmerican politics and policy. The president’s publicstanding, as observed in the classic exposition fromNeustadt (1990 [1960]), affects the all-important‘power to persuade’. Thus, popularity can impactupon the president’s prospects for passing sponsoredlegislation (for nuances on this, see Edwards 2009)and may even mean life or death regarding matters ofnational security (Rockman 1988, 32; James andOneal 1991). For an incumbent president, goodstanding with the public also could help to discourage
the potential threat posed by nominees from the otherparty, i.e. the ‘best and the brightest’ are more likelyto sit out a cycle if they anticipate the president beingre-elected easily. Steger’s (2003) expected utilitymodel, for instance, focuses on whether presidentswill experience re-nomination challenges. The chal-lenge from Senator Ted Kennedy to President JimmyCarter, for example, came from inside the DemocraticParty and reflected – at least in part – perceivedweakness of the incumbent as a candidate in thegeneral election (Stanley 2010).
What drives presidential approval ratings?Scholars and policy-makers have produced aplethora of empirical research to address the ques-tion. Their studies have incorporated both domesticand international factors in increasingly sophisti-cated frameworks of analysis (examples includeEdwards, Mitchell, and Welch 1995; James andRioux 1998; Nadeau et al. 1999; DeRouen 2000;Nadeau and Lewis-Beck 2001). Despite the range ofsophisticated research designs (all of which employstatistical models assuming linearity), empiricalresults are inconsistent. So the basic questionremains unresolved.
CONTACT Eric Olson [email protected] College of Business and Economics, West Virginia University, 1601 University Ave., PO Box 6025,Morgantown, WV 26506-6025, USA
APPLIED ECONOMICS, 2016VOL. 48, NO. 47, 4558–4572http://dx.doi.org/10.1080/00036846.2016.1161718
© 2016 Informa UK Limited, trading as Taylor & Francis Group
Dow
nloa
ded
by [
71.5
7.75
.222
] at
14:
36 0
8 A
ugus
t 201
6

What if, however, these linear models are notaccounting for nonlinearities? This observation isthe point of departure for our own modelling inorder for empirical study to focus on whether, infact, nonlinearities are waiting to be discovered. Weargue that public opinion, most notably with regardto the presidential approval rate in the U.S., will be anonlinear rather than a linear function of macroeco-nomic variables: unemployment, inflation and consu-mer sentiment. To account for these potentialnonlinearities, this study introduces a thresholdregression model. Drawing on quarterly data span-ning the 1960Q1–2012Q2 time period, we find evi-dence that when unemployment is slightly over 7%,its decline impacts significantly and favourably onpresidential approval, an effect that virtually disap-pears below the threshold value. Change in consumersentiment affects presidential approval in a limitedway, while inflation shows no association at all.
Section II identifies the present state of researchon presidential approval and proposes a nonlinearrelationship between economic conditions and pre-sidential approval. Then, we build and test a thresh-old regression model of presidential approval andpresent our empirical results in Section III. SectionIV summarizes the key findings and implications ofthis study and offers direction for future research.
II. Economic conditions and presidentialpopularity
Vast is the literature on presidential approval.1 Itsorigins, as identified in the field essay from Gronkeand Newman (2003, 502), can be traced to Mueller(1970, 1973). The subject is a priority for students ofAmerican politics for the obvious reasons describedabove. Edwards, Mitchell, and Welch (1995, 108)(see also Gronke and Newman 2003, 501) refer tothe study of presidential approval as a ‘cottageindustry in political science.’ Thus no effort will bemade here to offer a comprehensive review. Instead,a sample of studies will (a) locate disagreements inthe literature and variation of economic effects onpresidential popularity over time and (b) propose
causal models for the economy and approval thatare not strictly incremental.
Explanations offered by existing literature on pre-sidential approval vary significantly. This is true ofstudies focusing on the U.S. as well as those with across-national research design. Lewis-Beck andStegmaier (2013) survey the literature on economicsand elections and identify a number of well-con-firmed connections. Most generally and perhapsmost importantly, they find that the economic votealmost always achieves statistical significance andregisters a strong effect. Moreover, voters appear tobe sociotropic as opposed to egotropic, meaning thatthe weight of the economic vote varies according toinstitutional context because this affects the claritywith which voters perceive an incumbent as respon-sible for current conditions. For example, Geys andVermeir (2008) hypothesize that tax policy shouldhave dual and significant effects insofar as both thelevel and structure of the tax burden will impactupon presidential approval. They determine, basedon data from 1959 through 2006, that presidentialapproval declines in response to increases in boththe deficit and tax burden; moreover, ‘turbulence’ inthe structure of taxation exerts an ‘independent andnegative effect’ (Geys and Vermeir 2008, 314). Theirstudy focuses on one in a wide range of economicvariables at the macro-level that may potentiallyimpact upon presidential popularity. Other macro-economic performance measures typically includeunemployment, inflation, disposable income andeconomic growth.
Fauvelle-Aymar and Stegmaier (2013) take a stepbeyond these popular measures by introducing thestock market index that captures elements of nationaland household economic well-being. Their data analy-sis for 1960–2011 reveals that presidential popularityplummets with a rapid fall in the stock market index,while it soars with a sharp acceleration of indexgrowth. Nadeau and Lewis-Beck (2001, 161) also pro-pose a new indicator of economic conditions – theNational Business Index (NBI). The NBI assesses pub-lic views of business conditions. Both prospective andretrospective views of the NBI feed into presidential
1Representative studies include Mueller (1970, 1973), Stimson (1976), Kernell (1978, 1986, 2007); Norpoth (1984), Edwards and Gallup (1990), Marra, Ostrom,and Simon (1990), Beck (1991), Brace and Hinckley (1992), Clarke and Stewart (1994), Smyth, Dua, and Taylor (1994, 1995, 1999), Stimson, Mackuen, andErikson (1995), Newman (2003), Smyth and Taylor (2003), Clarke et al. (2005), Kelleher and Wolak (2006), Lebo and Cassino (2007), Geys and Vermeir(2008), Kam and Ramos (2008), Olson and Warber (2008), Berlemann and Enkelmann (2012) and Fauvelle-Aymar and Stegmaier (2013).
APPLIED ECONOMICS 4559
Dow
nloa
ded
by [
71.5
7.75
.222
] at
14:
36 0
8 A
ugus
t 201
6

voting, the ‘bottom line’ with regard to approval(Nadeau and Lewis-Beck 2001, 174).
Besides macro policy effects, researchers measurethe micro effects of incumbent personality and indivi-dual voter taste as well. For example, Lebo and Cassino(2007, 740) use data from 1955 to 2005 to assess theeffects of motivated reasoning in relation to partisan-ship. They expect that voters will be motivated todiscount negative performance, in terms of standardmacroeconomic indicators, if a president is from theirpreferred party. In contrast, if a president representsthe opposing party, a voter is more likely to disapproveregardless of macroeconomic conditions.
Kelleher and Wolak (2006), in a study using datafrom 1981 to 2000, explore effects of the media onpresidential approval. They expect that media prim-ing of issues will impact upon the public focusregarding assessment of presidential performance.News stories about the economy and presidentialcharacter are ‘more likely to be primed in assess-ments of presidential popularity, while policy mat-ters, both domestic and international, are less likelyto be emphasized in presidential evaluations becauseof heightened media attention’ (Kelleher and Wolak2006, 208). However, results from their data analysison presidential approval in the context of interna-tional factors are mixed. Kelleher and Wolak define‘internationalism’ in terms of how the president isdoing in an overall sense regarding the various issuesthat make up foreign affairs; their results detect noeffects of internationalism on presidential approval,even when it is interacted with a variable represent-ing the number of foreign policy news stories in agiven period (Kelleher and Wolak 2006, 206).
While focused primarily upon economic condi-tions, this study also incorporates an internationalperspective into the equation for presidentialapproval.2 This is a priority identified by Gronkeand Newman (2003, 508) in their comprehensiveassessment of the research programme on presiden-tial approval.
We already know that international conflict, mostnotably warfare, can have dramatic effects ondomestic politics – for example, leaders who losewars are significantly more likely to be removed
from power than otherwise (Bueno de Mesquita,Siverson, and Woller 1992; Mueller 1994, 76;Bueno de Mesquita and Siverson 1995).3 Consideralso recent findings on the surge and decline ofpresidential popularity in relation to crisis (Kamand Ramos 2008; see also Merolla, Ramos, andZechmeister 2007). Data on rally effects regardingpresidential approval from 2001 and 2002 supportsthe idea that patriotism exerts an important influ-ence. Approval in the period following 9/11 is deter-mined by a high but dissipating level of support forthe president based upon an ‘overarching nationalidentity’; as time goes by, though, partisanship reas-serts its importance (Kam and Ramos 2008, 628).
Behind the rally-around-the-flag effect is the ideaof diversion. Diversionary theory argues that leadersmay resort to international war when domesticsituations are troublesome (Coser 1956; Levy 1989).The goal is to direct public attention away fromproblems at home and towards war with an externalenemy (Mueller 1973; Ostrom and Simon 1985;Brody and Shapiro 1989; Edwards and Gallup 1990;Morgan and Bickers 1992; James and Rioux 1998).External threats could increase internal cohesion andspark nationalism, creating a badly needed rally-around-the-flag effect to boost national leaders’approval ratings. Elites therefore could use strategicdiversions for both political and economic reasons.Traditionally, although not exclusively (see Li,James, and Drury 2009), elites are believed to haveused military conflict or crisis as the main form ofdiversion in the quest for restored popularity.
Problematic, however, is the role of special eventswithin rigorous modelling of presidential approval.‘Mueller’, observe Gronke and Newman (2003, 502),‘was the first, but certainly not the last, to realize thatmeasuring rally events is fraught with difficulty.’Coding schemes, even after decades of research, con-tinue to be controversial with respect to what to des-ignate as a potential rally event (Gronke and Newman2003, 504). In sum, there still is need to further theo-rizing linkage between international factors, notablyexternal shocks, and presidential approval.
Regarding the relation of approval ratings to thepresentation of economic and foreign policy issues
2In the terminology of international relations, this type of connection is referred to as the ‘second image reversed’ – a causal connection from theinternational system into the state (Gourevitch 1978, 882).
3Furthermore, evidence from the U.S. and elsewhere suggests that leaders of democratic states are aware of the political side effects created by foreignpolicy (in)actions (Lamare 1991, 8; Siverson 1995, 484–486; Bennett and Stam 1996, 253; Sprecher and DeRouen, Jr. 2002; Pickering and Kisangani 2006).
4560 S.-W. CHOI ET AL.
Dow
nloa
ded
by [
71.5
7.75
.222
] at
14:
36 0
8 A
ugus
t 201
6
in the media, Edwards, Mitchell, and Welch (1995,111, 119) found that the greater degree of stress themedia puts on a particular issue, the greater itsimpact upon presidential approval ratings. Theyargued that previous studies had wrongly assumeda linear relationship between statistical factors (suchas the unemployment rate) and public reaction tothose factors; they posited that ‘perceptions may notfollow directly from objective indicators of the econ-omy’s performance’ (Edwards, Mitchell, and Welch1995, 113). Their study constituted an effort toaccount for the possibility that issue groups becomemore or less relevant to public opinion over timeand in relation to other issue groups. As Iyengar andKinder (1987) reveal, news (television news in parti-cular) possesses the capacity to affect public opinion,and also presidential approval ratings, by tellingvoters what issues to think about and how to thinkabout them through the methods of priming, fram-ing and agenda-setting. Edwards, Mitchell, andWelch (1995, 113) claim that, although the mediais less capable of affecting how individuals thinkabout issues that are closer to their own experience,it does serve to ‘prime collective perceptions.’ Millerand Krosnick (2000, 302) theorize this mechanismby arguing that viewers who trust their news sourcesnaturally assume that because an issue is being cov-ered, it is of national importance.
However, as Kelleher and Wolak (2006) demon-strate, the media is likely to target voters with storiespertaining to either presidential character or thestate of the economy rather than to present issuesof domestic or international policy. This is likelybecause certain stories represent more easily digested‘news bytes’ in today’s polarized 24-hour cable newsclimate. Although talk of ‘the economy’ and variousrhetorical indicators of its health might be pervasive,sophisticated discussion of structural unemploymentas a condition of the economic system is not.Therefore, when an indicator as straightforwardand powerful as an unemployment statistic crossesa certain threshold, it is likely to be an easy referenceto which media outlets can point in support of aparticular agenda. When an indicator of suchnational significance as an unemployment statisticis brought – seemingly out of nowhere – to publicattention, outrage often is exacerbated by a
generalized ignorance on the matter. Therefore, itseems reasonable to argue that the unemploymentrate has relatively little impact upon presidentialapproval ratings until it becomes visible to the publicas a rhetorical indicator in the media (Kelleher andWolak 2006).
Relatedly, Druckman and Holmes (2004) assertthat the conclusion of their study on presidentialrhetoric ‘raises questions about elite manipulationas opposed to elite enlightenment of public opinion’(774). In general, the findings regarding elite influ-ence on public opinion are somewhat counterintui-tive. One may suppose that the future, beingunknown, would naturally be a political referencepoint for consideration of expert opinions; however,results show that the public relies more on elitecuing in terms of what already lies within experience(Nadeau et al. 1999, 113). This is perhaps the mostvisible controversy in the presidential approval lit-erature: the debate between prospective and retro-spective public opinion formation (Smyth, Dua, andTaylor 1994; Nadeau et al. 1999, 112).
What emerges from the data analysis carried outby Nadeau et al. (1999) is a complex and convincingpicture of what shapes public views of the president.Objective economic conditions, referring to changesin unemployment and inflation, are significantregarding the subsequent level of presidentialapproval. So, too, are dramatic events at both thedomestic and international levels that can generatesubstantial shifts in support for the president. Mostinteresting among the results is the way in whichreflections and expectations of the public are com-bined: statistically significant links with approvalemerge for the public’s prospective views and eliteretrospections (Nadeau et al. 1999, 128; for cross-national results, see Cohen 2004).
Strikingly disparate empirical conclusions in theliterature as a whole seem to indicate that themechanism by which public opinion is translatedinto presidential approval ratings is incrediblycomplex.4 As Berlemann and Enkelmann (2012, 3)indicate, after four decades of systematic study, westill lack a clear picture. They suggest that one expla-nation for this gap might be that, while most analyticmodels have assumed linear relationships betweenvarious explanatory factors and presidential
4This complexity is anticipated and labelled as ‘dynamic representation’ by Stimson, Mackuen, and Erikson (1995).
APPLIED ECONOMICS 4561
Dow
nloa
ded
by [
71.5
7.75
.222
] at
14:
36 0
8 A
ugus
t 201
6

approval, the reality may be quite different. In fact,‘it is far from being clear,’ the authors insist, ‘thateconomic variables have a linear effect on presiden-tial popularity’; furthermore, if ‘the effect of eco-nomic variables on presidential popularity would infact be non-linear, (then) the results of linear estima-tion approaches would heavily depend on the levelof the independent variables’ (2012, 33). It is nowonder then that for all the attention that has beenpaid to this subject, consensus has been difficult toachieve. While their own nonlinear testing provesinconclusive once more, Berlemann and Enkelmann(2012, 38) concede that because their models ‘testedfor very specific types of non-linearities, [they] can-not rule out that the relation between economicvariables and presidential popularity follows a morecomplex non-linear relationship’.
Econometricians have focused increasingly ondeveloping and testing for nonlinearity in relation-ships between economic variables (Chan 1993;Hansen 1997; Enders and Siklos 2001; Hansenand Seo 2002), thereby revealing the potential forapplication in the political domain as well.Moreover, by allowing for nonlinearities in thedata, researchers have uncovered interesting eco-nomic results regarding Gross National Productgrowth, unemployment rate, monetary policy andcapital stock adjustment (Potter 1995; Rothman1998; Bunzel and Enders 2010; Boetel, Hoffman,and Liu 2007). Such results should be intriguing topolitical studies, where modelling is overwhel-mingly linear (i.e. incremental) even in heavilytravelled areas of research. We know that thenumber of existing studies exploring the relation-ship between various factors and presidentialapproval is immense; however, most of these stu-dies assume linearity in the data. Some authors,such as Smyth, Dua, and Taylor (1994, 1995),Edwards, Mitchell, and Welch (1995), Wood(2000, 2009), Smyth and Taylor (2003), McAvoy(2006), Berlemann and Enkelmann (2012) and tosome extent Ostrom and Simon (1985), haveexplored the relationship in a nonlinear setting.As such, our aim is to further delve into nonlinea-rities between economic conditions and presiden-tial approval by implementing the methodology
outlined in Hansen (1997) and Bunzel andEnders (2010).5
To be precise, our emphasis is on nonlinearityunderstood in terms of step-level or thresholdeffects. This is different from use of polynomialexpressions for one or more of the independentvariables in an equation for presidential approval.Our study therefore attempts to move beyond astandard linear approach by introducing a thresholdregression model. This model will allow us to deter-mine whether important tipping points – effectively,hidden steps in the data – will emerge with the shiftfrom a linear to a nonlinear approach. Edwards andGallup (1990) suggest that bad economic news, espe-cially during an economic recession, could becomemore salient to the president’s approval. Cho andYoung (2002), while examining the relationshipbetween inflation and presidential approval, findstrong evidence for asymmetric effects. Higher thanexpected inflation has a clear negative impact onpresidential approval, while lower than expectedinflation only has a negligible impact. These findingssuggest that presidential popularity may react todifferent domestic factors differently, making a non-linear regression model necessary to understand therelationship between approval rate and economicconditions.
The reason we anticipate a threshold effect lies inthe public culture of economic expectations, as theAmerican public expects low structural unemploy-ment. In this regard, when we analyse the effect ofunemployment as one of our key variables, weshould see it produces relatively little effect on publicopinion until it reaches a certain level. At that tip-ping point, it will begin to condition the public’sview of the national economy much more intensely.Further, once the rate of unemployment reaches thethreshold value, we should see that our operationalrenderings of public opinion (e.g. consumer senti-ment) begin to have a noticeably negative effect onpresidential approval. Our modelling, then, attemptsto discover the levels of economic conditions such asunemployment at which the nonlinear relationshipbegins to operate.
What then is the ‘transmission belt’ from eco-nomic conditions to public views of the president?
5For example, Smyth, Dua, and Taylor (1994, 1995) and Smyth and Taylor (2003) develop and test a model in which inflation and unemployment appear assquared terms in the test equation.
4562 S.-W. CHOI ET AL.
Dow
nloa
ded
by [
71.5
7.75
.222
] at
14:
36 0
8 A
ugus
t 201
6

(Choi and James 2007). In a word, it is media.Research noted above reveals the impact of mediacoverage of the economy, with attendant thresholdeffects. Consider the following sports analogy:Peyton Manning throws many touchdown passes,but media coverage explodes when he approachesand then breaks a record. We see the same beha-viour from media in other contexts as well; forinstance, coverage of a given economic indicatorwill expand in quantity and intensity when a keynumber is about to be reached. Exceptions are likelyto be at the margins: (a) just before an election,when the final unemployment and other key indica-tors are salient regardless of what else is going onand (b) if a hyper-visible news story overshadowseven the crossing of a major threshold in economicterms.
The above discussion leads us to draw a hypoth-esis as follows:
Threshold Hypothesis: Effects of economic condi-tions on presidential approval will take a nonlinearform.
The hypothesis is in line with intuition fromKelleher and Wolak (2006) that causal mechanismsregarding presidential approval will be nonlinearrather than purely incremental because of the roleplayed by public consciousness regarding a presi-dent’s economic performance. Significant effects fora given economic indicator can be expected onlyonce a certain level is achieved.6
What economic indicators and which levels arerelevant? This is where the inductive part of thestory, through modelling, comes into play.Candidate indicators include the usual suspectsfrom the existing literature–unemployment, infla-tion and consumer sentiment. However, the ques-tion of which of these will manifest thresholdeffects, and at what levels, will be resolvedthrough modelling and data analysis, as explainedlater.
III. Analysis of a threshold effect of economicconditions on presidential approval
Although previous studies have introduced a varietyof causal factors in their empirical models, ourapproach is to estimate a parsimonious one thatincludes the most common explanatory variables.As such, we include the unemployment rateunemplð Þ, inflation rate inflð Þ as measured by theconsumer price index,7 the University of MichiganConsumer Sentiment index (sent) and the number ofU.S. military personnel killed in action as recordedby the Defense Casualty Analysis System (casÞ.8 (TheNational Archives website (http://aad.archives.gov/)provides a search tool where one is able to obtain amonthly count of U.S. military personnel killed inaction.) As a preliminary analysis on the relationshipbetween each of the four factors and presidentialapproval, we do a visual inspection using time-seriesplots. Figure 1 displays the time series for each ofour independent variables overlaid against presiden-tial approval rates; presidential approval rates aremeasured on the left-hand axis and our independentvariables are measured on the right-hand side. Ascan be seen in Panel A of Figure 1, presidentialapproval rates and unemployment rates display aninverse relationship; however, note that the inverserelationship in Panel A does not appear to be con-stant. Presidential approval rates and inflation inPanel B appear to display an inverse but volatilerelationship in the 1960s and 1970s that significantlyweakens after 1980. Panel C displays the relationshipbetween presidential approval rates and consumersentiment; as can been seen, the two variables dis-play a positive relationship throughout the sampletime period. The relationship between causalitiesand presidential approval rates, as shown in PanelD, is rather opaque. This is due to the high numberof casualties from the Vietnam War in the late 1960sand early 1970s and subsequent fall in the number ofcasualties until the Iraq war. As such, given thenumber of time periods in which there is no change
6The hypothesis also is in line with public opinion literature, covered above, which focuses on presidential approval and supports the idea of asymmetriceffects (e.g. Miller and Krosnick 2000; Druckman and Holmes 2004). In particular, data on economic indicators can be expected to interact with mediacoverage to produce asymmetry with regard to impact on presidential approval (Iyengar and Kinder 1987; see also Soroka 2006 on Great Britain).
7Inflation in each quarter is defined as Inflationt = 100 × (log(CPIt)–log(CPIt−4)), which is standard practice in the macroeconomic literature. Moreover, nearlyall news organizations report inflation rates in the above mentioned form.
8This research design will incorporate casualties, as opposed to rally events, the other prominent international option. This is because serious questionscontinue to be raised about assessment of such events. Gronke and Newman (2003, 509, note 21) compare the two leading coding schemes and reportsome unsettling numbers: (a) 122 and 98 events are identified, respectively; (b) only 42 events appear on both lists and (c) 17 of the 42 commonlyidentified events are listed for different months.
APPLIED ECONOMICS 4563
Dow
nloa
ded
by [
71.5
7.75
.222
] at
14:
36 0
8 A
ugus
t 201
6
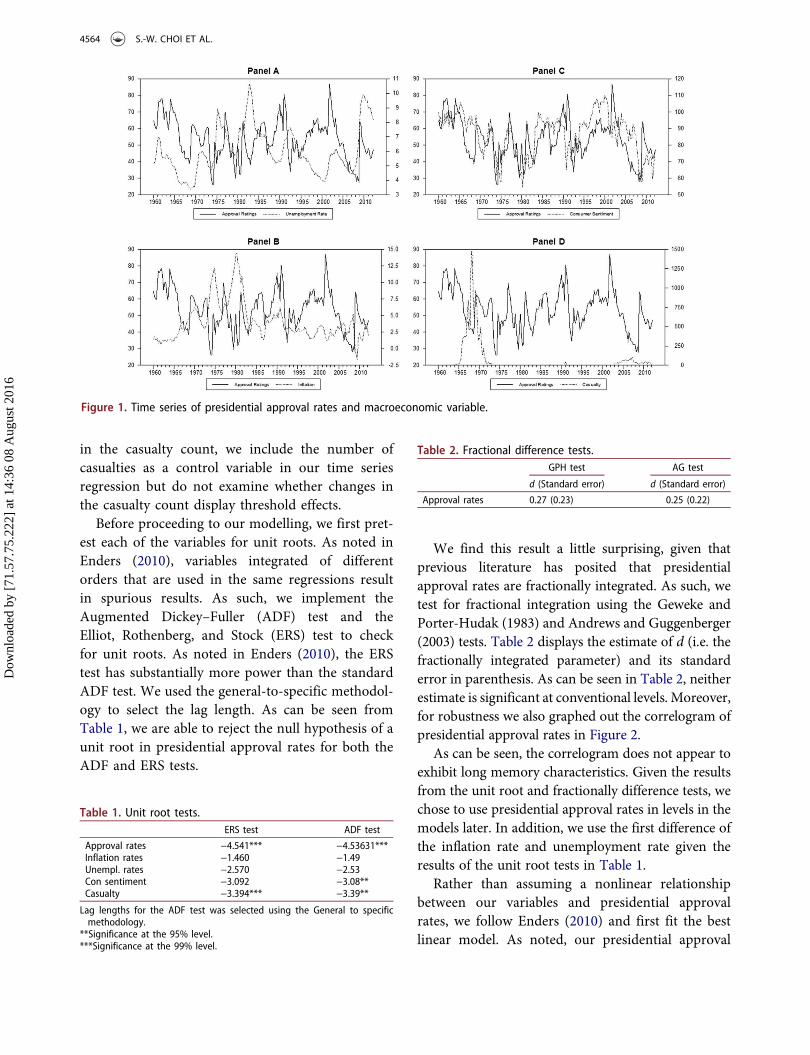
in the casualty count, we include the number ofcasualties as a control variable in our time seriesregression but do not examine whether changes inthe casualty count display threshold effects.
Before proceeding to our modelling, we first pret-est each of the variables for unit roots. As noted inEnders (2010), variables integrated of differentorders that are used in the same regressions resultin spurious results. As such, we implement theAugmented Dickey–Fuller (ADF) test and theElliot, Rothenberg, and Stock (ERS) test to checkfor unit roots. As noted in Enders (2010), the ERStest has substantially more power than the standardADF test. We used the general-to-specific methodol-ogy to select the lag length. As can be seen fromTable 1, we are able to reject the null hypothesis of aunit root in presidential approval rates for both theADF and ERS tests.
We find this result a little surprising, given thatprevious literature has posited that presidentialapproval rates are fractionally integrated. As such, wetest for fractional integration using the Geweke andPorter-Hudak (1983) and Andrews and Guggenberger(2003) tests. Table 2 displays the estimate of d (i.e. thefractionally integrated parameter) and its standarderror in parenthesis. As can be seen in Table 2, neitherestimate is significant at conventional levels. Moreover,for robustness we also graphed out the correlogram ofpresidential approval rates in Figure 2.
As can be seen, the correlogram does not appear toexhibit long memory characteristics. Given the resultsfrom the unit root and fractionally difference tests, wechose to use presidential approval rates in levels in themodels later. In addition, we use the first difference ofthe inflation rate and unemployment rate given theresults of the unit root tests in Table 1.
Rather than assuming a nonlinear relationshipbetween our variables and presidential approvalrates, we follow Enders (2010) and first fit the bestlinear model. As noted, our presidential approval
Table 1. Unit root tests.ERS test ADF test
Approval rates −4.541*** −4.53631***Inflation rates −1.460 −1.49Unempl. rates −2.570 −2.53Con sentiment −3.092 −3.08**Casualty −3.394*** −3.39**
Lag lengths for the ADF test was selected using the General to specificmethodology.
**Significance at the 95% level.***Significance at the 99% level.
Figure 1. Time series of presidential approval rates and macroeconomic variable.
Table 2. Fractional difference tests.GPH test AG test
d (Standard error) d (Standard error)
Approval rates 0.27 (0.23) 0.25 (0.22)
4564 S.-W. CHOI ET AL.
Dow
nloa
ded
by [
71.5
7.75
.222
] at
14:
36 0
8 A
ugus
t 201
6

model is parsimonious because it relies on the mostcommon explanatory variables. Moreover, the factthat we are estimating a time-series, rather than across-sectional model, does justice to the use of themost parsimonious model. Thus, we begin by esti-mating the following model9:
appt ¼ �a0 þXpi¼1
�aiappt�i þXpi¼0
γiΔunemplt�i
þXpi¼0
λiΔinflt�i þXpi¼0
�isentt�i
þXpi¼0
πicast�i þ εt (1)
where app is the presidential approval rate,Δunempl is the change in the unemploymentrate, Δinfl is the change in the inflation rate asmeasured by the consumer price index, sent is theUniversity of Michigan Consumer Sentiment indexand cas is the number of U.S. military personalkilled in action as recorded by the DefenseCasualty Analysis System.10 In order to select thelag length p, we used two criteria. First, weselected the lag length to ensure that our residualsdid not show serial correlation as measured byLjung–Box Q-statistics; second, we chose the laglength that minimized the AIC and BIC. We beganby allowing for lag length of eight and we pareddown the model as described in Enders (2010).Table 3 displays the results from the best fittingmodel.
As can be seen, the best fitting model includedtwo lags of presidential approval rates, two lags ofchanges in the unemployment rate, two lags ofchanges in inflation and two lags of consumersentiment.11 Note that all of the Ljung–Box Qstatistics are insignificant at all conventional levelsand the Durbin Watson statistic is 1.9958, both ofwhich suggest that the model is well specified.
0 Differences of APP
0 5 10 15 20 25–1.00
–0.75
–0.50
–0.25
0.00
0.25
0.50
0.75
1.00
CORRSPARTIALS
Figure 2. Correlogram of presidential approval rates.
Table 3. Panel A: coefficient estimates of Equation (1), panel B:tests for serial correlation, panel C: tests for nonlinearity.Panel A
Variable Coefficients Standard error
Constant −1.98 3.64appt�1 0.91 0.07appt�2 −0.15 0.07Δunemplt 3.80 1.82Δunemplt�1 −2.32 2.10Δunemplt�2 2.08 1.89Δinft −0.49 0.65Δinft�1 −1.46 0.67Δinft�2 1.01 0.63Con sentt 0.28 0.09Con sentt�1 −0.19 0.11Con sentt�2 0.07 0.09Durbin Watson statistic 1.9958AIC 1342.80BIC 1382.85
Panel B
Residuals (lags) Q-statistic p-Value
4 2.02 0.728 4.14 0.8412 5.29 0.9416 11.89 0.7920 16.45 0.68
Panel C
Test F-statistic
Ramsey RESET (h = 3) 3.37 0.03Ramsey RESET (h = 4) 2.23 0.08Teräsvirta (1994) 3.82 0.01
9For robustness, we also included a dummy variable to control for presidential elections. However, it did not qualitatively change our results. Those resultsmay be obtained upon request from the authors.
10While one could estimate a VAR with the above variables, we opted for a single equation given that we do not believe that presidential approval rates hasan effect on the macroeconomic variables in Equation 1.
11Note that the casualty series was completely pared out of the model. None of the casualty coefficients were significant at conventional levels.
APPLIED ECONOMICS 4565
Dow
nloa
ded
by [
71.5
7.75
.222
] at
14:
36 0
8 A
ugus
t 201
6
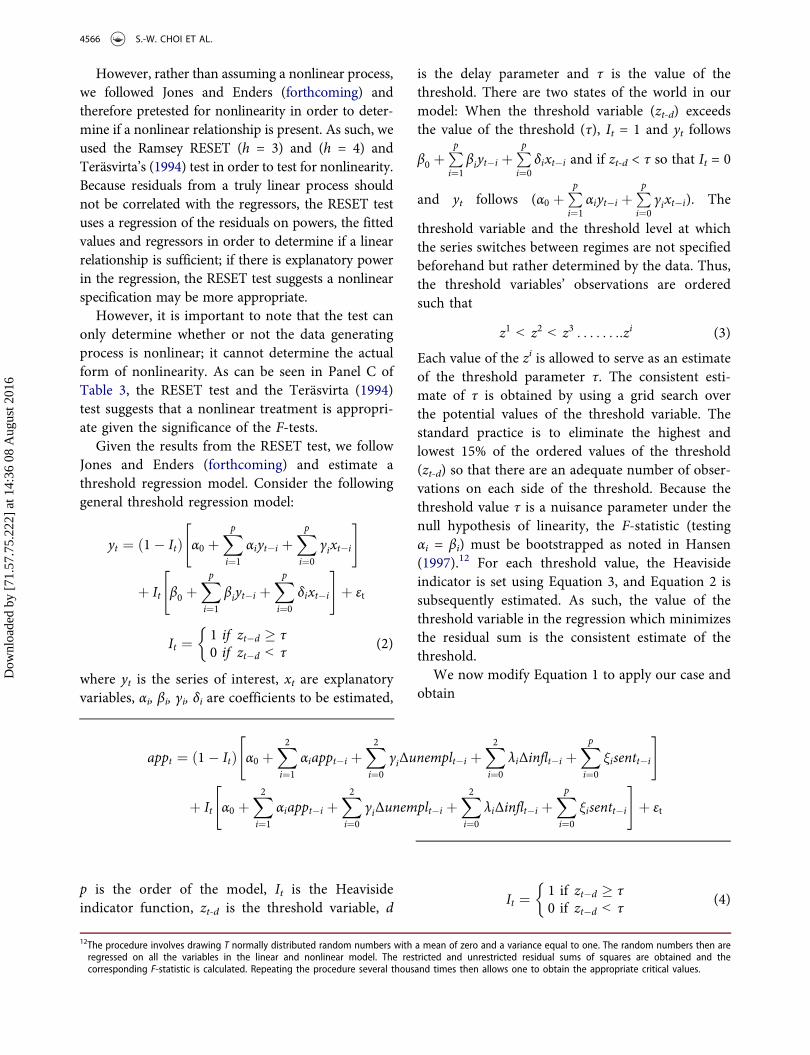
However, rather than assuming a nonlinear process,we followed Jones and Enders (forthcoming) andtherefore pretested for nonlinearity in order to deter-mine if a nonlinear relationship is present. As such, weused the Ramsey RESET (h = 3) and (h = 4) andTeräsvirta’s (1994) test in order to test for nonlinearity.Because residuals from a truly linear process shouldnot be correlated with the regressors, the RESET testuses a regression of the residuals on powers, the fittedvalues and regressors in order to determine if a linearrelationship is sufficient; if there is explanatory powerin the regression, the RESET test suggests a nonlinearspecification may be more appropriate.
However, it is important to note that the test canonly determine whether or not the data generatingprocess is nonlinear; it cannot determine the actualform of nonlinearity. As can be seen in Panel C ofTable 3, the RESET test and the Teräsvirta (1994)test suggests that a nonlinear treatment is appropri-ate given the significance of the F-tests.
Given the results from the RESET test, we followJones and Enders (forthcoming) and estimate athreshold regression model. Consider the followinggeneral threshold regression model:
yt ¼ 1� Itð Þ α0 þXpi¼1
αiyt�i þXpi¼0
γixt�i
" #
þ It β0 þXpi¼1
βiyt�i þXpi¼0
δixt�i
" #þ εt
It ¼ 1 if zt�d � τ0 if zt�d < τ
�(2)
where yt is the series of interest, xt are explanatoryvariables, αi, βi, γi, δi are coefficients to be estimated,
p is the order of the model, It is the Heavisideindicator function, zt-d is the threshold variable, d
is the delay parameter and τ is the value of thethreshold. There are two states of the world in ourmodel: When the threshold variable (zt-d) exceedsthe value of the threshold (τ), It = 1 and yt follows
β0 þPpi¼1
βiyt�i þPpi¼0
δixt�i and if zt-d < τ so that It = 0
and yt follows (α0 þPpi¼1
αiyt�i þPpi¼0
γixt�i). The
threshold variable and the threshold level at whichthe series switches between regimes are not specifiedbeforehand but rather determined by the data. Thus,the threshold variables’ observations are orderedsuch that
z1 < z2 < z3 . . . . . . ::zi (3)
Each value of the zi is allowed to serve as an estimateof the threshold parameter τ. The consistent esti-mate of τ is obtained by using a grid search overthe potential values of the threshold variable. Thestandard practice is to eliminate the highest andlowest 15% of the ordered values of the threshold(zt-d) so that there are an adequate number of obser-vations on each side of the threshold. Because thethreshold value τ is a nuisance parameter under thenull hypothesis of linearity, the F-statistic (testingαi = βi) must be bootstrapped as noted in Hansen(1997).12 For each threshold value, the Heavisideindicator is set using Equation 3, and Equation 2 issubsequently estimated. As such, the value of thethreshold variable in the regression which minimizesthe residual sum is the consistent estimate of thethreshold.
We now modify Equation 1 to apply our case andobtain
It ¼ 1 if zt�d � τ0 if zt�d < τ
�(4)
appt ¼ 1� Itð Þ α0 þX2i¼1
αiappt�i þX2i¼0
γiΔunemplt�i þX2i¼0
λiΔinflt�i þXpi¼0
�isentt�i
" #
þ It α0 þX2i¼1
αiappt�i þX2i¼0
γiΔunemplt�i þX2i¼0
λiΔinflt�i þXpi¼0
�isentt�i
" #þ εt
12The procedure involves drawing T normally distributed random numbers with a mean of zero and a variance equal to one. The random numbers then areregressed on all the variables in the linear and nonlinear model. The restricted and unrestricted residual sums of squares are obtained and thecorresponding F-statistic is calculated. Repeating the procedure several thousand times then allows one to obtain the appropriate critical values.
4566 S.-W. CHOI ET AL.
Dow
nloa
ded
by [
71.5
7.75
.222
] at
14:
36 0
8 A
ugus
t 201
6

As the first step, we test five indicators as potentialthreshold variables: unemployment rate, inflation rate,GDP growth, consumer sentiment and one lag of pre-sidential approval rates.13 The results are displayed inTable 4.
As can be seen, the unemployment rate, inflation rateand consumer sentiment are statistically significant atthe 0.001 level and presidential approval at the 0.05 level,while GDP growth rate is not. The estimated thresholdusing the unemployment rate was approximately 7%;that using the inflation rate was 5.6%; that using con-sumer sentiment was 72.1% and that using presidentialapproval was 48.93%. These estimated thresholds seemplausible. However, because the BIC statistic for theunemployment rate was the lowest, we chose to usethe unemployment rate as the threshold variable.
Table 5 displays the estimates from estimatingEquation 4. Note in Panel B of Table 5 that bothAIC and BIC suggest that the nonlinear model is abetter fit than the linear one.
As such, we believe that Equation 4 is a reason-able specification. In order to understand the
dynamics of Equation 4, we follow Jones andEnders (forthcoming) and use generalized impulseresponse functions. Koop, Pesaran, and Potter(1996) build a framework for generating impulseresponses from nonlinear models (see also Romerand Romer 2010). Traditional impulse responsefunctions possess the property that a positive andnegative shock have symmetric effects on the vari-able of interest as well as a linearity property in thescale of the shocks (i.e. a shock of size 1 will havetwice the effect on the variable of interest as a shockof size 0.5). In order to estimate the generalizedimpulse responses, we use standard Monte Carlotechniques and run 10,000 replications in order togenerate the impulse responses as well as the con-fidence intervals. Figures 3–5 display the generalizedimpulse responses along with one standard deviationbands.
As can be seen in Figure 3, a one percentageincrease in the change of the unemployment ratehas a statistically significant and positive effect onpresidential approval rates in the low unemploymentregime.14 Note that the contemporaneous effect onpresidential approval rates is approximately a posi-tive 7.15 bump in presidential approval ratings. Theeffect slightly increases two quarters after the shockbut dissipates over the subsequent ten quarters.Surprisingly, positive shocks to changes in theunemployment rate have no statistically significanteffect in the high unemployment rate regime.
Figure 4 displays the generalized impulseresponses from a one percentage increase in thechange of the inflation rate. Again, note that theeffects of inflation are different in the high and lowunemployment rate regimes. In the low unemploy-ment rate regime, a one percentage change has nocontemporaneous effect on presidential approvalrates. However, note that two quarters after theshock, the inflation shock is statistically significantwith presidential approval rates approximately 1.5percentage points higher after the inflation shock.Note that the effect of the shock gradually dissipatesin the subsequent quarters but remains statisticallydifferent from zero. In the high unemploymentregime, the results are substantially different. Notethat in the high unemployment rate regime, a
Table 4. Threshold estimates. τ is the threshold value.Threshold variable τ F-test Significance BIC
Unemployment rate 7.06 3.69 0.001 614.76Inflation rate 5.60 5.31 0.001 639.46GDP growth rate 0.69 1.14 0.510 637.90Consumer sentiment 72.1 4.21 0.001 643.09Presidential approvalt-1 48.93 2.78 0.023 676.72
Table 5. Model estimates from estimating Equation (4) usingthe unemployment rate as the threshold variable.Panel A: dependent variable: presidential approval rates
Regime 1: Unemploymentrate <7.06
Observations: 153
Regime 2:Unemployment rate >7.06
Observations: 53
Variable Coefficients (standard error) Coefficients (standard error)
Constant −6.77 (4.49) 5.08 (7.32)appt�1 0.87 (0.09) 0.65 (0.111)appt�2 −0.007 (0.09) −0.409 (0.113)Δunemplt 7.18 (2.76) 1.723 (2.917)Δunemplt�1 1.18 (2.85) −1.026 (2.67)Δunemplt�2 1.30 (2.95) 3.496 (2.058)Δinft −0.036 (0.99) 0.070 (0.978)Δinft�1 0.315 (0.97) −1.792 (1.403)Δinft�2 1.08 (0.92) 0.305 (0.949)Con sentt 0.388 (0.113) 0.056 (0.151)Con sentt�1 −0.138 (0.176) −0.10 (0.15)Con sentt�2 −0.091 (0.137) 0.45 (0.177)
Panel B
AIC 607.29BIC 614.76
13GDP growth rate is included as another robustness test for potential threshold factors.14Impulse responses were re-estimated excluding the first two quarters of 2009 (e.g. Obama taking office) and the quarters associated with 9/11. However,exclusion of those dates did not substantively change our results.
APPLIED ECONOMICS 4567
Dow
nloa
ded
by [
71.5
7.75
.222
] at
14:
36 0
8 A
ugus
t 201
6

positive shock to the change in the inflation rate hasa statistically significant negative effect of −1.5 onpresidential approval rates one quarter after theshock. The effect remains negative until approxi-mately three quarters after the shock.
Figure 5 displays the generalized impulseresponses from a positive shock in consumer senti-ment. Note again that the effects are different in thelow and high unemployment rate regimes. In the
low unemployment regime, a positive shock in con-sumer sentiment has a contemporaneous positive(0.4) statistically significant effect on presidentialapproval rates. The effect of the positive shock dis-sipates quickly and is approximately 0.08, two quar-ters after the shock. On the other hand, in the highunemployment rate regime, a positive shock to con-sumer sentiment has no contemporaneous effect onpresidential approval rates. Note that the positive
Low Unemployment Rate Regime(Unempl < 7.06)
HighUnemployment Rate Regime (Unempl > 7.06)
Presidential Approval Rates
0 1 2 3 4 5 6 7 8 9 10 11–1.0
–0.5
0.0
0.5
1.0
1.5
2.0
2.5
3.0Presidential Approval Rates
0 1 2 3 4 5 6 7 8 9 10 11–3.0–2.5–2.0–1.5–1.0–0.50.00.51.01.5
Figure 4. Responses to inflation shock.
Low Unemployment Rate Regime(Unempl < 7.06)
High Unemployment Rate Regime (Unempl>7.06)
Presidential Approval Rates
0 1 2 3 4 5 6 7 8 9 10 110.0
0.1
0.2
0.3
0.4
0.5Presidential Approval Rates
0 1 2 3 4 5 6 7 8 9 10 11–0.3–0.2–0.10.00.10.20.30.40.50.6
Figure 5. Responses to consumer sentiment shock.
Low Unemployment Rate Regime (Unempl < 7.06)
High Unemployment Rate Regime(Unempl > 7.06)
Presidential Approval Rates
0 1 2 3 4 5 6 7 8 9 10 110
2
4
6
8
10
12Presidential Approval Rates
0 1 2 3 4 5 6 7 8 9 10 11–3
–2
–1
0
1
2
3
4
5
6
Figure 3. Responses to unemployment shock.
4568 S.-W. CHOI ET AL.
Dow
nloa
ded
by [
71.5
7.75
.222
] at
14:
36 0
8 A
ugus
t 201
6

effect on presidential approval rates occurs betweenthe first and second quarters after the shock. Thus,in the high unemployment rate regime, a positiveshock to consumer sentiment features a delay inpositively affecting presidential approval rates.
IV. Conclusion
Existing literature generally postulates and tests for alinear relationship between economic conditions andpresidential popularity. However, we have arguedthat nonlinearity can provide a better understandingof the effect of economic conditions on presidentialstanding. Our data analysis supports the ThresholdHypothesis. Our threshold regression model showsstrong supporting evidence: when unemploymentrises to a specific level, it matters far more thanotherwise in impacting upon presidential popularity.Consumer sentiment shows a consistent but limitedassociation with presidential approval, while infla-tion does not. Analysis based on generalized impulseresponses for unemployment, inflation and consu-mer sentiment provide further support to theThreshold Hypothesis. Changes in these indicatorsimpact differently upon presidential approvaldepending on whether we examine a high or lowunemployment regime. In sum, the political economyof presidential approval contains an essentially non-linear element.
What about implications for the real world ofpolitics? From the standpoint of political strategyand tactics, the results here suggest that a presidentin search of approval should not devote resources tothe control of inflation. Instead, the focus should beon unemployment, with the proviso that the U.S. asan economic culture converges on 7%, for whateverreason, as a point of activation for unemployment asa driver of politics. Thus, the strategic point thatemerges is straightforward: take vigorous action toreduce unemployment once it hits 7%. This advice,of course, leaves aside the greater question ofwhether such a decision rule is consistent withsound economic policy. But the force of politicscan be compelling when it comes to policy, so allof this becomes quite relevant to what might interesta president in the real world.
One further thought, of a more encompassingnature, concerns the relevance of the results here tothe comparative literature on government approval
and economic voting (Lewis-Beck and Stegmaier2013; Stegmaier and Lewis-Beck 2013). The findingsabout presidential approval support the propositionthat the national economy is a continuously impor-tant public concern, and reveal a U.S.-based causalmechanism that is sustained for presidential politicsover a number of decades. The results are also in linewith the logic of Kelleher and Wolak (2006) regard-ing the step-level nature of impact to be anticipatedfor a given indicator in relation to presidentialapproval.
The lack of performance for the casualty variableis in line with previous findings about public opi-nion and U.S. involvement in conflict (e.g. Feaverand Gelpi 2004). This finding makes us ponder thepotential for politically motivated use of force. Apresident could be tempted, especially during atime of high unemployment, to divert public opinionfrom problems at home through involvement ininternational conflict. This possibility becomesmost interesting when considering the recent periodof relatively high unemployment – in the model’sterms, over 7% for a very long time – and anynumber of challenging developments abroad. Inother words, high unemployment, coupled withdeclining approval and perhaps some awarenessafter Iraq that the public is more tolerant of casual-ties than otherwise might have been believed, createsvery worrisome conditions regarding presidentialpropensity towards use of force in order to recoverpolitical standing at home.
Many avenues open up as a result of theresearch conducted here. Additional variablesfrom the political world, such as party identifica-tion, could be built into an elaborated model.Consider also the possibility of taking into accountthe recent context of the level of employment (orother indicators). A given number could be com-pared to the prior four quarters; for example, avalue such as 7% for unemployment might bemore or less acceptable depending on whether inthe previous year it had rested several pointshigher, lower or at about the same level. Withregard to extension of this work on the economicside, consider just one possibility – effects on pre-sidential popularity from local versus national con-ditions. It could be revealing to carry out acomparison of the model from this study with aseries of nonlinear specifications. Consider, in
APPLIED ECONOMICS 4569
Dow
nloa
ded
by [
71.5
7.75
.222
] at
14:
36 0
8 A
ugus
t 201
6

addition, a different type of asymmetry: amongpartisans. Is there greater impact among thosewho consume news programming that is morelikely to report bad news at or around a threshold,i.e. MSNBC/Fox News viewers for Republican/Democratic Presidents? This awaits investigation.
Cross-national assessment of the model alsodeserves consideration. Does it work the same wayin presidential systems other than the U.S.? Whatabout an extension to parliamentary systems? Allthings considered, the theorizing and results of thisinvestigation encourage further research on presi-dential approval in terms of pocketbook votingexpressed through any number of substantive andfunctional forms.
Acknowledgements
We are grateful to the editor, two annoymous referee, TobiasGibson, Morris Levy, Diana O’Brien, Jennifer Ramos, MackC. Shelley, Wayne Steger and Mary A. Stegmaier for helpfulcommentaries.
Disclosure statement
No potential conflict of interest was reported by the authors.
References
Andrews, D. W. K., and P. Guggenberger. 2003. “A Bias-Reduced Log-Periodogram Regression Estimator for theLong-Memory Parameter.” Econometrica 71 (2): 675–712.
Beck, N. 1991. “Comparing Dynamic Specifications: TheCase of Presidential Approval.” Political Analysis 3: 51–87. doi:10.1093/pan/3.1.51.
Bennett, D. S., and A. C. Stam III. 1996. “The Duration ofInterstate Wars, 1816-1985.” American Political ScienceReview 90: 239–257. doi:10.2307/2082882.
Berlemann, M., and S. Enkelmann. 2012. “The EconomicDeterminants of U.S. Presidential Approval.” CESIFOWorking Paper No. 3761. http://ideas.repec.org/p/ces/ceswps/_3761.html.
Boetel, B. L., R. Hoffman, and D. J. Liu. 2007. “EstimatingInvestment Rigidity within a Threshold RegressionFramework: The Case of U.S. Hog Production Sector.”American Journal of Agricultural Economics 89: 36–51.doi:10.1111/j.1467-8276.2007.00961.x.
Brace, P., and B. Hinckley. 1992. Follow the Leader. NewYork: Basic Books.
Brody, R. A., and C. R. Shapiro. 1989. “AReconsideration of theRally Phenomenon in Public Opinion.” In Political BehaviorAnnual, edited by S. Long Boulder, CO: Westview Press.
Bueno de Mesquita, B., and R. M. Siverson. 1995. “War andthe Survival of Political Leaders.” American PoliticalScience Review 89: 498–512.
Bueno de Mesquita, B., R. M. Siverson, and G. Woller. 1992.“War and the Fate of Regimes: A Comparative Analysis.”The American Political Science Review 86: 638–646.doi:10.2307/1964127.
Bunzel, H., and W. Enders. 2010. “The Taylor Rule and‘Opportunistic’ Monetary Policy.” Journal of Money,Credit, and Banking 42: 931–949. doi:10.1111/j.1538-4616.2010.00313.x.
Chan, K. S. 1993. “Consistency and Limiting Distribution ofthe Least Squares Estimator of a Threshold AutoregressiveModel.” The Annals of Statistics 21: 520–533. doi:10.1214/aos/1176349040.
Cho, S., and G. Young. 2002. “The Asymmetric Impact ofInflation on Presidential Approval.” Politics & Policy 30:401–430. doi:10.1111/polp.2002.30.issue-3.
Choi, S. C., and P. James. 2007. “Media Openness,Democracy, and Militarized Interstate Disputes.” BritishJournal of Political Science 37: 23–46. doi:10.1017/S0007123407000026.
Clarke, H. D., M. C. Stewart, M. Ault, and E. Elliott. 2005.“Men, Women, and the Dynamics of PresidentialApproval.” British Journal of Political Science 35: 31–51.doi:10.1017/S0007123405000025.
Clarke, H. D., and M. C. Stewart. 1994. “Prospections,Retrospections, and Rationality: The ‘Bankers’ Model ofPresidential Approval Reconsidered.” American Journal ofPolitical Science 38: 1104–1123. doi:10.2307/2111734.
Cohen, J. E. 2004. “Economic Perceptions and ExecutiveApproval in Comparative Perspective.” Political Behavior26: 27–43. doi:10.1023/B:POBE.0000022342.58335.cd.
Coser, L. A. 1956. The Functions of Social Conflict. New York:Free Press.
DeRouen, K. R., Jr. 2000. “Presidents and the DiversionaryUse of Force: A Research Note.” International StudiesQuarterly 44: 317–328.
Druckman, J. N., and J. W. Holmes. 2004. “Does PresidentialRhetoric Matter? Priming and Presidential Approval.”Presidential Studies Quarterly 34: 755–778. doi:10.1111/psq.2004.34.issue-4.
Edwards, G. C. 2004. “GeorgeW. Bush’s Strategic Presidency.” InNew Challenges for the American Presidency, edited by G. C.Edwards III and P. J. Davies. New York: Pearson Longman.
Edwards, G. C., III. 2009. “Presidential Approval as aSource of Influence in Congress.” In The OxfordHandbook of the American Presidency, edited by G. C.Edwards III and W. G. Howell, 338–361. New York:Oxford University Press.
Edwards, G. C., III., and A. M. Gallup. 1990. PresidentialApproval: A Sourcebook. Baltimore, MD: The JohnsHopkins University Press.
Edwards, G. C., III, W. Mitchell, and R. Welch. 1995.“Explaining Presidential Approval: The Significance ofIssue Salience.” American Journal of Political Science 39:108–134. doi:10.2307/2111760.
4570 S.-W. CHOI ET AL.
Dow
nloa
ded
by [
71.5
7.75
.222
] at
14:
36 0
8 A
ugus
t 201
6

Enders, W. 2010. Applied Econometric Time Series. NewYork: John Wiley and Sons, Inc.
Enders, W., and P. L. Siklos. 2001. “Cointegration andThreshold Adjustment.” Journal of Business &Economic Statistics 19: 166–176. doi:10.1198/073500101316970395.
Fauvelle-Aymar, C., and M. Stegmaier. 2013. “The StockMarket and U.S. Presidential Approval.” Electoral Studies32: 411–417. doi:10.1016/j.electstud.2013.05.024.
Feaver, P. D., and C. Gelpi. 2004. Choosing Your Battles.Princeton, NJ: Princeton University Press.
Geweke, J., and S. Porter-Hudak. 1983. “The Estimation andApplication of Long Memory Time Series Models.”Journal of Time Series Analysis 4 (4): 221–238.
Geys, B., and J. Vermeir. 2008. “Taxation and PresidentialApproval: Separate Effects from Tax Burden and TaxStructure Turbulence?” Public Choice 135: 301–317.doi:10.1007/s11127-007-9264-8.
Gourevitch, P. 1978. “The Second Image Reversed: TheInternational Sources of Domestic Politics.” InternationalOrganization 32: 881–911. doi:10.1017/S002081830003201X.
Gronke, P., and B. Newman. 2003. “FDR to Clinton, Muellerto ?: A Field Essay on Presidential Approval.” PoliticalResearch Quarterly 56: 501–512.
Hansen, B. E., and B. Seo. 2002. “Testing for Two-RegimeThreshold Cointegration in Vector Error-CorrectionModels.” Journal of Econometrics 110: 293–318.doi:10.1016/S0304-4076(02)00097-0.
Hansen, B. 1997. “Inference in TAR Models.” Studies inNonlinear Dynamics and Econometrics 64: 413–430.
Iyengar, S., and D. R. Kinder. 1987. News that Matters.Chicago, IL: University of Chicago Press.
James, P., and J. R. Oneal. 1991. “The Influence of Domesticand International Politics on the President’s Use of Force.”Journal of Conflict Resolution 35: 307–332. doi:10.1177/0022002791035002008.
James, P., and J.-S. Rioux. 1998. “International Crises andLinkage Politics: The Experiences of the United States,1953–1994.” Political Research Quarterly 51: 781–812.doi:10.1177/106591299805100311.
Jones, P., and W. Enders. Forthcoming. “The AsymmetricEffects of Uncertainty on Macroeconomic Activity.”Macroeconomic Dynamics 1–28.
Kam, C. D., and J. M. Ramos. 2008. “Joining and Leaving theRally: Understanding the Surge and Decline inPresidential Approval Following 9/11.” Public OpinionQuarterly 72: 619–650. doi:10.1093/poq/nfn055.
Kelleher, C. A., and J. Wolak. 2006. “Priming PresidentialApproval: The Conditionality of Issue Effects.” PoliticalBehavior 28: 193–210. doi:10.1007/s11109-006-9011-8.
Kernell, S. 1978. “Explaining Presidential Popularity. HowAd Hoc Theorizing, Misplaced Emphasis, and InsufficientCare in Measuring One’s Variables Refuted CommonSense and Led Conventional Wisdom Down the Path ofAnomalies.” The American Political Science Review 72:506–522. doi:10.2307/1954107.
Kernell, S. 1986. Going Public. Washington, DC:Congressional Quarterly, Inc.
Kernell, S. 2007. Going Public: New Strategies of PresidentialLeadership. 4th ed. Washington, DC: CQ Press.
Koop, G., M. H. Pesaran, and S. M. Potter. 1996. “ImpulseResponse Analysis in Nonlinear Multivariate Models.”Journal of Econometrics 74: 119–147. doi:10.1016/0304-4076(95)01753-4.
Lamare, J. W. 1991. “International Intervention and PublicSupport.” In International Crisis and Domestic Politics,edited by J. W. Lamare. New York: Praeger.
Lebo, M. J., and D. Cassino. 2007. “The AggregatedConsequences of Motivated Reasoning and the Dynamicsof Partisan Presidential Approval.” Political Psychology 28:719–746. doi:10.1111/j.1467-9221.2007.00601.x.
Levy, J. S. 1989. “The Diversionary Theory of War.” InHandbook of War Studies, edited by M. I. Midlarsky.Boston, MA: Unwin Hyman.
Lewis-Beck, M. S., and M. Stegmaier. 2013. “The Vp-Function Revisited: A Survey of the Literature on Voteand Popularity Functions after over 40 Years.” PublicChoice 157: 367–385. doi:10.1007/s11127-013-0086-6.
Li, Y., P. James, and A. C. Drury. 2009. “DiversionaryDragons, Or, ‘Talking Tough in Taipei’.” Journal of EastAsian Studies 9: 369–398.
Marra, R., C. Ostrom, and D. Simon. 1990. “Foreign Policyand Presidential Popularity: Creating Windows ofOpportunity in the Perpetual Election.” Journal of ConflictResolution 34: 588–623. doi:10.1177/0022002790034004002.
McAvoy, G. E. 2006. “Stability and Change: The TimeVarying Impact of Economic and Foreign PolicyEvaluations on Presidential Approval.” PoliticalResearch Quarterly 59: 71–83. doi:10.1177/106591290605900107.
Merolla, J. L., J. M. Ramos, and E. J. Zechmeister. 2007.“Crisis, Charisma, and Consequences: Evidence from the2004 U.S. Presidential Election.” The Journal of Politics 69:30–42. doi:10.1111/j.1468-2508.2007.00492.x.
Miller, J. M., and J. A. Krosnick. 2000. “News Media Impacton the Ingredients of Presidential Evaluations: PoliticallyKnowledgeable Citizens Are Guided by a Trusted Source.”American Journal of Political Science 44: 301–315.doi:10.2307/2669312.
Morgan, T. C., and K. N. Bickers. 1992. “Domestic Discontentand the External Use of Force.” Journal of ConflictResolution 36: 25–52. doi:10.1177/0022002792036001002.
Mueller, J. E. 1970. “Presidential Popularity from Truman toJohnson.” The American Political Science Review 64: 18–34. doi:10.2307/1955610.
Mueller, J. E. 1973.War, Presidents, and Public Opinion. NewYork: Willey.
Mueller, J. E. 1994. Policy and Opinion in the Gulf War.Chicago, IL: University of Chicago Press.
Nadeau, R., and M. S. Lewis-Beck. 2001. “National EconomicVoting in U.S. Presidential Elections.” The Journal ofPolitics 63: 159–181. doi:10.1111/0022-3816.00063.
APPLIED ECONOMICS 4571
Dow
nloa
ded
by [
71.5
7.75
.222
] at
14:
36 0
8 A
ugus
t 201
6

Nadeau, R., R. G. Niemi, D. P. Fan, and T. Amato. 1999.“Elite Economic Forecasts, Economic News, MassEconomic Judgments, and Presidential Approval.”Journal of Politics 61: 109–135. doi:10.2307/2647777.
Neustadt, R. E. 1990 [1960]. Presidential Power and theModern Presidents. New York: The Free Press.
Newman, B. 2003. “Integrity and Presidential Approval,1980–2000.” Public Opinion Quarterly 67: 335–367.doi:10.1086/377242.
Norpoth, H. 1984. “Economics, Politics and the Cycle ofPresidential Popularity.” In Economic Conditions andElectoral Outcomes, edited by H. Eulau and M. S. Lewis-Beck, 167–186. New York: Agathon Press, Inc.
Olson, L. R., and A. L. Warber. 2008. “Belonging, Behaving,and Believing: Assessing the Role of Religion onPresidential Approval.” Political Research Quarterly 61:192–204. doi:10.1177/1065912907313075.
Ostrom, C. W., and D. M. Simon. 1985. “Promise andPerformance: A Dynamic Model of PresidentialPopularity.” The American Political Science Review 79:334–338. doi:10.2307/1956653.
Pickering, J., and E. F. Kisangani. 2006. “Political, Economic,and Social Consequences of Foreign MilitaryIntervention.” Political Research Quarterly 59: 363–376.doi:10.1177/106591290605900304.
Potter, S. M. 1995. “A Nonlinear Approach to US GNP.”Journal of Applied Econometrics 10: 109–125. doi:10.1002/(ISSN)1099-1255.
Rockman, B. A. 1988. “Mobilizing Political Support.” InNational Security and the U.S. Constitution, edited by G.C. Edwards III and W. E. Walker. Baltimore, MD: TheJohns Hopkins University Press.
Romer, C. D., and D. H. Romer. 2010. “The MacroeconomicEffects of Tax Changes: Estimates Based on a NewMeasure of Fiscal Shocks.” American Economic Review100: 763–801. doi:10.1257/aer.100.3.763.
Rothman, P. 1998. “Forecasting Asymmetric UnemploymentRates.” Review of Economics and Statistics 80: 164–168.doi:10.1162/003465398557276.
Siverson, R. M. 1995. “Democracies and War Participation:In Defense of the Institutional Constraints Argument.”European Journal of International Relations 1: 481–489.doi:10.1177/1354066195001004004.
Smyth, D. J., P. Dua, and S. W. Taylor. 1994. “Voters andMacroeconomics: Are They Forward Looking orBackward Looking?” Public Choice 78: 283–293.doi:10.1007/BF01047759.
Smyth, D. J., P. Dua, and S. W. Taylor. 1995. “StructuralChange in the Relationship Between PresidentialPopularity and Inflation and Unemployment: The Nixonand Ford Presidencies.” Applied Economics Letters 2: 305–307. doi:10.1080/135048595357113.
Smyth, D. J., P. Dua, and S. W. Taylor. 1999. “Estimating thePublic’s Social Preference Function Between Inflation andUnemployment Using Survey Data: The Survey ResearchCenter Versus Gallup.” Empirical Economics 24: 361–372.doi:10.1007/s001810050060.
Smyth, D. J., and S. W. Taylor. 2003. “PresidentialPopularity: What Matters Most, Macroeconomics orScandals?” Applied Economics Letters 10: 585–588.doi:10.1080/1350485032000100189.
Soroka, S. N. 2006. “Good News and Bad News:Asymmetric Responses to Economic Information.” TheJournal of Politics 68: 372–385. doi:10.1111/j.1468-2508.2006.00413.x.
Sprecher, C., and K. DeRouen Jr. 2002. “Israeli MilitaryActions and Internalization-Externalization Processes.”Journal of Conflict Resolution 46: 244–259. doi:10.1177/0022002702046002004.
Stanley, T. 2010. Kennedy Vs. Carter. Lawrence: UniversityPress of Kansas.
Steger, W. P. 2003. “Presidential Renomination Challenges inthe 20th Century.” Presidential Studies Quarterly 33: 827–852. doi:10.1046/j.0360-4918.2003.00086.x.
Stegmaier, M., and M. S. Lewis-Beck. 2013. “EconomicVoting.” In Oxford Bibliographies in Political Science,edited by R. Valelly. New York: Oxford UniversityPress.
Stimson, J. A. 1976. “Public Support for AmericanPresidents: A Cyclical Model.” Public Opinion Quarterly40: 1–21. doi:10.1086/268264.
Stimson, J. A., M. B. Mackuen, and R. S. Erikson. 1995.“Dynamic Representation.” The American PoliticalScience Review 89: 543–565. doi:10.2307/2082973.
Teräsvirta, T. 1994. “Specification, Estimation, and Evaluationof Smooth Transition Autoregressive Models.” Journal ofthe American Statistical Association 89: 208–218.
Wood, B. D. 2000. “Weak Theories and ParameterInstability: Using Flexible Least Squares to Take TimeVarying Relationships Seriously.” American Journal ofPolitical Science 44: 603–618. doi:10.2307/2669267.
Wood, B. D. 2009. “Presidential Saber Rattling and theEconomy.” American Journal of Political Science 53: 695–709. doi:10.1111/ajps.2009.53.issue-3.
4572 S.-W. CHOI ET AL.
Dow
nloa
ded
by [
71.5
7.75
.222
] at
14:
36 0
8 A
ugus
t 201
6