Assessing regional competitiveness: analysis of stock indicators and flows variables
21
1 Assessing regional competitiveness: analysis of stock indicators and flows variables 1 Bellù L., Cistulli V., Marta S., Timpano F. Index 1 – Introduction. 2 - The concept of Regional Competitiveness. 3 - Composite Indexes for the measurement of territorial assets. 4 - Integration with a SAM: the TCI – SAM approach. 5 - Policy making with the TCI - SAM approach. 6 – Conclusions. 7 – References. 1 This is a work in progress zero draft. Please do not quote.
-
Upload
independent -
Category
Documents
-
view
0 -
download
0
Transcript of Assessing regional competitiveness: analysis of stock indicators and flows variables
1
Assessing regional competitiveness: analysis of stock indicators and flows
variables 1
Bellù L., Cistulli V., Marta S., Timpano F.
Index
1 – Introduction.
2 - The concept of Regional Competitiveness.
3 - Composite Indexes for the measurement of territorial assets.
4 - Integration with a SAM: the TCI – SAM approach.
5 - Policy making with the TCI - SAM approach.
6 – Conclusions.
7 – References.
1 This is a work in progress zero draft. Please do not quote.
2
1 – Introduction.
The purpose of this paper is the identification and definition of approaches and tools for the
assessment and measurement of territorial competitiveness.
Territorial competitiveness can be defined as an area that is able to face up to market
competition whilst at the same time ensuring environmental, social and cultural sustainability,
based on the dual approach of networking and inter-territorial relationships.
The rationale behind this work is that territorial competitiveness is a concept characterized by
a high level of complexity: therefore in order to understand the dynamics and the factors
responsible for the competitive development of an area it is necessary to use a combination of
tools that can measure both the territorial stock (tangible and intangible assets) and the
economic flows between the actors (households and institutions) of a region.
The Territorial Competitiveness Index (TCI) – SAM approach proposed in this paper aims at
integrating a Territorial Competitiveness Index, which measures territorial assets, with a
Social Accounting Matrix (SAM), that measures the economic flows within a given area, in
order to define a composite model that combines sectors’ potential resulting from the
multipliers based on SAM with the Index. The integration of these “stock and flows”
measurement tools will enhance the capacity to identify territorial potential (both expresses
and latent) and to assess territorial development scenarios.
The usefulness of this approach resides therefore first and foremost in its capacity to provide
the policy makers at local and central level with a simple visualisation of information to better
target strategies and policies and to better allocate resources.
By recognizing the importance of interdependencies among actors, sectors and spaces, the
tool is also suitable to capture the multi-dimensional nature of territorial competitiveness and
to support policy makers in the identification of the most appropriate territorial development
policy mix.
2 - The Concept of Regional Competitiveness.
Every country, as a socioeconomic system, consists of several subsystems, such as regions,
provinces or a particular territorial system. The economy of the entire nation directly depends
on social and economic dynamics of these subsystems, and therefore their ability to be
competitive.
The concept of competitiveness has become extremely influential in recent years, and today
represents a dominant policy discourse among those concerned with the development of

3
economies at the whole range of territorial scales (Oughton, 1997; Schoenberger, 1998; Lall,
2001; Bristow, 2005; Wilson James, 2008).
“The concept of competitiveness has in the last decades extended from the micro-level of firms to
the macro-level of countries: between the two levels stands the concept of Regional
Competitiveness” (Annoni, Kozovska, JRC 2010).
An interesting broad definition of regional competitiveness is the one reported by Meyer-Stamer
(2008): “We can define (systemic) competitiveness of a territory as the ability of a locality or
region to generate high and rising incomes and improve livelihoods of the people living there.”
The territorial competitiveness was also defined by the Organisation for Economic Co-
operation and Development (OECD) and the European Union (EU) as well. The definition of
territorial competitiveness commonly accepted sounds as follows: “ the degree to which a
country can, under free and fair market conditions, produce goods and services which meet
the test of international markets, while simultaneously maintaining and expanding the real
incomes of its people over the long term”. (OECD, EU).
According to Krugman (1994), the idea of “Regional Competitiveness” may make more sense
than “National Competitiveness” because regional economies are more open to trade than
national economies and factors of production move more easily in and out of a region than a
national economy.
“A region is defined as a composite part of a larger economic social space, which differs
from other surrounding territories in economic, social, demographic, cultural, natural, and
infrastructure systems connected by material and informational relations” (Bruneckienè,
2008).
For a correct assessment of the competitiveness of a given area it is necessary to develop a
model that takes into account all the factors that determine the competitiveness of that region.
For this purpose it is fundamental to define ex ante the geographical level to which the model
refers, so that it is possible to correctly identify the determinants of the model.
Cellini and Soci (2002) first, and later Capuano (2008), distinguish between the macro level
(the competitiveness of a country), the micro level (the competitiveness of the individual
firm) and the meso level (the competitiveness of local economic systems); the meso level is
divided into industrial districts (or clusters) and regions.
A region may be thought of as having absolute competitive advantages when it possesses
superior technological, social, infrastructural or institutional assets that are external to but
which benefit individual firms in such way that no set of alternative factor prices would
induce a geographical redistribution of economic activity. These assets tend to give the
4
region’s firms, overall, a higher productivity than would otherwise be the case (Camagni,
2002, Kitson et al, 2004).
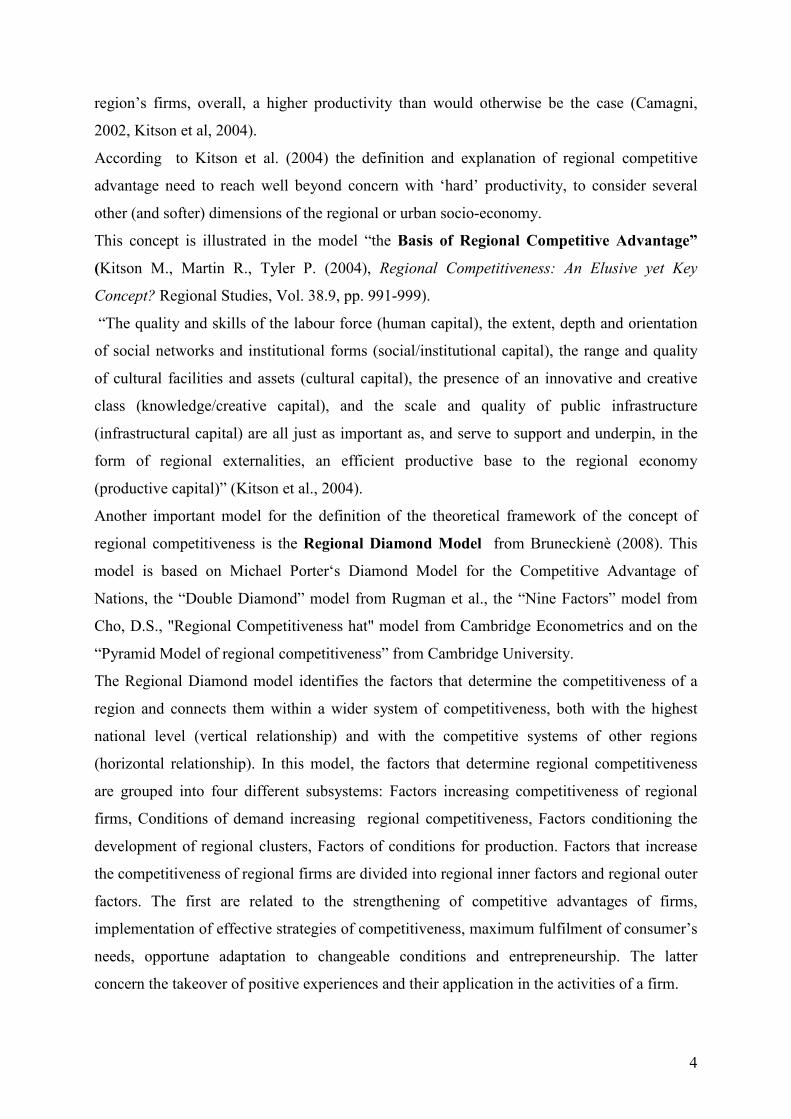
According to Kitson et al. (2004) the definition and explanation of regional competitive
advantage need to reach well beyond concern with ‘hard’ productivity, to consider several
other (and softer) dimensions of the regional or urban socio-economy.
This concept is illustrated in the model “the Basis of Regional Competitive Advantage”
(Kitson M., Martin R., Tyler P. (2004), Regional Competitiveness: An Elusive yet Key
Concept? Regional Studies, Vol. 38.9, pp. 991-999).
“The quality and skills of the labour force (human capital), the extent, depth and orientation
of social networks and institutional forms (social/institutional capital), the range and quality
of cultural facilities and assets (cultural capital), the presence of an innovative and creative
class (knowledge/creative capital), and the scale and quality of public infrastructure
(infrastructural capital) are all just as important as, and serve to support and underpin, in the
form of regional externalities, an efficient productive base to the regional economy
(productive capital)” (Kitson et al., 2004).
Another important model for the definition of the theoretical framework of the concept of
regional competitiveness is the Regional Diamond Model from Bruneckienè (2008). This
model is based on Michael Porter‘s Diamond Model for the Competitive Advantage of
Nations, the “Double Diamond” model from Rugman et al., the “Nine Factors” model from
Cho, D.S., "Regional Competitiveness hat" model from Cambridge Econometrics and on the
“Pyramid Model of regional competitiveness” from Cambridge University.
The Regional Diamond model identifies the factors that determine the competitiveness of a
region and connects them within a wider system of competitiveness, both with the highest
national level (vertical relationship) and with the competitive systems of other regions
(horizontal relationship). In this model, the factors that determine regional competitiveness
are grouped into four different subsystems: Factors increasing competitiveness of regional
firms, Conditions of demand increasing regional competitiveness, Factors conditioning the
development of regional clusters, Factors of conditions for production. Factors that increase
the competitiveness of regional firms are divided into regional inner factors and regional outer
factors. The first are related to the strengthening of competitive advantages of firms,
implementation of effective strategies of competitiveness, maximum fulfilment of consumer’s
needs, opportune adaptation to changeable conditions and entrepreneurship. The latter
concern the takeover of positive experiences and their application in the activities of a firm.
5
The Factors conditioning production include human resources, physical infrastructure and
geographic situation, knowledge resources and capital.
The conditions of demand increasing regional competitiveness are composed by:
• Inner factors: structure and size of the demand and consumers demand for the quality
and price of regional product (degree of material wealth, desire for knowledge);
• Outer factors: prominence of a region in international markets; extent, structure,
external markets’ demand for price and quality of regional products.
Finally, the Factors conditioning the development of regional clusters are: geographic
concentrations of economic activity, close cooperation between the research community,
businesses and local authorities, an infrastructure system developed and suited to the activity
of a cluster and favourable politics of the authorities for clusters.
TERRITORY AS A WHOLE OF TANGIBLE
AND INTANGIBLE RESOURCES
Artistic and Cultural Heritage
Socio-EconomicStructure
Infrastructure
GeographicLocation and Morphology
The System of Public
Services
ProductiveActivities and
Market Feautures
The intensity of economicand cultural exchanges
with the outside
The Level of Social Maturation and the
Distribution of Welfare
The Economic and Cultural Leadership
The spirit of the place (the tradition)
The System of Civicand Social Values
The Skill level of the Productive and Social
Tissue
INTENGIBLE Resources
TANGIBLE Resources
NaturalResources
TourismSector
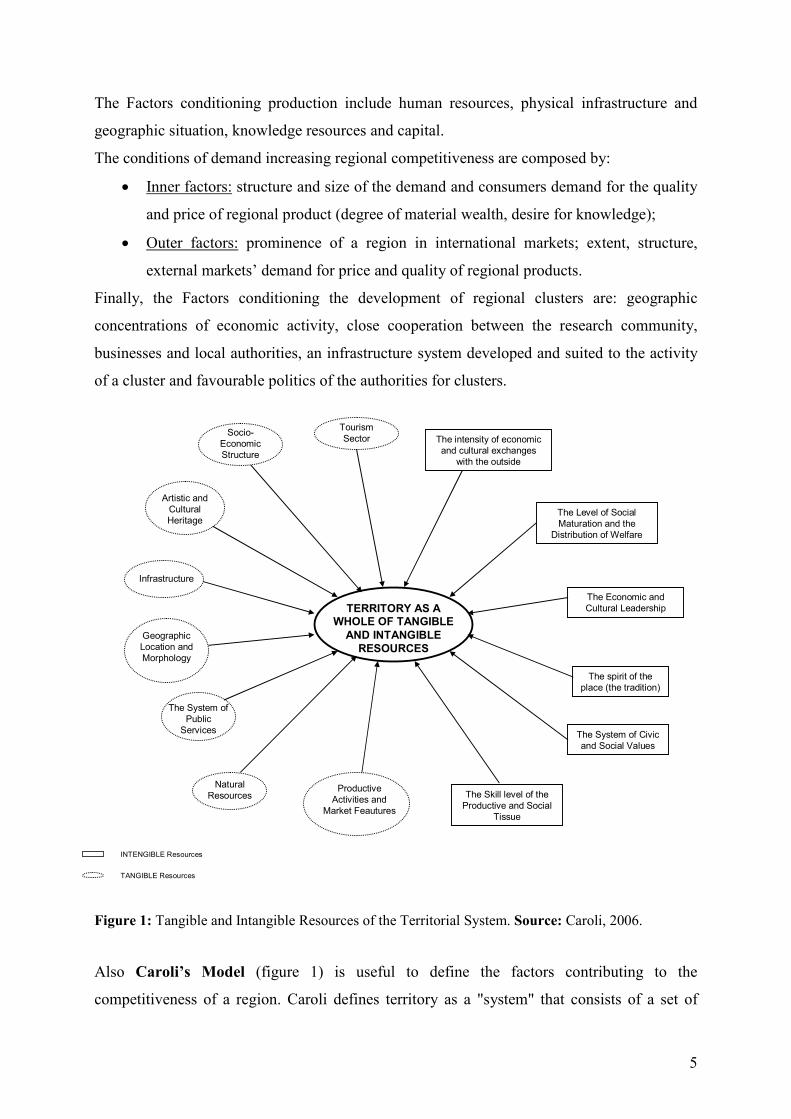
Figure 1: Tangible and Intangible Resources of the Territorial System. Source: Caroli, 2006.
Also Caroli’s Model (figure 1) is useful to define the factors contributing to the
competitiveness of a region. Caroli defines territory as a "system" that consists of a set of
6
actors and resources of material and immaterial nature. Tangible (material) resources concern
all "visible" and directly exploitable items characterizing a geographic area; intangible
(immaterial) resources are constituted from a set of non-tangible elements that characterize
the potential attractiveness of the territory, affecting also the value of material resources.
Tangible resources (T.R.) of a territory may be the result of a specific offer developed by
certain stakeholders that operate inside it or may be an "endowment" of the territory that
comes from its intrinsic specificity or by the sedimentation over time of various local actors.
Tangible resources characterizing a region are: the System of Public Services, Productive
Activities and Market Features, Natural Resources, Geographic Location and Morphology,
Infrastructure, Artistic and Cultural Heritage, Socio-Economic Structure, Tourism Sector.
The intangible resources (I.R.) result from evolutionary paths crossed from the territorial
system and the stakeholders who are or have been part of it during the time. I.R. are
characterized by being extremely specific of the geographical area in which they occur and
difficult to imitate in other spatial contexts (Caroli, 2006).
The main intangible resources include: the System of Civic and Social Values, the spirit of the
place (the tradition), the Skill level of the Productive and Social Tissue, the Economic and
Cultural Leadership, the Level of Social Maturation and the Distribution of Welfare, the
intensity of economic and cultural exchanges with the external world.
The tangible and intangible resources that characterize the territorial system determine the
quality of the assets that it makes available to its users and on which their international
competitiveness depends.
In many cases the competitive advantages of a territory derive from the special linkage that
exists between certain material elements and some intangible resources of that particular
region.
3 - Composite Indexes for the measurement of territorial assets.
The issue of the measurement and assessment of territorial competitiveness is of increasing
importance for the determination of development strategies at all geographical levels and
especially at regional level.
“Economic indicators – such as GDP per capita and employment – do not fully describe a
region’s quality of life. Security, health, education and the quality of environment all
contribute to a region’s “well-being”” (OECD, 2009).
7
“The analysis of the main problems of regional competitiveness measurement
(Simanaviciene, et al., 2007, Kitson et al., 2004, de Vet, et al. 2004, Huggins, 2003, Lengyel,
2003) showed that competitiveness cannot be completely defined by one or several economic
and social indicators: thus, complex measurement of competitiveness is a must”
(Bruneckienè, 2008).
For these reasons, this paper proposes the use of composite indicators for assessing the
territorial competitiveness, in order to obtain a synthesis measurement of all dimensions (both
tangible and intangible) of an area.
In fact, according to OECD (2004), a composite indicator measures multi-dimensional
concepts (eg. Competitiveness, e-trade or environmental quality) which cannot be captured by
a single indicator. Ideally, a composite indicator should be based on a theoretical
framework/definition, which allows individual indicators/variables to be selected, combined
and weighted in a manner which reflects the dimensions or structures of the phenomena being
measured.
According to OECD – JRC (2008), composite indicators which compare country performance
are increasingly recognised as a useful tool in policy analysis and public communication.
The justification for a composite indicator lies in its fitness for the intended purpose and in
peer acceptance (Rosen, 1991). EC JRC identifies three essential criteria for composite
indicators:
1. Salience: the indicators is interesting, useful and relevant for the user (policy
relevance);
2. Credibility: scientific validity;
3. Legitimacy: perception of the indicator, consensus around it and the competence of
the producer from the point of view of the users/scientific community.
The quality of a composite index as well as the soundness of the messages it conveys depend
not only on the methodology used in its constructions but primarily on the quality of the
framework and the data used (OECD – JRC, 2008).
For the methodological development of a Territorial Competitiveness Index the following 7
steps has been identified, on the basis mainly of the OECD and JRC Handbook on
Constructing Composite Indicators (2008), while for the definition of the operational scheme
of the TCI reference was made to the Rindex Model (Bruneckienè, 2008).
• Stage 1: Determination of factors of regional competitiveness within the country and
grouping of the factors of regional competitiveness: on the basis of the theoretical
framework and the conceptual model identified.
8
• Stage 2: Definition of the Indicators of the factors of competitiveness and
identification of the value of the indicators (imputation of missing data, if necessary):
indicators of factors of regional competitiveness.
• Stage 3: Normalization and standardization of the value of the indicators: normalized
and standardized value of factors of competitiveness.
• Stage 4: Weighting of factors of regional competitiveness: PCA (Principal
Component Analysis), DEA (Data Envelopment Analysis), regression approach,
participatory methods.
• Stage 5: Formulation of the function and calculation of the Territorial
Competitiveness Index: Index’s score.
• Stage 6: Robustness and sensitivity analysis of the Index.
• Stage 7: Presentation and communication of the Territorial Competitiveness Index.
With regards to the identification of the most relevant indicators (variables) for the definition
of regional competitiveness, this paper refers to the set of indicators identified by the WEF for
the development of the Global Competitiveness Report 2010-2011 (12 pillars) and then used
and adapted to the regional level by the EC JRC for the definition of the EU Regional
Competitiveness Index 2010.
The indicators have been grouped by the JRC in 11 pillars (dimensions), which are as follows:
1. Institutions: corruption, fraud, governance indicators (World Bank Worldwide), Ease
of doing business (Doing business 2010).
2. Infrastructure: road (motorway index), rail (railway index), air (number of flights
accessible with 90’ drive).
3. Macroeconomic stability: government deficit (or surplus), saving rate, inflation, long
term bond yields.
4. Health: road fatalities, healthy life expectancy, infant mortality, cancer and heart
disease death rate, suicide death rates.
5. Quality of Primary and Secondary Education: OECD PISA for reading, maths and
science.
These five pillars constitute the first group, called the Basic Pillars, and they represent the key
basic drivers of all types of economies.
The following three pillars constitute the group “ Efficiency Pillars” and they are considered
the factors responsible for increasing the competitiveness of a region from a basic level to a
more advanced level:
9
6. Higher Education, Training and Lifelong Learning: graduates, lifelong learning, early
school leavers, accessibility to universities, higher education expenditure.
7. Labour market efficiency: labour productivity, employment rate in industry and
services, unemployment rate, long-term unemployment, gender balance employment
and gender balance unemployment.
8. Market size: potential market size expressed in GDP, potential market size expressed
in population, GDP, compensation of employees, disposable income.
Finally, three pillars determine the group “Innovation Pillars”; the indicators of this group are
the key driver for regional competitiveness improvement in a developed regional economy.
These pillars are:
9. Technological readiness: household access to broadband or internet; individuals who
ordered online for private use; household with access to internet; enterprises use of
computers, access to internet, website, intranet, internal networks; persons employed
by enterprises with an extranet or intranet access.
10. Business sophistication: employment and GVA in financial and business services
(NACE J_K); FDI intensity; aggregate indicators for strength of regional clusters.
11. Innovation: patents; core creative class; knowledge workers; scientific publications;
R&D; Human Resources in Science Technology (HRST); high-tech and knowledge-
intensive employment; high-tech, ICT and biotechnology inventors.
All these dimensions (pillars) are "hard data", are tangible factors of competitiveness. For the
"measurement" of intangible factors ("soft data"), equally important for assessing the
competitiveness of a region (see figure 1), it is necessary to use qualitative methodologies and
tools.
An example of quanti-qualitative tool is the Sustainable Livelihoods Approach (SLA): this
concept is mainly used with regards to rural development, poverty reduction and
environmental management. “A livelihood comprises the capabilities, assets (stores,
resources, claims and access) and activities required for a means of living. A livelihood is
sustainable which can cope with and recover from stress and shocks, maintain and enhance its
capabilities and assets, and provide sustainable livelihood opportunities for the next
generation; and which contributes net benefits to other livelihoods at the local and global
levels and in short and long term.” (Chambers and Conway, 1992).
SLA is composed by five sub-dimensions:
1. creation of working days;
10
2. poverty reduction;
3. well-being and capabilities;
4. livelihood adaptation, vulnerability and resilience;
5. natural resource base sustainability.
These five dimensions are quite different in scope, with a range from very quantitative
assessment to very broad and different indicators requiring more qualitative techniques for the
assessment.
4 - Integration with a SAM: the TCI – SAM approach.
The assumption of this paper is that the concept of territorial competitiveness, given its
complexity, can not be explained comprehensively by a composite index that measures only
the assets/stock (even if both tangible and intangible) of an area.
In fact, in order to obtain a better understanding of the complex dynamics that characterize the
competitive development of an area, it is necessary to integrate these composite indices with
tools that are able to measure (take into consideration) also the economic flows that occur
within a territorial system.
For this purpose, this paper proposes the use of the SAM (Social Accounting Matrix) for the
measurement of the flows that take place in a given territory.
The integration of the SAM with the Composite Index - explained in the previous paragraph -
constitutes "the TCI - SAM approach" for Regional Competitiveness assessment (figure 2).
The figure explains the rationale of the proposed method: the integration of these “stock and
flows” measurement tools (Composite Indicators and SAMs) will allow to identify territorial
potential (both expressed and latent) and to better define and assess territorial scenarios.
A SAM is a particular representation of the macro and meso economic accounts of a socio-
economic system, which capture the transactions and transfers between all economic agents in
the system (Pyatt and Round, 1985; Reinert and Roland-Holst , 1997). “The SAM is a
comprehensive, disaggregate, consistent and complete data system that captures the
interdependence that exists within a socio-economic system” (Thorbecke, 2000).
According to Jeffery Round, a SAM is characterized by three main features:
1. first of all, building a SAM is very useful in order to aggregate data from a lot of
different sources; this helps to analyze the structural characteristics of an economy
(SAM could be also important to highlight data need and identify data gaps);
2. the SAMs are also an excellent tool for displaying information, as they show clearly
the structural interdependence characterizing an economy at both macro and meso:
11
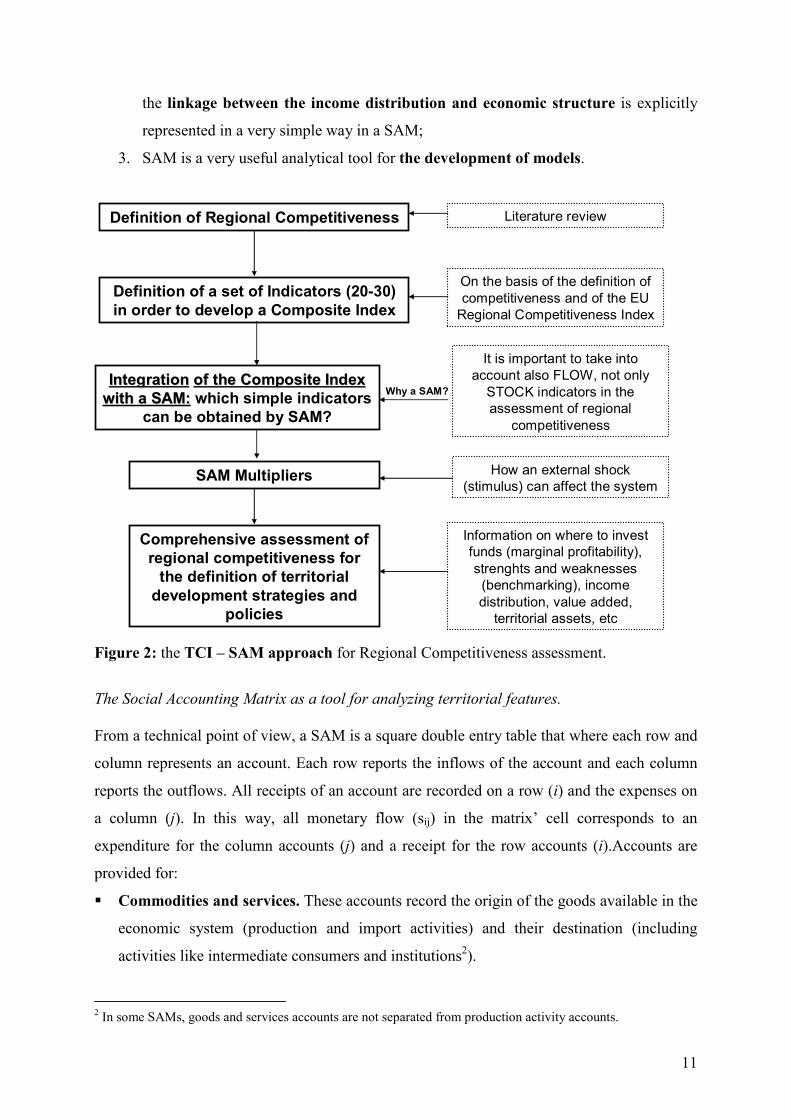
the linkage between the income distribution and economic structure is explicitly
represented in a very simple way in a SAM;
3. SAM is a very useful analytical tool for the development of models.
Definition of a set of Indicators (20-30) in order to develop a Composite Index
On the basis of the definition ofcompetitiveness and of the EU Regional Competitiveness Index
IntegrationIntegration ofof the Composite the Composite IndexIndexwithwith a SAM:a SAM: which simple indicators
can be obtained by SAM?
Definition of Regional Competitiveness
It is important to take intoaccount also FLOW, not onlySTOCK indicators in the assessment of regional
competitiveness
SAM Multipliers
Comprehensive assessment ofregional competitiveness forthe definition of territorialdevelopment strategies and
policies
Information on where to investfunds (marginal profitability), strenghts and weaknesses(benchmarking), incomedistribution, value added, territorial assets, etc
Why a SAM?
Literature review
How an external shock (stimulus) can affect the system
Figure 2: the TCI – SAM approach for Regional Competitiveness assessment.
The Social Accounting Matrix as a tool for analyzing territorial features. From a technical point of view, a SAM is a square double entry table that where each row and
column represents an account. Each row reports the inflows of the account and each column
reports the outflows. All receipts of an account are recorded on a row (i) and the expenses on
a column (j). In this way, all monetary flow (sij) in the matrix’ cell corresponds to an
expenditure for the column accounts (j) and a receipt for the row accounts (i).Accounts are
provided for:
§ Commodities and services. These accounts record the origin of the goods available in the
economic system (production and import activities) and their destination (including
activities like intermediate consumers and institutions2).
2 In some SAMs, goods and services accounts are not separated from production activity accounts.
12
§ Production Activities. These accounts record, on the rows, the destination of the output
of the activities, and on the columns, the way the value of the output of each activity is
allocated to intermediate consumption, factor costs and profits.
§ Production factors: these accounts give record on the rows the origin of factors’
remunerations (essentially the production activities) and on the columns, the destination of
factor incomes (Institutions, essentially households and firms). In general, work and
capital are differentiated, but in certain cases it also includes natural resources such as soil
and water.
§ Institutions (economic agents): mainly households, private companies and governments.
These accounts report on the rows the origin of institutions’ income and on the columns
their expenditures. The balance of the government account is the government deficit or
surplus, which feeds the saving-investment account.
§ Capital formation: or Savings-Investments (S-I), which records on the row the origin of
savings and on the column the allocation of resources for the capital formation, i.e. for the
purchase investment commodities and formation of commodity stocks.
§ External transactions: or Rest Of the World (ROW), which records on the row the
income paid by the country to the ROW and on the column the income received by the
country from the ROW.
The sequence of the accounts on the rows and those in the columns are exactly the same. In
addition, one of the principles of the social accounting matrix is the equality between total
receipts and the total expenditures of each account.
Table 1 here below gives a schematic view and content of a SAM3. .
3 Reported in: Bellù L.G. (2011): The social accounting Matrix for the analysis of development policies. Concepts and examples. EASYPol series (Forthcoming). www.fao.org/easypol FAO UN.
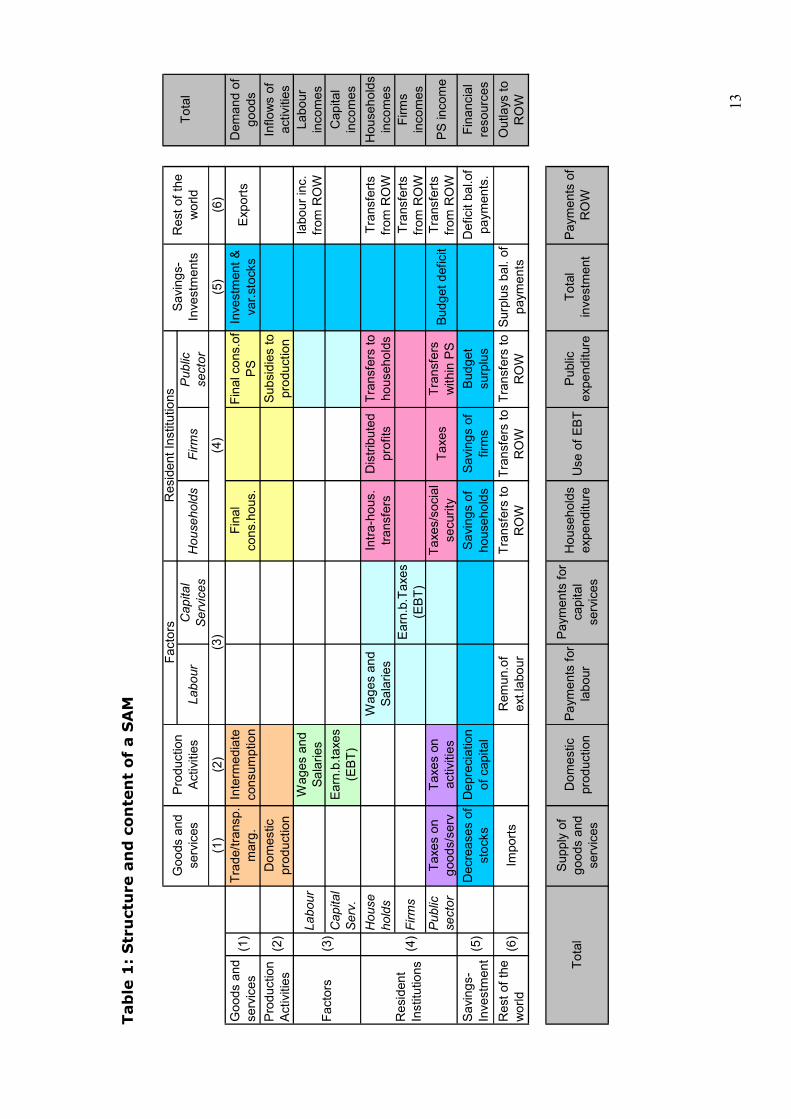
13
Table 1: Structure and content of a SAM
Labour
Capital
Services
Households
Firms
Public
sector
(1)
(2)
(5)
(6)
Goods and
services
(1)
Trade/transp.
marg.
Interm
ediate
consum
ption
Final
cons.hous.
Final cons.of
PS
Investment &
var.stocks
Exports
Dem
and of
goods
Production
Activities
(2)
Dom
estic
production
Subsidies to
production
Inflows of
activities
Labour
Wages and
Salaries
labour inc.
from
ROW
Labour
incomes
Capital
Serv.
Earn.b.taxes
(EBT)
Capital
incomes
House
holds
Wag
es and
Salaries
Intra-hous.
transfers
Distributed
profits
Transfers to
households
Transferts
from
ROW
Households
incomes
(4)Firms
Earn.b.Taxes
(EBT)
Transferts
from
ROW
Firm
s incomes
Public
sector
Taxes on
goods/serv
Taxes on
activities
Taxes/social
security
Taxes
Transfers
within PS
Budge
t deficit
Transferts
from
ROW
PS income
Savings-
Investment(5)
Decreases of
stocks
Depreciation
of capital
Savings of
households
Savings of
firms
Budge
t surplus
Deficit bal.of
paym
ents.
Financial
resources
Rest o
f the
world
(6)
Imports
Rem
un.of
ext.labour
Transfers to
ROW
Transfers to
ROW
Transfers to
ROW
Surplus bal. o
f paym
ents
Outlays to
ROW
Supply of
goods and
services
Dom
estic
production
Payments fo
r labour
Payments fo
r capital
services
Households
expenditure
Use of E
BT
Public
expenditure
Total
investment
Payments of
ROW
Total
Resident
Institutions
(3)
(4)
Factors
(3)
Resident Institutions
Savings-
Investments
Rest o
f the
world
Total
Goods and
services
Production
Activities
Factors
14
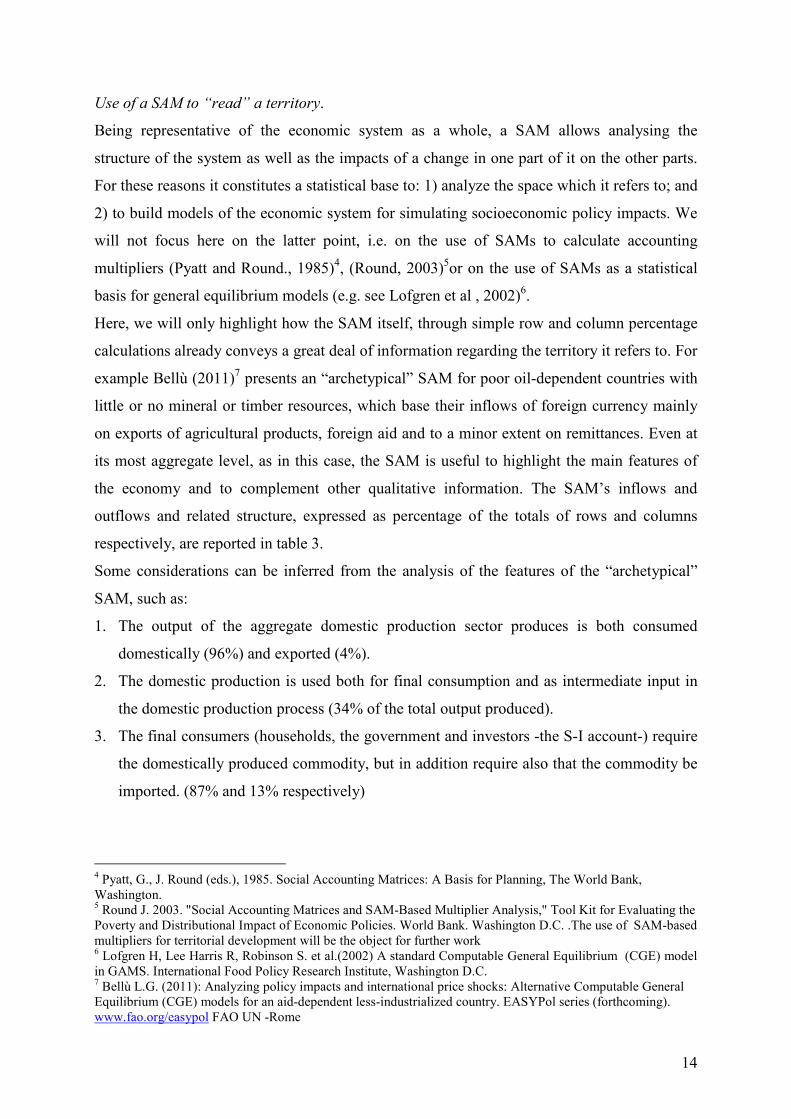
Use of a SAM to “read” a territory.
Being representative of the economic system as a whole, a SAM allows analysing the
structure of the system as well as the impacts of a change in one part of it on the other parts.
For these reasons it constitutes a statistical base to: 1) analyze the space which it refers to; and
2) to build models of the economic system for simulating socioeconomic policy impacts. We
will not focus here on the latter point, i.e. on the use of SAMs to calculate accounting
multipliers (Pyatt and Round., 1985)4, (Round, 2003)5or on the use of SAMs as a statistical
basis for general equilibrium models (e.g. see Lofgren et al , 2002)6.
Here, we will only highlight how the SAM itself, through simple row and column percentage
calculations already conveys a great deal of information regarding the territory it refers to. For
example Bellù (2011)7 presents an “archetypical” SAM for poor oil-dependent countries with
little or no mineral or timber resources, which base their inflows of foreign currency mainly
on exports of agricultural products, foreign aid and to a minor extent on remittances. Even at
its most aggregate level, as in this case, the SAM is useful to highlight the main features of
the economy and to complement other qualitative information. The SAM’s inflows and
outflows and related structure, expressed as percentage of the totals of rows and columns
respectively, are reported in table 3.
Some considerations can be inferred from the analysis of the features of the “archetypical”
SAM, such as:
1. The output of the aggregate domestic production sector produces is both consumed
domestically (96%) and exported (4%).
2. The domestic production is used both for final consumption and as intermediate input in
the domestic production process (34% of the total output produced).
3. The final consumers (households, the government and investors -the S-I account-) require
the domestically produced commodity, but in addition require also that the commodity be
imported. (87% and 13% respectively)
4 Pyatt, G., J. Round (eds.), 1985. Social Accounting Matrices: A Basis for Planning, The World Bank, Washington. 5 Round J. 2003. "Social Accounting Matrices and SAM-Based Multiplier Analysis," Tool Kit for Evaluating the Poverty and Distributional Impact of Economic Policies. World Bank. Washington D.C. .The use of SAM-based multipliers for territorial development will be the object for further work 6 Lofgren H, Lee Harris R, Robinson S. et al.(2002) A standard Computable General Equilibrium (CGE) model in GAMS. International Food Policy Research Institute, Washington D.C. 7 Bellù L.G. (2011): Analyzing policy impacts and international price shocks: Alternative Computable General Equilibrium (CGE) models for an aid-dependent less-industrialized country. EASYPol series (forthcoming). www.fao.org/easypol FAO UN -Rome
15
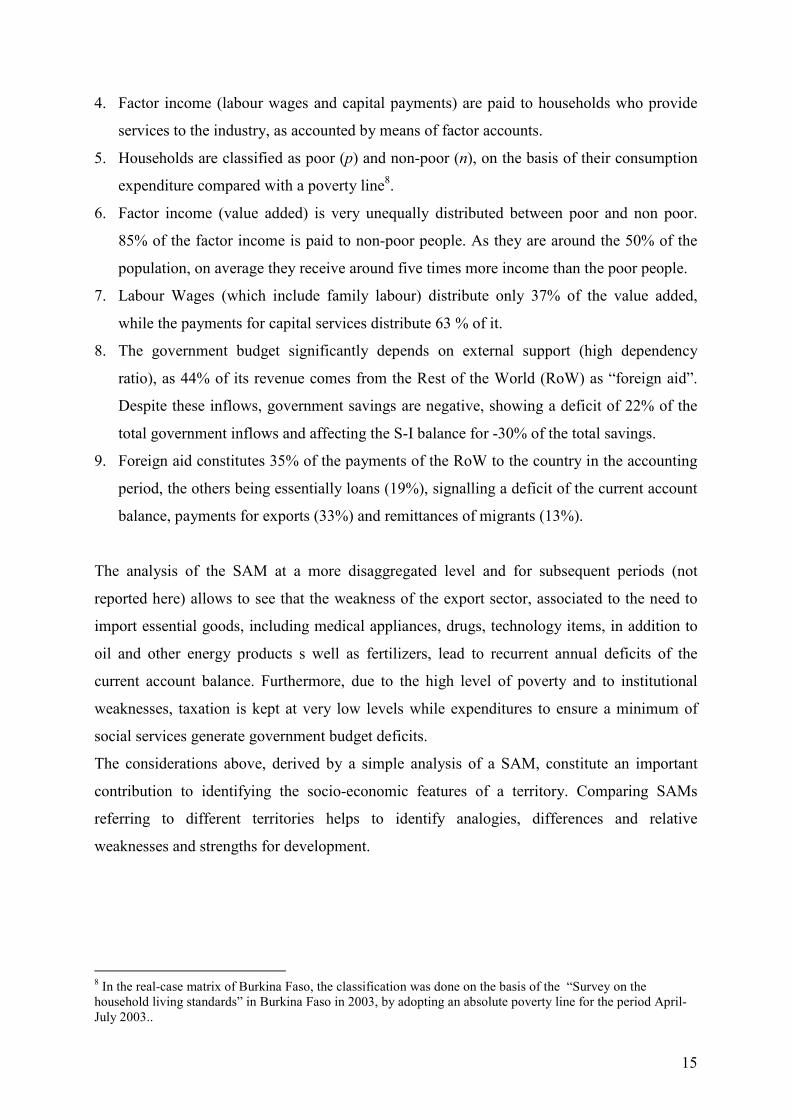
4. Factor income (labour wages and capital payments) are paid to households who provide
services to the industry, as accounted by means of factor accounts.
5. Households are classified as poor (p) and non-poor (n), on the basis of their consumption
expenditure compared with a poverty line8.
6. Factor income (value added) is very unequally distributed between poor and non poor.
85% of the factor income is paid to non-poor people. As they are around the 50% of the
population, on average they receive around five times more income than the poor people.
7. Labour Wages (which include family labour) distribute only 37% of the value added,
while the payments for capital services distribute 63 % of it.
8. The government budget significantly depends on external support (high dependency
ratio), as 44% of its revenue comes from the Rest of the World (RoW) as “foreign aid”.
Despite these inflows, government savings are negative, showing a deficit of 22% of the
total government inflows and affecting the S-I balance for -30% of the total savings.
9. Foreign aid constitutes 35% of the payments of the RoW to the country in the accounting
period, the others being essentially loans (19%), signalling a deficit of the current account
balance, payments for exports (33%) and remittances of migrants (13%).
The analysis of the SAM at a more disaggregated level and for subsequent periods (not
reported here) allows to see that the weakness of the export sector, associated to the need to
import essential goods, including medical appliances, drugs, technology items, in addition to
oil and other energy products s well as fertilizers, lead to recurrent annual deficits of the
current account balance. Furthermore, due to the high level of poverty and to institutional
weaknesses, taxation is kept at very low levels while expenditures to ensure a minimum of
social services generate government budget deficits.
The considerations above, derived by a simple analysis of a SAM, constitute an important
contribution to identifying the socio-economic features of a territory. Comparing SAMs
referring to different territories helps to identify analogies, differences and relative
weaknesses and strengths for development.
8 In the real-case matrix of Burkina Faso, the classification was done on the basis of the “Survey on the household living standards” in Burkina Faso in 2003, by adopting an absolute poverty line for the period April-July 2003..
16
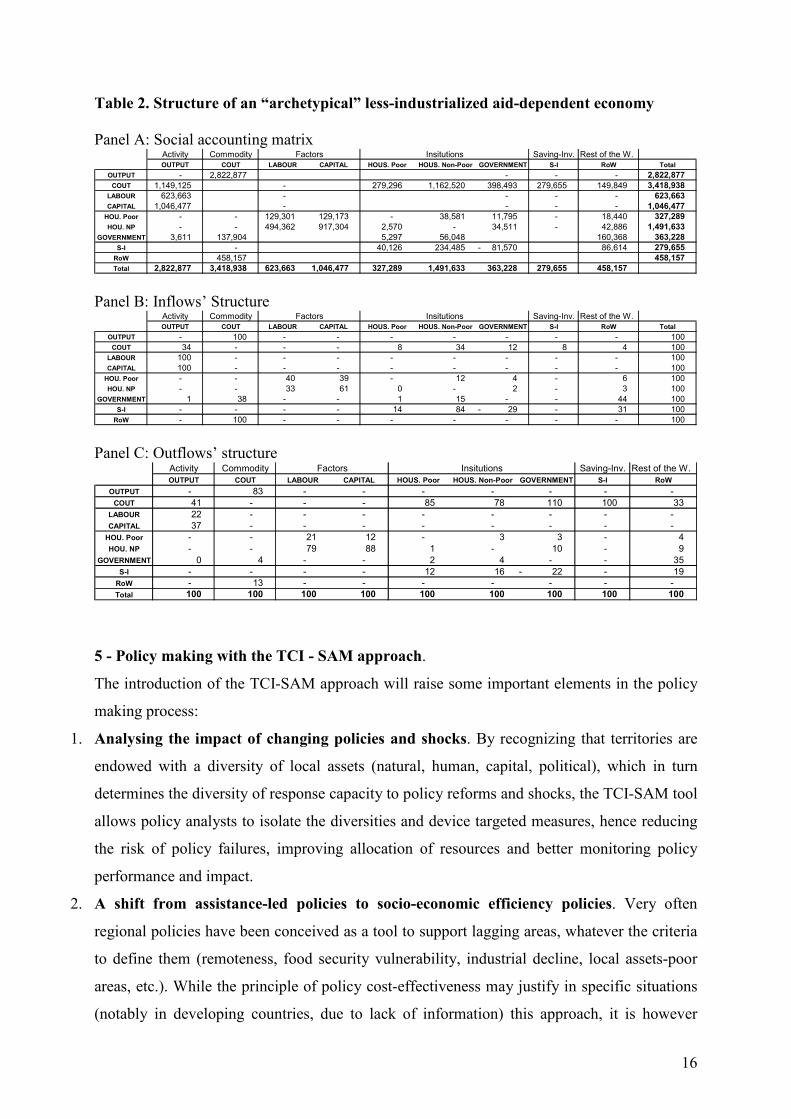
Table 2. Structure of an “archetypical” less-industrialized aid-dependent economy Panel A: Social accounting matrix
Activity Commodity Saving-Inv. Rest of the W.OUTPUT COUT LABOUR CAPITAL HOUS. Poor HOUS. Non-Poor GOVERNMENT S-I RoW Total
OUTPUT - 2,822,877 - - - 2,822,877 COUT 1,149,125 - 279,296 1,162,520 398,493 279,655 149,849 3,418,938
LABOUR 623,663 - - - - 623,663 CAPITAL 1,046,477 - - - - 1,046,477 HOU. Poor - - 129,301 129,173 - 38,581 11,795 - 18,440 327,289 HOU. NP - - 494,362 917,304 2,570 - 34,511 - 42,886 1,491,633
GOVERNMENT 3,611 137,904 5,297 56,048 160,368 363,228 S-I - 40,126 234,485 81,570 - 86,614 279,655 RoW 458,157 458,157 Total 2,822,877 3,418,938 623,663 1,046,477 327,289 1,491,633 363,228 279,655 458,157
Factors Insitutions
Panel B: Inflows’ Structure
Activity Commodity Saving-Inv. Rest of the W.OUTPUT COUT LABOUR CAPITAL HOUS. Poor HOUS. Non-Poor GOVERNMENT S-I RoW Total
OUTPUT - 100 - - - - - - - 100 COUT 34 - - - 8 34 12 8 4 100
LABOUR 100 - - - - - - - - 100 CAPITAL 100 - - - - - - - - 100 HOU. Poor - - 40 39 - 12 4 - 6 100 HOU. NP - - 33 61 0 - 2 - 3 100
GOVERNMENT 1 38 - - 1 15 - - 44 100 S-I - - - - 14 84 29 - - 31 100 RoW - 100 - - - - - - - 100
Factors Insitutions
Panel C: Outflows’ structure
Activity Commodity Saving-Inv. Rest of the W.OUTPUT COUT LABOUR CAPITAL HOUS. Poor HOUS. Non-Poor GOVERNMENT S-I RoW
OUTPUT - 83 - - - - - - - COUT 41 - - - 85 78 110 100 33
LABOUR 22 - - - - - - - - CAPITAL 37 - - - - - - - - HOU. Poor - - 21 12 - 3 3 - 4 HOU. NP - - 79 88 1 - 10 - 9
GOVERNMENT 0 4 - - 2 4 - - 35 S-I - - - - 12 16 22 - - 19 RoW - 13 - - - - - - - Total 100 100 100 100 100 100 100 100 100
Factors Insitutions
5 - Policy making with the TCI - SAM approach.
The introduction of the TCI-SAM approach will raise some important elements in the policy
making process:
1. Analysing the impact of changing policies and shocks. By recognizing that territories are
endowed with a diversity of local assets (natural, human, capital, political), which in turn
determines the diversity of response capacity to policy reforms and shocks, the TCI-SAM tool
allows policy analysts to isolate the diversities and device targeted measures, hence reducing
the risk of policy failures, improving allocation of resources and better monitoring policy
performance and impact.
2. A shift from assistance-led policies to socio-economic efficiency policies. Very often
regional policies have been conceived as a tool to support lagging areas, whatever the criteria
to define them (remoteness, food security vulnerability, industrial decline, local assets-poor
areas, etc.). While the principle of policy cost-effectiveness may justify in specific situations
(notably in developing countries, due to lack of information) this approach, it is however
17
increasingly recognized that territorial policies strengthen overall policy efficiency as it
allows to factor in local policy and market failures, which cannot be reflected in national or
supranational policies. Moreover, territorial policies are better suited to exploit “hidden” local
economic, natural and human potential and therefore to boost sustainable endogenous
development. With this approach, territories cease to be a passive entity characterised by
locational advantages and become a lively and dynamic socio-economic entity made of
economic and social agents that offer products and services and concur in boosting the
competitiveness of their space vis a vis other competing areas.
3. A new rationality in policy making and planning. Increasing volatility, complexity,
uncertainty and rapidity of changes in socio-economic systems as well as of behaviour of
actors and decision making (short term versus long term decisions) calls for a new rationality
which is able to factor in these elements in long term development planning at global, national
and local level. “Formal” and/or “substantive” economic rationality widely used in economic
modelling (Max, Weber, The Theory of Social and Economic Organization, Parsons, ed.,
1947) may not be enough or adequate to this end. The TCI-SAM approach is a step forward in
the direction of a more “procedural” rationality à la Simon, which suggests that policy making
consists of that process of thought that is more revealing of the quality of human rationality
than the outcome or product of the thought. By placing the focus on intangible factors (human
capital and knowledge), relational factors (co-operation, partnerships, local culture and
vocation, etc.), communication networks, etc., and involving the partners and stakeholders in
the determining strengths and weaknesses of their space as well as opportunities for
development, this approach stresses the importance of negotiation, consensus-building,
conflict resolution. In other words, it is able to capture the “thoughts” of the policy process
that lead to the decision (outcome). As such it enables the policy makers and the local actors
to design the right policies and measures to increase cohesion, co-operation, synergies and a
shared vision for the development of the area.
4. Rethinking policy focus. Within this framework, the traditional policy goals of optimal
allocation of resources, accessibility, income inequalities or countervailing local
disadvantages are reformulated to place more focus on sustainability, local competitiveness,
connectivity, interconnections and networking, innovation and relational capital, quality of
services.
18
6 – Conclusions.
The main concern of the paper is about the assessment of regional competitiveness and the
integration of information stemming out from a SAM in order to make more robust the
composite indicators usually used in this area.
There is an increasing interest for new indicators in the measurement of territorial
performance capable to give more comprehensive information on competitiveness and quality
of life more than on mere information on growth and employment. In paragraphs 2 and 3 a
summarized evidence of recent literature contributions has been proposed.
The Social Accounting Matrix is a comprehensive tool recording flows among actors of an
economy (at any territorial level). Along with the traditional information on flows among
sectors, additional information are available on flows among institutions and among
institutions and activities/factors. In paragraph 4 some hints about the relationship between
SAM and regional competitiveness indicators are shown with an application to Burkina Faso.
In paragraph 5 some issues about policy implications of the use of the SAM approach to
enforce territorial competitiveness evaluation by composite indicators have been risen.
Finally, the contribution to territorial composite indicators stemming out from SAMs can be
summarized in the following ones:
- evaluation of the thickness of the production system: the input-output matrix of the SAM
allow to give a robust measurement of the productive system in terms of relationships among
national production activities;
- evaluation of the degree of openness of the economy, in terms of the weight of import and
export on the total national production;
- evaluation of the dependence of internal consumption from internal and external sources
(demand side);
- evaluation of the volume of investment per sector, then any potential disaggregation for
investment demand among group of sectors classified on the basis of their attitude to
innovation might be exploited;
- degree of inequality of income distribution;
- composition of income distribution (labour or capital sources);
- impact of foreign aid on income distribution;
- measurement of poverty.
Some others indicators can be raised by the matrix and additional measurements can be
obtained from the multipliers matrix. In that case, the potential coming from the multipliers is
very useful in evaluating competitiveness. For example, it might be conceived an indicator
19
based on multipliers to measure the impact of certain policies in the economic system (ie
direct transfers to households or support to rural firms or others…). These indicators must be
build up on the basis of the need of the modeller, but a theoretical model might help to
generalize them for any kind of country.
Poverty, income distribution, density of the production system, degree of openness and policy
impact are the most important dimensions that can be included in any competitiveness
evaluation framework by using a SAM. Further research is needed to understand to build up
the proposed framework.
7 – References.
P. Annoni, K. Kozovska (2010). EU Regional Competitiveness Index. EC, JRC – IPSC. S. Brakman, H. Garretsen, C.v. Marrewijk (2009). The New Introduction to Geographical Economics. Cambridge University Press Bruneckienė J., Snieška V. (2008), Measurement of Lithuanian Regions by Regional Competitiveness Index. Kaunas. Budd L., Hirmis A.K. (2004), Conceptual Framework for Regional Competitiveness Regional Studies, Vol. 38.9, pp. 1015–1028. CAMBRIDGE ECONOMETRICS (2003) A Study of the Factors Determining Regional Competitiveness in the EU, Report submitted to the European Commission, Brussels. Capuano G. (2007), Mesoeconomia, Teorie ed Evidenza empiriche di economia Regionale, Franco Angeli. Caroli M.G. (2006), Il marketing territoriale, Strategie per la competitività sostenibile del territorio. Franco Angeli, Milano.
E.Ciciotti, P. Rizzi (2005). Politiche per lo sviluppo territoriale. Carrocci Editore. European Commission (2006): European Competitiveness Report 2006 (Competitiveness and economic reform); Luxembourg Gardiner B., Martin R., Tyler P. (2004), Competitiveness, Productivity and Economic Growth across the European Regions, Regional Studies Association’s Regional Productivity Forum Seminar, London. Garofoli G. (2002), Local Development in Europe: Theoretical Models and International Comparisons, European Urban and Regional Studies. Kitson M., Martin R., Tyler P. (2004), Regional Competitiveness: An Elusive yet Key Concept? Regional Studies, Vol. 38.9, pp. 991-999.
20
Krugman, Paul R. (1995). Development, geography, and economic theory; MIT Pr., London. Krugman, Paul R. (1991). Geography and Trade (Gaston Eyskens Lecture Series), MIT Pr., Cambridge, Massachusetts. S.Lovo (2004). Regional Models to Assess Policy Impacts. University of Verona. R. Martin, CAMBRIDGE ECONOMETRICS (2003). A Study on the Factors of Regional Competitiveness. A draft final report for The European Commission DG Regional Policy. R.Martin, M.Kitson, P.Tyler (2006). Regional Competitiveness. Regional Studies Association. Organisation for Economic Co-operation and Development (2006): Regional Competitiveness; OECD Paris. OECD – JRC of European Commission (2008), Handbook on Constructing Composite Indicators: methodology and user guide.
A. Pike, A. Rodriguez-Pose and J. Tomaney. (2006). Local and Regional Development.
A.Pike, (2009), Whither Regional Studies? Routledge, New York.
Porter, M.E. The Competitive Advantage of Nations. 1990. Reprinted in 1998 by Palgrave, 855 p. Porter, M.E. (2003) The economic performance of regions, Regional Studies, 37, 6/7, pp. 549-578. G. Pyatt, J. Round (2004), Multiplier Effects and the Reduction of Poverty, Poverty, Inequality and Development, Essays in Honour of Erik Thorbecke J. Round (2003), Constructing SAMs for Development Policy Analysis: Lessons Learned and Challenges Ahead. Economic Systems Research, Vol. 15, No. 2. J. Round (1979) Social Accounting Matrices and SAM-based Multiplier Analysis. The World Bank, Washington D.C. Rutkauskas A.V., (2008), On the sustainability of regional competitiveness development considering risk, Baltic Journal on Sustainability. I. Scoones (1997), Sustainable Rural Livelihoods, a framework for analysis. IDS working paper 72. Šenfelde M., Judrupa I., (2007), The main factors of regional competitiveness and the importance of international indexes in its evaluation. J.E. Stiglitz, A. Sen, J-P Fitoussi (2009), Report by the Commission on the Measurement of Economic Performance and Social Progress. Paris.

21
E. Thorbecke (2000), The Use of Social Accounting Matrix in Modelling. 26th General Conference of The Int. Ass. for Research in Income and Wealth. Cracow, Poland. Wilson J. (2008), Territorial competitiveness and development policy, Orkestra, Basque Institute of Competitiveness, Basque Country, Spain. World Economic Forum (2010), The Global Competitiveness Report. Geneva.