Embedded Competitiveness: Taiwan's Shifting Role in ...
307
Embedded Competitiveness: Taiwan’s Shifting Role in International Footwear Sourcing Networks Lu-Lin Cheng Department of Sociology Duke University 1
-
Upload
khangminh22 -
Category
Documents
-
view
0 -
download
0
Transcript of Embedded Competitiveness: Taiwan's Shifting Role in ...
Embedded Competitiveness: Taiwan’s Shifting Role in International
Footwear Sourcing Networks
Lu-Lin Cheng Department of Sociology
Duke University
1
Embedded Competitiveness:
Taiwan’s Shifting Role in International Footwear Sourcing Networks
ABSTRACT
The thesis studies Taiwan’s shifting role in international footwear sourcing networks over
the last three decades. It draws on multiple sources of data, including in-depth interview,
field observation, and published data, to construct phases and faces of the socially
embedded market. The research points to the anomalies in the comparative advantage
theory, evaluates the weakness of the state-centered and production-centered sociological
approaches in giving satisfactory explanations, and demonstrates a global commodity
chain approach which analyzes the changing institutional infrastructure, social
networking, and transaction organizations that have been shaping the changing positions
of Taiwanese footwear producers in the footwear OEM export market. The study shows
that production site transitions in the world footwear market are not universalistic.
Given similar state policy and environmental challenges on the global and local levels,
the differences between the Japan-to-Taiwan and Taiwan-to-China transitions reveal the
historically contingent and organizationally operated nature of markets.
2
TABLE OF CONTENTS
Acknowledgements............................................................................................................6
List of Tables ................................................................................................................. 7
List of Figures and Maps .............................................................................................. .9
Part I Case, Theory, and Method
Chapter 1 The Global Footwear Market and the Taiwanese Footwear Industry .......11
The World Footwear Market and the Fable of Economics................................11
Taiwan and its Miracle Economy......................................................................19
The Footwear Industry in the Industrialization of Taiwan.................................21
The Footwear Question: Taiwan’s Shifting Role in International Market........ 27
Chapter 2 Theory, Major Arguments, and Method ............................................30
Economics vs. Sociology: Fundamental Statement.......................................... 31
From Comparative Advantage to Commodity Chain........................................34
Price-Mediated Market vs. Trust-Mediated Market......................................... 44
Trust, Transaction Organization, and Institutionalized Resource ................... 51
Research Method I: Qualitative Interview.........................................................58
Research Method II: Field Observation............................................................ 64
Phases of the Research...................................................................................... 68
Part II Taiwanese Footwear Industry in its Booming Years (1960-1986)
Chapter 3 Institutional Formation of the Industry: From TPSEA to TFMA..... 77
Historical Origins of the Taiwanese Footwear Industry: Straw Hat Exports.... 78
The Growth of Upstream Plastic Industry........................................................ 84
The Birth of TPSEA and the Industry Institutionalization............................... 87 3
Evaluating the Japanese Influence.................................................................... 90
Protectionism Came After Booming Growth: OMA........................................ 96
Economics’ Evaluation on OMA.....................................................................101
Taking Advantage of OMA Institutionally: The Birth of TFMA................... 104
Taking Advantage of OMA Institutionally: Quota Management....................106
Chapter 4 The Socially Embedded Footwear Commodity Chain.......................112
Shop-floor Arrangement of a Taiwanese Footwear Factory............................113
Footwear OEM Export Network: Beyond In-house Production......................120
The Historical Formation of Footwear Marketing Networks in Taiwan........ 125
Expansion of the Production Network in Taiwanese Footwear Industry........136
Dynamism of the Taiwanese Footwear Subcontracting Networks..................145
Chapter 5 The Design-Sensitive Market, New Competition, and Market Closure
..........................................................152
The Emergence of New Competition in the 1980s..........................................154
Design-Intensiveness and Development Uncertainty in DS Transaction....... 161
Faces of Network Closure in the DSM: Exclusive Sourcing.......................... 165
Faces of Network Closure in the DSM: Tight Coupling................................ 175
Faces of Network Closure in the DSM: Culture of Commitment.................. 179
Chapter 6 The Cost-Sensitive Market, Flexible Imitation, and Quick Response
..........................................184
Cost-Sensitive Buyers and the Follower Strategy........................................... 185
Speed, Timing of Entry, and Flexible Imitation............................................. 190
Risk, Timing of Exit, and the Use of Competition .........................................198
Quick Response and Cushion Nets in Overlapping Networks........................205
Part III Industry Internationalization (1987-1995)
4
Chapter 7 Institutional Embeddedness of FDI in China.................................. 212
Industrial Crisis of the Taiwanese Footwear Industry.....................................214
Searching for a “Second Spring” in China..................................................... 219
Dong-Guan: the Taiwanese Shoe Nest in China..............................................221
Institutional Embeddedness as Buffering: FDI in Disguise.............................227
Restructuring a Labor Regime........................................................................ 233
The Formation of a Taiwanese Footwear Industrial District...........................239
Chapter 8 Restructuring Regional Sourcing Networks in the 1990s............... 246
Division of Labor Regionalized: Triangle Manufacturing..............................247
Cheap Labor is Not Easy to Use: the Buyer’s First Move...............................255
Invisible Shoe Nest in Taiwan: a Strong Sourcing Arm for Buyers................260
Production Site Transition: Limits of Comparative Advantage.......................269
Reference.................................................................................................................278
Appendix I Interviewee List........................................................................................ 295
Appendix II Abbreviations and Acronyms...................................................................299
Appendix III Maps .......................................................................................................287
5

ACKNOWLEDGEMENTS The intellectual integrity and infinite patience of my advisor, Dr. Gary Gereffi, have always
been the benchmark for my learning. I hope this thesis proves worthy of the many discussions
we have conducted and the encouragement he has given me over the years. I am also indebted
to Dr. Nan Lin, Dr. John Wilson, Dr. Angela O’Rand, Dr. Thomas Janoski, Dr. Gao Bai, Dr. G. S.
Shieh, Dr. C.M. Ka, and Dr. C. Y. Wu for their comments and suggestions, which helped me
clarify my dissertation significantly. The last four professors invited me to the area of economic
sociology. I hope this thesis, as my first step, shows the same encouragement. Dr. Hsin Huang
Michael Hsiao and Dr. Cheng-Kuang Hsu were the advisors of my master thesis in the National
Taiwan University. I apreciate their continuing support during my stay at the Institute of
Ethnology.
I want to thank those friends I met during the fieldwork who not only made the research
possible but also a rich journey: Morris Lin, Popper Hsu, Michael Cooper, Kenith Luo,
Mao-Shuh Ren, Yi-Kun Lin, Justine Wang, Wei-Chin Lee, Homer Lu, You-Tsu, Jack Lin, Seio
Nakajima, Shiro Honda, James Mann, Calvin Kao, Albertto Dy, and many others who kindly
offered precious time and wisdom to my research. Many wonderful friends, An-Ru, Mei-Lin,
Latiff, Hon-Chiu, Insook, Chih-Jou, Jinn-Yuh, and Irene, to name just a few, have been
challenging me to give the thesis a better shape. I wish their research successful. Thanks also
go to two institutes: the Institute of Ethnology, Academia Sinica, which provided me a very
supportive research environment, and the Chiang Ching-kuo Foundation, which offered me a
research fellowship for my fieldwork.
My wife, I-Yin, has accompanied me over the years, especially during the most difficult
time of the research, with loving support and hard-earned money. This thesis is as much hers as
my own. It’s now time for me to support her carreer. I hope her dream will come true in the
very near future.
We thank our parents who have been encouraging us in both our family life and individual
careers. Finally, this thesis is dedicated to my grandmother, Her-Li (1909-1995), who passed
away a year ago after a year of difficult struggle with a serious stroke. We had learned from her
a fading tradition of Taiwanese culture and are still nurtured by her endless care and love.
We will always miss her.
6
LIST OF TABLES Table 1-1 Market Shares of US Non-Rubber Footwear Imports, by Volume
Table 1-2 Wage and Unit Price of Footwear Exports in Selected Countries (1990)
Table 1-3 General Features of Taiwanese Society and Economy
Table 1-4 Number of Registered Footwear Factories, 1969-1994
Table 1-5 Ranks of Taiwan’s Principle Export Industries (1981-1994)
Table 2-1 Dimensions of Trust and their Network and Institutional Resource
Table 2-2 Four Phases of the Research
Table 3-1 Geographical Distribution of Footwear Factories in Taiwan (1991)
Table 3-2 Structure of Plastic Shoe and Plastic Goods Industry
Table 3-3 The Structure of Japanese Footwear Exports (unit: million US $)
Table 3-4 Approved DFI and Capital Formation, selected years
Table 3-5 Export Sales and Unit Prices of Shoes from Taiwan by Year
Table 3-6 Taiwanese Footwear Exports By Destination (1985-1994)
Table 4-1 Export Marketing Channels of Taiwanese Footwear
Table 4-2 L/C Payment in Total Export Trade from Taiwan, 1976-1992
Table 4-3 Average Size of Taiwanese Shoe Factories by Year
Table 4-4 The Structure of Footwear Industry in Taichung County (1986)
Table 4-5 Size Distribution of Footwear Firms in Taichung County
Table 4-6 Piece Work Price List for Athletic Shoe Upper, 5/25/1987
Table 4-7 Gender Structure of Taiwanese Shoe Industry
Table 5-1 The Causes and Consequences of Network Closure in the DSM
Table 5-2 Major Athletic Shoe Buyers and Their Taiwanese Suppliers
Table 6-1 Transaction Cycles in the CSM and the DSM
Table 6-2 Factory H’s Production Schedule for Late-March (an example)
Table 7-1 Changes in Exchange Rates against US dollars (Three Currencies)
Table 7-2 Ratio of Exports and Imports to GDP: Guang-Dong and Whole China
Table 7-3 Footwear Industry of Guang-Dong Province
Table 7-4 Basic Statistics of Dong-Guan City (1980-1993)
7 Table 7-5 Total Exports of Major Cities in Guang-Dong Province, China (1993)

Table 7-6 Average Monthly Wage of Guang-Dong and Adjacent Provinces
Table 8-1 The Operation of Taiwanese Footwear Factories in China
Table 8-2 The Export Value of Taiwanese Footwear and Machinery
Table 8-3 Production Volume of Taiwanese Synthetic Leather Industry
Table 8-4 The Regional Offices of Reebok’ Supplying Firms in China (1993)
Table 8-5 Converse’s Footwear Sourcing Network (1995)
Table 8-6 Nike’s Footwear Sourcing Network (1994)
Table 8-7 Two Waves of Production Site Transition in East Asia
8
LIST OF FIGURES AND MAPS
Figure 2-1 The Nested Structure Underlying Economic Interactions
Figure 2-2 Export Roles in the Global Economy by Major Third World Regions
Figure 3-1 U.S. Import and Domestic Production of Nonrubber Footwear, 1968-1990
Figure 4-1 Shop-Floor Layout of a Taiwanese Footwear Factory
Figure 4-2 The Production Procedures of an Athletic Shoe
Figure 4-3 Related Industries of Footwear Production
Figure 4-4 A Schematic Flow of an OEM Transaction
Figure 4-5 The Structure of OEM Market Networks
Figure 4-6 Three Clusters of Footwear Factories in Tsau-Tun Township
Figure 4-7 The Structure of Footwear Subcontracting Networks in Taiwan
Figure 5-1 Order Adjustment in Sourcing Network (An Example from Reebok)
Figure 5-2 A Simplified Map of Pou-Chen’s Taiwan Factory
Figure 8-1 Regionalized Footwear Production/Sourcing Networks
Figure 8-2 The Proportion of Footwear Supply from Taiwan to Payless
Map 1-1 Taiwan and its Neighbor Countries
Map 1-2 The Main Island of Taiwan
Map 7-1 Pearl River Delta and Dong-Guan City
9

PART I
CASE, THEORY, AND METHOD
10
Chapter 1 The Global Footwear Market and the Taiwanese Footwear Industry
We begin the thesis with a quick tour of the footwear industry over the last three
decades.1 We look both at the shifting global landscape of world footwear supply and
the development of the industry in Taiwan, a major supplying country. The subject is a
developing country’s labor-intensive manufacturing exports to the world market. The
story appears to be just another boring repetition about the mighty power of the
universalistic market’s invisible hand. Sociological curiosity however directs our
interest to the surprising twists and turns in the industry history. In the section about the
international market, we point to the empirical anomalies with which the price-making
market fails to cope. Sociology invites us to see markets as social constructions. The
formation and transformation of the Taiwanese footwear industry provide an excellent
opportunity to embed our quest for a sociological understanding in an empirically rich
context.
The World Footwear Market and the Fable of Economics
When I entered the field in 1993, the shoe industry of Taiwan was experiencing
turbulence after years of steady growth. A major exporting industry of the so called
“Taiwan Miracle” before the late 1980s had become negligible on the landscape. A
11
1 This chapter is designed to introduce the global and national contexts of Taiwanese footwear industry and
also highlight the questions that the thesis is intended to answer. Because of the intentions, much of the
descriptions in the chapter are not fully documented, but they will be empirically substantiated in the
subsequent chapters. I have also tried to avoid from framing my central concern too much in abstract
theoretical language. The main purpose of this chapter, as theory is concerned, is to highlight the
empirical sources of sociological theoretical interest.
colleague at the Institute of Economics of the Academia Sinica who had studied the
industry the year before gave me his observation. Footwear production is a typical
labor-intensive consumer goods industry; and the market is extremely competitive due to
the low entry barrier. As a country’s labor costs increase, other countries with better
comparative advantage (i.e., cheap labor) will inevitably take over the industry. Price
competition attracts new firms and drives old ones out by differential profit margins.
The economist’s story is not at all surprising to me, including the hard-hearted moral
about the responsibility of the scientist to be objective. What surprised me was his
confidence that no actual observation of factory operation or market transactions were
necessary for him to make his analysis. The best way to show the strength of
mainstream economics is by looking at the international trade statistics over years.
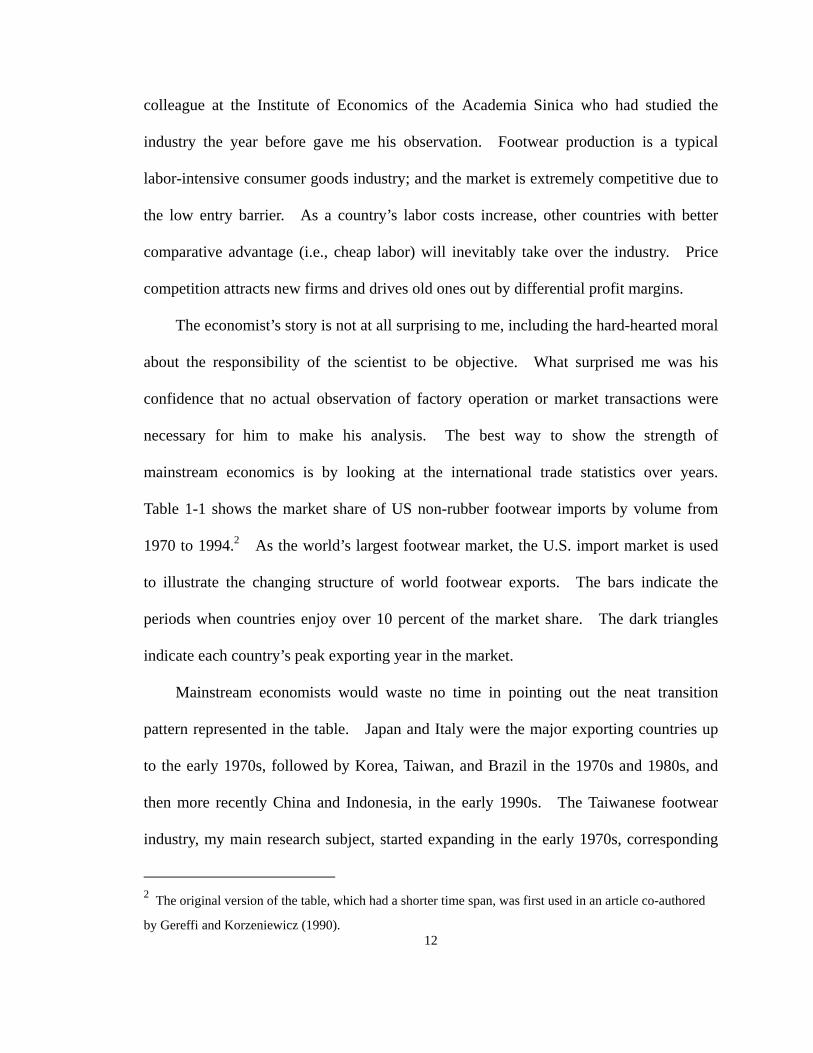
Table 1-1 shows the market share of US non-rubber footwear imports by volume from
1970 to 1994.2 As the world’s largest footwear market, the U.S. import market is used
to illustrate the changing structure of world footwear exports. The bars indicate the
periods when countries enjoy over 10 percent of the market share. The dark triangles
indicate each country’s peak exporting year in the market.
Mainstream economists would waste no time in pointing out the neat transition
pattern represented in the table. Japan and Italy were the major exporting countries up
to the early 1970s, followed by Korea, Taiwan, and Brazil in the 1970s and 1980s, and
then more recently China and Indonesia, in the early 1990s. The Taiwanese footwear
industry, my main research subject, started expanding in the early 1970s, corresponding
12
2 The original version of the table, which had a shorter time span, was first used in an article co-authored
by Gereffi and Korzeniewicz (1990).
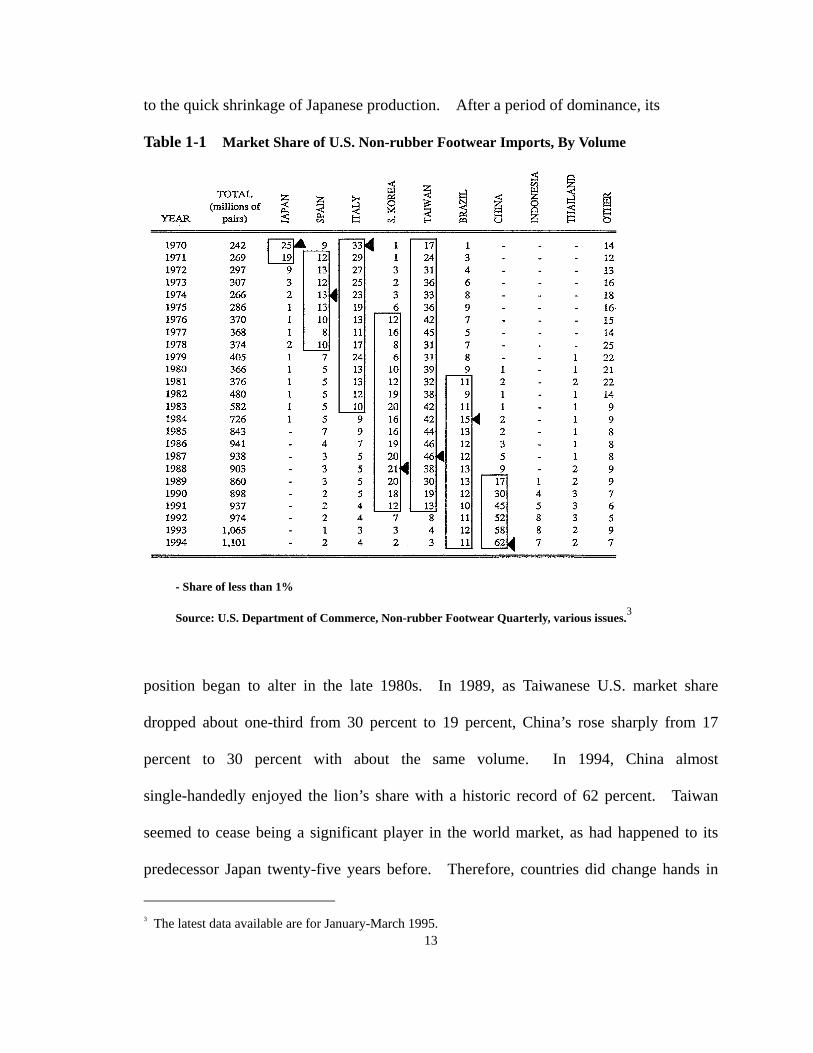
to the quick shrinkage of Japanese production. After a period of dominance, its
Table 1-1 Market Share of U.S. Non-rubber Footwear Imports, By Volume
- Share of less than 1%
Source: U.S. Department of Commerce, Non-rubber Footwear Quarterly, various issues.3
position began to alter in the late 1980s. In 1989, as Taiwanese U.S. market share
dropped about one-third from 30 percent to 19 percent, China’s rose sharply from 17
percent to 30 percent with about the same volume. In 1994, China almost
single-handedly enjoyed the lion’s share with a historic record of 62 percent. Taiwan
seemed to cease being a significant player in the world market, as had happened to its
predecessor Japan twenty-five years before. Therefore, countries did change hands in
13
3 The latest data available are for January-March 1995.
sequence as the primary production site for the world footwear market, just as
comparative advantage theory would predict.
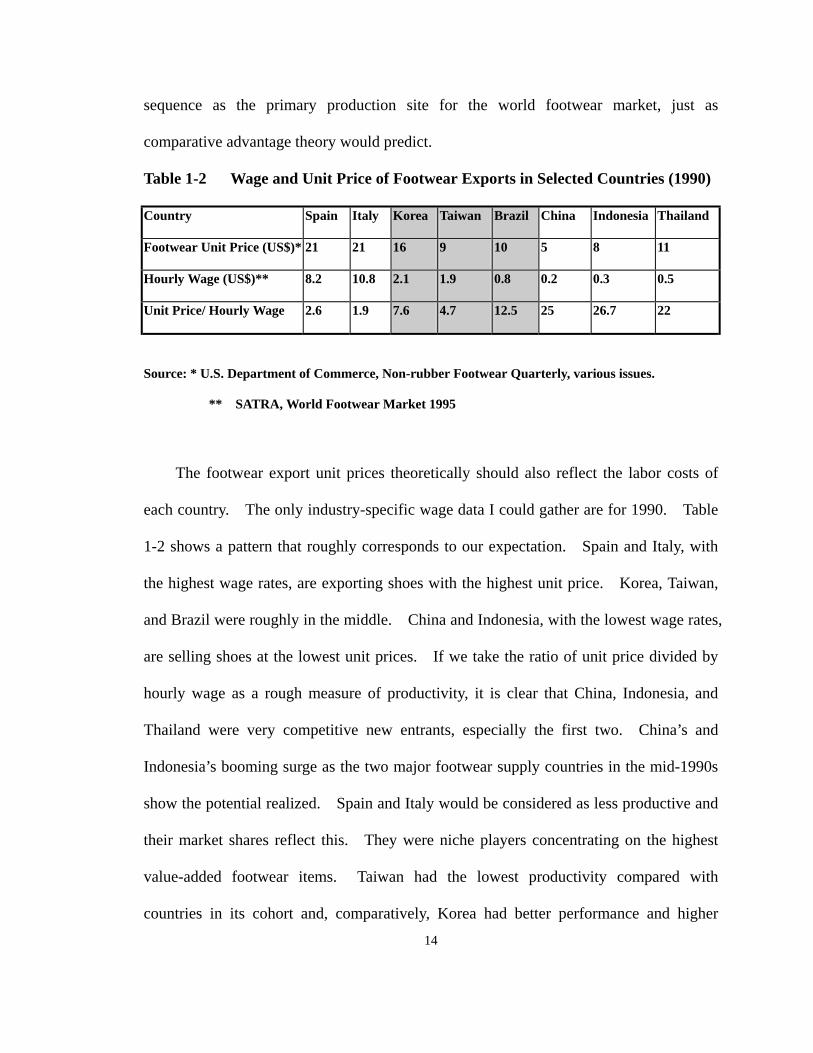
Table 1-2 Wage and Unit Price of Footwear Exports in Selected Countries (1990)
Country Spain Italy Korea Taiwan Brazil China Indonesia Thailand
Footwear Unit Price (US$)* 21 21 16 9 10 5 8 11
Hourly Wage (US$)** 8.2 10.8 2.1 1.9 0.8 0.2 0.3 0.5
Unit Price/ Hourly Wage 2.6 1.9 7.6 4.7 12.5 25 26.7 22
Source: * U.S. Department of Commerce, Non-rubber Footwear Quarterly, various issues.
** SATRA, World Footwear Market 1995
The footwear export unit prices theoretically should also reflect the labor costs of
each country. The only industry-specific wage data I could gather are for 1990. Table
1-2 shows a pattern that roughly corresponds to our expectation. Spain and Italy, with
the highest wage rates, are exporting shoes with the highest unit price. Korea, Taiwan,
and Brazil were roughly in the middle. China and Indonesia, with the lowest wage rates,
are selling shoes at the lowest unit prices. If we take the ratio of unit price divided by
hourly wage as a rough measure of productivity, it is clear that China, Indonesia, and
Thailand were very competitive new entrants, especially the first two. China’s and
Indonesia’s booming surge as the two major footwear supply countries in the mid-1990s
show the potential realized. Spain and Italy would be considered as less productive and
their market shares reflect this. They were niche players concentrating on the highest
value-added footwear items. Taiwan had the lowest productivity compared with
countries in its cohort and, comparatively, Korea had better performance and higher 14
productivity. This reflected the massive offshore investment of Taiwanese footwear
producers and government-assisted industrial rationalization in Korea as they responded
to an industrial crisis in 1990.
The transitions are manifested in different trajectories. Italy, Spain, and Brazil are
in the same trajectory, while Japan, Taiwan, Korea, and China are in another. Women
leather shoes is the major market niche of the first group. In 1993, Italy produced 452
million pairs of shoes, 313 million were leather and 166 million were for women. Spain
has a similar structure. Seventy-five percent of its 198 million pairs of shoes produced
in 1993 were leather. Among the leather shoes, 61 percent were for women. In terms
of export, 66 percent were leather shoes and 22 percent were textile shoes. Likewise,
Brazil’s 132 million pairs of shoe exports in 1991 included 89 percent of non-sports
leather shoes (SATRA 1995).
East Asian exports developed differently. The main item of East Asian footwear
exports had been sports shoes made of synthetic leather. As the industry upgraded,
sports shoes were increasingly made of real leather, but the category difference (i.e.,
sports shoes vs. dress shoes) still makes the two trajectories clearly recognizable.
Leather sports shoes comprised over 60 percent of footwear export value from Korea in
1992 (Footwear Industry Association in Korea 1993). In 1988, about 69 percent of the
leather sport shoes imported by the USA in volume came from Korea, and about 20
percent came from Taiwan. When the two countries dropped to 27 and 8 percent
respectively in 1992, Indonesia increased from less than one percent to 22 percent and
China 32 percent (Lim 1994: 570). Taiwan, different from Korea, had a long term
tradition of dress shoes with synthetic materials; athletic shoes gained increasing
15

importance only after the 1980s. In 1993, dress shoes, high heel, and boots together had
dropped to only eight percent of Taiwan’s exports, while sport shoes occupied 51.7
percent. The contrasting path is found elsewhere. Brazil had only about 1 percent of
sports shoes export in 1991. In the same year, only ten percent of Italy’s footwear
production were sports shoes.4
Of course, footwear exports from the countries are not completely segregated.
Some countries have a more diversified structure than others. Taiwan is a very good
case because it has been able to diversify into more categories, unlike Korea. Although
Taiwan started in the industry earlier, when diversified, it became a challenging
latecomer to Korean dominance in sports shoes. Because of its more diversified
structure, when dress shoes manufacturers were moved from Taiwan to China in the late
1980s, the Brazilian and Italian footwear industry began to feel the overwhelming threat
from the East Asia.
In other words, when the substitutability of products is low (e.g., not in the same
category), the co-variation between outputs of exporting countries declines, and as a
result, countries evolved in distinct ways. The best part of the economists’ story, which
they tout as about the “invisible hand,” ends about here.
Sociological curiosity provokes further questions however.
First of all, why did footwear exports from Taiwan come far earlier than in Korea
when they are in the same cohort? When Taiwan already enjoyed 17 percent of the US
market share in 1970, Korea was still at about 1 percent. And when Korea climbed to
12 percent in 1976, Taiwan’s share was 42 percent. Was it because that labor cost was
16
4 The exports figures based on function category are not available for Italy.
lower in Taiwan, especially considering the very low end shoes (e.g., slippers) they were
then producing? Evidence does not support this speculation. Taiwan’s GNP per capita
was US$ 140 in 1955, more than seventy percent above that of Korea. When the GNP
per capita of Korea reached US$ 150 in 1970, Taiwan moved up to US$ 312 (Levy 1988,
p.165). Comparative advantage provides no justification for the wide empirical
disparity between costs and performance at the stage of industry that was extremely labor
intensive. Socio-historic conditions must be taken seriously.
Another curious phenomenon is that two countries, Korea and Taiwan, dominated
the industry for almost two decades, strange given the long list of developing countries
waiting in line. In the athletic shoe market, Korea and Taiwan had over eighty percent
of the sports shoes market in their peak years of 1980s. In 1988, they together
controlled 90 percent of all leather athletic shoe imports to the USA. In 1987, they
contributed close to 70 percent of the US non-rubber footwear import market. While
Taiwan and Korea were losing their cost advantages in the late-1970s,5 not in the early
1990s, no other developing countries were able to seize the opportunity. It took another
ten years for the relocation to begin. The formation and transformation of a
labor-intensive industry involves more complex factors than just the marginal cost/profit
of maximizers in the competitive market.
In fact, with the second wave of transition inaugurated in the early 1990s, China’s 62
percent volume share in 1994 and 40 percent value share in 1993 show a further
concentration in the footwear supply market. Considering the ever-expanding US
(non-rubber) footwear import market, from 242 million pairs in 1970 when Taiwan took
17
5 Taiwan’s era of labor surplus came to an end early around 1968-1970 (Fei, Ranis and Kuo 1979).
over the position from Japan, to over 1 billion pairs in 1994, the increasing concentration
in footwear supply is even more dramatic than it appears. The lesson: the footwear
industry as the typical stepping stone for poor developing countries is not as big, or as
easily to step on, as economists would have us believe.
A recent industry survey of the Mexican footwear industry concludes that “the
optimism generated in the recent past soon became a spent force” and “the export
performance of the Mexican shoe industry must be judged as disappointing in that less
than ten percent of the output (22 million pairs) finds its way onto foreign market” (World
Footwear 1995). The article is in sharp contrast to an enthusiastic prediction made three
years ago about a “Mexican Footwear Revolution” (Kjelleren 1992). The expanding US
footwear import market has obviously not opened up as much as its size would suggest,
despite the aggressive tariff-reduction measures implemented by government-level
cooperation. The realities, which economists seem disciplined not to observe, urge us to
go beyond the factor endowment.6
“Why consistently East Asia?” A fruitful way of answering this question is to
examine closely the historical conjunctures of production site transition, partly because
they were also the times when opportunities for newcomers arose. With this approach, a
new set of questions logically follows. Who were the players involved in the transition
process? What conditions converged to trigger the transition? Were there two
different groups of buyers and suppliers, before and after the transition? How did the
18
6 In the model, economic units are too independent and egoistic to coordinate their actions; and for the
same reasons the price mechanism of the market will allocate them to their fittest positions according to
their cost structures. At the international level, the cost structure of firms could be bracketed and factor
endowment of nations stands out as the driving force (Krugman 1991).
new suppliers integrate various production factors? Did suppliers in the previous wave
give help (e.g., technical assistance) to firms in the new supplying country? Or, were
they involved in bitter competition for survival? Did buyers also change along with the
shift of production sites? Was the transition in the early 1990s when Taiwan was replaced
by China simply a repeat of the previous one in the late 1960s when Japan was leaving
the stage?
All these questions are related to an approach to understanding market dynamism
that steps away from the economist’s eternal (i.e., ahistorical) market. The aggregate
import-export data, which economists are keen to use, reach their limits. To explore
more deeply these questions, and to be better prepared to answer them, we must bring
both historical contingencies and actual firm behaviors back on stage. The global
bird’s-eye view of the shifting positions in the world footwear import/export structure
must now yield to a more concrete level of analysis that allows closer examination of
both history and actors in industry formation.
For that task, the story of Taiwanese footwear industry, with its longer span of
history, greater vitality and, most importantly, its perfect positioning in the intermediate
stage between Japan and China, is certainly worth examining. As we look closer at the
development of the industry in Taiwan, our questions can be re-phrased more specifically
and our quest for a sociological perspective can be embedded in rich empirical soil.
Taiwan and its Miracle Economy
Taiwan is situated in the Pacific Ocean about 100 miles from the southern coast of
the Chinese mainland. Located about midway between Korea and Japan to the north
19

and Hong Kong and Philippines to the south, Taiwan is at the geographical center
between the Northeast Asia and Southeast Asia. Shaped roughly like a tobacco leaf,
Taiwan is 245 miles long and 89.5 miles wide at its broadest point. The total area is
13,892 square miles, slightly larger than Maryland and Delaware combined. The
Central Mountain Range bisects Taiwan from north to south and about two-thirds of the
island is covered with forested peaks. Most of its 21 million population are
concentrated in the area composed of foothills, terraced flatlands, and coastal plains and
basins (see Map 1-1).
Table 1-3: General Features of Taiwanese Society and Economy
Selected Year 1960 1980 1994
Population (1,000 persons) 10,792 17,805 21,126
Exports (US$ billion) 0.2 19.8 93.0
Foreign Exchange Holdings 0.25 US$ billion (1965) 2.20 US$ billion 92.45 US$ billion
GNP (US$ billion) 1.7 41.4 244.2
GNP per capita (US$) 154 2344 11,604
Agriculture/GDP 28.5% 7.7% 3.6%
Industry/GDP 26.9% 45.7% 37.3%
Services/GDP 44.6% 46.6% 59.1%
Saving Rate* 17.8% 32.3% 26.5%
Distribution of Income** 4.4 (1974) 5.2 (1984) 5.4 (1993)
Illiteracy 27.1% 10.3% 6.0%
Unemployment Rate 4.0% 1.2% 1.6%
Average GNP Growth Rate 8.9% (1965-1994)
Area 13,900 miles2
* Gross National Saving/Gross National Product x 100 (%)
** Ratio of highest fifth’s (households) income to lowest fifth’s (households).
Source: Taiwan Statistical Data Book, Council for Economic Planning and Development (1995)
The economic growth of Taiwan has been spectacular, with an 8.9 percent average 20
growth rate from 1965 to 1994. With the world’s second highest population density at
2,422 people per square km of cultivated land and almost no natural resources, Taiwan
has successfully lifted its GNP from US$ 1.7 billion in 1960 to US$ 244 billion in 1994,
with foreign exchange holdings reaching over US$ 92 billion, second only to Japan.
The economic structure of Taiwan has experienced dramatic changes over the years.
The contribution of agriculture to GDP has decreased from 28.5 percent in 1960 to
merely 3.6 percent in 1994. The industrial sector’s contribution to GDP increased from
26.9 percent in 1960 to 47.1 percent in 1986; and after that, the success of
industrialization further stimulated the development of service sector to 59.1 percent in
1994. The speedy economic growth has not caused many of the problems created in
other developing countries. Income distribution has been amazingly equal. The ratio
of income for the top fifth of households to the bottom fifth was 5.4 in 1993, only a slight
increase from 4.4 in 1974. The unemployment rate has been very low since successful
industrialization and was 1.6 percent in 1994. The general features of Taiwanese
economy are listed in the Table 1-3. The economic success is measured not only by a
high growth rate, but also by the simultaneous achievement of equal income distribution,
and a low unemployment rate.
The Footwear Industry in the Industrialization of Taiwan
As one of the major export industries, the history of the footwear industry illustrates
the stages of the postwar economic development of Taiwan.
In 1949, the defeated Kuomintang (KMT) party was expelled from mainland China
and moved to Taiwan, with over two million refugees. Unemployment and inflation
21
were very serious problems7 and a massacre of Taiwanese civilians only two years
previous added to the social unrest. An ambitious land reform program was devised by
the ruling party to fostered social and political stability and increased agricultural
production. Taiwan’s import-substitution industrialization between 1953 and 1957 was
actually a first-aid measure to simultaneously preserve Taiwan’s scarce foreign exchange
and to produce essential consumer goods for self-sufficiency. This was the period of
after-war reconstruction.
Anticipating the end of American foreign aid, an economic reform program was put
in place in 1959, steering the economy toward export promotion. Taiwan’s first
export-processing zone (EPZ) was established in Kao-Hsiung in 1966, one year after the
withdrawal of aid, to attract foreign investment in labor-intensive industries. The
Taiwanese footwear industry began to develop at the same time, using mainly local
capital. It was one of the first waves of manufactured exports from Taiwan. Woven
slipper and sandals were the initial export categories.
The establishment of the Taiwanese Plastic Shoes Exporter’s Association (TPSEA)
in 1968 represents an important step in the formation of the industry. The 1973-74 oil
crisis hit Taiwan hard. Real GNP grew only 1.2 percent in 1974 and inflation climbed
to 47 percent, while exports declined in real terms by about 7 percent. The Taiwanese
government noticed the need for self-sufficiency in basic materials and intermediate
goods and adjusted its economy toward capital- and technology-intensive industries.
The Industrial Technology Research Institute was established in 1973 to assist industrial
22
7 The Taipei wholesale price index increased 260% in 1946, 360% in 1947 and 3500% in 1949 (Ho 1978, p.
104)
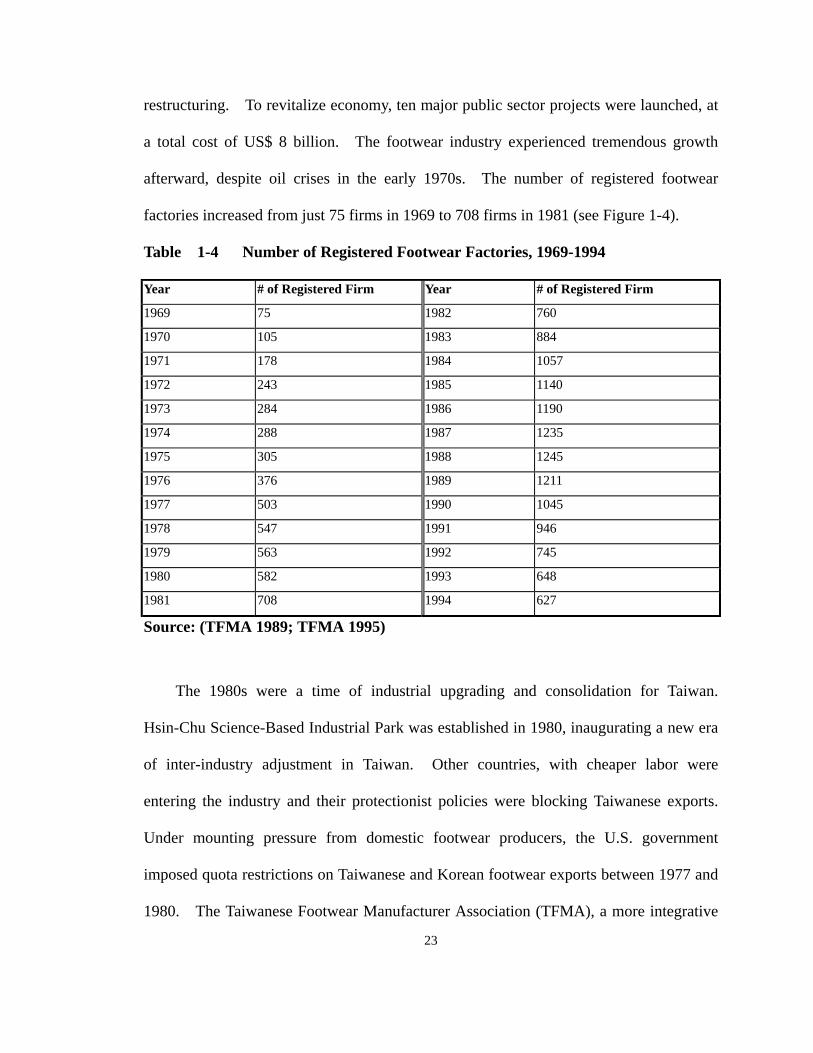
restructuring. To revitalize economy, ten major public sector projects were launched, at
a total cost of US$ 8 billion. The footwear industry experienced tremendous growth
afterward, despite oil crises in the early 1970s. The number of registered footwear
factories increased from just 75 firms in 1969 to 708 firms in 1981 (see Figure 1-4).
Table 1-4 Number of Registered Footwear Factories, 1969-1994
Year # of Registered Firm Year # of Registered Firm
1969 75 1982 760
1970 105 1983 884
1971 178 1984 1057
1972 243 1985 1140
1973 284 1986 1190
1974 288 1987 1235
1975 305 1988 1245
1976 376 1989 1211
1977 503 1990 1045
1978 547 1991 946
1979 563 1992 745
1980 582 1993 648
1981 708 1994 627
Source: (TFMA 1989; TFMA 1995)
The 1980s were a time of industrial upgrading and consolidation for Taiwan.
Hsin-Chu Science-Based Industrial Park was established in 1980, inaugurating a new era
of inter-industry adjustment in Taiwan. Other countries, with cheaper labor were
entering the industry and their protectionist policies were blocking Taiwanese exports.
Under mounting pressure from domestic footwear producers, the U.S. government
imposed quota restrictions on Taiwanese and Korean footwear exports between 1977 and
1980. The Taiwanese Footwear Manufacturer Association (TFMA), a more integrative
23
industrial association replacing TPSEA, was established in 1978 right after the
protectionism was taken place. Shocked by the quota, Taiwanese footwear producers
managed to upgrade and build even stronger ties with major footwear buyers.
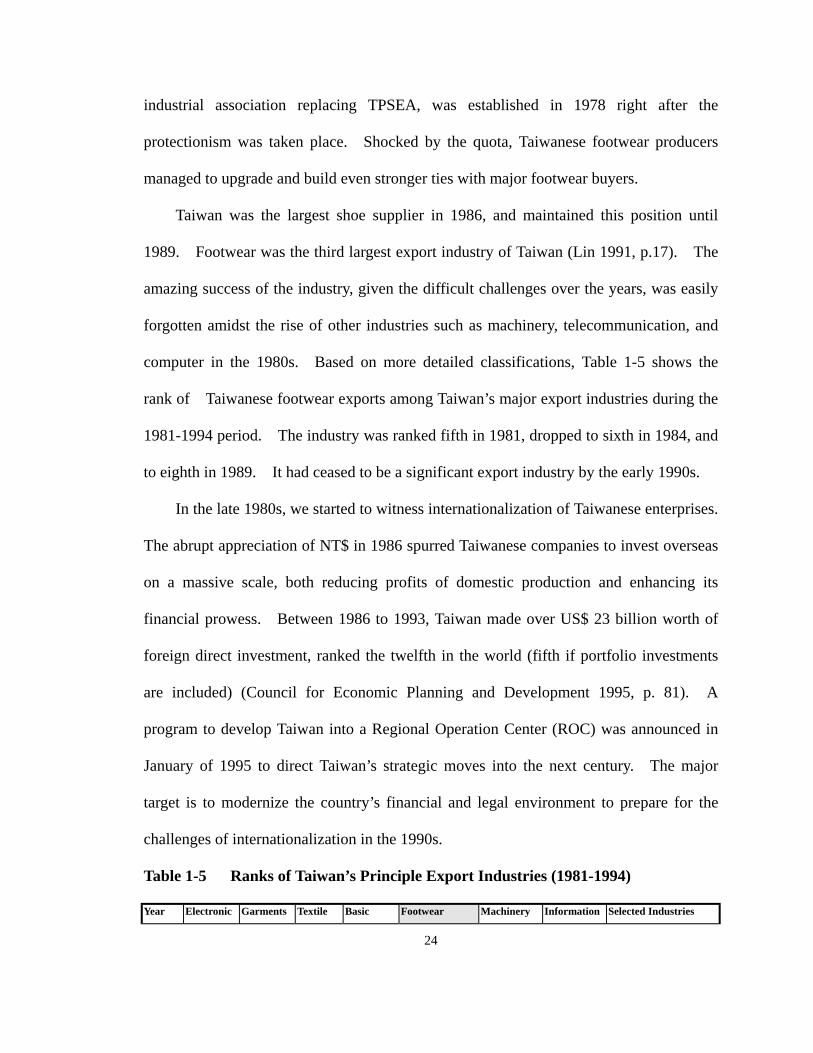
Taiwan was the largest shoe supplier in 1986, and maintained this position until
1989. Footwear was the third largest export industry of Taiwan (Lin 1991, p.17). The
amazing success of the industry, given the difficult challenges over the years, was easily
forgotten amidst the rise of other industries such as machinery, telecommunication, and
computer in the 1980s. Based on more detailed classifications, Table 1-5 shows the
rank of Taiwanese footwear exports among Taiwan’s major export industries during the
1981-1994 period. The industry was ranked fifth in 1981, dropped to sixth in 1984, and
to eighth in 1989. It had ceased to be a significant export industry by the early 1990s.
In the late 1980s, we started to witness internationalization of Taiwanese enterprises.
The abrupt appreciation of NT$ in 1986 spurred Taiwanese companies to invest overseas
on a massive scale, both reducing profits of domestic production and enhancing its
financial prowess. Between 1986 to 1993, Taiwan made over US$ 23 billion worth of
foreign direct investment, ranked the twelfth in the world (fifth if portfolio investments
are included) (Council for Economic Planning and Development 1995, p. 81). A
program to develop Taiwan into a Regional Operation Center (ROC) was announced in
January of 1995 to direct Taiwan’s strategic moves into the next century. The major
target is to modernize the country’s financial and legal environment to prepare for the
challenges of internationalization in the 1990s.
Table 1-5 Ranks of Taiwan’s Principle Export Industries (1981-1994)
Year Electronic Garments Textile Basic Footwear Machinery Information Selected Industries
24

Products Products Metals & Parts & Commun
1981 (1) (2) (3) (4) (5) 1.5 (6) - Toy & Sports G (7)
1982 (2) (1) (3) (4) (5) 1.5 (7) - Machinery (6)
1983 (1) (2) (3) (4) (5) 1.9 (6) - Toy & Sports G (7)
1984 (1) (2) (4) (5) (6) 2.3 (3) - Toy & Sports G (7)
1985 (2) (1) (3) (5) (6) 2.4 (4) (8) Toy & Sports G (7)
1986 (2) (3) (4) (6) (5) 3.1 (1) (8) Plastic Products (7)
1987 (2) (4) (3) (7) (6) 3.7 (1) (5) Toy & Sports G (8)
1988 (2) (6) (3) (5) (7) 3.9 (1) (4) Toy & Sports G (8)
1989 (2) (6) (3) (4) (8) 3.8 (1) (5) Plastic Products (7)
1990 (2) (8) (3) (4) (7) 3.5 (1) (5) Plastic Products (6)
1991 (3) (9) (2) (4) (8) 3.8 (1) (5) Plastic Products (6)
1992 (3) (10) (2) (4) (8) 3.7 (1) (5) Plastic Products (6)
1993 (2) (10) (3) (4) (9) 2.8 (1) (5) Plastic Products (6)
1994 (2) (9) (3) (4) (13) 1.7 (1) (5) Plastic Products (6)
Footwear and Parts column: billion US$.
Source: Taiwan Statistical Data Book, Council for Economic Planning and Development (1995)
The abrupt appreciation of the Taiwanese currency against the US dollar hit directly
the engine of exports. A labor shortage that had been haunting the industry, despite
flexible utilization of peripheral labor by the widespread putting-out system, hurt even
those firms which tried hard to upgrade into higher value-added niches. As the industry
moved toward the end of 1980s, a crisis was clearly in sight and the success story seemed
to be drawing to an end. The number of registered firms reached its peak in 1988 when
there were about 1245 registered firms. Subsequently, the industry started to decline,
falling to 627 firms in 1994. In just a few years, Taiwanese footwear producers lead the
first wave of offshore investment in post-war Taiwan, a challenge that both the Taiwanese
firms and the state had never before experienced. Years after being a backbone of
Taiwan’s postwar economic growth, the footwear industry became the forerunner of
Taiwan’s international investment in the 1990s.
25 Nine years after the first investment, the panic and frustration that once plagued

Taiwanese footwear producers were dissipated and a pattern of regional operation began
to emerge. The new structure is characterized by several features: 1) about 85 to 90
percent of footwear exports from China are now controlled by Taiwanese; 2) Chinese
state enterprises are actually discouraged from footwear exporting by Taiwanese
producers; 3) major footwear buyers, surprisingly especially those volume retailers who
are very sensitive to cost margin, remained in Taiwan; 4) Taiwan has become the world
center of footwear material and machinery supply; and 5) footwear sourcing transactions
now operate in a triangle system where orders are received, materials are procured, and
models are developed in Taiwan, productions are carried out in China, and finished goods
are shipped from Hong Kong.
The success story continues, as shown in the title of a journal report on the
Taiwanese footwear industry: “Another Sunrise of a Sunset Industry.” About seven
years ago, the Taiwanese official in charge of industrial development announced that shoe
manufacturing was a sunset industry. Years later, the current head of the Ministry of
Economic Affair, Bin-Quern Chian, on many occasions used the Taiwanese footwear
industry as a model of successful offshore investment. “The Made in Taiwan” era of the
industry is ending. But the industry has not died; it actually prospers. It is now shoes
“Made in China, the Philippines, Indonesia, or Vietnam by Taiwanese,” said Mr. Chian
before departing to Subic Bay for the opening ceremony of a Taiwanese-developed
industrial port in the Philippines.
The history of the industry parallels the stages of economic development of postwar
Taiwan. Footwear export was an important industry in the first wave of Taiwan’s export
growth in the late 1950s, when export promotion began. After a period of speedy
26
growth, it struggled to maintain momentum under severe competition and protectionism
in the late 1970s and early 1980s, and strove to reach its peak year in 1988 with nearly
US$ 4 billion of export value.8 However, its remarkable success under environmental
toughness was outshone by rising-star industries like machinery, information, and
tele-communication in the late 1980s (see Table 1-5). After a period of confusion and
frustration, it becomes clear that Taiwanese footwear producers have continued their
domination of the now regionally-operated footwear sourcing/ supplying networks.9
The Footwear Question: Taiwan’s Shifting Role in the International Market
The case of the Taiwanese footwear industry allows us to re-phrase the sociological
questions that we raised early in the chapter in a more specific context. Some countries,
such as Italy, are able to survive by making the highest value-added shoes for the world
market. The reasons why Italy has been able to continue its dominance in this niche
deserve careful examination. (Rabellotti 1995). The formation and transformation of
the Taiwanese footwear industry, which has been competing in the middle price-range,
are no less intriguing. Low wages alone do not explain success in the world market.
Despite low labor costs, closeness to the US market, and bilateral government
cooperation on tariff reduction, Mexican footwear exports have not lived up to that
expectation. The same question applies to the late development of the footwear industry
compared to Taiwan. Even though China opened its economy in the late 1970s and
Taiwan suffered labor shortages and protectionism, Taiwan still continued its dominance
8 This feature includes exports of both finished footwear and parts.
27
9 The detailed discussion will be presented in the chapters to follow.
in the world footwear market for over ten years. What are the barriers preventing
buyers shifting their orders to countries with far lower labor costs?
Based on the deductive model, we can always make the post de facto explanation
that the offshore investment of Taiwanese footwear producers reflects their declining
comparative advantage, and we could surely imagine a day when the Taiwanese are
completely replaced by the Chinese, who have direct contacts with Western buyers. The
question nevertheless remains: how do we explain the regional triangle manufacturing if
the footwear industry is understood only as labor-intensive and the market as only a
pricing mechanism? What are the assets Taiwanese producers withhold that allow them
to conduct direct investment in China, given the supposedly low entry-barrier in the
footwear industry? In other words, what are the barriers for fuller local participation in
China beyond simple labor inputs?
Although Taiwan has ceased to be a significant production base for the world
footwear market, and high-tech industries, like semiconductors, are driving the
Taiwanese economy toward a more advanced stage, a study that examines the formation
and transformation of the Taiwanese footwear industry is not simply a retrospective look
inspired by nostalgia. The exportation of footwear has been an industry representative
of Taiwan’s remarkable economic development. Even the industry’s offshore
investments in the 1990s are leading the way for other more advanced industries.
However, it is also a case that is most likely to be overlooked or misunderstood because
of its labor-intensiveness and severe competition. Without a clear understanding of the
historically-grounded and socially-embedded dynamism of Taiwanese footwear industry,
we would continue to examine even the more advanced industries through the simplistic
28

model of comparative advantage and its underlying theory of the universalistic market.
29
Chapter 2 Theory, Major Arguments, and Method
The thesis presents the result of sociological research on international trade,
specifically about the shifting role of Taiwan in the international footwear sourcing
networks. It is intended as an integrative research project that (1) combines the wisdom
of both developmental sociology and economic sociology, (2) explores a subject that has
rarely been touched in both fields, and (3) tries to push sociology into an area that has
been dominated by mainstream economics. Taiwanese footwear exports are chosen as
the case for the project because they represent a most-likely case of the competitive
market of mainstream economics in one of the most successful economies in the
developing world.10
This is not the first time that developmental sociology and other areas of sociology
have co-operated. In the 1980s, we witnessed the state-centered development studies
emerging concurrently with another stream in sociology to “bring the state back in” and
restore a historical sensibility traced back to our discipline’s classic tradition (Giddens
1981; Skocpol 1984; Evans 1985). Likewise, my current project would not be possible
without the research agenda represented in Gereffi’s framework of global commodity
chains (GCC) and the resurgence of economic sociology which climaxed in the
publication of The Handbook of Economic Sociology in 1994 (Swedberg 1990; Block
30
10 On the platform of developmental sociology, it examines the organizational features of the footwear
supply market in East Asia in order to shed new light on the development issue about the driving
mechanism of East Asian export-oriented industrialization. On the ground of economic sociology, the
thesis intends to illustrate the socially embedded conception of market by examining a most likely case of
the opposing mainstream free market and also pushes the economic sociology into the new terrain of the
international trade.

1990; Smelser and Swedberg1994).
This chapter describes the design of the research project. The first half discusses
the theoretical literature, the contending theories, and my alternative explanation. The
second half deals with methodological issues about how the research was conducted.
The fundamental theoretical statement I want to make in the thesis is that markets can be
more fruitfully analyzed as social constructions than seen as price mechanisms that
allocates resources without social coordination. I support this statement by
demonstrating how it can provide better answers to the anomalies in international trade
than those supplied by the price-mediated market.
The theoretical part of the chapter proceeds on two related theoretical contexts.
The context of developmental sociology creates a theoretical subject out of the Taiwanese
footwear industry. I point out the limits of current sociological approaches in filling the
theoretical void that mainstream economics leaves and explain how Gereffi’s GCC model
is providing a promising alternative which requires us to look at the market as socially
constructed. Economic sociology provides us with more detailed conceptual tools to
develop arguments regarding the social processes of market formation and the shifting
position of its constituent firms. The methodological section introduces the two major
methods I use in my research. My research experiences in conducting in-depth
interviews and participating in field observation are discussed. An introduction to the
phases of my research ends the chapter.
Economics vs. Sociology: Fundamental Statement
Most sociologists would agree that markets are social constructions. The social
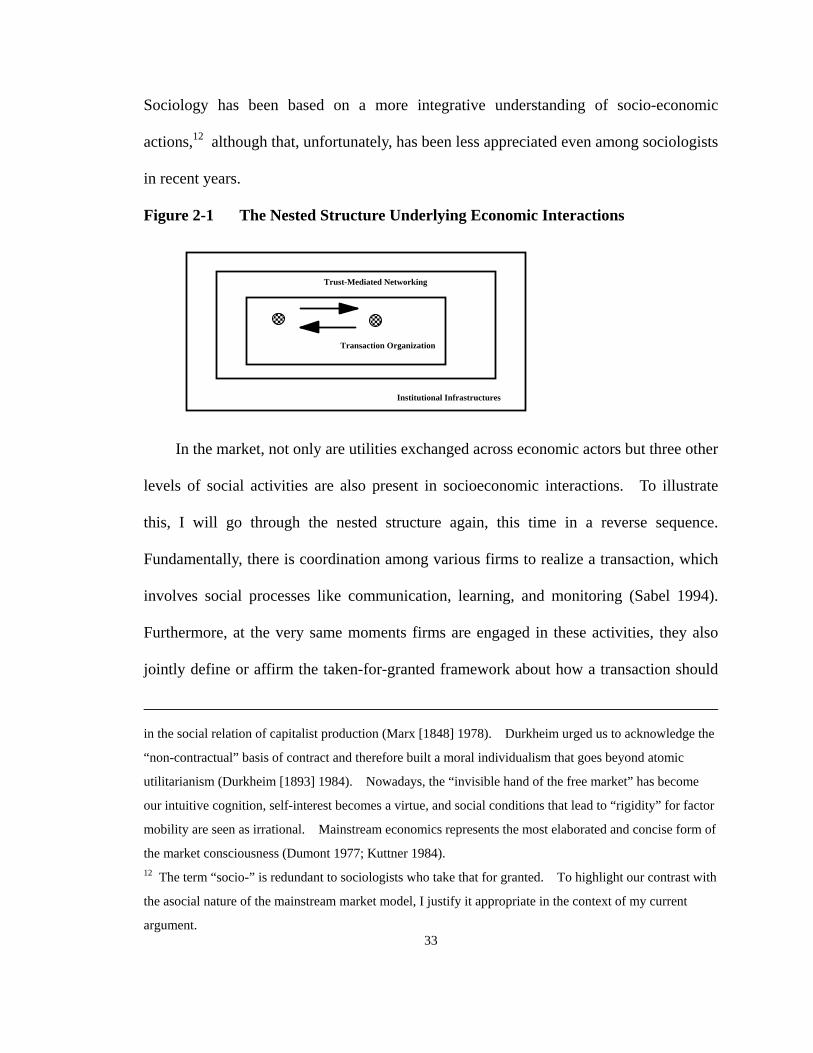
31
factors that come into economic transactions can be conceived as three levels of a nested
structure. There is, at the very bottom, the institutional infrastructure of economic
transactions which involves exogenous sources of influence through organizations not
directly involved in transactions, such as industrial associations and government agencies.
Above that there are social networks among economic agents which accumulate and use
institutionalized resources as social capital in facilitating trust in transactions. Finally, at
the technical core of market, economic interactions are patterned behaviors with
recognizable features, which I will call “transaction organization” in the thesis. Firms in
an industry continue to grow because supporting institutions are in place, business
networks are maintained, and transactions are well coordinated. The thesis intends to
explain the formation and transformation of Taiwanese footwear industry by examining
closely the social construction of the international footwear sourcing market where they
reside.
This approach distinguishes my position clearly from the price-mediated market
model of mainstream economics I argue against in the thesis. My argument does not
deny the rational calculation of economic actors, much emphasized by the followers of
the economic model, but rather alleges its incompleteness. The weakness of the
price-mediated market model is disguised by the deductive nature of modern economics.
Reflection upon the historical origin and social consequences of the “self-regulating”
capitalist market have been central to our discipline since the early founders. 11
32
11 Weber studied historically the complex institutional infrastructures of Western capitalist economies and
the unintended consequences that negate individual freedom (Weber [1906-24] 1946). Marx unveiled the
hidden abode of the capitalist free market and struggled to restore the freedom of labor which is exploited
Sociology has been based on a more integrative understanding of socio-economic
actions,12 although that, unfortunately, has been less appreciated even among sociologists
in recent years.
Figure 2-1 The Nested Structure Underlying Economic Interactions
������������
������������
Transaction Organization
Institutional Infrastructures
Trust-Mediated Networking
In the market, not only are utilities exchanged across economic actors but three other
levels of social activities are also present in socioeconomic interactions. To illustrate
this, I will go through the nested structure again, this time in a reverse sequence.
Fundamentally, there is coordination among various firms to realize a transaction, which
involves social processes like communication, learning, and monitoring (Sabel 1994).
Furthermore, at the very same moments firms are engaged in these activities, they also
jointly define or affirm the taken-for-granted framework about how a transaction should
in the social relation of capitalist production (Marx [1848] 1978). Durkheim urged us to acknowledge the
“non-contractual” basis of contract and therefore built a moral individualism that goes beyond atomic
utilitarianism (Durkheim [1893] 1984). Nowadays, the “invisible hand of the free market” has become
our intuitive cognition, self-interest becomes a virtue, and social conditions that lead to “rigidity” for factor
mobility are seen as irrational. Mainstream economics represents the most elaborated and concise form of
the market consciousness (Dumont 1977; Kuttner 1984).
33
12 The term “socio-” is redundant to sociologists who take that for granted. To highlight our contrast with
the asocial nature of the mainstream market model, I justify it appropriate in the context of my current
argument.
be seen, what their relationships are, and what each party expects of the other. Finally,
the institutionalized environment of a transaction provides social capital to the residing
firms making possible future transactions.
A market is a “socially embedded” reality sui generis that cannot be reduced to
atomic individuals in competition.13 Once the multi-dimensional social underpinning of
economic action is taken into consideration, factors such as conventions, historical stage,
legitimization, coercion, norms, tacit knowledge, and patterned behaviors become
essential to our analysis of market formation. The following discussion will show why
this perspective is necessary to our research subject. We elaborate on the social
embeddedness later.
From Comparative Advantage to Commodity Chain
There have been various debates on international trade about the source of national
prosperity dating back at least to the eighteenth century between those who emphasized
international trade and those who stressed domestic agriculture (Smith [1776] 1976).
After the World War II, many economists optimistically believed selective policies based
on the import-substitution principle could bring balanced economic growth to developing
countries (Hirschman [1958] 1978). After the failure of the import-substitution policy
in Latin America in the early 1970s, dependency theory emerged arguing that increasing
34
13 A major function of concept is to distinguish. The concept of “embeddedness” was first raised by
Polanyi ([1944] 1957) in his study on the historical formation of the self-regulating market and its
empirical impossibility as manifested in the counter-movement to commodification of social fabrics .
Granovetter (1985) adopts the term to emphasize the profound social networking in economic transactions
which cannot be reduced to economic rationality.
participation in international trade simply traps developing countries in unequal
exchanges with core developed countries (Frank 1967; Amin [1973]1976 ). The issue
consequently shifted ground to criticisms of the “linear, Euro-centric, and ahistorical”
model of modernization theory. With certain adjustments, the dependent development
variant of the dependency group emerged in the late 1970s (Cardoso 1979; Evans 1979),
followed by a bargaining model that emphasizes interactions among the state, foreign
capital, and domestic capital (Gereffi 1983). The analysis of international trade shifted
its focus to the role of foreign capital and how the state in capital-receiving countries
could use it positively. The state-centered approach gained shape within this context.
The tremendous economic growth of the East Asian newly industrializing countries
(NICs), which relied heavily on export trade, in contrast to the worsening debt crisis in
Latin America, cast serious doubts on classic dependency theory (Barrett 1982) and
brought the free market model of mainstream economics back to center stage in the 1980s
(Balassa 1981). The state-centered theories quickly challenged the self-claimed triumph
of free market proponents in explaining East Asian industrialization (Deyo 1987; ;
Henderson 1987; Amsden 1989; Wade 1990; Deyo 1995). In one way or another,
criticisms of the model all point to the importance of state actions in facilitating economic
growth, whether by suppressing labor resistance (Deyo 1987), making the price wrong
(Amsden 1989), or strategic planning (Wade 1990). Another contrasting sociological
approach emphasizes a bottom-up perspective, studying the social process of labor
control, instead of state policies. From Deyo to Shieh’s more recent works, the
mechanism of labor control has been examined in great detail, covering the contributions
of networked production to efficiency, legitimacy, and mobility (Deyo 1989; Shieh 1992).
35
Those sociological theories raised solid doubts about the application of the free market
model to East Asian industrialization. However, none of the sociological approaches
have ever targeted international trade as such, the topic that made the resurgence of the
free market model possible.
Comparative Advantage Theory: Porter describes the comparative advantage
theory of economics as the “classic explanation” of industrial success in international
trade (Porter 1990, p.11). The theory can be traced back to Adam Smith, the founder of
modern economics, who emphasized the merit of international trade in increasing scale
economy and therefore specialization in the division of labor (Smith [1776] 1976).
Ricardo was the real founder of the theory, modifying Smith’s concept of absolute
advantage to the concept of comparative advantage, which fine-tunes the allocating
power of the price-mediated market to the marginal utility principle.14 In other words, a
country will specialize in the industry where its unit labor is more productive compared
to other countries (Ricardo [1817]1951). While Ricardo’s theory is based on
productivity, the popular version of comparative advantage developed by Heckscher and
Ohlin is based on “factor endowments” in which labor, land, capital, and natural
resources are specifically included (Ohlin 1935). The concept of “factor endowment”
36
14 In mercantilism, state emphasized trade gains in a zero-sum economic world of exchange, therefore
tariff restriction and quota were usually imposed to lessen import volume and hence increase national
capital accumulation. Adam Smith’s The Wealth of Nation argued in a opposite way emphasizing that
absolute advantage of countries in international trade will lead them to specialize in the production niche
that is most efficient in terms of resource allocation. Ricardo further extended Smith’s thesis. He argued
that even if a country is absolutely less efficient than its trading partners at everything, it still makes sense
for that country to specialize in producing that which it is relatively less inefficient, and to gain from the
superior relative efficiencies of its trading partners.
reflects two characteristics of the economic model: it focuses on the substantive inputs to
production and those factors are endogenously given. A more dynamic theory of
international trade is proposed by Vernon in his “product cycle” theory. The theory
argues that production will stay in the home market in the initial launch of a new product,
then moves overseas when foreign markets expand, and finally, as the technology
matures, foreign firms will take over production and the home market will become reliant
on foreign imports (Vernon 1966). In a case like footwear manufacturing, which has a
low technological entry barrier and a fully matured consumer market, Vernon’s theory
shares the same premise as other economic modes: the universalistic price-mediated
market.15
Our empirical investigation of the production site changes in the world footwear
market over the last twenty-five years and the development of the industry in Taiwan
shows many empirical anomalies for which comparative advantage theory fails to
account. If the price-mediated universalistic market and its application in comparative
advantage theory are sufficient to explain the transition in footwear production sites,
given the industry’s labor intensiveness and open competition: Why did Taiwan enter the
market earlier than Korea when its labor costs have been consistently higher? Why was
Taiwan able to maintain its position in the market through the 1980s, when it had lost its
labor advantage by the 1970s? Why has footwear supply to the world market been
concentrated in so few countries? Why did other developing countries, such as Mexico,
37
15 For simplicity, in the thesis, the term comparative advantage theory includes the product life cycle
theory, although I will use the more precise “price-mediated market” whenever possible. For more
comprehensive discussions on the comparative advantage theory see the edited book by Lipsey and Dobson
(1987).
with cheap labor costs, tariff reductions, and transportation convenience, fail to ascend in
the global market? What assets allow Taiwanese footwear producers to conduct
offshore investment while keeping original marketing networks in a regionalized
operation? To answer these questions satisfactorily, we need to study the footwear
export/sourcing market as a historically-contingent and socially-constructed reality.
With this general agenda in mind, now let us look at the current sociological alternatives
to the mainstream economic model.16
State-centered Theories: The state-centered approach to social development is a
broad category of theories involving different models of development research, all of
which emphasize the role of the state in actively creating competitive advantage for a
country. “Getting the prices wrong” shows their skepticism that the free market will
provide appropriate incentives to trigger growth of new and more value-added
industries.17 Amsden argues that distorting the market to give national firms investment
incentives is not enough. The successful developmental state also sets bench marks to
discipline firms learning to meet international standards (Amsden 1989). Wade gives
his solution to the controversy about whether the state leads or follows the market by
ascertaining whether state policies come before or after the investments in private sector
(Wade 1990).18 Evans’ recent work shows that a mix of autonomous state and
16 For more detailed discussion, please refer to Chapter 1. 17 The term was first phrased by Amsden. I see no reason that other proponents of the approach, like
Wade, would disagree.
38
18 In fact, recent studies of the early history of Taiwanese plastic industry show that its development
actually followed the expansion of its downstream industries, like footwear exports (Wang 1995; Chu
1995).

cooperative networks is able to embed the private sector as a critical ingredient for
industry growth (Evans 1995). In a recent report by the World Bank, East Asian
Miracle, a “market-friendly” view is advocated, which yields to states some policy space
in managing the market, a small but clear sign of the interventionist state’s achievement.
Although our case does reveal the weakness of the free market model, it also creates
difficulties for the state-centered approach. Researchers in the state-centered approach
devote their efforts to demonstrating the creation of factors endowments through state-led
non-market signals, but fall short in examining the market where profit-making firms
engage in their daily business. In a sense, restricted by the framework of the national
economy, the state-centered approach can be conceived as a dynamic model of factor
creation, which explains why it tends to focus only on the supply side of the market. A
direct result of this paradigm limitation is that the causal mechanism embedded in the
transnational economic linkages of an industry is seriously understudied. Ironically, the
East Asian model is mainly characterized by its heavy involvement in and reliance on
export trade. It seems only natural that the supporters of state-centered approach tend to
focus on those upstream, large-scale industries that provide materials mainly to the
downstream domestic producers actually involved in export trade.19 Similarly, the
state-centered approach also tends to provide many details on state policies and
state-capital interactions, but falls short in analyzing the firm activities in the market,
where success is measured. Because of this shortcoming, the effectiveness of state
39
19 Acknowledging this weakness, Wade defends that “by setting directions for the large-scale [upstream]
sector, the government influences the configuration of risks and profit opportunities for small-scale
[downstream] firms” (Wade 1990, p.306). Interestingly, a theory that intends to explain East Asian
economic growth places export sectors as exogenous to its research subject.
industrial policy is not fully explored but assumed, given the known performance of the
industry. As a result, the downstream, labor-intensive footwear exporting from Taiwan,
with a large number of firms, severe competition, and far less state intervention, becomes
a subject that the state-centered approach cedes to the price-mediated market approach of
economists, who claim that the state-centered approach does not know where foreign
revenues are actually earned.
Production-centered approach: Production-centered approach (Deyo 1989;
especially Shieh 1992) claims a bottom-up approach distinct from the state-centered
approach. It complements the weakness of state-centered approach by looking at the
very detailed processes of production organization in manufacturing exports. The
production-centered approach also goes beyond factor endowment and examines the
organizational capability of production networks in offering adjustments to market
demands. Although research prompted by the productin-centered approach provides a
valuable correction to the state-centered approach, its almost exclusive focus on the labor
process, especially the subcontracting networks, limits how much of the production
system it can observe. Production-centered approach is therefore an incomplete
framework because it fails to embed production in the wider organizational field of
transnational economic linkages, which then must reincorporate the marketing networks
of manufacturing exports. One obvious consequence of this shortcoming is that, while
production-centered approach correctly points to the function of subcontracting networks
in curtailing market uncertainty, the specific content of uncertainty is under-specified.
Without a balanced examination on the organization-environment fit, the causal
contribution of subcontracting arrangement to uncertainty absorption is not clear.
40

Without stretching networks to embrace the marketing end of the chain,
production-centered approach will always face the danger of being conceived as just
another dynamic theory of factor endowment in which the local production networks
represent an asset that is ultimately selected by the asocial free market on the
international level.
Global Commodity Chains (GCC): The anomalies in the economics’ asocial
market model leave a theoretical void neither state-centered approach nor
production-centered approach can fill satisfactorily. Gereffi’s GCC perspective offers
an integrated approach that fits exactly the empirical subject of my research and
overcomes the shortcomings of the two sociological approaches we discussed. The
concept of commodity chain was first proposed by Hopkin and Wallerstein in 1986 as an
analytical framework for studying the “network of labor and production process whose
end results in a finished commodity” (Hopkins and Wallerstein 1986). Gereffi redefines
the focus of the chain study from the narrow emphasis on production process to the
organizational features of a series of transactions throughout the chain. The broadened
focus allows him to expand the scope of the chain to incorporate the marketing activities
at the final retail market.
The immediate effect of the modification allows GCC to highlight a very
fundamental change in capitalism after 1980s toward a “globalized coordination
system”20 (Ross and Trachte 1990; Gereffi 1992). The new reality is characterized by
41
20 The term was first used by Gereffi in a draft prepared for a workshop on Changing Business Systems in
East Asia, Hong Kong, 11-14 July, 1995. “Global capitalism” is the term used by Ross and Trachte to
highlight a new stage of capitalism. Since the focus of my current discussion is not on that topic, I prefer
two fundamental features that relates directly to my research subject. The first feature is
the industrialization of the developing world, which has been a profound phenomenon
since the 1960s and now ceases to be a sufficient indicator of development.21 On the
demand side, there has been a substantial consolidation of power in the hands of
designers and retailers in the developed countries.22 There may not be much change in
the way footwear is produced over the decades, but if we take the whole GCC into
consideration, it becomes clear that what Gereffi calls a “buyer-driven commodity chain”
has been consolidated, whose impact on production is beyond the production-centered
approach’s narrow scope. A buyer-driven commodity chain, as opposed to a
“producer-driven commodity chain,” refers to industries in which large retailers,
brandnamed merchandisers, and trading companies play the pivotal role in setting up
decentralized production networks in a variety of exporting countries, typically located in
the Third World (Gereffi 1994 b).
The buyer-driven commodity chain provides a fundamental framework for my
research for the following reasons: (1) It offers a comprehensive analytical unit of export
transaction which encompasses both the production and marketing networks of footwear
exports from Taiwan; (2) it is a model based on international trade, instead of the
to use “globalized coordination system.” 21 In 1990, 34 percent of the GDP of East and Southeast Asia was in the manufacturing sector, compared to
26 percent for Latin America, 17 percent for South Asia, and only 11 percent for sub-Saharan Africa. The
manufacturing sector’s share of GDP in some developing nations, such as China (38 percent), Taiwan (34
percent), and South Korea (31 percent), was even higher than Japan’s manufacturing/GDP ratio of 29
percent (Gereffi 1995b, p.106).
42
22 Between 1991 and 2000, for example, the ten biggest retailers in the United States are predicted to
increase their share of the US retail market from 43 percent to nearly 60 percent (KSA, 1992).

internalized production system of MNCs often seen in the producer-driven commodity
chains; (3) the model provides solid ground for a sociological model of international
trade because the chain perspective emphasizes the inter-firm coordination networks
across adjacent sectors, not endogenously confined factors; and (4) GCC is nearly
equivalent to economic sociology’s concept of “organizational field” in the area of
international economy.23 It focuses on the institutional and organizational formation of
transactions in the industry-specific organizational field of commodity chains, taking
cultural conditions and state policies in the nodes of global networks into consideration
without collapsing into the limited frameworks of either the state-centered approach or
the producion-centered approach.
As a result of the above, the GCC approach regards the roles that firms in the
developing countries play in GCCs as a fundamental parameter of industry development.
I follow this approach, basing my research on an acknowledgement of the original
equipment manufacturing (OEM) nature of Taiwanese footwear exports. A transaction
is defined as OEM when the supplier has four characteristics in transaction: (1)
independent from the buyer in term of ownership; (2) without control over distribution
channels; (3) without a brand; and (4) produces goods according to the design offered by
the buyer or one who acts on behalf of the buyer. In a comparative study of the export
roles of developing countries, Gereffi concludes that the broad scope of export roles and
43
23 “Organizations are affected by the structure of relations of the inter-organizational system in which they are embedded, and these systems are in turn affected by the societal systems in which they are located, and these systems are in turn affected by the world system in which they are located. ... While we are busily attempting to raise our models and analytical frameworks to scale higher levels of complexity, some of our colleagues in social science have started with more encompassing units ... and appear to be building frameworks that increasingly stretch down to the level of organizations and inter-organizational systems. ... It appears that as we labor to examine the connections between organizations and larger social structures, we will be in good company.” (Scott 1992, p.177, in concluding a theoretical review)
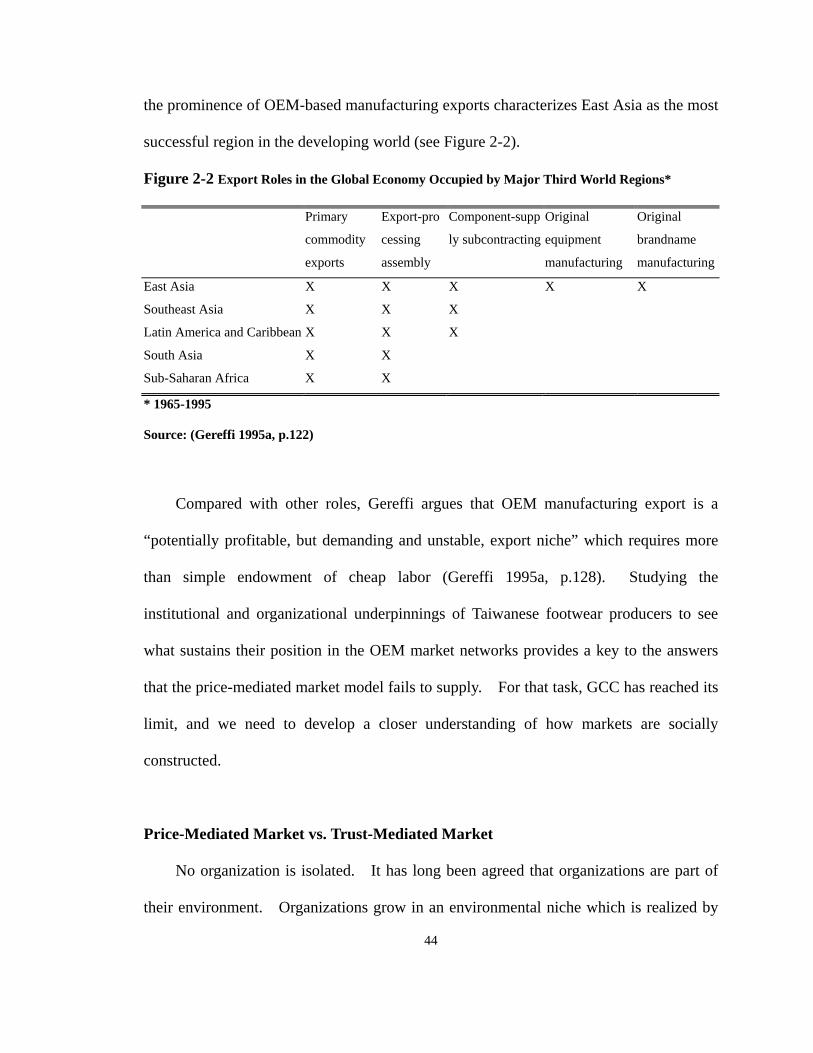
the prominence of OEM-based manufacturing exports characterizes East Asia as the most
successful region in the developing world (see Figure 2-2).
Figure 2-2 Export Roles in the Global Economy Occupied by Major Third World Regions*
Primary
commodity
exports
Export-pro
cessing
assembly
Component-supp
ly subcontracting
Original
equipment
manufacturing
Original
brandname
manufacturing
East Asia X X X X X
Southeast Asia X X X
Latin America and Caribbean X X X
South Asia X X
Sub-Saharan Africa X X
* 1965-1995
Source: (Gereffi 1995a, p.122)
Compared with other roles, Gereffi argues that OEM manufacturing export is a
“potentially profitable, but demanding and unstable, export niche” which requires more
than simple endowment of cheap labor (Gereffi 1995a, p.128). Studying the
institutional and organizational underpinnings of Taiwanese footwear producers to see
what sustains their position in the OEM market networks provides a key to the answers
that the price-mediated market model fails to supply. For that task, GCC has reached its
limit, and we need to develop a closer understanding of how markets are socially
constructed.
Price-Mediated Market vs. Trust-Mediated Market
No organization is isolated. It has long been agreed that organizations are part of
their environment. Organizations grow in an environmental niche which is realized by
44
their interaction with other organizations. They die out because they fail to mobilize
critical resources from their organizational environment. This view is compatible with
mainstream economics, except that the latter constructs a market model that makes the
social coordination among firms theoretically insignificant. According to economic
theory, in the capitalist economic sphere, competition characterizes the environment and
is driven by struggles among rival organizations. Price-mediated competition, as
emphasized by mainstream economics, is an invisible hand that turns disorganized self
interests into unintended collective well-being. The visible chain made by firms
involved in exchanges, consciously referring to other organizations with which they are
in cooperation, ironically becomes negligible or even invisible in the economists’ model.
The exchange side of the market has been largely neglected in the dominant
economics paradigm. For mainstream economics, the market is seen as an abstract
price-making mechanism that allocates resources efficiently throughout the competition
system (Swedberg, 1994). Transaction cost theory argues that the price-mediated
market is able to exert that power because transaction costs, which fundamentally reside
in chains, are assumed to be zero (Coase 1988). In other words, the commodity chain is
theoretically insignificant because transactions are assumed to be effortless and utility
satisfaction is spontaneous.
The market economy is constructed as a competition system where utility
maximizing individuals freely choose with whom to transact according to their inner
preferences and external price signals. It is competition, not exchange, that
distinguishes the market economy from other systems. At the aggregate level, when
resources are allowed (or forced) to flow freely, price elasticity among substitutes will be
45

greatest and resources will be used most efficiently. Therefore, even when the ties
among firms in a chain are empirically significant, they tend to be conceived as creating
rigidity, which is counter-productive. In the market model, production is conceived as a
function of factor inputs, instead of a social sphere of activities. Economic agents are an
abstract construction assumed to be homogeneous and the exchanges among them are
assumed to be spontaneous. The market is ultimately a fully automated matching
machine. There are no actors and no stages (i.e., industry) in the sense that their
concrete manifestations do not play a role in the drama. The price-mediated market is
universalistic, without historical marks.
Transaction cost, resource dependency, and relational contract theories all point to
the importance of inter-firm relationships inside the marketplace. They also challenge
the assumptions of mainstream economics that: transactions are discrete, transaction
coordination is insignificant, transaction incentives are associated only with output,
transaction monitoring is negligible, and transaction enforcement requires only minimum
external authority. I develop the theoretical framework of my research out of a review
of these theories.
Transaction Cost Theory─Transaction Needs Organization: Transaction cost
theory argues that transacting parties often develop asset specificity that can not be easily
substituted. Given more realistic assumptions about opportunism and bounded
rationality of economic agents, the “market” is not always the cost-optimal choice to
organize transactions. That is why hierarchies (i.e., firms) are so popular (Williamson
1975). The theory points to the necessity of transaction coordination and characterizes
46
the market as a form of transaction governance.24
There are solid criticisms of transaction cost theory from traditional sociologists.
Granovetter raises a Durkheimian question about transaction cost theory’s economic
fallacy, which reduces social institutions and networks to merely results of economic
rationality (Granovetter 1985). Powell emphasizes that Williamson’s
either-market-or-hierarchy model conceives a network as only an unstable intermediate
pattern and fails to acknowledge networks as a unique type of transaction governance
(Powell 1990). Stinchcombe’s case studies show that hierarchical elements are often
used in transaction-contracting to reduce information uncertainty (Stinchcombe 1990).
Bradach and Eccles argue that market, network, and hierarchy represent three different
ideal types of transaction coordination which are mediated through price, trust, and
authority respectively. They then propose to study how elements of the ideal types are
articulated into plural forms of transactions in the real world (Bradach 1989).
These criticisms show that transaction cost theory is plagued by the basic features of
the price-mediated market. It offers a solution to the classic question “why is there a
firm,” but once the pre-conditions are in place,25 the price-mediated market is kept intact.
The assumptions of “bounded rationality” and “opportunism” are convincingly realistic;
however their pervasive application is questionable because it is based on a pre-social
24 North’s version of transaction cost theory differs from Williamson’s in its focus on the multilateral
institutional environments and his insistence that institutions should not be reduced to the maximization of
cost efficiency. Some institutions are inefficient because of reasons such as path-dependency. The result
is an approach much closer to sociological interest than the mainstream economics (North 1990). I review
only Williamson’s theory because it is the transaction cost theory people mostly refer to and also good for
illustrating the analytical framework of my research.
47 25 Those conditions include different combinations of asset specificity, frequency, and uncertainty.
condition of atomic individuals. There are social propensities for people to cooperate
and express goodwill. People reason in the marketplace by interpreting the meaning of
each other’s acts based on social conventions accumulated over time. It is the “we”
identity and a fundamental sense of trust toward not only the immediate transacting
parties but also the multilateral institutionalized resources that make transactions in the
market possible (Etzioni, 1988). The atomistic competitive market never existed in the
real world. In Burt’s language, there is no market without holes (Burt 1992). It is the
“networkness ” of a specific market that needs to be studied, rather than assumed.26
Resource Dependency Theory ─ Uncertainty and Networking: Resource
dependency theory, is less constrained than transaction cost theory by the logic of
economic efficiency. It argues that organizations must manage their dependence on key
external resources and reduce uncertainty effectively in order to survive. To accomplish
that, organizations build and maintain inter-organizational linkages to create a buffering,
negotiated environment, and as a result, the organizational boundary is not as clear-cut as
ownership would imply (Pfeffer 1978). In other words, the “networkness” of a market
allows organizations to reduce interruptions from environmental complexity and
uncertainty.
Much research on business systems has echoed this approach on different grounds.
48
26 Block follows Polanyi’s idea that the “self-regulating market” is an unstable social construction in
capitalist history and proposes the idea of “marketness” (Block 1990). If we follow the sociological
tradition of network analysis, it is the “networkness” (e.g., different degree and dimensions of inter-firm
ties, and different network configurations) that is more suitable for empirical investigation. The idea of a
dichotomous model of network vs. hierarchy was first elaborated by Mingione’s study on informality in the
economy (Mingione 1991).
In marketing management, Heide argues that the inter-firm transaction relationship has
now become a critical variable of business strategy (Heide 1994). In industrial supply
management, Sako’s comparative study of the British and Japanese electronics industries
finds that “an obligational contractual relationship” among buyers and suppliers delivers
higher competitiveness (Sako 1992). In the industrial economy, Piore and Sabel
conclude from the Italian experience that flexible production networks composed of
specialized firms in close cooperation create stronger competitiveness when market
uncertainty is high (Piore and Sabel 1984). Leender and Blenkhorn advocate what they
called “reverse marketing” which focuses on building trustful transaction relationships
between production and marketing segments of chains (Leender and Blenkhorn 1988).
Contrary to what the atomistic market model would suggest, the networkness of a market
does not necessarily make it less efficient. Networking is a necessity, not an abnormal
deviation, and a well-coordinated market network is able to both reduce uncertainty and
increase flexibility ( Leibenstein 1966; Dore 1983).
The weakness of resource dependency theory is that it tends to focus on the
organizational forms of inter-firm relationship. Less emphasis is placed on the
institutional resources that firms must rely on to define their relationship (e.g., shared
knowledge about the rules of the game) for their goods. In an uncertain environment of
a competitive market, firms not only comply with but take advantage of the
institutionalized consensus on norms (e.g., “rational corporation” or “ healthy
competition”) (Powell 1991; Meyer 1991). In other words, uncertainty is more
profound and resource dependence is wider in the marketplace than is suggested by the
resource dependency theory (Giddens 1990).
49
Relational Contract Theory─Institutionalized Resource: While transaction cost
theory is based on economic efficiency in the technical core of inter-firm coordination
and resource dependency theory focuses on the various forms of organizational ties,
Macaulay’s relational contract theory pushes the discussion further to the institutional
contexts of transactions and also questions the economic fallacy warned against by
Durkheim (Macaulay 1963). Based on his practical experience, Macaulay questions the
legal-centrism which assumes that transactions should be and could be rationally
governed by law and contracts. The real world transaction relationships have never
followed step by step the regulations laid down by law and contracts. On the contrary,
contracts are constantly influenced by transaction relationships and normative
expectations that originate outside the contract settings or even business contexts.
Macneil further elaborates Macaulay’s ideas in his own research. He argues that
neo-classical economic theory is never a realistic model because it is based on the
assumption of “discrete exchange” (Macneil 1980). Under the model, consecutive
transactions between parties over time are stripped of any connection. Every spot
transaction concerns only the transference of commodity ownership. The enforcement of
transactions, when needed, is the responsibility of the state only. Macneil reminds us
that real world transactions are relational exchanges endowed with a time dimension.
Transactions are always embedded in historical and social contexts, which come from
both bilateral or multilateral sources. The enforcement of contracts is frequently based
on a shared sense of common interest among transacting parties. These bilateral norms
are reflected in the shared tacit knowledge among parties that help to facilitate mutual
adjustment. They must be developed over time. Transacting parties who stand ready 50
to file formal lawsuits can only ruin the kind of relationship that benefits both.
Compared with the two previous theories, resource dependency theory more
specifically emphasizes networking as a general social process in economic transactions,
highlights trust as a critical medium in market networks, and points to institutional
resources beyond the guarding laws. In a clear contrast to the transaction cost theory’s
obsession with risk aversion opportunism, the theory’s economic agents are looking more
aggressively for goodwill from the other parties and are more ready to show goodwill,
even during disputes.
Trust, Transaction Organization and Institutionalized Resources
While the price mechanism plays a pivotal role in the market model of economics,27
trust has been widely considered by sociologists as indispensable to the sheer existence of
social organizations, including markets (Blau 1964; Garfinkel 1967; Parsons 1969;
Luhman 1980; Gambetta 1988; Giddens 1990). A major reason for the consensus is that,
instead of viewing society as a conglomerate of individual interests, sociologists see
social relationships as a fundamental basis of social cohesion. In our research, the
concept of “trust-mediated networks” highlight the socially constructed nature of markets,
which differentiates our approach from the price-mediated impersonal mechanism.
The indispensability of trust can be illustrated with a brief discussion of the limits of
Stinchcombe’s arguments about contractual control of transaction uncertainty.
51
27 Some economists do acknowledge the importance of trust. For example, Kenneth Arrow says:
“Virtually every commercial transaction has within itself an element of trust, certainly any transaction
conducted over a period of time. It can be plausibly argued that much of the economic backwardness in
the world can be explained by the lack of mutual confidence” (Arrow 1975, p.24).
Stinchcombe argues that when uncertainty is high. (e.g. a time-lag between contracting
and delivery or an execution gap between order specification and final products),
hierarchical control tends to be written into contract. Therefore the mistake of
transaction cost theory is making market and hierarchy into two distinct categories
(Stinchcombe 1990). The analysis is correct but insufficient. Theoretically, we surely
could specify all the preventive and compensatory details in a contract to govern every
possible incident in a transaction.
Following the relational contract theory, there are at least four problems that can not
be solved in this manner:
1) Solving disputes through lawsuits is costly, especially in international trade.
2) Contracts that are highly complex will damage the efficiency and flexibility of
transactions.
3) Transactions that involve mutual adjustments during commercialization require
tacit knowledge that cannot be substituted by formal written language.
4) Transactions that rely too much on formal and complex contracts hinder the
accumulation of trust among parties.28
Trust is a crucial element in networked markets that can not be replaced by law,
contract codes, or administrative procedures. The concept of trust is very ambiguous
however. A precise understanding of trust is a basic step toward productive application
of the concept in empirical analyses. I define “trust” as “[in] the expectation that
52
28 Sitkin and Roth study the impact of AIDS/HIV on organizational trust/distrust. They find that
legalistic remedies provide legitimacy and value congruence to the organization and therefore reduce
litigation, but their explicitness also undermines the tacit value of institutionalized trust by enhancing
distance between organizational members (Sitkin and Roth 1993).

another party will perform actions that will result in positive outcomes, a social actor
voluntarily gives up preventive measures to give another party freedom to act alone and
therefore allows the uncertain possibility of being hurt.” This definition emcompasses
four elements. First of all, there is the expectation of predictability, which Barber called
the “generic” property of trust (Barber 1983, p. 9). What makes trust a distinctive
concept are the following three supplementary elements. Secondly, trust is a response
toward the uncertainty in social coordination, which may be originated from the
environment. For example, the relationships between suppliers and buyers (or, between
employers and employees) are subject to the disturbance of market fluctuation. In a
world of absolute certainty, trust is meaningless.29 The implication for our research is
that trust must be studied specifically to the sources of uncertainty where the transactions
take place. Thirdly, beside expectation and uncertainty, a trust-giving actor must be able
to foresee, consciously or subconsciously, the risk of being hurt. It makes no sense to
talk about trust when that possibility is dim. Finally, trust must go beyond just
expectation and demonstrate actions where an agent voluntarily removes possible
preventive measures that could have reduced risk in social interactions (Andaleeb 1992).
For example, knowing that it is not a legally effective document to guarantee payment, an
order by fax is accepted by a producer and put into production right away to meet the
need for a rush demand of a buyer.
It should not be difficult now to understand why trust is essential to the speed and
flexibility of transaction coordination in the marketplace, where uncertainty and risk are
53
29 Trust is a situation between full knowledge and full ignorance. From the perspective of subjective
experience, it is in a sense an “illusion” of social agents (Luhman 1980, p. 26, 32).
potentially high and also why detailed contracts (i.e., a typical preventive measure) may
be counter-productive. Unlike the model of the price-mediated market which conceives
flexibility in terms of the detachment of firms that reduces rigidities in resource flows,
trust is essential to flexibility in the coordination-based model of market transaction.
Trust helps to reduce coordination complexity and speeds up transactions so that both
parties benefit from the relationship (Johanson and Mattsson 1987). It is therefore a
vital asset in competitive markets because of, at least, the following functions in
economic transaction: reducing transaction complexity (therefore increasing speed),
widening the scope of cooperation (therefore encouraging learning), and creating barriers
for new entrants in the market (therefore building competitive advantage).30
It is important to note that emotional concern or attachment between transacting
parties, neither as a motive nor a consequence, is not included in the definition. The
exclusion helps to prevent the common mistake that confuses the embeddedness of trust
from its constituent elements. To clarify this point, Schmitz’s distinction of “ascribed”
and “earned” trust provides a heuristic context. In a review article about industrial
districts, Schmitz argues that we go beyond what he called “ascribed trust,” which is
rooted in the primariy relationships of family and kinships, to study how “earned trust” is
accumulated in an industrial district when economic growth brings increasing
differentiation and outsiders (e.g., foreign buyers) to its terrain (Schmitz 1996).31
30 The contribution of trust to economic competitiveness is not limited to inter-firm coordination only.
Production by command, whether in a centrally planned economy or vertically integrated Fordist factory,
yields poor results (Fukuyama 1995).
54
31People who reject “trust” as a central concept in economic governance tend to conceive of trust as
“long-lasting,” “blind in strategic consideration,” or “rooted in primary relationships.” That rejection is

The difficult question is: how is trust “earned” or “ascribed”? Schmitz does not
clearly articulate his answers to the question. Reality shows that “ascribed trust” which
is based on the institutionalized resource of primary relationships, such as family and
kinship, must also be mobilized. Schimtz himself pointed out that “social relationship
can also have negative effects on a cluster’s growth,” such as the footwear cluster of Agra
(India) (Schmitz 1996, p. 5). For the “earned trust,” Schmitz argues that it accumulates
because of “the economic cost of not cooperating”, “conscious investment in inter-firm
relationship”, and “honesty and competence” (Schmitz 1966, p. 3 and 5). These
answers are either prone to the repeated transaction much emphasized by the game
theory32 or the tautological argument.33
based on misunderstanding that equates “trust” with “primary relationship.” Reconsidering the
embeddedness of trust in the modern condition has been a central concern for sociologists who are not
confined by the traditional sociological dichotomy (Luhman 1980; Giddens 1990). The need for
“achieved trust” in differentiated modern society was first raised by Durkheim in his search for professional
ethics and civil virtues (Durkheim [1893] 1949). In our increasingly globalized economy, understanding
the social embeddedness of trust in transaction organization, market networking, and institutionalized
resources only becomes more important. 32 In The Evolution of Cooperation (1984), Axelrod demonstrates a rational choice approach toward trust
which claims to prove that cooperation can be achieved without centralized authorities or even shared
understanding and foresight among parties. That conclusion, however, is reached based on computer
experiments of the Prisoner’s Dilemma which leave no space for convention building and institutional
environment. In his empirical discussion of the “live-and-let-live” of trench war during World War I,
“rules,” “rituals,” “socialization,” and “tacit understanding” are emphasized as they emerged among
combatting soldiers in the most severe test of trust to dampen disturbances to the institutionalized practice
of live-and-let-live. In opposition to Axelrod’s interpretation, I see the live-and-let-live situation as a
proof of the essential importance of trust and how trust is “earned” or “achieved” by developing
institutionalized underpinning of rules and rituals even under the most competitive environment.
55 33For statements such as: “trust is earned by investing in trust,” “trust is earned by showing trustworthiness”
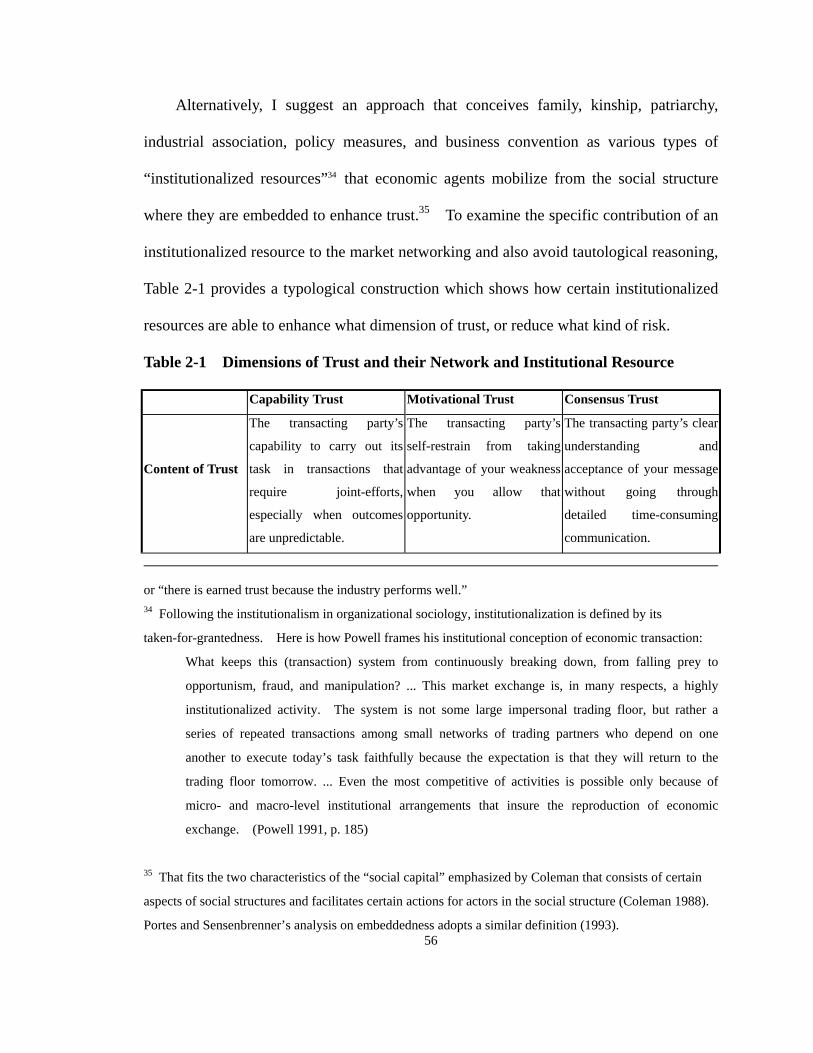
Alternatively, I suggest an approach that conceives family, kinship, patriarchy,
industrial association, policy measures, and business convention as various types of
“institutionalized resources”34 that economic agents mobilize from the social structure
where they are embedded to enhance trust.35 To examine the specific contribution of an
institutionalized resource to the market networking and also avoid tautological reasoning,
Table 2-1 provides a typological construction which shows how certain institutionalized
resources are able to enhance what dimension of trust, or reduce what kind of risk.
Table 2-1 Dimensions of Trust and their Network and Institutional Resource
Capability Trust Motivational Trust Consensus Trust
Content of Trust
The transacting party’s
capability to carry out its
task in transactions that
require joint-efforts,
especially when outcomes
are unpredictable.
The transacting party’s
self-restrain from taking
advantage of your weakness
when you allow that
opportunity.
The transacting party’s clear
understanding and
acceptance of your message
without going through
detailed time-consuming
communication.
or “there is earned trust because the industry performs well.” 34 Following the institutionalism in organizational sociology, institutionalization is defined by its
taken-for-grantedness. Here is how Powell frames his institutional conception of economic transaction:
What keeps this (transaction) system from continuously breaking down, from falling prey to
opportunism, fraud, and manipulation? ... This market exchange is, in many respects, a highly
institutionalized activity. The system is not some large impersonal trading floor, but rather a
series of repeated transactions among small networks of trading partners who depend on one
another to execute today’s task faithfully because the expectation is that they will return to the
trading floor tomorrow. ... Even the most competitive of activities is possible only because of
micro- and macro-level institutional arrangements that insure the reproduction of economic
exchange. (Powell 1991, p. 185)
56
35 That fits the two characteristics of the “social capital” emphasized by Coleman that consists of certain
aspects of social structures and facilitates certain actions for actors in the social structure (Coleman 1988).
Portes and Sensenbrenner’s analysis on embeddedness adopts a similar definition (1993).
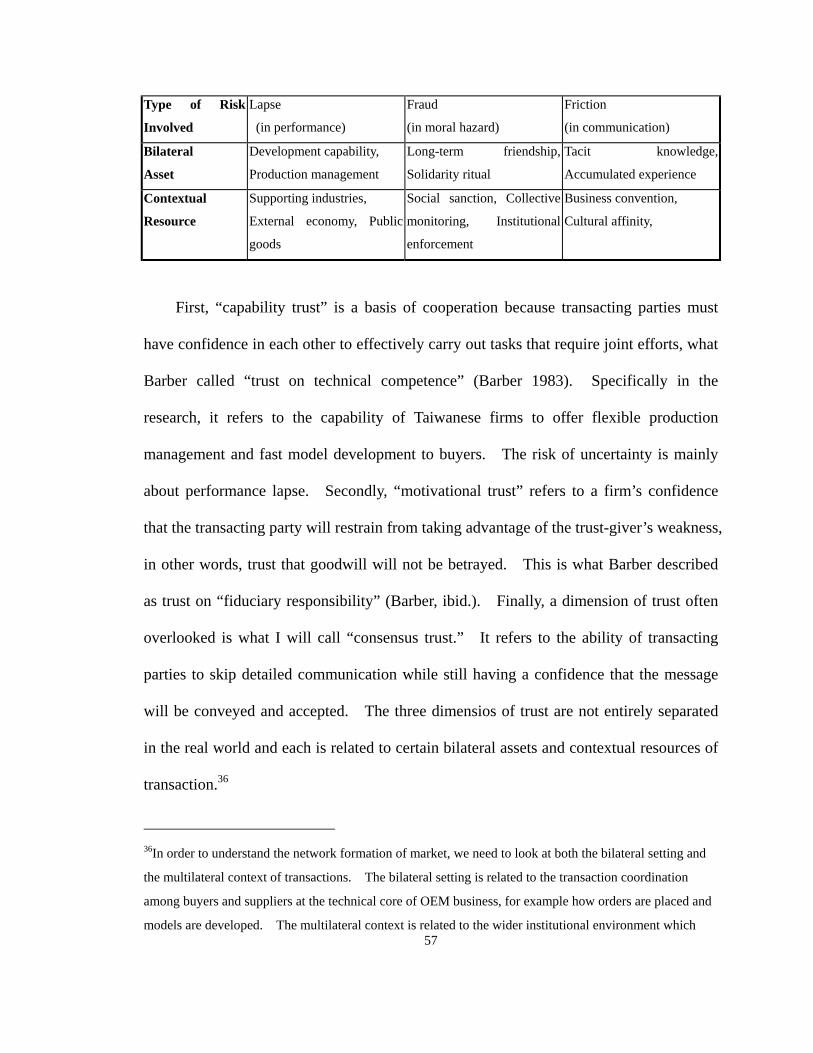
Type of Risk
Involved
Lapse
(in performance)
Fraud
(in moral hazard)
Friction
(in communication)
Bilateral
Asset
Development capability,
Production management
Long-term friendship,
Solidarity ritual
Tacit knowledge,
Accumulated experience
Contextual
Resource
Supporting industries,
External economy, Public
goods
Social sanction, Collective
monitoring, Institutional
enforcement
Business convention,
Cultural affinity,
First, “capability trust” is a basis of cooperation because transacting parties must
have confidence in each other to effectively carry out tasks that require joint efforts, what
Barber called “trust on technical competence” (Barber 1983). Specifically in the
research, it refers to the capability of Taiwanese firms to offer flexible production
management and fast model development to buyers. The risk of uncertainty is mainly
about performance lapse. Secondly, “motivational trust” refers to a firm’s confidence
that the transacting party will restrain from taking advantage of the trust-giver’s weakness,
in other words, trust that goodwill will not be betrayed. This is what Barber described
as trust on “fiduciary responsibility” (Barber, ibid.). Finally, a dimension of trust often
overlooked is what I will call “consensus trust.” It refers to the ability of transacting
parties to skip detailed communication while still having a confidence that the message
will be conveyed and accepted. The three dimensios of trust are not entirely separated
in the real world and each is related to certain bilateral assets and contextual resources of
transaction.36
57
36In order to understand the network formation of market, we need to look at both the bilateral setting and
the multilateral context of transactions. The bilateral setting is related to the transaction coordination
among buyers and suppliers at the technical core of OEM business, for example how orders are placed and
models are developed. The multilateral context is related to the wider institutional environment which
To give a concise summary of our theoretical discussion, the analytical framework
of this research focuses on the following issues about the social construction of markets:
(1) the sources of uncertainty that the economic actors (i.e., buyers and suppliers) in the
industry have to cope with in the transaction; (2) the ways that transactions are organized
among economic actors in the marketplace, and consequently their network configuration;
and (3) the conjunctures and processes where institutionalized resources are mobilized
(including maintained or created) to facilitate transaction coordination in specific sectors
of OEM transactions. The quest for answers to the issues cannot be accomplished by
simply an integrative analytical framework. To get the appropriate data to satisfy our
anlaytical need, we now turn to an introduction of the methods I adopted for the
research..
Research Method I: Qualitative Interview
This research relies heavily upon field observations and open-ended in-depth
interviews. To say some research is “qualitative” is more ambiguous than saying
something is “not quantitative.” Actually, that is how Strauss and Corbin define the
approach: “any kind of research that produces findings not arrived at by means of
statistical procedures or other means of quantification” (Strauss and Corbin 1990, p.17).
In fact, qualitative research is highly heterogeneous, involving a wide spectrum of
techniques and methods.
58
involves organizations (e.g., governments, associations, and households) and institutions (e.g.,
administrative regulation, cultural affinity, business convention, and patriarchy) that are not directly related
to the transaction that help to sustain stable sourcing arrangement and create barriers for new competitors.
In terms of data, qualitative research does not create a standardized data format in
advance (e.g., structured questionnaire) with the intention of statistically controlling and
measuring variation. Instead, it relies on multiple-sourcing of data and analytical
triangulation to increase both validity and reliability of findings. The materials I
gathered were in various forms. They included government publications, industry
reports prepared by research institutes, industry journals or business newspapers,
company documents such as statements, newsletters, or inspection guides, interview
notes and analytical memos, and observations conducted in the field. In using the
materials, two ways of reasoning proceeded simultaneously throughout the research. I
articulated general findings primarily by maximizing the congruencies as well as
resolving the discrepancies among materials. Throughout the process, new sources of
data were found necessary and therefore triggered empirical exploration accordingly.
Qualitative research sets out to develop knowledge with close affinity with the
knowledge subjects hold. This implies more space for theoretical induction, as the term
“grounded theory” clearly indicates (Strauss and Corbin 1990), more freedom for the
subjects to communicate in their own words, as outstanding works in this genre show
(e.g., Lamont 1992), and more involvement of researchers in the subjects’ working
environment (e.g., Burawoy 1979). The issue is not only one of studying subjects in
natural settings, which is in clear contrast to the laboratory experiment. I learned during
my research that once I collected the practical knowledge of the industry, which the
subjects already have, the research began to progress more smoothly.
The last characteristic of qualitative research that I want to highlight has to do with
the timing and nature of operationalization. Qualitative research proceeds in a less
59
linear sequence than quantitative work. The operationalization of theoretical questions
and concepts is often accomplished only after a certain period of data collection is
completed. It is an intermediate product of research indeed. Here is an example I
encountered in my research. I started my research as a project examining how
transactions get done in OEM sourcing/supplying networks by cooperation among
multiple agents who may or may not consciously notice this cooperation. Later, I
realized in the field that the sourcing offices of volume retailers still stayed in Taiwan,
even after at least eight years of offshore investment, and that almost none of their
supplying lines were in Taiwan. One operationalized question became: “why do these
buyers stay?”
My research objective mandates the selection of the method. The data necessary
for my research can be roughly classified into two groups: published documents and field
interviews. Published documents fit especially the macro level analysis which deals
with the historical conditions underlying the formation and transformation of Taiwanese
industry. Part of it is historical research based on published documents and interviews
with senior industry insiders. The important thing is: I am not interested in the degree to
which a variable in a model single-handedly contributes to explaining the dependent
variable at an aggregate level, but how factors jointly converged in forming a historical
conjuncture (Ragin 1994). Qualitative method suits this research goal.
To show that the footwear OEM markets are socially embedded, I must also be able
to delineate the operation of OEM markets with regard to how transactions are
60
coordinated.37 This requires looking at network configurations building upon relational
data, a research tradition that has been underpinned with a strong quantitative foundation
(Wellman 1988). I am, however, more interested in the complexity of how transactions
are shaped in both their bilateral and multilateral contexts. In-depth interviews and
on-site observations serve the purpose better than standardized survey research. The
task cannot be accomplished by defining a priori what the moves are and “adopting the
analytical categories built into the survey questionnaire” (Lamont 1992, p.3).
Interviews were very important to my research. The main reason is that a lot of the
inter-firm transaction and intra-firm activities were not documented. I have interviewed
subjects in about twenty trading companies and thirty manufacturing firms. A list of the
person interviewed is attached as an appendix to the thesis. I interviewed people in
some companies more than once, although not always with the same interviewee. I also
interviewed people whose jobs were related to the industry, for example, newspaper
reporters who wrote about the industry, an editor of an industry journal, directors of
industry associations, a government official in charge of the industry, and professors who
studied it. An interview lasted from two to three hours on average. Short interviews,
for example, one with an assembly line leader for only twenty minutes while touring the
plant, were not included in the list.
Interviews in qualitative research are generally more difficult than in a quantitative
survey. The reason is simply that the interview is not structured and the interviewer
61
37 Specifically, I found in the research that there were at least two types of markets in terms of how
transactions were coordinated. I called the two typical and contrasting markets: design-sensitive and
cost-sensitive OEM markets. Chapter 5 and 6 are designed to illustrate them respectively.
does not pretend to play a neutral role (Fontana and Frey 1994, p.364). Qualitative
research is based on the assumption that objectivity is accomplished by reflexivity of the
researcher in sensitively monitoring interviews as an open-ended inter-viewing process
between the researcher and the interviewee. Some excellent studies even take the
“impression management” of interviewees as the research subject itself (Lamont 1992,
p.21). How you are perceived by your interviewees and vice versa are critical to the
success of a qualitative interview. Quantitative researchers acknowledge the principle,
but aim at neutrality, not reflexivity.
My fluency in speaking Taiwanese helped me significantly in creating closeness
with the local businesspersons, the majority of whom were Taiwanese. Many sports
shoe buyers watched NCAA (National Collegiate Athletic Association) games and
therefore an easy atmosphere was created by simply chatting about the Blue Devils and
Coach K first.38 Who introduced me to the interviewee also became part of my image.
Experience showed that the higher the reference’s position the better the interview that
resulted39 However, I also noticed that when there was a direct link between them,
bitter words about the reference were unlikely, thus implying possible suppression of the
information that interviewees provided. At the least, flattering remarks toward the
reference must be suspect since the speaker might expect you to relay the compliments.
38 For example, when the NIKE production manager pointed to me, a student of Duke University, and said
to others that “Hey, we are patronizing him,” I knew immediately that the interview would work out well.
Thanks to Coach K, who led Duke basketball team to two consecutive NCAA championships in 1991 and
1992.
62
39 This is exactly what Nan Lin’s social resource theory is about. The social position of the contact
determines the outcome of instrumental actions (Lin 1982).

Being sensitive to the many possible facets of your presence and making use of them
skillfully are fundamental to the qualitative interviews.
What questions did I ask? There were many: the basic production and transaction
practices, history of the industry, firm-level strategies and their reasons and consequences,
labor and its management, the company’s suppliers, buyers and competitors, and the role
of governments. As the research covered various sectors in chains of the industry,
questions must be tailored to each interviewees.40 Given the time constraint and
semi-structure nature of the interviews, how a researcher perceives the interviewee
becomes critical to a rich interview. I judged an interviewee by the person’s chain
position (e.g., material supplier, manufacturer, or buyer), organizational position (e.g.,
boss, manager, inspector, or labor), market position (e.g., high or low end market), career
position (e.g., a development head who was an inspector or what companies the person
had worked for previously), and age (e.g., older men were valuable in offering
information about the early history of the industry).
Experience told me that interviewees were more open and candid when the topic
was their past experience in another company or what other companies were currently
doing. These kinds of questions also provided me with chances to cross-check what I
had collected from other interviews. An interview is an opportunity to gather data about
several cases under investigation. The kind of interview I have discussed so far is close
to what Gereffi called “strategic interview” (Gereffi 1995a).
63
40 There were also firm-specific questions, for example: the development of Air bag for NIKE, the Green
Seal project for Payless ShoeSource, and EDI (electronic data interchange) and Buy-America for
Wal-Mart.
Research Method II: Field Observation
Many of the interviews I conducted were carried out in natural settings, involving
on-the-scene-observation at the same time. The questions I asked in this situation were
largely determined by what was happening. These interviews were mostly informal and
spontaneous, involving emotional responses and situational reflection from the
interviewees. To emphasize, I argue that those interviews should be considered as part
of the field observations, instead of seeing the field observations as supplements to
interviews.
I conducted my research at four main research sites: Taipei City, the townships in the
central Taiwan, the Subic Bay of Philippine, and the Guang-Zhou area of China.
Interviews made in Taipei City were mostly in formal settings and some were in
industry-related institutes. Earlier in May of 1994, I had a chance to stay for a week in a
footwear factory at the Subic Bay of Philippine, during which many working questions
were operationalized. Many of the firms I visited later in Taiwan were in the towns
around Taichung City, which is located in the central Taiwan. The majority of the
trading companies, involving buyers, in the footwear industry are in Taichung City. The
southeast footwear factory that I visited in Taiwan was Feng-Tay in Yunlin County. I
stayed in the Tsautun Township for about a week mainly to observe the impact of
offshore investment upon a local community.
Two other trips were conducted in December of 1994 and March of 1995 to the
“shoe nest” of China’s footwear exports, the inner Pearl River Delta. The first one was
mainly in the Dong-Guang area located between Guang-Zhou City and Hong Kong. I
64
was posted to the Yu-Yuen Factory for one month. Five plants were located around the
main office with employment over twenty-five thousand. It is almost a self-contained
company town with its own hospital, power plant, kindergarten, roads, movie theater, and
commercial district. In the second trip, I was posted to Guang-Zhou City. I
accompanied the quality managers or inspectors of several trading companies on their
daily visits to the supplying factories around the inner Pearl River area. This strategy
allowed me great mobility to move around the area with low costs and also to involve in
very extensive observations of inter-firm transactions.
Field observation was critical and indispensable to my research. It can not be
substituted with literature reading, formal interviews, and even video-recording.41 The
natural settings of field observation allowed me to develop closer relationships with
research subjects, and therefore, more natural feelings and honest thoughts were revealed.
The most important thing is: I was able to glance at the backstage of the economic
agents’ game play. This meant that a lot of otherwise naive or wishful readings of
behavior were cast into doubt, a vital moment for theoretical reflection. As an outsider
who had no conflicting interest and spent enough time with them, my research subjects
felt relaxed enough to tell me what they actually had in mind.
Unlike laboratory observation, field observation frequently has no clear-cut start and
end in the typical sense of measurement. To highlight the analytical meaning of field
observation, I paid serious attention to the time and space context of my field experience.
65
41I actually had a chance to watch a video tape introducing a factory to its customer. It provided only a
thin surface of the complexity of factory operation, if not a distorted version. In the field, my perspective
was not framed to watch things from a certain angle and I can use my personal witness to make judgments.
Considering time, I see the unit of observation as “project,” that is, a series of
activities organized by social agents to accomplish a preconceived finished situation.
Here are some examples I encountered: a buyer and a supplier set out to discuss and
confirm a sample, a group of technicians worked together to solve a machinery problem
at the shop-floor, and a producer sought plastic factories to test his new outsole materials.
In the field, I observed economic activities with reference to the wider time context of a
project. Concerning space, I paid attention especially to the physical and symbolic
settings of economic activities, for example, the shop floor layout, the signs and posters
on the walls, and the presence or absence of people in a specific location.42 These
constitute the stages where social relationships are played out and also defined. I asked
what makes a space a development room, a karaoke bar, or a production floor? What
are their contributions to the transaction?
In the field, a researcher can not force things to happen, and when they do happen,
intervention is not possible. Because of that, field observation requires patience and
sensitivity. You do not ask your research subjects “what if a mistake in a transaction
occurred,” but instead, wait and see what actually occurs on the scene. Sensitivity is
also important because it is difficult even to sense what is happening or has already
happened. What is natural and intuitive for the insiders can be strange to the observer.
66
42 Walking around a factory, it was clear that space represents the power relationship in the latitude people
enjoy in moving their bodies. The line workers had to adapt their body movements to the fixed speed of
assembly line. A non-standardized move of their body was a luxury to them. Line leaders were
functionally allowed, or forced, to walk around, but not to the other lines. Managers could stand at the
upper floor and look down the whole shop-floor, a privileged angle that the watched labor could only
imagine. When line workers turned their eyes to look at me, I, a foot loose researcher, oftentimes felt a
strong sense of guilt.
I sometimes had to ask subjects questions directly and anxiously what was actually going
on. Their explanation helped me largely in understanding the exotic dramas. The type
of learning discussed above can not be attained by a grab-and-go questionnaire survey.
Waiting for events to occur is, therefore, not a drawback for the field observation, but one
of its advantages. Besides, many of the “projects” are repetitive, not rare occurrences.
The occurring event that my research subjects and I were both observing allowed us
to become involved in deeper discussions about the transactions. A formal interview
could not have accomplished this. Even for the formal interview per se, I also realized
that my experience of field observation largely helped me to conduct them in a language
that made sense to the interviewee and, conversely, for me to understand the
interviewee’s answer more precisely. Field observation facilitates dialogues between
knowledge the researcher and the researched withhold.
Field observation was also nutrimental for theoretical inspiration. The week I
stayed in the Subic Bay proved a turning point exactly in that sense. During the visit, I
developed a way of observing the market while being on the shop-floor. The shop-floor
was regarded as a theoretical space where the inspection point indicates the theoretical
interface of relationship-free transactions. With that perspective, I was able to
operationalize the theoretical question about organizational embeddedness in examining
how and why both sides of a transaction act across the line. Consequently, a
hypothetical explanation was also developed after the visit that firms in transaction create
a fuzzy boundary because they need to “internalize what has already been (and must still
be) externalized.” At the beginning of my field stay in the Subic Bay, the factory
appeared to be a functionally well coordinated whole, but I realized later that it was
67

actually an unstable network connecting different interests. The clear-cut boundary
between buyer and supplier began to blur as I stayed in the factory longer.
Phases of the Research
Finally, to end the method section, let me discuss how I utilize the various kinds of
data to ground my theoretical arguments in the empirical reality. The constant
interactions between theoretical thinking and data collection unfolded in accumulative
stages as the research progressed. In the August of 1993, based on deductive reasoning
from the extant literature and a previous trip to Taiwan in the summer of 1991, I had my
research proposal finished. In the proposal, I articulated my theoretical concern trying
to convince the readers of the intriguing importance of the questions I asked. The
second thing I did was to offer tentative answers to the questions by demonstrating the
plausibility of their underlying theoretical logic. Both works were accomplished by a
review of the extant literature, theoretical and empirical. The remainder of the proposal
was devoted to proposing a variable-oriented model with rigid hypotheses, precisely
operationalized variables, and a sampling scheme for statistical inference.
After I was settled in Taiwan, about ten test telephone interviews were conducted,
and they proved fruitless in even getting a simple agreement to reply my forthcoming
mail questionnaire. This result was not surprising at all, because even the government
and industry association were unable to implement a survey after the majority of
production was moved offshore. More importantly, I anxiously sensed that the
questions I was asking in the interviews were not specific to the industry and many
interviewees helpfully admitted that those questions were peripheral to their experience.
68
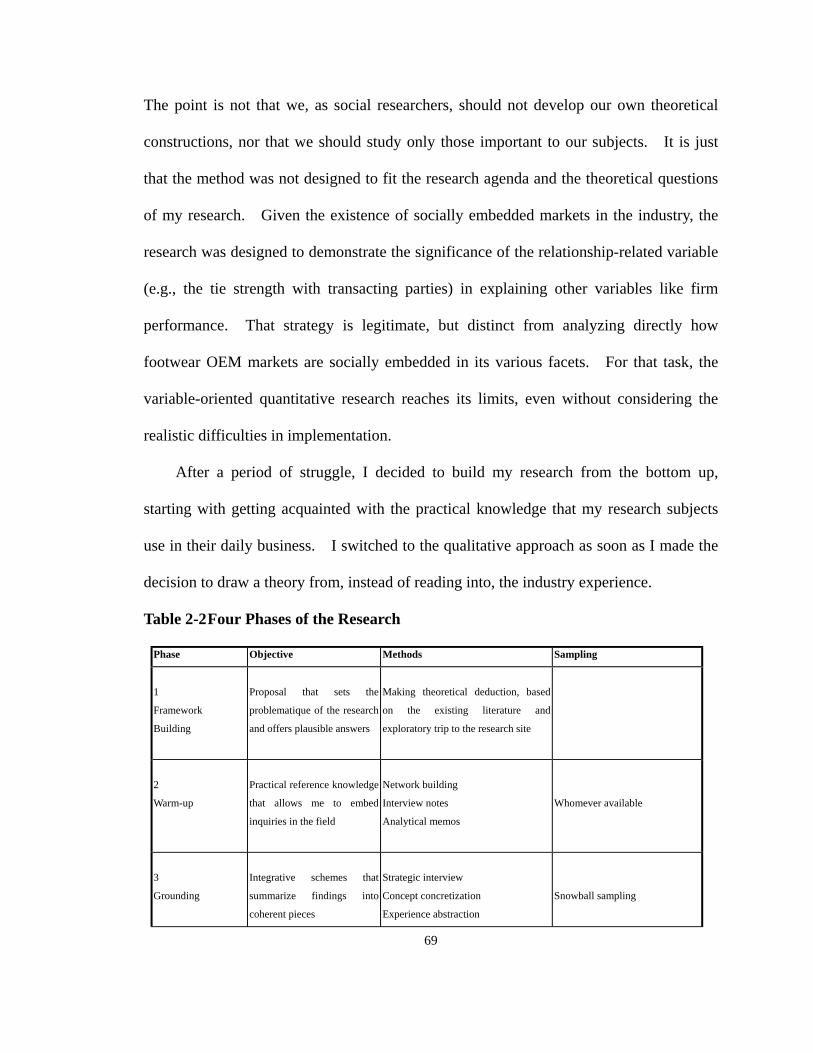
The point is not that we, as social researchers, should not develop our own theoretical
constructions, nor that we should study only those important to our subjects. It is just
that the method was not designed to fit the research agenda and the theoretical questions
of my research. Given the existence of socially embedded markets in the industry, the
research was designed to demonstrate the significance of the relationship-related variable
(e.g., the tie strength with transacting parties) in explaining other variables like firm
performance. That strategy is legitimate, but distinct from analyzing directly how
footwear OEM markets are socially embedded in its various facets. For that task, the
variable-oriented quantitative research reaches its limits, even without considering the
realistic difficulties in implementation.
After a period of struggle, I decided to build my research from the bottom up,
starting with getting acquainted with the practical knowledge that my research subjects
use in their daily business. I switched to the qualitative approach as soon as I made the
decision to draw a theory from, instead of reading into, the industry experience.
Table 2-2 Four Phases of the Research
Phase Objective Methods Sampling
1
Framework
Building
Proposal that sets the
problematique of the research
and offers plausible answers
Making theoretical deduction, based
on the existing literature and
exploratory trip to the research site
2
Warm-up
Practical reference knowledge
that allows me to embed
inquiries in the field
Network building
Interview notes
Analytical memos
Whomever available
3
Grounding
Integrative schemes that
summarize findings into
coherent pieces
Strategic interview
Concept concretization
Experience abstraction
Snowball sampling
69
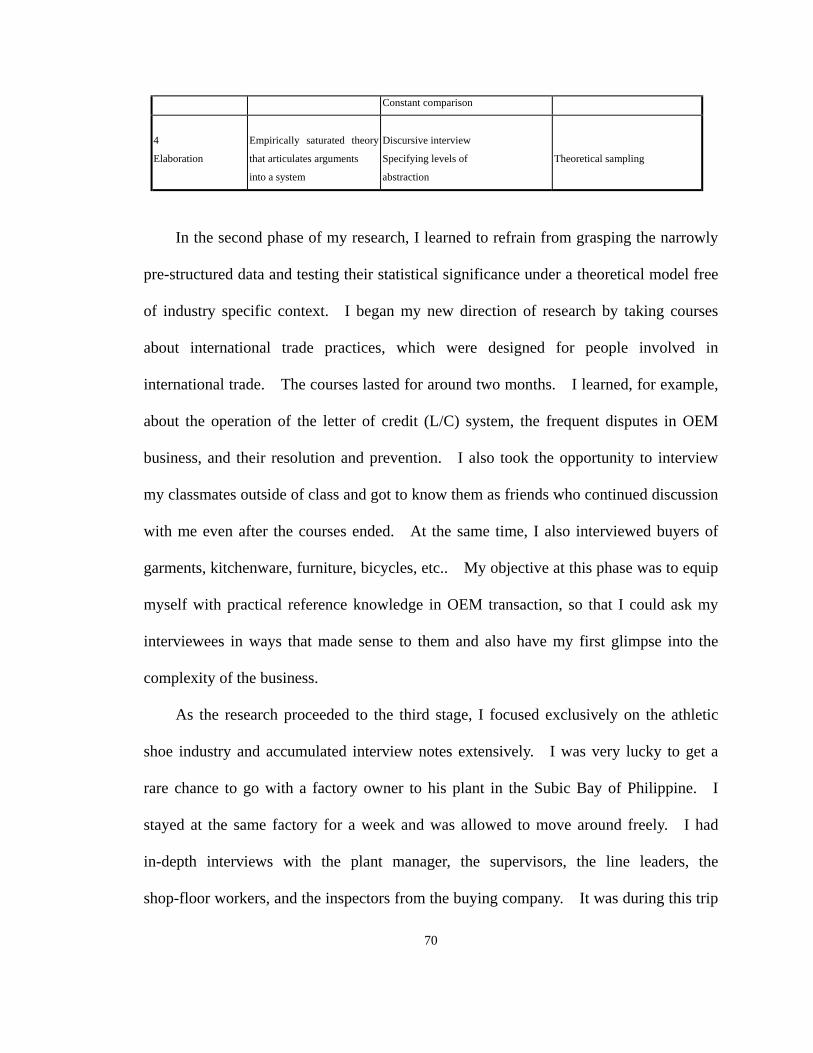
Constant comparison
4
Elaboration
Empirically saturated theory
that articulates arguments
into a system
Discursive interview
Specifying levels of
abstraction
Theoretical sampling
In the second phase of my research, I learned to refrain from grasping the narrowly
pre-structured data and testing their statistical significance under a theoretical model free
of industry specific context. I began my new direction of research by taking courses
about international trade practices, which were designed for people involved in
international trade. The courses lasted for around two months. I learned, for example,
about the operation of the letter of credit (L/C) system, the frequent disputes in OEM
business, and their resolution and prevention. I also took the opportunity to interview
my classmates outside of class and got to know them as friends who continued discussion
with me even after the courses ended. At the same time, I also interviewed buyers of
garments, kitchenware, furniture, bicycles, etc.. My objective at this phase was to equip
myself with practical reference knowledge in OEM transaction, so that I could ask my
interviewees in ways that made sense to them and also have my first glimpse into the
complexity of the business.
As the research proceeded to the third stage, I focused exclusively on the athletic
shoe industry and accumulated interview notes extensively. I was very lucky to get a
rare chance to go with a factory owner to his plant in the Subic Bay of Philippine. I
stayed at the same factory for a week and was allowed to move around freely. I had
in-depth interviews with the plant manager, the supervisors, the line leaders, the
shop-floor workers, and the inspectors from the buying company. It was during this trip
70
that I was inspired to develop some theoretical elaboration to guide the fieldwork that
followed. I primarily used the snowball sampling method to locate my interviewees in
this stage. This method fit well with my interest in investigating dyad relationship of
transacting parties. A typical example went like this: I met a senior manager of the
Company A, a buyer who gave OEM orders to a Taiwanese factory in Subic Bay. When
I came back to Taiwan, I interviewed the company's Taiwan branch manager with the
reference of its Philippine counterpart. Then I interviewed another supplier of A with
help from the company’s Taiwanese manager.
Later, I also made two trips to the inner Pearl River Delta. The field research
allowed me to observe extensively how people worked together to get things done.
When I was in Taiwan, I arranged and conducted formal interviews with buyers,
suppliers, and industry institutes. I took two types of notes after interviews. The
interview notes recorded my dialogue with informants. The analytical memos kept my
analytical reflections upon interviews and observations. They both provided the raw
materials for constructing integrative schemes. Besides the notes, I also collected any
documents that were available during the visits, especially those circulated only inside
the company.
In this phase, relying on the interview notes and analytical memos, I was able to
concretize theoretical concepts and research questions closely to the empirical settings.
For example, the issue of shifting "organizational boundary" was rephrased in quality
control language, which was familiar to my respondents. Meanwhile, in a reversed
fashion, I also developed abstract conceptualization and arguments out of the empirical
data. The rich and perplexing field encounters often brought me to some generative
71
questions that sharpened the way I approached my concern. In practice, the two
directions of reasoning merged in the same process of interpreting cases (Ragin 1992).
Either way, the research was conducted in constant comparisons among cases. Usually,
speculative findings suggested by a specific interview or a field observation were
discarded as the number of interviews accumulated. A critical point to make here is that
the falsification is not the main purpose of constant comparisons. A deviant case can
lead to a differentiation of concepts or a refinement of arguments. Even for a
conforming case, it did not only add to the number, but further substantiated findings in
their various manifestations (e.g., functionally or structurally equivalent). The most
salient achievement at this stage was to develop some integrative schemes. They came
in various forms as in a flow chart, a typological construction, or a conceptual table. An
integrative scheme summarized scattered data and helped to visualize their inner structure
in an easily recognizable form. Analytical memos helped largely in their formation.
In the fourth phase, the industry connections I accumulated and the interview
capability I developed began to support me in locating those people whom I believed
would help elaborate my theoretical findings. Strictly speaking, theoretical sampling
was possible only until this stage. Another work at this phase was what I called
"specifying levels of abstraction." While integrative schemes summarize findings
concisely to a specific area of social activities, they are scattered in different levels of
social aggregate. For example, a scheme about different facets of OEM transaction
dyads is distinct from one about the structural features of the OEM markets that involve
multilateral parties.
During this time, I started to share findings with interviewees with the help of
72
integrative schemes as a medium for detailed discussion, and I invited them to join the
theoretical elaboration. I called this type of interview the “discursive interview,” in the
sense of bringing routine practice into discursive consciousness through dialogues
(Giddens 1979). It showed probably the most exciting and characterizing part of doing
a qualitative field research, because I was finally able to close the gap between two
knowledge systems. The fact that the findings were both familiar and surprising to them
intrigued my research subjects. An example should illustrate sufficiently the very nature
of such a discursive interview. After some discussions, I would pause to raise a puzzle
that would inevitably occur if my arguments, with which the interviewee had just agreed,
were correct. “If the market does work like that, then I could see a strange possibility
that the imitated models could arrive on retail shelves earlier than the original ones. Did
that ever happen?” “Sure,” the interviewee answered, “because you see ....” Another
round of theoretical elaboration and empirical collection would begin. As is clearly
shown in this case, both the internal and external validity increases with this type of
interview (Schoenberger 1991, p.183).
With the caution that there were no decisive time lines dividing phases in the real
research, Table 2-2 illustrates phases of research I have gone through. The figure itself
also serves as a good example of an integrative scheme, which was grounded in and
abstracted from my research experience. The arrowhead lines indicate that every stage
is a succession from its former ones. For instance, the practical reference knowledge in
phase two was carried into the following phases and was constantly revised as the
research proceeded. The same applied to other categories like types of memo and
sampling methods. What is shown in the boxes are only those new elements not
73

existing in the previous phases. An accumulative model of learning also implies in the
figure that it would be premature to apply a technique to the research while works of the
previous stages are not yet sufficiently done. To emphasize, the figure is not intended to
show the steps of the qualitative research in general. It is primarily a methodological
summarization of my research experience.
I learned from my research experience that there is, indeed, a clear trajectory of
qualitative research by which we can examine how much progress has been accumulated
and which of our findings are stabilized. The main advantage of fieldwork is that its
end products are not aliented from the lay people studied. On the contrary, research
reports are seen as more or less a theoretical illustration of what research subjects
implicitly noticed. This positive dimension of researcher-researched interaction has
been largely missing in the main stream quantitative methodology. To highlight this
missing dimension and to end the section, let me shortly discuss how my field
experiences, in retrospect, manifested the features of my research subject-- the OEM
market as organizationally embedded networks.
I found that the most fruitful interviews were often based on the informal and
indirect ties that were generated on a non-economic basis. In searching for an
interviewee, it was far harder to go from the supplier to the buyer, than the opposite.
Also, it was more difficult to go from one supplier to another of the same buyer in the
branded market than in the non-branded. These observations will be illustrated later in
the coming chapters. The point I make here is that the affinity between my work
experience and the research findings should not be surprising because, as a qualitative
researcher, I connected to the market networks instead of observing from a distance.
74

Hence, the researcher is the ultimate tool in qualitative field research.
75
PART II
TAIWANESE FOOTWEAR INDUSTRY IN ITS BOOMING YEARS
(1960-1986)
76
Chapter 3 Institutional Formation of a Competitive Industry
This chapter deals with the formation of the footwear industry. The major
economic agents discussed in the chapter are industrial associations and government
agencies. This chapter prepares the institutional context for the following chapters that
deal mainly with transactions among producers and suppliers in the footwear
export/sourcing markets. It is divided into three parts: the initial grass root formation of
the industry, the institutionalization of the industry, and the crisis of protectionism and the
responses of Taiwanese footwear producers. “Market as a social construction” is the
common theme that runs throughout the discussion. I intend to highlight the following
theoretical hypotheses in the empirical analyses of this chapter:
1) Market formation is a result of the contingent convergence of social forces;
among them, the implicit role of interpersonal networking cannot be overemphasized.
2) Even market competition is subject to institutional construction. Economic
actors do not engage in exchanges and competition only. They also shape the social
infrastructure about how they exchange and compete.
3) Government actions do affect specific market formation; however more
importantly, their effects are not determinant and are ultimately dependent on the
economic interactions among firms inside the marketplace (sometimes through industrial
associations).
77
Historical Origins of the Taiwanese Footwear Industry: Straw Hat Exports
Taiwanese footwear exports originated over three decades ago. Not many
documents have been preserved about what happened in the very initial stage of the
industry. Memories of people in the industry are a valuable source to get information of
this kind. The tendency of industries to concentrate spatially has been often noted
(Krugman 1991; Saxenian 1994; Storper and Walker 1989). The footwear industry in
Taiwan, especially its exporting sector, has been concentrated in the central Taiwan.
The spatial distribution of footwear firms reveals the historical origin of the industry.
The data of 1991 Industrial and Commercial Census compiled in Table 3-1 show the
geographical distribution of footwear factories. Administrative units (cities or counties)
in the left-hand column are arranged parallel to their relative positions in the Taiwan
Island (see Map 1-1). The administrative units with negligible figures are not listed in
the table in order to keep it simple.43
The Taiwanese footwear industry began with the exports of textile shoes early in
1960s. We can still see the mark of its geographical origin in the figure, the central
Taiwan, although textile shoe was no longer the main item of exports after 1970s.
Leather dress shoes are mainly produced in Taipei County and Tainan City, the majority
of them fueled for the domestic consumption.44 Small team production, instead of
assembly lines, was widely practiced in the area around Taipei City. Those firms are
43 The table does not distinguish import and export firms, therefore, the exporting sector is underestimated
with large numbers of firms moved offshore. 44 The name “Taipei” is a composition of two Chinese characters: Taiwan and North. Likewise, “Tainan”
refers to Taiwan and South; and Taichung means the Center of Taiwan. Their names represent literally
their respective locations.
78
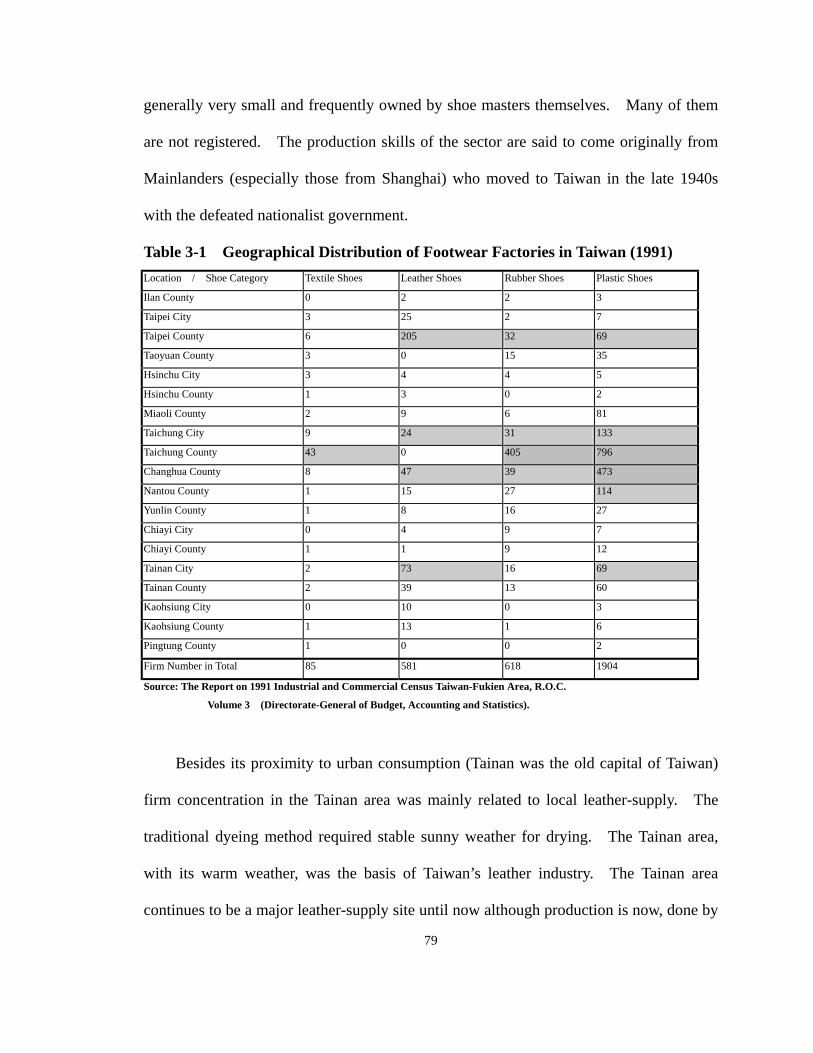
generally very small and frequently owned by shoe masters themselves. Many of them
are not registered. The production skills of the sector are said to come originally from
Mainlanders (especially those from Shanghai) who moved to Taiwan in the late 1940s
with the defeated nationalist government.
Table 3-1 Geographical Distribution of Footwear Factories in Taiwan (1991) Location / Shoe Category Textile Shoes Leather Shoes Rubber Shoes Plastic Shoes
Ilan County 0 2 2 3
Taipei City 3 25 2 7
Taipei County 6 205 32 69
Taoyuan County 3 0 15 35
Hsinchu City 3 4 4 5
Hsinchu County 1 3 0 2
Miaoli County 2 9 6 81
Taichung City 9 24 31 133
Taichung County 43 0 405 796
Changhua County 8 47 39 473
Nantou County 1 15 27 114
Yunlin County 1 8 16 27
Chiayi City 0 4 9 7
Chiayi County 1 1 9 12
Tainan City 2 73 16 69
Tainan County 2 39 13 60
Kaohsiung City 0 10 0 3
Kaohsiung County 1 13 1 6
Pingtung County 1 0 0 2
Firm Number in Total 85 581 618 1904
Source: The Report on 1991 Industrial and Commercial Census Taiwan-Fukien Area, R.O.C.
Volume 3 (Directorate-General of Budget, Accounting and Statistics).
Besides its proximity to urban consumption (Tainan was the old capital of Taiwan)
firm concentration in the Tainan area was mainly related to local leather-supply. The
traditional dyeing method required stable sunny weather for drying. The Tainan area,
with its warm weather, was the basis of Taiwan’s leather industry. The Tainan area
continues to be a major leather-supply site until now although production is now, done by
79
automated roller machines, indicating a typical case of path dependence (David 1985).
With concentrated urban population and local supply of leathers, the Tainan area became
a center of footwear production.
The Taichung area is the ultimate power-house of the footwear industry in Taiwan,
the “Shoe Nest,” as people in the industry called. The marked boxes in the Table 3-1
show a cluster of footwear firms around Taichung City. In the two main categories of
rubber and plastic shoes, about eighty-four percent of the firms are concentrated in the
Taichung area (i.e., Taichung City, Taichung County, Changhua County, and Nantou
County). If we take four categories together, the Taichung area comprises about
seventy-one percent of total footwear factories in Taiwan. The size of the “nest” has
expanded and shrunk over last forty years. The center that enjoys the commanding
height of the area is unarguably the Taichung City, where most of the buyers are located.
The historical center where the industry grew at the very beginning however was
further down Dachia river, located about sixteen miles north of Taichung City. The
Dachia river has traditionally been the line separating the north and central parts of
Taiwan. In the delta area, rushes flourished along river bank. Straw hat production
based on women’s household labor developed in the adjacent villages as a by-product of
agriculture. Dachia Township is still famous for its straw mats. It was a family
economy passed down through generations and grew rapidly until the early days of
Japanese colonialism (1895-1945).
Even before colonialism, Taiwan was a growing basis of regional economy,
controlled by the European merchants with assistance from local Taiwanese middlemen.
Sugar, tea, and camphor were the three major export items comprising 84.5 percent of
80
total exports in 1896 (Liou [1974]1992, p.17). Commercial activities were already
popular in Taiwan. The straw hat industry exported over five million hats annually
between 1912 and 1941, Japan being the major market. In the peak year of 1934, fifteen
million hats were produced, accounting for fifteen percent of the world’s grass hat
production (Hsieh 1964, pp. 335-6). The war between China and Japan broke out in
1937 and stopped the trade.
After the devastation of the War, woven hat production resumed in central Taiwan,
using housewife labor again. Rural sector non-farm activities have been documented as
providing a basis for Taiwan’s subsequent entry into export markets (Liang and Lee
1972). Around 1963, the industry reached another peak year, contributing to foreign
exchange earnings precious to the import-substitution period. Raffia straw, Vietnam
straw, and Viscos were the materials for weaving hats. In 1960, a number of straw-hat
merchants came up with the idea of weaving the uppers of shoes and then combining
them with plastic outsoles to make slippers and sandals for exports.45 That inaugurated
the beginning of footwear exports from Taiwan (TFMA 1989). The high concentration
of textile shoe production in Taichung County, as discussed earlier, reveals the historic
marks of the industry’s early history.
In 1967, there were about thirty registered footwear companies. They were
concentrated in the area between Da-Chia and Ching-Shui, two towns located on either
side of the Da-Chia river. The industry started to grow more quickly until the late 1960s.
45 Some of the main athletic shoe manufacturers, like Ron-Di-Shin, Ji-Lee, and Pou-Chen, actually started
as merchants who put out straw to farm households in central Taiwan for hat-weaving (Anonymity 1983).
Information about Ron-Di-Shin and Ji-Lee are based on interview.
81

The president of a footwear factory reflects upon what was happening during the early
days of his business.
“At that time, Taiwan had just begun to push exports. People were amazed by
how making shoes could earn them a little fortune. They were groping for
manufacturing exports in a learning-by-doing fashion (Bien-Juo-Bien-Shieh).
Market Information was passed around friends and relatives. For example, a
glue maker would tell his relatives about opportunities for shoe-making which
he got from his customers. A shoe maker would tell his best friend to set up a
carton factory, you know, making money together (Yu-Chien-Da-Chia-Chuan).
Things like that were very normal at the time and people were extremely
hard-working then. We started working at seven o’clock in the morning and
worked until 11 PM. Overtime work could easily extended till 3 AM”
(Informant MFC).
Another one described the scene from a different perspective:
“I was then working for the CITC (i.e., the footwear section of Mitsubishi) as
an inspector. It was really interesting to see how people made shoes at that
time. They made shoes inside the duck huts along a stream, beside a hog
house, or in the backyard of a farmhouse. One time, the high-frequency
molding of plastic shoes shut down the electric supply of entire village for a
while, and some even interfered the operation of Taichung military airport
where US air forces were stationed. Military officers were surprised that the
source of interruption came from the hog houses. As an inspector, I had seen
all these. We, the inspectors of trading companies, were the unsung heroes of
82
Taiwanese footwear industry. We moved around like bees spreading pollens
among separated manufacturers so that innovations in manufacturing spread
quickly. The industry grew out of the cooperation between two distinctive
groups of people: the undereducated manufacturers and us, the better educated
traders” (Informant MCA).
Ellis Safdeye, the president of E.S.Original, who was the first American footwear
importer to establish sourcing ties in East Asia, remembers what Taiwan was like when
he first visited it in June 1964. “I had a raffia sandal I thought could be made there” he
explained. “I found a gentleman who told me he had a factory that could make the shoe.
After a considerable journey by taxi, the man brought me to a garage, where twelve men
with money to invest were waiting. There was a factory, but it was making raffia hat
bodies, not shoes. I thought if they can make hats, they can make raffia shoe uppers,”
said Safdeye. “I gave the man an order for 50 thousand dozen-- in those days you
bought in dozens. They built the factory for me. The sandals were sold to J.C. Penney
for US$ 62.5 cents a pair, to retail for US$ 1. The factory grew. Others were built.
Taiwan became capable of making all kinds of shoes.” (Footwear News, Sept. 20, 1993)
With entrepreneurs on both sides of the Pacific Ocean working hard to set up their
businesses, and busy moving materials and finished shoes on the rural roads of central
Taiwan, no one would have imagined that the numerous interpersonal networks they built
would carry the footwear supply/sourcing market into such large-scale transactions in
later years. Likewise, who would have known that household straw hat weaving, as a
side product of the rural economy, would prepare a seed-bed for the interpersonal
networks of friend and family connections, that would be cultivated into a major export
83
economy of Taiwan. Both historical contingency and visible handshakes do play an
important role in industry development.
The Growth of its Upstream Plastic Industry
The straw-weaving industry alone cannot explain the formation of the Taiwanese
footwear industry. The plastic outsoles that were assembled with straw-woven footwear
uppers for the first export product of the industry were related to a different industry:
petrochemicals.46 The petrochemical industry can be traced to the time of Japanese
colonialism, especially after the of Sino-Japan War began in 1937. At that time, the
Japanese government changed its policy from building Taiwan as an agricultural basis to
building an industrialized infrastructure (Liou [1974]1992). From 1940 to 1942, the
petrochemical industry accounted for 12 percent of industrial production. It was the
second largest industry after food. After WWII, the Japanese left an oil refinery plant in
Kaohsiung which was taken over by KMT government as a state enterprise. After
restoration, the Kaohsiung oil refinery plant established itself as a prominent producer in
East Asia, producing half of the total consumed in China. When the import-substitution
phase was exhausted in the late 1950s, the Taiwanese economy shifted gears toward the
“export-oriented industrialization” (Gold 1986).
The import and refinery of crude oil is managed by the state-owned Chinese
Petroleum. The Taiwanese government did not consider petrochemicals a target
46 The narrow definition of petrochemical industry covers crude oil refinery and the following naphtha
cracking (Sector I). The broader definition includes two downstream sectors whose products are plastic
goods and man-made fibers (Sector III) and their inputs like PVC (Poly Vinyl Chloride), PE, ABS
(Acrylonitrile Butadiene Styrene Resin), and PTA (Sector II).
84

industry until the early 1970s. The downstream secondary processing sector was
developed in the 1960s, primarily as a response to growing end-product markets, such as
textiles and plastic goods. Almost none of these factories used governmental capital.
The dominant product was poly-vinyl-chloride (PVC) which comprised the main material
for products like footwear, toys, bags, and raincoats. The state’s role was limited to
restricting imports, the purpose being to save national revenue. The establishment of
the First Naphtha Cracker in 1968 represented the first governmental intervention to build
up backward linkages (Chu 1995; Wang 1995). The growth of the petrochemicals
industry can be seen in the increasing number of plastic factories, from two in 1948 to
over four hundred in 1966 (Wang 1988).
The industrial chain therefore was structured with a state monopoly at upstream, a
growing export-oriented sector of consumer goods at the other end, and a small number
of plastic material suppliers in the middle who relied on consumer goods for demand.
The chain was developed primarily through step-wise backward linkages that were
triggered by the expanding export industries downstream. 47 Even backward
import-substitution did not go smoothly. Studying aggregate data of the two periods of
1960-1971 and 1971-1976, Schive found that the Taiwan economy actually became more
dependent upon imported materials during this time. The domestic supply of
intermediate goods had lagged behind the expansion of downstream export industries.
The situation changed only during the second half of the 1970s when the
second-import-substitution began (Schive 1990a, pp. 270-3).
47 As Gereffi observed, the transition toward export-oriented industrialization had never been clear-cut and
the interplay of the import-substitution and export-oriented industrialization continued (Gereffi 1990).
85
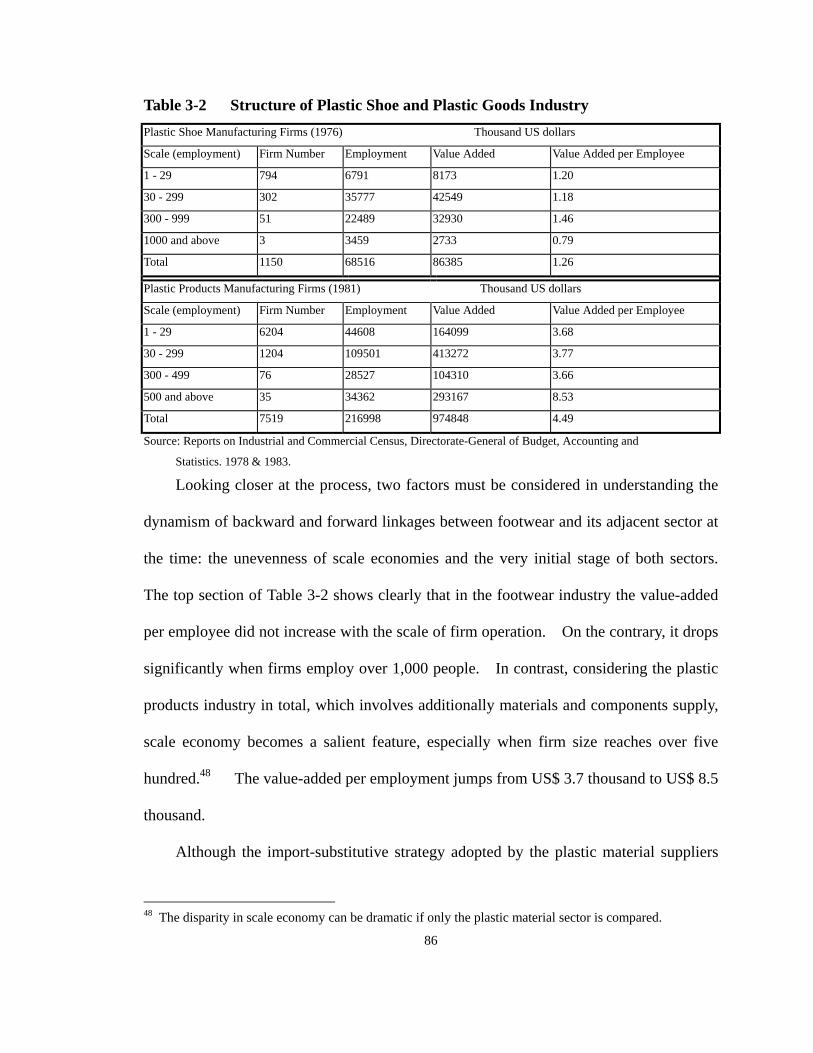
Table 3-2 Structure of Plastic Shoe and Plastic Goods Industry Plastic Shoe Manufacturing Firms (1976) Thousand US dollars
Scale (employment) Firm Number Employment Value Added Value Added per Employee
1 - 29 794 6791 8173 1.20
30 - 299 302 35777 42549 1.18
300 - 999 51 22489 32930 1.46
1000 and above 3 3459 2733 0.79
Total 1150 68516 86385 1.26
Plastic Products Manufacturing Firms (1981) Thousand US dollars
Scale (employment) Firm Number Employment Value Added Value Added per Employee
1 - 29 6204 44608 164099 3.68
30 - 299 1204 109501 413272 3.77
300 - 499 76 28527 104310 3.66
500 and above 35 34362 293167 8.53
Total 7519 216998 974848 4.49
Source: Reports on Industrial and Commercial Census, Directorate-General of Budget, Accounting and
Statistics. 1978 & 1983.
Looking closer at the process, two factors must be considered in understanding the
dynamism of backward and forward linkages between footwear and its adjacent sector at
the time: the unevenness of scale economies and the very initial stage of both sectors.
The top section of Table 3-2 shows clearly that in the footwear industry the value-added
per employee did not increase with the scale of firm operation. On the contrary, it drops
significantly when firms employ over 1,000 people. In contrast, considering the plastic
products industry in total, which involves additionally materials and components supply,
scale economy becomes a salient feature, especially when firm size reaches over five
hundred.48 The value-added per employment jumps from US$ 3.7 thousand to US$ 8.5
thousand.
Although the import-substitutive strategy adopted by the plastic material suppliers
48 The disparity in scale economy can be dramatic if only the plastic material sector is compared.
86
incurred less risk of market uncertainty, the higher scale economy of their operation and
the same formative stage as their downstream industries endowed them with a
fundamental interest in facilitating the expansion of their demand industries.49 For the
downstream footwear producers had learned that their market niche came out of a trial
introduction of plastic components into straw weaving production. The continuing
growth of the industry would have to be based on cooperation with the upstream
industries. The coordination between industries became critical for firms involved in
the chain, and this shows clearly in the institutionalization of the footwear industry.
The Birth of TPSEA and the Industry Institutionalization
The footwear industry, as an unexpected offspring of the hat weaving industry, grew
initially in an under-institutionalized situation, largely inheriting the marketing channels
of, and even identifying itself as, part of the weaving industry. It was not until 1968 that
the first industrial association for the footwear industry was established. The early title
of the association was Taiwan Plastic Slipper Exporter’s Association, reflecting the
majority of export items at the time. It was renamed Taiwan Plastic Shoes Exporter’s
Association (TPSEA) soon after to include wider variety of producers.
The executive director of the association also held this office in the Taiwan Hat
Exporter’s Association (THEA). This seemed inevitable at the time if the association
wanted to operate smoothly. The members of the counseling committee of TPSEA
49 The early establishment of Formosa Plastics in 1954 found itself in an embarrassing situation of
insufficient demand, and as a result, it boldly set up Nan Ya Plastics for its own demand in 1958. The
other major suppliers were established until the demand was more stabilized. Hua Hsia Plastic started
operation in 1964, Cathay Plastics in 1966, and Yi-Fang in 1966.
87
included the chairman of THEA and owners of the five major plastic companies (TFMA
1989). The five factories were Formosa Plastics, Hua Hsia Plastic, Cathay Plastic,
Yi-Fang Plastic, and Hou-Shen Plastic. The arrangement shows precisely the
networking efforts of the new industry in coping with its unique resource environment at
the time. On the one hand, its members had close affinity with the hat industry,
therefore connections had to be maintained to retain export experience. On the other
hand, those pioneer Taiwanese footwear producers knew clearly that the industry’s
development depended critically upon moving from plastic slippers to other types of
plastic shoes. For the upstream plastic material suppliers, the establishment of TPSEA
also equipped them with an institutional channel to get information about (and also
influence) the development of an important downstream industry.
The first thing that the new organization proposed to do was to establish a
“minimum price agreement” and enforce it. The proposal was first presented in a
national industrial conference to the minister of the Ministry of Economic Affair
(MOEA). It planned to enforce a bottom price agreement by adding that criterion to the
issuing of export permits, subject to the International Trade Bureau’s (ITB) discretion.50
The motive for this move was surely not for creating a monopoly. It was justified by the
immaturity of the industry, measured by the practitioner’s lack of information about the
supply and demand markets. The institution was intended to “help firms share
minimum understanding of the common costs structure, and therefore, prevent
unnecessary pricing that would damage the very survival of the industry,” said the former
chair of the industrial association. 50 The International Trade Bureau is a unit under the Ministry of Economic Affair.
88
Government responded to the proposal cautiously. It agreed to link export
licensing with price agreement if written agreement were reached among all association
members. The MOEA also refused to enforce the ruling alone. It agreed to block export
permits only if the exporting firm failed to get the approval stamp from the association.
In other words, the Taiwanese government wanted the association to take responsibility
for the new policy. Although the government primarily played a passive role, it gave
the intra-industry coordination critical de facto support, and at the same time,
strengthened the integrative function of the industry association. Correspondingly, it is
reasonable to say that the industry association intentionally made use of the governmental
authority for an internal integrative project that was initiated, coordinated, and actually
enforced by itself.
After reaching consensus with the MOEA, TPSEA organized many meetings among
its members to classify shoes into parsimonious categories with regard to types, ranks,
and their respective minimum costs. Although not documented, it is sensible to assume
that the upstream material suppliers must have been involved in the communication
process as they were assigned as counselors. After long discussions about materials,
designs, specifications, and methods of production, TPSEA came up with a scheme of
seven shoe categories51 and their bottom export prices. When the time came to sign the
agreement, some firms were hesitant and tried to deter the agreement. The persuasion
and coordination eventually took a longer time than was expected. It was finally
accomplished by the end of 1969 and ITB followed with its own work. The “price
approval for licensed export” was an institutional innovation that, since then, has never 51 They were chemical shoes, loafers, casuals, slippers, folding shoes, sandals, and beachcomber.
89

been practiced by other industries of Taiwan.
How do we evaluate the effects of this agreement? That the industry grew very fast
is hard to deny. Both export volume and value doubled in the following year 1970.
Between 1968 and 1973, the number of footwear factories increased ten-fold to three
hundred, and exports surpassed 200 million pairs. From 1969 to 1976, until the eve of
the Orderly Marketing Agreement (OMA), the average annual volume increase rate was
64 percent. The explanations the association offered were that, after implementation of
the system, the market was more stabilized, buyers’ confidence on Taiwanese shoe
exports increased, and transactions became smoother (TFMA 1989, pp.1-3).
There was indeed a strong co-variation between the policy and industry performance,
but the causal connections are difficult to confirm decisively. It is, however, safe to say
that: first, the signing of the agreement was itself an accomplishment of an industry-wide
coordination; secondly, the role of the industry association was largely strengthened;
thirdly, the information circulation in the industry was facilitated and made more
transparent; and fourth, both the industry identity and a shared knowledge of product
classification were established. In a word, the industry was fully institutionalized.
Evaluating the Japanese Influence
So far we have discussed various social forces shaping the industry. The straw hat
industry provided a precondition for the industry to grow. Interpersonal networking
helped spread entrepreneurial opportunities. The concurrent development of the
upstream plastic industry enabled the early footwear entrepreneurs to develop a wider
array of product items. And finally, the establishment of an industry association and the
90

process of making bottom price policy work hammered the last nail in institutionalizing
the footwear export industry. We must, however, discuss the influence of Japan in the
process, as they were the major footwear exporting country before Taiwan.
Unlike in Taiwan, where it was once the third largest export industry, the footwear
industry was unimportant in Japan. Even in its peak year of 1969, the Japanese
footwear industry was only ranked about sixteenth in terms of export contribution. With
regard to industrial policy, the industries that the Japanese government was promoting in
the 1960s were the heavy and chemical industries. The offshore investments of the
traditional labor-intensive industries were concentrated in the mid-1960s. For example,
in the textile and clothing industries, Japanese investments in Taiwan were concentrated
between 1965 and 1970. Indeed, a 1971 report spoke of the end of heavy industries and
hailed the need to concentrate on development of “the knowledge-intensive industries”
(Dore 1986, pp.13, 55).
Table 3-3 The Structure of Japanese Footwear Exports (unit: million US $) 1962 1963 1964 1965 1966 1967 1968 1969 1970
Total Footwear Export (1) 86 67 82 86 85 105 131 135 139
Rubber Shoes Export (2) 47 40 47 49 45 46 56 50 49
Total National Export (3) 4861 5391 6703 8333 9639 10442 12972 15990 19320
Footwear Export to USA (4) 56 42 53 56 52 67 83 88 93
Footwear Export to Canada (5) 8 5 6 5 7 7 9 8 7
(1) / (3) % 1.8 1.2 1.2 1.0 0.9 1.0 1.0 0.8 0.7
(2) / (1) % 54.7 59.7 57.3 57.0 52.9 43.8 42.7 37.0 35.3
(4) + (5) / (1) % 74.4 70.1 72.0 71.0 69.4 70.5 70.2 71.1 72.0
Source: White Book of Trade and Industry (various years), by MITI52
52 Before 1966, the value of rubber shoes exports are calculated by adding two categories: rubber shoes
with real sole and whole rubber rain shoes. After 1966, because of category changes, four categories
(rubber footwear, whole rubber rain shoes, whole rubber sandals, and rubber sole canvas shoes) are added.
91
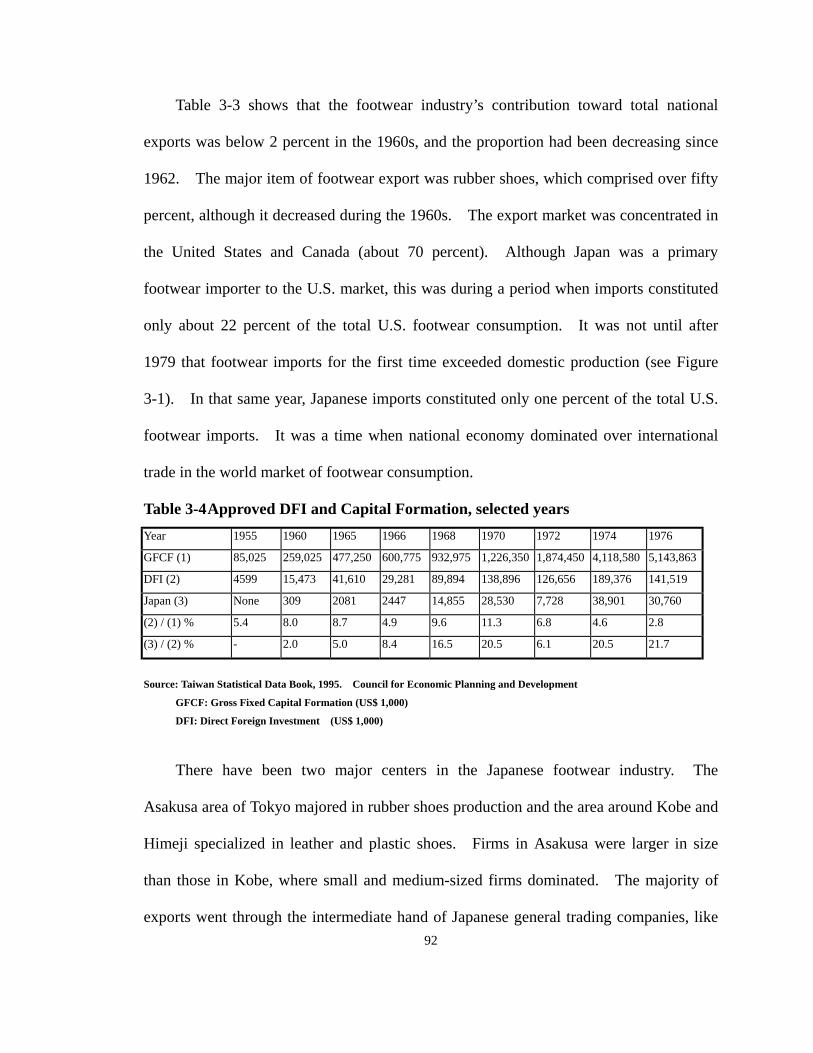
Table 3-3 shows that the footwear industry’s contribution toward total national
exports was below 2 percent in the 1960s, and the proportion had been decreasing since
1962. The major item of footwear export was rubber shoes, which comprised over fifty
percent, although it decreased during the 1960s. The export market was concentrated in
the United States and Canada (about 70 percent). Although Japan was a primary
footwear importer to the U.S. market, this was during a period when imports constituted
only about 22 percent of the total U.S. footwear consumption. It was not until after
1979 that footwear imports for the first time exceeded domestic production (see Figure
3-1). In that same year, Japanese imports constituted only one percent of the total U.S.
footwear imports. It was a time when national economy dominated over international
trade in the world market of footwear consumption.
Table 3-4 Approved DFI and Capital Formation, selected years Year 1955 1960 1965 1966 1968 1970 1972 1974 1976
GFCF (1) 85,025 259,025 477,250 600,775 932,975 1,226,350 1,874,450 4,118,580 5,143,863
DFI (2) 4599 15,473 41,610 29,281 89,894 138,896 126,656 189,376 141,519
Japan (3) None 309 2081 2447 14,855 28,530 7,728 38,901 30,760
(2) / (1) % 5.4 8.0 8.7 4.9 9.6 11.3 6.8 4.6 2.8
(3) / (2) % - 2.0 5.0 8.4 16.5 20.5 6.1 20.5 21.7
Source: Taiwan Statistical Data Book, 1995. Council for Economic Planning and Development
GFCF: Gross Fixed Capital Formation (US$ 1,000)
DFI: Direct Foreign Investment (US$ 1,000)
There have been two major centers in the Japanese footwear industry. The
Asakusa area of Tokyo majored in rubber shoes production and the area around Kobe and
Himeji specialized in leather and plastic shoes. Firms in Asakusa were larger in size
than those in Kobe, where small and medium-sized firms dominated. The majority of
exports went through the intermediate hand of Japanese general trading companies, like 92
Mitsubishi and Marubeni.
Japan’s shoe export industry was devastated by Nixon’s New Economic Policy of
August 1971 which took the U.S. dollar off the gold standard. In the “Nixon shock”, the
U.S. dollar began to dip in value with respect to major world currencies. Almost
overnight the Japanese yen increased in value by 17 percent against the U.S. dollar
(Uchino 1983). Taiwan attached its currency to the U.S. dollar and avoided the shock.
The Japanese government made the statement that Japan was no longer suitable for
footwear production; the industry was abandoned. A large number of firms went out of
business whereas others shifted to the domestic market. The majority of the rubber shoe
factories that were investing offshore moved to Korea, where the Japanese had
established production (e.g., military boots) during their its colonial occupation in the
1930s.
Factories that moved to Taiwan were mainly from the Kobe area. Japanese
offshore investment was never the driving force for the industry’s development in Taiwan.
In general, direct foreign investment (DFI) was more important for Taiwan than for
Korea in their industrialization. Nevertheless, DFI played only a minor role in Taiwan,
with the exception of the electronic industry (Schive 1990b). The contribution of DFI to
the fixed national capital formation ranged from 2.8 to 11.3 percent between 1955 and
1976. As shown in the Table 3-4, Japanese investment increased significantly after
1968, contributing around 20 percent of the total DFI.53
The footwear and garment industries together received sixty-five cases of approved
53 The abrupt drop of Japanese investment in 1972 was mainly because of the stop of diplomatic relation
between the two countries.
93

foreign investment from 1952 to 1984, only about four percent of the total DFI
(Investment Commission 1994). The number of actual investments made was possibly
even lower than that approved. The number of Japanese footwear factories in Taiwan,
estimated by my interviewees, ranged between ten and twenty. Their estimations are
compatible with the published number. In terms of ownership, the majority were joint
ventures, only 15 percent having exclusive Japanese ownership (Investment Commission
1974).54 In short, Japanese manufacturing capital played a negligible role in the
development of the Taiwanese footwear industry. The manufacturing methods that the
Japanese brought to Taiwan, mainly vulcanized shoe-making, were not very sophisticated.
“There was little need for the Japanese to provide technical or financial support: the
technology of footwear production is simple; the initial investment requirements are
small; and ... working capital was made available automatically.” (Levy 1988, p.156).
Japanese merchant capital played a more critical role than its manufacturing capital
in the production site transition. Japanese trading companies mainly facilitated local
networking through which opportunities for entrepreneurial investments were realized.
It was not the financial capital, but the social connections that mattered. Levy shows
that Japanese trading companies identified and encouraged reliable and ambitious
individuals already employed in footwear factories to start-up production facilities of
their own. Another trend that my interviewees emphasize is that many local employees
of trading companies set up their own factories with friends they made in their suppliers.
Some of them later became middlemen who, with their expertise in footwear
54 Factories where Japanese owned over 60 percent of the shares only constituted 30 percent.
94
procurement, connected Western buyers with local producers.55 The interpersonal
networks that the trading companies encompass in their activities are no less important
than their orders.
Levy argued that “the decision of Mitsubishi, the leading Japanese trading company
dealing in footwear, to relocate the manufacture of plastic sandals for the USA market
from Kobe, Japan to Taiwan provided the initial impetus for the expansion of footwear
exports“(Levy 1988, p.155). He is correct in emphasizing that merchant capital, instead
of manufacturing capital, carried the Japanese influence in the process. Besides that, the
influence of Japanese trading companies must not be over-emphasized. Although straw
hats exports had gone through Japanese trading companies since early in the colonial
period, and the channel was picked up after the war, the presence of Japanese trading
companies in the Taiwanese footwear industry was very brief, less than ten years in the
early period. The implication that Mitsubishi single-handedly created the “initial
impetus” of the footwear industry by the orders it gave to Taiwan is misleading. It
overlooks the indigenous context of industry development involving historical
inheritance and contingency, backward and forward linkages, and social networking in
the institutionalization processes. 55 Speaking of social connection, Japanese businessmen I interviewed had a common comment that
Taiwanese were far more friendly than Koreans in doing business with them. “Taiwanese never minded
speaking Japanese to us, while Koreans were just the opposite, although they could,” a senior manager of a
Japanese trading company gave as a vivid example. The same comments are also heard frequently in
interviews with Western trading companies (including buyers). There seems to be a deep cultural
tradition of customer-courting in Taiwan which underpins the networking processes. Possible reasons are
numerous, but that task is, however, beyond the scope of the thesis. Besides, cultural effects are not
determinant and cannot explain the shorter-term variation of specific consequences (Ellison and Gereffi
1990, pp.394-7).
95
Protectionism Came After Booming Growth: OMA
From 1968, when Taiwanese Plastic Shoe Exporters’ Association (TPSEA) was
established and the minimum price system was implemented, to 1986, when the
Taiwanese currency appreciated abruptly and pushed production to move overseas, the
Taiwanese footwear industry experienced booming growth. These were the glory years
of the industry. The number of registered firms of TPSEA (and later TFMA) expanded
from 75 in 1969 to 1,245 in 1988 (see Table 1-4). Over the years between 1968 and
1986, export volume exploded from 20 million pairs to 842 million pairs, a more than
forty-fold increase. The total exports value jumped from US$ 19 million to US$ 3.7
billion for the same period (see Table 3-5). According to the volume share of the U.S.
footwear import market, Taiwanese imports quickly replaced Italy as the leader in 1972.
Four years later in 1976, its value share also exceeded Italy. In the same year, Taiwan
became the world’s largest footwear producer. In 1980 alone, Taiwanese footwear
producers exported over 400 million pairs of shoes, valued at over US$ 1.4 billion, and
became the third largest exporting industry in Taiwan, trailing the electronics and textile
industries. Taiwan was acclaimed as “the Kingdom of Footwear Production” (TFMA
1989).
Footwear production overseas showed a contrasting picture. The United States
supplied almost 100 percent of its consumption in the years following World War II. The
American footwear industry, composed of over 700 firms employing 240,000 workers,
produced a peak of 600 million pairs by the early 1960s (Yoffie 1983, p. 323). After
96
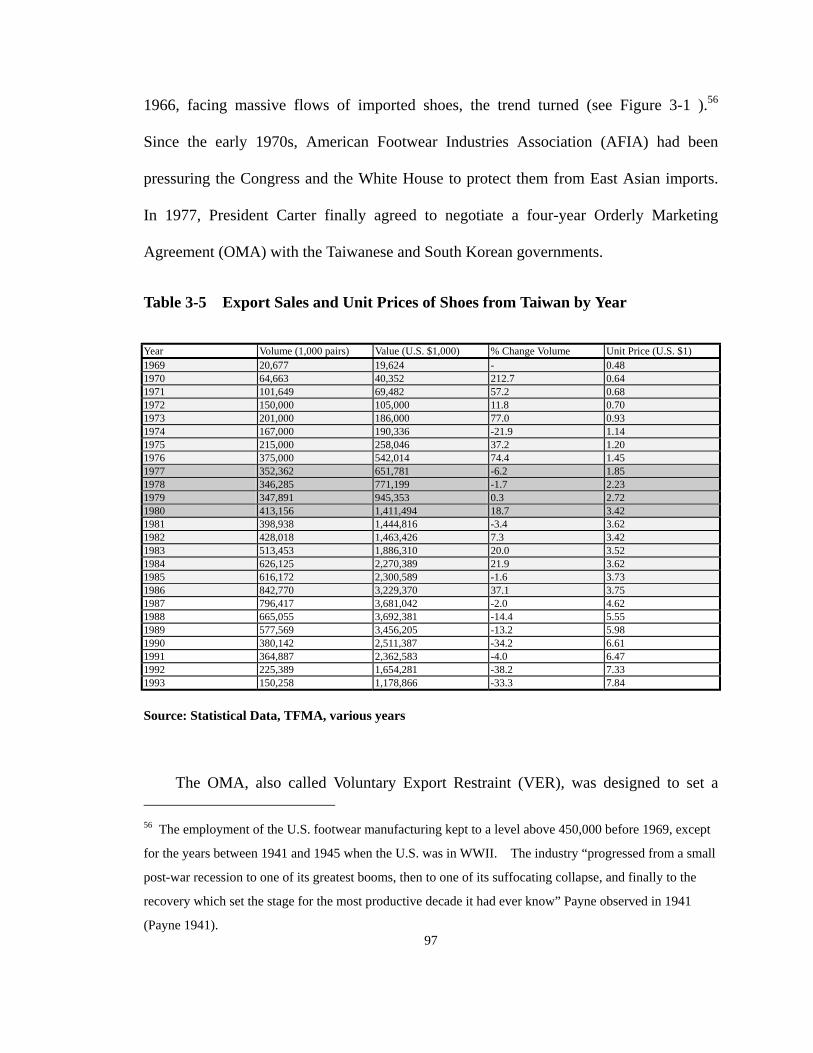
1966, facing massive flows of imported shoes, the trend turned (see Figure 3-1 ).56
Since the early 1970s, American Footwear Industries Association (AFIA) had been
pressuring the Congress and the White House to protect them from East Asian imports.
In 1977, President Carter finally agreed to negotiate a four-year Orderly Marketing
Agreement (OMA) with the Taiwanese and South Korean governments.
Table 3-5 Export Sales and Unit Prices of Shoes from Taiwan by Year
Year Volume (1,000 pairs) Value (U.S. $1,000) % Change Volume Unit Price (U.S. $1) 1969 20,677 19,624 - 0.48 1970 64,663 40,352 212.7 0.64 1971 101,649 69,482 57.2 0.68 1972 150,000 105,000 11.8 0.70 1973 201,000 186,000 77.0 0.93 1974 167,000 190,336 -21.9 1.14 1975 215,000 258,046 37.2 1.20 1976 375,000 542,014 74.4 1.45 1977 352,362 651,781 -6.2 1.85 1978 346,285 771,199 -1.7 2.23 1979 347,891 945,353 0.3 2.72 1980 413,156 1,411,494 18.7 3.42 1981 398,938 1,444,816 -3.4 3.62 1982 428,018 1,463,426 7.3 3.42 1983 513,453 1,886,310 20.0 3.52 1984 626,125 2,270,389 21.9 3.62 1985 616,172 2,300,589 -1.6 3.73 1986 842,770 3,229,370 37.1 3.75 1987 796,417 3,681,042 -2.0 4.62 1988 665,055 3,692,381 -14.4 5.55 1989 577,569 3,456,205 -13.2 5.98 1990 380,142 2,511,387 -34.2 6.61 1991 364,887 2,362,583 -4.0 6.47 1992 225,389 1,654,281 -38.2 7.33 1993 150,258 1,178,866 -33.3 7.84
Source: Statistical Data, TFMA, various years
The OMA, also called Voluntary Export Restraint (VER), was designed to set a
97
56 The employment of the U.S. footwear manufacturing kept to a level above 450,000 before 1969, except
for the years between 1941 and 1945 when the U.S. was in WWII. The industry “progressed from a small
post-war recession to one of its greatest booms, then to one of its suffocating collapse, and finally to the
recovery which set the stage for the most productive decade it had ever know” Payne observed in 1941
(Payne 1941).

quota restriction on the volume of the selected country’s footwear exports to the States.
The Taiwanese government agreed, not voluntarily at all, to freeze its exports of
non-rubber shoes at the 1976 level with only a three percent annual increase rate. The
consequences of the OMA largely went in the opposite direction from what the American
government and industrial association expected when the system was first implemented
on June 30, 1977. U.S. domestic footwear production continued to drop, albeit at a
slower speed. After adjustment to the OMA crisis, Taiwanese producers became even
more threatening, by entering the higher value-added market where, in 1977, American
producers were still strong.
Figure 3-1 U.S. Import and Domestic Production of Nonrubber Footwear, 1968-1990
Source: Footwear Industries of America,
compiled from Department of Commerce Data
The adjustment pattern of Taiwanese footwear producers can be first illustrated by a
comparison of export-import statistics during the OMA. Because OMA placed a
straightforward volume cap on Taiwanese imports, during the four-year period between
98
1977 and 1980, Taiwanese nonrubber shoe exports to the U.S. market dropped from 167
million pairs to 144 millions pairs. U.S. rubber footwear imports from Taiwan, which
were not constrained by quota, also decreased slightly from 61 million pairs to 58.9
million pairs. The total footwear exports out of Taiwan still increased about 17 percent
in volume however, mainly due to market diversification toward other countries. From
1977 to 1983, the U.S. market share in total Taiwan footwear exports dropped from 83
percent to 64 percent, while the European market increased from 3 percent to 11 percent
(IDB 1986, p.14). The trend of market diversification actually continued after 1985, as
is shown the Table 3-6. The proportion of exports to the U.S. market dropped from
another high of 75 percent in 1985 to 46 percent in 1994. Footwear exports to Japan
increased from 4 percent to 16 percent during the same period of time. Exports to other
countries (including Canada, Germany, and United Kingdom) increased from 21 percent
to 38 percent.
European countries quickly noticed the impact and pushed Taiwan to negotiate with
them for voluntary restraint similar to the OMA. This pattern of adjustment differed
from the Korean case significantly. From 1977 to 1980, Korea reduced its nonrubber
exports to the States from 58.7 million to 37.1 million pairs, but at the same time
increased rubber footwear exports from 24.8 million to 42.6 million pairs (Yoffie 1994,
p.124). Korea adapted to the crisis mainly by expanding its traditional specialty in
rubber shoe manufacturing while withdrawing from the restricted non-rubber footwear
market.
Contrary to the passive adaptation of its Korean counterpart, the flexibility of
Taiwanese footwear industry showed not only in its market diversification but also in its
99
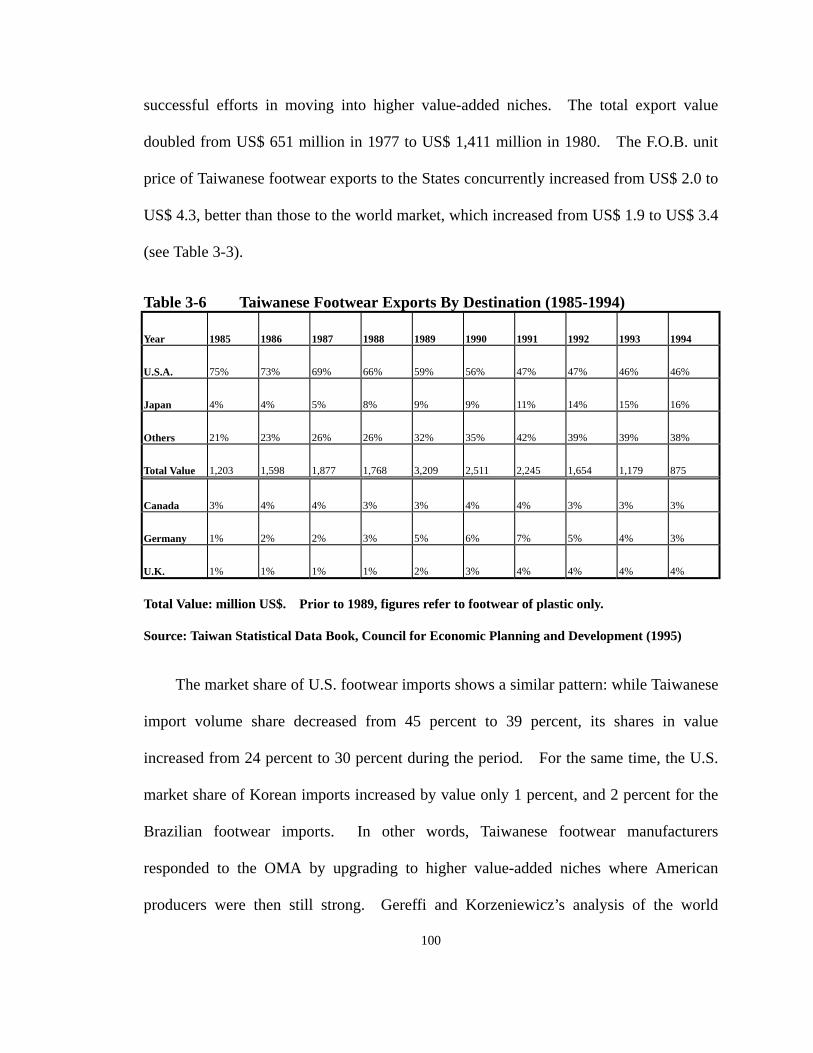
successful efforts in moving into higher value-added niches. The total export value
doubled from US$ 651 million in 1977 to US$ 1,411 million in 1980. The F.O.B. unit
price of Taiwanese footwear exports to the States concurrently increased from US$ 2.0 to
US$ 4.3, better than those to the world market, which increased from US$ 1.9 to US$ 3.4
(see Table 3-3).
Table 3-6 Taiwanese Footwear Exports By Destination (1985-1994)
Year 1985 1986 1987 1988 1989 1990 1991 1992 1993 1994
U.S.A. 75% 73% 69% 66% 59% 56% 47% 47% 46% 46%
Japan 4% 4% 5% 8% 9% 9% 11% 14% 15% 16%
Others 21% 23% 26% 26% 32% 35% 42% 39% 39% 38%
Total Value 1,203 1,598 1,877 1,768 3,209 2,511 2,245 1,654 1,179 875
Canada 3% 4% 4% 3% 3% 4% 4% 3% 3% 3%
Germany 1% 2% 2% 3% 5% 6% 7% 5% 4% 3%
U.K. 1% 1% 1% 1% 2% 3% 4% 4% 4% 4%
Total Value: million US$. Prior to 1989, figures refer to footwear of plastic only.
Source: Taiwan Statistical Data Book, Council for Economic Planning and Development (1995)
The market share of U.S. footwear imports shows a similar pattern: while Taiwanese
import volume share decreased from 45 percent to 39 percent, its shares in value
increased from 24 percent to 30 percent during the period. For the same time, the U.S.
market share of Korean imports increased by value only 1 percent, and 2 percent for the
Brazilian footwear imports. In other words, Taiwanese footwear manufacturers
responded to the OMA by upgrading to higher value-added niches where American
producers were then still strong. Gereffi and Korzeniewicz’s analysis of the world
100

footwear industry reaches a similar conclusion: that Taiwan is clearly a successful case of
entering new niches with higher added-value (Gereffi and Korzeniewicz 1990).
Countries other than the major exporter did take the opportunity to substitute low
value-added footwear originally exported from Taiwan, as shown in the increase of the
category’s volume share from 14 percent to 21 percent. However, two years after OMA
ended, their share returned to 14 percent.
Economics’ Evaluation on OMA
What lesson can we conclude from the market intervention of the U.S. government?
Two representative articles of free-market and interventionist-state approaches examined
the consequences of OMA but reached very distinct conclusions. Examining the
cross-price elasticity of demand, Bee Yan Aw, an economist, found that Taiwanese
imports on the low-quality end were in competition with footwear from the less
developed countries (LDCs). The competition in the sector was less than perfect,
however, because of Taiwan’s higher market share. Aw (1992) estimated that the
welfare loss to American consumers as a result of price mark-ups were about US$ 66.6
million; most of this money, about 65, percent went into Taiwanese pockets. The article
therefore implicitly recommends a hands-off free-trade policy.
The other study (Yoffie 1983) proposed a very different lesson. OMA policy failed
because the U.S. government was reluctant to break away from its free trade ideology and
sought a compromise between the Congress and AFIA by offering the half-way
protectionism of OMA, instead of a global tariff increase. The selective, volume-based,
and bargained characteristics of OMA protection made it not only ineffective in
101
implementation, but even worse, detrimental to the domestic industry. It did not provide
a supportive environment sufficient for a related three-year program aimed at promoting
the industry’s technological advancement. The lesson Yoffie proposed was that the
industrial adjustment policy as a whole seriously lacked integration and consistency.
The OMA actually backfired on the domestic industry because of not enough protection.
Specifically, it was the type of industry protection, not the protection itself, that went
wrong, and the ideology of economic liberalism was to blame. When Reagan took
office after Carter, he followed the wrong lesson by blocking any further protectionism.
The two contrasting articles share the conclusion. Despite the discrepancies
between their policy evaluations, OMA was a policy failure. The successful upgrading
of the Taiwanese footwear industry is clearly illustrated in Yoffie’s article and implied in
Aw’s analysis, although in a different language. Aw conceived OMA as an abrupt
restriction on the supply side of the market and designed a typical economic analysis
about how prices as a function of market equilibrium changed accordingly. If the
market was perfect (i.e., footwear are fully and spontaneously substitutable), theoretically,
we could expect to see the price remain steady. The real market was not perfect,
therefore Aw pursued an “empirical model” that measured price mark-ups in a
less-than-perfect situation. “[It] is possible to identify the degree of competitiveness in
a market using market price and output data even when production costs are unknown.”
Aw (1992, p. 329) thus emphasized his methodological innovation. The organizational
process of upgrading that took place inside Taiwan has no place in his paradigm. It is
overridden by the price mark-ups that reflect the narrowing of supply and the market’s
imperfection. The price mechanism of the impersonal market ultimately takes causal
102

priority.
Yoffie acknowledged the adjustment of production and sales strategies foreign
producers made in responding to the OMA. He argued:
“The calculus of profitability changes with protection. An OMA by its very
nature encourages diversification and upgrading of product lines by foreign
exporters. To avoid long-term losses in revenues due to restricted market
access, foreign manufacturers will often move into more dynamic markets that
are unrestrained and offer higher profit margins. Under an OMA, it is
entirely possible that foreign manufacturers will diversify into the strongest
segments of the American market.” (Yoffie 1983, p.321)
No one, the opposite policy diagnosis included, would doubt the possibility of
upgrading. The main argument of Yoffie is that the OMA introduced a new incentive
structure that triggered the upgrading of foreign producers and resulted in the backfire.
However, why did Taiwanese producers not realize the possibility of magnificent profits
by producing footwear with higher added-value before OMA was implemented and the
incentive was even higher? Even if they were pushed to the higher value-added niche
by the fear of long-term losses (a negative incentive) a critical question remains: why
were they able to accomplish it? If the answer is that upgrading is effortless in a
labor-intensive industry like footwear, as Aw’s article implies, the question goes full
circle as to why firms initially failed to enter the higher profit niches. Besides, as we
discussed earlier, Taiwanese producers obviously adopted a different path of adjustment
from the Koreans. There was no doubt a change in incentives, but incentives alone are
far from sufficient to explain the upgrading. We need to study the impact of OMA more
103
broadly, beyond the equilibrium market or incentive structure, and look at what was
happening inside Taiwan, and adopt a perspective that sees market competition as a social
arena that is mediated through institutional arrangements.
Taking Advantage of OMA Institutionally: The Birth of TFMA
Taiwan has faced protectionist pressures since the early 1970s. The Taiwanese
government fought off many attempts to impose quotas or increase tariffs on its footwear
industry. The International Trade Bureau (ITB) of MOEA led business groups
representing Taiwanese footwear manufacturers to the United States for public hearings
and lobbying. As the AFIA was struggling to gather support from the Congress, TPSEA
was also involved in intensive coordination with U.S. business associations, such as the
American Retailer Association or the Volume Footwear Retailers of America, to prevent
protectionism. The U.S. footwear industry had only a weak craft tradition and the
wholesale merchants, rather than producers, played the steering role in the evolution of
the industry from the early handicraft stage of local retail sale, through the putting-out
system, to the factory production stage (Thomson 1989). The manufacturing and
distribution sectors of the American footwear industry had no strong cooperative
tradition.
Through many direct and indirect joint efforts, an alliance of interests was
maintained between the Taiwanese government, Taiwanese manufacturers, and U.S.
importers and retailers. A triple alliance of interests across nations constituted the
overarching framework that supported the expanding Taiwanese OEM footwear exports
in its glory years between 1969 and 1986. Underlying the framework, there developed
104
many reciprocal and long-standing OEM business relationships among Taiwanese
producers and their foreign buyers. In this chapter, we focus on the impact of OMA and
the development of a well-integrated production network in Taiwan; we will examine the
adjacent marketing network in the next chapter. Besides strengthening the cooperative
network among Taiwanese suppliers and foreign buyers, a direct influence of OMA was
that it gave birth to the formation of the Taiwan Footwear Manufacturer’s Association
(TFMA). It came right at a time when the local industrial basis was growing rapidly
both in scope and scale, and therefore was in serious need of a more integrated industrial
association.
During the OMA negotiations, the International Trade Commission (ITC) insisted
that OMA should cover every footwear category except rubber shoes. The import quota
for Taiwan was divided into three categories: leather shoes, plastic shoes, and shoes with
mixed uppers of leather and plastic materials. Korean imports were divided into two
categories only (leather and non-leather), reflecting Taiwan’s greater flexibility. An
immediate problem for Taiwanese producers was that TPSEA covered only plastic shoe
manufacturers. Leather and rubber footwear manufacturers belonged to the Taiwan
Leather Product Industrial Association (TLPIA) and the Taiwan Rubber Products
Industrial Association (TRPIA) respectively. These two associations represent all
leather and rubber products manufacturers, not only footwear. To accomplish the
complex task of quota management efficiently, a temporarily-organized joint office,
composed of seven related associations (including, for example, the export trading
company’s association), was set up immediately after July 1977. European countries,
afraid of being dumped with footwear blocked outside of the American market, quickly
105
adopted their own versions of import quota restrictions in the following years. Bilateral
trade negotiations with major European countries gave TPSEA an increasing workload,
while its lack of representativeness crippled efficient coordination.
There was a general consensus among the associations and footwear producers of all
kinds that a new association must be established immediately. In April 1978, the
Taiwan Footwear Manufacturer’s Association (TFMA), representing all footwear
manufacturers in Taiwan, replaced TPSEA in order to cope with the increasing load of
quota negotiation and management. TFMA then took advantage of the OMA to develop
itself into a model industrial association in Taiwan and restructure the industry into
upgrade-driven competition.
Taking Advantage of OMA Institutionally: Quota Management
The first task TFMA faced was quota management. A Quota Research Committee
(QRC) involving governmental officials, academics, and representatives of related
industries was formed inside TFMA.57 The Committee designed a quota allocation
system that shaped the market competition in a unique fashion. The total quota was first
split into two parts: 85 percent for the “basic quota” and 15 percent for the “free quota.”
The annual 3 percent increase would be added to the free quota. In the first year, the
export capability of firms was calculated by their average export volume in the three
previous years (i.e., 1974-1976). The basic quota was then distributed to firms
according to the percentage they contributed to total exports to the U.S. market.
106
57 Most of the following analysis is based on interviews with senior government officials and managers of
industrial association.

Following the monitoring system developed during the TPSEA era, firms were
allowed to export by the custom only with a stamp from TFMA on the export permit.
This system encouraged self-management and also equipped TFMA with the capability
to keep detailed records of every transaction of its participating firms. The basic quota
assigned to a firm would be confiscated to the free quota if not used up by the year’s end.
The free quota was open to bidding and firms that held higher unit priced orders got the
quota. Since bidding cannot be held on a daily basis and the seasons of market demand
requires exact timing, QRC was involved in regular consulting with member firms to
coordinate periodic bidding based on the times of receiving orders and product delivery.
To avoid discrimination against new firms and ensure competition, only new firms or
those that used up their basic quota were allowed to enter the bidding. Since the
availability of quota was determined by the open bidding, orders during the OMA period
often indicated that they were “subject to available quota allocation.” This
unpredictability created certain disturbances to the business, but it also facilitated
order-screening which reduced the inclination of firms toward grabbing any orders
possible.
The impact of the competitive system varied among firms depending on size.
Smaller firms were placed in a difficult situation because orders that were larger than
their quota holding would require additional free quota, which was less certain. Many
sold their quota to those who were collecting quota. Some firms withdrew from the
quota-mediated American market and concentrated on non-American markets like
Europe. As a result, market diversification came hand in hand with specialization of
firms. Quota itself became a commodity, and firms quickly learned to mark up their
107
offers with a quota premium added, sometimes even when they were using basic quota.
Firms with a larger quota could more easily deal, and therefore, market opportunities
opened wider for them. A typical strategy adopted by larger firms was to set up new
firms and concentrate higher-valued orders in them in order to compete for free quota,
while keeping lower-valued orders in the original firms. As the higher-valued orders
became stabilized, they were transferred to the old firms to fill up the basic quota with
higher profits. Several larger manufacturing groups grew out of the OMA period. The
most famous of them was the Pou-Chen Group, which started competing on the basis of
cheap orders and ended as the world’s largest athletic shoe manufacturer. From April
1968 to March 1981, 114 firm were out of the TFMA (or TPSEA before 1978) and 206
new firms entered. The annual growth rate of members was only 4.4 percent, but at
least it was not declining as might have been expected.
The minimum price institution established in the late 1960s under TPSEA was
destined to paralyze itself by its own success It was based on the written agreement
among participatory firms, and even its price list became unrealistic as time passed. As
the number of new firms increased abruptly in the early 1970s, the minimum price
agreement started to lose momentum because of the difficulty in reaching new
agreements. At a time when cut-throat competition emerged, again fueled by booming
exports, OMA and the quota allocation system in 1977 reshaped market competition from
simply competing by offering the lowest price to one with a new dimension of upgrading
to higher value-added exports. The small guerrilla firms who tried to get orders at any
price were shuffled out of the game by the new system of competition, thereby reducing
market uncertainty. Quota flowed to manufacturers who were driven by quality
108

improvement. The periodic bidding held in TFMA created a new atmosphere of
competition and the other’s capability to win higher valued orders constantly set new
benchmarks for organizational learning. There was certainly an advantage for the
established firms and new entrants were discouraged unfairly. However, the point here
is that the competition was no weaker, only conducted under a redefined consensus about
what to compete.
Financed by the 0.06 percent quota management fee, TFMA sought to further
consolidate the upgrading-based competition and also give assistance to those firms who
pursued after quality improvement. The first move of TFMA was very straightforward.
It organized a team of quality control (QC) experts, and then conducted on-site firm visits
to evaluate firms’ QC capability according to a four-grade scale. This project was based
on cooperation with a newly established semi-official institute of the China Productivity
Center (CPC), which was built to facilitate a QC culture in Taiwanese industries. The
QC level of firms was indicated on the TFMA quota stamp on the export permits. The
frequency of inspection ranged from once a year for the highest-graded firms to once a
month for the lowest. At the same time, TFMA set up a special sector to provide
training programs and QC assistance for firms that requested help to improve their
operations, again with support from the CPC. During the OMA period, TFMA had
developed into a model association that carried out multiple functions, including trade
negotiations, training services, quota management, and quality promotion.
The continuing drive of supporting industries toward more advanced products was
another important impetus for the upgrading of their downstream footwear exports. It
was a virtuous circle that finally led to one of the world’s most competitive footwear
109
industrial complexes in Taiwan. In the late 1970s, domestic supply of dry-processed PU
leather was already developed and ready to push the footwear production into higher
value-added items like casual shoes, pumps, and boots. After OMA, the mass
production of wet-processed PU leather gave another big lift for footwear manufacturers
to upgrade into higher value-added niches. The footwear machinery industry also
surfed the tide and established a solid foothold in the late 1970s with the introduction of
lasting machines, sole attaching machine, and conveyors. In the 1980s, new machinery
that required more research investment, like hydraulic injection machines, computerized
stitching machines, and automatic cementing machines, were successfully
commercialized. By the end of the 1980s, Taiwan had become the world’s largest
synthetic leather and footwear machinery supplier. As the industry grew over the years,
a well-integrated local industrial base, composed of supporting industries like machinery,
synthetic leather, components, printing, and mold making, was gradually formed, mainly
around Taichung City. As a buyer said, “you can basically have everything (for
footwear development and manufacture) done in a small area of 25 kilometers in
diameter.”
“In only a few years, we accomplished a remarkable job, shifting gears from making
slippers and sandals, all the way to the CTCB (closed toe and closed back) shoes,”
commented a senior MOEA official, reflecting upon the glory years (Informant AI1).
The industry continued to grow after OMA, with a significant difference that footwear
companies like Florsheim, Survivors, Gilbor, Rockport, and Bass were now added to the
110

list of Taiwanese OEM buyers.58 By 1986, all the major athletic shoe brand names had
well-established OEM supply lines in Taiwan. Central Taiwan had become an
indispensable hub for the densely connected networks of the world footwear industry. It
was also during the 1980s that, in order to overcome labor shortages and periodic market
fluctuations, subcontracting was practiced extensively in Taiwan to utilize cheap female
labor hidden in households. After discussing the exogneous institutional factors in
shaping the industry formation, we now move to studying the marketplace and the
formation of the marketing and production networks that are intrinsic to the footwear
export business.
111
58 “In fact, the mark of Taiwan’s status as the Far East’s number one shoe resource, according to one
importer, is that ‘every nationally advertised brand is involved in some way in Taiwan’” (Footwear News
Dec. 5, 1983).

Chapter 4 The Socially Embedded Footwear Commodity Chain
This chapter begins our investigation of the economic relationships in the footwear
export marketplace. In today’s global economy, the accomplishment of a transaction,
even as technologically simple as footwear manufacturing export, involves many firms
across countries each one specializing in a small part of the whole process. Under
environmental challenges and underpinned by institutionalization processes, Taiwanese
footwear producers have developed into some of the world’s most competitive suppliers.
This advantageous position in the footwear commodity chain was supported by exchange
relationships with their upstream suppliers and downstream buyers over years of
transactions. A study of the industry must look at the structure and historicity of the
networks in which Taiwanese footwear producers were involved in its golden years.
The Taiwanese-centered footwear export networks can be divided into two major
constituents: the marketing networks through which shoes are ordered and delivered to
the retail market and the production networks where firms cooperate in making finished
shoes. This chapter begins with a brief introduction on footwear manufacturing by
describing how production is organized on the shop floor of a Taiwanese athletic shoe
factory. From the isolated in-house production, we stretch “forward” to the marketing
networks, examining the position of footwear production in a complete OEM transaction
and, to carry out the transactions, how marketing networks were formed to establish
Taiwanese footwear producers as major suppliers to the world market. In the final
section, we examine the production network “behind” Taiwanese producers, which
involves various types of firms coordinated in a decentralized system that exerts
international competitiveness.
112
Our analyses reaffirm the central theme of the thesis that a market is a
socially-organized reality, not just an asocial terrain where commodities of all kinds are
equivalently exchanged with money as the only medium. The flexibility of the
Taiwanese footwear production network should not be conceived as an unfolding of the
free market where factors are allowed to flow with least rigidity.
Shop-floor Arrangement of a Taiwanese Footwear Factory
Leaving the institutional environment of Taiwanese footwear producers, we now
step inside the core of the OEM sourcing/supplying market where shoes are made and
sold. We naturally make our first stop at a Taiwanese footwear factory to understand the
technical and organizational factors involved in shoe production on the shop-floor.
Figure 4-1 is the shop-floor layout of a Taiwanese athletic shoe factory I visited in the
Philippines which produces athletic shoes for Reebok. The straight layout of the factory
shop-floor is not typical of the Taiwanese factories confined by precious land space in
Taiwan. For example, the production flow of Pou-Chen’s Chang-Hua plants is divided
into two floors with elevators moving components and finished products between them.
Nevertheless, the figure fits our purpose here well, allowing us to illustrate how footwear
production is organized in a footwear assembly firm.
At the lower-left corner of the figure, materials arrive in the warehouse and are
immediately inspected for both quantity and quality. When a model is ready for
production, leather is first moved to the cutting section. It is important to have each
sheet of natural leather thoroughly inspected before cutting so that bruises, defects, or
shade variation on the surface can be avoided and cutting dies be arranged to make the
113
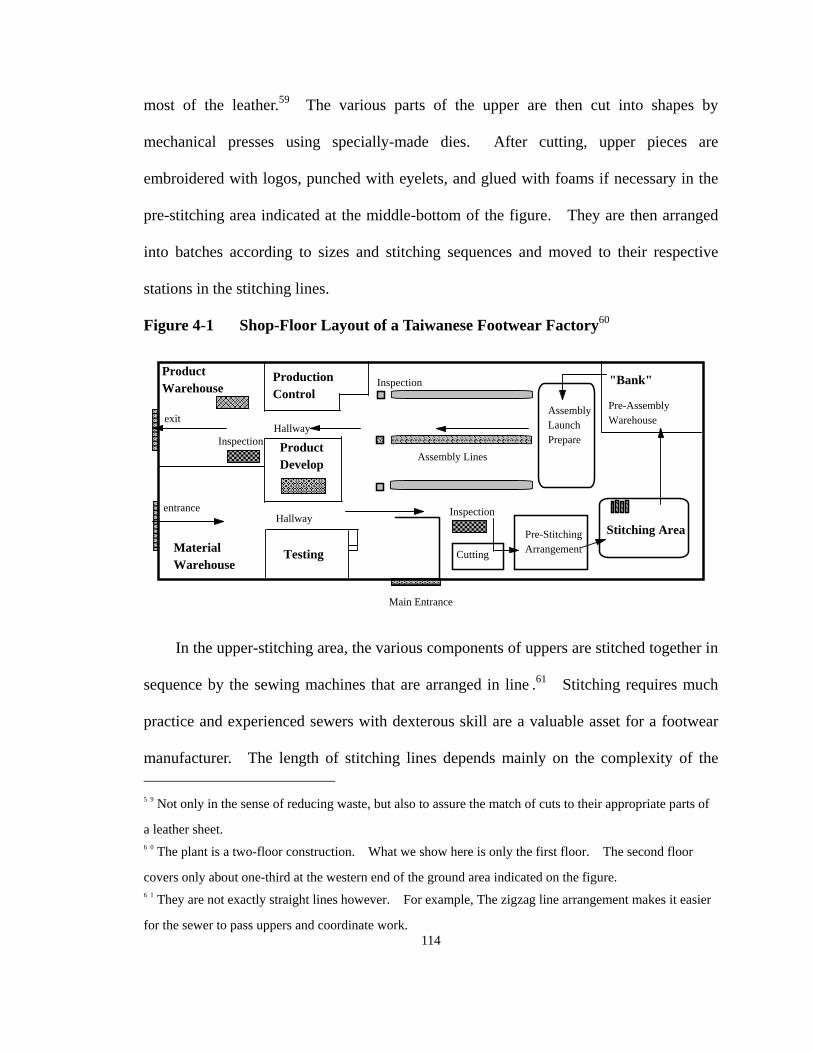
most of the leather.59 The various parts of the upper are then cut into shapes by
mechanical presses using specially-made dies. After cutting, upper pieces are
embroidered with logos, punched with eyelets, and glued with foams if necessary in the
pre-stitching area indicated at the middle-bottom of the figure. They are then arranged
into batches according to sizes and stitching sequences and moved to their respective
stations in the stitching lines.
Figure 4-1 Shop-Floor Layout of a Taiwanese Footwear Factory60
��������
�����������������������������������������������������������������������������������������������������������������������������
�������������
����������������������������
������������������������������������
��������������������
����������������
������������
����������
������
��������������Product Warehouse
Production Control
Product Develop
Material Warehouse
Testing
Stitching Area
"Bank"
Pre-Stitching Arrangement
Hallway
HallwayInspection
Main Entrance
Inspection
Assembly Lines
Inspection
Cutting
Pre-Assembly Warehouse
Assembly Launch Prepare
exit
entrance
In the upper-stitching area, the various components of uppers are stitched together in
sequence by the sewing machines that are arranged in line .61 Stitching requires much
practice and experienced sewers with dexterous skill are a valuable asset for a footwear
manufacturer. The length of stitching lines depends mainly on the complexity of the 59 Not only in the sense of reducing waste, but also to assure the match of cuts to their appropriate parts of
a leather sheet. 60 The plant is a two-floor construction. What we show here is only the first floor. The second floor
covers only about one-third at the western end of the ground area indicated on the figure.
114
61 They are not exactly straight lines however. For example, The zigzag line arrangement makes it easier
for the sewer to pass uppers and coordinate work.
upper design and how the work is divided (e.g., some stations might carry two stitching
steps). Fifteen to twenty sewing stations is about the average. Some factories have
small conveying lines to transport the unfinished uppers along the stitching lines;
otherwise, uppers are just passed along the line by hand.
The finished uppers and other components, mainly outsoles and midsoles, are placed
in the pre-assembly warehouse, which is nicknamed a “Bank.” The “Bank” is a central
post in the manufacturing process which divides the pre-assembly and assembly stages.
The production management office uses the warehouse to control the assembly schedule
of different models. When certain sizes of a model are ready to be assembled, the line
leaders will receive a “check” to “cash” components out of the “Bank” and place them at
the launching point at the beginning of the assembly lines. The ratio between assembly
line and stitching line is normally about one to three, given no subcontracting or imports
of uppers.62 Assembly lines are also called “flowing water” lines, drawing on the image
of a running river. For example, a line leader may be ordered to “put model X into the
flow” or “pull model Y out of the flow,” depending on material or order availability.
The flexible allocation of orders in production space (i.e., controlling the flow) is critical
to the efficient operation of a footwear factory.
The so called “pre-assembly” stage involves preparation of two major components:
the upper and the sole unit comprising the outsole and the midsole. Figure 4-2 shows
115
62 The number of assembly lines is often referred to as an indicator of the size of the firm. Notice the
difference between physical capacity and actually production capacity. Sometimes people double the line
number because two production shifts are conducted. Another practice, more often adopted by Korean
factories, but which I also saw quite often in Taiwanese firms, is to use double lines where each side of an
assembly line makes its own model.
the complete production procedures involved in making athletic shoes. The darkened
boxes and bold lines indicate the processes we just observed in Figure 4-1. The outsole
unit is made outside of the assembly plant. Rubber outsole is produced by cutting and
mixing natural and synthetic rubber with chemicals and color pigments in a container
which is then rolled into a flat sheet of rubber in a rolling machine. This rubber is then
die cut into pieces and pressed in a hydraulic press to form an outsole unit. The midsole
is made in either EVA or PU through certain chemical processes. The outsole and
midsole are then trimmed, polished, glued and pressed together to form a complete sole
unit. In between the upper and the sole unit of a shoe is the insole which is normally
made of fabric and paper board.
At the beginning of the assembly line, the insole board is first glued to the last,
which is a block of aluminum or plastic shaped like a foot and used for shaping shoes,
and the stitched upper is covered around it. A last, which comes in a variety of sizes
and dimensions, is crucial to the production of quality footwear. The last, together with
the insole board and the fitted upper, is then glued and placed into a lasting machine to
ensure a good fit to the shape of the last. Lasting is a critical step requiring higher skill
because the upper must be stretched and attached to the last evenly to give the shoes a
good looking shape.
Figure 4-2 The Production Procedures of Athletic Shoe
116
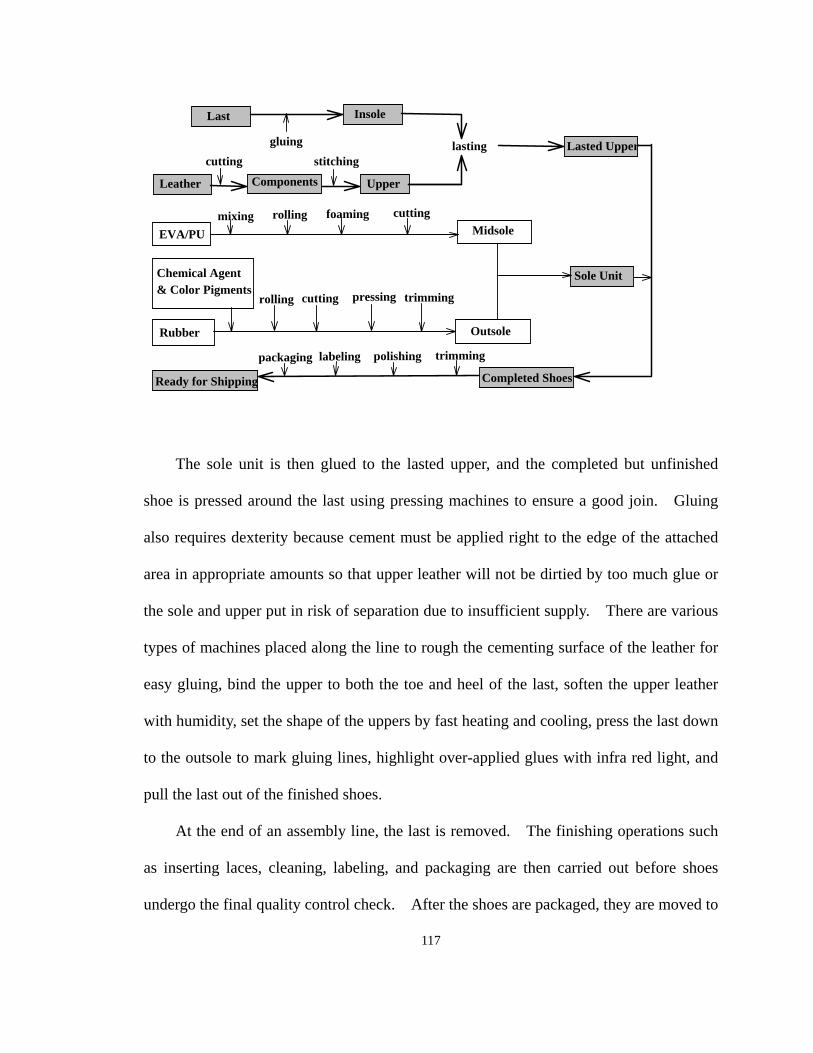
Last Insole
gluing Lasted Upper
EVA/PU Midsole
Sole Unit
Outsole
Chemical Agent & Color Pigments
lasting
Leather Components Upper
Rubber
Ready for Shipping
stitchingcutting
mixing rolling foaming cutting
cutting pressingrolling trimming
Completed Shoes
packaging labeling polishing trimming
The sole unit is then glued to the lasted upper, and the completed but unfinished
shoe is pressed around the last using pressing machines to ensure a good join. Gluing
also requires dexterity because cement must be applied right to the edge of the attached
area in appropriate amounts so that upper leather will not be dirtied by too much glue or
the sole and upper put in risk of separation due to insufficient supply. There are various
types of machines placed along the line to rough the cementing surface of the leather for
easy gluing, bind the upper to both the toe and heel of the last, soften the upper leather
with humidity, set the shape of the uppers by fast heating and cooling, press the last down
to the outsole to mark gluing lines, highlight over-applied glues with infra red light, and
pull the last out of the finished shoes.
At the end of an assembly line, the last is removed. The finishing operations such
as inserting laces, cleaning, labeling, and packaging are then carried out before shoes
undergo the final quality control check. After the shoes are packaged, they are moved to
117
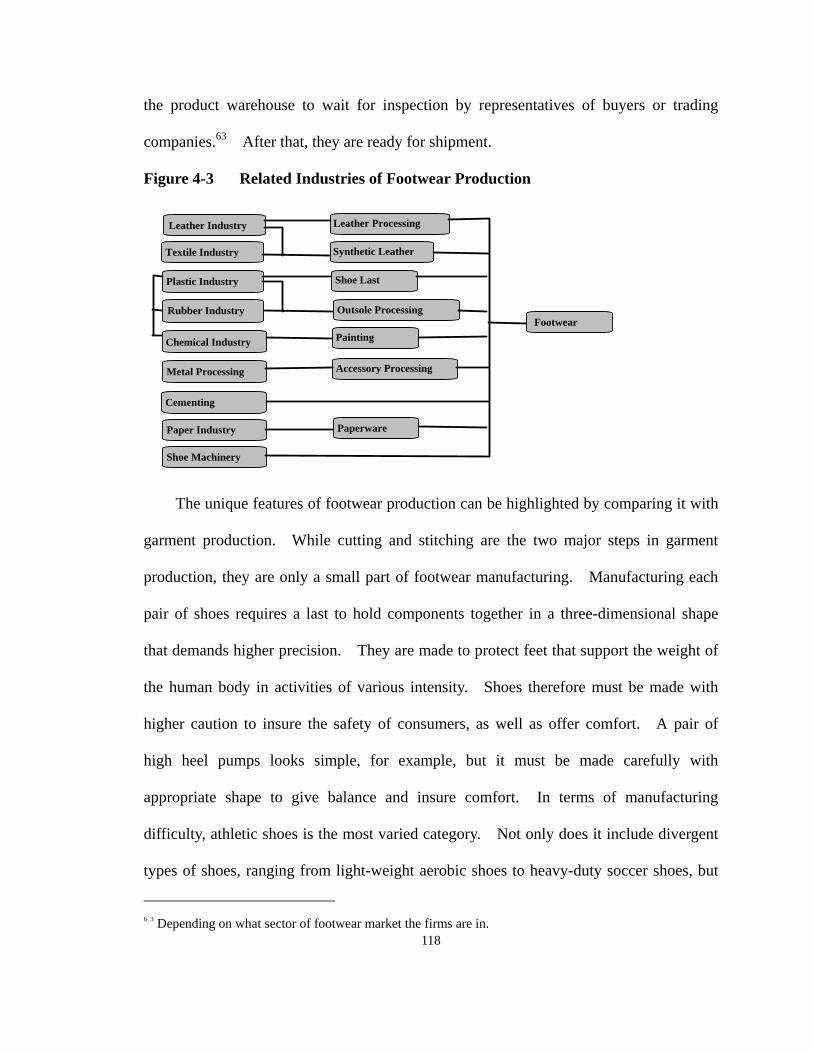
the product warehouse to wait for inspection by representatives of buyers or trading
companies.63 After that, they are ready for shipment.
Figure 4-3 Related Industries of Footwear Production
Textile Industry
Leather Industry
Plastic Industry
Rubber Industry
Chemical Industry
Metal Processing
Cementing
Shoe Machinery
Paper Industry
Leather Processing
Synthetic Leather
Paperware
Painting
Accessory Processing
Outsole Processing
Shoe Last
Footwear
The unique features of footwear production can be highlighted by comparing it with
garment production. While cutting and stitching are the two major steps in garment
production, they are only a small part of footwear manufacturing. Manufacturing each
pair of shoes requires a last to hold components together in a three-dimensional shape
that demands higher precision. They are made to protect feet that support the weight of
the human body in activities of various intensity. Shoes therefore must be made with
higher caution to insure the safety of consumers, as well as offer comfort. A pair of
high heel pumps looks simple, for example, but it must be made carefully with
appropriate shape to give balance and insure comfort. In terms of manufacturing
difficulty, athletic shoes is the most varied category. Not only does it include divergent
types of shoes, ranging from light-weight aerobic shoes to heavy-duty soccer shoes, but
118
63 Depending on what sector of footwear market the firms are in.
even for the same type of athletic shoe, the manufacturing complexity varies widely.64
Footwear production also requires more sophisticated machines and integrated work
in the final assembly. It can not be broken down into small independent units. While
cloth making is part of a sewing craft that many housewives enjoy at home, shoe making
is hardly a hobby. The higher complexity can also be seen in the broad scope of related
industries involved in footwear production as opposed to the garment industry which is
primarily related to textiles alone.
Figure 4-3 illustrates the basic related industries to footwear production. Some,
such as the mold and machinery industries, do not provide materials that go directly into
shoes but they are critical in determining the quality of finished shoes, since they provide
indispensable tools. Others that are related only to certain types of shoes, such as the
electronics industry, are not listed. Another related proof of footwear production’s
broader integration of materials is that footwear statistics are often hidden in diverse
categories like plastic product, textile product, and rubber product, while aggregate data
about the garment industry are more readily available, sometimes under the crude
category of textile product but no others. Footwear production is on the one hand
coordination-intensive involving a large number of supporting firms and on the other
requires certain integrated production that cannot be fully broken down into small
subcontracted units.
119
64 As a manager of a buyer described: “Athletic shoe production is the easiest and the most difficult.
There are the best and the mediocre producers; and their consumers are either very picky or generally
forgiving” (Informant BP1).
Footwear OEM Export Network: Beyond In-house Production
Firms are not self-sufficient economic units. Their very existence relies essentially
on interactions with other firms in the market, especially those with whom they have
direct exchanges. They are also influenced by the moves of their competitors.
Taiwanese footwear export, like many other export industries in Taiwan, is based on the
OEM marketing arrangement. The production control on the shop-floor must be
responsive to the market demands that are driven by buyer-supplier interactions. For
example, the manufacturing details of shoes are decided by negotiations with buyers and
final quality control is subject to buyer’s approval. Even the shipment of finished shoes
must be coordinated with buyers to match their marketing schedule. Taiwanese
footwear production must be studied as a part of OEM marketing networks (from buyer’s
point of view, sourcing networks) which have their own dynamism.
Instead of focusing exclusively on the production process, it is therefore important
to analyze the more encompassing unit of OEM transactions. As shown in the flow
chart of Figure 4-4, a complete OEM transaction involves three major sections: design,
development, and production. The design of a new model is based on preliminary
investigations of fashion trend, sales of previous models, and the new technology or
material development. Not all the initial designs will enter production. Buyers or
trading companies decide which models to make based on various kinds of market
research.
Figure 4-4 A Schematic Flow of an OEM Transaction
120

Preliminary investigation
Concept Design
Costing and checking availability of components
Production feasibility; Contract negotiation
Detailed specification
Prototype
Final Evaluation (Signing Contract)
Tooling
First small batch
TestingFull-scale production
Inspection
Shipping Retail Market
Procurement of materials
Demand Side
Overlapping Area
Supply Side
When entering the development stage, OEM suppliers are either given a prototype
with which to make counter-samples or simply some drawings to make prototypes for
market research. Costing and checking the availability of components are undertaken
by both suppliers and buyers to decide production feasibility and contract details. The
order might be canceled at the last moment when the market research based on a
prototype shows low profit potential.
After the order is placed, factories start to prepare molds, patterns, and materials.
Detailed specifications are also written in preparation for mass production. Testing the
first small batch produced is important because models made by the hands of shoe
masters might go wrong when put in the assembly line. Materials, if necessary, must
also go through different testing to assure quality. After these pre-production
procedures are finished, full-scale production begins and, after the process we have
discussed in the previous section, the finished shoes are shipped to the designated
destinations after inspection.
It is important to note that the dividing lines between design, development, and 121
production are ambiguous. While OEM is defined by a division of labor between the
design offered by the buyer and production conducted by producers, the development
stage, which refers to the activities in which prototypes are tested and modified until a
satisfactory pre-production version of the product is accepted, is an area where buyers
and producers work together on a bilateral basis (see the shaded boxes in Figure 4-4).
Although OEM producers, by definition, are not involved in original design, they are not
restricted to manufacturing either.
Walsh’s broad definition of “design,” which refers to the configuration of materials,
elements, and components that give a product its particular attributes of performance,
appearance, ease of use, and method of manufacture, actually covers what we have
labeled as “development” (Walsh 1992). Development is indeed very close to
“engineering design,” which makes a product meet pre-specified functions and
manufacturing efficiency, in contrast to “industrial design” which mainly looks at the
aesthetic dimensions of a product. OEM is therefore not simply confined to production
and is not without design elements. Instead of seeing OEM manufacturing export as a
fixed and self-contained technical activity, design should be considered as encompassing
a wide variety of activities.
Figure 4-5 The Structure of Taiwanese Footwear Export Commodity Chain
122

�������������������������������������������������������������������������������������������������������������������������������������������������������������������������������
Tool Suppliers
Machinery Suppliers
Taiwanese Footwear Suppliers
Local Trading Companies
Foreign Importers /Distributors
Sourcing Agents
Small Retailers
Discount Chain
Specialty Store
Retail Market
Brand-name Marketers/ Manufacturers
(B-grade shoes)
(rare)
Material Suppliers
������������������
����������������
������������������
Workshops
Subcontractors
SupplyOEM Order
123
Those activities are carried out in organizational structures of inter-firm
coordinations. The actual marketing arrangements in OEM transactions have great
variety (Figure 4-5) and involve transaction chains of different length. They can be as
short as a direct transaction between a footwear producer and a brandname footwear
marketer, or a longer chain that involves producers, local trading companies, foreign
importers, and final retailers. There are various types of buyers in the retail market.
The brandname marketers (e.g., Nike and Reebok) and discount chains (e.g., Wal-Mart
and Payless ShoeSource) are the two major buyers. Footwear specialty stores, like Foot
Locker, rely greatly on brandname marketers for supply. While the major discount
chains have their procurement office in Taiwan for direct sourcing, most of their supply
still passes through middlemen trading companies. The increasing concentration of the
retail market in the 1960s and 1970s was a major reason for the growth of the major
footwear importers. Importers (e.g., BBC, E.S. Original, and Madison) have a long
history in East Asia and have developed expertise in locating producers, coordinating
production, carrying out inspection, and developing new products. Sourcing agents are
trading companies that have formally established agreements with specific buyers to
handle procurement on behalf of the buyer.65 Local trading companies are small in size
and large in number in Taiwan. They have been facing severe competition from both
specialized foreign importers and sourcing agents.
According to a 1986 industry survey (see Table 4-1) of 844 footwear factories ,
about 72 percent of the firms had over 50 percent of their products sold through trading
companies (agents included). Another 25 percent of firms exported the majority of their
products directly to foreign companies or through their local branch office (TFMA 1986).
The majority of Taiwanese footwear factories export indirectly through trading
companies. This reflects the large number of trading companies in Taiwan, in a clear
contrast to Korea. Taiwan had 20,597 trading companies in 1984 while Korea had
5,300 in the same year. The average value of industrial exports per trader was US$ 1.4
million for Taiwan and US$ 5.2 million for Korea. TFMA published a directory of
footwear trading companies in 1993 and there were 647 companies listed. In Korea, the
top 10 athletic shoe buyers’ direct orders constituted 71 percent of the country’s total
export value. Levy explained the difference by the lower transaction costs which
Taiwanese businessmen were able to incur because of their higher education level and
early exposure to commercial activities (1988).
Table 4-1 Export Marketing Channels of Taiwanese Footwear
Export Percentage Number of Factories Percentage
124
65 Buyers pay buying agents a commission that is typically equal to a percentage of the price paid by the
buyer. While a trading company does not act for buyers, a buying agent is a legal extension of its
principal, and may therefore often speak or contact for its principle. Trading companies deal with buyers
on a principal-to-principal basis. The objective of a trading company is to maximize its markup.
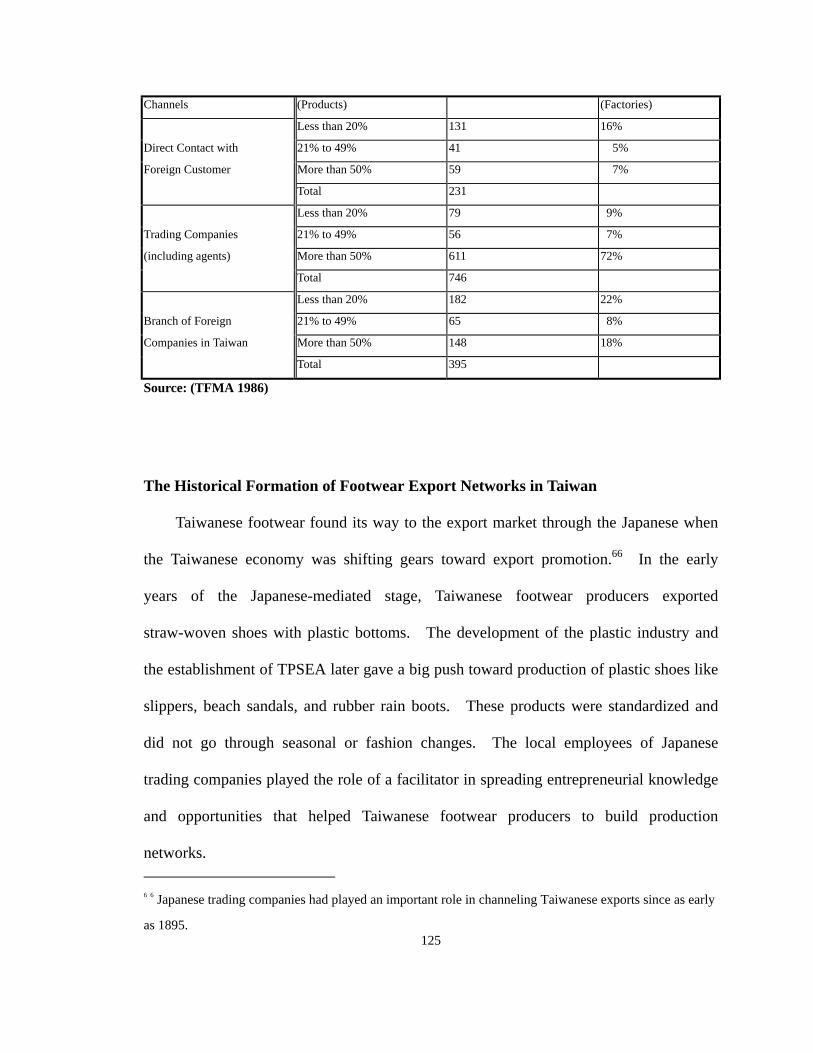
Channels (Products) (Factories)
Less than 20% 131 16%
Direct Contact with 21% to 49% 41 5%
Foreign Customer More than 50% 59 7%
Total 231
Less than 20% 79 9%
Trading Companies 21% to 49% 56 7%
(including agents) More than 50% 611 72%
Total 746
Less than 20% 182 22%
Branch of Foreign 21% to 49% 65 8%
Companies in Taiwan More than 50% 148 18%
Total 395
Source: (TFMA 1986)
The Historical Formation of Footwear Export Networks in Taiwan
Taiwanese footwear found its way to the export market through the Japanese when
the Taiwanese economy was shifting gears toward export promotion.66 In the early
years of the Japanese-mediated stage, Taiwanese footwear producers exported
straw-woven shoes with plastic bottoms. The development of the plastic industry and
the establishment of TPSEA later gave a big push toward production of plastic shoes like
slippers, beach sandals, and rubber rain boots. These products were standardized and
did not go through seasonal or fashion changes. The local employees of Japanese
trading companies played the role of a facilitator in spreading entrepreneurial knowledge
and opportunities that helped Taiwanese footwear producers to build production
networks.
125
66 Japanese trading companies had played an important role in channeling Taiwanese exports since as early
as 1895.
The role of Japanese trading companies in the postwar Taiwanese footwear export
market lasted for less than ten years however, and was quickly replaced by American
importers who placed orders directly in Taiwan beginning in the late 1960s. As
Japanese trading companies were fading out of the picture, many local employees, based
on the middlemen relationships built over early years, either set up footwear factories
with friends in former supplying firms or established their own trading companies
connecting American buyers and local producers. At that time, Taiwanese producers
already had contact with Americans who knew the American footwear retail market and
were either employed by Japanese trading companies or represented buyers. By the end
of the 1960s, Japanese trading companies no longer played a significant role in
Taiwanese footwear exports.
The success story of Sidney Rich, Philip Green, and Harvey Levy, the founders of
Pagoda Trading company, has become a legend in the footwear retail market. Before
setting up their business, they were US representatives of Kowa, a Japanese trading
company selling imported shoes to the US market. In 1972, they recognized the
emerging strength of the mass market while realizing that Taiwan was opening up as a
sourcing country. They decided that “The time is now to start importing for ourselves.”.
The trio stopped at a telephone booth on a Manhattan street corner to call Japan and
informed Kowa of their decision to strike out on their own. At that moment, Pagoda
Trading Co. was born. Since that day, Pagoda has evolved from a small, privately-held
company to a half-billion dollar global sourcing and marketing organization owned by St.
Louis-based Brown Group, Inc.. “They are legends in our industry, but their original
intent was just to build a business to support their families. Their reputation was
126

realized through dedication and hard work,” Gary Rich concludes.
Today the company consists of three divisions: Pagoda USA markets branded and
private label footwear to the mass market and better-graded stores in the US market;
Pagoda International expands the reach of Brown Group worldwide; and Pagoda Trading
is the sourcing arm of the company. Pagoda’s early success was based on strategic
partnerships with Taiwanese factories, which the founders had developed earlier in their
careers at a time when the emerging mass market needed a fresh source of low cost
footwear. At the other end, their relationship with top mass market retailers also helped.
“We received calls from executives at Meldisco and Volume Shoe, offering their support
in our new venture,” Sidney Rich recalled.67 “Our first order was a double-banded
stretch sandal to Meldisco.” (Footwear News, Nov. 13, 1995)
Similar stories can be found in all the major trading companies now playing actively
in the market.68 Those early American buyers who placed footwear orders in Taiwan in
the expanding years of the early 1970s were called “shoe dogs.” Their companies had
successfully increased ties with Taiwanese suppliers as they grew larger and stronger.
Some of the American “shoe dogs” are now important figures in the US footwear market.
Shaol Pozez was the founder of Volume Shoes. The company changed its name in
the late 1980s to Payless ShoeSource and is now the largest footwear retailer chain in the
United States. Harvey Levy was the founder of Pagoda Trading Company, now a
subsidiary of Brown Group, with an annual revenue of US$ 150 million in 1993. Bob 67 I was repeatedly told by interviewees that at the core of the US footwear retail market (especially the
importer/distributor sector) was a closed Jewish network. The issue is sociologically interesting but
requires further empirical verification.
127
68 Data are based on my interviews and Skoggard’s thesis (1993, p.148).
Campbell founded BBC International in New York in 1975. BBC International’s
Taiwan office was established the next year to take care of all of its orders and is still the
company’s sourcing center outside of the US. Campbell had established long-term
friendships with Taiwanese suppliers since the founding years. An interviewee told me
that Campbell’s ties with Taiwanese suppliers were further strengthened after one of his
Taiwanese suppliers saved him from a financial problem several years ago. Ellis
Safdeye, founder of E.S.Originals, placed his first order in Taiwan in 1971. His
encounter with Taiwanese footwear entrepreneurs in rural Taiwan has been described in
the first section of Chapter 3. Those were the entrepreneurs who knew about footwear
manufacturing, had contacts with Taiwanese manufacturers for years, established their
business in the early 1970s, and were building strong relationships with Taiwanese
footwear entrepreneurs at the production end.69 The direct contact between Taiwanese
and American retailers had grown enormously by the early 1970s. For example, in the
year 1971 alone, Melville Shoe Corp., which owned about two thousand retail shops in
the US at the time, placed over US$ 8 million worth of orders in Taiwan.
The importance of interpersonal networks between buyers and suppliers built over
years of repeated transaction is obvious. However, since they are decentralized informal
social organizations, it is difficult to document the increasing trust and tighter networking
between trade partners at the aggregate level. Another source of difficulty is the
ambiguous nature of trust, which encompasses many different dimensions of social
128
69 An American footwear merchant who has been stationed in Taiwan for over a decade attributes the early
success of these firms in Taiwan to their “Midwest mentality,” emphasizing thrift, hard-work, and trust in
business relationships.
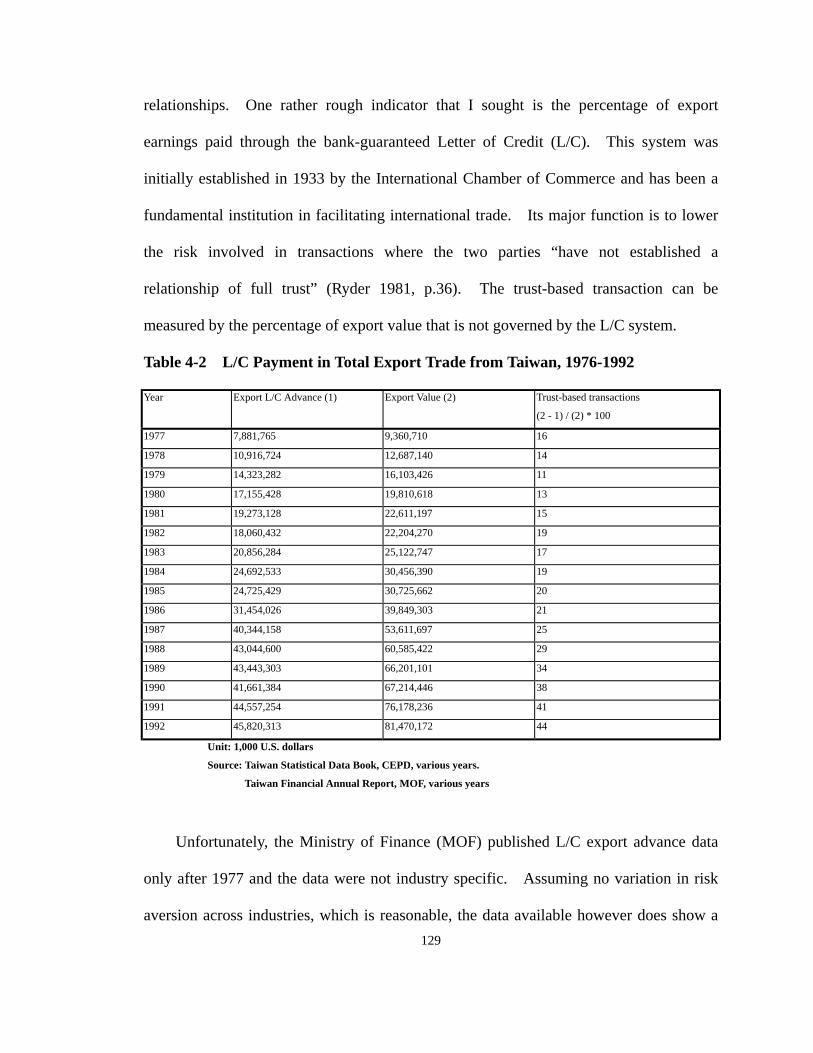
relationships. One rather rough indicator that I sought is the percentage of export
earnings paid through the bank-guaranteed Letter of Credit (L/C). This system was
initially established in 1933 by the International Chamber of Commerce and has been a
fundamental institution in facilitating international trade. Its major function is to lower
the risk involved in transactions where the two parties “have not established a
relationship of full trust” (Ryder 1981, p.36). The trust-based transaction can be
measured by the percentage of export value that is not governed by the L/C system.
Table 4-2 L/C Payment in Total Export Trade from Taiwan, 1976-1992
Year Export L/C Advance (1) Export Value (2) Trust-based transactions
(2 - 1) / (2) * 100
1977 7,881,765 9,360,710 16
1978 10,916,724 12,687,140 14
1979 14,323,282 16,103,426 11
1980 17,155,428 19,810,618 13
1981 19,273,128 22,611,197 15
1982 18,060,432 22,204,270 19
1983 20,856,284 25,122,747 17
1984 24,692,533 30,456,390 19
1985 24,725,429 30,725,662 20
1986 31,454,026 39,849,303 21
1987 40,344,158 53,611,697 25
1988 43,044,600 60,585,422 29
1989 43,443,303 66,201,101 34
1990 41,661,384 67,214,446 38
1991 44,557,254 76,178,236 41
1992 45,820,313 81,470,172 44
Unit: 1,000 U.S. dollars
Source: Taiwan Statistical Data Book, CEPD, various years.
Taiwan Financial Annual Report, MOF, various years
Unfortunately, the Ministry of Finance (MOF) published L/C export advance data
only after 1977 and the data were not industry specific. Assuming no variation in risk
aversion across industries, which is reasonable, the data available however does show a 129
clear trend toward a reduction in L/C payment from 1977 to 1992. Table 4-2 shows that
trust-based transactions have been steadily increasing without relying on institutionalized
third-party guarantee. It is important to note that non-L/C payment as an indicator tends
to underestimate the role of trust because L/C has been a routine practice in international
trade and using L/C does not necessarily indicate no trust between parties.
Following the early footwear importers, brandname athletic shoe marketers came to
Taiwan mostly in the late 1970s and early 1980s. The first brand athletic shoe buyer to
place orders in Taiwan was Adidas, early in 1971. Unlike Nike and Reebok, Adidas had
been maintaining its own manufacturing capacity in Germany. Its production
technology was the most advanced at the time. Before being Adidas’ exclusive sourcing
agent, Sherwood was a trading company that handled merchandise exports to Europe on a
commission basis. The company was founded by the Liou brothers in the mid-1960s.
Sherwood had some stable suppliers in the footwear industry because rubber boots were
the company’s major merchandise item. Through repeated business, the Liou brothers
became friends to a department store owner in Germany who happened to be a close
relative of Adidas’ owner, Adi Dassler. When Adidas was looking for OEM suppliers
in Asia in 1970, its first target was originally India, but the Liou brothers got this
information from their German customer and invited Adidas to look into Taiwan.
Sherwood’s experience in footwear exports and its relationship with Taiwanese
manufacturers convinced Adidas.
Mr. Liou concluded my interview with the comment that: “Personal connection is
always important in business, even for international trade with foreigners. If I did not
happen to know Adi Dassler’s son-in-law, it would be impossible to imagine what I
130
would have achieved today.” Sherwood has grown over the years into a diversified
business group controlling Adidas’ domestic sales in Taiwan and owning several
top-class restaurants in Taipei. The Taiwanese footwear industry would not have
achieved its amazing record today if not for Liou’s German connection. Historical
contingency does play a role in industry development, however it is the structure that
follows that catches most people’s attention.
Retrospectively, Adidas’ visit proved to be a historic moment for the Taiwanese’s
footwear industry. Adidas gave the Taiwanese footwear industry a big lift in its
manufacturing and managerial capability. With Sherwood’s assistance, Adidas brought
technicians to Taiwan and transferred technical packages to its supplying factories. For
example, the cement lasting method and sole injection machinery, which are now
mainstreams of advanced athletic shoe production, were first introduced to Taiwan by
Adidas. A senior government official of MOEA remembered how Taiwanese producers
were “stunned” by the manufacturing method which was described as “making shoes by
pasting parts together with glue.” It was also through continuing transactions with
Adidas that Taiwanese supplying factories gained specific management knowledge
meeting the toughest quality and delivery demands.
When Nike came to Taiwan in 1975 and Reebok in 1981, they had to circumvent
Adidas’ OEM suppliers, but the manufacturing technology and management skill already
spread over the industry allowed them to build their own suppliers. When Philip Knight
was trying to shift away from Japanese suppliers and source directly from Taiwan,70 he
131
70 Strasser (1992) gives detailed descriptions about how Nike’s (then Blue Ribbon Sports) tension with its
found a key person, Jerry Shieh, who was a former manager of Mitsubishi Trading
Company’s footwear department in Taiwan. They founded a small trading company
called Yin-Shin to handle Nike’s footwear procurement and quality inspection. Shieh
searched through Mitsubishi’s supplying factories and persuaded Feng-Tay, Chen-Shin
(later ADI) and Shun-Win (later Chin-Lu) to make shoes for Nike. These footwear
factories proved to be model footwear factories in Taiwan, famous for their relentless
drive to improve manufacturing capability. The relationships that Nike, “the company
based on a handshake,” developed with its suppliers have been more stable and more
consistent than other buyer’s.
The cooperative relationship between Fen-Tay and Nike is illustrative. Feng-Tay is
described by Nike as the world’s best athletic shoe factory. It has been an exclusive
supplier to Nike for the last 25 years. While Nike’s designers in Beaverton, Oregon
developed ideas about what a pair of athletic shoes could possibly be like, Feng-Tay’s
commercialization and mass-production capability helped bring these ideas to life.
Feng-Tay was not that good at the beginning, but it grew through the dedicated
relationship with its only buyer who constantly challenged it to improve and be
innovative. In return Feng-Tay vice versa gave Nike designers freedom to push new
ideas about shoes. “Nike has wings to fly in all directions and we have the feet to help
their dreams step on solid ground. It’s difficult to imagine one without the other,” a
Feng-Tay manager said very aptly. A Nike manager put it this way: “Can Nike live
without Feng-Tay? Sure. Can Feng-Tay live without Nike? Absolutely. But we
132
Japanese supplier Tiger Shoes lead to Nike’s direct sourcing from Taiwan and later developed from an
importer/distributor to a marketer.
have been enjoying our cooperation for many years, so why bother to separate?”
Reebok represents another case where interpersonal networks play a critical role in
building export/sourcing networks. When the British merchandise company Pentland
bought Reebok, it was only a small British footwear factory worth one million U.S.
dollars. The major product of the company was a lightweight athletic shoe with a
textile-leather upper. It looked fragile but felt comfortable, not at all typical for athletic
shoes at the time. In a visit to London, Paul Fireman happened to find the shoes and
placed some trial orders for the American market. The shoes were a business hit
because of the fitness boom and they became the classic aerobic shoe. As market
demand expanded abruptly, Paul Fireman bought 45 percent of stock in Reebok company
and took charge of marketing. To meet the growing market, Reebok searched for a
large-scale footwear supply source from East Asia, specifically Korea and Taiwan. Sam
Lin (a Taiwanese) and Patrick Tang (from Hong Kong) managed to build Pentland’s
Asian sourcing subsidiary, ASCO General Supplies, from scratch since 1971. At the
time ASCO started to place the first Reebok shoe orders in Taiwan, it had already
established relationships with local footwear companies. Sam Lin (now the president of
ASCO Group) recalled that when he first showed producers the aerobic shoe model, most
of them were afraid to accept the order because the shoes looked fragile and therefore
might involve them in claim losses. The unprecedented demand for Reebok aerobic
shoes was “like crazy,” as Sam Lin recalled. “They (footwear factories) were very
reluctant to make the shoes at the beginning and I almost begged them to trust me. It
turned out that the thing should have been the other way around.”
Reebok was valued at US$ 3.6 billion when Pentland split with Paul Fireman and
133

sold out all its holdings in 1991. Patrick Tang stayed with Reebok in charge of its Far
East procurement, but his British Pentland background somehow did not jibe with the
Americanizing Reebok. Tang left the company and moved back to Pentland Far East
two years later. OEM marketing networks with Reebok are not as stable as its contender
Nike because of the company’s shorter history, abrupt success, and ownership transition.
After leaving Reebok, relying on his profound involvement in Reebok’s Korean and
Taiwanese supplying networks, Tang was a key person in organizing new factories (e.g.,
KTP Group) in China and Indonesia supplying for Reebok after production moved out of
Korea and Taiwan. Liou’s involvement with Adidas, Shieh’s with Nike and Tang’s with
Reebok are excellent examples which illustrate the importance of personal networks in
business growth.
Our discussion of Adidas, Nike, and Reebok show different contingent paths of
developing their sourcing networks; we must also look at how Taiwanese footwear
factories established their OEM marketing networks. These OEM marketing networks
were usually initiated by buyers who were looking for footwear supply from Asia, and
local middlemen often played a critical role in making the matches. Ironically, as the
industry changed to making higher value-added products, producers gave up making
standardized footwear (e.g., plastic slippers) with no major brands and hardly any fashion
change, and became closer to the authentic OEM suppliers who by definition produce
according to the designs offered by the buyers. What occurred thereafter was that
Taiwanese producers had more intensive interactions with buyers (or their agents) during
the throughput of making a product. It is primarily this structural change in the nature
of those transactions that allowed Taiwanese footwear producers to learn how to upgrade
134

their operation. The process of learning to be a qualified OEM supplier (or collectively
learning to be a competitive production network) took place through repeated
transactions with a limited number of buyers. The technical transference that the
transaction relationships between Sherwood and Adidas had brought to Taiwan was
exactly the kind of nursery seedbed needed for industrial upgrading, as were the
interactions between Taiwanese suppliers and their buyers (e.g., Feng-Tay and Nike).
Italian researcher Becattini, the first to use Marshall’s notion of “industrial district”
to describe the territorial production system in Italy, concluded in a theoretical article
reflecting upon the weakness of current literature:
The origin and development of an industrial district is therefore not simply the
“local” result of a matching of some socio-cultural traits of a community, of
historical and natural characteristics of a geographical area, and of technical
characteristics of the production process, but also the result of a process of
dynamic interaction (a virtuous circle) between division-integration of labor in
the district, a broadening of the market for its products, and the formation of a
permanent linking network between the districts and the external markets.
(Becattini 1990, p.44)
We have made some initial analyses on the footwear marketing/sourcing networks
and will come back to the issue in the following chapters. With the broader
understanding of the marketing networks, we will now turn to the production networks of
the Taiwanese footwear industry in its booming years, what Becattini called the
“division-integration of labor in the district.”
135
Expansion of the Production Network in Taiwanese Footwear Industry
Representative of Taiwan’s early period of industrialization, the footwear industry in
Taiwan was mainly composed of numerous medium-to-small-sized firms each
specializing in a certain range of tasks and together constituting a highly responsive and
competitive system. As the industry grew over the years, the network nature of the
industry became more salient. Networked production, especially at the labor
subcontracting end, is at the core of the industry’s expansion in Taiwan. Most of the
Taiwanese footwear producers in its booming years did not have the space to lay out their
production in the orderly pattern depicted in Figure 4-1. Even the larger factories,
which had three assembly lines under the same roof, had to juggle limited space spread
across different floors of a factory building. The way Taiwanese producers used space
is an example of their grass-roots innovation. For example, they came up with assembly
conveying lines that make an L turn when they reach a wall, an innovation that amazed
visiting foreign experts (Informant AS1). What most characterized Taiwanese footwear
production in its booming years most however was the wide-spread practice of
subcontracting, which reduced the space needed for footwear export firms. Almost all
the steps in footwear production except final assembly can be subcontracted,71 including
upper stitching, lining cementing, midsole printing, embroidery, eyelet punching, leather
or midsole cutting, and production of other accessories like buttons. The most
significant subcontracted steps are upper stitching and lining cementing. Taiwanese
136
71 Transfer orders among assembly firms was not common when the industry stayed in Taiwan. It can be
conceived as a type of subcontracting where the whole shoes are subcontracted out. Most of the practice
is adopted when the principal firm receives orders larger than its capacity but, in order to keep the
transaction relationship, does not want to give up the order.
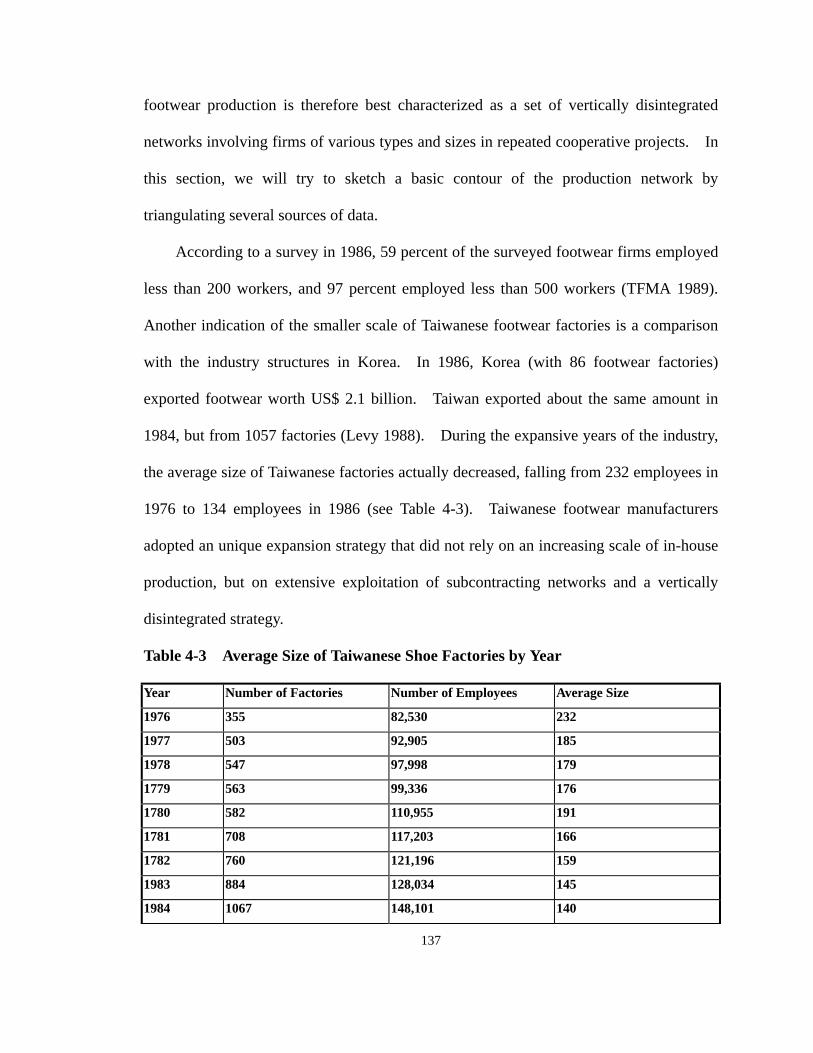
footwear production is therefore best characterized as a set of vertically disintegrated
networks involving firms of various types and sizes in repeated cooperative projects. In
this section, we will try to sketch a basic contour of the production network by
triangulating several sources of data.
According to a survey in 1986, 59 percent of the surveyed footwear firms employed
less than 200 workers, and 97 percent employed less than 500 workers (TFMA 1989).
Another indication of the smaller scale of Taiwanese footwear factories is a comparison
with the industry structures in Korea. In 1986, Korea (with 86 footwear factories)
exported footwear worth US$ 2.1 billion. Taiwan exported about the same amount in
1984, but from 1057 factories (Levy 1988). During the expansive years of the industry,
the average size of Taiwanese factories actually decreased, falling from 232 employees in
1976 to 134 employees in 1986 (see Table 4-3). Taiwanese footwear manufacturers
adopted an unique expansion strategy that did not rely on an increasing scale of in-house
production, but on extensive exploitation of subcontracting networks and a vertically
disintegrated strategy.
Table 4-3 Average Size of Taiwanese Shoe Factories by Year
Year Number of Factories Number of Employees Average Size
1976 355 82,530 232
1977 503 92,905 185
1978 547 97,998 179
1779 563 99,336 176
1780 582 110,955 191
1781 708 117,203 166
1782 760 121,196 159
1983 884 128,034 145
1984 1067 148,101 140
137
1985 1,140 157,610 138
1986 1,190 159,617 134
Source: (Skoggard 1993, p. 251)
The actual differentiation of the footwear production networks in Taiwan went much
deeper than it appears because the firms from which we draw data are registered firms of
the TFMA only. The difficulty of getting an aggregate description of the Taiwanese
footwear production network lies in the fact that a large part of the network stretches into
the so-called “informal economy.” To overcome this problem and obtain a more
accurate picture of the production network, I used the 1986 factory directory of industry
census survey to at least get some approximate features of the actual production networks
in Taiwan. I analyzed only the Taichung County data, but since it is the shoe nest of
Taiwan, the results should be representative.
The first impression I got is that four towns around Taichung City, Feng-Yuan,
Hou-Li, Ching-Shui, and Sha-Lu, stand out as centers of footwear production (see Map
1-2). The north-south railway passing through the western side of Taiwan island is split
into two lines between Chu-Nan Township (of Hsin-Chu County) and Chang-Hua City
(of Chang-Hua County). Taichung County is therefore traversed by two railroad lines.
Ching-Shui and Sha-Lu, which specialize mainly in women’s shoes, are located on the
“Coast Line,” while Feng-Yuan and Hou-Li, on the “Mountain Line”, specialize in
athletic shoes. The geographical concentration and specialization of footwear categories
is an indirect proof of network clusters. They also reflect the historical fact that the
industry originated in coastal townships and then moved eastward to the hinterland of the
Chang-Hua plain. Athletic shoe production grew until later in the mid-70s, which 138
corresponds to the location of its geographical concentration. Even the OEM
marketing networks are “localized” in Taichung City, the marketing center of the “Shoe
Nest.” Between 1971 and 1981, Taichung became the consumption and manufacturing
headquarters of central Taiwan with an average population growth of 42 percent annually.
As the commerce and service center of the industrial complexes surrounding the city,
Taichung City is home to almost all the major buyers and trading companies established
there, except some general merchandisers who are stationed in Taipei City because of its
wider product lines. Most of the companies are concentrated in two cross-cutting roads
of Taichung City: Jon-Gun Road which connects downtown with the seaport, and
Wen-Shin Road which is close to the highway exit. The spatial convergence of
production networks and marketing networks should not be surprising. They are after
all two parts of the same commodity chain that need to engage in close cooperation.
Another study of the economic development of central Taiwan shows a similar
pattern of eastward development of industrialization. The research finds that, after the
economic crisis of 1974, the putting-out and subcontracting system that had developed
earlier was further employed to mobilize labor in the peripheral hinterlands of central
Taiwan. Numerous firms are located along the main roads of the Chang-Hua plain, with
one-third of them employing less than five workers, one-quarter of them containing five
to nine workers, and only 1 percent having 300 or more workers (Hsia 1988, p.291).
This study links the eastward expansion of the industry with the problem of labor
shortage and market fluctuation. Overall, the sources of data indicate the various
geographical marks in central Taiwan that support the network strategy of industry
expansion in the 1970s and 80s.
139
To get a close look at the local level, I visited a town that lies at the hinterland of
Taichung County. Tsau-Tun is a small town located at the edge of the Chang-Hua plain
and close to the entrance to the mountains, the farthest hinterland of footwear networks
(see Map 1-2). Footwear production was the major industry of the town, employing half
of its manufacturing population in 1988. I visited the town several times in 1995 and
conducted interviews in footwear factories, subcontracting workshops, and with township
officials, trying to piece together a picture of how the industry operated at the local level.
Among the thirteen registered footwear factories in 1983, two were established
before 1970 making women’s shoes and five after 1975 making athletic shoes. This
supports the picture of the evolution of the industry we just presented. However,
Well-Lead, the first footwear factory in Tsau-Tun township, was established as early as
1968, which shows a jumping pattern of geographical expansion. The middle character
of the town’s original name, Shie, which means “shoe,” was lifted after the national
government took over the island. The full name of the township was therefore “Straw
Shoe Hill,”72 indicating a local economic history of shoe production dating back to the
Ching-Dynasty. That provides a clue to the locally-embedded origin of the shoe town.
A senior producer I interviewed in the township described to me what he called
“systems” among the footwear factories in Tsau-Tun township (Informant MQ1). From
what he described, they are actually informally bounded clusters of firms based on
interpersonal relationships and transaction cooperation (see Figure 4-6). For example,
140
72 Because of its location at the entrance to the mountain area, travelers stayed over night, traded goods,
and changed new shoes at the post. The used shoes were described as piled up like hills and became a
symbol of the small township. Supplying straw shoes became a local economy. Today, the logo of the
township is still a pair of straw-woven shoes.
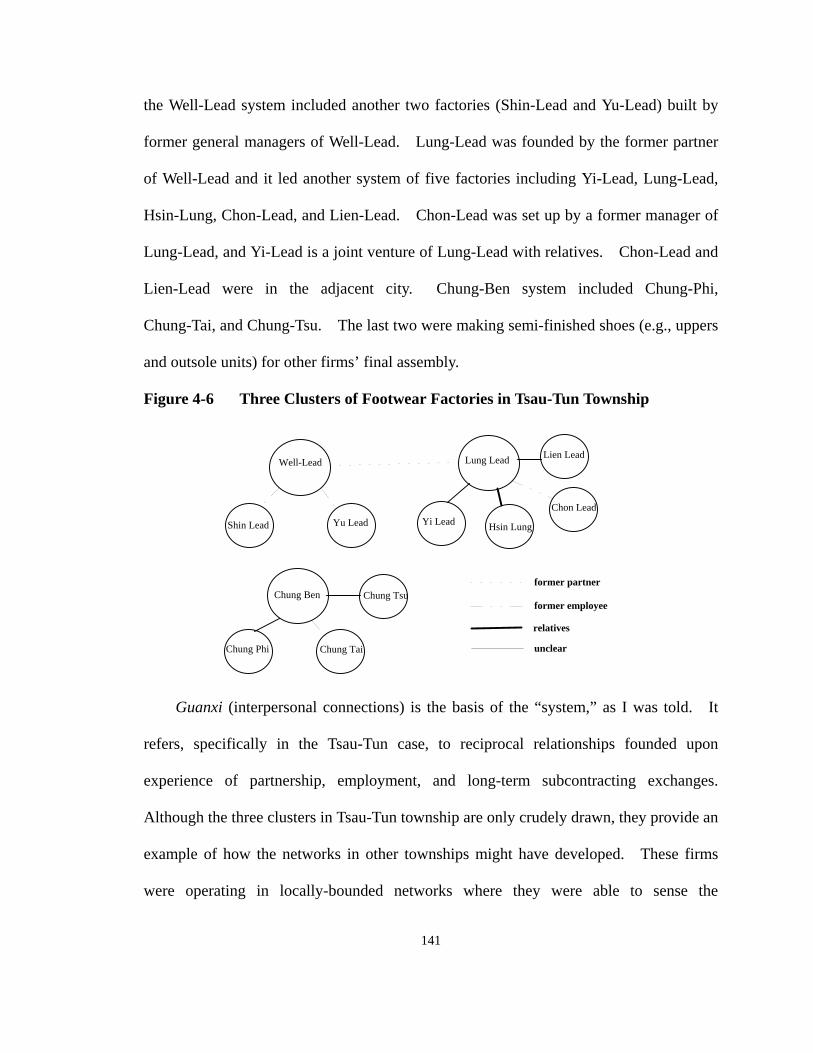
the Well-Lead system included another two factories (Shin-Lead and Yu-Lead) built by
former general managers of Well-Lead. Lung-Lead was founded by the former partner
of Well-Lead and it led another system of five factories including Yi-Lead, Lung-Lead,
Hsin-Lung, Chon-Lead, and Lien-Lead. Chon-Lead was set up by a former manager of
Lung-Lead, and Yi-Lead is a joint venture of Lung-Lead with relatives. Chon-Lead and
Lien-Lead were in the adjacent city. Chung-Ben system included Chung-Phi,
Chung-Tai, and Chung-Tsu. The last two were making semi-finished shoes (e.g., uppers
and outsole units) for other firms’ final assembly.
Figure 4-6 Three Clusters of Footwear Factories in Tsau-Tun Township
Shin Lead Hsin Lung
Lung Lead Lien Lead
Yi LeadChon Lead
Yu Lead
Chung Ben Chung Tsu
Chung TaiChung Phi
former partner
relatives
former employee
unclear
Well-Lead
Guanxi (interpersonal connections) is the basis of the “system,” as I was told. It
refers, specifically in the Tsau-Tun case, to reciprocal relationships founded upon
experience of partnership, employment, and long-term subcontracting exchanges.
Although the three clusters in Tsau-Tun township are only crudely drawn, they provide an
example of how the networks in other townships might have developed. These firms
were operating in locally-bounded networks where they were able to sense the
141
differential “distances” among each of them and benefitted from the ties they maintained
over time.
It should be clear by now that even regarding the production process alone, without
referring to the marketing networks, Taiwanese footwear assembly firms can not be
analyzed as self-sufficient units. They are parts of a networked production process
(Shieh 1992; Skoggard 1993). Firms working as subcontractors for the principal
factories can be roughly classified into two broad categories: part and processing firms
(see Figure 4-7). The former provides components or tools for footwear assembly, like
outsoles, molds, embroidery, pattern making, and cutting dies. The reason they are
regarded as working on the basis of subcontracting, instead of off-the-shelf procurement,
is because of their positioning in OEM networks. Specifically, they work according to
the specification and design provided by the principal firms, which ultimately came from
the buyers. The production of those components frequently requires investment in
sophisticated machine or higher technical expertise, what Holmes called “specialization
subcontracting” (Holmes 1986). They therefore are more independent and equal to
assembly factories.
The other group are processing firms that mainly earn money by simple labor
processing with less skill and machinery involved. Two of the major contracted steps in
this group are upper stitching and lining cementing. They are almost always based on a
putting-out system in which the materials are provided by the contracting factories. The
system goes deeper because in Taiwan the contractors often pass additional work down to
smaller workshops or residential households in the next tier to take advantages the labor
of housewives (see Figure 4-7). It is close to what Holmes called “capacity
142
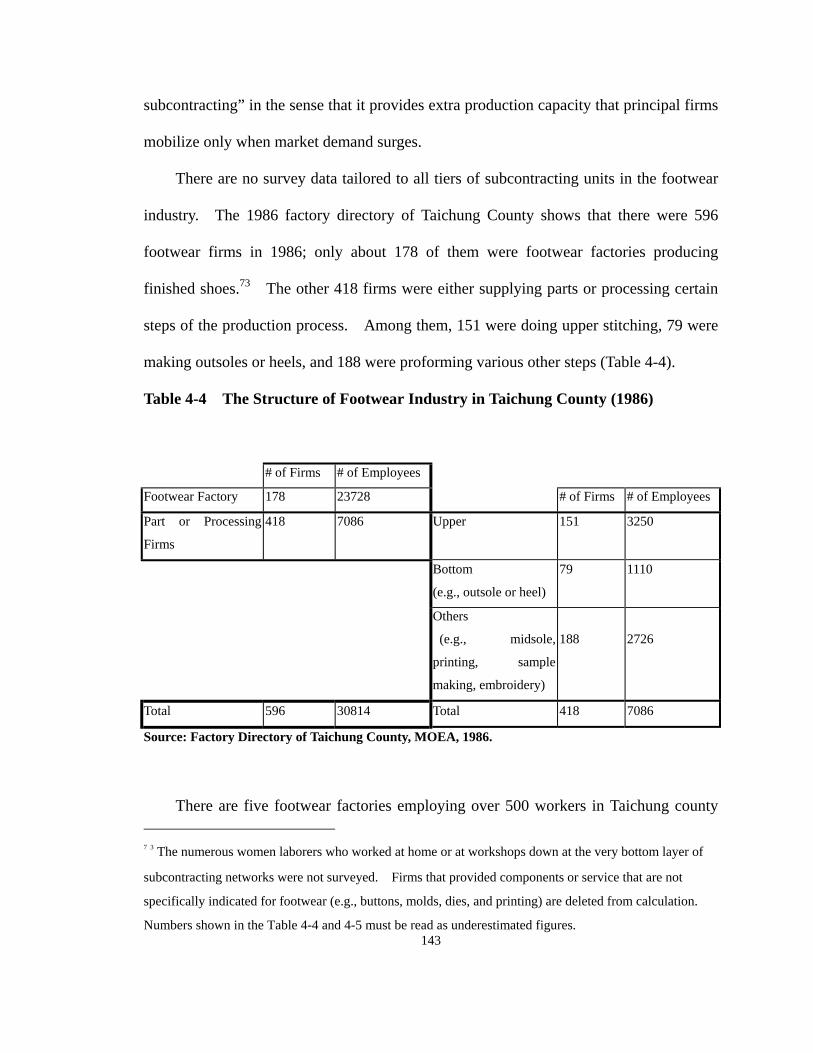
subcontracting” in the sense that it provides extra production capacity that principal firms
mobilize only when market demand surges.
There are no survey data tailored to all tiers of subcontracting units in the footwear
industry. The 1986 factory directory of Taichung County shows that there were 596
footwear firms in 1986; only about 178 of them were footwear factories producing
finished shoes.73 The other 418 firms were either supplying parts or processing certain
steps of the production process. Among them, 151 were doing upper stitching, 79 were
making outsoles or heels, and 188 were proforming various other steps (Table 4-4).
Table 4-4 The Structure of Footwear Industry in Taichung County (1986)
# of Firms # of Employees
Footwear Factory 178 23728 # of Firms # of Employees
Part or Processing
Firms
418 7086 Upper 151 3250
Bottom
(e.g., outsole or heel)
79 1110
Others
(e.g., midsole,
printing, sample
making, embroidery)
188
2726
Total 596 30814 Total 418 7086
Source: Factory Directory of Taichung County, MOEA, 1986.
There are five footwear factories employing over 500 workers in Taichung county
143
73 The numerous women laborers who worked at home or at workshops down at the very bottom layer of
subcontracting networks were not surveyed. Firms that provided components or service that are not
specifically indicated for footwear (e.g., buttons, molds, dies, and printing) are deleted from calculation.
Numbers shown in the Table 4-4 and 4-5 must be read as underestimated figures.

(see Table 4-5). They are big in relation to the average firm size in Taiwan, but still
very small compared with their Korean counterparts. Most of the assembly firms
employing less than 50 people were making plastic slippers, which involves few steps.
Several other export factories indicate that their material is “stitched uppers;” in other
words, they specialize in final assembly. There is one interesting case of a specialized
upper supplier employing as many as 279 workers. The overall size difference between
assembly factories and their supporting factories (either part or processing firms) is
significant however. About 73 percent of the part-processing firms employed less than
20 workers, and 94 percent employed less than 50. In contrast, 46 percent of assembly
firms hired between 51 to 200 workers, and five firms employed over 500 workers.
Table 4-5 Size Distribution of Footwear Firms in Taichung County
Footwear Factory Part or Processing Firm
Size Firm # Employee # Firm % Firm # Employee # Firm %
1-20 56 1522 31.5 306 2405 73.2
21-50 88 2632 21.0
51-200 83 9603 46.6 23 1770 5.5
201-500 34 9595 19.1 1 279 0.2
501- 5 3008 2.8 0 0 0.0
Total 178 23728 100 418 7086 99.9
Source: Factory Directory of Taichung County, MOEA, 1986.
144
There have been several efforts to give a picture of the size of subcontracted work in
Taiwan. A footwear industry survey in 1989 shows that about 86 percent of firms have
different degrees of subcontracting arrangements (TFMA 1990). Skoggard estimates
that outside workers comprise 31 percent of the shoe industry’s labor force while
one-third of outside workers (or 10.5 percent of the total work force) are home workers
(Skoggard 1993, p.192). Based on his field interviews, Shieh estimates that in the
footwear industry about 40 to 50 percent of labor costs are paid to the subcontracted
firms (Shieh 1991). The 1986 Industrial and Commercial Census data show that,
nationwide, plastic shoe factories spent a total of NT$ 11.6 billion for employee wages,
occupying about 21 percent of total operation costs. The expenditure for outside
subcontracted labor was NT$ 9.9 billion, about 12 percent of total operation costs or 46
percent of total labor expenses. The number supports Shieh’s fieldwork observation.
In other words, what we see in a Taiwanese assembly factory is only about half of the
whole production process.
Dynamism of the Taiwanese Footwear Subcontracting Networks
Transactions inside the subcontracting networks are highly complex and dynamic.
Not only are certain steps of production farmed out to subcontracting workshops; the
final assembly or the whole shoes may also be subcontracted to another assembly factory
when the production schedule is full. This kind of horizontal subcontracting (or order
transfer) is driven by the principal firm’s desire to maintain its reputation of punctual
delivery and also maintain the business relationship with its customers. It is however
also based on expectation of reciprocal exchange in the future. The most popular slogan
I heard in describing the cooperation is: “Share the chance of making money, when it
comes” (Iou-Chian-Da-Jia-Juan)! The same slogan is used by an assembly factory to
explain why the most profitable footwear factories are those able to garner a “basic team”
(Ban-Di) involving some committed part suppliers. A committed part supplier gives the
export footwear factory its priority in production, special attention to its orders, and
145
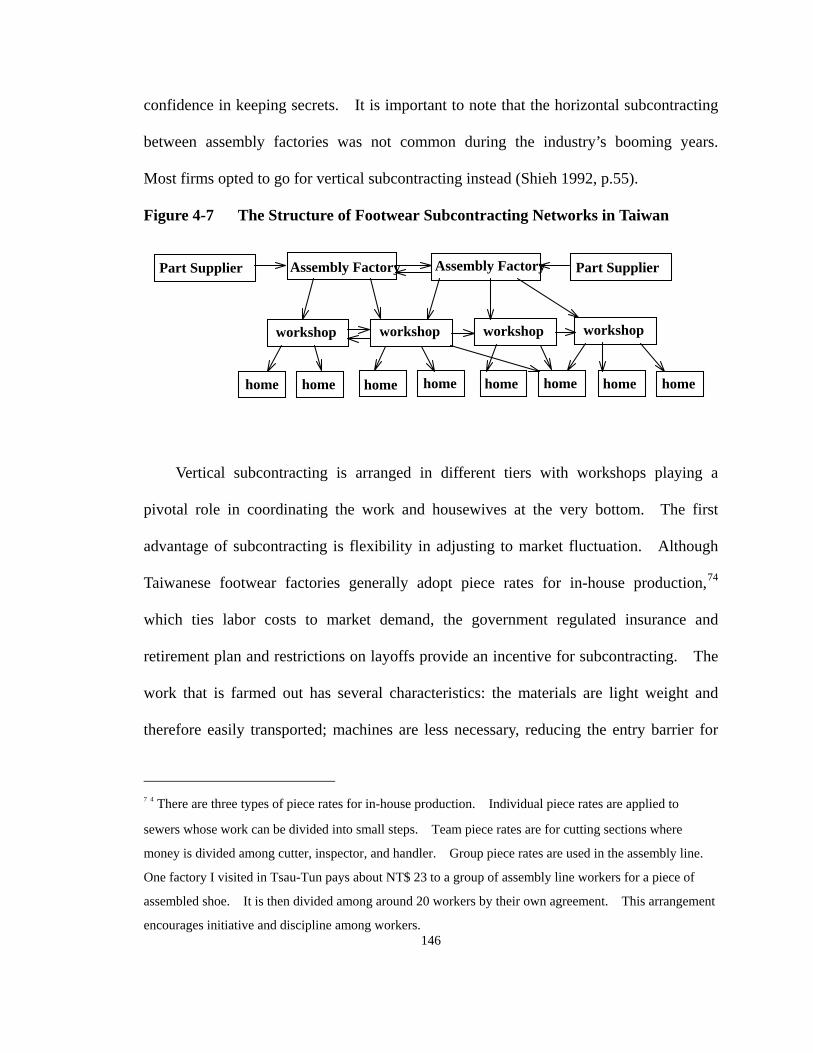
confidence in keeping secrets. It is important to note that the horizontal subcontracting
between assembly factories was not common during the industry’s booming years.
Most firms opted to go for vertical subcontracting instead (Shieh 1992, p.55).
Figure 4-7 The Structure of Footwear Subcontracting Networks in Taiwan
Assembly Factory Part SupplierPart Supplier
workshopworkshop workshop workshop
home homehome home homehome home home
Assembly Factory
Vertical subcontracting is arranged in different tiers with workshops playing a
pivotal role in coordinating the work and housewives at the very bottom. The first
advantage of subcontracting is flexibility in adjusting to market fluctuation. Although
Taiwanese footwear factories generally adopt piece rates for in-house production,74
which ties labor costs to market demand, the government regulated insurance and
retirement plan and restrictions on layoffs provide an incentive for subcontracting. The
work that is farmed out has several characteristics: the materials are light weight and
therefore easily transported; machines are less necessary, reducing the entry barrier for
146
74 There are three types of piece rates for in-house production. Individual piece rates are applied to
sewers whose work can be divided into small steps. Team piece rates are for cutting sections where
money is divided among cutter, inspector, and handler. Group piece rates are used in the assembly line.
One factory I visited in Tsau-Tun pays about NT$ 23 to a group of assembly line workers for a piece of
assembled shoe. It is then divided among around 20 workers by their own agreement. This arrangement
encourages initiative and discipline among workers.
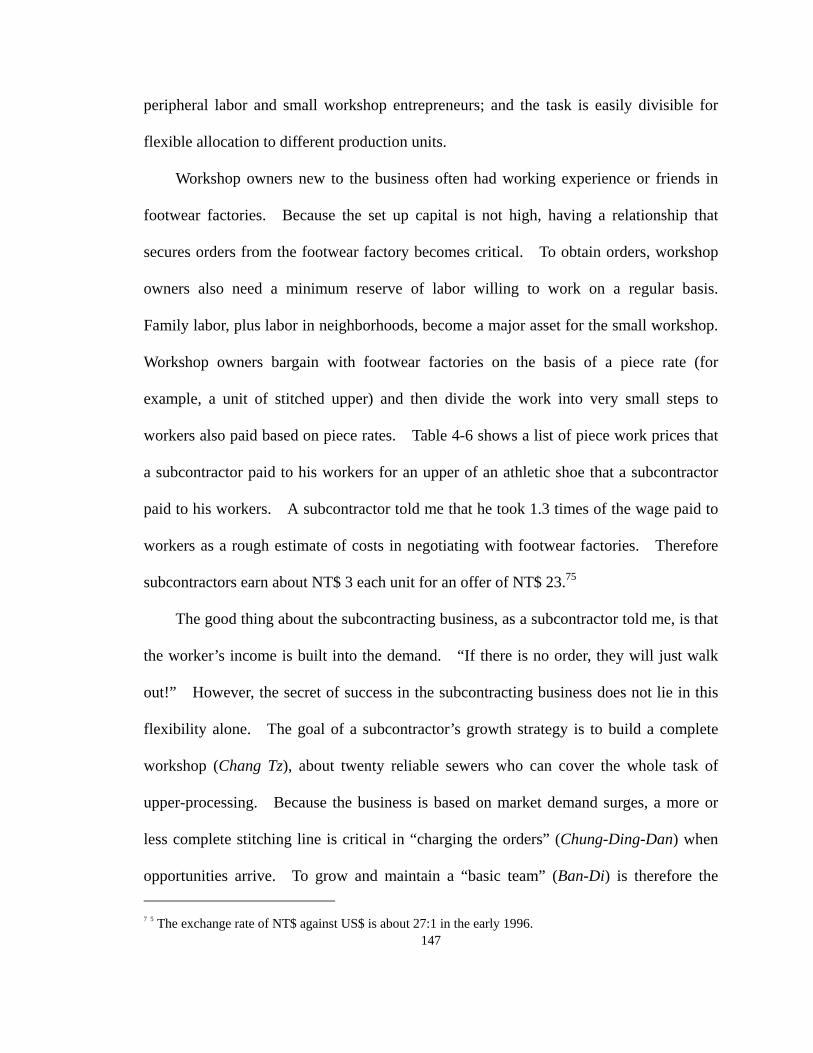
peripheral labor and small workshop entrepreneurs; and the task is easily divisible for
flexible allocation to different production units.
Workshop owners new to the business often had working experience or friends in
footwear factories. Because the set up capital is not high, having a relationship that
secures orders from the footwear factory becomes critical. To obtain orders, workshop
owners also need a minimum reserve of labor willing to work on a regular basis.
Family labor, plus labor in neighborhoods, become a major asset for the small workshop.
Workshop owners bargain with footwear factories on the basis of a piece rate (for
example, a unit of stitched upper) and then divide the work into very small steps to
workers also paid based on piece rates. Table 4-6 shows a list of piece work prices that
a subcontractor paid to his workers for an upper of an athletic shoe that a subcontractor
paid to his workers. A subcontractor told me that he took 1.3 times of the wage paid to
workers as a rough estimate of costs in negotiating with footwear factories. Therefore
subcontractors earn about NT$ 3 each unit for an offer of NT$ 23.75
The good thing about the subcontracting business, as a subcontractor told me, is that
the worker’s income is built into the demand. “If there is no order, they will just walk
out!” However, the secret of success in the subcontracting business does not lie in this
flexibility alone. The goal of a subcontractor’s growth strategy is to build a complete
workshop (Chang Tz), about twenty reliable sewers who can cover the whole task of
upper-processing. Because the business is based on market demand surges, a more or
less complete stitching line is critical in “charging the orders” (Chung-Ding-Dan) when
opportunities arrive. To grow and maintain a “basic team” (Ban-Di) is therefore the
147
75 The exchange rate of NT$ against US$ is about 27:1 in the early 1996.
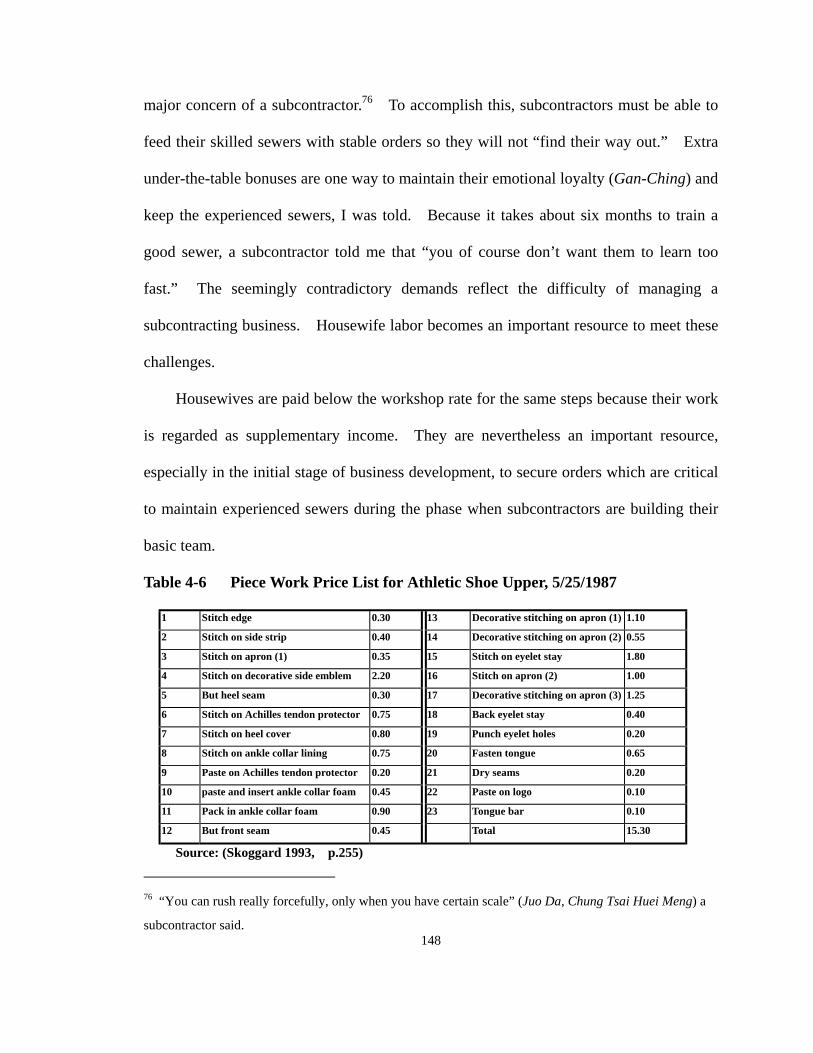
major concern of a subcontractor.76 To accomplish this, subcontractors must be able to
feed their skilled sewers with stable orders so they will not “find their way out.” Extra
under-the-table bonuses are one way to maintain their emotional loyalty (Gan-Ching) and
keep the experienced sewers, I was told. Because it takes about six months to train a
good sewer, a subcontractor told me that “you of course don’t want them to learn too
fast.” The seemingly contradictory demands reflect the difficulty of managing a
subcontracting business. Housewife labor becomes an important resource to meet these
challenges.
Housewives are paid below the workshop rate for the same steps because their work
is regarded as supplementary income. They are nevertheless an important resource,
especially in the initial stage of business development, to secure orders which are critical
to maintain experienced sewers during the phase when subcontractors are building their
basic team.
Table 4-6 Piece Work Price List for Athletic Shoe Upper, 5/25/1987
1 Stitch edge 0.30 13 Decorative stitching on apron (1) 1.10
2 Stitch on side strip 0.40 14 Decorative stitching on apron (2) 0.55
3 Stitch on apron (1) 0.35 15 Stitch on eyelet stay 1.80
4 Stitch on decorative side emblem 2.20 16 Stitch on apron (2) 1.00
5 But heel seam 0.30 17 Decorative stitching on apron (3) 1.25
6 Stitch on Achilles tendon protector 0.75 18 Back eyelet stay 0.40
7 Stitch on heel cover 0.80 19 Punch eyelet holes 0.20
8 Stitch on ankle collar lining 0.75 20 Fasten tongue 0.65
9 Paste on Achilles tendon protector 0.20 21 Dry seams 0.20
10 paste and insert ankle collar foam 0.45 22 Paste on logo 0.10
11 Pack in ankle collar foam 0.90 23 Tongue bar 0.10
12 But front seam 0.45 Total 15.30
Source: (Skoggard 1993, p.255)
148
76 “You can rush really forcefully, only when you have certain scale” (Juo Da, Chung Tsai Huei Meng) a
subcontractor said.
However, the mobilization of household labor is not without limits due to its social
characteristics. First, the skills of household laborers are generally lower than those of
the in-workshop workers, who have more experience. Secondly, their work is mostly
limited to handwork that requires few tools, for example, inserting foam. Thirdly, the
materials must be small in size and light weight to accommodate house space. Finally,
housewives have the liberty not to work on schedule. Their work is performed in their
spare time so that any family matters (for example, husband coming home early) can be a
valid excuse. “You must be ready to take the materials back,” a subcontractor described,
“they might guiltily give you a discount but the schedule is already delayed.” A
subcontractor therefore spends much time on the road checking and moving materials and
finished products around the community. The neighborhood is naturally the unit that the
subcontractor reaches out to.77
Table 4-7 Gender Structure of Taiwanese Shoe Industry
Production Site Men Women
Factory management 50% 50%
Workers 30% 70%
Workshop 14% 86%
Household 0% 100%
Source: (Skoggard 1993, p.154) Data based on TFMA 1983 survey.
Tasks that were put out to households (Ren Jia) are gradually drawn back inside the
149
77 As we walked around his neighborhood, a former workshop owner pointed out to me about 15
households (some in upper floors) along a small lane about 80 meters long where he put out jobs in the
industry’s booming years.

workshop as subcontractors stabilize their basic teams of in-workshop workers. A
certain amount of household labor is still important in this stage, however the strategic
importance of household labor is confined mainly to buffering the firm against order
variation. The expansion strategy of subcontractors is clearly based on patriarchy,
where the gender division of labor is maintained to keep labor costs low. The
overwhelming majority of workers in the subcontracting networks (and a smaller
majority in footwear factories) are females (see Table 4-7). Although women still
occupied about 50% of management jobs in the 1983 TFMA survey, these were
predominantly lower management positions such as cashiers and assistants. Skoggard’s
field observation reveals that the average monthly income for women office workers is
actually less than that of women production workers. Difference in salaries based on
sex vary from 18 to 31 percent when job level and seniority are held constant (Skoggard
1993, p.160).
The workshop owners also rely on family labor to take the first step in the
establishment of their business. There is also a gender division of labor in managing a
workshop. The male owners’ work tends to be more “public” - negotiating orders with
footwear factories and delivering materials and finished products to households, factories,
and other workshops. Their wives take care of the in-house production, managing other
women workers and housewives in their neighborhood. The family strategy can also be
extended to relatives. When a subcontractor had managed to establish capacity for more
lines, he might decide to give one line to his relatives and supply them with orders
received from the principal firms. A subcontractor who gave one line to his brother
pointed out that this move actually benefited himself because now he can withhold better
150
orders while having another stable subcontractor for flexible adjustment. This example
also shows that the subcontractors seem unable to manage large scale businesses.
To summarize, by developing extensive subcontracting networks, the Taiwanese
footwear industry has achieved flexibility in meeting orders of different sizes, reducing
both overhead costs and risk, and adjusting to the fluctuations of market demand. At the
different tiers of subcontracting networks, Taiwanese firms share a common strategy of
maintaining an inner circle of stable production capacity and also an external pool of
flexibly available labor. What to one firm is a “basic team” can be an external reserve to
a firm on the level above. At the end of the chain lies the household women’s labor
which can retreat inside families when demand dries up.
The role of the subcontracting network as a mechanism of informalization is well
documented (see Cheng 1994). The flexibility associated with this production
arrangement is often described merely as labor commodification (or historically speaking,
re-commodification) with workers’ wages tied to market demand. This is, however, a
superficial description, if not a distortion. The point is to maintain labor flexibly so that
firms can draw on a pool of workers when they are needed. This pool is embedded in
familism, patriarchy, neighborhood, relatives, and interpersonal networks. It is therefore
the socially-embedded “informality” that underpins the flexibility of the Taiwanese
footwear subcontracting networks.
151
Chapter 5 The Design-Sensitive Market, New Competition, and Network Closure
A complete unit of OEM transaction begins with a buyer’s design, passes through
model development, mass manufacturing, and ends with the final delivery of shoes from
factories. OEM transactions go in cycles as shoes of different models are introduced
into the consumer market. The process involves the joint effort of firms in production
and marketing networks which together constitute a footwear export commodity chain.
Although we have discussed the institutional environment and the network formation that
supports the Taiwanese footwear industry, we have not studied how transactions
themselves are organized in the OEM networks.
In sourcing footwear, buyers are primarily looking for the OEM transactions that are
able to deliver advantages in price, quality, and delivery (Egan 1992). They are also the
basis of competition in the footwear retail market. Buyers who are able to offer the
exact amount of quality shoes at the right time with reasonable price drive other
companies out of the market. These three major objectives of footwear sourcing (i.e.,
price, quality, and delivery) are indeed functions of how design, development, and
manufacturing are organized in OEM transactions that lie behind every buyer. Since the
nature of competition varies with market segment, OEM footwear transactions which
supply products for buyers are organized in different fashions according to the mixture of
objectives held by buyers who compete in the retail markets.
The analyses in the following two chapters are based on data about the athletic shoe
OEM market and the Taiwanese-centered footwear industry on which my fieldwork
focused. The athletic shoe industry has been reshaped by a dramatic change of
competition in the final product market toward design- and marketing-intensiveness.
152
This new competition primarily affects the core segment of what I call the
“design-sensitive” (DS) market, which is composed of a handful of brand-name buyers
and their suppliers.78 Struggling to either benefit from or avoid the impacts, firms in the
secondary “cost-sensitive” (CS) market are also involved in their own distinct
coordination-based competition.
The two chapters complement each other and should be read as a unit. The
findings presented in the two chapters are based on constant checking among interviews
and also are checked with secondary data when available. They were also subject to
discussion with industry insiders who helped me elaborate them. Examples of specific
transactions are used in the chapters to provide illustration. They are not intended to be
the sole evidence for my arguments.
There are two major purposes of the two chapters. The first one is more general.
By illustrating not just the transference of physical goods, but also the extensive and
intensive coordination between buyers and suppliers in OEM markets, I want to show
that competition is not only about firms competing to offer more for less to the consumers,
as it is often modeled in economics. It can also be understood as a matter of excelling in
behavioral coordination, planning, and execution, as much as of business literature claims.
Analysis of the two representative markets, design-sensitive market (DSM) and
cost-sensitive market (CSM), allows me to illuminate the features of transaction
coordination in OEM footwear markets while preserving detailed description of the
complexity. The organizational analysis is not only structural but also historical because
78 DSM refers to “design-sensitive market.” The same applies to CSM as it refers to “cost-sensitive
market.” Other similar terms like “DS buyers” and “DS supplier” are used in the same fashion.
153

both DSM and CSM are situated in the new forms of competition in footwear industry
that only emerged in the 1980s. The final purpose is secondary but more specific in that
I intend to show how Taiwanese footwear producers and their buyers conducted OEM
business in the industry’s peak years.
The Emergence of New Competition in the 1980s
Athletic shoes were never a significant segment in the footwear industry before the
convergent waves of technological and marketing innovations in the late 1970s. The
market expanded rapidly in the 1980s and now enjoys about 40% of the total U.S.
footwear market. There were only US$ 3.8 billions sales in 1982 but after that the
figure rose sharply to US$ 11.8 billions in 1990. The sales figures in the 1990s seem to
be staying flat at around US$ 11.5 billions indicating a matured stage for the new
competition; however, new products that are not counted as athletic shoes (e.g., hiking
shoes and sports sandals) are booming as athletic shoe companies are pushing into these
categories. Retrospectively, the 1980s was an era when the athletic shoe market
experienced a dramatic change on many business fronts. It is no longer business as
usual.
In the late 1970s, we witnessed the beginning of health consciousness, along with
the jogging and fitness mania in the United States. The fashion spread worldwide soon
after. At about the same time, Adidas invented a new way of making athletic shoes by
cementing nylon textile, EVA, and the plastic outsole, which pushed the athletic shoe
industry away from traditional vulcanized production. Riding on top of the fitness
154

fashion, Reebok created aerobic shoes using “textile leather”79 which quickly became a
sweeping success. In 1985 Nike struck back with its Air Force series, firmly
establishing athletic shoes as a fashionable product. On the supply side of the OEM
market, the survival of a footwear factory relies increasingly on the speedy and perfect
execution of commercialization, not simply on how cheaply labor could be bought.
When asked “how has the industry changed over the last two decades,” the response
of ASCO’s president represents a common view of those interviewees who have worked
in the athletic shoe industry for a long time:
The athletic shoe industry has experienced dramatic change over the years.
Incredible! When I sourced the classic aerobic model for Reebok about 15
years ago, I did not realize that we were creating a trend for many years to come.
Taiwan was already a solid footwear supplier at the time. When I was trying to
find factories to produce the shoes, nobody knew about Reebok. We were
only a three-person trading company then. It was like a miracle. When I
showed the model to local factories, no one even dared to make it because it was
very light and looked fragile. They were afraid of business claims. “It is like
committing suicide,” they told me [smiled Mr. Lin]. However the aerobic
shoes turned out to be a big gold mine. Consumers were just crazy about the
shoes, they grabbed what were available. We were stunned by the sales record.
79 PU textile leather is a synthetic leather designed to imitate NAPA leather (genuine leather). Its
characteristics are extra soft hand feeling and better physical property (burst strength, tear strength, and
tensile strength). The manufacturing process is basically categorized as wet PU when non-woven textile
is used as backing to enhance its strength and to make it even in all directions.
155
The country manager of Adidas reflects upon the past decade’s severe competition and
the company’s setback:
The industry is no longer what it was, you must keep alert all the time. New
technology, new material, new designs, and new categories kept popping up in
the volatile market. Adidas was once the only dominant player and still is
among the leading companies in the fast-paced market. We have to admit,
when Nike and Reebok were steering the industry into a new direction, we did
not fully notice its impact. Now we are coming back and we will take our
shares back. [I show him Adidas’ small market share in the U.S. market.]
Ugh, yes, but we are pretty good in Europe and, as far as the U.S. market is
concerned, I believe it is our growth rate that counts in the long run.
The most dramatic changes in the athletic shoe industry occurred in the core market
of the highest value-added shoes, where development sets the trend that other companies
scramble to follow. This core market consists of only a handful of national-brand
companies that anchor their competitive edge primarily in design and marketing. Nike
and Reebok are the top two. According to the Sporting Goods Intelligence, they had
respectively 29.7 percent and 21.3 percent of the U.S. branded athletic footwear market
in 1994.80 Adidas, in third place, has only 5.1 percent of the U.S. market, followed by
LA Gear with 4.8 percent. Since Adidas is the leading brand in Europe, the big three
80 In a speech presented at the CETRA Sporting Goods Show in Taipei (4/19/94), the Secretary General of
World Federation of the Sporting Goods Industry, Andre Gorgemans, said that brands are especially
appealing in the footwear category of sporting goods occupying 86% of the total market; in the other
categories, 66% of the merchandise is sold with name labels.
156
are actually Nike, Reebok, and Adidas. The athletic shoe industry is very concentrated
at the finished product level.
The footwear retail market in general reflects the same structure. According to a
1991 survey, six companies accounted for 60 percent of annual sales and 80 percent of
total industry profit.81 In the survey, the “manufacturer/sourcers,” who import footwear
from foreign manufacturing bases, are the most profitable (Inside Fashion 1993, p.13).
The proportion of athletic shoes in the total shoe industry has also been expanding. One
reason is that sports shoes have become casual. People wear sports shoes in
circumstances that were hard to imagine before, such as the work place. Although
athletic shoes with superior function performance, associated with technological
innovation, are the flagships central to DSM, it is estimated that performance wear (for
athletic usage) is currently less than 20 percent.82 The actual connotation of “sports
shoes” has now become “fashion-sports shoes,” instead of what its names indicates.
Just ten years ago, sports shoes occupied only about 20 percent of the footwear consumer
market, where it is now reaching 50 percent, a huge market estimated at US$ 12 billion
worldwide in 1992.
As the volume of the market expands, the number of sports shoe categories is also
increasing. Basketball shoes were the first specialized category. New categories have
been added to the product list. Now there are baseball shoes, soccer shoes, jogging
81 The six companies are Woolworth, Nike, Reebok, Melville, Brown Group, and May Department Store. 82 A recent marketing survey in 1994 by Athletic Footwear Association shows that eight out of ten pairs of
athletic shoes are primarily purchased as “street” wear. Forty-two percent of people interviewed primarily
wear athletic shoes as casual wear; twenty-seven percent of them wear athletic shoes primarily to school,
and 11 percent at work place (SGMA 1995).
157
shoes, tennis shoes, cross-training shoes, aerobic shoes, walking shoes, etc. Shoe
companies are constantly trying to widen their range by adding new categories (“sports
sandals,” for example). The actual size of the athletic shoe market is underestimated
because some “hot” new categories, like hiking and climbing boots, are not counted as
sports shoes in statistics.
Of course, footwear design must complement each new category to show its
uniqueness in meeting specific functional demands. Model changes have been
especially frequent and rapid for the top performers. Two main uses of category
creation are: (1) to distance the innovation from its competitors who compete on price
alone, and (2) to stimulate new consumer demand for sports shoes. Change in sports
shoe product lines used to occur only once a year, but it is now twice a year with some
shorter backup seasons to fine-tune supply. In 1990, Nike offered 300 models with 900
styles for 24 sports categories, while Adidas had about 500 styles and L.A. Gear had over
500 (Korzeniewicz 1994, p.249).83
These product differentiation strategies are parts of a new competition anchored in
marketing and design (Korzeniewicz 1994). Sports star endorsements play an important
83 It is not at all surprising or unreasonable that, with two major seasons, brand companies are able to come
up with 300 models and 900 styles. If we take an average, each category has about 6 to 7 models each
season. That number is an obvious underestimation for jogging shoes or basketball shoes. Smaller
categories like soccer shoes will have fewer models. Different color combinations or upper stitchings
create various styles for the same model. The three to one ratio between style and model is about what we
observe at retail stores, some have only two styles and others up to 4. There are two other factors to be
considered: (1) Regional differences, for example, some models or styles are sold only in the European
market, and thus not available for the U.S. market; and (2) During small backup seasons, which occur two
months after regular seasons, buyers might trim some orders or add new styles, or even new models, after
evaluating the market responses of the regular seasons.
158
role in brand marketing. In 1989, the top three brands accounted for 87 percent of the
top five’s US$ 94 million total advertising spending in the nine measured media traced by
Leading National Advertisers (LNA). Nike alone spent US$ 33 million. While
visiting a Reebok supplier in the Philippines in 1994, I learned from a Reebok newsletter
that it had just signed an endorsement contract with rising basketball star Shaquille
O’Neill for about US$ 25 million a year for endorsing Reebok’s Shark basketball shoes,
while the daily payment of the Philippine assembly workers around me was only 90
pesos, and 130 pesos for staff. The payment gap between the two ends of an athletic
shoe commodity chain has reached the limits of human imagination. The athletes
promoted by athletic shoe companies have become heroes worshipped by youngsters all
over the world (including the Philippine workers)--a globalized market that is waiting to
be conquered by big brands like Nike.
Design and marketing are intimately related, but what is most relevant to our
investigation of the OEM market is the design strategy. The top performers are leading
a “tech hype” that promises to bring state-of-the-art technology to the performance of
shoes. Nike’s Air 800 had cushioning which came from urethane pillows filled with a
“secret gas” that was tucked in strategic places. But the latest model of the Air series
brings the dual pressure, multi-chamber Air-Sole unit which consists of differential air
pressure in interior chambers and outer chambers to adapt to lateral or vertical force.
Pushing a small button on the outside of Reebok’s Running Pump infuses air for a
“custom fit.” L.A. Gear includes mercury-controlled lights, which flash when shaken,
into the heel sole of its jogging shoes. Adidas’ Pulson System for soccer shoes has
energy return properties that the company claims will result in greater velocity during
159
passing and shooting. Asics’ Hex Gel, placed in the heel of the midsole, is a semi-solid
silicone-based substance permanently encapsulated in polyurethane that provides shock
absorption. Avia’s Squish Lugs feature buttons made of EVA placed on the outsole of
walking shoes to add bounce and cushioning.
Every new design also comes with adaptations of the shoe’s outer appearance to
highlight the technological innovation and convey the value-added image. Exposing
technology is a strategy brand-name footwear companies found key to the success of a
model. For example, Reebok added a see-through window to highlight the new
technology of Energy Return System. One important function of industrial design is
embedding the performance features in a salient fashion design that can be easily
recognized in the consumer market.
Severe competition among national brand companies heightens to an
unprecedented degree the level of product differentiation in the mature athletic shoe
industry. Shorter product life cycles fueled by constant renewals of technology and
models constitute a significant feature of the market. Nike’s dramatic setback during the
second half of the 1980s came because it had no replacement when its popular Air Jordan
basketball shoes went out of vogue and rival Reebok pushed its stylish aerobic shoes in
the market. Another example is the recent success of L.A. Gear, which introduced its
flashlight shoes in the market and all of a sudden created a flashlight shoe mania.
Adidas was quickly pushed down to fourth place after L.A. Gear’s new products hit the
market in 1993.
160

Design-Intensiveness and Development Uncertainty in DS Transaction
At the core of DSM are a handful of national brand footwear companies like Nike,
Reebok, Adidas, and Converse. These company’s most precious asset is the brands they
have. A great deal of money has been invested in marketing the brand image because
companies know that patented high-tech components have brief lives (e.g., the patent of
Nike’s famous Air Bag will end in 1997) and models soon lose their fashion edge by
imitation from other companies. Not just any label or name constitutes a brand. To
be a significant brand, a product must (1) add exchange value to consumers,84 (2) insure
expectation (e.g., quality and originality), and (3) be distinctive. Consumers typically
can recall only five to ten product names in most categories, thus the great majority of
“names” are ineffective as brands (Milliken 1994; KSA 1988). Even Payless
ShoeSource and Wal-Mart managers admitted that their customers pay little attention to
their private brands: “They are more like a label,” as the regional manager of Payless
ShoeSource answered.85
New models are often based on creative incorporation of materials from other
seemingly unrelated industries. Nike’s idea of the air bag came from aerospace
engineering. Reebok’s first aerobic shoe made use of a new material called “garment
leather.” The Reebok Pump came originally from an air-filled rubber bag for body
shape. L.A. Gear’s flashlight shoes are an innovative adoption of materials from the
electronic industry. The flashlight shoe fashion created by L.A. Gear encouraged close
84 To the extent that the consumers have certain confidence that others who see them wearing the shoes
would value the brand. 85 Designer’s brand is almost non-existent in the athletic shoe industry. The designers who designed a
killer product, like Steinweiss who gave birth to Fila’s Grant Hill shoes, are however stars in the industry.
161
cooperation between Taiwanese footwear producers and the electronic companies who
came up with various types of flashlights to be inserted in the shoes. A few months
after L.A. Gear’s successful launch of the flashlight shoes, both consumer and
environment protection groups warned that the mercury-driven device might be harmful
to humans (especially children) and the environment. The crisis was quickly eased,
thanks to the Taiwanese electronic component suppliers who worked closely with
footwear producers to substitute new designs that avoided mercury. The incident shows
again the specific source of uncertainty in the DSM and how closer ties between
segments of a commodity chain are essential to success.
At the frontier of industry development, the related industries of DSM are
potentially wide in scope. Nike, as a leading firm of the market, shows this
characteristic most clearly. When I asked the development manager of Nike what will
be the company’s new technical surprise after the patent protection of air bag expired, he
sneakily replied: “I surely can not tell you the answer. But the possibilities are wide
open, for example, we recently had contact with Polaroid for cooperation on some
product development. What the product might be? You guess.”86
The design and development of shoes is therefore not random. It must be socially
grounded in a spatial context that allows frequent contacts between firms in related
industries in order to be inspired with new designs or speed up commercialization of
those designs. As brand-name footwear companies are intensifying their
162
86 Likewise, a senior vice president of Reebok said in an interview that “we are going to give a sneak
preview of some of our new technology that we worked on and negotiated through the space industry and
auto industry” (Feb. 6th, 1989, Footwear News)

design-sensitive competition, the importance of strengthening ties with Taiwan, which
has developed well-integrated supporting industries for footwear production, becomes
more critical then ever. Many famous footwear buyers have been adding more R&D
personnel in Taiwan regardless of the decline in production in recent years. Footwear
brand-name company L is one example. It has its Advanced Concept Division located
in Taichung City of Taiwan. The American designer in charge of the unit was described
by the company general manager as a strange man who rarely mingled with his
“higher-educated” colleagues, but who had interestingly developed very close friendships
with local mold-shop owners.
He was a former engineer dealing with the interior decoration of the Boeing
airplane. The guy is really weird. His office is at the corner of a different
floor than main offices. His work is to come up with brilliant new ideas for
model design. I often saw him sitting a whole day just tossing around different
materials. The stress was so much that I was once scared seeing him painfully
rolling on the floor. He is alienated from other people in the company, but
interestingly had a whole group of buddies at the local mold-shops who share
areca nuts with him.
The close ties between design and development must ultimately be embedded in the
interpersonal networks where trustful relationships can be established and nurtured.87
As a corollary, the development of a mass-production model in DSM can be difficult
87 The most valuable human resource of Taiwanese footwear industry is a large group of footwear
technicians in the assembly plants, mold shops, trading companies, etc.. who typically had only primary or
junior high school education, started their career as apprentices, and are now around 40 years old. They
are shoe masters (Shy-Fuh) who are well-respected in the companies I visited.
163

because routines are constantly changing and flexible adjustment between suppliers and
buyers is critical. Certainly not all models are based on completely new architectures
involving fresh technology; but it is also rare, for example, for different models to share
the same specific components (such as outsoles, an important design focus). When each
model is an integrative design of its own with distinct components, the pressure for
accurate execution of the chain flow becomes higher than for models with only minor
changes. It is not uncommon for minor adjustments to original design to be made
during development; in the DSM, however, the process requires more intense
coordination among transacting parties to accomplish it more rapidly. Again, close and
regular contacts between buyers and suppliers are critical to the success in DSM.
Feng-Tay’s development experience with the AFM model of Nike is a good example.
This model has an externally-exposed air bag in the heel. To move this design idea into
production, the supplier has to solve some stringent problems that are closely connected.
A fundamental challenge was how to join the upper and the sole firmly on every spot of
the surface with the exposed bag in-between. A manager reflected upon the experience:
It took us a long time to figure out how to mass produce this model. The
critical part is in the PU section, especially in cementing the air bag. We have
to change our traditional processing sequences. In making the mold for holding
the air bag, we faced several dilemmas in deciding on two-piece wrapping or
one-piece insertion because each has its pros and cons. In order to put cement
on the air bag, we came up with our fourth-generation cementing machine. The
challenge is in applying appropriate cement in a speed suitable to mass
production. Excessive cement will overflow and contaminate the appearance,
164

while insufficient cement cannot assure the join. After that was solved, pray
painting of the bag was another challenge. Through close cooperation with
buyer and different sections of our company, we invented a new bag holding
device. Just when we thought the project was done, we found bubbles at the
interface of the air bag and the PU outsole. The new challenge is how to drain
out the air without ruin the procedure that had already settled. By that time
however the technical package88 had been gradually transferred to the shop
floor.
To summarize, the design-sensitive competition in DSM has technically involved its
OEM transaction flow in higher uncertainty and complexity in the commercialization
processes. Intensive interactions among firms in the chain are therefore a crucial factor
in determining a buyer’s competitiveness in the marketplace. The pressure for closer
ties among transacting parties does not come only from technical necessity however. To
get a fuller understanding of the organizational features of DSM, we now move closer to
the inter-firm relationships in the market.
Faces of Network Closure in the DSM: Exclusive Sourcing
The top brand performers are at the leading edge of the industry. With no others to
imitate, those buyers face the tremendous uncertainty in deciding what kinds of design to
be produced. In other words, customer demand when a model hits the market could
88 The major devices like cutting dies, mold and detailed manufacturing instruction for mass production of
a model.
165
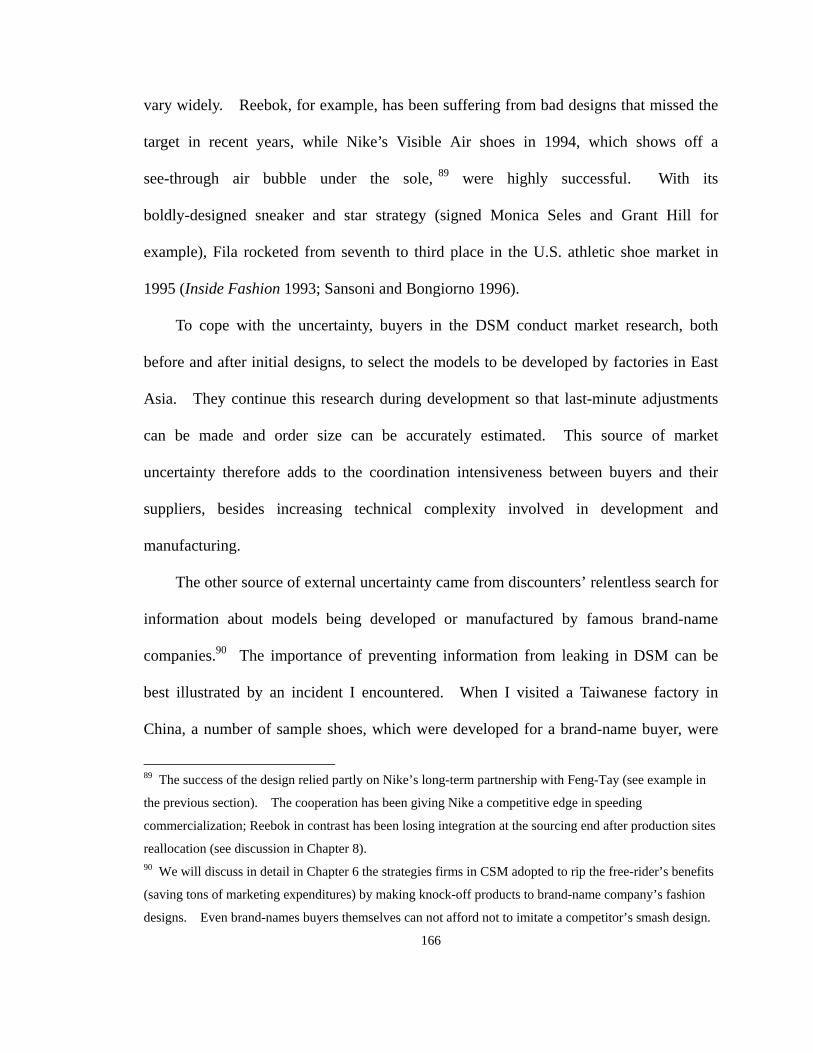
vary widely. Reebok, for example, has been suffering from bad designs that missed the
target in recent years, while Nike’s Visible Air shoes in 1994, which shows off a
see-through air bubble under the sole, 89 were highly successful. With its
boldly-designed sneaker and star strategy (signed Monica Seles and Grant Hill for
example), Fila rocketed from seventh to third place in the U.S. athletic shoe market in
1995 (Inside Fashion 1993; Sansoni and Bongiorno 1996).
To cope with the uncertainty, buyers in the DSM conduct market research, both
before and after initial designs, to select the models to be developed by factories in East
Asia. They continue this research during development so that last-minute adjustments
can be made and order size can be accurately estimated. This source of market
uncertainty therefore adds to the coordination intensiveness between buyers and their
suppliers, besides increasing technical complexity involved in development and
manufacturing.
The other source of external uncertainty came from discounters’ relentless search for
information about models being developed or manufactured by famous brand-name
companies.90 The importance of preventing information from leaking in DSM can be
best illustrated by an incident I encountered. When I visited a Taiwanese factory in
China, a number of sample shoes, which were developed for a brand-name buyer, were
89 The success of the design relied partly on Nike’s long-term partnership with Feng-Tay (see example in
the previous section). The cooperation has been giving Nike a competitive edge in speeding
commercialization; Reebok in contrast has been losing integration at the sourcing end after production sites
reallocation (see discussion in Chapter 8). 90 We will discuss in detail in Chapter 6 the strategies firms in CSM adopted to rip the free-rider’s benefits
(saving tons of marketing expenditures) by making knock-off products to brand-name company’s fashion
designs. Even brand-names buyers themselves can not afford not to imitate a competitor’s smash design.
166

stolen. The buyer was obviously annoyed and the office atmosphere in the factory was
downcast. There were whispers around and no one mentioned the event in public. I
was told privately that a local employee at the development department ran away with the
shoes and the president of the Taiwan-based company was rushing over here. Two days
later, the thief was caught by the police. My friends at the factory felt very relieved
although they knew that damage to the company’s credibility to the buyer was inevitable.
As a result of the need to both protect information from leaking to direct or indirect
competitors and facilitate extensive interactions among firms in commercialization, the
transaction networks of DSM develop into a relatively closed system which I will called
“network closure.” In other words, stable boundaries of network and ties between
supplier and buyer are consciously built and maintained on a bilateral basis. More
specifically, the network closeness of DSM can be characterized by three major
dimensions of transaction relationships: 1) The networks are composed of suppliers with
different degrees of exclusivity; 2) The transacting firms tightly coupled with overlapping
organizational boundaries; and 3) Firms in the network consciously maintain a culture of
commitment in which externalized transaction are symbolically internalized.
Table 5-1 represents a schematic illustration of the network features of DSM that I
observed in the Taiwanese-centered athletic footwear OEM market. The table indicates
the internal and external sources of uncertainty that transacting firms in the market must
cope with. Then three distinct dimensions of the relatively closed market network are
specified. Now let us discuss the network closure of DSM in more detail.
167
Table 5-1 The Causes and Consequences of Network Closure in DSM
The Empirical Type Design-Sensitive OEM Market
Basic Description OEM transactions that are centered around a handful of national brand footwear buyers
competing on the basis of offering unique design (both technically and aesthetically)
Overall Feature Network Closure
Source of Uncertainty Internal
to OEM Transaction
Experimenting new material in new design (from design to development),
Unstable commercialization routine (from development to manufacturing)
Source of Uncertainty External
to OEM Transaction
Difficulty in projecting sales (lonely leaders, no model to follow),
Imitation from direct and indirect competitors (seal information from leaking)
Three Dimensions of
Market Closure
Exclusive Sourcing Tight-Coupling Culture of Commitment
Characteristics of
Each Dimension
Marking network territory,
Exclusive company to
exclusive line,
Stable orders
Overlapping firm boundary,
Direct procurement,
Upward Participation,
Downward Intervention
Partnership enhancing,
Client-patron identity,
Private compartment
Network Closure is Embedded
in Different Forms of Trust
Based on capability trust
of each other to deliver
stability
Increasing co-work
experience and build
bilateral convention
Reducing distrust in
motivation and enhance
confidence in goodwill
The first sign of market closure is the buyer’s formal assignment of specific
mold-shops for an order. This is often not applicable to standard orders or reorders
where there is less valuable information because producers have already been released
into the market. By “marking the territory” of its OEM transaction, responsibility for
error can be tracked down easily. Also the trustworthiness of the mold-shop can be
evaluated over time. Repeated transactions with limited component suppliers to monitor
cooperating firms’ performance in keeping secrecy increase trust over time. The major
Taiwanese suppliers to brand-name footwear buyers all have their own outsole factory or
even mold factory because they know that vertical integration creates advantages in
gaining buyer’s confidence in placing high added-value orders.
168
Another sign of “marking network territory” can be seen in material specification.
Unlike CSM, where order specification indicates only the physical standard of materials,
the top brand companies prefer to use more patent materials in order to increase the value
of their products and to protect their models from imitation. A manager of an
Italy-based midsole company’s regional office told me how its company gets products
sold to Nike:
In general, our office here in Taiwan deals with marketing, inventory, delivery,
and after-sale service in East Asia because most of our customers--the shoe
factories or trading companies-- have main offices here in Taiwan. For the
brand companies, the procedure is different. In that case, our headquarters
takes over marketing because the materials of OEM production are often decided
by the buyer. For example, our Italy headquarters is currently negotiating with
Nike to adopt our newly invented green (environmentally friendly) midsole in its
new designs. Since they often prefer exclusive usage, we have to keep the
secret from their competitors and even their suppliers. Once the deal is settled,
we will rush to the assigned suppliers here in Taiwan to negotiate material
procurement and delivery schedule after Nike informs its suppliers.
This example reveals the closure of DSM by showing how a material supplier operates
internationally to adapt to the network of specific buyers.
Territory marking, as a measure by brand-name buyers to govern transactions in its
network, may only be a minor characteristic of DSM. But it must be regarded as a part
of DS buyers’ general preference toward exclusivity in sourcing arrangement. The
169
preference for exclusivity is set up in a hierarchical fashion: exclusive suppliers,
exclusive plants, and exclusive lines in decreasing degree. The exclusive supplier is
rare in the market because that involves too much risk to suppliers and a commitment that
not many buyers are willing to pledge.91 When transacting parties are, however, able
to manage a stable exclusive relationship, the competitiveness of both parties can be the
most powerful in the market. The twenty years of cooperation between Nike and its
exclusive supplier Feng-Tay is exactly such a case. The trust of Feng-Tay and the
commitment of Nike have brought tremendous success to both parties.
Exclusive plant is the most common preference of buyers in DSM. Like buyers,
most suppliers do business with multiple buyers. The unique feature of DS market
network is that firms on both sides strive to conduct OEM transactions in exclusive plants
(Bau-Chang). The exclusive plant seems to be a perfect middle ground to both
accomplish the coordination necessities in reducing uncertainties and protect firms from
risks of extreme exclusivity. Both the buyers and suppliers of DSM that I interviewed
agreed that exclusive plant has been a common phenomenon in their market. However,
most of them took a while to reflect upon the reasons. It obviously has become a
business convention of the market. Convenience, protecting secrets, and stability are
the three major reasons I received from both sides.
For convenience, exclusive plants save a lot of disturbing troubles. A manger told
me: “If you put the shoes of different buyers under the same roof, they will inevitably
91 Comparatively, sole supplier is non-existent in the footwear OEM market. This fact shows a basic
power relationship in the market-- firms on the supply side are more subject to substitution and have far
less bargaining power than those on the demand side. In short, footwear OEM relationship is asymmetric
in power.
170
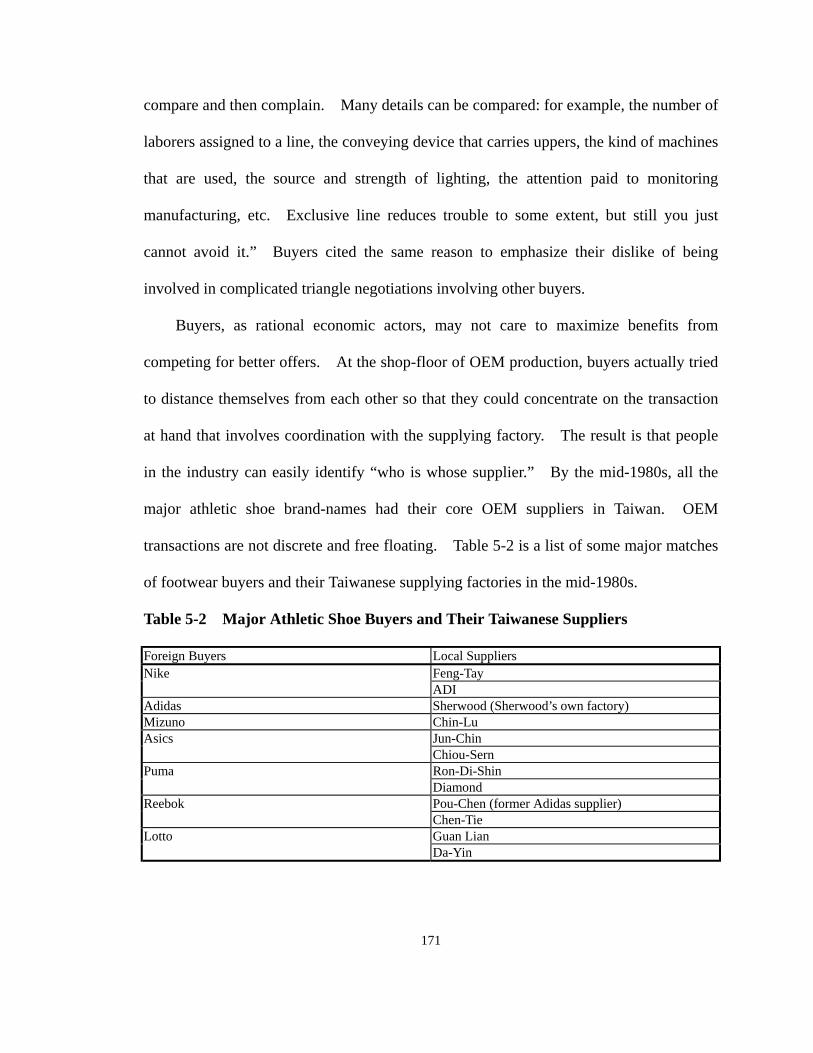
compare and then complain. Many details can be compared: for example, the number of
laborers assigned to a line, the conveying device that carries uppers, the kind of machines
that are used, the source and strength of lighting, the attention paid to monitoring
manufacturing, etc. Exclusive line reduces trouble to some extent, but still you just
cannot avoid it.” Buyers cited the same reason to emphasize their dislike of being
involved in complicated triangle negotiations involving other buyers.
Buyers, as rational economic actors, may not care to maximize benefits from
competing for better offers. At the shop-floor of OEM production, buyers actually tried
to distance themselves from each other so that they could concentrate on the transaction
at hand that involves coordination with the supplying factory. The result is that people
in the industry can easily identify “who is whose supplier.” By the mid-1980s, all the
major athletic shoe brand-names had their core OEM suppliers in Taiwan. OEM
transactions are not discrete and free floating. Table 5-2 is a list of some major matches
of footwear buyers and their Taiwanese supplying factories in the mid-1980s.
Table 5-2 Major Athletic Shoe Buyers and Their Taiwanese Suppliers
Foreign Buyers Local Suppliers Nike Feng-Tay ADI Adidas Sherwood (Sherwood’s own factory) Mizuno Chin-Lu Asics Jun-Chin Chiou-Sern Puma Ron-Di-Shin Diamond Reebok Pou-Chen (former Adidas supplier) Chen-Tie Lotto Guan Lian Da-Yin
171
Exclusive plant is basically a spatial phenomenon in which transactions are
constantly secluded from outsiders. It assures confidence from buyers that information
about their models will not be exposed. Stability has different connotations to buyer
and supplier. For suppliers, exclusive plant or line certainly guarantees a stable amount
of orders, or at least they have “legitimate” reasons to demand that from buyers. For
buyers, exclusive sourcing assures them a certain amount of production space that is
subject to planning. However, it is important to note that order stability is actually a
precondition for exclusivity, and not vice versa. If one of the transacting parties can not
offer stable supply or demand, there is no way to develop the exclusivity in transaction
relationship. The production in the DSM is better planned because the orders have
higher predictability. This can be seen in two places.
Push-back happens when the buyer requests a postponement in the final delivery
date. It is generally agreed among suppliers of both DSM and CSM that push-back is a
warning signal. The order may end up aborted because of sudden changes in the final
market. Push-back is rare in the DSM because the prolonged period of development
and market surveys increase the stability of the arriving orders. Also because of the
same characteristics, push-back has far less damage to suppliers in the DSM because it
often comes at the earlier stage of development when materials and tools are not yet
procured.
The other sign of order stability can be seen in the inspection procedure in the DSM.
The inspection procedure of the DSM is based on a grading system. Shoes are classified
172
into a B grade if there are only minor defects.92 Inspection is done in small lots (for
example, every two hours of production per size) and if the rejected shoes reach a certain
percentage, the whole lot will be rejected. The grade A shoes in the accepted lots will
continue to accumulate until reaching the amount specified in the order. The buyer also
accepts the grade B shoes, but with a discounted price. Grade B shoes are sold to some
distributors, outlets, or mail order companies who want to build their product lines with
certain national brandname shoes to attract customers who are basically more sensitive to
prices. Here two points can be made: first, in the DSM, production planning has higher
stability; and second, CSM constitutes a buffer for the DS buyers to adjust production
output more efficiently. It is clear that the two major markets are not entirely segregated
and we must take their interaction into consideration. We will discuss that in the next
chapter when we analyze CSM.
Figure 5-1 Order Adjustment in Sourcing Network (An Example from Reebok)
92 Here are several examples of minor defects that are recorded in a brand-name company’s quality
inspection procedure: “unbalanced toe lasting: less than 3 mm,” “small area of excessive cement on inside
quarter where adhesive margins is no higher than 2 mm wide if line is clean and smooth,” “any untrimmed
thread on upper stitching,” and “small light colored stain less than 3 mm in diameter on outsole.” Most
consumers will not be able to even notice these defects of B-grade shoes.
173
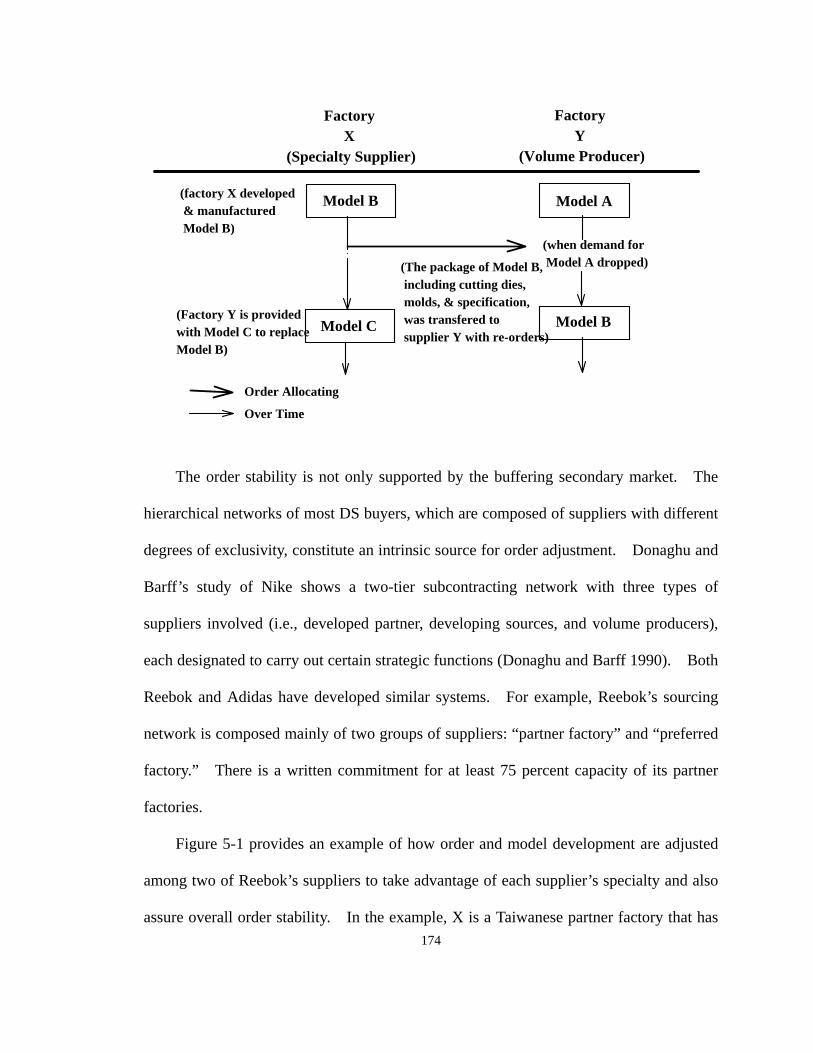
Factory X
(Specialty Supplier)
Factory Y
(Volume Producer)
Model B
(when demand for Model A dropped)
Model BModel C
(factory X developed & manufactured Model B)
(The package of Model B, including cutting dies, molds, & specification, was transfered to supplier Y with re-orders)
Model A
(Factory Y is provided with Model C to replace Model B)
Order Allocating
Over Time
The order stability is not only supported by the buffering secondary market. The
hierarchical networks of most DS buyers, which are composed of suppliers with different
degrees of exclusivity, constitute an intrinsic source for order adjustment. Donaghu and
Barff’s study of Nike shows a two-tier subcontracting network with three types of
suppliers involved (i.e., developed partner, developing sources, and volume producers),
each designated to carry out certain strategic functions (Donaghu and Barff 1990). Both
Reebok and Adidas have developed similar systems. For example, Reebok’s sourcing
network is composed mainly of two groups of suppliers: “partner factory” and “preferred
factory.” There is a written commitment for at least 75 percent capacity of its partner
factories.
Figure 5-1 provides an example of how order and model development are adjusted
among two of Reebok’s suppliers to take advantage of each supplier’s specialty and also
assure overall order stability. In the example, X is a Taiwanese partner factory that has 174
been making athletic shoes for Reebok and its subsidiary.93 X has an excellent
reputation for developing brand new models quickly. In contrast, Y is a Taiwanese
volume supplier who is basically making reorders that had already been produced for a
certain amount of early orders. When demand dropped for Model A, which factory Y
had been producing for a while, Model B, which factory X developed and manufactured,
was transferred to factory Y to keep the volume commitment. At the same time,
Reebok provided factory X with a newer model C to fill up the production space left over
after orders for Model B were moved away.
Faces of Network Closure in DSM: Tight Coupling
Exclusive sourcing in its various manifestations is profoundly presented in the DSM.
It helps to shape the very contour of network closure of the market. The second feature
of the DSM networks resides in the very kernel of bilateral transactions in the market. I
use the term “tight-coupling” to summarize the related characteristics. None of the top
three buyers in the DSM place their orders indirectly through trading companies. It is
obvious to firms in the DSM that the direct transaction between a supplier and a buyer
largely enhances accurate execution of tasks, reduces miscommunication, and prevents
leaking of industrial secrets. Converse has no formally registered office in Taiwan but
its de facto regional office has been operating inside its sole and exclusive sourcing agent
Yu-Shin Trading Company for about twenty years. It should be considered as direct
sourcing. Direct sourcing is the most distinct network feature, except a strong
93 Avia is a branch company owned by Reebok. Reebok is now emphasizing less on the brand but
focusing on its core brand.
175
preference for exclusivity, that separates DSM from CSM. It is also the primary
condition that sets the stage for tightly-coupled transaction relationships in the DSM.
If we look more closely inside the exclusive plant, we find that, especially in the
development stage, there are overlaps between organizational boundaries. The
development unit of the buyer, including its office and personnel, is stretched out and
implanted into the supplier’s organization. People from both companies work together
on a daily basis and in an enclosed space to speed up the commercialization process.
Formally, these buyer’s people are accommodated guests, and they should try to avoid
infringing the management authority of the host company. In reality, they have de facto
power in making decisions such as whether an engineering solution is acceptable or
whom is allowed to visit the shop floor. When I was denied access to a plant, the most
common reason I received was: “Sorry, I have asked the buyer’s people and unfortunately
they don’t allow visits.” Whether their reply was true or not is not of importance here.
The point is that the buyer’s permission is a legitimate reason.
In other words, if we look at the actual interactions between buyers and suppliers in
transactions, it is clear that the organizational influences of buyers are not confined by the
ownership defined hierarchical authority. The organizational boundary becomes fuzzy.
For example, a buyer made the following regulation that the inspection area must be “as
close to the warehouse area as possible with fluorescent lighting directly over the table
8-9 ft. high from the floor. It should be a room large enough to perform an inspection
with 30 cases in the room (15 ft x 15 ft).” Similar regulations are formally and
informally placed to shape the warehouse, assembly floor, inspection area, and even the
machines and shop-floor layout. One afternoon in a brand-name supplying factory, I
176

saw that line leaders all left their positions and moved to the conference room right next
to the buyer’s office. It was a three-hour seminar that the buyer gave to train line
leaders in the buyer’s quality culture. I was told by the plant manager that line leaders
must learn hard so that they could pass an exam to be held in the next week for getting a
certification from the buyers. That certification will influence their promotion and
salary (which is supposed to be subject to the factory’s discretion). At the main entrance
of another factory, I saw a big poster about the buyer’s announcement of its “labor human
policy” which was placed right next to time card machines so that workers can see it
everyday. The penetration of buyer’s influence is so pervasive that it does not only
create an overlapping boundary of organizational authorities, but sometimes even
threatens the supplier’s authority.
Spatially speaking, the theoretical point of firm interface should be the inspection
point at the very end of production where the quality responsibility for the goods change
hands.94 But the reality is that buyers have reached deep into the operation of the
supplying factories. When asked about the “invasion,” a plant manager reminded me
that the very essence of quality control must, as a prevention, begin far ahead of final
production, and not just in the afterward inspection. While the explanation is practically
functional, it, however, does highlight a fact about OEM that tends to be overlooked.
OEM is involved not only with, by definition, transaction externalization (i.e., buy
instead of make); it also creates certain pressure in internalization (i.e., place it under
94 In reality, this is not true at all because, even after inspection, the defect products in the retail market are
still the supplier’s responsibility. There are usually penalty clauses in OEM contracts (or simply in
business tradition) to take the costs out from supplier’s pocket, which is another sign of power asymmetry
in the market. Taiwanese suppliers overall share the “consensus.”
177

buyer’s authority control) especially when complexity and uncertainty are high. The
result of this dilemma is neither market nor hierarchy, but networks that are anchored on
tightly-coupled transacting firms where organizational boundary is ambiguous. Because
the plant manager sensed that my question is about authority, he tried to draw the
boundary by giving me an example: “They are the customers anyhow. How can we
know better than they do about what they want? But they must not instruct line leader
right at the assembly lines because those workers are our employees. It is however O.K.
to do that away from the manufacturing shop-floor.” The de facto organizational
boundary is ultimately a social construction.
The downward extension of the buyer’s managerial authority to the supplier is but
one way of looking at overlapping organizational boundaries. The reverse way would
be to see the supplier’s participation in the early stage of the flow where buyers are in
control. Feng-Tay, which supplies exclusively for Nike, represents the early
participation of a supplier most clearly. Nike has its Asian Research and Development
Center located in Feng-Tay. The Nike R&D Center, although a joint investment of both
companies, is organizationally a unit of Feng-Tay, and not an independent company
controlled by Nike. There are, in total, about forty engineers in the unit. Ten of them
are from Nike. Its operation is fully independent from other units of the company and
under the twin management of Nike’s Asian R&D head and a chief technician from
Feng-Tay. It is, in a sense, an overlapping territory of the two companies. In the most
tightly-coupled OEM pair of transactions (i.e., high exclusivity), not only the scale of
overlapping organizational boundaries increases, but the scope also expands. Through
this connection, Feng-Tay is able to gain access to the internally circulated information of
178
Nike far earlier than its competitors (e.g., the overall models that are evaluated at the
early point of the chain before OEM business even begins).
Faces of Network Closure in the DSM: Culture of Commitment
Developed upon the previous two features of the DSM, a very unique business
culture, which firms in the DSM strategically utilize to enhance OEM transactions,
emerges. I summarize the specific cultural characteristics under the general rubric of
the “culture of commitment.”
A very strong impression in interviewing brand-name buyers, as compared with
buyers in CSM, is the language they use to describe their OEM relationship with
suppliers. DS buyers consciously notice the strategic importance of “trust,”
“commitment,” and “partnership” in a competitive sourcing network and they do know
how to articulate that in language. Nike’s famous slogan of “We are a company built on
a hand-shake” was proudly quoted by its manager. Adidas’ manager emphasized the
great German tradition of Gemeinschaft (solidarity) at the root of Adidas’ business
philosophy. The American manager at Converse’s regional office obviously has stayed
in Taiwan for some time because when he emphasized trust as a critical ingredient for
sourcing success, he used “guanxi” to express partnership. When asked why he did not
use order to force the supplier to correct the mistakes that was troubling him, the country
manager of Reebok Philippine answered: “No. We just preach. Listen to my word:
‘preach.’ We Reebok appreciate partnership. It is the top priority that you don’t want
to hurt.” There is clearly an institutional isomorphism that shapes the similar culture
through business journals and mutual imitation.
179
Adidas’ manager gave me the most concrete example in my interviews about how
trust works in guiding sourcing relationships. The German manager told me that there
are four things he will never do that will hurt trusting relationships. First, there is no
price re-negotiation during the middle of production once a deal is stricken. The averse
effects of re-negotiation is that the supplier might looks for other buyers. “Your
relationship get sour before you even notice that,” the manager said. Second, there must
not be unnecessary or intentional claims. The quality evaluation must be fair and open.
Third, “I have being telling myself not to play one supplier against the others. As a
manager, my task is to analyze the unique strength of each supplier so that orders can be
properly placed.” Finally, “We pay tremendous attention to proper product mix (of
different types of models) to meet factory’s cash-flow need. Considering overhead,
labor, material and other costs of our suppliers, we knew that we could further cut the
price and still make them a profitable deal. But we will not do that because the profits
we cut would tighten their cash-flow and hamper their future investment. Profit is not
equal to growth and we want healthy growth.”
The “culture of commitment” also needs a stage to highlight the close ties and
mutual commitment. A visitor to the supplying factories in the DSM will
unquestionably notice how the suppliers are concealing their true identity by decorating
their factories with symbols of their OEM buyers. Almost without exception, DS
suppliers hang huge signs of their buyer’s logo and name at the top of the factory
buildings or on the walls so that anyone could see them from a long distance. At the
same time, it would take a visitor considerable effort to find the factory’s own sign.
Inside the factory, the buyer’s symbols are everywhere: on posters, policy
180
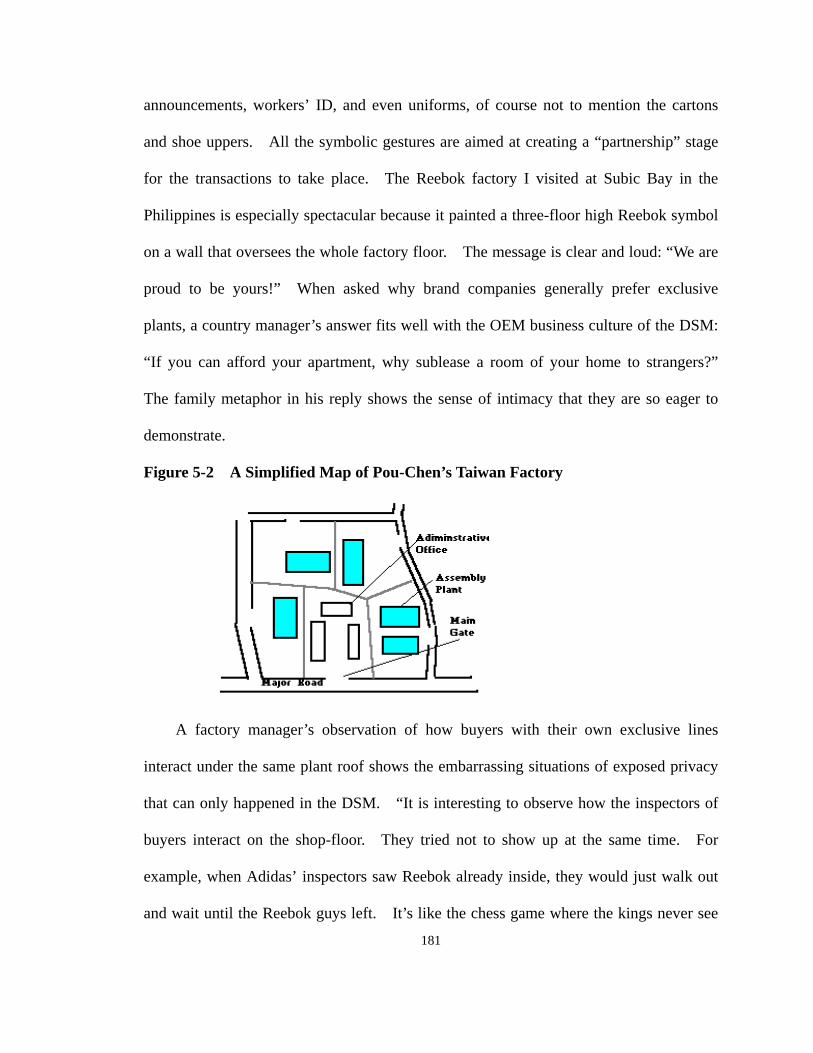
announcements, workers’ ID, and even uniforms, of course not to mention the cartons
and shoe uppers. All the symbolic gestures are aimed at creating a “partnership” stage
for the transactions to take place. The Reebok factory I visited at Subic Bay in the
Philippines is especially spectacular because it painted a three-floor high Reebok symbol
on a wall that oversees the whole factory floor. The message is clear and loud: “We are
proud to be yours!” When asked why brand companies generally prefer exclusive
plants, a country manager’s answer fits well with the OEM business culture of the DSM:
“If you can afford your apartment, why sublease a room of your home to strangers?”
The family metaphor in his reply shows the sense of intimacy that they are so eager to
demonstrate.
Figure 5-2 A Simplified Map of Pou-Chen’s Taiwan Factory
A factory manager’s observation of how buyers with their own exclusive lines
interact under the same plant roof shows the embarrassing situations of exposed privacy
that can only happened in the DSM. “It is interesting to observe how the inspectors of
buyers interact on the shop-floor. They tried not to show up at the same time. For
example, when Adidas’ inspectors saw Reebok already inside, they would just walk out
and wait until the Reebok guys left. It’s like the chess game where the kings never see
181

each other. Even when the buyer was alone, they tried not to look at other’s lines.”
The economic interactions become normative when overtime routines turned into cultural
convention.
Pou-Chen has been growing on a different marketing strategy than its rival Feng-Tay.
It makes shoes for all the major brand-name companies. The company’s Taiwan factory
has four assembly plants making shoes exclusively for specific buyers and one for a
variety of different buyers.95 The map of Pou-Chen’s Taiwan factory shows the spatial
effects of market closure on the firm level (see Figure 5-2). At the center is the
company’s administrative headquarters which is in the building which is first seen when
entering the main gate. At the two arms of the building are outsole and chemical plants.
The interesting thing is that the other five assembly plants are separated by iron fences
into four zones, each with their own entrance facing a different direction. The company
speaker told me that in the earlier years in order to meet a colleague they had to walk out
of their gate to the outside road and then enter another plant from its own gate. “Now it
is much relaxed. We have some short cuts on fences so that people can just squeeze in
and out.” Each plant becomes a private compartment for separately dedicated
transaction relationships.
Pou-Chen, as an integrated company, surely is not simply a composition of
dis-integrated plants. “Our company has a great advantage that Feng-Tay lacks.” “At
the top of our company,” the manager admitted, “we study the new model designs that no
buyers in the retail markets are able to know from each other months before the products
95 The factory is located at the Fu-Shin industrial zone of Chang-Hua County. It is the largest factory in
that industrial zone.
182
hit the market. Frankly, many designs we offered to our buyers are based on those of
the others. The point is not to do it too much so that you irritate any of your buyers.
You know trust is very important in the industry.”
Although Feng-Tay has advantages of far stronger tie than Pou-Chen, Pou-Chen has
been enjoying both ties and holes in the complicated world of DSM networks. Both
cases show that the OEM market is not at all merely governed by the invisible hand of
price mechanism. It is ultimately governed by networks that are socially embedded in
human interactions.
183
Chapter 6 The Cost-Sensitive Market, Flexible Imitation and Quick Response
This chapter analyzes the organizational features of the cost-sensitive market (CSM),
which is mainly composed of discounters, trading companies, and their suppliers. We
begin with an introduction of the major buyers in the market and the competition in
which they are involved. Under the impact of new competition, cost sensitive buyers
adopt a follower strategy by imitating designs in the DSM. Both the speed and the
timing in delivering imitation products to the market are critical to success in the CSM.
The flexibly-specialized footwear production network in Taiwan provides a strategic
partner that no buyer and trading company in the CSM can afford to overlook.
To buyers in the CSM, who must deal with a narrower profit margin, the
simultaneous inflow of similar knock-offs, and no back-up market for absorbing
oversupply, timing in exiting from the market when demand drops is as important as
timely entry. Instability in sourcing arrangements is therefore inevitable. Buyers in
the CSM, unlike those in the DSM, prefer neither direct nor exclusive sourcing. In
contrast to the network closure of the DSM, the CSM constitutes an open system
involving highly-differentiated cross-cutting networks. Although trust and commitment
are still a critical factor, firms in the market develop them informally and subject them to
less conscious planning. In many cases, resources are mobilized through indirect ties.
The cross-cutting networks of the CSM are embedded in reciprocal exchanges among
Taiwanese producers and their cooperative relationship with trading companies. The
network constitutes both a stabilizer in spreading risks and a facilitator in speeding up
flexible response to the volatile environment in the CSM.
184
Cost-Sensitive Buyers and the Follower Strategy
Buyers in the CSM are mainly composed of discounters who are competing in the
consumer market to offer cheaper products with satisfactory quality. Two typical buyers
in this market are Wal-Mart, a discount store, and the footwear specialty chain, Payless
ShoeSource. Payless ShoeSource has been the most successful shoe retailer in recent
years. It has about five thousand retail outlets in the United States controlling twelve to
eighteen percent of the footwear retail market. It sells shoes with retail prices between
US$ 10 and 15. Payless ShoeSource has its Asian headquarters in Taiwan and sources
US$ 900 million worth of shoes each year in East Asia. About twenty percent of the
orders are athletic shoes. The name of the company reveals how it competes and how it
wants to be recognized by consumers.
Wal-Mart is Payless ShoeSource’s main competitor.96 It is the world’s largest
discount store chain, selling a wide variety of goods. Wal-Mart has established a global
network of procurement offices. Its Taiwan office was established already in 1971.
Only about 10 percent of its footwear supply, mainly high-tariff shoes, such as western
bots, is sourced from domestic firms in the U.S.. Wal-Mart’s footwear procurement
operation is concentrated in two places, primarily Taiwan and secondarily Hong Kong.
One of Wal-Mart’s recent marketing slogans says: “At Wal-Mart, you buy more for less,”
a similar strategy to that used by Payless ShoeSource.
In contrast to the DSM, where competition is largely based on design and marketing,
the term “cost-sensitive” reflects the major preference of its consumers. A buyer who
can bargain for a cheaper offer from suppliers, given the same quality output and
185
96 K-Mart is another competitor whose footwear department operation is licensed to Meldisco.
overhead, can lower the retail price and hence attract consumers away from its
competitors. In my interview with the procurement head at Payless ShoeSource, for
example, the manager expressed his major concern about their relatively higher costs
compared to their rival Wal-Mart.
Cost, however, is not the only determinant in competition. A large inventory of
unsold shoes can ruin a retailer, no matter how cheaply those shoes are made. Given the
very competitive environment of the OEM supply market, the cost margins among buyers
of similar scale do not differ decisively. Payless ShoeSource, for example, as a specialty
store, places a great deal of importance on the variety of choices and faster model
changes than does Wal-Mart, which carries a narrower range of models. The manager
in charge of Wal-Mart’s footwear line also emphasizes the importance of hitting the right
products. With relatively fewer models on the shelf and generally larger orders than
Payless, developing the right lines of shoes is very important. Rates of return are more
crucial than the static costs of procurement. The bottom line of competition in the CSM
is getting the right product cheap and quickly to the consumers in the right volume.
The DSM and the CSM are not completely segregated. To understand how
transactions in the CSM are organized, we must first understand how competition in the
CSM is related to the DSM. The new competition in the DSM which we discussed has
spread to the CSM creating some uncertainty but also offering a partial solution. With
the broad scope of competition in mind, we are able to see the impact more precisely.
The country manager of a trading company offered this observation: “Since Nike
launched its Air series, the trend of athletic shoes becoming a fashion was clearly
established. Every year they announced a whole new style of Air shoes. We just have
186
to follow” (Informant BB1). Stable market demand can no longer be assumed. A hit
with the right product could create a big fortune; but an unappealing product could be a
nightmare to a company. The designer of a Canadian footwear trading company in
Taiwan told me how the follower’s strategy can be a life-or-death matter in the severe
competition of the CSM: “We were planning to close out the business, when we learned
from a recent shoe show that Nike is planning to push a new category called ‘street
hockey’ this winter. We have been good at a similar category and the Canadian market
should respond well. We bet on it to give us a last chance.” The line-builder in the
CSM (equivalent to the designer in the DSM) builds its product lines by imitating what
major buyers in the DSM sell to the market. Firms in the market compete by getting the
information about major brands’ latest models as quickly as possible and then making
imitative shoes at a cheaper price.
The CSM is not just passively influenced by the new competition in the DSM. It is
driven by the aggresive moves of firms in the CSM to increase profit by free-riding
fashions that buyers of the DSM have created. Buyers in the DSM are aware of this
practice: one development manager of a brandname company called these pirate firms in
the CSM “shameless cockroaches.” When facing market uncertainty in deciding what
kinds of products to develop, companies in the CSM, unlike the leading national brand
companies, overcome the problem by monitoring and following closely the steps of top
brand performers. Put in plain language - they imitate. The new competition in the
DSM creates not only challenges but also opportunities.
Being threatened by the ever-expanding market share of Nike and Reebok, importers
and buyers in the CSM not only imitate their products but their strategy. For example,
187

Mercury International, a footwear trading company of the Madison Group specializing in
sourcing athletic shoes, tried to push Spalding (a tennis racket brand) in the hope that
“there will be some resistance to the higher price points of the premium brands. Some
[consumers] will trickle down.” The plan obviously failed. “Originally with Spalding
we aimed upmarket but we hit a wall called Nike and Reebok,” said the marketing
director of Mercury (Footwear News, Feb. 18, 1991).
The only small category where buyers in the CSM are able to pursue a
differentiation strategy with some success is children’s shoes, which is largely ignored by
the major national brand companies however. Designs of those shoes are mostly based
on licensed characters associated with movies or cartoon series. Pagoda was the first
footwear importer licensing with the so-called “character brands” like Little Mermaid and
Lion King. Another example is BBC International’s license of Disney’s Pooh bear.
The category has several characteristics that fit well with the CSM: the original design is
well-established, the fashion is short-lived but large in volume, assembly requires few
steps because characters are simply printed on the upper, and parents do not require these
shoes to be durable, as long as they are safe. It is in a sense still a follower’s strategy,
except that the original designs are from another industry.
The quality assurance head of company P explains their follower strategy:
Our parent company observes daily the retail outlets for the top brand shoes,
like the Foot Locker. Once these companies have new models shown in
advertisements or on the shelf, we pick the models that are making hits
immediately. Then the models are rushed to our suppliers here in the Far East
for development. Everything has to be done fast. Our lead time (from
188
placing order to final shipment) was about three months before. Now we have
improved to two months. We target those consumers who want to wear a pair
of look-alike Nike shoes, but don’t want to pay that much money. There are
plenty of them. If you ask me why we have been so successful in recent years,
my answer would be: recession. (Informant BP3)
Company B is a famous trading company (an importer) which sources athletic shoes
for Payless, Wal-Mart, and many other buyers. The development head of the company
told me how they do business:
I will tell you the truth. We actually show our customer the product catalogues of
companies like Adidas. We tell them that we could make a model similar to
their model X (yes, as exact as that) but with two more colors and a far more
‘reasonable’ price. We do have several brands that are licensed from sporting
goods companies who have no athletic shoe line, like the famous tennis racket
company P. They are however negligible in the shoe industry. We are just
like vendors. (Informant BB1)
When asked about company B’s regional organizations, the answer was as follows:
We have four offices in East Asia. They are located in Taiwan, Guang-Dong of
China, Hong Kong, and Korea. The office in China is doing inspection and
delivery control. The Korean one is very small, only about two people. Its
function is to collect information. You know, Korea has many factories
producing brand-name athletic shoes. If we could get the information about
new models before they hit the market, we could make a hit too. (Informant
BMC)
189
Company D is an agent sourcing for a secondary brand which has had very good
performance in recent years. The top manager of Company D admits that:
Even for us, borrowing ideas from the top three is not unusual. Once in a while,
when visiting the mold-shop, I would ask the boss to show me Reebok’s molds,
for example. We are good old friends. The guy would then show me the
mold with a sneaky smile and say ‘Don’t tell other people.’ We certainly can
not copy the whole thing, but the important thing is about style. We could add
on that and make some variation. (Informant BSC)
These examples illustrate the basis of competition in the CSM and the market’s very
nature as a secondary sector compared to the DSM. With the backgroud understanding,
we are now ready to study the various features of transaction organization in the CSM.
Speed, Timing of Entry, and Flexible Imitation
Just as the DSM is also driven in part by cost considerations, the CSM is not driven
by cost alone. Shortening lead time has been a critical demand pressuring completion of
OEM transactions. However, the speed in delivering products to the market after the
order is placed is however just a function of inter-firm coordination in the sourcing
networks, which involve various constituents. Design, for example, an important factor
in shortening lead time, plays no less significant a role in the CSM. The difference is in
the function it serves in coordinating transactions and the environment it responds to.97
The development head of a successful trading company M told me about the role
190
97 I have emphasized in Chapter 4 that “design” refers to a wide spectrum of activities that is contingent on
the market networks in which it is located.
design plays in their business. I asked the manager whether models change more often
in the brand-name market than in the knock-off market. Here replied,
I don’t believe that brand-name companies change their models more often than
us. The reason is very simple: we actually imitate their models closely and
even provide more color combinations in design. Well... yes, I have to admit
that they are far more creative than us. So if you see the model change as a
quality matter, not simply quantity, I would agree with you. However, design is
still important to our business, and we have our own challenges. Put it this way,
our goal is to design a US$ 40-dollar-look-alike pair of shoes within a cost limit
of US$ 10 and with a retail price of US$ 20. This pair of shoes must also be
designed to be easily produced so that the products can hit the market as soon as
possible. Remember, our competitors are desperately doing the same thing.
(Informant BK1)
When asked how they speed up the process, the manager responded:
How do we make it? Compared to the original brand design, we substitute with
second-grade (I won’t say “inferior”) materials, like synthetic leather instead of
natural leather, or 600d of nylon instead of 1,200d. The number of steps,
especially in a stage like stitching, could be further reduced. For example,
reduce the upper design from a combination of thirty cut pieces to fifteen.
Keep used outsole molds that are readily available and change only the upper.
However, you cannot go so far as to lose the original flavor, and that is difficult.
Given the very limited latitude of time and cost allowed for our job, whose
design do you think is more difficult? Hey, we need creativity too.
191
The development head of another company gave me his own theory about their
design difficulty with a “you-can’t-blame-me-for-that” attitude:
Unlike designers of Nike, Reebok, and Adidas, we can’t let our crazy ideas go
any direction they want. Their designers could have plenty of time trying
different materials, making complex designs, experimenting with production
methods, and so on without too much concern about the costs. We go in a
reverse fashion. Before design, we already have the prospective model’s retail
price fixed. Our customers are very sensitive to the price. When we design,
we must keep costs in mind all the way through while still catching the essential
features that make it a successful model in the brand-name market. If the total
costs of our model turn out to be too high, we will have to adjust the design or
try squeezing the supplier for lower offers. We have to be very realistic
because it is all about costs. (Informant BMC)
With its well-developed supporting industries, Taiwan has been an excellent place
for trading companies not only to produce their orders but, increasingly, to develop their
models. The synthetic leather industry of Taiwan, for example, has developed a
reputation for constantly developing new products to supply its major downstream
industries, like footwear. The ability of many specialized Taiwanese small factories to
make footwear accessories like buttons in a few days, even offering many varieties, has
amazed buyers and trading companies I interviewed. The densely connected networks
among numerous mateiral suppliers, component suppliers, footwear producers, and
trading companies in a small area are critical for speed in responding to the changes in
the market.
192
The development of knock-offs for L.A. Gear’s flash-lighting shoes in 1995 was an
excellent example of Taiwan’s strength in footwear development. It was actually BBC
International who first got the flash-light license. Knowing that the little component
exactly fitted the tech-hype in the DSM, BBC International approached L.A. Gear and
struck an exclusive bilateral deal on the product. L.A. Gear was exited about the secret
weapon and agreed to the cross-segment cooperation. It proved a tremendous success,
lifting L.A. Gear to third rank in the DSM, surpassing Adidas. However, just a few
months after L.A. Gear launched its flash lighting shoes, trading companies in the CSM
had developed many varieties of lighting shoes that circumvented L.A. Gear’s patent
protection. The original lights were placed at the heel and the sensor was designed to
respond to an up-and-down movement. Knock-offs, thanks to the well-developed
electronic industry in Taiwan, which BBC International also relied on, came up with
lights placed at almost every possible positions (e.g., toe and upper) with sensors that
responded to different directions of movement. L.A. Gear’s success stalled in a year
and resulted in the appearance of its shoes at discount stores.
Since a large proportion of the world footwear supply is developed almost
simultaneously in the highly-condensed networks in central Taiwan (especially for the
CSM), product information circulates throughout the networks quickly and is subject to
easy access, creating another information-based competitivenss. A trading company
told me that one of its suppliers had a whole package of eyelets lost on the way to its
factory in China. This loss stalled production of the model. To help the supplier, the
trading company manager searched throughout his network and found the same eyelets
available in an adjacent Taiwanese factory in China. The manager was proud to tell me
193
that without him the two factories would never have been such good friends. The
example also shows that the production networks in the CSM are more open than in the
DSM in the sense that even competitive firms often cooperate. As I saw in the
Taiwanese footwear industry, this mixture of cooperation and competition characterizes
the transaction organization in the CSM.
The dense networks sometimes even allow transactions at their different stages to be
connected in a way that significantly shortens lead time. A trading company manager
told me how he surprised a buyer by shortening lead time to just one month, something
almost impossible in a full span operation. After the buyer asked to source knock-offs
of a specific model, an inspector of the trading company happened to see it being
produced in a factory he visited. He asked the manufacturer to make some additional
volume for the trading company with only a few minor modifications in leather and
colors. The time in pre-production preparation was thus saved. The buyer was
stunned by the company’s ability to deliver the products as speedily as promised.
Access to information and speed in transaction execution are crucial to success in
the severe competition in the CSM because they relate fundamentally to the rate of return.
Since the variation in labor costs and unit price is relatively limited in the market, volume
of retail sales largely determines profit. The sales volume is determined by hitting the
right product, but also delivering that product at the right time. To understand how this
is achieved, we must understand how competition in the two markets is related at points
of product cycles.
Although products in the DSM and CSM are not entirely substitutable (i.e., not in
direct competition), massive imitation in the CSM constitutes a force constantly driving
194
down sales in the DSM, due to the scarcity of the original designs. The top brand
companies use frequent model changes to enlarge the gap between them and their cost
competitors. Almost every point in the chain flow of the DSM is a possible hole for
information linkage to firms in the CSM (see Table 6-1). Not only, therefore, does new
competition in the DSM create pressure for the CSM, but there is clearly a reciprocal
pressure from the CSM that forces the DSM companies to protect information from
leaking to their competitors. The DSM and CSM are linked in the way companies take
advantage of fashion cycles.
Table 6-1 contrasts the transaction flows of the two OEM markets. In the DSM,
after internal review, a list of models is sent to develop salesman samples in the supplying
factories. Salesman samples for the DSM are far larger in volume than in the CSM,
over five hundred pairs for example. These are sent directly from manufacturing
factories to the retail points designated by buyers. The retail outlets then estimate
demand for the models and give suggestions to the buyer for last minute design
adjustments. Only at this point are designs in the DSM exposed to imitation.
In the mean time, the “line builders” (the counterparts of designers in the DSM)
develop their product line for the coming season based on various sources of information
about those models that are popular enough to be “re-interpreted” (a common term used
in the CSM to avoid the negative connotations of “imitation”).98 From the beginning,
the drive is to reduce complexity in manufacturing, both development and production, to
increase speed and reduce costs. The competition is so severe that a transaction cycle
195
98 The salesman samples in the CSM are very small in number, often less than five pairs of shoes, because
they deal with buyers directly.
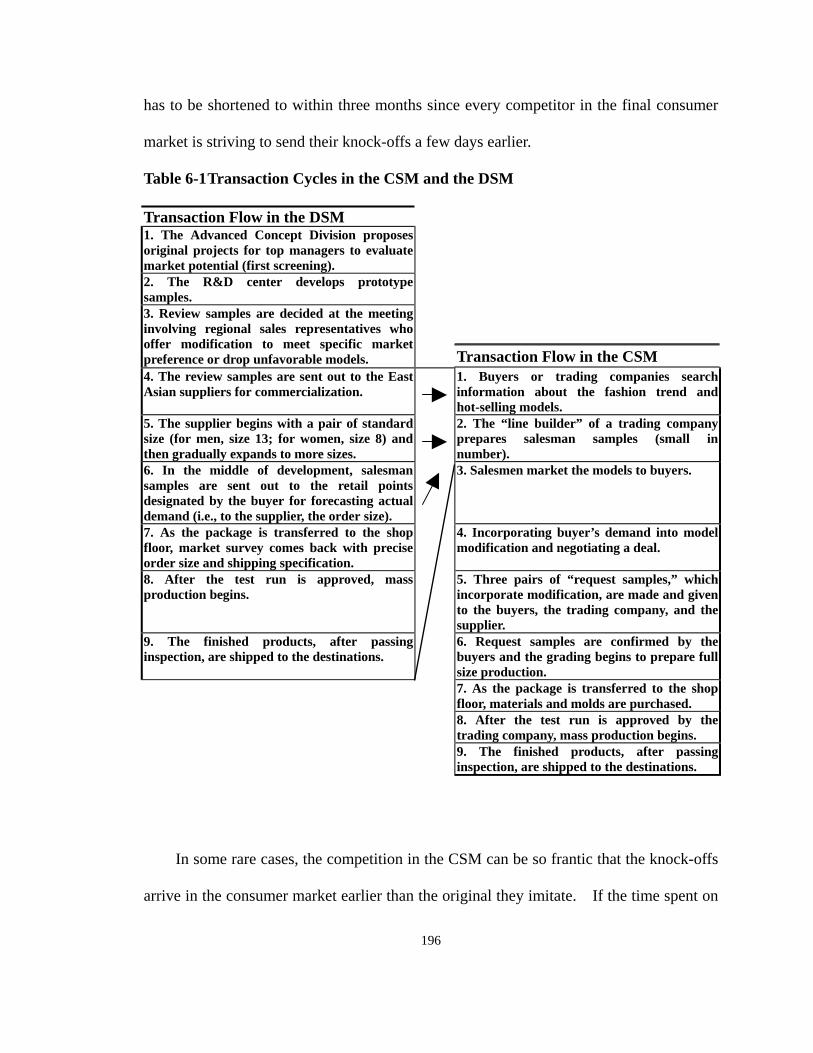
has to be shortened to within three months since every competitor in the final consumer
market is striving to send their knock-offs a few days earlier.
Table 6-1 Transaction Cycles in the CSM and the DSM
Transaction Flow in the DSM 1. The Advanced Concept Division proposes original projects for top managers to evaluate market potential (first screening).
2. The R&D center develops prototype samples.
3. Review samples are decided at the meeting involving regional sales representatives who offer modification to meet specific market preference or drop unfavorable models.
Transaction Flow in the CSM
4. The review samples are sent out to the East Asian suppliers for commercialization.
1. Buyers or trading companies search information about the fashion trend and hot-selling models.
5. The supplier begins with a pair of standard size (for men, size 13; for women, size 8) and then gradually expands to more sizes.
2. The “line builder” of a trading company prepares salesman samples (small in number).
6. In the middle of development, salesman samples are sent out to the retail points designated by the buyer for forecasting actual demand (i.e., to the supplier, the order size).
3. Salesmen market the models to buyers.
7. As the package is transferred to the shop floor, market survey comes back with precise order size and shipping specification.
4. Incorporating buyer’s demand into model modification and negotiating a deal.
8. After the test run is approved, mass production begins.
5. Three pairs of “request samples,” which incorporate modification, are made and given to the buyers, the trading company, and the supplier.
9. The finished products, after passing inspection, are shipped to the destinations.
6. Request samples are confirmed by the buyers and the grading begins to prepare full size production.
7. As the package is transferred to the shop floor, materials and molds are purchased.
8. After the test run is approved by the trading company, mass production begins.
9. The finished products, after passing inspection, are shipped to the destinations.
In some rare cases, the competition in the CSM can be so frantic that the knock-offs
arrive in the consumer market earlier than the original they imitate. If the time spent on
196

buyer searching and sample development are reduced enough and the DSM company
delays commercialization, a trading company can deliver the knock-offs at the same time,
or even earlier. The manager of a trading company reflects upon his experience: “I
thought that [early arrival] happened because they decided to do some changes in design
after the market survey and the project was therefore delayed.” But sooner is not always
better. The early arrival of knock-offs does not guarantee huge profits, and may even
result in losses. The reason is very simple: “because the market had not yet been stirred
up by the brand-name companies,” a development manager complains, “the shoes were
sitting there cold until the market warmed up months later.”
The fact that the CSM trading companies rush the knock-offs to market reveals the
culture of competition in the CSM. As a development manager told me: “You show off
your supplying capability to buyers by offering the newest models that are coming out.
It’s like chasing for exclusive news, no big deal for outsiders but a big pride for us.”
An ideal winning strategy for buyers in this competition is to place orders at the last
moment possible in order to make the right decision about which models to develop and
then make up the time lost in waiting by delivering the products to market as quickly as
possible. The dilemma is that if the model is chosen too late, the peak demand might be
missed. Shortening lead time is the only effective remedy for reducing that risk. The
reason why some Japanese trading companies are still sourcing shoes from Taiwan
provides another illustration of the competition on speed and timing. The flexibility of
the Taiwanese footwear production network in product development and manufacturing
has given Japanese buyers an advantage in placing orders late and therefore more precise
order arrangement in terms of size and style combination. This kind of lean sourcing
197
system can even offset costs incurred by minor adjustments that require air delivery.99
Our discussion also implies that the time saved by shortened lead time is to give the
buyer more leverage in selecting product line-ups, rather than to the hard-working
producer a safety net. The ability of Taiwanese producers to deliver quickly has
ironically created a tremendous challenge for them,100 because they are now forced to
assume greater risks because of the late placement of orders.
Risk, Timing of Exit, and the Use of Competition
Timing in withdrawal from the market is as important as bringing products to the
market. At the other end of the product demand curve, there is the problem of aburpt
drop in market demand caused by the massive supply of knock-offs. The risk can be
very serious when the market declines while the models are still being produced or
shipped. While firms in the DSM have CSM as their volume buffer, the strategy is far
less effective in the CSM. One effective way for CSM buyers to solve the inventory
problem is to sell the shoes at a discount, which cuts into their narrower profit margins.
Buyers at the product-market end of the chain are the earliest to sense market
shrinkage. Comparatively, OEM suppliers are in a passive position in responding to
unpredictable market demand. As a result, Taiwanese manufacturers gather market
information carefully, closely monitoring what happens to other suppliers. Information
99 Of course, the short distance between Taiwan and Japan is a necessary condition for this cooperation.
198
100 When an Italian midsole company established its Asian regional office in Taichung in 1994, the
company was surprised that Taiwanese footwear producers placed orders only two weeks before production.
“It has become a business convention,” the general manager of the company said,“in order to compete, we
finally set up a warehouse in China to speed up supply” (Informant MDG).
circulates very fast in the dense production network of the Taiwanese footwear industry
also partly due to the need of mutual monitoring.
Although buyers adopt forecasting techniques in placing orders, the uncertainty in
predicting demand and the danger of over-supply are unavoidable. A basic method to
reduce possible damage is to divide orders for a model into sequences of small orders so
that the loss, if any, can be minimized. Another concern for speed is in pulling out of
the market as soon as possible when decline becomes evident. An obvious way for
buyers to avoid receiving shoes destined to contribute to inventory problems is to stop
them from ever arriving.
One result of the volatile market is that while push-backs are rare in the DSM, they
are not at all unusual in the CSM.101 When a buyer pushes an order back, the damage it
inflicts on the supplier is more serious in the CSM because the order might well be
already in production. When that happens, the Taiwanese supplier must quickly pull the
model out of the assembly flow, try to push back materials that are ordered, find an
inventory space for the finished and unfinished goods, replace the opened space in the
production schedule with new models, and finally swallow the inventory costs. As I
have mentioned in Chapter 4, flexibly juggling fragmented orders and production space
has been business-as-usual for Taiwanese producers.
It is in the context of this market uncertainty that I often heard CSM suppliers
complain about buyers playing “dirty tricks” through push-backs and “unreasonable”
inspection to reduce loss. We are not in a position to judge the accuracy of these
charges, but one non-technical reason suppliers give is worth hearing:
199101 “Push-back” refers to a buyer’s delay of the shipping date of an order.
Rejection tends to happen in reorders, same as push-back. Experience taught
us that as the number of reorders increases, the rejection of shoes becomes
more likely. We are sometimes timid in accepting reorders because the
finished shoes are very easily rejected. This is ridiculous because as time goes
by, we are getting more experienced in producing the model. It makes no
sense to have these shoes rejected.
In the CSM, in contrast to the grading system in the DSM, the standard method of
inspection is an “all-or-nothing” system. Certain pairs of shoes are randomly picked
from a batch of orders and then inspected for defects to see if they meet the agreed
percentage of allowance. The whole order of shoes will then be either rejected or
accepted. This makes inspection a point of constant tension (and negotiation) between
buyers and suppliers.
The concern for managing risk and uncertainty can be observed in how the sourcing
channels are arranged by buyers as well. Indirect procurement through trading
companies is the most common sourcing strategy for buyers in the CSM. Why is
indirect procurement, in which a buyer needs to share profits with intermediate trading
companies, much more popular in the CSM than in the DSM? The most common
explanation for direct procurement would be the small scale of orders. In other words,
buyers rely on trading companies only when the order is small and, once the volume
reaches a certain scale, they take it back to save overhead. The evidence falsifies this
hypothesis because big buyers in the CSM source the majority of their supply through
indirect channels. Since these companies also have long-established regional offices in
Taiwan, the related hypothesis that it takes time to get acquainted with the local
200
environment cannot be sustained either. Buyers certainly rely on the competitive assets
of trading companies to coordinate supply with their industry specific knowledge and
local manufacturing networks. However, it is uncertainty in transaction which underlies
the practice of indirect sourcing, not an increase in scale shifting the cost margin.
To further substantiate this argument, a more interesting question to ask is: what
kind of orders do buyers place through indirect channels? What do they reserve for
their own direct procurement? An intuitive answer might be that buyers will keep
orders with higher value-added to themselves since the overhead for direct procurement
is relatively fixed. None of the buyers I interviewed agreed with this projection.
Indeed, their answer is the opposite. The general manager of company P gives a
representative answer:
We place orders directly only for those models that are easy to make and have
less propensity for defects. These orders are however often big in volume but
low in marginal profit. We have the majority of orders go through trading
companies because they are good at developing new models and solving
problems that can easily occur in more complex models. Placing orders
through trading companies avoids risk. Unlike models developed ourselves, we
can just reject the shoes if they don’t meet our quality demand. (Informant BP3)
It is not difficult to understand now why almost all the buyers I interviewed in the
CSM consciously avoid exclusivity in managing their supply. Risk aversion and
maintaining flexibility are the most common reasons they mentioned. Internally, the
pressure to develop transaction-specific assets to ensure task-transition is far lower, and
externally, the unpredictable drop in demand and smaller inventory buffer constitutes an
201

endemic disturbance to stable supplying relationships. Such a market ideology, which
emphasizes undedicated market relationships and the advantage of allowing firms to
switch transacting parties freely, is common in the CSM. A typical example of this is
recorded in the following interview
Why don’t we develop stable suppliers? You must know that the price will
inevitably be raised as the business becomes a routine. When you are
expected to continue the business, you are no longer free to cut the price as
much as you want because of the obligations that come out of personal
contacts. Competition is the only way to improve the capability of producers.
Suppliers would be spoiled if you give any hint of order assurance. Business
is business.
Coordination uncertainty and transaction organization in the real market, however,
do not follow this market ideology. A business strategy book about international
sourcing gives a practical suggestion: “The buyer has far more economic leverage than
many buyers themselves sense. The sales function legitimately seeks to cut out
competition. Yet the essence of buying is to create and use competition among sellers!”
(Pooler 1992: xv, italics original).
An excellent example of this was provided by a former employee of a big buyer who
told me a strategic move that his supervisor was proud of. Months after Taiwanese
businessmen were encouraged by buyers to set up factories in China, the manager,
knowing that the first movers had been enjoying lucrative profits by cheap labor, took
drastic measures to announce price cuts up to half of the original level. In anticipating
resistance, he admitted that he was not sure at the time if gradual adjustments would be a
202
better strategy since the shift of production site had given producers new leverage in the
market. The degree of competition among Taiwanese producers at that new price level
was not any explicit and therefore the buyer was in risk of embarrassing himself by
having to lift the price up again, which would hurt the company’s future negotiations.
To ensure success after his announcement, the manager spread rumors to Taiwanese
firms in Fu-Jian province that firms in Guang-Dong province102 had secretly accepted
the new price, and vice versa. Whether or not to trust a competitor’s assurance that it
had rejected the offer constituted an immediate challenge to Taiwanese producers who
tried to resist the price cuts. Besides, there were also difficulty to ascertaining whether
any unacquainted firms had accepted the offer. The original price level collapsed after a
while of struggle and the manager whose courageous move saved the company tons of
money was rewarded with a promotion. The bidding information in the networked
market is not as open and transparent as in the neo-classical economics’ auction model.
It was the holes in the cross-cutting production networks and the difficulties for
producers in verifying information that allowed the buyer to take advantages of
competition. Competition, in the networked market, is a social arrangement subject to
strategic considerations because the ways economic agents transact business also shape
the environment of the transactions.
The market ideology also underestimates the necessity for transaction coordination
in the CSM. The evolution of Payless ShoeSource’s quality assurance measures is a
good example to illustrate this point. A company that claims to “pursue price
elasticity,” Payless ShoeSource has never sought to build core supplying factories as
203102 I will analyze the offshore investments of Taiwanese footwear producers in the following two chapters.

buyers in the DSM have done. Its quality assurance system was first based on
standardization codified in a heavy volume, “the quality assurance manual,” which
specifies every detail of a transaction.103 This is a reasonable step for a buyer who has a
large number of undedicated suppliers. However, the effects of the system were
disappointing, explained a manager, because “suppliers forgot our standard even after we
stopped placing order to them for just once.” The problem was bearable when the
quality assurance department of Payless only needed to deal with suppliers of direct
orders. When the indirect orders were incorporated into the quality assurance process,
the system started to suffer from overburden and transactions were slowed.
In 1991, Payless ShoeSource launched a new “green seal” system.104 It gave the
Green Seal certification to the upstream material suppliers who passed examination and
were qualified according to the standard set by Payless. The explanations that the
quality assurance manager gave about the execution of the system show the careful
positioning of Payless in the marketplace. When asked if materials from green seal
suppliers are mandatory to its footwear suppliers, the answer was “no” because “if we
made that a necessity then the material suppliers will have upper hands in the market and
the imbalance will finally lead to increasing costs.” However, how did Payless
ShoeSource make the Green Seal certification an incentive and, most importantly, assure
its application in the footwear production sector? “We can either give those who use
green seal materials a faster and easier inspection or prolong the inspection process for
those who don’t. No firms can stand up to that for too long.” Another advantage of
103 It was called “the Payless Bible” by Taiwanese footwear producers.
204104 The system was adopted from the quality control certification system developed in Japan.
the system, the manager reminded me, is that we are now enjoying an authoritative
position in the marketplace and can judge the controversies about whether a rejected
order is due to material defects. Again, the advantage of market competition is
generated by the holes that separate firms that a buyer deals with simultaneously.
Quick Response and Cushion Nets in Overlapping Networks
The networks that connect trading companies and footwear producers reside the core
of transaction coordination in the CSM. Interestingly, if we examine the sector, not only
is information closure less needed in the CSM, horizontal cooperation among competing
firms is quite common, often with mediating help from trading companies. Trading
companies do not only mediate transactions between buyers and suppliers; they also play
an active role in facilitating cooperative interactions among manufacturers.
We have just discussed that buyers in the CSM prefer indirect sourcing because that
helps them to reduce risk and increase flexibility. Most manufacturers also prefer doing
business with trading companies. The supplier’s perception about the profit margin of
direct orders received from buyers is congruent with my interview of buyers. To them,
direct orders from buyers are no better, perhaps worse, than those made through trading
companies. A more important reason for their preference, however, is the role of
intermediate trading companies in dampening the impact of market fluctuation. Trading
companies play a critical role in the CSM by helping both buyer and supplier to carry out
the transaction more smoothly.
The difference between a trading company and a buyer is obvious if we notice their
position in the footwear commodity chain. Manufacturers sense the difference probably
205
most clearly by their contact with inspectors, who are closest to shop-floor manufacturing.
The inspector of a trading company demonstrates the difference:
Not all inspectors are the same. If the inspector of a buyer105 never blocks
orders from shipping, his boss might suspect that he is not controlling the
quality. For us, even if we just stop a few orders from shipping, our boss
would get mad at us that we haven’t done what we are expected to do to get the
products to the buyer. Sometimes, I felt more eager to ship the products than
the producers. I often said to the manufacturers that we are here to help, not
to make trouble. (Informant BD2)
A manufacturer with a trusting relationship with a trading company could largely
stabilize its environment because an order lost to one buyer can be compensated by
another buyer’s order provided by the trading company. To facilitate long-lasting
relationships, the risk-taking Taiwanese producers often take the first step to solve
transaction problems (e.g., product rejection) to demonstrate their sincerity and
commitment to the trading company. By basing the mutual trust on a longer-term
common interest, the obligational exchanges between Taiwanese producers and their
trading partners function as a mechanism buffering uncertainty and cushioning risk in the
volatile environment of the CSM. The potential frictions between buyers and producers
are also systematically reduced by the intermediate role of trading companies.
Ather dimension of cooperative networking is frequently observed among
competing Taiwanese manufacturers. The reciprocal exchange between Taiwanese
206
105 Payless ShoeSource calls their inspectors “quality assurance representatives” to differentiate from
inspectors of the trading companies.
CSM suppliers reveals further how those small-to-medium-sized firms are able to
develop and deliver products quickly. For example, a pair of outsole molds costs about
US$ 1,800 to a supplier, meaning that a set of five sizes will cost about US$ 9,000. To
save time and money in making outsoles and to keep their fixed costs low, Taiwanese
footwear factories often borrow outsoles from their potential competitors whose current
production needs do call for them. The expectation of reciprocity also obliges the
borrower to return the favor when asked. The networking of mutual help among
Taiwanese footwear producers through the use of substitutable components or materials
that are readily available fits well with the design strategy in the CSM which we
discussed earlier. Trading companies that travel between suppliers are very active in
facilitating this kind of give-and-take relationship when they find that diau-jie (dispatch
and borrowing) of materials and components is necessary. People in the Taiwanese
footwear district describe competition as “seizing orders at the first instance”
(chiun-dun-tz). The ability to diau-jie materials from other factories when needed is an
indispensable condition for Taiwanese firms to chiun-dun-tz when the opportunity for
OEM emerges.
Diau-jie is not only limited to the borrowing of material goods; space in the
assembly schedule is also open for reciprocal exchanges. There are many contingencies
that might interrupt an assembly schedule: delay of material preparation in the
pre-production stage, push-orders that must wait in hold, rush re-orders to demonstrate
customer courting, and many technical problems that stall production. Taiwanese
production managers commonly move various models of different sizes around the tight
“space” in the production schedule, deciding whether to “let a model flow” or “pull a size
207
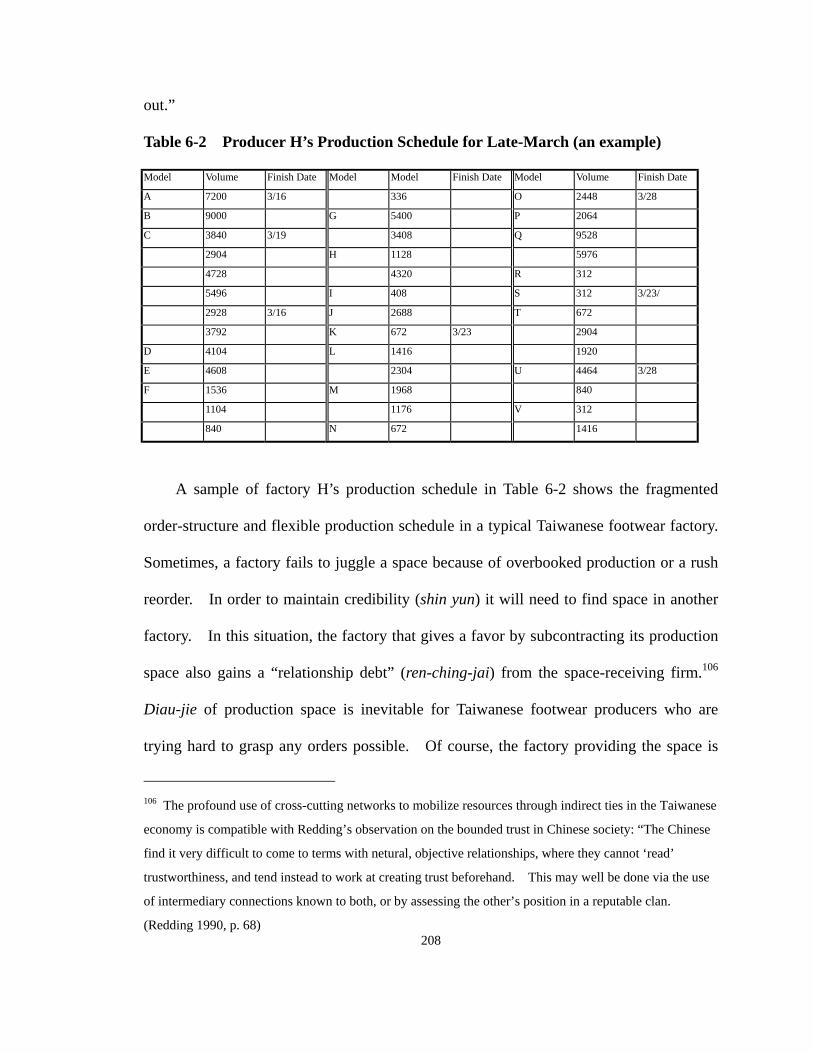
out.”
Table 6-2 Producer H’s Production Schedule for Late-March (an example)
Model Volume Finish Date Model Model Finish Date Model Volume Finish Date
A 7200 3/16 336 O 2448 3/28
B 9000 G 5400 P 2064
C 3840 3/19 3408 Q 9528
2904 H 1128 5976
4728 4320 R 312
5496 I 408 S 312 3/23/
2928 3/16 J 2688 T 672
3792 K 672 3/23 2904
D 4104 L 1416 1920
E 4608 2304 U 4464 3/28
F 1536 M 1968 840
1104 1176 V 312
840 N 672 1416
A sample of factory H’s production schedule in Table 6-2 shows the fragmented
order-structure and flexible production schedule in a typical Taiwanese footwear factory.
Sometimes, a factory fails to juggle a space because of overbooked production or a rush
reorder. In order to maintain credibility (shin yun) it will need to find space in another
factory. In this situation, the factory that gives a favor by subcontracting its production
space also gains a “relationship debt” (ren-ching-jai) from the space-receiving firm.106
Diau-jie of production space is inevitable for Taiwanese footwear producers who are
trying hard to grasp any orders possible. Of course, the factory providing the space is
208
106 The profound use of cross-cutting networks to mobilize resources through indirect ties in the Taiwanese
economy is compatible with Redding’s observation on the bounded trust in Chinese society: “The Chinese
find it very difficult to come to terms with netural, objective relationships, where they cannot ‘read’
trustworthiness, and tend instead to work at creating trust beforehand. This may well be done via the use
of intermediary connections known to both, or by assessing the other’s position in a reputable clan.
(Redding 1990, p. 68)
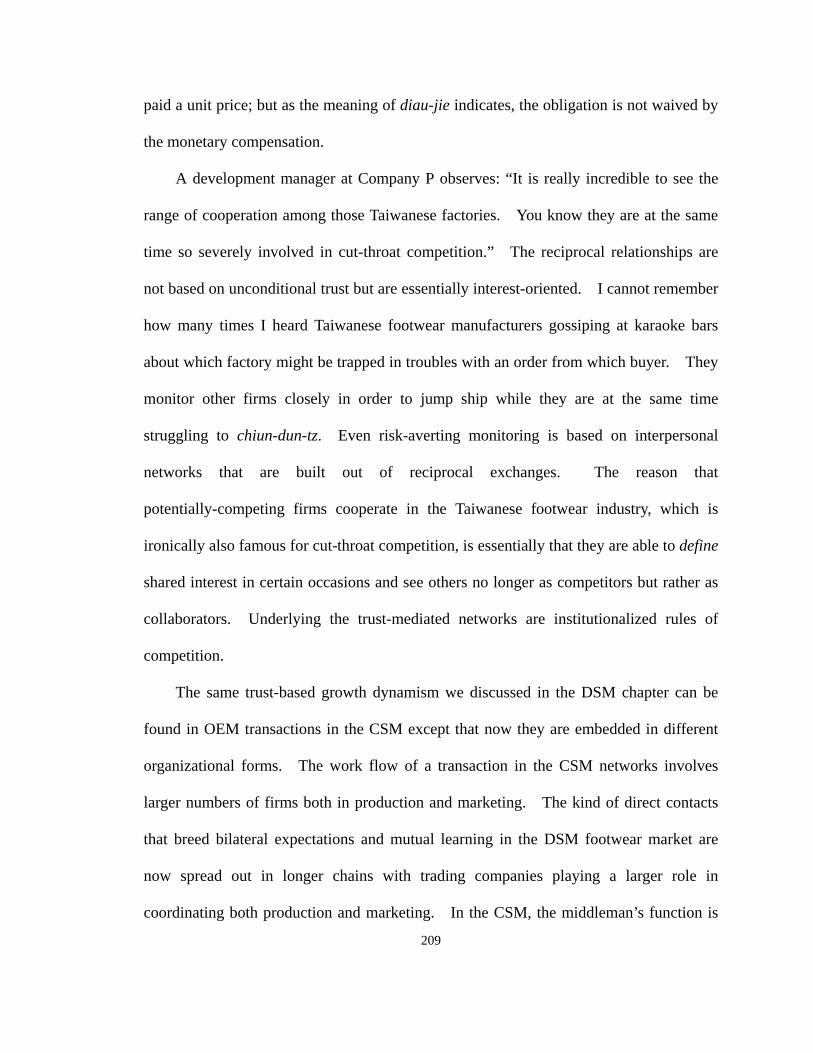
paid a unit price; but as the meaning of diau-jie indicates, the obligation is not waived by
the monetary compensation.
A development manager at Company P observes: “It is really incredible to see the
range of cooperation among those Taiwanese factories. You know they are at the same
time so severely involved in cut-throat competition.” The reciprocal relationships are
not based on unconditional trust but are essentially interest-oriented. I cannot remember
how many times I heard Taiwanese footwear manufacturers gossiping at karaoke bars
about which factory might be trapped in troubles with an order from which buyer. They
monitor other firms closely in order to jump ship while they are at the same time
struggling to chiun-dun-tz. Even risk-averting monitoring is based on interpersonal
networks that are built out of reciprocal exchanges. The reason that
potentially-competing firms cooperate in the Taiwanese footwear industry, which is
ironically also famous for cut-throat competition, is essentially that they are able to define
shared interest in certain occasions and see others no longer as competitors but rather as
collaborators. Underlying the trust-mediated networks are institutionalized rules of
competition.
The same trust-based growth dynamism we discussed in the DSM chapter can be
found in OEM transactions in the CSM except that now they are embedded in different
organizational forms. The work flow of a transaction in the CSM networks involves
larger numbers of firms both in production and marketing. The kind of direct contacts
that breed bilateral expectations and mutual learning in the DSM footwear market are
now spread out in longer chains with trading companies playing a larger role in
coordinating both production and marketing. In the CSM, the middleman’s function is
209
specialized in a differentiated sector of chains, instead of incorporated into the
overlapping organizational boundaries between suppliers or buyers. From the
manufacturing firms’ point of view, they are also involved with a small number of trading
companies, although exclusivity is clearly avoided. The CSM is no less a
trust-mediated network.
From a global perspective, not only are the buyers in the CSM supported by a
buffering mechanism in the production network behind them, but the turnover rates of
capital in the all-Taiwanese production networks are largely enhanced, which is vital to
the survival of the small and medium-sized Taiwanese factories. Instead of managing
information in an enclosed network space, the information flow in the CSM constitutes
an open but still socially-networked system.
210
PART III
INDUSTRY INTERNATIONALIZATION
(1987-1995)
211
Chapter 7 Institutional Embeddedness of FDI in China
The previous four chapters in Part II investigate the production and marketing
networks of the Taiwanese footwear industry from both historical and structural
perspectives. They also illustrate how the best-performing footwear industry operated
in its peak years. Since the late 1980s, the industry has entered a turbulent era, as the
result of the convergence of several disadvantageous conditions. Some companies
courageously developed their own brands, some struggled to upgrade to higher
value-added niches, and most firms moved their production offshore to reduce labor
costs.107 These strategies are not mutually exclusive. Indeed, a balanced mix of these
strategies is a key to success. Overseas investment is the strategy shared by almost all
the surviving footwear manufacturers. Footwear exports from Taiwan declined rapidly
when overseas assembly lines started to operate. China became the new powerhouse for
footwear exports, largely benefitting from direct Taiwanese investment.
The story of the Taiwanese footwear industry did not end there. Another chapter
unfolded when new Taiwanese industrial districts were constructed on foreign lands with
107 There are not many Taiwanese footwear factories who tried to build their own brand names.
Hongsong is a rare one that has successfully established its own brands. Hongson was a
trading company before it started promoting its own brand (e.g., Travel Fox). It has never
been a footwear producer and now maintains several long-standing suppliers each one
specializing in one or two brand lines. Jun-Tai is the only Taiwanese footwear producer
who clearly targeted on promoting its own brand of athletic shoes (i.e., ProMarx). It is
also the supplier for Hongsong’s athletic shoe line (i.e., Jump). Jun-Tai, a model factory
highly praised by MOEA, unexpectedly went into bankruptcy at the end of 1995, a shock to
the whole industry community. The end of Jun-Tai’s courageous trial signals the tremendous
difficulties of the OBM (original brandname manufacturing) strategy.
212
different institutional infrastructures. Labor was now controlled and used in a new
fashion. Buyers (especially those in the CSM) stayed in Taiwan, despite the massive
production migration of their suppliers. In the mid-1990s, a new regional division of
labor had clearly emerged as a result of the multilateral adjustments.
If the densely-connected production network and well-coordinated marketing
networks, both endowed with localized reciprocal exchanges, are the driving forces of the
Taiwanese footwear industry, what happens when production sites move offshore? How
do firms in the networks adjust their relationships to survive? During the network
restructuring, some features of the networks obviously disappeared and at the same time
new elements were articulated. The environmental challenges and consequent network
restructuring provide us with a kind of natural experiment to test and further substantiate
our previous analysis of the historical development and structural dynamism of the most
competitive OEM chains in world footwear industry.
The current chapter deals with the restructuring of new footwear production
networks in China. After a brief introduction on the industrial crisis and offshore
investment of the Taiwanese footwear industry, three major dimensions of the
restructuring processes are discussed. The institutional embeddedness of local linkage
of Taiwanese footwear investments shows the disparity between the policy design of the
Chinese government and the actual results of local economic development in Dong-Guan
City, where the Taiwanese built their shoe nest.
The second dimension of restructuring is building a labor regime in China for
footwear production, which involves both the institutional environment of labor supply
and firm strategies for making most out of the social character of cheap labor (e.g.,
213
regionalism of out-province labor). Putting out subcontracting, widely practiced in
Taiwan is now discarded in China, proving that the subcontracting system is more of a
contingent than a necessary component of Taiwanese footwear production, although the
contribution of subcontracting in Taiwan is undeniable. It is not only that the flexibility
is now preserved in-house, but cheap labor is used in ways that both upgrade the quality
of footwear output and shorten the transition time.
The final dimension is about the restructuring of networks among Taiwanese
producers. The various manifestations of network closedness and its underlying causes
are discussed. The networks constitute an enclave economy that is composed of
trust-mediated transactions among Taiwanese who exchange market and technical
information extensively. As we learned in the previous chapters, it is to this dimension
of production restructuring that we must turn in the wider spectrum of commodity chain
restructuring, which sees marketing and production networks as a single integrated
process.
Industrial Crisis of the Taiwanese Footwear Industry
The Taiwanese footwear industry reached its peak performing year in 1986 in terms
of export volume, and in 1988 in terms of value. If we consider the import volume
share of the U.S. footwear market, Taiwan reached the top position in 1987. Before
1987, the export performance of the Taiwanese went in waves of cycles. For example,
1984 was a dismal year because buyers rushed large orders early in the year in
anticipating quota protection and the expanding demand fueled by the Los Angeles
Olympic Games, but later shrank orders when demand proved sluggish and the
214

protectionism was aborted. About 200 factories went out of business after what
Taiwanese producers called “the Storm of 84.” Many of them were new entrants after
OMA. This is not difficult to understand. They had less-developed business
relationships with buyers (TFMA 1991, p.47).
Then came the best year (1987) in Taiwanese footwear history, when American
retailers finally cleared up their inventory and placed large orders again. However, it
turned out to be the beginning of another storm; this time a domestic one. Since 1987,
the overall pattern has been decline. Footwear exports from Taiwan have never
recovered, as witnessed by the decreasing number of export factories. When I left
Taiwan in 1995, there were about five hundred footwear factories and the majority of
them were supplying for the domestic market. Among the exporting factories, about ten
were exporting women’s shoes for the Japanese market. The closeness to the Japanese
market, production flexibility, and long-term commitment are giving Taiwanese footwear
exports to Japan an advantage that will not be matched by other countries in the near
future.
About ten athletic shoe factories were still producing shoes in Taiwan in 1995.
Among them, long time rivals Feng-Tay and Pou-Chen are the two leading firms who
have successfully developed into regionally-operated business groups making the world’s
best athletic shoes. Other factories are of three kinds. Jun-Tai tried to build its own
brand names but was suffocated by limited cash flow created by simultaneously pursuing
the three strategies mentioned earlier.108 Shan-Ron focused on making specialized items,
215
108 They are developing one’s own brand, upgrading to higher value-added niches, and pursuing

like working shoes, whose high unit price sustained its operation in Taiwan. The final
group of firms, like Jon-Chun, kept a small number of assembly lines operating to buffer
European restraint on Chinese footwear imports and backed up the unstable production of
its new Indonesian factory. Most of firms that remained rely on upper supplies from
their foreign subsidiary factories to save costs.
What were the environmental changes that led to the dramatic decline? After the
expiration of OMA, the American footwear producer’s association maintained the
pressure to impose the Special 301 tax sanction, or any forms of quota restrictions.
Protectionist legislation was introduced in 1982, 1984, 1985, 1986, and 1988. These
efforts were all vetoed by President Reagan. Although the crisis did not come to a head,
it did disturb OEM transactions, creating uncertainty and leading to miscalculation,
culminating in the disaster of 1984. American buyers began to reconsider their sourcing
arrangements. We will come back to buyers’ reactions in Chapter 8 when we discuss
changes in marketing networks in the 1990s.
A more serious blow was the abrupt appreciation of Taiwanese currency beginning
in 1986. Under pressure from the American government to reduce trade deficits, the
Taiwanese government decided to lift exchange rate controls. The exchange rate of
New Taiwanese dollars against US dollars was 40:1 at the beginning of the shock and
rose quickly to a historic height of 28:1 in a year. In 1987 alone, the scale of
appreciation was about 42 percent (see Table 7-1). Taiwanese footwear producers were
forced to swallow the increased costs and at best negotiate with trading companies to
share some loss. 1987 was therefore a clear dividing line that separated the two periods offshore production.
216
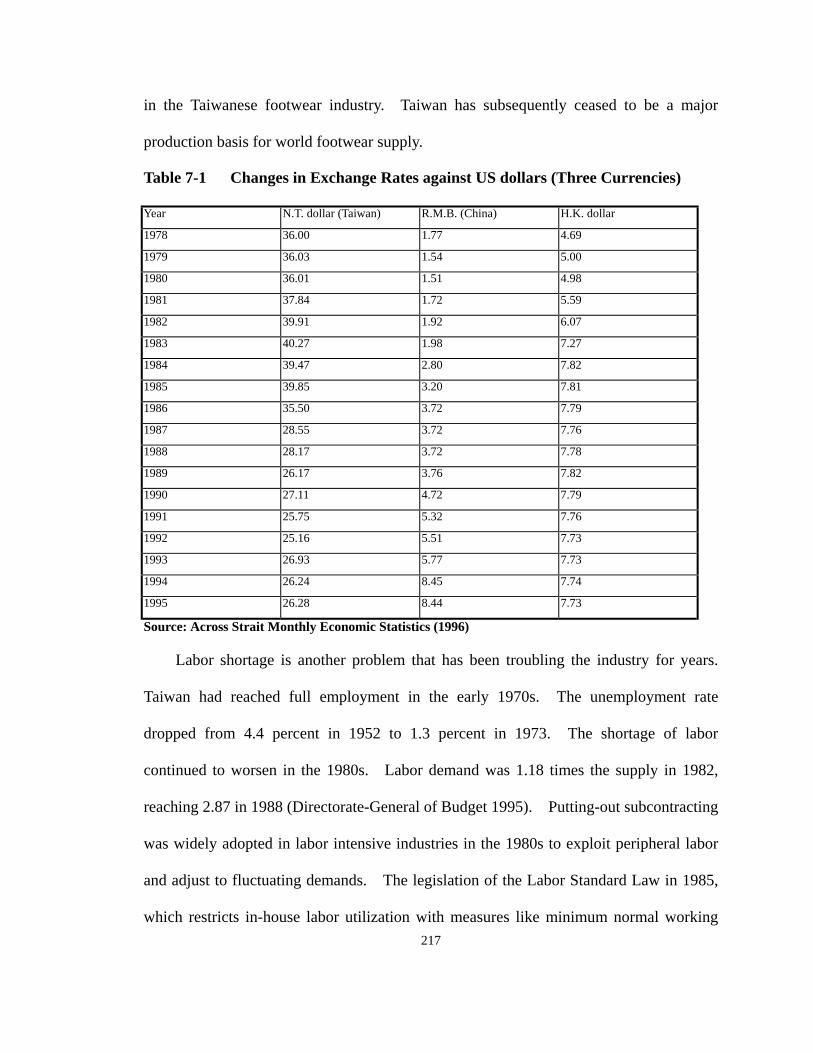
in the Taiwanese footwear industry. Taiwan has subsequently ceased to be a major
production basis for world footwear supply.
Table 7-1 Changes in Exchange Rates against US dollars (Three Currencies)
Year N.T. dollar (Taiwan) R.M.B. (China) H.K. dollar
1978 36.00 1.77 4.69
1979 36.03 1.54 5.00
1980 36.01 1.51 4.98
1981 37.84 1.72 5.59
1982 39.91 1.92 6.07
1983 40.27 1.98 7.27
1984 39.47 2.80 7.82
1985 39.85 3.20 7.81
1986 35.50 3.72 7.79
1987 28.55 3.72 7.76
1988 28.17 3.72 7.78
1989 26.17 3.76 7.82
1990 27.11 4.72 7.79
1991 25.75 5.32 7.76
1992 25.16 5.51 7.73
1993 26.93 5.77 7.73
1994 26.24 8.45 7.74
1995 26.28 8.44 7.73
Source: Across Strait Monthly Economic Statistics (1996)
Labor shortage is another problem that has been troubling the industry for years.
Taiwan had reached full employment in the early 1970s. The unemployment rate
dropped from 4.4 percent in 1952 to 1.3 percent in 1973. The shortage of labor
continued to worsen in the 1980s. Labor demand was 1.18 times the supply in 1982,
reaching 2.87 in 1988 (Directorate-General of Budget 1995). Putting-out subcontracting
was widely adopted in labor intensive industries in the 1980s to exploit peripheral labor
and adjust to fluctuating demands. The legislation of the Labor Standard Law in 1985,
which restricts in-house labor utilization with measures like minimum normal working 217

hours and overtime work, gave further incentive for informalization. The Labor Affair
Committee’s 1988 survey shows that out-factory subcontracted labor constituted 2.5% of
total employees in 1981 and increased to 7.0% in 1987 (China Times, 1-22-1988).
Most steps in footwear production rely on manual labor. Automated manufacturing
has never been realistic in mass production. The money footwear factories paid for
subcontracted labor was not significantly less than what they paid if production carried
in-house. The true function of the subcontracting system was the flexible expansion of
scale when demand increases and the subcontractor’s capability to maintain a reserve of
peripheral labor when not in need. Subcontracting is not simply for the sake of saving
static labor costs. After 1987, footwear factories could not even fill up their own labor
requirement for final assembly, which is the part difficult to farm out, under the wage
level capped by currency appreciation. In response, they increased in-house flexibility
by rotating jobs, including the putting-out work that was taken back, around the floor to
make production run smothly.
The footwear subcontractors I interviewed noted that their business started to shrink
after about 1988. Orders were dramatically reduced despite their capability to continue
managing labor supply. This time footwear subcontractors in Taiwan did not have
another prosperous year waiting in the next cycle. Footwear assembly factories were
moving swiftly to neighboring countries to take advantage of cheap and abundant labor.
Offshore investment became imperative and even those few factories that managed to
stay could not guarantee continued growth without offshore production. Most of the
subcontractors closed down. Some moved overseas along with their principal factories.
When the currency appreciation crisis hit the industry, labor shortage became a serious
218
problem because it inhibited adjustment for Taiwanese footwear producers, especially
those who kept certain production scale in Taiwan. Feng-Tay, said to be the best athletic
shoe factory in the world, had to offer part time jobs to students to fill vacancies.
Pou-Chen, the world’s largest athletic production group, now relies heavily on foreign
labor for its Taiwan factories.
Searching for a “Second Spring” in China
China had the cheapest labor and, potentially, the most lucrative market in East Asia.
Some Taiwanese footwear producers did establish factories in China before 1987, but
only a few. The political tension between the two countries discouraged Taiwanese
footwear producers from making large scale investment. The Taiwanese government’s
decision in 1987 to lift restrictions on private visits to China altered the situation. In the
next year, pressured by the labor-intensive industries suffering from currency
appreciation, the Taiwanese government formally allowed indirect investment in China.
By 1993, US$ 10 billion had been invested in China by Taiwanese entrepreneurs, making
Taiwan the number two investor in China, second only to Hong Kong. Taiwanese
footwear producers were scrambling to enjoy what they called the “Second Spring” in
China, after a bitter winter storm. The industry was leading the first wave of overseas
investments in Taiwanese history.
Smaller footwear factories making women’s shoes were the first to invest in China.
They preferred the Fu-Jian province, directly across the Taiwan Strait where people spoke
219
the same dialect as the Taiwanese.109 Although Guang-Dong province is a better place
for easy transportation (because Hong Kong is adjacent and direct shipment from Fu-Jian
is prohibited), language closeness, cultural affinity and the prospect of an end to the ban
on cross-strait shipping were the major reasons that these first wave factories invested in
Fu-Jian (see Map 1-1).
Subsequent investments concentrated increasingly in the Pearl River Delta of
Guang-Dong Province. Among the 103 factories reporting investment in China in a
1989 survey, 65 went to Guang-Dong and 27 to Fu-Jian (TFMA 1990). In Fu-Jian,
Taiwanese footwear producers are clustered around the Pu-Tien township (see Map 1-1).
In Guang-Dong province, the Taiwanese footwear industrial district is centered around
Dong-Guan City, which is located between Shen-Zhen City, the special economic zone
right next to Hong Kong, and Guang-Zhou City, the capital of Guang-Dong Province (see
Map 7-1).
There are various estimates of the number of Taiwanese footwear factories in
China. The data we used earlier tend to underestimate the numbers because they were
gathered in Taiwan early in 1989. A 1992 report based on an on-site industry study in
Guang-Dong estimates over 500 Taiwanese footwear factories in China, including about
400 factories in Guang-Dong and about 100 in Fu-Jian. About half of the firms in
Guang-Dong are concentrated in Dong-Guan, the new Taiwanese “shoe nest” (MAC
1992).
How much do Taiwanese footwear factories contribute to Chinese exports? The
estimates I have heard range from 80 to 90 percent. I support the higher percentage 109 Most ancestors of Taiwanese were immigrants from the Fu-Jen province of China.
220

even after trying to calculate conservatively based on more concrete data. If we take
two production lines as the average size of Taiwanese footwear factories (i.e., 800 lines in
Guang-Dong), 2,000 pairs of shoes are the daily output, and, based on data on Table 8-1
(85% as the percentage of exports), we have a daily export volume of about 1,360,000
pairs for Taiwanese footwear factories in Guang-Dong. Supposing 25 working days per
month, Taiwanese footwear factories in Guang-Dong contribute about 408 million pairs a
year to footwear exports. In 1994, the total footwear exports out of Guang-Dong were
480 million pairs (see Table 7-3) which means that the Taiwanese have overwhelming
control of about 85 percent of the largest base of Chinese footwear exports. It is
important to note that two production lines, 25 days a month, and 2,000 pairs of daily
output are all underestimated figures for the actual operation of Taiwanese footwear
factories in China.
Dong-Guan: the Taiwanese Shoe Nest in China
China launched its economic reforms in 1978. It started with agricultural reform,
ending collective farming and allowing collectively or privately-owned rural enterprises.
Next the Chinese government decentralized its fiscal and investment policies, giving
local authorities more leverage in developing the local economy. The decentralization
of the Chinese political economy has resulted in a new form of foreign direct investment
in which foreign investors negotiate with local governments, especially below the
province level, instead of with the central government (Hsing 1993). The effect of
economic decentralization is captured more precisely and comprehensively in the
221
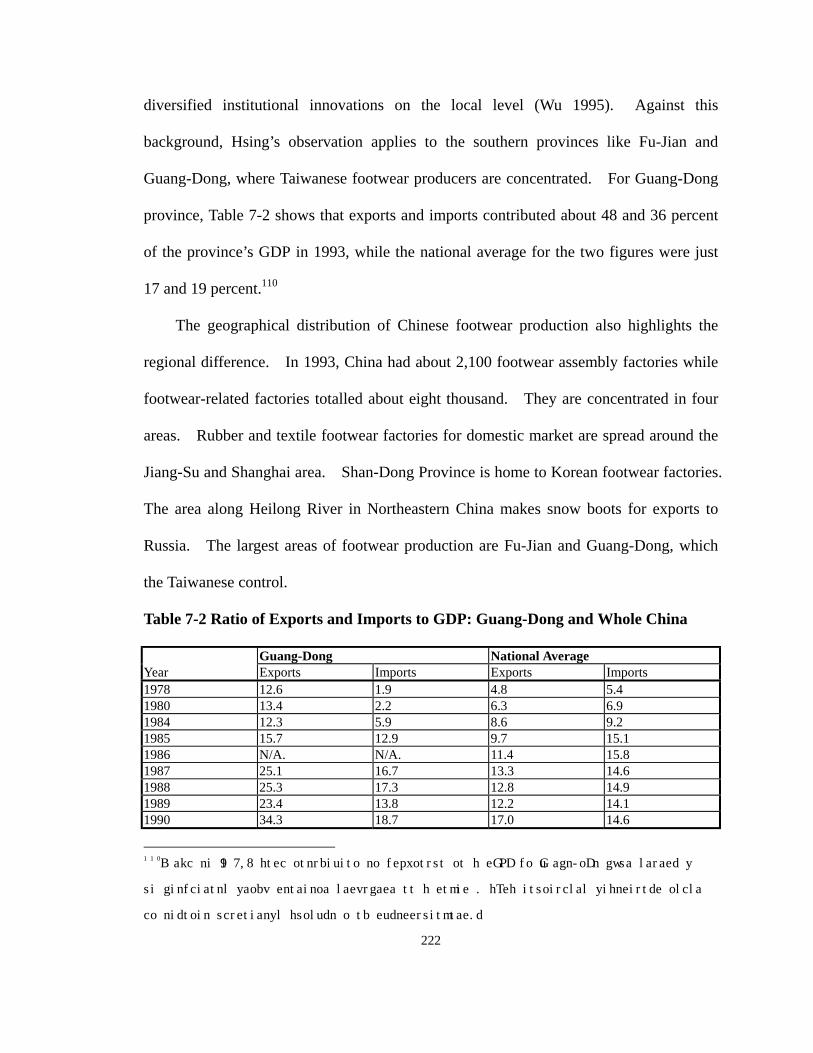
diversified institutional innovations on the local level (Wu 1995). Against this
background, Hsing’s observation applies to the southern provinces like Fu-Jian and
Guang-Dong, where Taiwanese footwear producers are concentrated. For Guang-Dong
province, Table 7-2 shows that exports and imports contributed about 48 and 36 percent
of the province’s GDP in 1993, while the national average for the two figures were just
17 and 19 percent.110
The geographical distribution of Chinese footwear production also highlights the
regional difference. In 1993, China had about 2,100 footwear assembly factories while
footwear-related factories totalled about eight thousand. They are concentrated in four
areas. Rubber and textile footwear factories for domestic market are spread around the
Jiang-Su and Shanghai area. Shan-Dong Province is home to Korean footwear factories.
The area along Heilong River in Northeastern China makes snow boots for exports to
Russia. The largest areas of footwear production are Fu-Jian and Guang-Dong, which
the Taiwanese control.
Table 7-2 Ratio of Exports and Imports to GDP: Guang-Dong and Whole China
Guang-Dong National Average Year Exports Imports Exports Imports 1978 12.6 1.9 4.8 5.4 1980 13.4 2.2 6.3 6.9 1984 12.3 5.9 8.6 9.2 1985 15.7 12.9 9.7 15.1 1986 N/A. N/A. 11.4 15.8 1987 25.1 16.7 13.3 14.6 1988 25.3 17.3 12.8 14.9 1989 23.4 13.8 12.2 14.1 1990 34.3 18.7 17.0 14.6
110 Back in 1978, the contribution of exports to the GDP of Guang-Dong was already
significantly above national average at the time. The historically inherited local
conditions certainly should not be underestimated.
222
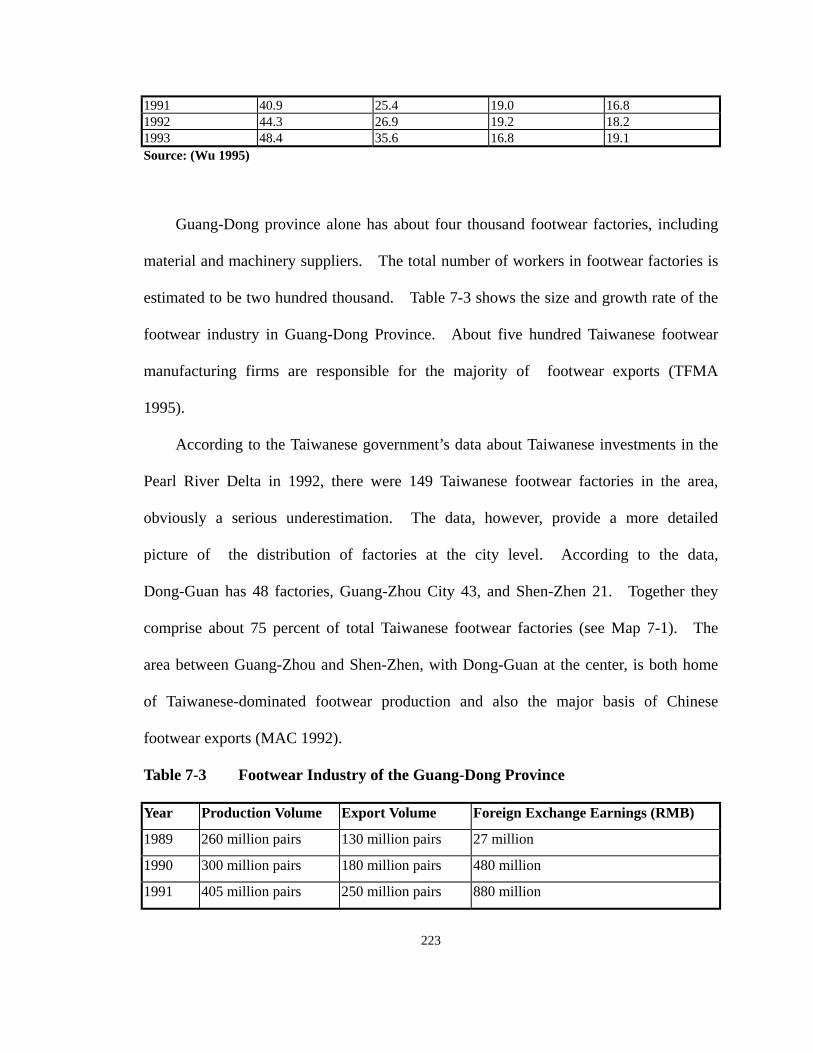
1991 40.9 25.4 19.0 16.8 1992 44.3 26.9 19.2 18.2 1993 48.4 35.6 16.8 19.1 Source: (Wu 1995)
Guang-Dong province alone has about four thousand footwear factories, including
material and machinery suppliers. The total number of workers in footwear factories is
estimated to be two hundred thousand. Table 7-3 shows the size and growth rate of the
footwear industry in Guang-Dong Province. About five hundred Taiwanese footwear
manufacturing firms are responsible for the majority of footwear exports (TFMA
1995).
According to the Taiwanese government’s data about Taiwanese investments in the
Pearl River Delta in 1992, there were 149 Taiwanese footwear factories in the area,
obviously a serious underestimation. The data, however, provide a more detailed
picture of the distribution of factories at the city level. According to the data,
Dong-Guan has 48 factories, Guang-Zhou City 43, and Shen-Zhen 21. Together they
comprise about 75 percent of total Taiwanese footwear factories (see Map 7-1). The
area between Guang-Zhou and Shen-Zhen, with Dong-Guan at the center, is both home
of Taiwanese-dominated footwear production and also the major basis of Chinese
footwear exports (MAC 1992).
Table 7-3 Footwear Industry of the Guang-Dong Province
Year Production Volume Export Volume Foreign Exchange Earnings (RMB)
1989 260 million pairs 130 million pairs 27 million
1990 300 million pairs 180 million pairs 480 million
1991 405 million pairs 250 million pairs 880 million
223

1992 750 million pairs 330 million pairs 1.3 billion
1993 900 million pairs 430 million pairs 2.1 billion
1994 1 billion pairs 480 million pairs 2.5 billion
Source: (TFMA 1995)
Dong-Guan was once an administrative area about on the level of a county. It was
formally upgraded to the “city” level in 1988. It covers twenty-nine townships located
on the eastern side of the Pearl River and occupies about 2,465 square kilometers. The
administrative center of the county is about 50 kilometers south from Guang-Zhou City
and 90 kilometers north of Shen-Zhen, positioned perfectly between the two major
commercial and industrial centers of Guang-Dong Province.
The county had long been designated as an agricultural county because of its
strategic location as a “military frontier.” This was true only after the Communist
revolution in 1948, which separated country people from their friends and relatives in
Hong Kong. Dong-Guan has since become a famous “Chiau-Shiun” (foreign Chinese’s
home town). About 650 thousand residents of Hong Kong came originally from
Dong-Guan. After China announced its open economy policy in 1978, the Dong-Guan
local government quickly took advantage of its long-established foreign connections to
import foreign capital. Hong Kong businessmen flooded into the county to find the
cheap and abundant labor they had long desired. A new division of labor (called “Front
Store, Back Factory”) emerged in which the Hong Kong side deals with export marketing
and Dong-Guan tookcare of production. The speedy growth of Dong-Guan became a
famous model of economic development in China.
224

Table 7-4 Basic Statistics of Dong-Guan City (1980-1993)
Year
Total Social
Production
(million RMB)
Manufacturing
Sector
(million RMB)
Agriculture
Sector
(million RMB)
Population
(thousand)
1980 1270 N/A. N/A. 1127
1985 3606 N/A. N/A. 1209
1986 N/A. N/A. N/A. N/A.
1987 6577 3206 1484 1240
1988 9668 5314 2036 1258
1989 10288 6569 2211 1277
1990 12442 8237 2364 1337
1991 15218 10466 2425 1337
1992 20830 15137 2712 1360
1993 28816 21488 2845 1390
* based on current year RMB value.
Source: Guang-Dong Province Statistical Data for National Economy and Social Development
: Guang-Dong Statistical Year Book (various years)
Given the fact that Dong-Guan was originally an agricultural county lacking
industry, its speedy growth in manufacturing exports since the economic reform has been
amazing. Table 7-4 reports some basic statistics about Dong-Guan City over the last
decade. The gross output of its manufacturing sector was two times that of the
agricultural sector in 1987, ten years after the reform. Just six years later, the ratio had
grown to nearly eight times. The total social production value (a special indicator in
socialist China) increased 23 fold from 1980 to 1993. Another source estimates an
annual growth rate from 1978 to 1991 of twenty percent (Deng 1993).
225

Table 7-5 Total Exports of Major Cities in Guang-Dong Province, China (1993)
Major Cities Export Value Processing Contract
(San-Lai-Yi-Bu)
Foreign Direct Investment
(San-Zi)
Shen-Zhen 5.768 1.128 2.924
Guang-Zhou 3.482 0.542 1.416
Dong-Guan 4.415 3.572 0.633
Zhon-Shan 1.120 0.186 0.528
Fo-Shan 2.330 0.076 1.335
Ju-Hai 1.029 0.037 0.664
Unit: U.S. billion dollars
The other category is “trade exports.”
Source: Statistical Year Book of Guang-Dong Province, 1994.
The success of the Dong-Guan model is based on a unique institutional
infrastructure of external linkages. Looking at the export figures of Guang-Dong
Province (Table 7-5), our first impression is clearly that of Dong-Guan’s significant
export contribution. The city’s total export value in 1993 was US$ 4.4 billion, second
only to Shen-Zhen’s US$ 5.7 billion, which has been the showcase of economic reform
largely fueled by special privileges from the central government, and even higher than the
province capital Guang-Zhou’s US$ 3.5 billion.
Looking at the composition of export contribution, the unique basis of Dong-Guan’s
phenomenal growth stands out among cities in the Pearl River Delta, especially when
compared with Shen-Zhen. The San Lai Yi Bu, which can be translated directly as
“three kinds of processing contracts and one kind of compensation trade,” contributes
mostly to the exports of Dong-Guan. The most common form among the processing
contracts is Lai Liao Jia Gong, which means “bringing materials for processing” and is
the typical export linkage of the Dong-Guan economy. In contrast, Shen-Zhen City,
226

which has received much attention as a special economic zone (SEZ) designed by the
central government relies heavily on foreign direct investment.111 A look at the actual
practice of the processing contract will provide us with a strategic entry point for
understanding the investment activities of Taiwanese footwear producers at the local
level.
Institutional Embeddedness as Buffering: FDI in Disguise
The term Lai Liao Jia Gong (i.e., processing contract) was first coined in 1979 after
a high-ranking official of the State Department of China visited Hong Kong and observed
that many of the factories in Hong Kong were manufacturing according to orders from all
over the world on a specification basis (i.e., OEM). A processing contract can be seen
as a low-end OEM. More precisely, it is the first tier of the putting-out subcontracting
of an OEM supplier. Same as in a typical OEM transaction, it is local capital
manufacturing according to export orders and buyer’s specifications. A major
difference is that producers bound by processing contracts do not prepare materials
themselves. Chinese government officials describe the processing contract as “two
heads outside, big in-flow [of materials] and out-flow [of finished products]”
(Liang-Tou-Tzai-Uai-Da-Jin-Da-Chu) indicating its position in the middle processing
section of global chains.
The governor of Dong-Guan knew that its overseas connection gave it an advantage
in making this type of external linkage and pushed contract processing energetically.
111 San Zi means “three kinds of investment.” They are sole ownership investment,
joint-venture, and cooperative investment. The first two are the major types.
227
Local people in Dong-Guan called the way they are hooked up with the world economy
“sailing out of port with borrowed boats.” In other words, it is conceived as the
institutional channel for finding an export outlet for labor. By 1989, Dong-Guan had
signed over 4,300 processing contracts at a processing fee of about US$ 450 million in
total (Pen 1989, p.118).
Based on our discussion so far, we seem to be faced with a puzzle. If Dong-Guan
is where Taiwanese footwear investors are concentrated, how can Dong-Guan also be
famous for processing contracts which are by definition based on local capital?
However, things in China can not be understood only by reading their face value or
formal definition. The institutional twist of Dong-Guan’s external linkage is critical to
our understanding of the organizational restructuring of the Taiwan-based OEM footwear
GCC.
A processing contract is supposed to be carried by local capital, mostly the township
enterprises in Dong-Guan. However, most of the enterprises involved in processing
contract exports are de facto foreign capitals who are registered as township enterprises
through informal cooperation with local authorities like the township master or the export
trade committee of the city. The Taiwanese footwear factories receive processing orders
from the paper companies their Taiwanese investors set up in Hong Kong. Since
materials that are imported under a processing contract are tax free, what the Chinese side
receives are the processing fees and payments paid by the foreign investors. Formally,
the township masters, for example, are often entitled “factory managers,” who receive
monthly payment for not doing actual management or even showing up in the
pseudo-township enterprises. Other company positions that are often assigned to the
228
local people include security guards, accounting, and custom forwarding. The security
guards are a position that Taiwanese businessmen offered to the military establishments
to build that important connection. The Chinese side often insists, or in some villages
makes mandatory, that they have their person in the accounting sector to prevent being
cheated. The accounting function in Taiwanese footwear factories is, however, limited
to booking only because the de facto financial control is located outside China.
Taiwanese footwear managers almost always use local people to do the Custom
forwarding work to take advantage of their local connections. Those job assignments
represent firm-level efforts of Taiwanese footwear producers to build buffering
mechansims to support their export transactions from local disturbance.
There are two main reasons for the institutional twist in contract processing’s actual
operation. In the early years of economic reform, Dong-Guan did plan to receive
processing orders from Hong Kong businessmen according to the policy designed by the
State Department. But both parties to the transaction quickly realized that cheap labor
and land alone were not sufficient to allow township enterprises to operate the business to
the degree that would meet the demands of OEM exports. Buying and operating
equipment, laying out factories, managing production and order are only a few of the
tasks the Chinese could not overcome quickly enough to meet the demand for precision
and flexibility in the OEM business. When Hong Kong businessmen arrived in the late
1970s, with the help of close local connections, they figured a way to circumvent the
problems by hiding their de facto control under the name of township enterprise. When
Taiwanese arrived, the practice had been well institutionalized in the sense that people
took it for granted.
229
The second reason is especially applicable to Taiwanese manufacturers who arrived
later in the 1980s. At the time, the “pseudo OEM, real FDI” had been practiced for
several years and became a pattern. Taiwanese footwear makers I interviewed
complained that much red tape was involved in setting up a factory in China. Every
institute they encountered (e.g. sanitation) required some backdoor guanxi (connections)
to push the government agency forward. In contrast to Hong Kong businessmen, who
have greater cultural affinity and less of a language barrier, it was an overwhelming job
for Taiwanese manufacturers to manage these regulation by themselves. These troubles
did not end with the establishment of the factory. There were frequent rent-seeking
behaviors from local institutes which factories needed to overcome. By registering as a
processing contract township enterprise, the Chinese counterparts were given the
responsibility of handling all these disruptions with their local connections or authorities.
Under this arrangement, there is often another contract that specifies the real duties
and responsibilities of both parties; for example, that the “factory manager” of the
Chinese side should not in any case intervene into factory operations. The
environmental uncertainty of Taiwanese factories in China is systematically reduced by
channeling unpredictable rent-seeking into an informally-institutionalized form. In
other words, the foreign investments of Taiwanese firms are institutionally embedded in
the Chinese local economy by the arrangement of pseudo processing contracts, which
play a buffer sheltering the technical core of OEM transactions from environmental
disturbance so that firms can concentrate on coping with their OEM business.
The other two external linkages designed by the central government are joint
ventures and sole ownerships. The trend in recent years is for Taiwanese factories to
230
move from processing contract to sole ownership. There are two major reasons for the
transition. The Chinese government felt that it should upgrade the economy away from
simple labor processing and move toward fuller participation in international business.
Pursuing that goal, it has been encouraging the joint venture, seeing it as a better
arrangement for local capital to gain technological knowledge and business expertise.
The major incentive for foreign manufacturers to comply with the policy reorientation is
the thirty percent allowance of domestic sales. Almost all of the Taiwanese footwear
factory managers I interviewed agreed that it is a great incentive, although only a few of
them have tried it. Their common conclusion, based on their experience and
observations, is that marketing shoes to the Chinese domestic market is very risky
because of difficulties in obtaining payments. The only way for them to sell shoes in
China is through cash transactions, clearly a problem of insufficient trust. There is
consequently little difference between processing contracts and joint ventures in the
operations internal to the Taiwanese footwear firms, except that in joint ventures the
Chinese receive payment by “head taxes.” The details of a joint venture are
documented in Wu’s research on the “pseudo joint venture” (Wu 1995).112
Interestingly, in this investment environment, the numbers of workers in a firm can
be very flexible depending on whom the numbers are reported to. A manager told me:
We tell our buyers that we have 3800 workers, our Chinese township partner
3,000, the province government 2,500, and the Hong Kong investors 4,300.
How many workers do we really have? It’s a secret [laugh]! Our Chinese
side even warned me that I take the full responsibility if I accidentally told the 112 The concept of “pseudo OEM, real FDI” is from Wu’s research.
231

wrong number. I said “No problem, they are all here in my head. (Informant
MY1)
On a certain level, there is indeed a shared tacit knowledge among Chinese businessmen
on both sides of the Strait regarding how flexible the informality can be in circumventing
government regulations.
There are other reasons for Taiwanese producers to prefer sole ownership. As time
goes by, Taiwanese businessmen started to build their local connections in China and also
organize their representing associations at the township level and above. A clear
dividing year in this change was the Tienanman Incident of 1989 when China was facing
tough economic sanctions. Taiwanese producers were at their peak years of investment
because they were able to negotiate better deals. They gained more capability in
curtailing the mounting rent-seeking at least without relying solely on the processing
contract arrangement. Another important factor is the difficulty of entering the domestic
market which diminishes the incentive to form a joint-venture. Finally, as the first two
factors are becoming reality, Taiwanese manufacturers are less patient about the
intervention of their Chinese partners. My interviewees cited more complete control
and greater flexibility as reasons for sole ownership.
To summarize thus far, we have discussed the industrial crisis of the Taiwanese
footwear industry after 1987, the footwear producers’ offshore investments, and finally
how the investments were embedded in the local environment. The institutional
embeddedness in the form of pseudo-OEM functions as a buffering mechanism,
dampening disturbances to the OEM chain flow. The disparity between the policy
design of promoting the processing contract and its actual consequences further
232
strengthens the thesis’ emphasis on the coordination necessity of OEM transactions
which cannot be reduced to simple labor processing.
Our analyses affirm the importance of cultural affinity in a broad sense as an asset
for Taiwanese manufacturers. However, more importantly, we also cast doubts on the
simple version of cultural advantages which emphasizes culture as an all-encompassing
value system that shapes its members by internalization. Taiwanese footwear
manufacturers preferred Guang-Dong Province over Fu-Jian Province, where cultural
affinity was much stronger. The existence of “pseudo OEM” assumes shared cultural
knowledge about how informality could operate in economic lives to circumvent
government regulation,113 but also shows Taiwanese producers’ lack of cultural capital
entering the “back doors” in China. My analytical strategy is to focus on the usage of
specific cultural elements, instead of the assumed encompassing effects of vague
categories, and examine them with regard to the function they serve for a specific sector
of the OEM chain flow (e.g., building buffering mechanisms in this chapter and a culture
of commitment in Chapter 5). Having discussed the new footwear industrial district’s
local embeddedness discussed, we are ready to look inside the Taiwanese footwear
production in China.
Restructuring a Labor Regime
Before manufacturing moved offshore, the production network of the Taiwanese
footwear industry was characterized by the extensive use of subcontracting networks with
113 The mayor of Dong-Guan City, Ow Yun Der, was arrested in April, 1995. He was charged
with corruption (Newsweekly 1995).
233
tiers tied ultimately to household labor. Although the passing of the Labor Standard
Law in 1987 facilitated production informalization, the subcontracting system in Taiwan
was primarily based on interpersonal networks of micro-entrepreneurs who voluntarily
stayed in the informal sector. When footwear factories began moving out of Taiwan,
most of the footwear subcontractors closed down and only a few of them followed
footwear factories to China. The only Taiwanese subcontractor I met in China became
an in-house subcontractor working inside his friend’s footwear factory. The reason he
gave me for being an in-house subcontractor, besides the long-term friendship with the
factory owner, was to that he wanted to save red tape in setting up a factory in China.
This is not difficult to understand because subcontractors are often driven by a motive to
get away from formal regulation. Likewise, the information I gathered at Tsau-Tun
township suggests that those subcontractors who closed their footwear business were not
“pushed back” to factory but stayed in other areas of the informal economy, such as street
peddling.
An obvious reason why Taiwanese footwear factories ceased to practice the putting
out system is the abundant supply of cheap labor in China. In Guang-Dong Province,
the monthly wage of workers in Taiwanese-owned footwear factories is around four
hundred RMBs, only about one tenth of the wage level in Taiwan. The productivity of
Chinese assembly workers is about half that of their Taiwanese counterparts. It can be
improved with experience. In an extreme case, the manager of a Taiwanese footwear
manufacturer estimates that the company’s monthly labor cost is about NT$ sixty one
million for a total of twelve thousand workers in sixteen factories. For the same amount
of money, they could hire only four hundred workers in Taiwan (Shiao 1995). Cheap
234
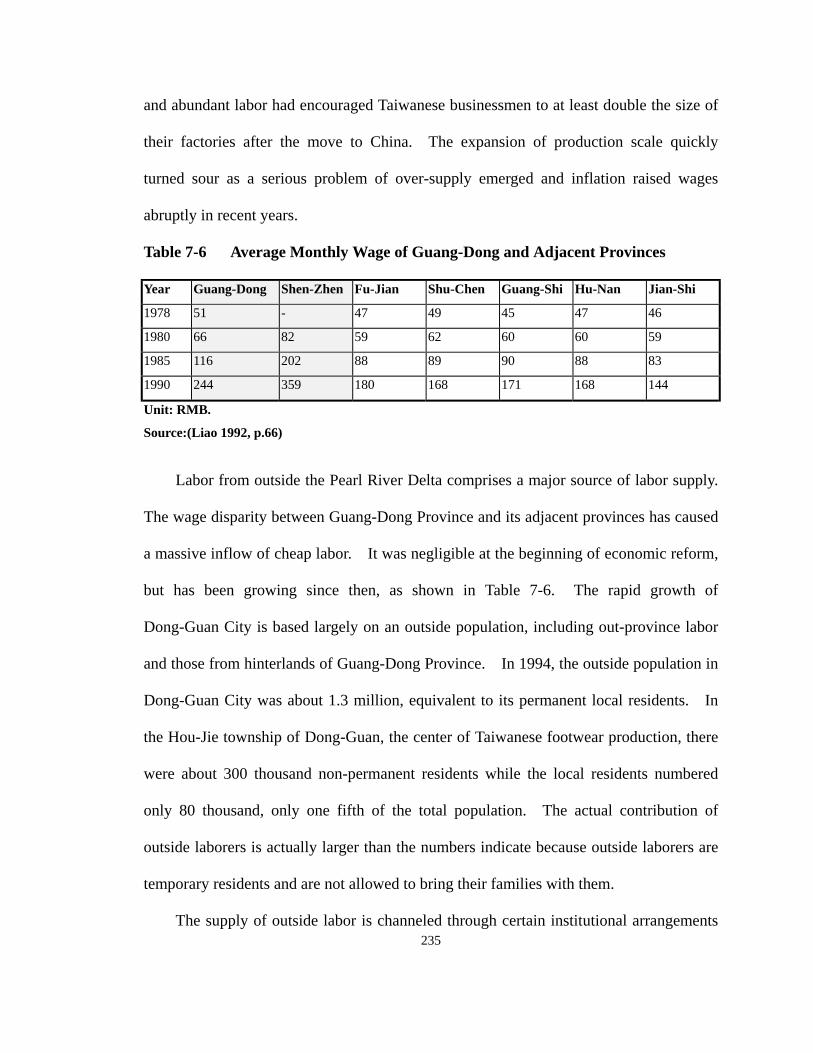
and abundant labor had encouraged Taiwanese businessmen to at least double the size of
their factories after the move to China. The expansion of production scale quickly
turned sour as a serious problem of over-supply emerged and inflation raised wages
abruptly in recent years.
Table 7-6 Average Monthly Wage of Guang-Dong and Adjacent Provinces
Year Guang-Dong Shen-Zhen Fu-Jian Shu-Chen Guang-Shi Hu-Nan Jian-Shi
1978 51 - 47 49 45 47 46
1980 66 82 59 62 60 60 59
1985 116 202 88 89 90 88 83
1990 244 359 180 168 171 168 144
Unit: RMB.
Source:(Liao 1992, p.66)
Labor from outside the Pearl River Delta comprises a major source of labor supply.
The wage disparity between Guang-Dong Province and its adjacent provinces has caused
a massive inflow of cheap labor. It was negligible at the beginning of economic reform,
but has been growing since then, as shown in Table 7-6. The rapid growth of
Dong-Guan City is based largely on an outside population, including out-province labor
and those from hinterlands of Guang-Dong Province. In 1994, the outside population in
Dong-Guan City was about 1.3 million, equivalent to its permanent local residents. In
the Hou-Jie township of Dong-Guan, the center of Taiwanese footwear production, there
were about 300 thousand non-permanent residents while the local residents numbered
only 80 thousand, only one fifth of the total population. The actual contribution of
outside laborers is actually larger than the numbers indicate because outside laborers are
temporary residents and are not allowed to bring their families with them.
The supply of outside labor is channeled through certain institutional arrangements 235

of labor control in China. Contract labor, which is based on a fixed period of
employment, appeared in China only after the economic reforms of 1978. To control
population flow, inland contract laborers are granted temporary resident registration only
after they find a job in the city, and recruiting out-province labor must be mediated by
official labor service centers. Labor service centers charge out-province labor a service
fee, transportation expenditure, training and registration fees which account for at least
three months of earnings. Many out-of-province laborers, however, come to
Guang-Dong without going through labor service centers. They are young people who
take a chance in order to escape poverty in their home towns. Many of them are
encouraged by their friends or relatives already working in the coastal cities and are often
seen waiting outside factories for a chance to get a job. Once they are accepted,
factories must then notify the local authorities to secure a worker’s temporary resident
status. The contract system was designed to reduce the burden of state enterprises
who were obliged to offer permanent employment, especially those in the inland
provinces, and also provide foreign factories in the coastal cities with abundant labor.
Taiwanese factories admit that they prefer to employ out-of-province laborers
because they are hardworking and more obedient. These workers are satisfied with their
wages (compared with the wages where they came from), concentrate more on working
(since they are isolated from their local environment), and are more appreciative of
employment (so that they can be granted with residency). The so called “regionalism”
(di-Iu-guan-nian) of out-of-province labor, where identity is based on the province of
origin, inhibits the solidarity of Chinese workers. Taiwanese managers clearly notice
the advantage of out-of-province laborers but are also aware of their potential threat to
236
management. Labor “regionalism” must also be carefully managed (e.g. by separating
workers into different dormitories and workplaces) to prevent conflicts along province
lines. The institutional arrangement and social character of cheap labor are critical to
the utilization of this labor.
Likewise, cheap labor is an obvious reason for the replacement of the putting-out
system with in-house production in Taiwanese footwear factories in China, but not
sufficient. The flexibility in responding to fluctuating demand that the putting-out
system achieved in Taiwan must also be replicated. Piece rate payment, already
practiced in Taiwan, is now pushed to an extreme by reducing basic wages even further.
The impact of market fluctuation is automatically absorbed in workers’ payment.
Another adjustment device is the use of casual workers who are hired on a short-term
basis. The lax labor regulations in China allow Taiwanese footwear factories to use
labor in-house without much restriction, meaning long working hours and frequent
dismissals. In the absence of formal labor protection, informalization of production
through putting-out is hardly necessary (Portes and Sassen-Koob 1987). It was however
reported that some Taiwanese footwear factories were putting out jobs again in 1995.
The market demand is again declining and the oversupply is driving profit margins down.
Firms reduce scale to lower fixed costs while using putting-out to grab rush orders. A
major problem they immediately face is how to find reliable subcontractors in China. In
order to “breed” subcontractors, low-level Chinese managers whom Taiwanese firms
trust are encouraged to set up their own workshops with orders they supply, a strategy
that had been adopted in Taiwan.
The arrangement of in-house production in China also reflects the organizational
237

strategies Taiwanese footwear manufacturers adopted in making use of the abundant
supply of cheap labor. Not only did the production scale of Taiwanese footwear
factories double after overseas investment (e.g. from two to four assembly lines) the
production process itself also became more labor-intensive. Production procedures
were divided into smaller steps to lower the learning barrier for Chinese workers. In
some factories, there is even a phenomenon of “de-mechanization” in which the
machinery equipment investments are systematically reduced. Ironically, while labor
intensiveness increased after manufacturing moved to China, the products themselves
were “upgraded” because complex upper designs with more stitching steps were allowed.
Even the quality control become labor-intensive because more inspectors could be placed
on the shop-floor to assure quality.
As a result of the above mentioned factors, an assembly line that accommodated
around thirty workers in Taiwan could now accommodate eighty workers in China. The
problem of limited factory space in Taiwan disappeared and the spacious factory in China
allowed Taiwanese manufacturers for the first time to arrange the shop-floor layout freely.
As the labor-intensiveness of production increased, machines were also modified to
match. The Taiwanese machinery industry has been adept at modifying foreign
machines to fit local production demands. The modified assembly conveying line
increased both the speed and length of the original Italian design, which failed to
accommodate the intensified piece rate production widely practiced in Taiwanese
factories. A printing factory I visited in Dong-Guan shows another example of the
flexibility in allocating space and machines to fit production needs. Three conveying
lines are flexibly divided into changeable sections (at least six as I observed) of
238

different lengths for spraying paint on models of different order size. The manager and
workers constantly move the heating tunnels, which are supposed to be fixed. The work
environment of this factory was, however, the worst among the ones I visited because, to
make the tunnels movable, the ventilators were taken away. Human suffering in the
incorporation of the laborer into GCC must be taken into consideration when flexibility is
examined. That concern, however, only demands that we study more seriously the
profound social forces that come into the social formation of market.
The Formation of a Taiwanese Footwear Industrial District
The establishment of production abroad was a joint effort between footwear
factories and their buyers and material suppliers. As we have discussed in earlier
chapters, the competitiveness of the Taiwanese footwear factories rests in the networks in
which they are embedded. The networks are not only able to absorb market fluctuation
by spreading risks but also offer speedy development and flexible production, which are
critical to competition in the footwear retail market. In light of these facts, the offshore
investment of Taiwanese manufacturers involves not only a spatial reallocation of
production lines but, more importantly, a multilateral adjustment among firms in OEM
market networks. The challenges in the process can be formidable, as the
organizationally embedded networks decompose and with which are recomposed over
short periods in the volatile market environment with which firms have to cope. The
uncertainty involved in these challenges only strengthens the networkness of the
Taiwanese footwear industrial district and makes trust even more valuable. We have
discussed two facets of the industrial restructuring that helped to stabilize the transition:
239

institutional buffering and a labor regime. Now let us look closer at the capital
relationships in the industrial district.
There were estimated to be about two thousand Taiwanese factories in Dong-Guan
City, a small area of 2465 square kilometers. The Taiwanese Businessmen Association
of Dong-Guan City registered about 1200 member factories in 1994. According to the
association’s 1995 directory, which listed only 441 Taiwanese companies, 132 were
footwear factories and about 70 were related factories providing equipment or materials
(e.g., glue, foams, lining cementing, outsoles, cutting dies, and machinery service) for
footwear production. The same source shows that among the 78 Taiwanese companies
in the footwear production center of Hou-Jie township, 31 were footwear factories, 27
were footwear related factories, five were Taiwanese-owned restaurants, and only 15
were of other industries. In Dong-Guan City, at least fifty thousand workers were
employed by Taiwanese footwear factories. These data clearly show that Taiwanese
footwear producers are geographically highly concentrated in Dong-Guan City, especially
in Hou-Jie township.
The concentration of footwear factories can be visually stunning, as I learned while
accompanying inspectors of trading companies on a drive among Taiwanese factories in
the small area. Not only do Taiwanese factories stand close to each other along the
major roads of Dong-Guan City, but many more hide down smaller lanes, as I realized
after a longer stay. Spatial concentration allows intensive and extensive interactions
among firms. Frequently we ran into Taiwanese managers whom my host informants
knew in restaurants and karaoke bars. These places of social gathering play an
important function in spreading and gathering valuable market information. They are
240
also where guanxi are explored and maintained. A clear sign of the instrumental
purpose of these social gatherings can be observed in the hierarchical nature of
interactions. Trading companies are at the top of the hierarchy, footwear factories at the
middle, and the poor material suppliers at the very bottom. Those at the higher level of
the chain were always the center of attention (or the target of quanxi building). I also
noticed that horizontal exchanges of information (e.g., assembly line space) among
factories of more equal standing were often taking place at the same time. The
network concentration of the industrial district has grown to such an extent that a more
formal utilization of networks is being sought by one leading footwear factory. A
general manager of the company told me of his proposal to set up a regional hospital in
Dong-Guan City to serve employees of Taiwanese factories by taking advantage of the
trustful relationships accumulated.
The establishment of a new production district can not be achieved overnight, but
the speed of transition Taiwanese manufacturers were able to accomplish was amazing.
Footwear factories moving out of Taiwan beckoned other factories and suppliers to go
with them, an inevitable result of differentiated production networks. A footwear
factory manager told me that at the peak years of offshore investment one footwear
assembly factory would bring roughly five other firms with it. That was about the
number of firms needed to manufacture a model of shoes in a differentiated OEM
commodity chain. Whether pushed out by closing factories or pulled by abundant cheap
labor, many former managers of footwear factories gathered friends and capital to set up
their own business. There were reshuffles of personnel among trading companies,
footwear factories, and material factories after the production moved offshore. A new
241
wave of entrepreneur spin-offs took place in China. I saw lots of occasions where old
friends in the industry circle were exchanging new business cards for their recent
positions. Because there were firms closing down and others setting up for the first time,
offshore investment entailed a very dynamic networking process rather than mere spatial
reallocation.
The spatial and social closeness of Taiwanese footwear firms were obvious during
the time I spent in the field. When asked where their suppliers were, factory managers
frequently just pointed to a direction outside of the factory saying “over there,” close
enough for a normal person to sense the direction intuitively. On another occasion, I
was introduced by a factory manager to his suppliers. We walked along the small lane
around the factory as I was introduced to a print factory, a lining cementing factory, an
outsole factory, and a chemical factory supplying plastic materials for making outsoles.
The tour ended with a social gathering for lunch at the cementing factory. The owner of
the factory told me his story during lunch about how he brought his whole family to
China, including his daughters and sons-in-law. “When my outsole factory was burned
down to ashes, I thought it was the time to retire. But I said to my self that I must
initiate a career for my kids in my retirement. Luckily my friend now just next door
invited me to come over here.” The father’s personal network became an asset for the
family’s new business in China.
Two other examples will be sufficient for illustrating how close networks function in
the spatially-concentrated Taiwanese footwear industrial district. I accompanied the
manager of a trading company for his scheduled visit to suppliers on a regular day.
Upon arrival at a footwear factory, it was found that the midsole of a model’s grading
242
sample failed to fit both outsole and uppers. The trading company manager called the
Taiwan head office in Taichung City to fax the drawings of an original confirmation
sample to the outsole factory at his next stop. A manager of the assembly factory then
came along with us to discuss this matter with managers at the outsole factory. After the
shoe master of the trading company re-drew the midsole patterns, the footwear factory
manager took it to the cutting-die factory right away. By the next morning, the new
cutting-dies were ready on the table of the trading company waiting for approval. They
were put to use and the outsole factory started to mass produce in the afternoon. By
intensive coordination among four different firms, it took less than two hours to solve the
problem in the first day and production resumed in less than twenty-four hours.
Another day, the general manager of a footwear factory in a suburb of Guang-Zhou
City visited his old friend who was working for a factory in Shen-Zhen City making
shoes for a famous brand. At the factory, he collected information about a new model of
the brandname company which emphasized recycled and recyclable materials. We then
drove back to Dong-Guan City to visit an outsole factory and asked the factory to try
making a test outsole using grounded powder of used tires the manager had brought.
We were introduced to another outsole factory before we left and later in the evening
found that company’s general manager at a karaoke bar. It was the first time my host
had met the manager and another outsole factory manager who happened to be there.
After some technical discussion, both companies agreed to experiment making the
recycled outsoles. We brought two bags of materials to their factories by midnight.
This example shows the speed of information processing and opportunities for learning
richly embedded in the industrial district.
243
The benefits of geographical closeness and extensive networking are based primarily
on the fact that the industry is coordination intensive.114 Footwear manufacturers know
that trading companies do not want their suppliers to be separated over long distances
because of the increased transportation costs. A footwear factory who distances itself
from other factories pushes business out of the door. The closeness of the Taiwanese
footwear production network is also evident in the fact that it constitutes an enclave
export economy in China, where the overwhelming majority of transactions are
conducted only among Taiwanese. As we have discussed, Taiwanese footwear factories
learned through painful lessons that cash transactions, which largely limit the scale of
exchanges, are necessary for playing in the Chinese domestic market. Without access to
larger scale retail channels, Taiwanese footwear factories are forced to do business with
very small retailers whose orders are far below the average size of export orders and
whose credibility is hard to ascertain. The same need for trust occurs inside the
Taiwanese-centered OEM production network. As production moves offshore, the
coordination among firms in an OEM transaction chain from design to shipment becomes
more complex and the longer transportation time of materials also places more demand
on the cash flow. Credit-based transactions, very popular in Taiwan, become more
demanding. As a result, cooperative transactions and network closeness are
strengthened in the new production district. The OEM transaction networks, as they are
embedded in personal relationships, are not confined by the space that accommodates the
production process. That is why we must turn to the complete unit of the OEM
114 The political antagonism between China and Taiwan is another reason for the mutual support
among Taiwanese factories in China.
244

transaction, which encompasses a fuller range of activities including marketing/sourcing
networks with buyers.
245

Chapter 8 Restructuring Regional Sourcing Networks in the 1990s
In the previous chapter I focused exclusively on the production network. In this
chapter, I continue my investigation of the network restructuring processes of the
footwear sourcing market but now stress the organization of a complete OEM transaction
and look at the OEM market network as a whole. Much emphasis is placed on the
marketing network as we move away from the enclave industrial district in southern
China.
This chapter is arranged in four parts. We begin with a sketch of the now
well-established triangle manufacturing, looking at how the OEM transaction is now
organized region-wide. We then turn the clock backward to the early 1980s tracing the
marks of a missing episode at the marketing end: a trial and failure of trading companies
and buyers during the first half of the 1980s to source footwear directly from China.
Then we examine how these companies later adjusted their sourcing arrangement and
contributed to the formation of triangle manufacturing. By comparing divergent
responses of buyers in network restructuring and their consequences, I further emphasize
the pivotal role of Taiwanese-based networks in the regionalized OEM transactions.
Finally, having completed our analysis of the different aspects of the production site
movement from Taiwan to neighboring countries in the late 1980s and early 1990s, we
compare it with the earlier transition from Japan to Taiwan twenty-five years ago. The
comparison shows the historically-contingent nature of production site transitions which
the universalistic market model fails to cope with properly.
246

Division of Labor Regionalized: Triangle Manufacturing
We have described three distinct features of the overseas investment of Taiwanese
footwear producers after the crisis in the late 1980s. They are: 1) an institutional
arrangement of investment to adapt to the local environment and buffer non-production
disturbance to the OEM transaction flow; 2) a new mode of labor control that takes
advantage of the social characteristics of labor supply to reduce labor antagonism and
lower learning barriers by increasing production fragmentation so that the transition time
can be reduced; 3) a close network among Taiwanese firms that empowers the enclave
industrial district with learning opportunities and makes flexible response possible.
At the end, we are close to reaching an understanding that the Taiwanese footwear
industrial districts in China are not self-sufficient. They are just a section of the OEM
commodity chains that encompass a long sequence of transaction coordination beyond
production. The fourth, and the overarching, characteristic of the investment is the
emergence of a regionalized division of labor that involves various firms interacting
across national borders. We begin our investigation of the new industrial structure by
looking at how the Taiwanese producers operate in China.
A survey of the operation of Taiwanese footwear factories in China, presented in
Table 8-1, shows that about 85 percent of their finished products were sold to other
countries, a sign of their export-oriented nature.115 Regarding material supply, 84
percent of the materials came from Taiwan and only 14 percent were sourced from China.
Leather and textiles are the two major items of material imports from Taiwan. In 1991,
247
115 The proportion of exports should be higher now because many Taiwanese factories gave up entering the
Chinese market.
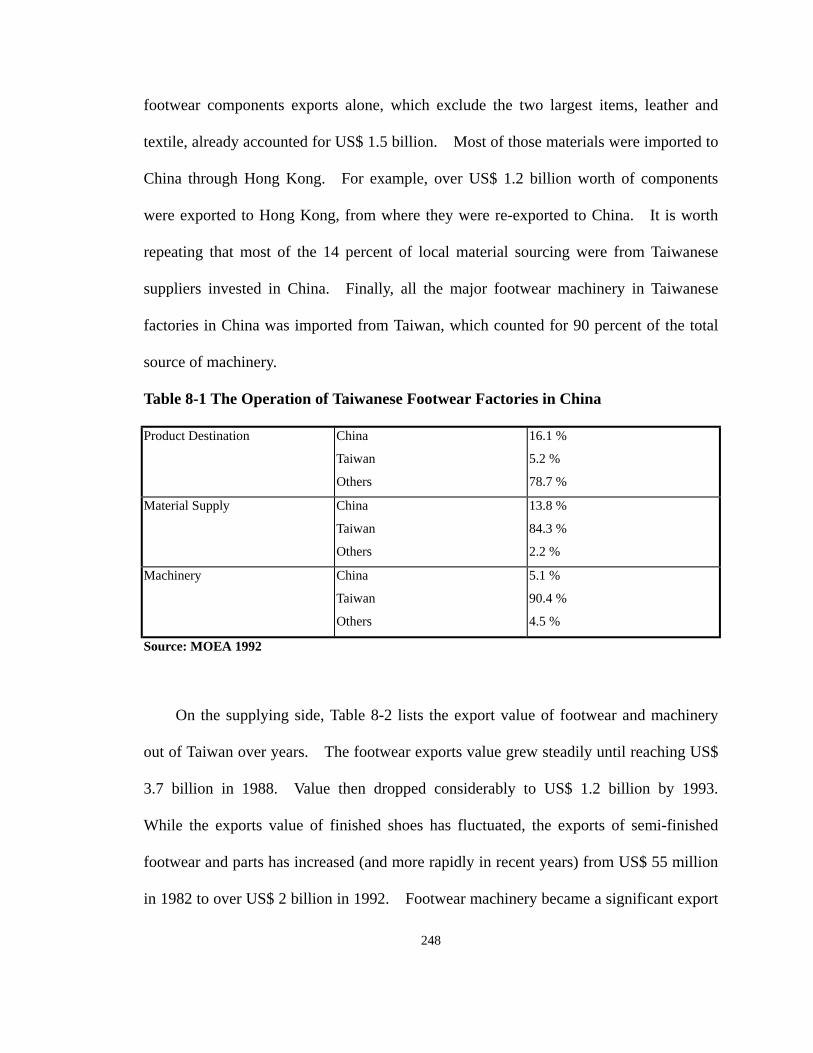
footwear components exports alone, which exclude the two largest items, leather and
textile, already accounted for US$ 1.5 billion. Most of those materials were imported to
China through Hong Kong. For example, over US$ 1.2 billion worth of components
were exported to Hong Kong, from where they were re-exported to China. It is worth
repeating that most of the 14 percent of local material sourcing were from Taiwanese
suppliers invested in China. Finally, all the major footwear machinery in Taiwanese
factories in China was imported from Taiwan, which counted for 90 percent of the total
source of machinery.
Table 8-1 The Operation of Taiwanese Footwear Factories in China
Product Destination China
Taiwan
Others
16.1 %
5.2 %
78.7 %
Material Supply China
Taiwan
Others
13.8 %
84.3 %
2.2 %
Machinery China
Taiwan
Others
5.1 %
90.4 %
4.5 %
Source: MOEA 1992
On the supplying side, Table 8-2 lists the export value of footwear and machinery
out of Taiwan over years. The footwear exports value grew steadily until reaching US$
3.7 billion in 1988. Value then dropped considerably to US$ 1.2 billion by 1993.
While the exports value of finished shoes has fluctuated, the exports of semi-finished
footwear and parts has increased (and more rapidly in recent years) from US$ 55 million
in 1982 to over US$ 2 billion in 1992. Footwear machinery became a significant export
248
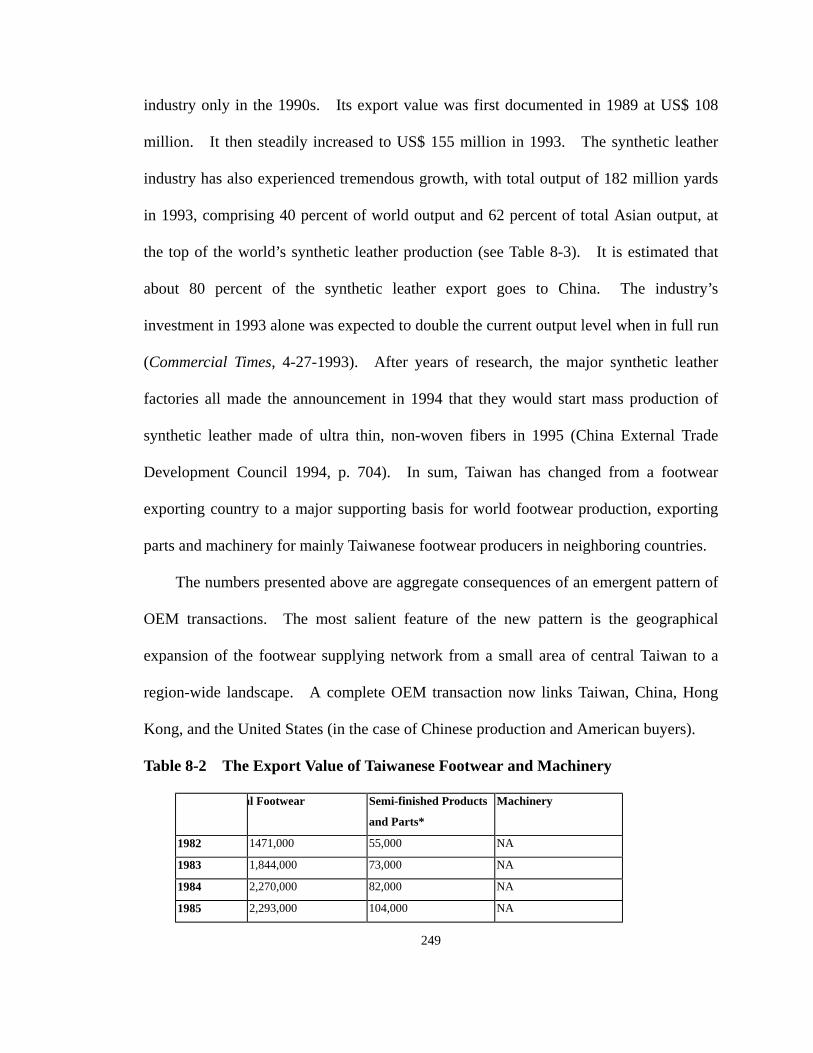
industry only in the 1990s. Its export value was first documented in 1989 at US$ 108
million. It then steadily increased to US$ 155 million in 1993. The synthetic leather
industry has also experienced tremendous growth, with total output of 182 million yards
in 1993, comprising 40 percent of world output and 62 percent of total Asian output, at
the top of the world’s synthetic leather production (see Table 8-3). It is estimated that
about 80 percent of the synthetic leather export goes to China. The industry’s
investment in 1993 alone was expected to double the current output level when in full run
(Commercial Times, 4-27-1993). After years of research, the major synthetic leather
factories all made the announcement in 1994 that they would start mass production of
synthetic leather made of ultra thin, non-woven fibers in 1995 (China External Trade
Development Council 1994, p. 704). In sum, Taiwan has changed from a footwear
exporting country to a major supporting basis for world footwear production, exporting
parts and machinery for mainly Taiwanese footwear producers in neighboring countries.
The numbers presented above are aggregate consequences of an emergent pattern of
OEM transactions. The most salient feature of the new pattern is the geographical
expansion of the footwear supplying network from a small area of central Taiwan to a
region-wide landscape. A complete OEM transaction now links Taiwan, China, Hong
Kong, and the United States (in the case of Chinese production and American buyers).
Table 8-2 The Export Value of Taiwanese Footwear and Machinery
al Footwear Semi-finished Products
and Parts*
Machinery
1982 1471,000 55,000 NA
1983 1,844,000 73,000 NA
1984 2,270,000 82,000 NA
1985 2,293,000 104,000 NA
249

1986 3,230,000 140,000 NA
1987 3,669,000 174,000 NA
1988 3,693,000 249,000 NA
1989 3,228,115 571,404 108,109
1990 2,510,965 1,017,366 114,396
1991 2,244,854 1,565,975 111,834
1992 1,654,281 2,049,274 148,459
1993 1,178,866 1,593,621 155,182
* Leather and Textile not included.
Source: Import-Export Statistics (TFMA), various years. US$ 1,000.
To give a snapshot of the very complex footwear supplying/sourcing network,
Figure 8-1 represents a schematic map of a footwear OEM transaction in the CSM. It
begins with the order negotiation between a trading company supplying imported shoes
from East Asia, the trading company’s Taiwanese footwear supplier, and a retailer-buyer
in the United States. About the same time as the order negotiation, the model is
developed with extensive coordination in Taiwan between the branch office of the trading
company, the Taiwanese head offices of its footwear supplier, pattern-making workshops,
and other materials suppliers. Once the order is stricken and model confirmed, the head
office of the Taiwanese footwear factory places orders to the material suppliers and
prepares tools for mass production. At the next stage of grading, the package is
transferred to the company’s factory in China (i.e., making tools of full sizes) and the
materials (e.g., leather) are shipped from Taiwan to the material suppliers’s warehouses in
China. When every thing is ready, mass production begins in China, with the service
stations of Taiwanese machinery companies providing maintenance and repair when
needed. After production is finished and approved by the inspector of the trading
250
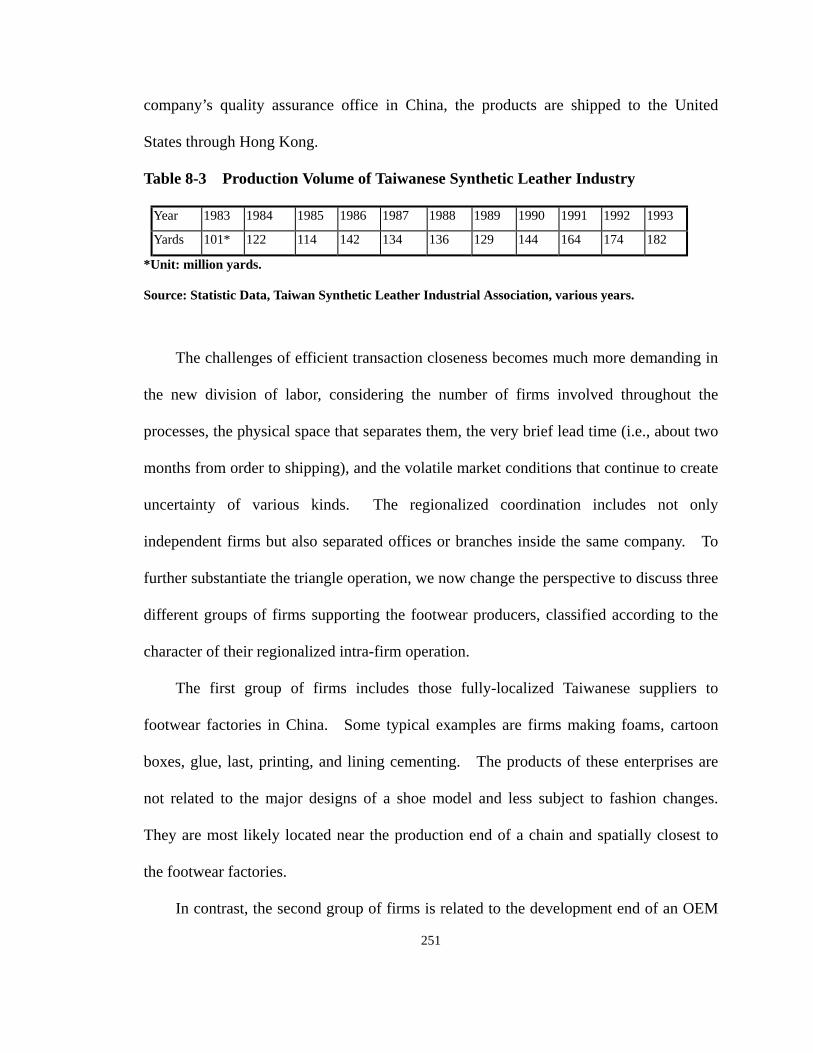
company’s quality assurance office in China, the products are shipped to the United
States through Hong Kong.
Table 8-3 Production Volume of Taiwanese Synthetic Leather Industry
Year 1983 1984 1985 1986 1987 1988 1989 1990 1991 1992 1993
Yards 101* 122 114 142 134 136 129 144 164 174 182
*Unit: million yards.
Source: Statistic Data, Taiwan Synthetic Leather Industrial Association, various years.
The challenges of efficient transaction closeness becomes much more demanding in
the new division of labor, considering the number of firms involved throughout the
processes, the physical space that separates them, the very brief lead time (i.e., about two
months from order to shipping), and the volatile market conditions that continue to create
uncertainty of various kinds. The regionalized coordination includes not only
independent firms but also separated offices or branches inside the same company. To
further substantiate the triangle operation, we now change the perspective to discuss three
different groups of firms supporting the footwear producers, classified according to the
character of their regionalized intra-firm operation.
The first group of firms includes those fully-localized Taiwanese suppliers to
footwear factories in China. Some typical examples are firms making foams, cartoon
boxes, glue, last, printing, and lining cementing. The products of these enterprises are
not related to the major designs of a shoe model and less subject to fashion changes.
They are most likely located near the production end of a chain and spatially closest to
the footwear factories.
In contrast, the second group of firms is related to the development end of an OEM
251

transaction. The most representative cases are large-scale textile and leather factories
that are capital intensive and compete on the basis of research and development capability.
These firms are able to stay in Taiwan by continuing to offer new materials on which
footwear design and development rely. The same is true of footwear machinery firms,
which often have operation in places where footwear manufacturing is concentrated.
However, the functions of these operations are mainly warehouse inventory and after-sale
services. Once model development is confirmed, the splitting operation of these
supporting firms allows Taiwanese footwear companies to place orders in Taiwan and
pick up materials in China.
Compared to the previous two, the final group of firms is tied more to the
transitional stage between development and production. After a model is confirmed, all
the tools (e.g., cutting dies and molds) must be expanded from one size to full sizes.
This step is called grading, which is immediately before the test run of mass production.
OEM transactions vary as to the timing of the transfer of packages to China. Some
prefer to transfer packages only when a full set of grading samples have been made in
Taiwan, while others decide to transfer packages earlier by making grading samples in
China. The former emphasizes small scale but extensive coordination in the
development stage and therefore keeps grading in Taiwan to enhance commercialization.
The latter stresses the importance of early involvement of the production department in
the models to be produced so that smooth production can be better assured. A typical
example of the group is outsole factories which divide their operation into two parts in
both Taiwan and China, like footwear machinery makers. The difference is that firms in
this group have a larger scale of operation in China.
252
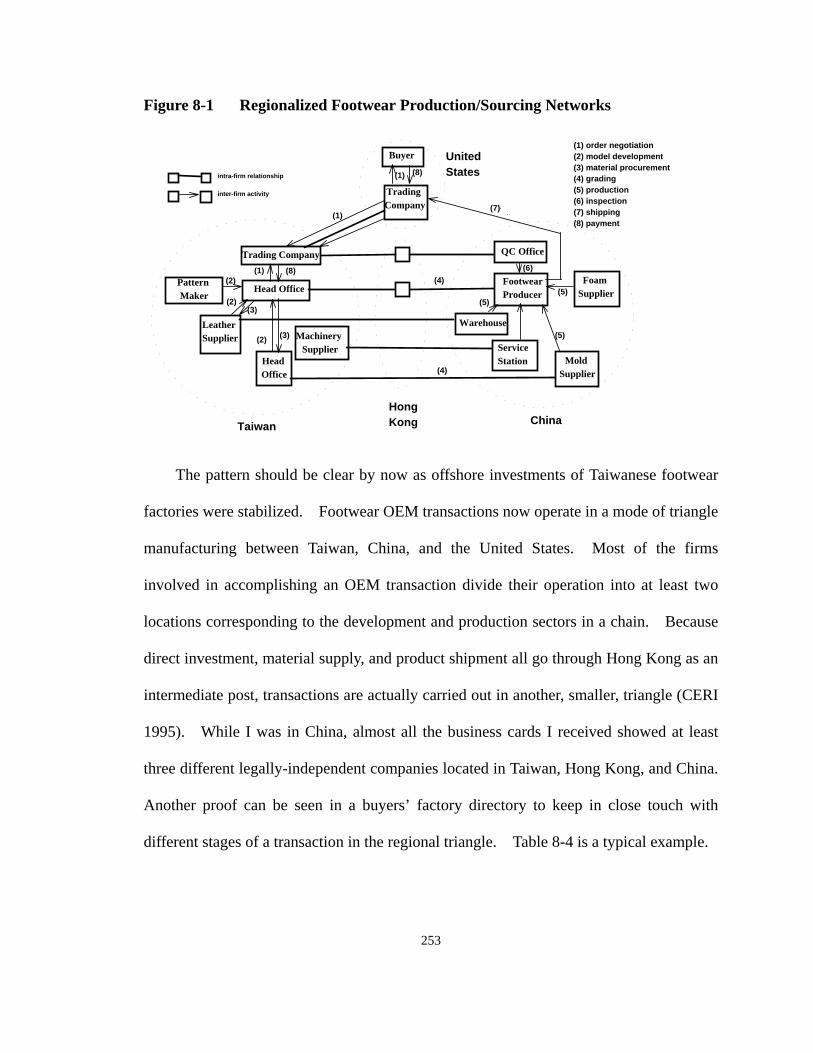
Figure 8-1 Regionalized Footwear Production/Sourcing Networks
Trading Company
Head Office
Leather Supplier
Head Office
Machinery Supplier
QC Office
Footwear Producer
Foam Supplier
Warehouse
Mold Supplier
(2)
(2)
(1)
(2)
(3)
(4)
(5)
(5)
(5)
(6)(8)
(1) order negotiation (2) model development (3) material procurement (4) grading (5) production (6) inspection (7) shipping (8) payment
United States
Hong Kong ChinaTaiwan
Buyer
(1) (8)
Trading Company
(1)
Service Station
Pattern Maker
(7)
(3)
intra-firm relationship inter-firm activity
(4)
The pattern should be clear by now as offshore investments of Taiwanese footwear
factories were stabilized. Footwear OEM transactions now operate in a mode of triangle
manufacturing between Taiwan, China, and the United States. Most of the firms
involved in accomplishing an OEM transaction divide their operation into at least two
locations corresponding to the development and production sectors in a chain. Because
direct investment, material supply, and product shipment all go through Hong Kong as an
intermediate post, transactions are actually carried out in another, smaller, triangle (CERI
1995). While I was in China, almost all the business cards I received showed at least
three different legally-independent companies located in Taiwan, Hong Kong, and China.
Another proof can be seen in a buyers’ factory directory to keep in close touch with
different stages of a transaction in the regional triangle. Table 8-4 is a typical example.
253
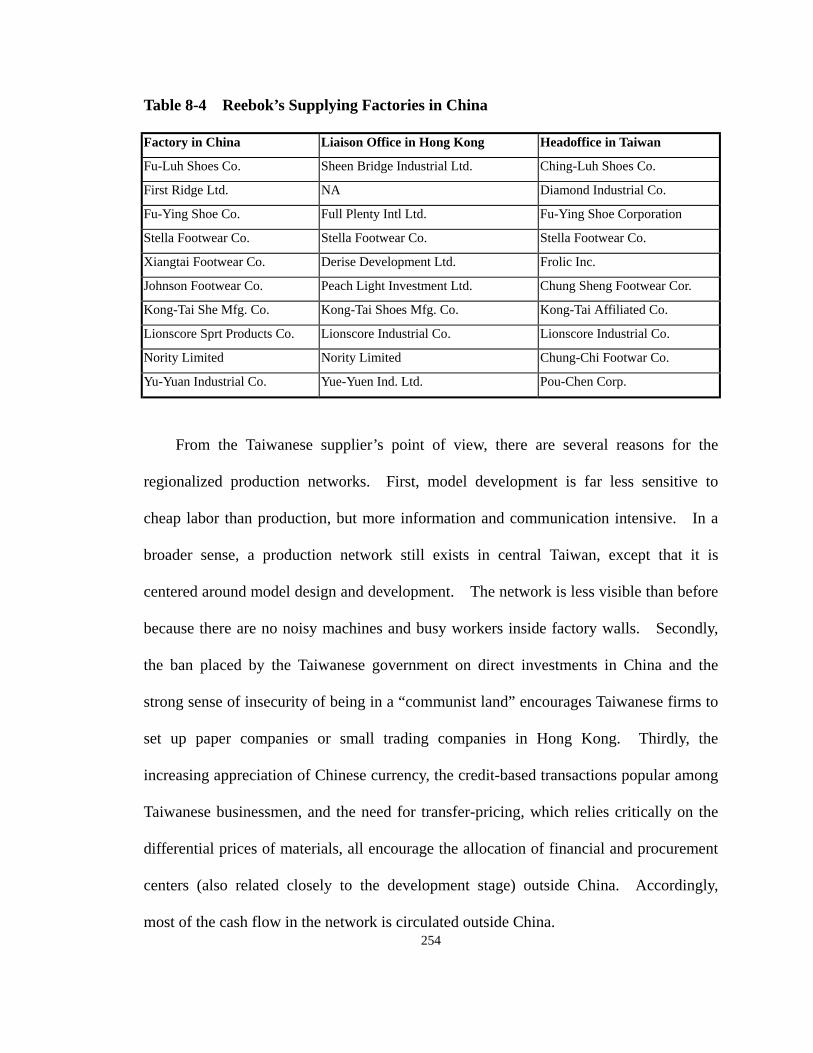
Table 8-4 Reebok’s Supplying Factories in China
Factory in China Liaison Office in Hong Kong Headoffice in Taiwan
Fu-Luh Shoes Co. Sheen Bridge Industrial Ltd. Ching-Luh Shoes Co.
First Ridge Ltd. NA Diamond Industrial Co.
Fu-Ying Shoe Co. Full Plenty Intl Ltd. Fu-Ying Shoe Corporation
Stella Footwear Co. Stella Footwear Co. Stella Footwear Co.
Xiangtai Footwear Co. Derise Development Ltd. Frolic Inc.
Johnson Footwear Co. Peach Light Investment Ltd. Chung Sheng Footwear Cor.
Kong-Tai She Mfg. Co. Kong-Tai Shoes Mfg. Co. Kong-Tai Affiliated Co.
Lionscore Sprt Products Co. Lionscore Industrial Co. Lionscore Industrial Co.
Nority Limited Nority Limited Chung-Chi Footwar Co.
Yu-Yuan Industrial Co. Yue-Yuen Ind. Ltd. Pou-Chen Corp.
254
From the Taiwanese supplier’s point of view, there are several reasons for the
regionalized production networks. First, model development is far less sensitive to
cheap labor than production, but more information and communication intensive. In a
broader sense, a production network still exists in central Taiwan, except that it is
centered around model design and development. The network is less visible than before
because there are no noisy machines and busy workers inside factory walls. Secondly,
the ban placed by the Taiwanese government on direct investments in China and the
strong sense of insecurity of being in a “communist land” encourages Taiwanese firms to
set up paper companies or small trading companies in Hong Kong. Thirdly, the
increasing appreciation of Chinese currency, the credit-based transactions popular among
Taiwanese businessmen, and the need for transfer-pricing, which relies critically on the
differential prices of materials, all encourage the allocation of financial and procurement
centers (also related closely to the development stage) outside China. Accordingly,
most of the cash flow in the network is circulated outside China.
Cheap Labor is Not Easy to Use: the Buyer’s First Move
Thus far, the role of buyers and trading companies in the formation of triangle
manufacturing has been bracketed in our discussion to permit focus on the adjustment to
the supply-side of the market. But buyers and trading companies also play a significant
role in shaping the new division of labor. There is always a question of why buyers do
not place orders directly to China and move their procurement operation to the new
production site. They did, in fact, but failed. Triangle manufacturing therefore
resulted from adjustments, not managerial design. Buyers are not foot-loose either. In
this section, we try to piece together the missing episode in sourcing arrangements.
When China opened its economy in 1978, buyers knew immediately that with its
large population China would soon become an extremely important sourcing site for
labor-intensive products. Because of the wide gap in GNP between Taiwan and China,
both buyers and manufacturers knew that Taiwan could not possibly hold its position as a
major footwear manufacturing site for long. While its competitors were still hesitant to
enter sourcing arrangements with China in 1980, Nike “just did it.” Other brand name
companies waited to see what would happen to Nike before deciding whether to jump in
themselves. Nike’s experience in China proved to be a negative one, indeed, a
nightmare, and other companies learned to hold back from sourcing directly from China.
Buyers in the CSM are supposed to be attracted by cheap labor such as that found in
China. Indeed, they were, but their experiences differ little from Nike’s.
Nike was the first sports footwear company to have contract arrangements with
Chinese state factories, early in 1980. Other brand name companies waited to see what
255
would happen after Nike’s entry into the new sourcing site. An earlier company study
on future sourcing indicated that India and China would be the two long-term, low-cost
suppliers. China won out in the end. Nike started cooperating with a state enterprise
in Tien-Jin City of China in 1980. But by late 1984, supply from China had reached
only 150,000 pairs per month, with very bad quality. Many unanticipated problems led
Nike’s president to comment: “China has got to be the toughest place to do business”
(Austin 1990).
Quality control was extremely poor. After four years of trial, B-grade shoes still
made up 20 percent of production. Model development took eight months in China,
compared to four months in Taiwan. Shipping time from Taiwan was twenty to
twenty-five days, while it was thirty-five to forty days from Shanghai. To solve the
mounting problems, Nike finally decided to send its managers and technicians to help its
Chinese suppliers. The situation deteriorated. There were bitter conflicts between
Nike and its Chinese suppliers. While Nike complained about the Chinese side’s bad
attitude in doing OEM business, the latter complained of Nike’s hypercritical attitude
toward product quality and its unfriendly intervention. Nike thought that the friction
was caused by cultural and language barriers. It brought in managers from its
Taiwanese suppliers to improve communication. This strategy failed because the
Taiwanese suppliers were anxious not to violate the law prohibiting contact with
communist China.
Another serious problem cropped up with the material supply. While Nike’s
Taiwanese suppliers sourced almost one hundred percent of its materials domestically, its
Chinese suppliers had to import over seventy percent. The majority of components
256
supply came from Nike’s Taiwanese suppliers, another sign of market closure discussed
earlier. Taiwanese suppliers were ambivalent about helping their potential competitors.
The result was subtle sabotage: shipment often arrived late and damaged. This created
strain and deteriorating relationships between Nike and its Taiwanese suppliers (Austin
1990, p.38). Nike soon realized that its move to China was not only causing troubles
but also disturbing its long-term relationships with its Taiwanese suppliers, a sign of
mismanagement of sourcing networks. Nike stopped sourcing from China after 1985.
Its competitors learned that cheap labor was not easy to grab.
A similar situation happened in the CSM. Hong Kong businessmen quickly
noticed the advantages they could reap from the opening of the Chinese economy. They
approached foreign footwear buyers, whose regional operation centers were stationed
mostly in Taiwan, to give them orders. They then transferred these orders through
contract processing in China, as described in Chapter 7. The trading companies I
interviewed reported a shrinkage of orders beginning in 1983, when buyers began
moving orders to China through Hong Kong trading companies. “We thought that our
business was close to an end, but orders flowed back again in just a year or so.” In an
interview in 1983, both the presidents of BBC International and Pagoda expressed their
frustration with their sourcing arrangement with China. The major complaint was
delivery time, basically a function of almost every organization factor (Footwear News,
12-5-1983).116 Both Wal-Mart and Payless ShoeSource denied they had placed orders
257
116 In a 1995 interview I conducted with the president of ASCO, he took a recent example of an order
placed to Mexico as an evidence of the difficulty in shifting orders away from East Asia, especially the
Taiwanese-based network. “We placed our first order to a Mexican factory last year. Look at the date
directly with China, but they did report problems with placing orders through Hong Kong.
The manager in charge of Wal-Mart footwear line told me:
Hong Kong has no tradition of footwear industry. You must understand that
footwear, unlike a garment, is three-dimensional. Footwear production
involves far more related industries, like plastic, leather, metal, mold, and textile
that garment production just could not be compared with. The other way to
look at this is by looking at the numbers of machines needed for footwear
manufacturing. For garment manufacturing, you basically just cut and stitch.
Where did you ever see a delicate machine like the lasting machine in the
garment industry? Hong Kong is just a small cup. It can not accommodate
the footwear industry. If they never had the manufacturing tradition in Hong
Kong, how were they going to do good in China?
One manager of a local trading company commented on his friend’s move to Hong
Kong, designed to capture more business: “they just could not find the qualified staff who
can handle the complexity of materials and production schedules. Here in Taichung,
you can easily find people who either had experience in footwear factories or trading
companies” (Informant BV2).
Many managers in Taiwanese factories in Guang-Dong mentioned that Hong Kong
businessmen had tried to set up joint ventures with the Chinese before Taiwanese
producers arrived. “They are not like us. We have been concentrated in footwear
manufacturing for over twenty years. No wonder they could not stay long,” a manager
258
now, it has been six months and I still have no idea what’s going on down there with our order. They just
cannot deliver [the transaction].”
commented (Informant MW1). A former manager of a state enterprise who is now
working for a Taiwanese factory confirmed to me a rumor that some Chinese enterprises
were actually cheated by Hong Kong businessmen who provided them with overpriced
materials and machinery and ran away when problems occurred. A manager of E.S.O.
echoed a complaint that Nike would surely understand: “Our Chinese suppliers were very
difficult to communicate with. For example, we just could not convince them that a pair
of shoes must have exactly the same color or that glue over-applied on a surface must be
cleaned. We were very afraid to do business with them anymore.” Today, ESO,
joining BBC, Mercury, and other major trading companies, uses Taiwan as a base for fast
orders, samples and administrative headquarters that oversee more than five branch
offices in China (Footwear News, 9-20-1993; Footwear News 11-13-1995).
Just as Nike adjusted after setbacks in China, orders that had been going to Hong
Kong began to flow back to Taiwan. Trading companies stationed in Taiwan (especially
the small local trading companies) were relieved that they did not have to close down or
move to Hong Kong. The situation prevailed even after most of the Taiwanese footwear
factories had migrated to China, Indonesia, and other neighboring low-wage countries.
The regionalized triangle manufacturing in East Asia and the enclave industrial district in
China are therefore not design-mandated by buyers, but consequences of quasi-natural
experiments involving trial, error, learning, and adjustment among suppliers, trading
companies, and buyers in the marketplace.
259
The Invisible Shoe Nest in Taiwan: a Strong Sourcing Arm for Buyers
Some buyers (and trading companies) learned from their own experience to source
from new production sites only through existing supplying networks. Others learned
this lesson from watching others making mistakes. Facing uncertainty during market
turbulence, companies adopt similar strategies by imitating others, a phenomenon that
has been called “mimetic isomorphism” by organizational sociologists (DiMaggio and
Powell 1991). Regarding readjustment, Nike again set an example for other companies
to learn from. After its fumbles in China, Nike managed to build a balanced and
competitive sourcing network much superior to that of its competitors. At the center of
the new system are Nike’s strategic partners in Taiwan (and less importantly Korea), who
not only continue to develop Nike’s flagship models but also help Nike develop its future
supply sources. Nike’s strategy of encouraging its existing Taiwanese suppliers to set
up factories in other countries has become a model other companies follow.
How much influence did buyers have in the offshore investment of Taiwanese
footwear producers in the late 1980s? A survey of Taiwanese footwear producers in
China shows that 41 percent of surveyed firms claimed that they were pushed by
American importers to invest in China, although most of them also agreed that cheap
labor was the main reason for their offshore investment (Chinese Economic Research
Institute 1990). The two most popular methods buyers and trading companies used to
push producers overseas were (1) to assure new factories of a certain amount of orders
and (2) to threaten to cut orders if production was not moved offshore by a certain date
(Commercial Times 5-6-1995). The most representative case of the carrot strategy is
Payless ShoeSource’s announcement that whoever established production lines in China
260
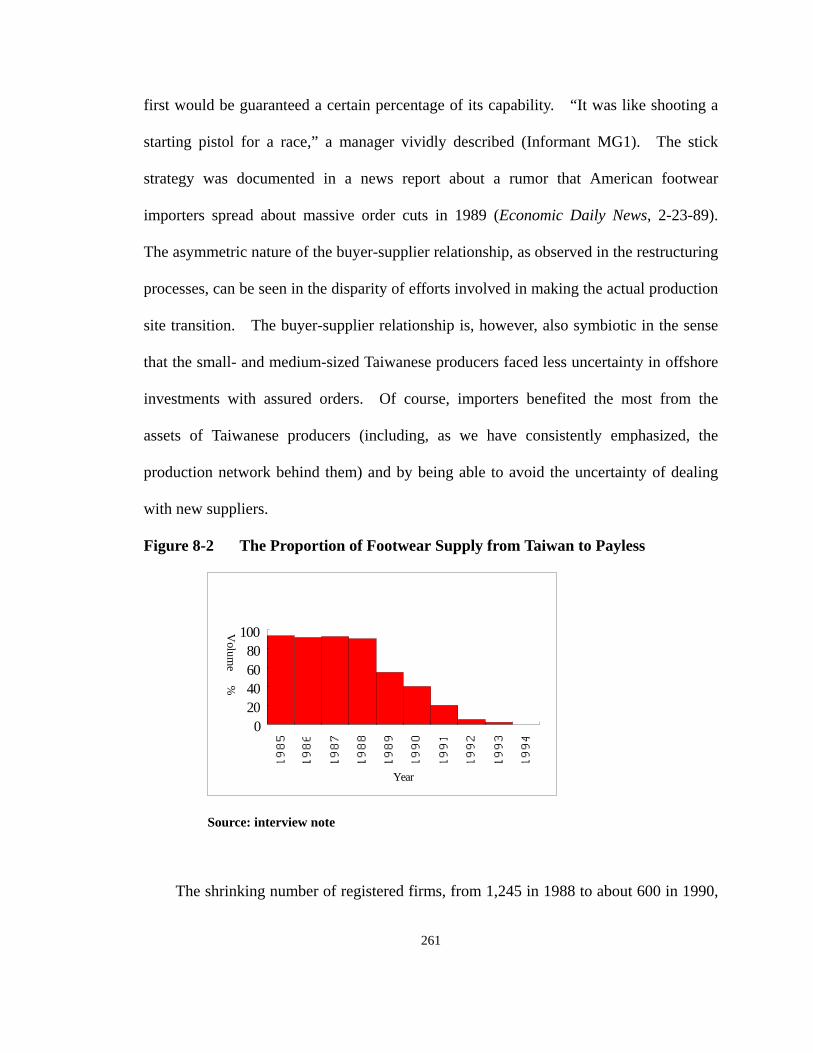
first would be guaranteed a certain percentage of its capability. “It was like shooting a
starting pistol for a race,” a manager vividly described (Informant MG1). The stick
strategy was documented in a news report about a rumor that American footwear
importers spread about massive order cuts in 1989 (Economic Daily News, 2-23-89).
The asymmetric nature of the buyer-supplier relationship, as observed in the restructuring
processes, can be seen in the disparity of efforts involved in making the actual production
site transition. The buyer-supplier relationship is, however, also symbiotic in the sense
that the small- and medium-sized Taiwanese producers faced less uncertainty in offshore
investments with assured orders. Of course, importers benefited the most from the
assets of Taiwanese producers (including, as we have consistently emphasized, the
production network behind them) and by being able to avoid the uncertainty of dealing
with new suppliers.
Figure 8-2 The Proportion of Footwear Supply from Taiwan to Payless
Year
Volum
e (%)
020406080
100
Source: interview note
The shrinking number of registered firms, from 1,245 in 1988 to about 600 in 1990,
261
shows that the Taiwanese footwear industry was experiencing a dramatic decline. Data
about buyer’s sourcing volume from Taiwan show the decline more clearly. In 1989,
almost 100 percent of the footwear supply to Payless ShoeSource was produced in
Taiwan. One year later, volume had dropped to about sixty percent. By1992 it had
less than ten percent. It is now no longer possible to find any Made-in-Taiwan shoes in
the Payless retail stores (see Figure 8-2). Similarly, Nike’s supplying factories in
Taiwan had dropped from eight to three by 1990.
It would be a mistake, however, to conclude from the evidence that Taiwan has
ceased to be a major player in the world footwear industry and that buyers are
abandoning Taiwan.
A 1995 report indicates that Taichung City still has over twenty procurement
headquarters of famous footwear companies, more than double the total ten years ago,
when footwear production was still in Taiwan (Commercial Times, 6-28-95). The “shoe
nest” in Taichung has not disappeared; on the contrary, it is expanding. Taiwan has
become an R&D and procurement center of the world’s footwear industry. To better
understand the way networks have been restructured, the discussion now turns to the
divergent responses of representative footwear companies during this process.
Our discussion begins with Marubeni, a famous Japanese trading company without
contacts with Taiwanese footwear producers before the industry moved its production
offshore. Marubeni had been sourcing a small amount of footwear from northern China
since 1978. The company soon noticed the emergence of a footwear export powerhouse
in southern China, controlled by the Taiwanese. Orders therefore moved gradually to
southern China. Initially, Marubeni set up an office in Hong Kong to take care of the
262
increasing Taiwanese procurements. The company soon learned that the model
development and material procurement of Taiwanese manufacturing factories took place
in Taiwan. In 1994, as the volume increased, Marubeni moved its Hong Kong office to
Taichung City in order to coordinate transactions more efficiently. All the orders to
southern China were placed under the control of the company’s Taichung office. As the
production network became regionalized, the OEM marketing networks in Taiwan
involved in model development and order negotiation were also strengthened.
Marubeni’s journey toward building its Taiwanese office is a typical case in the sense that
the production migration itself forced a new buyer to establish a foothold in Taiwan. It
shows not only the continued vitality of the “shoe nest” in Taichung, but also the
analytical advantage of my approach, which emphasizes the organizational necessity in
the inter-organizational field of OEM market networks.
The case of Marubeni is unusual but not all that different from other buyers or
trading companies. Lotto, an Italian footwear company famous for its soccer shoes, has
been sourcing from Taiwan for over twenty years. Its procurement relied upon a long
term partnership relationship with a local trading company as its sole sourcing agent.
After production lines went offshore, Lotto decided to set up its own regional
procurement office in Taichung City in 1995. It invited a former manager of the trading
company to be the new branch’s general manager. “Lotto wants to speed up model
development and better coordinate its supply by strengthening its East Asian procurement
operation,” said the manager.
Lotto’s move was not unique. Timberland and Rockport both established
procurement offices in Taichung in 1995. Timberland moved large volume orders
263
originally produced in the United States to Taiwan for development and negotiation. I
actually saw Timberland shoes being made in Pou-Chen’s Taiwan factory. The reason
they were still made in Taiwan, according to a factory manager, is Timberland’s human
rights policy which prevents it from sourcing from China. However, uppers were still
coming from Pou-Chen’s Guang-Dong factories. Timberland also reportedly increased
its R&D activities for its Taiwan office. Rockport copied Timberland, except that the
Taichung office was assigned mainly European lines (Commercial Times, 6-28-95).
Converse has never formally established an office in Taiwan. Instead, it set up a
long-term exclusive relationship with a local sourcing agent. Converse’s de facto
regional headquarters have been inside the trading company for over twenty years. Its
Taiwan office has been in charge of all the shoes manufactured outside of the United
States. Although production has now been spread over seven countries, model design,
development, and order-planning all take place first in Converse’s US headquarters and
its Taiwan regional center. Laboratory and wear-testing of shoes are conducted at
manufacturing sites when the production of a country reaches a certain scale. With the
exception of ten assembly lines in the United States, about 80 percent of footwear
sourcing volume was concentrated in China. The Taiwanese footwear producers
obviously control the overwhelming bulk of production outside the United States. All
models are confirmed in Taichung and grading samples are made at the production sites,
except some newly-cultivated sources such as the Philippines and Vietnam. If we look
at the material supplies to each country where production is carried out, it is again clear
that Taiwan is the single most important materials supply center. Converse’s sourcing
network (shown in Table 8-5) shows a more concentrated sourcing organization.
264
Adidas sourced about eighty percent of its footwear supply from East Asia, and the
other twenty percent from Poland and Hungary. Adidas set up its Taiwanese branch
office about ten years ago, but left its long term partner (Sherwood) to handle domestic
sales in Taiwan. In 1993, in response to triangle manufacturing, Adidas decided to
organize Taiwan, China, and Hong Kong as an integrated sourcing unit and set up its
regional headquarters in Hong Kong. There was no longer a separate country manager
for each production site. Instead, the departments of the branches report to the “China,
Taiwan team leader” who has the resposibilty to manage the triangle manufacturing
networks. The idea is to take advantage of Hong Kong as an intermediate post to
smooth out OEM transaction coordination across the Taiwan Strait.
What distinguishes Reebok’s network restructuring from others is its big push
toward “localization,” intended to avoid triangle manufacturing as much as possible.
“Localization” turned out to be a terrible nightmare, as one of its manager admitted.
The technicians and managers of Reebok Taiwan were separated into its five supplying
factories in China. Reebok Taiwan was scaled down as fast and much as possible, a
process the manager describeded as “disintegrating.”
My interviews with Reebok’s suppliers and a senior insider who has been observing
Reebok’s procurement for years support this judgment. Evidence of the problem is the
increase in model turnaround time (from development to shipping) now averaging two
months longer than that of its competitors.117 A recent article reports that in recent years
Reebok has been experiencing massive management turnover, high-level infighting, and
265
117 Both my Nike and Converse interviewees acknowledged their knowledge about Reebok’s trouble and
their own competitive edge.
strategic blunders. In one year, 50 percent of Reebok’s design staff left the company,
along with other marketing and product development managers (Smith 1996). Suppliers
at the production end also felt this instability. They, however, attributed the problem to
friction resulting from drastic “Americanization” since the British Pentland (and its
subsidiary ASCO) withdrew from Reebok in 1991.118
Unlike Reebok, recovering from its failure in sourcing directly from China, Nike
adjusted to take advantage of the networks already established with its suppliers in
Taiwan and Korea. Donaghu and Barff describe Nike’s international subcontracting
networks as a model of “flexible integration” which allows the company a high degree of
versatility in a dynamic and fluid market while still relying on Fordist mass production.
This flexibility is embedded in coordination among Nike’s functionally-specialized
suppliers at different levels of the hierarchical networks (Donaghu and Barff 1990).
Instead of pushing decentralized localization like Reebok, Nike went on to elaborate its
hierarchical sourcing networks.119
118 Reebok has replaced its Taiwanese inspectors in China with local Chinese and also placed them under
the supervision of Filipinos. It is also observed that Reebok is replacing Taiwanese development
technicians with those sent from Reebok American headquarters. These moves fit another plan under
serious consideration in establishing the Subic Bay of Philippine as its regional center in the future.
Someone I interviewed described the emergent pattern as a “three-tier-ethnic system,” with Americans at
the top, Filipinos in the middle, and Chinese at the bottom. The cultural affinity and lower language
barrier between Americans and Filipinos obviously could help reduce the costs of transition. Taiwanese
still are controlling the suppliers outside of Reebok however.
266
119 Harrison describes the Nike network as evidence of “concentration without centralization” which he
said rejects the “small firm myth” created by authors such as Becattini, Granovetter, and Piore and Sabel
(Piore and Sable 1984; Granovetter 1985; Becattini 1990; Harrison 1994). Power among firms is
undoubtly asymmetric and there is a dual labor market in the hierarchical network. However, relying on

Table 8-6 shows Nike’s sourcing networks in 1994. In terms of ownership control,
development location, and material supply, it is clear that there were two major clusters in
Nike’s production networks. Comparing the two, not only is the Taiwanese cluster
larger than the Korean, Taiwan has also become Nike’s regional center in East Asia.
It began with Feng-Tay’s participation in Nike’s Advanced Production Engineering
project experimenting with footwear manufacturing technology. An experimental
factory was built inside Feng-Tay following a project of the State-of-the-Art Production
(SOAP) to design a factory that pushes automation to the extreme. The intention was to
explore the possibility of counterbalancing periodic moves of the production site for
cheap labor.
In 1993, Nike and Feng-Tay jointly established Nike’s Asian R&D Center in Taiwan,
the only one outside its Oregon headquarters. The new organization has over forty
engineers from both Feng-Tay and Nike cooperating to develop advanced design,
development, and manufacturing technologies. Most of the research is at a more
267
Donaghu and Barff’s static analysis as the only evidence, Harrison fails to acknowledge the symbiotic
nature of the inter-firm relationships and tends to see the network formation as originated from the
omnipotent power of Nike. My analyses show instead the multilateral adjustment among firms in network
formation and also the organizational necessity and the embedded assets of Taiwanese suppliers that even
buyers have to adapt to. GCC analysis provides an integrative perspective proving that the socially
embedded industrial district and hierarchical network of control are not incompatible. The flexibility of
the Nike system resides, as Harrison correctly points out, in a combination of low cost, spread risk, and
most of all the speed by which a design for a new model of shoe is transformed into a product at the market.
However, the turnaround time is not simply a function of using highly disciplined labor and deploying mass
production technique (Harrison 1994, p. 208). What should be considered as essential is the
socio-organizational construction of transactions, which brings resources of all kinds into efficient usage.
With that purpose, trust and power are both important; and the later should be understood as relational.
advanced stage than specific model development. The cooperation has deepened and
enhanced Nike’s hierarchical supplying networks by building a powerhouse in Taiwan so
that synergy can be created by linking design and manufacturing more closely.
Feng-Tay is currently providing technical assistance to a Mexican footwear producer just
beginning to make shoes for Nike. Once the factory proves able to meet Nike standards,
Feng-Tay will pour in capital to expand production. This represents a completely
different strategy than its earlier failure in China.
Nike has learned from its experience. The structure and strategy of its network
expansion is now highly competitive. In a clear contrast to its close rival, Nike moved
its Taipei office to Taichung City in 1993 and also expanded its operation scale to
improve coordination, leaving only domestic sales and a garment line in Taipei. While
Reebok targeted triangle manufacturing as a transitional stage to be overcome, Nike fully
exploited the advantages of the new pattern.
The regionalized division of labor, or triangle manufacturing, has become so
prominent a pattern that its scale is able to support the development of some public and
private services which in turn help to enhance its further institutionalization. First, there
is the Taiwanese government’s decision to allow documentary bills (usually called Letter
of Credit, or L/C) to be issued in Hong Kong and cashed in Taiwan. This measure
encourages Taiwanese producers to keep Taiwan as a financial coordination center.
Second, there are Taiwanese companies providing express delivery of development
packages across the Strait. Some are allegedly using Taiwanese and Chinese fishing
boats to transfer packages illegally. Finally, several computer companies sell
networking software and services specifically designed for footwear transactions now
268
practiced regionally. A computer company manager told me that about eighty footwear
companies had already adopted different degrees of computerization to transfer
documents (e.g., model grading) and strengthen logistical control across the strait.
Converse and its partner agent have developed a computer network connecting its
Taichung office with its supplying factories and even some material suppliers. These
connections provide an infrastructure maintaining the flexibility of the industrial district
enjoyed before production migration.
Nike, Reebok, Converse, Adidas, Lotto, Payless ShoeSource, Wal-Mart, and many
other companies each had its own strategic considerations in managing their sourcing
networks. Some of the strategies were well-calculated, some were driven more by
power struggles, many were based on trial and error, and more were consequences of
numerous formal and informal negotiations with suppliers. The point I want to make is
not that firm-level strategies vary among firms, but that the underlying inter-firm
coordination of socially-embedded markets that these divergent moves were responding
to and helped to reveal is of essential importance.
Production Site Transition: Limits of Comparative Advantage
We now take a brief look at the investment of Taiwanese footwear producers in
other Asian countries. Diamond Co. wade the first recorded offshore footwear
investment from Taiwan. The factory was established in a suburb of Manila, in the
Philippines in 1980 during the OMA period. It was, however, mainly targeting the
Philippine market. Thailand, and later Indonesia, were Taiwanese footwear producers’
favorite countries for investment in the mid-1980s, before restrictions to China were
269

losened. They were replaced quickly by China after 1987. There are still about thirty
Taiwanese-owned footwear factories in Thailand, employing between1,000 to 3,000
workers each. About half of the factories are making athletic shoes (Liou 1993).
A survey in 1989 by TFMA shows that 65 percent of the 152 factories who had
overseas investments went to China, 12 percent to Indonesia and 11 percent to Thailand.
Most of the other 71 companies reporting factories under construction invested in China
[TFMA, 1990 #697]. In just a few years, the ratio of investments in China and
Indonesia changed from 1:1 in 1987 to 9:1 in 1992. The peak years of the industry’s
overseas investment were between 1988 and 1991.
In the 1990s, because of increasing tension between China and the U.S. over issues
about trade friction, human rights, and arms control, footwear imports from China were
constantly in danger of being in the sanction list of the Super-301. American importers
urged Taiwanese footwear producers in China to diversify some production capacity to
safer ASEAN countries (The World Journal, 12-1-91). Taiwanese footwear producers
became industrial nomads living under the demand for more flexible triangle
manufacturing. For the reason of dumping, EC started quota restrictions on footwear
imports from China in March of 1994 with the total quota set at 90 million pairs. A 20
percent tariff was also added later.
Although the EC tariff added about 7 to 16 percent to footwear imports from
ASEAN countries in 1995, another wave of offshore investment began in 1994. The
monthly wage rate for China was about US$ 60, Vietnam US$ 50, and Philippines US$
130 in 1995. To spread political risk, the Taiwanese government also promoted the so
called “go south policy,” encouraging Taiwanese producers to invest in its neighboring
270
countries by signing investment protection agreements and building industrial zones with
those countries. Taiwanese investment came back to ASEAN again. Cumulative
investment in the five ASEAN countries and Vietnam during 1959-1993 amounted to
US$ 16.1 billion, roughly equal to the estimated total Taiwanese investment in China
(Chen 1996). In the footwear industry, Indonesia, Vietnam, and other countries can be
seen as complements to China. By including those countries in buying decisions,
importers can reduce their vulnerability to punitive US trade actions against China.
Producers in the DSM tended to use more region-wide strategic planning than those
of the CSM.120 This is partly due to their closer and more intensive coordination with
specific buyers. The Taiwanese footwear supplier who invested in the Philippines told
me that his buyer was evaluating a project to build its regional center in the Subic Bay.
The manufacturer’s strategy was to occupy ahead a strategic position in the sourcing
network so that long-term partnership can be maintained. In the short run, the
Philippine factory also helped to maintain orders for the company’s profitable factories in
China, although it had not yet made money.
In contrast, the manager who was in charge of developing the Indonesian footwear
supply for Pagoda reflected upon his experience:
We surely thought about sourcing directly from Indonesian. Actually we
initially had four Indonesian footwear factories. Despite painful efforts in
communication and persuasion, they just could not meet our delivery and
quality standard. We therefore had to encourage our Taiwanese suppliers to
271
120 For more analyses on the organizational features of transactions in DSM and CSM, please refer to
Chapter 5 and Chapter 6.

invest there. It was difficult to push Taiwanese producers again because they
preferred China. We paid them all the expenditure for a visit to Indonesia,
arranged meetings with Indonesian officials, collected investment information
and documents for them, and promised orders to meet their investments. We
tried every means possible. Finally they agreed. Since then we worked
together perfectly. The problems of reliable sourcing all came down to the
muo-chi (i.e., shared tacit knowledge).
Indonesia is the second largest footwear export country after China. The
Indonesian government made joint investment with local capital a necessity except when
the investments were large scale or in less developed locations. Korean footwear
factories targeted Indonesia as their major offshore production base.121 The major
Taiwanese footwear factories also had plants in Indonesia. Those factories represented
21% of the total Taiwanese investment in Indonesia and imported 80% of their materials
from Taiwan in 1994. While the scale of investment in Indonesia was expanding after
1994, Vietnam emerged as a new favorite for investment.
Vietnam legally allowed foreign investments in 1987, for the first time after the
Communist revolution. In 1989, a new economic policy was announced which
encouraged manufacturing exports. By 1994, anticipating that the American
government would lift the ban on shipping and grant Vietnam with MFN status, the
121 SATRA reported in 1994 that there were 14 Korean footwear factories in Indonesia, 5 in China, 2 in
Thailand, and one in the Phillipines (1994b). My research in the Phillipines finds that there are at least
currently three Korean factories making shoes for Reebok. The proportions however do show the
geographical concentration of Korean footwear investments.
272
Taiwanese had already invested US$ 1.5 billion in Vietnam, and were at the top of
foreign investors. Another US$ 1.5 billion was in the process for approval. Many of
the Taiwanese footwear investors were from the Feng-Yuan township of Taichung County.
There were about 25 Taiwanese footwear factories in Vietnam by 1995. Similar to
Taiwanese investments in other ASEAN countries, they rely heavily on material imports
from Taiwan. Pou-Chen was leading the way and decided to commit US$30 million to
building a new factory with eight production lines on 20 acres outside Ho Chi Minh City.
Along with the expansion of Taiwanese footwear production networks, several
regionally operated Taiwanese footwear groups have emerged.
Pou-Chen group, for example, has factories in Taiwan, China, Indonesia,
and recently Vietnam, reaching a total production scale of 123 assembly lines. It is
estimated that the company will reach yearly revenue of US$ one billion, about 25
percent of the world athletic shoe output, in 1997 (Economic Daily News, 6-2-95). Its
headquarters in Taiwan have become the R&D and financial center of the group.
Chong-Tai is another footwear manufacturing group which is composed of twelve
factories in Taiwan, China, Indonesia and Vietnam. Among the factories, nine are
assembly plants with total capacity of 53 lines by 1995. The other three are outsole
factories. Feng-Tay, the exclusive supplier of Nike, had 41 assembly lines in 1995. Its
new Vietnam factory is expected to operate in 1996 with eight lines. The company’s
Taiwan factory has become a power house for its regional network providing technical
assistance and R&D capability. Feng-Tay’s Taiwan factory still makes the world’s best
shoes in terms of technical difficulty and unit prices.
China is still expected to be the single most important footwear supply site in the
273
years to come and the majority of Taiwanese footwear manufacturers will still remain in
China. Vietnam is generally anticipated to become the second largest footwear
production base in the near future, toping Indonesia at the third. They were mainly
intended to reduce risks in response to the increasing trade friction between China and the
States, for example the constant threat of lifting Most Favorite Nation status. Nike’s
success “because it uses Taiwan-based firms to light the way” (Far Eastern Economic
Review, 11-5-1992) will continue to be imitated and, “as Taiwanese proved in China,
[expanding to new production bases] can be done very quickly” because they “know
exactly what is expected of them and how to get things done” (Footwear News,
11-13-1995).
The industry internationalization has also proved to be an opportunity for Taiwanese
footwear producers to beat down South Korean producers. “[The] huge shoe
manufacturers are ‘locked’ into a one-product scenario needing high volume. They do
not appear to have been as adaptable as the Taiwanse in using offshore opportunities,
focusing on realistic market sectors with added value and being more flexible” (World
Footwear, 10-1993).
In the mid-1990s, the footwear GCCs in East Asia were restructured with new
organzational faces through adjustments among numerous firms in divergent positions
and locations. Those positions are clearly arranged in a hierarchical pattern on the
global landscape of capitalism. At the retail end of the chain, buyers enjoy the highest
profit and the flexibility of OEM sourcing while youngsters dream about having a pair of
Shaq Shoes with a price tag over US$ 100. At the other end of the chain, docile and
cheap labor of developing countries compete with each other in order to get a decent life
274
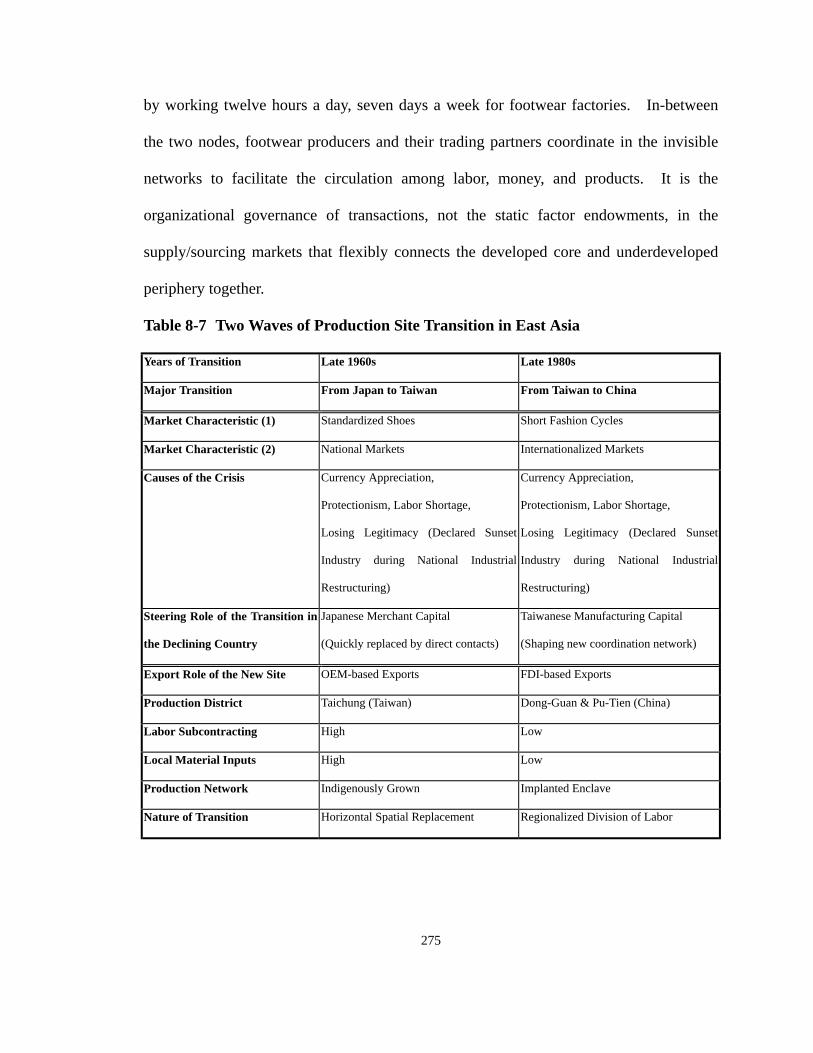
by working twelve hours a day, seven days a week for footwear factories. In-between
the two nodes, footwear producers and their trading partners coordinate in the invisible
networks to facilitate the circulation among labor, money, and products. It is the
organizational governance of transactions, not the static factor endowments, in the
supply/sourcing markets that flexibly connects the developed core and underdeveloped
periphery together.
Table 8-7 Two Waves of Production Site Transition in East Asia
Years of Transition Late 1960s Late 1980s
Major Transition From Japan to Taiwan From Taiwan to China
Market Characteristic (1) Standardized Shoes Short Fashion Cycles
Market Characteristic (2) National Markets Internationalized Markets
Causes of the Crisis Currency Appreciation,
Protectionism, Labor Shortage,
Losing Legitimacy (Declared Sunset
Industry during National Industrial
Restructuring)
Currency Appreciation,
Protectionism, Labor Shortage,
Losing Legitimacy (Declared Sunset
Industry during National Industrial
Restructuring)
Steering Role of the Transition in
the Declining Country
Japanese Merchant Capital
(Quickly replaced by direct contacts)
Taiwanese Manufacturing Capital
(Shaping new coordination network)
Export Role of the New Site OEM-based Exports FDI-based Exports
Production District Taichung (Taiwan) Dong-Guan & Pu-Tien (China)
Labor Subcontracting High Low
Local Material Inputs High Low
Production Network Indigenously Grown Implanted Enclave
Nature of Transition Horizontal Spatial Replacement Regionalized Division of Labor
275
After a long journey investigating the different facets of the structure and history of
the Taiwanese-centered footwear sourcing networks, at the end of the thesis, we are in a
advantageous position to compare the two waves of production site transition in East
Asia. Table 8-7 shows a concise comparison between the production site transition from
Japan to Taiwan in the late 1960s and the transition in the 1980s from Taiwan to China.
While Japanese and Taiwanese footwear producers faced similar crisis involving a
convergence of drastic currency appreciation, pressing protectionism, losing legitimacy
of policy favor, and serious labor shortage, the results of production site transition differ
dramatically in terms of the organziational structure of the GCCs. In the Taichung area,
the footwear industry grew indigenously and exported on an OEM basis. The local
Taiwanese capital had high participation and autonomy in the production process; the
industry’s integration with local economy was high in terms of material supply and
extensive subcontracting. The Japanese merchant capital played a major role by
transfering orders from Japanese suppliers to Taiwanese and were quickly replaced by
direct contacts between Taiwanese producers and their foreign buyers.
In the 1990s, new shoe nests were establisehd in Dong-Guan and Pu-Tien of China.
The transition was steered by Taiwanese manufacturing capital which aggresively shaped
new coordination networks that stretched out in a region-wide platform. Triangle
manufacturing emerged as a result of the regionalized division of labor in which the
production site in Dong-Guan was confined to an implanted enclave economy with very
low chance for the host country to participate beyond cheap labor supply.
The changing conditions in the retail market, the institutionalization processes in the
industry, the patterned transaction organizations emerged out of trial, error, and learning
276
among transacting firms, and the numerous personal networkings that convey
institution-mediated trust are the major forces that helped to shape the market
organizations in a decentralized fashion. Markets are therefore both historically and
socially embedded networks. The comparative advantage theory of neo-classical
economics has fundamental difficulty in studying the issue because it is plagued
essentially by its model of the price-mediated universalistic market. Even the dynamic
model of the product life cycle theory fails to envision the wider scope of learning
involved in a labor-intensive industry like footwear. The newest developing countries,
who now enjoy the massive exports of these products, are just beginning to climb the
steep learning curve, which the product life cycle theory unfortunately thought was
already behind them. It is in preparation for the tough lesson ahead that this study hopes
to contribute.
277
References
Amin, Samir. [1973] 1976. Unequal Development: An Essay on the Social Formation of
Peripheral Capitalism. New York: Monthly Review Press.
Amsden, Alice H. 1989. Asia’s Next Giant: South Korea and Late Industrialization. New
York: Oxford Univeristy Press.
Andaleeb, S. S. 1992. “The Trust Concept: Research Issues for Channels of
Distribution.” Research in Marketing 2: 1-34.
Anonymity. 1983. The Success Stories of Taiwanese Large Enterprises. Taipei:
Shuan-Her Books.
Anonymity. 1989. Ten Years in DongGuang 1979-1988. (in Chinese) Shanghai:
Shanghai People’s Publication.
Anonymity. 1995. “Country Survey: Mexican Shoe Industry.” World Footwear
July/August:24-26.
Anonymity. 1995. “The Arrestment of Ou-Yang Der shocked Hong Kong.” (in Chinese)
Pp. 18-23 in The International Chinese Newsweekly.
Arrow, Kenneth J. 1975. “Gifts and Exchange.” Pp. 13-28 in Altruism, Mortality, and
Economic Theory, edited by Phelps, Edmund S.. New York: Russell Sage.
Austin, James E., Francis Aguilar, and Jian-Sheng Jin. 1990. “Nike in China.” Pp. 29-57
in Strategic Management in Developing Countries, edited by James E. Austin and
Thomas O. Kohn. New York: Free Press.
Aw, Bee Yan. 1992. “An Empirical Model of Mark-Ups in a Quality-Differentiated
Export Market.” Journal of International Economics 33: 327-44. 278
Axelord, Robert. 1984. The Evolution of Cooperation. New York: Basic Books, Inc.
Balassa, Bela. 1981. The Newly Industrializing Countries in the World Economy. New
York: Pergamon Press.
Barber, Bernard. The Logic and Limits of Trust. New Brunswick, N.J.: Rugtgers
University Press.
Barff, R. and J. Austen. 1993. “'It's Gotta be Da Shoes': Domestic Manufacturing,
International Subcontracting, and the Production of Athletic Footwear.”
Environment and Planning 25:1103-1114.
Barrett, Richard E. and Martin King Whyte. 1982. “Dependency Theory and Taiwan:
Analysis of a Deviant Case.” American Journal of Sociology 87:1064-1089.
Becattini, Giacomo. 1990. “The Marshallian Industrial District as a Socio-Econoimic
Notion.” Pp. 37-51 in Industrial Districts and Inter-Firm Co-operation in Italy,
edited by F. Pyke, G. Becattini, and W. Sengenberger. Geneva: International
Institute for Labor Studies.
Blau, Peter M. 1964. Exchange and Power in Social Life. New York: Wiley.
Block, Fred. 1990. Postindustrial Possibilities: A Critique of Economic Discourse.
Berkeley: University of California Press.
Bradach, Jeffrey L. and Robert G. Eccles. 1989. “Price, Authority and Trust: from Ideal
Types to Plural Form.” Annual Review of Sociology:97-118.
Burawoy, Michael. 1979. Manufacturing Consent: Changes in the Labor Process Under
Monopoly Capitalism. Chicago: University of Chicago Press.
Burt, Ronald. 1992. Structural Holes: The Social Structure of Competition. Cambridge:
Harvard University Press.
279
Cardoso, F. H. and E. Faletto. 1979. Dependency and Development in Latin America.
Berkeley: University of California Press.
CERI (Chinese Economic Research Institute). 1995. A Research on the Investment of
Taiwanese Enterprises and Foregin Enterprises in Mainland China. (in Chinese)
Taipei: CERI.
______________________. 1990. Taiwanese Investment in China and Its Impacts on
Industries in Taiwan. (in Chinese) Taipei: CERI.
Chen, Xiangming. 1996. “‘Go West, But Also Go South’: A Comparative Analysis of
Taiwanese Investments in China and Southeast Asia.” Forthcoming article in
Asian Survey.
Cheng, Lu-Lin and Gary Gereffi. 1994. “The Informal Economy in East Asian
Development.” International Journal of Urban and Regional Research
18:194-219.
China External Trade Development Council. 1994. “Taiwanese Synthetic Leather
Exports: Still Standing on Number One.” p. 2 in Exhibition News of Taipei
International Leather Show. (in Chinese) Taipei.
Chu, Wan-Wen. 1995. “Import-Substitution and Export-Led Growth: A Study of
Taiwan's Petrochemical Industry.” (in Chinese) Taiwan: A Radical Quarterly in
Social Sciences:39-69.
Coase, R. H. 1988. The Firm, the Market, and the Law. Chicago: The Univeristy of
Chicago Press.
Coleman, James S. 1988. “Social Capital in the Creation of Human Capital”
280
American Journal of Sociology, 94 (supplement): S95-S120.
Council for Economic Planning and Development. 1995. ROC 1994 Economic Report.
Taipei: Council for Economic Planning and Development.
David, Paul. 1985. “Clio and the Economics of QWERTY.” American Economic Review
75:332-337.
Deng, Shin-Wei. 1993. Analysis on Pearl River Model. (in Chinese) Taipei: Biau-Tzu
Publication.
Deyo, Fredric. 1987. The Political Economy of the New Asian Industrialism. Ithaca:
Cornell University Press.
___________. 1989. Beneath the Miracle. Berkeley: University of California Press.
DiMaggio, Paul J. and Walter W. Powell. 1991. “The Iron Cage Revisited: Institutional
Isomorphism and Collective Rationality in Organizational Field.” Pp. 63-82 in
The New Institutionalism in Organizational Analysis, edited by Walter W. Powell
and paul J. DiMaggio. Chicago: University of Chicago Press.
DiMaggio, Paul. 1992. “Nadel’s Paradox Revisited: Relational and Cultural Aspects of
Organizational Structure.” Pp. 118-142 in Networks and Organizations, edited by
Nitin Nohria and Robert G. Eccles. Boston: Harvard Business School Press.
Directorate-General of Budget, Accounting, and Statistics,. 1995. Human Resource
Annual Report. Taipei.
Donaghu, Michael T., and Richard Barff. 1990. “Nike Just Did It: International
Subcontracting and Flexibility in Athletic Footwear Production.” Regional
Studies 24:537-552.
281
Dore, Ronald. 1983. “Goodwill and the Spirit of Market Capitalism.” British Journal of
Sociology 34:459-82.
___________. 1986. Flexible Rigidities: Industrial and Structural Adjustment in the
Japanese Economy 1970-1980. Stanford: Stanford University Press.
Dumont, Louis. 1977. From Mandeville to Marx: The Genesis and Triumph of
Economic Ideology. Chicago: The University of Chicago Press.
Durkheim, Emile. [1893] 1949. The Division of Labor in Society. Glencoe, IL: Free
Press.
_______________. 1982. The Rules of Sociological Method. London: Macmillan.
Egan, Mary Lou and Ashoka Mody. 1992. “Buyer-Seller Links in Export
Developmentq.” World Development 20:321-34.
Ellison, Christopher and Gary Gereffi. 1990. “Explaining Strategies and Patterns of
Industrial Development.” Pp. 368-403 in Manufacturing Miracles: Paths of
Industrialization in Latin America and East Asia, edited by Gary Gereffi and
Donald L. Wyman. Princeton: Princeton University Press.
Etzioni, Amitai. 1988. The Moral Dimension: Toward a New Economics. New York: Free
Press.
Evans, Peter B. 1979. Dependent Development: The Alliance of Multinational, State and
Local Capital in Brazil. Princeton: Princeton University Press.
Evans, Peter, Dietrich Rueschemeyer, and Theda Skocpol. 1985. Bringing the State Back
In. Cambridge: Cambridge University Press.
Fei, John, Gustav Ranis, and Shirley Kuo. 1979. Growth with Equity: The Taiwan Case.
New York: Oxford University Press.
282
Fontana, Andrea and James H. Frey. 1994. “Interviewing: The Art of Science.” Pp.
361-77 in Handbook of Qualitative Research, edited by Norman K. Denzin and
Yvonna S. Lincoln. London: Sage Publication.
Footwear Industry Association of Korea. 1993. Current Production of Footwear Industry.
Seoul: Footwear Industry Association of Korea.
Frank, Andre Gunder. 1967. Capitalism and Underdevelopment in Latin America:
Historical Studies in Chile and Brazil. New York: Monthly Review Press.
Fukuyama, Francis. 1995. Trust: The Social Virtues and the Creation of Prosperity.
New York: Free Press.
Gambetta, Diego (ed.). 1988. Trust: Making and Breaking Cooperative Relations.
Oxford: Basil Blackwell.
Garfinkel, Harold. 1967. Studies in Ethnomethodology. Englewood Cliffs, N.J.:
Prentice-Hall.
Gereffi, Gary. 1983. The Pharmaceutical Industry and Dependency in the Third World.
Princeton: Princeton University Press.
_____________. 1990. “Path of Industrialization: An Overview.” Pp. 3-31 in
Manufacturing Miracles: Paths of Industrialization in Latin America and East
Asia, edited by Gary Gereffi and Donald L. Wyman. Princeton: Princeton
University Press.
_____________. 1992. “New Realities of Industrial Development in East Asia and Latin
America: Global, Regional, and National Trend.” Pp. 85-112 in States and
Development in the Asian Pacific Rim, edited by Richard P. Appelbaum and
Jeffrey Henderson. Newbury Park: Sage.
283
____________. 1994 a. “Ihe International Economy and Economic Development.” Pp.
206-233 in The Handbook of Economic Sociology, edited by Neil J. Smelser and
Richard Swedberg. Princeton, N.J.: Princeton University Press.
____________. 1994 b. “The Organization of Buyer-Driven Global Commodity Chain:
How U.S. Retailers Shape Overseas Production Networks.” Pp. 95-122 in
Commodity Chain and Global Capitalism, edited by Gary Gereffi and Miguel
Korzeniewicz. London: Praeger.
____________. 1995a. “Contending Paradigms for Cross-Regional Comparison:
Development Strategies and Commodity Chains in East Asia and Latin America.”
Pp. 33-58 in Latin America in Comparative Perspective: New Approaches to
Methods and Analysis, edited by Peter H. Smith. Boulder, CO: Westview Press.
______________. 1995b. “Global Production System and Third World Development.”
Pp. 100-142 in Global Change, Regional Responses: The New International
Context of Development, edited by Barbara Stallings. New York: Cambridge
University Press.
Gereffi, Gary, and Miguel Korzeniewicz. 1990. “Commodity Chains and Footwear
Exports in the Semiperiphery.” Pp. 45-68 in Semiperipheral States in the
World-Economy, edited by William Martin. Westport, CT: Greenwood Press.
Giddens, Anthony. 1979. Central Problems in Social Theory: Action, Structure, and
Contradiction in Social Analysis. Berkeley: University of California Press.
_______________. 1981. A Contemporary Critique of Historical Materialism. Berkeley:
University of California Press.
_______________. 1990. The Consequences of Modernity. Stanford: Stanford University
284

Press.
Gold, Thomas. 1986. State and Society in the Taiwan Miracle. New York: Sharpe.
Granovetter, Mark. 1985. “Economic Action and Social Structure: The Problem of
Embeddedness.” American Journal of Sociology 91:481-510.
Heide, Jan B. 1994. “Interorganizational Governance in Marketing Channels.” Journal of
Marketing 58:71-85.
Henderson, Jeffrey. 1989. The Globalizatin of High Technology Production. London:
Routledge.
Hirschman, Albert O. 1978 [1958]. The Strategy of Economic Development. New York:
Norton.
Ho, S.P.S. 1978. Economic Development of Taiwan, 1860-1970. New Haven: Yale
University Press.
Holmes, John. 1986. “The Organizational and Locational Structure of Production
Subcontracting.” Pp. 80-103 in Production, Work, Territory: The Geographical
Anatomy of Industrial Capitalism, edited by Allen J. Scott and Michael Storper.
Boston: Allen & Unwin.
Hopkins, Terence K. and Immanuel Wallerstein. 1986. “Commodity Chains in the
World-Economy prior to 1800.” Review 10:157-70.
Hsia, C. J. 1988. “Dependency and Development in the Evolution of a Spatial Form: the
Case of Chang-HUa Taiwan.” (in Chinese) Tawian: A Radical Quarterly in Social
Studies 1:263-338.
Hsieh, Chiao-Min. 1964. Taiwan - Illa Formosa. Butterworths: The Catholic University
of America.
285
Hsing, You-Tien. 1993. “Transnational Networks of Taiwan's Small Business and China's
Local Governments: A New Pattern of Foreign Direct Investment. Unpublished
Ph.D. Thesis. Berkeley: University of California at Berkeley.
IDB (Industrial Development Bureau). 1986. Report on the Analysis of the Shoe
Manufacturing Industry Survey. (in Chinese) Taipei: IDB, MOEA.
Inside Fashion. 1993. “Team Fila.” Pp. 10-11 in Inside Fashion.
Investment Commission. 1974. “Survey on the Operation of Foreign Invested
Companies” (in Chinese). Taipei: MOEA.
___________________. 1994. Statistics on Overseas Chinese & Foreign Investment,
Technical Cooperation, Outward Investment, Ourtward Technological
Cooperation, Indirect Mainland Investment (in Chinese). Taipei: Investment
Commission, MOEA.
Johanson, J. and L. G. Mattsson. 1987. “Interorganizational Relations in Industrial
System: A Network Approach Compared with the Transaction Cost Approach.”
International Studies of Management and Organization 27 (1): 34-48.
Kjelleren, Donald L. 1992. “The Mexican Footwear Revolution.” : 16th International
Show of the Suppliers and Fashion Preview for the Leather and Shoe Industry.
Korzeniewicz, Miguel. 1994. “Commodity Chains and Marketing Strategies: Nike and
the Global Athletic Footwear Industry.” Pp. 247-266 in Commodity Chain and
Global Capitalism, edited by Gary Gereffi and Miguel Korzeniewicz. Westport:
Praeger.
Krugman, Paul. 1991. Georgraphy and Trade. Cambridge: The MIT Press.
KSA. 1988. “Marketing Formula for Private Brand.” Pp. 1-4 in The KSA Perspective.
286

Kuttner, Robert. 1984. The Economic Illusion: False Choices Between Prosperity and
Social Justice. Philadelphia: University of Pennsylvania Press.
Lamont, Michele. 1992. Money, Morals, and Manners. Chicago: Chicago University
Press.
Leender, Michiel R., and David L. Blenkhorn. 1988. Reverse Marketing: The New
Buyer-Supplier Relationship. New York: The Free Press.
Leibenstein, Harvey. 1966. “Allocative Efficiency and X-Efficiency.” The American
Economic Review 56:392-415.
Levy, Brian. 1988. “Transaction Costs, the Size of Firms, and Industrial Policy: Lessons
from a Comparative Study of the Footwear Industry in Korea and Taiwan.”
Williamstown, MA:Williams Colleage.
Liang, Kou-Shu and T. H. Lee. 1972. Process and Pattern of Economic Development in
Taiwan. Taipei: Joint Commission on Rural Reconstruction.
Liao, Bo-Wei , Yu-Jien Wang, Ern-Ron Sung, and Pei-Chon Liu. 1992. Chinese Reform
and Economic Development in the Pearl River Delta Area (in Chinese). Hong
Kong: Nan-Yiang Commercial Bank.
Lim, J. D. 1994. “Restructuring of the Footwear Industry and the Industrial Adjustment
of the Pusan Economy.” Environment and Planning A 26:567-81.
Lin, I-Chung. 1991. An Investigation into Taiwanese and U.K. Footwear Marketing
Strategies for the U.K. Market. Unpublished master thesis. Leicester, U.K.:
Leicester Polytechnic.
Lin, Nan. 1982. “Social Resource and Instrumental Action.” Pp. 131-45, in Social
Structure and Network Analysis, edited by Nan Lin and Peter V. Marsden.
287
Beverly Hills: Sage Publication.
Liou, Jin-Ching. [1974] 1992. An Anaysis on Post-War Taiwanese Economy (in Chinese).
Taipei: Ren-Jen Publication.
Lipsey, Richard G. and Wendy Dobson. (ed.) 1987. Shaping Comparative Advantage.
Ontario: Prentice-Hall.
Luhman, Niklas. 1980. Trust and Power. New York: John Wiley.
MAC. 1992. Envestment Environment and Taiwanese Business Operation in Guangdong.
Taipei: MAC.
Macaulay, Steward. 1963. “Non-Contractual Relations in Business: A Preliminary
Study.” American Sociological Review 28:55-67.
Macneil, Ian R. 1980. The New Social Contract: An Inquiry into Modern Contractual
Relations. New Haven: Yale University Press.
Marx, Karl. [1848] 1978. “Communist Manifesto” in Marx-Engels Reader, edited by
Robert C. Tucker. New York: W. W. Norton & Company.
Meyer, John W. and Brian Rowan. 1991. “Institutionalized Organizations: formal
Structure as Myth and Ceremony.” Pp. 41-62 in The New Institionalism i
Organizational Analysis, edited by Walter W. Powell and Paul J. DiMaggio.
Chicago: Univeristy of Chicago Press.
Milliken, Peter. 1994. “What's in a Name.” Pp. 16-17 in Inside Fashion.
Mingione, Enzo. 1991. Fragmented Societies: A Sociology of Economic Life Beyond the
Market Paradigm. Oxford: Basil Blackwell.
North, Douglass C. 1990. Institutions, Institutional Change and Economic
Performance. Cambridge: Cambridge University Press.
288
Ohlin, Bertil. 1935. Interregional and International Trade. Cambridge: Harvard
University Press.
Parsons, Talcott. 1969. Politics and Social Structure. New York: Free Press.
Pen, Nai-Dien. 1989. San Lai Yi Bu. Beijin. (in Chinese) Beijin: Chinese Export Trade
Publication.
Pfeffer, Jeffrey and Gerald R. Salancik. 1978. The External Control of Organizations: A
Resource Dependence Perspective. New York: Harper & Row.
Piore, Michael J. and Charles F. Sabel. 1984. The Second Industrial Divide: Possibilities
for Prosperity. New York: Basic Books.
Polanyi, Karl. [1944] 1957. The Great Transformation. Boston: Beacon Press.
Pooler, Victor H. 1992. Global Purchasing: Reaching for the World. New York: Van
Nonstrand Reinhold.
Porter, Michael E. 1990. The Competitive Advantage of Nations. New York: Free Press.
Portes, A. and S. Sassen-Koob. 1987. “Making It Underground: Comparative material
on the Informal Sector in Western Market Capitalism.” American Journal of
Sociology 93 (1): 30-61.
Portes, Alejandro and Julia Sensenbrenner. 1993. “Embeddedness and Immigration:
Notes on the Social Determinants of Economic Action” American Journal of
Sociology. 98 (6): 1320-50.
Powell, Walter W. 1990. “Neither Market Nor Hierarchy: Network Forms of
Organization.” Research in Organizational Behavior 12:295-336.
______________. 1991. “Expanding the Scope of Institutional Analysis.” Pp. 183-203 in
289
The New Instituionalism in Organizational Analysis, edited by Walter W. Powell
and Paul J. DiMaggio. Chicago: Univeristy of Chicago Press.
Rabellotti, Robert. 1995. “Is There an 'Industrial District Model'? Footwear Districts in
Italy and Mexico Compared.” World Development 23:29-41.
Ragin, Charles C. 1994. Constructing Social Research. London: Pine Forge Press.
Ragin, Charles C. and Howard S. Becker. 1992. What is a Case? Exploring the
Foundation of Social Inquiry. New York: Cambridge Univeristy Press.
Redding, S. Gordon. 1990. The Spirit of Chinese Capitalism. New York: Walter de
Gruyter.
Ricardo, David. [1817] 1951. On the Principles of Political Economy and Taxation.
London: G. Bell and sons, Ltd.
Ross, Robert J.S. and Kent C. Trachte. 1990. Global Capitalism: The New Leviathan.
New York: State University of New York Press.
Ryder, Frank R. 1981. “Challenges to the Use of the Documentary Credit in International
Trade Transactions.” Columbia Journal of World Business 16:36-40.
Sako, Mari. 1992. Prices, Quality and Trust: Inter-firm Relationships in Britain & Japan.
Cambridge: Cambridge University Press.
Sansoni, Silvia and Lori Bongiorno. 1996. “Fila's Full-Court Press to Snare Suburbia.”
Pp. 66 in Business Week.
SATRA. 1994. World Footwear Markets 1994. Kettering: SATRA.
______. 1994b. “South Korea’s Footwear Industry: Fighting for its Life.” Pp. 16-21.
Footwear Business International. May. Kettering: SATRA.
______ . 1995. World Footwear Markets 1995. Kettering: SATRA.
290
Saxenian, A. 1994. Regional Advantage. Cambridge: Harvard University Press.
Schive, Chi. 1990a. “The Next Stage of Industrialization in Taiwan and Korea.” Pp.
267-91 in Manufacturing Miracles:Paths of Industrialization in Latin America
and East Asia, edited by Gary Gereffi and Donald L. Wyman. Princeton:
Princeton University Press.
________________. 1990b. The Foreign Factor: The Multinational Corporation’s
Contribution of the Economic Modernization of the Republic of China. Stanford:
Stanford University Press.
Schmitz, Hubert. 1996. “From Ascribed to Earned Trust in Exporting Clusters.” Paper
presented at Workshop Social Capital, International Trade and Investment,
National Bureau of Economic Research, Stanford, California. 1-2 March.
Schoenberger, Erica. 1991. “The Corporate Interview as a Research Method in Economic
Geography.” Professional Geographer 43:180-189.
Scott, W. Richard. 1992. Organizations: Rational, Natural, and Open Systems.
Englewood Cliff: Prentice Hall.
SGMA. 1995. “The U.S. Athletic Footwear market Today.” WWW file, SGMA.
Shiao, Ju-Jen. 1995. “Another Sunrise for a Sunset Industry.” Journalist Weekly Jan 1 to
Jan 7:60-3.
Shieh, G. S. 1992. Boss' Island: The Subcontracting Network and
Micro-Entrepreneurhip in Taiwan's Development. New York: Peter Lang
Publication Inc.
Sitkin, Sim B. and Nancy L. Roth. 1993. “Explaining the Limited Effectiveness of
Legalistic ‘Remedies’ for Trust/Distrust.” Organization Science 4 (3): 367-392.
291
Skocpol, Theda. 1984. “Emerging Agendas and Recurrent Strategies in Historical
Sociology.” Pp. 356-91 in Vision and Method in Historical Sociology, edited by
Theda Skocpol. New York: Cambridge University Press.
Skoggard, Ian. 1993. Dependency and Rural Industrialization in Taiwan: The History
and Organization of Taiwan's Shoe Industry. Unpublished Ph.D. thesis. New
York: The City University of New York.
Smelser, Neil and Richard Swedberg. ed., 1994. The Handbook of Economic Sociology.
Princeton, N.J.: Princeton University Press.
Smith, Adam. [1776] 1976. An Inquiry into the Nature and Cause of the Wealth of
Nations. Oxford: Clarendon Press.
Smith, Geoffrey. 1996. “Reebok is Tripping Over its Own Laces.” Business Week :62-5.
Stinchcombe, Arthur L. 1990. Information and Organizations. Berkeley: University of
California Press.
Storper, Michael and Richard Walker. 1989. The Capitalist Imperative: Territory,
Technology, and Industrial Growth. New York: Blockwell.
Strasser, J. B. and Laurie Becklund. 1992. Swoosh: The Story of Nike and the Men Who
Played There. New York: Harcourt Brace Jovanovich.
Strauss, Anselm, and Juliet Corbin. 1990. Basics of Qualitative Research: Grounded
Theory Procedures and Techniques. Newbury Park: Sage.
Swedberg, Richard. 1990. Economics and Sociology. Princeton: Princeton University
Press.
_______________. 1994. “Markets as Social Structures.” Pp. 255-282 in The Handbook
of Economic Sociology, edited by Neil J. Smelser and Richard Swedberg.
292

Princeton, N.J.: Princeton University Press.
TFMA (Taiwanese Footwear Manufacturer’s Association). 1986. An Analytic Report of
the Taiwanese Footwear Industry (in Chinese). Taipei: TFMA.
______. 1989. 30-Year History of Taiwan's Shoe Manufacturing Industry. (in Chinese)
Taipei: Taiwanese Footwear Manufacturer’s Association.
______. 1990. “Survey Analysis on Current Situation of Taiwanese Footwear Industry”
(in Chinese). Taiwan Footwear News :39-46.
______. 1991. “Aspects of Footwear Factory Shut-down” (in Chinese). Taiwan Footwear
News :45-8.
______. 1995. “An Overview of Guan-Dong Footwear Industry” (in Chinese). Taiwan
Footwear News :35-38.
______. 1995. Statistical Data. Taipei: Taiwan Footwear Manufacturers Association.
Thomson, Rossq. 1989. The Path to Mechanized Shoe Productioon in the United States.
Chapel Hill, NC: The University of North Carolina Press.
Uchino, Tatsuro. 1983. Japan’s Postwar Economy: An Insider’s View of Its History and
Its Future. New York: Kodansha International.
Vernon, Raymond. 1966. “International Investment and International Trade in the
Product Cycle.” Quarterly Journal of Economics 80:190-207.
Wade, Robert. 1990. Governing the Market: Economic Theory and the Role of
Government in East Asian Industrialization. Princeton: Princeton University
Press.
Wang, Hong-Zen. 1988. Post-War Development of Private Monopoly Capital in Taiwan
(in Chinese). Unpublished master thesis, Department of Sociology. Taipei:
293

National Taiwan University.
Wang, Kenn-Hwan. 1995. “The State and the Development of Taiwan’s Petrochemical
Industry.” (in Chinese) Taiwan: A Radical Quarterly in Social Sciences. No. 18:
1-37.
Weber, Max. 1946. From Max Weber: Essays in Sociology. Translated by Hans H.
Gerth and C. Wright Mills. New York: Oxford University Press. (Original
essays published 1906-1924).
Wellman, Barry and S. D. Berkowitz. 1988. Social Structures: A Network Approach.
New York: Cambridge University Press.
Williamson, O. E. 1975. Markets and Hierarchies: Analysis and Antitrust Implication.
New York: Free Press.
Wu, Jien-Min. 1995. “Strange Bed-Fellows: An Enquiry into Pseudo-Joint-Venture
Relationship between the Local Authorities and a Taiwanese Corporation in the
Pearl River Delta.” in Regional Development of Mainland China, edited by NTU
Department of Geography. Taipei.
Yoffie, David B. 1983. “Adjustment in the Footwear Industry: The Consequences of
Orderly Marketing Agreements.” Pp. 313-349 in American Industry in
International Competition. Ithaca: Cornell University Press.
_____________. 1994. International Trade and Competition. New York: McGraw-Hill,
Inc.
294
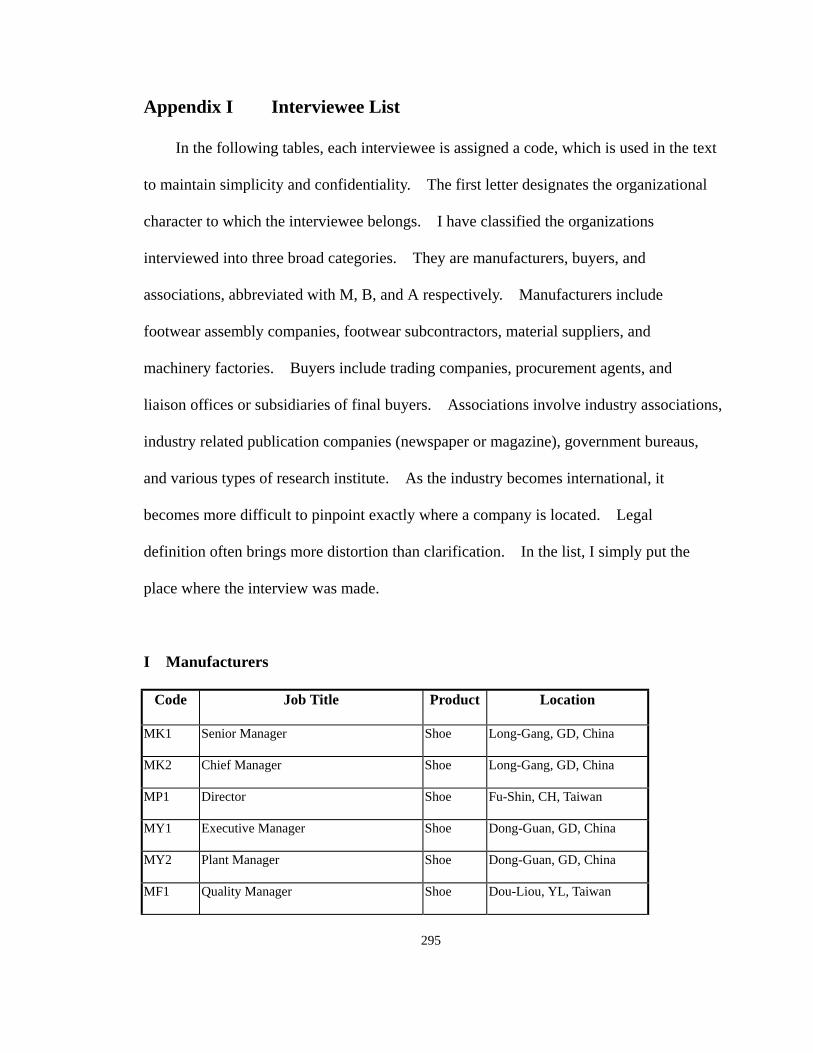
Appendix I Interviewee List
In the following tables, each interviewee is assigned a code, which is used in the text
to maintain simplicity and confidentiality. The first letter designates the organizational
character to which the interviewee belongs. I have classified the organizations
interviewed into three broad categories. They are manufacturers, buyers, and
associations, abbreviated with M, B, and A respectively. Manufacturers include
footwear assembly companies, footwear subcontractors, material suppliers, and
machinery factories. Buyers include trading companies, procurement agents, and
liaison offices or subsidiaries of final buyers. Associations involve industry associations,
industry related publication companies (newspaper or magazine), government bureaus,
and various types of research institute. As the industry becomes international, it
becomes more difficult to pinpoint exactly where a company is located. Legal
definition often brings more distortion than clarification. In the list, I simply put the
place where the interview was made.
I Manufacturers
Code Job Title Product Location
MK1 Senior Manager Shoe Long-Gang, GD, China
MK2 Chief Manager Shoe Long-Gang, GD, China
MP1 Director Shoe Fu-Shin, CH, Taiwan
MY1 Executive Manager Shoe Dong-Guan, GD, China
MY2 Plant Manager Shoe Dong-Guan, GD, China
MF1 Quality Manager Shoe Dou-Liou, YL, Taiwan
295
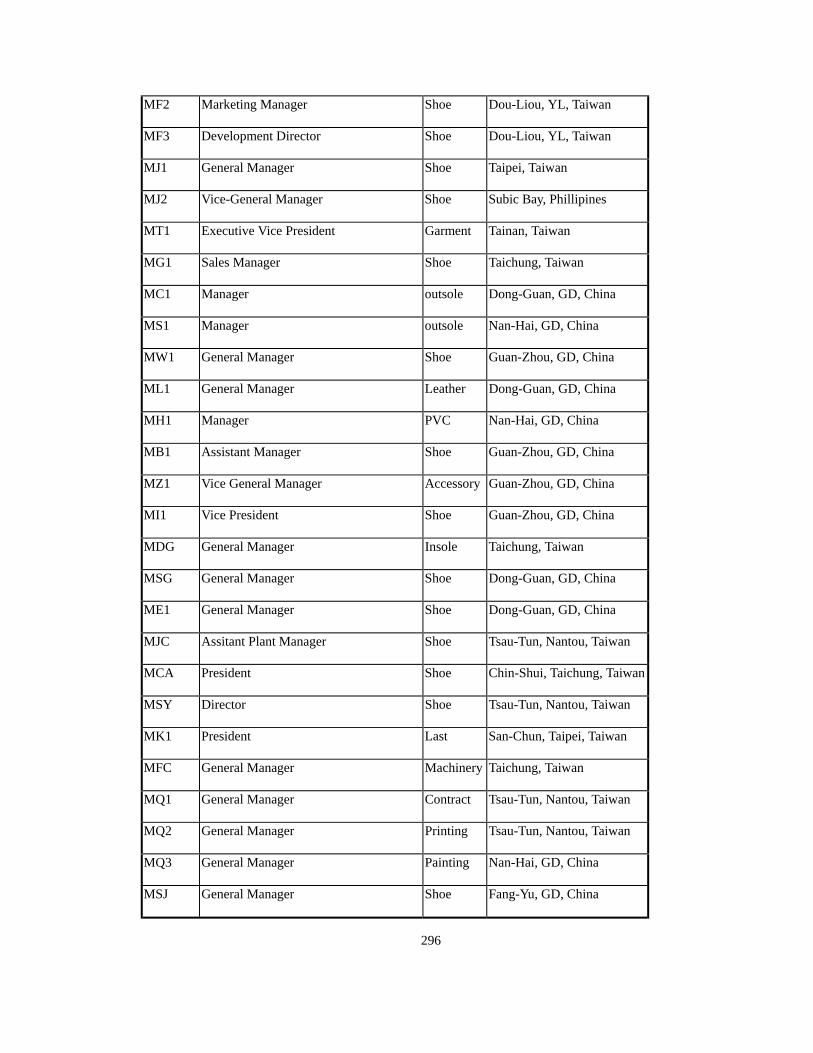
MF2 Marketing Manager Shoe Dou-Liou, YL, Taiwan
MF3 Development Director Shoe Dou-Liou, YL, Taiwan
MJ1 General Manager Shoe Taipei, Taiwan
MJ2 Vice-General Manager Shoe Subic Bay, Phillipines
MT1 Executive Vice President Garment Tainan, Taiwan
MG1 Sales Manager Shoe Taichung, Taiwan
MC1 Manager outsole Dong-Guan, GD, China
MS1 Manager outsole Nan-Hai, GD, China
MW1 General Manager Shoe Guan-Zhou, GD, China
ML1 General Manager Leather Dong-Guan, GD, China
MH1 Manager PVC Nan-Hai, GD, China
MB1 Assistant Manager Shoe Guan-Zhou, GD, China
MZ1 Vice General Manager Accessory Guan-Zhou, GD, China
MI1 Vice President Shoe Guan-Zhou, GD, China
MDG General Manager Insole Taichung, Taiwan
MSG General Manager Shoe Dong-Guan, GD, China
ME1 General Manager Shoe Dong-Guan, GD, China
MJC Assitant Plant Manager Shoe Tsau-Tun, Nantou, Taiwan
MCA President Shoe Chin-Shui, Taichung, Taiwan
MSY Director Shoe Tsau-Tun, Nantou, Taiwan
MK1 President Last San-Chun, Taipei, Taiwan
MFC General Manager Machinery Taichung, Taiwan
MQ1 General Manager Contract Tsau-Tun, Nantou, Taiwan
MQ2 General Manager Printing Tsau-Tun, Nantou, Taiwan
MQ3 General Manager Painting Nan-Hai, GD, China
MSJ General Manager Shoe Fang-Yu, GD, China
296
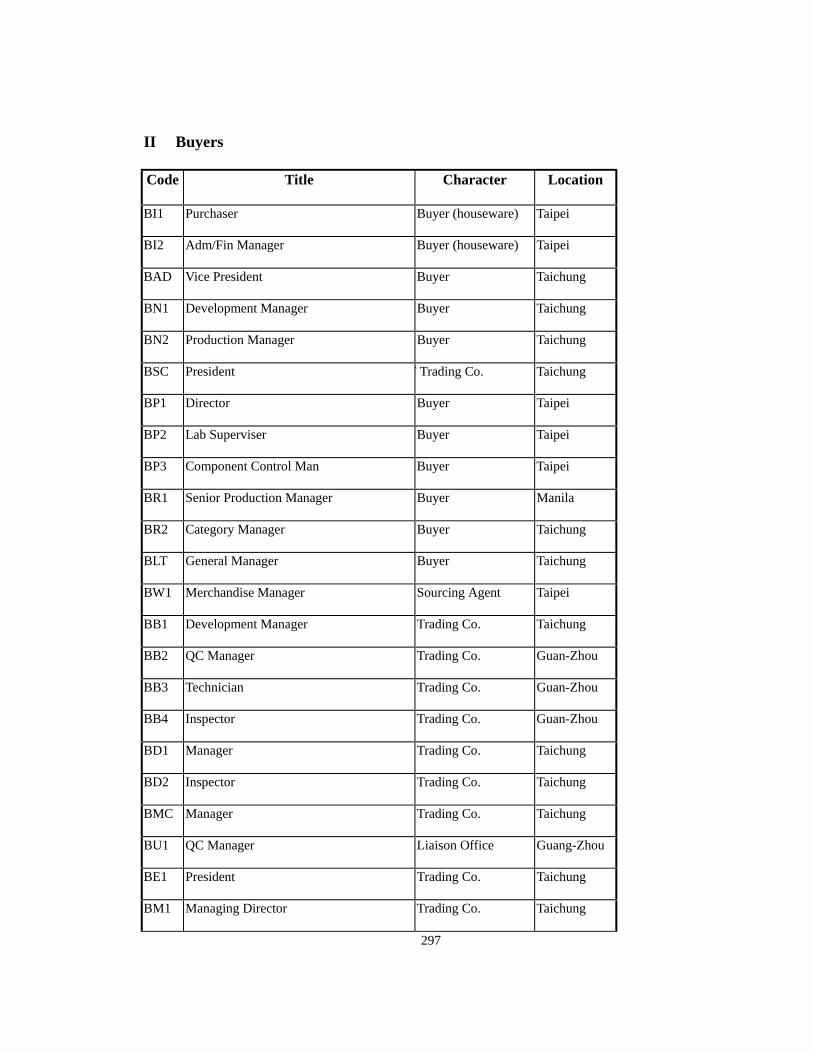
II Buyers
297
Code Title Character Location
BI1 Purchaser Buyer (houseware) Taipei
BI2 Adm/Fin Manager Buyer (houseware) Taipei
BAD Vice President Buyer Taichung
BN1 Development Manager Buyer Taichung
BN2 Production Manager Buyer Taichung
BSC President T Trading Co. Taichung
BP1 Director Buyer Taipei
BP2 Lab Superviser Buyer Taipei
BP3 Component Control Man Buyer Taipei
BR1 Senior Production Manager Buyer Manila
BR2 Category Manager Buyer Taichung
BLT General Manager Buyer Taichung
BW1 Merchandise Manager Sourcing Agent Taipei
BB1 Development Manager Trading Co. Taichung
BB2 QC Manager Trading Co. Guan-Zhou
BB3 Technician Trading Co. Guan-Zhou
BB4 Inspector Trading Co. Guan-Zhou
BD1 Manager Trading Co. Taichung
BD2 Inspector Trading Co. Taichung
BMC Manager Trading Co. Taichung
BU1 QC Manager Liaison Office Guang-Zhou
BE1 President Trading Co. Taichung
BM1 Managing Director Trading Co. Taichung

BCS Director Buyer Taichung
BH1 Managing Director Buyer Taichung
BH2 Manager Buyer Taichung
BH3 General Manager Buyer Taichung
BV1 Director Trading Co. Taichung
BV2 President Trading Co. Taichung
BED Business Manager Trading Co. Taipei
III Associations
Code Title Organization Location
AF1 Exec Director Taiwan Footwear Manufacurer’s Association Taipei
AF2 Section Chief Taiwan Footwear Manufacturer’s Association Taipei
AI1 Division Director Industrial Development Bureau, MOEA Taipei
AI2 Section Chief Industrial Development Bureau, MOEA Taipei
AT1 General Manager Taiwan Footwear Technology Institute Taichung
AT2 Specialist Taiwan Footwear Technology Institute Taichung
AC1 Specialist CSD Industrial Coordination Center Taipei
AN1 Chief Editor Footwear News Semimonthly Taipei
AP1 Reporter Commercial Times Taipei
AJ1 Mana Director Japan Rubber Footwear Association Tokyo
AT1 Professor Tung-Hai University Taichung
AS1 Business Service Manager SATRA Taichung
AC1 Officer (Construction Section) Tsau-Tun Town Government Nantou
AS1 Specalist CSD Industrial Coordination Center Taipei
AUC Teacher (Footwear Specialty) United Technical Colleague Miau-Li
298
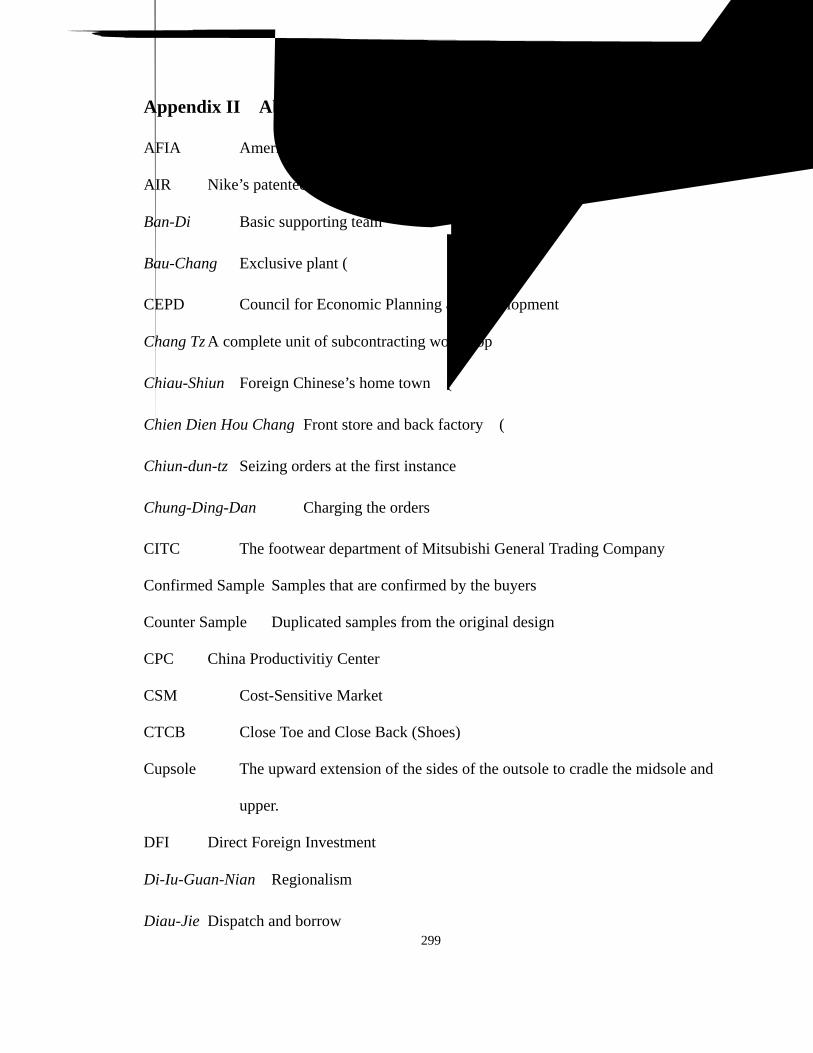
Appendix II Abbreviations and Acronyms
AFIA American Footwear Industries Association
AIR Nike’s patented cushion component, also called Air Bag
Ban-Di Basic supporting team (班底)
Bau-Chang Exclusive plant (包廠)
CEPD Council for Economic Planning and Development
Chang Tz A complete unit of subcontracting workshop (場子)
Chiau-Shiun Foreign Chinese’s home town (僑鄉)
Chien Dien Hou Chang Front store and back factory (前店後廠)
Chiun-dun-tz Seizing orders at the first instance (搶單子)
Chung-Ding-Dan Charging the orders (搶訂單)
CITC The footwear department of Mitsubishi General Trading Company
Confirmed Sample Samples that are confirmed by the buyers
Counter Sample Duplicated samples from the original design
CPC China Productivitiy Center
CSM Cost-Sensitive Market
CTCB Close Toe and Close Back (Shoes)
Cupsole The upward extension of the sides of the outsole to cradle the midsole and
upper.
DFI Direct Foreign Investment
Di-Iu-Guan-Nian Regionalism (地域觀念)
Diau-Jie Dispatch and borrow (調借) 299
DSM Design-Sensitive Market
EPZ Export Processing Zone
EVA Ethylene Yinyl Acetate
FDI Foreign Direct Investment
GCC Global Commodity Chains
Grading The process of preparing ties, molds, and patterns for full sizes
Gan-Ching Emotional tie (人情)
Guanxi Personal connection (關係)
IDB Industrial Development Bureau, MOEA
ITB International Trade Bureau, MOEA
ITC International Trade Commission
Juo Da, Chung Tsai Huei Meng You can charge forcefully, only when you have large
scale (做大,衝才會猛)
Lai-Liao-Jia-Gong Bringing materials for processing (來料加工)
Last The form around which the shoe is built.
L/C Letter of Credit
LDC Less Developed Countries
Liang-Tou-Tzai-Uai-Da-Jin-Da-Chu Two heads outside, big in-flow and out-flow
(兩頭在外,大進大出)
Iou-Chian-Da-Jia-Juan Share the chance of making money, when it comes
(有錢大家賺)
MAC Mainland Affair Committee
300
MFN Most Favorite Nation
Midsole A layer of polymer material between the insole and outsole that provides a
shoe’s cushioning, sometimes enhanced by foam, gel or air cushioning
units.
MNC Multinational Corporation
MOEA Ministry of Economic Affairs
MOF Ministry of Finance
Muo-Chi Shared implicit knowledge (默契)
NIC Newly Industrializing Countries
NIE Newly Industrializing Economy
OBM Original Brandname Manufacturing
ODM Original Design Manufacturing
OEM Original Equipment Manufacturing
OMA Orderly Marketing Agreement
Outsole The bottom surface of the shoe, made of a rubber-type compound or PU.
PU The abbreviation for polyurethane, a synthetic polymer used in both the
midsole and outsole.
PVC Polyvinyl chloride
QC Quality Control
QRC Quota Research Committee
Ren-Ching-Jai Relationship Debt (人情債)
Ren Jia Households (人家)
301
Request Sample Samples that are requested to be developed by buyers
Review Sample Samples that are subject to internal evaluation for development
Salesman Sample Samples that are sent to the retailers for deciding orders
San-Lai-Yi-Bu Three kinds of processing contracts and one kind of
compensation trade(三來一補)
San-Zi Three kinds of foreign investment (三資)
SATRA Shoes and Allied Trade Research Association
SEZ Special Economic Zone
SGMA Sports Good Manufacturer’s Association
Shin-Yun Credibility (信用)
Shy-Fuh (Shoe) Master (師傅)
TFMA Taiwan Footwear Manufacturer’s Association
TFRI Taiwan Footwear Research Institute
THEA Taiwan Hat Exporter’s Association
TLPIA Taiwan Leather Products Industrial Association
TNC Transnational Corporation
TPSEA Taiwan Plastic Slipper Exporter’s Association
TPSIA Taiwan Plastic Shoe Industrial Association
TRPIA Taiwan Rubber Products Industrial Association
Upper The leather or synthetic part of the shoe that encases the foot, often
reinforced with stabilizing straps.
VER Voluntary Export Restrain
302
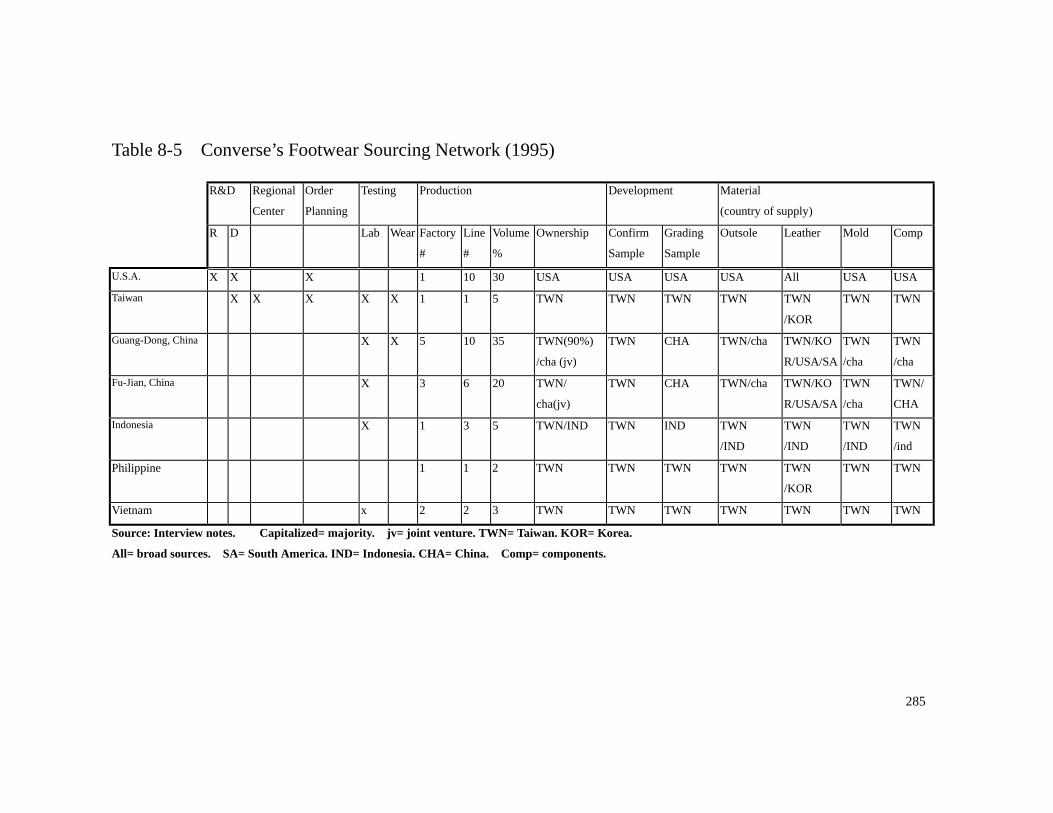
Table 8-5 Converse’s Footwear Sourcing Network (1995)
R&D Regional
Center
Order
Planning
Testing
Production
Development
Material
(country of supply)
R D Lab Factory
#
Wear Line
#
Volume
%
Ownership Confirm
Sample
Grading
Sample
Outsole Leather Mold Comp
U.S.A. X X X 1 10 30 USA USA USA USA All USA USA
Taiwan X X X X X 1 1 5 TWN TWN TWN TWN TWN
/KOR
TWN TWN
Guang-Dong, China X X 5 10 35 TWN(90%)
/cha (jv)
TWN CHA TWN/cha TWN/KO
R/USA/SA
TWN
/cha
TWN
/cha
Fu-Jian, China X 3 6 20 TWN/
cha(jv)
TWN CHA TWN/cha TWN/KO
R/USA/SA
TWN
/cha
TWN/
CHA
Indonesia X 1 3 5 TWN/IND TWN IND TWN
/IND
TWN
/IND
TWN
/IND
TWN
/ind
Philippine 1 1 2 TWN TWN TWN TWN TWN
/KOR
TWN TWN
Vietnam x 2 2 3 TWN TWN TWN TWN TWN TWN TWN
Source: Interview notes. Capitalized= majority. jv= joint venture. TWN= Taiwan. KOR= Korea.
All= broad sources. SA= South America. IND= Indonesia. CHA= China. Comp= components.
285
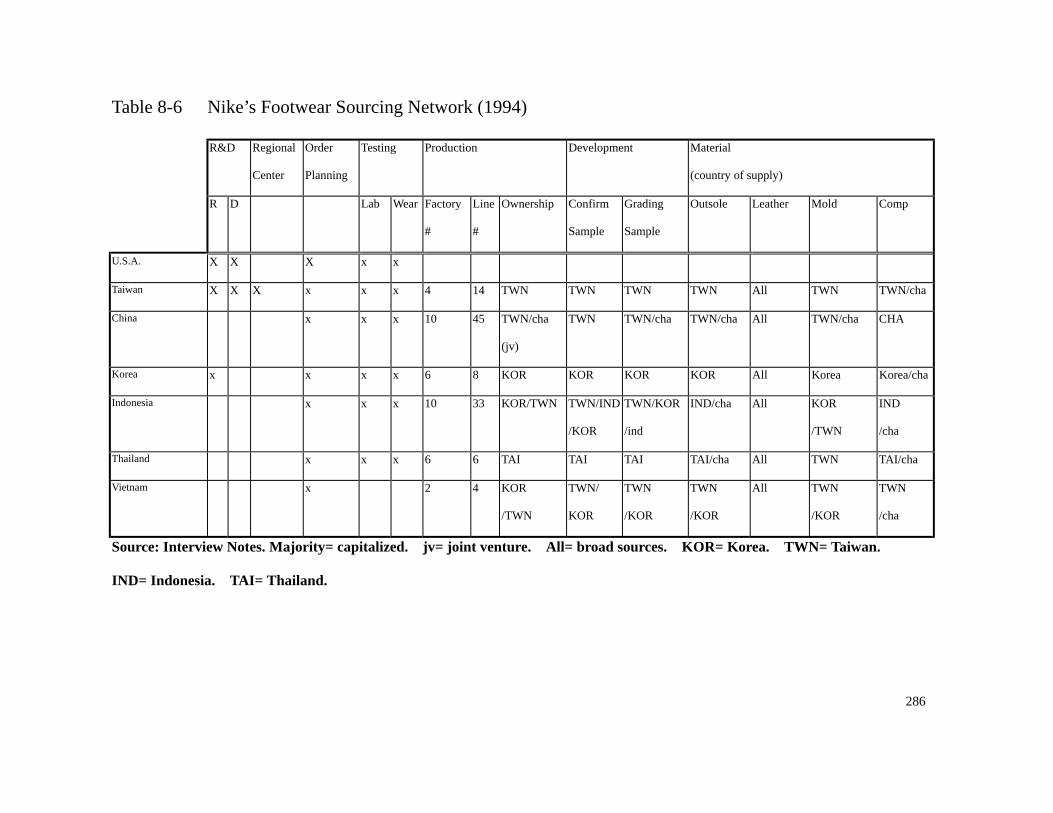
Table 8-6 Nike’s Footwear Sourcing Network (1994)
R&D Regional
Center
Order
Planning
Testing
Production
Development Material
(country of supply)
R D Lab Factory
#
Wear OwnershipLine
#
Confirm
Sample
Grading
Sample
Outsole Leather Mold Comp
U.S.A. X X X x x
Taiwan X X X x x x 4 14 TWN TWN TWN TWN All TWN TWN/cha
China x x x 10 45 TWN/cha
(jv)
TWN TWN/cha TWN/cha All TWN/cha CHA
Korea x x x x 6 8 KOR KOR KOR KOR All Korea Korea/cha
Indonesia x x x 10 33 KOR/TWN TWN/IND TWN/KOR
/KOR /ind
IND/cha All KOR
/TWN
IND
/cha
Thailand x x x 6 6 TAI TAI TAI TAI/cha All TWN TAI/cha
Vietnam x 2 4 KOR
/TWN
TWN/
KOR
TWN
/KOR
TWN
/KOR
All TWN
/KOR
TWN
/cha
Source: Interview Notes. Majority= capitalized. jv= joint venture. All= broad sources. KOR= Korea. TWN= Taiwan.
IND= Indonesia. TAI= Thailand.
286
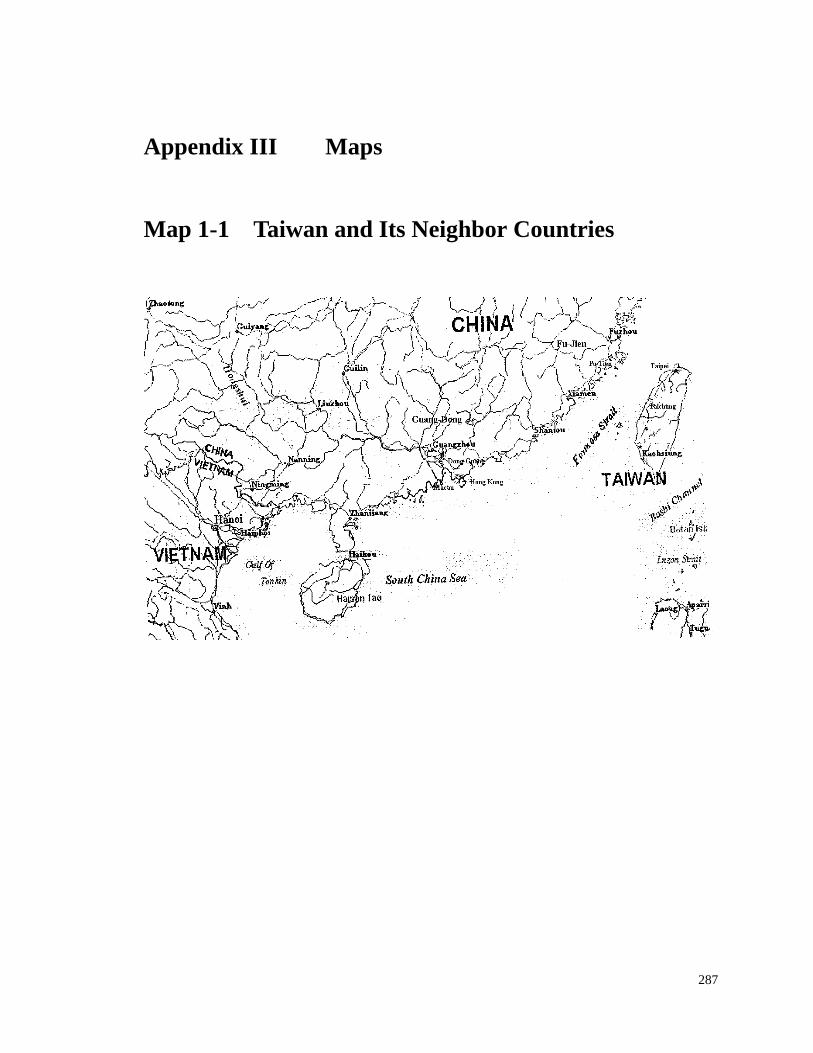
Appendix III Maps Map 1-1 Taiwan and Its Neighbor Countries
287
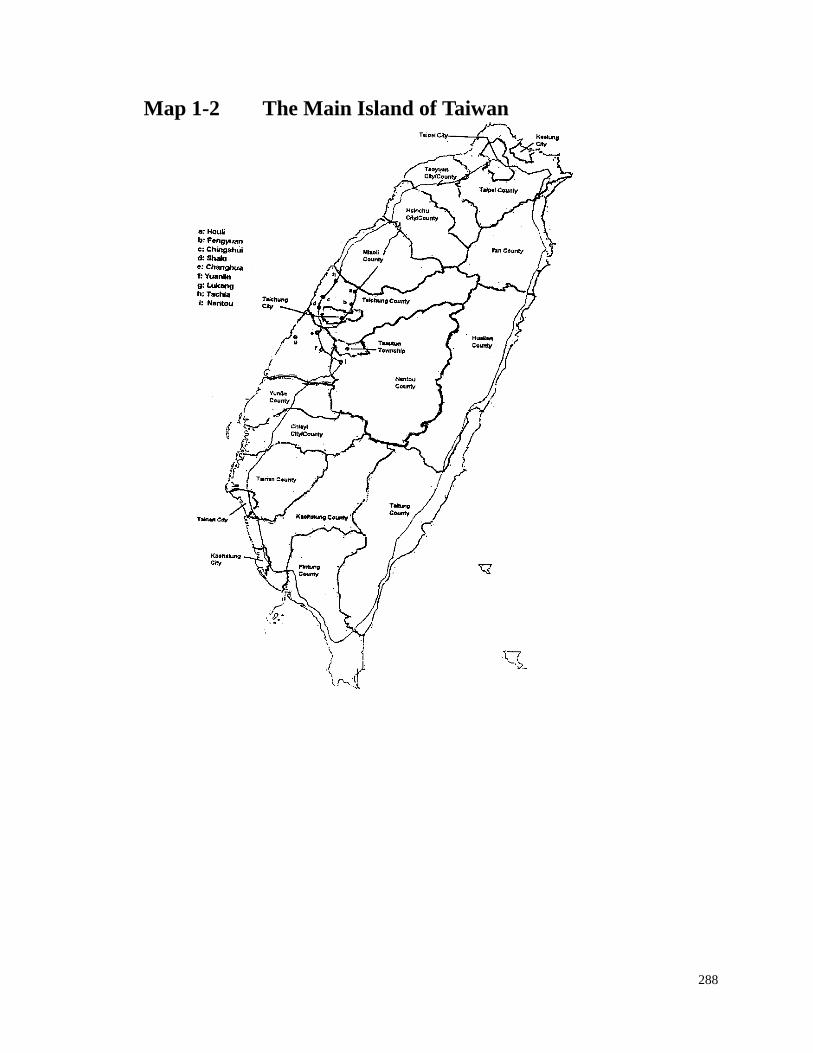
Map 1-2 The Main Island of Taiwan
288

Map 7-1 Pearl River Delta and Dong-Guang City
289