Optimisation and Prioritisation of Flows of Air Traffic through ...
9
Optimisation and Prioritisation of Flows of Air Traffic through an ATM Network Hugo de Jonge and Ron Seljée ATM department (ATAP) National Aerospace Laboratory, the Netherlands (NLR) Amsterdam, the Netherlands [email protected], [email protected] Abstract—Air Transport operations are performed through a network of airports connected by airspace sectors. This network is vulnerable to disruption. Specifically, large congested hub airports are sensitive to suffer from accumulating delays. SESAR developments are aiming to improve the quality of planning and that can be used to improve the quality of regulating traffic flows through this network in case of disruption. The research in this paper addresses the design and development of a prototype of an algorithm to allow improvement of ATM regulations by optimising and prioritising the management of the ATM network. This prototype is used to conduct an explorative experiment and to show potential benefits of this algorithm. The most remarkable results demonstrated that re-allocation of imposed pre-departure delays by prioritisation, will improve overall performance of the ATM Network. But even more important, both, main and hub airports, showed very significant enhanced performance, whilst imposed pre-departure delays could be reduced for the selected scenario with major reductions up to 40% for these airports. Keywords: ATM; Demand & Capacity Balancing (DCB); Planning; Flow Management; Optimization; Congestion; Capacity I. INTRODUCTION This paper describes the research and design of a prototype of an algorithm to allow improvement of Air Traffic Flow Management (ATFM) regulations by optimising and prioritising these regulations within an ATM network. This prototype is used to conduct an explorative experiment to show the potential benefits of this algorithm [1] and [2]. The experimental objectives were: To analyse city-pair connectivity and the performance of the ATM network in light of this connectivity, To investigate the sensitivity of the network for congestion, disruption and other capacity constraining conditions, and To analyse which planning strategy could help to solve congestion and to mitigate disruption. A network analysis model has been developed to perform enhanced ATFM, and this publication demonstrates its potential to contribute in solving today’s problems in the ATM network, and in particular to solve congestion around saturated hub airports. This algorithm could facilitate enhanced ATFM operations allowing: To select a local context in space and time and to determine if an overload condition occurs. To impose a pre-departure delay solving the overload condition, whilst being able to assess its impact on other flight operations. To apply optimisation towards minimised imposed delays, whilst solving the overload conditions. To apply optimisation towards the economic value of flight by prioritisation, taking into account the identification of high valued flows or high valued individual flights. To provide output that allows evaluating the consequences of delay assignments on the performance of individual flights, classes of flights and on the overall performance of flight operations, under constraining conditions. Application of Petri-nets turned out to be attractive to manage an ATM Network. This approach is innovative compared to other research in managing ATM Networks [3]. Some R&D results are presented to demonstrate the potential of these tools to validate ATM benefits and how these benefits can be assessed by applying the tools on a representative ATM network for Air Transport operations in Europe. The objective is to convince ATM users of the benefits that can be obtained by regulating departure flows in a different way than today by use of enhanced ATFM algorithms. This will be achieved by applying ATFM with maximum throughput, best achievable efficiency and minimum impact on flight performance. The measured benefits turned out to be significant and the tools to evaluate them will provide contributions to find the answers on questions about enhanced city-pair network connectivity, ATM network performance and options to mitigate disruption [1] and [2]. II. CONTEXT AND APPROACH A. Context Deficiencies in design and use of the ATM network are amongst the major problems of Air Traffic Management (ATM) in Europe. Enhanced ATM in Europe has the potential to reduce fuel consumption and emissions by about 10% per flight [4] and [5], and the European Commission (EC) promotes that “...the use of transparent and efficient rules will Second SESAR Innovation Days, 27 th – 29 th November 2012
-
Upload
khangminh22 -
Category
Documents
-
view
1 -
download
0
Transcript of Optimisation and Prioritisation of Flows of Air Traffic through ...

Optimisation and Prioritisation of Flows of Air Traffic through an ATM Network
Hugo de Jonge and Ron Seljée ATM department (ATAP)
National Aerospace Laboratory, the Netherlands (NLR) Amsterdam, the Netherlands
[email protected], [email protected]
Abstract—Air Transport operations are performed through a network of airports connected by airspace sectors. This network is vulnerable to disruption. Specifically, large congested hub airports are sensitive to suffer from accumulating delays. SESAR developments are aiming to improve the quality of planning and that can be used to improve the quality of regulating traffic flows through this network in case of disruption. The research in this paper addresses the design and development of a prototype of an algorithm to allow improvement of ATM regulations by optimising and prioritising the management of the ATM network. This prototype is used to conduct an explorative experiment and to show potential benefits of this algorithm. The most remarkable results demonstrated that re-allocation of imposed pre-departure delays by prioritisation, will improve overall performance of the ATM Network. But even more important, both, main and hub airports, showed very significant enhanced performance, whilst imposed pre-departure delays could be reduced for the selected scenario with major reductions up to 40% for these airports.
Keywords: ATM; Demand & Capacity Balancing (DCB); Planning; Flow Management; Optimization; Congestion; Capacity
I. INTRODUCTION
This paper describes the research and design of a prototype of an algorithm to allow improvement of Air Traffic Flow Management (ATFM) regulations by optimising and prioritising these regulations within an ATM network. This prototype is used to conduct an explorative experiment to show the potential benefits of this algorithm [1] and [2]. The experimental objectives were: To analyse city-pair connectivity and the performance of
the ATM network in light of this connectivity, To investigate the sensitivity of the network for
congestion, disruption and other capacity constraining conditions, and
To analyse which planning strategy could help to solve congestion and to mitigate disruption.
A network analysis model has been developed to perform enhanced ATFM, and this publication demonstrates its potential to contribute in solving today’s problems in the ATM network, and in particular to solve congestion around saturated hub airports. This algorithm could facilitate enhanced ATFM operations allowing:
To select a local context in space and time and to determine if an overload condition occurs.
To impose a pre-departure delay solving the overload condition, whilst being able to assess its impact on other flight operations.
To apply optimisation towards minimised imposed delays, whilst solving the overload conditions.
To apply optimisation towards the economic value of flight by prioritisation, taking into account the identification of high valued flows or high valued individual flights.
To provide output that allows evaluating the consequences of delay assignments on the performance of individual flights, classes of flights and on the overall performance of flight operations, under constraining conditions.
Application of Petri-nets turned out to be attractive to manage an ATM Network. This approach is innovative compared to other research in managing ATM Networks [3].
Some R&D results are presented to demonstrate the potential of these tools to validate ATM benefits and how these benefits can be assessed by applying the tools on a representative ATM network for Air Transport operations in Europe. The objective is to convince ATM users of the benefits that can be obtained by regulating departure flows in a different way than today by use of enhanced ATFM algorithms. This will be achieved by applying ATFM with maximum throughput, best achievable efficiency and minimum impact on flight performance. The measured benefits turned out to be significant and the tools to evaluate them will provide contributions to find the answers on questions about enhanced city-pair network connectivity, ATM network performance and options to mitigate disruption [1] and [2].
II. CONTEXT AND APPROACH
A. Context
Deficiencies in design and use of the ATM network are amongst the major problems of Air Traffic Management (ATM) in Europe. Enhanced ATM in Europe has the potential to reduce fuel consumption and emissions by about 10% per flight [4] and [5], and the European Commission (EC) promotes that “...the use of transparent and efficient rules will
Second SESAR Innovation Days, 27th – 29th November 2012

provide a flexible and timely management of air traffic flows at European level and will optimise the use of air routes.” [5]. This justifies considering optimisation of performance of the ATM network as a major contributor to enhanced Air Transport operations.
From literature survey [3], it became evident that most published research on Flow Management stems from the USA. Most research addresses single resource problems, caused e.g. by weather conditions, and solved by mixed integer linear programming technics. The European approach has to address multiple resource problems through an extensive network, often with routine-based congestion. In addition, planning and decision making has to be traceable and transparent, making optimization by linear programming less attractive. Some examples of applicable studies are: [14], [15], [16], [17], [18].
The principles of an operational concept for management, planning and executive operations of an ATM network were developed within the context of SESAR. The essentials regarding network management are summarised in two reports by NLR, explaining options for optimization and prioritization [6] and [7]. This study addresses some cases to apply Air Traffic Flow Management (ATFM) in particular under disruptive conditions.
Figure 1 - The ATM network defined by airport nodes, sector nodes and air
traffic through these nodes
B. The current scenario
Air Transport operations are performed through a network of airports connected to each other by airspace sectors. This network is vulnerable to disruption. Whenever the capacity of single or multiple nodes in this ATM network decreases, bottlenecks and congestion will cause delays and (cost)-inefficient flight operations. One evident cause of congestion is the allocation of dense flows through the Core Area of Europe, feeding its hub airports in that area (see Figure 1). Specifically, these airports are dependent also on transfer operations and the connectivity of their operations. Apart from dense flows, bottlenecks are caused by several properties characterising the ATM network and its deployment, such as for example:
Traffic takes place between a large number of airports but only traffic from and to a relative small number of
major hub airports is involved in the most congested bottlenecks [8] and [9].
The network determined by these congested airports is part of a sub-network, characterised by heavy peak-hour air traffic demand and intensive connectivity between major hub airports.
Some ATS routes are critical due to en-route capacity constraints, again, in particular in the core area.
In case of disruption, these airports are vulnerable moreover, due to sensitivity for reactionary delays. Disruption shows knock-on effects over the day, as analysed for example by the Performance Review Group (PRG) of EUROCONTROL [10] and [11].
In summary, the ATM network operates often at a critical level, and this criticality may relate to airport as well as airspace capacity constraining conditions.
C. Mitigation of congestion in the ATM network
To mitigate congestion, the CFMU started its operations in Brussels in 1993 to manage and monitor the ATM network and they were very successful in enlarging the realised capacity of this network by applying ATFM regulations on overloaded sectors. However, the CFMU limits its regulatory operations to airspace sectors mainly, whilst all regulations are based on rough planning information derived from unspecific and not always up-to-date flightplan information. Therefore, the performance of DCB regulations can be improved by an enhanced concept to manage the ATM network, assuming availability of accurate and up-to-date 4D planning data. This will be addressed by SESAR, and ATFM operations are expected to be improved in the SESAR timeframe, until 2020.
The need for flow management stems from an unevenly distributed load of the network in space and time. The mitigation of congestion takes place by issuing pre-departure delays by ATFM; however, imposed delays can be better issued to flights with small impact on overall network performance than on flights with high impact, and better to impose the smallest amount of delay to solve congestion. This leads to a selective optimisation process, selecting minimised imposed delays and minimised impact on other traffic.
Figure 2 - Principle of operation of Optimising and Prioritising ATFM in a
local context of space and time
Second SESAR Innovation Days, 27th – 29th November 2012
2

To mitigate congestion, selective assignment of delays can be applied also by taking into account differences in priority. Prioritisation differences can be assigned by selecting on the economic value of flight. The result is a (weighted) minimisation of imposed delays, applying priority differences within a local context of time and space, i.e. selecting departure constraints for those flights involved in a bottleneck (see Figure 2). Validation has to assess under which conditions this principle can be applied with significant benefits for prioritised flights and without significant (negative) impact on the overall performance of the ATM network.
III. DEMAND AND CAPACITY BALANCING OF AN ATM
NETWORK
The following describes how to manage and analyse the ECAC-wide ATM network, and how the research of this paper addressed this subject. The ATM network is considered regarding the analysis of bottlenecks and critical network throughput as well as regarding the tools to manage and analyse this network.
A. Balancing the ATM network and Optimisation
The present-day policy of CFMU to apply regulations originates from its mission to mitigate congestion when the planning of demand and capacity through the network suffers from identified overloads. Once a node of the network is identified as overloaded, and when regulations apply, flights get departure slots assigned following a principle of first arrival at the sector according to their planning. The concept of SESAR, under guidance of the principle of convergent layered planning, requires developing a concept for more systematic management of the ATM network, supported by a Central Network Management function. This function will monitor the balance of demand and capacity through the whole network, and the aim to monitor the full network, implies also to include the airports and their bottlenecks in this process.
Improvement of ATFM, compared to the today’s flow regulation process, stems firstly from a complete and accurately (layered) planning of network capacities and flight-plan information (RBTs). Secondly, the principle to identify overloaded network nodes and to select flights for applying regulations, can be subject of improvement. SESAR formulates a principle that the economic value of a flight will prevail over the traditional First-Come – First-Served (FC-FS) principle, and this principle is subject of research in this paper [12] and [13]:
Traditional ATFM (flow management) applies regulations by FC-FS of planned arrivals at a network node, assigned for regulations.
Optimised ATFM applies regulations by selecting over a time period at an overloaded node and will select those flights for constraint assignments that will minimise the amount of imposed delays and that will minimise the impact on other traffic.
Prioritised ATFM applies regulations by selective assignment of imposed delays, taking into account differences in priority. These prioritisation differences may be derived from e.g. differences of the economic value of flights. The result is a (weighted) minimisation of imposed delays, applying priority differences between flights within a local context of time and space, i.e. selecting constraints for those flights involved in a bottleneck (see Figure 2).
Validation has to assess under which conditions this principle can be applied with significant benefits for prioritised flights and without significant negative impact on the overall performance of the ATM network. This paper presents some first results by applying optimisation and prioritisation of ATFM.
B. The balance in the ATM Network
Starting from the principle of convergent layered planning, and aiming to plan air transport operations in a collaborative way, DCB requires a full understanding of demand and capacity of the ATM network:
Air Traffic demand: Demand is specified as scheduled ICAO flightplans. These ICAO flightplans are converted by trajectory prediction to 4D flightplans, the SBTs/RBTs (of SESAR), and these flightplans are predicted following their planned routes, and assumed to fly most efficient trajectories along these routes.
Airports and airport capacity: Two capacity constrained parts of the ATM network determine the throughput: airports and airspace. The airports are strongly varying in imposing capacity constraints on network operations. On the one hand, air traffic demand varying over the day, is causing constraining conditions, on the other hand, physical constraints like runway capacity, weather conditions and operational constraints determine the airports’ capacity bottlenecks and associated congestion problems. Around 20 airports can be considered as large and major hub airports, and these are often also the congested airports. Airports’ peak capacity figures were applied to apply regulations, and these figures were increased by 10% hourly capacity, for example to take into account uncertainty in departure/arrival demand. The objective was to use capacity figures precisely matching the physical airport capacity: o Too high capacity figures will disable the capability
to regulate throughput, and planned air traffic will cause bottlenecks and inefficiency of operations, measured by (in-flight) delays.
o Too low capacity figures, for example justified by environmental or noise policy motives, may regulate the throughput more constraining than physically required. The result will be lower throughput than physically possible and thus low performance figures.
Sectors and sector capacity: The second capacity constrained part of the network concerns airspace
Second SESAR Innovation Days, 27th – 29th November 2012
3

restrictions. RBTs are following routes through volumes of airspace, and these volumes are associated with airspace sectors. These sectors are constrained by different criteria, such as for example the controller workload, the complexity of the sector and the size of the airspace sector volume. These capacity constraints are characterised by declared capacity figures and available figures were applied as made available to the experiment, assuming to represent the physical capacity, indeed. All sectors were considered to be “open” and thus accessible.
The ATM network is characterised in this way by air traffic demand, airport capacity figures and sector capacity figures, whilst the planning by 4D trajectory prediction determines the required city-pair connectivity and the routing from airport to airport through sectors. A major problem of this network is, that airport nodes and airspace volumes (sector nodes), although characterised by similar simple capacity numbers, are totally different in their impact on network behaviour. Airport nodes are directly constrained by congestion; a bottleneck is detected for example because aircraft are waiting for access to a runway, and this access time is measured as “delay”. Sector nodes, however, are not performing directly as capacity constrained nodes. If a sector gets overloaded, the controller has to solve his/her problems and only afterwards it might be discussed to reduce the declared capacity. There is no option to “wait” in the air and to accept delay, unless holding patterns or re-routings are executed. Therefore, we discern two networks, the logical DCB ATM network and the “real-life” operational network. Both networks behave differently! (See Figure 3)
Figure 3 - Illustrative representation of the double network: the (logical, DCB)
ATM network representation and the (fast-time simulated) "real-life" operational representation of the Network
C. Analysing optimised throughput through the network
Given the fact that nodes of the ATM network (airports and sectors) are so unequal in their operating characteristics, delays and related throughput problems often cannot be attributed straightforwardly to specific node capacity problems. A primary requirement is therefore to understand the performance of the ATM network as if it was operating like an ideal network, where demand is just balanced against capacity. This
is the reason to separate performance assessment of the ATM network in two clearly segregated parts (See Figure 3):
Network throughput analysis, assessing throughput through the ATM network by analysing the network in terms of capacity per node and demand per node. The throughput analysis is performed by a Petri-net modelled Network Analysis Model (NAM) [1]. The throughput constraints are characterised by measured “waiting time”, accumulated each time a flight has to wait for access to a node when no capacity is available at that time at that node. N.B., it should be noted that this “waiting time” has no direct relationship with “delay”; it is just an indicator of overload at a node.
Network ATM performance analysis, assessing the operational performance of the ATM network by its capability to accommodate demand through realistically modelled network nodes, i.e. airports and airspace volumes. The performance analysis is done by a Fast-Time Simulation tool (FTS), such as e.g. TAAM® or AIRTOP®. The performance, related to capacity, is measured mainly as maximum achievable throughput through runways of airports, as queuing delays around runways and as calculated workload due to traffic load through sectors [1].
The experiment presented in this paper is based on network throughput analysis only, assuming that the demand and capacity figures are representing the true operational conditions of the ATM network. The consequence is that this paper addresses the assessment of different solutions to solve imbalances between demand and capacity, comparing differences in throughput by different regulations. However, the research did not validate whether the network performance matches the ATM operational performance by assessment of the associated delays and workload. The added value of this paper must be found in successfully demonstrating opportunities to improve network throughput based on available demand and capacity figures.
IV. EXPERIMENTAL VALIDATION OF ENHANCED ATFCM
An explorative experiment was executed to demonstrate the validity of the ATFM model developed by NLR to evaluate DCB measures and to apply flow management. The results demonstrate the added value to optimise air traffic flow regulations, and the interest of this model for future research. The experiment consisted of a set of experimental runs:
ATFM Reference scenario: It was shown that the model can be used to evaluate a present-day ATM scenario, that congestion in the ATM network can be understood, and that measures to mitigate congestion can be assessed on their impact on network throughput and network performance. Also, compliance was assessed with present-day FC-FS ATFM.
Sensitivity analysis: The ATM network is sensitive to bottlenecks, and in practice, airports often suffer from reduced capacity e.g. due to severe weather conditions.
Second SESAR Innovation Days, 27th – 29th November 2012
4

The model and the scenario were assessed on the impact of reduced capacity on performance at some nodes, i.e. in particular airports.
Options for enhanced ATFM: The model can be used to evaluate options that will demonstrate that optimising and prioritising ATFM regulation procedures may provide positive control on throughput characteristics with significant benefits for the Air Transport industry. One specific option for prioritisation was assessed on achievable benefits.
This paper will focus on the last two points, i.e. sensitivity analysis to analyse the bottlenecks and their characteristics, and enhanced ATFM to investigate one option for prioritisation of traffic flows under disruptive conditions. The results of the first point, assessment of a reference scenario and compliance with today’s regulations, are input to the research of this article. See further [1] and [2].
A. The Scenario
A Kernel Network was selected from an ECAC-wide scenario covering more than only the Core area (24.600 flights in 24 hours through 736 airport and sector nodes). This scenario is derived from air traffic of a busy day in 2008 [8] and [9]. The selected scenario comprises 15 main airports, and the reason to select only part of the ECAC wide network was to reduce processing time. The disadvantage is to be less representative. Measured and calculated congestion is expected to be higher for a Kernel Network than for an ECAC-wide network.
B. The tools and the algorithm
The tools and the algorithm had to address issues concerning network throughput and optimising the throughput. The key issues were:
ATM Network: What represents the ATM network, and do we understand the relationship between airport and sector capacities on the one hand, and air traffic demand on the other hand?
Bottleneck behaviour: Are we able to analyse and manage the network in such a way that bottleneck behaviour is minimised whilst the network still represents the physical ATM network as it is operated in real-life?
Effective throughput: How do we analyse the ATM network, and given scheduled air traffic demand, do we understand the optimisation of throughput through the network in space (a sectorised network) and time (a day of traffic) by modelling and processing planned flight operations through this network?
To answer these questions two new tools were developed, prototyping an innovative network analysis model, i.e. a Network Analysis Model (NAM) and an OPT-ATFM (Optimising ATFM) tool: The NAM tool is a light tool and performs network
throughput assessment only, performing validation
within the limited scope of the research actually undertaken, i.e. to balance demand against capacity and to investigate throughput through the network, constrained by capacity limitations only.
OPT-ATFM is a prototype typically for those flow regulation applications that cannot be applied yet today, i.e. to replace FC-FS by optimised and prioritised decision making.
These prototype models for ATM regulations have been developed, based on a Petri-net strategy to select a subset of flights involved in a bottleneck. At a congested node, an airport or airspace sector, optimisation and prioritisation of regulations may take place within a local context of space (one node) and time (a pre-determined prediction period, e.g. one hour look-ahead prediction time). (See Figure 2) Each flight, arriving at a node, receives a reservation by a token, whilst prioritisation will lead to rearrange these tokens. In first instance, prioritisation is applied in an absolute way, which works in a satisfactory way as long as saturation is limitedly applicable.
The outcome is obtained by iteration, because each calculated regulation could have impact on planning and regulation measures elsewhere. The tools were developed on a prototype platform, programmed in Visual-Studio 2008 and C#.
C. The Key Performance Areas (KPAs) and Metrics
The Key Performance Areas (KPAs) relevant to express the effectiveness of applying ATFM, are Capacity (throughput, delay and workload, i.e. by ATC) and Efficiency (distance of flight and flight duration). At this stage, only ATFM was assessed, and only on throughput characteristics. The measured quantities (KPIs) are:
Total number of flights with a waiting period, Total “waiting time” over the day in hours, measuring
the deficiencies of capacity during periods of overload at a node (sector or airport),
Total “waiting time” over the day at the 15 most saturated airports,
Total amount of imposed pre-departure delay over the day to mitigate “waiting time”,
Hourly distributions of total “waiting time” per run and per airport,
Hourly distributions of total amount of imposed pre-departure delay,
Key figures of measured total and average “waiting time” and imposed pre-departure delays for each run.
Geographical overviews of total “waiting time” and imposed pre-departure delays per node (airport or sector) and per run.
V. CONDUCT OF THE EXPERIMENT
The experimental runs are all runs, performed over the Kernel Network, comprising most major airports of Europe, and being representative for the whole ECAC-wide ATM
Second SESAR Innovation Days, 27th – 29th November 2012
5

Network. All experimental runs were processed by applying the Network Analysis Model (NAM) and OPT-ATFM, several times to evaluate results by iterative processing.
Figure 4 - Imposed pre-departure delays to mitigate airport/sector congestion
for the 5-airport disrupted scenario
A. Sensitivity analysis of disruption by capacity deficiency
Two cases of an unbalance in demand and capacity by disruption were investigated:
Incidental disruption, e.g. due to weather, by decrease of capacity at EHAM with 30%. This yields a decrease of declared capacity from 108 mov/hour to 76 (84, including 10% tolerance)
Incidental disruption by decrease of capacity at 5 selected airports: EHAM (-30%), EDDF (-20%), EDDM (-20%), EGKK (-20%) and LFPG (-30%).
The first case, EHAM disrupted, caused delays of peak hour traffic. These delays were impacting the congestion at other airports, however, only a few other airports suffered significant increase of delay. This publication discusses the more significant impact, caused by 5 capacity disrupted airports, only. This scenario shows (See Figure 4):
A strong increase of “waiting time” at 5 disrupted airports and not too much impact on other airports due to late arrivals, although still ignoring reactionary delays, but a strong positive effect (reduced load) on airspace sectors by constrained access.
The ATM system shows the typical behaviour of a saturated system with increase of imposed pre-departure delays at the end of the day. Of course, the disrupted airports had to accept again most of these delays.
The “waiting time” due to disruption at 5 airports can still be suppressed by a strong increase of imposed pre-departure delays. The imposed delays are similar in total delay and number of impacted flights, as the observed “waiting time” figures due to network congestion.
Figure 4 shows the imposed pre-departure delays to solve congestion at 5 capacity disrupted airports. Most imposed delays are assigned to flights departing from these disrupted airports.
B. Options for enhanced ATFM by prioritisation
Just one option was selected to assess optimisation by prioritisation, i.e. by assignment of priority to departure/arrival flights at disrupted airports. In first instance, prioritisation was attributed just to flights of the 5 capacity disrupted airports only, but it turned out that a major part of imposed delays moved now to London Heathrow. When London Heathrow, EGLL, was added to the group of 5 prioritised airports, the performance improved considerably.
The selected option yields prioritising access of flights through designated nodes, which can be either an airport or a sector. Prioritisation is applied whenever there is a feasible alternative, often a flight to or from a smaller non-prioritised airport. The prioritisation is implemented by moving the assigned pre-departure delay to the flight to or from the non-prioritised airport.
The most delayed airports in the disrupted scenario were EDDM, EGLL, EDDF, EGKK, EHAM and LFPG, exactly the 5 disrupted airports and, in addition, London Heathrow. In the prioritised scenario the 5 capacity disrupted airports are still part of top-ten of pre-departure delay receiving airports, whilst London Heathrow even falls out of this list. The amount of imposed pre-departure delays for these most penalised airports drops sharply to roughly 25% of the original amount of imposed delay. Figure 5 shows that the distribution of imposed pre-departure delays, i.e. the distribution of imposed delays including prioritisation, is more balanced now.
Figure 5 - Imposed pre-departure delays to mitigate airport/sector congestion for the 5-airport disrupted scenario, applying OPT-ATFM with prioritisation
The results of both experimental runs, without and with prioritisation, provide insight into the effects of prioritisation
Second SESAR Innovation Days, 27th – 29th November 2012
6
on a designated group of flights through the ATM network. It shows how performance of this network can be improved once disruption is understood and congestion anticipated as predicted. The conclusion is that once it is known a priori that one or more nodes of the network are heavily congested, an advantage can be achieved for the performance of the whole network by applying prioritisation on the group of flights through these nodes. Further, this is most obviously beneficial also to the congested hub airport nodes themselves.
Figure 6 shows the redistribution of imposed delays over the most penalised airports: Firstly for the Reference scenario, secondly for the 5-airports-disrupted scenario, and thereafter for the 5-airports-disrupted, 6-airports-prioritised scenario. The benefits are not only a re-distribution of imposed delays but also an improvement of overall performance. The reason is that waste of available capacity is avoided by not penalising flights through already capacity disrupted nodes. Lots of small airports receive imposed pre-departure delays now, in favour of improved throughput for the 5 (6) heavily congested airports, and this has a beneficial effect on overall throughput.
Figure 6 – Chart presenting the differences in imposed pre-departure delays at
the 20 most affected airports, comparing Reference Scenario, the 5-airports disrupted scenario and the 5-airports disrupted scenario with prioritisation
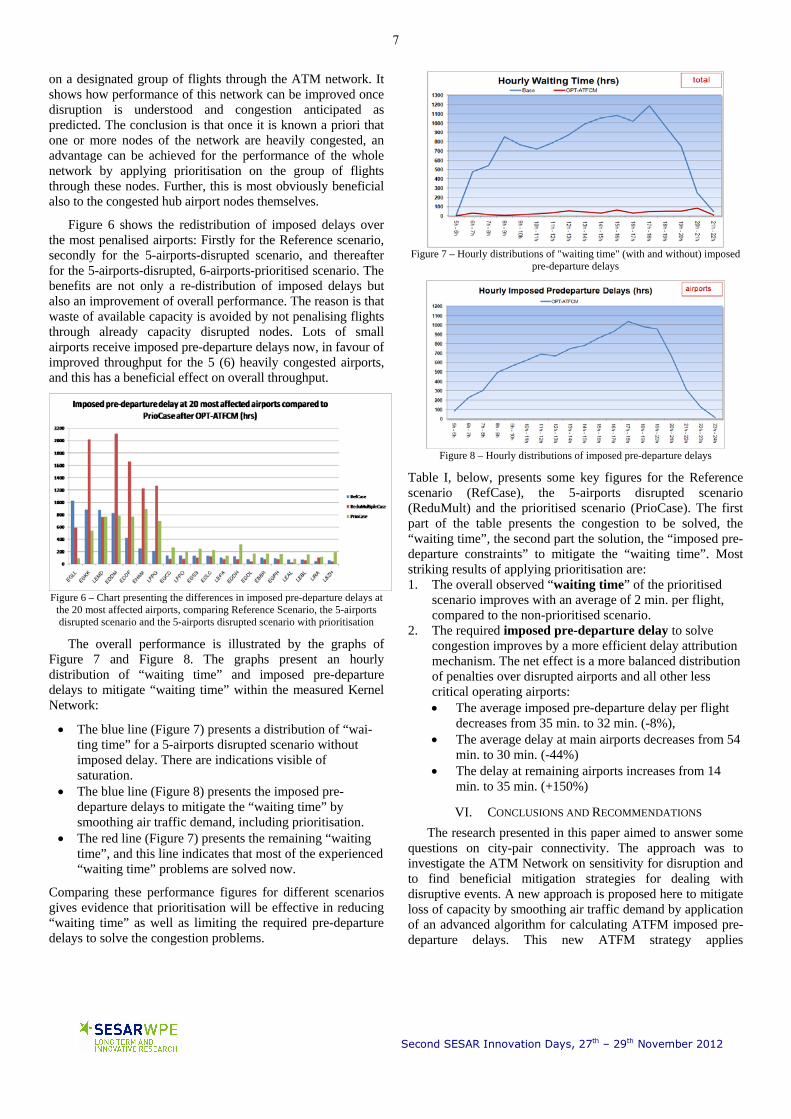
The overall performance is illustrated by the graphs of Figure 7 and Figure 8. The graphs present an hourly distribution of “waiting time” and imposed pre-departure delays to mitigate “waiting time” within the measured Kernel Network:
The blue line (Figure 7) presents a distribution of “wai-ting time” for a 5-airports disrupted scenario without imposed delay. There are indications visible of saturation.
The blue line (Figure 8) presents the imposed pre-departure delays to mitigate the “waiting time” by smoothing air traffic demand, including prioritisation.
The red line (Figure 7) presents the remaining “waiting time”, and this line indicates that most of the experienced “waiting time” problems are solved now.
Comparing these performance figures for different scenarios gives evidence that prioritisation will be effective in reducing “waiting time” as well as limiting the required pre-departure delays to solve the congestion problems.
Figure 7 – Hourly distributions of "waiting time" (with and without) imposed
pre-departure delays
Figure 8 – Hourly distributions of imposed pre-departure delays
Table I, below, presents some key figures for the Reference scenario (RefCase), the 5-airports disrupted scenario (ReduMult) and the prioritised scenario (PrioCase). The first part of the table presents the congestion to be solved, the “waiting time”, the second part the solution, the “imposed pre-departure constraints” to mitigate the “waiting time”. Most striking results of applying prioritisation are: 1. The overall observed “waiting time” of the prioritised
scenario improves with an average of 2 min. per flight, compared to the non-prioritised scenario.
2. The required imposed pre-departure delay to solve congestion improves by a more efficient delay attribution mechanism. The net effect is a more balanced distribution of penalties over disrupted airports and all other less critical operating airports: The average imposed pre-departure delay per flight
decreases from 35 min. to 32 min. (-8%), The average delay at main airports decreases from 54
min. to 30 min. (-44%) The delay at remaining airports increases from 14
min. to 35 min. (+150%)
VI. CONCLUSIONS AND RECOMMENDATIONS
The research presented in this paper aimed to answer some questions on city-pair connectivity. The approach was to investigate the ATM Network on sensitivity for disruption and to find beneficial mitigation strategies for dealing with disruptive events. A new approach is proposed here to mitigate loss of capacity by smoothing air traffic demand by application of an advanced algorithm for calculating ATFM imposed pre-departure delays. This new ATFM strategy applies
Second SESAR Innovation Days, 27th – 29th November 2012
7

optimisation and prioritisation for calculating imposed pre-departure delays, and for one specific case, i.e. capacity disruption at 5 airports, it was validated that such a strategy could lead to a reduction of at least 40% of total amount of imposed pre-departure delay for those disrupted airports. In addition, all major and hub airports could benefit from the applicable disruption-mitigation strategy due to enhanced throughput through the most congested parts of the ATM network.
The sensitivity analysis demonstrated how incidental disruption at one or more airports, leading to reduced capacity of those airports, would impact the performance of the ATM network. Local disruption is causing loss of performance by invoking large amounts of “waiting time”, whilst the disrupted airports are penalised again by imposed pre-departure delays to solve the experienced disruption. The results of just one case of prioritisation suggest that selective optimisation and/or prioritisation can become very beneficial by making more efficient use of available capacity of an ATFM network. This is valid in particular for high density traffic flows and a network fed by saturated airports.
Several other options are possible to improve performance results. For example, prioritisation can be assigned only to traffic flows to and from hub airports during periods of overload of declared/operational capacity. Another option is to prioritise flights with “a critical role” in the deployment scheme of an Airline. Anyhow, it must be possible to keep even better balance in benefits and penalties by fine-tuning throughput analysis and fine-tuning the issuing of imposed pre-departure delays. Such a balancing mechanism will benefit from a delay assignment strategy operating within a local context of space and time.
The results of the presented experiment showed that overall “waiting time” can be reduced whilst even decreasing the total amount of imposed pre-departure delays. The throughput of hub airports showed major improvements and decreased imposed delays, whilst remaining airports had to accept more “waiting time” and more imposed pre-departure delays, but never an excessively large amount of delay per airport. The overall chart of distribution of waiting time and delays looks significantly improved, compared to the non-prioritised case (see Figure 6).
In this experiment, demand and capacity figures were both representative figures but no verified figures. All outcomes are indicative for that reason. It is recommended to perform the described assessment experiment again on a full ECAC-wide ATM network scenario, using carefully verified capacity figures. In particular, the airport capacity figures have to match the “real-life” peak-period operational capacity figures. The outcome of network performance data has to be validated also by a “real-life” operational validation experiment, which can be achieved by ECAC-wide fast-time simulation. The outcome of this fast-time simulation experiment will give the required confidence in realism and will allow quantifying “real” benefits achievable under operational conditions.
VII. REFERENCES [1] H.W.G. de Jonge, R.R. Seljée, “Preliminary validation of Network
Analysis Model (NAM) and Optimising Air Traffic Flow Management (OPT-ATFM)”, NLR-CR-2011-379, NLR, Amsterdam, December 2011.
[2] H.W.G. de Jonge, R.R. Seljée, “Optimisation and Prioritisation of Flows of Air Traffic through an ATM Network”, NLR-TP-2011-567, NLR, Amsterdam, December 2011.
[3] R. Van Hout, “Literature Study Air Traffic Flow Management”, NLR-TR-2012-204, NLR, Amsterdam, May 2012.
[4] SES, Single European Sky Second Package (SES II), MEMO/08/432, http://ec.europa.eu/transport/air/single_sky/index_en.htm, Brussels, June 2008.
[5] SES, Optimising the use of European airspace, IP/10/363, http://ec.europa.eu/transport/air/single_sky/index_en.htm, Brussels, March, 2010.
[6] H.W.G. de Jonge, J.N.P. Beers, R.R. Seljée, “Flow Management and Airspace Management impacting Schiphol operations”, NLR-CR-2008-459, NLR, Amsterdam, November 2008.
[7] H.W.G. de Jonge, J.N.P. Beers, R.R. Seljée, “Flow Management on the ATM Network in Europe”, NLR-TP-2007-650, NLR, Amsterdam, October 2007.
[8] H.W.G. de Jonge, R.R. Seljée, J.N.P. Beers, “Demand and Capacity Balancing and Collaborative Flow Management in Europe, Performance Assessment Study by fast-time simulation”, NLR-CR-2007-778, NLR, Amsterdam, October 2007.
[9] SESAR Definition Phase, Task 2.3.1/D3, “Compute and Map Operational Concepts & Airspace KPIs based on identified available Tools and Methodologies”, DLT-0612-231-00-02, SESAR Consortium, Toulouse, June 2007.
[10] EUROCONTROL, PRR 2009, Performance Review Report, An Assessment of Air Traffic Management in Europe during the Calendar Year 2009, EUROCONTROL, Performance Review Commission, Brussels, May 2010.
[11] EUROCONTROL, PRR 2010, Performance Review Report, An Assessment of Air Traffic Management in Europe during the Calendar Year 2010, EUROCONTROL, Performance Review Commission, Brussels, May 2011.
[12] SESAR, SESAR D3: The ATM Target Concept, version 02-00, DLM-0612-001-02-00, Brussels, Sept 2007.
[13] SESAR, SESAR Concept of Operations, version 01-00, DLT-0612-222-01-00, Brussels, 2007.
[14] D. Bertsimas & S. Stock-Patterson, “The air traffic flow management problem with en-route capacities”, Operations Research, 46(3), 406-422, 1998.
[15] D. Bertsimas & S. Stock-Patterson, “The traffic flow management rerouting problem in air traffic control: A dynamic network flow approach”, Transportation Science, 34(3), 239-255, 2000.
[16] G. Lulli & A. Odoni, “The European air traffic flow management problem”, Transportation Science, 41(4), 431-443, 2007.
[17] N. Barnier & C. Allignol, “4D-trajectory deconfliction through departure time adjustment”, Proceedings of ATM, Vol. 9, 2009.
[18] L. Corrolli, L. Castelli, G. Lulli, “The air traffic flow management problem with time windows”, 4th International Conference on Research in Air Transportation (ICRAT), Budapest, Hungary, 2010.
VIII. TABLES
DEFINITIONS
Waiting time Time added to 4D-planned time for access to network node
Delay Calculated imposed pre-departure delay to mitigate “Waiting time”
Optimization (Weighted) minimization of imposed delays to mitigate waiting time
Prioritization (Weighted) minimization of imposed delays to mitigate waiting time, applying differences in priority
Second SESAR Innovation Days, 27th – 29th November 2012
8

TABLE I. SUMMARY OF “WAITING TIME” AND IMPOSED DELAYS COMPARING REFERENCE SCENARIO, 5-AIRPORT DISRUPTED SCENARIO
AND 5-AIRPORT DISRUPTED SCENARIO + PRIORITISATION
THROUGHPUT BY “WAITING TIME”
Total number of flights in period RefCase ReduMult PrioCase
Nr. of flights with a waiting time 4011 4774 5998Nr. of flights with a waiting time at all
airports 1368 2838 3493Nr. of flights with a waiting time at
main airports 1239 2694 3351Nr. of flights with a waiting time at
sectors 2465 1795 2338
Total waiting time in period RefCase ReduMult PrioCase
Total waiting time (hrs) 8576 12003 11246
Waiting time at all airports (hrs) 3330 8380 6205
Waiting time at main airports (hrs) 3154 8097 5903
Waiting time at sectors (hrs) 5245 3622 5041
Average per flight in period RefCase ReduMult PrioCase
Waiting time (min) 24,6 34,4 32,2
Waiting time at all airports (min) 9,6 24,2 17,9
Waiting time at main airports (min) 16,9 43,3 31,6
Waiting time at remain. airports (min) 1,1 1,8 1,9
Waiting time at sectors (min) 15,0 10,4 14,4
Imposed pre‐departure constraints
Total number of flights in period RefCase ReduMult PrioCase
Nr. of flights with a pre‐dep. delay at airports 4115 5324 6387
Nr. of flights with a pre‐dep. delay at main airports 2243 3448 3368
Total pre‐departure delay in period RefCase ReduMult PrioCase
Total pre‐dep. delay at airports (hrs) 8018 12199 11076
Pre‐dep. delay at main airports (hrs) 5021 10010 5589
Average per flight in period RefCase ReduMult PrioCase
Pre‐departure delay (min) 23,0 34,9 31,7
Pre‐departure at main airports (min) 26,8 53,5 29,9
Pre‐dep. at remaining airports (min) 18,8 13,7 34,4
TABLE II. ABBREVIATIONS AND ACRONYMS
Abbreviation Description
ANSP Air Navigation Service Provider
ATC Air Traffic Control
ATFCM Air Traffic Flow and Capacity Management
ATFM Air Traffic Flow Management
ATM Air Traffic Management
CFMU Central Flow Management Unit
DCB Demand & Capacity Balancing
DOD SESAR Detailed Operational Description (developed by EPISODE-3)
EC European Commission
ECAC European Civil Aviation Conference
FC-FS First Come – First Served
FM Flow Management
FTS Fast-Time Simulation
ICAO International Civil Aviation Organisation
KPA Key Performance Area
KPI Key Performance Indicator
NAM Network Analysis Model
NLR National Aerospace Laboratory of the Netherlands
NOP Network Operations Plan
OPT-ATFM Optimising Air Traffic Flow Management
PC Personal Computer
PRG Performance Review Group (EUROCONTROL)
R&D Research & Development
RBT Reference Business Trajectory
SBT System managed Business Trajectory
SES Single European Sky
SESAR Single European Sky ATM Research
TAAM© Total Airport and Airspace Model® (Fast-time simulation tool)
TMA Terminal Manoeuvring Area
UK United Kingdom
Second SESAR Innovation Days, 27th – 29th November 2012
9