INTEGRATION AND OPTIMISATION OF ... - ORTUS
161
RIGA TECHNICAL UNIVERSITY Faculty of Civil Engineering Institute of Materials and Structures Edgars LABANS INTEGRATION AND OPTIMISATION OF MULTIFUNCTIONALITY FOR PLYWOOD SANDWICH CONSTRUCTION Doctoral Thesis Scientific supervisor Dr. sc. ing., Kaspars KALNINS Riga 2016
-
Upload
khangminh22 -
Category
Documents
-
view
1 -
download
0
Transcript of INTEGRATION AND OPTIMISATION OF ... - ORTUS
RIGA TECHNICAL UNIVERSITY
Faculty of Civil Engineering
Institute of Materials and Structures
Edgars LABANS
INTEGRATION AND OPTIMISATION OF
MULTIFUNCTIONALITY FOR PLYWOOD
SANDWICH CONSTRUCTION
Doctoral Thesis
Scientific supervisor
Dr. sc. ing.,
Kaspars KALNINS
Riga 2016

2
This work has been supported by European Commission 7th Framework programme project
MAPICC 3D (One-shot Manufacturing on large scale of 3D upgraded panels and stiffeners for
lightweight thermoplastic textile composite structures). Thesis partially financed by IMATEH
(Innovative materials and smart technologies for environmental safety) project as well as the
European Social Fund within the project «Support for the implementation of doctoral studies
at Riga Technical University».
3
ANOTĀCIJA
Promocijas darbs ir veltīts multifunkcionālo īpašību (siltuma izolācija, vibrāciju slāpēšana,
trieciena izturība) integrēšanai vieglās saplākšņa sendviča-konstrukcijās. Līdzšinējie pētījumi
parāda, ka vieglas, liela laiduma pārseguma konstrukcijas ir efektīvākais veids saplākšņa
izmantošanai nesošajās konstrukcijās. Tas ļauj taupīt gan materiālus gan arī samazināt
konstrukciju pašsvaru. Papildus ir iespēja integrēt citas funkcijas paneļa serdes daļā, ar papildus
materiālu vai optimizējot stinguma elementu izvietojumu. Tomēr, lai pilnvērtīgi izmantotu
sendvičpaneļu multifunkcionālo īpašību potenciālu nepieciešama droša un pārbaudīta aprēķina
metodika. Detalizēts skaitlisko un eksperimentālo pētījumu apkopojums, kā arī aprēķina
metodika ir dota izstrādātajā promocijas darbā. Literatūras pārskats 1. Nodaļā apkopo pieejamo
svarīgāko informāciju par sendviča paneļiem. Tai skaitā inovatīvos risinājumus tieši saplākšņa
sendviča paneļu projektēšanā. Secinot, ka svarīgākā motivācija jaunu risinājumu izstrādē ir
primārā nepieciešamība taupīt izejmateriālus, kas nodrošina konstrukcijas vieglumu, kā arī
iespēja izmantot koksnes ražošanas atlikumus. Paneļu skaitliskajai modelēšanai nepieciešamās
atsevišķu komponenšu mehāniskās un termiskās īpašības tika noteiktas darba ietvaros un
apkopotas 2. Nodaļā. Kā izrādās, pastāv būtiska atšķirība starp zāģēta bērza kokmateriāla un
viena lobskaidas mehāniskajām īpašībām. 3. Nodaļā tiek demonstrēts, ka izmantojot detalizētu
skaitliskā aprēķina modeli, kas validēts ar eksperimentāliem rezultātiem, ir iespējams precīzi
prognozēt sendvičpaneļa deformācijas. Balstoties uz validētu aprēķina modeli un optimizāciju,
ir izstrādāta metodoloģija pilnajam saplāksnim līdzvērtīgas veiktspējas sendvičpaneļu
atrašanai. Lai vēl vairāk palielinātu klāja nestspēju tiek piedāvāts izmantot viļņotu
termoplastiska kompozīta serdi. Viena piegājiena izgatavošanas metode šāda veida paneļiem ir
izstrādāta un detalizēti aprakstīta 4. Nodaļā. Bezkontakta mērīšanas sistēmas priekšrocības
apkopotas 5. Nodaļā, izmantojot sendvičpaneļus ar šūnveida koksnes serdi. 6. Nodaļā ir
analizēts mehāniskās darbības un siltumizolācijas optimizācijas piemērs sendvičpaneļiem ar
dabīgās izcelsmes PU serdi. Balstoties uz Pareto optimuma fronti ir iespējams izvēlēties labākos
sendvičpaneļa risinājumus starp trīs atbildes reakcijām. Izvērtējot vibrāciju slāpēšanas
rezultātus 8. Nodaļā var teikt, ka sendvičpaneļiem ir priekšrocība pār parasta saplākšņa plātnēm,
galvenokārt zemāka stinguma dēļ. Trieciena testu apskats 9. Nodaļā parāda, ka plānas, elastīgas
vidus kārtas ievietošana saplāksnī būtiski palielina tā trieciena penetrācijas enerģiju. Liela
biezuma paneļos trieciena izturība galvenokārt atkarīga no virsmām.

4
ABSTRACT
This thesis is focused on integration of multifunctional properties (heat insulation, vibration,
damping, impact resistance) in lightweight sandwich panels with plywood components. It is
proven than lightweight sandwich structures are the most efficient way of applying plywood
for large span load-bearing applications. It allows to save significant amount of material and
also to reduce weight of the structures. In addition, there is a possibility to integrate additional
function in sandwich panel core by placing additional material like foam or optimizing layout
of stiffeners to increase performance in other fields. However, to fully employ a multifunctional
potential of plywood sandwich panels reliable and safe design methodology should be
developed. The detailed description of numerical and experimental investigation along with
validated design methodology has been provided in current thesis.
Chapter 1 gives a review of accumulated knowledge in development of lightweight wood
based sandwich panels. The main motivation behind design of novel sandwich materials is
material saving, lightweightness and consumption of wood processing surplus. Efforts of
acquiring input data (mechanical and thermal properties) for sandwich panel modelling is
summarized in Chapter 2. It has been found that there is great difference between clear wood
specimens and properties of compressed veneer with adhesive. Aspects of numerical modelling
for sandwich panels with I-type stiffeners and corrugated core is described in details in Chapter
3 along with experimental validation. Methodology of design of lightweight sandwich panels
to match bending performance of conventional plywood boards is approbated in scaffolding
deck application. The initial performance of plywood sandwich panels could be greatly
improved by introducing thermoplastic composite corrugated core as shown in Chapter 4. One-
shot prototyping technology of this novel sandwich panel has been developed. The benefits of
non-contacts measurement systems in validation of numerical models are given in Chapter 5
on the example of cellular wood core sandwich structure. Optimization of mechanical and
thermal performance of sandwich panels with natural foam core is given in Chapter 6. Based
on acquired Pareto optimality front it is possible to pick the most efficient design between three
response values. Evaluation of vibration damping in Chapter 7 indicates that sandwich panels
have an advantage of vibration damping due lower stiffness. The results of impact tests in
Chapter 8 shows that thin elastic middle layer improve penetration resistance of plywood board.
Impact resistance of large thickness panels is mainly dependant on surface layer.

5
ACKNOWLEDGEMENTS
I would like to thank my supervisor dr. Kaspars Kalniņš for providing me with the
opportunity to complete my PhD studies under his guidance. His ambitious, energetic and
creative approach motivated me to finish this work in the way it was initially designed.
I am grateful to my colleagues from the Institute of Materials and Structures. First of all to
prof. Andris Čate for administrative support and reminders to do work on time. Also I would
like to thank my colleagues Oļģerts Ozoliņš, Eduards Skuķis and Guntis Japiņš for support in
making experimental part of the study.
I gratefully acknowledge main funding source — EC 7th Framework programme MAPICC
3D as well as opportunity to work together with leading industrial and academic partners. The
research work was partially funded by European Social Fund. Also I appreciate support from
Kaspars Zudrags and AS “Latvijas Finieris” for providing raw materials and services for
creating panel prototypes and test rigs.
In addition I would like to mention fruitful cooperation between the Institute of Materials
and Structures and Latvia State Institute of Wood Chemistry inside Latvian Science Council
project IMATEH. Synergy between two institutions allowed to prototype new type of sandwich
panels and make common publications.
Finally my wife Liena, parents and closer relatives deserve the deepest appreciation for
supporting my academic and professional efforts.

6
List of abbreviations
ABFC — Adaptive Basis Function Construction
AIC — Akaike’s Information Criterion
DIC — Digital image correlation
OSB — Oriented strand board
MDF — Medium density fibreboard
HDF — High density fibreboard
LVDT — Linear Variable Differential Transformer
MSE — Mean Squared Error
NDE — Non Destructive Evaluation
PVC — Polyvinyl chloride
PU — Polyurethane
FEM — Finite Element method
GFRP — Glass Fibre Reinforced Polymer
GF — Glass Fibres
PP — Polypropylene
XPS — Extruded Polystyrene Foam
EPS — Expanded Polystyrene Foam
PVA — Polyvinyl acetate
List of notations
fE — fibre modulus of elasticity;
mE — matrix modulus of elasticity;
f — Fibres by volume relative to the total volume of the mixture.
m — matrix volume of the total volume of the mixture.
S — solution of the optimisation problem
H — vector of equality constraints
g — vector of inequality constraints.
L — length
B — width
T — thickness
H — height

7
C — degrees of Celsius
q — heat flow through the sample
A — area
β — parameters of the approximation function
x — input variable of the approximation function
P1-7 — cross section parameters
ΔV — relative volume
ΔS — relative stiffness
ΔV — relative thermal conductivity
ΔT — temperature difference
Ε — strain
fa — first frequency boundary
fb — second frequency boundary
ζn — damping factor
N — natural frequency
Δ — logarithmic decrement
Τ — period
n — number of period
R1 — cracking resistance
R2 — penetration resistance
g — gravitational constant
W — drop weight
8
List of figures
Figure 1.1. Example of birch plywood grading [2]................................................................... 26
Figure 1.2. Main plywood manufacturing steps. ...................................................................... 28
Figure 1.3. Equilibrium moisture content of the wood-based panels and solid wood at room
temperature [7]........................................................................................................................ 30
Figure 1.4. Modulus of elasticity and strength for birch plywood at
various thickness steps [15]. ................................................................................................... 32
Figure 1.5. Structure of typical sandwich panel....................................................................... 35
Figure 1.6. Young`s modulus/density ratio for wide range of engineering materials [3]. ....... 36
Figure 1.7. Lattice core with carbon fibre composite struts [58]. ............................................. 40
Figure 1.8. Sandwich panels with foam core [76]. .................................................................. 42
Figure. 1.9. Sandwich panels with paper honeycomb core [77]. .............................................. 43
Figure.1.10 Cellular wood material — application in building walls [78]. ............................. 43
Figure. 1.11 Sandwich with cement wood fibre surface [80]. .................................................. 44
Figure 1.12 Sandwich panels with solid wood core [81]. ......................................................... 44
Figure. 1.13 Core structure of plywood Sing core panels [82]. ................................................ 45
Figure. 1.14 large span insulated roof panel [83]. .................................................................... 45
Figure 1.15. Facade sandwich panel in 6-point bending [90]. .................................................. 46
Figure 1.16. 2D lattice core sandwich-beam [93]. .................................................................... 47
Figure 1.17. Veneer hollow core panel [95]. ............................................................................ 47
Figure 1.18. Sandwich panel with keel-web elements [99]. ..................................................... 48
Figure 1.19. Solution and attribute space nomenclature for a problem with two design
variables (x1 and x2) and two objectives (f1 and f2) be minimized [Andersson, 2001 [106]].. 51
Figure 2.1. Hierarchy of the experimental tests. ....................................................................... 52
Figure 2.2. Geometry of veneer specimen. ............................................................................... 54
Figure 2.3. Specimen tension test on INSTRON 8802. ............................................................ 54
Figure 2.4. ZWICK Z100 laser extensometer measuring the plywood specimen. ................... 55
Figure. 2.5. a) Laser extensometer measuring zones (red dots) and tension behaviour of wood
micro-cracks under tension load; b) Spacemen failure mode cases misleading the laser
extensometer measurements. .................................................................................................. 56
Figure. 2.6. Plywood specimen`s FEM model. ......................................................................... 58
Figure. 2.7. Plywood specimen tension test on INSTRON 8802 and dimensions
of the specimen. ...................................................................................................................... 58

9
Figure. 2.8. Load and strain curves for plywood specimens with longitudinal and
perpendicular orientation of the outer wood fibres. ............................................................... 59
Figure. 2.9. Comparisons of modulus of elasticity. .................................................................. 60
Figure 2.10. Tension test set-up of thermoplastic composite samples. .................................... 61
Figure 2.11. Linseis HFM 300 test set-up. ............................................................................... 62
Figure 2.12. Density/thermal conductivity ratio. ...................................................................... 63
Figure 2.13 Thermal conductivity for plywood and chipboard specimens. ............................. 63
Figure 2.14. Adhesive tensile strength tests according to EN 319. .......................................... 64
Figure 2.15. Samples after the EN 319 tests............................................................................. 64
Figure 2.16. Out-of-plane tensile strength for specimens bonded with
Thermoplastic composite layer .............................................................................................. 65
Figure 3.1. Finite element mesh of sandwich panels structures. .............................................. 67
Figure 3.2. Deflection (a) and stress plot (b) of sandwich panel with rib-stiffened core ......... 68
Figure 3.3. Testing of plywood sandwich panels in 4-point bending set up on INSTRON
8802 ........................................................................................................................................ 69
Figure 3.4 Load/strain and deflection curves for sandwich panels with corrugated core. ....... 71
Figure 3.5. Load/deflection curves for sandwich panels with rib stiffened core; comparison
deflection of Panel 5 with finite element analysis results (on the right). ............................... 71
Figure 3.6 Pareto set for sandwich panels with vertical stiffener (i-core)
and corrugated core (v-core). ................................................................................................. 77
Figure 3.7 Prototyped sandwich panels in comparison with conventional plywood boards. ... 79
Figure 3.8 Load/deflection curves for 30 mm plywood and equivalent stiffness sandwich
panels. ..................................................................................................................................... 80
Figure 3.9 Load/deflection curves for 40 mm plywood and equivalent stiffness
sandwich panels. .................................................................................................................... 80
Figure 3.10 Load/deflection curves for 50 mm plywood and equivalent stiffness
sandwich panels. .................................................................................................................... 81
Figure 3.11 Failure modes of rib-stiffened panels .................................................................... 82
Figure 3.12 Failure of the faces and core (Cutted middle section) ........................................... 83
Figure 3.13. Cross-section of the sandwich panels with plywood stiffeners ........................... 83
Figure 3.14. Graphical representation and dimensions of the test set-up. ................................ 84
Figure 3.16. Pressure/deflection curves for sandwich panels made by PU adhesive ............... 86
Figure 3.17. Pressure/deflection curves for sandwich panels made by PVA adhesive. ........... 86

10
Figure3.18. Pressure/deflection curves for sandwich panels with end insert. .......................... 87
Figure 3.19. Reference pressure/deflection curves for 35 mm plywood. ................................. 87
Figure 3.20. Reference pressure/deflection curves for 45 mm plywood. ................................. 88
Figure 4.1. Initial design of combined material sandwich panel. ............................................. 89
Figure 4.2 Finite element mesh and cross-section groups. ...................................................... 90
Figure 4.3 Deflection patter of the panel. ................................................................................. 90
Figure 4.5. Bending set-up on INSTRON 8802 ........................................................................ 91
Figure 4.6 Obtained load/deflection curves of the sandwich panels with GFRP core. ............. 92
Figure 4.7 Location of intermediate markers for displacement track ....................................... 93
Figure 4.8 Deflection at midpoints (at 5 KN load) ................................................................... 93
Figure 4.9. Design variables: for GFRP core sandwich panels ................................................ 94
Figure 4.10. Pareto optimality between relative stiffness and mass ......................................... 95
Figure 4.11. Effect of face ply number. .................................................................................... 96
Figure 4.12. Effect of core wall angle. ...................................................................................... 96
Figure 4.13. Mechanical performance of two different configurations of sandwich
panels with the corrugated core. ............................................................................................. 97
Figure 4.14. Core angle robustness graph. ................................................................................ 98
Figure 4.15. Aluminium bars and cross section of aluminium inserts ...................................... 98
Figure 4.16. Prototyping steps .................................................................................................. 99
Figure 4.17. Prototyping steps .................................................................................................. 99
Figure 4.18. Time-temperature graph of the sandwich panel consolidation. .......................... 100
Figure 4.19. Single-section sandwich panel ............................................................................ 101
Figure 4.20. Double-section sandwich panel .......................................................................... 101
Figure 4.21. Three-section sandwich panel ............................................................................ 102
Figure 4.22. Column-type structure. ....................................................................................... 102
Figure 4.23. 3-point bending test of the single-section sandwich panel on INSTRON 8802. 103
Figure 4.24. 4-point bending test of the double-section sandwich panel on INSTRON
8802. ..................................................................................................................................... 104
Figure 4.25. 4-point bending test of the double-section sandwich panel on INSTRON
8802. ..................................................................................................................................... 104
Figure 4.26. Load/deflection curves for two-section sandwich panel. ................................... 105
Figure 4.27. Load/deflection curves for three-section sandwich panel. ................................. 105
Figure 4.28. Failure mode of the double section sandwich panel. .......................................... 106

11
Figure 4.29. Failure of the support for the single-section sandwich panel. ............................ 106
Figure 4.30. The failure mode for three-section thermoplastic panels. .................................. 107
Figure 5.1. The manufacturing sequence of the cellular wood material. ............................... 108
Figure 5.2. Finite element models for sandwich beam specimens a — shell model,
b — solid 3D model. ............................................................................................................ 109
Figure 5.3. a) Cross-section of the core element; b) assembly of the core
elements and governing directions. ...................................................................................... 110
Figure 5.4. a) Finite element mesh of the small sandwich specimen and b) boundary
conditions for this model. ..................................................................................................... 110
Figure 5.5. Section between two boards ................................................................................. 111
Figure 5.6. 3- point bending test set-up on ZWICK Z100. .................................................... 112
Figure 5.7. Bending test set-up on INSTRON 8802 .............................................................. 113
Figure 5.8. Experimentally obtained deflection values compared with numerical results for
bending specimens B1 and B2. .............................................................................................. 114
Figure 5.9. Vertical displacement plot for B3 series panels with longitudinal core
orientation. ........................................................................................................................... 115
Figure 5.10. B3 series panels with longitudinal core orientation. Load/strain and
load/deflections curves. ........................................................................................................ 116
Figure 5.11. Vertical displacement plot for B4 series panels with transverse core
orientation. ........................................................................................................................... 116
Figure 5.12. B4 series panels with transverse core orientation. Load/strain and
load/deflections curves. ........................................................................................................ 117
Figure 5.13 Vertical displacement plot for B5 series panels with block direction
core orientation ..................................................................................................................... 117
Figure 5.14. B5 series panels with block core orientation. Load/strain and
load/deflections curves. ........................................................................................................ 118
Figure 5.15. Displacement plots for a sandwich specimen with longitudinal core
orientation and ARAMIS test set-up. ................................................................................... 119
Figure 5.16. Displacement plots for a sandwich specimen with transverse core
orientation. ........................................................................................................................... 120
Figure 5.17. Displacement plots for compression specimens. .............................................. 120
Figure 5.18. Comparison of experimentally and numerically acquired displacement
and strain plots. .................................................................................................................... 121

12
Figure 6.1. a — mesh pattern and b — deformed shape of the panel section. ....................... 122
Figure 6.2. a — mesh pattern; b -nodal temperatures at thermal equilibrium;
c — density and modulus of elasticity curve. ....................................................................... 123
Figure 6.3. Stepwise filling of core cavities............................................................................ 124
Figure 6.4 Cross-section of rib-stiffened sandwich panel with foam core. ............................ 124
Figure 6.5. Graphic representation of Pareto optimality between each of two responses. ..... 127
Figure 6.6. Graphic representation of Pareto optimality between three responses. ................ 128
Figure 7.1 Modal analysis test set-up. ..................................................................................... 129
Figure 7.2. Ideal mode shape for symmetrical sandwich panel with several sections ............ 131
Figure 7.3 Frequency response curves and mode shapes for sandwich panels
with 170 mm width. .............................................................................................................. 131
Figure 7.4 Frequency response curves and mode shapes for sandwich panels with
300 mm width. ...................................................................................................................... 132
Figure 7.5. Frequency response curves and mode shapes for sandwich panels with vertical
stiffeners — 65 mm cross-section height. ............................................................................ 133
Figure 7.6 Frequency response curves and mode shapes for sandwich panels with vertical
stiffeners — 65 mm cross-section height and foam filler..................................................... 133
Figure 7.7. Region for calculation of loss factor. .................................................................... 134
Figure 7.8. Loss factor for natural-frequency N1. ................................................................... 135
Figure 7.9. Loss factor for natural-frequency N3. ................................................................... 135
Figure 7.10. Test set-up for hammer impact test. ................................................................... 136
Figure 7.11. Amplitude/ time curves sandwich panel with a rib-stiffened core with
foam filler (a) solid plywood board (b). .............................................................................. 137
Figure 8.1. INSTRON Dynatup 9250HV drop tower ............................................................. 139
Figure 8.2. Measured load/deflection curves for plywood specimen. .................................... 140
Figure 8.3. Measured load/energy curves for plywood specimen. ......................................... 141
Figure 8.4 Impact energy of plywood, OSB and particle board specimens............................ 143
Figure 8.5 Damaged areas for OSB and particle board. ......................................................... 143
Figure 8.6. Damaged areas for plywood specimens. .............................................................. 144
Figure 8.7. Side view of plywood specimens with thin middle layer. .................................... 145
Figure 8.8 Impact energy of plywood specimens with middle layer. ..................................... 146
Figure 8.9. Penetration resistance for various thickness plywood and sandwich panels ........ 147
Figure 8.10. Top view of impact damage of sandwich panels with corrugated core. ............. 148

13
Figure 8.11. Inside view of the corrugated core sandwich panel. .......................................... 148
Figure 8.12. Top view of tested sandwich panels with vertical stiffeners.............................. 149
Figure 8.13. Inside view of the sandwich panel. .................................................................... 149
List of tables
Table 1.1. Mechanical properties of most widely used commercially available plywood
with 20 mm thickness ............................................................................................................. 32
Table 1.2. Shear properties of commercially available plywood with 20 mm thickness
(|| fibre direction) .................................................................................................................... 33
Table 1.3 Typical surface properties ........................................................................................ 38
Table 1.4. Typical core material properties .............................................................................. 39
Table 2.1 Modulus of elasticity for specimens with a parallel orientation of fibres [GPa]...... 57
Table 2.2 Summary of tested thermoplastic composite specimens .......................................... 61
Table 3.1. Geometrical properties of plywood sandwich panels with rib stiffened core ......... 70
Table 3.2. Geometrical properties of plywood sandwich panels with corrugate core ............. 70
Table 3.3 Comparison of experimental and numerically acquired deflection values
for panels with vertical stiffeners. .......................................................................................... 72
Table 3.4. Design space for deck structure ............................................................................... 75
Table 3.5. Optimal cross section design for sandwich panels .................................................. 76
Table 3.6. Geometrical properties of the specimens ................................................................ 78
Table 3.7. Tests series for sandwich panels ............................................................................. 85
Table 3.8. Tests series for plywood boards .............................................................................. 85
Table 3.9. Stiffness and weight comparison for sandwich panels and plywood boards. ......... 88
Table 4.1. Cross –section parameters for tested panels ............................................................ 91
Table 4.2. Design variables ...................................................................................................... 94
Table 4.3. Mechanical properties of the all tested panels ....................................................... 107
Table 5.1. Specification of small scale test specimens ........................................................... 112
Table 5.2. Specification of tested large scale sandwich panels .............................................. 113
Table 6.1 Comparison of experimental and numerical results ............................................... 125
Table 6.2. Design variables .................................................................................................... 125
Table 6.3. Optimised sandwich panels in comparison with conventional plywood............... 126
Table 6.4. Optimised sandwich panels (without stiffeners) in comparison with
solid plywood ....................................................................................................................... 126

14
Table 7.1. Sandwich specimens investigated by NDE........................................................... 130
Table 7.2. Logarithmic decrement for similar thickness boards ............................................. 137
Table 7.3. Elastic properties acquired by ASTM E1876 for panels with sandwich
panels and reference plywood panels. .................................................................................. 138
Table 8.1. List of investigated plywood reference panels and commercially
available strand board and chipboard ................................................................................... 142
Table 8.2. Cross-sections of the layered plates is provided in Figure 9.7. ............................. 145
Table 8.3. Summary of acquired results for the specimens with thin middle layer. ............... 147

15
Table of content
ANOTĀCIJA .............................................................................................................................. 3
ABSTRACT ............................................................................................................................... 4
Acknowledgements .................................................................................................................... 5
List of abbreviations ................................................................................................................... 6
List of notations .......................................................................................................................... 6
List of figures ............................................................................................................................. 8
List of tables ............................................................................................................................. 13
Table of content ........................................................................................................................ 15
Introduction — topicality of research ....................................................................................... 18
The aim of the research ............................................................................................................ 19
Thesis statements to be defended ............................................................................................. 19
Scientific novelty of the research ............................................................................................. 20
Overview of the thesis .............................................................................................................. 25
I Literature review — plywood and wood based sandwich panels ......................................... 26
1.1 Plywood — a general remarks........................................................................................ 26
1.2 Manufacturing ................................................................................................................ 27
1.3 Density ............................................................................................................................ 29
1.4 Moisture content and dimensional stability .................................................................... 29
1.5 Mechanical properties..................................................................................................... 31
1.6 Enhancing of plywood properties ................................................................................... 33
1.7 Environmental resistance ................................................................................................ 34
1.8 General description of sandwich panels ......................................................................... 35
1.9 Mechanical properties of core and surfaces ................................................................... 37
1.10 Thermal properties ........................................................................................................ 40
1.11 Impact properties .......................................................................................................... 41
1.12 Review of some commercially available wood based sandwich panels ...................... 42
1.13 Research of novel core types for wood based panels ................................................... 45
1.14 Optimization — general ............................................................................................... 48
1.15 Pareto optimality .......................................................................................................... 49
II Properties on component level ............................................................................................ 52
2.1 Overview ........................................................................................................................ 52
2.2 Veneer specimens ........................................................................................................... 53

16
2.2.2 Observed strain measurement difficulties .................................................................... 55
2.2.3 Results for veneer specimens ....................................................................................... 56
2.2.4 Validation of veneer mechanical properties................................................................. 57
2.3 Mechanical properties of thermoplastic GF/PP composite ............................................. 60
2.4 Thermal properties of sandwich components ................................................................. 61
2.5 Adhesive tests of GF/PP composite and plywood .......................................................... 63
III Improving of mechanical performance for wood based sandwich panels .......................... 66
3.1 Plywood sandwich panels with I-type and V-type core .................................................. 66
3.2 Numerical modelling....................................................................................................... 66
3.3 Validation of the numerical model.................................................................................. 68
3.4 Optimisation of plywood sandwich panels ..................................................................... 72
3.5 Pareto optimality for sandwich panels ............................................................................ 76
3.6 Experimental validation of the stiffness optimisation for plywood sandwich panels with
the rib-stiffened core. ............................................................................................................ 78
3.7 Application of rib-stiffened panels in scaffolding decks ................................................ 83
IV Design of plywood GF/PP sandwich panels ....................................................................... 89
4.1 Finite element model ....................................................................................................... 89
4.2 Initial validation of the numerical model ........................................................................ 90
4.3 Experimental validation .................................................................................................. 92
4.4 Design variables .............................................................................................................. 93
4.5 Optimisation of the panels .............................................................................................. 94
4.6 Prototyping of the panels with GF/PP core ..................................................................... 98
4.7 Flexural tests ................................................................................................................. 102
V Non-contact measurements in validation of numerical models ......................................... 108
5.1 Material description ...................................................................................................... 108
5.2 FEM modelling......................................................................................................... 109
5.3 Possible wood voids ...................................................................................................... 111
5.4 Experimental tests ......................................................................................................... 111
5.5 Validation of the numerical model for small-scale specimens ..................................... 113
5.6 Validation of the numerical model of the large scale sandwich panels ........................ 115
5.7 Investigation by non-contact measurements ................................................................. 118
VI Analysis of thermal properties for sandwich panels with foam core ................................. 122
6.1 Introduction ................................................................................................................... 122

17
6.2 Multiphysics in numerical modelling ........................................................................... 122
6.3 Validation of thermal behaviour model ........................................................................ 123
6.4 Optimisation ................................................................................................................. 125
6.5 Equivalent stiffness sandwich panel design ................................................................. 125
6.6 Pareto optimality front .................................................................................................. 127
VII Vibration analysis for sandwich panel design ................................................................. 129
7.1 Overview ...................................................................................................................... 129
7.2 Quality control by NDE ................................................................................................ 130
7.3 Estimation of loss factor by modal analysis ................................................................. 134
7.4 Estimation of damping ratio ......................................................................................... 136
7.5 Evaluation of stiffness properties ................................................................................. 137
VIII Impact resistance of plywood sandwich panels .............................................................. 139
8.1 Description of the impact test set up ............................................................................ 139
8.2 Impact tests of wood based sheet materials .................................................................. 141
8.3 Impact of plywood specimens with thin middle layer .................................................. 144
8.4 Impact of plywood sandwich panels ............................................................................ 146
Conclusions ............................................................................................................................ 150
References .............................................................................................................................. 152
Apstiprinājums/Confirmation ................................................................................................. 161

18
Introduction — topicality of research
Forestry product export plays a significant role in the Latvian export structure (according to
the data estimate by the Bank of Latvia ~ 15 %). Vast territories of growing timber and
proximity to transit networks allow developing the lumber processing factories and wood-based
plate manufactories for plywood, chipboard and oriented strand board (OSB). One should also
bear in mind historical wood product research traditions in Latvia, which make a good
background for the development of innovative wood-based products. The production of timber
building materials requires less energy compared to metal, reinforced concrete or plastics. This
reduces the negative impact on air and water quality; both in the production process,
exploitation and recycling process.
One of most promising areas for new product research and development (R&D) may be
considered lightweight sandwich structures with reduced structural weight and upgraded load
bearing capacities close to conventional wood-based panels. Such a solution offers structure
with improved specific strength — strength/ density ratio compared to solid wood plate.
Plywood sandwich panels consisting of all-plywood surfaces and light material core may
become a disruptive alternative for thick conventional plywood boards in fields such as surface
and maritime transport demanding reduced weight and appropriate load bearing capacity.
Moreover, a considerable environment gain could be achieved by saving raw materials.
However, a considerable scientific effort is required to further develop a functional product
with optimal cross-section parameters. Main effort is dedicated to optimise design and to
implement functionality not originally associated in conventional designs.
Birch plywood is considered an outstanding natural laminate material mainly taking into
account its high stiffness and strength properties in planar direction. Therefore, it is further
considered for the current study to be most appropriate face material for lightweight sandwich
panels. Advantages from different core materials were also studied in order to elaborate strength
and weaknesses of each material considering application/manufacturing aspects. The
preliminary analysis of combined sandwich materials may give some understanding of the
general behaviour of the structure. However, to assess the maximum capacity of the structure,
optimisation of the cross-section parameters is required.
Environmentally friendly composite/sandwich materials are among those promising
research topics currently funded by the European Commission’s Framework Programme for
innovation. Some results obtained within projects, such as WOOD-NET, BIOCOBSEPT,
19
TREES4FUTURE and mainly MAPICC 3D, are summarised and integrated in the present
Doctoral Thesis.
The aim of the research
The aim of the research is to integrate multifunctional properties (such as heat and vibration
insulation and impact absorption) in plywood sandwich panels and to develop the design
methodology in order to increase overall performance of the panels. The proposed methodology
is based on the Pareto optimality detailed numerical modelling, prototyping and experimental
validation.
The following tasks are set to reach the aim of the research:
1. To characterise properties of individual sandwich components, birch veneer, PU foam
and thermoplastic composite.
2. To develop a numerical method in order to find plywood sandwich-type panels (with
straight stiffeners or corrugated core) with improved or equivalent mechanical
performance of conventional plywood panels.
3. To develop methodology based on Pareto optimality between plywood sandwich and
conventional panels considering simultaneous optimisation of several response
properties.
4. To prototype a novel plywood sandwich-type panel with plywood outer surfaces and
thermoplastic glass fibre/polypropylene core by one-step manufacturing approach. To
characterise realised mechanical properties by a non-destructive evaluation and
subcomponent level flexural tests.
5. To assess and classify the influence of design parameters such as thickness, surface and
core type on heat conduction, vibration as well as impact absorption properties.
Thesis statements to be defended
1. Validated design methodology of equivalent mechanical performance of plywood
sandwich panels taking solid plywood boards as stiffness reference.
2. The methodology for assessment of panels’ efficiency in order to simultaneously
improve several response criteria by Pareto optimality and meta-modelling technique.

20
3. Evaluation of physical, mechanical, impact resistance and vibration damping properties
of novel sandwich panel with plywood surfaces and corrugated thermoplastic composite
core made by one-step manufacturing process.
Scientific novelty of the research
Method based on Pareto optimality approach is developed to assess the efficiency of the
panel in case of several responses and various core types. It is based on numerical modelling,
metamodeling technique and parametric optimization. Efficiency of the method confirmed by
extensive validation trials.
Novel plywood sandwich panels with plywood surfaces and thermoplastic glass
fibre/polypropylene core were made by one-step manufacturing/prototyping approach.
Guidelines for quality control are established for non-destructive evaluation testing method.
Impact resistance for different types of sandwich panel cores has been evaluated.
Practical importance of the thesis
The outcome of the present research enables to design light and multi-functional plywood
sandwich-type panels, which are an effective alternative to traditional plywood and wood-based
sheet boards. The described numerical methodology supports the strain and stress distribution
assessment in each layer of plywood. This allows emerging disruptive tailored designs with
improved stiffness (quasi-isotropic or gradual transversal isotropic) properties. The validated
prototype of scaffolding deck complies with a set of industrial requirements and additional
safety factors gained by the improved technology process.
The research methodology
The numerical analysis of multi-layer plywood structures and parametrical optimisation is
based on commercially available finite element software ANSYS. In-house software EDAOPT
is employed for computer design of experiments, while in-house software VARIREG deliver
both parametrical and non-parametrical response approximation functions by ABFC method.
All mechanical tests of sub-component scale specimens for bending load were done using
servo-hydraulic testing equipment INSTRON 8802. Both HBM linear alternating resistance
deformation measurements and strain gauges has been added for auxiliary measurements.
Furthermore IMETRUM digital image correlation system has been applied for non-contact
strain measurements. In order to obtain the heat conduction coefficient the equipment LINSEIS

21
HFM 200 was used. For non-destructive evaluation the dynamic laser-scanning equipment
POLYTECH PSV400 was employed to obtain natural frequencies, and mode shapes as well as
coefficient of damping. For specimen excitation the loudspeaker with frequency range of 0-20
kHz was utilised. The impact tests were conducted on INSTRON Dynatup 9250 HV with
working range between 0-1600 J. Following software were used for data processing — MS-
Office, Sigma Plot, Matlab, Catman Easy, Instron Bluehill, Imetrum Video Gauge, ANSYS and
PYTHON GUI.
The theoretical and methodological framework of the thesis
Obtained research results cover several engineering fields as:
Mechanics of composite materials;
Civil engineering;
Wood science;
Structural optimisation;
Heat dynamics;
Non-destructive evaluation
List of publications
Labans, E., Kalniņš, K. Experimental Validation of the Stiffness Optimisation for Plywood
Sandwich Panels with Rib-Stiffened Core. Wood Research, 2014, Vol.59, Iss.4, pp.793-802.
(indexed in ISI Web of Science)
Labans E., Kalnins K., Zudrags K., Rudzite S. High-performance plywood/GF/PP textile
composite sandwich panels developed during MAPICC 3D Project. Proceedings of the 5th
International conference on Intelligent Textiles and Mass Customization. Morocco,
Casablanca, 4-6 November, 2015 (on CD).
Labans, E., Kalniņš, K., Zudrags, K., Rudzīte, S., Kirpluks, M., Cabulis, U. Evaluation of
plywood sandwich panels with rigid PU foam-cores and various configurations of stiffeners.
In: Proceedings of the 3rd International conference on Optimization and Analysis of Structures,
Estonia, Tartu, 23-25 August, 2015, pp.45-51.

22
Labans, E., Kalniņš, K., Zudrags, K. Stiffness Analysis of Sandwich Panels with Corrugated
Plywood and GFRP Core. In: Shell Structures: Theory and Application: Proceedings of the 10th
International Conference “Shell Structures, Theory and Applications” (10th SSTA 2013),
Poland, Poznan, 16-18 October, 2013. London: Taylor & Francis Group, 2014, pp.539–542.
(indexed in ISI Web of Science and SCOPUS)
Labans, E., Kalniņš, K., Bikovs, A. Simulation of Mechanical and Thermal Properties for
Sandwich Panels with Cellular Wood Cores. In: The Eighth International Conference on
Engineering Computational Technology: Civil-Comp Proceedings 100, Croatia, Dubrovnik, 4–
7 September, 2012 (on CD) (indexed in SCOPUS)
Labans, E., Kalniņš, K. Numerical Versus Experimental Investigation of Plywood Sandwich
Panels with Corrugated Core. In: Civil Engineering 11: 3rd International Scientific Conference
: Proceedings, Latvia, Jelgava, 12-13 May, 2011. Jelgava: Latvia University of Agriculture,
2011, pp.159–165(indexed in SCOPUS)
Labans, E., Kalniņš, K. Numerical Modelling and Experimental Validation of Dendrolight
Cellular Wood Material. In: The 8th Meeting "Northern European Network for Wood Science
and Engineering (WSE)": Proceedings, Lithuania, Kaunas, 13-14 September, 2012. Kaunas:
Kaunas University of Technology, 2012, pp.177–184
Labans, E., Kalniņš, K. Optimal design practice for plywood sandwich panels // Proceedings of
the 9th ASMO UK / ISSMO conference on Engineering Design Optimization, Ireland, Cork, 5–
6 July, 2012. Cork: 2012, pp.71–79.
Labans, E., Kalniņš, K. Non-Contact Measuring System ARAMIS for Sandwich Panels
Research. Proceeding of the 16th scientific student’s conference Human-Environment -
technologies, Latvia, Rezekne, 25-25 April, 2012. pp.396–405
Labans, E., Kalniņš, K., Ozoliņš, O. Experimental and Numerical Identification of Veneers
Mechanical Properties. Construction Science. Vol.11, 2010, pp.38–43. ISSN 1407-7329.

23
List of attended conferences
Labans E., Kalnins K., Zudrags K., Rudzite S. High-performance plywood/GF/PP textile
composite sandwich panels developed during MAPICC 3D Project. 5th International conference
on Intelligent Textiles and Mass Customization. Morocco, Casablanca, 4–6 November, 2015
Labans, E., Kalniņš, K., Zudrags, K., Rudzīte, S., Kirpluks, M., Cabulis, U. Evaluation of
plywood sandwich panels with rigid PU foam-cores and various configurations of stiffeners.
3rd International conference on Optimization and Analysis of Structures, Estonia (OAS2015),
Tartu, 23-25 August, 2015.
Labans, E., Kalnins, K., Zudrags, K. Stiffness Analysis of Sandwich Panels with Corrugated
Plywood and GFRP Core Shell Structures: Theory and Application: (10th SSTA 2013), Poland,
Poznan, 16-18 October, 2013.
Labans, E., Kalniņš, K. Numerical Versus Experimental Investigation of Wood based panels
with plywood and GFRP composite components. Civil Engineering '12: 4th International
Scientific Conference, Latvia, Jelgava, 12-13 May, 2013
Labans, E., Kalniņš, K., Zudrags, K. Stiffness Analysis of Sandwich Panels with Corrugated
Plywood and GFRP Core. Shell Structures: Theory and Application: 10th International
Conference (10th SSTA 2013), Poland, Gdansk, 16-18 October, 2013.
Labans, E., Kalniņš, K., Bikovs, A. Simulation of Mechanical and Thermal Properties for
Sandwich Panels with Cellular Wood Cores. The Eighth International Conference on
Engineering Computational Technology, Croatia, Dubrovnik, 4-7 September, 2012
Labans, E., Kalniņš, K. Optimal design practice for plywood sandwich panels // Proceedings of
the 9th ASMO UK / ISSMO conference on Engineering Design Optimization, Ireland, Cork, 5-
6 July, 2012
Labans, E., Kalniņš, K. Numerical Modelling and Experimental Validation of Dendrolight
Cellular Wood Material. The 8th Meeting "Northern European Network for Wood Science and
Engineering (WSE), Lithuania, Kaunas, 13-14 September, 2012

24
Labans, E., Kalniņš, K. Non-Contact Measuring System ARAMIS for Sandwich Panels
Research. 16th International scientific students conference Human-Environment -technologies,
Latvia, Rezekne, 25-25 April, 2012
Labans, E., Kalniņš, K. Numerical Versus Experimental Investigation of Plywood Sandwich
Panels with Corrugated Core. Civil Engineering '11 : 3rd International Scientific Conference :
Proceedings, Latvia, Jelgava, 12-13 May, 2011
E. Labans, K. Kalniņš, Optimum design guidelines for plywood sandwich panels, OAS2011 —
Optimization and Analysis of Structures, Tartu, Estonia, 25-27 August , 2011
E. Labans, K. Kalniņš, Elaboration of design guidelines for all-plywood sandwich panels,
IAWS, Stockholm, Sweden, 31 August — 2 September, 2011
E. Labans, K. Kalniņš. Numerical and experimental investigation of plywood sandwich panels,
RTU 52nd International scientific conference, 13 October, 2011, Riga
E. Labans, K. Kalniņš, K. Zudrags, Testing and simulation of plywood sandwich panels with
corrugated core, Wood Science and Engineering 6th meeting, Tallin, Estonia, 21-22 October,
2010
Labans, E., Kalnins, K., Ozolins, O. Experimental and Numerical Identification of Veneers
Mechanical Properties. RTU 51st International scientific conference. Latvia, Riga, 12 October,
2010

25
Overview of the thesis
Doctoral thesis contains 8 chapters, conclusions and references. Thesis volume includes 161
pages, 131 figures, 30 tables and a reference list of 152 sources.
The first chapter provides literature review, for definition of a scope and tasks of current
research. Second chapter gives more insight on coupon scale tests to acquire material properties
for further design of sandwich components. Methodology for optimisation of lightweight
plywood sandwich panels (based on numerical modelling and experimental validation) is
described in the third chapter. The fourth chapter provides detailed description on technological
development of novel sandwich panel type with corrugated thermoplastic composite core and
plywood surfaces. Advantages of non-contact measurement system in evaluation and validation
of wood based sandwich panels are explained in the fifth chapter. In the next chapter focuses
on optimal design of lightweight sandwich panels with integrated heat insulation properties.
Following by Pareto optimality analysis for assessment of impact of the natural PU foam on
stiffness and thermal conductivity. Additionally a comparison of vibration damping properties
like loss factor and damping ratio for panels with various core types is outlined in the seventh
chapter. The final chapter deals with impact resistance characterisation of reference wood based
sheet specimens and sandwich panels with stiffener and corrugated core. Overall conclusions
and list of references conclude current thesis.

26
I Literature review — plywood and wood based sandwich panels
1.1 Plywood — a general remarks
Plywood is widely used wood based sheet material suitable for load-bearing and non-
structural applications. Comparing to structural timber it has outstanding mechanical
transversal isotropic properties and increased shape stability for high moisture environment.
Plywood conventionally consists of the odd number of plies with fibre directions balanced
against the central layer or an axis of plywood. Due to the stacking and orientations of wood
veneers (plies) timber defects like notches and cracks are being spread over considerable area
therefore localizing and reducing the weak spots in plywood sheets [1]. Taking into account
that in flexural loading mode the outer plies are more stressed than plies in the centre, defective
or second-grade timber could be successfully utilized as a core of the layered material. Such a
mechanical behaviour allows to maintain strength and stiffness properties by utilising lower
cost material. The same principle works for sandwich panels as well. The laminated structure
also reduces splitting when plywood is penetrated by fasteners — screws or nails even close to
the edges. Therefore ease of structural integrity is a key factor for plywood vast applicability.
Typically plywood is graded according to the quality of the outer veneers. Standard EN 635
(Plywood — Classification by Surface Appearance [2]) serves as the basis for quality grading
throughout the European region. More detailed description of face grades is provided in Finnish
standard for birch plywood SFS 2413 (a detailed example given in Figure 1.1). Surface grades
do not significantly affect the mean mechanical properties, however lower grade plywood might
cause larger scatter of those properties.
Figure 1.1. Example of birch plywood grading [2].
Gra
de B
(I)
Gra
de B
B (
III)
Gra
de S
(II)
Gra
de W
G (
IV)

27
Besides to excellent mechanical properties the environmental and production aspects should
be considered. Plywood is one of the most efficient means of wood processing with a low
amount of surplus and low energy consumption in the manufacturing process. Approximately
160 kg of CO2 equivalent is necessary for producing 1 m3 of uncoated plywood, comparing
with 120 kg/m3 of concrete, 5320 kg/m3 of steel [3] and 3250 kg/m3 of plastic [1].
A wide range of hardwood and softwood species could be utilized in plywood
manufacturing. Typical wood species for plywood manufacturing are silver birch (Betula
pendula), douglas-fir (Pseudotsuga menziesii), Norway spruce (Picea abies), pine (Pinus
silvestris), maple (Acer pseudoplatanus), beech (Fagus sylvatic), oak (Quercus robur). Some
tropical and decorative wood species like redwood (Sequoioideae) mainly utilised as a cover
ply in plywood designed for interior design purposes.
Plywood is integrated into many applications requiring high-strength and high-stiffness
sheet material. Most common civil-engineering applications are structural flooring, wall and
roof covering. Plywood sheets are utilized to form a shear diaphragm walls in the houses with
timber frame [4]. Resin film coated (moisture resistant) plywood from birch or maple wood is
widely used in concrete formwork/moulding systems. The same plywood is also utilized in the
floors, walls and roofs in transport vehicles and containers. Low-grade plywood is often utilized
in packaging and boxing applications as well as a base for transport palettes. Plywood can be
formed in the smoothly curved surface, convex / concave surfaces and three-dimensional
panels. This ability is widely applied for interior and furniture object manufacturing. Also
regarding the ability to bend separate plywood layers it is applied for building rotor blades, boat
hulls, interior furniture elements, as well as music and sport equipment.
1.2 Manufacturing
To produce high-quality plywood, timber logs with large diameter and a small cross-
sectional area change along the length are required. Before cutting and peeling of the logs, they
are placed in a hot water pond to enhance plasticity thus improving the quality of the peeled
veneer. After hydrothermal treatment logs are debarked and cut to necessary length. The peeling
machine rotates log about its longitudinal axis and thin blade peel a continuous strip of the
veneer. To maximize veneer yield, it is important to align log axis parallel to the blade. Laser
distance scanners are effective means of performing this operation. Peeled veneers are cut in
the uniform length sheets and stacked into the piles. Remaining log core is chopped into strands

28
for recycling in other wood based by-products or application as fuel for heating and drying
systems in the plant. Moist veneers are kiln-dried and sorted according to the size format and
grade of quality. Optionally veneers with low numbers of surface defects like knots and holes
could be patched manually to reach the higher grade of the veneer. Afterwards, the sheets are
covered with glue and stacked into perpendicular layers in necessary quantity to reach nominal
final plywood thickness. Small deviations from target sheet thickness are possible due
fluctuation of the veneer thickness and surface sanding. Step-by-step scheme of manufacturing
is given in Figure 1.2.
Figure 1.2. Main plywood manufacturing steps.
a — sorting of the logs, b — wood thermal and moisture treatment, c — debarking of the logs, d — cutting logs
to proper length pieces, e — peeling of the veneer, f — veneer drying, g — covering of adhesive, h — veneer
stacking in sequence, i — cold pressing of the veneers, h — hot pressing — final consolidation, k — quality control
of the final product.
Typical adhesive for moisture resistant plywood is phenol-formaldehyde resin. For indoor
application urea-formaldehyde glue might be considered as a cheaper alternative. It should be
noted that formaldehyde resin is carcinogenic and special attention should be given not to
exceed allowable limits this has been Europe wide regulated by standard EN 717 [5].
a. b. c.
d. e. f.
g.
h. i.
j. k.

29
Before hot pressing, stacked veneers covered with glue could be subjected to a cold pressing
at low-pressure magnitudes to improve the resin impregnation. Hot pressing finally cures the
resin and make a strong bond between layers. Typical pressure values vary from 1 to 2 MPa
and temperature about 1400 Celsius. Edge trimming is done after plywood is gradually cooled
and moisture content stabilized. The standard length of the plywood sheets is 2.5m to 3m,
nevertheless currently it could be produced up to 4m in length. Conventional width — 1.20m
to 1.55m. Sanding, painting or covering with resin film is the final step of the plywood
processing. At this stage quality control of the mechanical properties should be performed for
selected specimens from the pack. If mechanical properties correspond to the requirements,
plywood sheets are packed on the pallets and prepared for transportation.
1.3 Density
Plywood density is slightly higher than the density of the raw timber species it has been
made of. This effect is due fibre densification during hot pressing and impregnation of the pores
with the resin. In the case of birch plywood average density of the final product is approximately
650 kg/m3 at room temperature of 200 C and relative air humidity of 65 % [6]. Pine plywood
density at the same environment is 570 kg/m3 [1]. The density of the spruce plywood is
420 kg/m3 [6].
1.4 Moisture content and dimensional stability
Taking into account that wood materials are hygroscopic, the moisture content of the
plywood is dependent on relative air humidity and temperature (except cases of direct wetting
from outside).
Due to structure densification plywood has slightly lower moisture content (around 9.5 %)
comparing to (11 %) of the solid wood at the relative air humidity of 65 % and temperature of
210 C as shown in Figure 1.3 [7].

30
Figure 1.3. Equilibrium moisture content of the wood-based panels and solid wood at room
temperature [7].
Moisture content also induces dimensional changes of the plywood sheets. Extension in the
width and length of the sheet may reach up to 0.5 — 1 % comparing very dry and highly wet
environments [8]. At the same environment the solid wood may change dimensions up to 12 %
across the grain and less than 1 % along the grain [8].
In both in-plane directions linear expansion has approximately same value due to balanced
structure of the plywood neutralizing strains in transverse layers. Long-lasting research of the
plywood moisture behaviour in outdoor climate have been reported by Van den Bulcke [9].
Moisture content in various plywood boards has been monitored by measuring the mass of the
each specimen with a load cell. In severe rain environment plywood moisture may reach up to
25 % for a short period of time. According to Rapp et al. [10] wood moisture content exceeding
25 % causes permanent degradation of the wood due appearance of decay. Lower limit of
moisture content of 20 % is considered as safe margin to preserve different plywood types [11].
As one of the possible solutions of reducing moisture-induced dimensional changes in
plywood is increasing the number of layers in sheet [8] or applying a thermal treatment to
veneers [12]. Plywood made of thermally treated poplar veneers (90 min at 2000 C) demonstrate
30 % increase in antis-swelling-efficiency comparing with reference non-treated plywood.
0
10
20
30
40
50
60
70
80
90
100
0 5 10 15 20 25
Re
lati
ve h
um
idit
y, %
Moisture Content (%)
Solid Wood
Plywood
OSB

31
1.5 Mechanical properties
The structure of the conventional plywood possesses the same structure as the laminate
formed of unidirectional layers. Mechanical properties of the plywood largely depend on
properties and lay-up of the separate veneers and the bonding quality.
Bearing in mind that plywood consists of the odd number of plies, mechanical properties are
usually examined in two main directions: along fibres (largest fracture of the fibres oriented in
a single direction) and in the transverse direction. In further text direction along fibres is marked
with (||) and transverse direction (_|_). Due to larger fibre fracture on the outer sides of the
plywood board first principal direction has significantly higher stiffness and maximum stress
resistance. Mechanical properties and a density of the plywood are significantly affected by
wood species of the raw material. Most convenient way to determinate the flexural properties
is 3-point bending tests on a small scale coupons according to EN-310 [13] or ASTM D3043
[14]. Flexural properties of the most commonly used plywood of various wood species are
summarized in Table 1.1. There is some correlation between veneer density and mechanical
properties of the plywood however other processing aspects like adhesive type, ply thickness,
surface sanding and compacting pressure also has a considerable impact on final appearance.
Plywood made of silver birch has a significant advantage over plywood of Pine and other
softwood species.
One could note that mechanical properties in the transverse direction are much weaker to
those in parallel to the grain. However, this difference vanish by increasing the number of cross-
laminated plies and total sheet thickness. It should be noted that mechanical properties for
plywood vary depending on the number of plies in the sheet. In Figure 1.4.a it could be seen
that proportion of transverse and parallel layers influence modulus of elasticity in tension
especially for plywood with a small thickness.
In the case of 6.5 mm plywood with three plies 33 % of the plies are oriented in single
directions. For the plywood with a thickness of 50 mm (35 plies), this proportion is 43 %. The
same trend also could be observed for max stress in Figure 1.4b.

32
Table 1.1. Mechanical properties of most widely used commercially available plywood with
20 mm thickness
Wood species
Flexural
modulus of
elasticity, GPa
Flexural strength,
MPa
Density,
kg/m3
Manufacturer
|| _|_ || _|_
Silver birch 10.1 7.8 45.3 39.2 630.0
AS Latvijas Finieris
[15]
Spruce(Conifer) 7.3 5.6 22.5 19.6 570.0 WISA Plywood [6]
Poplar 4.6 2.6 28.1 14.9 470.0 Thebault [16]
Pine 8.1 4.2 20.1 15.1 580.0 Thebault [17]
Okuome 5.4 3.8 34.6 19.7 450.0 Thebault [18]
Figure 1.4. Modulus of elasticity and strength for birch plywood at various thickness steps
[15].
In-plane shear properties play a significant role when plywood is installed in timber frame
buildings as a diaphragm to provide shear stiffness and stability or integrated into double T-
shaped beams or as vertical stiffeners for sandwich panels. Out-of-plane shear properties are
important for small span floor plates with high bending load intensity, for example in truck
flooring. Shear properties for the some commercially available plywood are summarized in
Table 1.2.
6
7
8
9
10
11
12
4 9 15 21 27 35 45
E-m
od
ulu
s, G
Pa
Thickness, mm
Parallel outer fibres
Transverse outer fibres20
25
30
35
40
45
50
4 9 15 21 27 35 45
Stre
ss, M
Pa
Thickness, mm
Parallel outer fibres
Transverse outer fibres

33
Table 1.2. Shear properties of commercially available plywood with 20 mm thickness (|| fibre
direction)
Wood species
Shear modulus, GPa Shear strength, MPa Manufacturer
In-plane
Out-of-
plane In-plane
Out-of-
plane
Birch 0.75 0.19 10.00 2.30 AS Latvijas Finieris [15]
Spruce (Conifer) 0.53 0.07 7.00 1.66 WISA PlyWood [6]
Radiata Pine 0.52 0.13 4.50 1.70 CHH Woodproducts [19]
Shear strength values are not widely available because shear tests are complicated and time-
consuming. Therefore the main industrial standard for characterisation remains 3-point
bending.
Flexural and shear strength has a direct relation with moisture content in plywood. At elevated
moisture content mechanical properties become weaker, and dimension changes occuring. Siim
et.al [20] confirmed that in the most critical case when birch plywood is soaked in the water for
24 h, bending and shear mechanical properties might decrease by 35 %. It should be noted that
water resistant plywood performs significantly better than conventional “indoor” plywood. A
similar trend also has been confirmed by Aydin et. [21] examining poplar and spruce plywood
bonded by a urea-formaldehyde adhesive. Also, it has been found that Formaldehyde emission
decrease at higher moisture content [21].
1.6 Enhancing of plywood properties
Many scientific papers were published on the topic of improving plywood properties without
significant change of the material structure. For example Bekhta et al. [22, 23] propose the
method of pre-pressing of individual veneers before forming plywood lay-up. In such a way
mechanical properties could be increased by densification of the wood structure. At the same
time, the surface roughness is significantly decreased leading to reduced resin intake.
One of the ways for creating a novel type of plywood is trying of new wood species. For
example, plywood made of bamboo fibres/veneers possess excellent mechanical qualities and
at the same time fast raw material growth rate [24]. Reported modulus of elasticity for one layer
bamboo strand is 39 GPa [24]. Similarly ongoing efforts of exploiting oil palm stem fibres in
reinforced composite manufacturing are summarized in recent review paper [25].
Nano materials have a potential to certain degree to increase the mechanical characteristics
of the plywood. It was confirmed that nano-additive to melamine urea formaldehyde resin could

34
significantly increase dimensional stability and improve mechanical characteristics of the
plywood [26]. Nevertheless the benefits and risks associated are not fully evaluated.
Chemical engineering is focusing mainly on an adhesive modification to create
environmentally friendly substance and to add other multifunctional properties like fire
resistance. Therefore, significant scientific efforts are being turned towards development of the
inexpensive plywood adhesive with low phenol-formaldehyde emission level. Some of the
methods consider modification of existing resin to reduce emission [27] and others on complete
alteration with bio-based component resin. Plastic film has been proposed as a feasible
alternative to the liquid resin in [29]. The film also reduces manufacturing complexity and
labour intensity in manufacturing [29] thus in future could increase the manufacturing process
automation.
Zhang et.al. [30] investigated multifunctional formaldehyde scavenger with flame resistance
(FSFR). It has been found that formaldehyde emission of the treated plywood was 0.1-0.32 mg/,
which could meet the E0 grade requirement (<0.5 mg/l). The flame resistance of treated
plywood increased significantly at the same time such an adhesive do not influence bonding
strength of the plywood.
At the end of the life cycle it is possible to transform plywood into an energy source, however
research by Karshenas and Feely [31] suggest that old plywood used in concrete form-work
still have only slightly lower stiffness than new reference board.
1.7 Environmental resistance
The biological durability of the plywood (without any surface coat and sealed edges) is
similar to the wood species it is made of. The typical threat for plywood is wood decay, fungi
and insects.
Fungal growth is the main reason of decay in wood and plywood. Necessary conditions for
fungi growth is sufficient moisture, a temperature range of +3 to +40 deg Celsius and presence
of oxygen. In exterior conditions the risk of fungal growth appears when plywood moisture
content reach 20 % and temperature higher 0 deg Celsius [32]. Proper construction methods are
eliminating some of the necessary factors for fungal growth greatly reduce the risk. Phenol film
surface cover and impregnated edges of the plywood makes it more suitable for outdoor
applications by reducing possibilities of moisture penetration inside the plywood.
Blue-stain fungus and mould do not cause such a critical damage as decay because mainly
parasites on the outer surface of the plywood. It does not significantly weakens mechanical

35
properties although causes discoloration and stains of the surface [33]. It is also an indicator
that moisture content in the plywood is elevated and decay might occur.
It is generally accepted that thermal treatment has an outstanding result on improving
biological resistance for wood based materials; in addition, it also improve dimensional stability
and reduce moisture uptake [34]. The most significant drawback of this method is reduced
mechanical properties of plywood. Thermal treatment at 1800 C may reduce flexural strength
by more than 50 % as reported by Aro et. al.[35].
Plywood sheets subjected to direct sunlight receives a dose of ultraviolet radiation causing
fading of the surface colour and mechanical damage to outer wood fibres in long term run.
Applying phenol film or colour coat is efficient means of reducing the influence of the UV light
on the plywood surface, however it may hide natural texture of the wood. Extensive study of
plywood weather resistance has been performed by Biblis [36] observing and summarising
plywood specimens for more than ten years. Another option to protect the plywood from UV
light is covering it with glass sheets. Most suitable application of the glass cover might be in
the facades of the buildings.
1.8 General description of sandwich panels
Sandwich panel is the type of modern structural solutions where thin and strong face sheets
are combined with lightweight core material so that each material property gives the benefit of
the entire structure as a whole. [37]. Typical sandwich-structure conceptually consists of two
strong and durable surface sheets and the core, which is predominantly mechanically weaker
and lighter layer as shown in Figure 1.5. The adhesive is sometimes considered as an individual
layer.
Figure 1.5. Structure of typical sandwich panel.
Adhesive layer
Surface
Core layer

36
The main conception of sandwich panel is to redistribute materials inside the structure to
reach maximal stiffness in bending load case. It allows increasing thickness and consequently
moment of inertia without significant mass penalty.
Core, which is generally made up of weaker than the surface, links the two faces at constant
distance stabilizes the surface against buckling and wrinkling. The connection between the
individual layers of materials should be strong to prevent delamination. Shear stiffness of the
core also contributes to deflection of the whole panel. Various core types could produce a
beneficial result not only for light weighting and material saving but also for adding
multifunctional properties to sandwich panel like heat insulation, sound and vibration damping
as well as blast wave absorption [38].
Observing material Young`s modulus/Density ratio chart [39] in Figure 1.6 it can be seen
that some areas in design space are blank and feasible material is not yet found. For example in
the region of high modulus of elasticity and low density. It is considered that solution for filling
holes lay in extensive application of hybrid materials and adapted core structures for sandwich
panels, especially for bending stiffness [39].
Figure 1.6. Young`s modulus/density ratio for wide range of engineering materials [3].
37
Due to multifunctionality sandwich panels are used in huge spectra of applications. Light-
weightiness and superior mechanical properties are important for space modules where
unidirectional carbon fibre composites and aluminium honeycomb core provide the highest
strength/density ratio [40]. Foam core panels with GFRP, polymer or sheet metal core are
widely applied in transport structures, like trains, trucks and light boats [41, 42]. Civil
engineering field is mainly dominated by steel face and mineral-wool-core sandwich panels due
to competitive price, fast assembling and excellent heat insulation parameters. Wood based
sandwich panels are widespread in low-rise buildings and private housing. More detailed
comparison of commercially available wood based sandwich panels is given in further
paragraph.
The most significant disadvantages of a such material at the moment of production is a
complex, sophisticated quality control, connectivity difficulties and a lack of a basic knowledge
on the effects of damage to the structure [43]. Choosing ingredients of the sandwich material
mainly depends on the target application and related design criteria.
1.9 Mechanical properties of core and surfaces
Mechanical performance of sandwich panels is mainly dependent on mechanical properties
of individual components it is built. Most important surface properties are Modulus of elasticity
in tension and strength. It should be noted that tensile and compression strength are not equal
for most of the materials [44]. In addition, the surface should provide sufficient resistance to
environmental factors (like moisture and temperature) and abrasion resistance if installed as
flooring. Shock and blast wave absorption capacity might be relevant in marine applications for
boat hulls [37]. Summary of the most common surface materials is summarised in Table 1.3.
Special attention is given to wood based sheet materials that could be applied in the design of
sandwich panels.
It should be noted that the fibre composite material properties strongly depend on the
enclosing of the fibre-matrix properties and fibre layout. For example, glass fibre modulus is
about 70 GPa, but the setting up of the cloth and inserting the epoxy matrix, the modulus of
elasticity decreases to an average of 18 GPa equivalent birch veneer mechanical properties
along fibres [49]. The approximate value of the modulus of elasticity of the composite layer
comprising fibres and matrix could be detected by the law of the mixture(1.1), separately
reported for fibres and the surrounding matrix modulus and volume [44].

38
mmff EEE 1 (1.1)
where
fE — fibre modulus of elasticity; mmff EEE 1
mE — matrix modulus of elasticity;
f — Fibres by volume relative to the total volume of the mixture .
m — The matrix volume of the total volume of the mixture.
Following a similar principle, knowing the relationship between the two components, the
volume can be calculated from the elastic modulus fibres in the opposite direction, the Poisson
coefficient and shear modulus.
Table 1.3 Typical surface properties
Label Density ρ,
[kg/m3]
Modulus of
elasticity
Ex, [GPa]
Tensile
strength σt,
[MPa]
Reference
Steel 7800 206 360 [37]
Aluminium 2700 73 300 [37]
GFRP (fabric based) 1700 18 270 [37]
CFRP (fabric based) 1400 44 430 [37]
Plastic (polypropylene) 910 1.5 41.1 [45]
Plastic (polyethylene) 952 1.4 29.5 [45]
Birch plywood (3-layer
along grain) 650 12.8 75 [46]
Pine boards (C24
according EN 338) 350 11 14 [47]
High density fibreboard
(HDF) 880 4.9 47.8 [48]
Oriented strand board
(OSB) 650 2.5 20.0 [48]
Chipboard 600 2.7 15.6 [1]

39
Core layer task is to absorb the shear deformation and redistribute the strain to outer surfaces.
Moreover core material should affect the wrinkling stability of the surface. In most common
thin-wall core sandwich designs core occupy more than 90 % of the total volume of the
structure, which is an important prerequisite to ensure the design of a low weight [49]. This is
usually achieved by employing a core material with a very low density, for example balsa wood,
or by utilising materials of the high amount of cells and pores. The most common cell-type
material for industry are honeycombs. Unlike the sandwich panel surfaces, the main mechanical
properties of the shear modulus and modulus of elasticity perpendicular to the surface (Ez).
Some most widely spread core material properties are summarized in Table 1.4.
Table 1.4. Typical core material properties
Label Density ρ,
[kg/m3]
Shear
strength,
[MPa]
Shear
modulus,
[MPa]
Reference
Aluminium honeycomb 72 2.3 483 [50]
Aramid honeycomb 64 2 63 [50]
Paper honeycomb 56 0.88 97 [51]
PU foam 62 0.36 6.4 [52]
Aluminium foam 85 0.22 20 [53]
Mineral wool 95 0.015 0.04 [54]
Balsa wood 110 2.17 120 [55]
Pine wood 350 4 690 [47]
Balsa wood core is one of the oldest core material, which is still used in structural elements,
where the weight of the core is not critical, such as a small boats internal structures [40]. Product
density may range from 100 to 300 kg/m3. As with other wood-based materials and balsa wood
mechanical properties and thermal expansion coefficients, high temperature and humidity, is
dependent on the fibre direction. Thus to avoid a large panel warping balsa wood cubes are
placed in the transverse direction to the surfaces.
Aluminium honeycomb cores are the best stiffness / weight ratio, compared to the rest of the
core material, however, the complicated and expensive production makes it reasonable for
application only in high-performance structures like aircraft and space vehicle [38].
Honeycomb made from the fibre material as aramid are commonly used in crash abortion and
high-temperature applications in structures (depending on the type of binder up to 2500 C) [56].

40
Low-density paper honeycomb core are applied in structures with minor load bearing
requirements, like indoor furniture and partition walls. To increase moisture resistance paper
honeycomb might be soaked in the adhesive. Although the foam cores are weaker mechanical
properties than the same density honeycomb cores, the main advantages are simple and
inexpensive production, as well as good bonding opportunities with surfaces, due to the greater
contact area. In addition, the foam material has good thermal and acoustic wave damping
ability. In practice, the most commonly spread foam types are polyurethane, polyester and
polyvinyl chloride foam [38].
Another way of making lightweight, high performance sandwich structure is the design of a
core adapted to specific load requirements. The most straight-forward example is stiffener core
with vertical or inclined stiffeners. This design is well suited for panel type structure for bending
load cases like floor deck [57].
The design of stiffeners mentioned above are mainly designed for unidirectional load bearing
panels; to create a sandwich structure with uniform properties in two or more directions, lattice
web core could be applied. Example of truss core is given in Figure 1.7.
Figure 1.7. Lattice core with carbon fibre composite struts [58].
1.10 Thermal properties
Taking into account that largest volume in the typical sandwich structure is occupied by
lightweight core it provides excellent opportunity to integrate heat insulation properties inside
core layer. Sandwich panels with steel faces and mineral wool or foam core already take a
significant role in the construction of industrial buildings. Thermal conductivity is the main
property characterizing the ability of the material to conduct heat (unit W/(Km). It is possible
to calculate the rate of energy loss through the unit wall area knowing temperature difference
on both sides of the wall and thickness. In the case of classic three layered sandwich panel with thin
faces and thick core, effective thermal conductivity is close to that of the core layer. Introducing
rigid stiffeners usually create transit area between surfaces improving heat flow and increasing
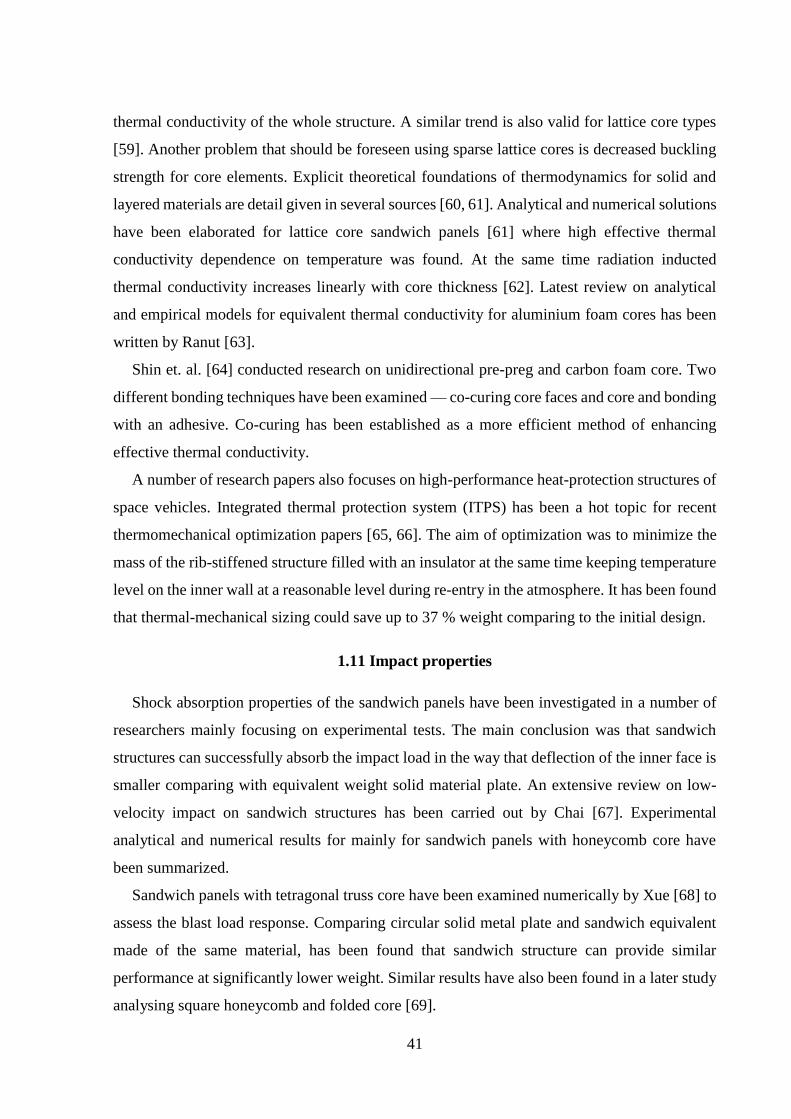
41
thermal conductivity of the whole structure. A similar trend is also valid for lattice core types
[59]. Another problem that should be foreseen using sparse lattice cores is decreased buckling
strength for core elements. Explicit theoretical foundations of thermodynamics for solid and
layered materials are detail given in several sources [60, 61]. Analytical and numerical solutions
have been elaborated for lattice core sandwich panels [61] where high effective thermal
conductivity dependence on temperature was found. At the same time radiation inducted
thermal conductivity increases linearly with core thickness [62]. Latest review on analytical
and empirical models for equivalent thermal conductivity for aluminium foam cores has been
written by Ranut [63].
Shin et. al. [64] conducted research on unidirectional pre-preg and carbon foam core. Two
different bonding techniques have been examined — co-curing core faces and core and bonding
with an adhesive. Co-curing has been established as a more efficient method of enhancing
effective thermal conductivity.
A number of research papers also focuses on high-performance heat-protection structures of
space vehicles. Integrated thermal protection system (ITPS) has been a hot topic for recent
thermomechanical optimization papers [65, 66]. The aim of optimization was to minimize the
mass of the rib-stiffened structure filled with an insulator at the same time keeping temperature
level on the inner wall at a reasonable level during re-entry in the atmosphere. It has been found
that thermal-mechanical sizing could save up to 37 % weight comparing to the initial design.
1.11 Impact properties
Shock absorption properties of the sandwich panels have been investigated in a number of
researchers mainly focusing on experimental tests. The main conclusion was that sandwich
structures can successfully absorb the impact load in the way that deflection of the inner face is
smaller comparing with equivalent weight solid material plate. An extensive review on low-
velocity impact on sandwich structures has been carried out by Chai [67]. Experimental
analytical and numerical results for mainly for sandwich panels with honeycomb core have
been summarized.
Sandwich panels with tetragonal truss core have been examined numerically by Xue [68] to
assess the blast load response. Comparing circular solid metal plate and sandwich equivalent
made of the same material, has been found that sandwich structure can provide similar
performance at significantly lower weight. Similar results have also been found in a later study
analysing square honeycomb and folded core [69].

42
There are relatively few researchers concerning impact response of wood based sandwich
panels. Zike [70, 71] performed low-velocity impact tests on birch plywood bonded with PP
film and glass fibre net reinforcement in the middle layer. Results show that additional
reinforcement do not increase flexural properties, however significantly increase energy needed
to penetrate specimen. Numerous sandwich panels with balsa core usually received attention in
low-velocity impact papers. It has been noted in that balsa wood has remarkable mechanical
properties comparative to PVC foam [72, 73]
Impact behaviour of spruce wood has been investigated by Zhong et. al [74]. It was
experimentally found that axial, radial and tangential directions show different energy
absorption abilities. To increase low-velocity impact resistance wood grain should be oriented
in axial direction. Radial and tangential directions perform better at a high-velocity impact.
Haldar and Bruck [75] evaluated impact properties in the radial direction of Palmetto wood.
Main property improving impact behaviour of the specimens is a concentration of macrofibers
— largest ratio of macrofibers is located on the outer side of the trunk.
1.12 Review of some commercially available wood based sandwich panels
Foam core panels with wood surfaces (in Figure 1.8) are designed for the use in roof and
floor structures with the trademark of ISOSANDWICH-TOP [76]. Wood board surfaces
provide good mechanical bending stiffness along fibre direction and foam core without
stiffeners allow to reach low thermal conductivity values (<0.035 W / mK). In addition, solid
foam core makes straightforward manufacturing process of gluing surfaces with the core.
Figure 1.8. Sandwich panels with foam core [76].
Sandwich with particleboard surface and cardboard honeycomb core can be produced using
a flat HDF surface and cardboard honeycomb core. This arrangement provides density lower
than 100 kg/m3. The increased panel thickness (> 50 mm) creates the illusion of solid
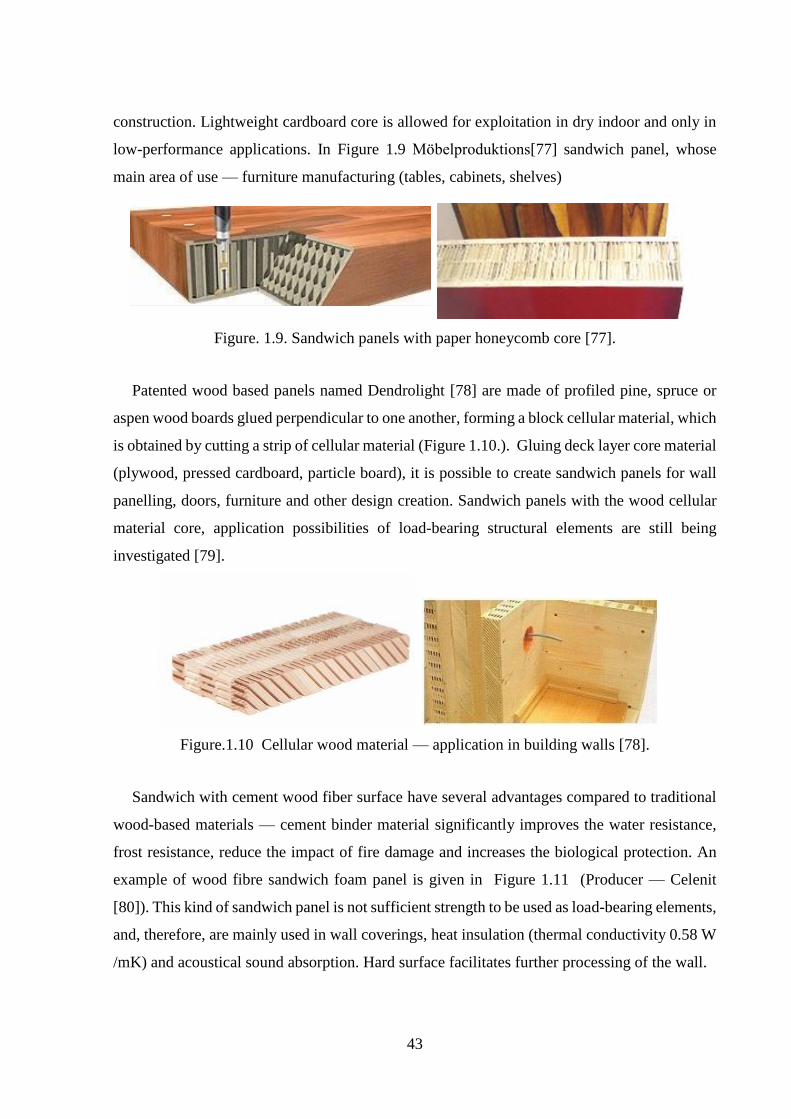
43
construction. Lightweight cardboard core is allowed for exploitation in dry indoor and only in
low-performance applications. In Figure 1.9 Möbelproduktions[77] sandwich panel, whose
main area of use — furniture manufacturing (tables, cabinets, shelves)
Figure. 1.9. Sandwich panels with paper honeycomb core [77].
Patented wood based panels named Dendrolight [78] are made of profiled pine, spruce or
aspen wood boards glued perpendicular to one another, forming a block cellular material, which
is obtained by cutting a strip of cellular material (Figure 1.10.). Gluing deck layer core material
(plywood, pressed cardboard, particle board), it is possible to create sandwich panels for wall
panelling, doors, furniture and other design creation. Sandwich panels with the wood cellular
material core, application possibilities of load-bearing structural elements are still being
investigated [79].
Figure.1.10 Cellular wood material — application in building walls [78].
Sandwich with cement wood fiber surface have several advantages compared to traditional
wood-based materials — cement binder material significantly improves the water resistance,
frost resistance, reduce the impact of fire damage and increases the biological protection. An
example of wood fibre sandwich foam panel is given in Figure 1.11 (Producer — Celenit
[80]). This kind of sandwich panel is not sufficient strength to be used as load-bearing elements,
and, therefore, are mainly used in wall coverings, heat insulation (thermal conductivity 0.58 W
/mK) and acoustical sound absorption. Hard surface facilitates further processing of the wall.

44
Figure. 1.11 Sandwich with cement wood fibre surface [80].
Solid wood in sandwich core ensures not only ensure shear force resistance but also
significantly increases the overall stiffness of the panel. Modulus of elasticity for sandwich
panels with solid wood core and plywood surfaces range from 5 to 8 GPa. Wood core also
allows efficiently utilizing small pieces of wood and also improving structural stability in
elevated moisture. To reduce the weight of the panel — balsa wood core is also used in several
investigations. Door panel by German company Moralt [81] is shown in Figure 1.12
Application fields — doors, furniture, partition walls.
Figure 1.12 Sandwich panels with solid wood core [81].
The main feature of Sing core [82] sandwich panels is a grid of thin-walled plywood
stiffeners with foam filler between as in Figure 1.13 Foams provide sufficient support to prevent
stiffener buckling and at the same maintaining low density and thermal conductivity. Stated
core compression strength is 4.5 MPa. Mechanical properties of assembled sandwich panel
mainly depend on surface material and thicknesses. Both wood based and metallic faces are

45
available. Main application areas — movable structures like sliding doors and exhibition
booths.
Figure. 1.13 Core structure of plywood Sing core panels [82].
Kerto-Ripa® roof and floor solutions (Figure 1.14) are suited for a long span, up to 18m,
roof structures. Vertical stiffeners are made of laminated veneer lumber (LVL) and plywood
surfaces with custom layer orientation (trademark Kerto®). Made of Kerto they can be of both
open and closed construction and insulated to the client´s exact requirements. [83] The product
is CE Marked has European Technical Approval ETA-07/0029 [84].
Figure. 1.14 large span insulated roof panel [83].
1.13 Research of novel core types for wood based panels
Experimental and numerical analysis of 3D corrugated structures made of short wood fibre
planar material have performed by Hunt [85]. The motivation behind this study was efficient
consumption of low-value (by-product) wood material like branches, treetops and bushes.
Mechanical characteristics for conducted research determining stiffness (average 6.1GPa) and

46
strength (average 44 MPa) which has been acquired by coupon tests according to ASTM D1037
[86]. Applying these isotropic mechanical properties in linear ANSYS model stiffness
behaviour of large-scale panel were predicted.
Work of Kawasaki et al. [87, 88] describes the development of low-density wood fibreboard
material (density of 40-50 kg/m3). Optimisation of sandwich panels with this core type is
studied in the last paper [89]. Lowest mass panel with sufficient load bearing and heat insulation
capacity for application as facade panels has been an object of optimisation. Most suitable
combination for this purpose is a plywood-faced sandwich panel with 95 mm thickness and the
average density of 450 kg/m3 providing stiffness of 5.5 GPa.
A similar study on facade panels has been conducted by Fernandez-Cabo et. al. [90]
evaluating panel’s wit low-density wood fibre core and wood based panels as shown in Figure
1.15.
Figure 1.15. Facade sandwich panel in 6-point bending [90].
The results of flexural tests show that wood fibre core with a density of 150-190 kg/m3 is a
viable solution for panels with the 3m span length to carry self-weight, wind pressure and
provide sufficient creep resistance.
Taking into account remarkable structural properties of lattice core sandwich panels made
of metals [91] or carbon fibres [92], attempt to reproduce similar structure from birch dowels
(shown in Figure 1.16) has been done by Jin [93]. Preliminary study shows that average
stiffness in static bending is 5.33 GPa. Taking into account the low density of wood
components, specific density of the panel reach the level of carbon fibre lattice core.

47
Figure 1.16. 2D lattice core sandwich-beam [93].
A work of Srinivasan et. al [94] and Banerjee and Bhattacharyya [95] investigates design
and optimisation of lightweight sandwich panels with 3-layer plywood faces and skins as shown
in Figure 1.1. A novel method for continuous manufacturing of profiled core sheets has been
proposed as well. Strength-based parametrical optimization with 4 geometrical variables has
been conducted to found minimal mass configuration for bending applications.
Figure 1.17. Veneer hollow core panel [95].
Negro et al. [96] proposed similar structure made of okoume (Aucoumea klainean) wood for
applications in boatbuilding industry. Characterization of mechanical and physical properties
shows that bending stiffness for a sandwich panel with 23 mm thickness is 2.86 GPa, flexural
strength 17.89 MPa. Mean density of the panel is 205 kg/m3. Hollow core pattern allows
maintaining remarkable stiffness and strength in transverse direction — around 70 % of the
magnitude in the longitudinal direction. Measuring sound absorption coefficient it has been
found that highest value of 0.4 could be achieved in the range 800 and 1000 Hz.
A Modified version of hollow core sandwich panels with combined curved and straight
vertical stiffeners have been investigated by Sliseris and Rocens [9, 98] Mechanical properties
of 3-layer birch (Betula pendula) plywood serve as input data for numerical analysis. Design
case of trailer floor structure has been employed to demonstrate advantages of positioning

48
stiffeners in several directions thus forming variable stiffness flooring. A three-phase
optimisation method based on the artificial neural network is proposed as effecttive means to
minimize the mass of this structure.
Large scale sandwich structures with keel-web-elements (in Figure 1.18) have been
developed in University of Stuttgart [99]. Stiffeners made of plywood or OSB are being glued
between wood boards which forms surfaces and provide bending stiffness. The main advantage
of these panels is automatized manufacturing process and ability to make large-span load
bearing structures up to 34 m. Besides prototyping, design guidelines have been drawn and
panels tested in several public buildings.
Figure 1.18. Sandwich panel with keel-web elements [99].
Research on birch (Betula pendula) plywood sandwich panels with vertical stiffeners and
the corrugated core has been made by Zudrags [100] in his PhD thesis “Plywood panels with
improved specific strength”. Technological processes for manufacturing of large scale
corrugated cores have been proposed along with characterization of mechanical properties for
panels with a thickness not exceeding 30 mm. Main results suggest that most robust
combination would be 9 mm plywood surfaces with vertical stiffeners oriented at 45 deg angle
to the longitudinal direction. The specific strength of the panel with 28 mm thickness in this
case would be 20 % higher than solid reference panel. Kalnins et. al. [101] applied parametrical
optimization employing metamodels to minimize the mass and increase stiffness for this type
of sandwich panels.
1.14 Optimization — general
Usually term ‘optimisation’ refers to process of finding the best solution (in the domain of
system variables) which satisfies designer requirements for product qualities (strength,
stiffness, weight). In mathematical sense it could be explained as searching for a global extreme
of defined function.

49
Optimization is closely related with design of experiments which denotes how many
experimental trials will be, in which order variables will be combined and also the sequence of
executing. Designs of computer experiments involve defining the response parameters, design
variables and boundaries of each variable and also observing system behaviour during
experimenting process. The goal of analysis of experiment results is to evaluate significance of
each design parameter. What is more important is to perform regression analysis in order to
create mathematical parametrical/non-parametrical function applicable for optimization of
desired response. The typical way of creating system mathematical model is approximation of
experimental results by polynomial functions, kriging, radial basis functions or locally weighted
regression methods. General methodology of enginnering optimization is given in numerous
sources, for example [102].
1.15 Pareto optimality
In case of several responses like maximum stiffness and minimal weight — different
approach of assessing the most suitable design is necessary. One of the most reliable methods
of evaluating optimal design in case of several responses is Pareto optimality front.
A Pareto optimality our optimization method (also known as a Multi-objective optimization)
problem is an optimization problem that involves multiple objective functions [Ehrgott,
2005[103]; Hwang & Masud,1979 [104]; Miettinen, 1999 [105]].
In mathematical terms, a multi-objective optimization problem is expressed by equations (1)
and (2)
min𝐅(𝐱) = [𝑓1(𝐱), 𝑓2(𝐱), … , 𝑓𝑘(𝐱)] (1)
s.t. 𝐱 ∈ 𝑆
𝐱 = (𝑥1, 𝑥2, … , 𝑥𝑚)𝑇 (2)
where 𝑓1(𝑥), 𝑓2(𝑥), . . . , 𝑓𝑘(𝑥) are the 𝑘 > 1 objective functions, (𝑥1, 𝑥2, … , 𝑥𝑚) are the m
optimization parameters, and S is the solution or parameter space with (implicit) set of
constraints that can be defined as
𝑆 = {𝑥 ∈ 𝑅𝑚|𝐡(𝑥) = 0, 𝐠(𝑥) ≥ 0}, (3)
where h is a vector of equality constraints and g is a vector of inequality constraints.
Obtainable objective vectors, {𝐅(𝐱)|𝑥 ∈ 𝑆}, are denoted by Y, so S is mapped by F onto Y.
𝑌 ∈ 𝑅𝑘 is usually referred to as the attribute or criteria space, where 𝜕Y is the boundary of Y.

50
For a general design problem, F is non-linear and multi-modal, and S might be defined by non-
linear constraints and may contain both continuous and discrete member variables.
𝑓1∗, 𝑓2
∗, . . . , 𝑓𝑘∗ will be used to denote the individual minima of each objective function
respectively. The utopian solution is defined as 𝐅∗ = [𝑓1∗, 𝑓2
∗, . . . , 𝑓𝑘∗]. As 𝐅∗ minimizes all
objectives simultaneously, it is an ideal solution, however it is rarely feasible.
In this formulation, minimization F(x), lacks clear meaning as the set {F(x)} for all feasible
x lacks a natural ordering, whenever F(x) is vector-valued. In order to determine whether F(x1)
is better than F(x2), and thereby order the set {F(x)}, the subjective judgment from a decision-
maker is needed.
Here the notion of Pareto optimality has to be introduced. Essentially, a vector 𝒙∗ ∈ 𝑆 is said
to be Pareto optimal for a multi-objective problem if all other vectors 𝑥 ∈ 𝑆 have a higher value
for at least one of the objective functions 𝑓𝑖, with 𝑖 ∈ {1,2, . . . , 𝑘}, or have the same value for all
the objective functions.
More formally speaking, we need to introduce a domination property. A necessary property
of any candidate solution to the multi-objective problem is that the solution is not dominated.
Considering a minimization problem and two solution vectors 𝐱1, 𝐱2 ∈ 𝑆. 𝐱1 is said to (Pareto)
dominate 𝐱2 if:
1. 𝑓𝑖(𝐱1) ≤ 𝑓𝑖(𝐱2) for all indices 𝑖 ∈ {1,2, . . . , 𝑘} and
2. 𝑓𝑖(𝐱1) < 𝑓𝑖(𝐱2) for at least one index 𝑖 ∈ {1,2, . . . , 𝑘}.
The Pareto subset of 𝜕Y contains all non-dominated solutions. The space in Rk formed by
the objective vectors of Pareto optimal solutions is known as the Pareto optimal front, Ƥ.
If the final solution is selected from the set of Pareto optimal solutions, there would not exist
any solutions that are better in all attributes. It is clear that any final design solution should
preferably be a member of the Pareto optimal set. If the solution is not in the Pareto optimal set,
it could be improved without degeneration in any of the objectives, and thus it is not a rational
choice. This is true as long as the selection is done based on the objectives only. Pareto optimal
solutions are also known as non-dominated or efficient solutions. Figure 1.19 provides a
visualization of the presented nomenclature.
The attribute space, Y, looks the same regardless of how the objectives are aggregated to an
overall objective function. Depending on how the overall objective function is formulated, the
optimization will result in different points on the Pareto front.
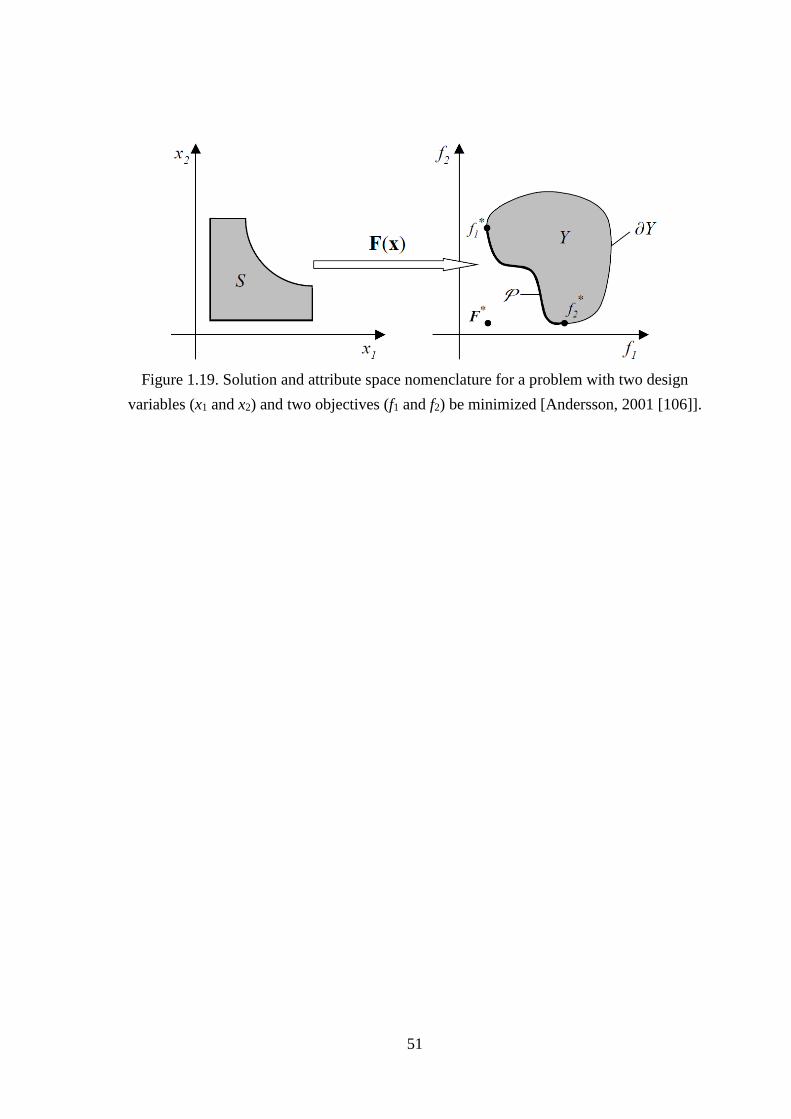
51
Figure 1.19. Solution and attribute space nomenclature for a problem with two design
variables (x1 and x2) and two objectives (f1 and f2) be minimized [Andersson, 2001 [106]].

52
II Properties on component level
2.1 Overview
In order to apply finite element method (FEM) commercial codes like ANSYS [107] or
ABAQUS [108] actual properties of the material should be provided as an input data. Common
industrial practice for this purpose is standardised tests on small-scale specimens also called
coupon tests. This kind of simplified experimental investigation occupies lower rank of the test
program hierarchy shown in Figure 2.1.
Figure 2.1. Hierarchy of the experimental tests.
Coupon test approach is generally accepted practice for industrial tasks to automate the
design process and to simulate the complex behaviour of products under various load
conditions. Extracting of mechanical and thermal properties for single plywood layer (veneer),
polyurethane foam and glass fibre composite are described in following chapters. Acquired test
mean lower/higher values will be used as an input data for numerical models of plywood based
sandwich panels in ANSYS finite element software.
Mechanical properties of wood are widely reported in sources like [1, 109] however
properties of a single plywood veneer are not widely studied and reported. Comparing to a
lumber specimens thin plywood veneer is subjected due manufacturing to the thermal treatment,
pressure and impregnation of adhesives, significantly modifying their mechanical properties.
Influence of each individual manufacturer practice also should be considered. Similar research
on pine veneer properties has been done by [110] and beech veneer by [111]. The mechanical

53
properties obtained from unidirectional veneer specimen tests has been incorporated and
validated in multilayer bone shaped plywood specimen numerical and experimental tests.
Mechanical properties of thermoplastic composite made of Twintex® glass
fibre/polypropylene fabric [113] have been elaborated to take into account consolidation
environment in the oven under vacuum pressure. Evidently for a single layer modulus of
elasticity is more affected by microcracks appearing after peeling process and hot pressing, thus
obtained material properties has a larger scatter and are less robust to be used in numerical
simulations.
2.2 Veneer specimens
To determine veneer mechanical properties, more than 250 test specimens have been
produced at the Lignums factory (JSC “Latvijas Finieris”) according to existing plywood
manufacturing practice. The specimen production process has been initiated with the
preparation of the test plates and the clamping plates. In total of four full scale (600 x 900 mm)
plywood plates had been produced to cover the full range of the test requirements. Specimen
production was realized in the same way as plywood manufacturing process, initiated with glue
covering and then cold preloading following the compression in the hot press at 1400C degree
temperature. The first plate was made out from dried single veneer sheet, with an average
thickness of t1 = 1.55 mm. The second plate was made from single veneer sheet compressed in
the hot press with an average thickness of t1 = 1.46 mm. The third plate produced from two
veneers and glued together using the hot press, thus average thickness t1 = 2.7 mm. The same
process has been used to produce the last — three-layer plate with an average thickness of
t1 = 4.03 mm. Before the final plate assembly, additional end tabs have been added at the ends
of these specimens to secure fastening zone protection against the local stresses. Tabs have been
produced from one veneer ply and attached perpendicularly to the specimen fibre direction. The
specimen geometrical characteristics (Figure 2.2) has been made according to EN 527 [114] for
a composite laminate tension test where the length L = 300 mm, and the width B = 20 mm; 25
mm and 30 mm. In a total of 220 specimens with longitudinal wood fibre orientation and 50
specimens with the perpendicular orientation of fibres have been examined. Influence of the
specimen width has been investigated for specimens with the longitudinal orientation of fibres,
therefore each thickness series has been subdivided into three groups with 20, 25 and 30 mm
widths.

54
L
Btt
L L L
2
2
2 21
Figure 2.2. Geometry of veneer specimen.
Some manufacturing difficulties have been reported, in particular once one side was
assembled with the end tab plates and compressed, significant bending deformations occurred
due unbalances stack sequence. The base plate has been straightened by addition thick plywood
plates on it before attaching end tabs from another side. Consequently, the positioning bias
between both tabs has been detected and reported in some specimens.
2.2.1 Experimental set-up
Universal testing equipment INSTRON 8802 (see. Fig. 2.3) and INSTRON 8872 (for
specimens with perpendicular fibres direction) has been employed to measure specimen
strength and strains.
Figure 2.3. Specimen tension test on INSTRON 8802.
The distance between the clamping/grips L2 has been assumed to be constant 100 mm and
all tests were realised with loading speed of 1 mm/min until ultimate failure. Strains were

55
recorded applying INSTRON 2620 series dynamic extensometer. Dimensions of the specimens
have been adjusted for each test sample.
2.2.2 Observed strain measurement difficulties
Initially mechanical tests of the veneers have been planned on ZWICK Z100 equipped with
laser extensometer BTC-EXOWMST.H01 however testing inconsistencies reviled by
performing first test trials. In particular, the lack of robustness for laser extensometer when
plywood specimens are being tested. The wood microheterogeneous structure cause trapping
of the laser measurement once the fibres start to open and unparallel cracks propagate along the
specimen. As sketched in Figure 2.5. once micro crack separate the laser measuring zone; the
laser probe cannot be used for measurement as the same measurement are have bidirectional
movement. Therefore, results cannot be retrieved from such specimen tests. (Figure 2.4). An
alternative engineering solution would be to attach the paper labels which would cover the local
micro crack propagation and global deflection could be measured.
Figure 2.4. ZWICK Z100 laser extensometer measuring the plywood specimen.

56
P P
Figure. 2.5. a) Laser extensometer measuring zones (red dots) and tension behaviour of wood
micro-cracks under tension load; b) Spacemen failure mode cases misleading the laser
extensometer measurements.
2.2.3 Results for veneer specimens
By performing specimen’s tension tests modulus of elasticity and breaking tensile stress and
also maximal and minimal values of these properties has been estimated. For specimens with
wood fibre orientation parallel to the specimen longitudinal direction, values of elasticity’s
modulus are summarised in Table 2.1. Average value of modulus of elasticity is 14.81 GPa. For
specimens with fibre orientation perpendicular longitudinal direction, average modulus of
elasticity is 0.5GPa. Highest modulus of elasticity are calculated for 1-ply specimen
impregnated with glue and produced under the pressure. By increasing the thickness of the
specimen, the modulus of elasticity decreases until average value of 13.26 GPa. It could be
explained by wood defects appearing in thicker specimen’s cross-section. Similar tendency to
decrease modulus of elasticity affect the width increment of specimens from 20 mm to 30 mm.
Most robust results from all specimens are specimens made from 2 unidirectional veneers —
difference between modulus of elasticity for specimens with 20 mm and 30 mm width vary
only up to 3.5 %. For other specimens results difference between specimens with various width
from 5-15 %.

57
Table 2.1 Modulus of elasticity for specimens with a parallel orientation of fibres [GPa].
Type of
specimen
Specimen width, mm
20 25 30
Laminated
Avg. 16.96
Max —
Min
max.17.51
min.16.49
1 ply
compressed
15.97 15.66 14.54
max.17.06
min.14.58
max.17.53
min.14.77
max.14.86
min.14.32
1 ply
15.19 14.61 13.99
max.16.32
min.13.68
max.15.10
min.14.04
max.14.96
min.12.21
2 ply
14.36 14.22 13.95
max.15.60
min.13.17
max.14.63
min.13.86
max.14.37
min.13.73
3 ply
13.26 13.39 11.99
max.13.21
min.12.45
max.13.55
min.13.18
max.12.22
min.11.65
Obtained average ultimate tensile stress for veneer specimens with fibres orientation parallel
to the specimen longitudinal direction is 125 MPa (maximal value 149 MPa, minimum 104
MPa). Breaking stress has a tendency to increase with specimen width, the difference between
specimens with 20 mm and 30 mm thickness is about 10 %.
2.2.4 Validation of veneer mechanical properties
In order to validate the mechanical properties of veneer samples, acquired values have been
inserted as input data in simplified finite element model of dog-bone shaped plywood tensile
specimen. Afterwards, the same specimens were experimentally tested on INSTRON 8802
machine and strain distribution has been compared with a numerical model.
The bone shaped specimen has been modelled applying ANSYS 4-node shell element
SHELL 181. It was assumed that each ply has a thickness of 1.35 mm in 7-layer plywood
specimens with extended grip area as shown in Figure 2.6. Plywood stacking sequence has been

58
modelled assuming that each layer is perpendicular to the upper and lower one, as plywood
consists of an odd number of plies.
Figure. 2.6. Plywood specimen`s FEM model.
The same testing procedure was realised on 7-ply plywood tension specimens (12 specimens
with longitudinal outer fibres and 16 with perpendicular outer fibres). The NF B 51-123 [7] test
setup is shown in Figure 2.7 together with the clip-on extensometer.
Figure. 2.7. Plywood specimen tension test on INSTRON 8802 and dimensions of the
specimen.
Average values of acquired modulus of elasticity for plywood specimens are as follows: for
specimens with outer fibers direction longitudinal mean 9.75 GPa (maximal value 11.39 GPa,
minimum 8.07 GPa), for specimens with outer fibre direction perpendicular to specimen length
average value of elasticity’s modulus 8.14 GPa (maximal value 10.20 GPa, minimum 5.52 GPa)

59
Average ultimate tensile stress for plywood specimens with fibres orientation parallel to the
specimen longitudinal direction is 72 MPa, for specimens with perpendicular fibre orientation
3.8 MPa.
In order to assess the robustness of the numerical and physical tests the load/strain field plots
have been drawn as shown in Figure 2.8. The field describes the min. and max. bounds between
the experimental and numerical results and an overlapping are outlined the concurrence
between them. It may be observed a slight underestimation by FEM analysis once similar
min/max values are exploited.
Figure. 2.8. Load and strain curves for plywood specimens with longitudinal and
perpendicular orientation of the outer wood fibres.
Effective modulus of elasticity Eef using numerical calculation could be determined
analytically by using equation (2.1).
n
i
i
i
ef EA
AE
1
(2.1)
iA — cross-section area for each layer
A — cross-section area of plywood structure
iE — modulus of elasticity for individual layer
It has been assumed that all plies have similar thickness and modulus of elasticity for
longitudinal wood fibre orientation — 16 GPa and for perpendicular to fibre orientation — 0.5
GPa. Acquired effective modulus of elasticity for plywood specimens with the longitudinal
orientation of outer fibres — 9.36 GPa, for specimens with the perpendicular orientation of
outer fibres — 7.14 GPa. It should be noted that there is no discrepancy of results because area
relation of perpendicular and parallel plies remains constant. In addition, average values of
max
min
max
min

60
analytically acquired values have been compared with numerically and experimentally acquired
results are shown in Figure 2.9.
Figure. 2.9. Comparisons of modulus of elasticity.
As illustrated in Figure 3.9 results for specimens with longitudinal orientation (0) of outer
wood fibres has low variations resulting in 4 % discrepancy. Meanwhile, specimens with
perpendicular orientation (90) of outer wood fibres have a significant difference between
experimental and numerical values of modulus of elasticity resulting in 12 % discrepancy. This
could be explained by wide dispersion of experimental results once specimens with
perpendicular stacking sequence are tested.
2.3 Mechanical properties of thermoplastic GF/PP composite
In order to obtain mechanical properties of GF/PP composite material made of
commercially available glass fibre/polypropylene fabric with the trademark of Twintex®. The
weight fraction of the glass fibres inside fabric is 60 % [113]. Tensile specimens with reinforced
end tabs have been prepared according to EN 527-4 [114]. Clip-on extensometer has been
attached for strain measurements as shown in Figure 2.10.
0
1
23
4
5
6
7
89
10
11
90 0
E [
GP
a]
Experimental ANSYS Analytical

61
Figure 2.10. Tension test set-up of thermoplastic composite samples.
In addition to non-contact digital image correlation system IMTERUM has been applied for
vertical and horizontal strain measurements to obtain Poisson`s ratio. Specimens with a
different number of Twintex layers has been tested and summarized in Table 2.2. At least five
specimens with average width of 25 mm have been tested for each thickness step. Taking into
account balanced structure of the fabric mechanical properties in transverse direction has been
assumed as similar.
Table 2.2 Summary of tested thermoplastic composite specimens
Specimen
label
Number
of
Twintex
layers
Average
specimen
thickness, mm
Average
specimen
width,
mm
Average
modulus of
elasticity,
GPa
Average
strength, MPa
Twintex 2 1.4 24.51 18.73 330.17
Twintex 3 2.06 24.53 18.57 269.61
Twintex 4 2.35 24.9 18.87 319.38
2.4 Thermal properties of sandwich components
In addition series of tests have been made for a polyurethane (PU) foam core specimens to
determine the relation between foam density and thermal conductivity of this material.
Apparatus based on Guarded Hot Plate Method [115] (Linseis HFM 300) have been applied for

62
this purpose (in Figure 2.11). Following results are acquired in cooperation with Latvian State
Institute of Wood Chemistry.
Figure 2.11. Linseis HFM 300 test set-up.
Flat specimens are positioned between two plates with different temperatures — heating and
cooling plate. Thermal conductivity λ (2.2) is calculated at steady state of temperature when
heat flow is constant value and temperature differences and specimen dimensions are known
[116].
𝜆 = 𝑞∙𝑡
𝐴∙∆𝑇 (2.2)
Thermal conductivity values of PU foam at various densities are represented in Figure 2.12.
A linear relationship has been obtained between thermal conductivity and density of the PU
foam.
The same technique has been applied to determine the thermal conductivity of the plywood.
Results are displayed in Figure 2.13 where values of plywood thermal conductivity are in the
range of 110-135 mW/(mK). Measuring several plywood plates stacked together causing
thermal conductivity to increase. An average value of 125 mW/(mK) is close to reference
values in literature [117]. Chipboard plates are added for reference.

63
Figure 2.12. Density/thermal conductivity ratio.
Figure 2.13 Thermal conductivity for plywood and chipboard specimens.
2.5 Adhesive tests of GF/PP composite and plywood
Before prototyping of new sandwich structures with corrugated GF/PP core preliminary
adhesive tests have been performed as shown in Figure 2.14. Thermoplastic composite made
of Twintex® fabric has been consolidated between two pieces of plywood with an edge length
of 50 mm and thickness 6.5 mm. Plywood/composite pieces have been consolidated by vacuum
pressure in oven environment. Specimens were pre-heated until the temperature in the middle
layer reached 1800 C and then held for 15 minutes before cooling down. The out-of-plane tensile
force with a constant velocity of 1 mm per minute was applied until failure of the specimen.
Zwick Z100 test equipment was employed for this purpose. Test set-up is based on EN 319
y = 0,0975x + 14,163
0
10
20
30
40
50
60
70
80
0 100 200 300 400 500 600 700
The
rmal
co
nd
uct
ivit
y, m
W/m
K
Density, kg/m3
Thermal Conductivity
Linear (Thermal Conductivity)
0
20
40
60
80
100
120
140
160
The
rmal
con
du
ctiv
ity,
mW
/mK

64
Particleboards and fiberboards — Determination of tensile strength perpendicular to the plane
of the board [118].
Figure 2.14. Adhesive tensile strength tests according to EN 319.
Several test series including specimens with one and two Twintex layers and a reference
specimens have been tested. Each series consist of five test specimens. It was found that
plywood with the paper-formaldehyde film on the upper surface does not provide bond with
polypropylene matrix. These specimens disassembles before mechanical test procedure.
Untreated reference plywood performs significantly better — fracture occurs in plywood
veneers as shown in Figure 2.15. None of the specimens displayed fracture on plywood —
composite interface indicating that composite made of Twintex® fabric has a good adhesion to
plywood.
Figure 2.15. Samples after the EN 319 tests.
Overall view of the test results is shown in Figure 2.16. Reference plywood specimens have
an average out-of-plane tensile strength of 2.5 MPa. Samples consolidated with a single layer
of the thermoplastic composite have higher average tensile strength than samples with 2 layers.
The increased thickness of GF/PP layer also causes higher scatter of experimental results. In
general thermal treatment of the plywood at high temperature causes reduction of mechanical
Twintex layer
T-shaped steel profile
5-veneer plywood
Load direction

65
properties of the wood structure. Similar funding has also been confirmed by other scientists
[119]. Large standard deviation of tensile strength for specimens with two Twintex® layers also
could be caused by the non-uniform thickness of thermoplastic composite after consolidation.
Therefore, specimen might be loaded unevenly.
Figure 2.16. Out-of-plane tensile strength for specimens bonded with Thermoplastic
composite layer
Acquired results show that sufficient plywood/GF/PP adhesion could be reached in thermal
consolidation process even without special plywood surface treatment. Based on the results of
this research stage design and prototyping of the large scale sandwich panels are feasible.
0 0,5 1 1,5 2 2,5 3
1 layer
2layers
Tensile stress, MPa
Plywood out-of-plane
tensile strength [6]

66
III Improving of mechanical performance for wood based sandwich
panels
3.1 Plywood sandwich panels with I-type and V-type core
Initial trials on numerical modelling, optimisation of the cross section parameters
prototyping and validation by physical tests have been made for sandwich panels with plywood
skins and vertical plywood stiffeners. Regarding straight forward core structure it relatively
easy to prototype and also numerically simulate this type of structures.
The plywood sandwich panels investigated in current paper consists of all plywood skins and
modified core — made out of corrugated plywood plate or plywood I — stiffeners. A wood
structure allows both manufacturing simplicity and recyclability at the end of panel’s life cycle.
Moreover I — stiffened core structure offers broad possibilities for improved topology design
tailored to meet necessary loading requirements.
The main emphasis in current research has been devoted to experimental validation of
numerical FE model of sandwich panels with the corrugated and rib-stiffened core as well as
optimization of cross-section topology for these boards. The goals are to improve the initial
design of sandwich panel prototypes and develop a general methodology (based on Pareto
Optimality) for assessing the optimum configurations of design variables.
3.2 Numerical modelling
The optimization conducted in the present research is based on an approximation of
mechanical response values acquired from numerically from ANSYS computer code.
Geometrical tolerance and virtual loading conditions are kept as close as possible to the original
test environment at the same time making assumptions for model suitability for numerical
analysis. For this reason, curved sandwich panel core — has been simplified to straight
elements. It significantly reduces calculation time without noticeable changes in global
behaviour on the output results. Skins and core walls are made of layered material taking into
account orientation of each layer.
Mechanical properties of single veneer largely differ from large scale wood specimens,
therefore mechanical properties of the veneer are taken from separate study in Chapter 2. More
explicit description of the same work could be found in the following paper [120]. The layer
thickness is set to 1.3 mm. Outer plies of produced plywood have thickness reduction of nearly
30 % from surface grinding procedure during the manufacturing process. An FE mesh for I-core

67
and V-core sandwich panel is shown in Figure 3.1, where equivalent mesh step of 10 mm has
been assigned (Figure 3.1). As an output result of numerical analysis the deflection at the panel
mid-span, strains at various locations on outer skins and the total volume of the structure have
been extracted (Figure 3.2).
Figure 3.1. Finite element mesh of sandwich panels structures.
For comparison, a numerical model of traditional plywood board has been used as a
reference to compare the optimum sandwich designs. The parameter of board thickness changes
accordingly within the range of manufacturing thicknesses (starting from 30 mm with the step
of 5 mm). For each thickness step has been made a set of pre-described layer count and
thicknesses because layer count between thickness steps is not following uniformly. For
example, there are four plies in the range between 25 and 30 mm at the same time there are only
two plies in 30 and 35 mm thicknesses range. This is due manufacturing tolerance once final
product has been ground.

68
Figure 3.2. Deflection (a) and stress plot (b) of sandwich panel with rib-stiffened core.
3.3 Validation of the numerical model
Experimental testing of several prototype configurations of plywood sandwich specimens
has been made in order to verify if numerical models appropriately represent the physical
structure. 4-point bending set-up according to EN789 [121] standard has been set up on
INSTRON 8802 testing equipment (in Figure 3.3). The distance between supports is constant
1000 mm and between loading points 200 mm. Deflection of the panels has been measured
with LVDT deflectometer at the bottom of the panel`s midspan. For sandwich panels with
a)
b)

69
corrugated core also strain gauges have been attached to both panel faces and core. Panels were
tested until deflection of 22 mm without destruction evidence and change in stiffness slope.
Obtained level of deformation is nearly 1/50 of the span length (in civil engineering designs the
limit deflection/span-length ratio usually never exceed 1/200). Moreover such deflection level
is equivalent to 30 % of predicted ultimate stress in wood.
Figure 3.3. Testing of plywood sandwich panels in 4-point bending set up on INSTRON
8802.
Detailed specifications of tested specimens are provided in Table 3.1 and 3.2. Several types
of panels with rib-stiffened core and different cross-section topology has been used to make a
prior estimation of panels stiffness properties. All panels with V-core have similar corrugated
plate geometry, where the only difference is thickness and orientation angles of upper plies. In
tables 3.1 and 3.2 special characters for ply orientation angles were introduced: / fibres direction
parallel to panel longitudinal direction; — fibres direction perpendicular to panel longitudinal
direction.

70
Table 3.1. Geometrical properties of plywood sandwich panels with rib stiffened core P
anel
nom
encl
ature
Pan
el w
idth
, [m
m]
Pan
el t
hic
knes
s,
[mm
]
Pan
el l
ength
, [m
m]
Thic
knes
s of
stif
fener
,[ m
m]
Dis
tance
bet
wee
n
stif
fener
s, [
mm
]
Panel surface thicknesses and
plies layout
Upper
surf
ace,
[m
m]
Low
er
surf
ace,
[m
m]
Upper
surf
ace
Low
er s
urf
ace
Panel 1_1 300 28.5 1100 14.4 17.4 6.5 9.0 -/-/- -/-/-/-
Panel 1_2 300 27.8 1100 14.4 13.0 6.5 9.0 -/-/- -/-/-/-
Panel 1_3 300 28.4 1100 14.4 22.0 9.0 9.0 -/-/-/- -/-/-/-
Panel 1_4 300 28.2 1100 14.5 17.0 9.0 9.0 -/-/-/- -/-/-/-
Panel 1_5 300 28.0 1100 14.4 22.0 9.0 9.0 /-/-/-/ /-/-/-/
In order to compare the experimental and numerical results, experimental load/deflection
and load/strain curves have been associated with numerical results from ANSYS. It is obvious
that sandwich structures show elastic mechanical behaviour within tested deflection range and
linear numerical model describes structure behaviour sufficiently well. For sandwich panels
with the corrugated core, deflection and strain values has been compared with numerical data
in Figure 3.4. Numerical curves fit experimental results adequately for both deflection and
strains. The numerical model is showing little less stiffness than experimental results. Curves
with negative strain values have been obtained from strain gauges attached at the bottom surface
of the panel and positive strains from upper strain gauges. Confirming symmetric strain
distribution in tested structure as shown in Figure 3.4.
Table 3.2. Geometrical properties of plywood sandwich panels with corrugate core
Pan
el n
om
encl
ature
Pan
el w
idth
, [m
m]
Pan
el t
hic
knes
s,
[mm
]
Pan
el l
ength
, [m
m]
Wav
e w
idth
, [m
m]
Wav
e th
ickn
ess,
[mm
]
Wav
e ply
count
Panel surface thicknesses and
plies layout
Upper
surf
ace,
[m
m]
Low
er
surf
ace,
[m
m]
Upper
surf
ace
Low
er
surf
ace
Panel
2_1 330.0 32.3 1200 82.0 5.6 4.0 6.5 6.5 -/-/- -/-/-
Panel
2_2 330.0 31.7 1200 82.0 5.6 4.0 6.5 6.5 -/-/- -/-/-
Panel
2_3 325.0 31.5 1200 82.0 5.6 4.0 6.5 6.5 /-/-/ /-/-/

71
Figure 3.4. Load/strain and deflection curves for sandwich panels with corrugated core.
Overall deflection results for plywood sandwich panels with I-core are shown in Figure 3.5.
One can notice that stiffener thickness and distance variation has an insignificant effect on panel
deflection, comparing with the orientation of upper veneers (in the case of Panel 1_5).
Deflection at midspan, mm
0 5 10 15 20 25
Load
, N
0
1000
2000
3000
4000
5000
6000
7000
Panel 1_1
Panel 1_2
Panel 1_3
Panel 1_4
Panel 1_5
Deflection at midspan, mm
0 5 10 15 20 25
Load
, N
0
1000
2000
3000
4000
5000
6000
7000
Panel 1_1
ANSYS (Panel 1)
Figure 3.5. Load/deflection curves for sandwich panels with rib stiffened core; comparison
deflection of Panel 5 with finite element analysis results (on the right).

72
Validation of numerical model with other types of sandwich panels is described in Table.3.3
The difference between experimental and numerical results does not exceed 10 %. Taking into
account that wood modulus of elasticity may vary due to heterogeneous structure obtained
model accuracy could be considered as sufficient.
Table 3.3 Comparison of experimental and numerically acquired deflection values for panels
with vertical stiffeners.
Nomenclature Load,
KN
Deflection, [mm] Diff.,
% Experimental ANSYS
Panel 1 4.9 20.74 22.15 6.37
Panel 2 5.1 21.23 23.63 10.16
Panel 3 4.8 21.02 21.64 2.87
Panel 4 5.3 21.22 23.51 9.74
Panel 5 5.9 20.89 22.90 8.78
3.4 Optimisation of plywood sandwich panels
Optimizations of plywood itself and it`s sandwich products are not being widely studied and
applied so far. A general concept of analysis and design of sandwich structures is described
initially by Allen [122] and more in detail by Zenkert [37]. More specific requirements for wood
based sandwich panels could be found in Wood Handbook [1]. In contrary, there is a wide range
of research done on design and optimization of various types of metallic sandwich panel cores,
like the design of sandwich panels with corrugated core Valdevit et al. [123], truss cores by
Wicks and Hutchinson [124]. Rathburn et. Al [125] proposed a general methodology for weight
optimization of metallic sandwich panels in bending. Banerjee and Bhattacharyya [95] adopted
this methodology for strength-based optimization for plywood sandwich panels with hollow
veneer cores. Kalnins et. al. [101] performed Finite Element (FE) analysis and stiffness-based
optimization on plywood sandwich panels with I-core and V-core, demonstrating significant
weight savings over conventional plywood boards. However, this numerical analysis has been
experimentally validated only throughout present research.
In industrial applications, in order to reduce the development time involving the high
precision simulations, the metamodels also called surrogate models can be constructed to
replace the original response with the approximation functions [101]. Design optimization
process applying metamodells usually consists of three major steps: 1) design of computer
experiments 2) approximation functions that best describes the behaviour of the problem 3)
employing developed metamodels in optimization task or derivation of the design guidelines.

73
In current research a sequential design based on Means Square error criterion has been
evaluated by in-house EdaOpt software. For common engineering tasks low order global
polynomial approximations (for example 2nd order polynomial) have been widely accepted. As
they do not require a large number of sample points and are computationally effective.
However, they fail to approximate most of the non-linear model behaviours. In such a case a
higher order polynomial could be utilised, but if no special control algorithms are assigned they
tend to overfit the data especially in regions where the sample points are relatively sparse. One
possible remedy for the overfitting problem is the employment of the subset selection
techniques [126]. These are aimed to identify the best (or near best) subset of individual
polynomial terms (basis functions) to include in the model while discarding the unnecessary
ones, in this manner creating a sparse polynomial model of increased predictive performance.
However, the approach of subset selection assumes that the chosen fixed full set of user-
predefined basis functions (usually predefined just by fixing the maximal order of a polynomial)
contains a subset that is sufficient to describe the target relation sufficiently well. Hence, the
effectiveness of subset selection largely depends on whether or not the predefined set of basis
functions contains such a subset.
In [127] an alternative approach is proposed — Adaptive Basis Function Construction
(ABFC). The approach enables automatically generating polynomial regression models of
arbitrary complexity and order without the requirement to predefine any basis functions or the
order — all the required basis functions are constructed adaptively specifically for the data at
hand.
Generally, a linear regression model, approximating a real-valued response variable y, can
be defined as a linear expansion of basis functions:
𝐹(𝑥) = ∑ 𝛽𝑖𝑓𝑖(𝑥)𝑘
𝑖 = 1, (3.1)
where 𝐱 = (𝑥1, 𝑥2, … , 𝑥𝑚)𝑇 is a vector of m input variables, β = (𝛽1, 𝛽2, . . . , 𝛽𝑘)𝑇 are k
parameters of the model, 𝑓𝑖(𝑥), 𝑖 ∈ {1,2, . . . , 𝑘} are the k basis functions in the model which
generally can be defined as a product of input variables each with an individual exponent:
𝑓𝑖(𝑥) = ∏ 𝑥𝑗
𝑟ij
𝑚
𝑗 = 1, (3.2)
where r is a 𝑘 × 𝑚 matrix of non-negative integer exponents such that rij is the exponent of the
jth variable in the ith basis function. Such matrix with specified values for each of its elements
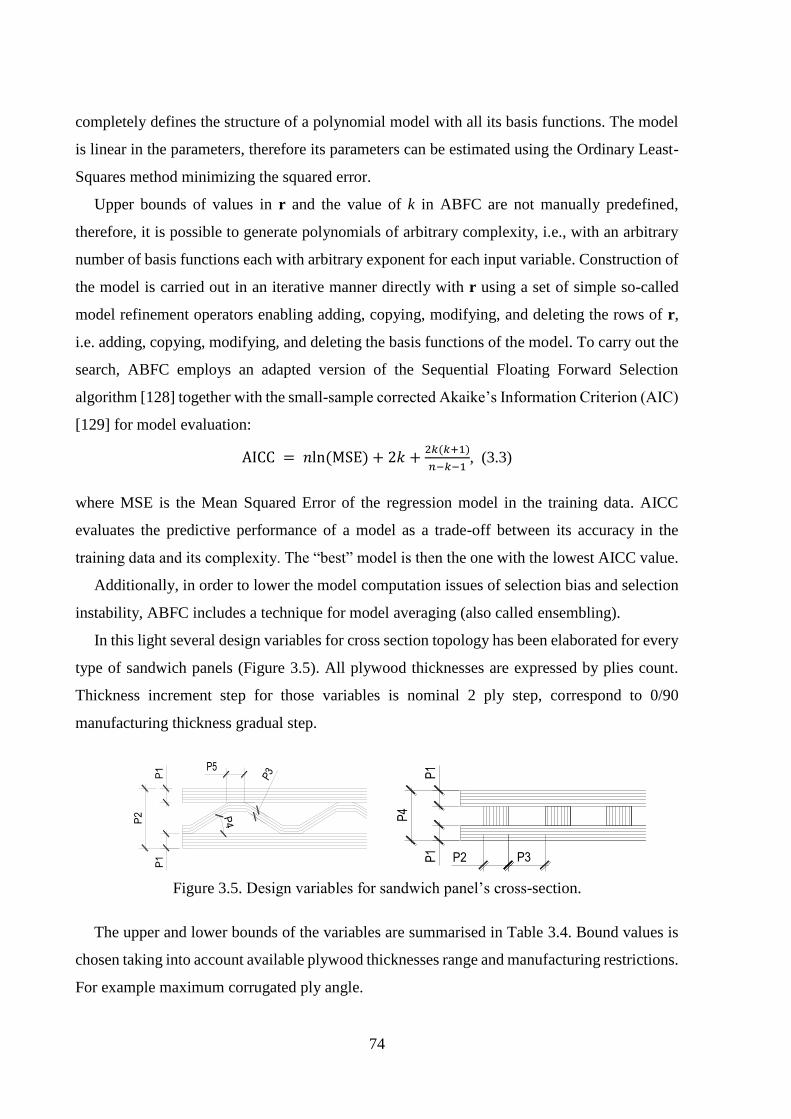
74
completely defines the structure of a polynomial model with all its basis functions. The model
is linear in the parameters, therefore its parameters can be estimated using the Ordinary Least-
Squares method minimizing the squared error.
Upper bounds of values in r and the value of k in ABFC are not manually predefined,
therefore, it is possible to generate polynomials of arbitrary complexity, i.e., with an arbitrary
number of basis functions each with arbitrary exponent for each input variable. Construction of
the model is carried out in an iterative manner directly with r using a set of simple so-called
model refinement operators enabling adding, copying, modifying, and deleting the rows of r,
i.e. adding, copying, modifying, and deleting the basis functions of the model. To carry out the
search, ABFC employs an adapted version of the Sequential Floating Forward Selection
algorithm [128] together with the small-sample corrected Akaike’s Information Criterion (AIC)
[129] for model evaluation:
AICC = 𝑛ln(MSE) + 2𝑘 +2𝑘(𝑘+1)
𝑛−𝑘−1, (3.3)
where MSE is the Mean Squared Error of the regression model in the training data. AICC
evaluates the predictive performance of a model as a trade-off between its accuracy in the
training data and its complexity. The “best” model is then the one with the lowest AICC value.
Additionally, in order to lower the model computation issues of selection bias and selection
instability, ABFC includes a technique for model averaging (also called ensembling).
In this light several design variables for cross section topology has been elaborated for every
type of sandwich panels (Figure 3.5). All plywood thicknesses are expressed by plies count.
Thickness increment step for those variables is nominal 2 ply step, correspond to 0/90
manufacturing thickness gradual step.
The upper and lower bounds of the variables are summarised in Table 3.4. Bound values is
chosen taking into account available plywood thicknesses range and manufacturing restrictions.
For example maximum corrugated ply angle.
P2
P1
P1
P4
P3P5
P4
P1
P1
P2 P3
Figure 3.5. Design variables for sandwich panel’s cross-section.

75
Table 3.4. Design space for deck structure
Parameter Notation
Lower
bound
Upper
bound
Increme
nt step Units
Panel with corrugated core
Number of cover plate plies P1 3 7 2 -
Total section height P2 30 50 5 mm
Number of plies in corrugate
section P3 3 5 1 -
Corrugated ply angle P4 30 60 - deg
Bonding area length P5 10 40 - mm
Panel with rib stiffened core
Number of cover plate plies P1 3 9 2 -
Total section height P2 30 50 5 mm
Stiffener plies count P6 5 23 2 -
Distance between stiffeners P7 10 80 - mm
As initial optimization step was considered the improved cross- section topology for tested
panels with corrugated and rib-stiffened core. The aim of optimization was to minimise the
volume (weight) of the panel. Combinations of cross section topology parameters have been
selected to guarantee deflection not over exceeding those original values obtained from
conventional board designs, As initial design for sandwich panel with corrugated core used
Panel 3 (marked as V-core) and for panels with rib-stiffened core — Panel 5, due to highest
stiffness (marked as I-core). Acronym Optimal Design 1 stands for a combination where design
variables provide the largest volume reduction comparing with initial panel design. However a
tendency may be observed than thinnest surfaces tend to acquire larger volume reduction.
Three-ply plywood outer surfaces are most appropriate for applications in configurations with
sufficiently small load intensity, however for heavy duty load environment thicker surfaces are
required to protect the panel from impact-induced damage, or local pressure as well as improve
screw fixation strength. Therefore obtained the second case of optimal design has been
elaborated with surface thickness restriction at least 5 layers. The second design has volume
reduction of 17 % less than initial design in case of a panel with the corrugated core, and 30 %
less in the case of rib-stiffened panels.

76
Table 3.5. Optimal cross section design for sandwich panels
Panel Characteristics Initial design Optimal Design 1 Optimal Design 2
v-c
ore
Cross-section
parameter values
P1 = 5;
P2 = 0.032;
P3 = 4; P4 = 40;
P5 = 0.01
P1 = 3; P2 = 0.042;
P3 = 3; P4 = 30;
P5 = 0.019
P1 = 5;
P2 = 0.037;
P3 = 3; P4 = 30;
P5 = 0.02
Load, N 6000 6000 6000
Deflection, mm 20.83 20.83 20.83
Volume, m3 0.00628 0.00352 0.00521
Absolute volume, % 100.0 56.0 83.1
I-co
re
Cross-section
parameter values
P1 = 7;
P2 = 0.028;
P6 = 11;
P7 = 0.022;
P1 = 3; P2 = 0.032;
P6 = 5; P7 = 0.08;
P1 = 7; P2 = 0.03;
P6 = 5; P7 = 0.08;
Load, N 5500 5500 5500
Deflection, mm 22.9 22.9 22.3
Volume, m3 0.00746 0.00336 0.00499
Absolute volume, % 100.0 45.0 66.9
Largest volume reduction of 55 % and 30 % has been reached for I-core sandwich panels. It
is mainly associated with not proportional skin thickness in the initial/reference design.
Obtained results approve assumption that optimal way to increase sandwich panel efficiency is
to increase the distance between stiffeners.
3.5 Pareto optimality for sandwich panels
The overall efficiency of plywood sandwich panels has been demonstrated by deriving
Pareto optimality front where maximization of relative stiffness ΔS is done simultaneously by
minimizing the relative volume ΔV of the panel. Relative stiffness is acquired dividing
numerically calculated conventional plywood board deflection with calculated deflection of the
sandwich panel with same length and thickness, under the same loading conditions. Relative
volume is acquired by dividing sandwich panel volume with solid plywood panel volume.
Stiffness of the sandwich panel is close to stiffness of plywood board if ΔS tend to 1. The
relationship is opposite for volume — if ΔV tends to 1 the volume of sandwich panel is close to
solid board volume, thus making sandwich panel weight ineffective.
Relative stiffness and volume values have been calculated within experimental designs from
initial optimization step. There were 150 combinations of variables explored for sandwich
panels with rib-stiffened core and 200 for panels with the corrugated core. Such experimental

77
design allows elaborating approximation functions for preferred responses with RRMSE
(Relative Root Mean Square Error) not exceeding 3 %. However for the accurate elaboration
of Pareto optimality front, the larger sample space up to 500 has been required. Responses were
acquired using regression metamodels instead of numerical analysis with ANSYS.
Results of Pareto optimality are outlined in Figure 3.6. Overall tendency could be observed
that panels with rib-stiffened core (I-core) have better stiffness ratio than panels with the
corrugated core. These results could be utilised in design of sandwich panels with the thickness
close to sandwich panel. From Figure 3.6 one could see that relative volume ratios are
ineffective beyond 0.7 for v-core and 0.8 for i-core panels because the volume of the panel
increases much faster than stiffness. This is mainly related to the low thickness profile of the
sandwich panel. For all points (on Pareto front) in ΔV region from 0.3 to 0.7 corresponding
relative stiffness values are higher by 15-25 %. For example, a sandwich panel which volume
is 50 % of solid plywood board could maintain 75 % of traditional plywood stiffness. At
ΔV = 0.5 this ratio is similar for both types of core topology.
Figure 3.6 Pareto set for sandwich panels with vertical stiffener (i-core) and corrugated core
(v-core).
0,40
0,50
0,60
0,70
0,80
0,90
1,00
0,20 0,30 0,40 0,50 0,60 0,70 0,80 0,90 1,00
Re
lati
ve s
tiff
ne
ss, Δ
S
Relative Volume, ΔV
i-core
v-core
i-core initial
i-core design1
v-core initial
v-core design 2
Desired result

78
Preliminary design I-core sandwich panel served for verification study is marked with a
black square within the set of optimum results. Sandwich panel may reach stiffness close to the
traditional plywood stiffness, however unfortunately, also keeping 90 % of solid section
plywood volume, which makes initial design highly ineffective. The gain of exploring sandwich
panels in matching stiffness region is negligible comparing with surge manufacturing costs.
Improved designs for I-core panels reduce their volume up to 30 % of traditional plywood
volume at the same time keeping about 60 % of plywood stiffness. The same strategy is
applicable also to the panels with the corrugated core, where the relative volume of initial design
is reduced more than twice, however relative stiffness is at the level of 57 %. V-core design
with thin 3-layer surfaces is out of the boundaries in Figure 3.6, because sandwich panel
stiffness comparing with same thickness plywood board is very low. It makes possible to use
this design only in fields with small load intensity- for example in the furniture industry.
3.6 Experimental validation of the stiffness optimisation for plywood sandwich panels
with the rib-stiffened core.
According to the optimised design three types of sandwich panels have been prototyped to
match the stiffness properties of conventional plywood boards. The aim of this task is to
examine robustness of optimisation output. Sandwich components have been made from
commercially available plywood sheets where veneers are bonded with the phenol —
formaldehyde resin. At the same time skins and stiffeners have been joined together applying
other type of resin — polyurethane. After manufacturing process panels were stored at the
ambient temperature of 20o C and relative air humidity of 50 % for two weeks. Geometrical
dimensions of those prototypes are summarised in Table 3.6. and Figure 3.7. It should be noted
that further weight saving could be reached applying even thinner face sheets however other
usability aspects of the sandwich panel like wear resistance or possibilities to use bolted joints
would be limited.
Table 3.6. Geometrical properties of the specimens
Sandwich
panel label
Equivalent
plywood board
thickness,
mm
Sandwich
panel
thickness,
mm
Surface
thickness,
mm
Stiffener
thickness,
mm
Distance
between
stiffeners,
mm
Panel 3 30 37.5 6.5 6.5 53.5
Panel 4 40 50.3 6.5 6.5 53.5
Panel 5 50 63 9 9 51

79
Further in current chapter panels with the stiffness equivalent to 30 mm will be marked as
Panel 1, consequently Panel 2 is devoted for stiffness equivalent for 40mm and Panel 3 for 50
mm thick conventional plywood boards.
All sandwich and reference plywood boards have been tested in 4-point bending set-up
according to the EN789 [121] standard on INSTRON 8802 the universal testing equipment
(Figure 4). The distance between the supports has been set to 1000 mm and 200 mm between
the loading points. During the test deflections have been measured with LVDT at the panel
midspan and panels have been tested up to deflection ratio of 1/200 which is treated as a
serviceability design limit in structural engineering legislation for timber structures Eurocode
5 (2004).
Figure 3.7 Prototyped sandwich panels in comparison with conventional plywood boards.
Ideal scenario is matching load deflection curves for the sandwich panels, reference plywood
boards. Results of numerically acquired load/deflection curve are the same for sandwich panels
and nominal thickness plywood reference. The case of sandwich panel stiffness exceeding
plywood reference is also acceptable however it indicates that it is not the most efficient
sandwich panel design.
In all Figures 3.8- 3.10 hollow core panels demonstrated higher structural stiffness compared
with conventional plywood boards at the same time reducing self-weight at least by 45 %
comparing with traditional plywood.
Largest divergence in absolute deflection values between the sandwich panel and
conventional plywood board’s has been observed for 30 mm equivalent design and shown in
Figure 3.8. More than 40 % discrepancy between the average deflection at 4 kN load limit is
caused mainly by thickness variation in commercially available conventional plywood boards,
where the actual thickness was more by one millimetre thinner than the average given by a
plywood producer and implemented in the numerical model by ANSYS.

80
Deflection at midspan , mm
0 2 4 6 8 10 12 14 16 18 20
Lo
ad
, N
0
1000
2000
3000
4000
5000
6000
Panel 3_1
Panel 3_2
Panel 3_3
Ref. plywood 3_1
Ref. plywood 3_2
Ref. plywood 3_3
ANSYS
Figure 3.8 Load/deflection curves for 30 mm plywood and equivalent stiffness sandwich
panels.
For the specimens of Panel 4 series difference between sandwich panels and traditional
plywood boards does not exceed 30 Numerical analysis marked as ANSYS demonstrated
slightly conservative results than estimated, closer to the mechanical behaviour of the sandwich
panels with the lowest stiffness.
Displacement at midspan, mm
0 2 4 6 8
Lo
ad
, N
0
1000
2000
3000
4000
5000
6000
7000
Panel 4_1
Panel 4_2
Panel 4_3
Ref. plywood 4_1
Ref. plywood 4_2
Ref. plywood 4_3
ANSYS
Figure 3.9 Load/deflection curves for 40 mm plywood and equivalent stiffness sandwich
panels.

81
Finally sandwich panels and plywood boards with the largest thickness demonstrated the
smallest scatter of experimental results (Figure 3.10). At this range plywood thickness deviation
has an inessential effect on stiffness in contrary to the boards with smaller thicknesses.
Deflection at midspan, mm
0 1 2 3 4 5 6 7
Lo
ad
, N
0
2000
4000
6000
8000
10000
Panel 5_1
Panel 5_2
Panel 5_3
Ref. plywood 5_1
Ref. plywood 5_2
Ref. plywood 5_3
ANSYS
Figure 3.10 Load/deflection curves for 50 mm plywood and equivalent stiffness sandwich
panels.
Analysing obtained experimental results it could be noted that applying numerical models
and optimisation techniques it is possible to design birch plywood sandwich panels with the
same stiffness as conventional plywood boards. Optimisation approach based on Latin
hypercube design space filling criteria and metamodelling method is a convenient way to find
function extremes (lower panel mass) because it requires a small number of trial runs and in
contrast to Genetic Algorithm optimisation always gives global maximums and minimums.
However many technological aspects regarding material properties and structure should be
preliminary studied, especially influence of the outer plies thickness to the stiffness of the whole
panel as mentioned by Kljak and Brezović [130].
During the examination of sandwich panel prototypes and plywood boards, slight variation
in final product thicknesses has been observed leading to a discrepancy between numerical and
experimental results especially for panels with the smallest thickness. One of the possible
solution how to reduce the deifference between numerical and experimental results is dividing
research process into two steps where the numerical model is at first verified with conventional
plywood boards and after that sandwich panels are designed and prototyped. In this case, close
match between numerical and experimentally obtained plywood board stiffness could be
reached.

82
The mean density of the rib-stiffened panels is approximately 288 kg/m3 which is more than
twice less than plywood board density. For comparison of all-plywood sandwich panels with
honeycomb core from okoume wood (Aucoumea klaineana) has more reduced density to
205 kg/m3 (Negro et al. [90]), however bending modulus of elasticity for such a sandwich
panels (mean 2.86 GPa) is significantly lower comparing with sandwich panels from birch
wood with the mean bending modulus of 5.59 GPa.
Although bending strength characterisation was out of scope in current study failure of the
panels has been examinated post mortem in order to assure that serviceability requirements of
the panels are met prior to the rupture of the skin or delamination. Typical failure mode of the
rib stiffened sandwich panel is given in Figure 3.11. Most frequent failure of the high thickness
sandwich panels is delamination of the stiffeners as shown in Figure 3.11.a. Thinner cross-
section generally provide skin rupture as in Figure 3.11.b. In some case simultaneous failure of
upper and lower skin and stiffener occurred like captured in Figure 3.12. In most cases failure
occurs in deflection range 4–7 % of the span length. Numerically calculated stresses in outer
layer of the skins at failure varies in the range of 75–130 MPa. It corresponds well with
experimentally acquired values from tension specimens descried in Chapter 2.
Figure 3.11 Failure modes of rib-stiffened panels
a — delamination; b — rupture of the outer fibres
a b

83
Figure 3.12 Failure of the faces and core (Cutted middle section)
3.7 Application of rib-stiffened panels in scaffolding decks
In order to validate the suitability of rib-stiffened sandwich panels for application in load
bearing decking structures (additional set of) all-plywood sandwich panels were designed and
prototyped. The new feature of these panels is milled groove in the surface sheets increasing
area and quality of the bond and improving assembly accuracy. Dimensions if the cross section
is given in Figure 3.13.
320
55
50
9,2
9,2
7,4
9,3*
50 50
9,3*
Figure 3.13. Cross-section of the sandwich panels with plywood stiffeners
Dimensions of the panel correspond to one section of the scaffolding decking structure of
the commonly used Plettac SL70 system [131]. Standard 3m long panels were produced.
Custom build test set-up to apply uniform pressure load was built in the industrial park of
AS Latvijas Finieris. Uniform pressure on the area was realized by water pressure in the sill
above sandwich panel. Design and dimensions of the test set-up are shown in Figure 3.14. The
pressure level is maintained by applying certain depth of the water. (each 100 mm of. water
provides approximately 1 kPa uniform pressure).
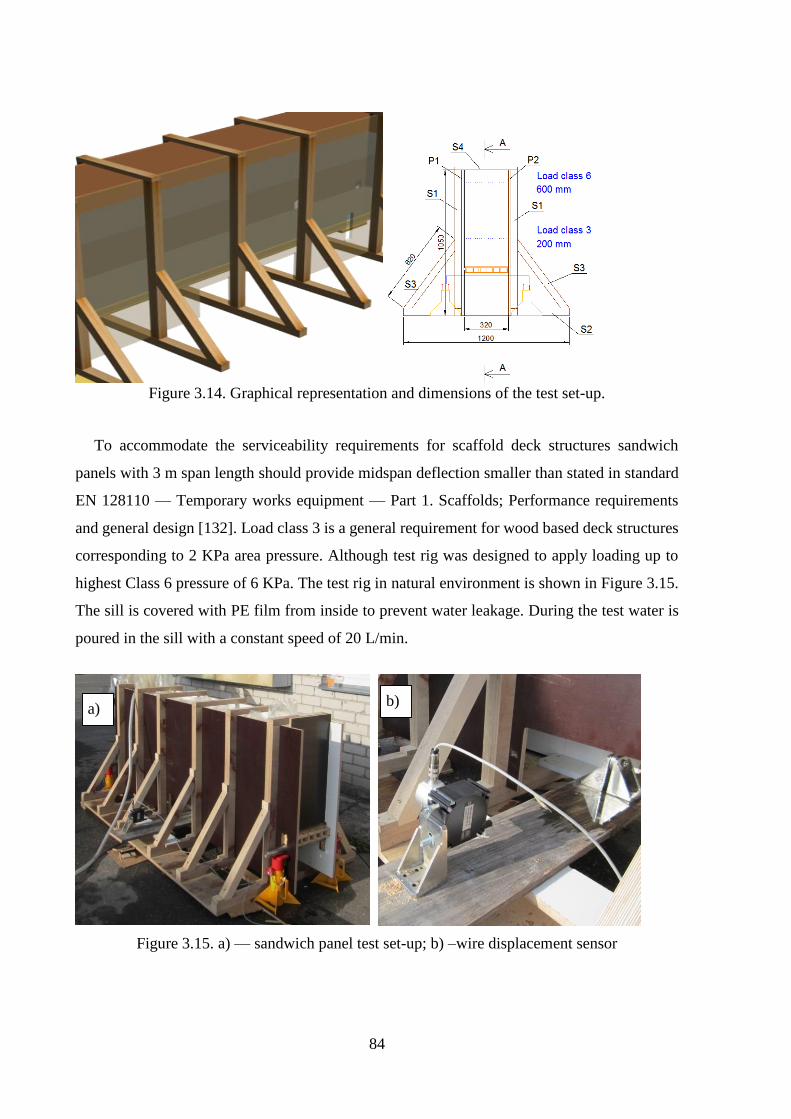
84
Figure 3.14. Graphical representation and dimensions of the test set-up.
To accommodate the serviceability requirements for scaffold deck structures sandwich
panels with 3 m span length should provide midspan deflection smaller than stated in standard
EN 128110 — Temporary works equipment — Part 1. Scaffolds; Performance requirements
and general design [132]. Load class 3 is a general requirement for wood based deck structures
corresponding to 2 KPa area pressure. Although test rig was designed to apply loading up to
highest Class 6 pressure of 6 KPa. The test rig in natural environment is shown in Figure 3.15.
The sill is covered with PE film from inside to prevent water leakage. During the test water is
poured in the sill with a constant speed of 20 L/min.
Figure 3.15. a) — sandwich panel test set-up; b) –wire displacement sensor
a) b)

85
At the same time deflection is being recorded by MICRO-EPSILON draw-wire displacement
sensor. The water level was synchronized/correlated with time and deflection in average
10 times per test. Several test series has been made. Overview of the series is shown in Table
3.7. Different adhesive types and treatment of the sandwich panel ends have been examined.
Reinforcing of panel ends was performed by filling the voids in sandwich panels with plywood
inserts bonded to the surfaces. This modification has a potential to increase stiffness and shear
strength of the core near the support points where shear deformations are the highest. (reffered
with “x”).
Table 3.7. Tests series for sandwich panels
No. Label Number
of panels
Average
thickness, mm Adhesive
Reinforced
panel ends
1 Panel 6 3 55 PU
2 Panel 7 3 55 PVA
3 Panel 8 2 55 PU x
4 Panel 9 2 55 PVA x
5 Panel 10 5 55 PU
* produced on industrial plant by JSC Latvijas Finieris
In addition, several series of conventional plywood boards were tested in the same
environment to provide stiffness and weight reference values in Table 3.8.
Table 3.8. Tests series for plywood boards
No. Label Number of
panels Nominal thickness, mm
1 Plywood ref. (45 mm) 3 45
2 Plywood ref. (35 mm) 3 35
Summary of load/deflection curves are shown in Figures 3.16 to 3.20. Deflection values
were measured at the midspan. The limit value for bending tests was limited by 6 kPa
corresponding to the water capacity of the test rig.

86
Figure 3.16. Pressure/deflection curves for sandwich panels made by PU adhesive
Figure 3.17. Pressure/deflection curves for sandwich panels made by PVA adhesive.
From the graphs above it could be seen that difference between panels made by PVA and
PU adhesive is negligible. In average midspan deflection of 25 mm was registered at 6 kPa
water pressure. Therefore other properties except mechanical should be considered by choosing
adhesive. Analyzing panels with wood end-inserts in Figure 3.18 it is clear that this kind of
upgrade does not provide any benefits for mechanical stiffness. Although these inserts could be
useful for making joints for attaching the sandwich panel to scaffolding frame.
0
1
2
3
4
5
6
7
0 10 20 30 40
Pre
ssu
re, k
Pa
Deflection, mm
Panel 6_1Panel 6_2Panel 6_3Panel 6_1 (rep)Panel 6_3 (rep)ANSYS
0
1
2
3
4
5
6
7
0 5 10 15 20 25 30 35
Pre
ssu
re, k
Pa
Deflection, mm
Panel 7_1
Panel 7_2
Panel 7_3
Panel 7_1 (rep)
Panel 7_2 (rep)
ANSYS

87
Figure3.18. Pressure/deflection curves for sandwich panels with end insert.
Plywood panels in demonstrated low scatter of test results as shown in Figure 3.19 and 3.20.
Comparison of sandwich panels and plywood boards is given in Table 3.9.
Figure 3.19. Reference pressure/deflection curves for 35 mm plywood.
0
1
2
3
4
5
6
7
0 5 10 15 20 25 30
Pre
ssu
re, k
Pa
Deflection, mm
Panel 8_2
Panel 8_1
Panel 9_2
Panel 9_1
Panel 8_2 (rep)
Panel 9_2 (rep)
Panel 9_1 (rep)
Panel 9_2 (rep)
0
1
2
3
4
5
6
0 10 20 30 40 50
Pre
ssu
re, k
Pa
Deflection, mm
Plywood ref (35 mm)_1
Plywood ref (35 mm)_2
Plywood ref (35 mm)_3

88
Figure 3.20. Reference pressure/deflection curves for 45 mm plywood.
Comparison of the sandwich panels and alternative decking structures are provided in Table
3.9. Weight and deflection values for commercially used wood and perforated steel decks are
collected from manufacturer source [7].
Table 3.9. Stiffness and weight comparison for sandwich panels and plywood boards.
Birch
plywood
I core
sandwich
Wood
board
Perforated
steel deck
Aluminum
deck
Avg. panel
thickness, mm 35.5 45.3 52.5 48.0 76.0 50.0
Avg. panel weight,
kg 19.1 26.4 13.9 21.7 20.5 13.2
Allowed load class
for 3m span 3 3 3 3 4 3
Sandwich panels with stiffener core (I-core) have significantly lower mass comparing to
wood boards, conventional plywood and steel decks. In addition, sandwich panels pass EN
128110 [15] requirements for deflection limits set to 1 % of the span length in case of uniform
loading. In this case, plywood sandwich panels have similar performance and weight as
aluminium decks.
0
1
2
3
4
5
6
7
0 10 20 30 40 50
Pre
ssu
re, k
Pa
Deflection, mm
Plywood ref (45 mm)_1
Plywood ref (45 mm)_2
Plywood ref (45 mm)_3
ANSYS

89
IV Design of plywood GF/PP sandwich panels
Design and optimization in previous sections confirmed that it is possible to reach significant
weight saving with rib-stiffened sandwich panels, however mechanical performance for all-
plywood sandwich panels are limited compared to solid (conventional) plywood of the same
thickness. Therefore as a next research step design, prototyping and optimization of sandwich
panels with corrugated GFRP core has been performed. Initial trials involved sandwich core
made of thermoset GFRPas shown Figure 4.1. The lateral research focused on characterization
of sandwich panels containing thermoplastic GF/PP composite core prototyped in a one-step
process to correspond requirements stated by MAPICC 3D project industrial partners [133].
Figure 4.1. Initial design of combined material sandwich panel.
4.1 Finite element model
A numerical model based on FEM has been created in ESI Crash-PAM computer code which
demonstrates reliable performance on implicit and explicit tasks for composites [134]. The
geometry of structure has been modelled using 4-node SHELL 131 elements Figure 4.2 and
4.3. Geometrical tolerances, loading and boundary conditions are kept as close as possible to
the original test environment. Nevertheless, some assumptions have been made by simplifying
curved core elements with straight ones. It significantly reduces solution time without
noticeable negative effect on the obtained results. Other aspects of numerical modelling are
described in Chapter 3.

90
Figure 4.2 Finite element mesh and cross-section groups.
Figure 4.3 Deflection patter of the panel.
4.2 Initial validation of the numerical model
Initially three panels from each type of specimens have been produced and tested in 4-point
bending set up according to EN 789 standard on INSTRON 8802 servo-hydraulic testing rig
(Figure 4.5). All panels have been manufactured in two-step process, at first, forming a
corrugated layer from plywood or GFRP, then attaching surfaces to the core.

91
Figure 4.5. Bending set-up on INSTRON 8802
Deflections under the symmetrical loading conditions have been recorded with LVDT
extensometer at the midspan of the panel. Geometrical properties of prototype panels are shown
in Table 4.1.
Table 4.1. Cross — section parameters for tested panels
Parameter Panels with GFRP
core
Number of face plies 3 plies
Total section height 28.4 mm
Core wall thickness 0.8 mm
Corrugated ply angle 45 deg.
Bonding area length 20 mm

92
4.3 Experimental validation
Throughout the test obtained load/deflection curves have been compared with numerical
results from ESI as presented in Figure 4.6 for panels with GFRP core and Figure 4.7 for panels
with a plywood core. Numerical and experimental curves have been compared to experimental
ones in the region of the elastic mechanical behaviour of the panel until load magnitude up to
6000 N. Due of the non-even bond area between GFRP core and skins, significant scatter of
experimental results have been observed in Figure 4.6 where Panel 11_2 has remarkably higher
stiffness than other panels. Though numerical results using ESI code are within the domain of
experimental load/deflection curves closer to panels 11_1 and 11_3 Numerical curves fit
experimental results adequately for panels with a corrugated plywood core. Scatter of
experimental results in this particular case can be neglected. Vertical line added to both of the
plots indicate deflection limit for the plate and beam elements by governing building code
(EuroCode 5) [135]
Deflection at midspan, mm
0 10 20 30 40
Str
ess
on
out
er
skin
, MP
a
0
20
40
60
80
Lo
ad
, N
0
1000
2000
3000
4000
5000
6000
7000
Panel 11_1
Panel 11_2
Panel 11_3
Numerical (ESI)
Figure 4.6 Obtained load/deflection curves of the sandwich panels with GFRP core.
For additional validation non-contact measurement system IMETRUM has been applied.
Therefore, it was possible to measure deflection also at intermediate points marked in Figure
4.7.
Deflection limit 1/200 L according EuroCode 5
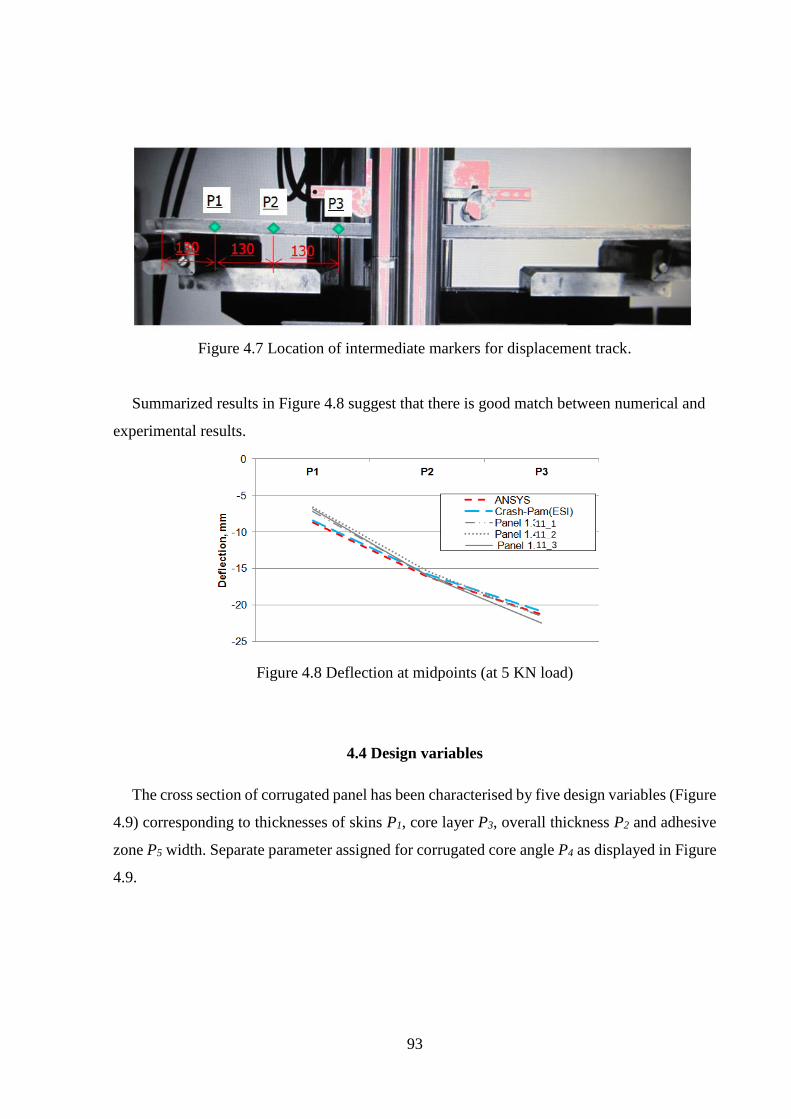
93
Figure 4.7 Location of intermediate markers for displacement track.
Summarized results in Figure 4.8 suggest that there is good match between numerical and
experimental results.
Figure 4.8 Deflection at midpoints (at 5 KN load)
4.4 Design variables
The cross section of corrugated panel has been characterised by five design variables (Figure
4.9) corresponding to thicknesses of skins P1, core layer P3, overall thickness P2 and adhesive
zone P5 width. Separate parameter assigned for corrugated core angle P4 as displayed in Figure
4.9.
11_1 11_2 11_3

94
Figure 4.9. Design variables: for GFRP core sandwich panels
Design space and parametrical increment for the variables are given in Table 4.2. The core
structure wall minimum thickness has been restricted to 1 millimetre in order to avoid local
buckling. In the case of plywood core, core wall thickness is expressed as the number of plies.
Acquired response parameters resulting from numeric calculations are maximum deflection at
the midspan and mass of the panel calculated by means of densities of plywood and GFRP.
Table 4.2. Design variables
Parameter Lower
bound
Upper
bound Step Units
Number of cover plate plies — P1 3 7 2 —
Total section height — P2 30 50 5 mm
Number of plies in corrugate section
(thickness for GFRP) — P3
3
(1.0)
5
(2.5)
1
(-)
(mm)
Corrugated ply angle for GFRP — P4 30 60 — deg
Bonding area length — P5 10 40 — mm
4.5 Optimisation of the panels
In order to assess most effective combinations of design variables of the sandwich panel
cross section in line to conventional plywood boards with similar total thickness, the Pareto
optimality problem has been formulated. The maximization of relative stiffness ΔS is performed
simultaneously minimizing the relative mass ΔM of the panel. Relative stiffness is acquired by
dividing numerical plywood reference board deflection values with ones of sandwich panels. A

95
constant length and thickness configurations have been assumed for the numerical model in
order to match the loading configurations. Furthermore, the relative mass is acquired by
dividing sandwich panel to conventional plywood panel mass. Metamodelling has been
exploited to reduce computational effort in analysing of a large number of design combinations
for the derivation of Pareto optimality plot. Results of Pareto optimality are outlined graphically
in Figure 4.10. Points on Pareto front line are marked with darker colour. It could be noticed
that panels with thermoset GFRP core could reach significantly higher relative stiffness/mass
ratio comparing to all plywood core. For example sandwich panel which mass is 60 % of
traditional plywood board could maintain up to 80 % stiffness in the case of plywood core and
93 % stiffness in the case of GFRP core.
Figure 4.10. Pareto optimality between relative stiffness and mass.
Additional colour plots in Figure 4.11 and 4.12 show trends depending on selected variable.
It is noticeable that most efficient configurations of sandwich panels with corrugated core could
be achieved with smallest number of face plies and core wall angle roughly 600.
0,30
0,40
0,50
0,60
0,70
0,80
0,90
1,00
1,10
0,20 0,30 0,40 0,50 0,60 0,70 0,80 0,90 1,00
Re
lati
ve s
tiff
ne
ss, Δ
S
Relative mass, ΔM
v-core (GFRP)
i-core
v-core
Initial design(GFRP)
30 mm
35 mm
40 mm
45 mm

96
Figure 4.11. Effect of face ply number.
Figure 4.12. Effect of core wall angle.
The previous scaffolding deck study indicated that plywood sandwich panels have a
potential to match stiffness and weight characteristics of lightweight aluminium decks.
However, plywood stiffeners in the core layer prevent reaching even larger weight saving. Thus,
implementation of corrugated thermoplastic GF/PP core might provide higher panel stiffness at
the same time keeping the weight low. Performing optimisation tasks on sandwich panels with
a corrugated core following results shown in Figure 4.13 were obtained. It was found that panels
with 5 veneer face thickness (~6.5 mm) and 1.5 mm core wall thickness could provide the same

97
mechanical performance as rib-stiffened panels maintaining the overall weight of the panel
lower (10.3 kg comparing to 14.1 kg).
Figure 4.13. Mechanical performance of two different configurations of sandwich panels with
the corrugated core.
Solutions analysed in 4.13 are based only on panel stiffness in the longitudinal direction,
however, transverse stiffness also is being affected by changes in core wall thickness and angle.
To assess the influence of core wall angle on panel bending stiffness in transverse direction
curve in 4.14 has been constructed. For better comparison transverse stiffness has constitutedby
longitudinal/transverse core stiffness ratio. It is obvious that even slight inclination of the
vertical stiffener provides a significant increase in the transverse stiffness of the panel. This is
the main reason why corrugated cores have an advantage over cores with vertical stiffeners.

98
Figure 4.14. Core angle robustness graph.
4.6 Prototyping of the panels with GF/PP core
Aluminium bars with prismatic cross section shown in Figure 4.15 have been employed to
form the corrugated core of the sandwich panels. The length of the bars is 1300 mm and cross-
section height 45 mm. 30 mm deep M8 thread is drilled in the both ends of the bar to help to
remove them from the structure after consolidation.
34
45
7,5
Ø8
12
15
52,
22
Figure 4.15. Aluminium bars and cross section of aluminium inserts
One-shot manufacturing approach proposed by MAPIC 3D has been implemented in the
prototyping of the sandwich panels. Detailed steps of panel consolidation are described in
Figure 4.16 and 4.17.
0
10
20
30
40
50
60
70
80
90
100
0,00 0,10 0,20 0,30 0,40 0,50 0,60 0,70 0,80
Co
re w
all a
ngl
e, d
eg.
Longitudinal/transverse core stifness ratio

99
Figure 4.16. Prototyping steps
a — positioning base inserts and lower surface; b — forming core; c — assembling core and upper surface.
Figure 4.17. Prototyping steps
d- vacuum bagging; e — thermal consolidation of the sandwich panel with aluminium inserts.
Fabric wrapped around the bars creates the core of the sandwich panel. PVC tape has
wrapped around structure in several places to hold the bars and plywood surfaces at the correct
position during forming and consolidation. The whole sandwich panel has been placed in
thermo-resistive vacuum bag and pressurized by vacuum.

100
Vacuum bag with sandwich panel further is placed inside industrial oven MEMMERT
UF750 for consolidation of the composite. One layer of the fabric after consolidation has
indicative thickness of 0.5mm. Two Twintex® layers have been determined as optimal thickness
for lightweight wood based panel subjected mainly to the bending load. Three step heating
process was explored gradually rising temperature from 170 deg. Celsius to 190 deg. Celsius.
This has been found as a most appropriate regime for consolidate polypropylene inside fabric.
Graph of the temperature and time relation could be found in Figure 4.18.
Figure 4.18. Time-temperature graph of the sandwich panel consolidation.
After consolidation sandwich structure is taken out of the oven and cooled down to
environment temperature (200C) before removing aluminium bars. Solid bars have been
removed from structure attaching threaded bar to the end of the bar and applying linear drag to
the each of the bars. Approximately 1500 N load magnitude is needed to remove the bar from
the structure. Ends of the panel should be cut to eliminate excessive fabric or locally damaged
plywood (by pulling out bars). Prepared single and double section sandwich panels with GF/PP
core with various thicknesses are shown in Figure 4.19 and 4.20.
0
20
40
60
80
100
120
140
160
180
200
0 50 100 150 200 250 300
Tem
pe
ratu
re, d
eg.
C
Time, min

101
Figure 4.19. Single-section sandwich panel
Figure 4.20. Double-section sandwich panel
Existing prototyping methodology has been modified to make panel prototypes with 3
sections of the corrugated core as shown in 4.21. A Large number of inserts adds extra weight
for the whole structure making difficulties of consolidation in the oven. Instead, steel inserts
were placed inserts in every other section, but other voids were filled with film tube. In such a
way the fabric has been pressed to other inserts and surfaces by vacuum. In addition, faster heat
transfer in the middle of the panel was achieved. The only drawback of this method is rough
core wall surface from the side where the film was located.

102
Figure 4.21. Three-section sandwich panel
In addition plywood column has been prototyped combining two single section panels and
additional plywood sidings as shown in Figure 4.22.
Figure 4.22. Column-type structure.
4.7 Flexural tests
Three-point bending test according to ASTM C393 [136] has been performed on two of the
prototype sandwich beams with a single section of the corrugated core. The distance between
support points has been set to 800 mm. The diameter of the bar for applying the load is 100 mm
and diameter of the support bars are 50 mm as shown in Figure 4.23. Failure of the beams is
caused by the buckling of the GF/PP core at the support. Specimen with 0.5 mm core wall
thickness has much lower load bearing capacity comparing to panel with 1 mm core wall..

103
Obtained Modulus of-elasticity for tested specimens are 2.75 and 3.2 GPa the stress calculated
by the standard is 7.7 and 17.4 MPa.
Figure 4.23. 3-point bending test of the single-section sandwich panel on INSTRON 8802.
Sandwich panels with two and three sections have been tested in 4-point bending, to make
test according to EN 789 [120] standard (Timber structures — Test methods — Determination
of mechanical properties of wood based panels) as shown in Figre 4.24 and 4.25. Observing
load/deflection data in Figure 4.26 it could be noted that panels with two sections have a good
repeatability of the stiffness and maximal load (buckling load).

104
Figure 4.24. 4-point bending test of the double-section sandwich panel on INSTRON 8802.
Figure 4.25. 4-point bending test of the double-section sandwich panel on INSTRON 8802.

105
Figure 4.26. Load/deflection curves for two-section sandwich panel.
Bending results for sandwich panels with 3-sections are displayed in Figure 4.27. Comparing
to two-section panels in Figure 4.26 scatter of experimental results is higher mainly because of
modified prototyping technology. In this case, steel inserts are placed only in three lower
sections and two upper sections are filled with thermo-resistant film. In this way, film is pressed
to the surface and also an insert.
Figure 4.27. Load/deflection curves for three-section sandwich panel.
Although sandwich panels reached buckling load at relatively low-stress values (by beam
theory) there is significant stiffness reserve beyond deflection limit < 5 % of the span length.
Such deflection limit is accepted in Eurocode 5 [3] for structural element made of timber and
wood based materials.

106
The main failure mode for panels with 0.5 and 1 mm core wall thickness (one and two section
panels) was buckling of the core wall near the support as shown in Figure 4.28 and 4.29. For
sandwich panels with thin surfaces of 3-layer plywood also surface wrinkling occurred.
Figure 4.28. Failure mode of the double section sandwich panel.
Figure 4.29. Failure of the support for the single-section sandwich panel.
In the case of sandwich panels with 2 mm core wall thickness (3-section panel), main failure
mode is a surface failure in tension or compression as shown in Figure 4.30. One of the reasons
for such failure is degradation of plywood mechanical properties in the high temperature during
the consolidation of polypropylene.

107
Figure 4.30. The failure mode for three-section thermoplastic panels.
Summary of mechanical properties acquired by performing flexural tests is shown in Table
4.3. Although sandwich panels with 2 mm core wall thickness do not suffer from core wall
buckling maximum stress values are significantly higher only for one of the specimens (27.28
MPa).
Table 4.3. Mechanical properties of the all tested panels
No Specimen label Plywood
thickness,
mm
Core wall
thickness,
mm
Panel
width,
mm
Bending
modulus,
GPa
Max.
stress,
MPa
1 Panel 12_1 4.1 0.5 85 2.75 7.75
2 Panel 12_2 4.1 1 85 3.20 17.40
3 Panel 13_1 6.3 1 170 5.39 19.69
4 Panel 13_2 6.3 1 170 5.39 18.90
5 Panel 13_3 6.3 1 170 5.46 19.78
6 Panel 13_4 6.3 1 170 5.14 19.36
7 Panel 14_1 6.3 2 300 4.72 27.28
8 Panel 14_2 6.3 2 300 3.84 18.98
9 Panel 14_3 6.3 2 300 3.99 21.64
10 Panel 14_4 6.3 2 300 3.19 13.80

108
V Non-contact measurements in validation of numerical models
In order to validate performanece of numerical model a full field strain test measurements
are a crucial evidence for achieving a reliable model performance and further design and
optimisation of sandwich structures. Usually mechanical behaviour is being validated by
attaching strain-gauges or LVDT based displacement measurement devices. However, this such
approach is limited to see a full field picture of displacements and strains preferably marked on
top of the structure. Currenlty much broader information about displacement and strain fields
on the specimen outer surface could be achieved by non-contact measurement systems like VIC
3D [137], ARAMIS [138] or IMETRUM [139]. In present chapter possibilities of non-contact
displacement and strain measurements is demonstrated on the example of sandwich panels with
sophisticated topology cellular wood core.
5.1 Material description
Cellular wood material with a trademark — DendroLight® is a unique concept in lightweight
massive wood boards mainly for applications in sandwich structures for the furniture industry.
The material structure is made from profiled wood boards stacked in perpendicular layers and
then sliced once more in plates perpendicularly to the board’s layers (Figure 5.1). The main
advantage of such a solution is a significant reduction of the structural weight (up to 40 %)
comparing to the conventional timber and improved structure dimensional stability. Therefore,
such a cellular wood material has a potential to be utilised as lightweight load bearing structures
as walls and floors where both strength and thermal insulation are required.
Figure 5.1. The manufacturing sequence of the cellular wood material.
a — milling of the boards with a double-sided groove, b — stacking of the boards in layers, c — forming of the
blocks from the layers, d- cutting the block into DendroLight®
plates.
However for further development of load-bearing sandwich panels validated design practice
based FEM models is necessary. A most comprehensive summary of numerical models in
development of wod based products is given by Mackerle [140]. A basic set of properties for
a) b) c) d)

109
this core material is described by Iejavs et al. [79] where they have conducted the experimental
investigation on a large scale wood sandwich panels with the wood deck faces. It has been
concluded that the cellular wood material could be successfully applied as the core material for
the large span structures (>6m). In current chapter alongside with experimental investigation, a
comparison of different FE techniques for modelling of DendroLight structure is given.
FEM modelling
Mechanical responses of the sandwich structures with cellular wood material core have been
simulated employing ABAQUS finite element code. Two different methods have been
examined: modelling the structure with the shell and the solid type elements (Figure 5.2). Both
methods have some particular advantages and drawbacks, for example, shell elements offer
reduction of calculation time, however solid model could provide a broader perspective about
strains over entire element thickness.
Figure 5.2. Finite element models for sandwich beam specimens a- shell model, b– solid 3D
model.
Determination of mechanical properties of spruce wood is out-of-scope in the present research
therefore these taken from literature source [106].
Plywood skins were modelled as multi-layered structures applying mechanical properties of
the veneer from Chapter 2.Corresponding isotropic mechanical properties have also been
assigned to High-Density Fibreboard (HDF) skins: Experimentally obtained the modulus of
elasticity EHDF = 3.98 GPa with STD of 0.12 GPa and Poisson`s ratio µHDF = 0.32. As only
stiffness analysis was our concern, therefore material strength characteristics have not been
extracted nor introduced into the analysis. The basic building block of the core is given in Figure
5.3.
a) b)
Transverse directionLongitudinaldirection
Blo
ck
direction

110
Bo
ard
thic
kness
wall thickness
Figure 5.3. a) Cross-section of the core element; b) assembly of the core elements and
governing directions.
Separate parts in finite element model have been joined using surface-to-surface connections
at coincident areas. The core modelling sequence represents the sequence of the actual
production process, starting with profiled board modelling, forming layers and slicing blocks
into DendroLight layers. Boundary and loading conditions have been set to match the
experimental test set-up. Due to prismatic component shape, mainly tetrahedral element
formulation has been exploited in meshing process. In the case of the shell elements linear
triangle (type S3) and quadrilateral (type S4R) elements have been applied. Model from solid
elements consisted of C3D8R and C3D4 types finite of elements. After the evaluations, the
mesh size step was set to the magnitude of 5 mm. Structural loads were assigned to the sets of
nodes with coupled deflections along the vertical direction (these nodes highlighted in Figure
5.4a). It allows simulating linear loads with rollers in case of bending specimens. Boundary
conditions have been applied only at the ends of the sandwich beam as shown in Figure 5.4b.
Nevertheless, it should be noted that boundary conditions allow the rotation of all nodes and
translation of nodes along the longitudinal direction from one end of the beam type specimen.
Figure 5.4. a) Finite element mesh of the small sandwich specimen and b) boundary
conditions for this model.
a)
b)
x,y,z
y,z

111
In order to reduce the calculation effort, only the linear analysis has been performed. Such
an approach is in line with good design practice, where the serviceability limit state is reached
much faster than the ultimate limit state.
5.3 Possible wood voids
Various wood defects could appear forming DendroLight® core from milled boards. Some
of them are shown in cross-section cut in Figure 4. Notches (Figure 5.5.a) significantly reduces
board cross section and furthermore stiffness and strength. Good bonding between boards is
marked with dashed line in the centre (Figure 5.5.b) fracture line, in this case, is located inside
wood fibres, not in the adhesive layer. Fracture in the adhesive could be seen in Figure 4.c
where board’s surface is undamaged and excessive glue lines are visible. Joints between the
boards in the same layer (marked as Figure 5.5.d) do not have an adhesive between, however,
stiffness loss is compensated by double cell wall thickness in this area. Mentioned voids in the
DendroLigh® structure do not have a regular pattern, therefore, it is not possible to take into
account all of the imperfections in the numerical model. In the result significant scatter between
experimental results may occur and the difference between numerical and experimental
load/deflection curves appears.
Figure 5.5. Section between two boards
a) notch space; b) region with good bonding c) fracture along adhesive layer; d) joints between boards
5.4 Experimental tests
Small specimens have been tested on ZWICK Z100 testing equipment (Figure 5.6). It should
be noted that as facing material for all sandwich specimens HDF sheets have been applied.
More detailed specification of tested specimens is given in Table 5.1. It has been assumed
that profiled board thickness for all specimens is kept constant 25 mm and the distance between
a)
b) c)
d) d)

112
support spans for B1 series specimens is 240 mm and for B2 series 260 mm. Moreover, B2 series
sandwich-beams have been tested in 4-point bending with the 80 mm distance between load
points.
Table 5.1. Specification of small scale test specimens
Notation Dimensions Number of
specimens
Surface
thickness,
mm
Structure
orientation Length,
mm
Width,
mm
Height,
mm
B1 300 50 60 3 4 Transverse
B2 350 50 30 3 4 Longitudinal
Figure 5.6. 3- point bending test set-up on ZWICK Z100.
Specimens have been loaded until failure in quasi-static compression with the test speed of
1 mm/min. Initially, displacements have been measured by the machine crosshead travel only.
Mechanical properties of large-scale panels with the length of 1.2 m and HDF skins also have
been investigated in the present study. Sandwich structures with such dimensions are usually
applied in the design of exterior structures like stair pads or shelve systems. Therefore, it is
important to evaluate possibilities of numerical modelling of interior load bearing elements.
Mechanical properties of DendroLight® largely depend on wood cell direction; for bending
specimens are possible three types of core orientation affecting mechanical properties, through
three series of sandwich panels have been manufactured (dimensions and core types are
summarised in Table 5.2).

113
Table 5.2. Specification of tested large scale sandwich panels
Series Number of
specimens
Dimensions Board
thickness,
mm
Structure
direction Length,
mm
Width,
mm
Thickness,
mm
B3 3 1200 300 60 25 Longitudinal
B4 3 1200 300 60 25 Transverse
B5 3 1200 300 80 18 Block
Due to manufacturing restrictions panels of B5 series have increased the thickness of 80 mm.
Sandwich panels have been tested in 4-point bending according to EN 789 standard [4.1] on
the INSTRON 8802 universal test equipment shown in Figure 5.7. The deflection at midspan
was recorded by LVDT deflectometer and strains acquired by HBM strain-gauges. Two clip-
on extensometers have been pinned to the panel side area near support points in order to acquire
the shear deformations in the core.
Figure 5.7. Bending test set-up on INSTRON 8802
a — attached strain-gauge, b — LVDT deflectometer, c — extensometer for shear strain measurement.
5.5 Validation of the numerical model for small-scale specimens
In order to ease the comparison of experimental and numerical results a load/deformation
curve plots have been compounded for experimental and numerical results. The validation
criterion for small scale sandwich-beam specimens is deflection at the midspan.
The mechanical behaviour of tested sandwich specimens is mainly affected by properties of
the outer skins. All specimens have clearly visible elastic behaviour region (Figure 5.8).
However for specimens with transverse core orientation (B2 series) an elastic region is only half
of the critical load due to the appearance of the shear deformations when the bond between
cellular boards was lost near the loading point. Numerical results in linear mechanical behaviour

114
regions are close to experimental deflection values or within the region of experimental data
scatter. Both numerical model types demonstrate similar stiffness behaviour. Specimen B1_3
has wood defects in the inner core, therefore, stiffness and strength for this panel is significantly
lower.
Figure 5.8. Experimentally obtained deflection values compared with numerical results for
bending specimens B1 and B2.
Comparing calculation times on a standard personal computer, there is no obvious advantage
of the model from shell elements over a model made with solids. In average shell models have

115
10-15 % shorter calculation times, however in some cases, the difference is even smaller.
Calculation time could be especially important for further optimisation tasks of sandwich
panel’s topology, where several hundreds of experimental runs are required on the full-scale
structure. Another challenge for numerical modelling is the appearance of the small mesh
elements. They could dramatically decrease calculation speed or in worst case scenario to cause
a crash of the calculation process entirely (no convergance has been reached). Such a faults
should be eliminated by redesigning meshing algorithm or suppressing these elements out of
the model.
5.6 Validation of the numerical model of the large scale sandwich panels
Similar validation process has also been applied to large scale sandwich panels. In addition,
to deflection data also strains at the midspan (on the surface of the skin) have been compared
with a numerical model. Results for B3 series specimens are displayed in Figure 5.9 and 5.10.
Panels have small scatter of experimental results compared to numerical deflection and strain
values. Computational results are close to experimental curves indicating good model
prediction accuracy. Mechanical characteristics of panels in this series are as follows: modulus
of elasticity 1.74 GPa, Shear modulus 21.33 MPa (calculated according to EN 408 methodology
[141]), bending strength 9.41 MPa.
Figure 5.9. Vertical displacement plot for B3 series panels with longitudinal core orientation.

116
Figure 5.10. B3 series panels with longitudinal core orientation. Load/strain and
load/deflections curves.
Transverse orientation of core (in Figure 5.11) layer slightly reduces the modulus of
elasticity to the magnitude of 1.64 GPa, and strength to 7.43 MPa. Due of weak shear modulus
in this direction — 14.26 MPa at skin failure structure rapidly lose any load carrying capacity
because wood has weak transverse properties. Numerical deflections and curves match the
experimental behaviour shown in Figure 5.12 entirely.
Figure 5.11. Vertical displacement plot for B4 series panels with transverse core orientation.

117
Figure 5.12. B4 series panels with transverse core orientation. Load/strain and load/deflections
curves.
Block direction (in Figure 5.13) of the core is the simplest way of manufacturing of the core
because it does not require additional cutting, however at the same time, it show the weakest
mechanical properties as well. Modulus of elasticity is 1.21 GPa, and shear modulus 8.16 MPa
with bending strength 9.62 MPa. It should be noted that thicknesses of these panels are higher
than for previous two series, therefore mechanical properties are weaker at higher load
magnitudes. Experimental results for this series also have the largest scatter (Figure 5.14).
Figure 5.13 Vertical displacement plot for B5 series panels with block direction core orientation.

118
Figure 5.14. B5 series panels with block core orientation. Load/strain and load/deflections
curves.
Main failure mode appeared for a specimen in all series is a fracture of the outer skin at
0.6 % strain ratio. It means that strength and stiffness of current panels could be significantly
improved replacing HDF skins with plywood alternative. However for furniture applications
existing mechanical properties and stiffness is sufficient.
Detailed numerical model with a length exceeding one meter demands significant
computational resources, therefore, for larger structures detailed core should be replaced with
continuum layer with equivalent stiffness core. Detailed numerical model, in this case, could
be used for virtual extraction of mechanical properties [142] or optimizing some mechanical
characteristics of the core [143].
5.7 Investigation by non-contact measurements
Several bending and compression specimens have been examined during the physical testing
by the ARAMIS digital image correlation (DIC) system . The main emphasis in current research
has been devoted towards analysing the distribution of displacements and strains during these
tests.
Load/deflection results for a sandwich specimen with longitudinal core orientation and HDF
skins are shown in Figure 5.15. Specimen with dimensions of 150x50x40 mm has been tested
in 4-point bending with a support span of 140 mm and distance between loading points of 40
mm. In additional to the experimental curves, a numerical deflection result has been overlaid.
During the strain recordings, a small time shift has been monitored among the measurement
time step and actual time increment. Therefore, the stage numbers are not necessary correlating
with actual time in seconds.

119
Delfection at midspan, mm
0 1 2 3 4 5
Lo
ad,
N
0
1000
2000
3000
4000
Specimen 1
ABAQUS (solid)
Sta
ge
70
Sta
ge
14
0
Sta
ge
22
0
ABAQUS plot
Figure 5.15. Displacement plots for a sandwich specimen with longitudinal core orientation
and ARAMIS test set-up.
From experimental results may be seen that sandwich beam has a linear mechanical
behaviour up to the stage 140 which correspond to 170 seconds of the test time. At the same
time displacements at the specimen middle span are not evenly distributed along the vertical
axis. The pattern indicates that the upper specimen part is compressed more than the lower
region, and it is possible to notice that diagonal boards in the middle are the most compressed.
Similar displacement pattern also may be observed on the numerical model as well. In Figure
11 one can say that specimens have uniform mechanical behaviour, at least, up to 80 % of
failure load value, which could be later applied in engineering design practice.
Obtained load/deflection results for sandwich-beam corresponding B2 specimens are shown
in Figure 5.16. Transverse orientation of the core layer worsens mechanical behaviour of the
panel. At the stage 60 specimen show clearly visible core shear deformation close to the load
applying point. For this reason, there is no sharp load drop observed once visible core
separation starting to appear. Analysing ARAMIS displacement plots one may conclude the
constant displacement pattern has been evaluated for a wide range of stages, as an example,
stage 22 up to stage 45. Local compression effect is not visible due of larger span length. The
region up to the stage 45 could be considered to have linear elastic mechanical behaviour.

120
Figure 5.16. Displacement plots for a sandwich specimen with transverse core orientation.
Compression specimen, with dimensions of 100x100x40 mm and longitudinal core
orientation, demonstrated non-uniform waveform displacement plot in the elastic region of
mechanical behaviour (Figure 5.17). After reaching the maximum load value the bonds between
profiled boards degrades and the boards are separating. Such behaviour could not be confirmed
numerically without dealing with sophisticated damage propagation mechanics, instead just
suppressing the bounds between boards.
Figure 5.17. Displacement plots for compression specimens.
Examples of all readings which are possible to extract from ditgital image correlation system
ARAMIS with sufficient camera resolution are given in Figure 5.18. One may see that both
types of numerical models could provide correct information about vertical displacements plots,
ABAQUS plot
ABAQUS plot with
suppressed bounds

121
where displacement transmission through the skew board side is clearly visible. Horizontal
displacement pattern (Figure 5.18.b) also could be observed in Figure 5.18.f and j. Due to skew
core stiffeners upper and lower part of the structure is moved in opposite directions along the
X axis. Not all sandwich beam surface is captured by ARAMIS system therefore only right side
is completely visible.
Only numerical model with solid type elements has the capacity to simulate local strains on
the specimen surface. Largest vertical strains shown in Figure 5.18c are located near the joints
between core elements and face. A similar trend could be observed in the numerical model as
well (Figure 5.18h), but with less intensity. Horizontal strains are mainly concentrated on
specimen surfaces as shown in Figure 5.18d. The same pattern is replicated in the FEM model
either (Figure 5.18h).
Figure 5.18. Comparison of experimentally and numerically acquired displacement and strain
plots.
a–b: Experimental readings from ARAMIS system; e–h: a Numerical model with solid elements; i–j: numerical
model with shell elements.

122
VI Analysis of thermal properties for sandwich panels with foam
core
6.1 Introduction
As a logical next step the foam core was introduced mainly to address one shot
manufacturing process of all — plywood sandwich panels with the rib-stiffened core.
Additional benefits of the core foam filler are improved the shear rigidity of the core and
consistent quality of sound/vibration and thermal insulation. Therefore, trade-off between
mechanical and thermal properties should be set.
6.2 Multiphysics in numerical modelling
Both mechanical and thermal responses have been acquired by the means of numerical
models available in commercial software ANSYS. As initially shell element numerical model
elements has been verified, additional 8-node SOLID185 elements was added in order to
simulate foam core. For the purposes of further validation of the shell elements 4-point bending
load appliance scheme were applied with the distance between load appliance points of 300 mm
and the distance between supports of 1100 mm (distances according to EN789[121]). Other
parameters and mechanical properties of the plywood veneer are the same as for numerical
modelling of sandwich panels in Chapter 3. Mesh density with cube size of 10 mm has been
assigned to the structure as shown in Figure 6.1.
Figure 6.1. a — mesh pattern and b — deformed shape of the panel section.
As a foam filler rigid PU foam has been applied. Rigid PU foams are one of the most
effective thermal insulation material available on the market with a thermal conductivity of 18-
28 mW/(mK) [1, 1.2.1]. Low thermal conductivity, closed-cell structure, low water absorption
and moisture permeability, and relatively high compressive strength make this material
a
)
b)

123
competitive with polystyrene foams (XPS and EPS) despite higher costs per m3 [144]. In
addition some preliminary fire tests confirmed that foam filled sandwich panels show improved
fire resistivity and with proper chemical composition may reach fire safety class necessary for
building materials. The linear relation between modulus of elasticity and density is given in
Figure 6.2c.
A thermal model of the cross-section numerically represented in a 2D model with PLANE55
elements. Steady state analysis with loads applied to the temperature on lower and upper nodes
of the mesh. Mesh pattern and heat flow are also shown in Figure 6.2.
Figure 6.2. a — mesh pattern; b -nodal temperatures at thermal equilibrium; c — density and
modulus of elasticity curve.
As the result of the thermal simulation — the sum of heat flow magnitudes from base nodes
are extracted and thermal conductivity k is calculated by Fourier's law in equation 2.1
6.3 Validation of thermal behaviour model
In order to validate numerical model and to produce firsts sandwich panel prototypes with
foam core filler, technological trials has been carried out to determine the most efficient means
of PU foam filling. The laboratory scale test set-ups have been made swapping upper face of
the sandwich panel with transparent glass surface as shown in Figure 6.3. This approach allows
observing expansion of the foam inside the cavities and further adjusting reaction time of the
chemicals. Liquid state of the foam also penetrates interface between stiffener and face sheet.
0
50
100
150
200
250
0 100 200 300 400D
ensi
ty,
kg
/m3
E-modulus, MPa
a
)
b c
)

124
Figure 6.3. Stepwise filling of core cavities.
Reaction causes significant expansion pressure therefore both surfaces should be pressed
together during curing time of foams. Unfortunately initial prototypes suffered from uneven
foam quality and inner pores as shown in Figure 6.4.
Figure 6.4 Cross-section of rib-stiffened sandwich panel with foam core.
Final foam density acquired for the first panel prototypes was in the range from 105-115
kg/m3. Knowing precise plywood density and thermal conductivity values it is possible to
calculate effective thermal conductivity of the whole structure. For this purpose specimens with
dimensions of 200x200x65 mm has been cut from the panel. Thermal conductivity of the
plywood is a magnitude higher than foams which also affect the overall performance.
Therefore, several cutting patterns have been examined — specimens containing 3 and 4
stiffeners. Results in Table 6.1 shows that numerical analysis has a capability to forecast
effective thermal conductivity; however, it shows lower values than in case of experimental
tests by Linseis FHM 300 apparatus.

125
Table 6.1 Comparison of experimental and numerical results
Number of
stiffeners
Effective thermal conductivity, mW/m·K
Δ,% Experimental result Numerical result
3 68.3(0.4) 56.5 17.3
4 73.5(2.1) 58.4 20.5
6.4 Optimisation
The cross section of a corrugated panel has been characterised by five design variables
(Table 6.1). Separate parameter assigned to core modulus of elasticity P5, which has a linear
relation with foam thermal properties.
The design space and parametrical increment for the variables are given in Table 6.2. In the
case of plywood core, core wall thickness is expressed by the number of plies. Acquired
response parameters resulting from numerical calculations are maximum deflection at the
middle of span and mass of the panel calculated by means of densities. Effective thermal
conductivity has been extracted by running the same design of experiments exclusively for the
thermal 2D model.
Table 6.2. Design variables
Parameter Lower
bound
Upper
bound Step Units
Number of surface plies —
P1
3 7 2 —
Total section height — P2 30 70 - mm
Number of stiffener plies —
P6
3 7 2 —
Stiffeners distance– P7 10 80 10 mm
Foam E-modulus — P8 75 300 - MPa
In the present research a sequential space filling design based on Latin Hypercube with
Means Square error criterion has been evaluated by the in-house EdaOpt software [3.8]. All
responses have been approximated employing Adaptive Basis Function Construction (ABFC)
approach proposed by [3.10].
6.5 Equivalent stiffness sandwich panel design
For efficient evaluation mechanical and thermal properties of sandwich panels were
compared with conventional plywood boards. It is commonly known that sandwich panel

126
thickness could be raised to increase bending stiffness without any significant weight penalty.
Therefore, in the first optimisation step combinations of variables have been selected. This
guarantee deflection restraint not to exceed over values obtained from numerical analysis of
conventional plywood board. The relative mass indicator in Table 6.3 is obtained dividing
sandwich panel mass by mass of plywood board of the same stiffness.
Table 6.3. Optimised sandwich panels in comparison with conventional plywood
Equivalent of 30
mm plywood
Equivalent of 40
mm plywood
Equivalent of 50
mm plywood
Cross-section
parameter values
P1 = 5; P2 = 33;
P6 = 3; P7 = 56;
P8 = 75
P1 = 5; P2 = 48;
P6 = 5; P7 = 74;
P8 = 75
P1 = 5; P2 = 63;
P6 = 3; P7 = 68;
P8 = 75
Relative mass, % 47.8 40.9 32.3
Relative thermal
conductivity, % 28.3 25.1 21.4
Analysing results summarised in Table 6.2 it could be stated that advantage of sandwich
panels increases gradually by increasing thickness. Due to exploitation considerations surface
thickness of the sandwich panel with 33 mm section height has been raised to 5 layer. For all
sandwich panels types the most efficient strategy to increase stiffness is by increasing the
section height using 3-layer stiffeners and low-density foam filler. In the case of the sandwich
panel with the largest section height, variables P7 and P8 reached the boundaries of design space.
Therefore, it has been considered useful to run the same optimisation task for sandwich panels
with foam core only (without stiffeners). Results of this optimisation are shown in Table 6.4.
Table 6.4. Optimised sandwich panels (without stiffeners) in comparison with solid plywood
Equivalent to 30
mm plywood
Equivalent to 40
mm plywood
Equivalent to 50
mm plywood
Cross-section
parameter values
P1 = 5; P2 = 34;
P8 = 75
P1 = 5; P2 = 53;
P8 = 75
P1 = 5; P2 = 70;
P8 = 121
Relative mass, % 47.1 34.1 35.5
Relative thermal
conductivity, % 25.3 21.7 24.7
From both types of sandwich structures it is clearly seen that increasing section thickness is
more efficient than raising density and thus mechanical properties of the foam. In the last
column of Table 6.3 foam properties were increased due to the reason that section height
variable reached the upper boundary.

127
6.6 Pareto optimality front
The overall efficiency of plywood sandwich panels has been demonstrated by formulating
3D Pareto optimization problem where maximization of relative stiffness ΔS is done
simultaneously by minimizing the relative mass ΔM and relative thermal conductivity ΔK of
the panel (Figure 6.3 and 6.4). Relative values are acquired dividing calculated conventional
plywood board deflection and thermal conductivity with corresponding values of the sandwich
panel with the same length and thickness, under the same loading conditions. Relative mass is
acquired by dividing sandwich panel mass with solid plywood panel mass.
Figure 6.5. Graphic representation of Pareto optimality between each of two responses.
From Figures 6.5 and 6.6 it is visible that both core types has similar stiffness/mass ratio.
Most of the marked points (points on the Pareto front) in Figure 6.3b have matching positions.
optimality optimality
o – foam/stiffener core
x – foam core
a) b)
optimality
c)

128
However sandwich panels with foam core have better relative thermal conductivity and stiffness
and the mass ratio (Figure 6.5b, 6.5c). Pareto front of sandwich panels with without stiffeners
is significantly closer to optimality point.
Figure 6.6. Graphic representation of Pareto optimality between three responses.
a) — all data points; b) — only points on Pareto front.
Summarizing research work it could be stated that the largest weight reductiom and thermal
conductivity benefits have sandwich structures with the highest cross-section thickness. Solid
plywood board with a thickness of 50 mm could be successfully replaced by the same stiffness
sandwich panel with 63 mm thickness, but possessing only 32.3 % of the reference panel`s mass
and approximately 5-fold decreased effective thermal conductivity. Due to the fact that PU
foam, made of renewable components, has linear modulus/density ratio increment of sandwich
thickness is more efficient than use of higher density foam core.
Pareto optimality front for all three numerical responses has been constructed to assess field
of possible optimisation outputs. General trend observed in Pareto front shows that sandwich
panels with foam core filler outperform panels with additional stiffeners especially comparing
effective thermal conductivity.
a)
b)
Optimality

129
VII Vibration analysis for sandwich panel design
7.1 Overview
Vibration and sound isolation play significant role in design of structures suitable for human
presence for example in train hulls. In addition vibration is cause of the noise often undesirable
for human wellbeing and structural integrity of assemblies where mechanical parts are joined
with electronic boards for example speed-boats. One of the reviews of materials for vibration
damping is written by Chung [145].
The main approach to the investigation of sandwich panels vibration damping properties
under dynamic load conditions was eigenfrequencies and modal analysis of the specimens with
different core types. Mainly POLYTECH PSV400 equipment has been used for these purposes.
Test set set-up for modal analysis investigation is shown in Figure 7.1. Specimen is attached to
the steel frame with lightweight wires to achieve free-free boundary conditions. Excitation to
motion in the specimen has been induced by loudspeaker behind the panel. Sound waves with
increasing frequency are generated by modal amplifier. Full-field mobile scanning head makes
non-contact acceleration measurements on specimen surface at all frequencies. Data processor
and software tools summarize measurement from a grid of measurement points and produce
plots of frequency response graphs and visual plots of mode shapes.
Figure 7.1 Modal analysis test set-up.
These results are also useful to estimate the quality of the structure observing symmetry of
the mode shape and comparing frequency/response graphs between specimens. The concept of
quality control could be extended to include the numerical model. Comparing experimentally

130
and numerically acquired eigenfrequencies and mode shapes it is possible to assess how well-
created prototype corresponds to an ideal structure in the model. This kind of non-destructive
evaluation also might be applied to evaluate changes in structure properties after some
exploitation time especially in an outer environment as described in literature sources [146,
147, 148]. Table of sandwich panels tested by NDE is provided in table 7.1. For the reference
a solid plywood board responses were added.
Table 7.1. Sandwich specimens investigated by NDE.
Series label Core type Thickness Width
Reference plywood
Plywood 20 mm Solid plywood 20 300
Plywood 40 mm Solid plywood 40 300
Plywood 48 mm Solid plywood 48 300
Sandwich panels with corrugated core
Panel 13 Corrugated core 55 170
Panel 14 Corrugated core 60 300
Sandwich panels with vertical stiffener core
Panel 15 Vertical stiffener core 36.7 300
Panel 16 Vertical stiffener core 49.3 300
Panel 17 Vertical stiffener core 64.5 300
Sandwich panels with foam and vertical stiffener core
Panel 18 Vertical stiffener core and foam 51 300
Panel 19 Vertical stiffener core and foam 63.5 300
7.2 Quality control by NDE
Before mechanical investigation of the panels, modal analysis on POLYTECH PSV400
equipment has been performed with the aim of estimation consolidation quality and deviation
between specimens. Idealized shape of the first shear and bending mode should be similar to
numerically acquired example in Figure 7.2.

131
Figure 7.2. Ideal mode shape for symmetrical sandwich panel with several sections
Typical frequency response graph for sandwich panels with 170 mm width and 5-layer
surface and 1 mm core wall is shown in Figure 7.3. Four panels has similar eigenfrequencies at
magnitudes of response. For comparison one panel with significant consolidation failure has
been added to the graph and has clearly distinctive response pattern.
Figure 7.3 Frequency response curves and mode shapes for sandwich panels with 170 mm
width.
Comparing with other panels response values are several times lower and shifted to the right
side for failed specimen. Mode shapes for successfully consolidated specimens has a
0,0E+00
5,0E-06
1,0E-05
1,5E-05
2,0E-05
2,5E-05
100 200 300 400 500 600
Ma
gn
itu
de
[
m/s
]
Frequency [Hz]
Panel 13_1 Panel 13_2 Panel 13_3 Panel 13_4 Failed spec.

132
symmetrical pattern.Dynamic tests also have been performed for sandwich panels with three-
section core and 2 mm core wall thickness. Frequency response graph for these panels is
displayed in Figure 7.4. Panels 14_2 and 14_3 has a close match in response magnitude and
frequency values. The last panel has lower first two eigenfrequencies due to consolidation
defects and geometrical imperfections. Some defects are visible on visual inspection. Another
indicator of imperfections is skewed mode shape of first bending mode.
Figure 7.4 Frequency response curves and mode shapes for sandwich panels with 300 mm
width.
Results for sandwich panels with vertical stiffener core and 65 mm thickness are given in
Figure 7.5. In this case, typical bending mode shape is located under a steeply inclined angle.
Probably caused by inconsistent bonding quality of stiffeners.
0,00E+00
1,00E-05
2,00E-05
3,00E-05
4,00E-05
5,00E-05
6,00E-05
7,00E-05
100 150 200 250
Ma
gn
itu
de
[
m/s
]
Frequency [Hz]
Panel 14_1 Panel 14_2 Panel 14_3 Panel 14_4
(2; 0)
(2; 0)
(2; 0)
(1; 1)
(1; 1)(1; 1)
(2; 0)- Bending mode (1; 1)- Shear mode

133
Figure 7.5. Frequency response curves and mode shapes for sandwich panels with vertical
stiffeners — 65 mm cross-section height.
The same panels with foam filler in the middle are shown in Figure 7.6. In this case, bending
mode is only slightly biased and response curves are generally matching. The only exception is
left shifted curve for specimen 19_3.
Figure 7.6 Frequency response curves and mode shapes for sandwich panels with vertical
stiffeners — 65 mm cross-section height and foam filler.
0,00E+00
5,00E-06
1,00E-05
1,50E-05
2,00E-05
2,50E-05
3,00E-05
3,50E-05
100 150 200 250 300 350 400
Mag
nit
ud
e [
m/s
]
Frequency [Hz]
Panel 17_1
Panel 17_2
0,00E+00
1,00E-05
2,00E-05
3,00E-05
4,00E-05
5,00E-05
6,00E-05
7,00E-05
8,00E-05
9,00E-05
1,00E-04
130 180 230 280 330 380
Mag
nit
ud
e [
m/s
]
Frequency [Hz]
Panel 19_1
Panel 19_2
Panel 19_3
Panel 19_4

134
7.3 Estimation of loss factor by modal analysis
Besides acquiring natural frequencies, one advantage of modal analysis set up is a
determination of modal damping factor (loss factor). A short explanation how loss factor has
been acquired is presented in Figure 7.7. According to ASTM E756 [150] damping factor could
be calculated for each natural-frequency (7.1) as the area below peak at pre-defined boundaries
(depends on peak height).
𝜁𝑛 = 𝑓𝑏−𝑓𝑎
𝑓𝑏+𝑓𝑎 (7.1)
Figure 7.7. Region for calculation of loss factor.
In this case, loss factor served as comparative value of damping performance for various
core types and plywood reference. Summary of acquired results is given Figures 7.8 and 7.9.
Theoretically loss factor could be calculated for each major natural-frequency however in
practice some of the natural-frequency peaks were undetectable. Therefore, in loss factor for
first bending (N1) and second shear natural-frequency (N3) has been calculated. These natural
frequencies were detected for most of the panels. General trend shows only a small increase of
loss factor comparing plywood boards and sandwich panels especially for the N3 graph.
However more significant tendency is a decrease of loss factor for sandwich panels with foam
filler, comparing with the same panels without foams. Most obvious reason is for this trend is

135
increased stiffness added by foams. Acquired results also possess high scatter of experimental
values which could be reduced by increasing number of tested panels.
Figure 7.8. Loss factor for natural-frequency N1.
Figure 7.9. Loss factor for natural-frequency N3.
0
0,5
1
1,5
2
2,5
Ply
wo
od
20
mm
Ply
wo
od
27
mm
Ply
wo
od
40
mm
Ply
wo
od
48
mm
San
dw
ich
GF/
PP
co
re
San
dw
ich
GF/
PP
co
re
Ve
rtic
al s
tiff
en
es c
ore
37
mm
Ve
rtic
al s
tiff
en
er c
ore
50
mm
Ve
rtic
al s
tiff
en
er c
ore
64
mm
Ve
rtic
al s
tiff
en
er c
ore
and
fo
am
Ve
rtic
al s
tiff
en
er c
ore
and
fo
am
Loss
fac
tor,
%
0,00
0,50
1,00
1,50
2,00
2,50
3,00
3,50
4,00
4,50
Ply
wo
od
20
mm
Ply
wo
od
27
mm
Ply
wo
od
40
mm
Ply
wo
od
48
mm
San
dw
ich
GF/
PP
core
San
dw
ich
GF/
PP
core
Ve
rtic
al s
tiff
en
esco
re 3
7 m
m
Ve
rtic
al s
tiff
en
erco
re 5
0 m
m
Ve
rtic
al s
tiff
en
erco
re 6
4 m
m
Ve
rtic
al s
tiff
en
erco
re a
nd
fo
am
Ve
rtic
al s
tiff
en
erco
re a
nd
fo
am
Loss
fac
tor,
%

136
7.4 Estimation of damping ratio
In addition, to modal analysis, simple oscillation damping test by impact hammer has been
done with the test set up in Figure 7.10. Taking into account that it is almost impossible to
clamp one end of the panel firmly, the same flexural test supports has been put as a base to bear
a panel. Excitations are measured in the middle of the panel. Low-velocity impact by the
hammer is performed in the middle between support and measurement point. Similar tests has
been performed by other authors as well to evaluate properties of plywood after applying
thermal treatment [151].
Figure 7.10. Test set-up for hammer impact test.
As the results of impact time/amplitude curves are drawn and logarithmic decrement and
calculated damping ratio (7.2).
𝜁 = 1
√1+(2𝜋
𝛿)2
(7.2)
where 𝛿 is logarithmic decrement (3)
𝛿 = 1
𝑛ln (
𝑥(𝑡)
𝑥(𝑡+𝑛𝑇)) (7.3)
Depending on the energy on impact amplitude may vary, however knowing induced energy
it is possible to downscale amplitude graph. Example of acquired time/ amplitude curves is
given in Figure 7.11.

137
Figure 7.11. Amplitude/ time curves sandwich panel with a rib-stiffened core with foam filler
(a) solid plywood board (b).
Summary of acquired logarithmic decrements is given in Table 7.2. In most cases sandwich
panel with rib-stiffened core outperforms solid plywood. However, the difference between solid
plywood board and sandwich panel with a foam core is smaller.
Table 7.2. Logarithmic decrement for similar thickness boards
Core type Density,
kg/m3
Damping ratio
Stiffeners 257 0.062
Stiffeners& Foam 335 0.042
Solid Plywood 670 0.047
7.5 Evaluation of stiffness properties
Based on first bending mode and first torsion mode it is possible to calculate elastic
properties (modulus of elasticity and shear modulus) according to ASTM E1876 standard [152].
Summary of these results are shown in Table 7.3. ASTM E1876 describes how the resonant
frequencies of elastic materials are excited by striking a rectangular or cylindrical bar which is
free to vibrate. A transducer and associated electronic equipment measure the frequency which
can be related to knowledge of the bar’s dimensions and mass, and the material’s Poisson’s
ratio, to the dynamic Young’s modulus. In the case of the rectangular bar, the fundamental
flexural frequency can be excited and similarly used to calculate the dynamic shear modulus.
Knowledge of both the dynamic Young’s modulus and shear modulus can be used to determine
-0,03
-0,025
-0,02
-0,015
-0,01
-0,005
0
0,005
0,01
0,015
0,02
0,025
0 0,1 0,2 0,3
Ve
loci
ty.
m/s
Time, s
-0,025
-0,02
-0,015
-0,01
-0,005
0
0,005
0,01
0,015
0,02
0,025
0 0,1 0,2 0,3
Ve
loci
ty, m
/s
Time, s

138
Poisson’s ratio where this is otherwise unknown. Analysing results in Table 7.3 it could be seen
that values for modulus of elasticity are close to those acquired by mechanical tests. Average
modulus of elasticity by 4-point bending acquired from at least three specimens in each series.
General trend indicated that lower eigenfrequencies provide lower bending and shear
modulus.
Table 7.3. Elastic properties acquired by ASTM E1876 for panels with sandwich panels and
reference plywood panels.
Series
label Core type Thickness Width
NDE eveluation 4-p
bending
E-modulus,
GPa
Shear
modulus,
GPa
E-
modulus,
GPa
Reference plywood
1_1 Solid plywood 20 300 10.8 1.2 11.6
1_4 Solid plywood 40 300 10.4 1 9.76
1_5 Solid plywood 48 300 9.9 1.1 9.34
Sandwich panels with corrugated core
2_1 Corrugated core 55 170 5.1 0.3 5.5
2_2 Corrugated core 60 300 4.3 0.3 4.2
Sandwich panels with vertical stiffener core
3_1 Vertical stiffener
core 36.7 300 6.98 - 7.03
3_2 Vertical stiffener
core 49.3 300 6.2 0.4 6.11
3_3 Vertical stiffener
core 64.5 300 6.1 0.4 5.25
Sandwich panels with foam and vertical stiffener core
4_1 Vertical stiffener
core and foam 51 300 5.1 0.4 5.2
4_2 Vertical stiffener
core and foam 63.5 300 6.48 0.5 6.5
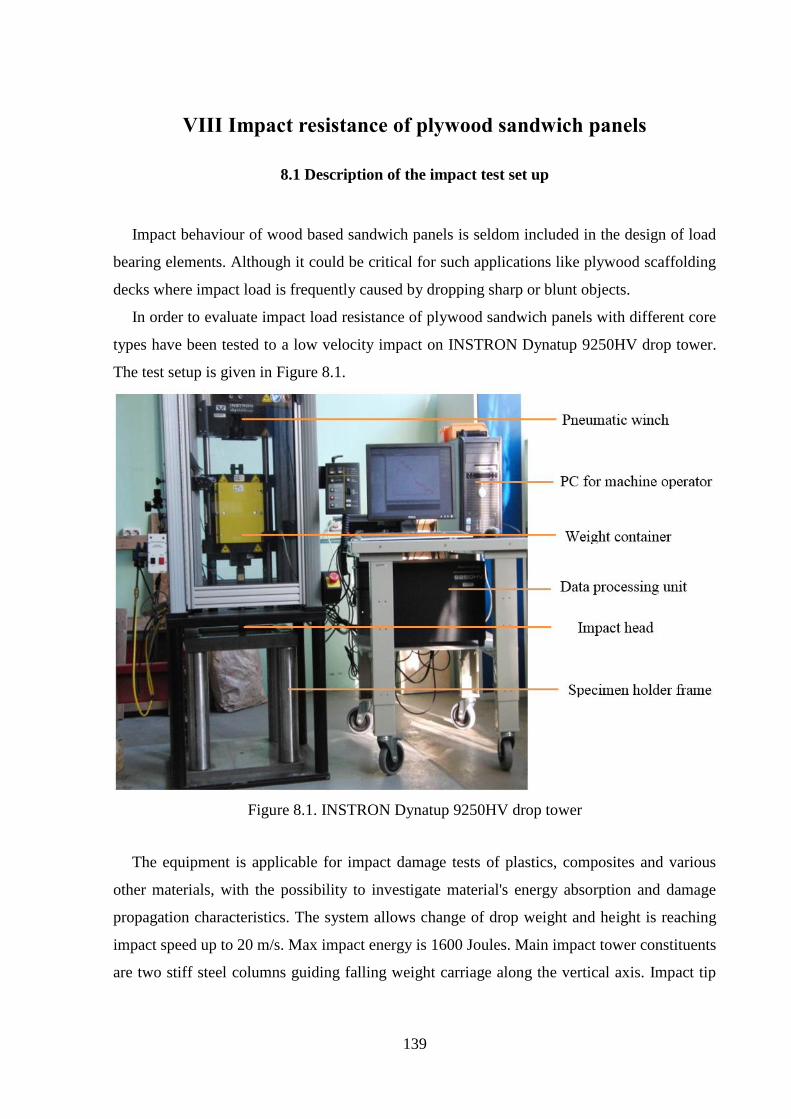
139
VIII Impact resistance of plywood sandwich panels
8.1 Description of the impact test set up
Impact behaviour of wood based sandwich panels is seldom included in the design of load
bearing elements. Although it could be critical for such applications like plywood scaffolding
decks where impact load is frequently caused by dropping sharp or blunt objects.
In order to evaluate impact load resistance of plywood sandwich panels with different core
types have been tested to a low velocity impact on INSTRON Dynatup 9250HV drop tower.
The test setup is given in Figure 8.1.
Figure 8.1. INSTRON Dynatup 9250HV drop tower
The equipment is applicable for impact damage tests of plastics, composites and various
other materials, with the possibility to investigate material's energy absorption and damage
propagation characteristics. The system allows change of drop weight and height is reaching
impact speed up to 20 m/s. Max impact energy is 1600 Joules. Main impact tower constituents
are two stiff steel columns guiding falling weight carriage along the vertical axis. Impact tip

140
with different shapes and diameters could be attached to falling weight carriage. Winch with
pneumatic release hook is used to lift carriage at desired height.
Test procedure and specimen dimensions have been taken from standard NF B51-327 —
Plywood Dynamic Punching Test [153]. The resistance to cracking and penetration should be
determined by measuring the height of mass falling on square shaped specimen. Required
specimen dimensions are 315x315 mm and punch head diameter is 25 mm. Specimen is placed
inside rigid steel frame to achieve simple support on all four edges.
Cracking high corresponds to the height of mass which causes cracking of the specimen —
generally on the opposite side. Perforation height corresponds to penetration of punch more
than 12.5 mm inside the test piece. Cracking resistance 𝑅1 furthermore is calculated as a
potential energy of drop weight W and gravitational constant g according to equation (8.1).
Penetration energy R2 in joules also could be calculated in the same way but using penetration
height H2.
𝑅1 = 𝑔𝐻1𝑊 (8.1)
Typical result output curves of the punching test for 12 mm plywood board could be seen in
Figure 8.2 and 8.3. The number in outlined box corresponds to the sequence of the impact on
the same specimen.
Figure 8.2. Measured load/deflection curves for plywood specimen.
Impacts on specimen surface 1-5. The third impact corresponds to cracking resistance R1 and the last one
(5th) correspond to penetration resistance R2.
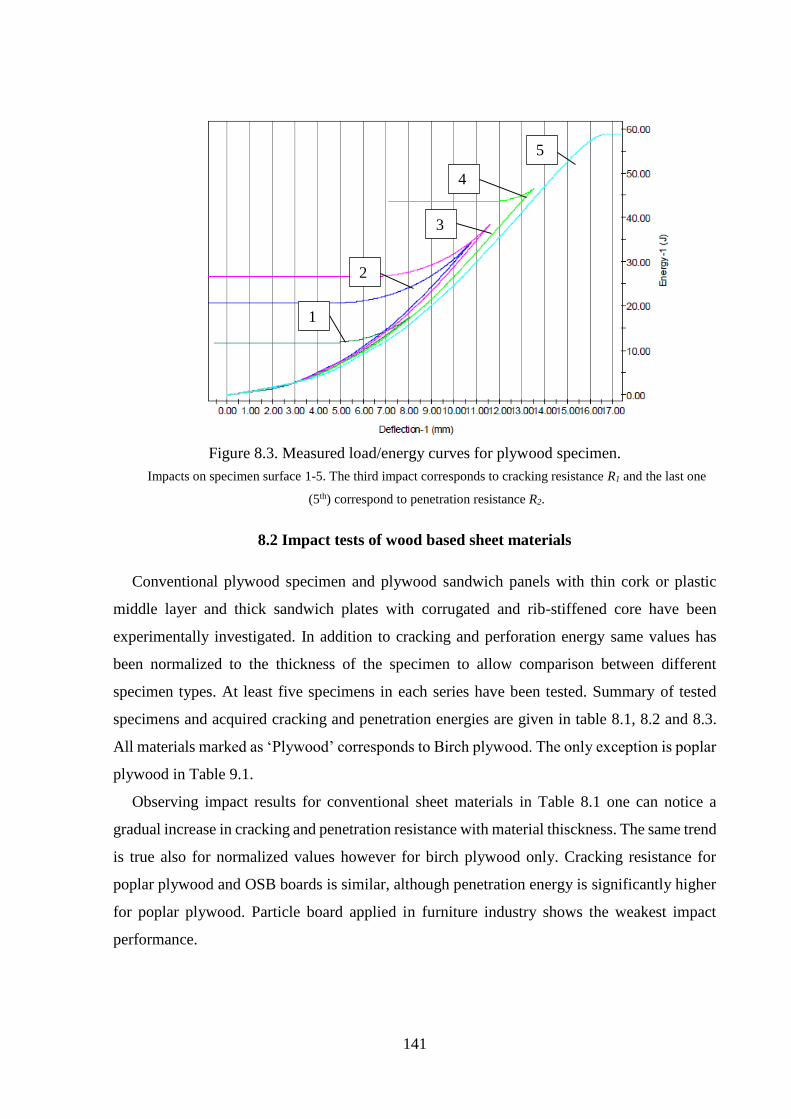
141
Figure 8.3. Measured load/energy curves for plywood specimen.
Impacts on specimen surface 1-5. The third impact corresponds to cracking resistance R1 and the last one
(5th) correspond to penetration resistance R2.
8.2 Impact tests of wood based sheet materials
Conventional plywood specimen and plywood sandwich panels with thin cork or plastic
middle layer and thick sandwich plates with corrugated and rib-stiffened core have been
experimentally investigated. In addition to cracking and perforation energy same values has
been normalized to the thickness of the specimen to allow comparison between different
specimen types. At least five specimens in each series have been tested. Summary of tested
specimens and acquired cracking and penetration energies are given in table 8.1, 8.2 and 8.3.
All materials marked as ‘Plywood’ corresponds to Birch plywood. The only exception is poplar
plywood in Table 9.1.
Observing impact results for conventional sheet materials in Table 8.1 one can notice a
gradual increase in cracking and penetration resistance with material thisckness. The same trend
is true also for normalized values however for birch plywood only. Cracking resistance for
poplar plywood and OSB boards is similar, although penetration energy is significantly higher
for poplar plywood. Particle board applied in furniture industry shows the weakest impact
performance.
2
3
4
5
1

142
Table 8.1. List of investigated plywood reference panels and commercially available strand
board and chipboard
Material Number
of layers
Thickness,
mm
Cracking
resistance
R1, J
Perforation
resistance
R2, J
Cracking
resistanc
e R1,
J/mm
Perforation
resistance
R2, J/mm
Plywood 5 6.5 14.65 22.96 2.25 3.53
Plywood 7 9.5 20.67 43.38 2.18 4.57
Plywood 9 12 31.28 48.33 2.61 4.03
Plywood 13 18 43.19 84.46 2.40 4.69
Plywood 17 23 85.05 105.54 3.70 4.59
Plywood 19 27 88.59 141.31 3.28 5.23
Plywood 21 30 109.55 160.25 3.65 5.34
Plywood 29 40 146.35 265.68 3.66 6.64
Plywood 35 50 255.92 326.96 5.12 6.54
Poplar plywood 7 9 11.47 24.13 1.27 2.68
Poplar plywood 13 18 15.77 62.24 0.88 3.46
Poplar plywood 15 21 23.02 57.39 1.10 2.73
OSB 1 8 6.03 9.81 0.75 1.23
OSB 1 12 10.12 15.92 0.84 1.33
OSB 1 15 12.4 17.92 0.83 1.19
OSB 1 22 17.2 24.08 0.78 1.09
Particle board 1 16 6.9 12.39 0.43 0.77
Graphical representation of the normalised cracking and penetration energy is given in
Figure 8.4. Birch plywood dominate over other types of wood based sheet materials.
Typical impact failure for OSB and Particleboard is shown in Figure 8.5 (conventional
plywood in Figure 8.6). Separation of the strand is visible for OSB specimen on the back side.
Particle board has brittle fracture around the impact zone where separate pieces disintegrated
in a circular pattern.

143
Figure 8.4 Caracking and penetration energy of plywood, OSB and particle board specimens.
Figure 8.5 Damaged areas for OSB and particle board.
Solid plywood specimen in Figure 8.6 has rupture of the outer fibres on the front side —
localized at the indentation point. Circular stain around hole indicates that impact head has
0
1
2
3
4
5
6
0 10 20 30 40 50
Ene
rgy
R1
, J/m
m
Board thickness, mm
Plywood(Birch)
Plywood(poplar)
OSB
Particle board
0
1
2
3
4
5
6
7
0 10 20 30 40 50
Ene
rgy
R2
, J/m
m
Board thickness, mm
Plywood(Birch)
Plywood(Poplar)
OSB
Particle board

144
reached depth limit of 12.5 mm corresponding to penetration energy R2. On the rear side of the
specimen, outer fibre failure is visible in wider area comparing to the front.
Figure 8.6. Damaged areas for plywood specimens.
8.3 Impact of plywood specimens with thin middle layer
Results for specimens with thin middle layer are summarized in Table 8.2. Four types inner
layer has been examined — cork, cork mixed with rubber fraction, high-density polymer layer
and separate strips of 2-component polymer glue. A number of layers column characterizes a
number of plywood layers on both sides from the middle layer. Illustration of core type for
tested specimens is given in Figure 8.7. A summarized result of cracking (R1) and penetration
(R2) energy is given in Figure 8.9. Specimens with clear cork core generally have about 20 %
higher cracking resistance comparing other core types in Table 8.2. Cracking resistance for all
specimens are close to analogue values of similar thickness plywood, however, penetration
energy is significantly higher (alt lest 2-fold) comparing with plywood boards.

145
Table 8.2. Cross-sections of the layered plates is provided in Figure 9.7.
Material
Num-
ber of
layers
Thickness
mm
Cracking
resistance
R1, J
Perfora-
tion
resistance
R2, J
Cracking
resistanc
e R1,
J/mm
Perfo-
ration
resistance
R2, J/mm
Plywood+Cork
(ACM40) 3/1/3 11 21.57 127.17 1.96 11.56
Plywood+Cork
(ACM40) 5/1/5 16.6 40.68 195.20 2.45 11.76
Plywood+Cork
(ACM40) 7/1/7 21.7 59.71 273.11 2.75 12.59
Plywood+Cork
(ACM17) 5/1/5 15.7 29.31 188.96 1.87 12.04
Plywood+Cork
(ACM17) 7/1/7 20.9 48.77 290.69 2.33 13.91
Plywood+Cork
(ACM15) 5/1/5 15.7 23.57 150.95 1.50 9.61
Plywood + IF
Heavy Layer 2F50 5/1/5 16.1 29.66 192.93 1.84 11.98
Plywood + Tenax 2-
component polymer
strips
5/1/5 15.7 28.03 176.16 1.79 11.22
Figure 8.7. Side view of plywood specimens with thin middle layer.
Obtained results suggest that thin-elastic middle layer reduces the stiffness of the specimen
and part of the energy is absorbed due elastic bending of the specimen. Failure modes for these
kinds of specimens are similar to plywood in Figure 8.6.

146
Figure 8.8 Impact energy of plywood specimens with middle layer.
8.4 Impact of plywood sandwich panels
Sandwich panel results are summarized in Table 8.3. Sandwich panels with foam core,
vertical stiffeners and corrugated thermoplastic GF/PP core. The main task is a comparison of
high thickness sandwich panels with different core configurations. In contrast, to all previous
impact tests, high-thickness sandwich panels do not have cracking resistance values. Specimens
reach perforation energy limit before back side fracture occurs. Impact resistance of specimen
is heavily dependent on impact position. Much less energy is needed to perforate specimen skin
between stiffeners comparing to impact directly on stiffener. Thus, both cases were tested. The
impact between stiffeners is marked with (a) and a direct hit of the stiffener with (b).
Normalized impact energy for various core types is displayed as a bar chart in Figure 8.10.
It is clearly noticeable that difference between the impact on stiffener and between stiffeners
varies at least twice. Another trend is doubled penetration energy between stiffeners for rib-
stiffened sandwich-specimens with core foam filler. Panels with corrugated core have similar
performance as rib-stiffened panels with foam filler. It should be pointed that corrugated core
has several advantages over all-plywood panels. Firstly overall density is significantly lower
due 5-layer surfaces and thin core wall. The average density of panels with the corrugated core
is 230 kg/m3 comparing to 325 kg/m3 for vertical stiffeners and foam. Secondly corrugated core
has a wider contact area with specimen surface (20 mm to 9 mm) and chance to hit stiffener is
higher than in the case of vertical stiffeners. Impact damage for sandwich panels with
0,0
0,5
1,0
1,5
2,0
2,5
3,0
10 15 20 25
Ene
rgy
R1
, J/m
m
Board thickness, mm
Plywood+Cork(ACM40)
Plywood+Cork(ACM17)
Plywood+Cork(ACM15)
Plywood + Isoform 2F50
Plywood + Tenax polymer strips
0
2
4
6
8
10
12
14
16
10 15 20 25En
erg
y R
2, J
/mm
Board thickness, mm
Plywood+Cork(ACM40)
Plywood+Cork(ACM17)
Plywood+Cork(ACM15)
Plywood + Isoform 2F50
Plywood + Tenax polymer strips

147
corrugated GF/PP core is shown in Figure 8.10. In all cases surface is completely penetrated by
impact head. Also, a patch of outer fibres in the impact zone is completely disintegrated
Table 8.3. Summary of acquired results for the specimens with thin middle layer.
Material Number
of layers
Thickness,
mm
Cracking
resistance
R1, J
Perforation
resistance
R2, J
Perforation
resistance
R2, J/mm
Plywood+ PU foam 5/1/5 28 — 25.12 0.90
Plywood+ PU foam 5/1/5 28 — 48.88 1.75
Plywood+ PU foam 5/1/5 28 — 34.04 1.22
Plywood + GF/PP
corrugated core (a) 5/1/5 60 — 76.83 1.28
Plywood + GF/PP
corrugated core (b) 5/1/5 60 — 34.38 0.57
Plywood + I-type
stiffeners (a) 5/1/5 65 — 68.52 1.05
Plywood + I-type
stiffeners (b) 5/1/5 65 — 21.27 0.33
Plywood + I-type
stiffeners + foam (a) 7/1/7 65 — 86.6 1.33
Plywood + I-type
stiffeners + foam (b) 7/1/7 65 — 43.01 0.66
Figure 8.9. Penetration resistance for various thickness plywood and sandwich panels
Inside view of the panel with the corrugated core is shown in Figure 8.11. Specimen has
been subjected to impact damage from both sides. Largest residual damage is visible for after
0,00
0,20
0,40
0,60
0,80
1,00
1,20
1,40
1,60
Plywood +GF/PP
corrugated core(a)
Plywood +GF/PP
corrugated core(b)
Plywood + I-type stiffeners
(a)
Plywood + I-type stiffeners
(b)
Plywood + I-type stiffeners
+ foam (a)
Plywood + I-type stiffeners
+ foam (b)
Ene
rgy
R2
, J/m
m

148
impact between stiffeners. On the both surfaces rupture of the thermoplastic composite layer is
clearly visible. It is additional evidence of the strong bond between wood fibres and composite.
Figure 8.10. Top view of impact damage of sandwich panels with corrugated core.
Figure 8.11. Inside view of the corrugated core sandwich panel.

149
Top view of tested sandwich panels with the rib-stiffened core is given in Figure 8.12 and
inside view in Figure 8.13. Observing inside view in Figure 8.13 it is noticeable that impact
damage between stiffeners is localized between two nearby stiffeners.
Figure 8.12. Top view of tested sandwich panels with vertical stiffeners.
Figure 8.13. Inside view of the sandwich panel.

150
Conclusions
Within current thesis it has been confirmed that plywood sandwich panels has enhanced
multifunctional properties (as heat and vibration insulation and impact absorption) comparing
to conventional plywood. In addition these properties could be tailored with developed design
methodology. Based on the statistically credible number of performed experimental tests,
numerical modelling and optimisation a set of conclusions have been drawn:
1. Although mechanical properties of the wood veneer shows significant scatter due to
processing factors, acquired properties are still applicable for accurate mechanical
simulation of plywood in the range from 3 to 35 plies (full spectre of conventional
plywood thicknesses).
2. The method for design of equivalent stiffness lightweight sandwich panels has been
developed taking industrial plywood boards as a reference. The method is based on high
fidelity numerical model, experimental validation and parametrical optimisation.
Practical approbation has been done by implementing optimization results in industrial
production trials by JSC “Latvijas Finieris” where sandwich panel with vertical stiffeners
has been produced to suit the requirements of scaffolding deck with 3 m length.
3. The method based on Pareto optimality approach could be applied for evaluating the
potentially most efficient sandwich panel designs from perspective of relative stiffness,
mass and thermal conductivity. It is also a valuable tool to compare core topologies.
Verification confirms that method allows to design fully stressed structures up to failure
state.
4. Novel sandwich panels with plywood faces and corrugated thermoplastic core has been
prototyped for the first time in one-shot manufacturing technology. Characterisation of
mechanical properties and impact resistance has been performed. Results of optimisation
and experimental tests suggest that new sandwich panels have significantly better
mechanical performance/weight ratio comparing to single material panels with stiffener
or corrugated core. It is possible to substitute solid plywood with the same thickness
sandwich panels and achieve 20 % weight saving in bending load cases alone.

151
5. Influence of three different core types on multifunctional properties of the sandwich
panels has been outlined:
i) Foam core filler reduces thermal conductivity to 0.05-0.07 W/(m·K) comparing
to 0.12 W/(m·K) for conventional plywood
ii) Plywood sandwich panels have a potential to improve vibration damping. Due to
lower stiffness of rib stiffened panels loss factor is increased by 30 % comparing
with conventional plywood.
iii) Impact resistance of sandwich panels depends on punch location and skin
thickness. Foam core filler or skin reinforced with the layer of thermoplastic
composite improve penetration energy by 40-50 % comparing to plain rib-
stiffened sandwich panel

152
References
1. Wood handbook. Forest Product Lab. Madison, USA, 2010.
2. EN 635-2:1995 Plywood - Classification by Surface Appearance. European Committee
for Standardization (CEN), Brussels, 1995
3. Ferguson I., La Fontaine B., Vinden P., Bren L., Hateley R., Hermesec B., Environmental
Properties of Timber. Research paper commisioned by the FWPRDC, 1996
4. Tissell J.R. Wood Structural panel shear walls. Report 154. APA- The Engineered Wood
Association, 2004
5. EN 717:1995 Wood-based panels. Determination of formaldehyde release. Formaldehyde
emission by the chamber method, European Committee for Standardization (CEN),
Brussels, 1995
6. Handbook of Finnish Plywood ,Finnish Forest Industries Federation, Finland, 2007
7. Agriculture Handbook No. 72, Forest Product Lab. Madison, USA, 1995.
8. Lee M .S. Handbook of Composite Reinforcements. John Willey & Sons, 1992. pp 678-
680
9. Van den Bulcke J., Van Acker J., De Smet, J. An experimental set-up for real-time
continuous moisture measurements of plywood exposed to outdoor climate // Building
and Environment, vol. 44, no. 12, 2009, pp. 2368-2377.
10. Rapp A.O., Peek R.D., Sailer M. Modelling the moisture induced risk of decay for treated
and untreated wood above ground // Holzforschung vol 54, 2000, 111-118.
11. Morris P.I., Winandy J.E. 2002. Limiting conditions for decay in wood systems. The
International Research Group on Wood Preservation, Cardiff, South Wales, 2002, pp 1-
11.
12. Zdravković V., Lovrić A., Stanković B. Dimensional stability of plywood panels made
from thermally modified poplar veneers in the conditions of variable air humidity // Drvna
Industrija, vol. 64, no. 3, 2013, pp. 175-181.
13. [13] EN 310:1993 Wood-based panels. Determination of modulus of elasticity in bending
and of bending strength. European Committee for Standardization (CEN), Brussels, 1993
14. ASTM D3043 Standard Test Methods for Structural Panels in Flexure. ASTM
International Designation Committee, 2011
15. Plywood handbook, AS Latvijas Finieris, Riga, 2010
16. TEBOPOPLAR product description http://www.groupe-thebault.com/TEBOPOPLAR-
EXTERIEUR,266.html?lang = en
17. TEBOPIN-STANDARD product description
http://www.groupe-thebault.com/TEBOPIN-STANDARD.html?lang = en
18. TEBOPLY-OKOUME-EXTERIEUR product description
http://www.groupe-thebault.com/TEBOPLY-OKOUME-EXTERIEUR.html
19. Ecoply specification& installation guide. CHH Woodproducts, 2014
20. Siim K., Kask R., Lille H., Täkker, E. Study of physical and mechanical properties of
birch plywood depending on moisture content // Proceedings of the International
Conference of DAAAM Baltic "Industrial Engineering 2012, pp. 735.

153
21. Aydin I., Colakoglu G., Colak S., Demirkir, C. Effects of moisture content on
formaldehyde emission and mechanical properties of plywood // Building and
Environment, vol. 41, no. 10, 2006, pp. 1311-1316.
22. Bekhta P., Hi0ziroglu S., Shepelyuk, O. Properties of plywood manufactured from
compressed veneer as building material, Materials and Design, vol. 30, no. 4,2009, pp.
947-953.
23. Bekhta P., Niemz P., Sedliacik J. Effect of pre-pressing of veneer on the glueability and
properties of veneer-based products // European Journal of Wood and Wood Products,
vol. 70, no. 1-3, 2012, pp. 99-106.
24. Anwar U.M.K., Zaidon A., Paridah M.T., Razak, W. The potential of utilising bamboo
culm (Gigantochloa scortechinii) in the production of structural plywood// Journal of
Bamboo and Rattan, vol. 3, no. 4,2004, pp. 393-400.
25. Shinoj S., Visvanathan R., Panigrahi S., Kochubabu, M. Oil palm fiber (OPF) and its
composites: A review // Industrial Crops and Products, vol. 33, no. 1,2011, pp. 7-22.
26. Candan Z. and Akbulut T.Nano-engineered plywood panels: Performance properties //
Composites Part B: Engineering, 64, 2014, pp. 155-161.
27. Gangi M., Tabarsa T., Sepahvand S., Asghari. Reduction of formaldehyde emission from
plywood // Journal of Adhesion Science and Technology, vol. 27, no. 13, 2013 pp. 1407-
1417.
28. Jang, Y., Li K. An all-natural for bonding wood // JAOCS, Journal of the American Oil
Chemists Society, vol. 92, no. 3, 2015, pp. 431-438.
29. Fang L., Chang L., Guo W., Chen, Y., Wang, Z. Manufacture of environmentally friendly
plywood bonded with plastic film// Forest Products Journal, vol. 63, no. 7-8, 2013, pp.
283-287.
30. Zhang S., Song F., Gao, Q., Li J. 2010, Preparation and properties of low formaldehyde
emission plywood with flame resistance // International Conference on Manufacturing
Engineering and Automation, ICMEA 2010, Volume 139-141, 2010, Pages 649-652.
31. Karshenas S., Feely J.P. Structural properties of used plywood // Construction and
Building Materials, vol. 10, no. 8, 1996, pp. 553-563.
32. Van den Bulcke J., De Windt I., Defoirdt N., De Smet J., Van Acker J. "Moisture
dynamics and fungal susceptibility of plywood // International Biodeterioration and
Biodegradation, vol. 65, no. 5, 2011, pp. 708-716.
33. Viitanen H. The durability and decay resistance of coated plywood, thermowood® and
wood plastic composites (WPC). VTT Tiedotteita - Valtion Teknillinen Tutkimuskeskus,
Issue 2558, 2010, Pages 87-100
34. Candan Z., Büyüksari U., Korkut S., Unsal O., Çakicier N. Wettability and surface
roughness of thermally modified plywood panels// Industrial Crops and Products, vol. 36,
no. 1,2012, pp. 434-436.
35. Aro M.D., Brashaw B.K., Donahue P.K. Mechanical and physical properties of thermally
modified plywood and oriented strand board panels// Forest Products Journal, vol. 64, no.
7-8,2014, pp. 281-289.

154
36. Biblis E.J. Effect of weathering on surface quality and structural properties of six species
of untreated commer-cial plywood siding after 6 years of exposure in Alabama// Forest
Products Journal. vol 50(5), 2000, pp 47–50.
37. Zenkert D. The Handbook of Sandwich Construction. London, EMAS Publishing, 1997.
38. Gay D., Hoa S. V. Composite materials. Design and applications. CRC press, 2007.
39. Ashby M.F. Hybrid materials to expand the boundaries of material-property space //
Journal of the American Ceramic Society, vol 94, 2011, pp. 3-14
40. Vinson J. R. Sandwich structures: past, present and future. // Sandwich Structures 7:
Advancing with Sandwich Structures and Materials. Proceedings of the 7th International
Conference on Sandwich Structures, Aalborg, Denmark, 2005, p. 3-12.
41. Fojtl L., Rusnáková S., Žaludek M., Rusnák V., Čapka A. 2015, Evaluation of
mechanical performance and failure modes of sandwich structures for transport industry
// EAN 2015 - 53rd Conference on Experimental Stress Analysis,2015, pp. 94.
42. Ning H., Janowski G.M., Vaidya U.K. & Husman G. 2007 // Thermoplastic sandwich
structure design and manufacturing for the body panel of mass transit vehicle", Composite
Structures, vol. 80, no. 1, pp. 82-91.
43. Kelly A. Concise encyclopedia of composite materials, Pergamon, 1995.
44. Ashby F. M. Material’s selection in mechanical design, Elsevier Butterworth-Heinemann,
2004.
45. Handbook of Polymers, Elastomers and Composites, edited by C.A. Harper, 3rd ed. Mc-
Graw-Hill, New York, USA, 1996.
46. Kollmann F., Kuenzi E., Stamm A. Principles of Wood Science and Technology, Vol.2
Wood based Materials, Berlin: Springer-Verlag, 1968
47. EN 338 Structural timber- Strength classes, European Committee for Standardization
(CEN), Brussels, 2009
48. Boidig J., Jayne B.A. Mechanics of Wood and Wood Composites. Van Nostrand Reinholt
Company, New York, USA, 1982
49. Johnson A.F., Sims G.D. "Mechanical properties and design of sandwich materials//
Composites, vol. 17, no. 4, 1986, pp. 321-328.
50. Bitzer T.N. Honeycomb Technology: Materials, Design, Manufacturing, Applications
and Testing. Chapman & Hall, London, 1997.
51. Pohl A. Strengthened corrugated paper honeycomb for application in structural elements
// Doctoral thesis. Universität Wien, 2009.
52. Witkiewicz W., Zieliński A. Properties of the polyurethane (PU) light foams // Advances
in material science, vol. 6, no 2, 2006, pp. 35-51.
53. Rakow J.F., Waas A.M. Size effects and the shear response of aluminum foam//
Mechanics of Materials, vol. 37, no. 1, 2005, pp. 69-82.
54. Gnip I., Vejelis S., Keršulis V., Vaitkus S. Strength and deformability of mineral wool
slabs under short-term compressive, tensile and shear loads// Construction and Building
Materials, vol. 24, no. 11, 2010, pp. 2124-2134.
55. Structural Sandwich composites, MIL-HDBK-23A, Government printing Office,
Washington D.C., USA, 1968

155
56. Nakamura H., Umeki K., Nomoto K. 1999, "Development of sandwich panel with CFRP
honeycomb core for HSCT// International SAMPE Symposium and Exhibition
(Proceedings), 1999, pp. 1507-1517.
57. Tuwair H., Hopkins M., Volz J., ElGawady M.A., Mohamed M., Chandrashekhara K.,
Birman V. Evaluation of sandwich panels with various polyurethane foam-cores and
ribs// Composites Part B: Engineering, vol. 79, 2015,pp. 262-276.
58. Dong, L., Wadley, H. Mechanical properties of carbon fiber composite octet-truss lattice
structures//Composites Science and Technology, vol. 119, 2015, pp. 26-33.
59. Yang F., Jin, Y., Qian X. Simulation of thermal conductivity of sandwich composite
//2012 International Conference on Mechatronics and Control Engineering, ICMCE
2012; Guangzhou; China; Volume 278-280, 2013, pp 523-526.
60. Bergman T.L., Lavine A.S., Incropera F. P., Dewitt D.P. Fundamentals of Heat and Mass
Transfer, USA, John Wiley & Sons, 2011
61. Moran, M. J., and H. N. Shapiro, Fundamentals of Engineering Thermodynamics, Wiley,
Hoboken, NJ, 2004.
62. Cheng X., Wei K., He R., Pei Y., Fang, D. The equivalent thermal conductivity of lattice
core sandwich structure: A predictive model//Applied Thermal Engineering, vol. 93,
2016, pp. 236-243.
63. Ranut P. On the effective thermal conductivity of aluminum metal foams: Review and
improvement of the available empirical and analytical models. Applied Thermal
Engineering 1-29 (in press).
64. Sihn S., Ganguli S., Anderson D.P., Roy, A.K. Enhancement of through-thickness
thermal conductivity of sandwich construction using carbon foam// Composites Science
and Technology, vol. 72, no. 7, 2012, pp. 767-773.
65. Xie G., Wang Q., Sunden B., Zhang W. Thermomechanical optimization of lightweight
thermal protection system under aerodynamic heating// Applied Thermal Engineering,
vol. 59, no. 1-2, 2013, pp. 425-434.
66. Martinez O.A., Sankar B.V., Haftka R.T., Bapanapalli S.K., Blosser M.L.
Micromechanical analysis of composite corrugated-core sandwich panels for integral
thermal protection systems // AIAA Journal, vol. 45, no. 9, 2007, pp. 2323-2336.
67. Chai G.B., Zhu S. A review of low-velocity impact on sandwich structures// Proceedings
of the Institution of Mechanical Engineers, Part L: Journal of Materials: Design and
Applications, vol. 225, no. 4, 2011, pp. 207-230.
68. Xue Z., Hutchinson J.W. Preliminary assessment of sandwich plates subject to blast
loads// International Journal of Mechanical Sciences, vol 45, 200.3, pp. 687-705.
69. Xue Z., Hutchinson J.W. A comparative study of impulse-resistant metal sandwich
plates// International Journal of Impact Engineering, vol 30, 2004, pp. 1283-1305.
70. Zike S., Kalnins K. Impact Properties of Birch Veneer and Flax Fabric Bio-Composite
//Cilvēks. Vide. Tehnoloģijas: 15. Starptautiskā studentu zinātniski praktiskā konference,
Latvia, Rēzekne, 27-27 April, 2011, pp.270-278.
71. Zike S., Kalnins K. Enhanced Impact Absorption Properties of Plywood// Civil
Engineering '11 : 3rd International Scientific Conference : Proceedings, Latvia, Jelgava,
12-13 May, 2011, pp.125-130.

156
72. Atas C., Sevim C. On the impact response of sandwich composites with cores of balsa
wood and PVC foam// Composite Structures, vol. 93, no. 1, 2010, pp. 40-48.
73. Abot J.L., Yasmin A., Daniel I.M. Impact behavior of sandwich beams with various
composite facesheets and balsa wood core// American Society of Mechanical Engineers,
Applied Mechanics Division, AMD, Volume 247, 2001, Pages 55-69.
74. Zhong W., Song S., Xie R., Huang X., Chen G. Numerical simulation on dynamic cushion
properties of spruce wood in three kinds of impact directions // 2010 International
Conference on Frontiers of Manufacturing and Design Science, ICFMD2010;
Chongqing; China, 2011, Pages 2321-2325.
75. Haldar S., Bruck H.A. Characterization of dynamic damage mechanisms in Palmetto
wood as biological inspiration for impact resistant polymer composites// Mechanics of
Materials, vol. 57, 2013, pp. 97-108.
76. ISOSANDWICH datasheet http://www.termoisolanti.com/en/products/thermal-
insulation/panel-structure-thermal-insulation/isosandwich.php
77. Sandwich panels with carboard core for furniture applications http://www.hunger-
moebel.de
78. Berger J. Patent US20090307996. Building Board or the Like, Its Manufacture and Use,
2006
79. Iejavs J., Spulle U. Jakovlevs V. Evaluation of bending properties of three layer cellular
wood panels using six different structural models // Research for Rural Development,
2001 , pp. 85-90.
80. Wood firbe- cement insulation sandwich panels - description http://www.celenit.com/
81. Wood based sandwich-type door panels. Datasheet. http://www.moralt-ag.co.uk/
82. General description of Sing-core sandwich panels http://singcore.com/
83. Kerto Ripa LVL Floor Elements http://www.metsawood.com/uk/Applications/Building-
and-Construction/Flooring-Solutions/Kerto-Ripa
84. [84] ETA-07/0029 Wood-based composite slab element for structural purposes. European
Technical Approval, 2007
85. Hunt J.F. 3D Engineered Fiberboard: Finite Element Analysis of a New Building Product
//2004 International ANSYS Conference. Pittsburg, PA, 2004 May, pp. 24-26.
86. ASTM D1037 Standard Test Methods for Evaluating Properties of Wood-Base Fiber and
Particle Panel Materials. ASTM International Designation Committee, 2012
87. Kawasaki T., Zhang M., Kawai S. Manufacture and properties of ultra-low-density
fibreboard// Journal of Wood Science vol. 44, 1998, pp354–360.
88. Kawasaki T., Hwang K., Komatsu K et al (2003) In-plane shear prop-erties of the wood-
based sandwich panel as a small shear wall evaluated by the shear test method using tie-
rods// Journal of Wood Science vol. 49 no. 3, pp. 199–209.
89. Kawasaki T, Zhang M, Wang Q, Komatsu K, Kawai S (2006) Elastic moduli and stiffness
optimization in four-point bending of wood-based sandwich panel for use as structural
insulated walls and floors// Journal of Wood Science vol. 52 no. 4. pp. 302–310.
90. Fernandez-Cabo J.L., Majano-Majano A., San-Salvador Ageo L., Ávila-Nieto M.
Development of a novel façade sandwich panel with low-density wood fibres core and

157
wood-based panels as faces// European Journal of Wood and Wood Products, vol. 69, no.
3, 2011, pp. 459-470.
91. Kooistra G.W., Deshpande V.S., Wadley, H.N.G. Compressive behavior of age
hardenable tetrahedral lattice truss structures made from aluminium, Acta Materialia, vol.
52, no. 14, 2004, pp. 4229-4237.
92. Finnegan K., Kooistra G., Wadley H.N.G., Deshpande V.S. The compressive response of
carbon fiber composite pyramidal truss sandwich cores// International Journal of
Materials Research, vol. 98, no. 12, 2007, pp. 1264-1272.
93. [93] Jin M., Hu Y., Wang B. Compressive and bending behaviours of wood-based two-
dimensional lattice truss core sandwich structures// Composite Structures, vol. 124, 2015,
pp. 337-344.
94. Srinivasan N., Bhattacharyya D., Jayaraman K. Profile production in muti-veneer sheets
by continuous roll forming// Holzforschung, vol. 62, 2007, pp. 453–460
95. Banerjee S., Bhattacharyya D., 2011: Optimal design of sandwich panels made of wood
veneer hollow cores. Composites Science and Technology, vol 71(4), 2011, pp. 425-432.
96. Negro F., Cremonini C., Zanuttini R., Properzi M., Pichelin F. A new wood-based
lightweight composite for boatbuilding // Wood Research vol. 56 no. 2, 2011, pp 257-66.
97. Sliseris, J., Rocens, K. Optimal design of composite plates with discrete variable
stiffness// Composite Structures, vol. 98, 2013, pp. 15-23.
98. Šliseris, J., Rocens K. Optimization of multispan ribbed plywood plate macrostructure
for multiple load cases// Journal of Civil Engineering and Management, vol. 19, no. 5,
2013, pp. 696-704.
99. Aicher S., Stritzke C., Klöck, W. Keel-web element - Novel wood-based lightweight
element for wide spans// WCTE 2014 - World Conference on Timber Engineering,
Proceedings, 2014, pp 1-10.
100. Zudrags K. Plywood panels with improved specific strength. Doctoral thesis. Latvia
University of Agriculture, Jelgava, Latvia, 2010.
101. Kalnins K., Jekabsons G., Zudrags K., Beitlers, R. Metamodels in optimisation of
plywood sandwich panels// Shell Structures: Theory and Applications, CRC press /Taylor
& Francis Group, London, vol. 2. 2009, pp. 291-294.
102. Rao S.S Engineering optimisation. John Willey & Sons, 1996.
103. Ehrgott M. Multicriteria optimization. Berlin: Springer, 2005.
104. Hwang C.L., Masud A.S.M. Multiple objective decision making, methods and
applications: a state-of-the-art survey. Springer-Verlag, 1979.
105. Miettinen K. Nonlinear Multiobjective Optimization. Springer, 1999.
106. Andersson J. Multiobjective Optimization in Engineering Design, PhD thesis, Linköpings
universitet, Sweden, 2001.
107. ANSYS Version 11. User Manual, Papenburg, USA, 2009.
108. ABAQUS/Standard User's Manual. Version 6.9.1 ABAQUS. Inc. 166 Valley Street
Providence. RI 02909. USA, 2009
109. Dinwoodie J.M. Timber: It’s Nature and Behaviour. (second ed.)E & FN Spon, New
York, 2000

158
110. Wu Q., Cai Z., Lee JN. Tensile and dimensional properties of wood strands made from
plantation southern pine lumber// Forest Products Journal vol. 55 no. 2, 2005. pp 87–92.
111. Wilczyński M., Warmbier K. Elastic moduli of veneers in pine and beech plywood//
Drewno, vol. 188, 2012, pp. 47-56.
112. NF B 51-123, Wood-based panels, Détermination du module d'élasticité en traction et de
la résistance à la traction parallèle aux faces, 1987
113. TWINTEX T PP product description
http://www.ocvreinforcements.com/pdf/products/Twintex_TPP_09_2008_Rev0.pdf
114. EN ISO 527-4 Plastics -- Determination of tensile properties -- Part 4: Test conditions for
isotropic and orthotropic fibre-reinforced plastic composites. European Committee for
Standardization (CEN), Brussels, 2012
115. EN 12664:2001 thermal performance of building materials and products - Determination
of thermal resistance by means of guarded hot plate and heat flow meter methods - Dry
and moist products with medium and low thermal resistance. European Committee for
Standardization (CEN), Brussels, 2001
116. User manual of Linseis HFM 300
http://www.linseis.com/fileadmin/user_upload/Brochures/Diffusivity/LINSEIS_HFM_
Heat_Flow_Meter.pdf
117. Carvill J. Mechanical Engineer's Data Handbook. Butterworth-Heinemann. 1994
118. EN 319 Particleboards and fiberboards- Determination of tensile strength perpendicular
to the plane of the board. European Committee for Standardization (CEN), Brussels, 1993
119. Aydin I., Colakoglu G. Variations in bending strength and modulus of elasticity of spruce
and alder plywood after steaming and high temperature drying// Mechanics of Advanced
Materials and Structures, vol. 15, no. 5, 2008, pp. 371-374.
120. Labans, E., Kalniņš, K., Ozoliņš, O. Experimental and Numerical Identification of
Veneers Mechanical Properties // Construction Science. Vol.11, 2010, pp.38-43. ISSN
1407-7329.
121. EN 789:2004. Timber structures. Test methods. Determination of mechanical properties
of wood based panels. European Committee for Standardization (CEN), Brussels, 2004
122. Allen H.G. Analysis and Design of Structural Sandwich Panels. Pergamon Press, Oxford,
1969.
123. Valdevit L, Wei Z, Mercer C, Zok F.W, Evans, A,G. Structural performance of near-
optimal sandwich panels with corrugated cores// International Journal of Solids
Structures, vol. 43 no. 16, 2006, pp. 4888-4905.
124. Wicks N, Hutchinson J, W. Performance of sandwich plates with truss cores // Mech
Mater, vol. 36 no. 8, 2004, pp. 739-51.
125. Rathbun H.J, Zok F.W, Evans A.G. “Strength optimization of metallic sandwich panels
subject to bending// International Journal of Solids and Structures, vol. 42 no. 26, 2005,
pp. 6643-6661.
126. Rawlings J.O. Applied Regression Analysis: A Research Tool, 2nd ed., Pacific Grove,
CA: Wadsworth & Brooks/Cole, 1998.
127. Jekabsons G. Adaptive Basis Function Construction: an approach for adaptive building
of sparse polynomial regression models// Machine Learning, 2010, pp. 127-156.

159
128. Pudil P., Novovicova J., and Kittler J. Floating search methods in feature selection//
Pattern Recognition Letters, vol 15, 1994, pp. 1119-1125.
129. Hurvich C. M., Tsai C.L. Regression and time series model selection in small samples//
Biometrika vol. 76, 1989, pp. 297-307.
130. Kljak J., Brezović M., 2007. Influence of plywood structure on sandwich panel properties:
Variability of veneer thickness ratio// Wood Research vol. 52 no.2, 2007, pp. 77-88.
131. Plettac SL 70/100 Facade Scaffolding. ALTRAD plettac assco GmbH, 2004
132. EN 12811 Temporary works equipment – Part 1. Scaffolds; Performance requirements
and general design. European Committee for Standardization (CEN), Brussels, 2003
133. MAPICC 3D general information http://mapicc3d.ensait.fr/
134. Pickett A.K., Fouinneteau M.R.C., Middendorf, P. Test and modelling of impact on
preloaded composite panel// Applied Composite Materials, vol. 16, no. 4, 2009, pp. 225-
244.
135. EN 1995-1-1 Eurocode 5, Design of Timber Structures-Part 1-1: General-Common Rules
and Rules for Buildings. European Committee for Standardization (CEN), Brussels, 2004
136. ASTM C393 Standard Test Method for Core Shear Properties of Sandwich Constructions
by Beam Flexure. ASTM International Designation Committee, 2011
137. The VIC-3D™ System http://www.correlatedsolutions.com/vic-3d/
138. Janíček P., Blažo M., Navrátil P., Návrat, T., Vosynek P. Accuracy testing of the DIC
optical measuring method the ARAMIS system by GOM// EAN 2011: 49th International
Scientific Conference on Experimental Stress Analysis, 2011, pp. 139.
139. Towse A, Potter K, Wisnom M.R. Adams R.D. Specimen size effects in the tensile failure
strain of an epoxy adhesive// Journal of Materials Science, vol. 33:17, 1998, pp. 4307-
4314.
140. Mackerle J. Finite element analyses in wood research: a bibliography// Wood Science and
Technology, vol. 39, 2005, pp. 579–600.
141. EN 408:2010 Timber structures – Structural timber and glued laminated timber –
Determination of some physical and mechanical properties. European Committee for
Standardization (CEN), Brussels, 2010
142. Aydincak I., Kayran A. An approach for the evaluation of effective elastic properties of
honeycomb cores by finite element analysis of sandwich panels// Journal of Sandwich
Structures and Materials, vol. 11 no. 5, 2009, pp. 385-408.
143. Qiao P., Fan W, Davalos J.F., Zou G. Homogenization and optimization of sinusoidal
honeycomb cores for transverse shear stiffness// Journal of Sandwich Structures and
Materials, vol. 10 no 5, pp. 385-412.
144. Kirpluks M., Cabulis U., Zeltins V., Stiebra L. Avots A.A. Rigid Polyurethane Foam
Thermal Insulation Protected with Mineral Intumescent Mat// AUTEX Research Journal,
vol. 14, no 4, 2014, pp. 259-269.
145. Chung, D.D.L. 2001, "Review: Materials for vibration damping", Journal of Materials
Science, vol. 36, no. 24, pp. 5733-5737.
146. Raghavan A., Cesnik C.E.S. 2007. Review of guided-wave structural health monitoring//
Shock and Vibration Digest, vol. 39, no. 2, 2007, pp 91-114.

160
147. Hufenbach W., Böhm R., Gude M., Berthel M., Hornig A., Ručevskis S., Andrich M. A
test device for damage characterisation of composites based on in situ computed
tomography, Composites Science and Technology, vol. 72, no. 12, 2012, pp. 1361-1367.
148. Rucevskis S., Wesolowsk, M. Identification of damage in a beam structure by using mode
shape curvature squares// Shock and Vibration, vol. 17, no. 4-5, 2010, pp. 601-610.
149. ASTM E756 Standard Test Method for Measuring Vibration-Damping Properties of
Materials, ASTM International Designation Committee, 2011
150. Won K., Chong S., Hong N.., Kang S., Byeon H.. Nondestructive evaluation of strength
performance for heat-treated wood using impact hammer & transducer// Journal of the
Korean Wood Science and Technology, vol. 41, no. 5, 2013, pp. 466-473.
151. ASTM E1876 Standard Test Method for Dynamic Young's Modulus, Shear Modulus, and
Poisson's Ratio by Impulse Excitation of Vibration, ASTM International Designation
Committee, 2009
152. NF B51-327 Plywood dynamic punching test, Francaise de Normalisation (NF), 1971

161
Apstiprinājums/Confirmation
Apstiprinu, ka esmu izstrādājis šo promocijas darbu, kas iesniegts izskatīšanai Rīgas
Tehniskajā universitātē inženierzinātņu doktora grāda iegūšanai. Promocijas darbs zinātniskā
grāda iegūšanai nav iesniegts nevienā citā universitātē.
I confirm that I have written this thesis and it is submitted for review in Riga Technical
University for acquiring the Doctoral degree in engineering sciences. The thesis is not submitted
in any other university for acquiring a scientific degree.
Edgars Labans.............................. Datums/Date: .............................