Re-Formulation and Cost Optimisation of One Component PU ...
96
Re-Formulation and Cost Optimisation of One Component PU Foams Ana Mafalda Félix Brilhante Dissertação para obtenção do Grau de Mestre em Engenharia Química Júri Presidente: Professor João Carlos Moura Bordado (DEQB) Orientador: Professor João Carlos Moura Bordado (DEQB) Mr. Aster de Schrijver (Altachem) Vogal: Professor António Boavida Correia Diogo (DEMAT) Outubro de 2008
-
Upload
khangminh22 -
Category
Documents
-
view
0 -
download
0
Transcript of Re-Formulation and Cost Optimisation of One Component PU ...

Re-Formulation and Cost Optimisation of
One Component PU Foams
Ana Mafalda Félix Brilhante
Dissertação para obtenção do Grau de Mestre em
Engenharia Química
Júri
Presidente: Professor João Carlos Moura Bordado (DEQB)
Orientador: Professor João Carlos Moura Bordado (DEQB)
Mr. Aster de Schrijver (Altachem)
Vogal: Professor António Boavida Correia Diogo (DEMAT)
Outubro de 2008

I
Acknowledgements
I would like to express my gratitude to Mr Aster De Schrijver not only for the opportunity he gave
me to develop my dissertation but also for helping to make this great adventure in my life
possible.
A special thanks to Professor João Bordado for making this work possible and for all the
support given during my last years in Instituto Superior Técnico.
I am also grateful to Cathy De Maertelaere for her availability, work and help.
To the Portuguese community in Gent: it was much easier with you!
To Pi for having made the distance so short.
And with all my love to my family all together for being truly together!
Bedankt. Obrigada.
If you can dream it, you can do it! (Walt Disney)
II
Resumo
O presente trabalho teve como principal objectivo o estudo de espumas de poliuretano de
um componente.
Com a crescente preocupação ambiental surgiu a necessidade de se usarem compostos
cada vez mais amigos do ambiente. O primeiro estudo consistiu em verificar se as formulações
com F134a, um agente de expansão com efeito negativo na camada de ozono, poderiam ser
substituídas por um novo desenvolvido pela Honeywell, o HBA-1, um gás com potencial de
deplecção de azoto zero e baixo potencial de aquecimento global.
A conclusão tirada foi que o gás pode ser substituído mas não sem antes se efectuar uma
reformulação da espuma.
O estudo seguinte foi efectuado pela particularidade de se realizar um teste apenas para
espumas de fixação, o teste da porta. A Soudal propôs uma avaliação entre uma espuma já
disponível no mercado e uma nova.
Dada a pouca informação disponibilizada, nomeadamente em relação à formulação, foram
efectuados testes de comparação podendo apenas concluir-se que a nova espuma obteve
resultados aceitáveis e mesmo superiores em relação à já disponível no mercado. Assim, é
possível substituir pela nova espuma de fixação.
O maior desafio deste trabalho foi relacionar e estudar as propriedades da espuma obtidas,
variáveis de resposta, com as variáveis de controlo disponíveis. A principal conclusão tirada foi
que a mudança numa variável de controlo tem consequência não só na variável de resposta
para a qual se destina mas também nas outras, uma vez que se está a quebrar um balanço
entre os vários reagentes usados. Assim, é necessário fazer um estudo minucioso de modo a
avaliar que reagentes têm de ser mudados em simultâneo para que as propriedades da
espuma melhorem globalmente.
Palavras-chave: espumas de poliuretano de um componente; agente de expansão; ambiente;
teste da porta; variáveis de resposta; variáveis de controlo.

III
Abstract
The main objective of this work was to study one component polyurethane foams.
With the growing environmental concerns, the need to use environmentally friendly
compounds is increasing. The first study consisted in verifying if the formulations with F134a, a
blowing agent with a negative effect on the ozone layer, could be replaced by a new one
developed by Honeywell, the HBA-1, a gas with zero ozone depletion potential and low global
warming potential.
The conclusion was that the gas could be replaced but not before a tuning up of the foam
was made.
The particularity of the following study is that a test was performed only for fixation foams,
the doortest. Soudal proposed an evaluation between a foam that was already available in the
market and a new one.
Due to the scarcity of the information available, in particular regarding the formulation,
comparison tests have been performed and the conclusion is that the new foam produced
acceptable and even better results than the one already available in the market. Therefore, it is
possible to replace it with the new fixation foam.
The biggest challenge of this work was to interconnect and to study the properties of the
foam obtained, the response variables, and the available control variables. The main conclusion
was that the change in one control variable has consequences not only on the response
variable on which it was supposed to act, but also on the others, since it breaks the balance
between the various reagents used. Therefore, a thorough study is necessary to evaluate which
reagents must be simultaneously changed in order to improve the properties of the foam
overall.
Key-words: one component polyurethanes foam; blowing agent; environment; doortest;
response variables; control variables.

IV
Index
Acknowledgements...................................................................................................................... I
Resumo ........................................................................................................................................ II
Abstract ....................................................................................................................................... III
Index ............................................................................................................................................ IV
Index of Figures..........................................................................................................................VI
Index of Tables .........................................................................................................................VIII
Abbreviations...............................................................................................................................X
1. Introduction......................................................................................................................... 1
2. Aim of this study................................................................................................................. 2
3. Literature overview............................................................................................................. 4
3.1. Polyurethanes .............................................................................................................. 4
3.2. Polyurethanes Foams .................................................................................................. 4
3.2.1. Flexible Foam...................................................................................................... 5
3.2.2. Rigid Foams ........................................................................................................ 5
3.2.3. Semi Rigid Foams ............................................................................................... 5
3.3. Basic PU chemistry...................................................................................................... 6
3.4. Chemicals used............................................................................................................ 9
3.4.1. Polyols ................................................................................................................. 9
3.4.2. Diisocyanates .................................................................................................... 10
3.4.3. Chain extenders ................................................................................................ 10
3.4.4. Additives ............................................................................................................ 11
3.5. OCF Foaming Process .............................................................................................. 13
3.6. Production .................................................................................................................. 13
3.6.1. One shot process .............................................................................................. 13
3.6.2. Quasiprepolymer process ................................................................................. 14
3.6.3. Prepolymer process .......................................................................................... 14
4. Materials and Methods..................................................................................................... 16
4.1. Reagents and Additives ............................................................................................. 16
4.2. Methods ..................................................................................................................... 16
4.2.1. Optimisation Process ........................................................................................ 16
4.2.2. OCF Benchmarking [10,18]............................................................................... 18
5. Check new gas HBA-1...................................................................................................... 29
5.1. Set-up......................................................................................................................... 29
5.2. Quick Test Results ..................................................................................................... 30
5.3. Discussion and Conclusion........................................................................................ 31
6. OCF Doorstand Report..................................................................................................... 32
6.1. Renaming of Cans ..................................................................................................... 32
6.2. Quick Test .................................................................................................................. 33

V
6.2.1. Discussion of Quick Test Results...................................................................... 34
6.3. AltaFoam Monitor....................................................................................................... 34
6.3.1. Discussion of AFM Results ............................................................................... 34
6.4. Physical Properties .................................................................................................... 34
6.4.1. Discussion of Physical properties ..................................................................... 35
6.5. Door Test ................................................................................................................... 35
6.6. DimStab ..................................................................................................................... 37
6.6.1. Discussion of dimstab results............................................................................ 38
6.7. Aging test ................................................................................................................... 38
6.7.1. Discussion of aging test results......................................................................... 38
6.8. Conclusion ................................................................................................................. 39
7. Developed work ................................................................................................................ 40
7.1. Re-formulation [13] .................................................................................................... 40
7.1.1. AEB3 Project ..................................................................................................... 40
7.2. Full Test of 6096 AEB3 .............................................................................................. 58
7.2.1. Pictures.............................................................................................................. 58
7.2.2. Physical Tests ................................................................................................... 59
7.2.3. AltaFoam Monitor .............................................................................................. 59
7.2.4. Discussion of results ......................................................................................... 59
7.3. Conclusion ................................................................................................................. 60
7.4. Brief Cost Optimisation [13] ....................................................................................... 62
8. Conclusion ........................................................................................................................ 63
9. References ........................................................................................................................ 64
10. Appendix ....................................................................................................................... 65
10.1. Appendix 1 – Quick Test of HBA1 and F134a formulations ...................................... 65
10.2. Appendix 2 – Quick Test of SoudaFoam Report ....................................................... 67
10.3. Appendix 3 - AFM of SoudaFoam Report.................................................................. 68
10.4. Appendix 4 – Physical tests of SoudaFoam Report .................................................. 73
10.5. Appendix 5 – Quick Test of AEB3 Project ................................................................. 76
10.6. Appendix 6 – Physical Tests of 6096 AEB3 .............................................................. 81
10.7. Appendix 7 – AFM of 6096 AEB3 .............................................................................. 83
VI
Index of Figures
Figure 3.1 - Schematic representation of polyurethanes structure. .............................................. 4
Figure 3.2 – Resonance structure of NCO group.......................................................................... 6
Figure 3.3 – Schematic representation of a urethane formation reaction mechanism. [7] ........... 6
Figure 3.4 – Reaction of an isocyanate with a primary amine giving urea. .................................. 7
Figure 3.5 – Reaction of an isocyanate with water resulting in amine and carbon dioxide. ......... 7
Figure 3.6 – Formation reaction of allophanate. ........................................................................... 8
Figure 3.7 – Formation reaction of biuret. ..................................................................................... 8
Figure 3.8 – Isocyanate reacting with a carboxylic acid resulting in an amide and CO2, with the
formation of an instable anhydride. ...................................................................................... 8
Figure 3.9 – Structure of a polyether polyol synthesized by propylene glycol with propylene
oxide. .................................................................................................................................... 9
Figure 3.10 – Structure of a polyester polyol obtain by condensation of ethylene glycol and
adipic acid........................................................................................................................... 10
Figure 3.11 – Molecular structure of a, 2,4 – toluene diisocyanate and b, 4,4’ –
diphenylmethane diisocyanate. .......................................................................................... 10
Figure 3.12 – Schematic representation of polyurethane chain. [14].......................................... 11
Figure 3.13 – The four stages of OCF foaming process. [10] ..................................................... 13
Figure 3.14 – Scheme of a typical quasiprepolymer foam process. [2] ...................................... 14
Figure 3.15 – Scheme of a typical prepolymer foam system. [14] .............................................. 15
Figure 4.1 – Sequence of a project in MultiSimplex.................................................................... 17
Figure 4.2 – Foam dispense on paper. ....................................................................................... 19
Figure 4.3 – Froth Shrinkage. [13]............................................................................................... 19
Figure 4.4 – Froth Outflow. [13]................................................................................................... 19
Figure 4.5 – Foam presenting curing streaks.............................................................................. 20
Figure 4.6 – Example of base holes............................................................................................ 21
Figure 4.7 – Voids and pin holes in a foam................................................................................. 21
Figure 4.8 – Cell collapse............................................................................................................ 22
Figure 4.9 – Example of dispensing in a mould. ......................................................................... 22
Figure 4.10 – No curing shrinkage, a, versus curing shrinkage, b, in mould. ............................. 23
Figure 4.11 – Block to be tested, compression test and adhesion test, respectively. ................ 24
Figure 4.12 – Shear strength test and mould.............................................................................. 24
Figure 4.13 – AltaFoam Monitor.................................................................................................. 25
Figure 4.14 – DimStab: block and samples before cutting. ........................................................ 26
Figure 4.15 – Set-up of the door test and sensors position. ....................................................... 27
Figure 4.16 – a- Door-closing test, b- Vertical load test, c- Doorstop test. ................................. 28
Figure 6.1 - Cans of SoudaFoam and SoudaFoam Alternative. ................................................. 32
Figure 7.1 – Effect of DMDEE on the response variables. ......................................................... 45
Figure 7.2 – Effect of Niax A1 in the response variables. ........................................................... 45

VII
Figure 7.3 – Effect of DME on the response variables. .............................................................. 49
Figure 7.4 – Effect of NCO on response variables...................................................................... 51
Figure 7.5 – Effect of OHv in response variables........................................................................ 55
Figure 7.6 – Effect of additive on response variables. ................................................................ 57

VIII
Index of Tables
Table 4.1 – Reagents and additives used in this work................................................................ 16
Table 4.2 – Control and Response Variables for MultiSimplex software. ................................... 17
Table 5.1 - Weight parts of each gas in the different formulations.............................................. 29
Table 5.2 – Quick Test Results for F134a Samples and HBA-1 Samples.................................. 30
Table 5.3 – F134a Samples. ....................................................................................................... 30
Table 5.4 – HBA-1 Samples........................................................................................................ 31
Table 5.5 – Results Output Test at 5ºC....................................................................................... 31
Table 6.1 - Altachem number and type of the cans to be tested. ............................................... 32
Table 6.2 – Quick Test Results. .................................................................................................. 33
Table 6.3 – SoudaFoam Samples............................................................................................... 33
Table 6.4 – Results Output Test at 5ºC....................................................................................... 33
Table 6.5 – Results of AFM......................................................................................................... 34
Table 6.6 – Physical properties. .................................................................................................. 35
Table 6.7 – Door closing results.................................................................................................. 36
Table 6.8 – Vertical load test results. .......................................................................................... 36
Table 6.9 – Doorstop test results. ............................................................................................... 36
Table 6.10 – Dimstab results for 5527 foam. .............................................................................. 37
Table 6.11 – Dimstab results for 5528 results............................................................................. 37
Table 6.12 – Aging test results for foam formulation 5527 and 5528. ........................................ 38
Table 7.1 – Part/weight of the polyol blend to make 3864 AEB3................................................ 40
Table 7.2 – Control Variables for 3864 AEB3 project. ................................................................ 41
Table 7.3 – Quick test results for formulation 3864 AEB3. ......................................................... 41
Table 7.4 – Re-formulation of 3864 AEB3. ................................................................................. 43
Table 7.5 – Quick test results for formulations 3883 to 3888 AEB3. .......................................... 44
Table 7.6 – Formulations 3908 and 3910 AEB3. ........................................................................ 46
Table 7.7 – Quick test results of formulations 3908 and 3910 AEB3.......................................... 47
Table 7.8 – Formulations 3960 and 3961 AEB3. ........................................................................ 48
Table 7.9 – Quick test results for 3960 and 3961 formulations................................................... 48
Table 7.10 – Formulation 6003 AEB3. ........................................................................................ 50
Table 7.11 – Quick test results of 6003 AEB3 formulation. ........................................................ 50
Table 7.12 – Formulations 6020 to 6022 AEB3. ......................................................................... 52
Table 7.13 – Quick test results of 6020 to 6022 AEB3 formulations........................................... 52
Table 7.14 – Comparative table between the formulations that originated the best results, 3887
and 6003, and the last ones, 6020-6022. ........................................................................... 53
Table 7.15 – Reported problems in the best formulations until now and the last ones. ............. 53
Table 7.16 – Formulations 6043 and 6044 AEB3. ...................................................................... 54
Table 7.17 – Quick test results of 6043 and 6044 AEB3. ........................................................... 54
Table 7.18 – Formulations 6064, 6065 and 6066 AEB3. ............................................................ 55

IX
Table 7.19 – Quick test results of formulations 6064-6066 AEB3. ............................................. 55
Table 7.20 – Formulations 6082 and 6083 AEB3. ...................................................................... 56
Table 7.21 – Quick test results for 6082 and 6083 formulations................................................. 56
Table 7.22 – Formulations 6096 to 6099 AEB3. ......................................................................... 57
Table 7.23 – Quick test results of 6096 to 6099 AEB3 formulations........................................... 57
Table 7.24 – 6096 AEB3 Samples. ............................................................................................. 58
Table 7.25 – Physical Tests Results. .......................................................................................... 59
Table 7.26 – AltaFoam Monitor Results. ..................................................................................... 59

X
Abbreviations
PU – Polyurethane
OCF – One Component Foam
MDI – Diphenylmethane Diisocyanate
DME – Dimethylether
LPG – Liquefied Petroleum Gas
FCA – Foam Controlling Additives
AFM – Alta Foam Monitor
DimStab – Dimensional Stability
NAC – Non Acceptable
AC – Acceptable
P – Paper
M – Mould
SR – Shaking Rate
SS – Surface Structure
GB – Glass Bubbles
CS – Cell Structure
V&PH – Voids and Pin Holes
BH – Base Holes
CC – Cell Collapse
SBH – Side Base Holes
ODM – Overall Density Mould

1
1. Introduction
It was clear that the nylon or polyamide plastics discovered by W.H. Carothers would
become technically important, first of all as textile fibres and later on, when they became
cheaper, as high-melting thermoplastics for injection moulding. To compete with that, Prof. Otto
Bayer was synthesizing polymer fibers when he developed the first fiber-forming polyurethane
in 1937. So it was discovered that the reaction between aliphatic di-isocyanates and aliphatic
diols (glicols) went smoothly under reflux conditions to build linear polymers of high molecular
weight. Although the melting points of these polyurethanes were a little lower than the nylons,
the new materials could be drawn into high tenacity yarn or used as thermoplastics for injection
moulding. [1,2]
The investigation was widened in scope, and the reactions between aromatic
polyisocyanates and alkyd or polyester resins were studied in detail. This research proved very
fruitful and, in the wartime, German foamed products, coatings, adhesives and even an
elastomer were discovered and gradually came into industrial use. After the war, British and
American intelligence teams reported on these important developments, and in both countries
work began on specialised service applications. [1]
The first commercial applications of polyurethane polymers, for millable elastomers,
coatings and adhesives, were developed between 1945 and 1947, followed in 1953 by flexible
foam and rigid foams in 1957. Since then they have been finding use in an ever-increasing
number of applications and polyurethanes are now all around us, playing a vital role in many
industries – from furniture to footwear, from building to cars production. Polyurethanes appear in
an astonishing variety of forms, making them the most versatile of any family of plastic
materials. [3]

2
2. Aim of this study
Since the viability of polyurethanes as a commercial product in the 1930’s, its industrial
production did not stop growing until today. To accompany this increase in overall production
there was also the need to diversity their range of applications.
Nowadays polyurethane polymers are present in almost all sectors of activity.
This dissertation focuses on polyurethanes foams. The aim of this work is to study one
component polyurethane foams and it is divided into two distinct parts.
The first one consists on foam properties analyses from a comparative in a point of view.
With the growing environmental concerns it is fundamental to develop new additives that
have no impact on the environment. With this in mind Honeywell developed a new blowing
agent, HBA-1. Altachem NV study its effect on formulations that already existed by replacing the
old blowing agent with the new one without re-formulation.
The other study was commissioned by Soudal and consisted in the comparison between an
already existing fixation foam and a new one.
The second part of the work was study the impact of changing some reagents in the final
foam properties.
The major concern was to improve the properties of a specific project not only taking into
account the visual and physical properties but also price competition.

3
Foam is a material, and foaming is a phenomenon. Both involve the presence of a gas phase
encapsulated by a spherical shell dense phase. [4]

4
3. Literature overview
A polymer is a large molecule built by the repetition of small, simple chemical units. In some
cases the repetition is linear, much as a chain is built up from its links. In other cases the chains
are branched or interconnected to form three-dimensional networks. The repeated unit of the
polymer is usually equivalent or nearly equivalent to the monomer, or starting material from
which the polymer is formed. [5]
3.1. Polyurethanes
Polyurethanes form one of the most important classes of synthetic polymers.
The name polyurethane is given to polymers that have urethane linkages in their molecular
structure regardless of the chemical composition of the rest of the chain and not because they
are obtained by polymerisation or the urethane groups are the main constituents. [6] Normally
urethane polymers contain a variety of groups in the polymer chain such as polyether linkages –
relatively flexible, aromatic rings providing a constant stiffening factor, urethane linkages that
contribute to strong intermolecular forces, urea linkages, among others.
Despite the characteristic group being usually called urethane it is also called carbamate.
[7]
The structure of polyurethanes is shown in figure 3.1, where urethane groups alternate with
organic radicals.
R1 O C
O
N
H
R2 N
H
C
O
O **
n
Figure 3.1 - Schematic representation of polyurethanes structure.
3.2. Polyurethanes Foams
Urethane foams occupy only a small percentage of the plastics industry at present, but in
light of the newness of urethanes and the rapid advancement in properties and property
improvement the end-use possibilities and growth for foams have exciting predictions. [8]
Foams are microcellular structures, produced by gas bubbles formed during the
polyurethane polymerisation mixture. The process of bubble formation in polyurethane foams is
called blowing. The blowing reaction is one of several reactions occurring in the final
polyurethane mixture while it is foaming. [2]

5
Polyurethane foams can be classified into two categories: flexible and rigid foams. However
in some cases it is also possible to distinguish semi rigid foam.
3.2.1. Flexible Foam
Linear or slightly branched polyols with relatively high molecular weight yield flexible foams.
Flexible PU foams, in contrast to rigid types, yield open-cell materials that allow free
movement of air throughout the materials when flexed. Flexible foams exhibit excellent sound
absorbing properties, low thermal conductivity, and good resistance to most solvents and
detergents, although some solvents (e.g. acetone and trichloroethylene) cause swelling, from
which the foam recovers unchanged upon drying. In presence of strong acids and alkalis
flexible foams are attacked. [2]
These foams are largely used for cushions, unicellular foams, insulation, and transparent
protective covers for radar (both for ground and air). They are also used in packaging and as
shock absorbers for structural purposes.
3.2.2. Rigid Foams
Rigid urethane foams are recognised as an outstanding material for insulation applications.
They have many desirable properties, such as low thermal conductivity, low density, excellent
dimensional stability, high strength-to-weight ratio, low moisture permeability, and low water
absorption, which make them particularly suitable for application in household refrigerators,
refrigerated trailers, and railroad cars, construction, and industrial insulation. [8]
3.2.3. Semi Rigid Foams
Semi rigid foams are thermoplastic and soften with a moderate increase in temperature.
They form excellent bonds between foamed-in-place and the materials used to form cavities
and are used in the field of insulation. [9]
OCF - One component foam - is a semi rigid foam that is self-expanding and self-adhesive
moisture curing gap filler develop by ICI (Imperial Chemical Industries Ltd) by A. Wooler, O.
Bengson and Aster De Schrijver in 1970. [10]
The OCF is dispensed from a simple pressurized container or aerosol-type and requires no
mechanical or power source. When the valve of the container is opened the contents of the
cylinder emerge from the nozzle as a well-expanded froth, which is easily directed into a gap or
hole. [11]
As it leaves the cylinder, the foam has the consistency of a shaving cream, and it is very
sticky and adheres firmly to most surfaces without any pre-treatment. Adhesion to damp
surfaces is excellent, which is particularly important point in a building site. Once in the gap the
foam expands to about double of its volume. [11]

6
When cured, the foam may be trimmed with a sharp knife and finished by normal plastering,
papering or grouting techniques. It can be recessed on external surfaces to accept a
conventional sealant to provide weather resistance. [11]
3.3. Basic PU chemistry
-N=C=O group is responsible for the unique reactivity of isocyanates, characterized by the great
facility of occurrence of nucleophilic reactions. This group of isocyanates has a high degree of
unsaturation, which makes it highly reactive with a wide range of compounds. In figure 3.2 are
represented the resonance structures of this group.
R N C O R N C O R N C O
Figure 3.2 – Resonance structure of NCO group.
The functional group of isocyanates is extremely reactive with nucleophilic substances,
being the most common reaction the nucleophilic attack to double linkage carbon-nitrogen. [2]
The more important reactions of isocyanates to produce polyurethanes are described
below.
1. Alcohol
The reaction, figure 3.3, between an alcohol and an isocyanate to give a urethane is
exothermic and releases 24 kcal/mol urethane. [12]
R O + C
O
N
R'
R O
H
C
O
N
R'
R O
H
C
O
N R'
O
C
O
N
H
R'
R
H
Figure 3.3 – Schematic representation of a urethane formation reaction mechanism. [7]

7
This process represents the fundamental reaction for all processes in polyurethane and
urethane synthesis.
2. Amines
The primary and secondary amines react easily with isocyanates to origin urea. These
reactions are very fast and normally they don’t need catalysts. [12]
R NCO + R' NH2 R N
H
C
O
N
H
R'
Figure 3.4 – Reaction of an isocyanate with a primary amine giving urea.
This reaction takes particularly importance since hydrogen’s from amine compounds are
more reactive than the hydrogen’s from water and so the two will compete to react with
isocyanates. If too much urea is formed the foam will became more and more rigid.
3. Water
In fabrication of PU foams the reaction of an isocyanate with water is extremely important.
The reaction is fast and involves the formation of an unstable intermediate – carbamic acid. The
intermediate acid breaks down in an amine and CO2.
R NCO + H2O RNH C
O
OH R NH2 + CO2
Figure 3.5 – Reaction of an isocyanate with water resulting in amine and carbon dioxide.
This reaction is an expansion reaction because the diffusion of carbon dioxide into the air
bubbles previously nucleated causes the foam expansion. It is an exothermic reaction that
releases 47 kcal/mol water. [12]
4. Urea and urethanes
The hydrogen from urethane and urea groups can react with NCO to produce allophanate,
figure 3.6, and biuret, figure 3.7. These secondary reactions are much slower than the primary
reactions, due to the lower reactivity of the active hydrogen in ureas and urethanes. [13]

8
R NCO + R'NH C
O
OR'' RNH C
O
N
R'
C
O
OR''
Figure 3.6 – Formation reaction of allophanate.
R NCO + R'NH C
O
NHR'' RNH C
O
N
R'
C
O
NHR''
Figure 3.7 – Formation reaction of biuret.
These reactions occur to a much lesser extent than the primary reactions while the froth is
curing; however their importance must not be underestimated because these reactions also
take place in the aerosol cans, which are responsible for reducing the shelf life of the product.
The formation of allophanates, and particularly biurets, is also responsible for crosslinking and
branching, which has an important effect on the foam properties. [13]
If a reasonable rate of reaction is to be obtained, and if no catalyst is present, these
reactions require high temperatures and higher concentrations than those necessary for the
primary reactions. It is important to note that the reaction with ureas to form biurets occurs more
readily than the reaction with urethanes to give allophanates. [13]
5. Acids
Despite carboxylic acids react with isocyanates, they have low reactivity compared with
alcohols, amines and water. [2]
R NCO + COOH R' RNH C
O
O C
O
R'
RNH C
O
R' + CO2
Figure 3.8 – Isocyanate reacting with a carboxylic acid resulting in an amide and CO2, with the formation
of an instable anhydride.

9
6. Condensation
The isocyanates can also react between them to form dimers or trimers.
The dimerization should be carried out at low temperatures because of its thermal
instability, which explains why the dimerization is limited to the more reactive ones, such as the
aromatic isocyanates. The trimerization is very important commercially especially in the
production of rigid foams. [12]
3.4. Chemicals used
A wide range of raw materials is used in the production of polyurethanes, with
diisocyanates, polyols and chain extenders as the principal ones.
3.4.1. Polyols
The compounds with two or more alcohol function are referred as glycols and polyols and a
great variety of them are used in PU’s fabrication.
The type of polyol defines the physical properties of the final foam. In one component foam,
with built in resilience, it will require some stiffness of the polymer network so that overall rigidity
is imparted to the foam. The polymer properties are primarily met by the degree of crosslinking,
and, in turn, this is achieved by an appropriate choice of both molecular weight and functionality
of the polyol used for coupling with the isocyanate. [13]
The more used polyols in polyurethanes synthesis are polyether polyols and polyester
polyols.
The name polyether polyol is given because this macromolecule has beyond the functional
alcohol groups, functional ether groups, figure 3.9.
They are obtained by the reaction of a simple molecule, named initiator, such as ethylene
glycol, propylene glycol, glycerine with cyclic ether such as propylene, ethylene and butylene
oxides. The most common ones are polyoxypropylene glycol and copolymers of
polyoxypropylene/ethylene glycol. [12,13]
The functionality is dependent on the functionality of the initiator molecule, if it is a diol the
functionality is two, and so on.
HO CH
CH3
CH2 O CH2 CH
CH3
O CH2 CH
CH3
OH
n
Figure 3.9 – Structure of a polyether polyol synthesized by propylene glycol with propylene oxide.

10
The polyester polyols were the first ones used in PU development. Normally they are
obtained by the polycondensation reaction of a diacid with an excess of diol, example given in
figure 3.10. Polyurethanes market has four principal types: polyester polyols aliphatic linear or
slightly branched, polyester polyols aromatic of low molecular weight, used in rigid foams,
polycaprolactones, and polycarbonate polyols. [12]
HO CH2 CH2 O C
O
CH24
C
O
O CH2 CH2 O H
n
Figure 3.10 – Structure of a polyester polyol obtain by condensation of ethylene glycol and adipic acid.
3.4.2. Diisocyanates
By analogy with polyols, the diisocyanates are isocyanates with two functional groups.
According to this, two ends can react allowing polymeric chains formation.
The most widely used isocyanates are toluene diisocyanate (TDI), figure 3.11a,
diphenylmethane diisocyanate (MDI), figure 3.11b, and modifications of these products,
especially “crude” TDI and MDI.
NCO
CH2
NCO
b
NCO
CH3
NCO
a
Figure 3.11 – Molecular structure of a, 2,4 – toluene diisocyanate and b, 4,4’ – diphenylmethane
diisocyanate.
The one that was used in this work is MDI; pure MDI is usually solid at room temperature
given its fusion point of 38ºC. [2]
3.4.3. Chain extenders
In polyurethane synthesis beyond the isocyanate and polyol, a glycol or a diamine with low
molecular weight is used. Despite being a component in a smaller percentage they have an
important role in shaping the final of the properties of polyurethane polymers. They contribute to
the nature and to the quantity of the links between the polymer chains, playing a key role in the
elastic properties of polyurethanes because they are small molecules that allow that multiple

11
molecules diisocyanate are close, causing portions of chain groups with the highest
concentration of urethane.
With the reagents above it’s possible to have an idea of the schematic structure of a chain
of polyurethane, figure 3.12.
Figure 3.12 – Schematic representation of polyurethane chain. [14]
Is it possible to identify different fractions of a chain where one is predominantly the result
obtained by the reaction of diisocyanate with the chain extender and the other the sequence
obtained by the reaction of diisocyanate molecules with polyol.
3.4.4. Additives
A large quantity of chemicals may be added to control or to modify both the reaction of PU
formation and their final properties.
Flame retardants
As all organic materials, polyurethanes burn in the presence of oxygen and with sufficient
heat. The flame-retardants are compounds used to delay ignition and reduce burning speed and
smoke. [12]
The physical state of the polymer is very important; for example, one component foam is a
semi rigid foam that because of its highly cross linkage is less flammable than flexible foams.
[13]
It is possible to reduce flammability of OCF by the use of compounds containing
phosphorous, halogens, boron, sulphur, antimony and various other metals. This reduction is
possible in the case of foams based on reactive flame retardant polyols (involving
reformulation), flame retardant additives (usually considered to be inert) or inorganic additives.
[13]
Silicones
The silicones used are surface active agents and can be classified in two groups depending
on the type of connection involved. If the connection is between the silicone Si and the O of
polyether (Si-O-C) the surfactant is hydrolysable, however if the connection is between the
silicone Si and the C of polyether (Si-C) it is not hydrolysable. [12,13]
Surfactants are molecules with structure characteristics allowing them to combine materials
with different properties. Typically, one component in surfactant has affinity to apolar phase
(hydrophobic) and another has affinity to the polar phase (hydrophilic). [13]

12
The stability of the cells of the froth is greatly influenced by the surface tension of the liquid.
The greater the surface tension, the greater the restraining force against expansion. Not adding
silicone causes froth collapse before the polymer is sufficiently cured. Gas must come out of the
solution quickly, forming a large number of tiny bubbles in the froth. These bubbles are
stabilized by the combined action of surfactants and the increased viscosity and elasticity of the
froth caused by moisture uptake curing. Silicones will lower the surface tension but must also
increase the system’s tear length so in the OCF froth, while curing and expanding, the gas must
be maximum retained in the form of bubbles which ultimately give the maximum closed cell
structure foam [13]
In short, silicones are particularly useful in PU foams having several functions such as
reduction of the surface tension, emulsification of the materials that are incompatible in the
formulation, promotion of nucleation of the air bubbles and stabilization of foam growth, among
others. [12]
Catalysts
Without a catalyst, the isocyanates group reacts slowly with alcohol, water or itself. The
choice of the catalyst on PU is usually made in order to obtain an appropriate profile among the
different reactions that can occur during the manufacturing process.
Besides the fact that catalysts are employed to bring about faster rates of reaction they also
establish a proper balance between the chain-propagating reaction and the foaming reaction. A
balance has to be established between polymer growth and gas formation in order to entrap the
gas efficiently and to develop sufficient strength in the cell walls at the end of the foaming
reaction (evolution of gas) to maintain their structure without shrinkage or collapse. Another
important function of catalysts is to bring about completion of the reactions resulting in an
adequate “cure” of the polymers. [8]
Blowing agents
Polymeric expansion results from the formation of a gaseous compound during
polymerisation. The release of this compound follows the formation of gas bubbles that are held
in cells within the polymer structure, leading to an increase in the overall volume of polymer.
[15]
One way to obtain this expansion is through the reaction of isocyanate with water, which
results in urea and carbon dioxide. The other way is through a physical process: to introduce a
low boiling point liquid that since is an exotermic reaction, evaporates and consequently
promotes the expansion.
Although the reagents described in detail above are the main and most used ones in almost
all formulations of polyurethanes, it is important to note that deeper analysis of the

13
characteristics of foam lead to the necessity to add another type of additives. References to
these will be made throughout the paper where appropriate.
3.5. OCF Foaming Process
OCF foaming process has generally 4 stages.
Figure 3.13 – The four stages of OCF foaming process. [10]
In the first one the aerosol can is filled off with a mixture of polyol blend, isocyanate and
blowing agent. The prepolymerisation reaction occurs inside the can. At dispensing (second
stage), the liquid prepolymer leaves the can and expands immediately to a low-density froth due
to the evaporation of the blowing agent. Once exposed to the air, third stage starts, and the
froth cures by the reaction with moisture in the air or from the substrate, resulting in CO2
production that gives a second expansion of the froth. The final stage consists in low-density
fully cured foam. [10]
3.6. Production
To obtain a polymer with useful properties more than a simple mixture of polyol, isocyanate
and additives is necessary. In reality, there is the need to introduce some changes in order to
obtain, from a simple mix of two components, a polymer with industrial utility.
3.6.1. One shot process
As the name indicates, the components are mixed directly, generally with the simultaneous
addition of auxiliaries such as catalysts, foam stabilizers, reinforced agents, fillers, and fire
retardants. The reaction is highly exothermic and largely completed in 0,5 min to 30 min,
depending upon the catalyst. The final properties, however, are frequently reached only after 24
to 48 h. [16]
There are two ways to do one shot process: the first one is to mix all the components
simultaneously being the urethane polymer produced in one step. The other one consists in
mixing all the components except isocyanate. This approach makes the final mixture simpler,
with only two components. The advantage of simplifying the mixture process is to decrease the
mixing equipment and, in consequence, also the costs. [14]
The one shot process is characterised by the absence of a prepolymer intermediate.

14
3.6.2. Quasiprepolymer process
In this approach, part of the polyol to be used in the formulation is prereacted with all of the
isocyanate. The resultant product is NCO-terminated as in a prepolymer; however, the free
NCO content of the quasiprepolymer is much higher. Foams are prepared by adding water,
catalysts, surfactants, and the remaining polyol. [2]
The quasiprepolymer approach is recommended when the isocyanate of choice is either
solid at normal operating conditions or when a modification will result in improved properties or
processing of the resultant foam. Quasiprepolymers also have been made with polyols or chain
extenders that are difficult to process when used alone. In many applications, the high free
NCO-terminated products are handled as though they were basic isocyanates. [2]
Figure 3.14 is a schematic diagram of the quasiprepolymer method.
Figure 3.14 – Scheme of a typical quasiprepolymer foam process. [2]
3.6.3. Prepolymer process
In the prepolymer foaming process, mostly used for flexible foams, the hydroxyl compound
is reacted with an excess of isocyanate (NCO:OH ratio 2:1) to form an isocyanate-terminated
prepolymer. [2]

15
Figure 3.15 – Scheme of a typical prepolymer foam system. [14]

16
4. Materials and Methods
4.1. Reagents and Additives
The reagents and additives employed in this work are shown in table 4.1.
Table 4.1 – Reagents and additives used in this work.
Type Full name Chemical name/ Specification Funcionality
GP1000 Propyleenoxide/ glycerol 3 Polyol
VD1000 Polypropylene glycol 2
Crosslinkers FCA202
29,2 % voranol CP 1055 polyol
60,1% monopropylene glycol
9,98% saxol 8002
2
Plasticyzer Cereclor S45 Chlorinated paraffin -
Silicone B8870 Polysiloxane-polyether 2
DMDEE 2’-Dimorpholino diethyl ether - Catalyst
Niax A1 70% bis (2-dimethylaminoethyl) ether -
Witco L6164 Cell opener - Additive
OSI L5348 Cell opener -
LPG
Butane 33,5%
Propane 46,5%
Isobutane 20%
- Gases
DME Dimethylether -
4.2. Methods
4.2.1. Optimisation Process
One objective of this work is the tuning up of PU foams and therefore the process of
optimisation is essential. In an environment of increasing international competition where
countries with lower production costs quickly catch up technologically, new thinking is required
in order to meet the competition. A proactive way of meeting the increasing competition is to
focus on maximizing the utilization of existing technology and, faster than the competitors, being
able to continuously introduce and make use of new technology. This means much more than
just investing in new equipment. [17]
The ability to optimise or improve a process is dependent upon the ability to control the
process, which in turn is dependent upon the access to reliable and valid measurements. A
successful industrial optimisation thus entails a strategic approach encompassing the whole
chain: [17]
Measuring => Controlling=> Optimising

17
Experimental optimisation can be carried out in several ways, being the most known the
one-variable-at-the-time approach. This method is, however, extremely inefficient in locating the
true optimum when interaction effects are present. Therefore, since many years ago, a
multivariable experimental design is used in order to overcome such problems.
Sequential designs are very useful for optimisation studies. Experiments are successively
performed in a direction of improvement until the optimum is reached. The simplex approach is
by far the most useful method.
The competitive tool to optimise used in this work was MultiSimplex software. MultiSimplex
is windows-base software for sequential design of experiments and optimisation. This software
handles up to 15 control and response variables simultaneously, it allows maximization,
minimization or a target value for each response variable and it provides an extensive database
with all the experimental results and the suggested trial conditions. The definition of control and
response variables is crucial for the outcome of the optimisation project. The main steps in the
definition sequence are:
Figure 4.1 – Sequence of a project in MultiSimplex.
In table 4.2 the control and response variables for the project are presented.
Table 4.2 – Control and Response Variables for MultiSimplex software.
Project Control Variables Response Variables
Shaking Rate
Cell Structure P 23/23
Base Holes P 23/23
Side Base Holes M 5/5
Cell Structure M 5/5
Overall Density Mould 23/23
AEB3
% Gas
DME
OHv
%NCO
Cereclor S45
B8870 Output

18
In addition to the use of multisimplex new formulations are also obtained by previous experience.
4.2.2. OCF Benchmarking [10,18]
For every sample of foam that is analysed an “OCF Benchmarking sheet” must be filled out.
The OCF Benchmarking sheet is a tool to gather several details about the sample of foam
that is going to be tested, the conditions in which these tests occur and the parameters that will
be analysed for the sample.
Quick Test
Foam properties can be analysed through a Quick Test. This can be applied to the following
foam samples obtained through different dispensing procedures: Foam Bead on Paper and
Foam Bead on Mould.
The foam tested properties are evaluated according to a scale from –5 to 5 (steps of 0,25),
in which the higher the value obtained the better the property.
The foam is dispensed at can temperature but the curing takes place at different
temperature. These temperatures are usually represented by “aerosol can T (ºC)/ curing T (ºC)”.
The foam samples are evaluated at 23/23 ºC and at 5/5 ºC.
The first thing to do in order to fill in the quick test is to shake the can to mix the prepolymer
and the gas inside, giving a score to the shaking rate of the can (the easier to shake the higher
the score). The shaking rate evaluation is very subjective and the score must be given
according to the initial shake, since it becomes more difficult to shake the can as time goes by,
as well as at lower temperatures.
Then the Output Test is carried out . This test consists in dispensing during 10 seconds the
can into a box at maximum tilting of the valve. This must be carried out at 5/5ºC because this is
the worst situation. Then by measuring the mass of the can and the box, before and after
dispensing, it is possible to know Output Liquid (g/s), Output Foam (g/s) and Gas Loss (%).
Afterwards the foam must be dispensed on paper and on mould.
Quick Test on Paper
In order to test the foam on paper it is necessary to prepare a properly identified piece of
paper to test the required samples and the conditions in which the dispensing and curing will
occur.

19
Figure 4.2 – Foam dispense on paper.
During foam dispensing and while the froth is curing it is important to check if the foam
presents froth shrinkage, figure 4.3, which may happen during the first seconds after
dispensing. This phenomenon is seen mostly with gun foams.
After dispensing adapter or gun foam, some short lines must be drawn on one side of the
sample at a distance of 1,5 – 2 cm from it, to later check if the foam presents froth outflow,
figure 4.4.
Figure 4.3 – Froth Shrinkage. [13]
Figure 4.4 – Froth Outflow. [13]
In order to distinguish froth outflow from froth shrinkage it is really important to pay attention
to phase 2.
Phase 3 is the post expansion caused by the reaction of free NCO with humidity producing
CO2 release. This phenomenon is a problem of froth stability or froth stiffness shortly after
dispensing. On the one hand we need a low viscosity prepolymer in the aerosol can to assure a
good output but once the froth is dispensed the froth should be stable and not flow out.
Besides the already mentioned analysed properties, the majority is evaluated only after the
curing of the froth. The curing period is also related to the temperature and relative humidity (%
RH) at which the froth is curing.
Description of how these properties can be evaluated is presented below.

20
- Foam on paper
This property is the last one to be evaluated, even if it is the first of the list, because it
reflects the quality of the tested sample. It can be measured by giving an acceptable or non-
acceptable appreciation according to the scores given to the other foam properties.
- Surface structure
The foam surface structure can be smooth or “frothy” (irregular). Adapter applied foams give
a smoother surface than gun applied foams.
- Cell structure
The cell structure of the foam is related to the size and distribution of the cells in the
sample. These cells must not be very large and should present themselves homogenously
distributed throughout the sample.
- Curing streaks
This property is related to problems during the curing of the froth, which causes the
appearance of coarser cells characterised by their weakness and lack of flexibility (hard zones).
This problem is mostly seen in the centre of the foam, where the curing faces more difficulties
due to the fact that it takes longer for the humidity to penetrate that area.
Figure 4.5 – Foam presenting curing streaks.
- Base holes
Base holes are an important physical phenomenon that occurs when the froth is in contact
with the porous surface and no densification of the contact layer can occur (no pressure
development). This occurrence is due to the fact that high boiling blowing agents like butanes
and iso-butanes are captured into the porous structure of the paper surface.
The evaporation of these gases will cause the appearance of base holes, by dissolving the
fresh froth, on the surface of the foam that is in contact with the porous substrate.
The lower the viscosity of the froth the bigger is the risk of base holes.
The base holes cause a very poor adhesion between the foam and substrate.

21
Figure 4.6 – Example of base holes.
- Glass bubbles
Glass bubbles can be identified by the shiny look of the surface of the foam. They result
from a bad gas combination in the prepolymer and they give poor physical properties to such a
foam layer.
Higher boiling points gases such as butane and iso-butane are dissolving the cells at the
surface of the foam what makes cell coalescence due to the quick evaporation.
Usually glass bubbles are more pronounced at low can temperature and in gun applied
foams.
- Crumbling
This property is related to the presence of friable cells in the foam. The friability can be
evaluated by pressing the foam (after 1h, 2h, and 24h). If the foam presents crumbling by
pressing it, a cracking sound will be noticed. The crumbling is more notorious when the curing
takes place at lower temperatures.
- Voids and Pin Holes
Voids and pin holes (small voids) are created due to “gas pockets” which could not be
homogeneously mixed into the prepolymer by shaking. The better the solubility of the gases in
the prepolymer, the lesser liquid gas pockets exist.
Poor shakability or not enough shaking of cans can cause voids in the foam.
The presence of voids will reduce the physical properties of the foam.
Figure 4.7 – Voids and pin holes in a foam.
- Cell collapse
Cell collapse can be detected by the presence of curing streaks or, in an aggravated
situation, by the presence of large void spaces in the foam. The presence of such formations in
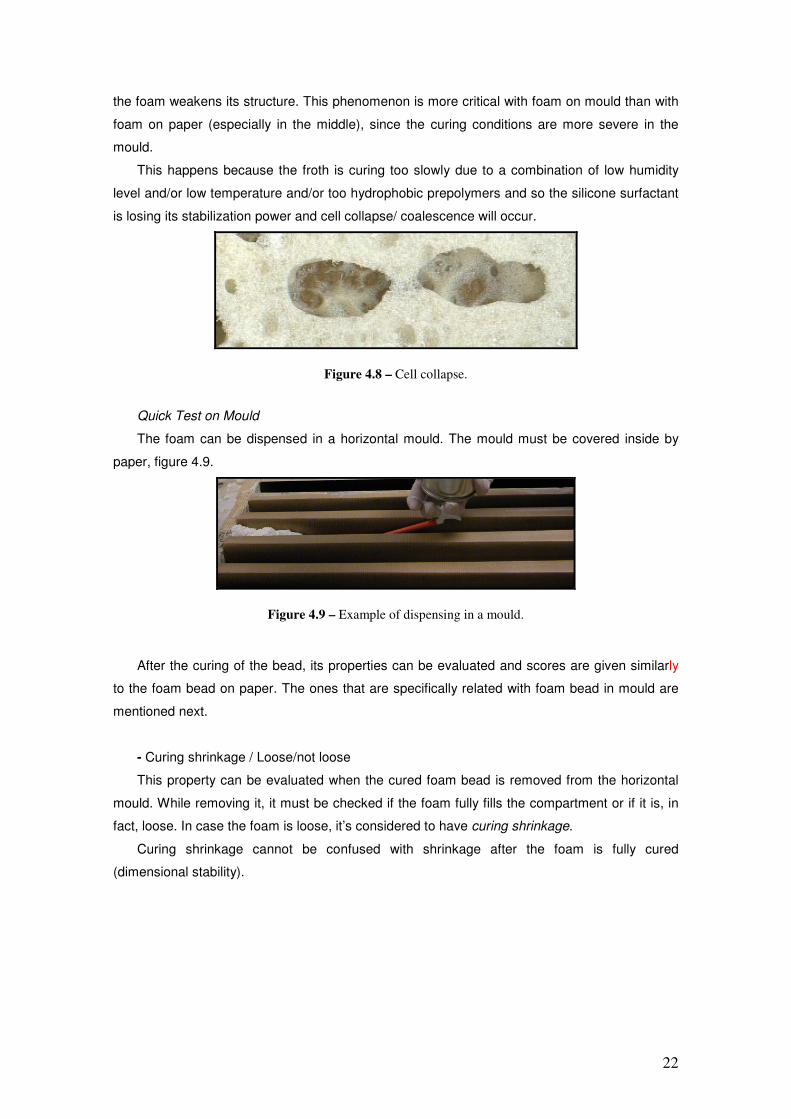
22
the foam weakens its structure. This phenomenon is more critical with foam on mould than with
foam on paper (especially in the middle), since the curing conditions are more severe in the
mould.
This happens because the froth is curing too slowly due to a combination of low humidity
level and/or low temperature and/or too hydrophobic prepolymers and so the silicone surfactant
is losing its stabilization power and cell collapse/ coalescence will occur.
Figure 4.8 – Cell collapse.
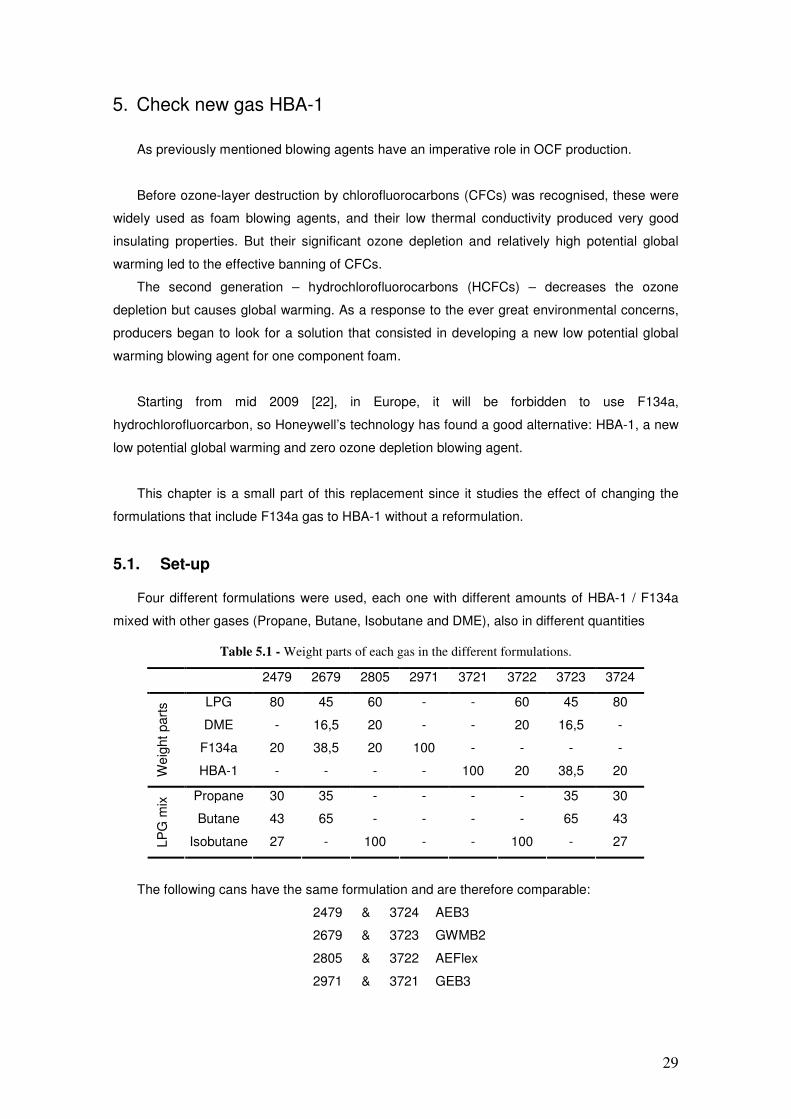
Quick Test on Mould
The foam can be dispensed in a horizontal mould. The mould must be covered inside by
paper, figure 4.9.
Figure 4.9 – Example of dispensing in a mould.
After the curing of the bead, its properties can be evaluated and scores are given similarly
to the foam bead on paper. The ones that are specifically related with foam bead in mould are
mentioned next.
- Curing shrinkage / Loose/not loose
This property can be evaluated when the cured foam bead is removed from the horizontal
mould. While removing it, it must be checked if the foam fully fills the compartment or if it is, in
fact, loose. In case the foam is loose, it’s considered to have curing shrinkage.
Curing shrinkage cannot be confused with shrinkage after the foam is fully cured
(dimensional stability).

23
Figure 4.10 – No curing shrinkage, a, versus curing shrinkage, b, in mould.
- Side base holes
In order to check for side base holes it is necessary to detach the excess of paper on each
side of the bead. The presence of side base holes is revealed by the low adhesion between the
foam and the paper caused by the presence of such holes.
- Overall density in the mould
The overall density is an average value of the density of the bead inside the mould (greater
density) and the foam on its surface. Weighing the sample and determining its volume,
discounting the paper attached to the bead and thus calculating an overall density value for the
foam on mould, determines the average value for this property.
Full Test
When the purpose is reached the formulation will be in full testing. This means that the
formulation has acceptable results in the quick test on paper and on mould and so it is
necessary to do different tests to see if the foam is good for it applications.
Some tests that are performed are physical tests, AltaFoam Monitor, dimstab, yield, aging
and when is a fixation foam, the door test.
Physical Tests
Most of the physical testing procedures were developed in 1975 jointly with some 1KPU
producers, raw material suppliers and SKZ (Süddeutsche Kunststoffinstitut in Wurzburg).
Besides foam density, already discussed in the previews section, the physical tests include
foams mechanical properties like compression strength at 10%, maximum adhesion strength
and finally maximum shear strength.
The three tests were performed in an Instron 5544 Machine and performed at 23ºC/ 23ºC.
In order to obtain a more precise value, each foam was tested with three different blocks for
each property.

24
• Compression and Max Adhesion Strength
In the test device, figure 4.11, test samples with both sides attached hardboard are
prepared. The foam between the two hardboards has the dimensions of 5 cm x 5 cm x 3 cm
(thickness).
In compression test a force is applied through a moving installed pressure plate, brought
perpendicular to the hardboard. The 10% of foam compression in the used moulds is equivalent
to 3 mm of compression extension. The propulsion speed was 5 mm/min.
For adhesion the setting is exactly the same as for compression. During the testing, a
traction force over a cross hinge and a specific grip construction must be installed or glued onto
the substrate, so that the test force is perpendicular to the testing adhesive surface foam/
surface of substrate. The testing speed was 2 mm/min till the complete failure.
Figure 4.11 – Block to be tested, compression test and adhesion test, respectively.
• Max shear strength
The test samples are made by foaming and filling of the gap in the test mould, figure 4.12.
Figure 4.12 – Shear strength test and mould.

25
By the compression/shear test, the foam is tested, by means of a moving pressure plate
made out of hard steel.
AltaFoam Monitor [19]
AltaFoam Monitor targets the study of curing of the froth. This monitoring is done through 4
major variables: temperature, height, pressure and curing rate.
The apparatus consists in a mould, a gap where the polyurethane foam will be sprayed,
with the four sensors to measure each one of the properties attached.
The temperature sensor is a thermometer, the height sensor is an optical (infra-red light)
sensor, the pressure sensor is a piezoelectric system, and a curing sensor that consists in an
electric conductivity sensor.
The curing in altafoam monitor is measured by foam dispensed in a mould where no water
is added to the froth bead. In this case the humidity mainly penetrates the froth from the top of
the bead towards the center of the bead. These curing conditions are of course more severe
than on paper and therefore the cells in the center of the foam are coarser or may show curing
streaks or even cell collapse.
The expansion of the froth due to the CO2 production is called the post-expansion. It is
calculated by the difference between the final and the initial height of the foam as a percentage
of the initial height.
At dispensing a temperature drop of ∆T is noticed due to the evaporation of the blowing
agent.
In figure 4.13 it is possible to see an AltaFoam Monitor.
Figure 4.13 – AltaFoam Monitor.

26
DimStab [20]
Dimstab is a test where a sample of the foam is stored at a certain temperature and its
objective is to measure its deformation over time.
To prepare the samples it is necessary to mark on a paper an area of 25 x 35 cm2. Before
spraying there is the need to moister this area with water, to shake the can subsequently and to
apply the first layer of the foam on the rectangle. Then one must moister the top of the foam and
apply the second layer of the foam, and bead direction should be perpendicular to the previous
one. Finally one must moister it again and spray the last layer in the same direction as the first
one.
After 24 hours of dispensing the cake the samples can be cut. The blocks must have 10 x
10 x 3 cm3.
Figure 4.14 – DimStab: block and samples before cutting.
After being cut, the samples must be identified, formulation and temperature of storage, and
measured.
After the first measurement, each sample will be stored at the right temperature: -20ºC,
23ºC and 45ºC. After one week, a measurement per week will be made during 4 weeks. It is
important to notice if the shape of the sample does not change due to any warping that might
happen.
Yield
The definition of the foam yield out of one can has been a major source of confusion and
discussion. Big differences on yield per can have been noticed and depend on the testing
method. In altachem the tests are done at 23ºC and consisted in dispensing different layers of
foam in a box, like in dimstab (perpendicular direction and moister between layers), until the can
is empty. After cured, the foam is measured with a ruler as precisely as possible.
Aging Test
The aging test consists in testing the performance of the foam over time.

27
The cans are stored at 45ºC and dispense every week at 5/5ºC and 23/23ºC. One day at
45ºC is the same as seven days at 23ºC, because high temperatures promote the aging of the
can. The test is performed during 8 weeks, and the last can corresponds to 1 year at 23ºC.
Door Test [21]
When a foam is used as a doorframe fixation before being launched in the market it is
important to check if the door can be used for that propose. Subsequently the door test consists
in measuring the displacement of the door with 4 sensors.
• Set-up of the doorstand
The distance between the concrete and the doorframe is set at 30 mm; this value can be
change by steps of 7,5 mm.
The width of the doorframe and of the concrete is 20 cm and 15 cm, respectively.
An important factor is the surface that is foamed in. Normally 6 dot of a defined surface are
foamed in, in 6 areas of 100 cm2, 150 cm
2, 200 cm
2, 250 cm
2 or 300 cm
2, depending on the
shear strength.
In figure 4.15 the position of the 4 sensors is indicated. This information is important to
assess displacements later.
Figure 4.15 – Set-up of the door test and sensors position.
• Testing
The testing consists in 3 phases: the door closing test, the vertical load test and the
doorstop test.

28
The door-closing test
The door closing test consists in closing the door 10000 times. An adjustable pressure
cylinder that is attached to the door promotes this, figure 4.16a. The door is closed with a force
of 80 Newton (corresponding to 8 kg).
This corresponds to a 32 year door lifecycle, which is closed 6 times per week with a force
of 80 N.
The cycle time of closing lies between 2 and 4 seconds. During the test the displacement is
measured by 4 inductive sensors every 10 seconds and the measurements of the
displacements are only stopped 3 hours after the test is completed.
The vertical load test
During the vertical load test, the door is loaded during 15 minutes with a vertical pressure
cylinder, figure 4.16b, which executes a force of 1000 Newton. The measurement is done in the
same way as the door closing test but here the measurement stops after 3 minutes the test is
completed.
The doorstop test
Finally the doorstop test is performed with the same horizontal pressure cylinder which is
now attached to the other side of the door, in order to open the door against the doorstop, figure
4.16c. The load is increased in 3 phases. During the first phase the door is opened 500 times
with a force of 40 N and the displacement is measured at the 4 sensors. Then the door is
opened 500 times with a force of 80 N, and the test is finalized by opening the door 500 times at
100 N. Between the 3 phases and after the last phase, it is necessary to wait a few minutes and
continue measuring in order to evaluate how the door relaxes.
Figure 4.16 – a- Door-closing test, b- Vertical load test, c- Doorstop test.
29
5. Check new gas HBA-1
As previously mentioned blowing agents have an imperative role in OCF production.
Before ozone-layer destruction by chlorofluorocarbons (CFCs) was recognised, these were
widely used as foam blowing agents, and their low thermal conductivity produced very good
insulating properties. But their significant ozone depletion and relatively high potential global
warming led to the effective banning of CFCs.
The second generation – hydrochlorofluorocarbons (HCFCs) – decreases the ozone
depletion but causes global warming. As a response to the ever great environmental concerns,
producers began to look for a solution that consisted in developing a new low potential global
warming blowing agent for one component foam.
Starting from mid 2009 [22], in Europe, it will be forbidden to use F134a,
hydrochlorofluorcarbon, so Honeywell’s technology has found a good alternative: HBA-1, a new
low potential global warming and zero ozone depletion blowing agent.
This chapter is a small part of this replacement since it studies the effect of changing the
formulations that include F134a gas to HBA-1 without a reformulation.
5.1. Set-up
Four different formulations were used, each one with different amounts of HBA-1 / F134a
mixed with other gases (Propane, Butane, Isobutane and DME), also in different quantities
Table 5.1 - Weight parts of each gas in the different formulations.
2479 2679 2805 2971 3721 3722 3723 3724
LPG 80 45 60 - - 60 45 80
DME - 16,5 20 - - 20 16,5 -
F134a 20 38,5 20 100 - - - -
We
ight
part
s
HBA-1 - - - - 100 20 38,5 20
Propane 30 35 - - - - 35 30
Butane 43 65 - - - - 65 43
LP
G m
ix
Isobutane 27 - 100 - - 100 - 27
The following cans have the same formulation and are therefore comparable:
2479 & 3724 AEB3
2679 & 3723 GWMB2
2805 & 3722 AEFlex
2971 & 3721 GEB3

30
5.2. Quick Test Results
The complete quick test results are shown in appendix 10.1.
The results obtained when dispensing the foam on paper and on mould are summarized in
the tables below.
Table 5.2 – Quick Test Results for F134a Samples and HBA-1 Samples.
2479 2679 2805 2971
23/23 5/5 23/23 5/5 23/23 5/5 23/23 5/5
Paper NAC NAC AC NAC NAC NAC NAC NAC
Mould AC AC NAC NAC AC NAC AC NAC F134a
Samples ODM
(g/L) 29,91 18,22 26,17 23,71
3724 3723 3722 3721
23/23 5/5 23/23 5/5 23/23 5/5 23/23 5/5
Paper NAC NAC NAC NAC NAC NAC NAC NAC
Mould AC NAC NAC NAC AC NAC NAC NAC HBA-1
Samples ODM
(g/L) 30,38 15,51 18,54 -
Table 5.3 – F134a Samples.
Substrate Can/ Cure
2479 2679 2805 2971
23/23
Paper
5/5 No Output
23/23
Mould
5/5 No Output

31
Table 5.4 – HBA-1 Samples.
Substrate Can/ Cure
3724 3723 3722 3721
23/23
Paper
5/5
23/23
Mould
5/5
No Output
Table 5.5 – Results Output Test at 5ºC.
Formulation Output liquid
(g/s) Output foam
(g/s) Gas Loss (%)
2479 13,2 11,8 10,4
2679 12,2 7,1 42,0
2805 13,1 13,1 0,2
2871 1,9 1,8 4,3
3721 No Output
3722 20,0 17,4 12,9
3723 18,9 16,5 12,8
3724 10,5 9,3 11,2
5.3. Discussion and Conclusion
It is important to notice that when only HBA-1 was used as blowing agent, the foam is more
viscous compared to F134a. That is why it was impossible to dispense at 5 ºC.
By analysis and comparison of tables 5.3 and table 5.4, cell collapse and voids & pin holes
are worse with HBA-1, particularly at low temperatures. This could mean that HBA-1, due to
being more viscous, is less soluble that F134a and therefore is negatively affecting the cell
stabilization.
Although it is impossible to see glass bubbles and cell structure in tables 5.3 and 5.4 they
are quite similar in both gases (Appendix 10.1).
At lower amounts, curing streaks tend to occur (Appendix 10.1).
In conclusion, HBA-1 can be used as a blowing agent but it cannot replace F134a without a
retuning of the formulations.

32
6. OCF Doorstand Report
When a company wants to market a new formulation the first thing to be done is an intense
benchmark comparison with already existing formulations.
Soudal, a producer of OCF, proposed to Altachem to run an extensive test on recently
developed foam. As we don’t know the formulation or even the name that will be given to it, it
will be called SoudaFoam Alternative in this text.
This chapter has been included in this thesis both because of one interesting test, the
doortest, and because it includes all the benchmarking tests that have been mentioned in
chapter 4.
6.1. Renaming of Cans
A unique Altachem number will be given to each formulation to simplify reference. This
number will be used along the report to distinguish the supplied cans.
Table 6.1 - Altachem number and type of the cans to be tested.
Altachem Number Type Trade Name Producer
5527 GUN SoudaFoam 1K SOUDAL
5528 GUN SoudaFoam
Alternative 1K SOUDAL
The pictures of the two cans provided can be seen below, figure 6.1.
Figure 6.1 - Cans of SoudaFoam and SoudaFoam Alternative.

33
6.2. Quick Test
In order to evaluate the foams, a quick test was done by spraying paper and the mould, as
seen before, and a score was given by visual evaluation to the most important characteristics of
the foam ranging from – 5, very bad, to + 5, very good. The complete quick test results can be
found in Appendix 10.2.
The summarized results are presented in table 6.2 below.
Table 6.2 – Quick Test Results.
5527 5528
23/23 5/5 23/23 5/5
Paper NAC NAC NAC NAC
Mould NAC NAC NAC NAC
ODM (g/L) 19,1 17,3
Table 6.3 – SoudaFoam Samples.
Substrate Can/
Cure 5527 5528
23/23
Paper
5/5
23/23
Mould
5/5
Table 6.4 – Results Output Test at 5ºC.
Formulation Output liquid
(g/s)
Output foam
(g/s) Gas Loss (%)
5527 19,6 17,6 10,2
5528 11,4 10,6 7,3

34
6.2.1. Discussion of Quick Test Results
Foam 5527 has base holes and side base holes both on paper and in the mould and also
has the additional problem of an evident cell collapse, especially at low temperatures. The
formulation is not known but the collapse can be due to slow curing and is more pronounced
with hydrophobic prepolymers due to loss of stabilization power of the silicone.
Besides the fact that some base holes and voids and pin holes are easily seen in table 6.3,
overall formulation 5528 has better results.
Looking at table 6.4, foam 5527 has a higher output than 5528 but both foams lay well
above the necessary 4,5 g/s limit [22]. So the output in both cases is high enough for standard
gun applications.
6.3. AltaFoam Monitor
In chapter 4 it was seen that with AFM it is possible to study the curing of the froth by
measuring temperature, pressure, post expansion and curing rate.
For each foam, 5 moulds have been sprayed and the temperature and pressure
development was recorded during 8 hours.
The graphs are to be found in Appendix 10.3 and the summarized results in table 6.5.
Table 6.5 – Results of AFM.
Temperature Post
Expansion Pressure Curing
Formulation Tmin (ºC) Tmax (ºC) PE% kPa Alfa
5527 19,1 26,9 -2,9 5,6 77,1
5528 21,3 28,3 1,1 12,3 82,9
Measuring post expansion the meter can be disturbed, for example, if there is no barrier
around the foam, whilst expanding it can fall down the side and cause errors in the readings.
Therefore figures, which were very disperse, have been discarded.
6.3.1. Discussion of AFM Results
Comparing the results for both foams that are shown in table 6.5, one may see that they are
quite similar and that only pressure shows a higher value for 5528 than for 5527.
Looking at post expansion and despite the fact that some values were not taken into
account, it is possible to conclude that these foams do not have a high outflow level.
6.4. Physical Properties
Graphs of physical properties are shown in Appendix 10.4 and the values in table 6.6.

35
Table 6.6 – Physical properties.
Shear Strength Compression
Strength @ 10% Max Adhesion
Elongation @
max Adhesion
kPa kPa kPa %
Typical range [13] > 50 > 100 > 145 > 15
5527 24,6 ± 4,6 24,6 ± 5,2 27,5 ± 3,7 8,9 ± 1
5528 46,5 ± 4,3 25,8 ± 1,3 60,3 ± 7,7 15,2 ± 0,2
6.4.1. Discussion of Physical properties
The results for 5528 are clearly higher than for 5527. The differences are more distinctive in
maximum adhesion and shear strength.
The higher values in maximum adhesion and shear strength are concordant with the results
obtained in the quick test. A better base holes rating due to the effective bigger adhesion
surface produced a better result in those two properties.
The properties of 5528 are closer to the typical range of fixation foams.
6.5. Door Test
The door tests were done with foam 5527 and 5528 at 23/23 and at 5/5 both with a 50% of
relative humidity and with a doorframe that was completely foamed in. Total calculated surface
of the foam area was 0,614 m2. The real surface of the foam is reduced if the side base holes
are increased and this happens mainly with foam 5527.
Although it is possible to observe that the maximum displacement of the foam 5528 was
significantly smaller than that of the foam 5527. This could have been predicted by looking at
the evaluation of the higher number and size of the base holes and side base holes and the
lower physical properties of foam 5527.
Both foams pass the entire test because the maximum displacement of 1 mm is not
reached in any of the tests.
Door closing test results
In this test sensor 2 was the most affected one; this means that the maximum displacement
is highest at the top of the door on the handle side and thus where the door is closed. The
results are poorer when the foams are sprayed out of a can at 5ºC and cured at 5ºC.
The foam 5528 scores better than the 5527, especially at 5/5 the foam 5527 almost reaches
the limit of 1 mm.

36
Table 6.7 – Door closing results.
Foam formulation Temperature
can/cure (ºC)
Maximum
Displacement (mm)
23/23 0,6 5527
5/5 0,9
23/23 < 0,1 5528
5/5 0,25
Vertical load test results
Sensor 1 was the most affected one, which is normal since hanging on the door will affect
the upper hinge the most.
Again the better results of the foam 5528 are more pronounced at 5/5.
Table 6.8 – Vertical load test results.
Foam formulation Temperature
can/cure (ºC)
Maximum
Displacement (mm)
23/23 0,55 5527
5/5 0,90
23/23 0,50 5528
5/5 0,55
Doorstop test results
In the doorstop test the results are inverted: foam 5527 scores better than 5528 and the
sensor that has the biggest displacement is different in both cases. Sensor 2 has the highest
displacement during the test with foam 5527 and sensor 3 has the highest displacement during
the test with the foam 5528.
Table 6.9 – Doorstop test results.
Foam formulation Temperature
can/cure (ºC)
Maximum
Displacement (mm)
23/23 0,40 5527
5/5 0,53
23/23 0,80 5528
5/5 0,60
The two foams pass the doortest when fully foamed in.
Further investigation is possible to determine the minimum foamed surface necessary to
pass the doortest in both temperature conditions.

37
6.6. DimStab
Dimstab test were performed in the two foams available. The foams were cured at 23.
Table 6.10 – Dimstab results for 5527 foam.
Foam formulation Days of
storage
Change
dimensions
Change
height
Change
warping
7 0,46% 1,35% 5,00%
14 0,64% 1,80% 6,52%
21 0,58% 1,64% 5,76% +45°C / 80%RH
28 0,90% 1,67% 5,76%
7 0,37% 0,87% 2,92%
14 0,68% 1,54% 4,41%
21 0,53% 1,57% 5,15% +23°C / 50%RH
28 0,66% 1,37% 3,67%
7 0,61% -0,15% 3,76%
14 1,00% 1,01% 3,76%
21 1,39% 1,50% 3,76% -20°C
28 1,10% 1,54% 3,76%
Table 6.11 – Dimstab results for 5528 results.
Foam formulation Days of
storage
Change
dimensions
Change
height
Change
warping
7 2,57% 5,47% 5,80%
14 2,94% 5,93% 5,80%
21 2,65% 5,67% 6,57% +45°C / 80%RH
28 2,42% 5,73% 6,57%
7 0,59% 1,98% 6,12%
14 1,24% 2,68% 6,12%
21 1,24% 3,76% 6,12% +23°C / 50%RH
28 1,29% 3,71% 6,12%
7 2,26% 2,55% 7,16%
14 2,93% 3,10% 7,95%
21 3,36% 3,31% 8,74% -20°C
28 3,59% 4,37% 8,74%

38
6.6.1. Discussion of dimstab results
For the results of the dimstab to be acceptable it is necessary that the maximum values are
–1% for –20 ºC, 2% for 23 ºC and 4% for 45 ºC. [22]
Looking at the results obtained it is clear that the results for 5528 are worst than for 5527,
especially when the temperature decreases.
Globally the results are not acceptable, in particular when analyzing the warping change.
6.7. Aging test
The aging tests were performed for the last 3 weeks, week 6 (corresponding to 42 weeks at
23ºC), week 7 (49 weeks at 23ºC) and week 8 (56 weeks at 23ºC).
The summarized results can be seen in table 6.12 below.
Table 6.12 – Aging test results for foam formulation 5527 and 5528.
Week 6 @ 45ºC Week 7 @ 45ºC Week 8 @ 45ºC
23/23 5/5 23/23 5/5 23/23 5/5
Paper AC NAC NAC AC AC AC
Mould NAC AC NAC NAC NAC NAC
ODM (g/L) 17,35 16,56 17,32
5527
Output Foam
(g/s) 23,0 23,7 22,2
Paper AC AC AC AC AC AC
Mould AC NAC NAC NAC NAC NAC
ODM (g/L) 16,65 15,22 16,82
5528
Output Foam
(g/s) 13,2 15,8 13,3
6.7.1. Discussion of aging test results
The typical range for the storage life is 12 months when stored at 20ºC. [23]
Comparing table 6.2, quick test results, and table 6.4, output test results, with table 6.12,
aging test results, it is possible to conclude that the storage life is not concordant with what was
expected because an old can should lose some properties and one of the easiest ones to see is
the viscosity that normally increases over time.
It is possible to conclude that the cans can be stored for a year without loosing their
properties.

39
6.8. Conclusion
As previously mentioned in this chapter, the main propose of this study was to compare an
alternative foam with a foam that is already available in the market. However it is also our wish
to understand which are the conclusions that can be drawn from a full benchmarking report.
Since Soudal disclosed so little information about the two formulations to be tested the
conclusions are only qualitative, that is to say, the conclusions are based solely on the results
obtained and are not connected with the chemical properties that are so important in PU foams.
Taking into account that the results for the new foam are better or quite similar, the already
existing foam can be replaced by the new alternative foam, 5528.

40
7. Developed work
In this chapter a re-formulation study of one component PU foam will be described since
this is the main purpose of the present thesis.
7.1. Re-formulation [13]
A re-formulation consists in taking one formulation, analysing its properties and improving
the ones that are not satisfactory by changing the initial formulation. This is tried until the
properties achieved are acceptable.
The foam that will be subject to reformulation in this project is of the economic and B3 type.
An economic foam system is applied and has acceptable properties at 23/23 ºC. Minimum
acceptable results mean that when tested the foam presents no outflow, no curing streaks, no
crumbling and no cell collapse. The flame retardancy parameter classifies the foam as B1, B2
and B3. B3 foam is the most common type due to being the cheaper one although is the less
flame retardant.
Foams are also divided according to the way in which they are applied. Standard applied
foams are the ones with a plastic adapter and tube-based in the do it your self industry. The
other ones are gun applied foams, which means a foam dispensing gun, and are mostly used
for professional purposes. This project is about an adapter applied foam.
To re-formulate the project the foams have been evaluated at 23/23 ºC and 5/5 ºC on paper
and on mould, and scored in a quick test sheet. The best formulations, which means the ones
with better results, gave origin to the ones that followed. Besides having used the multisimplex
software, some formulations were developed by analysing the best results that had been
obtained.
7.1.1. AEB3 Project
The characteristics of the initial trial, 3864 AEB3, are shown in tables 7.1 and 7.2.
Table 7.1 – Part/weight of the polyol blend to make 3864 AEB3.
Component Part/weight
GP1000 70
VD1000 30
FCA202 5,15
Cereclor S45 88
B8870 8,90
DMDEE 1,00

41
Table 7.2 – Control Variables for 3864 AEB3 project.
Formulation % Gas DME (weight
parts) OHv %NCO
3864 AEB3 43 24 174 17,2
Before looking at the quick test results of this initial formulation it is important to notice that
GP1000 and VD1000 have the same part per weight - 70 and 30, respectively - in all the
formulations developed for this project.
Polyols are very important. First of all, because they are the reagents that react with MDI to
originate polyurethane but also because of their influence in polymer properties.
Polyols can vary in equivalent weigth, functionality and the degree of rigidity or flexibility
depend on the different chain units in the polyols. For example typical groups that impart
flexibility to the polymer chain are ester and ether groups.
The functionality of the polyols has a profound effect on the properties of rigid foams. Higher
polyol functionality favours greater heat resistance and dimensional stability. The compressive
strength of the foams increases with increased functionality, while the tensile strength and
elongation tend to decrease.
Diols originate less crosslinking in the foam, which means that the foam is less branching.
Since dimensional stability and friability vary in opposite directions with the OHv of the
polyol, a compromise must be carried out to obtain a balance of properties.
So being the GP1000 a polyol with functionality 3, and VD1000 a polyol with functionality 2,
it is important to balance these two components with the purpose to obtain a foam that is not
very rigid and that has no problems like shrinkage and outflow. The proportion of polyols in this
work is a result of conclusions reached in previous projects.
Besides that, nowadays polyols like GP1000 are the more common flame retardants used.
The full quick test results of this project are shown in Appendix 10.5.
A quick test was done and therefore it is possible to evaluate the foam properties.
Table 7.3 – Quick test results for formulation 3864 AEB3.
3864
23/23 5/5
Paper AC NAC
Mould AC AC
ODM (g/L) 30,0
Output Foam (g/s) 14,2

42
The results are quite good, with acceptable results on mould and on paper at 23/23ºC.
Output foam is also above the limit of 4,5 g/s [18] and ODM is between the typical range for
OCF, that is 25 to 30 g/L [19].
The non-acceptable results at 5/5ºC on paper are due to the bad results in the baseholes
and cell collapse rating.
Baseholes are created due to the evaporation of high boiling point gases that are connected
to low viscosity froth, gas mixtures that are very soluble in the prepolymers and dry porous
materials.
The low viscosity froth is usually linked to a low viscosity prepolymer in the aerosol can.
This can be a result of a lower degree of prepolymerization of the prepolymers, which means a
higher NCO:OH value, or a result of low viscous polyol blends with low viscous MDI that creates
low viscosity prepolymers at the same NCO:OH value. Or it can finally be a result of a low
catalyst level, which leads to less side reactions and also low viscosity in the final prepolymers.
The gas mixtures also influence the baseholes, because when the gas is dispensed, it does
not escape through the paper. At low temperatures this phenomenon increases due to the fact
that the solubility of gas at lower temperature is better than at high temperature.
Dry porous materials are absorbing the foam layer, creating gas pockets and releasing gas
that dissolves the foam and causes the base holes.
Summarizing, a certain viscosity is necessary, that makes the gas less soluble in the foam.
A bad cell collapse rating happens because the froth is curing too slowly and this way the
silicone surfactant loses its stabilization power and causes coalescence of cells.
With this interpretation of the results it is possible to obtain new formulations that try to
improve the foam properties.

43
Table 7.4 – Re-formulation of 3864 AEB3.
3883 3884 3885 3886 3887 3888
FCA202
(part/weight) 5,40 5,61 5,40 5,40 5,40 5,40
Cereclor S45
(part/weight) 89 89 89 89 89 89
B8870
(part/weight) 11,60 13 11,60 11,60 11,60 11,60
DMDEE
(part/weight) 1,00 1,00 1,20 1,40 1,00 1,00
Niax A1 - - - - 0,15 0,30
%Gas 44 44 44 44 44 44
DME (weight
parts) 25 25 25 25 25 25
OHv 173 173 173 173 173 173
% NCO 17,2 17,2 17,2 17,2 17,2 17,2
The only formulation obtained by the Multisimplex software was the first one, 3883. The
other ones were obtained by combining the problems detected with the reagents that should
solve them.
The major differences between the initial formulation on table 7.1 and 7.2, and the following,
on table 7.4, are
• More FCA 202
• More B8870
• More DMDEE
• Addition of a new catalyst, Niax A1
FCA 202 is a low molecular diol and therefore increasing this reagent will result in more
chain fractions with urethanes groups and consequently will give more rigidity to the foam. This
increase will also affect the viscosity of the prepolymer because more OHv results in a more
viscous prepolymer.
The addition of more silicone, B8870, provides a better cell stabilization, which is very
important for cell collapse.
More catalyst, either by increasing the amount of DMDEE or by adding a new catalyst Niax
A1, is essential because this will balance the polymer growth with gas formation. Besides the
fact that more catalyst will influence the reactions rate, it is important to have a certain degree of
prepolymerization.

44
The difference between the two catalysts is that DMDEE is more sterically hindered and so
will only promote the NCO reaction with water, figure 3.5, while Niax A1 will also promote the
reaction with urethanes group, figure 3.6, giving a more reticulate and resistant foam.
The results are shown in table 7.5.
Table 7.5 – Quick test results for formulations 3883 to 3888 AEB3.
3883 3884 3885 3886 3887 3888
23/23 5/5 23/23 5/5 23/23 5/5 23/23 5/5 23/23 5/5 23/23 5/5
Paper NAC NAC NAC NAC NAC NAC NAC NAC NAC AC NAC NAC
Mould AC AC AC AC AC AC NAC AC AC AC NAC AC
ODM (g/L) 24,86 25,08 25,86 25,51 24,83 24,71
Output
Foam (g/s) 20,4 19,3 22,6 21,2 22,1 22,0
Looking at the results table one can easily verify that the results on paper are much poorer
than in the initial trial. In the mould, on the whole, the results are acceptable.
The output foam increases. This means that the viscosity did not increase with the
reformulation carried out, by increasing FCA202 and catalyst. This means that the degree of
prepolymerization achieved with more catalyst is not enough to change the viscosity of the
prepolymer and also the increased quantity of FCA202 is not enough to change this property.
It is therefore essential to look again for the detected problems in foam evaluation.
First of all it is important to notice that the baseholes problem is solved. No foam presents a
low baseholes rating. The increase of rigidity of the foam (FCA202) joined with
prepolymerization degree (catalyst) was enough to improve this property. But cell collapse is still
a problem in these new formulations.
The other problems detected were the bad shaking rate at low temperatures, cell structure
and voids and pin holes.
Shaking rate is related to the viscosity of prepolymers and also to the age of the can. Since
the age of these formulations is the same as the initial one this possibility was excluded. As
seen before, since viscosity does not seems to increased by this reformulations, the problem
could be a result of a bad solubility of gases inside the can.
Cell structure is related to the size and distribution of the cells in the sample. An optimum
cell structure is when it presents fine cells, homogeneously distributed. Normally this property
can be affected by low viscosity and low temperature. However in this case the cell structure in
both temperatures is almost the same but the minimum value for an acceptable result, in this
response variable, is higher at high temperatures and due to that cell structure at 23/23 ºC is not
acceptable.
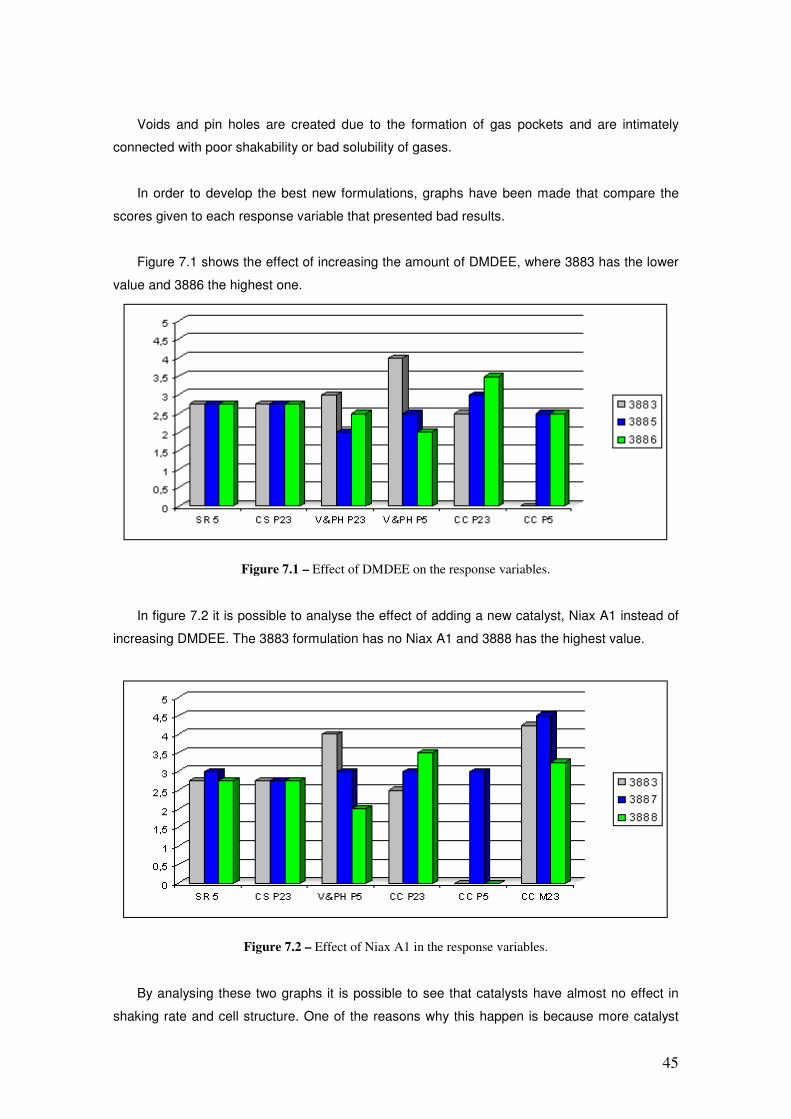
45
Voids and pin holes are created due to the formation of gas pockets and are intimately
connected with poor shakability or bad solubility of gases.
In order to develop the best new formulations, graphs have been made that compare the
scores given to each response variable that presented bad results.
Figure 7.1 shows the effect of increasing the amount of DMDEE, where 3883 has the lower
value and 3886 the highest one.
Figure 7.1 – Effect of DMDEE on the response variables.
In figure 7.2 it is possible to analyse the effect of adding a new catalyst, Niax A1 instead of
increasing DMDEE. The 3883 formulation has no Niax A1 and 3888 has the highest value.
Figure 7.2 – Effect of Niax A1 in the response variables.
By analysing these two graphs it is possible to see that catalysts have almost no effect in
shaking rate and cell structure. One of the reasons why this happen is because more catalyst

46
affects primarily the rate of the reactions. This means that being both response variables
mostly, although not only, affected by viscosity of prepolymer it is expected that the catalyst has
no influence on them due to not having a direct influence on that property.
Voids and pin holes and cell collapse are clearly affected by catalyst. Besides the rate of the
reaction catalyst establishes a balance between the chain propagating reaction and the foaming
reaction, which means that there has to exist a balance between polymer growth and gas
formation. This equilibrium will be one of the major reasons for the occurrence or not of cell
collapse and voids.
In voids and pin holes when more catalyst is added, poorer results will occur. In paper at
23/23 ºC this is not seen in the case of the formulation that has more catalyst added. This could
be an effect of catalyst together with high temperature.
Cell collapse has no behavior pattern with catalyst but for all conditions (P23, P5, M23) it
seems that the best option is the middle amount of catalyst. Just like in voids and pin holes
perhaps to achieve the necessary balance.
Finally it is possible to conclude that the two catalysts have not very different effects on the
final properties of the foam.
No more graphs were possible to do for the reason that the other changes were made in
more than one control variable. It has to be always kept in mind that although these graphs are
trying to analyse the effect of one control variable in a response variable, they are not
independent of the other control variables, which means that these graphs only have meaning
in the case of this project’s formulations.
Table 7.6 – Formulations 3908 and 3910 AEB3.
3908 3910
FCA202 (part/weight) 5,54 5,46
Cereclor S45 (part/weight) 88 89
B8870 (part/weight) 9,50 12,00
DMDEE (part/weight) 1,00 1,00
Niax A1 - 0,15
%Gas 46 44
DME (weight parts) 25 27
OHv 176 173
% NCO 16,9 17,2
To develop these formulations one of the aspects that was taken into account was that
formulation 3887 presented the best results only with bad cell structure.

47
The reagents that have been changed were:
• FCA 202
• B8870
• % Gas
• DME
• OHv
Occurrence of voids can be minimized by improving the miscibility of gases. One way to do
it is through the use of a solvent, like DME, and the other is increasing the amount of gas that is
present in the formulation by reduction of viscosity.
The presence of DME is also advantageous to achieve a good shaking rate.
One of the functions of silicone is nucleation. This way silicone, which tends to lower the
surface tension of the foam components, will promote early nucleation and fine cells, and thus
improve cell structure. Besides that, cell collapse is still happening probably due to slow curing
rate and it is necessary to increase its quantity to create more surface stabilization and avoid
the coalescence of cells.
OHv is connected with viscosity. Increasing its value will increase the viscosity since the
polyol is more viscous than MDI and therefore a more viscous prepolymer will result. This is
especially important in order to balance the increase of gas.
Results of previous formulations are shown in the table below.
Table 7.7 – Quick test results of formulations 3908 and 3910 AEB3.
3908 3910
23/23 5/5 23/23 5/5
Paper NAC AC AC NAC
Mould NAC NAC NAC NAC
ODM (g/L) 22,19 41,71
Output Foam (g/s) 20,9 19,7
Formulation 3910 presents the worst results due to still very bad cell collapse and the voids’
and pin holes’ rating. However notice that is the only where cell structure problems were solved,
maybe for having the bigger amount of silicone and DME that promote the formation of more
fine cells. Density is also very high for this type of formulations. Since there is no reasonable
explanation, this high value in density could be an error of measure.
Voids and pin holes problems were solved in 3908 formulation.
Cell collapse is still a problem but in the 3908 formulation it was improved on paper.
Through the analysis of the results obtained it is not clear which is the best silicone quantity.
Base holes show up again in formulation 3908; this could be a result of too much gas.

48
Since the problems were the same as those described in the previous pages, new
formulations were developed.
Table 7.8 – Formulations 3960 and 3961 AEB3.
3960 3961
FCA202 (part/weight) 5,54 5,54
Cereclor S45 (part/weight) 88 88
B8870 (part/weight) 9,50 9,50
DMDEE (part/weight) 1,00 1,00
Niax A1 0,25 0,25
%Gas 46 46
DME (weight parts) 25 30
OHv 176 176
% NCO 16,9 16,9
It was decided to try the lower value for the silicone B8870 first, since a higher quantity does
not seem to improve the properties of the foam.
A new approach of cell structure can be made. Combining viscosity and miscibility in
prepolymer influences cell structure. There has to be a certain viscosity, by adding more
catalyst for example, due to the higher number of side reactions that will happen or to the bigger
degree of prepolymerization, but also provides a higher quantity of gas. These two properties
combined have to be balanced to promote the formation of fine cells and not of gas pockets.
Therefore the viscosity must not be so high as to not allow the gas to come out and the gas
must not be so high as to not allow cell stabilization.
Finally for cell collapse the increase of catalyst could be also good because cell collapse
among other things is created by slow curing rate and with catalyst the cure of the froth is faster
and possibly there is no time to cell coalescence.
Table 7.9 shows the results for formulations 3960 and 3961.
Table 7.9 – Quick test results for 3960 and 3961 formulations.
3960 3961
23/23 5/5 23/23 5/5
Paper NAC NAC NAC NAC
Mould NAC NAC NAC NAC
ODM (g/L) 25,02 22,51
Output Foam (g/s) 11,8 23,7

49
No important improvements were noticed. Cell collapse is still the major concern.
The only thing to take attention to is that on mould at 5/5ºC formulation 3960 has serious
problems with voids and pin holes, base holes and cell collapse.
No substantial improvements occur on cell structure.
With the two developed formulations it is possible to see the influence of DME on the
properties of the foam, figure 7.3.
Figure 7.3 – Effect of DME on the response variables.
Figure 7.3 shows that, on the whole, the properties at high temperatures are better with
lower amounts of DME, formulation 3960, and at low temperatures they are better with higher
values, formulation 3961. There are no doubts that solubility of blowing agents is indispensable
to obtain a good foam but is also known that their solubility is greatly influenced by temperature,
it decreases as temperature rises. When the temperature is higher the solubility will be lower,
which means that more gas will be retained in the foam, and so the higher the amount of gas
the higher the probability of more problems occurring.
This conclusion is not verified for low temperatures on paper. On paper the foam is less
protected and so it will be easier for the gas to escape. If the quantity of gas is too high, the
quantity of the other reagents that are included in the formulation may not be the same and do
not balance the quantity of gas that is escaping therefore originating worse problems.
With this graph it is easy to conclude that DME cannot be changed without any change in
the others reagents because it has to be related with them. For example, if the DME quantity is
increased, a better solubility in the prepolymer will take place but if this is not connected with an
increased quantity of silicone there will be no improvements on cell stabilization and then the
properties could worsen specially regarding cell collapse, cell structure, base holes and voids
and pin holes.

50
A new formulation was developed considering that as no new problems appear it will be
assumed that the quantity of silicone is reasonable for the next formulations until some problem
connected with it appears and also that catalyst does not seem to have a significant role in this
project.
Considering again formulation 3908 the role of the viscosity will be analyzed by decreasing
the amount of %NCO.
Table 7.10 – Formulation 6003 AEB3.
6003
FCA202 (part/weight) 5,54
Cereclor S45 (part/weight) 88
B8870 (part/weight) 9,50
DMDEE (part/weight) 1,00
Niax A1 -
%Gas 46
DME (weight parts) 25
OHv 176
% NCO 17,4
Increasing the OHv helped to improve the cell structure in the 3908 formulation.
A bigger NCO value corresponds to a larger free isocyanate and as MDI has a lower
viscosity than polyol blend the higher amount of it will contribute to dilute the prepolymer inside
the can.
This is the same that was done in formulations 3960 and 3961 but in that case the viscosity
was reduced by increasing the amount of DME.
The results are shown in table 7.11.
Table 7.11 – Quick test results of 6003 AEB3 formulation.
6003
23/23 5/5
Paper NAC AC
Mould NAC AC
ODM (g/L) 22,72
Output Foam (g/s) 15,7
So far, this formulation presents the best results of this project that are acceptable at 5/5 ºC.
Cell collapse is the only problem that was detected.
The graph below shows the effect of NCO on the response variables.

51
Figure 7.4 – Effect of NCO on response variables.
A low viscosity in the prepolymer could interfere in the size and distribution of the cells but
also if it is high. By analysing figure 7.4, for these proportions of reagents the better value for
cell structure is the lower viscosity that is the higher value of NCO, formulation 6003. The
conclusion in the case of base holes is the same as in the case of cell structure, because the
lower the viscosity, the easier the gas escapes due to not having time to create gas pockets.
Finally, cell collapse is worse for higher quantities of NCO. This could be explained by the fact
that the viscosity is too low for the amount of silicone that was used.
At this stage it is important to analyse in more detail why in all formulations cell collapse is
the major difficulty to solve in the current project. It is known that, despite the influence of the
other components of foam, silicone has an essential role in this problem. The only formulation
where cell collapse did not take place was in formulation 3887 that was the first one with a small
amount of catalyst.
As seen in chapter 3 a balance has to be established between polymer growth and gas
formation in order to entrap the gas efficiently and to develop sufficient strength in the cell walls
at the end of the foaming reaction to maintain their structure without shrinkage or collapse,
caused by the catalysts. For that reason besides looking for silicone it is essential to look for the
amount of catalyst.
Three new formulations were developed. First by following the conclusions from the
previous formulations, where the viscosity of prepolymer is very important and then taking into
account that viscosity changes cannot be dissociated from the changes in another reagents,
specially catalyst and silicone.

52
Table 7.12 – Formulations 6020 to 6022 AEB3.
6020 6021 6022
FCA202 (part/weight) 5,54 5,54 5,93
Cereclor S45 (part/weight) 88 88 88
B8870 (part/weight) 9,50 9,50 12,00
DMDEE (part/weight) 1,00 1,00 1,00
Niax A1 0,15 0,30 0,30
%Gas 46 46 46
DME (weight parts) 25 25 25
OHv 176 176 176
% NCO 17,4 17,4 17,4
The first two formulations are just an update of 6003 together with 3887, the only
formulation without cell collapse problems with addition of NiaxA1. The 6022 formulation took
into account not only the catalyst but also the fact that efficient froth stabilization is necessary,
which is obtained by adding more silicone and also FCA 202.
Table 7.13 – Quick test results of 6020 to 6022 AEB3 formulations.
6020 6021 6022
23/23 5/5 23/23 5/5 23/23 5/5
Paper NAC NAC NAC NAC NAC NAC
Mould AC NAC AC NAC NAC AC
ODM (g/L) 19,83 23,25 26,11
Output Foam (g/s) 18,1 17,7 16,5
Instead of improving, the results were poorer. Cell collapse became worse, especially on
paper and at 5/5 ºC. Increasing the quantity of catalyst alone doesn’t improve the properties of
the foam but also changing more than one reagent without any study is not a good solution. The
changes must be logical and interconnected.
In this stage of the work developed, one of the main conclusions is that when changes are
made in one reagent they will have an impact on the other ones since the existing equilibrium is
broken. And this is the major concern when carrying out a tuning up of OCF foams. The
problems and the reagents are not independent of each other.
In order to try to organize the findings a comparative table - table 7.14 – was created
between the formulations that originated the best scores until now, 3887 and 6003, and the last
ones.

53
Table 7.14 – Comparative table between the formulations that originated the best results, 3887 and 6003,
and the last ones, 6020-6022.
3887 6003 6020 6021 6022
FCA202
(part/weight) 5,40 5,54 5,54 5,54 5,93
Cereclor S45
(part/weight) 89 88 88 88 88
B8870
(part/weight) 11,60 9,50 9,50 9,50 12,00
DMDEE
(part/weight) 1,00 1,00 1,00 1,00 1,00
Niax A1 0,15 - 0,15 0,30 0,30
%Gas 44 46 46 46 46
DME (weight
parts) 25 25 25 25 25
OHv 173 176 176 176 176
% NCO 17,2 17,4 17,4 17,4 17,4
Table 7.15 – Reported problems in the best formulations until now and the last ones.
3887 6003 6020 6021 6022
Cell structure
P23 Cell collapse 23
- Cell collapse P
- Baseholes M5
- Cell collapse P
- Baseholes M5
- Cell collapse P
- Cell structure &
cell collapse
M23
Analysing the 3887 and the 6003 formulations and their problems it is clear that a
connection must be established between silicone, catalyst and gas.
Taking a look at formulation 6020 and 6021 and their problems, it is clear that if cell
collapse remains and if a new problem - base holes - appears when more catalyst is added a
change in B8870 and in gas is required because of the occurrence of a not very good froth
stabilization and a good solubility of gases.

54
Table 7.16 – Formulations 6043 and 6044 AEB3.
6043 6044
FCA202 (part/weight) 5,93 5,93
Cereclor S45 (part/weight) 88 88
B8870 (part/weight) 12,00 12,00
DMDEE (part/weight) 1,00 1,00
Niax A1 0,30 0,30
%Gas 46 46
DME (weight parts) 30 40
OHv 176 176
% NCO 17,1 17,1
Decreasing the NCO amount causes a more viscous prepolymer that should be adjusted by
adding more DME in order not to lose the solubility of the gases inside the can. For this to work
properly it is indispensable to promote good froth stabilization by adding more silicone.
The results achieved with these formulations are shown in table 7.17.
Table 7.17 – Quick test results of 6043 and 6044 AEB3.
6043 6044
23/23 5/5 23/23 5/5
Paper AC NAC NAC NAC
Mould AC NAC NAC NAC
ODM (g/L) 33,05 31,52
Output Foam (g/s) 24,3 31,6
The output test indicates that the quantity of DME in the 6044 formulation was too high and
did not improve the properties of the foam. Actually the results are worse than those of the 6043
formulation. Therefore, and analysing figure 7.3, the conclusion is that higher amounts of DME
are not always the best option to increase solubility and decrease viscosity of prepolymer
particularly if not connected with the other reagents.
The reported problems in the 6043 formulation are voids and pin holes and cell collapse at
5/5 ºC.
Since almost everything had already been tried, a new approach to the problem was
deemed necessary.
And what if the viscosity is too low and does not allow good froth stabilization over the
curing time? If this is true the rapid outgoing of the gas causes more cell coalescence since the
silicone effect has no time to stabilize the froth correctly and as a consequence cell collapse
and voids will occur.

55
When changing the OHv by adding more FCA 202 it is possible to increase viscosity and to
develop new formulations.
Table 7.18 – Formulations 6064, 6065 and 6066 AEB3.
6064 6065 6066
FCA202 (part/weight) 6,55 7,34 8,15
Cereclor S45 (part/weight) 88 88 88
B8870 (part/weight) 12,00 12,00 12,00
DMDEE (part/weight) 1,00 1,00 1,00
Niax A1 0,30 0,30 0,30
%Gas 46 46 46
DME (weight parts) 30 30 30
OHv 180 185 190
% NCO 17,1 17,1 17,1
The summarised results are shown in table 7.19.
Table 7.19 – Quick test results of formulations 6064-6066 AEB3.
6064 6065 6066
23/23 5/5 23/23 5/5 23/23 5/5
Paper NAC NAC NAC NAC NAC NAC
Mould AC NAC NAC NAC AC AC
ODM (g/L) 28,18 29,17 26,24
Output Foam (g/s) 21,6 21,3 22,3
A graph was then created - figure 7.5 – in order to analyse the behaviour of properties of
the foams with the quantity of OHv.
Figure 7.5 – Effect of OHv in response variables.
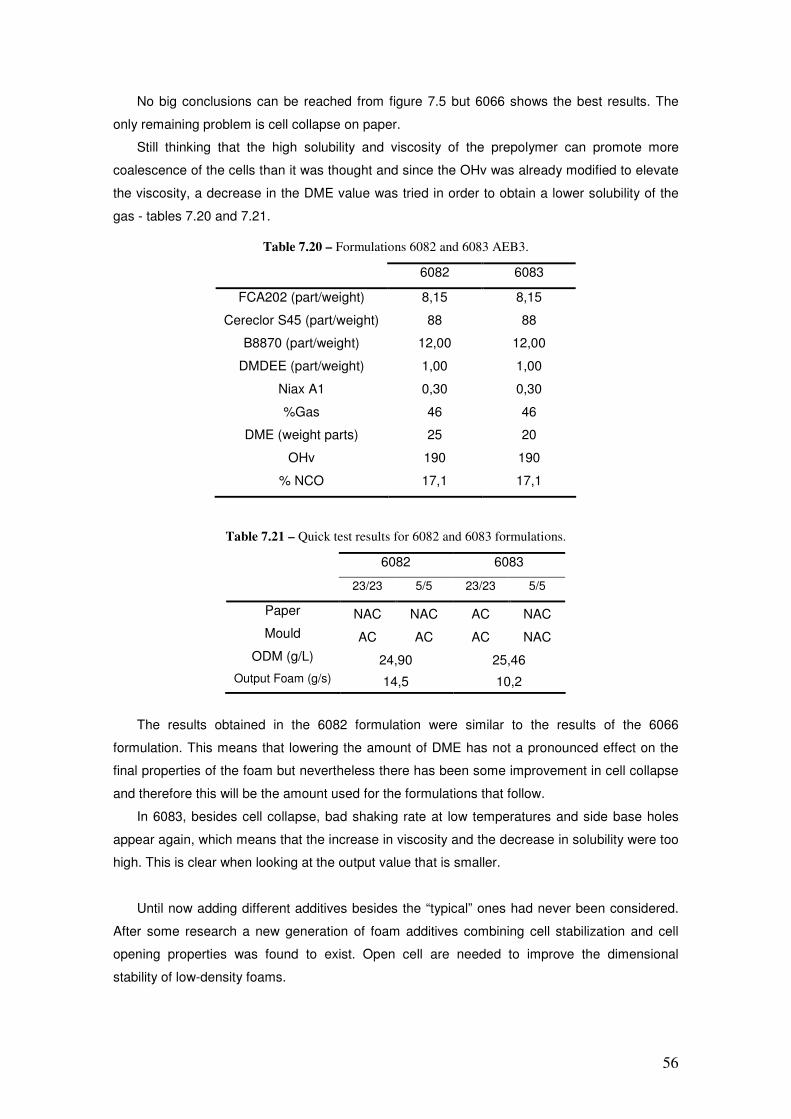
56
No big conclusions can be reached from figure 7.5 but 6066 shows the best results. The
only remaining problem is cell collapse on paper.
Still thinking that the high solubility and viscosity of the prepolymer can promote more
coalescence of the cells than it was thought and since the OHv was already modified to elevate
the viscosity, a decrease in the DME value was tried in order to obtain a lower solubility of the
gas - tables 7.20 and 7.21.
Table 7.20 – Formulations 6082 and 6083 AEB3.
6082 6083
FCA202 (part/weight) 8,15 8,15
Cereclor S45 (part/weight) 88 88
B8870 (part/weight) 12,00 12,00
DMDEE (part/weight) 1,00 1,00
Niax A1 0,30 0,30
%Gas 46 46
DME (weight parts) 25 20
OHv 190 190
% NCO 17,1 17,1
Table 7.21 – Quick test results for 6082 and 6083 formulations.
6082 6083
23/23 5/5 23/23 5/5
Paper NAC NAC AC NAC
Mould AC AC AC NAC
ODM (g/L) 24,90 25,46
Output Foam (g/s) 14,5 10,2
The results obtained in the 6082 formulation were similar to the results of the 6066
formulation. This means that lowering the amount of DME has not a pronounced effect on the
final properties of the foam but nevertheless there has been some improvement in cell collapse
and therefore this will be the amount used for the formulations that follow.
In 6083, besides cell collapse, bad shaking rate at low temperatures and side base holes
appear again, which means that the increase in viscosity and the decrease in solubility were too
high. This is clear when looking at the output value that is smaller.
Until now adding different additives besides the “typical” ones had never been considered.
After some research a new generation of foam additives combining cell stabilization and cell
opening properties was found to exist. Open cell are needed to improve the dimensional
stability of low-density foams.

57
The additives used were Witco L6164 and Osi L5348.
Table 7.22 – Formulations 6096 to 6099 AEB3.
6096 6097 6098 6099
FCA202 (part/weight) 8,15 8,15 8,15 8,15
Cereclor S45 (part/weight) 88 88 88 88
B8870 (part/weight) 12,00 12,00 12,00 12,00
DMDEE (part/weight) 1,00 1,00 1,00 1,00
Niax A1 0,30 0,30 0,30 0,30
Additive 0,15
(Witco L6164)
0,30
(Witco L6164)
0,15
(Osi L5348)
0,30
(Osi L5348)
%Gas 46 46 46 46
DME (weight parts) 25 25 25 25
OHv 190 190 190 190
% NCO 17,1 17,1 17,1 17,1
Table 7.23 – Quick test results of 6096 to 6099 AEB3 formulations.
6096 6097 6098 6099
23/23 5/5 23/23 5/5 23/23 5/5 23/23 5/5
Paper AC NAC NAC NAC NAC NAC NAC NAC
Mould AC AC NAC NAC AC AC AC NAC
ODM (g/L) 24,56 28,45 25,13 23,45
Output Foam
(g/s) 9,5 8,8 14,1 10,9
The graph below shows the effect of the two additives for two different quantities.
Figure 7.6 – Effect of additive on response variables.

58
In general the best results are obtained in the case of the ones that have lower amount of
additive, 6096 (Witco L6164) and 6098 (Osi L5348).
At the end of these formulations it will be assumed that no more improvements are possible
in this project. The best results obtained correspond to 6096 AEB3 formulation, they are even
better than those obtained in the initial formulation 3864 because it only presents cell collapse
on paper at 5/5ºC.
At the end of this re-formulation work, it is important to notice that the change made in
Cereclor S45, a plasticizer, was not analysed because it was too small. But this reagent plays
an important role in the formulation, which should not be underestimated. Plasticizers make the
prepolymers components more compatible and it is also them that open the space between the
molecular chains and thus help the water to react easier with the NCO groups to form polyurea
linkages. Plasticizer reduces tensile elongation and tear strengths and increases the density
and softens the foam.
In order to verify whether this formulation was acceptable within the OCF parameters a full
test was performed.
7.2. Full Test of 6096 AEB3
Because this was started in the final period of training it was not possible to perform all the
tests that are included in a full test. Therefore only the values for the tests that were completed
are shown.
7.2.1. Pictures
Table 7.24 – 6096 AEB3 Samples.
Substrate Can/
Cure 6096
23/23
Paper
5/5

59
23/23
Mould
5/5
7.2.2. Physical Tests
The full results are shown in Appendix 10.6.
Table 7.25 – Physical Tests Results.
Shear Strength Compression
Strength @ 10% Max Adhesion
Elongation @
max Adhesion
kPa kPa kPa %
Typical range [23] 22 – 50 33 – 120 85 – 150 8 – 20
6096 79,07 ± 2,56 33,70 ± 1,60 66,76 ± 1,35 10,33 ± 1,64
7.2.3. AltaFoam Monitor
The full results are shown in Appendix 10.7.
Table 7.26 – AltaFoam Monitor Results.
Temperature Post
Expansion Pressure Curing
Formulation Tmin (ºC) Tmax (ºC) PE% kPa Alfa
6096 18,39 28,33 58,40 19,76 61,34
The post-expansion measure has the same problem that was presented in chapter 6.
7.2.4. Discussion of results
The density and output rate are 24,56 g/L and 9,5 g/s, respectively, are between the typical
values for one component foams that are, as seen before, for density among 25 and 30 g/L and
for output rate the minimum required is 4,5 g/s.

60
The pictures on table 7.24 show a good foam especially on mould. Looking at the
correspondent picture, the cell collapse on paper at 5/5 ºC becomes clear.
Analysing the results of the physical tests on table 7.25, the values are quite good although
shear strength is bigger than necessary and adhesion is lower than it should be.
7.3. Conclusion
At the end of this chapter it is possible to reach some conclusions about the effect of the
reagents as well as about some combinations that can to be done in order to improve the
properties of the foam.
The effect of the most used reagents is described below.
The Polyols used are a combination of a triol with a diol; the purpose of combining these
two reagents is to obtain a foam that is not very rigid and that has no problems like shrinkage
and outflow. The triol used, GP1000, is also the flame retardant additive.
FCA 202, a low molecular diol, is responsible for the chain fractions with urethanes groups
and therefore increasing its quantity results in a more rigid foam. This will also affect viscosity
since more OHv results in more viscosity due to the fact that polyol is more viscous than MDI;
and obviously more MDI results in less viscous polymers.
Catalysts are essential to balance the polymer growth with gas formation.
Gases increase the miscibility of the gases by reducing the viscosity.
Silicone has a stabilization function because it tends to lower the surface tension of the
foam components and promotes early nucleation and fine cells.
Plasticizers make the prepolymers components more compatible and it is also them that
open the space between the molecular chains. Plasticizer reduces tensile elongation and tear
strengths, increases the density and softens the foam.
The main problems detected were baseholes, cell collapse, bad shaking rate, poor cell
structure and voids and pin holes.
Baseholes occur due to the evaporation of high boiling point gases. To solve this problem a
certain degree of prepolymerization resulting in a given viscosity is necessary, so that the gas
becomes less soluble in the foam.
Cell collapse occurs because the froth is curing too slow and silicone is loosing its
stabilization power. Therefore a combination between catalyst and silicone must be done in
order to guarantee a certain curing rate but also enough sufficient silicone to have stabilization
power during the curing.
Shaking rate is related to the viscosity of prepolymers and also to the age of the can. The
best way to achieve a good shaking rate is to obtain a balance of the viscosity and the solubility
in the prepolymer, that means it must not be too high neither too low.

61
Cell structure is related to the size and distribution of the cells in the sample. Usually this
property can be affected by low viscosity and low temperature.
Voids and pin holes occur due to the formation of gas pockets and are intimately connected
with poor shakability or bad solubility of gases.
Summing up, in order to obtain acceptable results on these properties it is necessary to look
mainly for viscosity, rigidity and miscibility of prepolymers. They should be correlated in the most
correct way so that the resulting polymer is neither too viscous nor too soluble.
Some of the conclusions that were drawn in this work were based on the graphs made.
These graphs show a relationship between some reagents and the final properties of the foam.
Catalysts have almost no effect in shaking rate and cell structure. One of the reasons why
this happens is because more catalyst affects primarily the rate of the reactions. This means
that being both response variables mostly, although not only, affected by the viscosity of the
prepolymer it is expected that the catalyst has no influence on them due to not having a direct
influence on that property. Voids and pin holes and cell collapse are clearly affected by catalyst
because these two properties are an effect of the balance between polymer growth and gas
formation.
The properties at high temperatures are better with lower amounts of DME and at low
temperatures they are better with higher values. When the temperature is higher the solubility
will be lower, which means that more gas will be retained in the foam, and so the higher the
amount of gas the higher the probability of more problems occurring. This conclusion is not
verified in the case of low temperatures on paper. On paper the foam is less protected and
therefore it will be easier for the gas to escape.
If the DME quantity is increased, a better solubility in the prepolymer will take place but if
this is not connected with an increased quantity of silicone there will be no improvements on cell
stabilization and then the properties could worsen specially regarding cell collapse, cell
structure, base holes and voids and pin holes.
Low viscosity in the prepolymer could interfere with the size and distribution of the cells but
also if it is high. The viscosity is too high for the amount of silicone that was used. The lower the
viscosity, the easier the gas escapes, not having time to create gas pockets.
Output rate is a good measure of the viscosity and solubility. If it is high it shows that there
is a great amount of gases in the prepolymer or that the viscosity is too low.
It is also useful to know that if the properties do not improve there are different new
additives that are not often used but that contribute to improve the foam properties. These foam
additives are mostly used to combine cell stabilization and cell opening properties.
The main conclusion of this part of the chapter is that in order to improve a property by
changing one reagent, the effect it will have on others must be taken into account because what
may be a benefit to one of them may be not a benefit to another.

62
Therefore a compromise between the various reagents must be reached in order to obtain
satisfactory properties.
As mentioned before, when the tuning up of a project is carried out it is essential to analyse
the problems that are detected. When there are only a few properties with bad results instead of
using the multisimplex software it is more convenient to change the different parameters without
that tool, and resort mainly to the experience obtained in other projects. When there are too
many parameters to control, the interpretation becomes very difficult and in this case
multisimplex is a very useful tool. In the AEB3 project almost all formulations have been
developed without the use of the multisimplex software.
The result of this re-formulation work was the 6096 AEB3 formulation. It was only possible
to make a few tests and the conclusion is that quite good results were obtained. Only adhesion
could be improved because the value for filling foam was lower than it was expected.
A final remark is done about this project because the first formulation 3864 AEB3 has no big
different results of the final formulation, 6096 AEB3. Therefore a suggestion is that when a foam
just presents one problem maybe is more advantageous to do the full test before do a
reformulation work because that foam could have already enough good properties for the
expected purpose. This way it is save time and money.
7.4. Brief Cost Optimisation [13]
Why talk about cost optimisation when a re-formulation is being developed? One of the
words that can summarize one component foam is “economical”.
Due to the severe price competition amongst OCF producers, more and more low density
foams are being produced that yield more litters of foam per aerosol can.
In addition and also thinking about price competition, higher amounts of low cost non
reactive fillers are added to the foam, that further decrease its physical properties. In such a
way that the physical properties of all OCF systems containing a high amount of low cost non
reactive fillers and a low foam density are so low that the minimum needed as a foamable
adhesive gap filler is no longer assured and fulfilled.
Therefore it is important to develop cost optimisation solutions in order to be competitive in
the market but it is also important to achieve the minimum requirements for the foam
applications. Otherwise poor foam properties can lead to big complaints due to foam failures,
which in the short term could become more expensive than if it reformulations were made that
take into account not only the price but also the minimum requirements for a filling or fixation
foam.

63
8. Conclusion
Polyurethanes form one of the most important classes of synthetic polymers. Urethane
foams occupy only a small percentage of the plastics industry at present, but in light of the
newness of urethanes and the rapid advancement in properties and property improvement the
end-use possibilities and growth for foams have exciting predictions.
One component foam is a semi rigid foam that is a self-expanding and self-adhesive
moisture curing gap filler with the main advantage that it is dispensed from a simple pressurized
container or aerosol-type and requires no mechanical or power source.
There are several methods to evaluate foams. In previous stages only the quick test sheet
that allows comparisons between the foam properties was used. In advanced phases of the
work tests like physical, AltaFoam Monitor, Dimstab and the door test were performed.
With the growing environmental concerns, the need to use environmentally friendly
compounds is increasing and polyurethanes foam industry does not escape from that.
The main conclusion of this work is that there are several reagents and additives that are
used in PU chemistry and that when a change is performed in one reagent it will have an impact
on the other ones, since the equilibrium between reagents and properties is broken. In other
words, the foam properties are not independent of each other and the same is true for the
reagents.
An easier way to make changes and try to analyse the real influence of each reagent on
each property when there are just a few properties to improve, is to modify one reagent in one
round of formulations and verify the differences that occur between formulations.

64
9. References
1. Phillips, L.N., Parker, D.B.V., Polyurethanes, Ed. of The Plastic Institute, 1st Edition,
1964, p1-5
2. Szycher, M., Szycher’s Handbook of Polyurethanes, 1st Edition, CRC Press, 1999
3. Woods, G., The ICI Polyurethanes Book, Ed. John Wiley& Sons, 1987
4. Lee, S.T., Armes, N.S., Polymeric Foams – Mechanisms and Materials, 1st Edition,
CRC Press, 2004, p1
5. Billmeyer Jr., F.W., Textbook of Polymer Science, 3rd
Edition, John Wiley& Sons, 1984
6. Pigott, K.A., Polyurethanes, John Wiley& Sons, 1969
7. Solomons, G., Fryhle, C., Organic Chemistry, 7th Edition, John Wiley& Sons, 2000
8. Bruins, P.F., Polyurethane technology, John Wiley & Sons, 1969, p3-4
9. Salamone, J.C., Polymeric Materials Encyclopedia – Volume 9, CRC Press, 1996
10. Schrijver, A., Cuvelier, D., 1K PU Foam is not equal to 1KPU Foam, Utech
Presentation, March 2003
11. Doyle, E.N., The Development and Use of Polyurethane Products, McGraw-Hill, 1971
12. Vilar, W., Química e Tecnologia dos Poliuretanos, www.poliuretanos.com.br, p11-15,
accessed in August 2008
13. Schrijver, A., Development guidelines on speciality PU foams in aerosol cans, Internal
Report, 15/09/2001
14. Claro, J.C., Poliuretanos, UTAD, 2001, p30, 68
15. Clara, M.N., Santos, C., Bordado, J.C., Rev. Sociedade Portuguesa de Química, 1986,
p24, 60
16. Elvers, B., Hawkins, S., Schulz, G., Ullmann’s Encyclopedia of Industrial Chemistry –
Volume A21, 5th Edition, VCH, 1992
17. www.multisimplex.com, accessed in September 2008
18. Schrijver, A., OCF Benchmarking Test, Altachem, Internal Report, 11/03/2004
19. User’s guide to AltaFoam Monitor, Altachem, Internal Report
20. Practical Manual DIMSTAB, Altachem, Internal Report
21. Brilhante, M., Maertelaere, C., OCF Doorstand Report, Altachem, 06/2008
22. Information gently provided by Cathy De Maertelaere
23. Schrijver, A., One Component Foams, a European technology, proven true worldwide,
Altachem, Internal Report, p4
24. http://goliath.ecnext.com/, accessed in September 2008
25. http://www.honeywell.com, accessed in September 2008

65
10. Appendix
10.1. Appendix 1 – Quick Test of HBA1 and F134a formulations
F134 Samples

66
HBA1 Samples

67
10.2. Appendix 2 – Quick Test of SoudaFoam Report
5527 5528 Paper Short
Threshold 23/23
Threshold 5/5
Rating 23/23 5/5 23/23 5/5
Foam On Paper AC/NAC NAC NAC NAC NAC
Shaking Rate SR 3 3 [-5 ; +5] 4 3,75 3,5 2,75
Froth Shrinkage Shrink 3 3 [-5 ; +5] 5 5 5 5
Froth Outflow Flow 2,5 2,5 [-5 ; +5] 5 5 5 5
Surface structure SS SM/FR FR FR FR SM
Crumbling > 24h 5 3,5 [-5 ; +5] 5 5 5 5
Glass Bubbles GB 3 2,5 [-5 ; +5] 4,5 4 4 3
Cell Structure Rating CS 3 2,5 [-5 ; +5] 3,75 3 3 3
Voids & Pin Holes Rating
V&PH 2,5 2,5 [-5 ; +5] 3,5 3 3 3
Baseholes Rating BH 2,5 2,5 [-5 ; +5] 2 0 2,25 1
Cell Collapse Rating CC 4 3 [-5 ; +5] 4 1,5 4,25 4
Curing Streaks Rating Cstreaks 2,5 2,5 [-5 ; +5] 5 5 5 5
5527 5528 Mould Short
Threshold 23/23
Threshold 5/5
Rating 23/23 5/5 23/23 5/5
Foam In Mould FIM AC/NAC NAC NAC NAC NAC
Mould release MR L/NL L L NL NL
Surface structure SS SM/FR SM SM FR FR
Curing Shrinkage Curing 3,5 3,5 [-5 ; +5] 5 4 5 5
Glass Bubbles GB 3 2,5 [-5 ; +5] 4,25 3,75 3,75 3,5
Side Base Holes SBH 3,5 3,5 [-5 ; +5] 3,25 2,5 2,25 2,5
Cell Structure Rating CS 3 2,5 [-5 ; +5] 3 2,75 3 3
Voids & Pin Holes Rating
V&PH 2,5 2,5 [-5 ; +5] 3 3 3 3
Baseholes Rating BH 2,5 2,5 [-5 ; +5] 2 1 3,25 2
Cell Collapse Rating CC 4 3 [-5 ; +5] 1 3 4,25 4,25
Curing Streaks Rating Cstreaks 2,5 2,5 [-5 ; +5] 5 5 5 5
5527 5528 Density Mould Rating
23/23 5/5 23/23 5/5
Overall Density Mould ODm [g/L] 19,07 - 14,28 -
5527 5528 Output Rating
23/23 5/5 23/23 5/5
Output Liquid liquid [g/s] - 19,6 - 11,4
Output Foam Foam [g/s] - 17,6 - 10,6
Gas Loss at dispensing
[%] - 10,2 - 7,3
GENERAL INFO 5527 5528
Can Pressure [bar] 4,00 bar 4,00 bar
Can Weight [g] 886,0 g 703,8 g

68
10.3. Appendix 3 - AFM of SoudaFoam Report
5527, Soudafoam

69

70
5528, Soudafoam Alternative

71

72

73
10.4. Appendix 4 – Physical tests of SoudaFoam Report
5527, Soudafoam

74
5528, Soudafoam Alternative

75

76
10.5. Appendix 5 – Quick Test of AEB3 Project
3864 AEB3 Paper
Threshold 23/23
Threshold 5/5
Rating 23/23 5/5
Foam On Paper AC/NAC AC NAC
Shaking Rate 3 3 [-5 ; +5] 4 3
Froth Shrinkage 3 3 [-5 ; +5] 5 4,75
Froth Outflow 2,5 2,5 [-5 ; +5] 5 4,5
Surface structure SM/FR SM SM
Crumbling 5 3,5 [-5 ; +5] 5 5
Glass Bubbles 3 2,5 [-5 ; +5] 5 4
Cell Structure Rating 3 2,5 [-5 ; +5] 4 3,25
Voids & Pin Holes Rating
2,5 2,5 [-5 ; +5] 4 4
Baseholes Rating 2,5 2,5 [-5 ; +5] 4,25 0,75
Cell Collapse Rating 4 3 [-5 ; +5] 4 -1,75
Curing Streaks Rating 2,5 2,5 [-5 ; +5] 4 4,75
3864 AEB3 Mould
Threshold 23/23
Threshold 5/5
Rating 23/23 5/5
Foam In Mould AC/NAC AC AC
Mould release L/NL NL NL
Surface structure SM/FR SM SM
Curing Shrinkage 3,5 3,5 [-5 ; +5] 5 5
Glass Bubbles 3 2,5 [-5 ; +5] 5 4,25
Side Base Holes 3,5 3,5 [-5 ; +5] 5 4
Cell Structure Rating 3 2,5 [-5 ; +5] 4 3,75
Voids & Pin Holes Rating
2,5 2,5 [-5 ; +5] 4 4,25
Baseholes Rating 2,5 2,5 [-5 ; +5] 5 4,5
Cell Collapse Rating 4 3 [-5 ; +5] 4,25 4,25
Curing Streaks Rating 2,5 2,5 [-5 ; +5] 4 5
3864 AEB3 Density Mould Rating
23/23 5/5
Overall Density Mould [g/L] 30,01 -
3864 AEB3 Output Rating
23/23 5/5
Output Liquid [g/s] - 15,5
Output Foam [g/s] - 14,2
Gas Loss [%] - 8,4
GENERAL INFO 3864 AEB3
Can Pressure [bar]
Can Weight [g] 887,0 g

77
3883 3884 3885 3886 3887 3888 PAPER
23/23 5/5 23/23 5/5 23/23 5/5 23/23 5/5 23/23 5/5 23/23 5/5
NAC NAC NAC NAC NAC NAC NAC NAC NAC AC NAC NAC
SR 4 2,75 3,75 2,75 4 2,75 4,25 2,75 3,75 3 3,75 2,75
Shrink 5 5 5 5 5 5 5 5 5 5 5 5
Flow 4,5 4 4,5 4 4 4 4 4 4,25 4 4,25 4
SS SM SM SM SM SM SM SM SM SM SM SM SM
CR > 24h 5 5 5 5 5 5 5 5 5 5 5 5
GB 4,75 4 4,75 4 4,75 4 4,75 4 4,75 4 4,75 4
CS 2,75 2,75 2,75 2,75 2,75 2,75 2,75 2,75 2,75 2,75 2,75 2,75
V&PH 3 4 2,5 4 2 2,5 2,5 2 3 3 3 2
BH 4 3,5 4,25 3,5 4 3,5 4 3,5 4,5 3,5 4,5 3
CC 2,5 0 2,5 3 3 2,5 3,5 2,5 3 3 3,5 0
Cstreaks 5 5 5 5 4,75 5 4,75 5 4,75 5 4,75 5
3883 3884 3885 3886 3887 3888 MOULD
23/23 5/5 23/23 5/5 23/23 5/5 23/23 5/5 23/23 5/5 23/23 5/5
FIM AC AC AC AC AC AC NAC AC AC AC NAC AC
MR NL NL NL NL NL NL NL NL NL NL NL NL
SS SM SM SM SM SM SM SM SM SM SM SM SM
Curing 5 5 5 5 5 5 5 5 5 5 5 5
GB 4 3,75 4 3,75 4 3,75 4 3,75 4 3,5 4 3,5
SBH 5 4 4,5 4,5 4,75 4 5 4 4,5 4,5 5 3,75
CS 3 3 3 3 3 2,75 2,75 2,75 3,25 3 3 3
V&PH 3 3 3 4 4 3 3 3 3,75 4 2,75 3
BH 4 3,25 4,5 3,25 4,25 3,25 4,25 3 5 2,75 4,25 2,75
CC 4,25 3 4 4 4,25 2,5 4,25 4 4,5 3 3,25 4
Cstreaks 5 5 5 5 4,75 4,5 4,5 4,75 4,75 5 5 4,5
3883 3884 3885 3886 3887 3888 Density
23/23 5/5 23/23 5/5 23/23 5/5 23/23 5/5 23/23 5/5 23/23 5/5
ODm 24,86 - 25,08 - 25,86 - 25,51 - 24,83 - 24,71 -
3883 3884 3885 3886 3887 3888 Output
23/23 5/5 23/23 5/5 23/23 5/5 23/23 5/5 23/23 5/5 23/23 5/5
liquid - 22,4 - 21,1 - 24,7 - 23,2 - 24,3 - 24,3
Foam - 20,4 - 19,3 - 22,6 - 21,2 - 22,1 - 22,0 at
dispensing - 9,0 - 8,5 - 8,5 - 8,5 - 9,0 - 9,4
INFO 3883 3884 3885 3886 3887 3888
Can P
Can W 885,2 g 881,6 g 880,5 g 882,4 g 879,7 g 881,0 g

78
3908 3910 3960 3961 6003 6020 PAPER
23/23 5/5 23/23 5/5 23/23 5/5 23/23 5/5 23/23 5/5 23/23 5/5
NAC AC AC NAC NAC NAC NAC NAC NAC AC NAC NAC
SR 4 3,5 4 3,25 4,25 3 4,5 3 4,5 3 4,5 3
Shrink 5 5 5 5 5 5 5 5 5 5 5 5
Flow 4,5 4 4,5 4 4,75 4,5 5 4 4,5 4,5 4 4
SS SM SM FR FR FR SM FR FR SM SM SM SM
CR > 24h 5 5 5 5 5 5 5 5 5 5 5 5
GB 4,75 4,5 5 4,75 5 4,25 5 4,25 4,75 4,5 4,75 4,5
CS 2,5 2,75 3 3 3 2,75 2,75 3 3 3 3 2,75
V&PH 4 3 3 2 3 3 3 2 4 4 2,5 4
BH 4 3,25 4 3,5 4 2,5 4,75 3 4,5 3 4,25 3,75
CC 3 3 4 -1 3 -1 2,75 -3 1,5 3 3 -5
Cstreaks 5 4,75 4 4 4,75 4,75 4,5 4,75 5 5 4,75 5
3908 3910 3960 3961 6003 6020 MOULD
23/23 5/5 23/23 5/5 23/23 5/5 23/23 5/5 23/23 5/5 23/23 5/5
FIM NAC NAC NAC NAC NAC NAC NAC NAC NAC AC AC NAC
MR NL NL NL NL NL NL NL NL NL NL NL NL
SS SM SM SM SM SM SM SM SM SM SM SM SM
Curing 5 5 5 5 5 5 5 5 5 5 5 5
GB 4,5 4 4,75 4 4 4 4 4 4 4 4 3,75
SBH 5 4 4,5 3,5 4,25 3 4,5 4 4,5 5 5 4,75
CS 2,75 3,25 3,25 3 2,75 4 2,75 3,5 3 3 3 2,5
V&PH 4 4 2 2 3,5 0 4 1 4 4,25 3,5 3
BH 4,5 2 4,5 3,75 4 0 4,75 3 4,5 3 4,5 2
CC 4,5 4,5 2 -4 4 0 4,5 1 1 4,5 4 3
Cstreaks 4,75 5 0 4,5 5 4,5 5 5 4,75 5 4,5 4,75
3908 3910 3960 3961 6003 6020 Density
23/23 5/5 23/23 5/5 23/23 5/5 23/23 5/5 23/23 5/5 23/23 5/5
ODm 22,19 - 41,71 - 25,02 - 22,51 - 22,72 - 19,83 -
3908 3910 3960 3961 6003 6020 Output
23/23 5/5 23/23 5/5 23/23 5/5 23/23 5/5 23/23 5/5 23/23 5/5
liquid - 22,9 - 21,7 - 13,2 - 26,7 - 17,0 - 19,8
Foam - 20,9 - 19,7 - 11,8 - 23,7 - 15,7 - 18,1 at
dispensing - 8,7 - 9,3 - 10,7 - 11,1 - 7,4 - 8,7
INFO 3908 3910 3960 3961 6003 6020
Can P 4,50 bar 4,50 bar 5,10 bar 5,50 bar 4,50 bar 3,90 bar
Can W 884,7 g 880,7 g 881,1 g 888,0 g 876,9 g 879,8 g

79
6021 6022 6043 6044 6064 6065 PAPER
23/23 5/5 23/23 5/5 23/23 5/5 23/23 5/5 23/23 5/5 23/23 5/5
NAC NAC NAC NAC AC NAC NAC NAC NAC NAC NAC NAC
SR 4,5 3,25 4,25 3,5 4,75 4 4,75 4,25 4,5 3,75 4 3,75
Shrink 5 5 5 5 5 4,5 5 4,5 5 5 5 5
Flow 4 4 4 4 4,25 4 4,25 4 4 3,5 4 3,5
SS SM SM SM FR SM SM SM SM FR FR FR FR
CR > 24h 5 5 5 5 5 5 5 5 5 5 5 5
GB 4,75 4,5 4,75 4,5 5 4,75 5 4,75 4,75 4,25 4,75 4,25
CS 3 3 3,25 3 4,25 3,75 4,25 3,25 3,25 3,25 4 3
V&PH 3,5 4 3 4 3,5 0,75 2,75 1 4 3 3 4
BH 4 3,75 3,5 3,5 4 2,75 3,5 2,5 4 3,5 4,5 3,75
CC 0,5 -3 2 1 4,25 2,75 3,75 3,25 1 1 3 -2
Cstreaks 4,25 4,75 4,75 5 5 5 5 5 4,5 4,75 4,25 5
6021 6022 6043 6044 6064 6065 MOULD
23/23 5/5 23/23 5/5 23/23 5/5 23/23 5/5 23/23 5/5 23/23 5/5
FIM AC NAC NAC AC AC NAC NAC NAC AC NAC NAC NAC
MR NL NL NL NL NL L NL NL NL NL NL NL
SS SM SM SM FR SM SM SM SM SM SM SM SM
Curing 5 5 5 5 5 5 5 5 5 5 5 5
GB 4 3,75 4 4 5 4,5 5 4,5 4 4 4 4
SBH 4,5 5 4,25 4,75 4,75 3 4,25 3,75 4,25 3,25 4,25 3
CS 3 3 2,75 2,75 4 4 4 3,25 3,25 3 3,25 3
V&PH 3,5 4 3 4 3,75 0 2,5 3 3,5 4 3,5 3
BH 4,25 2,25 4,25 3 4,25 2,75 4,25 0,5 4,75 3 4,5 3,5
CC 4,25 4 3,75 4 4 0 3,75 3,5 4 4 3,25 4,25
Cstreaks 4,25 5 4,5 5 4,75 4,75 4,75 5 4,5 5 4,25 5
6021 6022 6043 6044 6064 6065 Density
23/23 5/5 23/23 5/5 23/23 5/5 23/23 5/5 23/23 5/5 23/23 5/5
ODm 23,25 - 26,11 - 33,05 - 31,52 - 28,18 - 29,17 -
6021 6022 6043 6044 6064 6065 Output
23/23 5/5 23/23 5/5 23/23 5/5 23/23 5/5 23/23 5/5 23/23 5/5
liquid - 19,5 - 18,2 - 27,1 - 35,6 - 23,6 - 23,4
Foam - 17,7 - 16,5 - 24,3 - 31,6 - 21,6 - 21,3 at
dispensing - 9,4 - 9,2 - 10,4 - 11,2 - 8,4 - 9,1
INFO 6021 6022 6043 6044 6064 6065
Can P 4,00 bar 4,10 bar 5,10 bar 5,10 bar 4,90 bar 4,80 bar
Can W 874,4 g 874,6 g 879,0 g 882,9 g 874,3 g 875,7 g

80
6066 6082 6083 6096 6097 6098 6099 PAPER
23/23 5/5 23/23 5/5 23/23 5/5 23/23 5/5 23/23 5/5 23/23 5/5 23/23 5/5
NAC NAC NAC NAC AC NAC AC NAC NAC NAC NAC NAC NAC NAC
SR 4,5 3 4 3 3,75 2,75 4,25 3,25 3,75 3 4,5 3,25 4,5 3
Shrink 5 5 5 5 5 5 5 5 5 5 5 5 5 5
Flow 4 3,5 4 4 4 4 4,5 4,5 4,5 4,5 4,5 3,75 4,5 3,75
SS FR FR FR FR FR SM FR SM FR SM FR FR FR SM
CR > 24h 5 5 5 5 5 5 5 5 5 5 5 5 5 5
GB 4,75 4,25 4,75 3,75 4,75 3,75 4,75 4 4,75 4 4,75 4 4,75 3,75
CS 3,5 3,25 4 3,75 4 3,75 4,5 3,25 4,5 3,25 4 3,75 4 3,5
V&PH 3,5 3 3 4 4 4 3 4,5 4 4,5 4 4,5 4 4
BH 4,25 3,75 4,5 3,5 4,5 3,5 4 3,5 4 4 4 3 4 3
CC 1 -1 3 0 4,25 -3 4 -1 3,5 -2 3,25 -1 3 -2
Cstreaks 4,25 4,75 4,75 5 5 4,5 5 4,75 4,75 4,75 4,5 4,75 4,75 4,75
6066 6082 6083 6096 6097 6098 6099 MOULD
23/23 5/5 23/23 5/5 23/23 5/5 23/23 5/5 23/23 5/5 23/23 5/5 23/23 5/5
FIM AC AC AC AC AC NAC AC AC NAC NAC AC AC AC NAC
MR NL NL NL NL NL NL NL NL NL NL NL NL NL NL
SS SM SM SM SM SM SM SM SM SM SM SM SM SM SM
Curing 5 5 5 5 5 5 5 5 5 5 5 5 5 5
GB 4 4 4 4 4 4 4 3,75 4 3,75 4 4 4 4
SBH 4,5 3,5 4,25 4,25 3,75 3,25 4,5 3,75 3,75 3,5 4,25 4,5 4 3
CS 3,25 3 4,25 3,5 3,75 3 3,5 3 3,5 3 3,5 3 3,5 3
V&PH 4 4,25 4 4 3,5 4 4 4,5 4 4,25 4 4 4 4
BH 4 3,5 4 3 4,25 3 4 2,75 4,25 2 4,25 2,75 4 3,5
CC 4,25 4 4 3,5 4,25 2,5 4 4 3,75 4 4,25 3,5 4,25 4,25
Cstreaks 4,5 5 4,75 5 5 5 5 5 4 5 4,5 5 4,5 5
6066 6082 6083 6096 6097 6098 6099 Density
23/23 5/5 23/23 5/5 23/23 5/5 23/23 5/5 23/23 5/5 23/23 5/5 23/23 5/5
ODm 26,24 - 24,90 - 25,46 - 24,56 - 28,45 - 25,13 - 23,45 -
6066 6082 6083 6096 6097 6098 6099 Output
23/23 5/5 23/23 5/5 23/23 5/5 23/23 5/5 23/23 5/5 23/23 5/5 23/23 5/5
liquid - 24,7 - 16,3 - 11,4 - 10,6 - 9,6 - 15,5 - 12,2
Foam - 22,3 - 14,5 - 10,2 - 9,5 - 8,8 - 14,1 - 10,9 at
dispensing - 9,9 - 11,2 - 10,8 - 10,0 - 7,9 - 9,0 - 10,4
INFO 6066 6082 6083 6096 6097 6098 6099
Can P 4,70 bar 4,90 bar 4,80 bar 4,50 bar 4,40 bar 4,40 bar 4,50 bar
Can W 878,2 g 877,8 g 876,0 g 879,8 g 877,6 g 873,3 g 883,3 g

81
10.6. Appendix 6 – Physical Tests of 6096 AEB3
Adhesion F6096 23°C/23°C
0
10
20
30
40
50
60
70
0 2 4 6 8 10 12 14
Strain (%)
Str
ess (kPa)
SHEAR STRENGTH F6096 23°C/23°C
0
10
20
30
40
50
60
70
80
0 5 10 15 20 25
Strain (%)
Str
ess (kPa)

82
COMPRESSION F6096 23°C/23°C
0
5
10
15
20
25
30
35
40
45
50
0 1 2 3 4 5 6 7
Compression (mm)
Str
ess (kPa)

83
10.7. Appendix 7 – AFM of 6096 AEB3

84

85