Epigenetic PU.1 silencing in myeloid leukemia by mimicrying ...
Upload
khangminh22Category
view
0download
0
FEB – Fresenius Environmental Bulletin founded jointly by F. Korte and F. Coulston
Production by PSP – Parlar Scientific Publications, Angerstr. 12, 85354 Freising, Germany in cooperation with Lehrstuhl für Chemisch-Technische Analyse und Lebensmitteltechnologie,
Technische Universität München, 85350 Freising - Weihenstephan, Germany
Copyright © by PSP – Parlar Scientific Publications, Angerstr. 12, 85354 Freising, Germany. All rights are reserved, especially the right to translate into foreign language. No part of the journal
may be reproduced in any form- through photocopying, microfilming or other processes- or converted to a machine language, especially for data processing equipment- without the written permission of the
publisher. The rights of reproduction by lecture, radio and television transmission, magnetic sound recording or similar means are also reserved.
Printed in GERMANY – ISSN 1018-4619
© by PSP Volume 21 – No 3a. 2012 Fresenius Environmental Bulletin
1
FEB - EDITORIAL BOARD
Chief Editor:
Prof. Dr. H. Parlar Institut für Lebensmitteltechnologie und Analytische Chemie TU München - 85350 Freising-Weihenstephan, Germany e-mail: [email protected]
Co-Editors:
Environmental Analytical Chemistry:
Dr. D. Kotzias Commission of the European Communities, Joint Research Centre, Ispra Establishment, 21020 Ispra (Varese), Italy Environmental Proteomic and Biology:
Prof. Dr. A. Görg Fachgebiet Proteomik TU München - 85350 Freising-Weihenstephan, Germany Prof. Dr. A. Piccolo Università di Napoli “Frederico II”, Dipto. Di Scienze Chimico-Agrarie Via Università 100, 80055 Portici (Napoli), Italy Prof. Dr. G. Schüürmann UFZ-Umweltforschungszentrum, Sektion Chemische Ökotoxikologie Leipzig-Halle GmbH, Permoserstr.15, 04318 Leipzig, Germany Environmental Chemistry:
Prof. Dr. M. Bahadir Institut für Ökologische Chemie und Abfallanalytik TU Braunschweig Hagenring 30, 38106 Braunschweig, Germany
Prof. Dr. M. Spiteller Institut für Umweltforschung Universität Dortmund Otto-Hahn-Str. 6, 44221 Dortmund, Germany
Prof. Dr. Ivan Holoubek RECETOX_TOCOEN Kamenice 126/3, 62500 Brno, Czech Republic Environmental Management:
Dr. H. Schlesing Secretary General, EARTO, Rue de Luxembourg,3, 1000 Brussels, Belgium Prof. Dr. F. Vosniakos T.E.I. of Thessaloniki, Applied Physics Lab. P.O. Box 14561, 54101 Thessaloniki, Greece Dr. K.I. Nikolaou Organization of the Master Plan & Environmental Protection of Thessaloniki (OMPEPT) 54636 Thessaloniki, Greece
Environmental Toxicology:
Prof. Dr. H. Greim Senatskomm. d. DFG z. Prüfung gesundheitsschädl. Arbeitsstoffe TU München, 85350 Freising-Weihenstephan, Germany
Prof. Dr. A. Kettrup Institut für Lebensmitteltechnologie und Analytische Chemie TU München - 85350 Freising-Weihenstephan, Germany
FEB - ADVISORY BOARD
Environmental Analytical Chemistry:
K. Ballschmitter, D - K. Bester, D - K. Fischer, D - R. Kallenborn, N D.C.G. Muir, CAN - R. Niessner, D - W. Vetter, D – R. Spaccini, I Environmental Proteomic and Biology:
D. Adelung, D - G.I. Kvesitadze, GEOR A. Reichlmayr-Lais, D - C. Steinberg, D - R. Viswanathan, D Environmental Chemistry:
J.P. Lay, D - J. Burhenne, D - S. Nitz, D - R. Kreuzig, D D. L. Swackhammer, U.S.A. - R. Zepp, U.S.A. – T. Alpay, TR V. Librando; I Environmental Management:
O. Hutzinger, A - L.O. Ruzo, U.S.A - U. Schlottmann, D Environmental Toxicology:
K.-W. Schramm, D - H. Frank, D - H. P. Hagenmeier, D D. Schulz-Jander, U.S.A. - H.U. Wolf, D – M. McLachlan, S
Managing Editor:
Dr. G. Leupold Institut für Chemisch-Technische Analyse und Chemische Lebensmitteltechnologie, TU München 85350 Freising-Weihenstephan, Germany e-mail: [email protected]
Editorial Chief-Officer:
Selma Parlar PSP- Parlar Scientific Publications Angerstr.12, 85354 Freising, Germany e-mail: [email protected] - www.psp-parlar.de
Marketing Chief Manager:
Max-Josef Kirchmaier MASELL-Agency for Marketing & Communication, Public-Relations Angerstr.12, 85354 Freising, Germany e-mail: [email protected] - www.masell.com
Abstracted/ indexed in: Biology & Environmental Sciences, BIOSIS, C.A.B. International, Cambridge Scientific Abstracts, Chemical Abstracts, Current Awareness, Current Contents/ Agricul-ture, CSA Civil Engineering Abstracts, CSA Mechanical & Trans-portation Engineering, IBIDS database, Information Ventures, NISC, Research Alert, Science Citation Index Expanded (SCI Expanded), SciSearch, Selected Water Resources Abstracts

© by PSP Volume 21 – No 3a. 2012 Fresenius Environmental Bulletin
663
CONTENTS ORIGINAL PAPERS
SUBSTITUTION OF NO3- BY NH4
+ INCREASES 665 AMMONIUM-ASSIMILATING ENZYME ACTIVITIES AND REDUCES THE DELETERIOUS EFFECTS OF CADMIUM ON THE GROWTH OF TOMATOES Nasraoui Hajaji Afef, Chaffei-Haouari Chiraz, Maaroufi Dghimi Houda, Ghorbel Mohamed Habib, and Gouia Houda EFFECTS OF AIR-DRYING ON PHOSPHORUS SORPTION IN SHALLOW LAKE SEDIMENT, CHINA 672 Wen-Juan Xiao, Chun-Lei Song, Xiu-Yun Cao and Yi-Yong Zhou METHODOLOGIES FOR THE STUDY OF 679 FILAMENTOUS CYANOBACTERIA BY FLOW CYTOMETRY Raquel Azevedo, Eleazar Rodriguez, Daniela Figueiredo, Francisco Peixoto and Conceição Santos
THE EFFECT OF ASPIRIN AND ACETALDEHYDE ON 685 EGG FERTILITY AND DEVELOPMENT IN Drosophila melanogaster Duygu Keser and Ayla Karataş SIMULATION OF HUMAN HEALTH RISK OF CADMIUM ASSOCIATED SPATIALLY 695 WITH SOIL ORGANIC CARBON AND pH IN DABAOSHAN MINE, SOUTH CHINA Huarong Zhao, Beicheng Xia, Jianqiao Qin, Xu Zhou, Peng Zhao and Shili Shen
MICROBIAL PRODUCTION OF POLY-β-HYDROXYBUTYRATE (PHB) BY Bacillus megaterium 704 STRAINS ISOLATED FROM ROOT NODULES OF DIFFERENT FLOWERING PLANTS IN TURKEY Esra Ersoy Omeroglu, Figen Ozyildiz and Ismail Karaboz SIMULTANEOUS SORPTION OF PHOSPHATE AND 713 ARSENATE BY RED MUDS (A BAUXITE ORE PROCESSING WASTE) Paola Castaldi, Margherita Silvetti, Giovanni Garau, and Salvatore Deiana
EFFECTS OF UV-B RADIATION ON CARBOHYDRATE METABOLISM 723 AND LIGHT ABSORBING COMPOUNDS IN CUCUMBER COTYLEDONS Magdalena Rybus-Zając and Jan Kubiś REMOVAL OF ENDOCRINE DISRUPTING COMPOUNDS AND ESTROGENIC 731 ACTIVITY FROM SECONDARY EFFLUENTS DURING TiO2 PHOTOCATALYSIS Wenlong Zhang, Yi Li, Kai Mao and Guoping Li SONOCHEMICAL SOLUBILIZATION OF NITROGEN 736 AND PHOSPHORUS: IMPROVEMENT OF THE EFFICIENCY Nasser Mehrdadi, Alireza Mohamadi Aghdam, Azadeh Aghajani Yasini and Ali Zahedi THE EFFECTS OF ORGANIC SELENIUM ON SOME 743 PHYSIOLOGICAL AND BIOCHEMICAL PARAMETERS IN HORDEUM VULGARE L. AND TRITICUM AESTIVUM L. EXPOSED TO SALT STRESS Emel Yigit, Gulcin Beker Akbulut, Yetkin Gok and Dilek Bayram

© by PSP Volume 21 – No 3a. 2012 Fresenius Environmental Bulletin
664
INFLUENCE OF POLYCYCLIC AROMATIC 748 HYDROCARBONS ON EARTHWORMS EISENIA FETIDA Michaela Stoupalová, Miroslava Beklová, Milada Vávrová, Edita Štilárková and Ivana Bednářová REMOVAL OF ORGANIC HALOGENS FROM INORGANIC 755 CHLORIDES BY ACTIVATED CHARCOAL IN AIR SAMPLES Ozgen Ercan PHYTOTOXIC EFFECTS OF TRIVALENT CHROMIUM ON RAPESEED PLANTS 761 Matúš Peško, Katarína Kráľová and Jaroslav Blaško CADMIUM-INDUCED ALTERATIONS IN 769 HEAD KIDNEY HEMATOPOIETIC TISSUE OF COMMON CARP Elżbieta Kondera and Małgorzata Witeska EVALUATION OF LONGITUDINAL DISPERSION IN 774 BRAIDED RIVER FROM TRANSIENT TRACER TESTS Li Gu, Zu-lin Hua, Ke-jian Chu and Dan Wu
ASSESSMENT OF LEVELS AND ASSOCIATED RISKS OF 781 EXPOSURE TO VOCS RELEASED FROM MSW LANDFILL SITES Selami Demir, Arslan Saral and S. Levent Kuzu KINETICS AND THERMODYNAMIC STUDY OF 789 NITRATE ADSORPTION ON GRANULAR FERRIC HYDROXIDE Lei Huo, Qi Yang and Haitao Shang
INDEX 797

© by PSP Volume 21 – No 3a. 2012 Fresenius Environmental Bulletin
665
SUBSTITUTION OF NO3- BY NH4
+ INCREASES AMMONIUM-ASSIMILATING ENZYME ACTIVITIES AND REDUCES THE DELETERIOUS EFFECTS OF
CADMIUM ON THE GROWTH OF TOMATOES
Nasraoui Hajaji Afef*, Chaffei-Haouari Chiraz, Maaroufi Dghimi Houda, Ghorbel Mohamed Habib, and Gouia Houda
Unité de Recherche Nutrition et Métabolisme Azotés et Protéines de Stress, 99UR/09-20, Département de Biologie, Faculté des Sciences de Tunis, Université de Tunis Elmanar, 1060 Tunis, Tunisia
ABSTRACT
Depending on the N source supplied, significant dif-ferences in sensitivity of plants to Cd were observed. Ac-cumulation of Cd in roots exceeded by far that of leaves, with the greatest Cd accumulation occurring in plants sup-plied with NO3
-. Concurrently, Cd treatment enhanced proline (Pro) and glutamine (Gln) contents, but reduced glutamate (Glu). Indeed, proline accumulation (as osmo-regulator) reflects tomato tolerance to ammonium toxicity and cadmium stress. Implication of Glu in N assimilation for Cd-treated tomatoes was suggested. In presence of Cd, the decline of Gln synthetase (GS) activity was shown in different tomato plants derived from different nitrogen forms. In fact, protein gel blot analysis from Cd-treated tomato showed a decrease in chloroplastic GS (GS2) pro-tein and an increase in the cytosolic one (GS1), regardless of the nitrogen source added to the culture medium. Na-tive gel electrophoresis demonstrates that, independently of N-form used, Glu dehydrogenase (GDH) was resolved into 7 isoenzymes in foliar tissues, but only one in roots. Simultaneously, Cd treatment enhanced the phosphoe-nolpyruvate carboxylase (PEPC) activity in tomato roots, independently of the N-source used. In leaves, Cd inhib-ited PEPC activity when the plants were fed with NO3
-, or with a mixture of NO3
- and NH4+. On the contrary, when
plants received NH4+ as a unique N-source, PEPC activity
was inhibited. This study suggests that a readjustment of the co-ordination between N and C metabolism via the modulation of GDH and PEPC activities could avoid the accumulation of toxic levels of ammonium.
KEYWORDS: Amino acid synthesis; ammonium assimilation; cadmium; enzymes; nitrogen fertilization
* Corresponding author
ABBREVIATIONS
Cd, cadmium; GDH, glutamate dehydrogenase; Glu, glutamate; Gln, glutamine ;GOGAT, glutamate synthase; GS, glutamine synthetase; GS1, cytosolic glutamine syn-thetase; GS2, chloroplastic glutamine synthetase; PEPC, phosphoenolpyruvate carboxylase; Pro, proline.
1. INTRODUCTION
Cadmium is a naturally occurring rare element that does not have any known essential or beneficial biological function. In plants, Cd is known to disturb growth [1, 2], photosynthesis [3, 4], amino-acid biosynthesis [5], and N metabolism [6, 7]. Glu occupies a central position in amino acid metabolism in plants. However, Glu is also the sub-strate for the synthesis of Gln from ammonia, catalyzed by GS. The α-amino group of Glu may be transferred to other amino acids. In addition, both the carbon skeleton and α-amino group of Glu form the basis for the synthesis of Pro.
It is known that ammonium assimilation is firstly cata-lysed by the glutamine synthetase (GS)/glutamate synthase (GOGAT) cycle. In this pathway, GS catalyses the genera-tion of Gln from the amidation of Glu. GDH can catalyse the reductive amination of 2-oxoglutarate; likewise, it ca-talyses the reverse reaction of oxidative deamination of Glu. However, the Glu biosynthesis carried out by GDH seems to be functional, preferentially when ammonia is abundant [8] and/or when GS activity is partially or totally inhibited [5]. Thus, some authors [9] postulated that GDH catalyses the oxidation of Glu to provide carbon to the tricarboxylic-acid cycle, or that this amino acid could play a complementary role on the glutamate synthase cycle (GS/ GOGAT) for the Glu synthesis. Ammonium assimilation requires a substantial contribution of fixed C as α-ketoglu-tarate in both leaves and roots [10]. In fact, PEPC is be-lieved to play a variety of physiological roles in plants,
© by PSP Volume 21 – No 3a. 2012 Fresenius Environmental Bulletin
666
such as the supplement of carbon skeletons for ammo-nium assimilation [11]. So, PEPC is an important inter-face between carbon and nitrogen metabolisms [12].
The aim of this report was to investigate how ammo-nium assimilation enzymes responded to different nitro-gen sources under Cd stress, and more specifically, its effect on the GDH isoenzymic pattern. We showed how PEPC could participate together with GDH in the am-monium assimilation and detoxification when GS/GOGAT cycle was inhibited.
2. MATERIALS AND METHODS
2.1. Plant material Seeds of tomato (Solanum lycopersicon esculentum
Mill. cv. 63/5.F) were germinated in Petri dishes in the dark. Seedlings were transferred and grown on a nutrient solution continuously aerated and containing 0.1 mM KNO3, 0.5 mM CaSO4, 1 mM MgSO4, 2.5 mM K2SO4, 1 mM KH2PO4, 1 µM ZnSO4, 5 µM MnSO4, 30 µM H3BO3, 1 µM CuSO4, 30 µM Fe-K-EDTA, and 1 µM (NH4)6MO7O24. Plants were grown in a growth chamber under controlled conditions: a 16-h light (150 µmol m-2 s-1 PAR)/8-h dark cycle, 22 °C (day) /18 °C (night), and 65% relatively hu-midity. The 7-days-old seedlings were supplied with the above nutrient solution containing NO3
- , a mixture of NO3-
and NH4+ in a ratio of 60:40, or only NH4
+ (of the total 5 mM nitrogen) (Table1). Nutrient solutions (pH: 5.57) were fre-quently renewed. At age of one week, only half of the seedlings were maintained on nutrient solution containing different nitrogen forms (Table 1) without Cd. Where as, the rest of plants were fed with the different form of ni-trogen (Table 1) and treated with Cd (25 µM).
At harvest, plants were assorted into leaves, shoots and roots. Roots were rapidly washed three times with distilled water and dried on filter paper. Fresh weight (FW) of each sample (leaves, shoots or roots) was deter-mined before storage in liquid N2. Samples of fresh matter were dried at 70 °C during 72 h, in order to determine dry weight (DW) of each sample. Six individual plants from each treatment were used to realise each determination.
TABLE 1 - Final concentration of different nutrients added to different culture media.
Nitrate medium
Mixed medium
Ammonium medium
KNO3 5 mM 3 mM 0 mM (NH4)2SO4 0 mM 1 mM 2.5 mM CaSO4 0.5 mM 0.5 mM 0.5 mM MgSO4 1 mM 1 mM 1 mM K2SO4 0 mM 1 mM 2.5 mM KH2PO4 1 mM 1 mM 1 mM ZnSO4 1 µM 1 µM 1 µM MnSO4 5 µM 5 µM 5 µM H3BO3 30 µM 30 µM 30 µM CuSO4 1 µM 1 µM 1 µM Fe-K-EDTA 100µM 100 µM 100 µM (NH4)6MO7O24 1 µM 1 µM 1 µM
2.2. Cadmium assay Desiccated samples were ground to a fine powder us-
ing a porcelain mortar and pestle, and then digested with an acid mixture (HNO3/HClO4, 4/1 cm3/cm3). Cd concen-tration was determined by atomic absorption spectropho-tometry (Perkin-Elmer, AAanalyst 300) [13].
2.3. Ammonium and soluble protein assays
Ammonium was measured after extraction of plant tissues (0.5 to 1g FW) at 4 °C in 2 ml of H2SO4 (0.3 mM) and 0.5% (w/v) Polyclar AT. The homogenate was then clarified by centrifugation for 15 min at 30,000g. Ammo-nium was quantified by the Berthelot reaction modified according to Weatherburn [14]. Protein was determined according to Bradford [15].
2.4. Glutamate and glutamine analysis
Amino acids were determined after extraction in a 2% solution of 5-sulfosalicylic acid. Individual amino acid com-position was determined on powder samples extracted from an equal dry weight from three samples corre-sponding to three different plants, using ion exchange chromatography [16].
2.5. Enzyme assays 2.5.1. Protease activity
Protease activity was measured by the method of Wechenmann and Martin [17], using azocasein as sub-strate. Absorbance of the released azo-dye was measured at 340 nm, and one unit of activity was defined as the activity producing an increase of 0.01 unit of absorbance during 2-h incubation.
Glutamine synthetase
Frozen samples were homogenized using a cold mor-tar and pestle with grinding medium (4 cm3 g-1 FW) con-sisting of 25 mM Tris-HCl buffer (pH 7.8), 1 mM EDTA, 1 mM MgCl2, 14 mM ß-mercaptoethanol and 1% (w/v) polyvinylpyrrolidone (PVP) as described by Maaroufi et al. [18]. Homogenate was centrifuged (25,000g for 30 min at 4 °C), and the resulting supernatant was used as en-zyme extract.
GS activity was determined using hydroxylamine as substrate, and the formation of γ-glutamylhydroxylamine (γ-GHM) was quantified with acidified ferric chloride [19]. The γ-GHM was quantified using commercial glutamine as a standard after reading the absorbance of the incubation at 540 nm.
Glutamate dehydrogenase
GDH activity was measured as described by Turano et al. [20]. Frozen samples were homogenized in a cold mortar and pestle with 100 mM Tris-HCl (pH 7.5), 14mM-mercaptoethanol and 1% (w/v) PVP. NADH-dependent activity was determined by following the ab-sorbance changes at 340 nm.
Phosphoenolpyruvate carboxylase
PEPC activity was measured spectrophotometrically at 340 nm, in a final volume of 1 ml containing 100 mM

© by PSP Volume 21 – No 3a. 2012 Fresenius Environmental Bulletin
667
HEPES-HCl, 10 mM MgCl2, 5 mM NaHCO3, 0.2 mM NADH, at optimal pH (8.0) and 2 mM PEP [21]. Assays were initiated by the addition of plant extracts.
Gel electrophoresis, protein gel blot analysis and gel staining procedure
Proteins were extracted as described above for GS as-say. Proteins were separated by SDS-PAGE [22]. An equal amount of protein (50 µg) was loaded in each track. The percentage of polyacrylamide in the running gels was 10% for GS. Denatured proteins were electrophoretically transferred to nitrocellulose membranes for GS detection, or directly stained with Coomassie Blue. Polypeptide detection was performed using polyclonal antiserum raised against grape leaf GS (Biorad, Hercules, CA) [9]. Relative GS protein amounts were determined by densi-tometric scanning of Western blot membranes.
Native polyacrylamide gel electrophoresis
Native-PAGE was performed in slab gels containing 7% acrylamide by the method of David, and run at 25 V for 20 h in a refrigerator. After completion of electropho-
resis, bands containing GDH activity (deamination) were visualized with a tetrazolium assay [23]. After incubation at 25 °C for 20 min, the gel was distained with distilled water at 4 °C and photographed.
Statistical Analysis
Analyses of variance (ANOVA) with orthogonal con-trasts and mean comparison procedures were used to detect differences between treatments. Mean separation procedures were carried out using multiple range tests with Fisher’s least significant difference (LSD) (p<0.05).
3. RESULTS
Independently of the nitrogen form used, Cd content was higher in roots than in leaves. The presence of NH4
+ in culture medium reduced Cd in the different organs studied (Table 2). In non Cd-treated plants, NH4
+ content was higher in plants receiving NH4
+ as nitrogen source. In treated tomato seedlings, Cd increased endogenous NH4
+
content in the leaves and roots (Table 2).
TABLE 2 - Effect of nitrogen form and cadmium on Cd, NH4+, total soluble proteins, glutamate, glutamine and proline contents in leaves and
roots of tomato cultivated with NO3-, NH4
+, or mixture as nitrogen source (Values are means ± SE of 6 individual plants).
NO3
-/NH4+
Cadmium (µmol/gFW)
Leaves Roots
Ammonium (µmol/gFW)
Leaves Roots
Soluble protein (µmol/gFW)
Leaves Roots
Glu (µmol/gFW)
Leaves Roots
Gln (µmol/gFW)
Leaves Roots
Pro (µmol/gFW)
Leaves Roots
No cadmium 100/0
- - 0.036± 0.001 0.048±0.006
315± 23.6 170± 9.82
23.04±1.98 15.01±0.92
9.98±0.9 18.35±0.94
10.542±1.2 7.46±1
60/40 - - 0.089± 0.002 0.16± 0.012
302± 24.01 171± 10.08
25.14±1.13 14.99±0.90
11.44±2.01 18.28±0.94
21.413±1.81 8.76±0.9
0/100 - - 0.132± 0.01 0.20± 0.01
80.12± 5.03 78.55± 2.11
27.75±1.74 12.5±1.1
13.05±1.05 17.07±2.23
23.49±2.01 11.04±1.39
25 µM Cd 100/0
5.1±0.12 33.7±2.54
0.058± 0.0032 0.081±0.001
101.2± 8.74 65±3.10
20.75±1.76 6.81±0.53
12.10±0.96 24.09±1.18
30.72±2.5 25.88±1.9
60/40 2.3± 0.21 26.4±1.93
0.215± 0.053 0.134±0.005
102.4± 2.13 62.74± 3.91
23.31±1.87 10.25±1.05
13.65±1.24 26.14±2.01
39.88±3.06 30.58±2.27
0/100 1.1± 0.002 20±0.84
0.54± 0.024 0.341±0.018
120.15±8.70 90.01± 7.01
28.76±2.22 28.03±1.86
16.18±0.85 26.97±1.58
63.53±3.02 46.04±2.23
TABLE 3 - Effect of nitrogen form and cadmium on protease, GS, NADH-GDH and PEPC activities in leaves and roots of tomato cultivated with NO3
-, NH4+, or a mixture as nitrogen source (Values are means ± SE of 6 individual plants).
NO3
-/NH4+
Protease (Unit/gFW)
Leaves Roots
GS (µmol γ-GHM/gFW/min)
Leaves Roots
NADH-GDH (µmol NADHox/gFW/min)
Leaves Roots
PEPC (µmol PEPox/gFW/min)
Leaves Roots
No cadmium 100/0
18.668±1.86 21.09 ±1.04
0.644± 0.001 0.127± 0.006
0.297± 0.119 3.6± 0.85
2.025±1.98 12.85±0.92
60/40 21.4±1.62 23.15± 1.9 -
0.737± 0.002 0.276± 0.012
0.514± 0.234 4.29± 0.411
9.87±1.13 17.85±0.90
0/100 26.84±2.08 28.449±2.04
0.885± 0.01 0.588± 0.01
0.967± 0.22 5.19± 0.45
21.97±1.74 2.57±1.1
25 µM Cd 100/0
15.4±0.12 11.11±2.54
0.294± 0.0032 0.03± 0.001
0.652± 0.257 6.17±0.4170
15.14±1.76 17.85±1.05
60/40 18.04± 0.21 12.85±1.93
0.439± 0.053 0.121±0.005
0.739± 0.218 7.65± 0.56
13.18±0.11 15.25±0.49
0/100 13.18± 0.002 6.784±0.84
0.802± 0.024 0.068± 0.018
2.908± 0.166 9.26± 0.36
9.18±0.13 6.784±0.3

© by PSP Volume 21 – No 3a. 2012 Fresenius Environmental Bulletin
668
A significant effect on soluble protein content per DW was observed by both Cd and N regimes. Within the control treatments, NH4
+ nutrition led to a decrease in soluble protein content (Table 2). In leaves and roots, a decrease in soluble protein content was observed when plants were grown with NH4 +/NO3
- mixture, or with NO3-
only. However, plants grown under NH4+ regime and
treated with Cd exhibited a significant increase of soluble protein content.
Glu, Gln and Pro contents were more important in plants fed with NH4
+ than in those that received a mixture of NO3
- and NH4+, or only NO3
-. In Cd-treated tissues, an accumulation of Pro and Gln was observed, whereas Glu content was decreased (Table 2).
Protease activity was affected by the N-form added to nutrient solution. Protease activity was higher in plants grown in NH4
+-rich medium than with NO3- as a sole N
source (Table 3). Enhancement of protease activity by Cd stress was recorded in leaves and roots from plants grown with NO3
- alone, or a mix of NO3-/NH4
+. On the other hand, presence of Cd decreased protease activity in leaves and roots of the plants that received NH4
+ as N source. Regardless of the N-form added to culture medium, GS activity was higher in the leaves than in the roots. In the leaves, GS activity was slightly higher in NH4
+-fed plants
than in the other treatments. In roots, GS activity was enhanced with the increase of external NH4
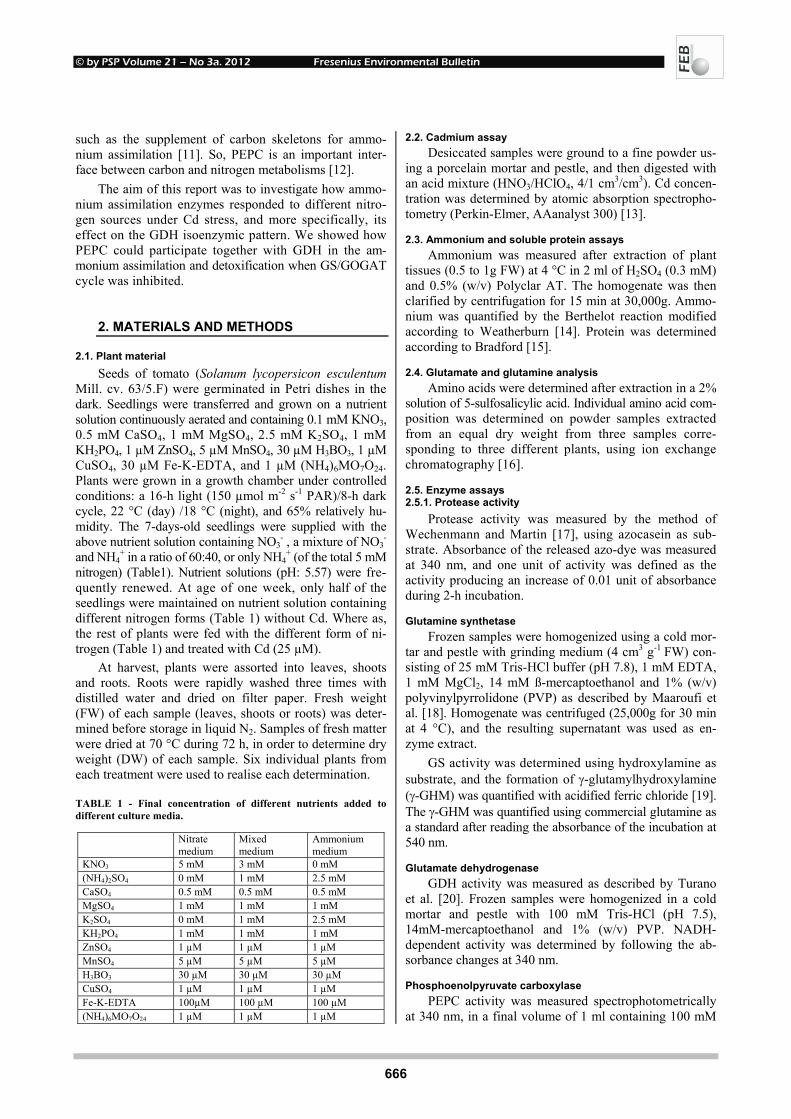
+ supply. Cd stress inhibited GS activity in leaves and roots of the plants grown under different nitrogen medium (Table 3). Protein gel blots analysis for the GS demonstrated that in leaves the plastid isoenzyme (GS2) was more abundant regardless of the N-form used (Fig. 1A). By contrast, the cytosolic isoenzyme (GS1) was more abundant in root tissues (Fig. 1B). Presence of Cd augmented the protein quantity of GS1 isoenzyme but reduces the GS2 in both-leaves and roots, regardless of the N-form added to the culture medium (Figs. 2A and B).
Our results showed that aminating GDH activity (NADH-GDH) was higher in roots than in leaves, inde-pendent from the N-form added to nutrient solution. Ami-nating GDH activity was higher in tomato plants fed with NH4
+ than in those fed with a mixture of NO3-/NH4
+, or NO3
- alone (Figs. 4A and B). Cd treatment was found to stimulate aminating GDH activity in leaves and roots of plants grown under different N sources (Table 3).
Regardless of N-form added to culture media, seven GDH isoenzymes were found on both control and treated leaves (Fig. 2A), but just one isoform in the roots of these plants (Fig. 2B).
FIGURE 1 - Protein gels blot analysis of GS protein in the control and treated leaves (A) and roots (B) from tomato cultivated with NO3-,
NH4+ or mixture.
© by PSP Volume 21 – No 3a. 2012 Fresenius Environmental Bulletin
669
FIGURE 2 - Native polyacrylamide gel of NADH-GDH from tomato cultivated with NO3
-, NH4+ or mixture as nitrogen source. A : control
and treated leaves. B: control and treated roots.
In control plants, presence of NH4
+ in culture medium resulted in an increase of PEPC activity in leaves. How-ever, in roots, the activity of this enzyme decreased in presence of excess NH4
+ (5 mM; (Table 3). Furthermore, there was an important increase in root PEPC activity when Cd was added to the nutrient solution. In leaves, Cd enhanced PEPC activity in those plants receiving NO3
- or a mix of NH4 +/NO3
-. However, when NH4+ was added as
the sole N source, PEPC activity was inhibited (Table 3). 4. DISCUSSION AND CONCLUSION
Nasraoui et al. [4] demonstrated that Cd-treated to-mato plants showed a growth inhibition as well as a re-duction of some parameters related to photosynthesis and chlorophyll fluorescence. Presence of NH4
+ in nutrient solution resulted in a decrease of Cd content, which could explain the lower inhibition degree of growth in NH4
+-fed-tomato plants [7]. The decrease in root and leaf pro-tein contents may be due to protein degradation as well as an amino acid hydrolysis [24, 25]. In fact, protein content
increased in NH4+-fed plants, in which protease activity
was inhibited in presence of Cd. Glu and Pro, as well as other organic solutes, are
characteristic for plant osmotic and pH adjustments under Cd stress [26]. In addition, Gln can act as a precursor of Pro, and it has been shown that this compound is accumu-lated under abiotic stresses, such as that induced by heavy metals [27]. In response to heavy metal exposure, accumu-lation of free Pro seems to be widespread among plants [27, 28]. It has been suggested that Pro accumulation in plants under Cd stress is due to the decrease of the plant water potential, and the functional significance of this accumu-lation could be related to the water balance [7, 29].
Under Cd stress, the increase of Pro concentration in leaves and roots, independently of N-form used, has been also proposed as a storage mechanism of excess N [30].
Generally, it is assumed that in higher plants, NH4+
has to be assimilated on its site of production/uptake to prevent toxicity, and also its little export from roots to shoots [31]. Indeed, our results showed that the total GS activity increased in roots from NH4
+-rich medium, which
© by PSP Volume 21 – No 3a. 2012 Fresenius Environmental Bulletin
670
reflected the higher accumulation of GS1 protein com-pared to this in plants fed with NO3
-. It appears that to-mato roots cope with the high levels of NH4
+ by an accel-eration of its incorporation into Glu and Pro. The differen-tial effect of Cd on GS in the different organs may reflect a specific response of GS isoenzyme. In leaves of Cd-treated tomatoes, inhibition of GS activity was closely linked to a decrease in GS2 cognate proteins. However, the inhibition of GS2 activity by Cd was associated with a compensatory induction of GS1 isoenzyme. It was sug-gested that N remobilisation was generally associated with cytosolic GS1 isoenzyme induction [5, 32]. Moreover, our results suggested that when the chloroplastic GS activity was negatively affected by Cd, the cytosolic isoenzyme one was stimulated in order to maintain biosynthesis of Glu (Glu was accumulated in Cd-treated tomatoes). Even though the GS/GOGAT pathway is the major route in higher plants, GDH can also participate in the assimila-tion of NH4
+ into 2-oxoglutarate to produce Glu. Presence of NH4
+ in the culture medium enhanced the aminating GDH activity in leaves and roots, due likely to the NH4
+ accumulation, which confirms that GDH contributes to the NH4
+ detoxification, particularly in response to high levels of this metabolite [6, 8, 12, 33, 34]. It has been observed that tomato plants can express several GDH isoenzymes with differential deaminating and aminating activities, and that Cd-treated plants are referentially in-volved in glutamate synthesis [35]. In all nitrogen sources tested and Cd treatments, the seven isoenzymes had the same migration profile but exhibited differences in the intensity of their bands. It can be suggested that GDH activity was increased in tomato plants when stressed with Cd and fed with different N-forms; this was correlated with an induction of different isoenzymes showing that the ami-nating activity of GDH may play a role in the NH4
+ detoxi-fication and tolerance of tomato plants to Cd.
The metabolic pathways of nitrogen and carbon are linked since nitrogen assimilation requires carbohydrates for the production of energy and the provision of carbon skeletons [12]. PEPC is the primary cytosolic enzyme re-plenishing oxaloacetate in the tricarboxylic acid cycle [36]. The increased PEPC activity with cadmium might be at-tributed to a number of factors. Principally, increased PEPC activity under abiotic stress may reflect the need of the plant for increased production of carbon skeletons in order to regulate osmotic pressure, and to maintain cell ionic neutral-ity by synthesis of organic acids [37]. Furthermore, PEPC might provide 2-oxaloactetate to replace a lower availabil-ity of oxoglutarate under stress Cd. Oxoglutarate is funda-mental in the respiratory cycle to produce ATP for osmo-regulation, and to provide 2-oxaloactetate for the TCA cycle. Gouia et al. [38] showed that induction of PEPC activity by Cd was partially due to PEPC protein synthesis. However, there was a difference in the behaviour of this enzyme depending on the plant organ studied. In our Cd-stressed tomatoes receiving NH4
+as nitrogen source, the decrease in PEPC activity could be explained as follows: Firstly, the deleterious effects of Cd were alleviated by the supply
of NH4+ as nitrogen source [4]. Secondly, a rapid pumping
of OAA for amino acid synthesis was not necessary be-cause, in such a situation, soluble proteins were highly accumulated.
In summary, our experiments showed that the detri-mental effects of Cd on plant growth were reduced by substitution of NO3
- by NH4+ in the nutrient solution, which
could be correlated with an increase of total soluble protein, Glu and Pro contents. Pro accumulation was a perfect indi-cator reflecting the tolerance capacity of tomato plants to different abiotic stress situations (NH4
+ and Cd stress). Moreover, the differences found in Cd response be-
tween tomatoes grown with different N forms, seem to be related to differences in the NH4
+assimilation pathway. The compensatory inhibition of GS2 activity by the in-duction of GS1 and GDH seems to play a crucial role in Glu regeneration from Gln. Thus, the present results pro-vide a relationship between NH4
+assimilation and Cd tolerance. Moreover, our results highlight the importance of the strategy played by plants on the induction of differ-ent GDH isoenzymes, and the role of PEPC for the NH4
+detoxification. REFERENCES
[1] He X J. and Li J. (2010) Effects of cadmium toxicity on some growth parameters and antioxidant enzymes in Luffa cylindrica seedlings. Fresen. Environ. Bull. 19 ( 11A), 2630-2636.
[2] Yu F., Liu K., Li M., Zhou Z., Deng H. and Chen B. (2011) Ef-fects of cadmium on nitrogen metabolism in tillering stage of Oryza Saliva L. Fresen. Environ. Bull
[3] Maksymiec, W., Wojcik, M. and Krupa, Z. (2007) Variation in oxidative stress and photochemical activity in Arabidopsis thaliana leaves subjected to cadmium and excess copper in the presence or absence of jasmonate and ascorbate. Chemosphere 66 (3), 421-427.
[4] Nasraoui, H.A., Gharbi, F., Ghorbel, M.H. and Gouia, H. (2010) Cadmium stress effects on photosynthesis and PSII efficiency in tomato grown on NO3
- or NH4+ as nitrogen source. Acta Bot.
Gall. 157, 1010-115.
[5] Chaffei H.C., Carrayol E., Ghorbel M.H. and Gouia H. (2009) Physiological and biochemical effects of cadmium toxicity in en-zymes involved in nitrogen and amino-acid metabolism in tomato plants. Acta Bot. Gall. 156, 477-486.
[6] Nasraoui H.A., Ghorbel M.H. and Gouia H. (2008) Effects of ni-trate concentration on growth and nitrogen metabolism of tomato (Lycopersicon esculentum Mill.) under cadmic stress. Acta Bot. Gall. 155, 577-583.
[7] Nasraoui H.A., Chaffei H.C., Ghorbel M.H. and Gouia H. (2011) Growth and nitrate assimilation in tomato (Solanum lycopopersi-cum) grown with different nitrogen source and treated with cad-mium Acta Bot. Gall. 158, 3-11.
[8] Kant S., Kant P., Lips H. and Barak S. (2005) Partial substitution of NO3
- by NH4+ fertilization increases ammonium assimilating
enzyme activities and reduces the deleterious effects of salinity on the growth of barley. J. Plant Physiol. 164, 303-311.
[9] Loulakis K.A. and Roubelakis-Angelakis K.A. (1992) Ammo-nium induced increase in NADH-glutamate dehydrogenase activ-ity is caused by de-novo synthesis of the subunit. Planta. 187, 322-7.
© by PSP Volume 21 – No 3a. 2012 Fresenius Environmental Bulletin
671
[10] Amancio S. and Santos H. (1992) Nitrate and ammonium assimi-lation by roots of maize (Zea mays L.) seedlings as investigated by in vivo 15N-NMR. J. Exp. Bot. 43, 633–639.
[11] Frechilla S., Lasa B., Aleu M., Juanarena N., Lamsfus C. and Pedro M. (2002) Short-term ammonium supply stimulates gluta-mate dehydrogenase activity and alternative pathway respiration in roots of pea plants. J. Plant Physiol. 159, 811–816.
[12] Lasa B., Frechilla S., Aparicio-Tejo P.M. and Lamsfus C. (2002) Role of glutamate dehydrogenase and phosphoenolpyruvate car-boxylase activity in ammonium nutrition tolerance in roots. Plant Physiol .Biochem. 40, 969-76.
[13] Van Assche F., Cardinaels C. and Clijsters H. (1988) Induction of enzyme capacity in plants as a result of heavy metal toxicity: dose-response relations in Phasoelus vulgaris L., trated with zinc and cadmium. Environ. Pollut. 52, 103-115.
[14] Weatherburn M.W. (1967) Phenol hypochlorite reaction for de-termination of ammonia. Anal. Chem. 39, 971-974.
[15] Bradford M.M. (1976) A rapid and sensitive method for the quantification of microgram quantities of protein utilizing the principle of protein-dye binding. Anal. Biochem. 72, 248–54.
[16] Rochat C. and Boutin J.P. (1989) Carbohydrates and nitrogenous compounds changes in the hull and in the seed during the pod de-velopment of pea. Plant Physiol. Biochem. 27, 881-887.
[17] Wechenmann. D. and Martin P. (1980) Endopeptidase activity and nitrogen mobility in senescing leaves of Nicotiana rustica in light and dark. Physiol. Plant. 60, 333-340.
[18] Mâaroufi H., Debouba M., Ghorbel M.H. and Gouia H. (2009) Tissue-specific cadmium accumulation and its effects on nitrogen metabolism in tobacco (Nicotiana tabaccum, Bureley v. Fb9), C. R. Biol. 332, 58 -68.
[19] O'Neal D. and Joy K.D. (1973) Glutamine synthetase of pea leaves. I –purification, stabilization and pH optimal, Arch. Bio-chem. Biophys. 159, 113-122.
[20] Turano F.J., Thakkar S.S., Fang T. and Weiseman J.M. (1997) Characterisation ans expression of NAD(H)-dependennt gluta-mate dehydrogenase genes in Arabidopsis. Plant Physiol. 113, 1329-1334.
[21] Echevarria C.V., Pacquit N., Bakrim L., Osuna B., Delgado Mar-rio D. and Vidal J. (1994) The effect of pH on the covalent and metabolic control of C4 phosphoenolpyruvate carboxylase from sorghum leaf. Arch. Biochem. Biophys. 315, 425-430.
[22] Laemmli U.K. (1970) Cleavage of structural proteins during the assembly of the head of bacteriophage T4. Nature. 227, 680-685.
[23] Hartman T., Nagel M. and Ilert H.J. (1973) Organ specific multi-ple forms of glutamic dehydrogenase in Medicago sativa. Planta 111, 119-128.
[24] Davies K. J. A. (1987) Protein damage and degradation by oxy-gen radicals. I. General aspects. J. Biol. Chem. 262, 9895–9901.
[25] Gouia H., Gorbel M.H. and Meyer C. (2000) Effects of cadmium on activity of nitrate reductase and on other enzymes of the ni-trate assimilation pathway in bean, Plant Physiol. Biochem. 38, 629-638.
[26] Lorenzo H., Siverio J.M. and Caballero M. (2001) Salinity and nitrogen fertilization and nitrogen metabolism in rose plants. J3 Agric. Sci. 137, 77-84.
[27] Hermandez L. E., Garate A. and Carpena R. (1997) Effects of cadmium on the uptake, distribution and assimilation of nitrate in Pissium Sativum. Plant Soil. 189, 97-106.
[28] Costa G. and Morel J. L. (1994) Water relation, gas exchange and amino acid content in Cd treated lettuce. Plant Phsiol. Biochem. 32, 561–570.
[29] Schat H., Sharma S. S. and Vooijs R. (1997) Heavy metal-induced accumulation of free proline in metal-tolerant and non tolerant ecotypes of Silene vulgaris. Physiol. Plant. 10, 477-482.
[30] Rhodes D., Varlues P.E. and Sharp R. E. (1999) Role of amino acids in abiotic stress resistance. In: Plant Amino Acids-Biochemistry and Biotechnology (Singh B. K., ed.). New York: Marcel Dekker.
[31] Majerowicz N., Kerbauy G.B., Nievola C.C. and Suzuki R.M. (2000) Growth and nitrogen metabolism of Catasetum fimbria-tum (orchidaceae) grown with different nitrogen sources. Env. Expt. Bot. 44, 195-206.
[32] Chaffei C., Pageau K., Suzuki A., Gouia H., Ghorbel M.H. and Masclaux-Daubresse C. (2004) Cadmium toxicity induced changes in nitrogen management in Lycoopersicon esculentum leading to a metabolic safeguard through an amino acid storage strategy. Plant Cell Physiol. 45, 1681-1693.
[33] Dubois F.S., Thercé-Laforgue T., Gonzalez-Moro M.B., Estavillo J.M., Sangwan R., Gallais A. and Hirel B. (2003) Glutamate de-hydrogenase in plants: is there a new story for an old enzyme. Plant Physiol. Biochem. 41, 565-576.
[34] Peter J.L. and Miflin B.J. (2003) Glutamate synthetase and the synthesis of glutamate in plants. Plant Physiol. Biochem. 41, 555-564.
[35] Chaffei C., Masclaux-Daubresse C., Gouia H. and Ghorbel M.H. (2006) Purification of glutamate dehydrogenase isoenzymes from control and cadmium treated tomato leaf, Cadmium Toxicity and Tolerance in Plants. Book Editors; Nafees A. et al. (eds) Narosa Publishing Housse, New Delhi. 137-157.
[36] Champigny M. and Foyer C. (1992) Nitrate activation of cytoso-lic protein kibnases diverts photosynthetic from sucrose to amino and biosynthesis, basis for anew carbon concept, Plant physiol. 95, 281-285.
[37] Cramer M.D., Lewis Q.A.M. and Lips S.H. (1993) Inorganic car-bon fixation and metabolism in maize roots as affected by nitrate and ammonium nutrition. Physiologia Plantarum 89, 632–639.
[38] Gouia H., Chaffei C., Deboouba M. and Gorbel M.H. (2008) Dif-ferential toxicological response to cadmium stress of bean seed-lings grown with NO3
- or NH4+ as nitrogen source, Inter. J. Bot.
4, 14-23.
Received: December 13, 2010 Revised: June 28, 2011; September 13, 2011 Accepted: September 30, 2011 CORRESPONDING AUTHOR
Nasraoui-Hajaji Afef Unité de Recherche Nutrition et Métabolisme Azotés et Protéines de Stress 99UR/09-20 Département de Biologie Faculté des Sciences de Tunis Universitaire de Tunis Elmanar, 1060 Tunis TUNISIE E-mail: [email protected]
FEB/ Vol 21/ No 3a/ 2012 – pages 665 – 671

© by PSP Volume 21 – No 3a. 2012 Fresenius Environmental Bulletin
672
EFFECTS OF AIR-DRYING ON PHOSPHORUS SORPTION IN SHALLOW LAKE SEDIMENT, CHINA
Wen-Juan Xiao1, 2, Chun-Lei Song1, Xiu-Yun Cao1 and Yi-Yong Zhou1,*
1 Institute of Hydrobiology, Chinese Academy of Sciences, No. 7 Donghu South Road, Wuhan, Hubei Province, China 2 Graduate School of the Chinese Academy of Sciences, No. 19 Yuquan Road, Beijing, China
ABSTRACT
Air-drying has significant influences on phosphorus sorption behaviors in soils. It is urgently necessary to expend the relevant knowledge to sediments of lakes, especially large eutrophic ones. Sediments were collected at different sites in a Chinese large shallow eutrophic lake (Lake Chaohu) and an urban shallow lake (Lake Donghu) in November 2007; contents of organic matter (OM) were measured. Phosphorus sorption behavior fitted Langmuir equation well. Compared to the field-moist sample, the air-dried sediments had significantly lower sorption energy (K). Additionally, there was a significant positive relation-ship between the OM content and K value in the field-moist sediments. The changes in geochemical characteris-tics of iron oxide and organic carbon may be mainly re-sponsible for the decreasing K value in air-dried sediment. Furthermore, in the incubation experiments, the air-dried sediments generally gave higher concentrations of soluble reactive phosphorus coupled with alkaline phosphatase activity, which was mainly due to the decreased phospho-rus sorption energy, because there was no significant differences of pH values and dissolved oxygen concentra-tions between the air-dried and field-moist sediments. Finally, in contrast with the field-moist samples, the air-dried ones showed a significantly positive relationship between OM content and EPC0 value, suggesting that the breakdown of OM during drying may be a major source of P upon reflooding.
KEYWORDS: Air-drying, lake sediment, phosphorus sorption, organic matter, alkaline phosphatase activity, equilibrium phos-phorus concentration
1. INTRODUCTION
Phosphorus (P) plays a major role in eutrophication of aquatic systems [1]. Naturally or artificially, their water * Corresponding author
levels change in different frequency. As a consequence, the relevant sediment undergoes air-drying and flooding alternation. In the soils, air-drying increased P sorption [2]. However, the information on the relationship between air-drying and P sorption behaviors in sediments of aqua-tic systems is scarce. In a Spremberg reservoir, the sedi-ment increases the P release on reflooding [3]. There was an increase in P level after air-drying and reflooding of North Lake sediments [4]. Shortly, few studies on sedi-ments give the result contradictory to that obtained from soils. Additionally, sediment P behavior was measured using either air-dried [5, 6] or field-moist [7, 8] samples, which may yield different results; Moreover, there is the controversy over the role of OM in P sorption. For exam-ple, P sorption was positively correlated with OM [9-11], but then, a negative correlation between P sorption and OM was noted in soils [12, 13]. However, this subject was inadequately studied.
In this study, sediments were collected in a Chinese large shallow eutrophic lake (Lake Chaohu) and an urban shallow lake (Lake Donghu) in November 2007. The OM content was measured and P sorption behaviors were described by Langmuir equation. Furthermore, the field-moist and air-dried sediments were compared for their abilities to shape the patterns of soluble reactive P con-centration and alkaline phosphatase activity under the aeration conditions by incubation experiments. The aims of this study were 1) to further describe the effects of air-drying on P sorption capacity in sediments of aquatic systems, especially lakes; 2) to have deeper understanding of the roles played by OM in modifying sediment P sorp-tion capacity; 3) to reveal environmental significance of drying and flooding alternation for the restoration and management of eutrophic lakes.
2. MATERIALS AND METHODS
2.1. Sample preparation
2.1.2. Air-dried and field-moist sediment suspension
Sediments were collected from Lake Chaohu and Lake Donghu in November 2007 (Fig. 1). The sediments were sampled by a Peterson grab sampler, stored at 4 °C,

© by PSP Volume 21 – No 3a. 2012 Fresenius Environmental Bulletin
673
homogenized and sub-sampled randomly for two treat-ments. One portion of the sample was allowed to air-dry at room temperature (about 20 °C). Another portion was
immediately mixed with distilled water (1:9) and stored at 4 °C [14].
(a) Lake Chaohu
(b) Lake Donghu
FIGURE 1 - Map of sampling sites of Lake Chaohu (a) and Lake Donghu (b).

© by PSP Volume 21 – No 3a. 2012 Fresenius Environmental Bulletin
674
2.2. Incubation experiment
Sediment samples were taken in February 2009 by polyethylene pipes, pushing 20 cm into the sediment with-out disturbing the sediment-water interface. Three field-moist sediment cores were incubated at 4 °C immediately. The other three cores were air-dried during 40 days at room temperature (about 20 °C). For the air-dried sedi-ments, the final water ratio decreased by 17%, on average. After air-drying, the sediment cores were reflooded with filtered original lake water (0.45 µm, stored at 4 °C) by siphoning to the same water levels as in the field-moist sediment controls. The reflooded and air-dried sediment cores are referred to as air-dried sediment cores. A 45-ml water sample was taken from each core for analysis and replaced by the same volume of filtered lake water. The whole incubation times were in the aeration state [15].
2.3. Chemical analysis 2.3.1. Phosphorus sorption
The suspension was incubated with 0, 0.5, 1, 2, 5, 8, 10, and 15 mg P L-1 as KH2PO4 in 10-ml centrifuge tubes (each set has triplicate suspensions; modified by [14]). Tubes were shaken for 24 h at 20±3 °C, centrifuged at 3000 rpm for 20 min, and analyzed for soluble reactive phosphorus (SRP). Sorption parameters were calculated using equations as follows: Linear equation: Q=KC-Q0 Langmuir equation:C/Q = C/Qmax +1/K Qmax Freundlich equation: LnQ=lnKf +nlnC C: P concentration in solution after 24 h equilibrium (mg L-1); Q: amount of P sorbed by the solid phase (mg kg-1).
The equilibrium P concentration (EPC0) was meas-ured by Linear equation, where no P sorption or desorp-tion occurs, and is equal to the value of C when Q is 0. The maximum P sorption (Qmax) and P sorption energy (K) were measured by Langmuir equation. Freundlich value (Kf) was measured by Freundlich equation.
Water SRP concentration was determined by the mo-lybdate blue method [16]. OM was measured by digestion with potassium dichromate plus sulfuric acid. Alkaline phosphatase activity (APA) in the water was determined using a procedure modified by [17, 18]. Dissolved oxygen (DO) was recorded with a portable JPBJ-608 meter and pH with a PHBJ-260 meter.
2.4. Statistical analysis
Statistical analyses of variance were performed using SPSS 17.0 program.
3. RESULTS AND DISCUSSION
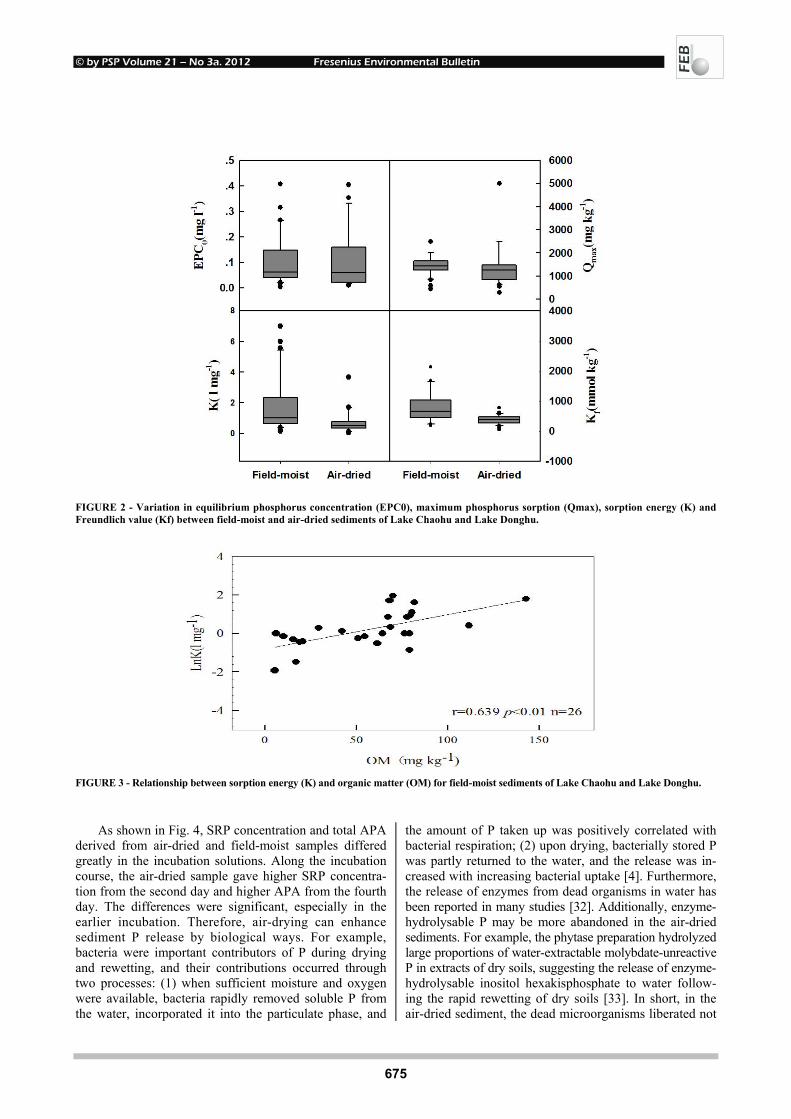
Under both air-dried and field-moist conditions, se-diment P sorption fitted Langmuir equation well (r = 0.87-0.99). Compared to the field-moist samples, the air-dried ones had slightly higher EPC0 and lower Qmax val-
ues; furthermore, they showed significantly lower K val-ues (p<0.05) (Fig. 2). Taken together, air-drying weakened sediment P sorption capacity with the sorption energy being mostly affected.
The decrease in sorption energy (K) could be ex-
plained in terms of iron oxide and OM. Firstly, our phos-phate sorption data also fitted Freundlich equation well, and the adsorption of phosphate onto Fe(OOH) can be satisfactorily described with the Freundlich adsorption iso-therm [19]. Furthermore, in Chinese shallow lakes includ-ing the study lakes, the sediment OM content was posi-tively proportional to soluble reactive P concentration in interstitial water, in a form of exponential function, but inversely related to the sediment Fe/P ratio [20]. Iron-bound phosphates were the major P fractions in Lake Chaohu [21] and Lake Donghu [22]. Therefore, iron oxide plays an important role in P sorption in the sediments of the studied lakes, which might be adversely affected by air-drying. For example, in wetland sediment, iron extrac-tability of wet and air-dried sediments suggested an in-crease in iron crystallinity upon drying, correlated with the decrease in P-sorption capacity [23]. Complete desic-cation of sediments may lead to a decrease in the affinity of P for iron minerals [24]; Secondly, in the field-moist samples existed a significant positive relationship between OM content and K value (p<0.01) (Fig. 3), suggesting an important role of the sediment OM for binding phosphate. Consistently, positive correlations of both K and S-max with oxalate-extractable Fe (r values of 0.93 and 0.81, p < 0.05) and total carbon (TC) (r values of 0.89 and 0.74, p < 0.05) were found, suggesting that OM and amorphous or poorly crystalline Fe would play dominant roles in P adsorption in the headwater ditch sediments [25]. There-fore, the decomposition of the sediment OM upon air-drying could weaken the P sorption energy. For example, decreased P sorption after air-drying has been attributed to an increase in water-extractable OM [26]. DOM from decomposed organic materials inhibited P sorption to a greater extent than did DOM derived from fresh materials [27]. The relative affinity for phosphate decreases as the OM/specific surface area ratio increases supporting the hypothesis that phosphate and organic anions compete strongly for the same sorption sites. The amount of ox-alate + malate released from the solid phase was related roughly to that of P sorbed after the initial P sorption [28]. Moreover, the decrease in aerobic respiratory activity and humification index was observed in soil column from the surface to 1.5 m depth [29]; it means that, under aerobic conditions, the contents of humic substances were higher in the air-dried sediments relevant to the field-moist one, which also had adverse effects on P sorption. For example, amendment of the humic-fulvic acid mixture increased the amount of applied P in soils [30], and humic and fulvic acids competitively inhibit P sorption [31]. In short, changes in the geochemical characteristics of iron oxide and organic carbon would decrease the P sorption energy in air-dried sediments.
© by PSP Volume 21 – No 3a. 2012 Fresenius Environmental Bulletin
675
FIGURE 2 - Variation in equilibrium phosphorus concentration (EPC0), maximum phosphorus sorption (Qmax), sorption energy (K) and Freundlich value (Kf) between field-moist and air-dried sediments of Lake Chaohu and Lake Donghu.
FIGURE 3 - Relationship between sorption energy (K) and organic matter (OM) for field-moist sediments of Lake Chaohu and Lake Donghu.
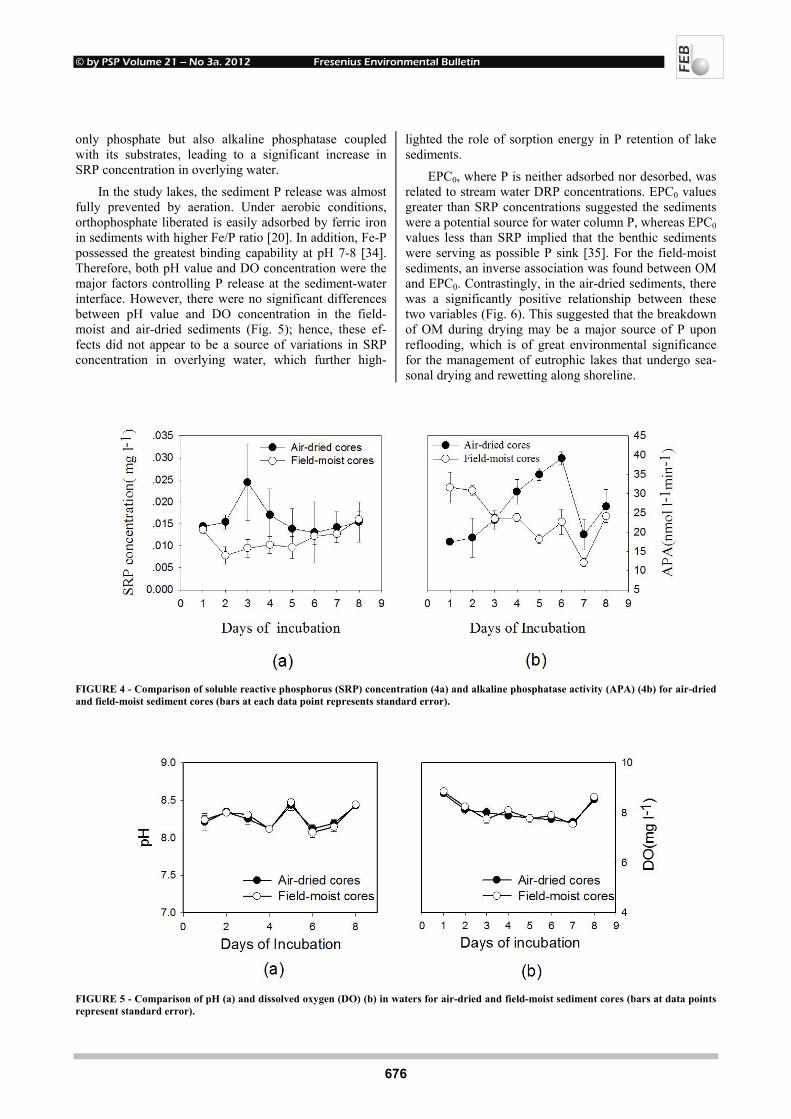
As shown in Fig. 4, SRP concentration and total APA
derived from air-dried and field-moist samples differed greatly in the incubation solutions. Along the incubation course, the air-dried sample gave higher SRP concentra-tion from the second day and higher APA from the fourth day. The differences were significant, especially in the earlier incubation. Therefore, air-drying can enhance sediment P release by biological ways. For example, bacteria were important contributors of P during drying and rewetting, and their contributions occurred through two processes: (1) when sufficient moisture and oxygen were available, bacteria rapidly removed soluble P from the water, incorporated it into the particulate phase, and
the amount of P taken up was positively correlated with bacterial respiration; (2) upon drying, bacterially stored P was partly returned to the water, and the release was in-creased with increasing bacterial uptake [4]. Furthermore, the release of enzymes from dead organisms in water has been reported in many studies [32]. Additionally, enzyme-hydrolysable P may be more abandoned in the air-dried sediments. For example, the phytase preparation hydrolyzed large proportions of water-extractable molybdate-unreactive P in extracts of dry soils, suggesting the release of enzyme-hydrolysable inositol hexakisphosphate to water follow-ing the rapid rewetting of dry soils [33]. In short, in the air-dried sediment, the dead microorganisms liberated not
© by PSP Volume 21 – No 3a. 2012 Fresenius Environmental Bulletin
676
only phosphate but also alkaline phosphatase coupled with its substrates, leading to a significant increase in SRP concentration in overlying water.
In the study lakes, the sediment P release was almost fully prevented by aeration. Under aerobic conditions, orthophosphate liberated is easily adsorbed by ferric iron in sediments with higher Fe/P ratio [20]. In addition, Fe-P possessed the greatest binding capability at pH 7-8 [34]. Therefore, both pH value and DO concentration were the major factors controlling P release at the sediment-water interface. However, there were no significant differences between pH value and DO concentration in the field-moist and air-dried sediments (Fig. 5); hence, these ef-fects did not appear to be a source of variations in SRP concentration in overlying water, which further high-
lighted the role of sorption energy in P retention of lake sediments.
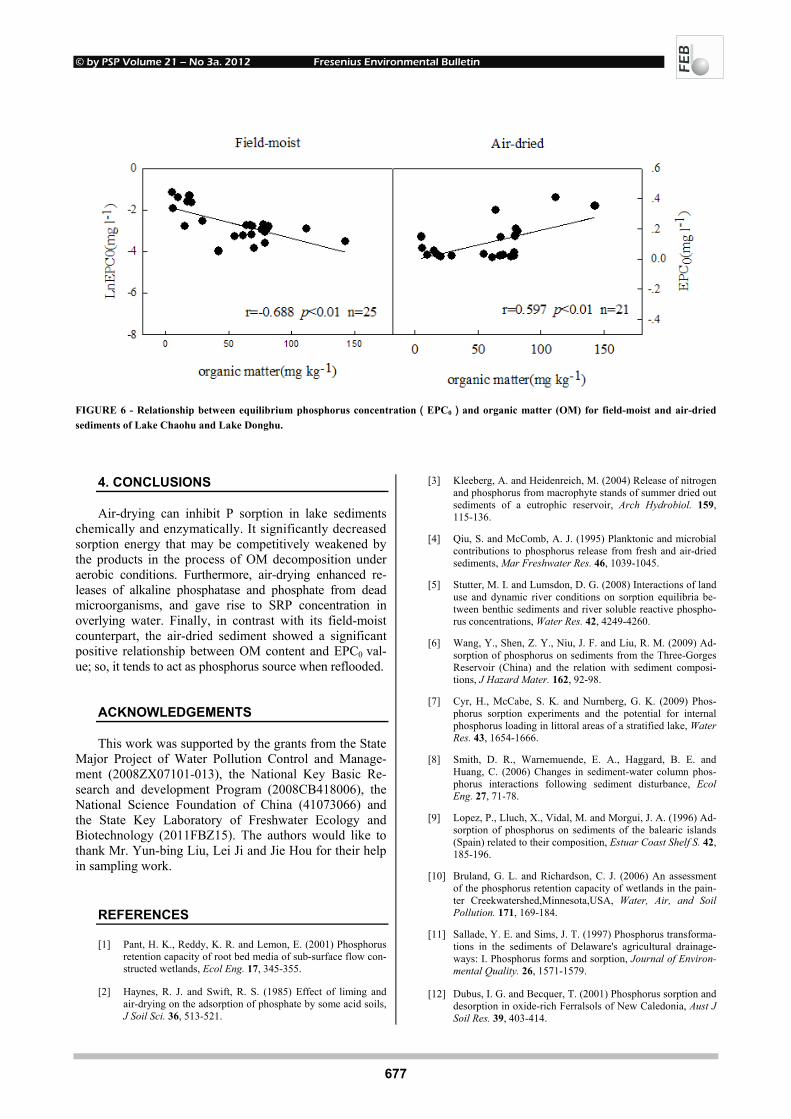
EPC0, where P is neither adsorbed nor desorbed, was related to stream water DRP concentrations. EPC0 values greater than SRP concentrations suggested the sediments were a potential source for water column P, whereas EPC0 values less than SRP implied that the benthic sediments were serving as possible P sink [35]. For the field-moist sediments, an inverse association was found between OM and EPC0. Contrastingly, in the air-dried sediments, there was a significantly positive relationship between these two variables (Fig. 6). This suggested that the breakdown of OM during drying may be a major source of P upon reflooding, which is of great environmental significance for the management of eutrophic lakes that undergo sea-sonal drying and rewetting along shoreline.
FIGURE 4 - Comparison of soluble reactive phosphorus (SRP) concentration (4a) and alkaline phosphatase activity (APA) (4b) for air-dried and field-moist sediment cores (bars at each data point represents standard error).
FIGURE 5 - Comparison of pH (a) and dissolved oxygen (DO) (b) in waters for air-dried and field-moist sediment cores (bars at data points represent standard error).
© by PSP Volume 21 – No 3a. 2012 Fresenius Environmental Bulletin
677
FIGURE 6 - Relationship between equilibrium phosphorus concentration(EPC0)and organic matter (OM) for field-moist and air-dried sediments of Lake Chaohu and Lake Donghu.
4. CONCLUSIONS
Air-drying can inhibit P sorption in lake sediments chemically and enzymatically. It significantly decreased sorption energy that may be competitively weakened by the products in the process of OM decomposition under aerobic conditions. Furthermore, air-drying enhanced re-leases of alkaline phosphatase and phosphate from dead microorganisms, and gave rise to SRP concentration in overlying water. Finally, in contrast with its field-moist counterpart, the air-dried sediment showed a significant positive relationship between OM content and EPC0 val-ue; so, it tends to act as phosphorus source when reflooded.
ACKNOWLEDGEMENTS
This work was supported by the grants from the State Major Project of Water Pollution Control and Manage-ment (2008ZX07101-013), the National Key Basic Re-search and development Program (2008CB418006), the National Science Foundation of China (41073066) and the State Key Laboratory of Freshwater Ecology and Biotechnology (2011FBZ15). The authors would like to thank Mr. Yun-bing Liu, Lei Ji and Jie Hou for their help in sampling work.
REFERENCES
[1] Pant, H. K., Reddy, K. R. and Lemon, E. (2001) Phosphorus retention capacity of root bed media of sub-surface flow con-structed wetlands, Ecol Eng. 17, 345-355.
[2] Haynes, R. J. and Swift, R. S. (1985) Effect of liming and air-drying on the adsorption of phosphate by some acid soils, J Soil Sci. 36, 513-521.
[3] Kleeberg, A. and Heidenreich, M. (2004) Release of nitrogen and phosphorus from macrophyte stands of summer dried out sediments of a eutrophic reservoir, Arch Hydrobiol. 159, 115-136.
[4] Qiu, S. and McComb, A. J. (1995) Planktonic and microbial contributions to phosphorus release from fresh and air-dried sediments, Mar Freshwater Res. 46, 1039-1045.
[5] Stutter, M. I. and Lumsdon, D. G. (2008) Interactions of land use and dynamic river conditions on sorption equilibria be-tween benthic sediments and river soluble reactive phospho-rus concentrations, Water Res. 42, 4249-4260.
[6] Wang, Y., Shen, Z. Y., Niu, J. F. and Liu, R. M. (2009) Ad-sorption of phosphorus on sediments from the Three-Gorges Reservoir (China) and the relation with sediment composi-tions, J Hazard Mater. 162, 92-98.
[7] Cyr, H., McCabe, S. K. and Nurnberg, G. K. (2009) Phos-phorus sorption experiments and the potential for internal phosphorus loading in littoral areas of a stratified lake, Water Res. 43, 1654-1666.
[8] Smith, D. R., Warnemuende, E. A., Haggard, B. E. and Huang, C. (2006) Changes in sediment-water column phos-phorus interactions following sediment disturbance, Ecol Eng. 27, 71-78.
[9] Lopez, P., Lluch, X., Vidal, M. and Morgui, J. A. (1996) Ad-sorption of phosphorus on sediments of the balearic islands (Spain) related to their composition, Estuar Coast Shelf S. 42, 185-196.
[10] Bruland, G. L. and Richardson, C. J. (2006) An assessment of the phosphorus retention capacity of wetlands in the pain-ter Creekwatershed,Minnesota,USA, Water, Air, and Soil Pollution. 171, 169-184.
[11] Sallade, Y. E. and Sims, J. T. (1997) Phosphorus transforma-tions in the sediments of Delaware's agricultural drainage-ways: I. Phosphorus forms and sorption, Journal of Environ-mental Quality. 26, 1571-1579.
[12] Dubus, I. G. and Becquer, T. (2001) Phosphorus sorption and desorption in oxide-rich Ferralsols of New Caledonia, Aust J Soil Res. 39, 403-414.
© by PSP Volume 21 – No 3a. 2012 Fresenius Environmental Bulletin
678
[13] Daly, K., Jeffrey, D. and Tunney, H. (2001) The effect of soil type on phosphorus sorption capacity and desorption dynam-ics in Irish grassland soils, Soil Use Manage. 17, 12-20.
[14] Istvanovics, V. (1994) Fractional composition, adsorption and release of sediment phosphorus in the Kis-Balaton reser-voir, Water Res. 28, 717-726.
[15] Qiu, S. and A.J.McComb (1994) Effects of oxygen concen-tration on phosphorus release from reflooded air-dried wet-land sediments, Aust J Mar Fresh Res. 45, 1319-1328.
[16] Murphy, J. and Riley, J. (1962) A modified single solution method for the determination of phosphate in natural waters, Analytica chimica acta. 27, 31-36.
[17] Gage, M. A. and Gorham, E. (1985) Alkaline phosphatase activity and cellular phosphorus as an index of the phospho-rus status of phytoplankton in Minnesota lakes, Freshwater Biol. 15, 227-233.
[18] Boon, P. (1989) Organic matter degradation and nutrient re-generation in Australian freshwaters: I. Methods for exoen-zyme assays in turbid aquatic environments, Archiv fuer Hy-drobiologie AHYBA 4. 115.
[19] Golterman, H. L. (1995) The labyrinth of nutrient cycles and buffers in wetlands: Results based on research in the Camar-gue (southern France), Hydrobiologia. 315, 39-58.
[20] Liu, Y. B., Guo, Y. X., Song, C. L., Xiao, W. J., Huang, D. Z., Cao, X. Y. and Zhou, Y. Y. (2009) The effect of organic matter accumulation on phosphorus release in sediment of Chinese shallow lakes, Fund Appl Limnol. 175, 143-150.
[21] pan, C.-R., wang, J.-Q., zheng, Z.-X., liu, J.-J. and yin, F.-C. (2007) Forms of phosphorus and nitrogen existing in sedi-ments in Lake Chaohu Journal of Ecology and Rural Envi-ronment. 23, 43-47.
[22] Jiang, P.-H., Ji, L., Xiao, W.-J., Huang, D.-Z., Liu, Y.-B., Song, C.-L., Cao, X.-Y. and Zhou, Y.-Y. (2010) Bioturbation of two chironomid species on nutrient exchange at sediment-water interface in a chinese shallow eutrophic lake, Fresenius Environmental Bulletin. 19, 902-910.
[23] Qiu, S. and McComb, A. J. (2002) Interrelations between iron extractability and phosphate sorption in reflooded air-dried sediments, Hydrobiologia. 472, 39-44.
[24] Baldwin, D. S. and Mitchell, A. M. (2000) The effects of drying and re-flooding on the sediment and soil nutrient dy-namics of lowland river-floodplain systems: A synthesis, Re-gul River. 16, 457-467.
[25] Luo, Z. X., Zhu, B., Tang, J. L. and Wang, T. (2009) Phos-phorus retention capacity of agricultural headwater ditch se-diments under alkaline condition in purple soils area, China, Ecol Eng. 35, 57-64.
[26] Peltovuori, T. and Soinne, H. (2005) Phosphorus solubility and sorption in frozen, air-dried and field-moist soil, Eur J Soil Sci. 56, 821-826.
[27] Hunt, J. F., Ohno, T., He, Z., Honeycutt, C. W. and Dail, D. B. (2007) Inhibition of phosphorus sorption to goethite, gibb-site, and kaolin by fresh and decomposed organic matter, Bi-ol Fert Soils. 44, 277-288.
[28] Afif, E. (1995) Organic matter delays but does not prevent phosphate sorption by cerrado soils from Brazil, Soil Sci. 159, 207andhyhen.
[29] Cannavo, P., Dudal, Y., Boudenne, J. L. and Lafolie, F. (2004) Potential for fluorescence spectroscopy to assess the quality of soil water-extracted organic matter, Soil Sci. 169, 688.
[30] Delgado, A., Madrid, A., Kassem, S., Andreu, L. and del Carmen del Campillo, M. (2002) Phosphorus fertilizer recov-ery from calcareous soils amended with humic and fulvic ac-ids, Plant and Soil. 245, 277-286.
[31] Guppy, C., Menzies, N., Moody, P. and Blamey, F. (2005) Competitive sorption reactions between phosphorus and or-ganic matter in soil: a review, Aust J Soil Res. 43, 189-202.
[32] Reichardt, W., Overbeck, J. and Steubing, L. (1967) Free dis-solved enzymes in lake waters.
[33] Turner, B. L., McKelvie, I. D. and Haygarth, P. M. (2002) Characterisation of water-extractable soil organic phosphorus by phosphatase hydrolysis, Soil Biology and Biochemistry. 34, 27-35.
[34] Peng, J.-f., Wang, B.-z., Song, Y.-h., Yuana, P. and Liua, Z. (2007) Adsorption and release of phosphorus in the surface sediment of a wastewater stabilization pond, Ecol Eng.
[35] Froelich, P. N. (1988) Kinetic control of dissolved phosphate in natural rivers and estuaries: A primer on the phosphate buffer mechanism, Limnol Oceanogr. 33, 649-668.
Received: February 16, 2011 Revised: May 17, 2011; July 12, 2011 Accepted: September 28, 2011 CORRESPONDING AUTHOR
Yi-Yong Zhou Institute of Hydrobiology Chinese Academy of Sciences No.7 Donghu South Road Wuhan, Hubei Province P.R. CHINA Phone: +86 27 68780709 Fax: +86 27 68780709 E-mail: [email protected]
FEB./ Vol 21/ No 3a/ 2012 – pages 672 – 678
© by PSP Volume 21 – No 3a. 2012 Fresenius Environmental Bulletin
679
METHODOLOGIES FOR THE STUDY OF FILAMENTOUS CYANOBACTERIA BY FLOW CYTOMETRY Raquel Azevedo1, Eleazar Rodriguez1, Daniela Figueiredo1, Francisco Peixoto2 and Conceição Santos1,*
1CESAM & Department of Biology, Laboratory of Biotechnology and Cytometry, University of Aveiro, 3810 Aveiro, Portugal 2Centre for Research and Technology of Agro-Environment and Biological Sciences,
University of Trás-os-Montes and Alto Douro, Apartado 1013, 5001-801 Vila Real, Portugal
ABSTRACT
Flow cytometry (FCM) is largely used in phytoplank-ton analyses, but its potential for analysing filamentous algae is limited by the difficulty to obtain individualised cells. To overcome this, we developed a rapid and low-cost method for isolating high yields of cells from fila-mentous cyanobacteria (Anabaena cylindrica, Anabaena cf. solitaria., Nostoc sp., Aphanizomenon gracile, Apha-nizomenon sp. and Aphanizomenon flos-aquae) allowing maximum efficiency in cell isolation while minimizing degradation. In order to achieve an optimal methodology, six isolation solutions [Otto, Sgorbati and WPB buffers and FCB1 (0.1 % Triton-X100), FCB2 (0.2 % Triton-X100) and FCB5 (0.5 % Triton-X100) solutions], differ-ent incubation time and sonication periods were tested. Results indicate that cell isolation yield was mostly de-pendent on the isolation solution used. Among the buffers assayed, fluorescence microscopy observation revealed that WPB and FCB5 provided the highest yield of isolated cells. However, A. cylindrica and Nostoc sp. were more resistant and required sonication prior to incubation in WPB and FCB5 in order to obtain acceptable yields. In all species, FCB5 buffer provided best global results for cell integrity. The volume, granularity and autofluorescence of isolated cells were then characterized by FCM. In conclu-sion, this is the first report of an efficient, easy and low cost methodology for individualization of filamentous cyanobacteria cells, which enables their analysis by FCM, and will open a vast set of possibilities in this area of research.
KEYWORDS: Filamentous cyanobacteria, flow cytometry, isola-tion buffers, methodology.
1. INTRODUCTION
Cyanobacteria have a major role in the growth of many organisms such as aquatic plants and animals, because * Corresponding author
some of them are capable of fixing atmospheric nitrogen [1], being fundamental for the primary production on aquatic systems. Notwithstanding, contamination of the environ-ment by nutrients (mostly of anthropogenic origin) might result in uncontrolled growth of cyanobacteria, forming blooms which normally occurs in early summer [2]. These blooms might cause the eutrophication and are also respon-sible for releasing toxins to the ecosystem, which can be harmful to many live forms including humans [3]. It is thus important to have a rapid and efficient way to study and characterize these organisms and their population dynamics.
Unfortunately, most of the techniques available to characterize community dynamics, like cell counting and optical density, are laborious, time consuming and results can be affected by factors like high biodiversity of samples and small cellular volume. Flow cytometry (FCM) allies high speed analysis with sensitivity and the possibility of multi-parametric data acquisition [4], being a more suitable solution to study these bacterial communities with preci-sion. This is possible because particles are forced to move individualized and thus information is gathered for each particle. The ability of the particle to interact with light, reflecting it at different angles, gives information about particle’s volume and granularity. Intracellular compounds with intrinsic fluorescence (e.g. chlorophyll, phycocyanin) allow a selective differentiation of subpopulations, which is an advantage when analyzing samples with high biodi-versity [5]. FCM has been successfully applied to analyze unicellular algae [6] and cyanobacteria [7, 8], but filamen-tous cyanobacteria have seldom been studied by FCM. This is highly likely to be due to the structural nature of filamentous cyanobacteria; their organization in filament surrounded by strong mucilage is a major obstacle for FCM analysis. To reinforce this idea, Sakr et al. [9] was able to isolate and individualized cells from Anabaena sp. Strain PCC 7120 but with the protocol applied data analy-sis was difficult due to the elevated number of relatively small particles and debris resulting from cell lysis (proba-bly due to sonication).
The aim of the work presented here is to provide an easy and reliable protocol to facilitate filamentous cyano-bacteria analysis by FCM. In order to achieve this, several parameters were tested (Isolation Solution, Incubation
© by PSP Volume 21 – No 3a. 2012 Fresenius Environmental Bulletin
680
time, Sonication) to provide the best results. With this work, we expect to give new tools to researchers in the study of cyanobacterial communities, by proposing a simple and effective protocol to obtain individualized cells, opening the possibility to study them by FCM.
2. MATERIAL AND METHODS
2.1. Species and culture conditions
The photosynthetic prokaryotes Anabaena cf. soli-taria (UADFA14), Aphanizomenon gracile (UADFA16), Aphanizomenon sp (UADFA18) and Aphanizomenon flos-aquae (UADFA15) were isolated from environmental sam-ples (Vela Lake, Quiaios, Portugal). Samples of Anabaena cylindrica (N_212) and Nostoc sp. (N_213) were obtained from the University of Trás-os-Montes and Alto Douro collection.
Filamentous cultures were grown in MBL medium [10] without nitrates in 50 ml Erlenmeyer’s at 20°C ± 1°C and light provided by daylight fluorescent TLD 18W/840 Philips at constant irradiance of 135µmolm-2 s-1.
2.2. Sample preparation
Algal suspensions in exponential-growth phase were collected for analysis. In order to optimize a protocol for single cell isolation we tested the performance of six isolation solutions [Otto [11], Sgorbati [13], WPB [14], FCB1, FCB2 and FCB5- for composition see Table 1] and different incubation periods.
The species N_212 and N_213 presented high resis-tance to cellular isolation and thus it was necessary to resort to sonication at 35 KHz (Sonorex RK100H- Bande-lin electronics, Berlin) in order to obtain a good yield of isolated cells. For this reason, a new set of assays were performed to determine the most effective combination of sonication period/incubation in isolation solution.
In brief, samples were divided in two batches, one was sonicated in the isolation solution while the other was sonicated (in culture medium) and then the isolation solu-tion was added. After sonication, cells were collected by centrifugation and were resuspended in the isolation solu-tion. The sonication periods tested ranged from one to
five minutes. Final cell suspension were recovered and filtered through a 20-µm nylon filter.
2.3. Isolation performance and scoring with Fluorescence microscopy
The cyanobacteria were treated with different concen-trations of the buffers and FCB solutions (0.1, 0.2, 0.5 and 1%) and observed under a fluorescence microscope (Eclipse 80i fluorescence microscope Nikon Corporation, Nikon Instech Co., Kanagawa, Japan) to evaluate which of the treatment combinations provided the best yield of isolated cells. Filaments were evaluated continuously in order to pinpoint the beginning of cell isolation and its progression along time, until all the cells were isolated. We also assessed if any type of structural changes oc-curred in the individualized cells, namely degradation, as this would mean that the methodology was too abrasive and thus unsuitable. The buffers and solutions with the highest yield of cell isolation and the lowest time of incu-bation were used to the further analysis.
2.4. Flow-cytometric analysis
All samples were analyzed with a Coulter EPICS XL (Coulter Electronics, Hialeah, FL, USA) flow cytometer equipped with an air-cooled argon-ion laser tuned at 15 mW and operating at 488nm. Fluorescence was collected through a 645nm dichroic long-pass filter and a 675nm band-pass filter (30 nm bandwidth) for chlorophyll fluo-rescence. The results were acquired using the SYSTEM II software version 3.0 (Coulter Electronics). Distilled water was used as the sheath fluid.
The forward scatter (FS), which is related with cell size/volume, and side scatter (SS) which is related with granularity/internal organization and refractive index of the cell were recorded and used to characterize the mor-phology of the individualized cells.
Polystyrene latex beads with 0.945 µm (Agar scien-tific, 66a Cambridge Road, Stansted, Essex U.K.) were used to help in the identification of cyanobacteria indi-vidualized cells and to set up the instrument (FS and SS). Acquisition was performed at a low rate and all settings were kept constant throughout the analysis. The normali-zation of the data was measured by Coefficient of Varia-tion which gives the quality of the samples.
TABLE 1 - Composition of the four Isolation solutions tested.
Buffer Composition Reference
Otto I: 100mM citric acid, 0.5% (v/v) Tween 20 (pH 2-3) Otto
Otto II: 400mM Na2PO4.12H2O (pH 8-9)
Otto [11] Dolezel and Göhde [12]
Sgorbati 4% formaldehyde in Tris buffer (10 mM Tris, 10mM Na2.EDTA, 100mM NaCl, pH 7.4); 0.1% triton X-100
Sgorbati et al. [13]
WPB 0.2 M Tris-HCl, 4mM MgCl2.6H2O, 1% Triton X-100, 2mM EDTA Na2.2H2O, 86Mm NaCl, 10 Mm metabissulfite, 1% PVP-10 (pH 7.5)
Loureiro et al. [14]
FCB1, FCB2 and FCB5 solutions
Triton-X100 at 0.1%, 0.2%, 0.5% and distilled water.
© by PSP Volume 21 – No 3a. 2012 Fresenius Environmental Bulletin
681
3. RESULTS
3.1. Isolation solution performance
From the isolation solutions tested, only WPB and FCB5 solutions successfully managed to provide isolated cells within a short time period (Table 2). Nonetheless, while for the species isolated from UADFA14, UAD-FA16, UADFA18 and UADF15, buffer treatment was enough for cell isolation, for N_212 and N_213, sonica-tion was later found to also be required in order to achieve good cell isolation.
TABLE 2 - Quantitative evaluation of the isolation solution per-formance. Values vary between 0- no effect was observed, and 3- maximum effect. Cell lysis was only evaluated in the buffers that provided cell release.
Buffers Incubation Time
Number of Events
Cell Lysis Rating
Otto 0 0 - 0 Sgorbati 0 0 - 0
WPB 3 3 3 0 FCB1 1 1 0 1 FCB2 1 1 0 1 FCB5 3 3 0 3
Both FCB5 solution and WPB achieved maximum
yield after 10 minutes incubation, for a concentration 1:2 (culture suspension: isolation solution). For the other solutions, the filaments remained intact even after thirty minutes of incubation (Fig 1a).
The species N_212 and N_213 proved to be more dif-ficult to isolate, as incubation was not enough to provide high yield of isolated cells in an acceptable time and thus, complementary methodologies were tested.
Sonication time and incubation in isolation solution were assayed in order to determine the combination pre-senting the highest yield of isolated cells. Sonication of cellular suspension with WPB and FCB5 were assayed but the filaments remained intact for both buffers in either conditions (Table 3).
TABLE 3 - Quantitative evaluation of sonication. Values vary be-
tween 0- no effect was observed, and 3- maximum effect. Rating for WPB was 0 because isolated cell’s integrity was compromised.
Buffers Buffer Incubation
Incubation Time
Number of Events
Cell Integrity
Rating
After Sonication
3 3 3 3
FCB5 With Sonication
3 0 0 0
After Sonication
3 0 0 0
WPB With sonication
3 3 0 0
On the other hand, sonication of cellular suspension
followed by the addition of the isolation solutions proved to be a better procedure for these two species. From the sonication time tested, four minutes gave the best results, as the filament broke and posterior incubation at a 1:2 concentration in buffer, culminated in a high yield of isolated cells.
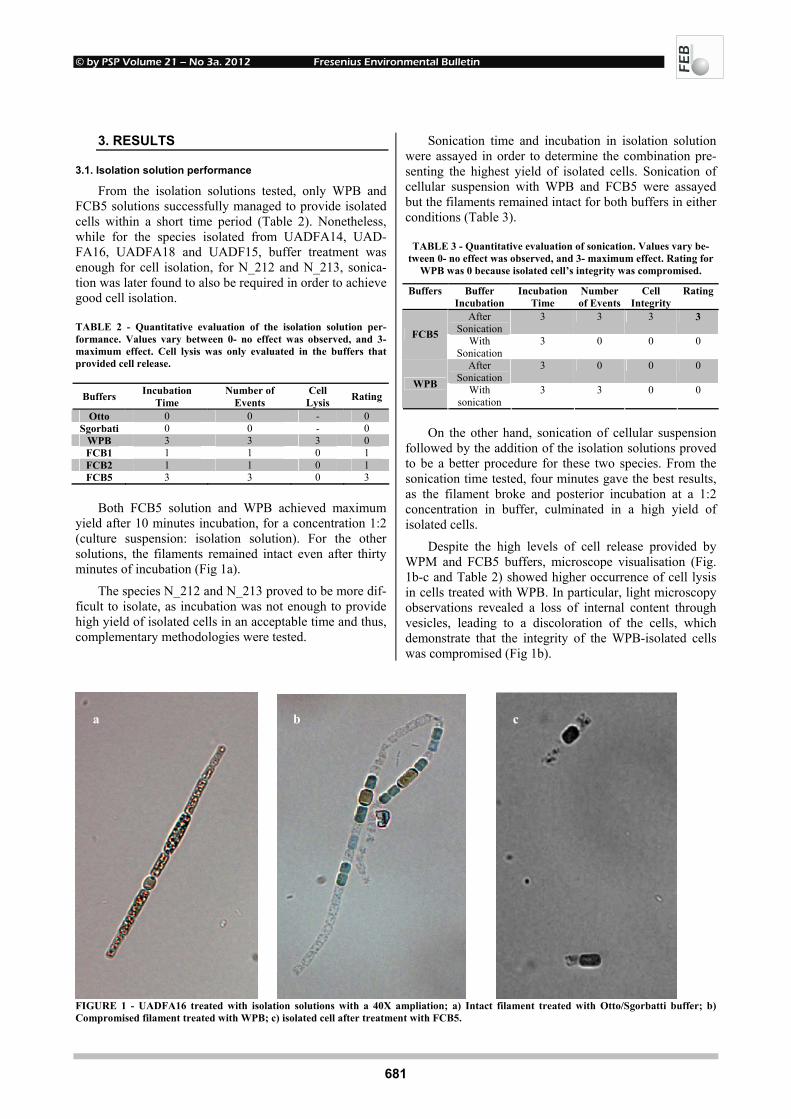
Despite the high levels of cell release provided by WPM and FCB5 buffers, microscope visualisation (Fig. 1b-c and Table 2) showed higher occurrence of cell lysis in cells treated with WPB. In particular, light microscopy observations revealed a loss of internal content through vesicles, leading to a discoloration of the cells, which demonstrate that the integrity of the WPB-isolated cells was compromised (Fig 1b).
FIGURE 1 - UADFA16 treated with isolation solutions with a 40X ampliation; a) Intact filament treated with Otto/Sgorbatti buffer; b) Compromised filament treated with WPB; c) isolated cell after treatment with FCB5.
a b c
© by PSP Volume 21 – No 3a. 2012 Fresenius Environmental Bulletin
682
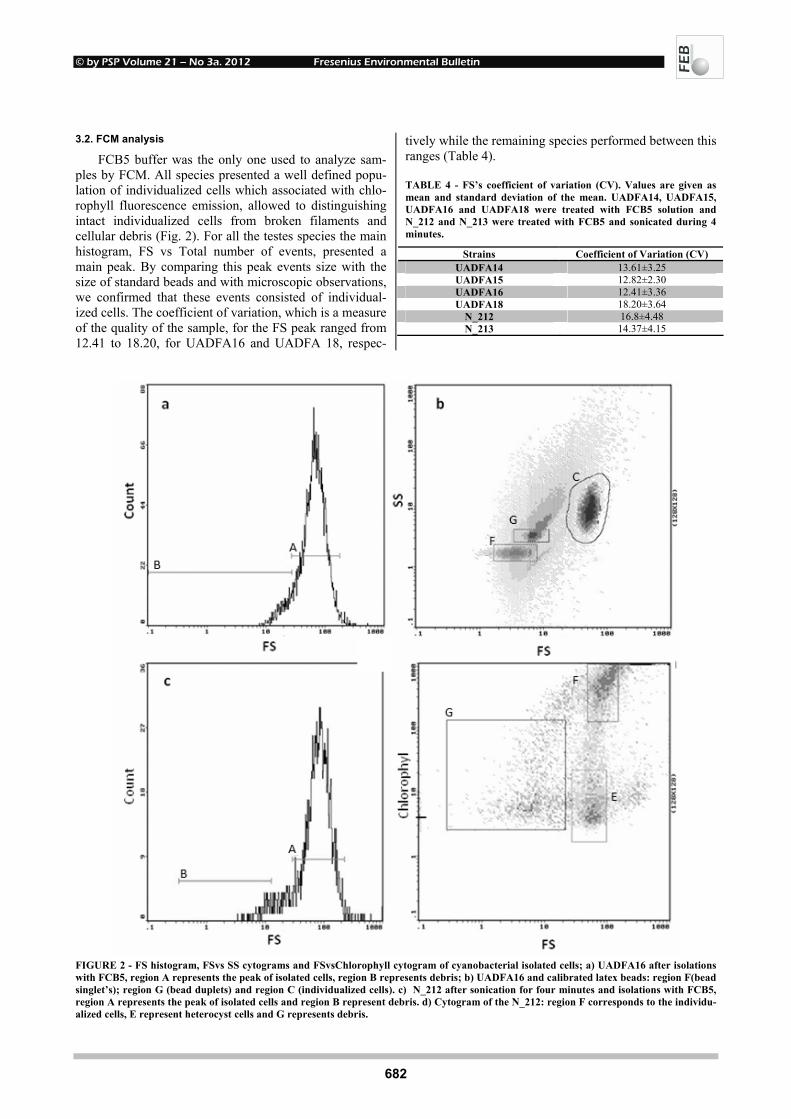
3.2. FCM analysis
FCB5 buffer was the only one used to analyze sam-ples by FCM. All species presented a well defined popu-lation of individualized cells which associated with chlo-rophyll fluorescence emission, allowed to distinguishing intact individualized cells from broken filaments and cellular debris (Fig. 2). For all the testes species the main histogram, FS vs Total number of events, presented a main peak. By comparing this peak events size with the size of standard beads and with microscopic observations, we confirmed that these events consisted of individual-ized cells. The coefficient of variation, which is a measure of the quality of the sample, for the FS peak ranged from 12.41 to 18.20, for UADFA16 and UADFA 18, respec-
tively while the remaining species performed between this ranges (Table 4).
TABLE 4 - FS’s coefficient of variation (CV). Values are given as mean and standard deviation of the mean. UADFA14, UADFA15, UADFA16 and UADFA18 were treated with FCB5 solution and N_212 and N_213 were treated with FCB5 and sonicated during 4 minutes.
Strains Coefficient of Variation (CV) UADFA14 13.61±3.25 UADFA15 12.82±2.30 UADFA16 12.41±3.36 UADFA18 18.20±3.64
N_212 16.8±4.48 N_213 14.37±4.15
FIGURE 2 - FS histogram, FSvs SS cytograms and FSvsChlorophyll cytogram of cyanobacterial isolated cells; a) UADFA16 after isolations with FCB5, region A represents the peak of isolated cells, region B represents debris; b) UADFA16 and calibrated latex beads: region F(bead singlet’s); region G (bead duplets) and region C (individualized cells). c) N_212 after sonication for four minutes and isolations with FCB5, region A represents the peak of isolated cells and region B represent debris. d) Cytogram of the N_212: region F corresponds to the individu-alized cells, E represent heterocyst cells and G represents debris.

© by PSP Volume 21 – No 3a. 2012 Fresenius Environmental Bulletin
683
4. DISCUSSION AND CONCLUSION
The applicability of FCM to study filamentous cyano-bacteria is traditionally hampered by the necessity of isolat-ing cells (and consequently their cytomes) and available FCM data is restricted to unicellular cyanobacteria spe-cies. With those unicellular species there is no need for isolation buffers, as mostly the culture medium is used both for counting, morphological analyses (FS and SS) [e.g. 7, 8] or a fixation in buffer containing e.g. formalde-hyde (Sgorbati buffer) which however are not efficient in releasing cells from filamentous species. To overcome these difficulties, we describe here a simple isolation solu-tion and an easy and robust protocol allowing isolation of cells from six filamentous cyanobacteria species and later analysis by FCM.
These six filamentous species were chosen according to their environmental abundance in temperate ecosys-tems (e.g. abundant in rice fields and shallow lakes) and their different characteristics such as cell form, filaments length and mucilaginous presence. This plankton diversity allowed evaluating if the protocol could be used in a large spectrum of cyanobacteria species with different charac-teristics and requisites.
The six isolation solutions were selected according to their diverse constitution: Otto’s is a highly used and robust buffer in plant sciences, using citric acid to slightly fixate cells, and Tween 20 as a less abrasive detergent counterpart of Triton X-100. WPB was specifically de-signed for FCM analyses of recalcitrant plant [14], and proved to be very versatile and efficient buffer. Sgorbatti’s buffer was chosen as its composition includes formalde-hyde, which might help to preserve cells for a reasonable period of time once isolated. However, as preliminary data showed that from these buffers only WPB produced iso-lated cells, we tested the putative interaction of Triton X-100 (a non-ionic detergent with surfactant activity) with mucilaginous compounds (mostly polysaccharides) that link the filamentous cells. From the cell isolation buffers tested, with UADF species, our results indicate that only WPB and FCB5 solutions (both having Triton as deter-gent) provided individualized cells. As none of the other buffers provided significant results and as their composi-tion differs highly, the most plausible explanation for their inability to isolate cells is the low concentration of detergent present in the other buffers containing Triton X-100 as detergent. In the case of Otto, the poor results observed are likely due to Tween 20, the detergent used in this buffer, being less abrasive than Triton X-100.
Comparing FCB5 and WPB results we demonstrate that FCB5 has a great performance in cell isolation from filamentous cyanobacteria. Moreover, under the micro-scope, the occurrence of cell lysis was not observed in FCB5, contrarily to the abundant lysis of cells exposed to WPB. Complementary analyses of esterases activity using fluorescin diacetate (FDA, data not shown) also supported that WPB compromised cell viability. WPB was therefore
considered less suitable than FCB5 for filamentous cyano-bacteria cell isolation.
For the other species tested, N_212 and N_213, the initial protocol did not work probably due to the larger size of the filaments and stronger mucilage. Therefore, for these two species, sonication was required in order to obtain isolated cells and from the two approaches tested, sonication in buffer or sonication followed by buffer incubation, only the latter provided individualized cells. The approach used to determine the most suitable combi-nation of sonication and buffer incubation showed that any sonication bellow four minutes was unable to isolate cells. Filaments start to disrupt rapidly after four and five minutes of sonication, and as no foreseeable differences were observed between these two different times, we decided to adopt four min as the sonication time to be used in this protocol. Concerning to buffer incubation, we had good results with FCB2 and FCB5 solutions after sonication of cyanobacteria. This demonstrates that, after the filaments are broken, detergent is more efficient in individualizing cells.
With the protocol optimized, samples of each species were prepared and analyzed by FCM in order to evaluate the suitability of the methodology proposed. All species provided well defined populations in what regards volume (FS) and complexity (SS) (Fig. 2) and when compared to calibrated latex beads, presented dimensions in the order of what is expected for isolated cells (Fig 2b).
The fluorescence emitted by chlorophyll molecules was used to distinguish cyanobacterial cells from other particles, by applying a gating of the fluorescence emit-ting population to the FS histogram (fig 2a and 2c). In this histogram, a well defined peak, representing cyanobaterial isolated cells was observed and only a small amount of debris was visible. Also, a small amount of events with high volume and complexity were observed, events which can be either multiplets (individualized cells that pass through the laser point aggregated) or a few broken fila-ments. In what concerns the coefficient of variation of the samples, which evaluates the quality of the samples, it varied between 12.41 and 18.20, values obtained for spe-cies UADF16 and UADF18 respectively. This is the first report of CV values for SS and FS in cyanobacteria cells; despite they are extremely important to ensure the reli-ability of any fluorescence FCM analyses, CVs are rarely identified in literature and the only work providing CV concerns DNA staining of Prochlorococcus species la-beled with SyberGreen [17], with CV values around 8.9%. We are currently testing the protocol presented here for DNA labeling in these filamentous cyanobacteria species, using SyberGreen, propidium iodide and Picogreen, but small amount of DNA allied to high interference of cyanoabacterial pigments fluorescence are nuisances for FCM analysis.
In conclusion, we present here an isolation buffer and a methodology which provides high yield isolation of filamentous cyanobacteria cells, in a simple and low cost
© by PSP Volume 21 – No 3a. 2012 Fresenius Environmental Bulletin
684
approach. Also, it is presented a protocol for the analysis of filamentous cyanoabacteria by FCM and this break-through will open a vast set of possibilities in this area of research and expand the applications of flow cytometry, proving this technique as powerful and reliable tool for cyanobacterial studies.
ACKNOWLEDGEMENTS
We want to thanks to FCT that financed Daniela Fi-gueiredo (SFRH/BD/23864/2005), Eleazar Rodriguez (SFRH/BPD/75696/2011) and Raquel Azevedo (SFRH/BD/75955/2011) with PhD fellowships.
REFERENCES
[1] Hader, D.P., Kumar, H.D., Smith, R.C. and Worrest, R.C. (1998) Effects on aquatic ecosystems. Journal of Photochem-istry and Photobiology B-Biology; 46(1-3):53-68.
[2] de Figueiredo, D., Reboleira, A., Antunes, S., Abrantes, N., Azeiteiro, U., Gonçalves, F. and Pereira, M. (2006) The ef-fect of environmental parameters and cyanobacterial blooms on phytoplankton dynamics of a Portuguese temperate lake. Hydrobiology, 568 (1): 145-157.
[3] Regueiras, A., Saker, M. and Vasconcelos, V. (2009) Use of PCR for the early detection of pathogenic bacteria and cya-nobacteria in water samples from different urban water sources (Porto, Portugal). Fresenius Environmental Bulletin, Vol. 18 No. 12 pp. 2359-2365
[4] Calejo, A., Rodriguez, E., Silva, V., Jorgačevski, J., Steno-vec, M., Kreft, M., Santos, C., Zorec, R. and Gonçalves, P. (2010) Life and death in aluminium-exposed cultures of rat lactotrophs studied by flow cytometry. Cell Biology and Tox-icology, 26(4):341-353.
[5] Doležel, J. and Bartos, J. (2005) Plant DNA flow cytometry and estimation of nuclear genome size. Annals of Botany, 95(1):99-110.
[6] Rodriguez, E., Santos, C., Lucas, E. and Pereira, M.J. (2011) Evaluation of chromium (VI) toxicity to Chlorella vulgaris Beijerinck cultures. Fresenius Environmental Bulletin, 20, 2, 334-339.
[7] Jacquet, S., Partensky, F., Marie, D., Casotti, R. and Vaulot, D. (2001) Cell cycle regulation by light in prochlorococcus species. Appl. Environ. Microbiol., 67(2):782-790.
[8] Binder, B.J. and Chisholm, S.W. (1995) Cell cycle regulation in marine Synechococcus sp. species. Appl. Environ. Micro-biol., 61(2):708-717.
[9] Sakr, S., Thyssen, M., Denis, M., Zhang, C. (2006) Relation-ship of several key cell-cycle events in the developmental cy-anobacterium Anabaena sp. Strain PCC 7120, J. Bacteriol. 188: 5958-5965.
[10] Nichols, H.W. (1973) Handbook of Phycological Methods In: Stein, J.R. (ed.), Cambridge University Press, 16-17.
[11] Otto F. (1992) Preparation and staining of cells for high-resolution DNA analysis. In: Radbruch A, ed.Flow cytometry and cell sorting. Berlin: Springer-Verlag, 101–104.
[12] Doležel, J. and Göhde, W. (1995) Sex determination in dio-ecious plants Melandrium album and M. rubrum using high-resolution flow cytometry. Cytometry, 19(2):103-106.
[13] Sgorbati, S., Levi, M., Sparvoli, E., Trezzi, F. and Lucchini, G. (1986) Cytometry and flow cytometry of 4',6-diamidino-2-phenylindole (DAPI)-stained suspensions of nuclei re-leased from fresh and fixed tissues of plants. Physiologia Plantarum, 68(3):471-476.
[14] Loureiro, J., Rodriguez, E., Dolezel, J. and Santos, C. (2007) Two new nuclear isolation buffers for plant DNA flow cy-tometry: A test with 37 species. Annals of Botany, 100(4):875-888.
[15] Persidsky, M.D. and Baillie, G.S. (1977) Fluorometric test of cell-membrane integrity. Cryobiology, 14:322–331.
[16] Krasnow, M., Matthews, M. and Shackel, K. (2007) Evi-dence for substancial maintenance of membrane integrity and cell viability in normally developing grape (Vitis vinifera L.) berries throughout development. Journal of Experimental Botany, 59(4):849-859.
[17] Marie, D., Guillou, L., Partensky, F. and Vaulot, D. (2000) DNA/RNA analysis of phytoplankton by flow cytometry. In: Current protocols in cytometry. John Wiley & Sons, Inc.11.12.1-18.
Received: May 04, 2011 Revised: June 27, 2011; October 13, 2011 Accepted: November 10, 2011 CORRESPONDING AUTHOR
Conceição Santos CESAM & Department of Biology Laboratory of Biotechnology and Cytomics University of Aveiro 3810 Aveiro PORTUGAL Phone: +351 234 370 766 Email: [email protected]
FEB/ Vol 21/ No 3a/ 2012 – pages 679 – 684
© by PSP Volume 21 – No 3a. 2012 Fresenius Environmental Bulletin
685
THE EFFECT OF ASPIRIN AND ACETALDEHYDE ON EGG FERTILITY AND DEVELOPMENT IN Drosophila melanogaster
Duygu Keser1 and Ayla Karataş2,*
1Kocaeli University, Faculty of Arts and Sciences, Kocaeli, Turkey 2Kocaeli University, Faculty of Education, Kocaeli, Turkey
ABSTRACT
This study investigates both separate and joint (ASA+ AcH) effects of acetylsalicylic acid (ASA), an active ingre-dient of aspirin, and acetaldehyde (AcH), an intermediary metabolite in alcohol metabolism, on some developmental features of Drosophila melanogaster. Substances were applied to Drosophila melanogaster by means of nutrition, adding them to culture media. With the effects of ASA and AcH, egg fertility decreased in the F1 generation, while it increased in the F2 generation. This increase was even more evident in the experimental groups of F2 that were influenced by ASA and AcH together. Egg devel-opment was inhibited in experimental groups exposed to low concentrations of AcH. However, at high ASA+AcH concentrations (ASA + 20 mM AcH, ASA + 30 mM AcH), egg development was close to or higher than that of the control group. The number of larvae in the culture me-dium containing AcH and ASA decreased in the F1 gen-eration, while it increased in the F2 generation. This in-crease was more evident with the combination of ASA and AcH. It can be concluded that the combination of ASA and AcH resulted in the development of resistance to those substances.
KEYWORDS: Drosophila melanogaster, fecundity, fertility, aspi-rin, acetylsalicylic acid, acetaldehyde.
1. INTRODUCTION
Acetylsalicylic acid [ASA; 2-(acetyloxy) benzoic acid], which is the active compound of Aspirin® and an ingredient in several other pharmaceuticals, is an over-the-counter analgesic consumed in large quantities throughout the world [1, 2]. There is a great deal of information indi-cating the positive side effects of aspirin in addition to its painkilling effect. For instance, aspirin was determined to inhibit somatic mutation and recombination on mytomycin * Corresponding author
C-induced mutagenesis in Drosophila melanogaster [3] and to reduce the chromosome deviations in bone marrow cells and blood micronucleus tests in mice [4].
Long-term use of aspirin has been reported to exert a protective effect against malignity in many human tissues [5]. In addition, it was reported to prevent cancer devel-opment stimulated by chemicals in various animal models [6] and to reduce the size and number of radiation-in-duced tumors in rodents [7]. It was also observed to in-hibit DNA injuries caused by H2O2 [1]. However, besides these positive effects, aspirin was determined in endoscopic studies to cause damage to the gastric mucosa [8, 9] and have side effects including the inhibition of thrombocyte aggregation and toxicity in the kidney [10]. Sodium sali-cylate, a sodium salt of salicylic acid, was determined to decrease the rate of hatching in chicken embryos [11]. The main metabolites of aspirin, salicylic acid and gentisic acid, caused regression in the development and propagation of Daphnia magna and Daphnia longispina [12].
Acetaldehyde is the main metabolite of alcohol me-tabolism and demonstrates toxic effects in the liver. It has a wide application area, although humans are directly in con-tact with it particularly due to its use in tanning products, cosmetic production, synthetic sweetening, and protection of fish and fruit products [13]. Furthermore, low amounts of acetaldehyde were identified in oven-baked coffee, all alcoholic beverages like beer and wine, plant sap, and essential fats. It is also an intermediary metabolite formed by ethanol and sugar metabolism and is present in blood in trace quantities [14]. Acetaldehyde is metabolically quite reactive and toxic; it also binds with proteins and macro-molecules [15]. It was determined to cause sister chromatid exchanges, chromosome deviations, and cross-linking in culture cells of mammals [16]. It is reported to suppress the coenzyme A (CoA-SH) activity in the brain and liver, to be 10-30 times more toxic than ethanol [1], and to possibly result in cancer in humans [17, 18]. As a result of in vitro AcH application, embryonic anomalies were de-tected in ten-day-old rat embryos [19, 20]. In addition, acetaldehyde was observed to bind with DNA in the granulocytes and lymphocytes of people consuming large quantities of alcohol [21].

© by PSP Volume 21 – No 3a. 2012 Fresenius Environmental Bulletin
686
One can often encounter acetylsalicylic acid in every-day life as a painkiller, and acetaldehyde as an intermedi-ary metabolite of alcohol metabolism. In this regard, the effects of ASA and AcH on the fecundity and egg devel-opment of Drosophila melanogaster were investigated in this study. Due to the positive side effects of aspirin, its influence on the toxicity of acetaldehyde was also investi-gated. ASA and AcH were therefore applied together in some experimental groups. The genetic properties and re-production of Drosophila melanogaster are fully known and the species has nearly all of the metabolic activation enzymes present in mammals. It is further known that any material effective on Drosophila DNA can create a simi-lar effect on mammal and human DNA [22, 23]. There-fore, determining the effects of synthetic materials on the developmental features of Drosophila and following those effects in subsequent generations will aid the understand-ing of the material or compound’s effects on humans.
2. MATERIALS AND METHODS
Acetylsalicylic acid (CAS no. 50-78-2) was obtained from Sigma and acetaldehyde (CAS No. 75-07-0) was ob-tained from Merck. Acetylsalicylic acid was used in ex-periments in crystal form, while acetaldehyde was used after being dissolved in pure water.
Oregon-R, a rather inbred and wild-type strain of D. melanogaster (Diptera: Drosophilidae), was used in the analysis. This strain has round, red eyes and contains no mutant genes. Cultures used in the experiments were kept in cooled incubators at 25 ± 1 °C, in a dark environment, and 60% in humidity level. As the culture medium, 50 mL of standard Drosophila medium (SDM), containing corn flour, sugar, brewer’s yeast, agar, water, and propionic acid, was used [24, 25, 26]. The effects of ASA and AcH were observed in 2 generations, F1 and F2. Only SDM was used in the control group and the F2 generation.
To observe egg fertility, 50 female individuals were put on culture media for experimental and control groups. They were kept in the substance-added cultures for 5 days to expose them to ASA and AcH. Subsequently, 10 ran-domly selected female individuals were transferred to petri dishes containing standard cultures. After incubation for 24 h, the individuals were removed and eggs were counted with a dissection microscope.
In order to observe the egg fertility of the F2 genera-tion, F2 was obtained from the female individuals of the F1 generation that had been exposed to ASA and AcH. The F2 generation was not directly exposed to ASA or AcH, as the goal was to see whether the effects of these substances as absorbed by the F1 generation continued into the next generation. Individuals of the F2 generation com-pleted their development in cultures containing only SDM. The other processes were the same as those for the F1 generation.
In the second part of the study, the development of eggs left in the culture media was observed. After the eggs were counted in the first part of the study, the petri dishes were left in an incubator for 5 days so that the eggs could complete their development. On the sixth day, the cultures were diluted, and larvae were counted and re-moved from the culture with the assistance of a brush over a black backdrop. The number of laid eggs and the number of removed third instar larvae were compared. The same processes were repeated for the F2 generation. As in the examination of egg fertility, individuals of the F2 generation were permitted to lay eggs without exposure to ASA or AcH during egg development [24, 27-29].
For statistical evaluation of data, a Z-test was applied, comparing the difference between 2 mean rates. Minitab for Windows (v. 13.0) statistical software was used in the calculations. All of the experimental groups were com-pared both with the control group and among themselves. Experimental groups were labeled as follows: G1: Con-trol, G2: 10 mM AcH, G3: 20 mM AcH, G4: 30 mM AcH, G5: ASA, G6: ASA + 10 mM AcH, G7: ASA + 20 mM AcH, G8: ASA + 30 mM AcH.
p1, p2, q1, and q2: rates between the compared groups n: sample number in compared groups 3. RESULTS
Lethal concentrations of the selected chemicals were first determined. The crystal form of ASA was added to culture media in different quantities so as to find the lethal concentration; 50 male and 50 female adult individuals were put on each medium and, 24 h later, the numbers of dead and living individuals were determined and the sur-vival percentage was calculated accordingly. The LD50 value was found to be 500-600 mg for ASA (Figure 1). A lower amount, 300 mg, was used in the experiments. The same method was repeated to determine the lethal concen-tration of acetaldehyde. With this purpose ten different concentrations of AcH within 10- 17730 mM range were repeated three times. However, no mortality was observed, not even at higher concentrations. For this reason, informa-tion in the literature was taken into consideration for the LC50 value of acetaldehyde [30] and 10, 20, and 30 mM concentrations of AcH were used in the present study.
Statistical results, including the number of eggs laid by female individuals treated with ASA and AcH in the F1 generation and number of eggs laid by individuals of the F2 generation, and a comparison of these numbers, are given in Tables 1 and 2. Egg fertility decreased in all experimental groups of the F1 generation (P<0.001). Egg fertility was quite lower in the experimental groups that received only ASA (G5) or a combination of ASA and
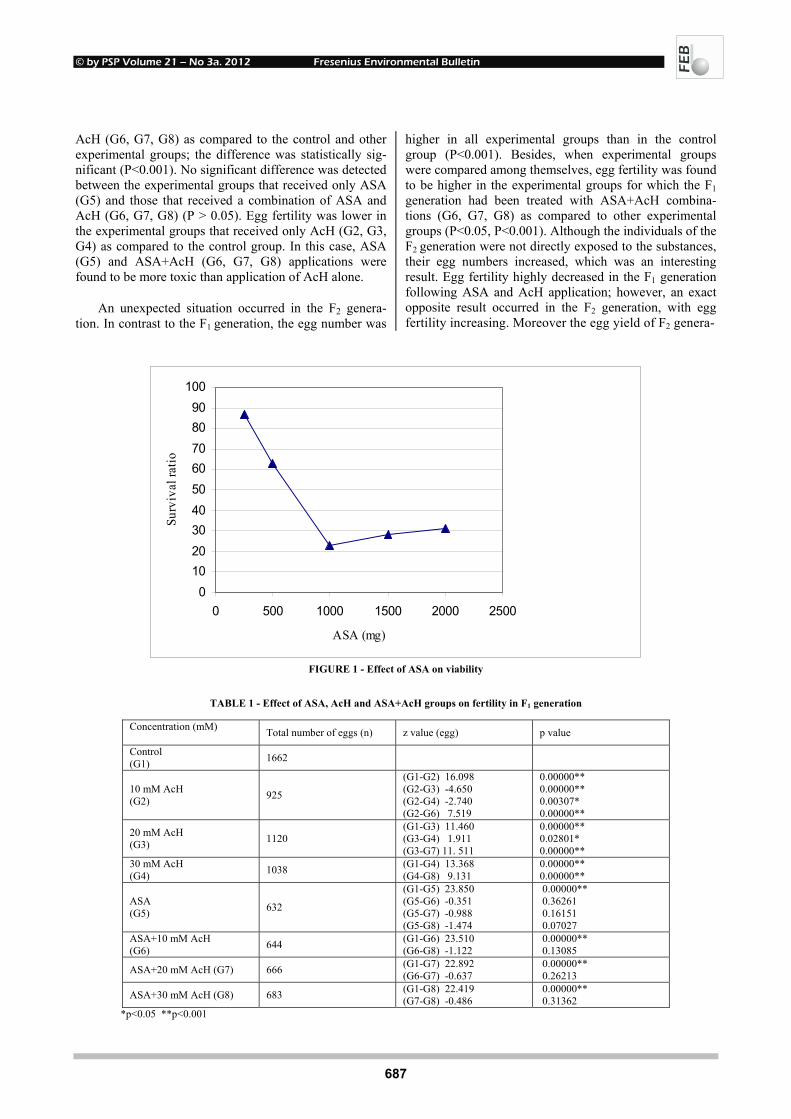
© by PSP Volume 21 – No 3a. 2012 Fresenius Environmental Bulletin
687
AcH (G6, G7, G8) as compared to the control and other experimental groups; the difference was statistically sig-nificant (P<0.001). No significant difference was detected between the experimental groups that received only ASA (G5) and those that received a combination of ASA and AcH (G6, G7, G8) (P > 0.05). Egg fertility was lower in the experimental groups that received only AcH (G2, G3, G4) as compared to the control group. In this case, ASA (G5) and ASA+AcH (G6, G7, G8) applications were found to be more toxic than application of AcH alone.
An unexpected situation occurred in the F2 genera-tion. In contrast to the F1 generation, the egg number was
higher in all experimental groups than in the control group (P<0.001). Besides, when experimental groups were compared among themselves, egg fertility was found to be higher in the experimental groups for which the F1 generation had been treated with ASA+AcH combina-tions (G6, G7, G8) as compared to other experimental groups (P<0.05, P<0.001). Although the individuals of the F2 generation were not directly exposed to the substances, their egg numbers increased, which was an interesting result. Egg fertility highly decreased in the F1 generation following ASA and AcH application; however, an exact opposite result occurred in the F2 generation, with egg fertility increasing. Moreover the egg yield of F2 genera-
0102030405060708090
100
0 500 1000 1500 2000 2500
ASA (mg)
Surv
ival
ratio
FIGURE 1 - Effect of ASA on viability
TABLE 1 - Effect of ASA, AcH and ASA+AcH groups on fertility in F1 generation
Concentration (mM) Total number of eggs (n) z value (egg) p value
Control (G1) 1662
10 mM AcH (G2) 925
(G1-G2) 16.098 (G2-G3) -4.650 (G2-G4) -2.740 (G2-G6) 7.519
0.00000** 0.00000** 0.00307* 0.00000**
20 mM AcH (G3) 1120
(G1-G3) 11.460 (G3-G4) 1.911 (G3-G7) 11. 511
0.00000** 0.02801* 0.00000**
30 mM AcH (G4) 1038 (G1-G4) 13.368
(G4-G8) 9.131 0.00000** 0.00000**
ASA (G5) 632
(G1-G5) 23.850 (G5-G6) -0.351 (G5-G7) -0.988 (G5-G8) -1.474
0.00000** 0.36261 0.16151 0.07027
ASA+10 mM AcH (G6) 644 (G1-G6) 23.510
(G6-G8) -1.122 0.00000** 0.13085
ASA+20 mM AcH (G7) 666 (G1-G7) 22.892 (G6-G7) -0.637
0.00000** 0.26213
ASA+30 mM AcH (G8) 683 (G1-G8) 22.419 (G7-G8) -0.486
0.00000** 0.31362
*p<0.05 **p<0.001
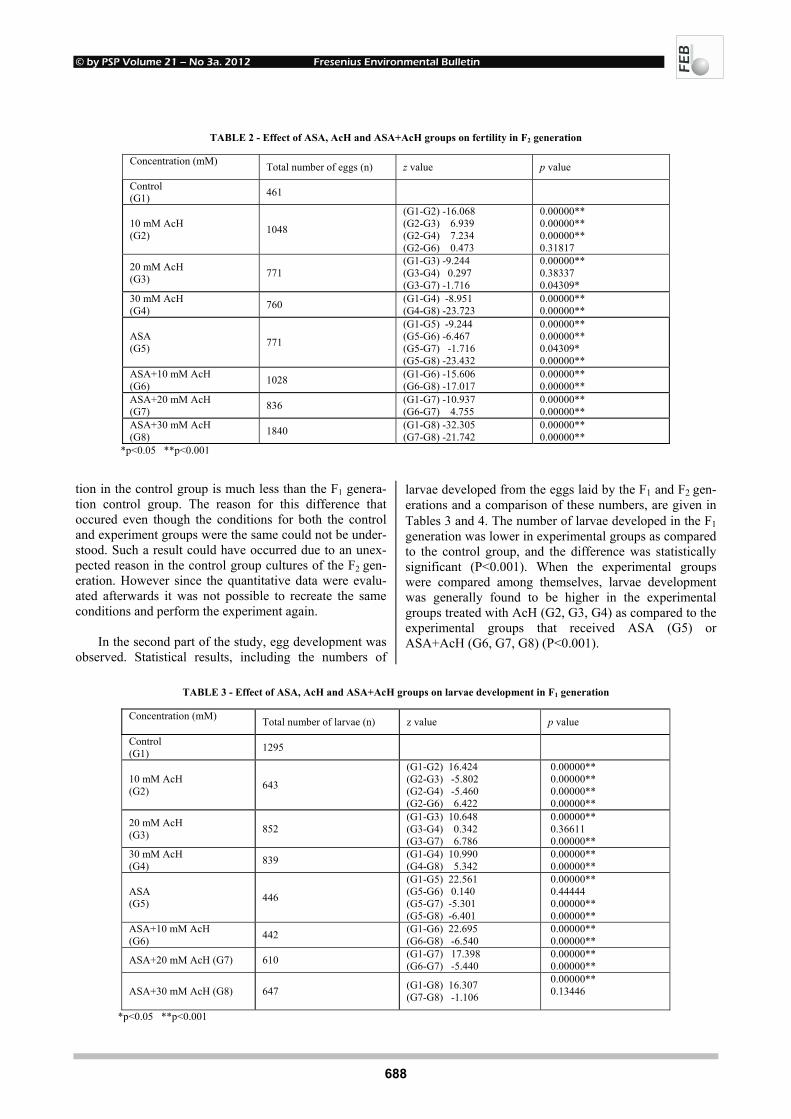
© by PSP Volume 21 – No 3a. 2012 Fresenius Environmental Bulletin
688
TABLE 2 - Effect of ASA, AcH and ASA+AcH groups on fertility in F2 generation
Concentration (mM) Total number of eggs (n) z value p value
Control (G1) 461
10 mM AcH (G2) 1048
(G1-G2) -16.068 (G2-G3) 6.939 (G2-G4) 7.234 (G2-G6) 0.473
0.00000** 0.00000** 0.00000** 0.31817
20 mM AcH (G3) 771
(G1-G3) -9.244 (G3-G4) 0.297 (G3-G7) -1.716
0.00000** 0.38337 0.04309*
30 mM AcH (G4) 760 (G1-G4) -8.951
(G4-G8) -23.723 0.00000** 0.00000**
ASA (G5) 771
(G1-G5) -9.244 (G5-G6) -6.467 (G5-G7) -1.716 (G5-G8) -23.432
0.00000** 0.00000** 0.04309* 0.00000**
ASA+10 mM AcH (G6) 1028 (G1-G6) -15.606
(G6-G8) -17.017 0.00000** 0.00000**
ASA+20 mM AcH (G7) 836 (G1-G7) -10.937
(G6-G7) 4.755 0.00000** 0.00000**
ASA+30 mM AcH (G8) 1840 (G1-G8) -32.305
(G7-G8) -21.742 0.00000** 0.00000**
*p<0.05 **p<0.001 tion in the control group is much less than the F1 genera-tion control group. The reason for this difference that occured even though the conditions for both the control and experiment groups were the same could not be under-stood. Such a result could have occurred due to an unex-pected reason in the control group cultures of the F2 gen-eration. However since the quantitative data were evalu-ated afterwards it was not possible to recreate the same conditions and perform the experiment again.
In the second part of the study, egg development was observed. Statistical results, including the numbers of
larvae developed from the eggs laid by the F1 and F2 gen-erations and a comparison of these numbers, are given in Tables 3 and 4. The number of larvae developed in the F1 generation was lower in experimental groups as compared to the control group, and the difference was statistically significant (P<0.001). When the experimental groups were compared among themselves, larvae development was generally found to be higher in the experimental groups treated with AcH (G2, G3, G4) as compared to the experimental groups that received ASA (G5) or ASA+AcH (G6, G7, G8) (P<0.001).
TABLE 3 - Effect of ASA, AcH and ASA+AcH groups on larvae development in F1 generation
Concentration (mM) Total number of larvae (n) z value p value
Control (G1) 1295
10 mM AcH (G2) 643
(G1-G2) 16.424 (G2-G3) -5.802 (G2-G4) -5.460 (G2-G6) 6.422
0.00000** 0.00000** 0.00000** 0.00000**
20 mM AcH (G3) 852
(G1-G3) 10.648 (G3-G4) 0.342 (G3-G7) 6.786
0.00000** 0.36611 0.00000**
30 mM AcH (G4) 839 (G1-G4) 10.990
(G4-G8) 5.342 0.00000** 0.00000**
ASA (G5) 446
(G1-G5) 22.561 (G5-G6) 0.140 (G5-G7) -5.301 (G5-G8) -6.401
0.00000** 0.44444 0.00000** 0.00000**
ASA+10 mM AcH (G6) 442 (G1-G6) 22.695
(G6-G8) -6.540 0.00000** 0.00000**
ASA+20 mM AcH (G7) 610 (G1-G7) 17.398 (G6-G7) -5.440
0.00000** 0.00000**
ASA+30 mM AcH (G8) 647 (G1-G8) 16.307 (G7-G8) -1.106
0.00000** 0.13446
*p<0.05 **p<0.001
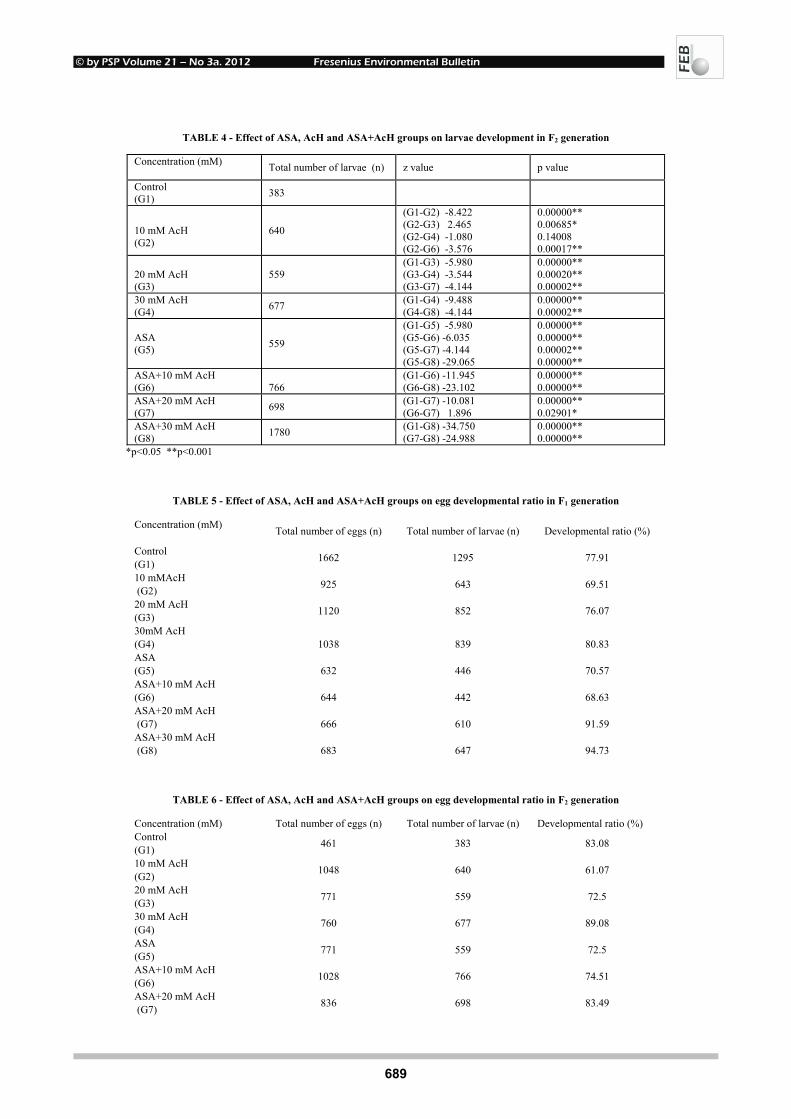
© by PSP Volume 21 – No 3a. 2012 Fresenius Environmental Bulletin
689
TABLE 4 - Effect of ASA, AcH and ASA+AcH groups on larvae development in F2 generation
Concentration (mM) Total number of larvae (n) z value p value
Control (G1) 383
10 mM AcH (G2)
640
(G1-G2) -8.422 (G2-G3) 2.465 (G2-G4) -1.080 (G2-G6) -3.576
0.00000** 0.00685* 0.14008 0.00017**
20 mM AcH (G3)
559 (G1-G3) -5.980 (G3-G4) -3.544 (G3-G7) -4.144
0.00000** 0.00020** 0.00002**
30 mM AcH (G4) 677 (G1-G4) -9.488
(G4-G8) -4.144 0.00000** 0.00002**
ASA (G5) 559
(G1-G5) -5.980 (G5-G6) -6.035 (G5-G7) -4.144 (G5-G8) -29.065
0.00000** 0.00000** 0.00002** 0.00000**
ASA+10 mM AcH (G6)
766
(G1-G6) -11.945 (G6-G8) -23.102
0.00000** 0.00000**
ASA+20 mM AcH (G7) 698 (G1-G7) -10.081
(G6-G7) 1.896 0.00000** 0.02901*
ASA+30 mM AcH (G8) 1780 (G1-G8) -34.750
(G7-G8) -24.988 0.00000** 0.00000**
*p<0.05 **p<0.001
TABLE 5 - Effect of ASA, AcH and ASA+AcH groups on egg developmental ratio in F1 generation
Concentration (mM) Total number of eggs (n) Total number of larvae (n) Developmental ratio (%)
Control (G1) 1662 1295 77.91
10 mMAcH (G2) 925 643 69.51
20 mM AcH (G3) 1120 852 76.07
30mM AcH (G4)
1038
839
80.83
ASA (G5)
632
446
70.57
ASA+10 mM AcH (G6)
644
442
68.63
ASA+20 mM AcH (G7)
666
610
91.59
ASA+30 mM AcH (G8)
683
647
94.73
TABLE 6 - Effect of ASA, AcH and ASA+AcH groups on egg developmental ratio in F2 generation
Concentration (mM) Total number of eggs (n) Total number of larvae (n) Developmental ratio (%) Control (G1) 461 383 83.08
10 mM AcH (G2) 1048 640 61.07
20 mM AcH (G3) 771 559 72.5
30 mM AcH (G4) 760 677 89.08
ASA (G5) 771 559 72.5
ASA+10 mM AcH (G6) 1028 766 74.51
ASA+20 mM AcH (G7) 836 698 83.49

© by PSP Volume 21 – No 3a. 2012 Fresenius Environmental Bulletin
690
ASA+30 mM AcH (G8) 1840 1780 96.74
For the higher concentrations of ASA and AcH com-binations, the number of larvae was found to be higher compared to the experimental group treated with only ASA (P<0.001). In addition, the development percentage was evidently higher for higher concentrations of ASA+ AcH combinations as compared to other experimental and control groups (Table 5 and 6). The larval growth rate in F1 generation was 77.91 % where it was 91.59 % and 94.3 % upon combined ASA and AcH application at high concen-trations (ASA +20 mM Ach, ASA + 30 mM AcH) (Table 5). In the F2 generation (Table 6), the development percent-age was the highest in the experimental groups (G8) treated with concentrations of ASA and ASA+AcH combinations (96.74 %), as compared to the control group (83.08 %). This result for the F2 generation demonstrated that the development rate increased with higher concentrations of ASA+AcH combinations. The common result observed in both parts of the study is the similar findings for the F2 generation, which support each other. It is quite interest-ing that a positive effect was observed in both egg fertility and egg development, though the individuals of the F2 generation had not been directly exposed to the sub-stances.
4. DISCUSSION
Findings concerning the effects of ASA and AcH on egg fertility of D. melanogaster are given in Tables 1 and 2 (Table 1: F1 generation, Table 2: F2 generation). Egg numbers were lower in all experimental groups of the F1 generation than in the control group (P < 0.001). This de-crease was especially quite evident in those experimental groups (G5, G6, G7, G8) treated with only ASA or ASA+AcH combinations (Figure 2). Egg number of ASA and ASA+AcH groups were lower than that of control and AcH groups.
There are studies in the literature supporting the find-
ing that ASA and AcH treatments decrease egg fertility in the F1 generation. Effects of O-hydroxyhippuric acid, one of the main metabolites of aspirin, were evaluated for Daphnia, with egg losses and abnormalities in juveniles observed in chronic application. On the other hand, sali-cylic acid and gentisic acid decreased the number of indi-viduals and the daily development rate [12]. In some studies on rats, acetaldehyde was observed to cause fetal resorption, malformations, and growth failure [31], as well as embryolethal effects, developmental abnormali-ties, and chromosomal deviations in cells [32]. In another
Cont
rol
10 m
M A
cH
20 m
M A
cH
30 m
M A
cH
ASA
ASA+
10 m
M A
cH
ASA+
20 m
M A
cH
ASA+
30 m
M A
cH
F1F2
0
200
400
600
800
1000
1200
1400
1600
1800
2000
Egg
num
ber
Groups
F1F2
FIGURE 2 - Egg number of F1 and F2 generation.
© by PSP Volume 21 – No 3a. 2012 Fresenius Environmental Bulletin
691
study, AcH was injected into D. melanogaster, and, sub-sequently, gender-related lethal mutations were observed in the meiotic and postmeiotic germ cells of Canton-S males [30]. The present study also investigates whether ASA has a positive side effect in reducing toxicity. For this purpose, ASA and AcH were applied to cultures at the same time. However, contrary to the expectation, ASA did not reduce the toxic effects of AcH. In a study supporting this finding, ethanol and ASA were applied to male Spra-gue-Dawley rats; toxic effects were consequently ob-served in spermatozoa and fertility decreased. Moreover, ASA was not found to be effective on this kind of ethanol damage [33]. A study investigated the effects of alcohol, aspirin and cigarettes on plasma testosterone levels and seminal parameters. There was a significant decrease in sperm motility among students who used moderate amounts of aspirin (i.e.,> or = 500 mg/wk) [34]. In another study, aspirin had an inhibitory effect on cellular respiration and caused the release of most of the mitochondrial cyto-chrome c and a dramatic drop in the mitochondrial mem-brane potential on Saccharomyces cerevisiae [35]. When the results from the two studies are evaluated together it could be inferred that the reason for the decrease in egg yield could be a decrease in fertilization upon ASA appli-cation because it is possible that aspirin decreases mito-chondrial membrane potential and decreases sperm motil-ity due to inhibition of cellular respiration. The movement of sperm flagellum is possible through ATP production in the flagellar mitochondria. So the decrease in the egg yield could be due to inhibition of cellular respiration in the flagellar mitochondria of the sperm, decreased sperm motility and decreased fertilization.
Egg number was higher in all experimental groups of the F2 generation as compared to the control group, and the difference was statistically significant (P<0.001). The increase in egg number was especially evident at high con-centrations (G6, G7, G8) of ASA+AcH (Figure 2). Previ-ous studies have reported that Drosophila egg numbers increase in response to stress and toxicity [36]. The repro-duction potential of the insects was affected by a series of behavioral and physiological reactions from the coordina-tive function of the nervous and endocrine systems. It was difficult to find any evidence of a molecular reason for the positive effects of foreign substances on reproduction po-tential. However, stimulation of the neuroendocrine system was suggested to possibly cause oversecretion of the juve-nile hormone (JH) ecdysone, which might be the reason for the increase in the number of eggs [37, 29]. A balance between the levels of JH and 20-hydroxy ecdysone (20HE), brought about by the neurotransmitter dopamine, is vital for oogenesis. JH also plays a key role in regulat-ing egg-laying behavior under adverse conditions such as starvation and heat stress [38, 39]. It was also claimed that Drosophila melanogaster can itself regulate its number of eggs on the condition that it feeds on different nutrients. This regulation of egg number is suggested to occur in order to ensure insect generation [39]. For this reason, when ASA and AcH are applied at the same time, they
could increase the egg fertility by stimulating the neuro-endocrine system. In another study, the exposure of fertile Drosophila females to methoprene resulted in an increase in female reproduction and increased susceptibility to oxi-dative stress and starvation [36]. It could be thought that the toxic effect triggered stress, and thus the female indi-viduals increased the number of eggs laid to overcome the stress. When the individuals that can tolerate the toxic effect are considered to have developed resistance, it can be said that resistance is developed against ASA and ASA+ AcH. Due to the resistance mechanism of insects against pesticides, more resistant individuals are known to de-velop [41]. In this regard, it could be claimed that resis-tance was developed in the F2 generation due to the effects of the substances, and, as a result, the new individuals appeared more resistant than those of the laboratory line.
In the second part of the study, the numbers of larvae developed from eggs in the F1 and F2 generations (Tables 3 and 4) were compared and the larvae development rates were calculated. The number of larvae developed in all F1 experimental groups was lower than that of the control group (Figure 3). However, the development rate percent-age was higher with high concentrations of ASA+AcH (G7, G8) as compared to the control group (Figure 4). The combination of ASA and AcH had a positive effect on development, or larvae development increased due to high resistance.
The number of larvae was quite higher in all experi-mental groups of the F2 generation, contrary to the find-ings for the F1 generation, and the difference was statisti-cally significant. However, the F2 larvae development rate was similar to that of the F1 generation. Namely, 30 mM AcH (G4) applications and the higher concentrations of ASA+AcH (G7, G8) increased the development rate (Ta-ble 4). Similar findings were obtained in the F1 and F2 generations in terms of development rate. Based on these results, it could be argued that ASA and AcH affected the development of the two generations in the same way, stimulating at higher concentrations and inhibiting at lower concentrations. This could be explained by resistance de-velopment. Individuals of the F1 generation that were ex-posed to higher concentrations and thus overcame the stress were strong individuals in terms of developmental charac-teristics, and, therefore, the development rate increased at higher concentrations. In fact, egg fertility of natural populations of Drosophila was reported to increase in parallel with malathion resistance [42].
AcH had less toxic effects on egg fertility and egg development than expected. On the other hand, AcH injections were observed to increase postnatal mortality in rats [17]. Another study investigated the effect of acetal-dehyde on tree different hen species and reported terato-genic effects on longevity and growth [43]. Drosophila tends to feed on fruits including as much ethanol as beer and vinegar; therefore, the genus is accepted as an impor-tant source of information on ethanol resistance. In fact, a positive relation was determined between ethanol resis-

© by PSP Volume 21 – No 3a. 2012 Fresenius Environmental Bulletin
692
Cont
rol
10 m
M A
cH20
mM
AcH
30 m
M A
cH
ASA
ASA+
10 m
M A
cHAS
A+20
mM
AcH
ASA+
30 m
M A
cH
F1F2
0
200
400
600
800
1000
1200
1400
1600
1800
Larv
ae n
umbe
r
Groups
F1F2
FIGURE 3 - Larvae number of F1 and F2 generation
Cont
rol
10 m
M A
cH20
mM
AcH
30 m
M A
cH
ASA
ASA
+10
mM
AcH
ASA
+20
mM
AcH
ASA
+30
mM
AcH
F1F2
0
10
20
30
40
50
60
70
80
90
100
Dev
elop
men
t rat
io
Groups
F1
F2
FIGURE 4 - Development ratio of F1 and F2 generation

© by PSP Volume 21 – No 3a. 2012 Fresenius Environmental Bulletin
693
tance and tolerance of D. melanogaster specimens col-lected on different continents [44]. For this reason, acetal-dehyde could not demonstrate a highly toxic effect in Drosophila.
Based on the study results, it could be stated that ASA+AcH increased egg fertility and egg development, and thus developed resistance in D. melanogaster. CNS structures of neurons were reported to show resistance to AcH in a study on rats [45], and in chronic ethanol appli-cation, E. coli showed resistance to ethanol [46]. In some other studies, high concentrations of formaldehyde were reported to develop resistance in bacteria [47]. Aspirin, frequently used in human treatments, was reported to develop resistance at a rate of 10%-40% [48, 49]. In an-other study, resistance development was observed as a result of ASA application in rat megakaryocytes [50]. Escherichia coli was reported to develop resistance to certain antibiotics due to the effects of salicylates [51]. One study identified salicylic acid and its derivatives as potentially stimulating resistance in plants [52]. These results support the present finding that high concentra-tions of ASA and AcH develop resistance in D. melanogaster. The toxic effects of the applied substances are similar in both developmental stages. It is not possible to claim that either egg stage or larval stage is more sensi-tive compared to the other. Furthermore the possibility of ASA+AcH acting as a pesticide at very low concentra-tions should be investigated.
People frequently encounter both acetylsalicylic acid (ASA) as a painkiller and acetaldehyde (AcH) as an in-termediary metabolite in alcohol metabolism in everyday life. In the present study, these substances were deter-mined to increase egg fertility in D. melanogaster, and though they decreased the number of larvae in the F1 and F2 generations, their high concentrations increased egg development. In this regard, these substances are thought to negatively affect embryogenesis. However, despite this negative effect, both substances increased egg fertility and egg development through the development of resistance. It would be useful to investigate the effects of these sub-stances on increased resistance development or fertility in other organisms.
ACKNOWLEDGEMENT
We would like to thank Prof. Dr. Ensar Başpınar who performed the statistical evaluations.
REFERENCES
[1] Hsu, S. and Li, Y. (2002) Aspirin potently inhibits oxidative DNA strand breaks: implications for cancer chemoprevention. Biochemical and Biophysical Research Communications 293, 705 - 709.
[2] Marques, C.R, Abrantes, N. and, Goncalves, F. (2004) Life-history traits of standard and autochthonous cladocerans: II. Acute and chronic effects of acetylsalicylic acid metabolites. En-viron. Toxicol. 19 (5), 527 - 40.
[3] Sato, T., Nagaoka, K. and Nagase, H., Niikawa, M. and Kito, H. (1996) The effect of several antipyretic analgesics on mitomycin C-induced mutagenesis using the wing spot test in Drosophila melanogaster. Jpn. J. Toxicol. Environ. Health. 42, 136 - 141.
[4] Niikawa, M., Nakamura, T. and Nagase, H. (2001). Suppressive effect of aspirin on chromosome aberration induced by mitomy-cin C in mice. Biol. Pharm. Bull. 24, 964 - 966.
[5] Baron, J.A, Sandler, R.S. (2000) Nonsteroidal anti-inflammatory drugs and cancer prevention. Annu. Rev. Med. 51, 511- 523.
[6] Barnes, C.J., Lee, M. (1999) Determination of an optimal dosing regimen for aspirin chemoprevention of 1,2-dimethylhydrazine-induced colon tumors in rats. Br. J. Cancer. 79, 1646 - 1650.
[7] Niikawa, M., Nagase, H., (2007) Effect of aspirin on DNA dam-age induced by MMC in Drosophila. Biomedicine & Pharmaco-therapy. 61, 250-253.
[8] Kawai, T., Yamagishi, G.S. (2009) Circardian variations of gas-trointestinal mucosal damage detected with transnasal endoscopy in apparently healthy subjects treated with low-dose aspirin (ASA) for a short period. Journal of Atheroclerosis and Throm-bosis. 16, 155 - 163.
[9] Yeomans, N.D., Hawkey, C.J., Brailsford, W., and Naesdal, J. (2009) Gastroduodenal toxicity of low-dose acetylsalicylic acid: a comparison with non-steroidal anti-inflammatory drugs, Curr. Med. Res. Opin. 25 (11), 2785 - 93.
[10] Botting, R.M. (2010) Vane’s discovery of the mechanism of ac-tion of aspirin changed our understanding of its clinical pharma-cology. Pharmalogical Reports. 62, 518 - 525.
[11] Castelli, M. C., Venturini, L. S., and Sparber, B. (2001) Cocaine and salicylate: documentation of hydroxyl radical formation in hearts and brains of 18-day-old chick embryos and unexpected interactive toxicity. Psychopharmacology. 156, 23 - 31.
[12] Marques, C.R, Abrantes, N. and, Goncalves, F. (2004) Life-history traits of standard and autochthonous cladocerans: II. Acute and chronic effects of acetylsalicylic acid metabolites. En-viron. Toxicol. 19 (5), 527 - 40.
[13] ACGIH (1991) American Conference of Govermental Industrial Hygienists Documentation of the Threshold Limit Values and Biological Exposure Indices. 6th Ed. Cincinnati OH, 1, 1- 5.
[14] Jira, R., Laib, R.J., and Bolt, H.M. (1985) Acetaldehyde. In: Gerhartz, W. & Yamamoto, Y.S., eds, Ullmann’s Encyclopedia of Industrial Chemistry 5th rev. Ed. Deerfield Beach FL. VCH Publishers A1, 31 - 44.
[15] You, M. and Crabb, D.W. (2004) Recent advances in alcholic liver disease II. Molecular mechanisms of alcholic fatty liver, Am. J. Physiol. Gastrointest. Liver Physiol. 287 (1), 1 – 6.
[16] Obe, G. and Ristow, H. (1979) Mutagenic, carcinogenic and tera-togenic effects of alchol. Mutat. Res. 65 (4), 229 - 59.
[17] IARC (1985) Allyl Compounds, Aldehydes, Epoxides, and Per-oxides. IARC Monographs on the Evaluation of Carcinogenic Risk of Chemicals to Humans Lyon France. International Agency for Research on Cancer. Volume 36.
[18] IARC (1999) Re-evaluation of Some Organic Chemicals, Hydra-zine, and Hydrogen Peroxide. International Agency for Research on Cancer. Volume 71.
[19] Giavini, E., Broccia, M. L., Prati, M., Bellomo, D. and Menegola, E. (1992) Effects of ethanol and acetaldehyde on rat embryos de-veloping in vitro. In Vitro Cell. Dev. Biol. 28, 205 - 210.
[20] Menegola, E., Broccia, M.L., Prati, M., Ricolfi, R. and Giavini, E. (1995) Glutathione and N-acetylcysteine protection against ac-etaldehyde embryotoxicity in rat embryos developing in vitro. Toxic. In Vitro. 5, 633 - 641.
© by PSP Volume 21 – No 3a. 2012 Fresenius Environmental Bulletin
694
[21] Fang, J.L. and Vaca, C.E. (1997) Detection of DNA adducts of acetaldehyde in peripheral white blood cells of alcohol abusers. Carcinogenesis 18, 627 - 632.
[22] Bağrıaçık, E.Ü. (1988) DDVP (Dichlorvos)’ nin Drosophila melanogaster Meig. (Diptera: Drosophilidae) üzerindeki muta-jenik etkileri. Thesis of Specialty in Science Hacettepe University Institue of Science Ankara, 4 - 12.
[23] Karataş, A. and Bahçeci, Z. (2009) Toxic effects of diazinon on adult individuals of Drosophila melanogaster. Journal of Applied Biologycal Sciences. 3 (2), 102 - 108.
[24] Nazir, A., Mukhopadhyay, I., Saxena, D.K. and Kar Chowdhuri, D. (2001) Chlorpyrifos-Induced hsp 70 expression and effect on reproductive performance in transgenic Drosophila melanogaster (hsp70-lacZ) bg9. Arch. Environ. Contam. Toxicol. 41, 443 - 449.
[25] Ağar, G., Uysal, H. and Kaya, Y. (2005) Toxic effects of aque-ous extract of Nerium oleander (Apocynaceae) leaves and its la-tex on total protein level in fruit fly Drosophila melanogaster (Diptera: Drosophilidae). Fresenius Environmental Bulletin 14 (7), 616 - 619.
[26] Kaya, Y., Uysal, H. (2005) Impacts of Nerium oleander leaf- wa-ter extract in Drosophila melanogaster (Meigen) (Diptera: Dro-sophilidae). Fresenius Environmental Bulletin. 1412b, 1164-1169.
[27] Uysal, H., Kaya, Y. (2004) Toxicity of Eupharbia canariensis la-tex to some developmental stages of Drosophila melanogaster (Diptera: Drosophilidae). Bull. Environ. Contam. Toxicol. 72 (1), 45 - 53.
[28] Karataş, A., Bahçeci, Z. (2009) Effect of cypermethrin on some developmental stages of Drosophila melanogaster. Bull. Environ. Contam. Toxicol. 82, 738 - 742.
[29] Karataş, A., Bahçeci, Z. (2011) The effect of diazinon on egg fer-tility and development in Drosophila melanogaster. Turk. J. Biol. 35, 95 - 101.
[30] Woodruff, R.C., Mason, J.M., Valencia, R. and Zimmering, S. (1985) Chemical mutagenesis testing in Drosophila. Environ. Mutag. 7, 677 - 702.
[31] Sreenathan, R.N., Padmanabhan, R. and Singh, S. (1982) Terato-genic effects of acetaldehyde in the rat. Drug Alcohol. Depend. 9 (4), 339 - 50.
[32] Bariliak, I.R. (1983) Embryotoxic and mutagenic activity of ethanol and acetaldehyde in intra-amniotic exposure. Tsitol. Genet. 17 (5), 57 - 60.
[33] Dare, W.N., Noronha, C.C., Kusemiju, O.T. and Okanlawon, O.A. (2002) The effect of ethanol on spermatogenesis and fertil-ity in male Sprague-Dawley rats pretreated with acetylsalicylic acid. Niger Postgrad Med J. 9 (4), 194 - 8.
[34] Stutz G, Zamudio J, Santillán ME, Vincenti L, de Cuneo MF, Ruiz RD. (2004) The effect of alcohol, tobacco, and aspirin con-sumption on seminal quality among healthy young men. Arch Environ Health. 59 (11), 548 - 52.
[35] Sapienza K., Bannister W. and Balzan R. (2008) Mitochondrial involvement in aspirin-induced apoptosis in yeast. Microbiology. 154 (9), 2740 - 7.
[36] Salmon, A.B, Marx, B.B and Harsman, L.G. (2001) A cost of re-production in Drosophila melanogaster: stress susceptibility. Evolution. 55, 1600 - 8.
[37] Özkan, F. (1995) Oral yolla alınan organofosfatlı insektisit malathionun Pimpla turionellae L. dişi bireylerinin yaşam süresi, yumurta verimi ve açılımına etkisi. M.S. Thesis, Çukurova Uni-versity, 62 - 78.
[38] Barnes, A.I., Wigby, S., Bone, J.M. and Partridge, L. (2008) Feeding fecundity and lifespan in female Drosophila melanogaster. Proc. R. Soc. B. 275, 1675 - 1683.
[39] Manjunata, T., Hari, D.S., and Sharma V.K. (2008) Egg-laying rhythm in Drosophila melanogaster. J. Genet. 87, 495 - 504.
[40] Partridge, L., Gren, A. and Fowler, K. (1987) Effects of egg pro-duction and exposure to males on females survival in Drosophila melanogaster. J. Insect. Physol. 33 (10), 745 - 749.
[41] Bruce, T.J.A. (2010) Tackling the threat to food security caused by crop pests in the new millennium. Food Security. 2 (2), 133 - 141.
[42] Memmi Koçak, B., Atlı, E. (2011) Positive correlation between malathion resistance and fecundity within natural population of Drosophila melanogaster. Turk. J. Biol. doi: 10.3906/biy-0906-6, 35.
[43] Hartl, M.W., Shibley, I.A. (2002) Supraphysiological acetalde-hyde levels suppress growth in chicken embryos. Alcohol. 28 (2), 111 - 5.
[44] Fry, J., Donlon, K. and Saweikis, M. (2007) A Worldwide poly-morphism in aldehyde dehydrogenase in Drosophila melanogaster: Evidence for selection mediated by dietary etha-nol. Evolution. 62 (1), 66 - 7.
[45] Zimatkin, S.M. (1991) Histochemical study of aldehyde dehy-drogenase in the rat CNS, J. Neurochem. 56 (1), 1 - 11.
[46] Ingram, L.O., Dickens, B.F. and Buttke, T.M. (1980) Reversible effects of ethanol on E. coli. Adv Exp. Med. Biol. 126, 299 - 337.
[47] Kaulfers, P.M., Marquardt, A. (1991) Demonstration of formal-dehyde dehydrogenase activity in formaldehyde-resistant Entero-bacteriaceae. FEMS Microbiol. Lett. 79, 335 - 338.
[48] Howard, P.A. (2002) Aspirin resistance. Ann. Pharmacother. 36, 1620 - 4.
[49] Weber, A.A., Przytulski, B., Schanz, A., Hohlfeld, T. and Schror, K. (2002) Towards a definition of aspirin resistance: a typologi-cal approach, Platelets. 13, 37 - 40.
[50] Young, J.P., Beckerman, J., Vicini, S., and Myers, A. (2010) Acetylsalicylic acid enhances purinergic receptor-mediated out-ward currents in rat megakaryocytes, Am. J. Physiol. Cell Physiol. 298 (3), 602-10.
[51] Berlanga, M. and Vinas, M. (2000) Salicylate induction of pheno-typic resistance to quinolones in Serratia marcescens. J. Antim-icrob. Chemother. 46, 279 - 282.
[52] Kauss, H., Theisinger-Hinkel, E., Mindermann, R., and Conrath, U. (1992) Dichloroisonicotinic acid and salicylic acid inducers of systemic acquired resistance, enhance fungal elicitor responses in parsley cells. Plant Journal. 2, 655 - 60.
Received: May 26, 2011 Revised: October 24, 2011 Accepted: November 10, 2011 CORRESPONDING AUTHOR
Ayla Karatas Kocaeli University Faculty of Education 41380 Kocaeli TURKEY Phone: +90 262 303 24 40 Fax: +90 262 303 24 03 E-mail: [email protected]
FEB/ Vol 21/ No 3a/ 2012 – pages 685 – 694
© by PSP Volume 21 – No 3a. 2012 Fresenius Environmental Bulletin
695
SIMULATION OF HUMAN HEALTH RISK OF CADMIUM ASSOCIATED SPATIALLY WITH SOIL ORGANIC CARBON
AND pH IN DABAOSHAN MINE, SOUTH CHINA
Huarong Zhao1,2, Beicheng Xia1,*, Jianqiao Qin3, Xu Zhou1, Peng Zhao1 and Shili Shen1
1School of Environmental Science and Engineering, Sun Yat-Sen University, 510275 Guangzhou, China 2School of Environmental Science and Engineering, Guilin University of Technology, 541004 Guilin, China
3Guangdong Provincial Academy of Environmental Science, 510045 Guangzhou, China ABSTRACT
Soil samples were collected in Dabaoshan mine, South China from 2008 to 2009 to analyze soil pH, soil organic carbon (SOC) and total soil cadmium. A cad-mium uptake model of crops was established based on the Hough model. Combined with geostatistic simulation, spatial pattern of cadmium risk was performed using dose-response assessment method. Forty-eight percent of hazard quotient (HQ) of sample locations was above one. Higher risk regions were located in the mine site, the basins of Chuangdu river watershed and Hengshi river watershed. Higher risk regions were overlapped with lower soil pH, higher SOC and higher cadmium regions. The higher risk regions were advised to be remedied based on the spatial analysis. Preferential remediation was suggested in the high risk regions covered by 25 percen-tile HQ map, while monitor and mitigation measures should be taken in the high risk regions covered by 50 percentile HQ map. This study highlights the influences of soil pH and SOC on human health risk assessment of cadmium-contaminated land.
KEYWORDS: Human health; Cadmium; Risk assessment; Se-quential indicator simulation; Dabaoshan mine
1. INTRODUCTION
Heavy metal-contaminated lands have been concerned in recent years for rapid progress of industrialization and urbanization [1]. Heavy metals reach soils primarily through geogenic and anthropogenic processes [2]. Anthropogenic processes, such as fertilizer products, biosolids, animal manures as well as wastes of industrial and mining are the major sources of heavy metals. Generally, heavy metals * Corresponding author
are bioavailable by crops, and harm to human being through food webs [3, 4]. Itai-itai and Minamata disease are famous cases in Japan for the residents consuming heavy metal-contaminated foods [5]. Heavy metal issues cannot be optimistic in China. Li [6] reports that some farmlands are heavy metal-contaminated in Southwest China. Therefore, it is necessary to investigate heavy metal contamination and to assess human health risks there.
Dabaoshan Mine, the largest mine in South China, had been mined since Sony Dynasty (960-1279 AD), but extensively in the 1970s [7]. Soils and streams vicinity of the mine sites had been contaminated by heavy metals for long-term mining activities. Zhou et al. [8] reported that concentrations of Cu, Zn, Cd and Pb in paddy soils are 576, 1140, 2.48 and 191 mg/kg, respectively. The concen-trations of Cu, Zn and Cd are 11.5, 5.7 and 8.2 times higher than the Grade II of national standard (China Envi-ronmental Quality Standard for soils GB 15618-1995). Heavy metal concentration of crops in some areas are exceeding the maximum permissible level of China [9, 10]. Dwellers are bearing high health risks for long-term heavy metals exposure [10]. School-age children suffering from behavioral problems are increasing [11]. These studies are focused on the hotspots of health risks in the area. How-ever, there is little knowledge about the spatial distribution of the health risks of heavy metal in the area. It is essential both to environmental remediation as well as to effective management measurement and policy.
Soil characteristics, such as soil pH and soil organic carbon (SOC), are affecting heavy metal bioavailability [2, 12-14]. Hough et al. [13] calculated the heavy metals uptake by plants based on the soil pH and heavy metals adsorbed on SOC, and assessed the risks of urban dwellers exposed to heavy metals via food consumption, respira-tion and hand-to-mouth pathways. Gay and Korre [15] developed a methodology that Cd concentration ratio could be calculated based on soil pH, and assessed the health risks of population living in Cd-contaminated areas in the vicinity to mine sites. Soluble heavy metals in soils
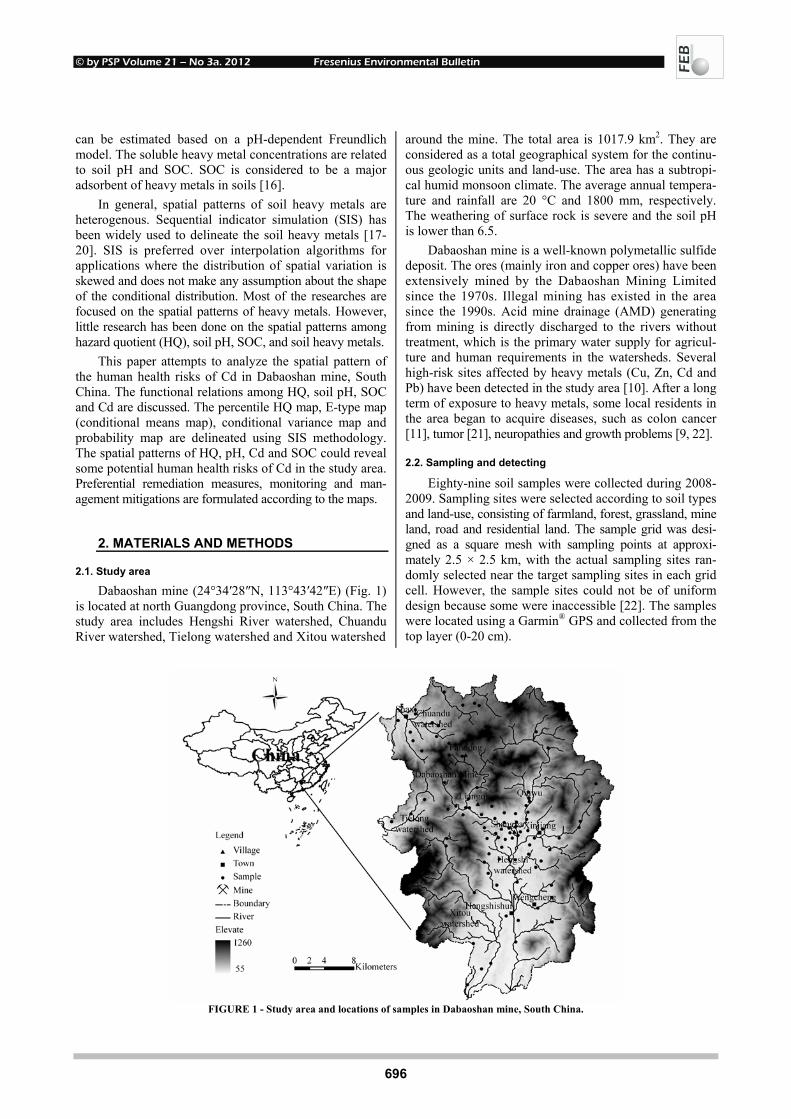
© by PSP Volume 21 – No 3a. 2012 Fresenius Environmental Bulletin
696
can be estimated based on a pH-dependent Freundlich model. The soluble heavy metal concentrations are related to soil pH and SOC. SOC is considered to be a major adsorbent of heavy metals in soils [16].
In general, spatial patterns of soil heavy metals are heterogenous. Sequential indicator simulation (SIS) has been widely used to delineate the soil heavy metals [17-20]. SIS is preferred over interpolation algorithms for applications where the distribution of spatial variation is skewed and does not make any assumption about the shape of the conditional distribution. Most of the researches are focused on the spatial patterns of heavy metals. However, little research has been done on the spatial patterns among hazard quotient (HQ), soil pH, SOC, and soil heavy metals.
This paper attempts to analyze the spatial pattern of the human health risks of Cd in Dabaoshan mine, South China. The functional relations among HQ, soil pH, SOC and Cd are discussed. The percentile HQ map, E-type map (conditional means map), conditional variance map and probability map are delineated using SIS methodology. The spatial patterns of HQ, pH, Cd and SOC could reveal some potential human health risks of Cd in the study area. Preferential remediation measures, monitoring and man-agement mitigations are formulated according to the maps.
2. MATERIALS AND METHODS
2.1. Study area
Dabaoshan mine (24°34′28″N, 113°43′42″E) (Fig. 1) is located at north Guangdong province, South China. The study area includes Hengshi River watershed, Chuandu River watershed, Tielong watershed and Xitou watershed
around the mine. The total area is 1017.9 km2. They are considered as a total geographical system for the continu-ous geologic units and land-use. The area has a subtropi-cal humid monsoon climate. The average annual tempera-ture and rainfall are 20 °C and 1800 mm, respectively. The weathering of surface rock is severe and the soil pH is lower than 6.5.
Dabaoshan mine is a well-known polymetallic sulfide deposit. The ores (mainly iron and copper ores) have been extensively mined by the Dabaoshan Mining Limited since the 1970s. Illegal mining has existed in the area since the 1990s. Acid mine drainage (AMD) generating from mining is directly discharged to the rivers without treatment, which is the primary water supply for agricul-ture and human requirements in the watersheds. Several high-risk sites affected by heavy metals (Cu, Zn, Cd and Pb) have been detected in the study area [10]. After a long term of exposure to heavy metals, some local residents in the area began to acquire diseases, such as colon cancer [11], tumor [21], neuropathies and growth problems [9, 22].
2.2. Sampling and detecting
Eighty-nine soil samples were collected during 2008-2009. Sampling sites were selected according to soil types and land-use, consisting of farmland, forest, grassland, mine land, road and residential land. The sample grid was desi-gned as a square mesh with sampling points at approxi-mately 2.5 × 2.5 km, with the actual sampling sites ran-domly selected near the target sampling sites in each grid cell. However, the sample sites could not be of uniform design because some were inaccessible [22]. The samples were located using a Garmin® GPS and collected from the top layer (0-20 cm).
FIGURE 1 - Study area and locations of samples in Dabaoshan mine, South China.

© by PSP Volume 21 – No 3a. 2012 Fresenius Environmental Bulletin
697
The soils were air-dried at room temperature. Part of each sample was sieved (2 mm) for pH measurement, and another part was finely crushed for SOC and Cd detec-tion.
Soil pH was measured using a 1:2.5 soil-to-water ra-tio, and SOC was detected by dichromate digestion method [23]. The soil samples were digested by aqua regia (HNO3-HCl) acid [22]. The digestion was performed in a micro-wave oven. Cd concentration was analyzed using a graph-ite furnace atomic absorption spectrophotometer (GFAAs, HITACHI Z-2000).
Quality assurance and quality control procedures were carried out in the analysis. Replicate and blank analyses were performed throughout the study. Standard reference materials (SRM) were used for validation of the analytical procedure. The SRM of soil (GBW 08303) was obtained from the National Research Center for CRMs (Beijing China). The recovery of Cd was 95%.
2.3. Cadmium uptake model
Human health risk assessment of Cd-contaminated land requires the consideration of transfer into crops. Several studies established cadmium uptake models, such as the New Model Framework (NMF) model, the National Insti-tute of Public Health and the Environmental (RIVM) model, Hough model, the United States Environmental Protection Agency (US EPA) model and the Contami-nated Land Exposure Assessment (CLEA) model. These models are considering specific parameters, such as pH, SOC and clay content. We selected Hough model for this work, based on the results of literature [24]. The model is expressed as follows:
s.t(a b pH c log(C 100/OC))p pC DW 10 + × + × ×= × (1)
where, Cp is the concentration of metal in fresh plant tissue (mg kg fw-1), DWp is the concentration coefficient from dry weight to fresh weight, and a, b, c are empirical parameters, Cs.t is the total concentration of metal in soil extracted by acid digestion (mg kg dw-1), pH is the soil pH, and OC is the organic carbon content of soil (% dw/dw).
Equation (1) can be re-expressed as:
p clog(C ) d b pH c log(M )= + × + × (2)
where, d, b, and c are empiric metal and crops spe-cific coefficients, and Mc is heavy metal adsorbed on organic carbon. The coefficients of cadmium of d, b, and c were fitted by the data of Zhuang et al. [10], who stud-ied human health risk of heavy metals in this area. The specific equation is as follows:
p clog(C ) 3.2370 0.7425 pH 0.2629 log(M )= − × − × (3)
The correlation coefficient is 0.929, while the root mean square error is 0.189. There is a strong correlation among Cp, pH, and Mc.
2.4. Human health risk assessment model
Hazard quotient (HQ) is a ratio of chronic daily intake (CDI) of a heavy metal to relative reference dose (RfD). The potential human health risk is characterized by HQ in dose-response method defined by the USEPA. The RfD of cadmium is 0.001 (mg/(kg·day)) [25]:
CDIHQRfD
= (4)
CDI is the sum of cadmium intake via three path-ways: inhalation, dermal absorption, and oral intake. However, the contribution of intake from the dermal ab-sorption and inhalation pathways is less than 1% [15]. Therefore, CDI of cadmium is reduced to the following equation:
3EF ED FI MCCDI 10BW AT
−× × ×= ×
× (5)
where, EF is exposure frequency (365 days/year), ED is average exposure duration (year) (70 years), FI is food ingestion (646 g/(person·day)), MC is cadmium concen-tration in food (mg/kg), which is calculated by equation (3), BW is average body weight (65 kg), and AT is aver-aging time (AT = 365 days/year × 70 years).
The values in bracket are adult parameters of the study area [10]. Combining equations (3), (4) and (5), the HQ of each sample site may be calculated according to the relative soil pH, SOC and Cd. The functional relation can be described as follows:
clog(HQ) 4.2343 0.7425 pH 0.2926 log(M )= − × − × (6)
There is an exponential relation between HQ and Mc, while a logarithmic relation is presented between HQ and soil pH.
2.5. Geostatistical simulation based on SIS
The geostatistical method is based on the regionalized variable theory that variables of model have both random and spatial structures in an area. SIS is one of non-Gaussian simulation techniques [26-29]. Briefly, the procedures of SIS are binary code transformations and variogram analy-sis, prior distribution estimation, and sequential simulation [28]. A variogram of the data should be determined before geostatistics is performed. The spatial variability of vari-ables is quantified by an experimental variogram calcula-tion, which can be fitted by a theoretical model γ(h), and the model can be a spherical, exponential or Gaussian model. Nugget effect, sill, and range are fitted for the model. At the grids without sample, a prior distribution of probability is estimated according to the probabilities of grids nearby. A continuous conditional cumulative distribution function (ccdf) within each class of threshold values is determined by linear interpolation. The continuous ccdf at the lower tail is extrapolated towards zero using a negatively skewed power model with ω = 2.5 and an infinite upper bound using a hyperbolic model with ω = 1.5 [26, 27].

© by PSP Volume 21 – No 3a. 2012 Fresenius Environmental Bulletin
698
Multiple realizations can be produced by SIS. The realizations are established by following a random path, and the realizations represent the same spatial distribution of HQ in the study area. Therefore, many realizations could be used to evaluate the variation and uncertainty of the HQ. The experimental variogram is performed by AUTO-IK, which is built around the GSLIB (Geostatisti-cal Software Library) programs gamv, kb2d, ik3d, postik, vargplt, vmodel, and the semivariogram modeling pro-gram varfit [30]. The SIS is performed by sisim codes in GSLIB [27]. The interpolation of distribution maps is performed under geographic information system (GIS).
3. RESULTS AND DISCUSSION
3.1. Data characterization
Data characteristics reveal the distribution of ele-ments in the study area. Fig. 2 shows the histograms of pH, SOC, Cd, and HQ, and summarizes some descriptive statistics, such as mean, standard deviation, skew, maxi-mum, median and minimum values, for the 89 samples. Fig. 2(a) shows the histogram of soil pH. The mean pH value is 5.27, with maximum and minimum values of 7.44 and 3.05. The skewness is -0.11 indicating that the dis-tribution of soil pH is almost a normal one. The soil pH is generally acidic (pH < 6.5) [31]. There are several sample locations with low pH, which means that the soil is con-taminated by AMD seriously.
The descriptive statistics (Fig. 2(b)) show that the mean value of SOC (%) in the study area is 1.78. The range be-tween the minimum and maximum is 4.77. The skew is 0.51 and the histogram of SOC shows a right tail distribution suggesting that there are some high SOC values existing.
Fig. 2(c) illustrates the histograms and statistic char-acteristics of Cd in the study area. The mean value (1.72 mg/kg) is greater than the national value of Cd (0.30 mg/kg) (GB 15618-1995). The range (21.48 mg/kg) be-tween the minimum and maximum values is large. The mean value is greater than the median value, and the skew-ness is 5.12 proving that the histogram is strong and positively skewed. The spatial patterns of Cd concentrations reveal that the spatial distribution of Cd concentrations is not homogeneous. High-value of Cd concentrations is existing, which means that the soil in some areas is con-taminated by Cd seriously.
HQ values of each sample site are calculated based on the equation (6). Fig. 2(d) indicates that the histogram of HQ is positively skewed. Approximately, forty-eight percent of the HQ values are higher than 1.0 which means nearly half of the sample site is exposed to a high risk of Cd contamination. The histograms of Cd and HQ are similarly skewed.
The maximum value of SOC is close to the results of Zhuang et al. [10], and the minimum value is lower than the results. The reason is that the samples of our investi-gation are consisting of more soil types, and that the area is larger. Median value of SOC is lower than that investi-gated in Guangdong [32]. McGrath and Zhang [33] inves-tigated pH and SOC in grassland of Ireland. The skewness of raw data of pH and SOC were 0.70 and 1.66. The probability distribution of pH was close to normal distri-bution, and that of SOC was positively skewed. The dis-tribution of tolerable daily soil intake in the study of Gay and Korre [15] was also positively skewed. Crops absorb Cd amounts differently at various pH and SOC conditions. Therefore, the distribution of HQ is different but related to the distributions of pH and SOC.
FIGURE 2 - Histogram of soil pH, SOC, Cd, and HQ.
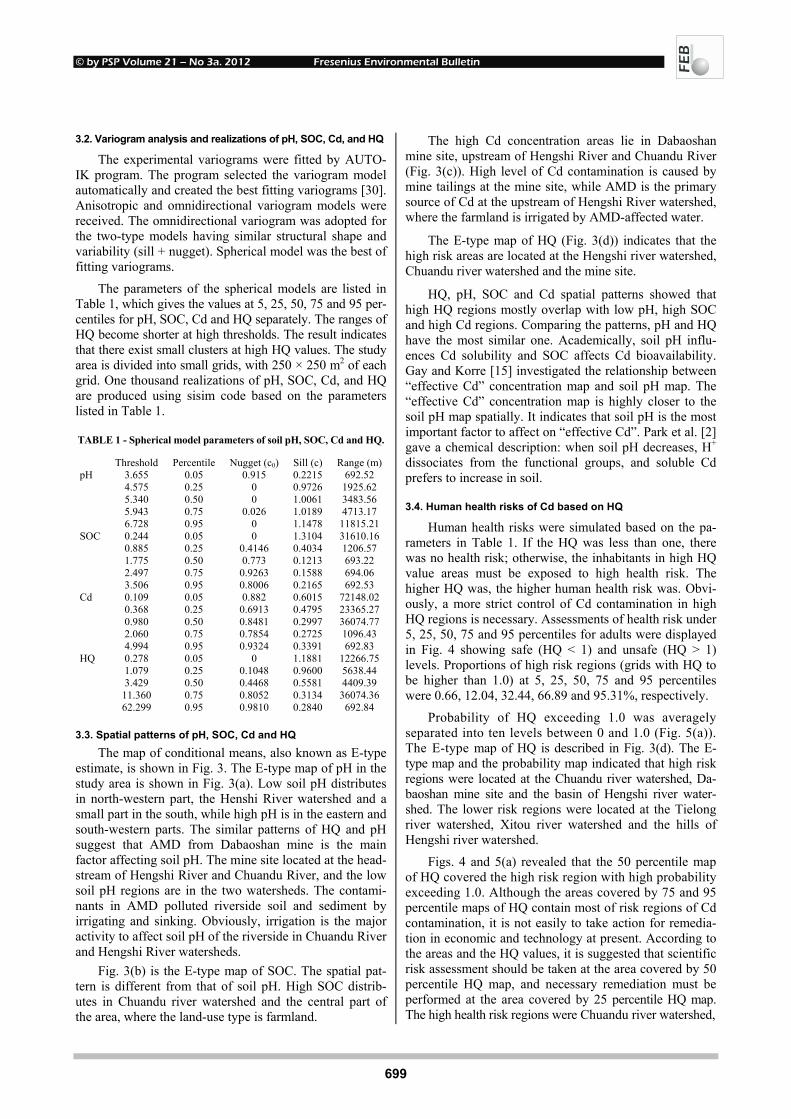
© by PSP Volume 21 – No 3a. 2012 Fresenius Environmental Bulletin
699
3.2. Variogram analysis and realizations of pH, SOC, Cd, and HQ
The experimental variograms were fitted by AUTO-IK program. The program selected the variogram model automatically and created the best fitting variograms [30]. Anisotropic and omnidirectional variogram models were received. The omnidirectional variogram was adopted for the two-type models having similar structural shape and variability (sill + nugget). Spherical model was the best of fitting variograms.
The parameters of the spherical models are listed in Table 1, which gives the values at 5, 25, 50, 75 and 95 per-centiles for pH, SOC, Cd and HQ separately. The ranges of HQ become shorter at high thresholds. The result indicates that there exist small clusters at high HQ values. The study area is divided into small grids, with 250 × 250 m2 of each grid. One thousand realizations of pH, SOC, Cd, and HQ are produced using sisim code based on the parameters listed in Table 1.
TABLE 1 - Spherical model parameters of soil pH, SOC, Cd and HQ.
Threshold Percentile Nugget (c0) Sill (c) Range (m) 3.655 0.05 0.915 0.2215 692.52 4.575 0.25 0 0.9726 1925.62 5.340 0.50 0 1.0061 3483.56 5.943 0.75 0.026 1.0189 4713.17
pH
6.728 0.95 0 1.1478 11815.21 0.244 0.05 0 1.3104 31610.16 0.885 0.25 0.4146 0.4034 1206.57 1.775 0.50 0.773 0.1213 693.22 2.497 0.75 0.9263 0.1588 694.06
SOC
3.506 0.95 0.8006 0.2165 692.53 0.109 0.05 0.882 0.6015 72148.02 0.368 0.25 0.6913 0.4795 23365.27 0.980 0.50 0.8481 0.2997 36074.77 2.060 0.75 0.7854 0.2725 1096.43
Cd
4.994 0.95 0.9324 0.3391 692.83 0.278 0.05 0 1.1881 12266.75 1.079 0.25 0.1048 0.9600 5638.44 3.429 0.50 0.4468 0.5581 4409.39 11.360 0.75 0.8052 0.3134 36074.36
HQ
62.299 0.95 0.9810 0.2840 692.84
3.3. Spatial patterns of pH, SOC, Cd and HQ
The map of conditional means, also known as E-type estimate, is shown in Fig. 3. The E-type map of pH in the study area is shown in Fig. 3(a). Low soil pH distributes in north-western part, the Henshi River watershed and a small part in the south, while high pH is in the eastern and south-western parts. The similar patterns of HQ and pH suggest that AMD from Dabaoshan mine is the main factor affecting soil pH. The mine site located at the head-stream of Hengshi River and Chuandu River, and the low soil pH regions are in the two watersheds. The contami-nants in AMD polluted riverside soil and sediment by irrigating and sinking. Obviously, irrigation is the major activity to affect soil pH of the riverside in Chuandu River and Hengshi River watersheds.
Fig. 3(b) is the E-type map of SOC. The spatial pat-tern is different from that of soil pH. High SOC distrib-utes in Chuandu river watershed and the central part of the area, where the land-use type is farmland.
The high Cd concentration areas lie in Dabaoshan mine site, upstream of Hengshi River and Chuandu River (Fig. 3(c)). High level of Cd contamination is caused by mine tailings at the mine site, while AMD is the primary source of Cd at the upstream of Hengshi River watershed, where the farmland is irrigated by AMD-affected water.
The E-type map of HQ (Fig. 3(d)) indicates that the high risk areas are located at the Hengshi river watershed, Chuandu river watershed and the mine site.
HQ, pH, SOC and Cd spatial patterns showed that high HQ regions mostly overlap with low pH, high SOC and high Cd regions. Comparing the patterns, pH and HQ have the most similar one. Academically, soil pH influ-ences Cd solubility and SOC affects Cd bioavailability. Gay and Korre [15] investigated the relationship between “effective Cd” concentration map and soil pH map. The “effective Cd” concentration map is highly closer to the soil pH map spatially. It indicates that soil pH is the most important factor to affect on “effective Cd”. Park et al. [2] gave a chemical description: when soil pH decreases, H+ dissociates from the functional groups, and soluble Cd prefers to increase in soil.
3.4. Human health risks of Cd based on HQ
Human health risks were simulated based on the pa-rameters in Table 1. If the HQ was less than one, there was no health risk; otherwise, the inhabitants in high HQ value areas must be exposed to high health risk. The higher HQ was, the higher human health risk was. Obvi-ously, a more strict control of Cd contamination in high HQ regions is necessary. Assessments of health risk under 5, 25, 50, 75 and 95 percentiles for adults were displayed in Fig. 4 showing safe (HQ < 1) and unsafe (HQ > 1) levels. Proportions of high risk regions (grids with HQ to be higher than 1.0) at 5, 25, 50, 75 and 95 percentiles were 0.66, 12.04, 32.44, 66.89 and 95.31%, respectively.
Probability of HQ exceeding 1.0 was averagely separated into ten levels between 0 and 1.0 (Fig. 5(a)). The E-type map of HQ is described in Fig. 3(d). The E-type map and the probability map indicated that high risk regions were located at the Chuandu river watershed, Da-baoshan mine site and the basin of Hengshi river water-shed. The lower risk regions were located at the Tielong river watershed, Xitou river watershed and the hills of Hengshi river watershed.
Figs. 4 and 5(a) revealed that the 50 percentile map of HQ covered the high risk region with high probability exceeding 1.0. Although the areas covered by 75 and 95 percentile maps of HQ contain most of risk regions of Cd contamination, it is not easily to take action for remedia-tion in economic and technology at present. According to the areas and the HQ values, it is suggested that scientific risk assessment should be taken at the area covered by 50 percentile HQ map, and necessary remediation must be performed at the area covered by 25 percentile HQ map. The high health risk regions were Chuandu river watershed,
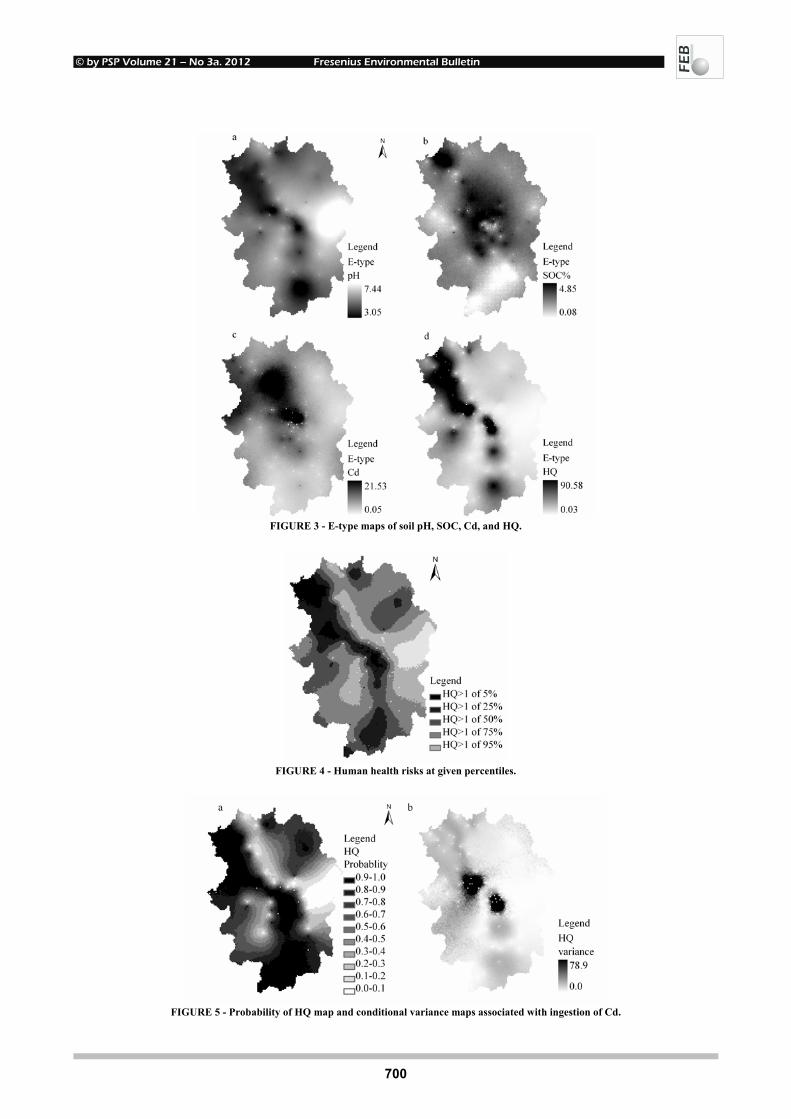
© by PSP Volume 21 – No 3a. 2012 Fresenius Environmental Bulletin
700
FIGURE 3 - E-type maps of soil pH, SOC, Cd, and HQ.
FIGURE 4 - Human health risks at given percentiles.
FIGURE 5 - Probability of HQ map and conditional variance maps associated with ingestion of Cd.

© by PSP Volume 21 – No 3a. 2012 Fresenius Environmental Bulletin
701
Hengshi river watershed and the mine site. Comparing Figs. 4 and 5(a), the high health risk region corresponded to 0.8-1.0 probability regions.
Conditional variance of HQ is shown in Fig. 5(b), which represented spread of ccdf and probability of HQ being higher or lower than the threshold at each grid node. Higher uncertainty was mostly located at high HQ re-gions.
Recently, some researches were carried out on human health risk assessment and epidemiological survey in the area. Zhuang et al. [10] investigated Cu, Zn, Cd and Pb con-tamination and revealed that Zn, Cd and Pb levels in crops exceeded the maximum permissible concentrations of Chinese national standards. Tendency of Cd and Pb accu-mulation in rice was analyzed. Estimated daily intake and target hazard quotient (THQ) of Cd and Pb in rice and vegetables exceeded the FAO/WHO permissible limit at Fandong, Liangqiao, Zhongxin and Shangba villages, and the health risks decreased with distance from the central mine. Liu et al. [21] investigated incidence of enteron tumors in Shangba village during 1984-2001. It was about 400 times higher than that in Yangzhong city, and mortal-ity of enteron cancer was 1000 times higher than that in Hangzhou city. Behavioral problems of school-aged chil-dren have been studied in Shangba, Xiaozhen and Dong-fang village in August, 2006 [11]. A significant ranking of behavioral problems was as follows: Shangba > Xiaoz-hen > Dongfang. Although the behavioral problems were impacted by multiple factors, heavy metal contamination was considered to be the major factor. The villages bear-ing higher HQ have higher tumor incidence, cancer mor-tality and behavioral problems.
The concentrations of Cu, Zn, Cd, Pb, and rock mag-netic in the area could indicate the anthropogenic anoma-lies of heavy metal pollution [22]. Geochemical back-ground of the four heavy metals exceeded the national standard ( GradeII of Chinese Environmental Quality of Soils GB 15618-1995), and the human health was at high-risk along the riparian region of the Hengshi River [22].
3.5. Uncertainties in risk assessment
The heterogeneity of HQ, pH, soil total Cd, and SOC was examined in the study areas; the spatial pattern of HQ provided the probability of hotspots of Cd risk. However, some uncertainties affecting spatial patterns of the risk, are existing. Firstly, soil chemical characteristics, except soil pH and SOC, could affect Cd bioavailability. The characteristics included silicate clays, iron, aluminum and manganese oxides, redox potential, cation/anion exchange capacity etc. Secondly, the variogram of geostatistical models could contribute a little to accuracy. Number of thresholds in the program was difficult to choice although the suggested number was no more than nine [30]. The accuracy of variogram parameters were determined by the representation and the number of samples [34]. Generally, the more samples and representatives were, the less error
of simulation was. The selected sample points were not strictly asymmetric in the area, and some error could be transferred to the neighbor grids, especially at high HQ regions. Thirdly, parameters of assessment method of hu-man health risk were impact factors, such as CR, EF, ED, FI, MC, AT, BW and RfD. The spatial pattern of HQ was based on the assumption that these parameters were certain. However, some of them were not certain but stochastic. Finally, there was an assumption that spatial distributions of soil pH and SOC were constant. However, they were fluctu-ating due to irrigation, hydrologic and geochemical proc-esses [28]. Moreover, the relative error, including sampling, detecting and so on, could influence these uncertainties.
4. CONCLUSIONS
This study demonstrated that human health vicinity of the mine site was affected by soil pH, SOC and heavy metal concentration. The functional relations among HQ, soil pH, Mc and Cd were established based on Freundlich equation in Dabaoshan mine. There is an exponential re-lation between HQ and Mc, but a logarithmic relation be-tween HQ and soil pH. HQs are calculated at the sample locations depending on the functional relation. Forty-eight percent of HQ values are higher than 1.0 in the samples.
SIS results of HQ, soil pH, SOC, and total soil Cd in-dicate that high HQ regions are spatially corresponding to low soil pH, high SOC and high Cd regions. The influ-ence of soil pH is greater than that of SOC to HQ. High total soil Cd regions must be of the regions with high HQ. The high HQ (HQ > 1) regions lie in the Chuandu river watershed, Dabaoshan mine site and the basin of Hengshi river watershed. Inhabitants in these regions are poten-tially bearing higher Cd risks than others.
In unsafe regions (HQ > 1) of 50 percentile HQ map, soil heavy metal concentration should be monitored. Moreover, effective environment managements, such as monitoring of soil pH, SOC, and Cd concentrations of crops, should be considered. In unsafe regions (HQ > 1) of 25 percentile HQ map, Cd-contaminated soil must be remedied firstly (increase of the soil pH, immobilizing the Cd). Planting and harvesting of crops are forbidden in these regions. Then, Cd must be removed from the soils.
ACKNOWLEDGMENTS
This study was financially supported by the Guangdong Provincial Natural Science Foundation (No. 06202438) and the Research Funds of The Guangxi Key Laboratory of Environmental Engineer-ing, Protection and Assessment (GuiKeNeng0801Z020 and GuiKeNeng0901Z005).
© by PSP Volume 21 – No 3a. 2012 Fresenius Environmental Bulletin
702
REFERENCES
[1] Dudka, S., Piotrowska, M. and Terelak, H. (1996) Transfer of cadmium, lead, and zinc from industrially contaminated soil to crop plants: A field study. Environmental Pollution 94, 181-188.
[2] Park, J.H., Lamb, D., Paneerselvam, P., Choppala, G., Bolan, N. and Chung, J.W. (2011) Role of organic amendments on enhanced bioremediation of heavy metal(loid) contaminated soils. Journal of Hazardous Materials 185, 549-574.
[3] Haro-Bravo, M.I.d., Río-Celestino, M.d. and Haro-Bailón, A.d. (2008) Uptake and accumulation of lead by broccoli plants grown in contaminated soils. Fresenius Environmental Bulletin 17, 1640-1643.
[4] Pérez-Sirvent., C., Martínez-Sánchez, M.J., García-Lorenzo, M.L. and Bech, J. (2008) Uptake of Cd and Pb by natural vegetation in soils polluted by mining activities. Fresenius Environmental Bulletin 17, 1666-1671.
[5] Kobayashi, J. (1978) Pollution by cadmium and the itai-itai disease in Japan. ed. F. W. Oehme. Marcel Dekker New York, USA.
[6] Li, Y. (2011) Farmland contaminated by heavy metals in southwest of China. http://news.sina.com.cn/c/sd/2011-02-22/015921990515.shtml.
[7] Chen, A., Lin, C., Lu, W., Wu, Y., Ma, Y., Li, J. and Zhu, L. (2007) Well water contaminated by acidic mine water from the Dabaoshan Mine, South China: Chemistry and toxicity. Chemosphere 70, 248-255.
[8] Zhou, J.M., Dang, Z., Cai, M.F. and Liu, C.Q. (2007) Soil heavy metal pollution around the Dabaoshan Mine, Guang-dong Province, China. Pedosphere 17, 588-594.
[9] Zhuang, P., Zou, B., Li, N. and Li, Z. (2009) Heavy metal contamination in soils and food crops around Dabaoshan mine in Guangdong, China: implication for human health. Environmental Geochemistry and Health 31, 707-715.
[10] Zhuang, P., McBride, M.B., Xia, H., Li, N. and Li, Z. (2009) Health risk from heavy metals via consumption of food crops in the vicinity of Dabaoshan mine, South China. Science of the Total Environment 407, 1551-1561.
[11] Bao, Q.S., Lu, C.Y., Song, H., Wang, M., Ling, W., Chen, W.Q., Deng, X.Q., Hao, Y.T. and Rao, S. (2009) Behavioural development of school-aged children who live around a multi-metal sulphide mine in Guangdong province, China: a cross-sectional study. BMC Public Health 9, 217-224.
[12] Zeng, F., Ali, S., Zhang, H., Ouyang, Y., Qiu, B., Wu, F. and Zhang, G. (2010) The influence of pH and organic matter content in paddy soil on heavy metal availability and their uptake by rice plants. Environmental Pollution 159, 84-91.
[13] Hough, R., Breward, N., Young, S., Crout, N., Tye, A., Moir, A. and Thornton, I. (2004) Assessing potential risk of heavy metal exposure from consumption of home-produced vegeta-bles by urban populations. Environmental Health Perspectives 112, 215-221.
[14] Soriano-Disla, J.M., Gómez, I., Guerrero, C., Jordan, M.M. and Navarro-Pedreño, J. (2008) Soil factors related to heavy metal bioavailability after sewage sludge application. Fresen-ius Environmental Bulletin 17, 1839-1845.
[15] Gay, J.R. and Korre, A. (2009) Accounting for pH heteroge-neity and variability in modelling human health risks from cadmium in contaminated land. Science of The Total Envi-ronment 407, 4231-4237.
[16] Hough, R., Young, S. and Crout, N. (2003) Modelling of Cd, Cu, Ni, Pb and Zn uptake, by winter wheat and forage maize, from a sewage disposal farm. Soil Use and Management 19, 19-27.
[17] Tavares, M.T., Sousa, A.J. and Abreu, M.M. (2008) Ordinary kriging and indicator kriging in the cartography of trace ele-ments contamination in São Domingos mining site (Alentejo, Portugal). Journal of Geochemical Exploration 98, 43-56.
[18] Lin, Y.P., Chu, H.J., Huang, Y.L., Cheng, B.Y. and Chang, T.K. (2011) Modeling spatial uncertainty of heavy metal con-tent in soil by conditional Latin hypercube sampling and geo-statistical simulation. Environmental Earth Sciences 62, 299-311.
[19] Lin, Y.P., Cheng, B.Y., Shyu, G.S. and Chang, T.K. (2010) Combining a finite mixture distribution model with indicator kriging to delineate and map the spatial patterns of soil heavy metal pollution in Chunghua County, central Taiwan. Envi-ronmental Pollution 158, 235-244.
[20] Juang, K.W., Chen, Y.S. and Lee, D.Y. (2004) Using sequen-tial indicator simulation to assess the uncertainty of delineat-ing heavy-metal contaminated soils. Environmental Pollution 127, 229-238.
[21] Liu, Y., Gao, Y., Wang, K., Cheng, G. and Xu, T. (2005) Etiologic study on alimentary tract malignant tumor in vil-lages of high occurrence. China tropical medicine (in chi-nese) 5, 1139-1142.
[22] Zhou, X. and Xia, B. (2010) Defining and modeling the soil geochemical background of heavy metals from the Hengshi River watershed (southern China): Integrating EDA, stochas-tic simulation and magnetic parameters. Journal of Hazard-ous Materials 180, 542-551.
[23] Li, Y.T., Becquer, T., Dai, J., Quantin, C. and Benedetti, M.F. (2009) Ion activity and distribution of heavy metals in acid mine drainage polluted subtropical soils. Environmental Pollution 157, 1249-1257.
[24] Legind, C.N. and Trapp, S. (2010) Comparison of prediction methods for the uptake of As, Cd and Pb in carrot and let-tuce. SAR and QSAR in Environmental Research 21, 513-525.
[25] USEPA (2009) Integrated Risk Information System (IRIS): Cadmium (CASRN 7440-43-9). http://www.epa.gov/iris/subst/0141.htm.
[26] Goovaerts, P. (1997) Geostatistics for natural resources evaluation. Oxford University Press, New York.
[27] Deutsch, C. and Journel, A. (1998) GSLIB: Geostatistical software library and user's guide. Oxford University Press, New York.
[28] Zeng, G., Liang, J., Guo, S., Shi, L., Xiang, L., Li, X. and Du, C. (2009) Spatial analysis of human health risk associ-ated with ingesting manganese in Huangxing Town, Middle China. Chemosphere 77, 368-375
[29] Zhao, Y., Shi, X., Yu, D., Wang, H. and Sun, W. (2005) Un-certainty assessment of spatial patterns of soil organic carbon density using sequential indicator simulation, a case study of Hebei province, China. Chemosphere 59, 1527-1535.
[30] Goovaerts, P. (2009) AUTO-IK: A 2D indicator kriging pro-gram for the automated non-parametric modeling of local un-certainty in earth sciences. Computers & Geosciences 35, 1255-1270.

© by PSP Volume 21 – No 3a. 2012 Fresenius Environmental Bulletin
703
[31] Yang, C., Wu, Z., Zhang, H., Guo, R. and Wu, Y. (2009) Risk assessment and distribution of soil Pb in Guangdong, China. Environmental Monitoring and Assessment 159, 381-391.
[32] Zhang, H., Wu, Z., Yang, C., Xia, B., Xu, D. and Yuan, H. (2008) Spatial Distributions and Potential Risk Analysis of Total Soil Selenium in Guangdong Province, China. Journal of Environmental Quality 37, 780-787.
[33] McGrath, D. and Zhang, C. (2003) Spatial distribution of soil organic carbon concentrations in grassland of Ireland. Ap-plied Geochemistry 18, 1629-1639.
[34] Yu, W.H., Harvey, C.M. and Harvey, C.F. (2003) Arsenic in groundwater in Bangladesh: A geostatistical and epidemiol-ogical framework for evaluating health effects and potential remedies. Water Resources Research 39, 1146-1162.
Received: July 08, 2011 Accepted: September 12, 2011 CORRESPONDING AUTHOR
Beicheng Xia School of Environmental Science and Engineering Sun Yat-Sen University 510275 Guangzhou P.R. CHINA Phone: +86 20 8411 4591 Fax: +86 20 8411 0267 E-mail: [email protected]
FEB/ Vol 21/ No 3a/ 2012 – pages 695 – 703
© by PSP Volume 21 – No 3a. 2012 Fresenius Environmental Bulletin
704
MICROBIAL PRODUCTION OF POLY-Β-HYDROXYBUTYRATE (PHB) BY
BACILLUS MEGATERIUM STRAINS ISOLATED FROM ROOT NODULES OF DIFFERENT FLOWERING PLANTS IN TURKEY
Esra Ersoy Omeroglu*, Figen Ozyildiz and Ismail Karaboz
Ege University, Faculty of Science, Biology Department, Basic and Industrial Microbiology Section, 35100 Bornova-Izmir, Turkey
ABSTRACT
The aim of this research was the isolation and identi-fication of 5 strains achieved from root nodules of differ-ent flowering plants (Vicia sp., Phaeseolus vulgaris, Pisum sativum, Vicia faba), and the determination of poly-β-hydroxybutyrate (PHB) efficiency of the isolates on dif-ferent media conditions. Results of our experiments showed that the strains were Bacillus megaterium based on cultural, biochemical and 16S rRNA sequencing methods and VITEK2 system. The amounts and yield of PHB (%) pro-duced by B. megaterium strains were also determined by use of spectrophotometric method. Consequently, the high-est yields of PHB were obtained from strain 13/1 (83.82%) on yeast extract mannitol medium (YEM), strain 13/2 (87.50%) with glycin, and strains 13/1 (86.30%) and 2/a (82.03%) with glucose on YEM medium. For further ex-periments by using these bacteria, determination of less expensive substrates and industrial-scale PHB production will be necessary. For this purpose, B. megaterium strains 13/1, 13/2 and 2/a can be used.
KEYWORDS: Bacillus megaterium, poly-β-hydroxybutyrate (PHB), nodule, 16S rRNA, VITEK2 system
1. INTRODUCTION
Plastic products replace glass, wood and other con-structional materials, and become an dispensable part of everyday life. On the other hand, these plastics accumu-late in the environment year after year, and amounts of accumulation reach millions of tons [1]. Because of the fact that the plastic wastes are serious environmental contami-nants, use of biodegradable plastics come into prominence [2]. In spite of some desirable properties [1, 3], such as * Corresponding author
stability and durability [1, 4], petrochemical plastics can-not be degraded biologically. Consequently, the search for biodegradable polymers as an alternative to plastic in-creases [4].
There are a lot of biodegradable plastic materials. Among the candidates, polyhydroxyalkanoates (PHAs) have a growing interest because they have similar material properties with conventional plastics [4], can be produced from renewable resources, are complete biodegradable, and do not cause decrease of limited resources [4, 5].
PHAs are a broad class of biodegradable thermoplas-tics. In addition to approximately 150 hydroxyalkonoic acids, poly-β-hydroxybutyrate (PHB) is one of the constitu-ents of PHAs [5]. PHB is accumulated by over 250 different bacteria (many Gram-negative and Gram-positive ones) [4, 6] which synthesize and accumulate PHB under unfa-vorable growth conditions such as limitation of phospho-rus, oxygen, nitrogen and magnesium in the presence of abundant carbon sources [1, 4, 7]. Under these conditions, bacteria can improve tolerance to high temperatures, H2O2 exposure, UV-irradiation, drying and osmotic stress, and can survive [8]. Some bacteria can accumulate PHB within the cells in high amounts (80-90% of dry cell weight) [9, 10]. Bacillus megaterium is one of the members of PHB-producing microorganisms. Habitat of B. megaterium strains is generally soil and can colonize the rhizosphere because of the fact that it is a member of rhizospheric and endophytic microbial community [11, 12].
Lemoigne [13] found 3-hyroxybutyric acid as a result of degradation of an unknown material in B. megaterium isolated from soil. In 1983, Findlay and White [14] ob-served that PHB was accumulated in B. megaterium cells under nutrient stress.
The objective of this study was to determine the abil-ity of PHB production of rhizospheric bacteria isolated from Vicia sp., Phaseolus vulgaris, Pisum sativum and Vicia faba. Additionally, cultural, biochemical and molecular methods should be identified to indicate the yields of
© by PSP Volume 21 – No 3a. 2012 Fresenius Environmental Bulletin
705
PHB (%) of identified cultures. In this respect, we isolated 5 PHB-accumulating bacteria, and the isolates were iden-tified as Bacillus megaterium depending on antimicrobial susceptibility, microscopic characteristics, tolerance of pH, temperature and different concentrations of NaCl and 16S rRNA sequencing analysis. In addition, for analyzing the highest yielding PHB medium, different carbon sources and nitrogen sources were tested.
2. MATERIALS AND METHODS
2.1. Isolation and cultivation of endophytic and PHB-producing bacteria
To isolate endophytic bacteria from cultivated plants (Phaseolus vulgaris, Pisum sativum, Vicia faba) and a wilding one (Vicia sp.) collected from different regions of Izmir in Turkey (Table 1), nodules on the plants were washed with tap water. A few nodules with epidermis and cortex region of the plants were taken by a sterile scalpel and washed in a Petri dish with sterile distilled water. Nodules were kept in a Petri dish containing 95% ethanol for 30 sec, and then for 3-4 min depending on size of the nodules in acidifying HgCl2 (0.1%) for surface steriliza-tion of nodules. These steps were followed by 10 rinses in sterile tap water for disinfection of nodules from residual HgCl2. Finally, 4 or 5 drops of tap water were transferred to a Petri dish, and nodules were crushed by glass ba-guettes in it. The crushed nodules were streaked onto Petri dishes containing solid yeast extract mannitol agar me-dium (YEMA) consisting of 10 g mannitol, 0.5 g KH2PO4, 0.2 g MgSO4.7H2O, 0.1 g NaCl, 2.5 g tryptone, 2.5 g pep-tone, 2.5 g yeast extract per L, and the pH was adjusted to 7.0 with NaOH. All experiments were performed with YEMA. The plates were incubated at 30 oC and observed daily for bacterial colony development during 24 and 72 h. After bacterial growth had occurred, colonies were puri-fied by a number of streakings on YEMA [15]. Purified isolates were suspended in 20% glycerol solution and stored at -70 oC [11].
2.2. Microscopic characteristics
Gram reactions, morphologies, capsule formations and endospore generations were determined by light micros-copy as described by Atlas et al. [16, 17]. In addition to endospore-staining method, to determine whether the iso-lates generate endospores, bacterial suspensions were ex-posed to 80 oC for 20 min and then transferred to streak onto YEMA medium for incubation at 30 oC [18].
2.3. Physiological test for salt, acidity and temperature toler-ance
Growth ability of the isolates on different concentra-tions of NaCl (0-5% w/v) as well as different degrees of pH (4.0-9.0) and temperatures (27-45 oC) were tested by using YEMA medium [19]. The bacterial growth was determined with TTC, a growth indicator. TTC was added to the media in a ratio of 0.01% [20].
2.4. Determination of intrinsic antibiotic resistance profile
Four different antibiotic discs (ampicillin 10 µg/ml, tetracyclin 10 µg/ml, erythromycin 15 µg/ml, chloram-phenicol 30 µg/ml) were used for determination of anti-biotic susceptibility of the isolates against the antimicro-bial agents. Commercially available antibiotic discs were purchased from Oxoid (England). Fresh isolates cultured on YEMA medium were transferred to bi-distilled water containing 0.85% NaCl, and the turbidity equivalent was adjusted to 0.5 McFarland. Inoculation on YEMA me-dium was performed with 100 µl bacterial suspensions, and antibiotic discs were put onto Petri dishes. After 24-48 h incubation at 28 oC, the isolates were observed in terms of resistance profiles. In an assay performed with agar disc diffusion method, the inhibition zones were measured in mm using a transparent ruler [20, 21]. All procedures were based on the standardization of the agar disc diffusion method of The Clinical and Laboratory Standards Insti-tute (CLSI, 2008) [22] prepared for antimicrobial suscep-tibility tests.
2.5. Microbial identification by using VITEK 2 system
For this assay, VITEK 2 system (software version 04.02) was used according to the manufacturer’s recom-mendation. The test organisms were grown on YEMA me-dium at 30 oC for 24 h. Bacterial suspensions were pre-pared in sterile physiological saline and turbidity equiva-lents were regulated as 1.80-2.20 McFarland turbidity range. The samples prepared were filled into the BCL identifica-tion card, then placed into the incubator-reader of the VITEK 2 system, and final identification results were available within approximately 14 h [23].
2.6. 16S rRNA gene sequence determination
16S rRNA gene sequences of the isolates were de-termined using universal primers, and amplicons obtained from the isolates were sequenced on an ABI 3130XL Ge-netic Analyzer. For sequencing, BigDye Cycle Sequencing V.3.1 kit was used, and sequences were purified by NaOAc-EtOH purification method.
2.7. Staining of bacterial intracellular lipids
It is known that Sudan Black B is a specific fat stain for the detection of lipids. So, this staining can be used to distinguish between PHA-accumulating and non- accumu-lating strains. With a view to determine whether the endo-phytic isolates were accumulating microbial intracellular lipids, Sudan Black B stain was used. In this staining, the intracellular lipid droplets are observed as blue-black or blue-grey. Owing to stain bacterial cytoplasm, safranine was used as a contrast stain. So, cytoplasm will be stained light pink [24-26].
2.8. Dry cell weight estimation
Bacteria were grown on YEM broth at 30 oC for 24 h. Pre-cultured cells (OD600=1.0) were inoculated at 4% (v/v) into 250-ml flasks containing medium (50 ml), and
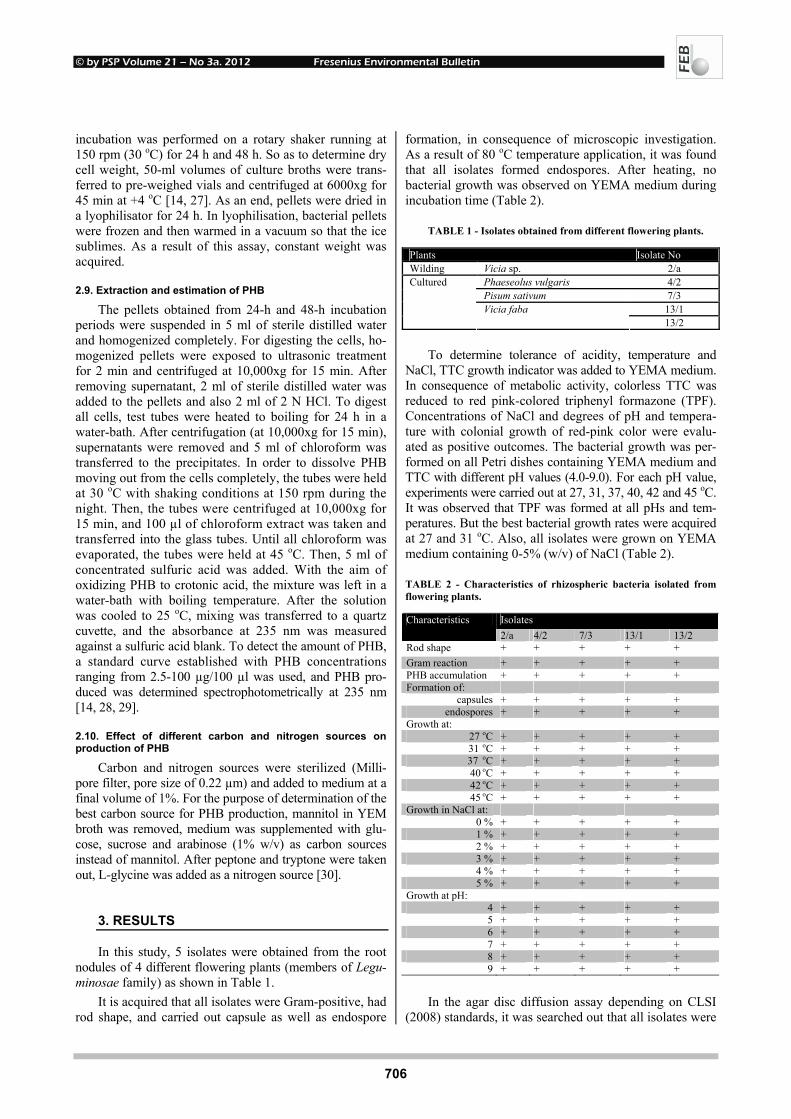
© by PSP Volume 21 – No 3a. 2012 Fresenius Environmental Bulletin
706
incubation was performed on a rotary shaker running at 150 rpm (30 oC) for 24 h and 48 h. So as to determine dry cell weight, 50-ml volumes of culture broths were trans-ferred to pre-weighed vials and centrifuged at 6000xg for 45 min at +4 oC [14, 27]. As an end, pellets were dried in a lyophilisator for 24 h. In lyophilisation, bacterial pellets were frozen and then warmed in a vacuum so that the ice sublimes. As a result of this assay, constant weight was acquired.
2.9. Extraction and estimation of PHB
The pellets obtained from 24-h and 48-h incubation periods were suspended in 5 ml of sterile distilled water and homogenized completely. For digesting the cells, ho-mogenized pellets were exposed to ultrasonic treatment for 2 min and centrifuged at 10,000xg for 15 min. After removing supernatant, 2 ml of sterile distilled water was added to the pellets and also 2 ml of 2 N HCl. To digest all cells, test tubes were heated to boiling for 24 h in a water-bath. After centrifugation (at 10,000xg for 15 min), supernatants were removed and 5 ml of chloroform was transferred to the precipitates. In order to dissolve PHB moving out from the cells completely, the tubes were held at 30 oC with shaking conditions at 150 rpm during the night. Then, the tubes were centrifuged at 10,000xg for 15 min, and 100 µl of chloroform extract was taken and transferred into the glass tubes. Until all chloroform was evaporated, the tubes were held at 45 oC. Then, 5 ml of concentrated sulfuric acid was added. With the aim of oxidizing PHB to crotonic acid, the mixture was left in a water-bath with boiling temperature. After the solution was cooled to 25 oC, mixing was transferred to a quartz cuvette, and the absorbance at 235 nm was measured against a sulfuric acid blank. To detect the amount of PHB, a standard curve established with PHB concentrations ranging from 2.5-100 µg/100 µl was used, and PHB pro-duced was determined spectrophotometrically at 235 nm [14, 28, 29].
2.10. Effect of different carbon and nitrogen sources on production of PHB
Carbon and nitrogen sources were sterilized (Milli-pore filter, pore size of 0.22 µm) and added to medium at a final volume of 1%. For the purpose of determination of the best carbon source for PHB production, mannitol in YEM broth was removed, medium was supplemented with glu-cose, sucrose and arabinose (1% w/v) as carbon sources instead of mannitol. After peptone and tryptone were taken out, L-glycine was added as a nitrogen source [30].
3. RESULTS
In this study, 5 isolates were obtained from the root nodules of 4 different flowering plants (members of Legu-minosae family) as shown in Table 1.
It is acquired that all isolates were Gram-positive, had rod shape, and carried out capsule as well as endospore
formation, in consequence of microscopic investigation. As a result of 80 oC temperature application, it was found that all isolates formed endospores. After heating, no bacterial growth was observed on YEMA medium during incubation time (Table 2).
TABLE 1 - Isolates obtained from different flowering plants.
Plants Isolate No Wilding Vicia sp. 2/a
Phaeseolus vulgaris 4/2 Pisum sativum 7/3
13/1
Cultured
Vicia faba 13/2
To determine tolerance of acidity, temperature and
NaCl, TTC growth indicator was added to YEMA medium. In consequence of metabolic activity, colorless TTC was reduced to red pink-colored triphenyl formazone (TPF). Concentrations of NaCl and degrees of pH and tempera-ture with colonial growth of red-pink color were evalu-ated as positive outcomes. The bacterial growth was per-formed on all Petri dishes containing YEMA medium and TTC with different pH values (4.0-9.0). For each pH value, experiments were carried out at 27, 31, 37, 40, 42 and 45 oC. It was observed that TPF was formed at all pHs and tem-peratures. But the best bacterial growth rates were acquired at 27 and 31 oC. Also, all isolates were grown on YEMA medium containing 0-5% (w/v) of NaCl (Table 2).
TABLE 2 - Characteristics of rhizospheric bacteria isolated from flowering plants.
Isolates Characteristics 2/a 4/2 7/3 13/1 13/2
Rod shape + + + + + Gram reaction + + + + + PHB accumulation + + + + + Formation of:
capsules + + + + + endospores + + + + +
Growth at: 27 oC + + + + + 31 oC + + + + + 37 oC + + + + + 40 oC + + + + + 42 oC + + + + + 45 oC + + + + +
Growth in NaCl at: 0 % + + + + + 1 % + + + + + 2 % + + + + + 3 % + + + + + 4 % + + + + + 5 % + + + + +
Growth at pH: 4 + + + + + 5 + + + + + 6 + + + + + 7 + + + + + 8 + + + + + 9 + + + + +
In the agar disc diffusion assay depending on CLSI
(2008) standards, it was searched out that all isolates were
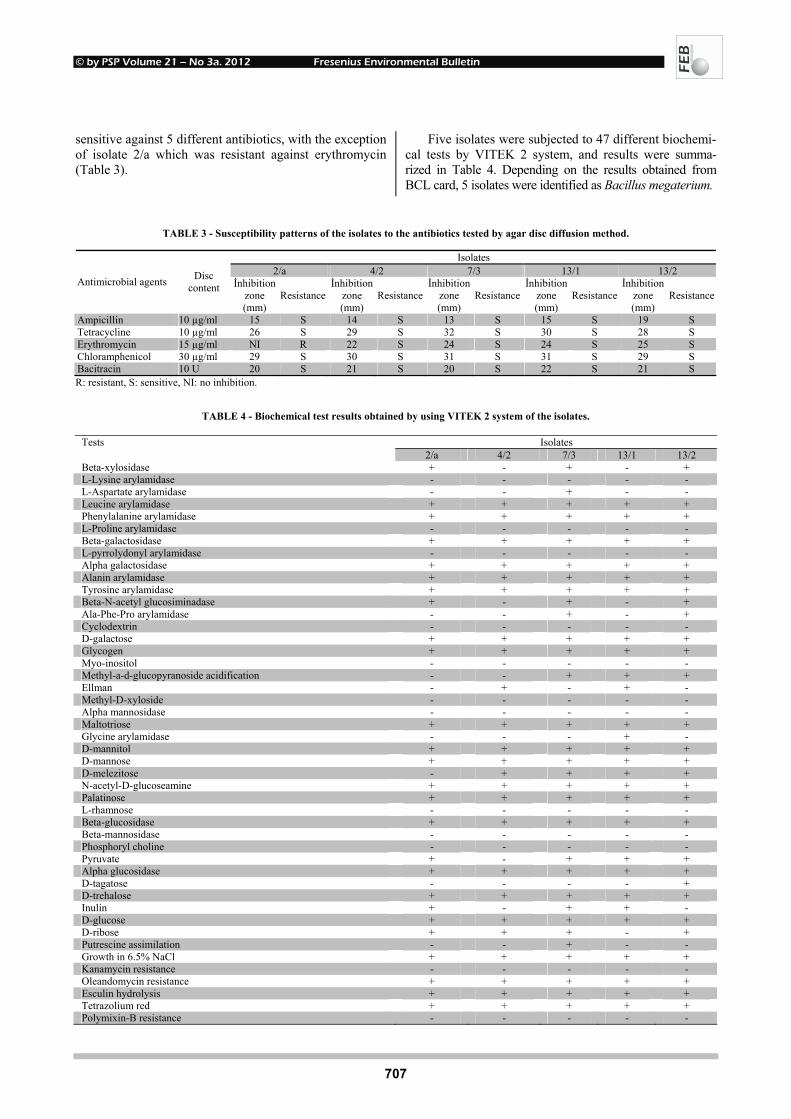
© by PSP Volume 21 – No 3a. 2012 Fresenius Environmental Bulletin
707
sensitive against 5 different antibiotics, with the exception of isolate 2/a which was resistant against erythromycin (Table 3).
Five isolates were subjected to 47 different biochemi-cal tests by VITEK 2 system, and results were summa-rized in Table 4. Depending on the results obtained from BCL card, 5 isolates were identified as Bacillus megaterium.
TABLE 3 - Susceptibility patterns of the isolates to the antibiotics tested by agar disc diffusion method.
Isolates 2/a 4/2 7/3 13/1 13/2
Antimicrobial agents Disc content İnhibition
zone (mm)
Resistance İnhibition
zone (mm)
Resistanceİnhibition
zone (mm)
Resistanceİnhibition
zone (mm)
Resistance İnhibition
zone (mm)
Resistance
Ampicillin 10 µg/ml 15 S 14 S 13 S 15 S 19 S Tetracycline 10 µg/ml 26 S 29 S 32 S 30 S 28 S Erythromycin 15 µg/ml NI R 22 S 24 S 24 S 25 S Chloramphenicol 30 µg/ml 29 S 30 S 31 S 31 S 29 S Bacitracin 10 U 20 S 21 S 20 S 22 S 21 S R: resistant, S: sensitive, NI: no inhibition.
TABLE 4 - Biochemical test results obtained by using VITEK 2 system of the isolates.
Isolates Tests 2/a 4/2 7/3 13/1 13/2
Beta-xylosidase + - + - + L-Lysine arylamidase - - - - - L-Aspartate arylamidase - - + - - Leucine arylamidase + + + + + Phenylalanine arylamidase + + + + + L-Proline arylamidase - - - - - Beta-galactosidase + + + + + L-pyrrolydonyl arylamidase - - - - - Alpha galactosidase + + + + + Alanin arylamidase + + + + + Tyrosine arylamidase + + + + + Beta-N-acetyl glucosiminadase + - + - + Ala-Phe-Pro arylamidase - - + - + Cyclodextrin - - - - - D-galactose + + + + + Glycogen + + + + + Myo-inositol - - - - - Methyl-a-d-glucopyranoside acidification - - + + + Ellman - + - + - Methyl-D-xyloside - - - - - Alpha mannosidase - - - - - Maltotriose + + + + + Glycine arylamidase - - - + - D-mannitol + + + + + D-mannose + + + + + D-melezitose - + + + + N-acetyl-D-glucoseamine + + + + + Palatinose + + + + + L-rhamnose - - - - - Beta-glucosidase + + + + + Beta-mannosidase - - - - - Phosphoryl choline - - - - - Pyruvate + - + + + Alpha glucosidase + + + + + D-tagatose - - - - + D-trehalose + + + + + Inulin + - + + - D-glucose + + + + + D-ribose + + + - + Putrescine assimilation - - + - - Growth in 6.5% NaCl + + + + + Kanamycin resistance - - - - - Oleandomycin resistance + + + + + Esculin hydrolysis + + + + + Tetrazolium red + + + + + Polymixin-B resistance - - - - -
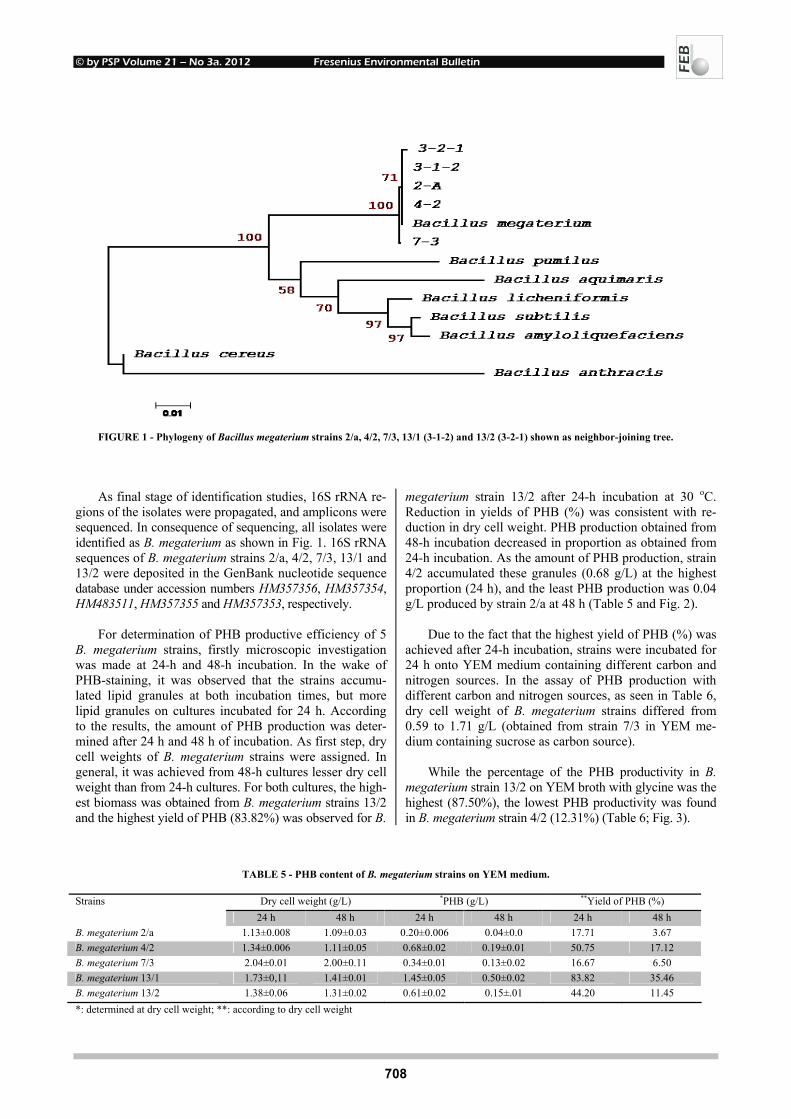
© by PSP Volume 21 – No 3a. 2012 Fresenius Environmental Bulletin
708
FIGURE 1 - Phylogeny of Bacillus megaterium strains 2/a, 4/2, 7/3, 13/1 (3-1-2) and 13/2 (3-2-1) shown as neighbor-joining tree. As final stage of identification studies, 16S rRNA re-
gions of the isolates were propagated, and amplicons were sequenced. In consequence of sequencing, all isolates were identified as B. megaterium as shown in Fig. 1. 16S rRNA sequences of B. megaterium strains 2/a, 4/2, 7/3, 13/1 and 13/2 were deposited in the GenBank nucleotide sequence database under accession numbers HM357356, HM357354, HM483511, HM357355 and HM357353, respectively.
For determination of PHB productive efficiency of 5
B. megaterium strains, firstly microscopic investigation was made at 24-h and 48-h incubation. In the wake of PHB-staining, it was observed that the strains accumu-lated lipid granules at both incubation times, but more lipid granules on cultures incubated for 24 h. According to the results, the amount of PHB production was deter-mined after 24 h and 48 h of incubation. As first step, dry cell weights of B. megaterium strains were assigned. In general, it was achieved from 48-h cultures lesser dry cell weight than from 24-h cultures. For both cultures, the high-est biomass was obtained from B. megaterium strains 13/2 and the highest yield of PHB (83.82%) was observed for B.
megaterium strain 13/2 after 24-h incubation at 30 oC. Reduction in yields of PHB (%) was consistent with re-duction in dry cell weight. PHB production obtained from 48-h incubation decreased in proportion as obtained from 24-h incubation. As the amount of PHB production, strain 4/2 accumulated these granules (0.68 g/L) at the highest proportion (24 h), and the least PHB production was 0.04 g/L produced by strain 2/a at 48 h (Table 5 and Fig. 2).
Due to the fact that the highest yield of PHB (%) was
achieved after 24-h incubation, strains were incubated for 24 h onto YEM medium containing different carbon and nitrogen sources. In the assay of PHB production with different carbon and nitrogen sources, as seen in Table 6, dry cell weight of B. megaterium strains differed from 0.59 to 1.71 g/L (obtained from strain 7/3 in YEM me-dium containing sucrose as carbon source).
While the percentage of the PHB productivity in B.
megaterium strain 13/2 on YEM broth with glycine was the highest (87.50%), the lowest PHB productivity was found in B. megaterium strain 4/2 (12.31%) (Table 6; Fig. 3).
TABLE 5 - PHB content of B. megaterium strains on YEM medium.
Dry cell weight (g/L) *PHB (g/L) **Yield of PHB (%) Strains 24 h 48 h 24 h 48 h 24 h 48 h
B. megaterium 2/a 1.13±0.008 1.09±0.03 0.20±0.006 0.04±0.0 17.71 3.67 B. megaterium 4/2 1.34±0.006 1.11±0.05 0.68±0.02 0.19±0.01 50.75 17.12 B. megaterium 7/3 2.04±0.01 2.00±0.11 0.34±0.01 0.13±0.02 16.67 6.50 B. megaterium 13/1 1.73±0,11 1.41±0.01 1.45±0.05 0.50±0.02 83.82 35.46 B. megaterium 13/2 1.38±0.06 1.31±0.02 0.61±0.02 0.15±.01 44.20 11.45 *: determined at dry cell weight; **: according to dry cell weight
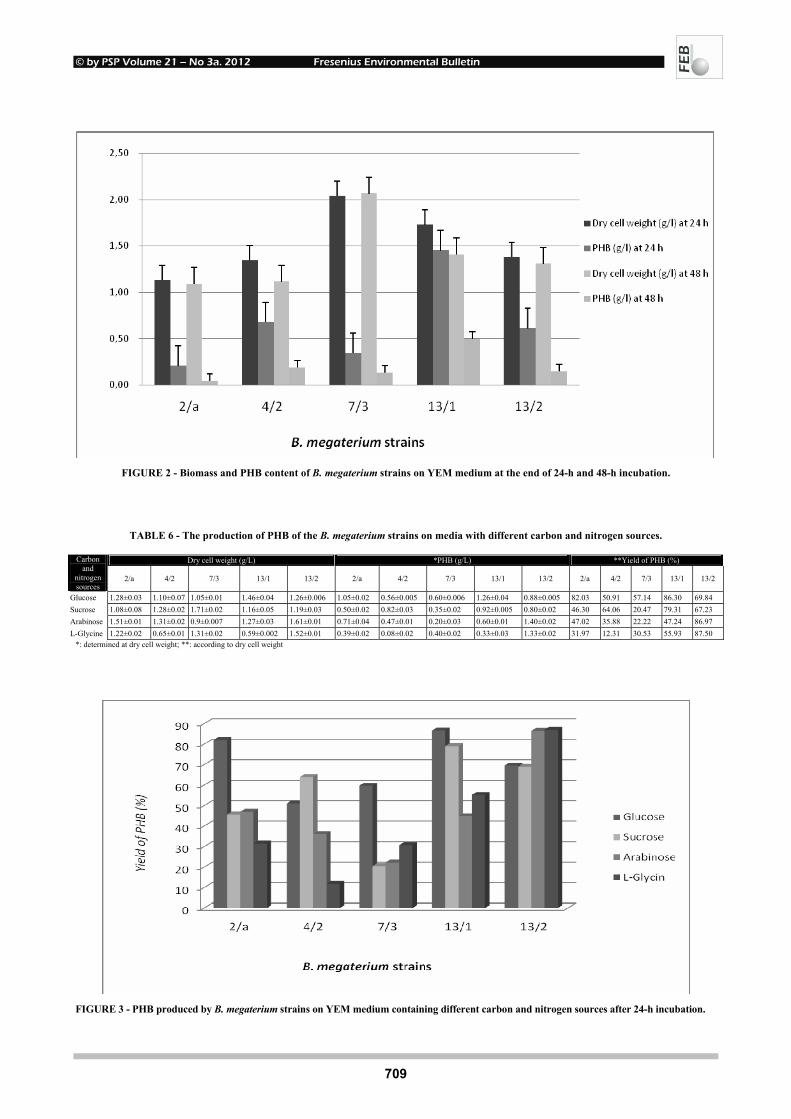
© by PSP Volume 21 – No 3a. 2012 Fresenius Environmental Bulletin
709
FIGURE 2 - Biomass and PHB content of B. megaterium strains on YEM medium at the end of 24-h and 48-h incubation.
TABLE 6 - The production of PHB of the B. megaterium strains on media with different carbon and nitrogen sources.
Dry cell weight (g/L) *PHB (g/L) **Yield of PHB (%) Carbon and
nitrogen sources
2/a 4/2 7/3 13/1 13/2 2/a 4/2 7/3 13/1 13/2 2/a 4/2 7/3 13/1 13/2
Glucose 1.28±0.03 1.10±0.07 1.05±0.01 1.46±0.04 1.26±0.006 1.05±0.02 0.56±0.005 0.60±0.006 1.26±0.04 0.88±0.005 82.03 50.91 57.14 86.30 69.84 Sucrose 1.08±0.08 1.28±0.02 1.71±0.02 1.16±0.05 1.19±0.03 0.50±0.02 0.82±0.03 0.35±0.02 0.92±0.005 0.80±0.02 46.30 64.06 20.47 79.31 67.23 Arabinose 1.51±0.01 1.31±0.02 0.9±0.007 1.27±0.03 1.61±0.01 0.71±0.04 0.47±0.01 0.20±0.03 0.60±0.01 1.40±0.02 47.02 35.88 22.22 47.24 86.97 L-Glycine 1.22±0.02 0.65±0.01 1.31±0.02 0.59±0.002 1.52±0.01 0.39±0.02 0.08±0.02 0.40±0.02 0.33±0.03 1.33±0.02 31.97 12.31 30.53 55.93 87.50
*: determined at dry cell weight; **: according to dry cell weight
FIGURE 3 - PHB produced by B. megaterium strains on YEM medium containing different carbon and nitrogen sources after 24-h incubation.
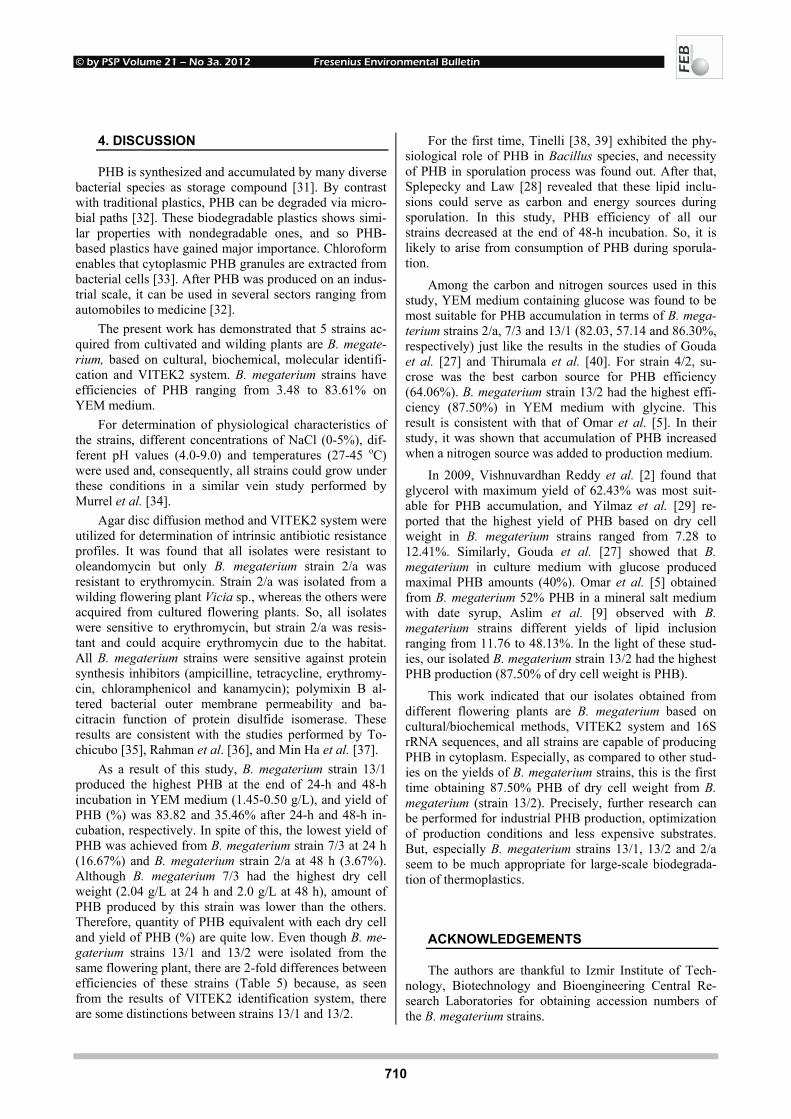
© by PSP Volume 21 – No 3a. 2012 Fresenius Environmental Bulletin
710
4. DISCUSSION
PHB is synthesized and accumulated by many diverse bacterial species as storage compound [31]. By contrast with traditional plastics, PHB can be degraded via micro-bial paths [32]. These biodegradable plastics shows simi-lar properties with nondegradable ones, and so PHB-based plastics have gained major importance. Chloroform enables that cytoplasmic PHB granules are extracted from bacterial cells [33]. After PHB was produced on an indus-trial scale, it can be used in several sectors ranging from automobiles to medicine [32].
The present work has demonstrated that 5 strains ac-quired from cultivated and wilding plants are B. megate-rium, based on cultural, biochemical, molecular identifi-cation and VITEK2 system. B. megaterium strains have efficiencies of PHB ranging from 3.48 to 83.61% on YEM medium.
For determination of physiological characteristics of the strains, different concentrations of NaCl (0-5%), dif-ferent pH values (4.0-9.0) and temperatures (27-45 oC) were used and, consequently, all strains could grow under these conditions in a similar vein study performed by Murrel et al. [34].
Agar disc diffusion method and VITEK2 system were utilized for determination of intrinsic antibiotic resistance profiles. It was found that all isolates were resistant to oleandomycin but only B. megaterium strain 2/a was resistant to erythromycin. Strain 2/a was isolated from a wilding flowering plant Vicia sp., whereas the others were acquired from cultured flowering plants. So, all isolates were sensitive to erythromycin, but strain 2/a was resis-tant and could acquire erythromycin due to the habitat. All B. megaterium strains were sensitive against protein synthesis inhibitors (ampicilline, tetracycline, erythromy-cin, chloramphenicol and kanamycin); polymixin B al-tered bacterial outer membrane permeability and ba-citracin function of protein disulfide isomerase. These results are consistent with the studies performed by To-chicubo [35], Rahman et al. [36], and Min Ha et al. [37].
As a result of this study, B. megaterium strain 13/1 produced the highest PHB at the end of 24-h and 48-h incubation in YEM medium (1.45-0.50 g/L), and yield of PHB (%) was 83.82 and 35.46% after 24-h and 48-h in-cubation, respectively. In spite of this, the lowest yield of PHB was achieved from B. megaterium strain 7/3 at 24 h (16.67%) and B. megaterium strain 2/a at 48 h (3.67%). Although B. megaterium 7/3 had the highest dry cell weight (2.04 g/L at 24 h and 2.0 g/L at 48 h), amount of PHB produced by this strain was lower than the others. Therefore, quantity of PHB equivalent with each dry cell and yield of PHB (%) are quite low. Even though B. me-gaterium strains 13/1 and 13/2 were isolated from the same flowering plant, there are 2-fold differences between efficiencies of these strains (Table 5) because, as seen from the results of VITEK2 identification system, there are some distinctions between strains 13/1 and 13/2.
For the first time, Tinelli [38, 39] exhibited the phy-siological role of PHB in Bacillus species, and necessity of PHB in sporulation process was found out. After that, Splepecky and Law [28] revealed that these lipid inclu-sions could serve as carbon and energy sources during sporulation. In this study, PHB efficiency of all our strains decreased at the end of 48-h incubation. So, it is likely to arise from consumption of PHB during sporula-tion.
Among the carbon and nitrogen sources used in this study, YEM medium containing glucose was found to be most suitable for PHB accumulation in terms of B. mega-terium strains 2/a, 7/3 and 13/1 (82.03, 57.14 and 86.30%, respectively) just like the results in the studies of Gouda et al. [27] and Thirumala et al. [40]. For strain 4/2, su-crose was the best carbon source for PHB efficiency (64.06%). B. megaterium strain 13/2 had the highest effi-ciency (87.50%) in YEM medium with glycine. This result is consistent with that of Omar et al. [5]. In their study, it was shown that accumulation of PHB increased when a nitrogen source was added to production medium.
In 2009, Vishnuvardhan Reddy et al. [2] found that glycerol with maximum yield of 62.43% was most suit-able for PHB accumulation, and Yilmaz et al. [29] re-ported that the highest yield of PHB based on dry cell weight in B. megaterium strains ranged from 7.28 to 12.41%. Similarly, Gouda et al. [27] showed that B. megaterium in culture medium with glucose produced maximal PHB amounts (40%). Omar et al. [5] obtained from B. megaterium 52% PHB in a mineral salt medium with date syrup, Aslim et al. [9] observed with B. megaterium strains different yields of lipid inclusion ranging from 11.76 to 48.13%. In the light of these stud-ies, our isolated B. megaterium strain 13/2 had the highest PHB production (87.50% of dry cell weight is PHB).
This work indicated that our isolates obtained from different flowering plants are B. megaterium based on cultural/biochemical methods, VITEK2 system and 16S rRNA sequences, and all strains are capable of producing PHB in cytoplasm. Especially, as compared to other stud-ies on the yields of B. megaterium strains, this is the first time obtaining 87.50% PHB of dry cell weight from B. megaterium (strain 13/2). Precisely, further research can be performed for industrial PHB production, optimization of production conditions and less expensive substrates. But, especially B. megaterium strains 13/1, 13/2 and 2/a seem to be much appropriate for large-scale biodegrada-tion of thermoplastics.
ACKNOWLEDGEMENTS
The authors are thankful to Izmir Institute of Tech-nology, Biotechnology and Bioengineering Central Re-search Laboratories for obtaining accession numbers of the B. megaterium strains.
© by PSP Volume 21 – No 3a. 2012 Fresenius Environmental Bulletin
711
REFERENCES
[1] Mercan, N., Aslim, B., Yuksekdag, Z.N. and Beyatli, Y. (2002) Production of poly-β-hydroxybutyrate (PHB) by some Rhizobium bacteria. Turk J. Biol. 26, 215-219.
[2] Vishnuvardhan Reddy, S., Thirumala, M. and Mahmood, S.K. (2009) Production of PHB and P (3HB-co-3HV) bio-polymers by Bacillus megaterium strain OU303A isolated from municipal sewage sludge. World J. Microbiol. Biotech-nol. 25, 391-397.
[3] Thakur, P.S., Borah, B., Baruah, S.D. and Nigam, J.N. (2001) Growth-associated production of poly-β-hydroxy-butyrate by Bacillus mycoides. Folia Microbiol. 46, 488-494.
[4] Ojumu, T.V., Yu, J. and Solomon, B.O. (2004) Production of polyhydroxyalkanoates, a bacterial biodegradable polymer. Afr. J. Biotechnol. 3, 18-24.
[5] Omar, S., Rayes A., Eqaab, A., Vob, A. and Steinbüchel, A. (2001) Optimizaiton of cell growth and poly(3-hydroxybutyrate) accumulation on date syrup by a Bacillus megaterium strain. Biotechnol. Lett. 23, 1119-1123.
[6] Sun, W., Cao, J.G., Teng, K. and Meighen, E.A. (1994) Bio-synthesis of poly-3-hydroxybutyrate in the luminescent bac-terium, Vibrio harveyi, and regulation by the lux autoinducer, N-(3-hydroxybutanoyl) homoserine lactone. The Journal of Biological Chemistry 269, 20785-20790.
[7] Lee, S.Y. (1996) Bacterial polyhydroxyakanoates. Biotech-nol. Bioeng. 49, 1-14.
[8] Ratcliff, W.C., Kadam, S.V. and Denison, R.F. (2008) Poly-3-hydroxybutyrate (PHB) supports survival and reproduction in starving rhizobia. FEMS Microbiol. Ecol. 65, 391-399.
[9] Aslim, B., Yuksekdag, Z.N. and Beyatli, Y. (2002b) Deter-mination of PHB growth quantities of certain Bacillus spe-cies isolated from soil. Turk Elect. J. Biotechnol. Special Is-sue 24-30.
[10] Beyatli, Y., Aslim, B., Katircioglu, H. and Yuksekdag, Z.N. (2006) Determination of PHB production in different growth medium by Cyanobacteria. Pakistan J. Biol. Sci. 9, 45-47.
[11] Dias, A.C.F., Costa, F.E.C., Andreote, F.D., Lacava, P.T., Teixeira, M.A., Assumpcao, L.C., Araujo, W.L., Azevedo, J.L. and Melo, I.S. (2009) Isolation of micropropagated strawberry endophytic bacteria and assessment of their poten-tial for plant growth promotion. World J. Microbiol. Biotech-nol. 25, 189-195.
[12] Aslim, B., Saglam, N. and Beyatli, Y. (2002a) Determination of some properties of Bacillus isolated from soil. Turk J. Bi-ol. 26, 41-48.
[13] Braunegg, G., Lefebvre, G. and Genser, K.L. (1998) Polyhy-droxyalaknoates, biopolyesters from renewable resources: physiological and engineering aspects. J. Biotechnol. 65, 127-161.
[14] Katircioglu, H., Aslim, B., Yuksekdag, Z.N., Mercan, N. and Beyatlı, Y. (2003) Production of poly-β-hydroxybutyrate (PHB) and differentiation of putative Bacillus mutant strains by SDS-PAGE of total cell protein. Afr. J. Biotechnol. 6, 147-149.
[15] Vincent, J.M. (1970) A manuel fort he practical study of the root nodule bacteria. I.B.P. Handbook No.15.7 Merylebone Road, London NWI.
[16] Atlas, R.M., Parks, L.C. and Brown, A.E. (1995a) Micros-copy observing microorganisms. In: Fishback, J.E. (Ed.) Laboratory manual of experimental microbiology. Mosby-Year Book Inc, St. Lois, Missouri, pp. 45-54.
[17] Atlas, R.M., Parks, L.C. and Brown, A.E. (1995b) Staining microorganisms. In: Fishback, J.E. (Ed.) Laboratory manual of experimental microbiology. Mosby-Year Book Inc, St. Lois, Missouri, pp. 65-76.
[18] Knaysi, G. (1964) Effects of temperatures above the maxi-mum for germination on the endospore of Bacillus cereus. J. Bacteriol. 87, 1129-1136.
[19] Kucuk, C., Kivanc, M. and Kinaci, E. (2006) Characteriza-tion of Rhizobium sp. isolated from bean. Turk J. Biol. 30, 127-132.
[20] Ersoy Omeroglu, E., Karaboz, I. and Sukatar, A. (2009) In vitro susceptibility of anibiotics against bioluminescent Vi-brio harveyi TEMO5 and TEMS1 isolated from Holothuria tubulosa and seawater. Fresen. Environ. Bull. 11, 2023-2028.
[21] Singh, B., Kaur, R. and Singh, K. (2008) Characterization of Rhizobium strain isolated from the roots of Trigonella foe-numgraceum (fenugreek). Afr. J. Biotechnol. 7, 3671-3676.
[22] CLSI, The Clinical and Laboratory Standards Institute. (2008) Performance standarts for antimicrobial susceptibility testing; eighteenth ınformational supplement. CLSI docu-ment M100-S18. Clinical and Laboratory Standarts Institute, Wayne.
[23] Kobayashi, I., Muraoka, H., Iyoda, T., Nishida, M., Hase-gawa, M. and Yamaguchi, K. (2004) Antimicrobial suscepti-bility testing of vancomycin-resistant Enterococcus by the VITEK’ system, and comparison with two NCCLS reference methods. J. Med. Microbiol. 53, 1229-1232.
[24] Hartman, T.L. (1940) The use of sudan black B as a bacterial fat stain. Stain Technology 15, 23-27.
[25] Khanafari, A., Akhavan Sepahei, A. and Mogharab, M. (2006) Production and recovery of poly-β-hydroxybutyrate from whey degradation by Azotobacter. Iran J. Environ. Health Sci. Eng. 3, 193-198.
[26] Spiekermann, P., Rehm, B.H.A., Kalscheuer, R., Baumeister, D. and Steinbüchel, A. (1999) A sensitive, viable-colony staining method using nile red for direct screening of bacteria that accumulate polyhydroxyalcanoic acids and other lipid storage compounds. Arch. Microbiol. 171, 73-80.
[27] Gouda, M., Swellam, A.E. and Omar, S.H. (2001) Production of PHB by a Bacillus megaterium strain using sugarcane mo-lasses and corn steep liquor as sole carbon and nitrogen sources. Microbol. Res. 156, 201-207.
[28] Slepecky, R.A., and Law, J.H. (1960) Synthesis and degrada-tion of poly-β-hydroxybutyric acid in connection with sporu-lation of Bacillus megaterium. Bacteriol. 82, 37-42.
[29] Yilmaz, M., Soran, H. and Beyatli, Y. (2005) Determination of poly-β-hydroxybutyrate (PHB) production by some Bacil-lus sp. World J. Microbiol. Biotechnol. 21, 565-566.
[30] Kaynar, P., and Beyatli, Y. (2009) Dtermination of poly-β-hydroxybutyrate production by Bacillus spp. isolated from the intestines of various fishes. Fish Sci. 75, 439-443.
[31] Griebel, R., Smith, Z. and Merrick, J.M. (1968) Metobolism of poly-β-hydroxybutyrate. I.purification, composition, and properties of native poly-β-hydroxybutyrate granules from Bacillus megaterium. Biochem. 7, 3676-3681.

© by PSP Volume 21 – No 3a. 2012 Fresenius Environmental Bulletin
712
[32] Reddy, C.S.K., Ghai, R., Rashmi, and Kalia, V.C. (2003) Po-lyhydroxyalkanoates: an overview. Bioresource Technol. 87, 137-146.
[33] Madison, L.L., and Huisman, G.W. (1999) Metabolic engi-neering of poly (3-hydroxyalkanoates): from DNA to plastic. Microbiol. Mol. Biol. Rev. 63, 21-53.
[34] Murrel, W.G., and Rankie, B.C. (1979) Isolation and identifi-cation of a sporing Bacillus from bottled brandy. Am. J. Enol. Vitic 30, 247-249.
[35] Tochikubo, K. (1978) Outgrowth and vegetative growth inhi-bition of Bacillus subtilis spores after transient exposure to polymixin B. J. Bacteriol. 134, 680-682.
[36] Rahman, M.U., Gul, S. and Odhano, E.A. (2008) Antimicro-bial activities of Ferula assafoetide oil against gram positive and gram negative bacteria. American-Eurasian J. Agric. & Environ. Sci. 4, 203-206.
[37] Min Ha, Y., Park, Y.H. and Kim, Y.J. (2002) A taxonomic study of Bacillus sp. isolated from Korean salt-fermented an-chovy. Molecular Biology Today 3, 25-29.
[38] Tinelli, R. 1955(a) Etude de la biochimie de la sporulation chez Bacillus megaterium. I. Composition des spores otbe-nues par carence des differents substrats carbones. Ann. Inst. Pasteur 88, 212-226.
[39] Tinelli, R. 1955(b) Etude de la biochime de la sporulation chez Bacillus megaterium. II. Modifications biochimiques et echanges gazeux accompagnant la sporulation provoquee par carence de glucose. Ann. Inst. Pasteur 88, 364-375.
[40] Thirumala, M., Vishnuvardhan Reddy, S. and Mahmood, S.K. (2010) Production and characterization of PHB two novel strains of Bacillus spp. isolated from soil and activated sludge. J. Ind. Microbiol. Biotechnol. 37, 271-278.
Received: July 22, 2011 Revised: October 19, 2011 Accepted: November 10, 2011 CORRESPONDING AUTHOR
Esra Ersoy Omeroglu Ege University Faculty of Science Biology Department Basic and Industrial Microbiology Section 35100 Bornova-Izmir TURKEY Phone: +90 2323112811 Fax: +90 2323881036 E-mail: [email protected]
FEB/ Vol 21/ No 3a/ 2012 – pages 704 – 712
© by PSP Volume 21 – No 3a. 2012 Fresenius Environmental Bulletin
713
SIMULTANEOUS SORPTION OF PHOSPHATE AND ARSENATE BY RED MUDS (A BAUXITE ORE PROCESSING WASTE)
Paola Castaldi*, Margherita Silvetti, Giovanni Garau, and Salvatore Deiana
Dipartimento di Scienze Ambientali Agrarie e Biotecnologie Agro-Alimentari, Sez. Chimica Agraria ed Ambientale ,University of Sassari, Viale Italia 39, 07100 Sassari, Italy
ABSTRACT
In the present work we investigated the interactions established between red mud (RM, a bauxite ore residue), arsenate and phosphate anions at pH 4.0, 7.0 and 10.0, through adsorption isotherms, FT-IR spectroscopy and thermal analysis. RM samples were artificially enriched with solutions containing increasing concentrations of As(V) and P(V) [As,P-RM]. The sorption of anions was higher at lower pH values and followed the order: RM-pH 4.0 [As(V) 0.669 mmol·g-1; P(V) 1.056 mmol·g-1]> RM-pH 7.0 [As(V) 0.537 mmol·g-1; P(V) 0.857 mmol·g-1]> RM-pH 10.0 [As(V) 0.154 mmol·g-1; P(V) 0.336]. The lower sorption of arsenate compared to phosphate could be due to a higher affinity of phosphate towards the RM sorp-tion sites, despite the similar chemistry of the two anions. The sorption of As(V) and P(V) was highlighted in the FT-IR spectra by a band at 865 and 1114 cm−1 respectively. These peaks were likely due to As-O(H) and P-O(H) stretch-ing-modes associated to inner-sphere complexes of arse-nate and phosphate on Fe-Al phases. Thermal analysis showed that the sorption of anions increased the stability of RM. The results obtained highlighted that phosphate and arsenate, although with different reactivity, were strongly bounded to some RM phases, such as gibbsite and hema-tite, through a chemical sorption.
KEYWORDS: Red mud; Arsenate; Phosphate; Adsorption capac-ity; FT-IR spectroscopy; Thermal analysis.
1. INTRODUCTION
Arsenic is an extremely toxic element for living or-ganisms. It is present in all natural environments (soils, sediments, groundwaters, and surface waters) due to natu-ral processes and anthropogenic activities [1, 2]. Arsenate [As(V)] and arsenite [As(III)] are the two main forms of As commonly found in soils, sediments and waters [3]. Arse- * Corresponding author
nate generally predominates under oxidising conditions, whereas As(III) occurs when conditions become suffi-ciently reducing [4, 5].
In soil pore water, at pH values between 4.0-9.5, ar-senic can be mainly found as arsenious acid (H3AsO3), arsenite (H2AsO3
-) and oxyanion of arsenic acid (arsenate: H2AsO4
-, HAsO42- and AsO4
3-). Arsenate and arsenite can be sorbed by the soil mineral surfaces, especially by iron and aluminum oxides and hydroxides, which are impor-tant As-controlling soil constituents able to form inner-sphere complexes with arsenic at acidic and near-neutral pH conditions [2, 3, 5, 6].
Several methods are currently available for removing arsenate from soil including metalloid precipitation, co-agulation, as well as adsorption and ion exchange reactions [7]. Among these latter strategies, As adsorption seems particularly promising [5, 6, 8]. The effectiveness of ad-sorption reactions is influenced by a number of variables, including pH, redox potential, temperature, ionic strength, and in particular by the presence of competing ions such as phosphate [e.g. 5]. Phosphate and arsenate form chemical species with similar properties and both anions in soil can therefore compete for the same adsorption sites located mainly on Al/Fe oxide surfaces [5, 9-13]. This competi-tion between arsenate and phosphate for the adsorption sites on mineral surfaces has the potential to influence As mobility and bioavailability in the soil environment. Some recent studies seem to support this view. For example, Zhang and Selim [8] showed that the application of phos-phorus fertilizer to agricultural soils can result in the re-lease of As already sorbed in the soil matrix.
Many studies have been devoted to the study of ad-sorbents with As-immobilising capacities. In particular, granular-activated alumina [7], Fe/Al/Mn oxides and hydroxides [10,14,15], activated carbon [16], granular-activated carbon impregnated with ferrous chloride [17], and some industrial by-products such as red mud [5, 6, 18-21], have been evaluated among the others. Red muds (RM), fine-textured residues deriving from the digestion of bauxite during the Bayer process, are probably one of the most promising adsorbents amid the latter. RM are mainly constituted by Fe, Al, Si and Ti oxides and oxy-
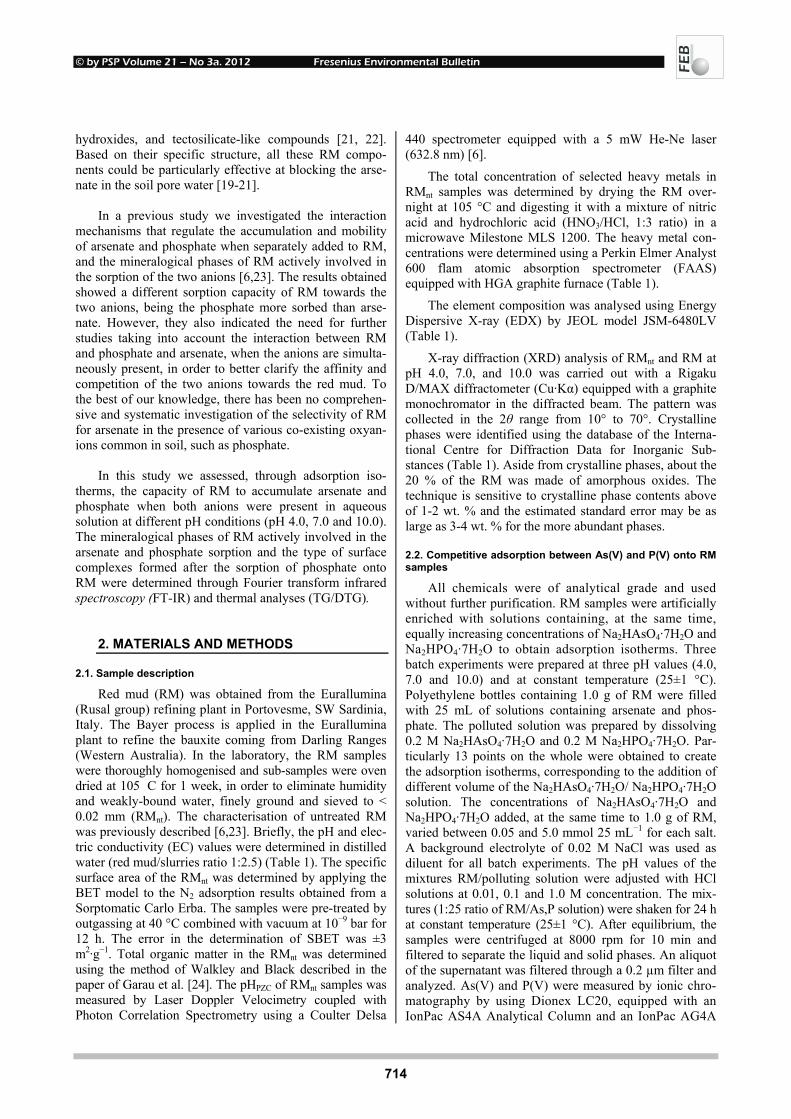
© by PSP Volume 21 – No 3a. 2012 Fresenius Environmental Bulletin
714
hydroxides, and tectosilicate-like compounds [21, 22]. Based on their specific structure, all these RM compo-nents could be particularly effective at blocking the arse-nate in the soil pore water [19-21].
In a previous study we investigated the interaction
mechanisms that regulate the accumulation and mobility of arsenate and phosphate when separately added to RM, and the mineralogical phases of RM actively involved in the sorption of the two anions [6,23]. The results obtained showed a different sorption capacity of RM towards the two anions, being the phosphate more sorbed than arse-nate. However, they also indicated the need for further studies taking into account the interaction between RM and phosphate and arsenate, when the anions are simulta-neously present, in order to better clarify the affinity and competition of the two anions towards the red mud. To the best of our knowledge, there has been no comprehen-sive and systematic investigation of the selectivity of RM for arsenate in the presence of various co-existing oxyan-ions common in soil, such as phosphate.
In this study we assessed, through adsorption iso-
therms, the capacity of RM to accumulate arsenate and phosphate when both anions were present in aqueous solution at different pH conditions (pH 4.0, 7.0 and 10.0). The mineralogical phases of RM actively involved in the arsenate and phosphate sorption and the type of surface complexes formed after the sorption of phosphate onto RM were determined through Fourier transform infrared spectroscopy (FT-IR) and thermal analyses (TG/DTG).
2. MATERIALS AND METHODS
2.1. Sample description
Red mud (RM) was obtained from the Eurallumina (Rusal group) refining plant in Portovesme, SW Sardinia, Italy. The Bayer process is applied in the Eurallumina plant to refine the bauxite coming from Darling Ranges (Western Australia). In the laboratory, the RM samples were thoroughly homogenised and sub-samples were oven dried at 105 C for 1 week, in order to eliminate humidity and weakly-bound water, finely ground and sieved to < 0.02 mm (RMnt). The characterisation of untreated RM was previously described [6,23]. Briefly, the pH and elec-tric conductivity (EC) values were determined in distilled water (red mud/slurries ratio 1:2.5) (Table 1). The specific surface area of the RMnt was determined by applying the BET model to the N2 adsorption results obtained from a Sorptomatic Carlo Erba. The samples were pre-treated by outgassing at 40 °C combined with vacuum at 10−9 bar for 12 h. The error in the determination of SBET was ±3 m2·g−1. Total organic matter in the RMnt was determined using the method of Walkley and Black described in the paper of Garau et al. [24]. The pHPZC of RMnt samples was measured by Laser Doppler Velocimetry coupled with Photon Correlation Spectrometry using a Coulter Delsa
440 spectrometer equipped with a 5 mW He-Ne laser (632.8 nm) [6].
The total concentration of selected heavy metals in RMnt samples was determined by drying the RM over-night at 105 °C and digesting it with a mixture of nitric acid and hydrochloric acid (HNO3/HCl, 1:3 ratio) in a microwave Milestone MLS 1200. The heavy metal con-centrations were determined using a Perkin Elmer Analyst 600 flam atomic absorption spectrometer (FAAS) equipped with HGA graphite furnace (Table 1).
The element composition was analysed using Energy Dispersive X-ray (EDX) by JEOL model JSM-6480LV (Table 1).
X-ray diffraction (XRD) analysis of RMnt and RM at pH 4.0, 7.0, and 10.0 was carried out with a Rigaku D/MAX diffractometer (Cu·Kα) equipped with a graphite monochromator in the diffracted beam. The pattern was collected in the 2θ range from 10° to 70°. Crystalline phases were identified using the database of the Interna-tional Centre for Diffraction Data for Inorganic Sub-stances (Table 1). Aside from crystalline phases, about the 20 % of the RM was made of amorphous oxides. The technique is sensitive to crystalline phase contents above of 1-2 wt. % and the estimated standard error may be as large as 3-4 wt. % for the more abundant phases.
2.2. Competitive adsorption between As(V) and P(V) onto RM samples
All chemicals were of analytical grade and used without further purification. RM samples were artificially enriched with solutions containing, at the same time, equally increasing concentrations of Na2HAsO4·7H2O and Na2HPO4·7H2O to obtain adsorption isotherms. Three batch experiments were prepared at three pH values (4.0, 7.0 and 10.0) and at constant temperature (25±1 °C). Polyethylene bottles containing 1.0 g of RM were filled with 25 mL of solutions containing arsenate and phos-phate. The polluted solution was prepared by dissolving 0.2 M Na2HAsO4·7H2O and 0.2 M Na2HPO4·7H2O. Par-ticularly 13 points on the whole were obtained to create the adsorption isotherms, corresponding to the addition of different volume of the Na2HAsO4·7H2O/ Na2HPO4·7H2O solution. The concentrations of Na2HAsO4·7H2O and Na2HPO4·7H2O added, at the same time to 1.0 g of RM, varied between 0.05 and 5.0 mmol 25 mL−1 for each salt. A background electrolyte of 0.02 M NaCl was used as diluent for all batch experiments. The pH values of the mixtures RM/polluting solution were adjusted with HCl solutions at 0.01, 0.1 and 1.0 M concentration. The mix-tures (1:25 ratio of RM/As,P solution) were shaken for 24 h at constant temperature (25±1 °C). After equilibrium, the samples were centrifuged at 8000 rpm for 10 min and filtered to separate the liquid and solid phases. An aliquot of the supernatant was filtered through a 0.2 µm filter and analyzed. As(V) and P(V) were measured by ionic chro-matography by using Dionex LC20, equipped with an IonPac AS4A Analytical Column and an IonPac AG4A
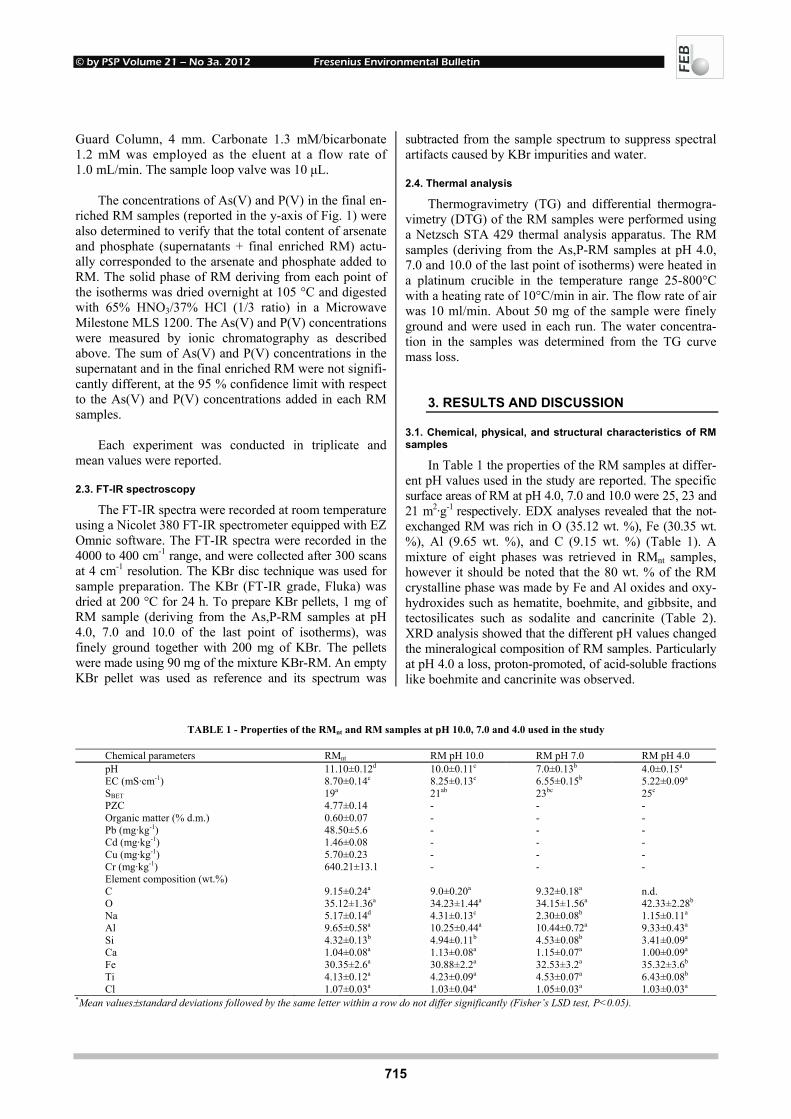
© by PSP Volume 21 – No 3a. 2012 Fresenius Environmental Bulletin
715
Guard Column, 4 mm. Carbonate 1.3 mM/bicarbonate 1.2 mM was employed as the eluent at a flow rate of 1.0 mL/min. The sample loop valve was 10 µL.
The concentrations of As(V) and P(V) in the final en-
riched RM samples (reported in the y-axis of Fig. 1) were also determined to verify that the total content of arsenate and phosphate (supernatants + final enriched RM) actu-ally corresponded to the arsenate and phosphate added to RM. The solid phase of RM deriving from each point of the isotherms was dried overnight at 105 °C and digested with 65% HNO3/37% HCl (1/3 ratio) in a Microwave Milestone MLS 1200. The As(V) and P(V) concentrations were measured by ionic chromatography as described above. The sum of As(V) and P(V) concentrations in the supernatant and in the final enriched RM were not signifi-cantly different, at the 95 % confidence limit with respect to the As(V) and P(V) concentrations added in each RM samples.
Each experiment was conducted in triplicate and
mean values were reported.
2.3. FT-IR spectroscopy
The FT-IR spectra were recorded at room temperature using a Nicolet 380 FT-IR spectrometer equipped with EZ Omnic software. The FT-IR spectra were recorded in the 4000 to 400 cm-1 range, and were collected after 300 scans at 4 cm-1 resolution. The KBr disc technique was used for sample preparation. The KBr (FT-IR grade, Fluka) was dried at 200 °C for 24 h. To prepare KBr pellets, 1 mg of RM sample (deriving from the As,P-RM samples at pH 4.0, 7.0 and 10.0 of the last point of isotherms), was finely ground together with 200 mg of KBr. The pellets were made using 90 mg of the mixture KBr-RM. An empty KBr pellet was used as reference and its spectrum was
subtracted from the sample spectrum to suppress spectral artifacts caused by KBr impurities and water.
2.4. Thermal analysis
Thermogravimetry (TG) and differential thermogra-vimetry (DTG) of the RM samples were performed using a Netzsch STA 429 thermal analysis apparatus. The RM samples (deriving from the As,P-RM samples at pH 4.0, 7.0 and 10.0 of the last point of isotherms) were heated in a platinum crucible in the temperature range 25-800°C with a heating rate of 10°C/min in air. The flow rate of air was 10 ml/min. About 50 mg of the sample were finely ground and were used in each run. The water concentra-tion in the samples was determined from the TG curve mass loss.
3. RESULTS AND DISCUSSION
3.1. Chemical, physical, and structural characteristics of RM samples
In Table 1 the properties of the RM samples at differ-ent pH values used in the study are reported. The specific surface areas of RM at pH 4.0, 7.0 and 10.0 were 25, 23 and 21 m2·g-1 respectively. EDX analyses revealed that the not-exchanged RM was rich in O (35.12 wt. %), Fe (30.35 wt. %), Al (9.65 wt. %), and C (9.15 wt. %) (Table 1). A mixture of eight phases was retrieved in RMnt samples, however it should be noted that the 80 wt. % of the RM crystalline phase was made by Fe and Al oxides and oxy-hydroxides such as hematite, boehmite, and gibbsite, and tectosilicates such as sodalite and cancrinite (Table 2). XRD analysis showed that the different pH values changed the mineralogical composition of RM samples. Particularly at pH 4.0 a loss, proton-promoted, of acid-soluble fractions like boehmite and cancrinite was observed.
TABLE 1 - Properties of the RMnt and RM samples at pH 10.0, 7.0 and 4.0 used in the study
Chemical parameters RMnt RM pH 10.0 RM pH 7.0 RM pH 4.0 pH 11.10±0.12d 10.0±0.11c 7.0±0.13b 4.0±0.15a EC (mS·cm-1) 8.70±0.14c 8.25±0.13c 6.55±0.15b 5.22±0.09a SBET 19a 21ab 23bc 25c PZC 4.77±0.14 - - - Organic matter (% d.m.) 0.60±0.07 - - - Pb (mg·kg-1) 48.50±5.6 - - - Cd (mg·kg-1) 1.46±0.08 - - - Cu (mg·kg-1) 5.70±0.23 - - - Cr (mg·kg-1) 640.21±13.1 - - - Element composition (wt.%) C 9.15±0.24a 9.0±0.20a 9.32±0.18a n.d. O 35.12±1.36a 34.23±1.44a 34.15±1.56a 42.33±2.28b Na 5.17±0.14d 4.31±0.13c 2.30±0.08b 1.15±0.11a Al 9.65±0.58a 10.25±0.44a 10.44±0.72a 9.33±0.43a Si 4.32±0.13b 4.94±0.11b 4.53±0.08b 3.41±0.09a Ca 1.04±0.08a 1.13±0.08a 1.15±0.07a 1.00±0.09a Fe 30.35±2.6a 30.88±2.2a 32.53±3.2a 35.32±3.6b Ti 4.13±0.12a 4.23±0.09a 4.53±0.07a 6.43±0.08b Cl 1.07±0.03a 1.03±0.04a 1.05±0.03a 1.03±0.03a
*Mean values±standard deviations followed by the same letter within a row do not differ significantly (Fisher’s LSD test, P<0.05).

© by PSP Volume 21 – No 3a. 2012 Fresenius Environmental Bulletin
716
TABLE 2 - Chemical phases of the RMnt and RM samples at pH 10.0, 7.0 and 4.0 (wt.%) (140°C)
Chemical phases(wt %) RMnt RM pH 10 RM pH 7 RM pH 4 Cancrinite [Na6Ca1.5Al6Si6O24(CO3)1.6] 4.0 4.0 3.5 n.d. Sodalite [Na8(Cl,OH)2|Al6Si6O24] 20.0 24.0 24.0 22.0 Hematite [Fe2O3] 44.0 42.0 42.0 49.0 Boehmite [AlO(OH)] 12.0 12.0 12.0 8.0 Gibbsite [Al(OH)3] 4.0 4.0 4.0 4.0 Anatase [TiO2] 4.5 4.0 4.0 5.5 Andradite [Ca-Fe-Al-Si oxide] 5.5 5.0 5.0 5.5 Quartz [SiO2] 6.0 5.0 5.5 6.0
………
3.2. Adsorption isotherms of As(V) and P(V) on RM at differ-ent pH values
The simultaneous adsorption isotherms (Fig. 1), car-ried out using equimolecular concentrations of As and P indicated, at all the pH values tested, a higher affinity of red mud towards these elements at low equilibrium con-centrations (the first eight points of the isotherms) (Fig. 1). Vice-versa, under conditions where the binding sites approached saturation, e.g. at high concentration of both anions (the last 5 points of the isotherms), the sorption of both oxyanions onto RM increased slowly, and a stronger competitive effect of phosphate was observed.
Isotherms analysis showed that different concentra-tions of arsenate and phosphate were sorbed at different pH values. These latter values affected the surface charge of the solid particles, the protonation/deprotonation of oxyan-ions and their speciation. Particularly the As(V) and P(V) sorption was higher at lower pH values and increased in the following order: RM-pH 4.0 (As(V) 0.669 mmol·g-1; P(V) 1.056 mmol·g-1)> RM pH 7.0 (As(V) 0.537 mmol·g-1; P(V) 0.857 mmol·g-1)> RM pH 10.0 (As(V) 0.154 mmol·g-1; P(V) 0.336) (Fig. 1). The anions sorption on RM surfaces at different pH values could be attributed to various mecha-nisms, such as electrostatic attraction/repulsion, chemical interaction and ion exchange [6,23,25]. At pH 4.0 the RM surface was positively charged (pHpcz RM 4.77) and H2AsO4
- (98 % of total dissolved As) and H2PO4- (100 %
of total dissolved P) were dominant, therefore adsorption in RM was facilitated because this maximised the release of electrostatic energy [6,26]. On the other hand, at pH 10.0, where the divalent anions HAsO4
2− (97-91 %) and HPO4
2− (97-88 %) are largely dominant, and at pH 7.0, where more species co-exist (H2AsO4
-/HAsO42- H2PO4
-
/HPO42-), the surface of the RM is negatively charged and
the anions may be affected by Coulombic repulsion [27]. Therefore at higher pH values the arsenate and phosphate sorption should be mainly due to chemical sorption of specific anions, which involved the exchange of OH– groups on RM surface with arsenate and phosphate [6, 23, 28].
The RM surfaces showed a different affinity towards the two oxyanions. More phosphate was adsorbed with respect to arsenate, also at low concentrations of both anions, where the RM available binding sites were in excess, and this is in agreement with the results showed by several authors which studied the sorption of arsenate
FIGURE 1 - As(V) and P(V) adsorption isotherms onto RM samples at different pH values.

© by PSP Volume 21 – No 3a. 2012 Fresenius Environmental Bulletin
717
and phosphate on several mineral surfaces and soil [2, 12,28-31]. Moreover, the inhibiting effect of phosphate was greater at high pH than at low pH indicating that in alkaline systems OH− ions competed with both anions, but clearly inhibiting arsenate much more than phosphate sorption [2]. It could be deduced that the lower sorption of arsenate compared to phosphate was primarily due to a higher affinity of phosphate towards the sorption sites of the RM, despite the similar chemistry and dissociation constants of the two anions. Besides, it can be hypothesized that different sorption mechanisms occurred between phos-phate, arsenate and RM, probably because of the different sizes of the two anions, particularly phosphate is smaller in size than arsenate. Indeed different surface inner-sphere complexes (e.g. monodentate mononuclear, bidentate mo-nonuclear, and bidentate binuclear complexes) can be formed between the two anions and the surface functional groups of RM.
The results of simultaneous sorption of phosphate and arsenate are in agreement with those obtained in our pre-vious studies, where the single sorption of arsenate and phosphate was studied. The results presented by Castaldi et al. [6,23] showed that the two anions have a different reactivity towards the RM phases, being the phosphate more sorbed than arsenate (i.e. the phosphate sorbed in RM at pH 4.0 was 3.0 times higher with respect to arse-nate) because of the different mechanisms governing the sorption of these anions. However, when anions were both present, the quantity sorbed by the RM, at all the pH values, was lower with respect to the single sorption [6,23]. The supposed formation of surface complexes between the Fe/Al surface groups of RM and arsenate and phosphate likely restricted the accessibility of those surface sites for further adsorption, as showed by several authors [8,32-33]. Besides, the decrease in arsenate sorption in the presence of phosphate was strongly dependent by the pH value. Par-ticularly at pH 4.0, 7.0, and 10.0, arsenate sorption by RM in the simultaneous experiments was respectively 64.9 %, 31.6 %, and 18.6 % of the single sorption. Low pH values (pH 4.0) hindered less the sorption of arsenate, which taken place on sites with more high-affinity.
In order to describe the equilibrium adsorption of ar-senate and phosphate into red mud two types of models, Langmuir and Freundlich isotherms, were applied. The Langmuir isotherm model is empirically-based and the parameters represent physicochemical information about the adsorption mechanism, specifically the adsorption maximum, and the binding energy. The Langmuir equa-tion was applied for adsorption equilibrium of arsenate and phosphate sorbed onto RM as follows:
x/m = KbC/(1+KC);
where x/m is the amount of arsenate or phosphate sorbed per unit mass of adsorbent, b is the maximum amount of arsenate or phosphate that may be bound to the adsorbent, C is the equilibrium solution concentration, and K is a constant related to the binding energy [2,6,23].
FIGURE 2 - Langmuir plots for As(V) and P(V) adsorption iso-therms onto RM samples at different pH values.
Langmuir plots for As(V) and P(V) adsorption onto red
mud samples at pH 4.0, 7.0 and 10.0 are presented in Fig. 2. The values of the Langmuir correlation coefficients were calculated using linear regression and are given in Table 3. The values of maximum As(V) and P(V) sorbed, notably b, and the Langmuir constant C were calculated, at each pH values, from these Langmuir plots and summarized in Table 3.
All the adsorption data have been also described by the Freundlich adsorption model, which is an empirically-based equation employed to describe heterogeneous sys-tems [23, 34, 35]. The Freundlich isotherm can be ex-pressed as:

© by PSP Volume 21 – No 3a. 2012 Fresenius Environmental Bulletin
718
TABLE 3 - The Langmuir and Freundlich parameters relating to the simultaneous arsenate [As] and phosphate [P] sorption into RM samples.
Model Parameters Langmuir isotherm b (mmol g-1) K (L mmol-1) R2 As(V)-RM pH 4.0 0.654 0.665 0.834 As(V)-RM pH 7.0 0.452 0.877 0.985 As(V)-RM pH 10.0 0.122 1.069 0.977 P(V)-RM pH 4.0 1.054 0.790 0.880 P(V)-RM pH 7.0 0.873 2.318 0.963 P(V)-RM pH 10.0 0.350 2.504 0.965 Freundlich isotherm KF (mmol g-1) 1/n R2 As(V)-RM pH 4.0 0.974 0.962 0.879 As(V)-RM pH 7.0 0.761 0.784 0.852 As(V)-RM pH 10.0 0.467 0.577 0.828 P(V)-RM pH 4.0 1.694 0.645 0.799 P(V)-RM pH 7.0 1.003 0.553 0.895 P(V)-RM pH 10.0 0.557 0.358 0.898
x/m = KFC1/n
where KF and n are the Freundlich constants related to the adsorption capacity and intensity, respectively, and Ce is the equilibrium concentration of the anions [7].
Comparison between isotherms models showed that at pH 7.0 and 10.0 the Langmuir isotherm represented the adsorption process better than the Freundlich isotherm, indeed all the data were fitted very well by Langmuir isotherms with linear correlation coefficients greater than 0.96, in agreement with the results of Li et al. [34] and Castaldi et al. [23]. The highest adsorption values of phosphate with respect to arsenate onto RM at all pH values, obtained from the Langmuir’s equation, agreed with the experimental results (Table 3). Besides the Langmuir’s parameter K showed the highest values for the phosphate sorption at all pH values, so explaining the strong competitive effect exerted by phosphate on the adsorption of arsenate.
3.3. FT-IR spectra analysis
The nature of the RM surface configuration after ar-senate and phosphate sorption was evaluated by spectro-scopic analyses (Fig. 3). In all of the spectra a strong band was present in the hydroxyl stretching region at 3400-3300 cm-1. This was likely due to the presence of H2O in the RM [6,23]. In all the spectra, a band at 3090 cm-1, which could be ascribed to O–H stretching vibration of crystalline boehmite [36] was also visible.
In all the samples a band at 1630 cm-1 was detected. This was attributed to the water molecules occluded in-side the aluminosilicate structure [37]. Carbonates bands appear in the RM samples at pH 7.0 and 10.0, within the 1410-1470 cm-1 region, while these bands were missing in the RM samples at pH 4.0, due to the acidification of the sorbent. The peak at 1070 cm-1 in the RM at pH 4.0 is characteristic of a band corresponding to Si–O vibration [37]. The band at 994 cm-1, present in RM at pH 7.0 and 10.0, could be assigned to the stretching vibrations of Si(Al)–O. This band is sensitive to the content of struc-tural Si and Al [6,23]. The decrease of this band in RM samples at pH 4.0 could be due to the dissolution of
FIGURE 3 - FT–IR spectra of RMnt and As,P-RM at different pH values.
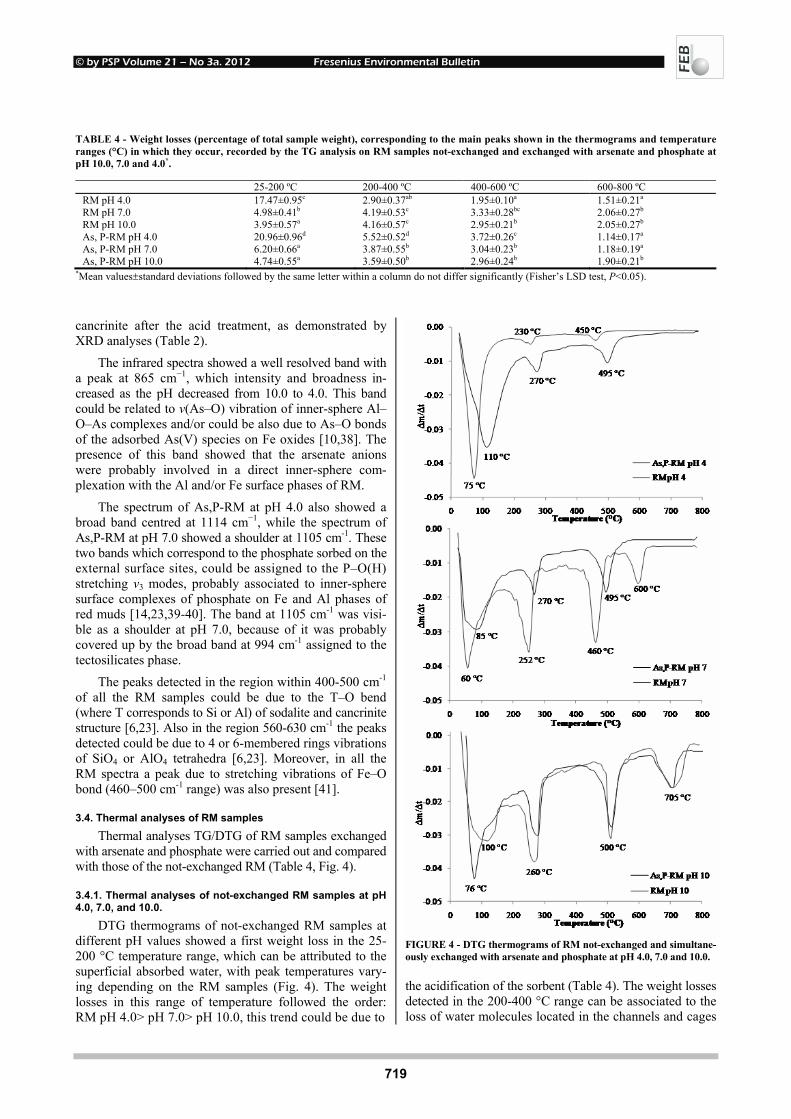
© by PSP Volume 21 – No 3a. 2012 Fresenius Environmental Bulletin
719
TABLE 4 - Weight losses (percentage of total sample weight), corresponding to the main peaks shown in the thermograms and temperature ranges (°C) in which they occur, recorded by the TG analysis on RM samples not-exchanged and exchanged with arsenate and phosphate at pH 10.0, 7.0 and 4.0*.
25-200 ºC 200-400 ºC 400-600 ºC 600-800 ºC RM pH 4.0 17.47±0.95c 2.90±0.37ab 1.95±0.10a 1.51±0.21a RM pH 7.0 4.98±0.41b 4.19±0.53c 3.33±0.28bc 2.06±0.27b RM pH 10.0 3.95±0.57a 4.16±0.57c 2.95±0.21b 2.05±0.27b As, P-RM pH 4.0 20.96±0.96d 5.52±0.52d 3.72±0.26c 1.14±0.17a As, P-RM pH 7.0 6.20±0.66a 3.87±0.55b 3.04±0.23b 1.18±0.19a As, P-RM pH 10.0 4.74±0.55a 3.59±0.50b 2.96±0.24b 1.90±0.21b
*Mean values±standard deviations followed by the same letter within a column do not differ significantly (Fisher’s LSD test, P<0.05).
cancrinite after the acid treatment, as demonstrated by XRD analyses (Table 2).
The infrared spectra showed a well resolved band with a peak at 865 cm−1, which intensity and broadness in-creased as the pH decreased from 10.0 to 4.0. This band could be related to v(As–O) vibration of inner-sphere Al–O–As complexes and/or could be also due to As–O bonds of the adsorbed As(V) species on Fe oxides [10,38]. The presence of this band showed that the arsenate anions were probably involved in a direct inner-sphere com-plexation with the Al and/or Fe surface phases of RM.
The spectrum of As,P-RM at pH 4.0 also showed a broad band centred at 1114 cm−1, while the spectrum of As,P-RM at pH 7.0 showed a shoulder at 1105 cm-1. These two bands which correspond to the phosphate sorbed on the external surface sites, could be assigned to the P–O(H) stretching ν3 modes, probably associated to inner-sphere surface complexes of phosphate on Fe and Al phases of red muds [14,23,39-40]. The band at 1105 cm-1 was visi-ble as a shoulder at pH 7.0, because of it was probably covered up by the broad band at 994 cm-1 assigned to the tectosilicates phase.
The peaks detected in the region within 400-500 cm-1 of all the RM samples could be due to the T–O bend (where T corresponds to Si or Al) of sodalite and cancrinite structure [6,23]. Also in the region 560-630 cm-1 the peaks detected could be due to 4 or 6-membered rings vibrations of SiO4 or AlO4 tetrahedra [6,23]. Moreover, in all the RM spectra a peak due to stretching vibrations of Fe–O bond (460–500 cm-1 range) was also present [41].
3.4. Thermal analyses of RM samples
Thermal analyses TG/DTG of RM samples exchanged with arsenate and phosphate were carried out and compared with those of the not-exchanged RM (Table 4, Fig. 4).
3.4.1. Thermal analyses of not-exchanged RM samples at pH 4.0, 7.0, and 10.0.
DTG thermograms of not-exchanged RM samples at different pH values showed a first weight loss in the 25-200 °C temperature range, which can be attributed to the superficial absorbed water, with peak temperatures vary-ing depending on the RM samples (Fig. 4). The weight losses in this range of temperature followed the order: RM pH 4.0> pH 7.0> pH 10.0, this trend could be due to
FIGURE 4 - DTG thermograms of RM not-exchanged and simultane-ously exchanged with arsenate and phosphate at pH 4.0, 7.0 and 10.0.
the acidification of the sorbent (Table 4). The weight losses detected in the 200-400 °C range can be associated to the loss of water molecules located in the channels and cages
© by PSP Volume 21 – No 3a. 2012 Fresenius Environmental Bulletin
720
of the cancrinite and sodalite structure, and bound to the non framework anions and cations present in both tecto-silicates [42]. The reduced weight losses in this tempera-ture range for the not-exchanged RM samples at pH 4.0 could be due to a dissolution of cancrinite phase attribut-able to the acidification of the RM samples, as highlighted by the XRD analyses (Table 2).
The thermal events recorded in the range 400-600 °C can be ascribed to a synergic effect of the release of CO3
2- groups coming from cancrinite [43], the decomposition of gibbsite [44], and the dehydration of boehmite forming aluminium oxide phases (Fig. 4) [45]. In the RM samples at pH 4.0 the peak at 450 °C markedly decreased in its intensity because the acid pre-treatment favoured the dissolution of carbonates and bohemite (Fig. 4) [42].
Finally, in the not-exchanged RM at pH 7.0 and 10.0 another weight loss, in the 600-800 °C range, was ob-served (Fig. 4). This weight loss may be attributed to the release of CO2 during decomposition of calcite [42]. How-ever, the calcite phase was not detected through XRD dif-fractometry, probably because it was present at concentra-tions lower than the instrumental detection limit. Finally, the temperature of peak corresponding to the release of CO2 was approximately at 600 °C and 705 °C in RM at pH 7.0 and 10.0 respectively. This increase of tempera-ture following the pH increase, suggests that more energy was needed for the thermal decomposition of calcite in the RM at pH 10.0, which was better crystallized com-pared to that present in the RM at pH 7.0.
3.4.2. Thermal analyses of As,P-RM samples at pH 4.0, 7.0, and 10.0.
The first weight loss (25-200°C) in DTG thermograms of As,P-RM at pH 4.0 and 7.0 shifted toward higher tem-peratures with respect to the same not-exchanged RM, with a peak temperature of 85-110 °C (Fig. 4). The increased thermal stability of this peak could be due to a stronger network of hydrogen bonds between the OH- groups of the different phases of RM and the hydrated arsenate and phosphate anions, as pointed out by Palmer et al. [46]. Besides, higher weight losses in the RM samples ex-changed with arsenate and phosphate were observed, at pH 4.0, 7.0 and 10.0, with respect to not-exchanged RM (Table 4).
The second and third temperature peaks (range 200-400 °C and 400-600 °C) shifted considerably to higher temperatures after the arsenate and phosphate sorption processes at pH 4.0 and 7.0. For RM at pH 4.0, the second temperature peak shifted from 230 ºC to 270 ºC and the third peak shifted from 450 ºC to 495 ºC; for RM at pH 7.0, the second peak shifted from 252 ºC to 270 ºC and the third peak shifted from 460 ºC to 495 ºC. This could be attributed to an increased thermal stability of the RM phases involved in the sorption of both anions and to the consequent strengthening of sorbent structure. The weight losses recorded in the 400-600 °C range were higher in As,P-RM at pH 4.0, 7.0 and 10.0, with respect to not-
exchanged RM (Table 4). These results showed that any dissolution of gibbsite phase occurred during the reaction with the arsenate and phosphate.
4. CONCLUSIONS
The sorption of arsenate and phosphate by the red mud surfaces, especially iron and aluminium oxides and oxihydroxides, can affect their mobility, reactivity and bio-availability in soils. Arsenate and phosphate, when co-occurring, could directly compete for the binding sites of the red mud and affect the extent of their sorption. To verify such hypothesis we have taken into account sys-tems containing equimolecular amounts of As and P at pH 4.0, 7.0 and 10.0. The results indicated that red muds were able to act as accumulators of both anions. However, this ability was closely related to the type and total con-centration of the two anions in solution and to the pH of the system. Simultaneous sorption of phosphate and arse-nate by red muds showed a different affinity of the sor-bent towards the two anions. For example the phosphate sorbed in RM at pH 4.0 was 1.6 times higher with respect to arsenate. It can be hypothesized that the lower sorption of arsenate with respect to phosphate was due to a higher affinity of phosphate towards the sorption sites of the RM, despite the similar chemistry and dissociation constants of the two anions. The amount of phosphate and arsenate sorbed, as shown by adsorption isotherms, decreased as the pH increased, while the P/As sorption ratio increased, suggesting that different mechanisms were regulating the sorption of the two ions. This finding was supported by the fact that, even at low concentrations, phosphate affected arsenate sorption by RM (under these conditions, the available binding sites were in excess). Under conditions where the binding sites approached saturation, e.g. at high concentration of both anions, a stronger competitive ef-fects of phosphate was observed. This suggested that the sorption of phosphate was linked to its greater capacity to form inner-sphere complexes with the superficial sites of RM. Another factor which could contribute in determining a higher absorption of phosphate is its ionic size, smaller than that of arsenate, making the ion easily diffusible to-wards the surface adsorbing sites. To verify this hypothesis the sorption of other oxyanions such as chromate, selenate and vanadate will be examined and compared with that of As(V).
The FT-IR spectra of As,P-RM showed a band at 865 cm−1 and ˜ 1114 cm−1 which could be due, respec-tively, to arsenate and phosphate sorbed on Fe and Al phases of red muds (hematite, boehmite and gibbsite) through a direct inner-sphere complexation. However, this spectroscopic technique did not discriminate the different role of Fe-Al oxides and oxyhydroxides in the arsenate polyhedra sorption. The thermal analyses showed an in-crease of the thermal stability of the RM phases involved in the sorption of both anions and a consequent strengthen-ing of the sorbent structure, while they did not show any

© by PSP Volume 21 – No 3a. 2012 Fresenius Environmental Bulletin
721
dissolution anion-promoted of the RM phases, thus ex-cluding the involvement of precipitation reactions.
The results obtained highlighted a higher affinity of RM phases towards phosphate with respect to arsenate, besides the main sorption mechanisms of both anions were ascribable to a chemical interaction. These aspects are of particular importance for the assessment of the effectiveness of the RM as As-immobilizing agent in polluted soils and waters.
ACKNOWLEDGMENTS
The financial support of Regione Sardegna (L.R. 7/2007 Progetti di ricerca di base- Bando 2008) and of Ministero dell’Istruzione, dell’Università e della Ricerca (PRIN 2008) are gratefully acknowledged.
REFERENCES
[1] Ciardelli, M.C., Xu, H. and Sahai, N. (2008) Role of Fe(II), phosphate, silicate, sulfate, and carbonate in arsenic uptake by coprecipitation in synthetic and natural groundwater. Wa-ter Res. 42, 615-624.
[2] Violante, A., Pucci, M., Cozzolino, V., Zhu, J. and Pigna, M. (2009) Sorption/desorption of arsenate on/from Mg–Al lay-ered double hydroxides: Influence of phosphate. J. Colloid Interf. Sci. 333, 63-70.
[3] Deiana, S., Deiana, L., Premoli, A. and Senette, C. (2009) Accumulation and mobilization of arsenate by Fe(III) poly-ions trapped in a Ca-polygalacturonate network. Plant Phy-siol. Bioch. 47, 615-622.
[4] Wang, S. and Mulligan, C.N. (2008) Speciation and surface structure of inorganic arsenic in solid phases: a review. Envi-ron. Int. 34, 867-87.
[5] Frau, F., Addari, D., Atzei, D., Biddau, R., Cidu, R. and Rossi, A. (2010) Influence of major anions on As(V) adsorp-tion by synthetic 2-line ferrihydrite, kinetic investigation and XPS study of the competitive effect of bicarbonate. Water Air Soil Poll. 205, 25-41.
[6] Castaldi, P., Silvetti, M., Enzo, S. and Melis, P. (2010) Study of sorption processes and FT-IR analysis of arsenate sorbed onto red muds (a bauxite ore processing waste). J. Hazard. Mater. 175, 172-178.
[7] Ruixia, L., Jinlong, G. and Hongxiao, T. (2002) Adsorption of fluoride, phosphate, and arsenate ions on a new type of ion exchange fiber. J. Colloid Interf. Sci. 248, 268-274.
[8] Zhang, H. and Selim, H.M. (2008) Competitive sorption-desorption kinetics of arsenate and phosphate in soils. Soil Sci. 173, 3-12.
[9] Persson, P., Nilsson, N. and Sjöberg, S. (1996) Structure and bonding of orthophosphate ions at the iron oxide–aqueous in-terface. J. Colloid Interf. Sci. 177, 263-275.
[10] Goldberg, S. and Johnston, C.T. (2001) Mechanisms of arse-nic adsorption on amorphous oxides evaluated using macro-scopic measurements, vibrational spectroscopy, and surface complexation modelling. J. Colloid Interf. Sci. 234, 204-216.
[11] Antelo, J., Avena, M., Fiol, S., López, R. and Arce, F. (2005) Effects of pH and ionic strength on the adsorption of phos-phate and arsenate at the goethite–water interface. J. Colloid Interf. Sci. 285, 476-486.
[12] Jain, A. and Loeppert, R.H. (2000) Effect of competing ani-ons on the adsorption of arsenate and arsenite by ferrihydrite. J. Environ. Qual. 29, 1422-1430.
[13] Manning, B.A. and Goldberg, S. (1996) Modeling competi-tive adsorption of arsenate with phosphate and molybdate on oxide minerals. Soil Sci. Soc. Am. J. 60, 121-131.
[14] Luengo, C., Brigante, M., Antelo, J. and Avena, M. (2006) Kinetic of phosfate adsorption on goethite:comparing batch adsorption and ATR-IR measuraments. J. Colloid Interf. Sci. 300, 511-18.
[15] Luxton, T.P., Eick, M.J. and Rimstidt, D.J. (2008) The role of silicate in the adsorption/desorption of arsenite on goe-thite. Chem. Geol. 252, 125-135.
[16] Pattanayak, J., Mondal, K., Mathew, S. and Lalvani, S.B. (2000) A parametric evaluation of the removal of As(V) and As(III) by carbon-based adsorbents. Carbon 38, 589-596.
[17] Gu, Z., Fang, J. and Deng, B. (2005) Preparation and evalua-tion of GAC based iron containing adsorbents for arsenic re-moval. Environ. Sci. Technol. 39, 3833-3843.
[18] Lombi, E., Hamon, R.E., Wieshammer, G., McLaughlin, M.J. and McGrath, S.P. (2004) Assessment of the use of in-dustrial by-products to remediate a copper- and arsenic-contaminated soil. J. Environ. Qual. 33, 902-910.
[19] Garau, G., Silvetti, M., Deiana, S., Deiana, P. and Castaldi P. (2011) Long-term influence of red mud on As mobility and soil physico-chemical and microbial parameters in a polluted sub-acidic soil. J. Hazard. Mater. 185, 1241–1248.
[20] Castaldi, P., Melis, P., Silvetti, M., Deiana, P. and Garau, G. (2009) Influence of pea and wheat growth on Pb, Cd, and Zn mobility and soil biological status in a polluted amended soil. Geoderma 151, 241-248.
[21] Wang, S., Ang, H.M. and Tadé M.O. (2008) Novel applica-tions of red mud as coagulant, adsorbent and catalyst for envi-ronmentally benign processes. Chemosphere 72, 1621-1635.
[22] Santona, L., Castaldi, P. and Melis, P. (2006) Evaluation of the interaction mechanisms between red muds and heavy metals. J. Hazard. Mater. 136, 324-329.
[23] Castaldi, P., Silvetti, M., Garau, G., Deiana, S. (2010) Influ-ence of the pH on the accumulation of phosphate by red mud (a bauxite ore processing waste). J. Hazard. Mater. 182, 266-272.
[24] Garau, G., Castaldi, P., Santona, L., Deiana, P. and Melis, P. (2007) Influence of red mud, zeolite and lime on heavy metal immobilization, culturable heterotrophic microbial popula-tions and enzyme activities in a contaminated soil. Geoderma 142, 47-57.
[25] Li, Y., Liu, C., Luan, Z., Peng, X., Zhu, C., Chen, Z., Zhang, Z., Fan, J. and Jia, Z. (2006) Phosphate removal from aque-ous solutions using raw and activated red mud and fly ash. J. Hazard. Mater. 137, 374-383.
[26] Hiemstra, T. and Van Riemsdijk, W.H. (1999) Surface struc-tural ion adsorption modeling of competitive binding of oxyanions by metal (hydr)oxides. J. Colloid Interf. Sci. 210, 182-193.
[27] Genç-Fuhrman, H., Tjell, J.C. and McConchie, D. (2004) Adsorption of arsenic from water using activated neutralized red mud. Environ. Sci. Technol 38, 2428-2434.
© by PSP Volume 21 – No 3a. 2012 Fresenius Environmental Bulletin
722
[28] Goh, K.H. and Lim, T.T. (2010) Influences of co-existing species on the sorption of toxic oxyanions from aqueous so-lution by nanocrystalline Mg/Al layered double hydroxide. J. Hazard. Mater. 180, 401-408.
[29] Su, C. and Puls, R.W. (2001) Arsenate and arsenite removal by zerovalent iron: effects of phosphate, silicate, carbonate, borate, sulfate, chromate, molybdate, and nitrate, relative to chloride. Environ. Sci. Technol. 35, 4562-456.
[30] Goh, K.H., Lim, T.T. and Dong, Z. (2008) Application of layered double hydroxides for removal of axxyanions: a re-view. Water Res. 42, 1343-1368.
[31] Hsu, J.C., Lin, C.J., Liao, C.H. and Chen, S.T. (2008) Evaluation of the multiple-ion competition in the adsorption of As(V) onto reclaimed iron-oxide coated sands by frac-tional factorial design. Chemosphere 72, 1049-1055.
[32] Hingston, F.J., Posner, A.M. and Quirk, J.P. (1971) Competi-tive adsorption of negatively charged ligands on oxide sur-faces. Disc. Faraday Soc. 52, 334-342.
[33] Smith, E., Naidu, R. and Alston, A.M. (2002) Chemistry of inorganic arsenic in soils: II. Effect of phosphorus, sodium, and calcium on arsenic sorption. J. Environ. Qual. 31, 557-563.
[34] Li, Y., Liu, C., Luan, Z., Peng, X., Zhu, C., Chen, Z., Zhang, Z., Fan, J. and Jia, Z. (2006) Phosphate removal from aque-ous solutions using raw and activated red mud and fly ash. J. Hazard. Mater. 137, 374-383.
[35] Huang, W., Wang, S., Zhu, Z., Li, L., Yao, X., Rudolph, V. and Haghseresht, F. (2008) Phosphate removal from waste-water using red mud. J. Hazard. Mater. 158, 35-42.
[36] Boumaza, A., Favaro, L., Lédion, J., Sattonnay, G., Brubach, J.B., Berthet, P., Huntz, A.M., Roy, P. and Tétot, R. (2009) Transition alumina phases induced by heat treatment of boehmite: An X-ray diffraction and infrared spectroscopy study. J. Solid State Chem. 182, 1171-1176.
[37] Gök, A., Omastová, M. and Prokeš, J. (2007) Synthesis and characterization of red mud/polyaniline composites: Electrical properties and thermal stability. Eur. Polym. J. 43, 2471-2480.
[38] Jia, Y., Xu, L., Wang, X. and Demopoulos, G.P. (2007) In-frared spectroscopic and X-ray diffraction characterization of the nature of adsorbed arsenate on ferrihydrite. Geochim. Cosmochim. Ac. 71, 1643-1654.
[39] Arai, Y. and Sparks, D.L. (2001) ATR-FTIR spectroscopic investigation on phosphate adsorption mechanisms at the fer-rihidrite-water interface. J. Colloid Interf. Sci. 241, 317-26.
[40] Elzinga, E.J. and Sparks, D.L. (2007) Phosphate adsorption onto hematite: an in situ ATR-FTIR investigation of the ef-fects of pH and loading level on the mode of phosphate sur-face complexation. J. Colloid Interf. Sci. 308, 53-70.
[41] Ruan, H.D., Frost, R.L. and Kloprogge, J.T., (2001) The be-havior of hydroxyl units of synthetic goethite and its dehyxy-lated product hematite. Spectrochim. Acta 57, 2575-2586.
[42] Castaldi, P., Silvetti, M., Santona, L., Enzo, S. and Melis, P. (2008) XRD, FT-IR, and thermal analysis of bauxite ore-processing waste (red mud) exchanged with heavy metals. Clays Clay Miner. 56, 461-469.
[43] Linares, C.F., Sánchez, S., Urbina de Navarro, C., Rodríguez, K. and Goldwasser, M.R. (2005) Study of cancrinite-type zeolites as possible antiacid agents. Micropor. Mesopor. Mat. 77, 215-221.
[44] Pontikes, Y., Nikolopoulos, P. and Angelopoulos, G.N. (2007) Thermal behaviour of clay mixtures with bauxite resi-due for the production of heavy-clay ceramics. J. Eur. Ceram. Soc. 27, 1645-1649.
[45] Sglavo, V.M., Campostrini, R., Maurina, S., Carturan, G., Monagheddu, M., Budroni, G. and Cocco, G. (2000) Bauxite red mud in the ceramic industry. Part 1: thermal behaviour. J. Eur. Ceram. Soc. 20, 235-244.
[46] Palmer, S.J., Soisonard, A. and Frost R.L. (2009) Determina-tion of the mechanism(s) for the inclusion of arsenate, va-nadate, or molybdate anions into hydrotalcites with variable cationic ratio. J. Colloid Interf. Sci. 329, 404-409.
Received: July 28, 2011 Revised: September 07, 2011 Accepted: September 14, 2011 CORRESPONDING AUTHOR
Paola Castaldi Dipartimento di Scienze Ambientali Agrarie e Bio-tecnologie Agro-Alimentari, Sez. Chimica Agraria ed Ambientale University of Sassari Viale Italia 39 07100 Sassari ITALY Phone: +39079229214; Fax:+39079229276. E-mail: [email protected]
FEB/ Vol 21/ No 3a/ 2012 – pages 713 – 722

© by PSP Volume 21 – No 3a. 2012 Fresenius Environmental Bulletin
723
EFFECTS OF UV-B RADIATION ON CARBOHYDRATE METABOLISM AND LIGHT
ABSORBING COMPOUNDS IN CUCUMBER COTYLEDONS
Magdalena Rybus-Zając and Jan Kubiś*
Department of Plant Physiology, Poznań University of Life Sciences, Wołyńska 35, 60-637 Poznań, Poland ABSTRACT
Ultraviolet-B (UV-B) radiation has a negative impact on plant cells. Photosynthetic activity, allocation and avail-ability of the photoassimilates are important parameters in determining plant response to UV-B radiation. Carbohy-drate metabolism may also affect the production of UV-B absorbing compounds and other phenolics, as a result of the supply of substrates and partly from the action of rate-limiting enzymes.
Cucumber is a plant highly sensitive to stress factors, when grown outdoors its cotyledons are often exposed to elevated UV radiation. In order to explain the effects of time-dependent UV-B doses the photosynthetic activity in terms of photosynthetic pigment contents, primary me-tabolites – the accumulation of carbohydrates and activi-ties of carbohydrate-related enzymes, and secondary me-tabolites - flavonoids and total phenolic compounds, were subsequently determined in cucumber cotyledons. Despite earlier observed depression of photosynthesis an increase was observed in the concentrations of chloroplast pig-ments (chlorophyll and carotenoids) and soluble sugars (fructose, glucose and sucrose). In view of the above mentioned results, radiation stress applied at the germina-tion stage leads to a UV-B time-dose dependent increase in the activity of two enzymes connected with carbohy-drate metabolism, i.e. invertase and glucosidase. Supple-mentary UV-B radiation also resulted in an increase in the levels of secondary metabolites (flavonoids and phenolic compounds). Our results suggest that the exposure of cucumber seedlings to supplemental UV-B doses does not limited availability of the photoassimilate and facilitates the synthesis and accumulation of UV-B absorbing and phenolic compounds.
KEYWORDS: Chloroplast pigments, invertase, β-D-glucosidase, phenolic, flavonoids
* Corresponding author
1. INTRODUCTION
Plants as sessile photosynthetic organisms have to use sunlight for photosynthesis and consequently cannot avoid exposure to stressful ultraviolet radiation. UV-B dose rates (280-315 nm) of solar radiation reaching the Earth’s sur-face have increased as a consequence of the depletion of ozone in the stratosphere layer caused by trace gases, such as chlorofluorocarbons (CFCs) and NOx [1]. Decreased ozone levels are expected to recover to the 1970 levels by 2050 [2]. Current levels of UV-B during the cropping sea-son are anywhere between 2 and 12 kJ m-2 per day on the Earth’s surface, which includes an increase of 6-14% of UV-B radiation over the pre-1980 levels and the effects of enhanced radiation might increase in the future years [2, 3]. This range of radiation has a multifaceted, most often negative, effect on crops. Additionally, in the fields plants are often exposed to multiple environmental factors such as high temperature, drought, heavy metals, pesticides, etc., and may modify UV-B induced effects [4,5].
The intensity of damage caused by stress depends on plant species and its development phase, anatomical and morphological traits, environmental conditions, as well as the dose and duration of a given stress factor. UV-B ef-fects include complex changes in the DNA repair capac-ity, photosynthetic activity, growth, plant morphology, gene expression, pest- and pathogen-resistance, and sec-ondary metabolism [6]. A lower photosynthetic activity due to degradation of the D1 and D2 protein of photosys-tem II, reduced CO2 assimilation due to a reduction of the activity and amount of Rubisco, damage of the thylacoid membrane and destruction of chlorophyll and carotenoids have been described for various plant species [7,8]. Allo-cation and availability of the photoassimilate are impor-tant parameters in determining plant response to UV-B radiation [9]. Therefore, factors that affect the carbohy-drate metabolism would also affect the production of UV-B absorbing compounds and other phenolics, partly as a result of the supply of substrates (carbon skeletons) and intermediates, and partly from the action of rate-limiting enzymes [9]. In this context, the UV-B radiation may act as a regulator of both CO2 assimilation and carbohydrate

© by PSP Volume 21 – No 3a. 2012 Fresenius Environmental Bulletin
724
metabolism. Additionally, the UV-B induced relationship between carbohydrates as primary metabolites, and sec-ondary metabolites that may be occurring in plants [10]. The most common protective mechanism of plants against potentially damaging irradiation is the biosynthesis of UV-absorbing compounds [11]. These secondary metabo-lites, i.e. phenolic compounds and flavonoids, accumulate in the vacuoles of epidermal cells in response to UV-B irradiation and attenuate the penetration of this radiation range into deeper cell layers [6].
Cucumber is a plant highly sensitive to stress factors. It is also one of the most common vegetable species. When grown in the field it is at a real risk of exposure of their cotyledons at early stages of germination to e.g. elevated UV radiation. The aim of this study was to investigate the effect of time-dependent UV-B doses on the photosyn-thetic activity and photosynthetic pigment contents, and primary metabolism, i.e. the accumulation of soluble car-bohydrates and activities of carbohydrate-related enzymes. Contents of secondary metabolites – flavonoids and total phenolic compounds -were also measured in cucumber cotyledons at the exposure to elevated ultraviolet-B radia-tion.
2. MATERIALS AND METHODS
2.1. Plant material
Seedlings of cucumber plants (Cucumis sativus cv. Dar) were sown in perlite (30 per 1.0 l pot) and allowed to germinate and develop in a growth chamber under con-trolled growth conditions: 120 µmol m-2 s-1 – photon flux density of 400-700 nm, at photoperiod of 14/10 h (day/ night) and temperature of 250C (day) and 20ºC (night), and 60-70% relative humidity. PAR intensity was meas-ured with FF-01 fitophotometer (Sonopan). Seven-day-old seedlings were subjected to UV-B irradiation, supplied by Philips TL 20 W/01 RS lamps, with max. 315 nm at the intensity of 16 kJ m-2 day-1 for 8 h per day (555 mW m-2 ), during 9 days respectively. UV-B irradiation intensity was controlled using VLX 3W radiometer.
2.2. Chloroplast pigments
Chloroplast pigments were extracted according to Hiscox and Israelstam [12]. One hundred milligrams of leaf tissues were placed in vials containing 5 ml DMSO (Sigma Chemicals Ltd., Germany) and left for about 24 hours. The liquids were used for OD reading at 645 and 663 nm with a spectrophotometer. Chlorophyll and carotenoids contents were calculated following the equation used by Arnon’s method and expressed in mg and µg respectively on g fresh leaf weight.
2.3. Carbohydrate analysis
Frozen samples were ground in 80% ethanol and ex-tracted in closed teflon tubes at 80°C for 1 h. After cool-ing the extracts were centrifuged (10 min 12,000 g) and
evaporated in a speed vacuum concentrator (Heto Lab Equipment A/S, Denmark). The residues were resus-pended in 0.1 mM CaEDTA. The HPLC analysis was performed by Waters Alliance with a Sugar Pack I column. Parameters concerning temperature and the mobile phase flow were used according to Waters’ protocol, whereas quantitative analysis was based on standard curves [13].
Acid invertase activity
Acid invertase activity was assayed using the method of Copeland and Lea [14] with some modifications. Coty-ledon samples 400 mg were ground in 1.6 ml 50 mM cold Na phosphate buffer (pH 7.4) containing 10 µl mercap-toethanol. The homogenate was centrifuged for 30 min at 27.000 g at 4°C. The reaction mixture contained 0.18 ml extract, 0.57 ml 0,1 M acetate buffer (pH 5.0) with 0,1 M sucrose. The reaction was carried out in vials kept at 30°C for 45 min. After incubation 0.05 M tricine buffer (pH 8.3) was added and boiled at 100°C for 3 min. Absorbance increase was followed 1 min at 560 nm. The enzyme activ-ity was expressed as the absorbance increase per 1 min and g fresh weight.
The activity of β-D-glucosidase
The activity of β-D-glucosidase was denoted on the basis of Nichols et al. [15]. The leaves were ground in 0.1 M phosphate buffer of pH 7.0 containing 0.5% of polyethylene glycol and 40 mg of Polyclar AT (the substance binding low-quantity-molecular-compounds). Supernatant obtained after centrifugation at 10000g/15 min were used to deter-mine the enzyme activity. The mixture containing 0.2 ml extract and 0.2 ml 4-nitrophenyl-β-D-glucopyranoside as substrate was incubated for one hour at 350C. After the time 0.6 ml 0.2 N Na2CO3 was added. The formation of p-nitrophenol (p-NP) was followed at 400 nm.
Extraction of phenolic compounds
200 mg of leaves were poured with methanol and al-lowed to stand for 24 hours. After grounding and cen-trifugation the precipitates were washed 2 times with 80% methanol and centrifuged. Combined methanolic extracts were evaporated to a water stage and extracted 2 times with ethyl acetate. Combined ethyl acetate fractions were evaporated to dryness. The precipitates dissolved in 1 ml 80% methanol.
Total phenolic contents
Total phenolic contents were determined by Folin-Denis method [16].
Flavonoids content
Flavonoids content was assayed according to the method based on Caldwell et al. [17].
Protein content
Protein content was determined by the Bradford method [18].
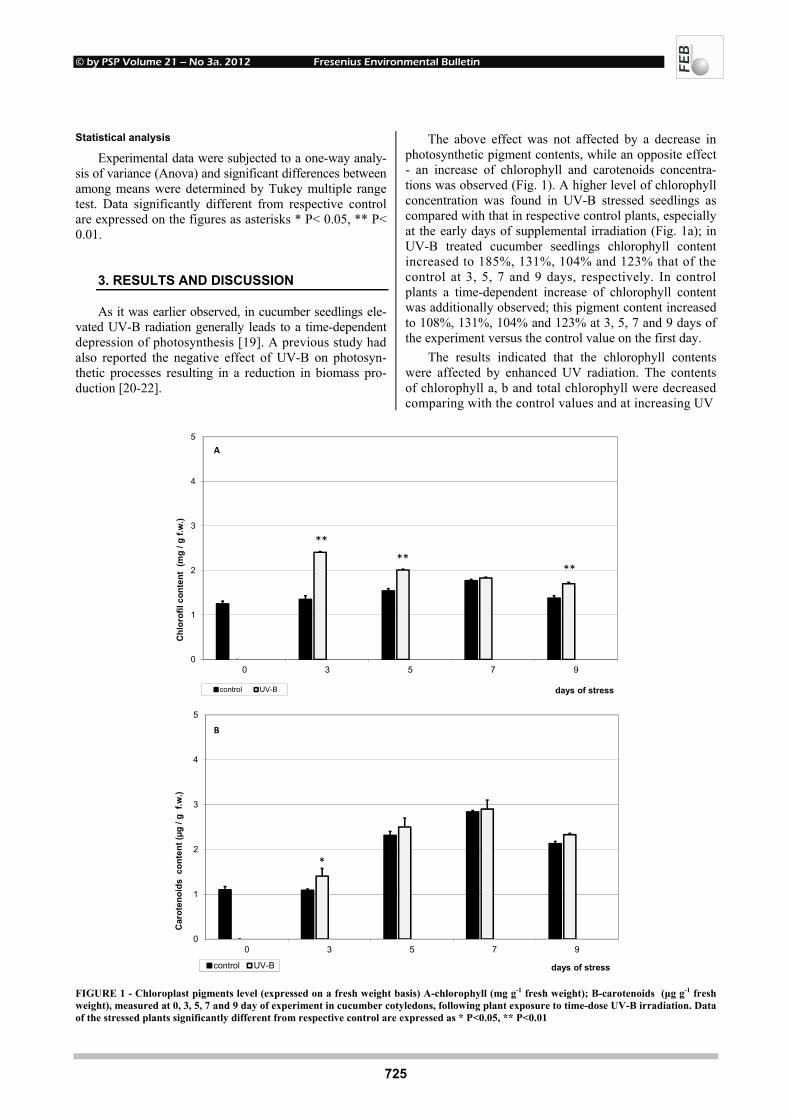
© by PSP Volume 21 – No 3a. 2012 Fresenius Environmental Bulletin
725
Statistical analysis
Experimental data were subjected to a one-way analy-sis of variance (Anova) and significant differences between among means were determined by Tukey multiple range test. Data significantly different from respective control are expressed on the figures as asterisks * P< 0.05, ** P< 0.01.
3. RESULTS AND DISCUSSION
As it was earlier observed, in cucumber seedlings ele-vated UV-B radiation generally leads to a time-dependent depression of photosynthesis [19]. A previous study had also reported the negative effect of UV-B on photosyn-thetic processes resulting in a reduction in biomass pro-duction [20-22].
The above effect was not affected by a decrease in photosynthetic pigment contents, while an opposite effect - an increase of chlorophyll and carotenoids concentra-tions was observed (Fig. 1). A higher level of chlorophyll concentration was found in UV-B stressed seedlings as compared with that in respective control plants, especially at the early days of supplemental irradiation (Fig. 1a); in UV-B treated cucumber seedlings chlorophyll content increased to 185%, 131%, 104% and 123% that of the control at 3, 5, 7 and 9 days, respectively. In control plants a time-dependent increase of chlorophyll content was additionally observed; this pigment content increased to 108%, 131%, 104% and 123% at 3, 5, 7 and 9 days of the experiment versus the control value on the first day.
The results indicated that the chlorophyll contents were affected by enhanced UV radiation. The contents of chlorophyll a, b and total chlorophyll were decreased comparing with the control values and at increasing UV
0
1
2
3
4
5
0 3 5 7 9
Chl
orof
il co
nten
t (m
g / g
f.w
.)
days of stresscontrol UV-B
**
****
A
0
1
2
3
4
5
0 3 5 7 9
Car
oten
oids
con
tent
(µg
/ g f
.w.)
days of stresscontrol UV-B
*
B
FIGURE 1 - Chloroplast pigments level (expressed on a fresh weight basis) A-chlorophyll (mg g-1 fresh weight); B-carotenoids (µg g-1 fresh weight), measured at 0, 3, 5, 7 and 9 day of experiment in cucumber cotyledons, following plant exposure to time-dose UV-B irradiation. Data of the stressed plants significantly different from respective control are expressed as * P<0.05, ** P<0.01
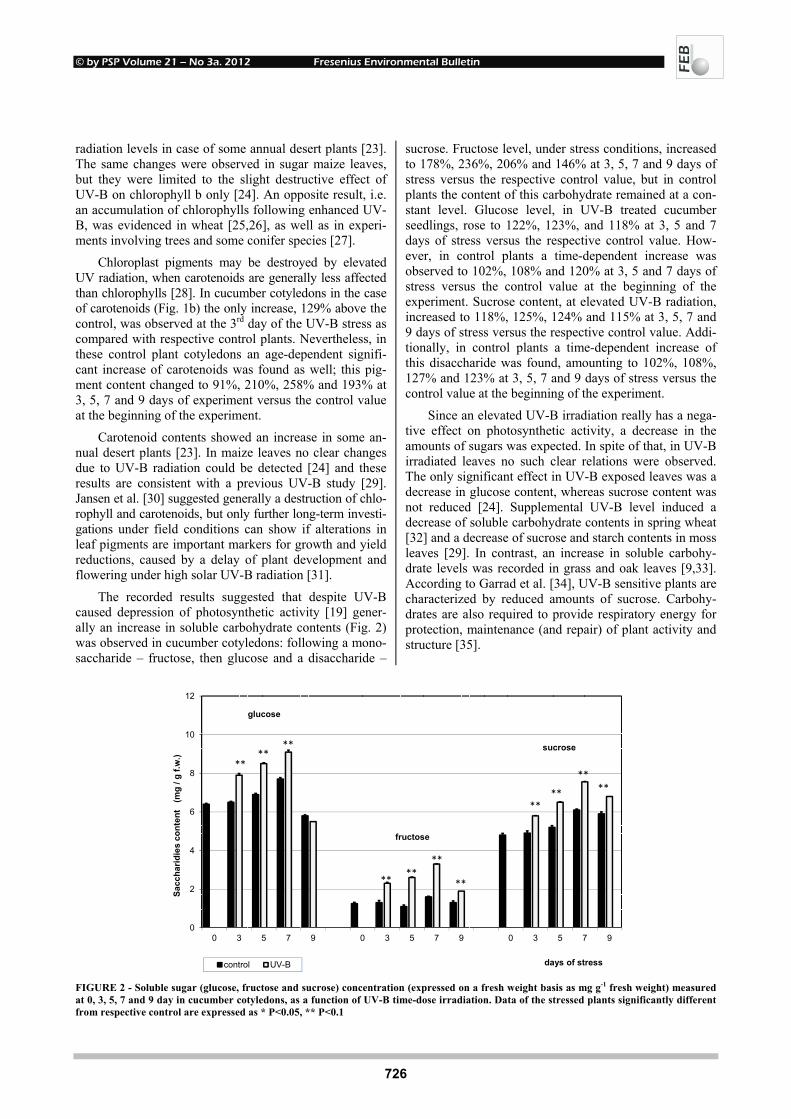
© by PSP Volume 21 – No 3a. 2012 Fresenius Environmental Bulletin
726
radiation levels in case of some annual desert plants [23]. The same changes were observed in sugar maize leaves, but they were limited to the slight destructive effect of UV-B on chlorophyll b only [24]. An opposite result, i.e. an accumulation of chlorophylls following enhanced UV-B, was evidenced in wheat [25,26], as well as in experi-ments involving trees and some conifer species [27].
Chloroplast pigments may be destroyed by elevated UV radiation, when carotenoids are generally less affected than chlorophylls [28]. In cucumber cotyledons in the case of carotenoids (Fig. 1b) the only increase, 129% above the control, was observed at the 3rd day of the UV-B stress as compared with respective control plants. Nevertheless, in these control plant cotyledons an age-dependent signifi-cant increase of carotenoids was found as well; this pig-ment content changed to 91%, 210%, 258% and 193% at 3, 5, 7 and 9 days of experiment versus the control value at the beginning of the experiment.
Carotenoid contents showed an increase in some an-nual desert plants [23]. In maize leaves no clear changes due to UV-B radiation could be detected [24] and these results are consistent with a previous UV-B study [29]. Jansen et al. [30] suggested generally a destruction of chlo-rophyll and carotenoids, but only further long-term investi-gations under field conditions can show if alterations in leaf pigments are important markers for growth and yield reductions, caused by a delay of plant development and flowering under high solar UV-B radiation [31].
The recorded results suggested that despite UV-B caused depression of photosynthetic activity [19] gener-ally an increase in soluble carbohydrate contents (Fig. 2) was observed in cucumber cotyledons: following a mono-saccharide – fructose, then glucose and a disaccharide –
sucrose. Fructose level, under stress conditions, increased to 178%, 236%, 206% and 146% at 3, 5, 7 and 9 days of stress versus the respective control value, but in control plants the content of this carbohydrate remained at a con-stant level. Glucose level, in UV-B treated cucumber seedlings, rose to 122%, 123%, and 118% at 3, 5 and 7 days of stress versus the respective control value. How-ever, in control plants a time-dependent increase was observed to 102%, 108% and 120% at 3, 5 and 7 days of stress versus the control value at the beginning of the experiment. Sucrose content, at elevated UV-B radiation, increased to 118%, 125%, 124% and 115% at 3, 5, 7 and 9 days of stress versus the respective control value. Addi-tionally, in control plants a time-dependent increase of this disaccharide was found, amounting to 102%, 108%, 127% and 123% at 3, 5, 7 and 9 days of stress versus the control value at the beginning of the experiment.
Since an elevated UV-B irradiation really has a nega-tive effect on photosynthetic activity, a decrease in the amounts of sugars was expected. In spite of that, in UV-B irradiated leaves no such clear relations were observed. The only significant effect in UV-B exposed leaves was a decrease in glucose content, whereas sucrose content was not reduced [24]. Supplemental UV-B level induced a decrease of soluble carbohydrate contents in spring wheat [32] and a decrease of sucrose and starch contents in moss leaves [29]. In contrast, an increase in soluble carbohy-drate levels was recorded in grass and oak leaves [9,33]. According to Garrad et al. [34], UV-B sensitive plants are characterized by reduced amounts of sucrose. Carbohy-drates are also required to provide respiratory energy for protection, maintenance (and repair) of plant activity and structure [35].
0
2
4
6
8
10
12
0 3 5 7 9 0 3 5 7 9 0 3 5 7 9
Sacc
harid
ies
cont
ent
(mg
/ g f.
w.)
days of stresscontrol UV-B
fructose
sucrose
glucose
****
**
****
**
**
**
****
**
FIGURE 2 - Soluble sugar (glucose, fructose and sucrose) concentration (expressed on a fresh weight basis as mg g-1 fresh weight) measured at 0, 3, 5, 7 and 9 day in cucumber cotyledons, as a function of UV-B time-dose irradiation. Data of the stressed plants significantly different from respective control are expressed as * P<0.05, ** P<0.1

© by PSP Volume 21 – No 3a. 2012 Fresenius Environmental Bulletin
727
0
0,5
1
1,5
2
2,5
0 3 5 7 9
Inve
rtas
e ac
tivity
(A
/ gf.w
.)
days of stresscontrol UV-B
**** **
**
FIGURE 3 - Acid invertase activity (expressed as A g-1 fresh weight) measured at 0, 3, 5, 7 and 9 day in cucumber cotyledons, as a function of UV-B time-dose irradiation. Data of the stressed plants significantly different from respective control are expressed as * P<0.05, ** P<0.01
0
1
2
3
4
5
0 3 5 7 9
Glu
cosi
dase
act
ivity
(um
ole
p-N
P / m
g pr
otei
ns)
days of stresscontrol UV-B
****
*
*
FIGURE 4 - Glucosidase activity (expressed as µ mol p-NP/ mg protein) measured at 0, 3, 5, 7 and 9 day in cucumber cotyledons, as a func-tion of UV-B time-dose irradiation. Data of the stressed plants significantly different from respective control are expressed as * P<0.05, ** P<0.01
According to the above presented results, i.e. an in-
crease in soluble carbohydrate contents, radiation stress applied at the germination stage generally leads to an increase in the UV-B time-dose dependent activity of two enzymes connected with carbohydrate metabolism. Inver-tase activity (Fig. 3) rose to 143%, 140%, 141% and 203% at 3, 5, 7 and 9 days of stress versus the respective control activity; additionally, in control plants an opposite effect, i.e. a time-dependent decrease of enzyme activity, was observed, amounting to 98%, 94%, 86% and 54% at 3, 5, 7 and 9 days of stress versus the activity in control seed-
lings at the beginning of the experiment. Invertase ap-pears to provide hexoses for both metabolic reactions and biosynthetic carbon skeletons. A similar effect was ob-served in UV-B irradiated Asian pear fruit [36] and lem-ons [10].
Glucosidase activity (Fig. 4) increased to 123%,
132%, 142% and 113% at 3, 5, 7 and 9 days of stress versus the respective control activity, while in the control plants generally a stable level of enzyme activity through-out the experiment was observed. Glucosidase activity
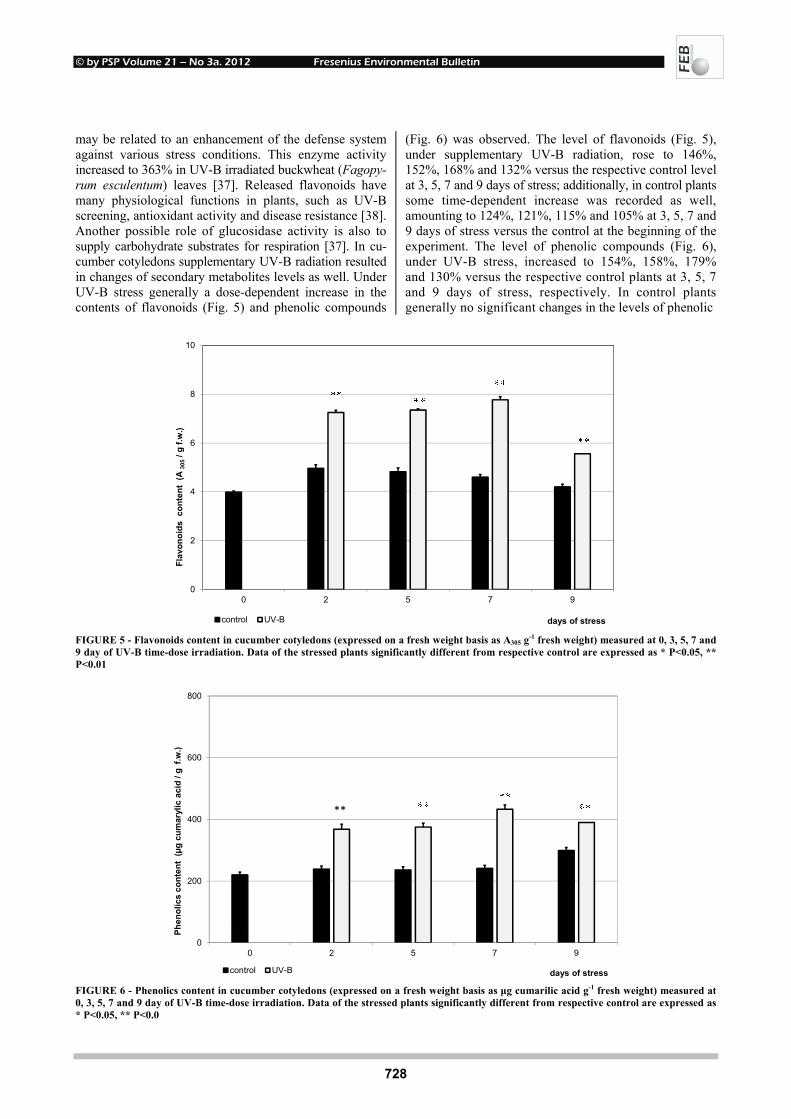
© by PSP Volume 21 – No 3a. 2012 Fresenius Environmental Bulletin
728
may be related to an enhancement of the defense system against various stress conditions. This enzyme activity increased to 363% in UV-B irradiated buckwheat (Fagopy-rum esculentum) leaves [37]. Released flavonoids have many physiological functions in plants, such as UV-B screening, antioxidant activity and disease resistance [38]. Another possible role of glucosidase activity is also to supply carbohydrate substrates for respiration [37]. In cu-cumber cotyledons supplementary UV-B radiation resulted in changes of secondary metabolites levels as well. Under UV-B stress generally a dose-dependent increase in the contents of flavonoids (Fig. 5) and phenolic compounds
(Fig. 6) was observed. The level of flavonoids (Fig. 5), under supplementary UV-B radiation, rose to 146%, 152%, 168% and 132% versus the respective control level at 3, 5, 7 and 9 days of stress; additionally, in control plants some time-dependent increase was recorded as well, amounting to 124%, 121%, 115% and 105% at 3, 5, 7 and 9 days of stress versus the control at the beginning of the experiment. The level of phenolic compounds (Fig. 6), under UV-B stress, increased to 154%, 158%, 179% and 130% versus the respective control plants at 3, 5, 7 and 9 days of stress, respectively. In control plants generally no significant changes in the levels of phenolic
0
2
4
6
8
10
0 2 5 7 9
Flav
onoi
ds c
onte
nt (
A 30
5/ g
f.w
.)
days of stresscontrol UV-B
FIGURE 5 - Flavonoids content in cucumber cotyledons (expressed on a fresh weight basis as A305 g-1 fresh weight) measured at 0, 3, 5, 7 and 9 day of UV-B time-dose irradiation. Data of the stressed plants significantly different from respective control are expressed as * P<0.05, ** P<0.01
0
200
400
600
800
0 2 5 7 9
Phen
olic
s co
nten
t (µ
g cu
mar
ylic
aci
d / g
f.w
.)
days of stresscontrol UV-B
**
FIGURE 6 - Phenolics content in cucumber cotyledons (expressed on a fresh weight basis as µg cumarilic acid g-1 fresh weight) measured at 0, 3, 5, 7 and 9 day of UV-B time-dose irradiation. Data of the stressed plants significantly different from respective control are expressed as * P<0.05, ** P<0.0

© by PSP Volume 21 – No 3a. 2012 Fresenius Environmental Bulletin
729
compounds were observed during the experiment. One of the main protection mechanisms against UV is the accu-mulation of secondary metabolites [38,39]. The most pro-nounced response to UV was found in the accumulation of species-specific secondary metabolites of two Brassi-caceae [40], but decrease of specific phenolic compounds was also noted [41]. Significant amounts of these flavon-oids were accumulated in the leaf epidermis and they play a role in UV screening [6]. Our focus on the accumulation of these phenolic compounds has, perhaps, obscured the fact of UV-B induced changes in a range of different plant metabolites, including anti-oxidants, alkaloids and isopre-noids. Jansen et al. [30] suggested that human consumers do benefit from UV-B stress-induced changes in the plant metabolome, thus it is advisable to assess nutritional and/or medicinal consequences of plant stress acclima-tion.
4. CONCLUSIONS
Despite depression of photosynthesis an increase was observed in the concentrations of chloroplast pigments (chlorophyll and carotenoids)
Supplementary UV-B radiation also resulted in an in-crease in the availability of primary metabolites soluble sugars (fructose, glucose and sucrose) and secondary metabolites (flavonoids and phenolic compounds)
Radiation stress leads to a UV-B time-dose dependent increase in the activity of two enzymes connected with carbohydrate metabolism, i.e. invertase and glucosidase
REFERENCES
[1] Kakani, V.G. Reddy, K.R. Zhao, D. and Sailaja, K. (2003). Field Crops responses to ultraviolet-B radiation: a review. Agricultural and Forest Meteorology 120, 191-218.
[2] UNEP. (2002). Executive summary. Final of UNEP/WMO Scientific Assessment of Ozone Depletion: 2002. Prepared by the Scientific Assessment Panel of the Montreal Protocol on Substances that Deplete the Ozone Layer. UNEP, Nairobi (released 23 August 2002).
[3] Madronich, S. Mckenzie, L.O. Björn, L.O. and Caldwell, M.M. (1998). Changes in biologically active ultraviolet ra-diation reaching the earth’s surface. Journal of Phytochemis-try and Photobiology. B, Biology 46, 5-19.
[4] Mittler, R. (2006). Abiotic stress, the field environment and stress combination. TRENDS in Plant Science 11, 15-19.
[5] Mishra, V. Srivastava, G. Prased, S.M. and Abraham, G. (2008). Growth, Photosynthetic pigments and photosynthetic activity during seedlings stage of cowpea (Vigna unguicu-lata) in response to UV-B and dimethoate. Pesticide Bio-chemistry and Physiology 92, 30-37.
[6] Frohnmeyer, H. and Staiger, D. (2003). Ultraviolet-B radia-tion-mediated responses in plants. Balancing damage and protection. Plant Physiology 133, 1420-1428.
[7] Jansen, M.A.K. Gaba, V. and Greenberg, B.M. (1998). Higher plants and UV-B radiation: balancing damage, repair and acclimation. Trends in Plant Science 3, 131-135.
[8] Caldwell, M.M. Ballaré, C.L. Borman, J.F. Flint, S.D. Björn, L.O, Teramura, A.H. Kulandaivelu, G. and Tevini, M. (2003). Terrestrial ecosystems, increased solar ultraviolet ra-diation and interaction with other climatic change factors. Photochemical & Photobiological Sciences 2, 29-38.
[9] Gwynn-Jones, D. (2001). Short-term impact of enhanced UV-B radiation on photoassimilate allocation and metabo-lism: a possible interpretation for time-dependent inhibition of growth. Plant Ecology 154, 67-73.
[10] Interdonato, R. Rosa, M. Nieva, C.B. Gonzáles, J.A. Hilal, M. and Prado, F.E. (2011). Effects of low UV-B doses on the ac-cumulation of UV-B absorbing compounds and total phenolics and carbohydrate metabolism in the peel of harvested lemons. Environmental and Experimental Botany 70, 204-211.
[11] Hahlbrock, K, and Scheel D. (1989). Physiology and molecular biology of phenylpropanoid metabolism. Annual Review of Plant Physiology and Plant Molecular Biology 40, 347–369.
[12] Hiscox, J.D. and Israelstam, G.F. (1979) A method for the extraction of chlorophyll from leaf tissue without maceration. Canadian Journal of Botany 5, 1332-1334.
[13] Nygara, J.H. Vibe, G. and Bach, K. K.E. (1996) Influence of extraction solvent and temperature on the qualitative deter-mination of oligosaccharies from plant materials by high-performance liquid chromatography. Journal of Agricultural and Food Chemistry 44, 1470-1474.
[14] Copeland, L. and Lea, P.J. (1990) Enzymes of sucrose me-tabolism. Methods Plant Biochemistry. Acad. Press London. 3, 73-86.
[15] Nichols, E.J. Beckman, J. M. and Hadwiger, L.A. (1980) Glycosidic enzyme activity in pea tissues and pea-Fusarium solani interaction. Plant Physiology 66, 199-204
[16] Swain, T. and Hillis, W.E. (1959) The phenolic constituents of Prunus domestica. I. The quantitative analysis of phenolic constituents. Journal of the Science of Food and Agriculture 10, 63-68.
[17] Caldwell, M.M. Flint, S.D. and Searles, P.S. (1994) Spectral balance and UV-B sensitivity of soybean: a field experiment. Plant, Cell & Environment 17, 267-276.
[18] Bradford, M.M. (1976). A rapid and sensitive method for the quantitation of microgram quantities of protein utilizing the principle of protein-dye binding. Analytical Biochemistry 72, 248-254.
[19] Rybus-Zając, M. and Kubiś, J. 2010. Effect of UV-B radia-tion on antioxidative enzyme activity in cucumber cotyledons. Acta Biologica Cracoviensia Series Botanica 52, 97–102.
[20] Correia, C.M. Moutinho-Pereira, J.M. Coutinho, J.F. Björn, L.O. and Torres-Pereira, J.M.G. (2005) Ultraviolet-B radia-tion and nitrogen affect the photosynthesis of maize: a Medi-terranean field study. European Journal of Agronomy 22, 337–347.
[21] Agrawal, S.B. and Rathore, D. (2007) Changes in oxidative stress defense system in wheat (Triticum aestivum L.) and mung bean (Vigna radiata L.) cultivars grown with and with-out mineral nutrients and irradiated by supplemental ultravio-let-B. Environmental and Experimental Botany 59, 21-33.
© by PSP Volume 21 – No 3a. 2012 Fresenius Environmental Bulletin
730
[22] Han, C. Liu, Q. and Yang, Y. (2009) Short-term effects of experimental warming and enhanced ultraviolet-B radiation on photosynthesis and antioxidant defense of Picea asperata seedlings. Plant Growth Regulation 58, 153-162.
[23] Salama, H.M.H. Al Watban, A.A. and Al-Fughom, A.T. (2011) Effect of ultraviolet radiation on chlorophyll, carote-noid, protein and proline contents of some annual desert plants. Saudi Journal of Biological Sciences 18, 79–86.
[24] Barsig, M. and Maiz, R. (2000) Fine structure, carbohydrates and photosynthetic pigments of sugar maize leaves under UV-B radiation. Environmental and Experimental Botany 43, 121–134.
[25] Zheng, Y. Gao, W. Slusser, J.R Grant, R.H. and Wang, C.H. (2003) Yield and yield formation of field winter wheat in re-sponse to supplemental solar ultraviolet-B radiation. Agricul-tural and Forest Meteorology 120, 279–293.
[26] Zu, Y. Li, Y. Chen J. and Chen, H. (2004) Intra-specific re-sponses in grain quality of 10 wheat cultivars to enhanced UV-B radiation under field conditions. Journal of Photo-chemistry and Photobiology 74, 95–117.
[27] Brzezińska E., Kozłowska M. and Stachowiak J. (2006). Re-sponse of three conifer species to enhanced UV-B radiation; consequences for photosynthesis. Polish Journal of Environ-mental Study 15, 531-536.
[28] Pfundel, E.E. Ppan, R.S. and Dilley, R.A. (1992) Inhibition of violaxanthin deep oxidation by ultraviolet-b radiation in isolated chloroplasts and intact leaves. Journal of Plant Physiology 98, 1372–1380.
[29] Barsig, M. Gehrke, C. and Schneider, K. (1998) Effects of UV-B radiation on fine structure, carbohydrates and pig-ments in Polytrichum commune. Bryologist 101, 357–365.
[30] Jansen, M.A.K. Hectors, K. O’Brien, N.M. Guisez, Y. and Potters, G. (2008) Plant stress and human health: Do human consumers benefit from UV-B acclimated crops? Plant Sci-ence 175, 449–458.
[31] Tevini, M. (1996) Erhöhte UV-B-Strahlung: Ein Risiko für Nutzpflanzen? Biologie in unserer Zeit 26, 245–254.
[32] Yue, M. Li, Y. and Wang, X. (1998) Effects of enhanced ul-traviolet-B radiation on plant nutrients and decomposition of spring wheat under field conditions. Environmental and Ex-perimental Botany 40, 187–196.
[33] Newsham, K.K. Splatt, P. Coward, P.A. Greenslade, P.D. McLeod, A.R. and Anderson, J.M. (2001) Negligible influ-ence of elevated UV-B radiation on leaf litter quality of Quercus robur. Soil Biology & Biochemistry 33: 659-665.
[34] Garrard, L.A. Van, T.K. and West, S.H. (1977) Plant re-sponse to middle ultraviolet (UV-B) radiation: carbohydrate levels and chloroplast reactions. Crop Sciences 36, 184–188.
[35] Farrar, J. F. (1989) The carbon balance of fast-growing and slow-growing species. Pp. 241–245. In: Lambers, H (ed.), Causes and Consequence of Variation in Growth Rate and Productivity of Higher Plants, Vol. 1. SPB Academic Pub-lishing, The Hague.
[36] Muriguchi, T. Abe, K. Sanada, T. and Yamaki, S. (1992) Levels and role of sucrose synthase, sucrose phospate syn-thase, and acid invertase in sucrose accumulation in fruit of Asian pear. Journal of the American. Society for Horticul-tural Science 117, 274–276.
[37] Suzuki, T, Honda, Y. and Mukasa, Y. (2005) Effects of UV-B radiation, cold and desiccation stress on rutin concentration and rutin glucosidase activity in tartary buckwheat (Fagopy-rum tataricum) leaves. Plant Science 168, 1303–1307.
[38] Harborne, J.B. and Williams, C.A. (2000) Advances in fla-vonoid research since 1992. Phytochemistry 55, 481–504.
[39] Kolb, C.A. Käser, M.A. Kopecký, J. Zotz, G. Riederer, M. and Pfűndel, E. (2001) Effects of natural intensities of visible and ultraviolet radiation on epidermal ultraviolet screening and photosynthesis in grape leaves. Plant Physiology 127, 863–875.
[40] Reifenrath, K. and Müller, C. (2007) Species-specific and leaf-age dependent effects of ultraviolet radiation on two Brassicaceae. Phytochemistry 68, 875–885.
[41] Urban, O. Vrchotová, N. Triska, J. and Marek M.V. (2008) Enhanced UV-B radiation may lead to the decrease of spe-cific phenolic compounds in Norway spruce needles. Fresen-ius Environmental Bulletin 17, 564-567.
Received: August 03, 2011 Revised: October 26, 2011 Accepted: November 08, 2011 CORRESPONDING AUTHOR
Jan Kubiś Department of Plant Physiology Poznań University of Life Sciences Wołyńska 35 60-637 Poznań POLAND Phone: 48 61 8466039 FAX: 48 61 8487179 E-mail: [email protected]
FEB/ Vol 21/ No 3a/ 2012 – pages 723- 730

© by PSP Volume 21 – No 3a. 2012 Fresenius Environmental Bulletin
731
REMOVAL OF ENDOCRINE DISRUPTING COMPOUNDS AND ESTROGENIC ACTIVITY FROM SECONDARY
EFFLUENTS DURING TiO2 PHOTOCATALYSIS
Wenlong Zhang1, Yi Li1,*, Kai Mao1 and Guoping Li2
1Key Laboratory of Integrated Regulation and Resource Development of Shallow Lakes, Ministry of Education, College of Environmental Science and Engineering, Hohai University, Xi Kang Road #1, Nanjing 210098, PR China
2Jiangsu Provincial Academy of Environmental Science, Nanjing, 210036, PR China
ABSTRACT
This paper presents the results of application of TiO2 photocatalysis in advanced wastewater treatment to simu-late the removal of endocrine disrupting compounds (i.e., bisphenol A, nonylphenol, estrone, and 17α-estradiol) and estrogenic activity from secondary effluents of a munici-pal wastewater treatment plant, aiming to evaluate the possibility of application of photocatalysis for advanced wastewater treatment. The removal efficiencies of alkyl-hydroxybenzene (bisphenol A, nonylphenol) by traditional process in wastewater treatment plant are more sensitive to temperature than steroid hormones (estrone, and 17α-estradiol), resulting in a risk of effluent insecurity. All the targeted EDCs in secondary effluent could be totally de-graded by TiO2 photocatalysis within 60 min except BPA (92% removal), following pseudo first-order kinetics. The estrogenic activity, expressed as the E2 equivalent concen-tration (EEQ), was also totally removed during the same process. The mechanisms for the photocatalytic removal of EDCs and estrogenic activity were proposed according to the experimental results. When EDCs reacted with hydroxyl radicals, aromatic rings were cleaved, resulting in a de-creased estrogenic activity. The findings suggest that TiO2 photocatalysis is an effective method for removal of cer-tain EDCs and estrogenic activity from secondary efflu-ents and can be used for advanced wastewater treatment.
KEYWORDS: photocatalysis; titanium dioxide; endocrine disrupt-ing compounds; estrogenic activity; secondary effluent
* Corresponding author
1. INTRODUCTION
In recent years, wastewater reclamation has been con-sidered a viable and attractive method for solving water shortage. The presence of micropollutants in wastewater treatment plant effluents is, however, believed to cause adverse effects in the environment and has been exten-sively documented [1-3]. According to these studies, endo-crine disrupting compounds (EDCs) are responsible for a significant proportion of reproductive and sexual abnormali-ties in wildlife. Unfortunately, in most countries, including China, the only standard for determining organic pollution in reclaimed wastewater is the chemical oxygen demand. EDCs are ignored, potentially threatening water utility customers during wastewater reuse.
To remove EDCs and estrogenic activity from waste-water that is intended for direct or indirect reuse, various methods have been developed as advanced wastewater treatment processes [4, 5]. Among them, TiO2 heteroge-neous photocatalysis has attracted increasing attention during the past few years. Coleman et al. [6] compared temporal changes in the estrogenic activity of E1, E2, and 17α-ethinylestradiol (EE2) using both UVA photolysis and immobilized-TiO2 photocatalysis in synthetic water. The three estrogens were decomposed with virtually all the estrogenic activity removed within 55 min. Benotti et al. [7] evaluated the removal of 32 pharmaceuticals and EDCs from surface water with a photocatalytic reactor membrane pilot system. The results showed that twenty-nine of the targeted compounds in addition to total estro-genic activity were greater than 70% removed while only three compounds were less than 50% removed following the highest level of treatment.
Compared with the synthetic and surface water, how-ever, many more microorganisms and dissolved organic matter (DOM) are found in secondary effluents from wastewater treatment plants. The present matter will cause many complicated photocatalytic reactions in solutions. The present study aims to investigate the removal of four
© by PSP Volume 21 – No 3a. 2012 Fresenius Environmental Bulletin
732
EDCs [estrone (E1), 17α-estradiol (E2), nonylphenol (NP), and bisphenol A (BPA)] and estrogenic activity from sec-ondary effluents. Possible mineralization processes of EDCs are also discussed.
2. MATERIALS AND METHODS
2.1. Materials
Titanium dioxide (Degussa P25, 30 nm particle size, and 50±15m2•g−1 BET surface area) used as the catalyst was purchased from Aldrich (Dorset, UK). The four es-trogenic compounds (E1, E2, NP, and BPA) were pur-chased from Sigma-Aldrich (USA) and used without fur-ther purification. All organic solvents used including metha-nol, acetone, and dichloromethane were purchased from Rathburns (Scotland). BSTFA containing 1% of trimethyl-chlorosilane was supplied by Aldrich (Dorset, UK). Pyri-dine was supplied by Rathburns (Scotland). Ultrapure deionised water was obtained from a Maxima Unit from USF Elga, UK.
2.2. Photocatalytic experiments
Wastewater samples of influents and secondary efflu-ents were collected from the Chengbei Domestic Waste-water Treatment Plant (Suzhou, China) in July and De-cember 2009. All the samples were collected, stored in 1 or 4 L acid-washed amber bottles, and placed on ice for transport to the laboratory, where they were processed immediately for later extraction and analysis.
The experiments were conducted in a cylindrical glass reactor (60 cm height, 18 cm outer diameter, and 15 cm inner diameter). The secondary effluent collected in De-cember was used as test solution. The major characteristics of the tested secondary effluent were shown in Table 1. The double-walled glass reservoir was equipped with ther-mostatically controlled water flowing between the outer walls. The TiO2 powder was added into the solution (8 L) to give a concentration of 1 g/L [8]. The aqueous solutions were stirred in dark with a magnetic stirrer for 30 min after TiO2 was added. Then, the suspension was irradiated with a Philips TL 6-W black light lamp placed in the y-axis of the reactor. The lamp provided a nominal UVA radiation of 0.7 W with a maximum emission peak centered at 365 nm. The incident photon flux was 2.8×10⁻⁴ einstein•m-2•s-1. The solution was sampled for analysis from the reactor cell using a glass syringe at specified time intervals during
TABLE 1 - Major characteristics of the tested secondary effluent
Parameter Value Parameter Value pH 7.2 Total phosphorus (mg /L) 1.7 COD (mg/L) 48 SS (mg/L) 30.4(2.1*) TOC (mg/L) 8.6 E1 (ng/L) 29.6 DOC (mg/L) 7.4 E2 (ng/L) 13.7 UV254 (m-1) 15.5 NP (ng/L) 221.5 Nitrate (mg N/L) 4.8 BPA (ng/L) 46.5 Ammonia (mg N/L) 6.1 Estrogenic activity (ng/L) 64.34 *: after filtration
degradation. Then the water samples were separated by filtration with a 0.22 µm glass fiber filter.
2.3. Analytical methods
Water samples were first separated by filtration with a 1 µm glass fiber filter (GF/B, Whatman). The filtrate was acidified to pH 3 by 99% H2SO4 before solid phase ex-traction (SPE). Then the dried eluate post-SPE was deri-vatized with 100 µL of pyridine and 50 µL of N,O-bis-(trimethylsilyl)trifluoroacetamide containing 1% tri-methyl-chlorosilane (Sigma) at 70°C for 60 min. Thereafter, the solution was cooled down to room temperature. EDC analysis was carried out using a gas chromatography/mass spectrometry (GC/MS) system. The GC/MS system (GC: 7890 Series; MS: 5975c Network, Agilent) used a DB-5MS capillary column (30 mm × 0.25 mm × 0.25 µm) for organic separation and high-purity helium gas as carrier gas at a constant flow rate of 1 mL/min. The GC oven tempera-ture was programmed as follows: the oven was equilibrated at an initial temperature of 60°C for 1 min; the temperature successively increased to 200°C (10°C/min), 260°C (15°C/min), and 285°C (3°C /min); and the temperature was maintained at 285°C for 2 min. The inlet, MS transfer line, and ion source temperatures were set at 280, 280, and 250°C, respectively. The quantification and confirma-tion ions used in the selected ion monitoring mode were as follows: m/z 292.00 179.00 (NP), m/z 372.20 357.20 (BPA), m/z 342.20 281.10 257.10 (E1), and m/z 416.30 285.20 232.10 (E2).
The estrogenic activity of the concentrated samples was evaluated with the yeast two-hybrid assay based on yeast cells (Saccharomyces cerevisiae Y190) containing the rat estrogen receptor ERα and the coactivator TIF2 [9]. In this assay, the yeast cells were preincubated overnight at 30 °C. The 100 µL overnight yeast culture and 20 µL DMSO solution containing the samples were added to 400 µL of fresh medium and incubated for 4 h at 30 °C. After incubation, 150 µL of yeast culture was fractioned for the absorbance at 595 nm. The residual culture (370 µL) was collected by centrifugation and then digested by incu-bation with 1 g/L Zymolyase 20T at 37 °C for 15 min. The enzymatic reaction was started by addition of 4 g/L 2-nitrophenyl-β-D-galactoside (ONPG) at 30 °C and then stopped by addition of 1 M Na2CO3 after 30 min. Thereaf-ter, the solution was centrifuged and 150 µL of supernatant liquid was taken for the absorbance at 415 and 570 nm. The absorbance at 415, 570, and 595 nm was converted to β-galactosidase activity.
3. RESULTS AND DISCUSSION
3.1. Monitoring of E1, E2, BPA, NP in wastewater
Concentrations of E1, E2, NP, and BPA in secondary effluents collected in July were 27, 13.1, 170, and 28 ng/L. In the December samples, concentrations of E1, E2, NP, and BPA were 30, 13.5, 220, and 47 ng/L (Table 2). The re-
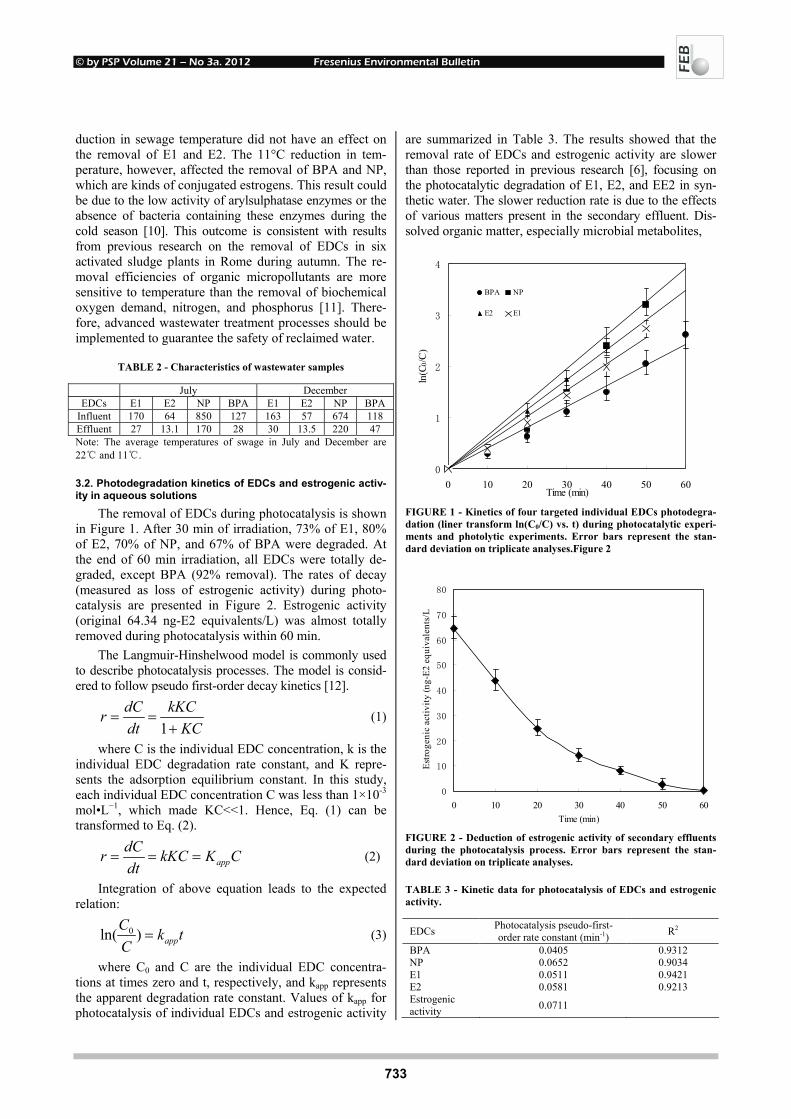
© by PSP Volume 21 – No 3a. 2012 Fresenius Environmental Bulletin
733
duction in sewage temperature did not have an effect on the removal of E1 and E2. The 11°C reduction in tem-perature, however, affected the removal of BPA and NP, which are kinds of conjugated estrogens. This result could be due to the low activity of arylsulphatase enzymes or the absence of bacteria containing these enzymes during the cold season [10]. This outcome is consistent with results from previous research on the removal of EDCs in six activated sludge plants in Rome during autumn. The re-moval efficiencies of organic micropollutants are more sensitive to temperature than the removal of biochemical oxygen demand, nitrogen, and phosphorus [11]. There-fore, advanced wastewater treatment processes should be implemented to guarantee the safety of reclaimed water.
TABLE 2 - Characteristics of wastewater samples
July December EDCs E1 E2 NP BPA E1 E2 NP BPA
Influent 170 64 850 127 163 57 674 118 Effluent 27 13.1 170 28 30 13.5 220 47 Note: The average temperatures of swage in July and December are 22 and 11.
3.2. Photodegradation kinetics of EDCs and estrogenic activ-ity in aqueous solutions
The removal of EDCs during photocatalysis is shown in Figure 1. After 30 min of irradiation, 73% of E1, 80% of E2, 70% of NP, and 67% of BPA were degraded. At the end of 60 min irradiation, all EDCs were totally de-graded, except BPA (92% removal). The rates of decay (measured as loss of estrogenic activity) during photo-catalysis are presented in Figure 2. Estrogenic activity (original 64.34 ng-E2 equivalents/L) was almost totally removed during photocatalysis within 60 min.
The Langmuir-Hinshelwood model is commonly used to describe photocatalysis processes. The model is consid-ered to follow pseudo first-order decay kinetics [12].
1dC kKCrdt KC
= =+
(1)
where C is the individual EDC concentration, k is the individual EDC degradation rate constant, and K repre- sents the adsorption equilibrium constant. In this study, each individual EDC concentration C was less than 1×10⁻³ mol•L−1, which made KC<<1. Hence, Eq. (1) can be transformed to Eq. (2).
appdCr kKC K Cdt
= = = (2)
Integration of above equation leads to the expected relation:
0ln( ) appC k tC
= (3)
where C0 and C are the individual EDC concentra-tions at times zero and t, respectively, and kapp represents the apparent degradation rate constant. Values of kapp for photocatalysis of individual EDCs and estrogenic activity
are summarized in Table 3. The results showed that the removal rate of EDCs and estrogenic activity are slower than those reported in previous research [6], focusing on the photocatalytic degradation of E1, E2, and EE2 in syn-thetic water. The slower reduction rate is due to the effects of various matters present in the secondary effluent. Dis-solved organic matter, especially microbial metabolites,
0
1
2
3
4
0 10 20 30 40 50 60Time (min)
ln(C
0/C)
BPA NP
E2 E1
FIGURE 1 - Kinetics of four targeted individual EDCs photodegra-dation (liner transform ln(C0/C) vs. t) during photocatalytic experi-ments and photolytic experiments. Error bars represent the stan-dard deviation on triplicate analyses.Figure 2
0
10
20
30
40
50
60
70
80
0 10 20 30 40 50 60Time (min)
Estro
geni
c ac
tivity
(ng-
E2 e
quiv
alen
ts/L
FIGURE 2 - Deduction of estrogenic activity of secondary effluents during the photocatalysis process. Error bars represent the stan-dard deviation on triplicate analyses.
TABLE 3 - Kinetic data for photocatalysis of EDCs and estrogenic activity.
EDCs Photocatalysis pseudo-first-order rate constant (min-1) R2
BPA 0.0405 0.9312 NP 0.0652 0.9034 E1 0.0511 0.9421 E2 0.0581 0.9213 Estrogenic activity 0.0711
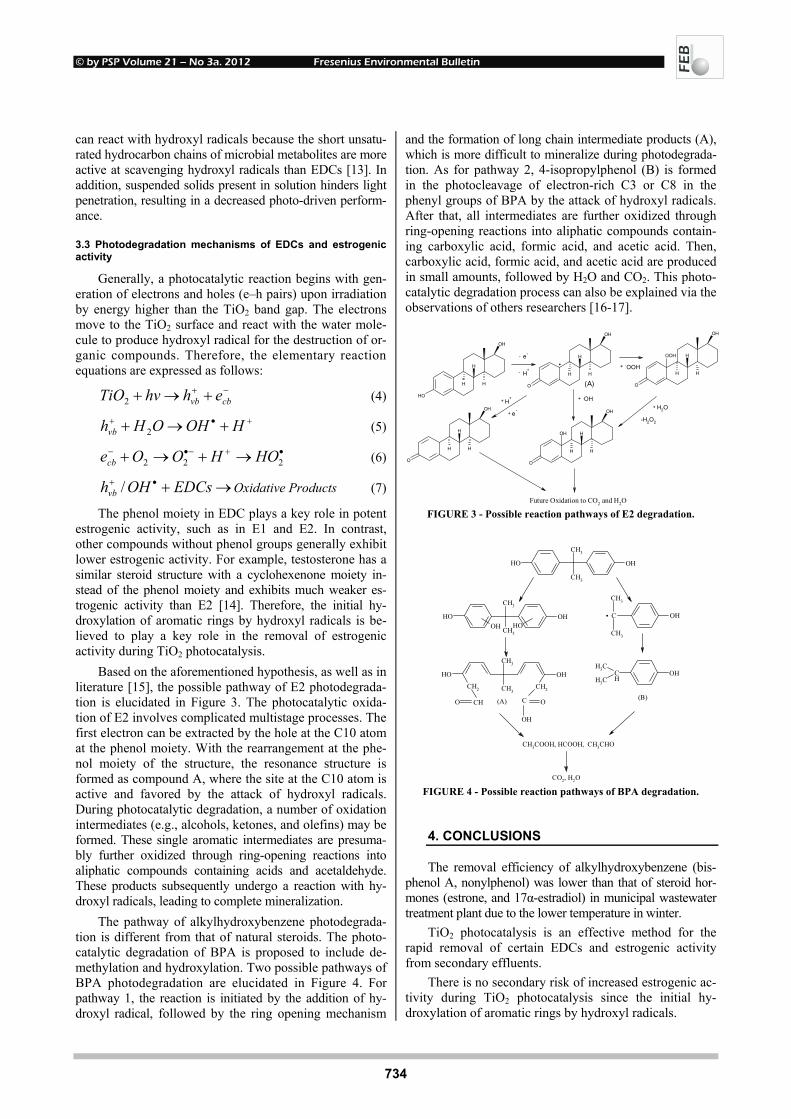
© by PSP Volume 21 – No 3a. 2012 Fresenius Environmental Bulletin
734
can react with hydroxyl radicals because the short unsatu-rated hydrocarbon chains of microbial metabolites are more active at scavenging hydroxyl radicals than EDCs [13]. In addition, suspended solids present in solution hinders light penetration, resulting in a decreased photo-driven perform-ance.
3.3 Photodegradation mechanisms of EDCs and estrogenic activity
Generally, a photocatalytic reaction begins with gen-eration of electrons and holes (e–h pairs) upon irradiation by energy higher than the TiO2 band gap. The electrons move to the TiO2 surface and react with the water mole-cule to produce hydroxyl radical for the destruction of or-ganic compounds. Therefore, the elementary reaction equations are expressed as follows:
−+ +→+ cbvb ehhvTiO2 (4)
+•+ +→+ HOHOHhvb 2 (5)
•+−•− →+→+ 222 HOHOOecb (6)
→+•+ EDCsOHhvb / Oxidative Products (7)
The phenol moiety in EDC plays a key role in potent estrogenic activity, such as in E1 and E2. In contrast, other compounds without phenol groups generally exhibit lower estrogenic activity. For example, testosterone has a similar steroid structure with a cyclohexenone moiety in-stead of the phenol moiety and exhibits much weaker es-trogenic activity than E2 [14]. Therefore, the initial hy-droxylation of aromatic rings by hydroxyl radicals is be-lieved to play a key role in the removal of estrogenic activity during TiO2 photocatalysis.
Based on the aforementioned hypothesis, as well as in literature [15], the possible pathway of E2 photodegrada-tion is elucidated in Figure 3. The photocatalytic oxida-tion of E2 involves complicated multistage processes. The first electron can be extracted by the hole at the C10 atom at the phenol moiety. With the rearrangement at the phe-nol moiety of the structure, the resonance structure is formed as compound A, where the site at the C10 atom is active and favored by the attack of hydroxyl radicals. During photocatalytic degradation, a number of oxidation intermediates (e.g., alcohols, ketones, and olefins) may be formed. These single aromatic intermediates are presuma-bly further oxidized through ring-opening reactions into aliphatic compounds containing acids and acetaldehyde. These products subsequently undergo a reaction with hy-droxyl radicals, leading to complete mineralization.
The pathway of alkylhydroxybenzene photodegrada-tion is different from that of natural steroids. The photo-catalytic degradation of BPA is proposed to include de-methylation and hydroxylation. Two possible pathways of BPA photodegradation are elucidated in Figure 4. For pathway 1, the reaction is initiated by the addition of hy-droxyl radical, followed by the ring opening mechanism
and the formation of long chain intermediate products (A), which is more difficult to mineralize during photodegrada-tion. As for pathway 2, 4-isopropylphenol (B) is formed in the photocleavage of electron-rich C3 or C8 in the phenyl groups of BPA by the attack of hydroxyl radicals. After that, all intermediates are further oxidized through ring-opening reactions into aliphatic compounds contain-ing carboxylic acid, formic acid, and acetic acid. Then, carboxylic acid, formic acid, and acetic acid are produced in small amounts, followed by H2O and CO2. This photo-catalytic degradation process can also be explained via the observations of others researchers [16-17].
H
OH
H H
OH
H
OH
H H
O
H
OH
H H
O
H+
e
H
OH
H H
O
OH
OH
H
OH
H H
O
OOH
OOH
H2O
-H2O2
Future Oxidation to CO2 and H2O
-
- e.
H+
..
.
-
-
(A)
+
+
+
+
+
FIGURE 3 - Possible reaction pathways of E2 degradation.
CH3
CH3
OHOH
OH
CH3COOH, HCOOH, CH3CHO
CO2, H2O
OHC
CH3
CH3
.
CH2CH2 CH3
CH3
OH OH
CH3
CH3
OHOH
O
OH
CO CH
OHCHCH3
CH3
(A) (B)
OH
FIGURE 4 - Possible reaction pathways of BPA degradation. 4. CONCLUSIONS
The removal efficiency of alkylhydroxybenzene (bis-phenol A, nonylphenol) was lower than that of steroid hor-mones (estrone, and 17α-estradiol) in municipal wastewater treatment plant due to the lower temperature in winter.
TiO2 photocatalysis is an effective method for the rapid removal of certain EDCs and estrogenic activity from secondary effluents.
There is no secondary risk of increased estrogenic ac-tivity during TiO2 photocatalysis since the initial hy-droxylation of aromatic rings by hydroxyl radicals.
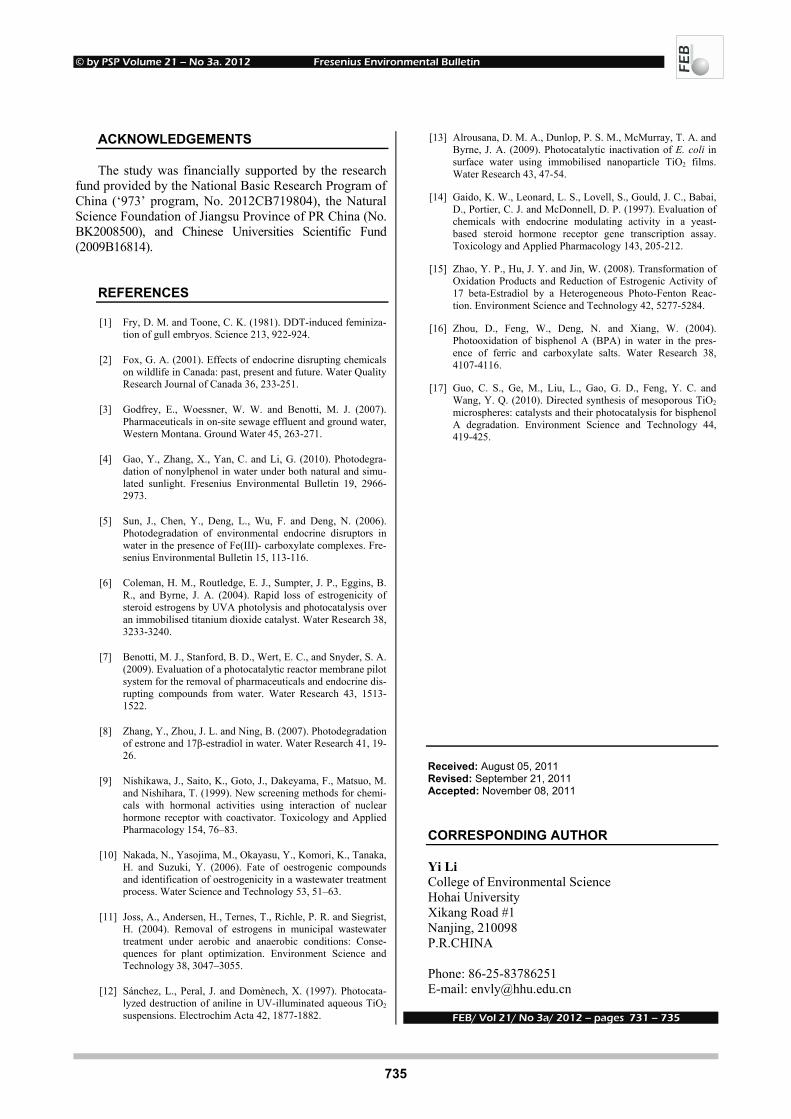
© by PSP Volume 21 – No 3a. 2012 Fresenius Environmental Bulletin
735
ACKNOWLEDGEMENTS
The study was financially supported by the research fund provided by the National Basic Research Program of China (‘973’ program, No. 2012CB719804), the Natural Science Foundation of Jiangsu Province of PR China (No. BK2008500), and Chinese Universities Scientific Fund (2009B16814).
REFERENCES
[1] Fry, D. M. and Toone, C. K. (1981). DDT-induced feminiza-tion of gull embryos. Science 213, 922-924.
[2] Fox, G. A. (2001). Effects of endocrine disrupting chemicals on wildlife in Canada: past, present and future. Water Quality Research Journal of Canada 36, 233-251.
[3] Godfrey, E., Woessner, W. W. and Benotti, M. J. (2007). Pharmaceuticals in on-site sewage effluent and ground water, Western Montana. Ground Water 45, 263-271.
[4] Gao, Y., Zhang, X., Yan, C. and Li, G. (2010). Photodegra-dation of nonylphenol in water under both natural and simu-lated sunlight. Fresenius Environmental Bulletin 19, 2966-2973.
[5] Sun, J., Chen, Y., Deng, L., Wu, F. and Deng, N. (2006). Photodegradation of environmental endocrine disruptors in water in the presence of Fe(III)- carboxylate complexes. Fre-senius Environmental Bulletin 15, 113-116.
[6] Coleman, H. M., Routledge, E. J., Sumpter, J. P., Eggins, B. R., and Byrne, J. A. (2004). Rapid loss of estrogenicity of steroid estrogens by UVA photolysis and photocatalysis over an immobilised titanium dioxide catalyst. Water Research 38, 3233-3240.
[7] Benotti, M. J., Stanford, B. D., Wert, E. C., and Snyder, S. A. (2009). Evaluation of a photocatalytic reactor membrane pilot system for the removal of pharmaceuticals and endocrine dis-rupting compounds from water. Water Research 43, 1513-1522.
[8] Zhang, Y., Zhou, J. L. and Ning, B. (2007). Photodegradation of estrone and 17β-estradiol in water. Water Research 41, 19-26.
[9] Nishikawa, J., Saito, K., Goto, J., Dakeyama, F., Matsuo, M. and Nishihara, T. (1999). New screening methods for chemi-cals with hormonal activities using interaction of nuclear hormone receptor with coactivator. Toxicology and Applied Pharmacology 154, 76–83.
[10] Nakada, N., Yasojima, M., Okayasu, Y., Komori, K., Tanaka, H. and Suzuki, Y. (2006). Fate of oestrogenic compounds and identification of oestrogenicity in a wastewater treatment process. Water Science and Technology 53, 51–63.
[11] Joss, A., Andersen, H., Ternes, T., Richle, P. R. and Siegrist, H. (2004). Removal of estrogens in municipal wastewater treatment under aerobic and anaerobic conditions: Conse-quences for plant optimization. Environment Science and Technology 38, 3047–3055.
[12] Sánchez, L., Peral, J. and Domènech, X. (1997). Photocata-lyzed destruction of aniline in UV-illuminated aqueous TiO2 suspensions. Electrochim Acta 42, 1877-1882.
[13] Alrousana, D. M. A., Dunlop, P. S. M., McMurray, T. A. and Byrne, J. A. (2009). Photocatalytic inactivation of E. coli in surface water using immobilised nanoparticle TiO2 films. Water Research 43, 47-54.
[14] Gaido, K. W., Leonard, L. S., Lovell, S., Gould, J. C., Babai, D., Portier, C. J. and McDonnell, D. P. (1997). Evaluation of chemicals with endocrine modulating activity in a yeast-based steroid hormone receptor gene transcription assay. Toxicology and Applied Pharmacology 143, 205-212.
[15] Zhao, Y. P., Hu, J. Y. and Jin, W. (2008). Transformation of Oxidation Products and Reduction of Estrogenic Activity of 17 beta-Estradiol by a Heterogeneous Photo-Fenton Reac-tion. Environment Science and Technology 42, 5277-5284.
[16] Zhou, D., Feng, W., Deng, N. and Xiang, W. (2004). Photooxidation of bisphenol A (BPA) in water in the pres-ence of ferric and carboxylate salts. Water Research 38, 4107-4116.
[17] Guo, C. S., Ge, M., Liu, L., Gao, G. D., Feng, Y. C. and Wang, Y. Q. (2010). Directed synthesis of mesoporous TiO2 microspheres: catalysts and their photocatalysis for bisphenol A degradation. Environment Science and Technology 44, 419-425.
Received: August 05, 2011 Revised: September 21, 2011 Accepted: November 08, 2011 CORRESPONDING AUTHOR
Yi Li College of Environmental Science Hohai University Xikang Road #1 Nanjing, 210098 P.R.CHINA Phone: 86-25-83786251 E-mail: [email protected]
FEB/ Vol 21/ No 3a/ 2012 – pages 731 – 735
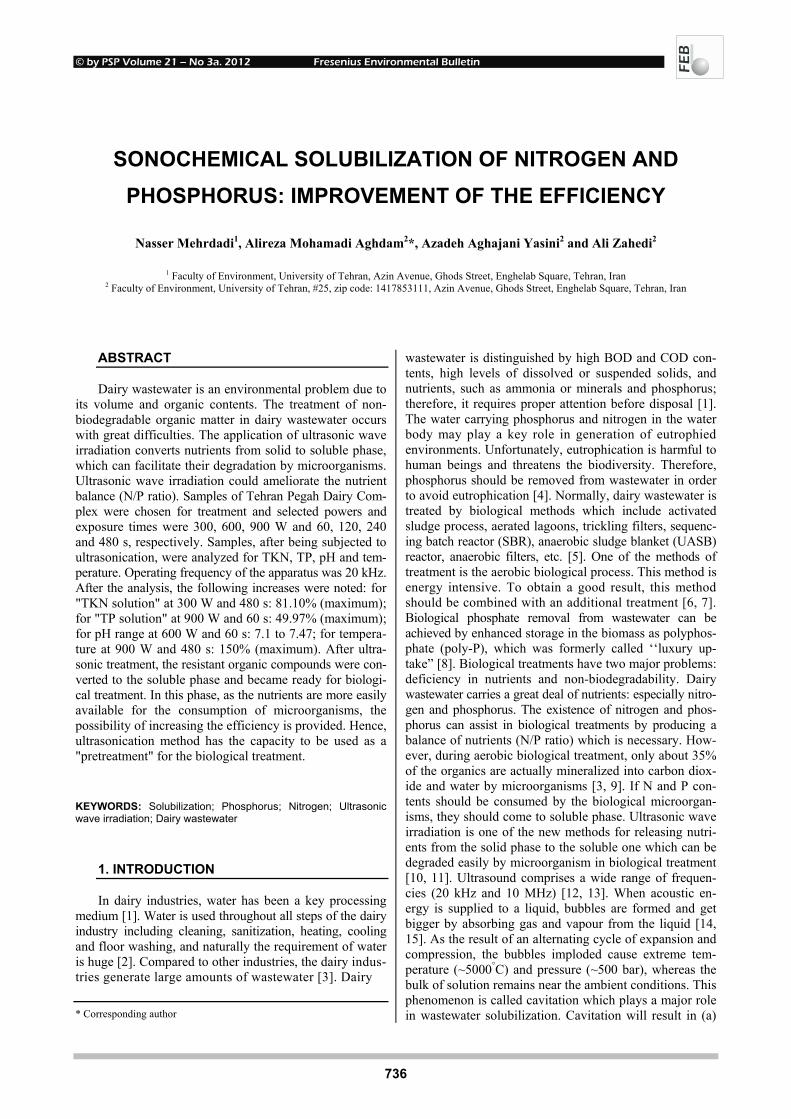
© by PSP Volume 21 – No 3a. 2012 Fresenius Environmental Bulletin
736
SONOCHEMICAL SOLUBILIZATION OF NITROGEN AND PHOSPHORUS: IMPROVEMENT OF THE EFFICIENCY
Nasser Mehrdadi1, Alireza Mohamadi Aghdam2*, Azadeh Aghajani Yasini2 and Ali Zahedi2
1 Faculty of Environment, University of Tehran, Azin Avenue, Ghods Street, Enghelab Square, Tehran, Iran 2 Faculty of Environment, University of Tehran, #25, zip code: 1417853111, Azin Avenue, Ghods Street, Enghelab Square, Tehran, Iran
ABSTRACT
Dairy wastewater is an environmental problem due to its volume and organic contents. The treatment of non-biodegradable organic matter in dairy wastewater occurs with great difficulties. The application of ultrasonic wave irradiation converts nutrients from solid to soluble phase, which can facilitate their degradation by microorganisms. Ultrasonic wave irradiation could ameliorate the nutrient balance (N/P ratio). Samples of Tehran Pegah Dairy Com-plex were chosen for treatment and selected powers and exposure times were 300, 600, 900 W and 60, 120, 240 and 480 s, respectively. Samples, after being subjected to ultrasonication, were analyzed for TKN, TP, pH and tem-perature. Operating frequency of the apparatus was 20 kHz. After the analysis, the following increases were noted: for "TKN solution" at 300 W and 480 s: 81.10% (maximum); for "TP solution" at 900 W and 60 s: 49.97% (maximum); for pH range at 600 W and 60 s: 7.1 to 7.47; for tempera-ture at 900 W and 480 s: 150% (maximum). After ultra-sonic treatment, the resistant organic compounds were con-verted to the soluble phase and became ready for biologi-cal treatment. In this phase, as the nutrients are more easily available for the consumption of microorganisms, the possibility of increasing the efficiency is provided. Hence, ultrasonication method has the capacity to be used as a "pretreatment" for the biological treatment.
KEYWORDS: Solubilization; Phosphorus; Nitrogen; Ultrasonic wave irradiation; Dairy wastewater
1. INTRODUCTION
In dairy industries, water has been a key processing medium [1]. Water is used throughout all steps of the dairy industry including cleaning, sanitization, heating, cooling and floor washing, and naturally the requirement of water is huge [2]. Compared to other industries, the dairy indus-tries generate large amounts of wastewater [3]. Dairy * Corresponding author
wastewater is distinguished by high BOD and COD con-tents, high levels of dissolved or suspended solids, and nutrients, such as ammonia or minerals and phosphorus; therefore, it requires proper attention before disposal [1]. The water carrying phosphorus and nitrogen in the water body may play a key role in generation of eutrophied environments. Unfortunately, eutrophication is harmful to human beings and threatens the biodiversity. Therefore, phosphorus should be removed from wastewater in order to avoid eutrophication [4]. Normally, dairy wastewater is treated by biological methods which include activated sludge process, aerated lagoons, trickling filters, sequenc-ing batch reactor (SBR), anaerobic sludge blanket (UASB) reactor, anaerobic filters, etc. [5]. One of the methods of treatment is the aerobic biological process. This method is energy intensive. To obtain a good result, this method should be combined with an additional treatment [6, 7]. Biological phosphate removal from wastewater can be achieved by enhanced storage in the biomass as polyphos-phate (poly-P), which was formerly called ‘‘luxury up-take” [8]. Biological treatments have two major problems: deficiency in nutrients and non-biodegradability. Dairy wastewater carries a great deal of nutrients: especially nitro-gen and phosphorus. The existence of nitrogen and phos-phorus can assist in biological treatments by producing a balance of nutrients (N/P ratio) which is necessary. How-ever, during aerobic biological treatment, only about 35% of the organics are actually mineralized into carbon diox-ide and water by microorganisms [3, 9]. If N and P con-tents should be consumed by the biological microorgan-isms, they should come to soluble phase. Ultrasonic wave irradiation is one of the new methods for releasing nutri-ents from the solid phase to the soluble one which can be degraded easily by microorganism in biological treatment [10, 11]. Ultrasound comprises a wide range of frequen-cies (20 kHz and 10 MHz) [12, 13]. When acoustic en-ergy is supplied to a liquid, bubbles are formed and get bigger by absorbing gas and vapour from the liquid [14, 15]. As the result of an alternating cycle of expansion and compression, the bubbles imploded cause extreme tem-perature (~5000°C) and pressure (~500 bar), whereas the bulk of solution remains near the ambient conditions. This phenomenon is called cavitation which plays a major role in wastewater solubilization. Cavitation will result in (a)
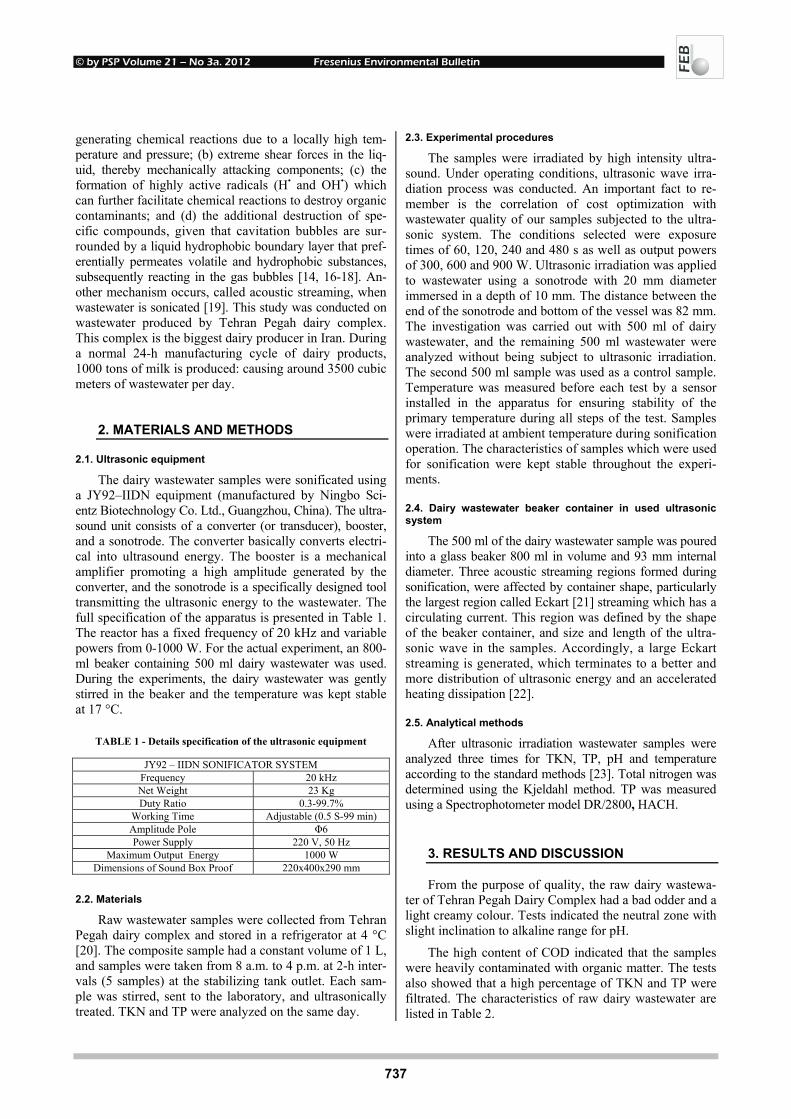
© by PSP Volume 21 – No 3a. 2012 Fresenius Environmental Bulletin
737
generating chemical reactions due to a locally high tem-perature and pressure; (b) extreme shear forces in the liq-uid, thereby mechanically attacking components; (c) the formation of highly active radicals (H• and OH•) which can further facilitate chemical reactions to destroy organic contaminants; and (d) the additional destruction of spe-cific compounds, given that cavitation bubbles are sur-rounded by a liquid hydrophobic boundary layer that pref-erentially permeates volatile and hydrophobic substances, subsequently reacting in the gas bubbles [14, 16-18]. An-other mechanism occurs, called acoustic streaming, when wastewater is sonicated [19]. This study was conducted on wastewater produced by Tehran Pegah dairy complex. This complex is the biggest dairy producer in Iran. During a normal 24-h manufacturing cycle of dairy products, 1000 tons of milk is produced: causing around 3500 cubic meters of wastewater per day.
2. MATERIALS AND METHODS
2.1. Ultrasonic equipment
The dairy wastewater samples were sonificated using a JY92–IIDN equipment (manufactured by Ningbo Sci-entz Biotechnology Co. Ltd., Guangzhou, China). The ultra-sound unit consists of a converter (or transducer), booster, and a sonotrode. The converter basically converts electri-cal into ultrasound energy. The booster is a mechanical amplifier promoting a high amplitude generated by the converter, and the sonotrode is a specifically designed tool transmitting the ultrasonic energy to the wastewater. The full specification of the apparatus is presented in Table 1. The reactor has a fixed frequency of 20 kHz and variable powers from 0-1000 W. For the actual experiment, an 800-ml beaker containing 500 ml dairy wastewater was used. During the experiments, the dairy wastewater was gently stirred in the beaker and the temperature was kept stable at 17 °C.
TABLE 1 - Details specification of the ultrasonic equipment
JY92 – IIDN SONIFICATOR SYSTEM Frequency 20 kHz Net Weight 23 Kg Duty Ratio 0.3-99.7%
Working Time Adjustable (0.5 S-99 min) Amplitude Pole Φ6 Power Supply 220 V, 50 Hz
Maximum Output Energy 1000 W Dimensions of Sound Box Proof 220x400x290 mm
2.2. Materials
Raw wastewater samples were collected from Tehran Pegah dairy complex and stored in a refrigerator at 4 °C [20]. The composite sample had a constant volume of 1 L, and samples were taken from 8 a.m. to 4 p.m. at 2-h inter-vals (5 samples) at the stabilizing tank outlet. Each sam-ple was stirred, sent to the laboratory, and ultrasonically treated. TKN and TP were analyzed on the same day.
2.3. Experimental procedures
The samples were irradiated by high intensity ultra-sound. Under operating conditions, ultrasonic wave irra-diation process was conducted. An important fact to re-member is the correlation of cost optimization with wastewater quality of our samples subjected to the ultra-sonic system. The conditions selected were exposure times of 60, 120, 240 and 480 s as well as output powers of 300, 600 and 900 W. Ultrasonic irradiation was applied to wastewater using a sonotrode with 20 mm diameter immersed in a depth of 10 mm. The distance between the end of the sonotrode and bottom of the vessel was 82 mm. The investigation was carried out with 500 ml of dairy wastewater, and the remaining 500 ml wastewater were analyzed without being subject to ultrasonic irradiation. The second 500 ml sample was used as a control sample. Temperature was measured before each test by a sensor installed in the apparatus for ensuring stability of the primary temperature during all steps of the test. Samples were irradiated at ambient temperature during sonification operation. The characteristics of samples which were used for sonification were kept stable throughout the experi-ments.
2.4. Dairy wastewater beaker container in used ultrasonic system
The 500 ml of the dairy wastewater sample was poured into a glass beaker 800 ml in volume and 93 mm internal diameter. Three acoustic streaming regions formed during sonification, were affected by container shape, particularly the largest region called Eckart [21] streaming which has a circulating current. This region was defined by the shape of the beaker container, and size and length of the ultra-sonic wave in the samples. Accordingly, a large Eckart streaming is generated, which terminates to a better and more distribution of ultrasonic energy and an accelerated heating dissipation [22].
2.5. Analytical methods
After ultrasonic irradiation wastewater samples were analyzed three times for TKN, TP, pH and temperature according to the standard methods [23]. Total nitrogen was determined using the Kjeldahl method. TP was measured using a Spectrophotometer model DR/2800, HACH.
3. RESULTS AND DISCUSSION
From the purpose of quality, the raw dairy wastewa-ter of Tehran Pegah Dairy Complex had a bad odder and a light creamy colour. Tests indicated the neutral zone with slight inclination to alkaline range for pH.
The high content of COD indicated that the samples were heavily contaminated with organic matter. The tests also showed that a high percentage of TKN and TP were filtrated. The characteristics of raw dairy wastewater are listed in Table 2.
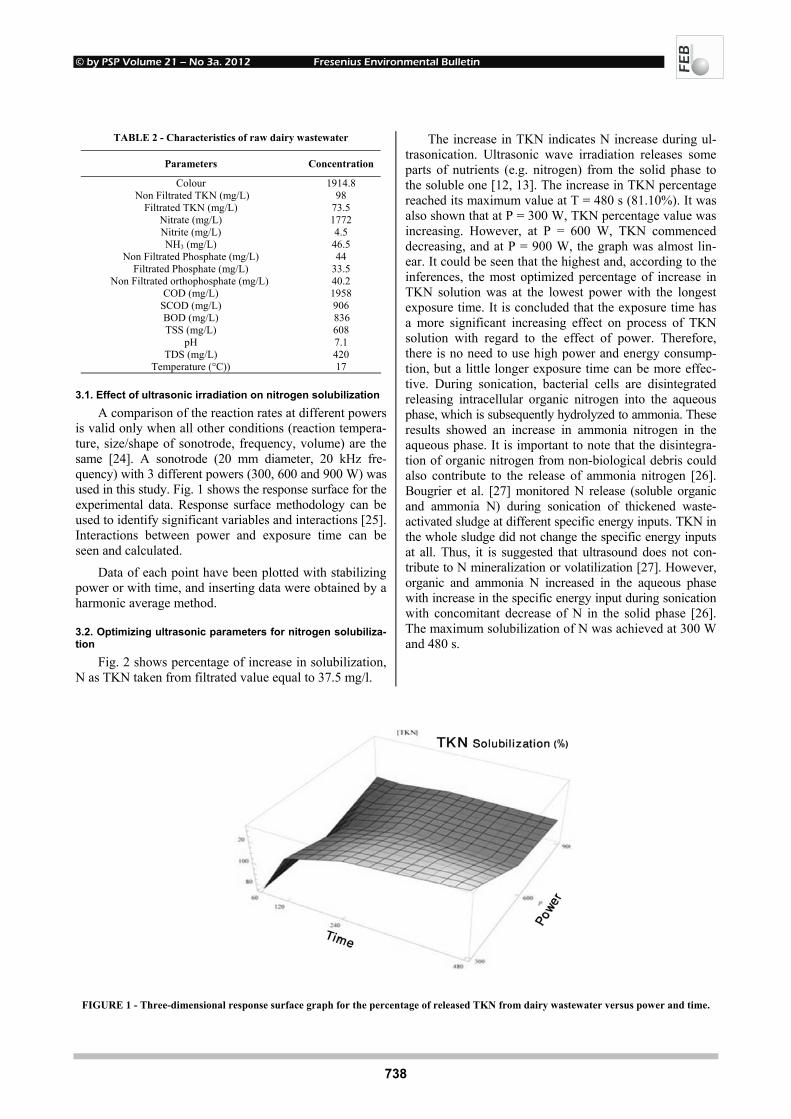
© by PSP Volume 21 – No 3a. 2012 Fresenius Environmental Bulletin
738
TABLE 2 - Characteristics of raw dairy wastewater
Concentration Parameters
1914.8 Colour 98 Non Filtrated TKN (mg/L)
73.5 Filtrated TKN (mg/L) 1772 Nitrate (mg/L) 4.5 Nitrite (mg/L)
46.5 NH3 (mg/L) 44 Non Filtrated Phosphate (mg/L)
33.5 Filtrated Phosphate (mg/L) 40.2 Non Filtrated orthophosphate (mg/L) 1958 COD (mg/L) 906 SCOD (mg/L) 836 BOD (mg/L) 608 TSS (mg/L) 7.1 pH 420 TDS (mg/L) 17 Temperature (°C))
3.1. Effect of ultrasonic irradiation on nitrogen solubilization
A comparison of the reaction rates at different powers is valid only when all other conditions (reaction tempera-ture, size/shape of sonotrode, frequency, volume) are the same [24]. A sonotrode (20 mm diameter, 20 kHz fre-quency) with 3 different powers (300, 600 and 900 W) was used in this study. Fig. 1 shows the response surface for the experimental data. Response surface methodology can be used to identify significant variables and interactions [25]. Interactions between power and exposure time can be seen and calculated.
Data of each point have been plotted with stabilizing power or with time, and inserting data were obtained by a harmonic average method.
3.2. Optimizing ultrasonic parameters for nitrogen solubiliza-tion
Fig. 2 shows percentage of increase in solubilization, N as TKN taken from filtrated value equal to 37.5 mg/l.
The increase in TKN indicates N increase during ul-trasonication. Ultrasonic wave irradiation releases some parts of nutrients (e.g. nitrogen) from the solid phase to the soluble one [12, 13]. The increase in TKN percentage reached its maximum value at T = 480 s (81.10%). It was also shown that at P = 300 W, TKN percentage value was increasing. However, at P = 600 W, TKN commenced decreasing, and at P = 900 W, the graph was almost lin-ear. It could be seen that the highest and, according to the inferences, the most optimized percentage of increase in TKN solution was at the lowest power with the longest exposure time. It is concluded that the exposure time has a more significant increasing effect on process of TKN solution with regard to the effect of power. Therefore, there is no need to use high power and energy consump-tion, but a little longer exposure time can be more effec-tive. During sonication, bacterial cells are disintegrated releasing intracellular organic nitrogen into the aqueous phase, which is subsequently hydrolyzed to ammonia. These results showed an increase in ammonia nitrogen in the aqueous phase. It is important to note that the disintegra-tion of organic nitrogen from non-biological debris could also contribute to the release of ammonia nitrogen [26]. Bougrier et al. [27] monitored N release (soluble organic and ammonia N) during sonication of thickened waste-activated sludge at different specific energy inputs. TKN in the whole sludge did not change the specific energy inputs at all. Thus, it is suggested that ultrasound does not con-tribute to N mineralization or volatilization [27]. However, organic and ammonia N increased in the aqueous phase with increase in the specific energy input during sonication with concomitant decrease of N in the solid phase [26]. The maximum solubilization of N was achieved at 300 W and 480 s.
FIGURE 1 - Three-dimensional response surface graph for the percentage of released TKN from dairy wastewater versus power and time.
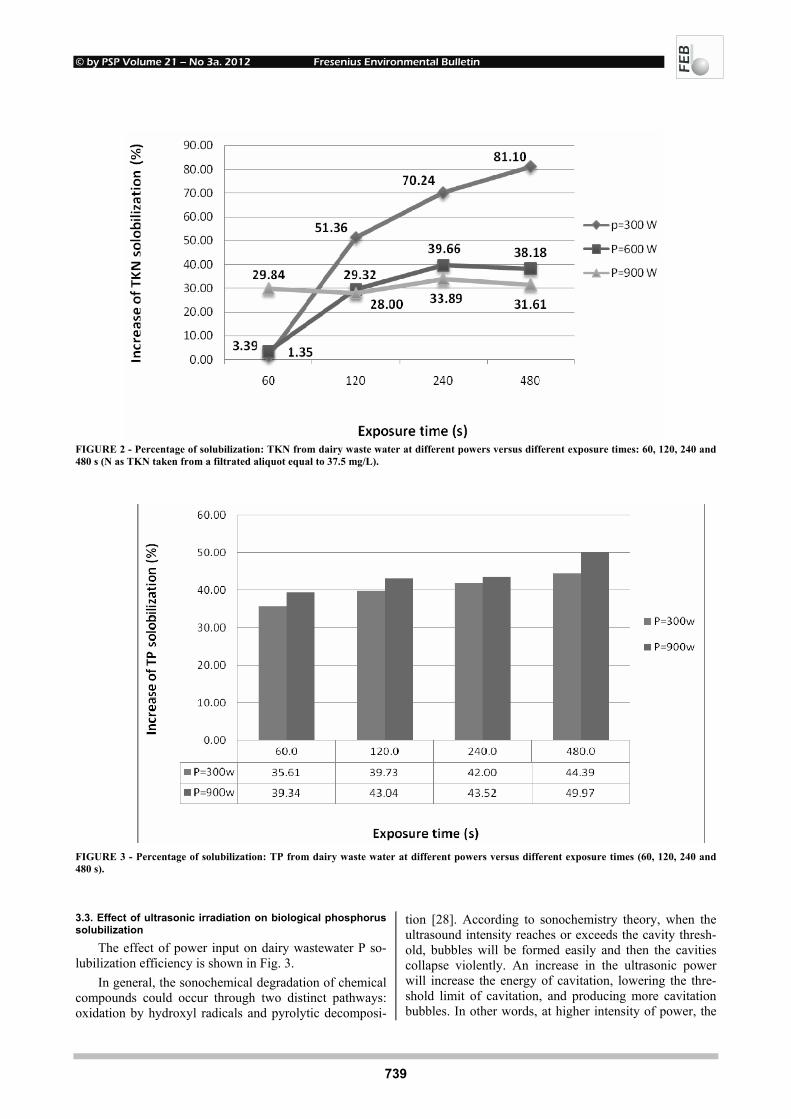
© by PSP Volume 21 – No 3a. 2012 Fresenius Environmental Bulletin
739
FIGURE 2 - Percentage of solubilization: TKN from dairy waste water at different powers versus different exposure times: 60, 120, 240 and 480 s (N as TKN taken from a filtrated aliquot equal to 37.5 mg/L).
FIGURE 3 - Percentage of solubilization: TP from dairy waste water at different powers versus different exposure times (60, 120, 240 and 480 s).
3.3. Effect of ultrasonic irradiation on biological phosphorus solubilization
The effect of power input on dairy wastewater P so-lubilization efficiency is shown in Fig. 3.
In general, the sonochemical degradation of chemical compounds could occur through two distinct pathways: oxidation by hydroxyl radicals and pyrolytic decomposi-
tion [28]. According to sonochemistry theory, when the ultrasound intensity reaches or exceeds the cavity thresh-old, bubbles will be formed easily and then the cavities collapse violently. An increase in the ultrasonic power will increase the energy of cavitation, lowering the thre-shold limit of cavitation, and producing more cavitation bubbles. In other words, at higher intensity of power, the
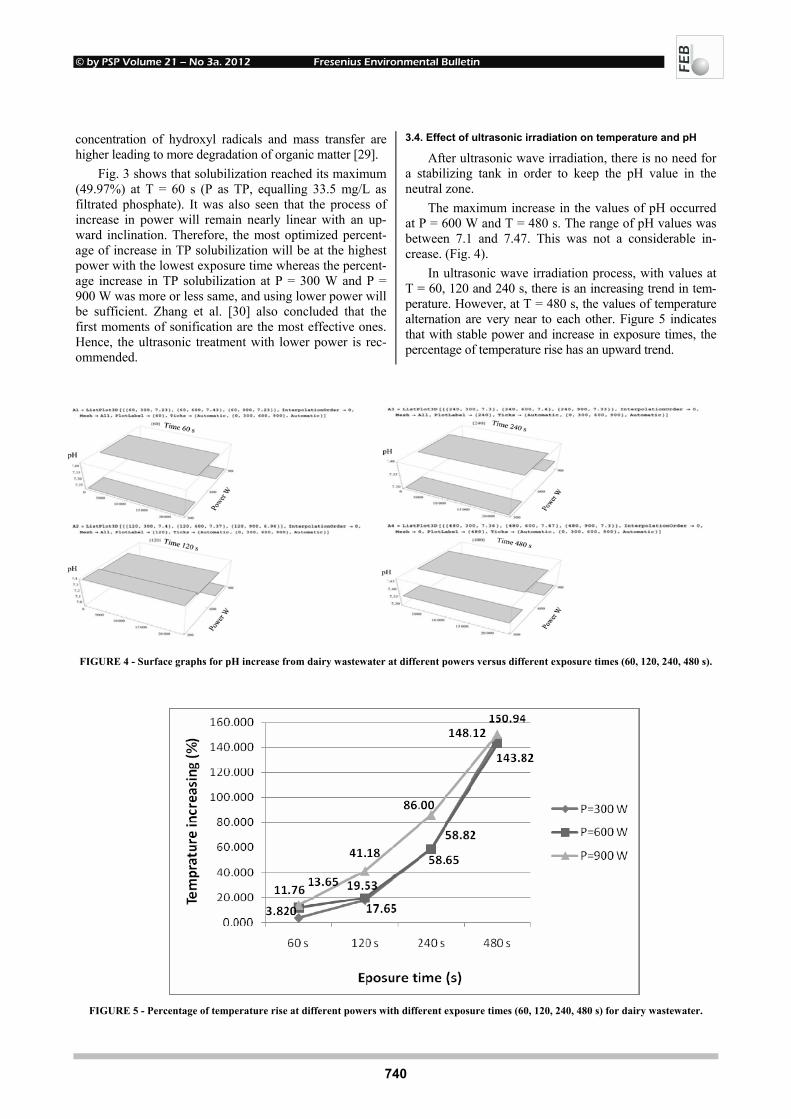
© by PSP Volume 21 – No 3a. 2012 Fresenius Environmental Bulletin
740
concentration of hydroxyl radicals and mass transfer are higher leading to more degradation of organic matter [29].
Fig. 3 shows that solubilization reached its maximum (49.97%) at T = 60 s (P as TP, equalling 33.5 mg/L as filtrated phosphate). It was also seen that the process of increase in power will remain nearly linear with an up-ward inclination. Therefore, the most optimized percent-age of increase in TP solubilization will be at the highest power with the lowest exposure time whereas the percent-age increase in TP solubilization at P = 300 W and P = 900 W was more or less same, and using lower power will be sufficient. Zhang et al. [30] also concluded that the first moments of sonification are the most effective ones. Hence, the ultrasonic treatment with lower power is rec-ommended.
3.4. Effect of ultrasonic irradiation on temperature and pH
After ultrasonic wave irradiation, there is no need for a stabilizing tank in order to keep the pH value in the neutral zone.
The maximum increase in the values of pH occurred at P = 600 W and T = 480 s. The range of pH values was between 7.1 and 7.47. This was not a considerable in-crease. (Fig. 4).
In ultrasonic wave irradiation process, with values at T = 60, 120 and 240 s, there is an increasing trend in tem-perature. However, at T = 480 s, the values of temperature alternation are very near to each other. Figure 5 indicates that with stable power and increase in exposure times, the percentage of temperature rise has an upward trend.
FIGURE 4 - Surface graphs for pH increase from dairy wastewater at different powers versus different exposure times (60, 120, 240, 480 s).
FIGURE 5 - Percentage of temperature rise at different powers with different exposure times (60, 120, 240, 480 s) for dairy wastewater.

© by PSP Volume 21 – No 3a. 2012 Fresenius Environmental Bulletin
741
FIGURE 6 - Surface graphs for temperature increase of dairy wastewater at different powers with different exposure times. As shown in Fig. 6, the highest temperature increase
was 150% at P = 900 W and T = 480 s. Explosion of cavitation bubbles in the vessel is the reason for this rise in temperature. When acoustic energy was irradiated to the wastewater, cavitation bubbles were formed. explod-ing and causing high local temperature (>5000 °C) [31].
4. CONCLUSIONS
As stated above, sonificated dairy wastewater sam-ples were analyzed for TKN, TP, pH and temperature. In brief, the results of tests and analyses were as follows:
The maximum percentage of increase in solubilized N as TKN in ultrasonic process was achieved at T = 480 s with P = 300 W, and there was no need to consume high energy for obtaining optimized efficiency. Increase in exposure time had a significant effect.
When considering percentage increase in solubilized P as TP in ultrasonic process at T = 480 s, the application of the highest power (900 W) and the lowest one (300 W) did not cause significant changes in solubilized P. It is, therefore, suggested that the lower power can be adapted. With longer exposure times, a better result was obtained. We can categorically recommend a low power with long exposure time for industrialized treatment of dairy wastewater. The tests clearly demonstrated that exposure time is more significant than power during ultrasonic process for solubilization of nutrients.
Ultrasonic process causes temperature rise which plays an important role in solubilization. At the power of 900 W and an exposure time of 480 s, an increase of 150% in temperature was obtained.
As mentioned before, ultrasonic process can increase solubilized N and P (the nutrients).
The increase in nutrients will alter the N/P ratio to an optimization level. Amelioration of N/P ratio will lead to improvement in wastewater treatment. Microorganisms present in wastewater resulting from biological treatment can attack and consume these nutrients. If the nutrients are in the soluble phase, their consumption is much easier. This method (ultrasonic wave irradiation) is the right pretreatment tool before biological treatment. The effi-ciency of ultrasonic wave irradiation may be improved, if necessary, by being coupled with biological treatment.
REFERENCES
[1] Sarkar, B., Chakrabarti, P.P., Vijaykumar, A., and Kale V. (2006) Wastewater treatment in dairy industries—possibility of reuse. Lipid Science and Technology Division, Indian In-stitute of Chemical Technology, Desalination, 195, 141–152.
[2] Kushwaha, J. P., Srivastava, V. C., and Mall, I. D. (2010) Organics removal from dairy wastewater by electrochemical treatment and residue disposal. Separation and Purification Technology, 76, 198–205.
[3] Wang, L. K., Hung, Y., Lo, H. H., and Yapijakis, C. (2006) Waste Treatment in the food processing industry. CRC Press: New Orleans, LA, 1–3.

© by PSP Volume 21 – No 3a. 2012 Fresenius Environmental Bulletin
742
[4] De-Bashan, L.E. and Bashan, Y. (2004) Recent advances in removing phosphorus from wastewater and its future use as fertilizer.Water Resources, 38, 4222–4246.
[5] Demirel, B., Yenigun, O., and Onay, T.T. (2005) Anaerobic treatment of dairy wastewaters: a review. Process biochemis-try, 40, 2583–2595.
[6] Montuelle, B., Coillard, J., Lehy, J.B. (1992) A combined anaerobic–aerobic process for the co-treatment of effluents from a Piggery and a Cheese Factory. Journal of Agricultural Engineering Resources, 51, 91–100.
[7] Srinivasan, A. and Viraraghavan, T. (2007) Biological proc-esses for removal of oil from wastewater – a review, Vol. 16, No. 12a, 1532-1543.
[8] Levin, G.V. and Shapiro, J. (1965) Metabolic uptake of phosphorus by wastewater organisms. Water Pollution Con-trol Federation, 37, 800–821.
[9] Ke, K., Liu, Q., Pesce, L., and Du, D. (2011) A new method to enhance bio-treatment of wastewater with high organic strength. Fresenius Environmental Bulletin, Vol. 20, No. 8, 1949-1954.
[10] Preeti, C.S. and Aniruddha, B. (2004) Pandit Ultrasound pre-treatment for enhanced biodegradability of the distillery wastewater. Ultrasonics Sonochemistry, 11, 197–203.
[11] Ping, N., Hans-Jorg, B. Yijiao Haand, J., de Hann, A., and Tien C. (2005) Treatment of organic pollutants in cock plant wastewater by the method of ultrasound irradiation, catalytic oxidation and activated sludge. Separation and Purification Technology, 41, 133–139.
[12] Chiu, Y.C., Chang, C.N., Lin, J.G., and Huang, S.J. (1997) Alkaline and ultrasonic pre-treatment of sludge before an-aerobic digestion, Water Science and Technology, 36, 155–162.
[13] Laborde, J.L., Bouyer, C., Caltagirone, J.P., and Ge´rard, A. (1998b) Acoustic cavitation field prediction at low and high frequency ultrasounds. Ultrasonics, 36, 581–587.
[14] Laborde, J.L., Bouyer, C., Caltagirone, J.P., and Ge´rard, A. (1998a). Acoustic bubble cavitation at low frequencies, Ul-trasonics, 36, 589–594.
[15] Portenlanger, G. (1999) Mechanical and radical effects of ul-trasound. Environmental Engineering, 25, 11–22.
[16] Neis, U. (2002) Intensification of biological and chemical processes by ultrasound.Technical University Hamburg–Harburg Reports on Sanitary Engineering, 35.
[17] Lauterborn, W. and Ohl, C.D. (1997) Cavitation bubbledynamics.Ultrasonics Sonochemistry, 4, 65–75.
[18] Tiehm, A., Nickel, K., Zellhorn, M., and Neis, U. (2001) Ul-trasonic waste activated sludge disintegration for improving anaerobic stabilization. Water Research, 35, 2003–2009.
[19] Graff, K. (1988) Independent Study on High Power Ultra-sonic. Lecture Notes. WE 795, The Ohio State University, Columbus, OH.
[20] Standard methods for the examination of water and wastewa-ter, (1999) APHA, AWWA, WEF, Standard Methods for the Examination of Water and Wastewater. 20 ed.
[21] Gonze, E., Pillot, S., Valette, E., Gonthier, Y. and Bernis, A. (2003) Ultrasonic treatment of an aerobic activated sludge in a batch reactor. Chemical Engineering and Processing, 42, 965–975.
[22] Young, F.R. (1989) Cavitation, McGraw-Hill Book com-pany, Maidenhead, UK. 40–76.
[23] APHA, Standard Methods for the Examination of Water and Wastewater, (1998) 20th ed.
[24] Lim, M., Son, Y., and Khim, J. (2011) Frequency effects on the sonochemical degradation of chlorinated compounds. Ul-trasonic Sonochemistry, 18, 460–465.
[25] Tansel, B. and Dizge, N. (2011) Multi objective performance analysis of nanofiltration process to loading parameters by response surface approach. Desalination, 272, 164–169.
[26] Khanal, S. K., Grewell, D., Sung, Sh., and van Leeuwen, H. (2007) Ultrasound Applications in Wastewater Sludge Pre-treatment: A Review. Critical Reviews in Environmental Sci-ence and Technology, 37, 277–313.
[27] Bougrier, C., Carr`ere, H., and Delgenes, J.P. (2005) Solubilization of waste-activated sludge by ultrasound treat-ment.Chemical Engineering Journal, 106, 163–169.
[28] Wang, S., Wu, X., Wang, Y., Li, Q., and Tao M. (2008) Re-moval of organic matter and ammonia nitrogen from landfill leachate by ultrasound. Ultrasonics Sonochemistry, 15, 933–937.
[29] Entezari, M. and Kruus, P. (1996) Effect of frequency on sonochemical reactions II. Temperature and intensity ef-fects.Ultrasonics Sonochemistry, 3, 19–24.
[30] Zhang , G., Zhang, P , . Yang, J., and Liu, H. (2008) Energy-efficient sludge sonication: Power and sludge characteristics. Bioresource Technology, 99, 9029–9031.
[31] Flint, E.B. and Suslick, K.S. (1991) The temperature of cavitation. Science, 253, 1397–1399.
Received: August 08, 2011 Revised: August 24, 2011; October 13, 2011 Accepted: November 02, 2011 CORRESPONDING AUTHOR
Alireza Mohamadi Aghdam
Faculty of Environment University of Tehran #25, zip code: 1417853111 Azin Avenue, Ghods Street, Enghelab Square, Tehran IRAN Phone: +982161113177 E-mail: [email protected]
FEB/ Vol 21/ No 3a/ 2012 – pages 736 – 742

© by PSP Volume 21 – No 3a. 2012 Fresenius Environmental Bulletin
743
THE EFFECTS OF ORGANIC SELENIUM ON SOME PHYSIOLOGICAL AND BIOCHEMICAL
PARAMETERS IN HORDEUM VULGARE L. AND TRITICUM AESTIVUM L. EXPOSED TO SALT STRESS
Emel Yigit1,*, Gulcin Beker Akbulut1, Yetkin Gok2 and Dilek Bayram1
1 Inonu University, Department of Biology, Science and Art Faculty, 44280, Malatya, Turkey 2Inonu University, Department of Chemistry, Science and Art Faculty, 44280, Malatya, Turkey
ABSTRACT
In this study, the protective role of organic selenium against salt stress on Hordeum vulgare L. and Triticum aestivum L. were determined. Seeds, treated with 0.004 M organic selenium in the pre-application, were germinated in environments exposed to 50, 100 and 200 mM salt stress (NaCl), in comparison to seeds without selenium treatment. The effects of 0.004 M organic selenium on peroxidase, ascorbate peroxidase, and lipid peroxidation were investi-gated in both plants. An evaluation of their germination and enzyme activities showed that organic selenium re-sulted in salient improvement when compared to the plants directly exposed to salt stress. The present study suggests that selenium can play a protective role during salt stress by enhancing the antioxidant defense system.
KEYWORDS: Selenium, ascorbate peroxidase, peroxidase, lipid peroxidation
1. INTRODUCTION
Selenium (Se) functions in plants as an antioxidant [1]. It is an essential trace element for animals, humans, and microorganisms, whereas the essentiality of selenium in higher plants is still under debate [2-4]. However, there are increasing indications that Se may also play a positive bio-logical role in higher plants [1, 5, 6]. It was also reported that Se is accumulated by a number of plants in sufficient amounts to be toxic if consumed by livestock [7, 8].
Selenium may increase the tolerance of plants to UV-radiation induced oxidative stress, delay senescence and promote the growth of ageing seedlings [5]. Recently, it has been shown that Se can regulate the water status of plants under conditions of water deficiency and, thereby, had a protective effect [9-11]. * Corresponding author
Numerous studies have reported marked declines in germination percentages of plants exposed to salt stress [12, 13]. Factors causing stress in plants considerably in-crease the production of free oxygen radicals. These active oxygen radicals are known to lead to significant changes by influencing molecules found in different parts of the cell, such as proteins, lipids and nucleic acids. An increase in peroxidase activity is the most common response to various stress factors [14, 15]. Plants have a complex de-fence system which consists of lipid soluble and mem-brane-associated antioxidants (α-tocopherol, β-carotene which directly suppress free radicals of lipid peroxida-tion), water soluble antioxidants (glutathione and ascor-bate) and enzymatic antioxidants (superoxide dismutase, catalase, peroxidase, ascorbate peroxidase and glutathione reductase). Plants which are exposed to drought stress are capable of overcoming the oxidative stress by activation of some or all of these systems [16-20].
Selenium binds to proteins in order to form seleno-proteins, which are important antioxidant enzymes. The antioxidant properties of selenoproteins help to prevent cellular damage caused by free radicals [21]. Salinity in agricultural fields is one significant problem that adversely affects land fertility and limits crop yield. Land salinity usually occurs in arid and semiarid areas with low amounts of rainfall and high temperatures, which may lead to seri-ous yield losses in these areas [22].
The goal of this work was to determine the effects of organic Se on certain physiological and biochemical para-meters in H. vulgare L. (barley) and T. aestivum L. (wheat) exposed to salt stress.
2. MATERIALS AND METHODS
Selenium used in this study was organically produced in the chemistry laboratory at Inonu University. The novel synthetic organo-selenium compound, 1,3-di (p-methoxy-benzyl)-1,3-diazepan-2-selenone (SeI) (Fig. 1) was syn-

© by PSP Volume 21 – No 3a. 2012 Fresenius Environmental Bulletin
744
FIGURE 1 - Structure of 1,3-di(p-methoxybenzyl)-1,3-diazepan-2-selenone (SeI) [23].
thesized and identified by 1H NMR (300 MHz), 13C NMR (75.5 MHz) and microanalysis [23]. The samples were grown in perlite-containing pots using Hoagland’s solu-tion. The tests were conducted in a climate room at 23±2 °C and a humidity of 60%. The samples were extracted from the treatment groups on 21th day and subjected to analyses.
H. vulgare and T. aestivum seeds exposed to 0.004 M Se in the pre-application were germinated in environments exposed to 50, 100 and 200 mM NaCl stress, in comparison to seeds not treated with selenium to determine their ger-mination percentages. Then, peroxidase, ascorbate peroxi-dase and lipid peroxidation were determined.
2.1. Determination of peroxidase activity
0.5 g of polyvinylpyrrolidone (PVP) was added to 0.5 g of leaf sample and homogenized in 3 ml of 66 mM potas-sium phosphate buffer and 3 ml of 100 mM KC1 [24]. The homogenate was centrifuged at 10,000 rpm for 10 min at 4 ºC. After a homogeneous solution was prepared by vortexing 3 ml of 0.1 M (pH 6.0) potassium phosphate buffer with 0.04 ml of 0.03 M H2O2 and 0.05 ml of 0.2 M guaiacol, 0.1 ml of the extract was added to 0.9 ml of the solution and the alteration in enzyme activity was meas-ured at 436 nm for 1 min [25].
2.2. Determination of ascorbate peroxidase
According to the methods of Nakano and Asada [26] and Cakmak [27], 0.5 g fresh leaf tissue was homoge-nized in 10 ml of 50 mM potassium phosphate buffer (pH 7.6). The homogenate was centrifuged at 15,000 rpm for 20 min. The reaction mixture contained 550 µl of phos-phate buffer (pH 7.6), a mixture of 12 mM of H2O2 and 100 µl of 10 mM EDTA, 250 µl of the extract, and 100 µl of 0.25 mM ascorbic acid. The enzyme activity was de-fined as the alteration in absorbance per min at 290 nm (Shimadzu-UV-1601, UV/Vis), and ascorbate peroxidase activity was calculated by using the extinction coefficient of 2.8 mM-1 cm-1.
2.3. Malondialdehyde (MDA) analysis
The method was performed by following Heath and Packer [28]. 0.5 g of leaf tissue was homogenized in 5 ml of 0.1% trichloroacetic acid (TCA), and the homogenate was centrifuged at 10,000 rpm for 5 min. 2 ml of this solution and 2 ml of 0.5% thiobarbituric acid (TBA) were heated in a 95 ºC boiling water-bath for 30 min (TBA was prepared in 20% TCA). The samples were chilled in an
ice bath after boiling. The final mixture was centrifuged at 10,000 rpm for 15 min. Absorbance of the supernatant was measured at 532 and 600 nm, and MDA content was calculated with an extinction coefficient of 155 mM-1 cm-1 by subtracting the absorbance at 532 nm from that at 600 nm.
2.4. Determination of total soluble protein
The amount of total soluble protein was determined by Bradford’s method [29] using a microplate reader sys-tem (Molecular Devices Corp., Versamax). 5 µl of the pre-pared homogenate and 250 µl of Bradford reagent were added to each well on the microplate, and kept in the dark at room temperature (25 ºC) for 15 min. The color-dependent changes in absorbance were measured at 595 nm. The ob-tained optical density (OD) values were compared to stan-dard graphic values obtained by using bovine serum al-bumin (BSA), and the amount of total protein in the sam-ples was calculated by using a package software (Slide). The measurements were repeated three times.
2.5. Statistical analysis
Statistical analysis was performed using SPSS 15.0 software. Duncan’s test [30] was used for significance control (P<0.05) following variance analysis.
3. RESULTS
In barley and wheat, germination percentages were found to be higher in groups receiving combined Se/NaCl treatment when compared to those treated only with NaCl. Although germination percentage declined in groups treated with Se and 200 mM NaCl, it was higher than that in groups treated only with NaCl (Figs. 2, 3).
020406080
100120
Control 50 mM 100 mM 200 mM
Hordeum vulgare L.
Ger
min
atio
n ra
te %
NaClSe+NaCl
FIGURE 2 - Changes in germination rate of Hordeum vulgare L. leaves exposed to NaCl and Se+NaCl application. Vertical bars represent standard error of average of three replications. Data followed by different letters are significantly different from each other (P<0.05) according to Duncan’s test.
020406080
100120
Control 50 mM 100 mM 200 mM
Triticum aestivum L.
Ger
min
atio
n ra
te %
NaClSe+NaCl
FIGURE 3 - Changes in germination rate of Triticum aestivum L. leaves exposed to NaCl and Se+NaCl application. Vertical bars represent standard error of average of three replications. Data followed by different letters are significantly different from each other (P<0.05) according to Duncan’s test.

© by PSP Volume 21 – No 3a. 2012 Fresenius Environmental Bulletin
745
In barley and wheat, peroxidase activities in groups treated with 200 mM NaCl were found to be lower than activity in control group as well as those treated with 50 and 100 mM NaCl. The highest peroxidase activity was found in groups treated with 100 mM NaCl (5.30 U/mg protein in wheat; 5.93 U/mg protein in barley). The low-est peroxidase activity among the Se-treated groups was obtained in control groups of both plants (Figs. 4, 5).
In application groups (50, 100 and 200 mM NaCl), ascorbate peroxidase activities were found to be higher than that in control groups, and it increased with increas-ing concentrations following Se treatment (Figs. 6, 7).
The MDA amounts in barley and wheat were found to be higher in groups treated with Se and salt. The highest MDA amount was found to be 15.29 µmol MDA g/fresh weight in groups treated with 0.004 M Se and 200 mM NaCl. On the other hand, the MDA amount was higher than that in control group when treated with 0.004 M Se and salt.
02468
1012
Control 50 mM 100 mM 200 mM
Hordeum vulgare L.
Per
oxid
ase
activ
ity
(U/ m
g pr
otei
n)
NaClSe+NaCl
FIGURE 4 - Changes in peroxidase activity of Hordeum vulgare L. leaves exposed to NaCl and Se+NaCl application. Vertical bars represent standard error of average of three replications. Data followed by different letters are significantly different from each other (P<0.05) according to Duncan’s test.
0
2
4
6
8
Control 50 mM 100 mM 200 mM
Triticum aestivum L.
Per
oxid
ase
activ
ity
(U/ m
g pr
otei
n)
NaClSe+NaCl
FIGURE 5 - Changes in peroxidase activity of Hordeum vulgare L. leaves exposed to NaCl and Se+NaCl application. Vertical bars represent standard error of average of three replications. Data followed by different letters are significantly different from each other (P<0.05) according to Duncan’s test.
0123456789
Control 50 mM 100 mM 200 mM
Hordeum vulgare L.
Asc
orba
te p
erox
idas
e ac
tivity
(U
/mg
prot
ein)
NaClSe+NaCl
FIGURE 6 - Changes in ascorbate peroxidase activity of Hordeum vulgare L. leaves exposed to NaCl and Se+NaCl application. Vertical bars represent standard error of average of three replications. Data followed by different letters are significantly different from each other (P<0.05) according to Duncan’s test.
0
1
2
3
4
5
6
7
8
Control 50 mM 100 mM 200 mM
Triticum aestivum L.
Asc
orba
te p
erox
idas
e ac
tivity
(U/ m
g pr
otei
n)
NaClSe+NaCl
FIGURE 7 - Changes in ascorbate peroxidase activity of Triticum aestivum L. leaves exposed to NaCl and Se+NaCl application. Verti-cal bars represent standard error of average of three replications. Data followed by different letters are significantly different from each other (P<0.05) according to Duncan’s test.
0
5
10
15
20
25
Control 50 mM 100 mM 200 mM
Hordeum vulgare L.
MD
A (µ
mol
MD
A/g
fres
h w
eigh
t)
NaClSe+NaCl
FIGURE 8 - Changes in MDA levels of Hordeum vulgare L. leaves exposed to NaCl and Se+NaCl application. Vertical bars represent standard error of average of three replications. Data followed by different letters are significantly different from each other (P<0.05) according to Duncan’s test.
02
468
101214
1618
Control 50 mM 100 mM 200 mM
Triticum aestivum L.
MD
A (µ
mol
MD
A/g
fres
h w
eigh
t)
NaClSe+NaCl
FIGURE 9 - Changes in MDA levels of Triticum aestivum L. leaves exposed to NaCl and Se+NaCl application. Vertical bars represent standard error of average of three replications. Data followed by different letters are significantly different from each other (P<0.05) according to Duncan’s test. The highest MDA amount was 20.09 µmol MDA g/fresh weight in groups treated with 0.004 M Se and 200 mM NaCl (Figs. 8, 9).
4. DISCUSSION
In recent years, several studies have been published indicating protective effects of selenium against toxic ele-ments, such as cadmium, silver, arsenic and mercury, in different animals and plants [31]. Another toxic molecule for plants occurs as a product of superoxide radicals’ trans-formation to H2O2 by SOD enzyme. CAT and POD are the major detoxifying enzymes of H2O2. Therefore, POD and CAT play an important role in plants’ antioxidant re-

© by PSP Volume 21 – No 3a. 2012 Fresenius Environmental Bulletin
746
sponse against salt stress [32]. Recent researches have demonstrated that Se4+ has antioxidant effects, enhances the photo-oxidative stress tolerance of plant and carbohy-drate metabolism, delays plant senescence [33], protects plants from phloem-feeding aphids by means of deter-rence and toxicity to aphids [34], protects plants against fungal infection, herbivory [35], and against different types of abiotic stress [36]. Herein, germination percentages in barley and wheat were found to higher in groups receiving combined Se/NaCl treatment when compared to those treated only with NaCl (Figs. 2, 3). When Se was applied on plants subjected to Cd2+ stress, the antioxidative en-zymes significantly prevented DNA methylation, and fatty acid composition was changed [37-39]. A recent research indicated that Se application at low rates can be used to prevent the induction of antioxidant systems in plants [1, 40]. In this study, ascorbate peroxidase activity and per-oxidase activity also generally increased with increasing concentrations following Se treatment in both barley and wheat (Figs. 4-7). It was observed that peroxidase activity increased with 50 and 100 mM but decreased with 200 mM in the groups treated with salt and Se/NaCl (Figs. 4, 5). Ascorbate peroxidase increased at all concentrations, in contrast to control plants (Figs. 6, 7). The defense sys-tem that was initially active in the plant weakened with increasing concentrations, which leads to a decrease in the responses of the defense system depending on the con-sumption of proteins that govern the synthesis of these enzymes.
Although Se is toxic at high concentrations, recent studies have shown that it can positively influence plants at low levels. Hartikainen et al. [1] showed that Se at low concentrations had antioxidative properties inhibiting per-oxidation of lipids but enhancing the activity of glutathione peroxidase. Moreover, Se can increase plant tolerance to oxidative stress induced by UV radiation [36], retard senescence of plants [5], and response of lettuce (Lactuca sativa L.) to Se in nutrient solutions contaminated with Ni [41]. The MDA content in barley and wheat were found to be higher in groups treated with Se/NaCl (Figs. 8, 9). The idea of lipid peroxidation as a solely destructive process has changed in recent times. It has been shown that lipid hydroperoxides and oxygenated products of lipid degrada-tion as well as lipid peroxidation initiators (i.e. ROS) can participate in the signal transduction cascade [42].
The change in the amount of MDA depending on the increased concentrations was higher in control when com-pared to treatment groups. Generally, MDA content was detected to be higher in Se/NaCl treatment groups than both control and NaCl treatment groups (Figs. 8, 9).
5. CONCLUSION
It is striking that combined use of salt and Se had a protective effect against salt stress during germination. Changes in peroxidase, ascorbate peroxidase and MDA
activities significantly increased in both plants barley and wheat exposed to salt stress. As a result, it is believed that organic Se can be used as an effective chemical against salt stress in order to improve the production of barley and wheat, commonly grown in areas exposed to salt stress.
REFERENCES
[1] Hartikainen, H., Xue, T. and Piironen, V. (2000) Selenium as an antioxidant and pro-oxidant in ryegrass. Plant Soil 225, 193-200.
[2] Terry, N., Zayed, A.M., de Souza, M.P. and Tarun A.S. (2000) Selenium in higher plants. Annu. Rev. Plant Physiol. Plant Mol. Biol. 51, 401-432.
[3] Ellis, D.R. and Salt, D.E. (2003) Plants, selenium and human health. Curr. Opin. Plant Biol. 6, 273-279.
[4] Germ, M. and Osvald, J. (2005) Selenium treatment affected respiratory potential in Eruca sativa. Acta Agriculturae Slo-venica, 85-2, November. 329-335.
[5] Xue, T., Hartikainen, H. and Piironen, V. (2001) Antioxida-tive and growth-promoting effect of selenium on senescing lettuce. Plant and Soil 237, 55-61.
[6] Seppanen, M., Turakainen, M. and Hartikainen, H. (2003) Selenium effects on oxidative stress in potato. Plant Sci. 165, 311-319.
[7] Kampen, Van K.R., James, L.F. and Keeler, R.F. (1978) Manifestations of intoxication by selenium accumulating plants. In: Effects of Poisonous Plants on Livestock. Van Kampen, K.R., James, L.F. (eds.). New York: Academic Press Inc. 135-138.
[8] Tinggi, U. (2002) Essentiality and toxicity of selenium and its status in Australia: a review. Toxicol Lett. 137, 103-110.
[9] Kuznetsov, V.V., Kholodova, V.P. and Yagodin, B.A. (2003) Selenium regulates the water status of plants exposed to drought. Dokl. Biol. Sci. 390, 266-268.
[10] Zahedi, H., Noormorhammadi, G., Rad, A.H.S., Habibi, D. and Boojar, M.M.A. (2009) The effects of zeolite and foliar applications of selenium on growth, yield and yield compo-nents of three canola cultivars under drought stress. World Applied Sciences Journal 7, 255-262.
[11] Agar, G., Alpsoy, L, and Yildirim, N. (2005) The protective role of selenium against the genotoxicity induced by afla-toxin B1 in root cells of crop plants. Fresenius Environ. Bull. 14, 849-853.
[12] Jamil, M., Lee, D.B., Jung, K.Y., Ashraf, M., Lee, S.C. and Rha, E.S. (2006) Effect of salt (NaCl) stress on germination and early seedling growth of four vegetables species. Journal Central European Agriculture 7, 273-282.
[13] Berrichi, A., Tazi, R., Bellirou, A., Kouddane, N. and Bouali, A. (2010) Role of salt stress on seed germination and growth of jojoba plant Simmondsia chinensis (link) schneider. IUFS J. Biol. 69, 33-39.
[14] Song, N.H., Yin, X .L., Chen, G.F. and Yang, H. (2007) Bio-logical responses of wheat (Triticum aestivum) plants to the herbicide chlorotoluron in soils. Science Direct Chemosphere 68, 1779-1787.
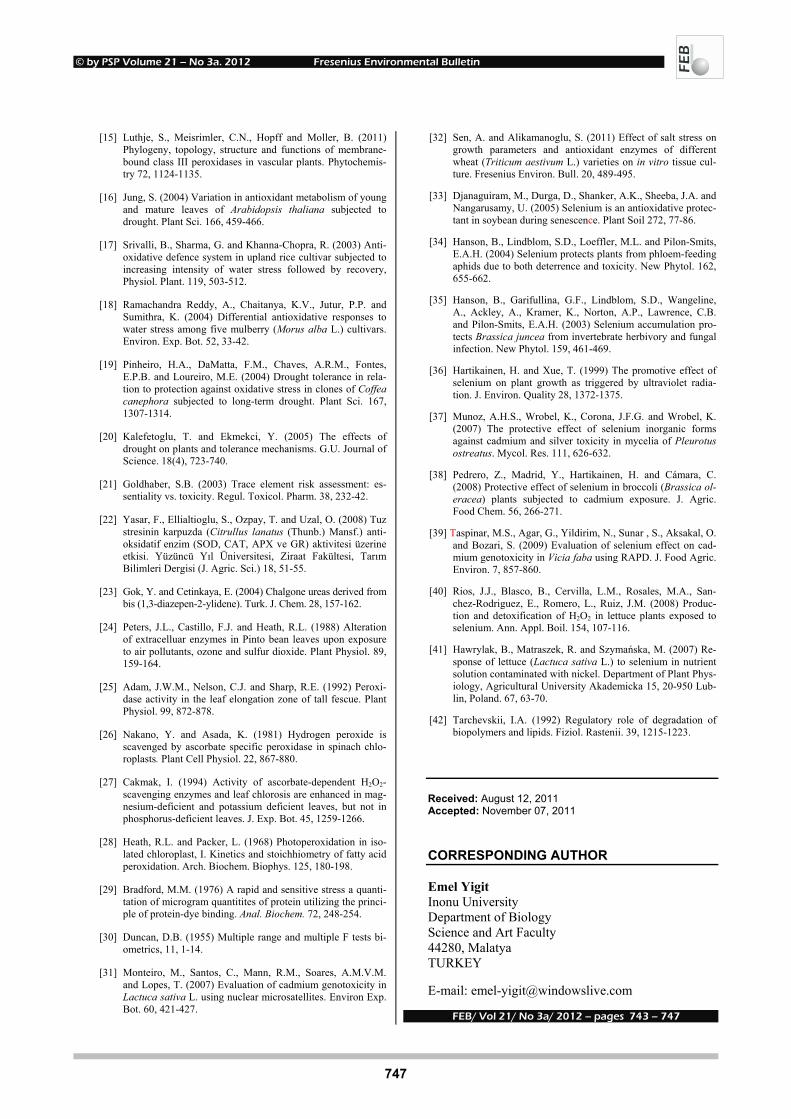
© by PSP Volume 21 – No 3a. 2012 Fresenius Environmental Bulletin
747
[15] Luthje, S., Meisrimler, C.N., Hopff and Moller, B. (2011) Phylogeny, topology, structure and functions of membrane-bound class III peroxidases in vascular plants. Phytochemis-try 72, 1124-1135.
[16] Jung, S. (2004) Variation in antioxidant metabolism of young and mature leaves of Arabidopsis thaliana subjected to drought. Plant Sci. 166, 459-466.
[17] Srivalli, B., Sharma, G. and Khanna-Chopra, R. (2003) Anti-oxidative defence system in upland rice cultivar subjected to increasing intensity of water stress followed by recovery, Physiol. Plant. 119, 503-512.
[18] Ramachandra Reddy, A., Chaitanya, K.V., Jutur, P.P. and Sumithra, K. (2004) Differential antioxidative responses to water stress among five mulberry (Morus alba L.) cultivars. Environ. Exp. Bot. 52, 33-42.
[19] Pinheiro, H.A., DaMatta, F.M., Chaves, A.R.M., Fontes, E.P.B. and Loureiro, M.E. (2004) Drought tolerance in rela-tion to protection against oxidative stress in clones of Coffea canephora subjected to long-term drought. Plant Sci. 167, 1307-1314.
[20] Kalefetoglu, T. and Ekmekci, Y. (2005) The effects of drought on plants and tolerance mechanisms. G.U. Journal of Science. 18(4), 723-740.
[21] Goldhaber, S.B. (2003) Trace element risk assessment: es-sentiality vs. toxicity. Regul. Toxicol. Pharm. 38, 232-42.
[22] Yasar, F., Ellialtioglu, S., Ozpay, T. and Uzal, O. (2008) Tuz stresinin karpuzda (Citrullus lanatus (Thunb.) Mansf.) anti-oksidatif enzim (SOD, CAT, APX ve GR) aktivitesi üzerine etkisi. Yüzüncü Yıl Üniversitesi, Ziraat Fakültesi, Tarım Bilimleri Dergisi (J. Agric. Sci.) 18, 51-55.
[23] Gok, Y. and Cetinkaya, E. (2004) Chalgone ureas derived from bis (1,3-diazepen-2-ylidene). Turk. J. Chem. 28, 157-162.
[24] Peters, J.L., Castillo, F.J. and Heath, R.L. (1988) Alteration of extracelluar enzymes in Pinto bean leaves upon exposure to air pollutants, ozone and sulfur dioxide. Plant Physiol. 89, 159-164.
[25] Adam, J.W.M., Nelson, C.J. and Sharp, R.E. (1992) Peroxi-dase activity in the leaf elongation zone of tall fescue. Plant Physiol. 99, 872-878.
[26] Nakano, Y. and Asada, K. (1981) Hydrogen peroxide is scavenged by ascorbate specific peroxidase in spinach chlo-roplasts. Plant Cell Physiol. 22, 867-880.
[27] Cakmak, I. (1994) Activity of ascorbate-dependent H2O2-scavenging enzymes and leaf chlorosis are enhanced in mag-nesium-deficient and potassium deficient leaves, but not in phosphorus-deficient leaves. J. Exp. Bot. 45, 1259-1266.
[28] Heath, R.L. and Packer, L. (1968) Photoperoxidation in iso-lated chloroplast, I. Kinetics and stoichhiometry of fatty acid peroxidation. Arch. Biochem. Biophys. 125, 180-198.
[29] Bradford, M.M. (1976) A rapid and sensitive stress a quanti-tation of microgram quantitites of protein utilizing the princi-ple of protein-dye binding. Anal. Biochem. 72, 248-254.
[30] Duncan, D.B. (1955) Multiple range and multiple F tests bi-ometrics, 11, 1-14.
[31] Monteiro, M., Santos, C., Mann, R.M., Soares, A.M.V.M. and Lopes, T. (2007) Evaluation of cadmium genotoxicity in Lactuca sativa L. using nuclear microsatellites. Environ Exp. Bot. 60, 421-427.
[32] Sen, A. and Alikamanoglu, S. (2011) Effect of salt stress on growth parameters and antioxidant enzymes of different wheat (Triticum aestivum L.) varieties on in vitro tissue cul-ture. Fresenius Environ. Bull. 20, 489-495. Bulleti
[33] Djanaguiram, M., Durga, D., Shanker, A.K., Sheeba, J.A. and Nangarusamy, U. (2005) Selenium is an antioxidative protec-tant in soybean during senescence. Plant Soil 272, 77-86.
[34] Hanson, B., Lindblom, S.D., Loeffler, M.L. and Pilon-Smits, E.A.H. (2004) Selenium protects plants from phloem-feeding aphids due to both deterrence and toxicity. New Phytol. 162, 655-662.
[35] Hanson, B., Garifullina, G.F., Lindblom, S.D., Wangeline, A., Ackley, A., Kramer, K., Norton, A.P., Lawrence, C.B. and Pilon-Smits, E.A.H. (2003) Selenium accumulation pro-tects Brassica juncea from invertebrate herbivory and fungal infection. New Phytol. 159, 461-469.
[36] Hartikainen, H. and Xue, T. (1999) The promotive effect of selenium on plant growth as triggered by ultraviolet radia-tion. J. Environ. Quality 28, 1372-1375.
[37] Munoz, A.H.S., Wrobel, K., Corona, J.F.G. and Wrobel, K. (2007) The protective effect of selenium inorganic forms against cadmium and silver toxicity in mycelia of Pleurotus ostreatus. Mycol. Res. 111, 626-632.
[38] Pedrero, Z., Madrid, Y., Hartikainen, H. and Cámara, C. (2008) Protective effect of selenium in broccoli (Brassica ol-eracea) plants subjected to cadmium exposure. J. Agric. Food Chem. 56, 266-271.
[39] Taspinar, M.S., Agar, G., Yildirim, N., Sunar , S., Aksakal, O. and Bozari, S. (2009) Evaluation of selenium effect on cad-mium genotoxicity in Vicia faba using RAPD. J. Food Agric. Environ. 7, 857-860.
[40] Rios, J.J., Blasco, B., Cervilla, L.M., Rosales, M.A., San-chez-Rodriguez, E., Romero, L., Ruiz, J.M. (2008) Produc-tion and detoxification of H2O2 in lettuce plants exposed to selenium. Ann. Appl. Boil. 154, 107-116.
[41] Hawrylak, B., Matraszek, R. and Szymańska, M. (2007) Re-sponse of lettuce (Lactuca sativa L.) to selenium in nutrient solution contaminated with nickel. Department of Plant Phys-iology, Agricultural University Akademicka 15, 20-950 Lub-lin, Poland. 67, 63-70.
[42] Tarchevskii, I.A. (1992) Regulatory role of degradation of biopolymers and lipids. Fiziol. Rastenii. 39, 1215-1223.
Received: August 12, 2011 Accepted: November 07, 2011 CORRESPONDING AUTHOR
Emel Yigit Inonu University Department of Biology Science and Art Faculty 44280, Malatya TURKEY E-mail: [email protected]
FEB/ Vol 21/ No 3a/ 2012 – pages 743 – 747

© by PSP Volume 21 – No 3a. 2012 Fresenius Environmental Bulletin
748
INFLUENCE OF POLYCYCLIC AROMATIC HYDROCARBONS ON EARTHWORMS EISENIA FETIDA
Michaela Stoupalová*, Miroslava Beklová, Milada Vávrová, Edita Štilárková and Ivana Bednářová
Department of Veterinary Ecology and Environmental Protection, Faculty of Veterinary Hygiene and Ecology, University of Veterinary and Pharmaceutical Sciences, Brno, Palackého 1/3, 612 42 Brno, Czech Republic
ABSTRACT
Polycyclic aromatic hydrocarbons (PAHs) are persis-tent organic pollutants contaminating all components of the environment. The soil is polluted by these substances mainly due to dry and wet deposition from the atmosphere and fields irrigation with wastewater from oil or coal processing industries. Earthworms, common soil organ-isms, were used to evaluate the load of this environmental component by PAHs. The influence of PAHs on earthworm Eisenia fetida was evaluated according to the OECD meth-ods No. 207 („Earthworm Acute Toxicity Tests“, 4 April 1984). A standard mixture containing 16 individual PAHs was used in the test. PAHs were administered into defined substrates in concentrations of 20, 40 and 60 µg.kg-1 each individual PAH in dry substrate. The relation between soil contamination and soil organisms, i.e. the bioavailability of PAHs, was evaluated on the basis of determining their content in tissues of earthworms and in the substrate. Sam-ples of the substrate and tissues were homogenized, dehy-drated using anhydrous sodium sulphate and than were extracted by dichloromethane. PAHs were then determined following cleaning the extract by column chromatography using gas chromatography-mass spectrometry. There was no acute toxicity during the 14-day test with PAHs. Our analyses document the fact that PAHs show a higher affin-ity to animal tissues than soils. The relation between soil contamination and soil organisms, i.e. the bioavailability of PAHs, was evaluated on the basis of determining their content in tissues of earthworms and in the substrate. For 16 PAHs the bioaccumulation factor ranged from 0.25 to 5.69 values.
KEYWORDS: Eisenia fetida, earthworms, polycyclic aromatic hydrocarbons, contamination, acute toxicity, bioaccumulation
* Corresponding author
1. INTRODUCTION
Polycyclic aromatic hydrocarbons (PAHs) are ubiqui-tous pollutants. For their long-term ability to persist in the environment and health severity of PAHs are consid-ered as typical representatives of persistent organic pollut-ants (POPs). They have a strong ability to bind to the solid sorbents or particles (dust) in living organisms (bioaccumu-lation). The environment also appears a number of their derivatives, most halogenated, sulphonated, amino- and nitro-derivatives. There are hundreds of PAHs, while experimental studies show that many of them are muta-genic, carcinogenic or toxic [1, 2].
Earthworms are found in a wide range of soils and may represent 60-80 % of the total soil biomass [3]. They have been considered as model organisms for studying the effects of chemicals on terrestrial invertebrates by both OECD (Organization for Economic Co-operation and De-velopment) and ISO (International Organization for Stan-dardization) [1]. Eisenia fetida andrei has been the most commonly used species since standardization of acute and chronic ecotoxicity assays for industrial chemicals [4, 5]. Earthworms accumulate many lipophilic organic pollutants from the surrounding soil environment, passive absorption through the gut. Autochthonous microorganisms degrade hydrocarbons, but if earthworms are added to soil, they will improve aeration, and stimulate microbial activity, thus increasing biodegradation [6]. Applying earthworms to a contaminated site might be an environmentally friendly way to remove hydrocarbons [7].
Bioavailability is a key point in the fate of pollutants
in ecosystems and their effects on individual species and populations. Bioavailability of PAH compounds is mark-edly affected by soil properties and the ageing of soils [8]. Many studies have been conducted using individual PAH-spiked soils in which the bioavailability of PAHs may differ from field-contaminated soils [7-10].
The aims of this study were: (i) to assess ecotoxi-
cological effect of PAHs using contaminated soil on earth-worms Eisenia fetida, and (ii) to determine PAHs concen-tration in contaminated soils and in earthworms after ex-periment end.
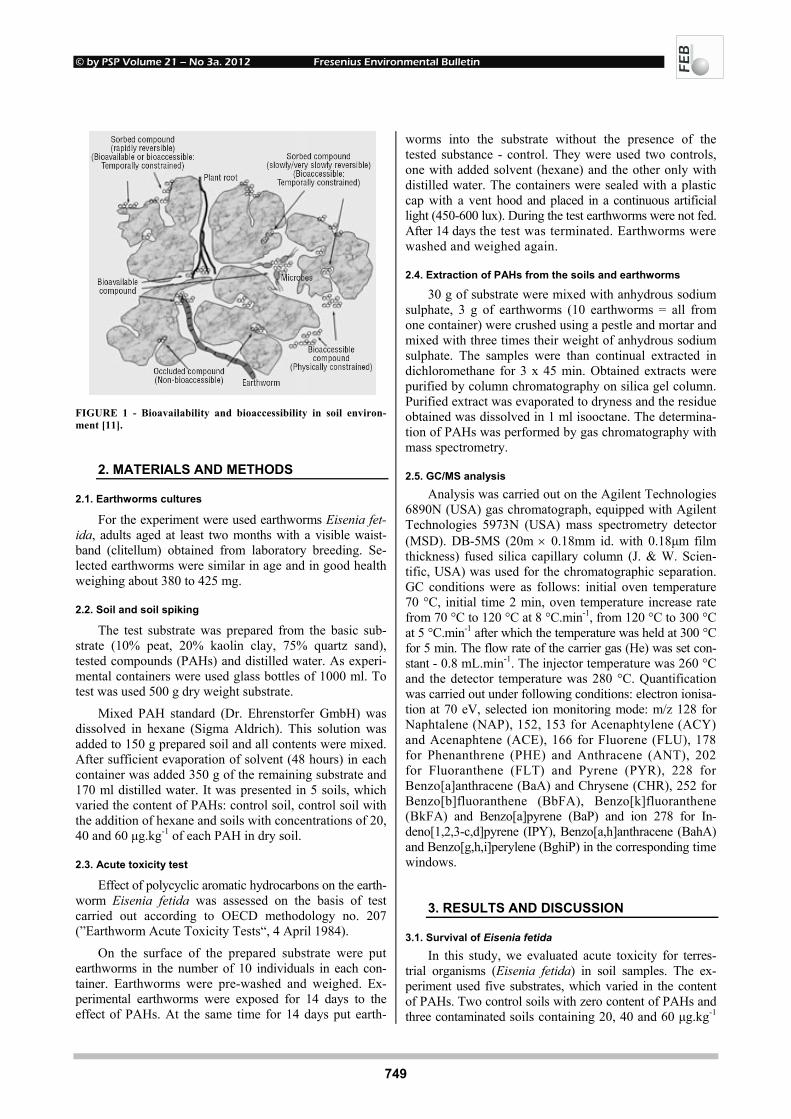
© by PSP Volume 21 – No 3a. 2012 Fresenius Environmental Bulletin
749
FIGURE 1 - Bioavailability and bioaccessibility in soil environ-ment [11].
2. MATERIALS AND METHODS
2.1. Earthworms cultures
For the experiment were used earthworms Eisenia fet-ida, adults aged at least two months with a visible waist-band (clitellum) obtained from laboratory breeding. Se-lected earthworms were similar in age and in good health weighing about 380 to 425 mg.
2.2. Soil and soil spiking
The test substrate was prepared from the basic sub-strate (10% peat, 20% kaolin clay, 75% quartz sand), tested compounds (PAHs) and distilled water. As experi-mental containers were used glass bottles of 1000 ml. To test was used 500 g dry weight substrate.
Mixed PAH standard (Dr. Ehrenstorfer GmbH) was dissolved in hexane (Sigma Aldrich). This solution was added to 150 g prepared soil and all contents were mixed. After sufficient evaporation of solvent (48 hours) in each container was added 350 g of the remaining substrate and 170 ml distilled water. It was presented in 5 soils, which varied the content of PAHs: control soil, control soil with the addition of hexane and soils with concentrations of 20, 40 and 60 µg.kg-1 of each PAH in dry soil.
2.3. Acute toxicity test
Effect of polycyclic aromatic hydrocarbons on the earth-worm Eisenia fetida was assessed on the basis of test carried out according to OECD methodology no. 207 (”Earthworm Acute Toxicity Tests“, 4 April 1984).
On the surface of the prepared substrate were put earthworms in the number of 10 individuals in each con-tainer. Earthworms were pre-washed and weighed. Ex-perimental earthworms were exposed for 14 days to the effect of PAHs. At the same time for 14 days put earth-
worms into the substrate without the presence of the tested substance - control. They were used two controls, one with added solvent (hexane) and the other only with distilled water. The containers were sealed with a plastic cap with a vent hood and placed in a continuous artificial light (450-600 lux). During the test earthworms were not fed. After 14 days the test was terminated. Earthworms were washed and weighed again.
2.4. Extraction of PAHs from the soils and earthworms
30 g of substrate were mixed with anhydrous sodium sulphate, 3 g of earthworms (10 earthworms = all from one container) were crushed using a pestle and mortar and mixed with three times their weight of anhydrous sodium sulphate. The samples were than continual extracted in dichloromethane for 3 x 45 min. Obtained extracts were purified by column chromatography on silica gel column. Purified extract was evaporated to dryness and the residue obtained was dissolved in 1 ml isooctane. The determina-tion of PAHs was performed by gas chromatography with mass spectrometry.
2.5. GC/MS analysis
Analysis was carried out on the Agilent Technologies 6890N (USA) gas chromatograph, equipped with Agilent Technologies 5973N (USA) mass spectrometry detector (MSD). DB-5MS (20m × 0.18mm id. with 0.18µm film thickness) fused silica capillary column (J. & W. Scien-tific, USA) was used for the chromatographic separation. GC conditions were as follows: initial oven temperature 70 °C, initial time 2 min, oven temperature increase rate from 70 °C to 120 °C at 8 °C.min-1, from 120 °C to 300 °C at 5 °C.min-1 after which the temperature was held at 300 °C for 5 min. The flow rate of the carrier gas (He) was set con-stant - 0.8 mL.min-1. The injector temperature was 260 °C and the detector temperature was 280 °C. Quantification was carried out under following conditions: electron ionisa-tion at 70 eV, selected ion monitoring mode: m/z 128 for Naphtalene (NAP), 152, 153 for Acenaphtylene (ACY) and Acenaphtene (ACE), 166 for Fluorene (FLU), 178 for Phenanthrene (PHE) and Anthracene (ANT), 202 for Fluoranthene (FLT) and Pyrene (PYR), 228 for Benzo[a]anthracene (BaA) and Chrysene (CHR), 252 for Benzo[b]fluoranthene (BbFA), Benzo[k]fluoranthene (BkFA) and Benzo[a]pyrene (BaP) and ion 278 for In-deno[1,2,3-c,d]pyrene (IPY), Benzo[a,h]anthracene (BahA) and Benzo[g,h,i]perylene (BghiP) in the corresponding time windows.
3. RESULTS AND DISCUSSION
3.1. Survival of Eisenia fetida
In this study, we evaluated acute toxicity for terres-trial organisms (Eisenia fetida) in soil samples. The ex-periment used five substrates, which varied in the content of PAHs. Two control soils with zero content of PAHs and three contaminated soils containing 20, 40 and 60 µg.kg-1
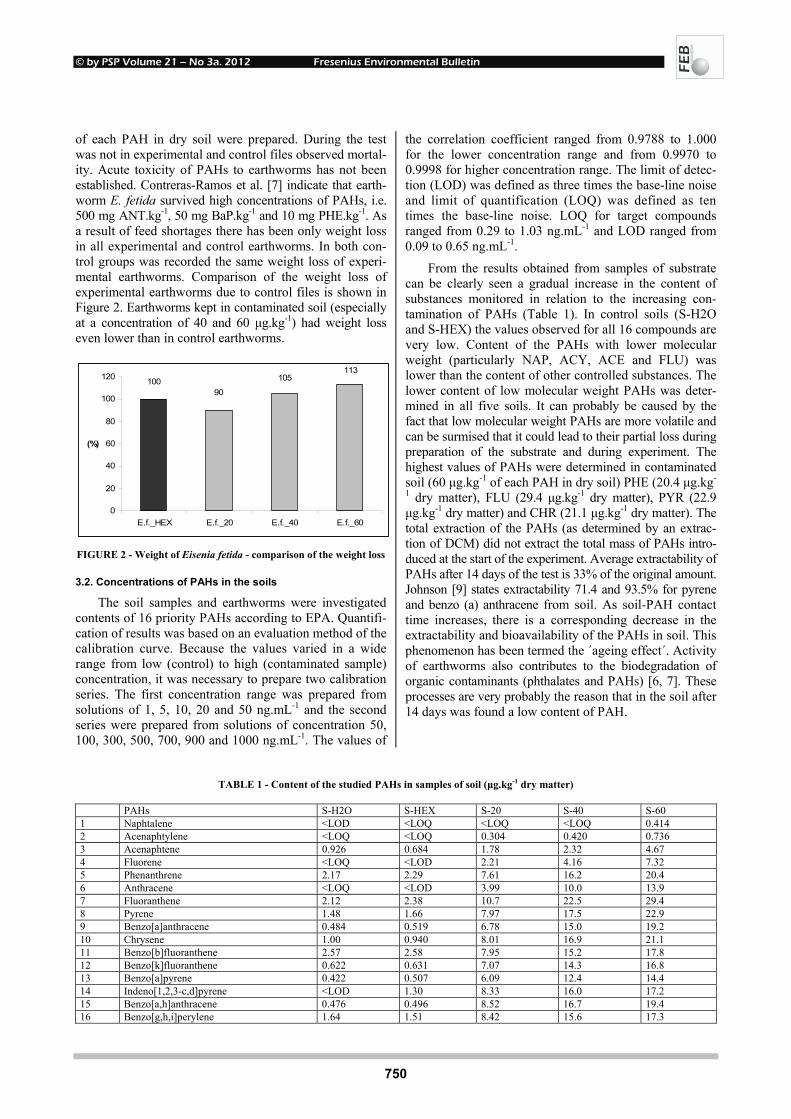
© by PSP Volume 21 – No 3a. 2012 Fresenius Environmental Bulletin
750
of each PAH in dry soil were prepared. During the test was not in experimental and control files observed mortal-ity. Acute toxicity of PAHs to earthworms has not been established. Contreras-Ramos et al. [7] indicate that earth-worm E. fetida survived high concentrations of PAHs, i.e. 500 mg ANT.kg-1, 50 mg BaP.kg-1 and 10 mg PHE.kg-1. As a result of feed shortages there has been only weight loss in all experimental and control earthworms. In both con-trol groups was recorded the same weight loss of experi-mental earthworms. Comparison of the weight loss of experimental earthworms due to control files is shown in Figure 2. Earthworms kept in contaminated soil (especially at a concentration of 40 and 60 µg.kg-1) had weight loss even lower than in control earthworms.
113
105
90100
0
20
40
60
80
100
120
E.f._HEX E.f._20 E.f._40 E.f._60
(%)
FIGURE 2 - Weight of Eisenia fetida - comparison of the weight loss
3.2. Concentrations of PAHs in the soils
The soil samples and earthworms were investigated contents of 16 priority PAHs according to EPA. Quantifi-cation of results was based on an evaluation method of the calibration curve. Because the values varied in a wide range from low (control) to high (contaminated sample) concentration, it was necessary to prepare two calibration series. The first concentration range was prepared from solutions of 1, 5, 10, 20 and 50 ng.mL-1 and the second series were prepared from solutions of concentration 50, 100, 300, 500, 700, 900 and 1000 ng.mL-1. The values of
the correlation coefficient ranged from 0.9788 to 1.000 for the lower concentration range and from 0.9970 to 0.9998 for higher concentration range. The limit of detec-tion (LOD) was defined as three times the base-line noise and limit of quantification (LOQ) was defined as ten times the base-line noise. LOQ for target compounds ranged from 0.29 to 1.03 ng.mL-1 and LOD ranged from 0.09 to 0.65 ng.mL-1.
From the results obtained from samples of substrate can be clearly seen a gradual increase in the content of substances monitored in relation to the increasing con-tamination of PAHs (Table 1). In control soils (S-H2O and S-HEX) the values observed for all 16 compounds are very low. Content of the PAHs with lower molecular weight (particularly NAP, ACY, ACE and FLU) was lower than the content of other controlled substances. The lower content of low molecular weight PAHs was deter-mined in all five soils. It can probably be caused by the fact that low molecular weight PAHs are more volatile and can be surmised that it could lead to their partial loss during preparation of the substrate and during experiment. The highest values of PAHs were determined in contaminated soil (60 µg.kg-1 of each PAH in dry soil) PHE (20.4 µg.kg-
1 dry matter), FLU (29.4 µg.kg-1 dry matter), PYR (22.9 µg.kg-1 dry matter) and CHR (21.1 µg.kg-1 dry matter). The total extraction of the PAHs (as determined by an extrac-tion of DCM) did not extract the total mass of PAHs intro-duced at the start of the experiment. Average extractability of PAHs after 14 days of the test is 33% of the original amount. Johnson [9] states extractability 71.4 and 93.5% for pyrene and benzo (a) anthracene from soil. As soil-PAH contact time increases, there is a corresponding decrease in the extractability and bioavailability of the PAHs in soil. This phenomenon has been termed the ´ageing effect´. Activity of earthworms also contributes to the biodegradation of organic contaminants (phthalates and PAHs) [6, 7]. These processes are very probably the reason that in the soil after 14 days was found a low content of PAH.
TABLE 1 - Content of the studied PAHs in samples of soil (µg.kg-1 dry matter)
PAHs S-H2O S-HEX S-20 S-40 S-60 1 Naphtalene <LOD <LOQ <LOQ <LOQ 0.414 2 Acenaphtylene <LOQ <LOQ 0.304 0.420 0.736 3 Acenaphtene 0.926 0.684 1.78 2.32 4.67 4 Fluorene <LOQ <LOD 2.21 4.16 7.32 5 Phenanthrene 2.17 2.29 7.61 16.2 20.4 6 Anthracene <LOQ <LOD 3.99 10.0 13.9 7 Fluoranthene 2.12 2.38 10.7 22.5 29.4 8 Pyrene 1.48 1.66 7.97 17.5 22.9 9 Benzo[a]anthracene 0.484 0.519 6.78 15.0 19.2 10 Chrysene 1.00 0.940 8.01 16.9 21.1 11 Benzo[b]fluoranthene 2.57 2.58 7.95 15.2 17.8 12 Benzo[k]fluoranthene 0.622 0.631 7.07 14.3 16.8 13 Benzo[a]pyrene 0.422 0.507 6.09 12.4 14.4 14 Indeno[1,2,3-c,d]pyrene <LOD 1.30 8.33 16.0 17.2 15 Benzo[a,h]anthracene 0.476 0.496 8.52 16.7 19.4 16 Benzo[g,h,i]perylene 1.64 1.51 8.42 15.6 17.3
© by PSP Volume 21 – No 3a. 2012 Fresenius Environmental Bulletin
751
More than detected concentrations of individual sub-stances will probably tell you the percentage of substances in the sample. Both controls exhibit the same relative repre-sentation of individual PAHs (Fig.3). Contaminated soils show a relatively good agreement on behalf of individual PAHs. When comparing the contaminated and control sub-strates, there are apparent differences in the proportional representation, the most striking difference can be observed in PHE, FLT and BbFA that in controls are represented in larger quantities.
3.3. Concentrations of PAHs in the earthworms
Multicellular animals such as nematodes, microarthro-podes and annelids (earthworms) come in close contact with PAHs by moving around in soil and can accumulate them. This accumulation is the results of passive absorption through the body wall of the dissolved fraction in the inter-stitial water and intestinal uptake during the passage of contaminated soil through the gut [7]. Higher levels of PAHs were observed in samples of earthworms from con-taminated substrates than in controls. The highest content
0%
20%
40%
60%
80%
100%
S_H2O S_HEX S_20 S_40 S_60
BghiPBahAIPYBaPBkFABbFACHRBaAPYRFLTANTPHEFLUACE
FIGURE 3 - Percentage of PAHs in soil samples
TABLE 2 - Content of the studied PAHs in tissues of Eisenia fetida (µg.kg-1 tissues)
PAH E.f.-H2O E.f.-HEX E.f.-20 E.f.-40 E.f.-60 1 Naphtalene <LOQ <LOQ 1.01 <LOQ <LOQ 2 Acenaphtylene 1.08 11.4 1.22 1.17 0.883 3 Acenaphtene <LOQ 18.1 10.1 8.39 7.06 4 Fluorene <LOQ 0.762 1.31 2.29 1.38 5 Phenanthrene 0.610 3.13 5.03 14.3 7.94 6 Anthracene <LOD 0.733 1.27 11.3 4.93 7 Fluoranthene 1.30 0.541 3.00 22.9 11.2 8 Pyrene 1.65 0.705 5.65 24.8 14.3 9 Benzo[a]anthracene 1.24 3.03 4.07 24.0 12.8 10 Chrysene <LOD <LOQ <LOD 27.0 8.32 11 Benzo[b]fluoranthene 2.38 1.66 2.55 16.6 6.20 12 Benzo[k]fluoranthene 0.541 0.691 1.78 18.7 5.78 13 Benzo[a]pyrene 0.852 0.656 2.46 11.7 3.10 14 Indeno[1,2,3-c,d]pyrene <LOD <LOD 4.03 12.5 4.61 15 Benzo[a,h]anthracene <LOD <LOD 3.79 14. 3 4.95 16 Benzo[g,h,i]perylene <LOD <LOD 5.23 11.9 6.24

© by PSP Volume 21 – No 3a. 2012 Fresenius Environmental Bulletin
752
of PAHs was in most cases determined in earthworms from the soil at a concentration of 40 µg.kg-1 of each PAH in dry soil (Table 2). As with soil samples and also sam-ples of earthworms were the highest values found in CHR (27.0 µg.kg-1 tissues), PYR (24.8 µg.kg-1 tissues), BaA (24.0 µg.kg-1 tissues) and FLU (22.9 µg.kg-1 tissues). We can assume that earthworms kept in soil with PAHs at a concentration 60 µg.kg-1 of each PAH in dry soil started to use some of the PAHs and metabolize them. Some reports indicate that annelids can metabolize Benzo[a]pyrene. E. fetida and other annelids have cytochrome-P450 enzymes capable of degrading these compounds [12].
We also can observe a small content of low molecular weight PAHs (especially NAP, ACY and FLU) in sam-ples of all tested earthworms. An exception is surprisingly high amounts of ACE, especially in tissues of hexane control. ACE was demonstrated in all five groups tested, i.e. how to earthworms placed in the control substrate without the addition of PAHs and the earthworms placed on contaminated substrate.
Figure 4 shows the proportions of individual PAHs
determined in samples of earthworms. Representation of individual PAHs in the tissues of earthworms from sub-strates with zero contamination and from different con-taminated substrates is different. Representation of indi-vidual PAHs in the two controls were different. In the control with addition of pure hexane was found a high
incidence of ACE and ACY. The worms from contami-nated substrate can see the relative agreement on behalf of individual PAHs especially at concentrations of PAHs in the soil 40 and 60 µg.kg-1 of each PAH in dry soil, earth-worms from the substrate 20 µg.kg-1 of each PAH in dry soil contained a significantly greater number of ACE. These results show that earthworms are able to accumu-late PAHs in their tissues from the environment.
For 16 PAHs the bioaccumulation factor (BAF =
PAHs concentration in earthworm tissue divided by PAHs concentration in the soil) was calculated (Table 3). Bioac-cumulation factor ranged from 0.25 to 5.69 values. The highest BAF in all contaminated soils have been calcu-lated for the ACE (1.51 – 5.69) and ACY (1.20 – 4.20). Other BAF were close to or below 1 in most cases. Hank-ard (2004) stated in his study similar results, the highest BCF was 47 for the FLU and 26 for ACE. Bioconcentra-tion factors (BCFs) in this study were calculated as mean earthworm residue level divided mean measured soil residue level. Other BCF values correspond to our results, especially in samples of reference samples, where the concentration of PAHs was similar to amount we used to contamination in our experiments. But it must be men-tioned that in the experiments were used earthworms Lumbricus rubellus, a different kind than in our case [14]. However, it is possible that this similarity is not acciden-tal and should lead to further experiments.
0%
20%
40%
60%
80%
100%
E.f._H2O E.f._HEX E.f._20 E.f._40 E.f._60
BghiPBahAIPYBaPBkFABbFACHRBaAPYRFLTANTPHEFLUACEACYNAP
FIGURE 4 - Percentage of PAHs in E. fetida samples

© by PSP Volume 21 – No 3a. 2012 Fresenius Environmental Bulletin
753
TABLE 3 - Content of the studied PAHs in tissues of Eisenia fetida (µg.kg-1 tissues)
PAH BAF 20 BAF 40 BAF 60 1 Naphtalene - - - 2 Acenaphtylene 4.03 2.79 1.20 3 Acenaphtene 5.69 3.62 1.51 4 Fluorene 0.59 0.55 0.19 5 Phenanthrene 0.66 0.88 0.39 6 Anthracene 0.32 1.13 0.35 7 Fluoranthene 0.28 1.02 0.38 8 Pyrene 0.71 1.42 0.63 9 Benzo[a]anthracene 0.60 1.60 0.67 10 Chrysene - 1.60 0.39 11 Benzo[b]fluoranthene 0.32 1.10 0.35 12 Benzo[k]fluoranthene 0.25 1.31 0.34 13 Benzo[a]pyrene 0.40 0.94 0.22 14 Indeno[1,2,3-c,d]pyrene 0.48 0.78 0.27 15 Benzo[a,h]anthracene 0.45 0.86 0.26 16 Benzo[g,h,i]perylene 0.62 0.76 0.36
4. CONCLUSION
The transfer of polycyclic aromatic hydrocarbons from soil substrate into tissue of earthworms was con-firmed on the determination of PAHs in the tissue of earthworms in the substrate, in which the concentrations of PAHs were applied. Eisenia fetida earthworms have been shown to be suitable for this type of experiment. There were found differences between the content of PAHs in earthworms kept in various contaminated sub-strates. In earthworms kept in the contaminated substrates were found all PAHs used for soil contamination. In earthworms kept in control substrates were detected only 8 of the 16 monitored PAHs. These observed concentra-tions were very low. There was no acute toxicity during the 14-day test with PAHs.
ACKNOWLEDGEMENTS
The work was supported by Research Project No. 6215712402 Ministry of Education, Young and Sports of Czech Republic.
REFERENCES
[1] Zheng, S., Song, Y., Qio, X., Sun, T., Ackland, M.L. and Zhang, W. (2008) Annetocin and TCTP expressions in the earthworm Eisenia fetia exposed to PAHs in artificial soil. Ecotoxicology and Environmental Safety, 71, pp. 566-573.
[2] Wu, S., Wu, E., Qui, L., Zhong, W. and Chen, J. (2011) Ef-fects of phenanthrene on the mortality, growth, and anti-oxidant system of earthworms (Eisenia fetida) under labora-tory conditions. Chemosphere, 83, pp. 429-434.
[3] Bouché, A. (1992) Earthworm species and ecotoxicological studies. (eds. Greig-Schmith, P.W., Becker, H., Edwards, P.J., Heimbach, F.). Ecotoxikology of earthworms. Intercept Ltd, Andover, Hants, UK, pp. 20-35.
[4] Saint-Denis, M., Narbonne, J.F., Arnaud, C., Thybaud, E. and Ribera, D. (1999) Biochemical response of the earth-worms Eisenia fetida andrei exposed to contaminated artifi-cal soil: effects of benzo(a)pyrene. Soil Biology and Bio-chemistry, 31, pp. 1837-1846.
[5] Peres, G., Piron, D., Bellido, A., Goater, C. and Cluzeau, D. (2008) Earthworms used as an indicators of agricultural man-agements. Fresenius Environmental Bulletin, 17, pp. 1181-1189.
[6] Contreras-Ramos, S.M., Álvarez-Bernal, D. and Dendooven, L. (2008) Removal of polycyclic aromatic hydrocarbons from soil amended with biosolid or vermicompost in the presence of earthworms (Eisenia fetida). Soil Biology and Biochemistry, 40, pp. 1954-1959.
[7] Contreras-Ramos, S.M., Álvarez-Bernal, D. and Dendooven, L. (2009) Characteristics of earthworms (Eisenia fetida) in PAHs contaminated soil amended with sewage sludge or vermicompost. Applied Soil Ecology, 41, pp. 269-276.
[8] Eom, I.C., Rast, C., Veber, A.M. and Vasseur, P. (2007) Eco-toxicity of a polycyclic aromatic hydrocarbon (PAH)-contaminated soil. Ecotoxicology and Environmental Safety, 67, pp. 190-205.
[9] Johnson, D.L., Jones, K.C., Langdon, C.J., Piearce, T.G. and Semple, K.T. (2002) Temporal changes in earthworm avail-ability and extractability of polycyclic aromatic hydrocarbons in soil. Soil Biology and Biochemistry, 34, pp. 1363-1370.
[10] Reid, B.J., Jones, K.C. and Semple, K.T. (2000) Bioavail-ability of persistent organic pollutants in soils and sediments – a perspective on mechanism, consequences and assessment. Environmental Pollution, 108, pp. 103-112.
[11] Semple, K. T., Doick, K. J., Jones, K. C., Burauel, P., Craven, A. and Harms, H. (2004) Defining bioavailability and bioac-cessibility of contaminated soil and sediment is complicated. Environmental Science & Technology, 38, 228A-231A.
[12] Tejada, M. and Masciandaro, G. (2011) Application of or-ganic wastes on a benzo(a)pyrene polluted soil. Response of soil biochemical properties and role of Eisenia fetida. Eco-toxicology and Environmental Safety, 74, pp. 668-674.
[13] Driscoll, S.B.K. and McElroy, A.E. (1997) Elimination of sediment-associated benzo[a]pyrene and its matabolites by polychaete worms exposed to 3-methylcholanthrene. Aquatic Toxicology, 39, pp. 77-91.

© by PSP Volume 21 – No 3a. 2012 Fresenius Environmental Bulletin
754
[14] Hankard, P. K., Svendsen, C., Wright, J., Wienberg, C., Fishwick, S.K., Spurgeon, D.J. and Weeks, J.M. (2004). Bio-logical assessment of contaminated land using earthworm biomarkers in support of chemical analysis. Science of the Total Environment, 330, pp. 9-20.
[15] OECD methods No. 207 („Earthworm Acute Toxicity Tests“, 4 April 1984)
Received: August 24, 2011 Accepted: November 07, 2011 CORRESPONDING AUTHOR
Michaela Stoupalova Department of Veterinary Ecology and Environmental Protection Faculty of Veterinary Hygiene and Ecology University of Veterinary and Pharmaceutical Sciences Brno Palackeho 1-3 612 42 Brno CZECH REPUBLIC E-mail: [email protected]
FEB/ Vol 21/ No 3a/ 2012 – pages 748 - 754

© by PSP Volume 21 – No 3a. 2012 Fresenius Environmental Bulletin
755
REMOVAL OF ORGANIC HALOGENS FROM INORGANIC CHLORIDES BY ACTIVATED CHARCOAL IN AIR SAMPLES
Ozgen Ercan*
TUBITAK Marmara Research Center, Environment Institute, 41470, Gebze-Kocaeli, Turkey.
ABSTRACT
Determination of inorganic chloride from stationary sources in the presence of organic chloride compounds is of great importance during the analysis. The amount of re-leased inorganic chloride into atmosphere was determined with burned refuse-derived fuel (RDF) originated plastic wastes according to the rule of Hazardous Waste Regula-tions. Organic chlorides absorbed in scrubber solution during the sampling time interfere for analysis of inor-ganic chloride by ion chromatography. Organic chlorides are removed by using two different activated charcoal tubes so that inorganic chloride analysis is provided more reliably. Recovery of inorganic chloride levels in the scrub-ber solution was obtained approximately 50% by using granular activated charcoal where these levels increased by approximately 95% when it is passed from the pow-dered activated charcoal. The amounts of chlorides were obtained 0.13, 0.50, 0.91 mg Cl-/Nm3 using 0%, 8%, 12% and 15% RDF ratio after Di.Elle activated charcoal and 0.13, 0.63, 0.93, 1.13 mg Cl-/Nm3 using 0%, 8%, 12% and 15% RDF ratio after Merck activated charcoal. Re-sults show that powdered activated charcoal is more ef-fective than granular activated charcoal.
KEYWORDS: air sample, chloride, activated charcoal, analysis
1. INTRODUCTION
Discharge of industrial wastes from chemical industry activities, components of the urban solid waste and the leaching from agricultural and forest land are the main sources of organic pollution in water streams. These com-pounds are used on a large scale even in everyday and may be industrial effluent contaminants. Some of them are toxic and slow to biodegrade, they accumulate in the environment [1-3]. * Corresponding author
There are a variety of methods available for removal of organic pollutants from wastewater and the most im-portant of them are reverse osmosis, electrochemical oxida-tion, incineration, ion exchange, precipitation, and adsorp-tion. Of those adsorption is by far the most versalite and widely used method for the removal of toxic pollutants as it is inexpensive and eases to use operation. Different materials are used as adsorbents for the removal of differ-ent pollutants. Activated charcoal (AC) is frequently used for the removal of organic pollutants from wastewater for more than three decades [4-12].
AC are known as very effective adsorbents due to their high porosity, large surface area (that can reach 3000 m2 g_1), and high adsorption capacity. This is a very versalite mate-rial show that the unique properties of AC, which has not been used only as adsorbents, but also used as catalysts and catalyst supports for different purposes such as the removal of pollutants from gaseous or liquid phases and the purification or recovery of chemicals. Despite the satis-factory results obtained using some of these low-cost adsorbents, AC are known to be more effective adsorbent for removal of greater amount of pollutants than other adsorbents [3, 13].
The most important characteristics of AC in the ad-sorption of organic compounds are pore size distribution, surface chemistry (functionality) and mineral matter con-tent. Adsorption capacity is defined as the accumulation of the solute molecules at the surface of a solid. This capacity is directly proportional to the area of the surface exposed and is dependent on the solute partial pressure and the temperature. Coal-based activated carbons are typically used to remove both low-molecular weight hy-drocarbons, such as chlorinated organics, and high-molecular weight materials, like pesticides [14-16].
RDF technology can be applied in large municipal solid waste (MSW) facilities. RDF is a fuel produced from flammable components of the urban solid waste. RDF production consists of grinding, classification and disposal operations in order to remove metal components from the solid waste. The last step of RDF production is to bring the samples to a uniform size by shredding. RDF pellets compared to clean coal are environmentally friendly, en-
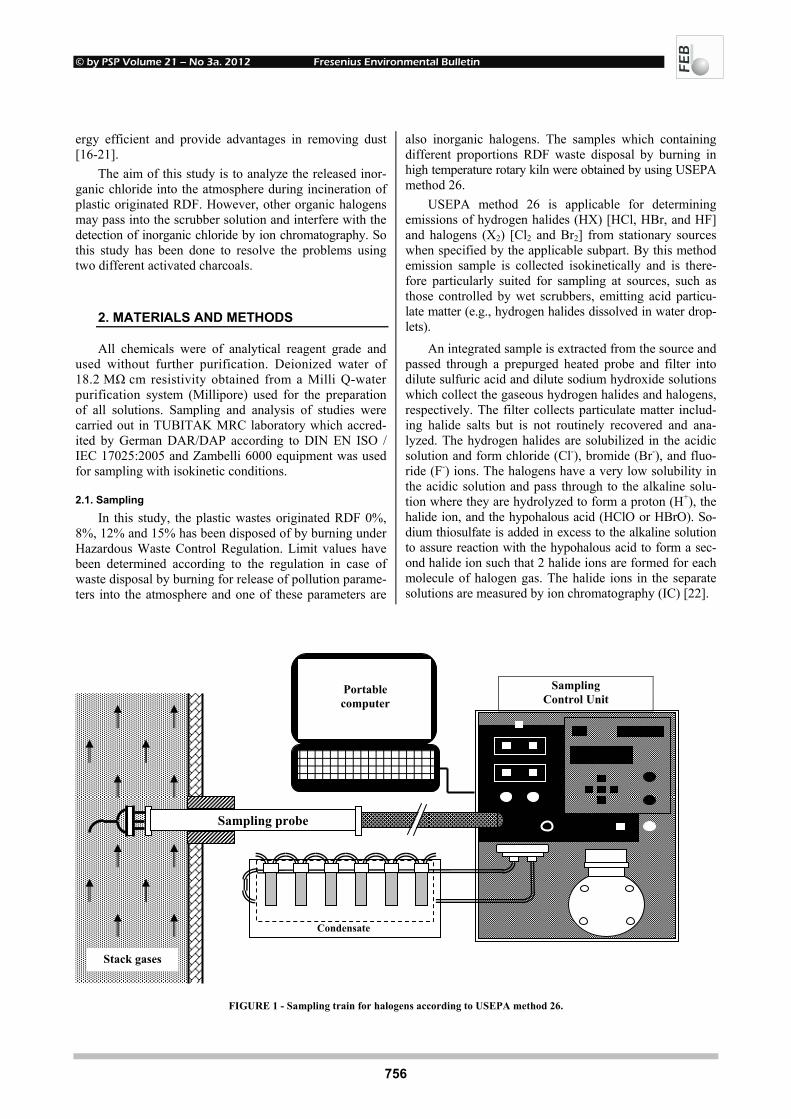
© by PSP Volume 21 – No 3a. 2012 Fresenius Environmental Bulletin
756
ergy efficient and provide advantages in removing dust [16-21].
The aim of this study is to analyze the released inor-ganic chloride into the atmosphere during incineration of plastic originated RDF. However, other organic halogens may pass into the scrubber solution and interfere with the detection of inorganic chloride by ion chromatography. So this study has been done to resolve the problems using two different activated charcoals.
2. MATERIALS AND METHODS
All chemicals were of analytical reagent grade and used without further purification. Deionized water of 18.2 MΩ cm resistivity obtained from a Milli Q-water purification system (Millipore) used for the preparation of all solutions. Sampling and analysis of studies were carried out in TUBITAK MRC laboratory which accred-ited by German DAR/DAP according to DIN EN ISO / IEC 17025:2005 and Zambelli 6000 equipment was used for sampling with isokinetic conditions.
2.1. Sampling
In this study, the plastic wastes originated RDF 0%, 8%, 12% and 15% has been disposed of by burning under Hazardous Waste Control Regulation. Limit values have been determined according to the regulation in case of waste disposal by burning for release of pollution parame-ters into the atmosphere and one of these parameters are
also inorganic halogens. The samples which containing different proportions RDF waste disposal by burning in high temperature rotary kiln were obtained by using USEPA method 26.
USEPA method 26 is applicable for determining emissions of hydrogen halides (HX) [HCl, HBr, and HF] and halogens (X2) [Cl2 and Br2] from stationary sources when specified by the applicable subpart. By this method emission sample is collected isokinetically and is there-fore particularly suited for sampling at sources, such as those controlled by wet scrubbers, emitting acid particu-late matter (e.g., hydrogen halides dissolved in water drop-lets).
An integrated sample is extracted from the source and passed through a prepurged heated probe and filter into dilute sulfuric acid and dilute sodium hydroxide solutions which collect the gaseous hydrogen halides and halogens, respectively. The filter collects particulate matter includ-ing halide salts but is not routinely recovered and ana-lyzed. The hydrogen halides are solubilized in the acidic solution and form chloride (Cl-), bromide (Br-), and fluo-ride (F-) ions. The halogens have a very low solubility in the acidic solution and pass through to the alkaline solu-tion where they are hydrolyzed to form a proton (H+), the halide ion, and the hypohalous acid (HClO or HBrO). So-dium thiosulfate is added in excess to the alkaline solution to assure reaction with the hypohalous acid to form a sec-ond halide ion such that 2 halide ions are formed for each molecule of halogen gas. The halide ions in the separate solutions are measured by ion chromatography (IC) [22].
FIGURE 1 - Sampling train for halogens according to USEPA method 26.
Stack gases
Sampling probe
Portable computer
Sampling Control Unit
Condensate
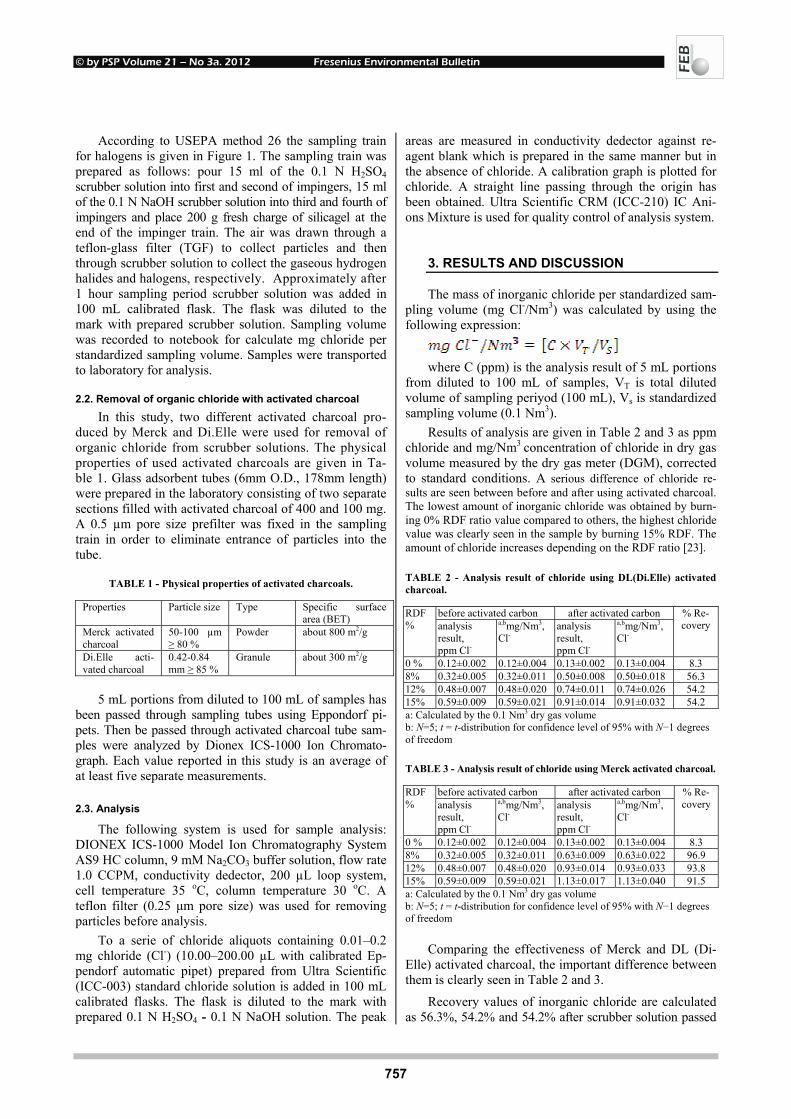
© by PSP Volume 21 – No 3a. 2012 Fresenius Environmental Bulletin
757
According to USEPA method 26 the sampling train for halogens is given in Figure 1. The sampling train was prepared as follows: pour 15 ml of the 0.1 N H2SO4 scrubber solution into first and second of impingers, 15 ml of the 0.1 N NaOH scrubber solution into third and fourth of impingers and place 200 g fresh charge of silicagel at the end of the impinger train. The air was drawn through a teflon-glass filter (TGF) to collect particles and then through scrubber solution to collect the gaseous hydrogen halides and halogens, respectively. Approximately after 1 hour sampling period scrubber solution was added in 100 mL calibrated flask. The flask was diluted to the mark with prepared scrubber solution. Sampling volume was recorded to notebook for calculate mg chloride per standardized sampling volume. Samples were transported to laboratory for analysis.
2.2. Removal of organic chloride with activated charcoal
In this study, two different activated charcoal pro-duced by Merck and Di.Elle were used for removal of organic chloride from scrubber solutions. The physical properties of used activated charcoals are given in Ta-ble 1. Glass adsorbent tubes (6mm O.D., 178mm length) were prepared in the laboratory consisting of two separate sections filled with activated charcoal of 400 and 100 mg. A 0.5 µm pore size prefilter was fixed in the sampling train in order to eliminate entrance of particles into the tube.
TABLE 1 - Physical properties of activated charcoals.
Properties Particle size Type Specific surface area (BET)
Merck activated charcoal
50-100 µm ≥ 80 %
Powder about 800 m2/g
Di.Elle acti-vated charcoal
0.42-0.84 mm ≥ 85 %
Granule about 300 m2/g
5 mL portions from diluted to 100 mL of samples has
been passed through sampling tubes using Eppondorf pi-pets. Then be passed through activated charcoal tube sam-ples were analyzed by Dionex ICS-1000 Ion Chromato-graph. Each value reported in this study is an average of at least five separate measurements.
2.3. Analysis
The following system is used for sample analysis: DIONEX ICS-1000 Model Ion Chromatography System AS9 HC column, 9 mM Na2CO3 buffer solution, flow rate 1.0 CCPM, conductivity dedector, 200 µL loop system, cell temperature 35 oC, column temperature 30 oC. A teflon filter (0.25 µm pore size) was used for removing particles before analysis.
To a serie of chloride aliquots containing 0.01–0.2 mg chloride (Cl-) (10.00–200.00 µL with calibrated Ep-pendorf automatic pipet) prepared from Ultra Scientific (ICC-003) standard chloride solution is added in 100 mL calibrated flasks. The flask is diluted to the mark with prepared 0.1 N H2SO4 - 0.1 N NaOH solution. The peak
areas are measured in conductivity dedector against re-agent blank which is prepared in the same manner but in the absence of chloride. A calibration graph is plotted for chloride. A straight line passing through the origin has been obtained. Ultra Scientific CRM (ICC-210) IC Ani-ons Mixture is used for quality control of analysis system.
3. RESULTS AND DISCUSSION
The mass of inorganic chloride per standardized sam-pling volume (mg Cl-/Nm3) was calculated by using the following expression:
where C (ppm) is the analysis result of 5 mL portions
from diluted to 100 mL of samples, VT is total diluted volume of sampling periyod (100 mL), Vs is standardized sampling volume (0.1 Nm3).
Results of analysis are given in Table 2 and 3 as ppm chloride and mg/Nm3 concentration of chloride in dry gas volume measured by the dry gas meter (DGM), corrected to standard conditions. A serious difference of chloride re-sults are seen between before and after using activated charcoal. The lowest amount of inorganic chloride was obtained by burn-ing 0% RDF ratio value compared to others, the highest chloride value was clearly seen in the sample by burning 15% RDF. The amount of chloride increases depending on the RDF ratio [23].
TABLE 2 - Analysis result of chloride using DL(Di.Elle) activated charcoal.
before activated carbon after activated carbon RDF % analysis
result, ppm Cl-
a,bmg/Nm3, Cl-
analysis result, ppm Cl-
a,bmg/Nm3, Cl-
% Re-covery
0 % 0.12±0.002 0.12±0.004 0.13±0.002 0.13±0.004 8.3 8% 0.32±0.005 0.32±0.011 0.50±0.008 0.50±0.018 56.3 12% 0.48±0.007 0.48±0.020 0.74±0.011 0.74±0.026 54.2 15% 0.59±0.009 0.59±0.021 0.91±0.014 0.91±0.032 54.2 a: Calculated by the 0.1 Nm3 dry gas volume b: N=5; t = t-distribution for confidence level of 95% with N−1 degrees of freedom
TABLE 3 - Analysis result of chloride using Merck activated charcoal.
before activated carbon after activated carbon RDF % analysis
result, ppm Cl-
a,bmg/Nm3, Cl-
analysis result, ppm Cl-
a,bmg/Nm3, Cl-
% Re-covery
0 % 0.12±0.002 0.12±0.004 0.13±0.002 0.13±0.004 8.3 8% 0.32±0.005 0.32±0.011 0.63±0.009 0.63±0.022 96.9 12% 0.48±0.007 0.48±0.020 0.93±0.014 0.93±0.033 93.8 15% 0.59±0.009 0.59±0.021 1.13±0.017 1.13±0.040 91.5 a: Calculated by the 0.1 Nm3 dry gas volume b: N=5; t = t-distribution for confidence level of 95% with N−1 degrees of freedom
Comparing the effectiveness of Merck and DL (Di-
Elle) activated charcoal, the important difference between them is clearly seen in Table 2 and 3.
Recovery values of inorganic chloride are calculated as 56.3%, 54.2% and 54.2% after scrubber solution passed
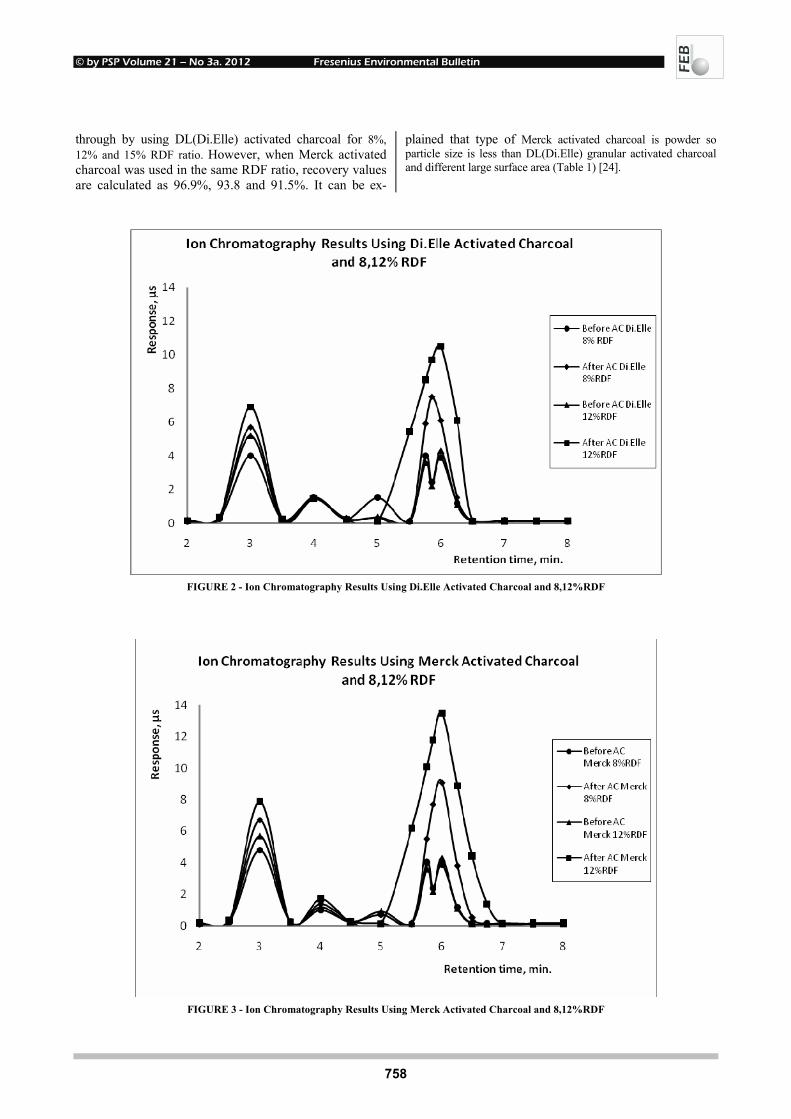
© by PSP Volume 21 – No 3a. 2012 Fresenius Environmental Bulletin
758
through by using DL(Di.Elle) activated charcoal for 8%, 12% and 15% RDF ratio. However, when Merck activated charcoal was used in the same RDF ratio, recovery values are calculated as 96.9%, 93.8 and 91.5%. It can be ex-
plained that type of Merck activated charcoal is powder so particle size is less than DL(Di.Elle) granular activated charcoal and different large surface area (Table 1) [24].
FIGURE 2 - Ion Chromatography Results Using Di.Elle Activated Charcoal and 8,12%RDF
FIGURE 3 - Ion Chromatography Results Using Merck Activated Charcoal and 8,12%RDF

© by PSP Volume 21 – No 3a. 2012 Fresenius Environmental Bulletin
759
There is also a significant influence on the results to analyze the samples after using activated charcoal. In Figure 2 and 3 it can be seen that very different response values were obtained between before no passed and after passed activated charcoal by using rates of all RDF mate-rial.
The chloride peak values were shown almost same re-tention times for all samples, better resolved peaks and response values were obtained after activated charcoal compared to other.
The organic compounds that absorbed in scrubber so-lution and negative impacts during analysis were removed by using activated charcoal in this study. The placement of guard column before the main column can be faster and more practial during the chromatographic analysis of water and soil samples in order to remove of organic compounds. However, limited number of air samples were collected during incineration of plastic originated RDF wherefore not obtained same process conditions. Therefore, use of activated charcoal instead of guard column for removal of organic compounds in air samples that are more practial and feasible.
ACKNOWLEDGEMENTS
The author would like to thank TUBITAK Marmara Research Center Water and Wastewater Laboratory for analyses.
REFERENCES
[1] Gupta, V. K., Mittali A., Jain, R., Mathur, M. And Sikarwar, S. (2006) Adsorption of Safranin-T from Wastewater Using Waste Materials Activated Carbon and Activated Rice Husks. Journal of Colloid and Interface Science 303, 80–86.
[2] Srivastava, S.K., Gupta,V.K., Mohan, D. and Pant, N. (1993) Removal of COD from Reclaimed Rubber Factory Effluents by Using the Activated Carbon (developed from fertilizer waste material) and Activated Slag (Developed from blast furnace waste material)—a case study. Fresenius Environ-mental Bulletin 2, 394–401.
[3] Joana, M.D., Maria, C.M., Alvim, F., Manuel, F.A., Jose, R.U. and Manuel, S.P. (2007) Waste Materials for Activated Carbon Preparation and its use in Aqueous-Phase Treatment: A Re-view. Journal of Environmental Management 85, 833–846.
[4] Pavoni, B., Drusian, D., Giacometti, A. and Zanette, M. (2006) Assessment of organic chlorinated compound removal from aqueous matrices by adsorption on activated carbon. Water Research 40, 3571-3579.
[5] Xing, W., Ngo, H.H., Kim, S.H., Guo, W.S. and Hagare, P. (2008) Adsorption and bioadsorption of granular activated carbon (GAC) for dissolved organic carbon (DOC) removal in wastewater. Bioresource Technology 99, 8674-8678.
[6] Pan, Z.H., Tian, J.Y., Xu, G.R., Li, J.J. and Li, G.B. (2011) Characteristics of adsorbents made from biological, chemical and hybrid sludges and their effect on organics removal in wastewater treatment. Water Research 45(2), 819-827.
[7] Gupta, V.K., Carrott, P.J.M., Ribeiro Carrott, M.M.L. and Suhas (2009) Low-Cost Adsorbent: Growing Approach to wastewater treatment-a review. Critical Reviews in Environ-mental Science and Technology 39, 783-842.
[8] Ali, I. and Gupta, V.K. (2007) Advances in water treatment by adsorption technology. Nature Protocols 1(6), 2661-2667.
[9] Mayan-Mondragon, R., Ibanoz, J.G. and Vasquez-Medrano, R. (2008) Simultaneous electrochemical oxidation and reduc-tion of representative organic pollutants, Fresenius Environ-mental Bulletin 17(9a), 1294-1299.
[10] Gupta, V.K., Gupta, B., Rastogi, A., Agarwal, S. and Nayak, A. (2011) A comparative investigation on adsorption per-formances of mesoporous activated carbon prepared from waste rubber tire and activated carbon for a hazardous azo dye-Acid Blue 113. Journal of Hazardous Materials 183, 891-901.
[11] Gupta, V.K., Mittal, A., Gajbe, V. and Mittal, J. (2008) Ad-sorption of basic fuchsin using waste materials-bottom ash and deoiled soya-as adsorbents. Journal of Colloid Interface Science 319(1), 30-39.
[12] Gupta, V.K. (2006) Removal and Recovery of the hazardous azo dye acid orange 7 through adsorption over waste materi-als: Bottom ash and de-oiled soya. Industrial and Engineering Chemistry Research 45(4), 1446-1453.
[13] Alvarez-Uriarte, J.I., Iriarte-Velasco, U., Chimeno-Alanís, N. and González-Velasco, J.R. (2010) The effect of mixed oxi-dants and powdered activated carbon on the removal of natu-ral organic matter. Journal of Hazardous Materials 181(1-3), 426-431.
[14] Derbyshire, F., Jagtoyen, M., Andrews, R., Rao, A., Martin-Gullon, I. and Grulke, E. (2001) Carbon Materials in Envi-ronmental Applications, Marcel Decker, New York.
[15] Hashiho, Z., Rood, M. and Botich L. (2005) Microwave-swing Adsorption to Capture and Recover Vapors from Air Streams with Activated Carbon Fiber Cloth. Environmental Science &Technology 39, 6851–6859.
[16] Ma, J., Cui, B.Y., Chen, X. and Dai, J. (2011) Carbonized and activated municipal organic waste for wastewater treat-ment, Fresenius Environmental Bulletin 20(1), 63-68.
[17] Nicholas, P. C. (2002) Handbook of air pollution prevention and control, Butterworth-Heinemann An imprint of Elsevier Science.
[18] Carson, P. and Mumford, C. (2002) Hazardous Chemical Handbook, Second Edition, Butterworth-Heinemann An im-print of Elsevier Science.
[19] Woodard, F. (2001) Industrial Waste Treatment Handbook, Treatment and Disposal of Solid Wastes from Industry, But-terworth–Heinemann.
[20] United Nations Environment Programme (2004) Expert Group on Best Available Techniques and Best Environmental Practices, Japan.
[21] Sika, P. (2000) Energy from MSW, RDF Pelletization, A Pi-lot Indian Plant, Department of Science & Technology, Gov-ernment of India.
[22] USEPA Method 26 (2000) Determination of Hydrogen Hal-ide and Halogen Emissions from Stationary Sources Isoki-netic Method.

© by PSP Volume 21 – No 3a. 2012 Fresenius Environmental Bulletin
760
[23] Chiemchaisri, C., Charnnok, B. and Visvanathan, C. (2010) Recovery of Plastic Wastes from Dumpsite as Refuse-Derived Fuel and its Utilization in Small Gasification Sys-tem. Bioresource Technology 101, 1522-1527.
[24] Rouquerol F., Rouquerol, L. and Sing, K. (1999) Adsorption by Powders and Porous Solids, Principles, Methodology and Applications, Academic Press.
Received: August 19, 2011 Revised: October 20, 2011 Accepted: November 07, 2011 CORRESPONDING AUTHOR
Ozgen Ercan TUBITAK Marmara Research Center Environment Institute 41470 Gebze-Kocaeli TURKEY Phone: +90 262 677 29 73 Fax. +90 262 641 2309 E-mail: [email protected]
FEB/ Vol 21/ No 3a/ 2012 – pages 755 - 760

© by PSP Volume 21 – No 3a. 2012 Fresenius Environmental Bulletin
761
PHYTOTOXIC EFFECTS OF TRIVALENT CHROMIUM ON RAPESEED PLANTS
Matúš Peško, Katarína Kráľová* and Jaroslav Blaško
Comenius University Bratislava, Faculty of Natural Sciences, Bratislava, Slovak Republic
ABSTRACT
The response of hydroponically cultivated rapeseed (Brassica napus L.; c.v. Verona) plants to Cr(III)-nitrate was investigated. The applied metal concentration varied in the range from 6 to 480 µmol L-1 (i.e. 0.312−12.480 mg L-1). Cr(III) application resulted in reduced length, fresh mass as well as dry mass of rapeseed plant organs and the inhibi-tory effect of Cr(III) increased with increasing metal con-centration in the external solution. The roots were more sensitive to Cr(III) treatment than the shoots. Due to Cr(III) application significant decrease in the concentration of assimilation pigments (chlorophyll a, chlorophyll b, caro-tenoids), proteins and reduced thiol groups in rapeseed leaves was observed. As an indicator of lipid peroxida-tion, malondialdehyde contents were used, expressed as thiobarbituric acid reactive substances (TBARS). The concentration of TBARS rose with the increasing Cr(III) concentration. Accumulated Cr concentration in roots of rapeseed cultivar Verona showed linear increase with increasing external Cr(III) concentration reaching 22810 mg Cr kg-1 at treatment with 480 µmol L-1 Cr(III), how-ever translocation of Cr into the shoots was low, what was reflected in small values of translocation factors (0.0015–0.0330).
KEYWORDS: Brassica napus L., Cr(III), production characteris-tics, photosynthetic pigments, bioaccumulation
1. INTRODUCTION
The widespread contamination of environment with chromium due to anthropogenic activities resulted in in-crease of its bioavailability and biomobility. The impact of Cr contamination in the physiology of plants depends on the metal speciation, which is responsible for its mobiliza-tion, subsequent uptake and resultant toxicity in the plant system. Cr toxicity in plants is observed at multiple levels, from reduced yield, through effects on leaf and root growth, to inhibition on enzymatic activities and mutagene-sis [1]. * Corresponding author
Trivalent chromium plays important nutritional func-tions for mammals and must be supplied to the organisms with the diet. In particular, the digestive availability of Cr(III) from organic bonds is better than from mineral com-pounds [2]. Cr(III) is taken up passively, being retained by the cation-exchange sites of the cell walls [3]. At in-creased concentrations it can interfere with several meta-bolic processes because of its high capability to coordi-nate with various organic compounds resulting in inhibi-tion of some metalloenzyme systems [4]. Richard and Bourg [5] also suggested that Cr(III) is an essential nutrient in plant metabolism, e.g., in synthesis of amino and nucleic acids.
In general, Cr(III) was found to be less toxic than Cr(VI). Hydrated Cr(III) ion does not cross the cell mem-branes [6], however at biological pH values the organi-cally bound Cr(III) is able to penetrate the cell wall [7]. The prevalent amount of Cr accumulated by plants re-mains allocated in roots [8, 9]. Zayed et al. [4] found that seven from ten tested agricultural plants accumulated chro-mium to a higher extent after Cr(VI)-treatment in com-parison with Cr(III) application.
Chromium also causes deleterious effects on plant physiological processes such as photosynthesis, water rela-tions and mineral nutrition [1, 10]. For example, the pres-ence of high levels of Cr decreased levels of Fe and Zn and increased Mn concentrations in bush beans [11]. On the other hand, low levels of Cr(III) were noted to reduce symp-toms of Fe-deficiency and increase Fe/Mn ratios in Fe-deficient bean plants [12]. Cr is reported to affect Fe uptake in dicots either by inhibiting reduction of Fe(III) to Fe(II) or by competing with Fe(II) at the site of absorption [1]. Metabolic alterations by Cr exposure have also been de-scribed in plants either by a direct effect on enzymes or other metabolites or by its ability to generate reactive oxygen species which may cause oxidative stress [1, 13]. As a consequence of Cr stress toxic reactive oxygen species (ROS) like H2O2, O2
⋅-, ⋅OH, etc. are produced what results in damage of DNA, proteins and pigments as well as in initiating lipid peroxidation [13] which can be monitored by malondialdehyde (MDA) formation as content of thiobarbi-turic acid reactive substances (TBARS).
Rapeseed (Brassica napus L. subsp. napus) is one of the most important oil crops, which is used as an agricul-

© by PSP Volume 21 – No 3a. 2012 Fresenius Environmental Bulletin
762
tural crop (food industry), excellent nutritive animal fod-der (rapeseed press cakes), technical crop (biocomponent in biofuels, remediation technology for cleaning of soils contaminated by toxic metals) and in the next future also as a function crop (edible part of plant fortified by nutri-ents, vitamins, flavonoids, etc.) [14]. Some rapeseed cul-tivars were found to accumulate relatively high toxic metal concentrations in tissues of plant organs, thus utili-zation of this plant species in phytoextraction technolo-gies was considered [15, 16].
This paper is aimed to study the Cr(III) effect on some production parameters of hydroponically cultivated rape-seed plants (cv. Verona), to determine the phytotoxic effects of Cr(III) on the concentration of assimilation pigments, proteins, reduced SH groups and malondialdehyde in leaves as well as accumulated chromium concentration in plant organs.
2. MATERIALS AND METHODS
Analytical reagent-grade chemicals purchased from Centralchem (Bratislava) were used for the preparation of all solutions. Freshly distilled water was used in all experi-ments. For metal treatments Cr(NO3)3.9H2O was applied. The seeds of rapeseed (Brassica napus L.), cv. Verona (a late and medium-high genotype suitable for maize and potato production regions) were purchased from Slovak Centrum of Agricultural Production, Research Institute of Plant Production in Piestany, Slovakia.
2.1. Phytotoxicity test
The seeds of B. napus were placed in Petri dishes of 14 cm diameter and filter paper on the bottom. In each Petri dish 60 seeds were evenly distributed on the surface of filter paper and the amount of solution used was 10 cm3 per dish. Five different Cr(NO3)3.9H2O concentrations were used and experiment with each Cr(NO3)3.9H2O concentra-tion was duplicated. The applied concentrations of studied compounds varied in the range from 0.1–2.5 mmol L-1 (5.2–130 mg L-1). After 72 h exposure in the dark at mean air temperature (23 ± 0.5 oC) the length of roots and shoots of seedlings was measured and the results were statistically evaluated.
2.2. Cultivation of rapeseed plants in the presence of Cr(III)
Seeds of rapeseed, cv. Verona were sown into the soil and after 3 weeks they were cultivated in hydroponic solution (pH = 5.9) at controlled conditions (photoperiod 16 h light/8 h dark; irradiation: 80 µmol m-2 s-1 PAR; mean air temperature: 25 oC): control variant in Hoagland solution and metal variants containing Cr(NO3)3.9H2O (6, 12, 24, 60, 120, 240 and 480 µmol L-1, i.e. 0.312, 0.624, 1.248, 3.120, 6.240 and 12.480 mg L-1) and the response of plants to Cr(III) treatment was evaluated 7 d after Cr(III) application. For each experiment six plants were used. Then length of roots and shoots, fresh mass of
leaves and dry mass of roots, stems and leaves were de-termined.
2.3. Determination of assimilation pigments
Concentrations of assimilation pigments (chlorophyll a, chlorophyll b and carotenoids) in plant leaves were de-termined spectrophotometrically (Chl a at 663.2, Chl b at 646.8, and Cars at 470.0 nm) after extraction into 80 % (v/v) acetone (Genesys 6, Thermo Scientific, U.S.A) ac-cording to Lichtenthaler [17].
2.4. Preparation of leaf homogenate
Fresh leaf biomass (90 mg) was homogenised with ethanol (0.5 mL) in mortar, the homogenate was filled up to the volume of 6 mL and resulting suspension was cen-trifuged 5 min at 2900 g. For determination of TBARS (thiobarbituric acid reactive substances), proteins and non-reduced –SH groups the corresponding supernatant was used.
2.5. Determination of the TBARS
Concentration of malondialdehyde (MDA; main prod-uct of lipid peroxidation) was determined as a content of thiobarbituric acid reactive substances (TBARS) in rape-seed leaves. 2 mL of leaf homogenate were incubated for 30 min at 85–100 oC with 1 mL of solution containing 0.5 % (w/v) thiobarbituric acid, 20 % (v/v) trichloroacetic acid, and 100µL of 4 % solution of butylated hydroxy-toluene, followed by cooling in an ice bath for 10 min and centrifuged 2 min at 2900 g. The absorbance of the solu-tion was determined at λ = 532 nm spectrophotometri-cally (Genesis 6, Thermo Scientific) and concentration of TBARS was calculated using extinction coefficient ε= 155 L mmol-1 cm-1.
2.6. Determination of proteins
Protein concentration in rapeseed leaves was deter-mined spectrophotometrically according to Bradford [18] using Bradford reagent which was prepared by dissolution of 10 mg Coomassie Brilliant Blue G-250 in 5 ml of 95 % ethanol, thereafter 10 ml H3PO4 was added and solution was supplemented with water to 100 mL. After 5 min incubation of the reaction mixture (100 µL of homogenate obtained from leaf biomass and 1 mL of Bradford re-agent) at room temperature absorbance was measured at λ = 595 nm (Genesys 6) and protein concentration was evaluated by use of calibration curve. As the standard serum bovine albumin was used.
2.7. Determination of reduced sulfhydryl (thiol) groups
Due to reaction of reduced sulfhydryl groups in pro-teins with 5´5-dithiobis-2-nitrobenzoic acid (DTNB) com-pound with absorption maximum at λ = 412 nm is formed. To 500 µL of homogenate prepared from leaf biomass 100 µl of DTNB (c = 20 mmol L-1) was added and after 45 min incubation of reaction mixture at room temperature its absorbance was measured at λ = 412 nm (Genesys 6)
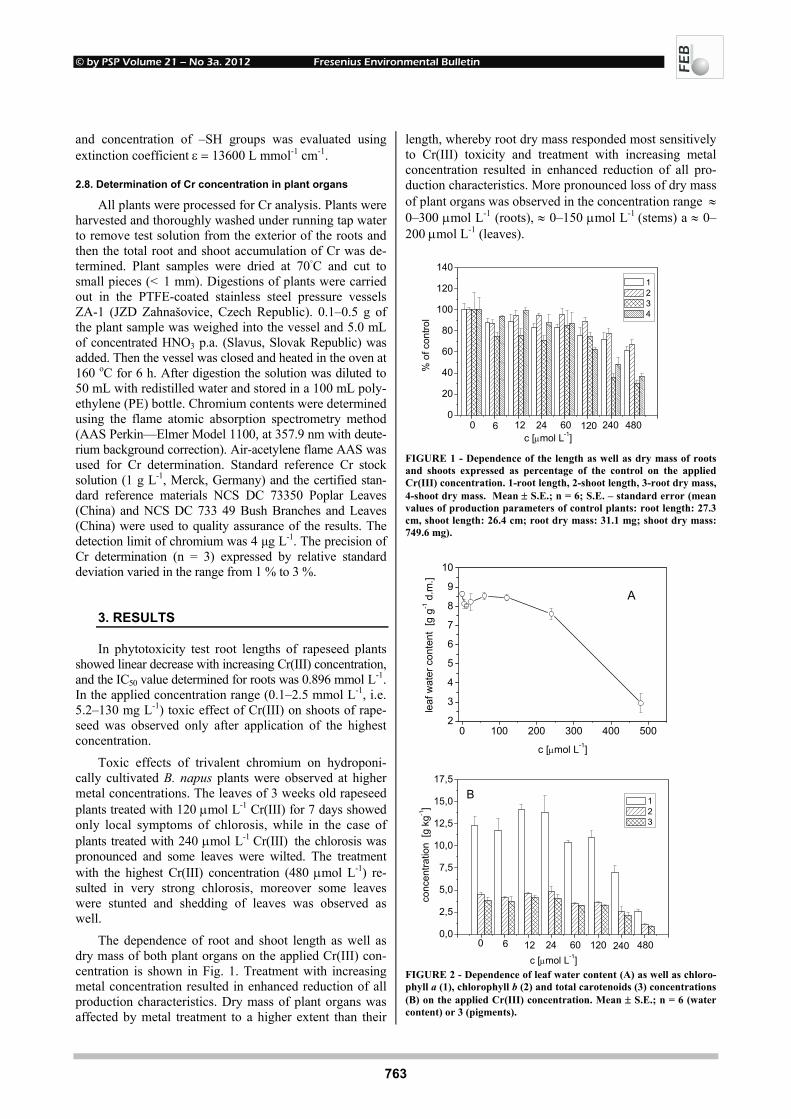
© by PSP Volume 21 – No 3a. 2012 Fresenius Environmental Bulletin
763
and concentration of –SH groups was evaluated using extinction coefficient ε = 13600 L mmol-1 cm-1.
2.8. Determination of Cr concentration in plant organs
All plants were processed for Cr analysis. Plants were harvested and thoroughly washed under running tap water to remove test solution from the exterior of the roots and then the total root and shoot accumulation of Cr was de-termined. Plant samples were dried at 70C and cut to small pieces (< 1 mm). Digestions of plants were carried out in the PTFE-coated stainless steel pressure vessels ZA-1 (JZD Zahnašovice, Czech Republic). 0.1–0.5 g of the plant sample was weighed into the vessel and 5.0 mL of concentrated HNO3 p.a. (Slavus, Slovak Republic) was added. Then the vessel was closed and heated in the oven at 160 oC for 6 h. After digestion the solution was diluted to 50 mL with redistilled water and stored in a 100 mL poly-ethylene (PE) bottle. Chromium contents were determined using the flame atomic absorption spectrometry method (AAS Perkin—Elmer Model 1100, at 357.9 nm with deute-rium background correction). Air-acetylene flame AAS was used for Cr determination. Standard reference Cr stock solution (1 g L-1, Merck, Germany) and the certified stan-dard reference materials NCS DC 73350 Poplar Leaves (China) and NCS DC 733 49 Bush Branches and Leaves (China) were used to quality assurance of the results. The detection limit of chromium was 4 µg L-1. The precision of Cr determination (n = 3) expressed by relative standard deviation varied in the range from 1 % to 3 %.
3. RESULTS
In phytotoxicity test root lengths of rapeseed plants showed linear decrease with increasing Cr(III) concentration, and the IC50 value determined for roots was 0.896 mmol L-1. In the applied concentration range (0.1–2.5 mmol L-1, i.e. 5.2–130 mg L-1) toxic effect of Cr(III) on shoots of rape-seed was observed only after application of the highest concentration.
Toxic effects of trivalent chromium on hydroponi-cally cultivated B. napus plants were observed at higher metal concentrations. The leaves of 3 weeks old rapeseed plants treated with 120 µmol L-1 Cr(III) for 7 days showed only local symptoms of chlorosis, while in the case of plants treated with 240 µmol L-1 Cr(III) the chlorosis was
pronounced and some leaves were wilted. The treatment with the highest Cr(III) concentration (480 µmol L-1) re-sulted in very strong chlorosis, moreover some leaves were stunted and shedding of leaves was observed as well.
The dependence of root and shoot length as well as dry mass of both plant organs on the applied Cr(III) con-centration is shown in Fig. 1. Treatment with increasing metal concentration resulted in enhanced reduction of all production characteristics. Dry mass of plant organs was affected by metal treatment to a higher extent than their
length, whereby root dry mass responded most sensitively to Cr(III) toxicity and treatment with increasing metal concentration resulted in enhanced reduction of all pro-duction characteristics. More pronounced loss of dry mass of plant organs was observed in the concentration range ≈ 0–300 µmol L-1 (roots), ≈ 0–150 µmol L-1 (stems) a ≈ 0–200 µmol L-1 (leaves).
1 2 3 4 5 6 7 8 9
0
20
40
60
80
100
120
140
% o
f con
trol
c [µmol L-1]
1 2 3 4
0 6 12 24 60 120 240 480
FIGURE 1 - Dependence of the length as well as dry mass of roots and shoots expressed as percentage of the control on the applied Cr(III) concentration. 1-root length, 2-shoot length, 3-root dry mass, 4-shoot dry mass. Mean ± S.E.; n = 6; S.E. – standard error (mean values of production parameters of control plants: root length: 27.3 cm, shoot length: 26.4 cm; root dry mass: 31.1 mg; shoot dry mass: 749.6 mg).
0 100 200 300 400 5002
3
4
5
6
7
8
9
10
leaf
wat
er c
onte
nt [
g g-1
d.m
.]
c [µmol L-1]
A
0 1 2 3 4 5 6 7 8 9
0,0
2,5
5,0
7,5
10,0
12,5
15,0
17,5
conc
entra
tion
[g k
g-1]
c [µmol L-1]
1 2 3
0 6 12 24 60 120 240 480
B
FIGURE 2 - Dependence of leaf water content (A) as well as chloro-phyll a (1), chlorophyll b (2) and total carotenoids (3) concentrations (B) on the applied Cr(III) concentration. Mean ± S.E.; n = 6 (water content) or 3 (pigments).
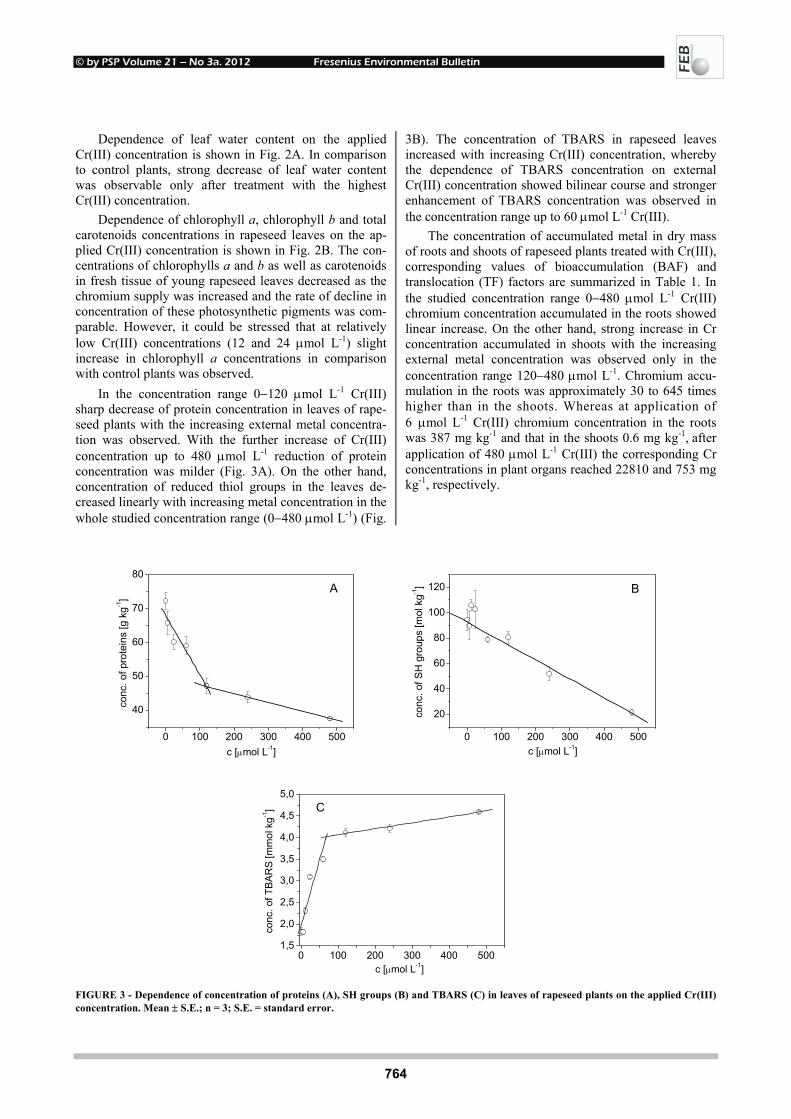
© by PSP Volume 21 – No 3a. 2012 Fresenius Environmental Bulletin
764
Dependence of leaf water content on the applied Cr(III) concentration is shown in Fig. 2A. In comparison to control plants, strong decrease of leaf water content was observable only after treatment with the highest Cr(III) concentration.
Dependence of chlorophyll a, chlorophyll b and total carotenoids concentrations in rapeseed leaves on the ap-plied Cr(III) concentration is shown in Fig. 2B. The con-centrations of chlorophylls a and b as well as carotenoids in fresh tissue of young rapeseed leaves decreased as the chromium supply was increased and the rate of decline in concentration of these photosynthetic pigments was com-parable. However, it could be stressed that at relatively low Cr(III) concentrations (12 and 24 µmol L-1) slight increase in chlorophyll a concentrations in comparison with control plants was observed.
In the concentration range 0−120 µmol L-1 Cr(III)
sharp decrease of protein concentration in leaves of rape-seed plants with the increasing external metal concentra-tion was observed. With the further increase of Cr(III) concentration up to 480 µmol L-1 reduction of protein concentration was milder (Fig. 3A). On the other hand, concentration of reduced thiol groups in the leaves de-creased linearly with increasing metal concentration in the whole studied concentration range (0−480 µmol L-1) (Fig.
3B). The concentration of TBARS in rapeseed leaves increased with increasing Cr(III) concentration, whereby the dependence of TBARS concentration on external Cr(III) concentration showed bilinear course and stronger enhancement of TBARS concentration was observed in the concentration range up to 60 µmol L-1 Cr(III).
The concentration of accumulated metal in dry mass of roots and shoots of rapeseed plants treated with Cr(III), corresponding values of bioaccumulation (BAF) and translocation (TF) factors are summarized in Table 1. In the studied concentration range 0−480 µmol L-1 Cr(III) chromium concentration accumulated in the roots showed linear increase. On the other hand, strong increase in Cr concentration accumulated in shoots with the increasing external metal concentration was observed only in the concentration range 120−480 µmol L-1. Chromium accu-mulation in the roots was approximately 30 to 645 times higher than in the shoots. Whereas at application of 6 µmol L-1 Cr(III) chromium concentration in the roots was 387 mg kg-1 and that in the shoots 0.6 mg kg-1, after application of 480 µmol L-1 Cr(III) the corresponding Cr concentrations in plant organs reached 22810 and 753 mg kg-1, respectively.
0 100 200 300 400 500
40
50
60
70
80
conc
. of p
rote
ins
[g k
g-1]
c [µmol L-1]
A
0 100 200 300 400 500
20
40
60
80
100
120
conc
. of S
H g
roup
s [m
ol k
g-1]
c [µmol L-1]
B
0 100 200 300 400 5001,5
2,0
2,5
3,0
3,5
4,0
4,5
5,0
conc
. of T
BAR
S [m
mol
kg-1
]
c [µmol L-1]
C
FIGURE 3 - Dependence of concentration of proteins (A), SH groups (B) and TBARS (C) in leaves of rapeseed plants on the applied Cr(III) concentration. Mean ± S.E.; n = 3; S.E. = standard error.

© by PSP Volume 21 – No 3a. 2012 Fresenius Environmental Bulletin
765
TABLE 1 - The concentration of accumulated metal in dry mass of roots and shoots of rapeseed plants treated with Cr(III), corresponding values of bioaccumulation (BAF) and translocation factors (TF).
Cr(III) conc [µmol L-1]
Cr content [mg kg-1]
BAF roots
Cr content [mg kg-1]
BAF shoots
TF
0 3.9 0.6 - 6
387.2 1241
0.6 1.92
0.0015
12
688.7 1104
0.6 1.92
0.0009
24
1317 1055
1.41 1.13
0.0011
60
2636 845
5.46 1.75
0.0021
120
6086 975
15.8 2.52
0.0026
240
15480 1240
294.3 23.58
0.0190
480
22810 913.9
753.2 30.18
0.0330
BAF expresses the ratio of the metal concentration in
biological material (in µmol or µg per g of the plant dry mass) to the metal concentration in external solution (in µmol L-1 or µg L-1). The translocation factor (TF) corre-sponds to the ratio of accumulated metal concentration in shoots and roots, respectively. For plants cultivated in the presence of Cr(III) (6−480 µmol L-1) the bioaccumulation factors (BAF) determined for plant roots were in the range from 1241 to 914, whereby the corresponding BAF values related to shoots ranged from 1.92 to 30.18. The translocation factor varied within the range from 0.0015 (6 µmol L-1 Cr) to 0.0330 (480 µmol L-1 Cr).
4. DISCUSSION
Phytotoxicity test, especially seed germination and root elongation test is often used to study the toxic effects of metals on plants. These tests are characterized by high sensitivity due to the rapid metabolism, nutrient transport and cell division occurring in germination period and mini-mal maintenance cost. In general, the sensitive response of plant roots to toxic metal treatment can be used for the assessment of metal toxicity. Samantaray et al. [19] de-termined the rate of retardation in the root growth of the germinating seedlings of Echinochloa colona in solution culture in the presence of various metals and found that Cr toxicity exceeded that of Hg, Ag, Mn, Fe and Mo and it was lower than the toxicity of Cu, Ni and Pb. Based on the previous results obtained with rapeseed cultivar Ve-rona the toxicity of metal ions decreased in the following order Cu > Cr(VI) > Hg > Cd > Pb > Ni > Zn [20]. Ad-verse effect of Cr(III) on root growth of this rapeseed cultivar (IC50 = 0.896 mmol L-1) was seven times lower than that of Cr(VI) (IC50 = 0.128 mmol L-1) indicating importance of chromium oxidation state from the aspect of metal toxicity which was reported previously by sev-
eral authors (e.g. [1, 21]). While for rapeseed plants more toxic form of chromium was Cr(VI), Gardea-Torresdey et al. [22] observed that Cr(III) exhibited more toxic effects on tumbleweed plants than Cr(VI) what was reflected in more strong reduction of root and shoot growth as well as in lower absorption of macronutrients and microelements from cultivation medium. It has been suggested that the reduction in root growth could be due to inhibition of root cell division or elongation, or due to the extension of the cell cycle [1]. Damage to the root apparatus due to Cr(III) treatment might have caused an unbalanced supply of nutrients and/or an alteration of their role in anabolic pathways, which ultimately arrest normal physiological and developmental processes [23]. According to Barcelo et al. [24] reduction of root growth at high Cr concentra-tions could be connected with the collapse and subse-quent inability of the roots to absorb water from the me-dium. Toxic effect of chromium resulting in reduction of biomass (Fig. 1) could be direct consequence of inhibition of chlorophyll synthesis as well as impaired uptake of essential nutrients [1]. On the other hand, Cr(III) has little effects on primary photochemistry of photosystem II [8]. The reduction in shoot height might be mainly due to the reduced root growth and consequent lesser nutrients and water transport to the above parts of the plant. Inhibition of shoot growth in lucerne cultures due to Cr(III) treat-ment was reported by Barton et al. [25].
At application of the highest Cr(III) concentration (480 µmol L-1) significant decline in leaf water content in comparison with the control plants was observable (from 8.64 g g-1 d.m. to 2.94 g g-1 d.m.) (Fig. 2A) which could be connected with changes in plant roots that inhibit water uptake [26]. According to Pandey and Sharma [9] Cr(III) induces also changes in plant water relations, resulting in decrease in physiological availability of water.
Due to treatment with low Cr(III) concentrations (12 and 24 µmol L-1) slight increase mainly in Chl a concentra-

© by PSP Volume 21 – No 3a. 2012 Fresenius Environmental Bulletin
766
tion was observed what is in agreement with previous observations [27]. As the chromium supply was in-creased, reduction in concentration of photosynthetic pigments (both chlorophylls a and b and carotenoids) in fresh tissue of young rapeseed leaves decreased, whereby the rate of this decline was the highest for chlorophyll a (Fig. 2B). The decrease in the chlorophyll a/b ratio [28] brought about by Cr indicates that Cr toxicity possibly reduces size of the peripheral part of the antenna complex. Similar effects on the reduction of the concentration of chlorophylls and carotenoids were observed beside of Cd [29] also with other borderline elements [30, 31]. De-crease in chlorophyll concentration in leaves of Cr(III)-treated B. napus plants could be explained by reduced leaf tissue concentration of Fe in response to Cr toxicity be-cause Cr(III) impairs the Fe requiring steps of chlorophyll and heme biosynthesis [9, 32]. The obtained results are in agreement with findings of Zengin [33] who found that elevated Cr levels decreased the total chlorophyll and total protein contents in primary leaves of 10-days-old bean (Phaseolus vulgaris) seedlings.
The decrease in protein contents in Cr(III)-treated plant at higher concentrations of Cr (Fig. 3A) was proba-bly due to adverse effects of reactive oxygen species, which may cause degradation of a number of proteins [34]. According to Vajpayee et al. [35], significant inhibi-tion of the protein content of plants due to treatment with increasing Cr concentrations indicates the fact that such treatments affect nitrogen uptake, consequently affecting the assimilation of nitrogen to produce amino acids and proteins.
Thiol (-SH) groups of sulphur containing amino acids can protect cell membrane protein chains from oxidation. The pool of non-protein SH groups include mainly the antioxidant glutathione and thiol-rich peptides known as phytochelatins [36]. Toxic metal ions are able to bind irreversibly to SH groups involved in the catalytic action or structural integrity of proteins [37]. Cr(III) ions at increased concentrations can interfere with several meta-bolic processes because of its high capability to coordi-nate various organic compounds resulting in inhibition of some metalloenzyme systems [4]. Decrease of concentra-tion of reduced thiol groups in the leaves of rapeseed plants due to increasing supply of Cr(III) (Fig. 3B) indi-cates that thiol-rich peptides were consumed and detoxifi-cation mechanisms in plants failed to eliminate toxic effects of chromium.
Lipid peroxidation can be determined by the forma-tion of MDA as the decomposition product of polyunsatu-rated fatty acids, which are the main components of membrane lipids. Malondialdehyde formation in plants, which are exposed to toxic metals, is a reliable indicator of cellular free-radical generation. Significant increase of MDA concentration suggests that reactive oxygen species (ROS) may be generated by chromium stress, in particular from nitrate, which can initiate the peroxidation and de-struction of lipids with subsequent damage (Fig. 3C).
Cr(III) toxicity may be due at least in part to an oxidative stress induced by the production of reactive oxygen spe-cies because Cr(III) can be endogenously reduced to Cr(II) by biological reductants such as cysteine and NADPH. In turn, the newly formed Cr(II) reacts with H2O2 producing hydroxyl radicals and causes tissue damage [38]. Karup-panapandian and Manoharan [39] found significantly in-creased lipid peroxidation as observed in the form of accu-mulation of malondialdehyde and production of hydrogen peroxide (H2O2) in 7-d-old Vigna mungo L. plants treated with 100 µmol L-1 of Cr(III). Catalase and monodehydro-ascorbate reductase activities were not significantly in-creased under Cr(III)-treatment, however oxidized glu-tathione (GSSG) content was steadily increased.
Cr(III) is taken up passively, being retained by the cation-exchange sites of the cell walls [3]. Therefore, such non-specific absorption to cell walls could be a way to immobilize the metal at the root level beside its sequestra-tion in the vacuoles of the root cells. Poor chromium trans-location to shoots observed by several researchers [8, 9] was confirmed also in our experiments (Table 1). While accumulated Cr concentration in root increased linearly with increasing applied Cr(III) concentration (up to 22810 mg kg-1 for treatment with 480 µmol L-1), more expressive rise for Cr accumulated in shoots was observed only at application of 240 and 480 µmol L-1 Cr(III). That means that higher Cr concentration in shoots was determined only in plants which were seriously damaged by metal toxicity. Alloca-tion of toxic metals in old or damaged leaves belongs to plant defence mechanisms against metal excess, whereby the yellowing and falling of such leaves could be ascribed to early senescence [40]. Juneja and Prakash [41] investi-gated the chemical form in which Cr(III) is transported by xylem sap and found that complexation of Cr(III) with ligands of xylem sap, especially with carboxylates, was evident. Cationic Cr(III) was vitally being transported as anionic organic complex species, whereby the major spe-cies was Cr(III)-citrate. These mobile and soluble Cr(III) complexes may get immobilized and stored in leaves and other edible plant parts.
The BAF (bioaccumulation factor) values determined for roots varied in close range from 1241 to 913 and they were by one till three orders higher than those determined for shoots (Table 1). Low mobility of Cr(III) within the plants was reflected also by low values of translocation factors (0.0015–0.0330). Cr(III) and Fe(III) have similar chemical properties, though plants usually contain several hundred times more Fe than Cr. Chromium immobility in soil–plant systems compared to Fe may be explained by the relative ease of reduction of Fe(III) to mobile Fe(II) and the great difficulty of reducing Cr(III) to Cr(II) under natural conditions [42]. Contrary to the opinion of other authors [11, 12], according to Shams et al. [43] rapeseed does not stand as robust candidate for remediation of Cr contami-nated sites because this plant species is vulnerable to in-sects and needs pesticides to grow its full phase to accom-plish remedial purposes what is not desirable as the use of
© by PSP Volume 21 – No 3a. 2012 Fresenius Environmental Bulletin
767
pesticides further threatens the ecosystem in general. However, as Cr translocation to aerial parts is low, and solubilities in the soil solution are usually low, the risk growing rapeseed at contaminated sites is also low. For phytoextraction of Cr from sites contaminated with KCr(SO4)2, Shams et al. have proposed growing Urtica dioica [43].
ACKNOWLEDGEMENTS
This study was financially supported by Development fund of Comenius University in Bratislava under the con-tract No. UK/209/2011 and Sanofi Aventis Pharma Slova-kia.
REFERENCES
[1] Shanker, A.K., Cervantes, C., Loza-Tavera, H. and Avu-dainayagam, S. (2005) Chromium toxicity in plants. Environ. Int. 31, 739–753.
[2] Czekala, J. (2010) Chromium in soils and fertilizers and its accumulation by plants. Fresen. Environ. Bull. 19, 281−288.
[3] Skeffington, R.A., Shewry, P.R. and Petersen, P.J. (1976) Chromium uptake and transport in barley seedlings Hordeum vulgare. Planta. 132, 209–214.
[4] Zayed, A., Lytle, C.M., Qian, J.H. and Terry, N. (1998) Chromium accumulation, translocation and chemical speci-ation in vegetable crops. Planta. 206, 293−299.
[5] Richard, F.C. and Bourg, A.C.M. (1991) Aqueous geochem-istry of chromium: A review. Water Res. 25, 807–816.
[6] Lahouti, M. and Peterson, P.J. (1979) Chromium accumula-tion and distribution in crop plants. J. Sci. Food Agr. 30, 136−142.
[7] Bartlett, R.J. and James, B.R. (1988) Mobility and bioavail-ability of chromium in soils. In: Chromium in the natural and human environments, Vol. 20 (J.O. Nriagu and E. Nieboer, editors). John Wiley& Sons, New York: 267-306.
[8] Vernay, P., Gauthier-Moussard, C., Jean, L., Bordas, F., Faure, O., Ledoigt, G. and Hitmi, A. (2008) Effect of chro-mium species on phytochemical and physiological parame-ters in Datura innoxia. Chemosphere. 72, 763−771.
[9] Pandey, N. and Sharma, C.P. (2003) Chromium interference in iron nutrition and water relations of cabbage. Environ. Exp. Bot. 49, 195−200.
[10] Zayed, A.M. and Terry, N. (2003) Chromium in the envi-ronment: factors affecting biological remediation. Plant Soil. 249, 139–156.
[11] Barcelo, J., Poschenrieder, C. and Gunse, B. (1985) Effect of chromium VI on mineral element content of bush beans. J. Plant Nutr. 8, 211–217.
[12] Poschenrieder, C., Vazquez, M.D., Bonet, A. and Barcelo, J. (1991) Chromium-III-iron interaction in iron sufficient and iron deficient bean plants. 2. Ultrastructural aspects. J. Plant Nutr. 14, 415–428.
[13] Panda, S.K. and Choudhury, S. (2005) Chromium stress in plants. Braz. J. Plant Physiol. 17, 95-102.
[14] Masarovičová, E., Kráľová, K., Brestič, M. and Olšovská, K. (2008) Production potential of rapeseed in Slovakia environ-mental conditions from the aspect of „FAME“ production. [In Slovak]. International symposium Motor fuels 2008. Ta-transké Matliare, 23. - 26.6.2008, 520–536.
[15] Marchiol, L., Assolari, S., Sacco, P. and Zerbi, G. (2004) Phytoextraction of heavy metals by canola (Brassica napus) and radish (Raphanus sativus) grown on multicontaminated soil. Environ. Pollut. 132, 21–27.
[16] Grispen, V.M.J., Nelissen, H.J.M. and Verkleij, J.A.C. (2006) Phytoextraction with Brassica napus L.: a tool for sustainable management of heavy metal contaminated soils. Environ. Pollut. 144, 77–83.
[17] Lichtenthaler, H.K. (1987) Chlorophylls and carotenoids: Pigments of photosynthetic biomembranes. Methods Enzy-mol. 148, 350–382.
[18] Bradford, M.M. (1976) Rapid and sensitive method for the quantitation of microgram quantities of protein utilizing the principle of protein-dye binding. Anal. Biochem. 72, 248–254.
[19] Samantaray, S., Rout, G.R. and Das, P. (1996) Root growth of Echinochloa colona: Effects of heavy metals in solution culture. Fresen. Environ. Bull. 5, 469−473.
[20] Peško, M., Kráľová, K. and Masarovičová, E. (2011) Phyto-toxic effect of some metal ions on selected rapeseed cultivars registered in Slovakia. Proceedings of ECOpole. 5(1), 83–86.
[21] McGrath, S.P. (1982) The uptake and translocation of tri and hexavalent chromium and effects on the growth of oat in flowing nutrient solution and in soil. New Phytologist. 92, 381–390.
[22] Gardea-Torresdey, J.L., de la Rosa, G., Peralta-Videa, J.R., Montes, M., Cruz-Jimenez, G. and Cano-Aguilera, I. (2005) Differential uptake and transport of trivalent and hexavalent chromium by tumbleweed (Salsola kali). Arch. Environ. Contam. Toxicol. 48, 225−232.
[23] Scoccianti, V., Crinelli, R., Tirillini, B., Mancinelli, V. and Speranza, A. (2006) Uptake and toxicity of Cr(III) in celery seedlings. Chemosphere. 64, 1695–1703.
[24] Barcelo, J., Poschenrieder, C. and Gunse B. (1986) Water re-lations of chromium VI treated bush bean plants (Phaseolus vulgaris L. cv. Contender) under both normal and water stress conditions. J. Exp. Bot. 37, 178–187.
[25] Barton, L.L., Johnson, G.V., O’Nan, A.G. and Wagener, B.M. (2000) Inhibition of ferric chelate reductase in alfalfa roots by cobalt, nickel, chromium, and copper. J. Plant Nutr. 23, 1833–1845.
[26] Mukherjee, S. and Roy, B.K. (1977) Toxic effect of chro-mium on germinating seedlings and potato tuber slices. Bio-chem. Physiol. Pflanz. 171, 235–238.
[27] El-Bassam, N. (1978) Spurenelemente: Nahrstoffe und Gift Zugleich. Kali-Briefe. 14, 255–272.
[28] Shanker, A.K. (2003) Physiological, biochemical and mo-lecular aspects of chromium toxicity and tolerance in selected crops and tree species. Coimbatore, Tamil Nadu Agricultural University, PhD Thesis.
[29] Peško, M., Kráľová, K. and Masarovičová, E. (2010) Re-sponse of young Brassica juncea plants to cadmium and se-lenium treatment. Fresen. Environ. Bull. 19, 1505–1510.
© by PSP Volume 21 – No 3a. 2012 Fresenius Environmental Bulletin
768
[30] Kummerová, M., Zezulka, Š., Kráľová, K. and Masarovi-čová, E. (2010) Effect of zinc and cadmium on physiological and production characteristics in Matricaria recutita. Biol. Plant. 54, 308–314.
[31] Yruela, I. (2005) Copper in plants. Braz. J. Plant Physiol. 17, 145-156.
[32] Schmidt, W. (1996) Influence of chromium (III) on root as-sociated Fe (III) reductase in Plantago lanceolata L. J. Exp. Bot. 47, 805–810.
[33] Zengin, F.K. (2009) The effect of Ni2+ and Cr3+ on the con-tents of chlorophyll, protein, abscisic acid and proline in bean (Phaseolus vulgaris cv. Strike) seedlings. Fresen. Environ. Bull. 18, 2301−2305.
[34] Davies, K.J.A. (1987) Protein damage and degradation by oxygen radicals. I. General aspects. J. Biol. Chem. 262, 9895–9901.
[35] Vajpayee P., Tripathi, R.D., Rai, U.N., Ali, M.B. and Singh, S.N. (2000) Chromium accumulation reduces chlorophyll biosynthesis, nitrate reductase activity and protein content in Nympaea alba L. Chemosphere. 41, 1075–1082.
[36] De Vos, C.H.R., Vonk, M.J., Vooijs, R. and Schat, H. (1992) Glutathione depletion due to Cu-induced phytochelatin syn-thesis causes oxidative stress in Silene cucubalus. Plant Physiol. 98, 853–858.
[37] Van Assche, F. and Clijsters, H. (1990). Effects of the metals on enzyme activity in plants. Plant Cell Environ. 13, 195–206.
[38] Shanker, A.K. and Pathmanabhan, G. (2004) Speciation de-pendant antioxidative response in roots and leaves of Sor-ghum (Sorghum bicolor (L) Moench cv. CO 27) under Cr(III) and Cr(VI) stress. Plant Soil. 265, 141–151.
[39] Karuppanapandian, T. and Manoharan, K. (2008) Uptake and translocation of tri- and hexavalent chromium and their ef-fects on black gram (Vigna mungo L. Hepper cv. Co4) roots. J. Plant Biol. 51, 192−201.
[40] Di Baccio, D. Tognetti, R., Minnocci, A. and Sebastiani, L. (2009) Responses of the Populus×euramericana clone I-214 to excess zinc: Carbon assimilation, structural modifications, metal distribution and cellular localization. Environ. Exp. Bot. 67, 153–163.
[41] Juneja, S. and Prakash, S. (2006) The chemical form of triva-lent chromium in xylem sap of maize (Zea mays L.). Chem. Spec. Bioavail. 18, 161–169.
[42] Cary, E.E, Allaway, W.H. and Olson, O.E. (1977) Control of Cr concentrations in food plants. 1. Absorption and transloca-tion of Cr by plants. J. Agric. Food Chem. 25, 300–304.
[43] Shams, K.M., Tichy, G., Fischer, A., Sager, M., Peer, T., Ba-shar, A. and Filip, K. (2010) Aspects of phytoremediation for chromium contaminated sites using common plants Urtica dioica, Brassica napus and Zea mays. Plant Soil. 328, 175–189.
Received: September 05, 2011 Revised: November 09, 2011 Accepted: November 14, 2011 CORRESPONDING AUTHOR
Dr. Katarína Kráľová Comenius University Bratislava Faculty of Natural Sciences Institute of Chemistry Mlynská dolina 842 15 Bratislava SLOVAK REPUBLIC E-mail: [email protected]
FEB/ Vol 21/ No 3a/ 2012 – pages 761 – 768
© by PSP Volume 21 – No 3a. 2012 Fresenius Environmental Bulletin
769
CADMIUM-INDUCED ALTERATIONS IN HEAD KIDNEY HEMATOPOIETIC TISSUE OF COMMON CARP
Elżbieta Kondera and Małgorzata Witeska*
Department of Animal Physiology, University of Podlasie, Prusa 12, 08-110 Siedlce, Poland
ABSTRACT
Hematopoietic head kidney tissue and peripheral blood of common carp were analyzed after 1 month post 3 hour exposure to 6.5 mg/dm3 of cadmium (96hLC50) and 1 month exposure to 0.65 mg/dm3 (10% of 96hLC50). Short-term exposure resulted in an increase in percentage of monocytoid cells and eosinophils in head kidney and blood leukocyte count. Long-term exposure induced a sig-nificant increase in frequency of erythroid precursors and thrombocytes in head kidney, accompanied by an increase in percentage of polychromatic erythroblasts and lympho-cytes, and a decreased percentage of neutrophils, mono-cytes and basophils in peripheral blood. Both exposures resulted in a reduced frequency of head kidney lymphoid cells, and a considerable increase in frequency of periph-eral erythrocyte cellular anomalies, an increase in throm-bocyte count, and a drop in metabolic activity of phago-cytes. Cadmium caused a significant increase in apoptotic rate of hematopoietic precursor cells with only minor increase in the rate of cell proliferation which resulted in a reduced cell renewal rate. The obtained results indicate that the most persistent cadmium-induced hematological disturbances were: damage to erythrocytes, impairment of phagocyte activity, and reduction of hematopoietic poten-tial. However, the results indicate that increased erythro-poietic activity effectively compensated for erythrocyte destruction. On the other hand, reduced neutropoiesis and monocytopoiesis resulted in a significant impairment of nonspecific immune system of cadmium-exposed fish.
KEY WORDS: hematotoxicity, proliferation, apoptosis, fish, heavy metal
1. INTRODUCTION
Cadmium is one of the most toxic heavy metals, and a common aquatic pollutant entering surface waters from various industrial and domestic sources. Concentration of * Corresponding author
the most toxic free ion Cd2+ in water, even if it is usually low, may temporarily increase due to water acidification or hypoxia [1]. The effects of cadmium on peripheral blood of fish are quite well known. Cadmium very often induces anemia [2-4] and immunosuppression [5-8]. Sublethal Cd exposure may also induce morphological aberrations in mature circulating erythrocytes [9-12] some of them (nu-clear anomalies) showing genotoxic potential of this ele-ment [13]. In some cases a compensatory reaction: activa-tion of erythropoiesis and an increase in frequency of im-mature erythrocytes in blood occurs [12, 14, 15]. Both, damage to erythrocytes and increased erythropoiesis indi-cate that cadmium may affect hematopoietic tissue of fish. However, toxicity of cadmium to hematopoietic system is almost unknown. According to Garofano and Hirshfield [16] cadmium causes destruction or elimination of all he-matopoietic elements (except for mature erythrocytes) in head kidney of cadmium-intoxicated Ictalurus nebulosus. Cadmium may also downregulate Hb and Epo expression in Cyprinodon variegatus larvae under hypoxic conditions [17] which indicates inhibitory effect on erythropoiesis. According to Celik et al. [18, 19] cadmium induces cyto-toxic and genotoxic effect in the rat bone marrow erythroid progenitor cells accompanied by genotoxic effect on pe-ripheral blood erythrocytes. Dietary cadmium reduces he-matopoietic rate in the bone marrow which results in ane-mia in rat [20]. However, according to Lutton et al. [21] cadmium and lead are less toxic to rat bone marrow erythroid precursors (CFU-E) than silver. The results ob-tained by Van den Heuvel et al. [22, 23] for murine and human hematopoietic progenitor cells indicate that various cell lines may show different sensitivity to toxic com-pounds, and interspecific differences may also occur.
Proliferation and apoptosis rates, together with cell differentiation and maturation determine effectiveness of hematopoiesis. The effects of cadmium on proliferation and apoptosis of hematopoietic cells in fish are unknown but there are some reports concerning other tissues. Accord-ing to Berntssen et al. [24], significant increase in regu-lated cell death and proliferation in Salmo salar fed cad-mium-containing diets compared to the control fish may effectively prevent histopathological damage. Results con-cerning cadmium-induced apoptosis of human immune cells indicate that B-cells are more sensitive than lymphoblasts
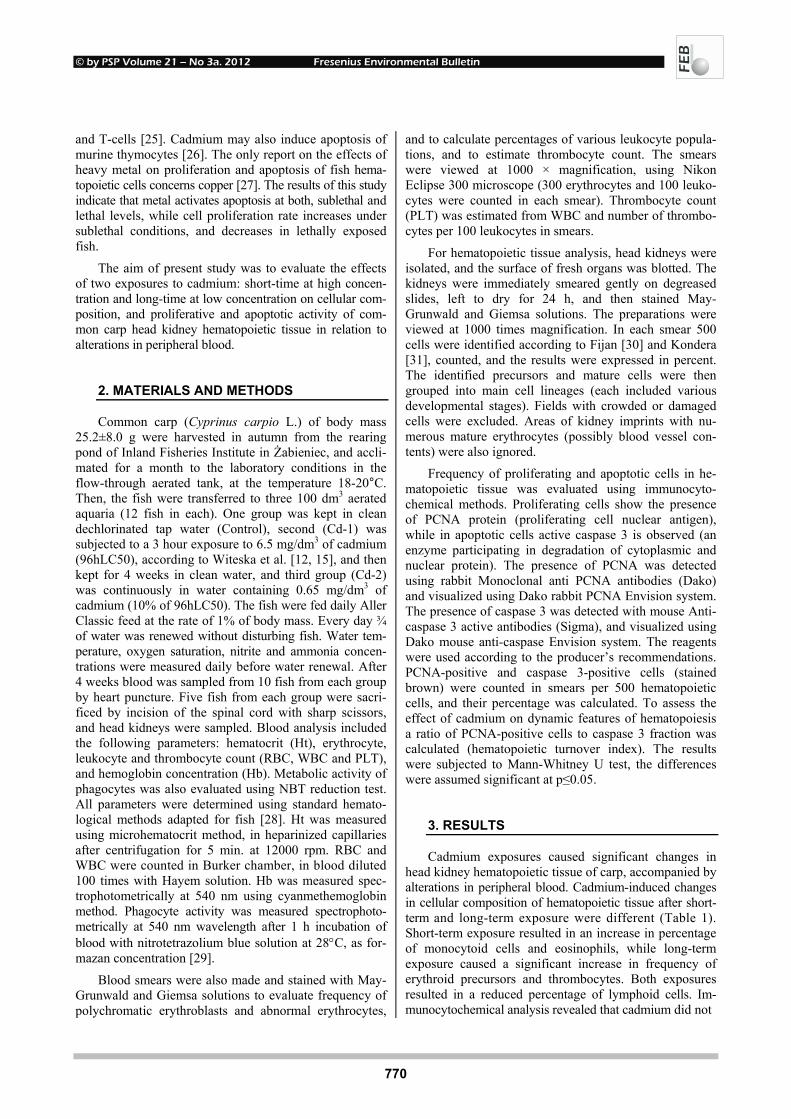
© by PSP Volume 21 – No 3a. 2012 Fresenius Environmental Bulletin
770
and T-cells [25]. Cadmium may also induce apoptosis of murine thymocytes [26]. The only report on the effects of heavy metal on proliferation and apoptosis of fish hema-topoietic cells concerns copper [27]. The results of this study indicate that metal activates apoptosis at both, sublethal and lethal levels, while cell proliferation rate increases under sublethal conditions, and decreases in lethally exposed fish.
The aim of present study was to evaluate the effects of two exposures to cadmium: short-time at high concen-tration and long-time at low concentration on cellular com-position, and proliferative and apoptotic activity of com-mon carp head kidney hematopoietic tissue in relation to alterations in peripheral blood.
2. MATERIALS AND METHODS
Common carp (Cyprinus carpio L.) of body mass 25.2±8.0 g were harvested in autumn from the rearing pond of Inland Fisheries Institute in Żabieniec, and accli-mated for a month to the laboratory conditions in the flow-through aerated tank, at the temperature 18-20°C. Then, the fish were transferred to three 100 dm3 aerated aquaria (12 fish in each). One group was kept in clean dechlorinated tap water (Control), second (Cd-1) was subjected to a 3 hour exposure to 6.5 mg/dm3 of cadmium (96hLC50), according to Witeska et al. [12, 15], and then kept for 4 weeks in clean water, and third group (Cd-2) was continuously in water containing 0.65 mg/dm3 of cadmium (10% of 96hLC50). The fish were fed daily Aller Classic feed at the rate of 1% of body mass. Every day ¾ of water was renewed without disturbing fish. Water tem-perature, oxygen saturation, nitrite and ammonia concen-trations were measured daily before water renewal. After 4 weeks blood was sampled from 10 fish from each group by heart puncture. Five fish from each group were sacri-ficed by incision of the spinal cord with sharp scissors, and head kidneys were sampled. Blood analysis included the following parameters: hematocrit (Ht), erythrocyte, leukocyte and thrombocyte count (RBC, WBC and PLT), and hemoglobin concentration (Hb). Metabolic activity of phagocytes was also evaluated using NBT reduction test. All parameters were determined using standard hemato-logical methods adapted for fish [28]. Ht was measured using microhematocrit method, in heparinized capillaries after centrifugation for 5 min. at 12000 rpm. RBC and WBC were counted in Burker chamber, in blood diluted 100 times with Hayem solution. Hb was measured spec-trophotometrically at 540 nm using cyanmethemoglobin method. Phagocyte activity was measured spectrophoto-metrically at 540 nm wavelength after 1 h incubation of blood with nitrotetrazolium blue solution at 28°C, as for-mazan concentration [29].
Blood smears were also made and stained with May-Grunwald and Giemsa solutions to evaluate frequency of polychromatic erythroblasts and abnormal erythrocytes,
and to calculate percentages of various leukocyte popula-tions, and to estimate thrombocyte count. The smears were viewed at 1000 × magnification, using Nikon Eclipse 300 microscope (300 erythrocytes and 100 leuko-cytes were counted in each smear). Thrombocyte count (PLT) was estimated from WBC and number of thrombo-cytes per 100 leukocytes in smears.
For hematopoietic tissue analysis, head kidneys were isolated, and the surface of fresh organs was blotted. The kidneys were immediately smeared gently on degreased slides, left to dry for 24 h, and then stained May-Grunwald and Giemsa solutions. The preparations were viewed at 1000 times magnification. In each smear 500 cells were identified according to Fijan [30] and Kondera [31], counted, and the results were expressed in percent. The identified precursors and mature cells were then grouped into main cell lineages (each included various developmental stages). Fields with crowded or damaged cells were excluded. Areas of kidney imprints with nu-merous mature erythrocytes (possibly blood vessel con-tents) were also ignored.
Frequency of proliferating and apoptotic cells in he-matopoietic tissue was evaluated using immunocyto-chemical methods. Proliferating cells show the presence of PCNA protein (proliferating cell nuclear antigen), while in apoptotic cells active caspase 3 is observed (an enzyme participating in degradation of cytoplasmic and nuclear protein). The presence of PCNA was detected using rabbit Monoclonal anti PCNA antibodies (Dako) and visualized using Dako rabbit PCNA Envision system. The presence of caspase 3 was detected with mouse Anti-caspase 3 active antibodies (Sigma), and visualized using Dako mouse anti-caspase Envision system. The reagents were used according to the producer’s recommendations. PCNA-positive and caspase 3-positive cells (stained brown) were counted in smears per 500 hematopoietic cells, and their percentage was calculated. To assess the effect of cadmium on dynamic features of hematopoiesis a ratio of PCNA-positive cells to caspase 3 fraction was calculated (hematopoietic turnover index). The results were subjected to Mann-Whitney U test, the differences were assumed significant at p≤0.05.
3. RESULTS
Cadmium exposures caused significant changes in head kidney hematopoietic tissue of carp, accompanied by alterations in peripheral blood. Cadmium-induced changes in cellular composition of hematopoietic tissue after short-term and long-term exposure were different (Table 1). Short-term exposure resulted in an increase in percentage of monocytoid cells and eosinophils, while long-term exposure caused a significant increase in frequency of erythroid precursors and thrombocytes. Both exposures resulted in a reduced percentage of lymphoid cells. Im-munocytochemical analysis revealed that cadmium did not
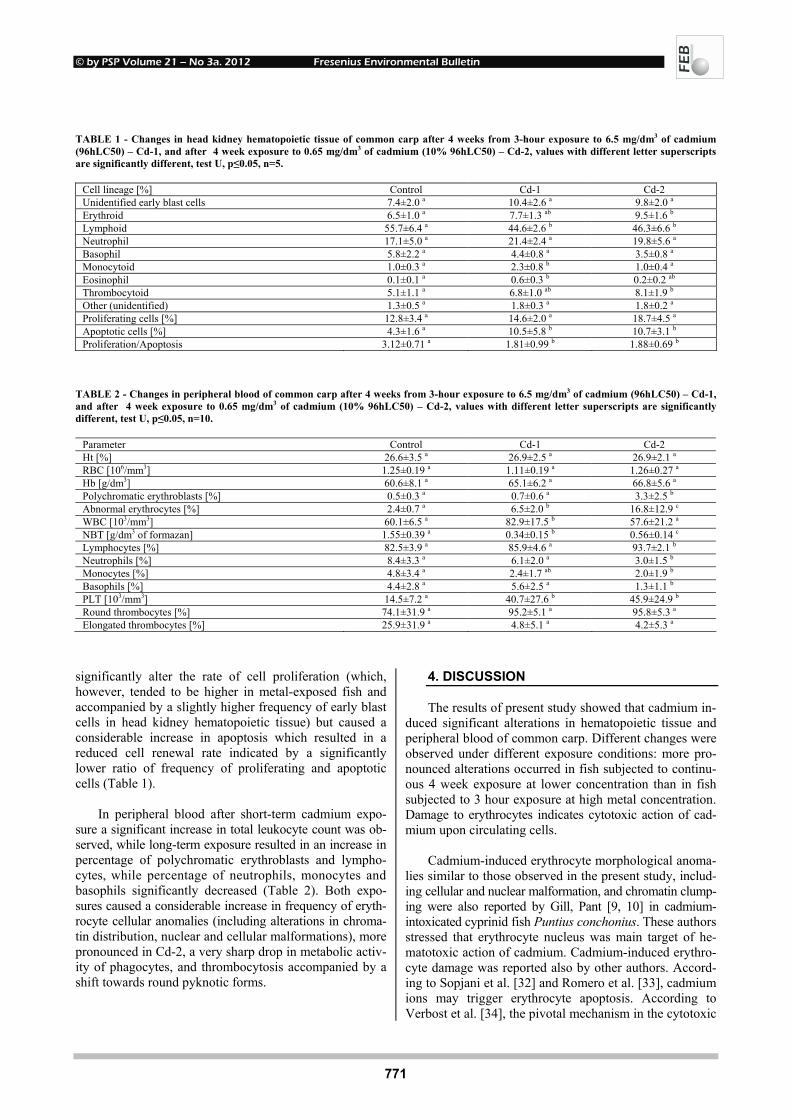
© by PSP Volume 21 – No 3a. 2012 Fresenius Environmental Bulletin
771
TABLE 1 - Changes in head kidney hematopoietic tissue of common carp after 4 weeks from 3-hour exposure to 6.5 mg/dm3 of cadmium (96hLC50) – Cd-1, and after 4 week exposure to 0.65 mg/dm3 of cadmium (10% 96hLC50) – Cd-2, values with different letter superscripts are significantly different, test U, p≤0.05, n=5.
Cell lineage [%] Control Cd-1 Cd-2 Unidentified early blast cells 7.4±2.0 a 10.4±2.6 a 9.8±2.0 a
Erythroid 6.5±1.0 a 7.7±1.3 ab 9.5±1.6 b Lymphoid 55.7±6.4 a 44.6±2.6 b 46.3±6.6 b Neutrophil 17.1±5.0 a 21.4±2.4 a 19.8±5.6 a
Basophil 5.8±2.2 a 4.4±0.8 a 3.5±0.8 a
Monocytoid 1.0±0.3 a 2.3±0.8 b 1.0±0.4 a
Eosinophil 0.1±0.1 a 0.6±0.3 b 0.2±0.2 ab
Thrombocytoid 5.1±1.1 a 6.8±1.0 ab 8.1±1.9 b Other (unidentified) 1.3±0.5 a 1.8±0.3 a 1.8±0.2 a
Proliferating cells [%] 12.8±3.4 a 14.6±2.0 a 18.7±4.5 a
Apoptotic cells [%] 4.3±1.6 a 10.5±5.8 b 10.7±3.1 b
Proliferation/Apoptosis 3.12±0.71 a 1.81±0.99 b 1.88±0.69 b
TABLE 2 - Changes in peripheral blood of common carp after 4 weeks from 3-hour exposure to 6.5 mg/dm3 of cadmium (96hLC50) – Cd-1, and after 4 week exposure to 0.65 mg/dm3 of cadmium (10% 96hLC50) – Cd-2, values with different letter superscripts are significantly different, test U, p≤0.05, n=10.
Parameter Control Cd-1 Cd-2 Ht [%] 26.6±3.5 a 26.9±2.5 a 26.9±2.1 a
RBC [106/mm3] 1.25±0.19 a 1.11±0.19 a 1.26±0.27 a
Hb [g/dm3] 60.6±8.1 a 65.1±6.2 a 66.8±5.6 a
Polychromatic erythroblasts [%] 0.5±0.3 a 0.7±0.6 a 3.3±2.5 b Abnormal erythrocytes [%] 2.4±0.7 a 6.5±2.0 b 16.8±12.9 c WBC [103/mm3] 60.1±6.5 a 82.9±17.5 b 57.6±21.2 a
NBT [g/dm3 of formazan] 1.55±0.39 a 0.34±0.15 b 0.56±0.14 c Lymphocytes [%] 82.5±3.9 a 85.9±4.6 a 93.7±2.1 b Neutrophils [%] 8.4±3.3 a 6.1±2.0 a 3.0±1.5 b Monocytes [%] 4.8±3.4 a 2.4±1.7 ab 2.0±1.9 b Basophils [%] 4.4±2.8 a 5.6±2.5 a 1.3±1.1 b PLT [103/mm3] 14.5±7.2 a 40.7±27.6 b 45.9±24.9 b Round thrombocytes [%] 74.1±31.9 a 95.2±5.1 a 95.8±5.3 a
Elongated thrombocytes [%] 25.9±31.9 a 4.8±5.1 a 4.2±5.3 a
significantly alter the rate of cell proliferation (which, however, tended to be higher in metal-exposed fish and accompanied by a slightly higher frequency of early blast cells in head kidney hematopoietic tissue) but caused a considerable increase in apoptosis which resulted in a reduced cell renewal rate indicated by a significantly lower ratio of frequency of proliferating and apoptotic cells (Table 1).
In peripheral blood after short-term cadmium expo-
sure a significant increase in total leukocyte count was ob-served, while long-term exposure resulted in an increase in percentage of polychromatic erythroblasts and lympho-cytes, while percentage of neutrophils, monocytes and basophils significantly decreased (Table 2). Both expo-sures caused a considerable increase in frequency of eryth-rocyte cellular anomalies (including alterations in chroma-tin distribution, nuclear and cellular malformations), more pronounced in Cd-2, a very sharp drop in metabolic activ-ity of phagocytes, and thrombocytosis accompanied by a shift towards round pyknotic forms.
4. DISCUSSION
The results of present study showed that cadmium in-duced significant alterations in hematopoietic tissue and peripheral blood of common carp. Different changes were observed under different exposure conditions: more pro-nounced alterations occurred in fish subjected to continu-ous 4 week exposure at lower concentration than in fish subjected to 3 hour exposure at high metal concentration. Damage to erythrocytes indicates cytotoxic action of cad-mium upon circulating cells.
Cadmium-induced erythrocyte morphological anoma-
lies similar to those observed in the present study, includ-ing cellular and nuclear malformation, and chromatin clump-ing were also reported by Gill, Pant [9, 10] in cadmium-intoxicated cyprinid fish Puntius conchonius. These authors stressed that erythrocyte nucleus was main target of he-matotoxic action of cadmium. Cadmium-induced erythro-cyte damage was reported also by other authors. Accord-ing to Sopjani et al. [32] and Romero et al. [33], cadmium ions may trigger erythrocyte apoptosis. According to Verbost et al. [34], the pivotal mechanism in the cytotoxic

© by PSP Volume 21 – No 3a. 2012 Fresenius Environmental Bulletin
772
action of Cd2+ is the inhibition of Ca2+ extrusion and dis-turbance of intracellular Ca2+ homeostasis which results in an increase in cytosolic Ca2+ to toxic levels. Zikic et al. [2] reported that prolonged exposure to cadmium in-creased activity of antioxidant enzymes (SOD and CAT) in goldfish erythrocytes which suggest also the possibility of oxidative damage.
In the present study high frequency of abnormal erythrocytes observed in peripheral blood after long-term exposure was accompanied by increased erythropoiesis, while minor effect of cadmium observed after short-term exposure did not activate erythropoiesis.
Cadmium significantly reduced overall hematopoietic potential of head kidney tissue – proliferation rate did not change but the rate of apoptosis significantly increased in all cadmium-exposed fish. Little is known about the ef-fects of toxic heavy metals on hematopoietic activity. According to Garofano, Hirshfield [16], 2-hour exposure of Ictalurus nebulosus to 61.3 mg/dm3 of cadmium re-sulted in destruction or elimination of all hematopoietic elements (except for the mature erythrocytes) from head kidney hematopoietic tissue within 24 hours post expo-sure which indicates very strong cytotoxicity. Concentra-tion-related changes in erythropoietic activity were ob-served in copper-exposed Labeo rohita [27]. Under sub-lethal conditions (50% of 72hLC50) erythropoietic effi-ciency increased at the beginning of exposure, and subse-quently decreased, while under lethal conditions (100% 72hLC50) initial decrease was followed by an increase. The authors reported also an increase in frequency of blast cells in all copper-exposed Labeo rohita and an increase in apoptotic rate of hematopoietic precursors, while proliferation rate was elevated under sublethal con-ditions and reduced in fish subjected to lethal exposure. These results indicate that the effect of metal on hemato-poietic potential depends on the level of intoxication. Under moderate toxicity conditions organism may com-pensate erythrocyte loss due to metal-induced cytotoxicity by activation of erythropoiesis but during prolonged in-toxication or at higher concentration of metal hematopoi-etic potential decreases and may become insufficient to counteract accelerated erythrocyte loss which results in anemia.
All cadmium-exposed fish showed a decrease in lym-phocyte frequency in head kidney tissue, and considerable reduction in blood phagocyte metabolic activity. Reduced hematopoietic potential and shift towards erythropoiesis to compensate erythrocyte loss in fish subjected to a long-term cadmium exposure probably caused reduced supply of phagocytes (neutrophils and monocytes) to blood. How-ever, reduction of phagocyte activity occurred also in fish after short-term Cd exposure in which an increase in WBC took place, and no changes in blood phagocyte level were observed. This indicates that cadmium affected not only the number but also function of phagocytes. Cadmium was reported to reduce phagocyte respiratory burst in Limanda limanda [35] and in Oncorhynchus mykiss [36]. Accord-
ing to Schuwerack [37], cadmium caused a decrease in count of pronephric neutrophils in Cyprinus carpio. Phagocytosis is one the most important immune mecha-nisms in fish, therefore cadmium intoxication may render fish more susceptible to diseases. A decrease in peripheral basophil count after long-term cadmium exposure is diffi-cult to explain since these cells are rarely observed in fish [38]. According to Suzuki 39], they may play an impor-tant role in the acute phase of inflammation, similarly as in higher vertebrates. The obtained results indicate that hematopoietic tissue of common carp head kidney is very sensitive to intoxication, and suggest that erythroid and thrombocytoid cell lines are more resistant compared to neutrophilic and monocytoid lines.
REFERENCES
[1] Kock G., Hofer R. (1998) Origin of cadmium and lead in clear softwater lakes of high-altitude and high-latitude, and their bioavailability and toxicity to fish. In: Fish Ecotoxicol-ogy, Braunbeck T., Hinton D. E., Streit B. (Eds.). Birkhauser Verlag, Basel, Switzerland, 225-257.
[2] Zikic R. V., Stajn A. S., Pavlovic S. Z., Ognjanovic B. I., Saicic Z. S. (2001) Activities of superoxide dismutase and catalase in erythrocytes and plasma transaminases of goldfish (Carassius auratus gibelio Bloch.) exposed to cadmium. Physiol. Res. 50, 105-111.
[3] Seong-Gil K., Jae-Won K., Ju-Chan K. (2004) Effect of die-tary cadmium on growth and haematological parameters of juvenile rockfish, Sebastes schlegeli (Hilgendorf). Aquacult. Res. 35, 80-86.
[4] Kori-Siakpere O., Ake J. E. G., Avworo U. M. (2006) Sub-lethal effects of cadmium on some selected haematological parameters of Heteroclarias (a hybrid of Heterobranchus bi-dorsalis and Clarias gariepinus). Int. J. Zool. Res. 2, 77-83.
[5] Zelikoff J. (1995) Immunotoxicity of low level cadmium ex-posure in fish: an alternative animal model for immunotoxi-cological studies. J. Toxicol. Environ. Health 45, 235-248.
[6] Viola A., Pregnolato G.,. Albergoni V (1996) Effect of in vi-tro cadmium exposure on natural killer (NK) cells of catfish, Ictalurus melas. Fish & Shellfish Immunol. 6, 167-172.
[7] Drastichova J., Svobodova Z., Luskova V., Machova J. (2004) Effects of cadmium on hematological indices of common carp (Cyprinus carpio L.). Bull. Environ. Contam. Toxicol. 72, 725-732.
[8] Witeska M., Kondera E., Lipionoga J., Nienałtowska R. (2009) The changes in blood leukocyte profile of common carp induced by acute exposures to copper and cadmium. Fresenius Environmental Bulletin 18, 1534-1540.
[9] Gill T. S., Pant J. C. (1985) Erythrocytic and leukocytic re-sponses to cadmium poisoning in a freshwater fish, Puntius conchonius Ham. Environ. Res. 36, 327-337.
[10] Gill T. S., Pant J. C. (1986) Chromatin condensation in the erythrocytes of fish following exposure to cadmium. Bull. Environ. Contam. Toxicol. 36, 199-203.
[11] Papoutsoglou S. E., Abel P. D. (1988) Sublethal toxicity and accumulation of cadmium in Tilapia aurea. Bull. Environ. Contam. Toxicol. 41, 404-411.
© by PSP Volume 21 – No 3a. 2012 Fresenius Environmental Bulletin
773
[12] Witeska M., Jezierska B., Wolnicki J. (2006) Respiratory and hematological response of tench, Tinca tinca (L.) to a short-term cadmium exposure. Aquacult. Int. 14, 141-152.
[13] Cavas T. Garanko N. N., Arkhipchuk V. V. (2005) Induction of micronuclei and binuclei in blood, gill and liver cells of fishes subchronically exposed to cadmium chloride and cop-per sulphate. Food Chem. Toxicol. 43, 569-574.
[14] Beena S., Viswaranjan S. (1987) Effect of cadmium and mercury on the hematological parameters of the fish Cypri-nus carpio. Environ. Ecol. 5, 726-732.
[15] Witeska M., Kondera E., Lipionoga J., Jastrzębska A. (2010) Changes in oxygen consumption rate and red blood parame-ters in common carp Cyprinus carpio L. after acute copper and cadmium exposures. Fresenius Environmental Bulletin 19, 115-122.
[16] Garofano J. S., Hirshfield H. I. (1982) Peripheral effects of cadmium on the blood and head kidney in the brown bull-head (Ictalurus nebulosus). Bull. Environ. Contam. Toxicol. 28, 552-556.
[17] Dangre A. J., Manning S., Brouwer M. (2010) Effects of cadmium on hypoxia-induced expression of hemoglobin and erythropoietin in larval sheepshead minnow, Cyprinodon variegatus. Aquat. Toxicol. 99, 168-175.
[18] Celik A., Comelekoglu U., Yalin S. (2005) A study on the investigation of cadmium chloride genotoxicity in rat bone marrow using micronucleus test and chromosome aberration analysis. Toxicol. Ind. Health 21, 243-248.
[19] Celik A., Buyukakilli B., Cimen B., Tasdelen B., Ozturk M. I., Eke D. (2009) Assessment of cadmium genotoxicity in pe-ripheral blood and bone marrow tissues of male Wistar rats. Toxicol. Mech. Meth. 19, 135-140.
[20] Mitsumori K., Shibutani M., Sato S., Onodera H., Nakagawa J., Hayashi Y., Ando M. (1998) Relationship between the de-velopment of hepato-renal toxicity and cadmium accumula-tion in rats given minimum to large amounts of cadmium chloride in the long-term: preliminary study. Arch. Toxicol. 72, 545-552.
[21] Lutton J. D., Ibraham N. G., Friedland M., Levere R. D. (1984) The toxic effects of heavy metals on rat bone marrow in vitro erythropoiesis: Protective role of hemin and zinc. Environ. Res. 35, 97-103.
[22] Van den Heuvel R. L., Leppens H., Schoeters G. E. R. (1999) Lead and catechol hematotoxicity in vitro using hu-man and murine hematopoietic progenitor cells. Cell Biol. Toxicol. 15, 101-110.
[23] Van den Heuvel R. L., Leppens H., Schoeters G. E. R. (2001) Use of in vitro assays to assess hematotoxic effects of environmental compounds. Cell Biol. Toxicol. 17, 107-116.
[24] Berntssen M. H. G., Aspholm O. O., Hylland K., Wendelaar Bonga S. E., Lundebye A. K. (2001) Tissue metallothionein, apoptosis and cell proliferation responses in Atlantic salmon (Salmo salar L.) parr fed elevated dietary cadmium. Comp. Biochem. Physiol C 128, 299-310.
[25] Tsangaris G.T., Tzortzatou-Stathoupoulou F. (1998) Cad-mium induces apoptosis differentially on immune system cell lines. Toxicology 128, 143-150.
[26] Fujimaki H., Ishido M., Nohara K. (2000) Induction of apop-tosis in mouse thymocytes by cadmium. Toxicol. Lett. 115, 99-105.
[27] Som M., Kundu N., Bhattacharyya S., Homechaudhuri S. (2009) Evaluation of hemopoietic responses in Labeo rohita Hamilton following acute copper toxicity. Toxicol. Environ. Chem. 91, 87-98.
[28] Svobodova Z., Pravda D., Palackova J. (1991) Unified meth-ods of haematological examination of fish. VURH Vodnany, 31 pp.
[29] Sopińska A. (1985) Usefulness of NBT test for evaluation of metabolic activity of carp peripheral blood granulocytes. Med. Wet. 41, 738-740 [In Polish].
[30] Fijan N. (2002) Morphogenesis of blood cell lineages in channel catfish. J. Fish Biol. 60, 999-1014.
[31] Kondera E. (2011) Haematopoiesis in the head kidney of common carp (Cyprinus carpio L.): a morphological study. Fish Physiol. Biochem . 37, 355-362.
[32] Sopjani M., Dreischer P., Lang F. (2008) Stimulation of eryptosis by acdmium ions. Cell. Physiol. Biochem. 22, 245-252.
[33] Romero D., Hernandez-Garcıa A., Tagliati C.A., Martınez-Lopez E., Garcıa-Fernandez A.J. (2009) Cadmium- and lead-induced apoptosis in mallard erythrocytes (Anas platyrhyn-chos) Ecotoxicol. Environ. Saf. 72, 37– 44.
[34] Verbost P. M., Flik G., Pang P. K. T., Lock R. A. C., Wende-laar Bonga S. E. (1989) Cadmium inhibition of erythrocyte Ca2+ pump. J. Biol. Chem. 264, 5613-5615.
[35] Hutchinson T. H., Manning M. J. (1996) Effect of in vivo cadmium exposure on the respiratory burst of marine fish (Limanda limanda L.) phagocytes. Mar. Environ. Res. 41, 327-342.
[36] Sanchez-Dardon J., Voccia I., Hontela A., Anderson P., Brousseau P., Blakley B., Boermans H., Fournier M. (1997) Immunotoxicity of cadmium, zinc and mercury after in vivo exposure, alone or in mixture in rainbow trout (Oncorhyn-chus mykiss). Dev. Comp. Immunol. 21, 133.
[37] Schuwerack P. M. (2003) Cadmium-induced cellular and immunological responses in Cyprinus carpio infected with the blood parasite Sanguinicola inermis. J. Helminthol. 77, 341-350.
[38] Suzuki Y. (1986) Cytochemistry of basophil granulocytes in carp and puffer. Bull. Jap. Soc. Sci. Fish. 52, 1895-1899.
[39] Suzuki Y. (1992) Basophil migration in acute inflammation in the puffer fish. Nippon Suisan Gakkaishi 58, 2005-2007.
Received: September 06, 2011 Revised: November 08, 2011 Accepted: November 14, 2011 CORRESPONDING AUTHOR
Małgorzata Witeska Dept. of Animal Physiology Siedlce Univ. of Natural Sciences and Humanities Prusa 12 08110 Siedlce POLAND Phone: +48 25 6431348 E-mail: [email protected]
FEB/ Vol 21/ No 3a/ 2012 – pages 769 – 773
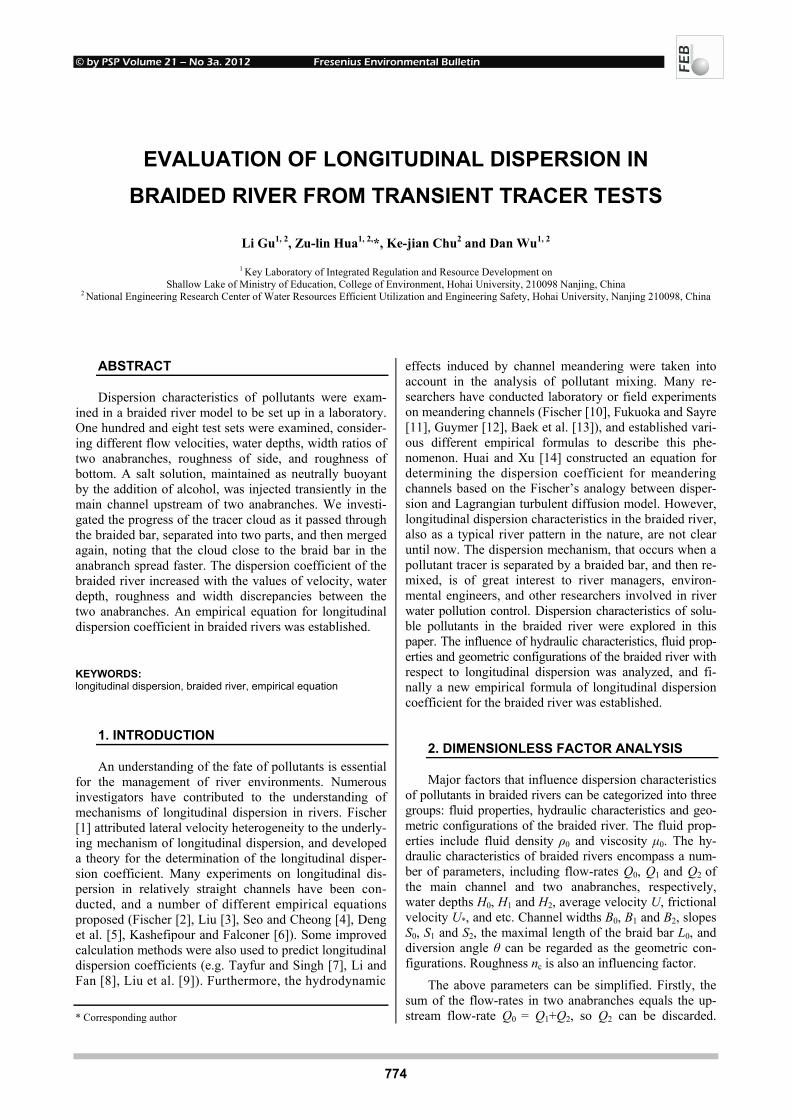
© by PSP Volume 21 – No 3a. 2012 Fresenius Environmental Bulletin
774
EVALUATION OF LONGITUDINAL DISPERSION IN BRAIDED RIVER FROM TRANSIENT TRACER TESTS
Li Gu1, 2, Zu-lin Hua1, 2,*, Ke-jian Chu2 and Dan Wu1, 2
1 Key Laboratory of Integrated Regulation and Resource Development on Shallow Lake of Ministry of Education, College of Environment, Hohai University, 210098 Nanjing, China
2 National Engineering Research Center of Water Resources Efficient Utilization and Engineering Safety, Hohai University, Nanjing 210098, China
ABSTRACT
Dispersion characteristics of pollutants were exam-ined in a braided river model to be set up in a laboratory. One hundred and eight test sets were examined, consider-ing different flow velocities, water depths, width ratios of two anabranches, roughness of side, and roughness of bottom. A salt solution, maintained as neutrally buoyant by the addition of alcohol, was injected transiently in the main channel upstream of two anabranches. We investi-gated the progress of the tracer cloud as it passed through the braided bar, separated into two parts, and then merged again, noting that the cloud close to the braid bar in the anabranch spread faster. The dispersion coefficient of the braided river increased with the values of velocity, water depth, roughness and width discrepancies between the two anabranches. An empirical equation for longitudinal dispersion coefficient in braided rivers was established.
KEYWORDS: longitudinal dispersion, braided river, empirical equation
1. INTRODUCTION
An understanding of the fate of pollutants is essential for the management of river environments. Numerous investigators have contributed to the understanding of mechanisms of longitudinal dispersion in rivers. Fischer [1] attributed lateral velocity heterogeneity to the underly-ing mechanism of longitudinal dispersion, and developed a theory for the determination of the longitudinal disper-sion coefficient. Many experiments on longitudinal dis-persion in relatively straight channels have been con-ducted, and a number of different empirical equations proposed (Fischer [2], Liu [3], Seo and Cheong [4], Deng et al. [5], Kashefipour and Falconer [6]). Some improved calculation methods were also used to predict longitudinal dispersion coefficients (e.g. Tayfur and Singh [7], Li and Fan [8], Liu et al. [9]). Furthermore, the hydrodynamic * Corresponding author
effects induced by channel meandering were taken into account in the analysis of pollutant mixing. Many re-searchers have conducted laboratory or field experiments on meandering channels (Fischer [10], Fukuoka and Sayre [11], Guymer [12], Baek et al. [13]), and established vari-ous different empirical formulas to describe this phe-nomenon. Huai and Xu [14] constructed an equation for determining the dispersion coefficient for meandering channels based on the Fischer’s analogy between disper-sion and Lagrangian turbulent diffusion model. However, longitudinal dispersion characteristics in the braided river, also as a typical river pattern in the nature, are not clear until now. The dispersion mechanism, that occurs when a pollutant tracer is separated by a braided bar, and then re-mixed, is of great interest to river managers, environ-mental engineers, and other researchers involved in river water pollution control. Dispersion characteristics of solu-ble pollutants in the braided river were explored in this paper. The influence of hydraulic characteristics, fluid prop-erties and geometric configurations of the braided river with respect to longitudinal dispersion was analyzed, and fi-nally a new empirical formula of longitudinal dispersion coefficient for the braided river was established.
2. DIMENSIONLESS FACTOR ANALYSIS
Major factors that influence dispersion characteristics of pollutants in braided rivers can be categorized into three groups: fluid properties, hydraulic characteristics and geo-metric configurations of the braided river. The fluid prop-erties include fluid density ρ0 and viscosity µ0. The hy-draulic characteristics of braided rivers encompass a num-ber of parameters, including flow-rates Q0, Q1 and Q2 of the main channel and two anabranches, respectively, water depths H0, H1 and H2, average velocity U, frictional velocity U*, and etc. Channel widths B0, B1 and B2, slopes S0, S1 and S2, the maximal length of the braid bar L0, and diversion angle θ can be regarded as the geometric con-figurations. Roughness nc is also an influencing factor.
The above parameters can be simplified. Firstly, the sum of the flow-rates in two anabranches equals the up-stream flow-rate Q0 = Q1+Q2, so Q2 can be discarded.
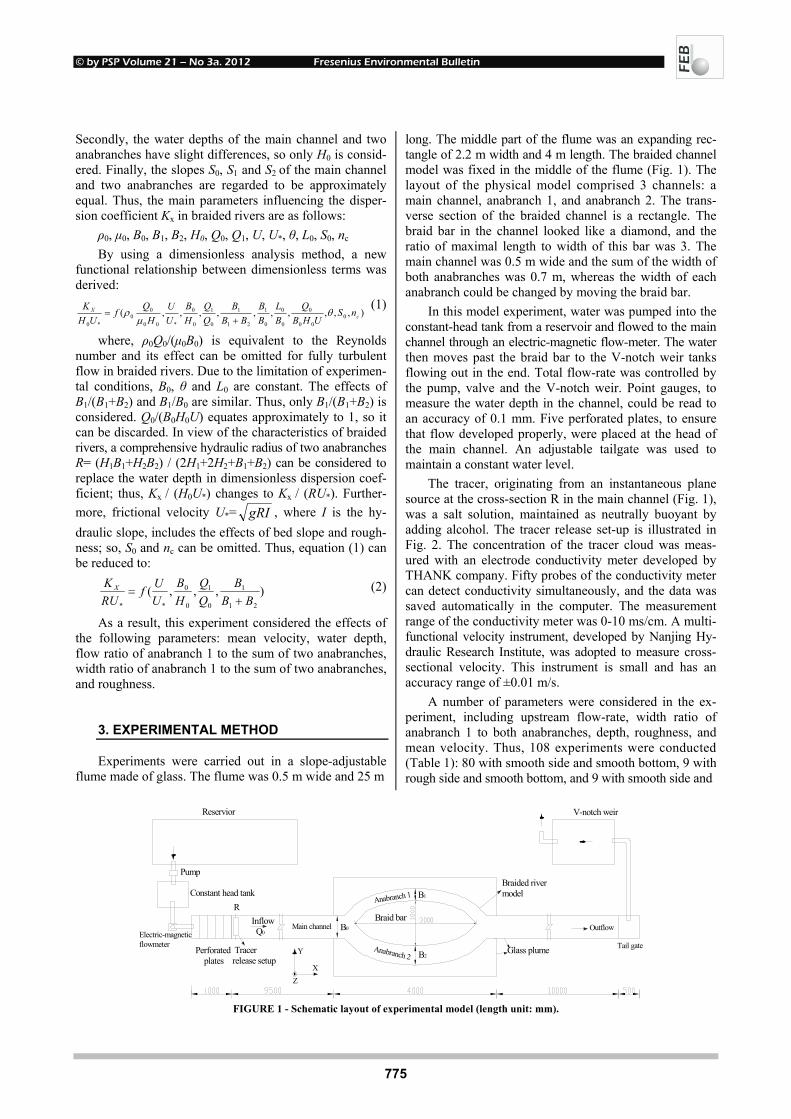
© by PSP Volume 21 – No 3a. 2012 Fresenius Environmental Bulletin
775
Secondly, the water depths of the main channel and two anabranches have slight differences, so only H0 is consid-ered. Finally, the slopes S0, S1 and S2 of the main channel and two anabranches are regarded to be approximately equal. Thus, the main parameters influencing the disper-sion coefficient Kx in braided rivers are as follows:
ρ0, µ0, B0, B1, B2, H0, Q0, Q1, U, U*, θ, L0, S0, nc
By using a dimensionless analysis method, a new functional relationship between dimensionless terms was derived:
),,,,,,,,,,( 000
0
0
0
0
1
21
1
0
1
0
0
*00
00
*0c
X nSUHB
QBL
BB
BBB
HB
UU
HQf
UHK θ
µρ
+=
(1)
where, ρ0Q0/(µ0B0) is equivalent to the Reynolds number and its effect can be omitted for fully turbulent flow in braided rivers. Due to the limitation of experimen-tal conditions, B0, θ and L0 are constant. The effects of B1/(B1+B2) and B1/B0 are similar. Thus, only B1/(B1+B2) is considered. Q0/(B0H0U) equates approximately to 1, so it can be discarded. In view of the characteristics of braided rivers, a comprehensive hydraulic radius of two anabranches R= (H1B1+H2B2) / (2H1+2H2+B1+B2) can be considered to replace the water depth in dimensionless dispersion coef-ficient; thus, Kx / (H0U*) changes to Kx / (RU*). Further-more, frictional velocity U*= gRI , where I is the hy-draulic slope, includes the effects of bed slope and rough-ness; so, S0 and nc can be omitted. Thus, equation (1) can be reduced to:
),,,(21
1
0
1
0
0
** BBB
HB
UUf
RUK X
+= (2)
As a result, this experiment considered the effects of the following parameters: mean velocity, water depth, flow ratio of anabranch 1 to the sum of two anabranches, width ratio of anabranch 1 to the sum of two anabranches, and roughness.
3. EXPERIMENTAL METHOD
Experiments were carried out in a slope-adjustable flume made of glass. The flume was 0.5 m wide and 25 m
long. The middle part of the flume was an expanding rec-tangle of 2.2 m width and 4 m length. The braided channel model was fixed in the middle of the flume (Fig. 1). The layout of the physical model comprised 3 channels: a main channel, anabranch 1, and anabranch 2. The trans-verse section of the braided channel is a rectangle. The braid bar in the channel looked like a diamond, and the ratio of maximal length to width of this bar was 3. The main channel was 0.5 m wide and the sum of the width of both anabranches was 0.7 m, whereas the width of each anabranch could be changed by moving the braid bar.
In this model experiment, water was pumped into the constant-head tank from a reservoir and flowed to the main channel through an electric-magnetic flow-meter. The water then moves past the braid bar to the V-notch weir tanks flowing out in the end. Total flow-rate was controlled by the pump, valve and the V-notch weir. Point gauges, to measure the water depth in the channel, could be read to an accuracy of 0.1 mm. Five perforated plates, to ensure that flow developed properly, were placed at the head of the main channel. An adjustable tailgate was used to maintain a constant water level.
The tracer, originating from an instantaneous plane source at the cross-section R in the main channel (Fig. 1), was a salt solution, maintained as neutrally buoyant by adding alcohol. The tracer release set-up is illustrated in Fig. 2. The concentration of the tracer cloud was meas-ured with an electrode conductivity meter developed by THANK company. Fifty probes of the conductivity meter can detect conductivity simultaneously, and the data was saved automatically in the computer. The measurement range of the conductivity meter was 0-10 ms/cm. A multi-functional velocity instrument, developed by Nanjing Hy-draulic Research Institute, was adopted to measure cross-sectional velocity. This instrument is small and has an accuracy range of ±0.01 m/s.
A number of parameters were considered in the ex-periment, including upstream flow-rate, width ratio of anabranch 1 to both anabranches, depth, roughness, and mean velocity. Thus, 108 experiments were conducted (Table 1): 80 with smooth side and smooth bottom, 9 with rough side and smooth bottom, and 9 with smooth side and
Constant head tank
V-notch weirReservior
Braided river model
Inflow Q0
Main channel
Anabranch 1
Anabranch 2
Braid bar
Pump
Outflow
Tail gate
B0
B1
B2Perforated plates
X
Y
Z
Glass plume Tracer release setup
R
Electric-magnetic flowmeter
FIGURE 1 - Schematic layout of experimental model (length unit: mm).
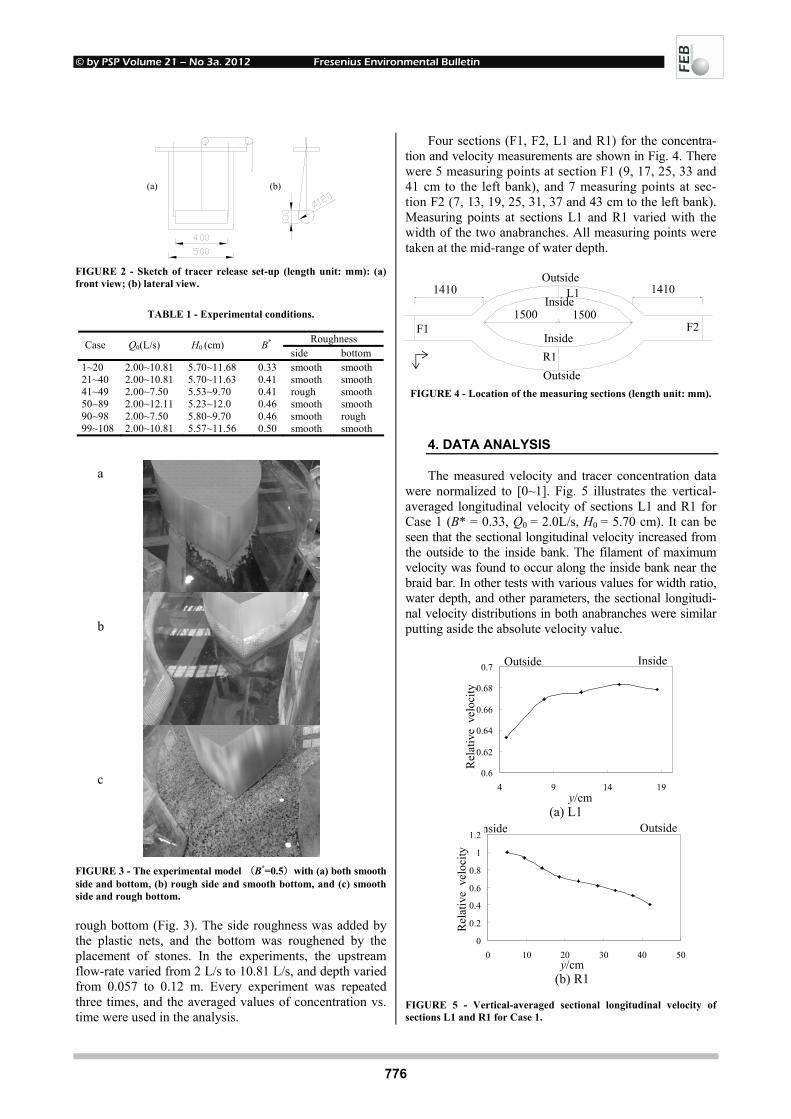
© by PSP Volume 21 – No 3a. 2012 Fresenius Environmental Bulletin
776
(a) (b)
FIGURE 2 - Sketch of tracer release set-up (length unit: mm): (a) front view; (b) lateral view.
TABLE 1 - Experimental conditions.
Roughness Case Q0(L/s) H0 (cm) B* side bottom
1~20 2.00~10.81 5.70~11.68 0.33 smooth smooth 21~40 2.00~10.81 5.70~11.63 0.41 smooth smooth 41~49 2.00~7.50 5.53~9.70 0.41 rough smooth 50~89 2.00~12.11 5.23~12.0 0.46 smooth smooth 90~98 2.00~7.50 5.80~9.70 0.46 smooth rough 99~108 2.00~10.81 5.57~11.56 0.50 smooth smooth
FIGURE 3 - The experimental model (B*=0.5)with (a) both smooth side and bottom, (b) rough side and smooth bottom, and (c) smooth side and rough bottom.
rough bottom (Fig. 3). The side roughness was added by the plastic nets, and the bottom was roughened by the placement of stones. In the experiments, the upstream flow-rate varied from 2 L/s to 10.81 L/s, and depth varied from 0.057 to 0.12 m. Every experiment was repeated three times, and the averaged values of concentration vs. time were used in the analysis.
Four sections (F1, F2, L1 and R1) for the concentra-tion and velocity measurements are shown in Fig. 4. There were 5 measuring points at section F1 (9, 17, 25, 33 and 41 cm to the left bank), and 7 measuring points at sec-tion F2 (7, 13, 19, 25, 31, 37 and 43 cm to the left bank). Measuring points at sections L1 and R1 varied with the width of the two anabranches. All measuring points were taken at the mid-range of water depth.
FIGURE 4 - Location of the measuring sections (length unit: mm).
4. DATA ANALYSIS
The measured velocity and tracer concentration data were normalized to [0~1]. Fig. 5 illustrates the vertical-averaged longitudinal velocity of sections L1 and R1 for Case 1 (B* = 0.33, Q0 = 2.0L/s, H0 = 5.70 cm). It can be seen that the sectional longitudinal velocity increased from the outside to the inside bank. The filament of maximum velocity was found to occur along the inside bank near the braid bar. In other tests with various values for width ratio, water depth, and other parameters, the sectional longitudi-nal velocity distributions in both anabranches were similar putting aside the absolute velocity value.
(a) L1
(b) R1
FIGURE 5 - Vertical-averaged sectional longitudinal velocity of sections L1 and R1 for Case 1.
0.6
0.62
0.64
0.66
0.68
0.7
4 9 14 19y/cm
Rel
ativ
e v
eloc
ity
Outside Inside
0
0.2
0.4
0.6
0.8
1
1.2
0 10 20 30 40 50
Outside
y/cm
Rel
ativ
e v
eloc
ity
nside
1410 1410
1500 1500 F1
L1
R1
F2
Outside
Inside
Inside
Outside
a b c

© by PSP Volume 21 – No 3a. 2012 Fresenius Environmental Bulletin
777
0.0
0.2
0.4
0.6
0.8
0 100 200 300 400
T/s
relative concentration
F1
L1
R1
F2
(a) B*=0.5
0
0.2
0.4
0.6
0.8
1
0 100 200 300 400
T/s
relative concentration
F1
R1
L1
F2
(b)B*=0.33
FIGURE 6 - The concentration versus time curves at the sections of F1, L1, R1 and F2: (a) B* = 0.5, Case 100; (b) B* = 0.33, Case 1.
(a) L1
(b) R1
FIGURE 7 - Concentration versus time curves of different points at sections L1 and R1 (Case 1): (a) L1, (b) R1.
The concentration versus time curves at the sections of F1, L1, R1 and F2 with B* = 0.5 (case 100, Q0 = 2.0L/s, H0 = 6.32 cm) and B* = 0.33 (case 1, Q0 = 2.0L/s, H0 = 5.70 cm) are shown in Fig. 6. The arrival time and peak concentration at sections L1 and R1 are similar when the two anabranches are equal (B* = 0.5). As to unequal widths of two anabranches (B* = 0.33), the tracer cloud travels faster in anabranch R1 due to the large velocity that prevails in this anabranch. The concentration versus time curves of different points at sections L1 and R1 for Case 1 are shown in Fig. 7. It could be known that the major tracer cloud moved along the inside bank. From the points at the inside towards the outside bank, a trend is noted whereby the peak concentration decreases and the arrival time of peak concentration increases.
On the basis of measured data at sections F1 and F2, the routing-optimization method [15] was used to deter-mine longitudinal dispersion coefficients for the braided river (Table 2). The non-dimensional longitudinal disper-sion coefficients, Kx / (RU*), were between 9.2 and 45.8.
TABLE 2 - Results of calculated longitudinal dispersion coefficients in the braided river.
Case B* U* (m/s) U (m/s) Kx (m2/s) 1~20 0.33 0.0076~0.014 0.0643~0.213 0.0079~0.032 21~40 0.41 0.0090~0.017 0.0635~0.201 0.0065~0.023 41~49 0.41 0.0080~0.016 0.0660~0.172 0.0073~0.015 50~89 0.46 0.0039~0.016 0.0643~0.205 0.0053~0.019 90~98 0.46 0.012~0.025 0.0677~0.171 0.0081~0.019 98~108 0.50 0.0070~0.0096 0.0660~0.185 0.005~0.0125
The relationships between the longitudinal dispersion
coefficients and the major factors were analyzed as de-scribed below.
(1) Fig. 8 illustrates the relationship between the lon-gitudinal dispersion coefficient Kx and average velocity U at the approximately equal water depth (H1∈[9.64, 9.66], H2∈[5.72, 5.79]) and the same width ratio of two ana-branches (B*=0.46). It can be seen that Kx increases with U, the reason being that the mixing capacity in a braided river increases as the average velocity increases. A similar relationship also existed in experimental tests with other width ratios and water depths.
(2) Results illustrated in Fig. 9 indicate that the longi-tudinal dispersion coefficient Kx increases with increasing water depth H0 when the average velocity and the width ratio of the two anabranches are approximately equal (U1∈[0.169, 0.176], U2∈[0.0953, 0.0980], B* = 0.46). As the water depth increased, the velocity distribution of the braided river became non-uniform, and the longitudinal dispersion coefficient increased.
(3) The relationship between the longitudinal disper-sion coefficient Kx and the width ratio B* at the approxi-mately equal water depth (H1∈[5.59, 5.75], H2∈[5.72, 5.80]) and velocity (U1∈[0.122, 0.127], U2∈[0.201, 0.203]) is shown in Fig. 10. When B* changed from 0.33
Outside
90110
130150
170190
210230
85185
285385
0
0.5
1
Rel
ativ
e C
once
ntra
tion
Inside
T/s y/mm
100120
140160
180200
220240
45115
185
0
0.5
1
Outside
T/s y/mm
Rel
ativ
e C
once
ntra
tion
Inside
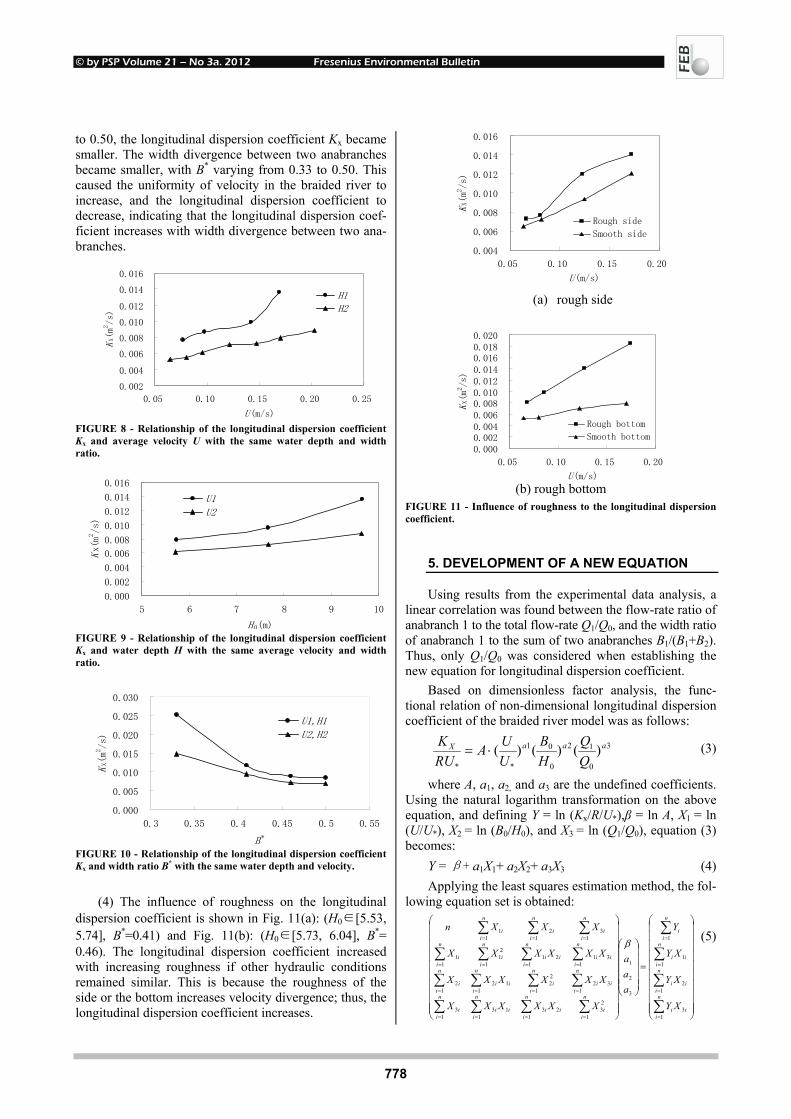
© by PSP Volume 21 – No 3a. 2012 Fresenius Environmental Bulletin
778
to 0.50, the longitudinal dispersion coefficient Kx became smaller. The width divergence between two anabranches became smaller, with B* varying from 0.33 to 0.50. This caused the uniformity of velocity in the braided river to increase, and the longitudinal dispersion coefficient to decrease, indicating that the longitudinal dispersion coef-ficient increases with width divergence between two ana-branches.
0.002
0.004
0.006
0.008
0.010
0.012
0.014
0.016
0.05 0.10 0.15 0.20 0.25
U(m/s)
KX(m
2/s)
H1
H2
FIGURE 8 - Relationship of the longitudinal dispersion coefficient Kx and average velocity U with the same water depth and width ratio.
0.000
0.002
0.004
0.006
0.008
0.010
0.012
0.014
0.016
5 6 7 8 9 10
H 0(m)
Kx(m
2/s)
U1
U2
FIGURE 9 - Relationship of the longitudinal dispersion coefficient Kx and water depth H with the same average velocity and width ratio.
0.000
0.005
0.010
0.015
0.020
0.025
0.030
0.3 0.35 0.4 0.45 0.5 0.55
B *
KX(m
2/s)
U1,H1
U2,H2
FIGURE 10 - Relationship of the longitudinal dispersion coefficient Kx and width ratio B* with the same water depth and velocity.
(4) The influence of roughness on the longitudinal
dispersion coefficient is shown in Fig. 11(a): (H0∈[5.53, 5.74], B*=0.41) and Fig. 11(b): (H0∈[5.73, 6.04], B*= 0.46). The longitudinal dispersion coefficient increased with increasing roughness if other hydraulic conditions remained similar. This is because the roughness of the side or the bottom increases velocity divergence; thus, the longitudinal dispersion coefficient increases.
0.004
0.006
0.008
0.010
0.012
0.014
0.016
0.05 0.10 0.15 0.20
U(m/s)
KX(m2/s)
Rough side
Smooth side
(a) rough side
0.0000.0020.0040.0060.0080.0100.0120.0140.0160.0180.020
0.05 0.10 0.15 0.20
U(m/s)
KX(m2/s)
Rough bottom
Smooth bottom
(b) rough bottom
FIGURE 11 - Influence of roughness to the longitudinal dispersion coefficient.
5. DEVELOPMENT OF A NEW EQUATION
Using results from the experimental data analysis, a linear correlation was found between the flow-rate ratio of anabranch 1 to the total flow-rate Q1/Q0, and the width ratio of anabranch 1 to the sum of two anabranches B1/(B1+B2). Thus, only Q1/Q0 was considered when establishing the new equation for longitudinal dispersion coefficient.
Based on dimensionless factor analysis, the func-tional relation of non-dimensional longitudinal dispersion coefficient of the braided river model was as follows:
3
0
12
0
01
**
)()()( aaaX
HB
UUA
RUK
⋅= (3)
where A, a1, a2, and a3 are the undefined coefficients. Using the natural logarithm transformation on the above equation, and defining Y = ln (Kx/R/U*),β = ln A, X1 = ln (U/U*), X2 = ln (B0/H0), and X3 = ln (Q1/Q0), equation (3) becomes:
Y = β+ a1X1+ a2X2+ a3X3 (4) Applying the least squares estimation method, the fol-
lowing equation set is obtained:
=
∑
∑
∑
∑
∑∑∑∑
∑∑∑∑
∑∑∑∑
∑∑∑
=
=
=
=
====
====
====
===
n
iii
n
iii
n
iii
n
ii
n
ii
n
iii
n
iii
n
ii
n
iii
n
ii
n
iii
n
ii
n
iii
n
iii
n
ii
n
ii
n
ii
n
ii
n
ii
XY
XY
XY
Y
aaa
XXXXXX
XXXXXX
XXXXXX
XXXn
13
12
11
1
3
2
1
1
23
123
113
13
132
1
22
112
12
131
121
1
21
11
13
12
11
β (5)

© by PSP Volume 21 – No 3a. 2012 Fresenius Environmental Bulletin
779
where n is the number of experimental tests. On the basis of experimental data, the coefficients can be calcu-lated, using equation (5), as follows:
β = -0.434,a1 = 0.666,a2 = 0.305,a3 = -1.408
Thus, the empirical formula for non-dimensional lon-gitudinal dispersion coefficient is obtained as follows:
048.1
0
1305.0
0
0666.0
**
)()()(648.0 −=QQ
HB
UU
RUK X (R2=0.759) (6)
The experimental value and calculated value of Kx/(RU*) is shown in Fig. 12. It can be seen that the calcu-lated results of the equation (6) are satisfied.
y = x
0
10
20
30
40
50
60
0 10 20 30 40 50 60
Measured Kx/(RU*)
Calculated K
x/(RU
*)
FIGURE 12 - Comparison of experimental value and calculated value of Kx/(RU*).
6. CONCLUSION
Tracer experiments were carried out to examine dis-persion characteristics in a laboratory model of braided river. In the braided river, the tracer cloud was separated by the braid bar into two parts, and then merged into one again. The characteristics of the sectional averaged con-centration versus time curves in two anabranches were concerned with the width ratio. The arrival times of peak concentration in two anabranches were the same if the widths of the two anabranches were equal (B* = 0.5). When the widths of both anabranches became unequal, however, the arrival time of peak concentration in the main ana-branch with the larger velocity became shorter. In each anabranch, the tracer cloud was transported following the filament of maximum velocity close to the braid bar at the inside bank. Results taken from measurements of the inside bank to the outside bank indicated a trend of peak concentrations decreasing and arrival times becoming longer. The routing-optimization method was applied to determine the longitudinal dispersion coefficients of the braided rivers, using the measured data at sections F1 and F2. The longitudinal dispersion coefficient of the braided river increased with increasing velocity, water depth, rough-ness, and width discrepancies between the two anabranches. By using experimental data and multiple regression analy-sis, a new empirical equation of longitudinal dispersion coefficient in the braided river was developed.
ACKNOWLEDGEMENTS
The research was partly supported by the National Basic Research Program of China (973 Program) (Grant No. 2008CB418202), the National Natural Science Foun-dation of China (Grant No. 51009048, 50979026 and 51179052), the National Key Technologies R&D Pro-gram (2012BAB03B04), the Major Science and Technology Program for Water Pollution Control and Treatment (Grant No. 2009ZX07103-006), The Project of “Six Tal-ent Peak” of Jiangsu Province (08-C), Ministry of Water Resources’ Special Funds for Scientific Research on Public Causes (Grant No. 201001028), the Nature Sci-ence Foundation of Hohai University (No. 2009422611), and the Fundamental Research Funds for the Central Uni-versities (No. 2009B16714 and 2009B18314).
REFERENCES
[1] Fischer, B.H. (1967) The mechanics of dispersion in natural streams. J. Hydraul. Div., ASCE, 93(6), 187–216.
[2] Fischer, H.B., List, E.J., Koh, R.C.Y., Imberger, J. and Brooks, N.H. (1979) Mixing in inland and coastal waters. New York: Academic Press.
[3] Liu, H. (1977) Predicting Dispersion Coefficient of Stream. J. Envir. Engrg. Div., ASCE, 103(1), 59-69.
[4] Seo, I.W. and Cheong, T.S. (1998) Predicting Longitudinal Dispersion Coefficient in Natural Streams. Journal of Hy-draulic Engineering, 124(1), 25-31.
[5] Deng, Z.Q., Singh, V.P. and Bengtsson, L. (2001) Longitudi-nal dispersion coefficient in straight rivers. Journal of Hy-draulic Engineering, 127(11), 919-927.
[6] Kashefipour, S.M. and Falconer, R.A. (2002) Longitudinal dispersion coefficients in natural channels. Water Research, 36(6), 1596-1608.
[7] Tayfur G. and Singh V.P. (2005) Predicting longitudinal dis-persion coefficient in natural streams by artificial neural net-work. Journal of Hydraulic Engineering-Asce 131(11), 991-1000.
[8] Li E. and Fan Y.H. (2007) Inverse calculation models based on both time and frequency domains applied for the calcula-tion of longitudinal dispersion coefficient and BOD decay rate in the water quality model for the tidal Foshan River (China). Fresenius Environmental Bulletin, 16(1), 76-81.
[9] Liu, X.D., Hua, Z.L., Xue, H.Q., Gu, L., and Xie, Z.F. (2011) Inverse optimization method to determine longitudinal dis-persion coefficient and selection of sampling time in tracer tests. Fresenius Environmental Bulletin, 20(5), 1149-1154.
[10] Fischer, H. B. (1969) The effect of bends on dispersion in streams. Water Resour. Res., 5(2), 496–506.
[11] Fukuoka, S. and Sayre, W.W. (1973) Longitudinal dispersion in sinuous channels. J. Hydr. Div., 99(1), 195–217.
[12] Guymer, I. (1998) Longitudinal dispersion in a sinuous chan-nel with changes in shape. J. Hydraul. Eng., 124(1), 33-40.

© by PSP Volume 21 – No 3a. 2012 Fresenius Environmental Bulletin
780
[13] Baek, K.O., Seo, I.W. and Jeong, S.J. (2006) Evaluation of dispersion coefficients in meandering channels from transient tracer tests. Journal of hydraulic engineering, 132(10), 1021-1032.
[14] Huai, W.X. and Xu, X.P. (2002) Hydraulic estimation of dis-persion coefficient for sinuous channel. Engineering Journal of Wuhan University, 35(4), 9-12. (In Chinese)
[15] Gu, L., Hua, Z.L., He, W., and Hu, Y.L. (2007) Routine-optimization method for determination of longitudinal dis-persion coefficient in river. Journal of Hydraulic Engineer-ing, 38(12), 1421-1425. (In Chinese)
Received: September 12, 2011 Accepted: November 04, 2011 CORRESPONDING AUTHOR
Zu-lin Hua College of Environment Hohai University 1 Xikang Road Nanjing 210098 P.R. CHINA E-mail: [email protected]
FEB/ Vol 21/ No 3a/ 2012 – pages 774 - 780
© by PSP Volume 21 – No 3a. 2012 Fresenius Environmental Bulletin
781
ASSESSMENT OF LEVELS AND ASSOCIATED RISKS OF EX-POSURE TO VOCS RELEASED FROM MSW LANDFILL SITES
Selami Demir1,*, Arslan Saral1 and S. Levent Kuzu1
1 Yildiz Technical University, Department of Environmental Engineering, Davutpasa Campus 34220, Esenler Istanbul, Turkey.
ABSTRACT
A modeling study was performed to simulate atmos-pheric dispersion of volatile organic compound (VOC) emissions from a main municipal solid waste (MSW) land-fill site in Istanbul-Turkey using Industrial Source Complex short term version (ISCST3). Ambient concentrations of 1,2-dichloroethane, dichloromethane, benzene, vinyl chlo-ride, toluene, xylenes and dichlorobenzenes emitted from the landfill site were calculated over six averaging periods (1, 2, 4, 8, 12 and 24 hours). Real case model results and worst case scenario-based model results were obtained for each VOC and over each averaging periods. The model results were combined with human activity data in order to estimate average community exposure levels to landfill VOCs and associated risks. For instance, those values for dichloromethane over twelve hours of exposure dura-tion were 0.910 µg.hr.m-3 and 2.0*10-9, respectively. For worst case conditions, these values were estimated as 2.249 µg.hr.m-3 and 4.35 * 10-8. Values for each and all VOC species over each averaging period were evaluated. No significant health risks associated with exposure to landfill VOCs were expected.
KEYWORDS: Istanbul, Landfill VOC, Dispersion modeling, Expo-sure, Probability analysis
1. INTRODUCTION
During the last few decades, airborne volatile organic compounds (VOCs) have become a topic of great concern to air pollution engineers due to the fact that they possess deep impacts associated with their toxic and carcinogenic as well as odorous effects [1, 2]. Besides, they are involved in atmospheric photochemical reactions and they contribute to ambient ozone levels in some manner [3-5].
The major sources of VOCs within the urban areas are industrial activities, traffic and solid waste handling activities. Several researchers studied the odorous effects * Corresponding author
of VOCs [1, 6] and their toxic and carcinogenic effects [7-9]. Several others examined the health risks associated with personal VOC exposure [10, 11]. Most of these stud-ies focused on personal exposure to VOCs of traffic and industrial origin [12]. One example of these studies is the one conducted by Wang and Zhao [13]. They monitored diurnal concentrations of several VOCs near major roads at five distinct locations for ten consecutive days. They decided that the VOC species that can exist in the atmos-phere near a source depends on the source characteristics. In another study, Lau and Chan [14] investigated com-muter exposure to aromatic VOCs in public transport modes. They assessed the exposure levels of commuters during transportation with several vehicles. Park and Jo [15], in another study, studied personal exposure levels of children due to industrial activities near primary schools.
As obviously seen in the available literature, most of researchers focused on the exposure to VOCs of traffic and industrial origin. Therefore, there is a lack of research about the adverse effects of sub-chronic, chronic and long-term personal exposure to VOCs originating from solid waste handling activities.
Solid waste handling operations involve collection, transfer and disposal. Of these steps, disposal via landfill-ing is the most important source of VOC emissions be-cause VOCs are continuously being emitted to the atmos-phere from landfill gas withdrawal stacks and from the wide surface of landfills.
Landfill gases generally comprise methane (CH4), carbon dioxide (CO2), hydrogen sulfide (H2S) and trace amounts of VOCs. Although the VOCs are found in trace concentrations within the landfill gases, they possess high potential of environmental effects. Besides, VOCs from landfill sites are of wide variety depending on the opera-tional conditions and the characteristics of the wastes. USEPA [16] lists emission factors for 43 VOC species that exist in landfill gases. In another study, Zou et al. [17] reported the number of VOCs emitted from MSW landfill sites varies from 38 to 60 from winter to summer seasons. Haug [18] states that these VOCs include satu-rated and unsaturated hydrocarbons, organic acids, alco-hols, amines, aromatics, organic sulfides, terpenes, am-monia, aldehydes, ketones, esters, acrylates and several others.
© by PSP Volume 21 – No 3a. 2012 Fresenius Environmental Bulletin
782
Exposure is defined as the product of pollutant con-centration exposed and the time period of exposure [19]. Some more generally applicable definition of exposure is given by Zartarian et al. [20] as “contact between an agent and a target.” Considering the terminology, the definition given by Zartarian et al. [20] is widely accepted now and it is accepted for the current study as well. Here, for stud-ies relating to exposure to air pollutants, the agent can be referred to as pollutants that have already become airborne and are readily available to contact the target and the target is the human living or spending considerable time within the polluted area. After defining the exposure to a pollut-ant, there is a need to quantitatively express the exposure levels in terms of exposure concentrations and exposure durations. Fortunately, a mathematical definition of expo-sure concentration at a point in space and an instant in time is available in Ott et al. [21] as the total mass of pollutant within the contact volume at an instant in time divided by the contact volume:
∫∫∫
∫∫∫=
V
Vt
t dxdydz
dxdydzCε (1)
Here, tε is the average exposure concentration at a specified point in space and specified instant in time, and
tC is the concentration of the pollutant of interest within the contact volume at the specified instant in time. To clarify, the concentration within the contact volume is defined as the concentration of the pollutant in immediate proximity to the target to be exposed by inhalation, inges-tion or absorption; and it is different than the concentra-tion of that pollutant in surrounding ambient air due to the shading effect of the target, for example. However, it can easily be assumed that the air around a person is com-pletely mixed at a distance of inhalable proximity. This assumption is not considered to cause considerable error in the estimation of exposure concentrations using ambi-ent concentrations. With this simplifying assumption, the exposure concentration given in Ott et al. [21] becomes ambient air concentration for an airborne pollutant.
Exposure to hazardous materials is studied under three main titles: exposure by inhalation, by ingestion and by dermal absorption. During daily activities, people are ex-posed to many VOCs from several sources including traffic emissions, industrial, occupational and solid waste handling emissions, home activities like cooking, shower-ing, paints and many others. This study, however, focuses on the exposure by inhalation to landfill VOCs. The expo-sure level in the current study is, then, a measure of expo-sure concentration (ambient concentration) and exposure duration.
Main pathway of landfill VOCs for reaching humans is air dispersion. Some landfill VOCs can also leach from the landfills to the groundwater making its way eventually to humans, however, this study only focuses on VOCs
that come into contact with the humans through air dis-persion, particularly, via inhalation.
The aim of this study is to characterize the VOC emissions from a municipal landfill site in Istanbul, Tur-key (Odayeri Sanitary Landfill Site); to model atmos-pheric dispersion of these VOCs in order to estimate their ambient concentrations (exposure concentrations for the case) in a nearby residential area (Gokturk); to determine personal exposure levels to these landfill VOCs in Gok-turk by combining the results from the modeling study and human activity data; and to discuss health risks associated with personal exposure of those people to specific volatile organic compounds from the landfill site.
2. MATERIALS AND METHODS
2.1. Site Definition
Istanbul is the biggest metropolis of Turkey in eco-nomical aspects. It is also the most attractive city for this reason. The city is settled in a surface area of 5712 km2. The results of census 2007 [22] showed that Istanbul com-prises approximately 18% of Turkey's overall population with the population of 12,461,170. When the surface area of Istanbul is considered, this population of Istanbul makes it the most crowded city of Turkey. The population densi-ties of Istanbul and Turkey are approximately 2,420 people/ km2 and 92 people/km2, respectively. The city is settled in northwestern part of Turkey where it acts as a bridge be-tween European and Asian parts of Turkey. 65% of the city's total population live in European side, while the rest in Asian side.
ISTAC [23] reported that 13,200 tonnes per day of domestic wastes are generated in Istanbul. Approximately 8,700 tonnes of this is generated in European side while the rest is coming from Asian side. Currently, there are two active MSW landfills operating in Istanbul since 1995. Two closed dump sites in Hasdal and Umraniye had been active till 1995. Of the active landfills, one is located in Kemerburgaz on the European side and the other is located in Sile on the Asian side of Istanbul. These two landfills have been receiving all of the domestic wastes of Istanbul since 1995. Locations of municipal solid waste handling facilities in Istanbul are shown in Saral et al. [1].
2.2. Emission Inventory for Selected Compounds
In the selection of VOC species of interest, two main criteria were employed. First, the particular VOC of inter-est from landfill site was required to be listed in the avail-able literature along with its typical emission factor or its typical concentration in the landfill gas. Second, the VOC of interest needed to be included in US EPA’s Integrated Risk Information System (IRIS) [24] with unit risks asso-ciated with it. The latter constraint was employed in the selection process in order to make proper evaluations for the results of exposure and its health effects on people exposed. Four species were selected based on these crite-
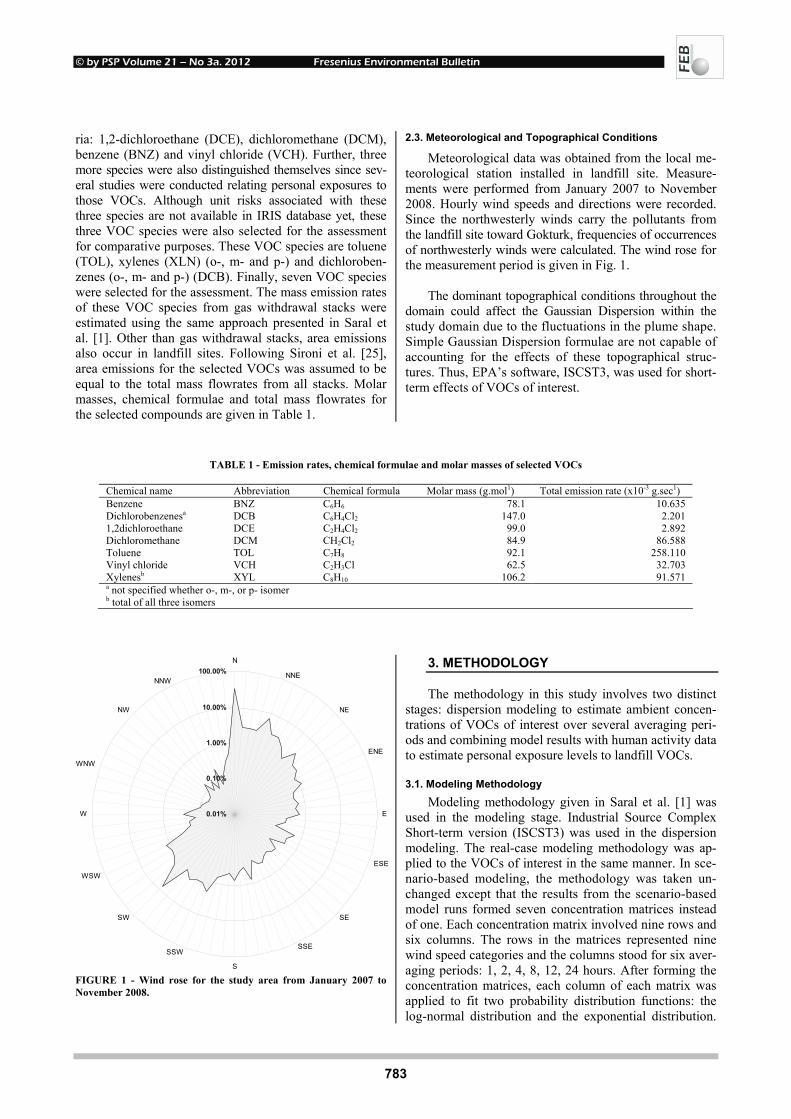
© by PSP Volume 21 – No 3a. 2012 Fresenius Environmental Bulletin
783
ria: 1,2-dichloroethane (DCE), dichloromethane (DCM), benzene (BNZ) and vinyl chloride (VCH). Further, three more species were also distinguished themselves since sev-eral studies were conducted relating personal exposures to those VOCs. Although unit risks associated with these three species are not available in IRIS database yet, these three VOC species were also selected for the assessment for comparative purposes. These VOC species are toluene (TOL), xylenes (XLN) (o-, m- and p-) and dichloroben-zenes (o-, m- and p-) (DCB). Finally, seven VOC species were selected for the assessment. The mass emission rates of these VOC species from gas withdrawal stacks were estimated using the same approach presented in Saral et al. [1]. Other than gas withdrawal stacks, area emissions also occur in landfill sites. Following Sironi et al. [25], area emissions for the selected VOCs was assumed to be equal to the total mass flowrates from all stacks. Molar masses, chemical formulae and total mass flowrates for the selected compounds are given in Table 1.
2.3. Meteorological and Topographical Conditions
Meteorological data was obtained from the local me-teorological station installed in landfill site. Measure-ments were performed from January 2007 to November 2008. Hourly wind speeds and directions were recorded. Since the northwesterly winds carry the pollutants from the landfill site toward Gokturk, frequencies of occurrences of northwesterly winds were calculated. The wind rose for the measurement period is given in Fig. 1.
The dominant topographical conditions throughout the
domain could affect the Gaussian Dispersion within the study domain due to the fluctuations in the plume shape. Simple Gaussian Dispersion formulae are not capable of accounting for the effects of these topographical struc-tures. Thus, EPA’s software, ISCST3, was used for short-term effects of VOCs of interest.
TABLE 1 - Emission rates, chemical formulae and molar masses of selected VOCs
Chemical name Abbreviation Chemical formula Molar mass (g.mol1) Total emission rate (x10-3 g.sec1) Benzene BNZ C6H6 78.1 10.635 Dichlorobenzenesa DCB C6H4Cl2 147.0 2.201 1,2dichloroethane DCE C2H4Cl2 99.0 2.892 Dichloromethane DCM CH2Cl2 84.9 86.588 Toluene TOL C7H8 92.1 258.110 Vinyl chloride VCH C2H3Cl 62.5 32.703 Xylenesb XYL C8H10 106.2 91.571 a not specified whether o-, m-, or p- isomer b total of all three isomers
0.01%
0.10%
1.00%
10.00%
100.00%N
NNE
NE
ENE
E
ESE
SE
SSE
S
SSW
SW
WSW
W
WNW
NW
NNW
FIGURE 1 - Wind rose for the study area from January 2007 to November 2008.
3. METHODOLOGY
The methodology in this study involves two distinct stages: dispersion modeling to estimate ambient concen-trations of VOCs of interest over several averaging peri-ods and combining model results with human activity data to estimate personal exposure levels to landfill VOCs.
3.1. Modeling Methodology
Modeling methodology given in Saral et al. [1] was used in the modeling stage. Industrial Source Complex Short-term version (ISCST3) was used in the dispersion modeling. The real-case modeling methodology was ap-plied to the VOCs of interest in the same manner. In sce-nario-based modeling, the methodology was taken un-changed except that the results from the scenario-based model runs formed seven concentration matrices instead of one. Each concentration matrix involved nine rows and six columns. The rows in the matrices represented nine wind speed categories and the columns stood for six aver-aging periods: 1, 2, 4, 8, 12, 24 hours. After forming the concentration matrices, each column of each matrix was applied to fit two probability distribution functions: the log-normal distribution and the exponential distribution.

© by PSP Volume 21 – No 3a. 2012 Fresenius Environmental Bulletin
784
The parameters for the probability distribution functions were obtained by rank regressions on cumulative probabil-ity distributions. The coefficients of determination (values of R2) for each probability distribution fit were compared. The probability distribution that best explains the fluctua-tions in ambient concentrations of VOCs, with respect to the changing wind speeds, was chosen and distribution parameters were estimated for each VOC over each aver-aging period. Percentiles of several probability degrees were, then, calculated using selected probability distribu-tion function. As in Saral et al. [1], the upper and lower limits of ambient concentrations for each VOC over each averaging period within given probability intervals were calculated for further use.
3.2. Human Activity Data
Human activity is one of the most important factors in exposure assessment. Human activity patterns involve data about individuals’ daily activities. The patterns are ob-tained via community surveys conducted on site and indi-viduals are asked a set of questions about where and how
much they spend time. These surveys are very expensive and time-consuming to conduct for each specific research study. Thus, a generalized form of individuals’ activities is required most of the time. Human activity patterns are established to reduce costs and to save time. For this study, human activity patterns were obtained from a previous study [26]. Since outdoor ambient concentrations are estimated in this study, the periods of time that individuals spend outdoors were extracted from the database. Extracted data is presented in Table 2.
4. RESULTS
4.1. Model results 4.1.1. Real-case model results
Short-term model runs with the measured meteoro-logical data provided 1-, 2-, 4-, 8-, 12-, and 24-hr average concentrations for the seven VOC species: benzene, di-chlorobenzenes (o-,m-, and p- isomers), 1,2-dichloroethane, dichloromethane, toluene, vinylchloride and xylenes (o-,m-,
TABLE 2 - Human activity data
Percent population that spends specified hours per day for outdoor activities (%) Hours per day All ages < 5 yr. old 5–11 yr. old 12–17 yr. old 18–64 yr. old > 64 yr. old 1 85.1 91.6 90.7 80.4 83.4 85.4 2 73.1 79.8 79.6 68.3 71.4 71.1 4 53.0 57.0 56.5 47.3 53.3 51.4 8 29.1 26.7 29.6 22.7 30.5 29.4 12 18.5 15.5 16.9 11.9 20.5 17.7 24 5.80 2.00 3.30 2.40 6.90 3.50
TABLE 3 - Real-case model results
Values of exposure concentrations AP Distribution BNZ DCB DCE DCM TOL VCH XYL 1 hr Average (µg.m-3) 0.143 0.030 0.039 1.168 3.482 0.441 1.235
Upper (µg.m-3) 0.221 0.046 0.060 1.798 5.359 0.679 1.901 Lower (µg.m-3) 0.066 0.014 0.018 0.538 1.604 0.203 0.569 PPA1 (%) 0.0 0.0 0.0 73.1 100.0 0.0 79.0
2 hr Average (µg.m-3) 0.119 0.025 0.032 0.970 2.891 0.366 1.025 Upper (µg.m-3) 0.212 0.044 0.058 1.728 5.151 0.653 1.828 Lower (µg.m-3) 0.026 0.005 0.007 0.211 1.604 0.080 0.223 PPA1 (%) 0.0 0.0 0.0 49.0 97.4 0.0 52.0
4 hr Average (µg.m-3) 0.081 0.017 0.022 0.657 1.959 0.248 0.695 Upper (µg.m-3) 0.165 0.034 0.045 1.341 3.996 0.506 1.418 Lower (µg.m-3) – – – – – – – PPA1 (%) 0.0 0.0 0.0 12.5 85.8 0.0 19.0
8 hr Average (µg.m-3) 0.054 0.011 0.015 0.440 1.311 0.166 0.465 Upper (µg.m-3) 0.130 0.027 0.035 1.055 3.144 0.398 1.115 Lower (µg.m-3) – – – – – – – PPA1 (%) 0.0 0.0 0.0 2.1 65.0 0.0 2.9
12 hr Average (µg.m-3) 0.052 0.011 0.014 0.410 1.250 0.158 0.444 Upper (µg.m-3) 0.131 0.027 0.036 1.070 3.190 0.404 1.132 Lower (µg.m-3) – – – – – – – PPA1 (%) 0.0 0.0 0.0 2.3 61.6 0.0 3.1
24 hr Average (µg.m-3) 0.028 0.006 0.008 0.233 0.694 0.088 0.246 Upper (µg.m-3) 0.076 0.016 0.021 0.615 1.834 0.232 0.651 Lower (µg.m-3) – – – – – – – PPA1 (%) 0.0 0.0 0.0 0.0 26.9 0.0 0.0
AP: averaging period, PPA1: percentile probability at which exposure concentrations are greater than or equal to 1 µg.m-3
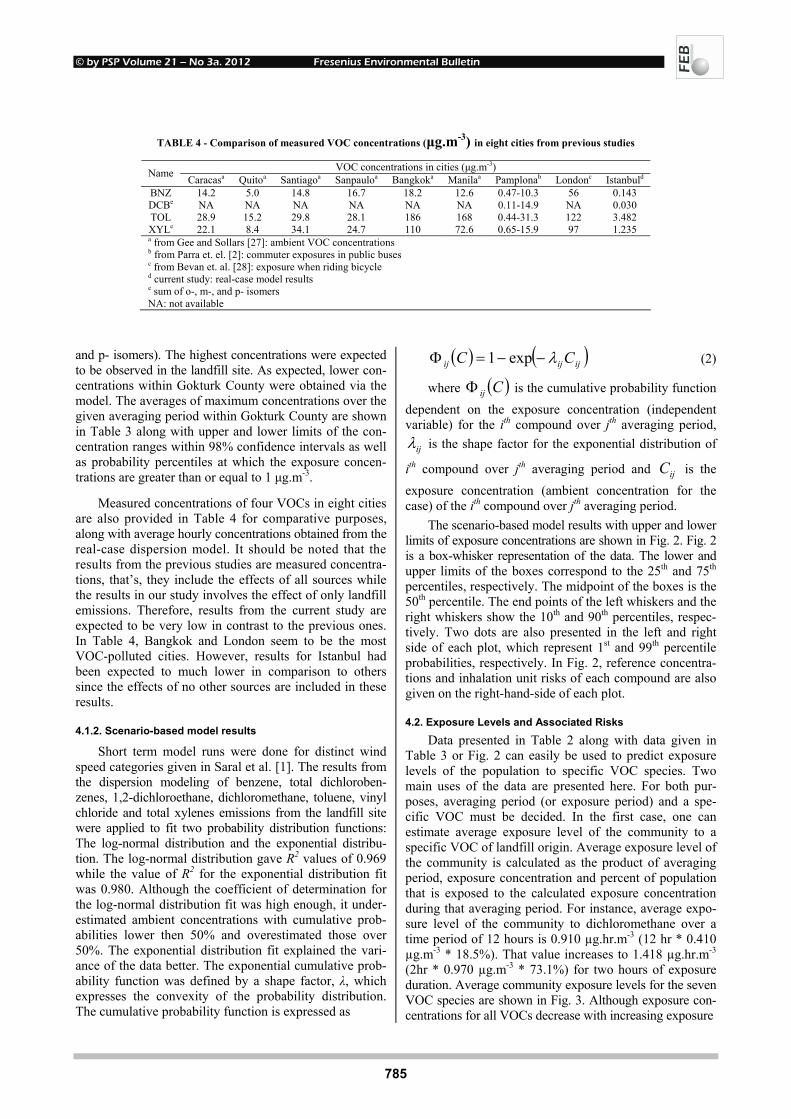
© by PSP Volume 21 – No 3a. 2012 Fresenius Environmental Bulletin
785
TABLE 4 - Comparison of measured VOC concentrations (µg.m-3) in eight cities from previous studies
VOC concentrations in cities (µg.m-3) Name Caracasa Quitoa Santiagoa Sanpauloa Bangkoka Manilaa Pamplonab Londonc Istanbuld BNZ 14.2 5.0 14.8 16.7 18.2 12.6 0.47-10.3 56 0.143 DCBe NA NA NA NA NA NA 0.11-14.9 NA 0.030 TOL 28.9 15.2 29.8 28.1 186 168 0.44-31.3 122 3.482 XYLe 22.1 8.4 34.1 24.7 110 72.6 0.65-15.9 97 1.235 a from Gee and Sollars [27]: ambient VOC concentrations b from Parra et. el. [2]: commuter exposures in public buses c from Bevan et. al. [28]: exposure when riding bicycle d current study: real-case model results e sum of o-, m-, and p- isomers NA: not available
and p- isomers). The highest concentrations were expected to be observed in the landfill site. As expected, lower con-centrations within Gokturk County were obtained via the model. The averages of maximum concentrations over the given averaging period within Gokturk County are shown in Table 3 along with upper and lower limits of the con-centration ranges within 98% confidence intervals as well as probability percentiles at which the exposure concen-trations are greater than or equal to 1 µg.m-3.
Measured concentrations of four VOCs in eight cities are also provided in Table 4 for comparative purposes, along with average hourly concentrations obtained from the real-case dispersion model. It should be noted that the results from the previous studies are measured concentra-tions, that’s, they include the effects of all sources while the results in our study involves the effect of only landfill emissions. Therefore, results from the current study are expected to be very low in contrast to the previous ones. In Table 4, Bangkok and London seem to be the most VOC-polluted cities. However, results for Istanbul had been expected to much lower in comparison to others since the effects of no other sources are included in these results.
4.1.2. Scenario-based model results
Short term model runs were done for distinct wind speed categories given in Saral et al. [1]. The results from the dispersion modeling of benzene, total dichloroben-zenes, 1,2-dichloroethane, dichloromethane, toluene, vinyl chloride and total xylenes emissions from the landfill site were applied to fit two probability distribution functions: The log-normal distribution and the exponential distribu-tion. The log-normal distribution gave R2 values of 0.969 while the value of R2 for the exponential distribution fit was 0.980. Although the coefficient of determination for the log-normal distribution fit was high enough, it under-estimated ambient concentrations with cumulative prob-abilities lower then 50% and overestimated those over 50%. The exponential distribution fit explained the vari-ance of the data better. The exponential cumulative prob-ability function was defined by a shape factor, λ, which expresses the convexity of the probability distribution. The cumulative probability function is expressed as
( ) ( )ijijij CC λ−−=Φ exp1 (2)
where ( )CijΦ is the cumulative probability function dependent on the exposure concentration (independent variable) for the ith compound over jth averaging period,
ijλ is the shape factor for the exponential distribution of
ith compound over jth averaging period and ijC is the exposure concentration (ambient concentration for the case) of the ith compound over jth averaging period.
The scenario-based model results with upper and lower limits of exposure concentrations are shown in Fig. 2. Fig. 2 is a box-whisker representation of the data. The lower and upper limits of the boxes correspond to the 25th and 75th percentiles, respectively. The midpoint of the boxes is the 50th percentile. The end points of the left whiskers and the right whiskers show the 10th and 90th percentiles, respec-tively. Two dots are also presented in the left and right side of each plot, which represent 1st and 99th percentile probabilities, respectively. In Fig. 2, reference concentra-tions and inhalation unit risks of each compound are also given on the right-hand-side of each plot.
4.2. Exposure Levels and Associated Risks
Data presented in Table 2 along with data given in Table 3 or Fig. 2 can easily be used to predict exposure levels of the population to specific VOC species. Two main uses of the data are presented here. For both pur-poses, averaging period (or exposure period) and a spe-cific VOC must be decided. In the first case, one can estimate average exposure level of the community to a specific VOC of landfill origin. Average exposure level of the community is calculated as the product of averaging period, exposure concentration and percent of population that is exposed to the calculated exposure concentration during that averaging period. For instance, average expo-sure level of the community to dichloromethane over a time period of 12 hours is 0.910 µg.hr.m-3 (12 hr * 0.410 µg.m-3 * 18.5%). That value increases to 1.418 µg.hr.m-3 (2hr * 0.970 µg.m-3 * 73.1%) for two hours of exposure duration. Average community exposure levels for the seven VOC species are shown in Fig. 3. Although exposure con-centrations for all VOCs decrease with increasing exposure
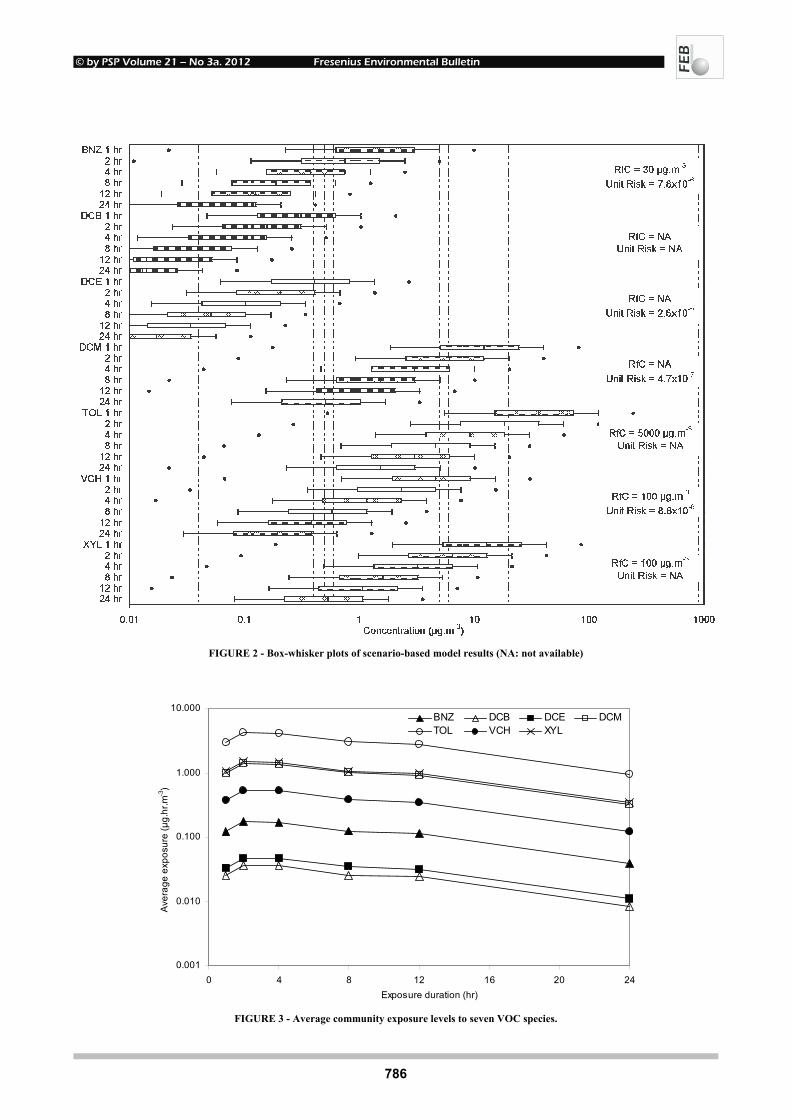
© by PSP Volume 21 – No 3a. 2012 Fresenius Environmental Bulletin
786
FIGURE 2 - Box-whisker plots of scenario-based model results (NA: not available)
0.001
0.010
0.100
1.000
10.000
0 4 8 12 16 20 24Exposure duration (hr)
Ave
rage
exp
osur
e (µ
g.hr
.m-3
)
BNZ DCB DCE DCMTOL VCH XYL
FIGURE 3 - Average community exposure levels to seven VOC species.

© by PSP Volume 21 – No 3a. 2012 Fresenius Environmental Bulletin
787
duration, average community exposure levels increases by approximately 1.5 times from one hour of exposure dura-tion to two hours. This is because the percent of popula-tion that spends time outside is also included in the calcu-lations.
Another use of the data presented is the estimation of risks associated with exposure to a specific VOC concen-tration during a specified period of time. One can predict the risk associated with exposure to a specific VOC by multiplying PPA1 (percentile probability at which con-centration is greater than or equal to 1 µg.m-3) value for a selected exposure duration in Table 3 by corresponding percent of population that spends that exposure duration outside and associated unit risk. For instance, risks asso-ciated with exposure to dichloromethane for a time period of 12 hours is 2.0*10-9. Since dichloromethane is known to cause combined adenomas and carcinomas, the calcu-lated risk can be interpreted as it is probable that two individuals out of a billion may suffer adenomas and carcinomas.
Figure 2 shows the results from the scenario-based model and represents worst case conditions. Values ex-tracted from Fig. 3 can also be used in the estimation of worst case exposure levels and associated risks instead of data from Table 3. For instance, worst case average com-munity exposure level to dichloromethane over a period of 12 hours is estimated to be approximately 2.249 µg.hr.m-3. This level is 2.5 times the average value estimated earlier using the real-case model results. On the other hand, worst case risks associated with dichloromethane expo-sure is calculated as 4.35 * 10-8, which is approximately 22 times the value estimated earlier.
5. CONCLUSIONS
Atmospheric dispersion of VOC emissions from a main MSW landfill site in Istanbul-Turkey were modeled using ISCST3. Seven VOC species (1,2-dichloroethane, dichloromethane, benzene, vinyl chloride, toluene, xylenes and dichlorobenzenes) were selected and average ambient concentrations of these VOCs within Gokturk County were estimated over six distinct averaging periods (1, 2, 4, 8, 12 and 24 hours). Scenario-based model results represent-ing worst case conditions and real-case model results were obtained for each specific VOC and each averaging period. The real-case model results were analyzed and maximum, minimum and average ambient concentrations as well as percentile probabilities at which ambient concen-trations are greater than or equal to 1 µg.m-3 were calcu-lated. The scenario-based model results were used to fit exponential distribution functions for each and all VOC species and averaging periods (42 fits were estimated). The exponential distribution fits represented the model results well with R2 values of 0.980. The probability distribution of scenario-based model results is shown in a box-whisker plot for later use. The results from real-case and scenario-
based models were, then, combined with human activity data in order to estimate average community exposure levels to these landfill VOC species and risks associated with exposure. Besides, results from the real-case model were compared with those obtained in previous studies.
The real-case model results were higher than ex-pected. Although Bangkok and London seemed to be the most VOC-polluted cities, results from the current study did not involve the effects of VOC sources other than landfill. Still, ambient levels of landfill VOCs were con-sidered to be high in comparison to the previous ones.
Real-case and scenario-based model results were also used to estimate average community exposure levels and associated risks. Average community exposure to dichloro-methane, for instance, was calculated 0.910 µg.hr.m-3 over an exposure duration of 12 hours and this value was ex-pected to reach 2.249 µg.hr.m-3 in the worst case. Average risk associated with this level of exposure was calculated as 2.0*10-9 while worst case value of the risk was 22 times this value (4.35 * 10-8). The calculated risks were inter-preted and no significant health risks associated with ex-posure to landfill VOCs were expected within Gokturk County. However, it should be noted that the current study focused on the effects of landfill VOCs only. Thus, further investigation involving on-site measurements must be done to assess real community exposure levels to VOCs of all effective sources and associated risks.
REFERENCES
[1] Saral, A., Demir, S., Yıldız, Ş. (2009) Assessment of odorous VOCs released from a main MSW landfill site in Istanbul-Turkey via a modelling approach. Journal of Hazardous Ma-terials 168: 338-345.
[2] Parra, M.A., Elustondo, D., Bermejo, R., Santamaria, J.M. (2008) Exposure to volatile organic compounds (VOC) in public buses of Pamplona, Northern Spain. The Science of the Total Environment 404: 18-25.
[3] Wark, K., Warner, C. F., Davis, W. T. (1997) Air Pollution: Its Origin and Control, 3rd ed., Prentice Hall, USA.
[4] Jiang, W., Singleton, D.L., Hedley, M., McLaren, R. (1997) Sensitivity of ozone concentrations to VOC and NOx emis-sions in the Canadian Lower Fraser Valley. Atmospheric En-vironment 31 (4): 627-638.
[5] Carter, W.P.L. (1990) A detailed mechanism for the gasphase atmospheric reactions of organic compounds. Atmospheric Environment 24A: 481-518.
[6] Demir, S., 2007. The modelling of dispersion of VOC emis-sions from sanitary landfills (in Turkish), M.Sc. Thesis, http://tez2.yok.gov.tr/tez.htm, Yıldız Technical University, Institute of Natural Sciences, Istanbul, 2007.
[7] Angerer, J., H. Wulf. (1985) Occupational chronic exposure to organic solvents. XI. Alkylbenzene exposure of varnish workers: Effects on hematopoietic system. International Ar-chives of Occupational and Environmental Health 56(4): 307-321.

© by PSP Volume 21 – No 3a. 2012 Fresenius Environmental Bulletin
788
[8] Dean, B.J., Brooks, T.M., Hodson-Walker, G., Hutson, D.H. (1985) Genetic toxicology testing of 41 industrial chemicals. Mutat. Res. 153: 57-77.
[9] NTP (National Toxicology Program). 1990. NTP Technical Report on the Toxicity Studies of ethylbenzene in F344 rats and B6C3F1 mice (Inhalation Studies). NTP TOX 10, U.S. DHHS.
[10] Jia,C., D’Souza, J., Batterman, S. (2008) Distributions of personal VOC exposures: A populationbased analysis. Envi-ronment International 34: 922-931.
[11] Edwards, R.D., Schweizer, C., Liacqua, V., Lai, H.K., Jan-tunen, M. et. al. (2006) Time–activity relationships to VOC personal exposure factors. Atmospheric Environment 40: 5685-5700.
[12] Demir, S., Saral, A., Kuzu, S.L., Akyıldız, A., Işık, D., Mert, S., Demir, G., Goncaloğlu, B.İ. (2011). Characterization of ambient volatile organic compounds and their diurnal varia-tions in Istanbul, Turkey. Fresenius Environmental Bulletin 20(11):2951-2958.
[13] Wang, P., Zhao, W. (2008) Assessment of ambient volatile organic compounds (VOCs) near major roads in urban Nan-jing, China. Atmospheric Research 89: 289-297.
[14] Lau, W.L., Chan, L.Y. (2003) Commuter exposure to aro-matic VOCs in public transportation modes in Hong Kong. The Science of the Total Environment 308: 143-155.
[15] Park, K.H., Jo, W.K. (2004) Personal volatile organic com-pound (VOC) exposure of children attending elementary schools adjacent to industrial complex. Atmospheric Envi-ronment 38: 1303-1312.
[16] USEPA (1998) AP42 Emission Factors Compilation, Office of Air Quality Planning and Standards. Research Triangle Park, NC. http://www.epa.gov/ttn/chief/ap42/ch02/final/c02s04.pdf.
[17] Zou, S.C., Lee, S.C., Chan, C.Y., Ho, K.F., Wang, X.M. et. al. (2003) Characterization of ambient volatile organic com-pounds at a landfill site in Guangzhou South China. Chemos-phere 51: 1015–1022.
[18] Haug, R.T. (1993) The Practical Handbook of Compost En-gineering, Lewis Publishers, Florida, USA.
[19] De Nevers, N. (2000) Air Pollution Control Engineering, 2nd ed., McGraw-Hill Inc., USA.
[20] Zartarian, V.G., Ott, W.R., Duan, N. (1997) A Quantitative Definition of Exposure and Related Concepts. Journal of Expo-sure Analysis and Environmental Epidemiology 7: 411–437.
[21] Ott, W.R., Steinemann, A.C., Wallace, L.A. (2007) Exposure Analysis, Taylor & Francis Group, LLC, USA.
[22] TUIK (Turkish Statistical Institute) (2008) 2007 Census, available at http://www.turkstat.gov.tr.
[23] ISTAC (Istanbul Metropolitan Municipality Environmental Protection and Waste Materials Valuation Industry and Trade Co.) (2008) Solid Waste Generation. Available at http://www.istac.com.tr.
[24] USEPA (2009) Integrated Risk Information System web site. Available at http://www.epa.gov/iris/. Accessed in 2009.
[25] Sironi, S., Capelli, L., Céntola, P., Del Rosso, R., Il Grande, M. (2005) Odor emission factors for assessment and predic-tion of Italian MSW landfills odor impact. Atmospheric En-vironment 39: 5387-5394.
[26] Tsang, A.M., Klepeis, N.E. (1996) Descriptive statistics ta-bles from a detailed analysis of the National Human Activity Pattern Survey (NHAPS) data. USEPA report number EPA/600/R-96/148.
[27] Gee, I.L., Sollars, C.J. (1998) Ambient air levels of volatile organic compounds in Latin American and Asian cities. Chemosphere 36: 2497-2506.
[28] Bevan, M.A.J., Protor, C.J., Baker-Roger, J., Warren, N.D. (1991) Exposure to carbon monoxide, respirable suspended particulates, and volatile organic compounds while commut-ing by bicycle. Environmental Science and Technology 25: 964-972.
Received: September 27, 2011 Accepted: November 04, 2011 CORRESPONDING AUTHOR
Selami Demir Yıldız Technical University Department of Environmental Engineering Davutpasa Campus Esenler 34220 Istanbul TURKEY Phone: +90 212 383 5372 Fax: +90 212 383 5358 E-mail: [email protected]
FEB/ Vol 21/ No 3a/ 2012 – pages 781 – 788

© by PSP Volume 21 – No 3a. 2012 Fresenius Environmental Bulletin
789
KINETICS AND THERMODYNAMIC STUDY OF NITRATE ADSORPTION ON GRANULAR FERRIC HYDROXIDE
Lei Huo, Qi Yang and Haitao Shang
School of Water Resources and Environment, China University of Geosciences (Beijing), Beijing, P.R. China
ABSTRACT
This study explored the feasibility of using granular ferric hydroxide as adsorbent for the removal of NO3
--N. Optimum conditions for NO3
--N removal were found to be pH 5.0 and equilibrium time 80min. The equilibrium sorption isotherm was better described by Langmuir sorp-tion isotherm model. The maximum sorption capacity of granular ferric hydroxide was 4.254mg/g at 298K. A comparison of four kinetic models applied to the adsorp-tion of NO3
--N was evaluated. The experimental data fitted well the pseudo-second-order kinetic model. ∆H0 and ∆G0 all suggested that the adsorption of NO3
--N onto granular ferric hydroxide was physisorption.
KEYWORDS: nitrate removal; granular ferric hydroxide; Adsorp-tion isotherm; kinetics; thermodynamics
1. INTRODUCTION
In many parts of the world, groundwater serves as the sole source of drinking water in rural communities and urban areas. Nitrate, due to its high water solubility, is pos-sibly the most widespread groundwater contaminant in the world, imposing a serious threat to drinking water supplies and promoting eutrophication. Excess nitrate in drinking water may cause two adverse health effects: a blue baby disease (methemoglobinaemia), especially in infants, and the potential formation of carcinogenic nitrosamines [1].
Traditional methods for nitrogen removal from waste-water are biological processes (denitrification, nitrification), chemical processes (breakpoint chlorination, selective ion exchange) and physical operation (ammonia stripping). Other operations or processes are conventional treatment (primary, secondary), biological processes (bacterial as-similation, harvesting of algae, oxidation ponds), chemi-cal processes (chemical coagulation, adsorption), physical operations (ammonia stripping, electrodialysis, filtration, reverse osmosis), land application (irrigation rapid infil-tration, overland flow) [2]. * Corresponding author
The application of most of these methods on com-mercial scale is limited due to high operational and main-tenance costs, secondary pollution and complicated pro-cedure involved in the treatment. Comparatively, adsorp-tion process seems to be a more attractive method for the removal of aquatic pollutants due to its simple design and ease of operation [1]. In recent years, considerable atten-tion has been paid on economic and environmental con-cerns to the study of using different types of low-cost sorbents such as carbon based adsorbents [3]; clay adsorb-ents [4]; layered double hydroxides [5]; agricultural waste such as sugarcane bagasse and rice hull [6], wheat straw [7]; industrial waste such as original and activated red mud [8].
The objective of this work was to study the feasibility of using granular ferric hydroxide (GFH) [9] as an ad-sorbent for NO3
--N removal from wastewater. It has been successfully applied for removal of bromate [10], fluoride [9], arsenic [11], phosphorus [12] and natural organic mat-ters [13] from water.
In the present work, the effects of various operating parameters, such as NO3
--N concentration, solution pH, and temperature, were studied and optimized by batch sorption experiments. Sorption isotherms, kinetics and thermody-namic parameters were also evaluated for the sorption of NO3
--N onto GFH. In addition, the kinetics and thermo-dynamics studies were used to gain insight on potential sorption mechanism of NO3
--N by GFH. 2. MATERIALS AND METHODS
2.1. Materials
GFH is predominately akaganeite, a poorly crystal-lized iron oxide. The specific surface area is reported to be 280 m2 /g, the point of zero charge (pHPZC) is between 7.5 and 8.0, the water content is 50% by weight. Accord-ing to the manufacturer’s references (GEH Wasserche-mie, Osnabrück), the applied material had a grain size range of 0.32-2.0mm [12]. It was sieved to obtain a frac-tion with grain size ranges between 0.1 and 1.0mm for batch study. This fraction was then washed several times with deionised water and dried at room temperature for 16h. Finally samples were transferred to glass bottles for further study. Stock solution of NO3
--N (500mg/L) was
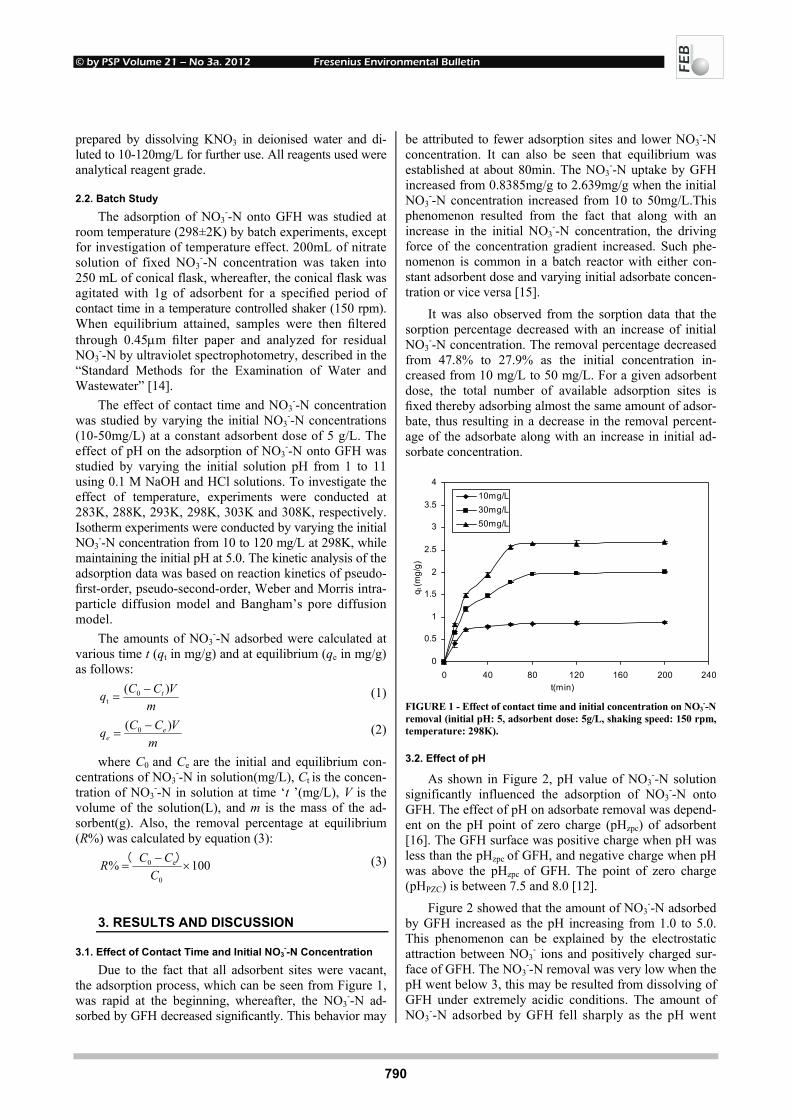
© by PSP Volume 21 – No 3a. 2012 Fresenius Environmental Bulletin
790
prepared by dissolving KNO3 in deionised water and di-luted to 10-120mg/L for further use. All reagents used were analytical reagent grade.
2.2. Batch Study
The adsorption of NO3--N onto GFH was studied at
room temperature (298±2K) by batch experiments, except for investigation of temperature effect. 200mL of nitrate solution of fixed NO3
--N concentration was taken into 250 mL of conical flask, whereafter, the conical flask was agitated with 1g of adsorbent for a specified period of contact time in a temperature controlled shaker (150 rpm). When equilibrium attained, samples were then filtered through 0.45µm filter paper and analyzed for residual NO3
--N by ultraviolet spectrophotometry, described in the “Standard Methods for the Examination of Water and Wastewater” [14].
The effect of contact time and NO3--N concentration
was studied by varying the initial NO3--N concentrations
(10-50mg/L) at a constant adsorbent dose of 5 g/L. The effect of pH on the adsorption of NO3
--N onto GFH was studied by varying the initial solution pH from 1 to 11 using 0.1 M NaOH and HCl solutions. To investigate the effect of temperature, experiments were conducted at 283K, 288K, 293K, 298K, 303K and 308K, respectively. Isotherm experiments were conducted by varying the initial NO3
--N concentration from 10 to 120 mg/L at 298K, while maintaining the initial pH at 5.0. The kinetic analysis of the adsorption data was based on reaction kinetics of pseudo-first-order, pseudo-second-order, Weber and Morris intra-particle diffusion model and Bangham’s pore diffusion model.
The amounts of NO3--N adsorbed were calculated at
various time t (qt in mg/g) and at equilibrium (qe in mg/g) as follows:
mVCCq t )( 0
t−
= (1)
mVCCq e
e)( 0 −
= (2)
where C0 and Ce are the initial and equilibrium con-centrations of NO3
--N in solution(mg/L), Ct is the concen-tration of NO3
--N in solution at time ‘t ’(mg/L), V is the volume of the solution(L), and m is the mass of the ad-sorbent(g). Also, the removal percentage at equilibrium (R%) was calculated by equation (3):
100%0
e0 ×−
=C
CCR )( (3)
3. RESULTS AND DISCUSSION
3.1. Effect of Contact Time and Initial NO3--N Concentration
Due to the fact that all adsorbent sites were vacant, the adsorption process, which can be seen from Figure 1, was rapid at the beginning, whereafter, the NO3
--N ad-sorbed by GFH decreased significantly. This behavior may
be attributed to fewer adsorption sites and lower NO3--N
concentration. It can also be seen that equilibrium was established at about 80min. The NO3
--N uptake by GFH increased from 0.8385mg/g to 2.639mg/g when the initial NO3
--N concentration increased from 10 to 50mg/L.This phenomenon resulted from the fact that along with an increase in the initial NO3
--N concentration, the driving force of the concentration gradient increased. Such phe-nomenon is common in a batch reactor with either con-stant adsorbent dose and varying initial adsorbate concen-tration or vice versa [15].
It was also observed from the sorption data that the sorption percentage decreased with an increase of initial NO3
--N concentration. The removal percentage decreased from 47.8% to 27.9% as the initial concentration in-creased from 10 mg/L to 50 mg/L. For a given adsorbent dose, the total number of available adsorption sites is fixed thereby adsorbing almost the same amount of adsor-bate, thus resulting in a decrease in the removal percent-age of the adsorbate along with an increase in initial ad-sorbate concentration.
0
0.5
1
1.5
2
2.5
3
3.5
4
0 40 80 120 160 200 240t(min)
q t (m
g/g)
10mg/L30mg/L50mg/L
FIGURE 1 - Effect of contact time and initial concentration on NO3
--N removal (initial pH: 5, adsorbent dose: 5g/L, shaking speed: 150 rpm, temperature: 298K).
3.2. Effect of pH
As shown in Figure 2, pH value of NO3--N solution
significantly influenced the adsorption of NO3--N onto
GFH. The effect of pH on adsorbate removal was depend-ent on the pH point of zero charge (pHzpc) of adsorbent [16]. The GFH surface was positive charge when pH was less than the pHzpc of GFH, and negative charge when pH was above the pHzpc of GFH. The point of zero charge (pHPZC) is between 7.5 and 8.0 [12].
Figure 2 showed that the amount of NO3--N adsorbed
by GFH increased as the pH increasing from 1.0 to 5.0. This phenomenon can be explained by the electrostatic attraction between NO3
- ions and positively charged sur-face of GFH. The NO3
--N removal was very low when the pH went below 3, this may be resulted from dissolving of GFH under extremely acidic conditions. The amount of NO3
--N adsorbed by GFH fell sharply as the pH went
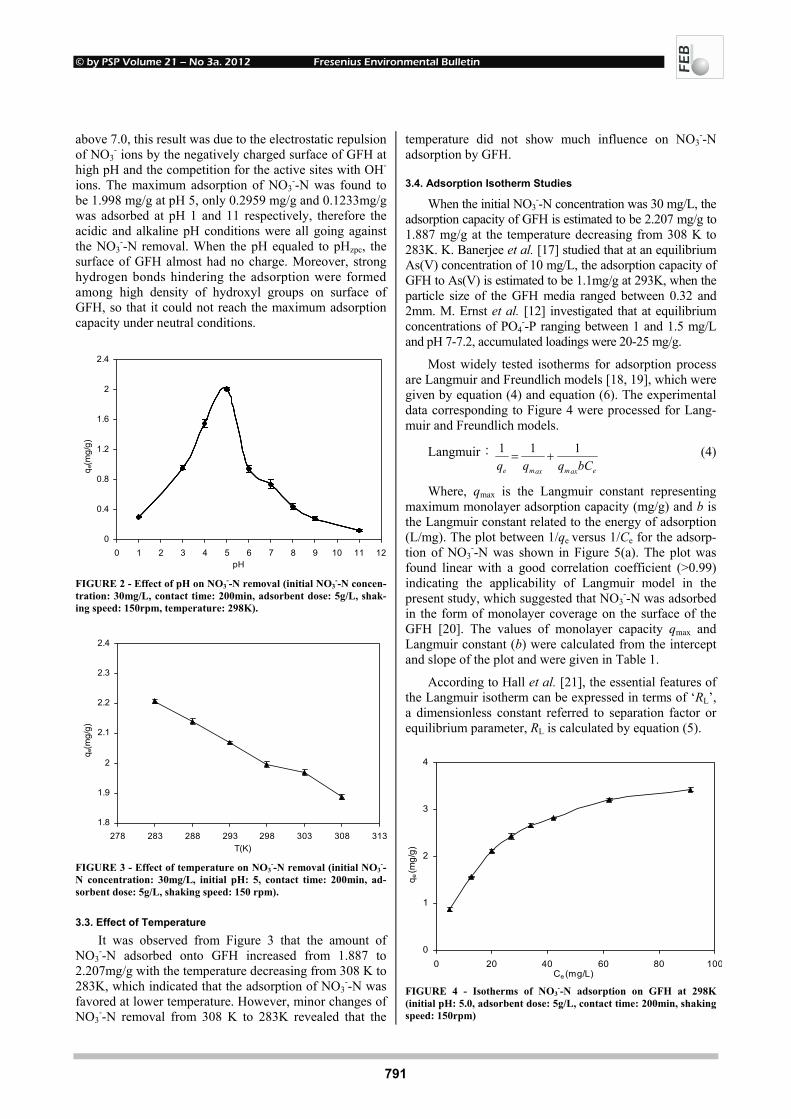
© by PSP Volume 21 – No 3a. 2012 Fresenius Environmental Bulletin
791
above 7.0, this result was due to the electrostatic repulsion of NO3
- ions by the negatively charged surface of GFH at high pH and the competition for the active sites with OH- ions. The maximum adsorption of NO3
--N was found to be 1.998 mg/g at pH 5, only 0.2959 mg/g and 0.1233mg/g was adsorbed at pH 1 and 11 respectively, therefore the acidic and alkaline pH conditions were all going against the NO3
--N removal. When the pH equaled to pHzpc, the surface of GFH almost had no charge. Moreover, strong hydrogen bonds hindering the adsorption were formed among high density of hydroxyl groups on surface of GFH, so that it could not reach the maximum adsorption capacity under neutral conditions.
0
0.4
0.8
1.2
1.6
2
2.4
0 1 2 3 4 5 6 7 8 9 10 11 12pH
q e(m
g/g)
FIGURE 2 - Effect of pH on NO3
--N removal (initial NO3--N concen-
tration: 30mg/L, contact time: 200min, adsorbent dose: 5g/L, shak-ing speed: 150rpm, temperature: 298K).
1.8
1.9
2
2.1
2.2
2.3
2.4
278 283 288 293 298 303 308 313T(K)
q e(m
g/g)
FIGURE 3 - Effect of temperature on NO3
--N removal (initial NO3--
N concentration: 30mg/L, initial pH: 5, contact time: 200min, ad-sorbent dose: 5g/L, shaking speed: 150 rpm).
3.3. Effect of Temperature
It was observed from Figure 3 that the amount of NO3
--N adsorbed onto GFH increased from 1.887 to 2.207mg/g with the temperature decreasing from 308 K to 283K, which indicated that the adsorption of NO3
--N was favored at lower temperature. However, minor changes of NO3
--N removal from 308 K to 283K revealed that the
temperature did not show much influence on NO3--N
adsorption by GFH.
3.4. Adsorption Isotherm Studies
When the initial NO3--N concentration was 30 mg/L, the
adsorption capacity of GFH is estimated to be 2.207 mg/g to 1.887 mg/g at the temperature decreasing from 308 K to 283K. K. Banerjee et al. [17] studied that at an equilibrium As(V) concentration of 10 mg/L, the adsorption capacity of GFH to As(V) is estimated to be 1.1mg/g at 293K, when the particle size of the GFH media ranged between 0.32 and 2mm. M. Ernst et al. [12] investigated that at equilibrium concentrations of PO4
--P ranging between 1 and 1.5 mg/L and pH 7-7.2, accumulated loadings were 20-25 mg/g.
Most widely tested isotherms for adsorption process are Langmuir and Freundlich models [18, 19], which were given by equation (4) and equation (6). The experimental data corresponding to Figure 4 were processed for Lang-muir and Freundlich models.
Langmuir:eaxmaxme bCqqq
111+= (4)
Where, qmax is the Langmuir constant representing maximum monolayer adsorption capacity (mg/g) and b is the Langmuir constant related to the energy of adsorption (L/mg). The plot between 1/qe versus 1/Ce for the adsorp-tion of NO3
--N was shown in Figure 5(a). The plot was found linear with a good correlation coefficient (>0.99) indicating the applicability of Langmuir model in the present study, which suggested that NO3
--N was adsorbed in the form of monolayer coverage on the surface of the GFH [20]. The values of monolayer capacity qmax and Langmuir constant (b) were calculated from the intercept and slope of the plot and were given in Table 1.
According to Hall et al. [21], the essential features of the Langmuir isotherm can be expressed in terms of ‘RL’, a dimensionless constant referred to separation factor or equilibrium parameter, RL is calculated by equation (5).
0
1
2
3
4
0 20 40 60 80 100Ce (mg/L)
q e (m
g/g)
FIGURE 4 - Isotherms of NO3
--N adsorption on GFH at 298K (initial pH: 5.0, adsorbent dose: 5g/L, contact time: 200min, shaking speed: 150rpm)
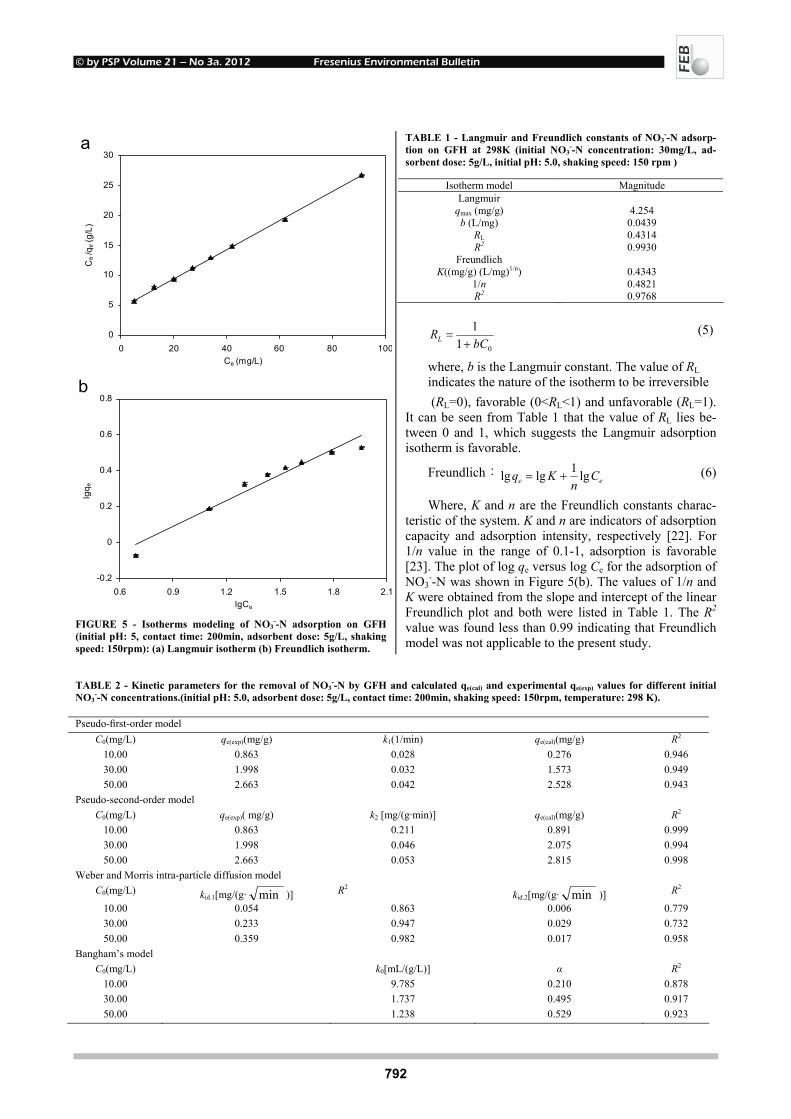
© by PSP Volume 21 – No 3a. 2012 Fresenius Environmental Bulletin
792
a
0
5
10
15
20
25
30
0 20 40 60 80 100Ce (mg/L)
Ce /
q e (g
/L)
b
-0.2
0
0.2
0.4
0.6
0.8
0.6 0.9 1.2 1.5 1.8 2.1lgCe
lgq e
FIGURE 5 - Isotherms modeling of NO3
--N adsorption on GFH (initial pH: 5, contact time: 200min, adsorbent dose: 5g/L, shaking speed: 150rpm): (a) Langmuir isotherm (b) Freundlich isotherm.
TABLE 1 - Langmuir and Freundlich constants of NO3--N adsorp-
tion on GFH at 298K (initial NO3--N concentration: 30mg/L, ad-
sorbent dose: 5g/L, initial pH: 5.0, shaking speed: 150 rpm )
Isotherm model Magnitude Langmuir
qmax (mg/g) 4.254 b (L/mg) 0.0439
RL 0.4314 R2 0.9930
Freundlich K((mg/g) (L/mg)1/n) 0.4343
1/n 0.4821 R2 0.9768
011bC
RL += (5)
where, b is the Langmuir constant. The value of RL indicates the nature of the isotherm to be irreversible (RL=0), favorable (0<RL<1) and unfavorable (RL=1).
It can be seen from Table 1 that the value of RL lies be-tween 0 and 1, which suggests the Langmuir adsorption isotherm is favorable.
Freundlich:ee C
nKq lg1lglg += (6)
Where, K and n are the Freundlich constants charac-teristic of the system. K and n are indicators of adsorption capacity and adsorption intensity, respectively [22]. For 1/n value in the range of 0.1-1, adsorption is favorable [23]. The plot of log qe versus log Ce for the adsorption of NO3
--N was shown in Figure 5(b). The values of 1/n and K were obtained from the slope and intercept of the linear Freundlich plot and both were listed in Table 1. The R2 value was found less than 0.99 indicating that Freundlich model was not applicable to the present study.
TABLE 2 - Kinetic parameters for the removal of NO3--N by GFH and calculated qe(cal) and experimental qe(exp) values for different initial
NO3--N concentrations.(initial pH: 5.0, adsorbent dose: 5g/L, contact time: 200min, shaking speed: 150rpm, temperature: 298 K).
Pseudo-first-order model C0(mg/L) qe(exp)(mg/g) k1(1/min) qe(cal)(mg/g) R2
10.00 0.863 0.028 0.276 0.946 30.00 1.998 0.032 1.573 0.949 50.00 2.663 0.042 2.528 0.943
Pseudo-second-order model C0(mg/L) qe(exp)( mg/g) k2 [mg/(g·min)] qe(cal)(mg/g) R2
10.00 0.863 0.211 0.891 0.999 30.00 1.998 0.046 2.075 0.994 50.00 2.663 0.053 2.815 0.998
Weber and Morris intra-particle diffusion model C0(mg/L) kid.1[mg/(g· min )] R2 kid.2[mg/(g· min )] R2
10.00 0.054 0.863 0.006 0.779 30.00 0.233 0.947 0.029 0.732 50.00 0.359 0.982 0.017 0.958
Bangham’s model C0(mg/L) k0[mL/(g/L)] α R2
10.00 9.785 0.210 0.878 30.00 1.737 0.495 0.917 50.00 1.238 0.529 0.923

© by PSP Volume 21 – No 3a. 2012 Fresenius Environmental Bulletin
793
3.5. Sorption Kinetics
In order to investigate the adsorption mechanism of NO3
--N onto GFH, four kinetic models including pseudo-first-order, pseudo-second-order, Weber and Morris intra-particle diffusion model and Bangham’s pore diffusion model had been applied at three different initial NO3
--N concentrations (10, 30, 50mg/L). The applicable models had been discussed in detail below and modeling parame-ters were provided in Table 2. Figure 6 shows the plots of the linearized form.
3.5.1. Pseudo-first-order model
The Lagergren’s rate equation is one of the most widely used rate equation to describe the adsorption of an adsorbate from liquid phase [24]. The pseudo-first-order Lagergren equation is given as
tkqqq ete 303.2log)log( 1−=− (7)
where, qe and qt are the amount of NO3--N adsorbed
(mg/g) at equilibrium and at time t(min),respectively, and k1 (1/min)is the rate constant of pseudo-first-order kinetic. A straight line of log (qe-qt) versus t (Figure 6(a)) suggested the applicability of this kinetic model. The slope and inter-cept of the plot were used to calculate k1 and qe(calculated) and both were shown in Table 2 along with correlation coefficient (R2) values and qe(experimental). From the data, qe(calculated) and qe(experimental) values were not in agreement with each other. Therefore, the adsorption of NO3
--N on GFH was not a first-order reaction [25].
3.5.2. Pseudo-second-order model
The pseudo-second-order [26] is expressed as equa-tion (8):
tqqkq
t
eet
112
2
+= (8)
where, k2 is the rate constant of pseudo-second-order kinetic (g/(mg·min)). The plots of t/qt versus t were shown in Figure 6(b).The values of qe(calculated) and k2 were determined from the slope and intercept of the plot, re-spectively, and were compiled in Table 2 along with cor-relation coefficient (R2) values and qe(experimental).
Figure 6(b) showed that R2 values (>0.99) were higher than those obtained from the pseudo-first-order kinetics. In addition, theoretical and experimental qe values were in agreement. Therefore, it was possible to prove that the ad-sorption process followed the second-order kinetic model.
The adsorption of solute from the solution by the ad-sorbent is driven by four mass transport mechanisms: diffu-sion at bulk space, film diffusion, intra-particle diffusion and sorption into interior sites. Generally, the first and fourth steps are rapid and thus, not considered as rate-limiting steps. Therefore, film and intra-particle diffusion are ma-jor steps controlling the rate of adsorption. The Weber and Morris intra-particle diffusion model and Bangham’s pore diffusion model have been further applied to observe the diffusion mechanism [9].
a
-2.5
-2
-1.5
-1
-0.5
0
0.5
0 20 40 60 80 100 120 140t(min)
log(
q e-q
t)
10mg/L
30mg/L
50mg/L
b
0
20
40
60
80
100
120
140
160
0 20 40 60 80 100 120 140t(min)
t/qt(m
in g
/mg)
10mg/L
30mg/L
50mg/L
C
0
0.5
1
1.5
2
2.5
3
2 3 4 5 6 7 8 9 10 11 12 13 14 15t1/2,min1/2
q t(m
g/g)
10mg/L
30mg/L
50mg/L
phaseⅠ phaseⅡ
d
-1.6
-1.4
-1.2
-1
-0.8
-0.6
-0.4
0.8 1 1.2 1.4 1.6 1.8 2 2.2logt
logl
og(C
0/(C
0-q t
m))
10mg/L
30mg/L
50mg/L
FIGURE 6 - Kinetic models of NO3--N adsorption on GFH (a)
pseudo-first-order kinetic plots (b) pseudo-second-order kinetic plots (c) Weber and Morris intra-particle diffusion plots (d) Bangham’s pore diffusion plots.
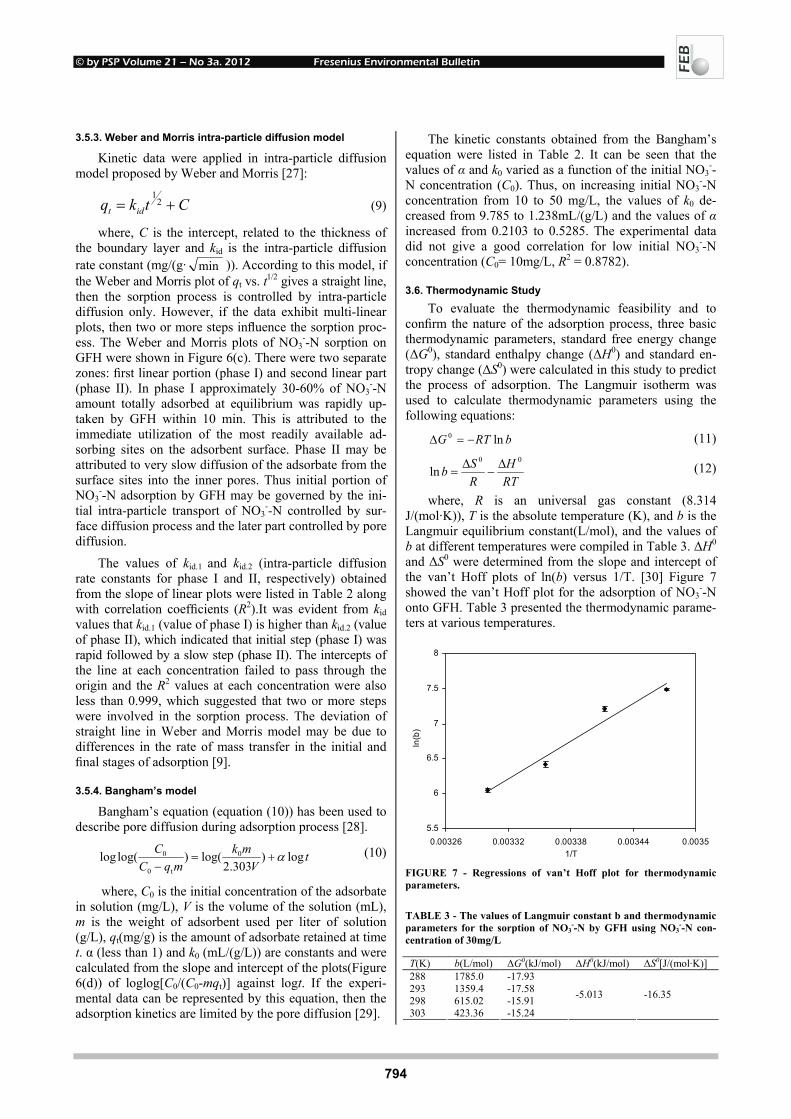
© by PSP Volume 21 – No 3a. 2012 Fresenius Environmental Bulletin
794
3.5.3. Weber and Morris intra-particle diffusion model
Kinetic data were applied in intra-particle diffusion model proposed by Weber and Morris [27]:
Ctkq idt += 21
(9)
where, C is the intercept, related to the thickness of the boundary layer and kid is the intra-particle diffusion rate constant (mg/(g· min )). According to this model, if the Weber and Morris plot of qt vs. t1/2 gives a straight line, then the sorption process is controlled by intra-particle diffusion only. However, if the data exhibit multi-linear plots, then two or more steps influence the sorption proc-ess. The Weber and Morris plots of NO3
--N sorption on GFH were shown in Figure 6(c). There were two separate zones: first linear portion (phase I) and second linear part (phase II). In phase I approximately 30-60% of NO3
--N amount totally adsorbed at equilibrium was rapidly up-taken by GFH within 10 min. This is attributed to the immediate utilization of the most readily available ad-sorbing sites on the adsorbent surface. Phase II may be attributed to very slow diffusion of the adsorbate from the surface sites into the inner pores. Thus initial portion of NO3
--N adsorption by GFH may be governed by the ini-tial intra-particle transport of NO3
--N controlled by sur-face diffusion process and the later part controlled by pore diffusion.
The values of kid.1 and kid.2 (intra-particle diffusion rate constants for phase I and II, respectively) obtained from the slope of linear plots were listed in Table 2 along with correlation coefficients (R2).It was evident from kid values that kid.1 (value of phase I) is higher than kid.2 (value of phase II), which indicated that initial step (phase I) was rapid followed by a slow step (phase II). The intercepts of the line at each concentration failed to pass through the origin and the R2 values at each concentration were also less than 0.999, which suggested that two or more steps were involved in the sorption process. The deviation of straight line in Weber and Morris model may be due to differences in the rate of mass transfer in the initial and final stages of adsorption [9].
3.5.4. Bangham’s model
Bangham’s equation (equation (10)) has been used to describe pore diffusion during adsorption process [28].
tV
mkmqC
C log)303.2
log()log(log 0
t0
0 α+=−
(10)
where, C0 is the initial concentration of the adsorbate in solution (mg/L), V is the volume of the solution (mL), m is the weight of adsorbent used per liter of solution (g/L), qt(mg/g) is the amount of adsorbate retained at time t. α (less than 1) and k0 (mL/(g/L)) are constants and were calculated from the slope and intercept of the plots(Figure 6(d)) of loglog[C0/(C0-mqt)] against logt. If the experi-mental data can be represented by this equation, then the adsorption kinetics are limited by the pore diffusion [29].
The kinetic constants obtained from the Bangham’s equation were listed in Table 2. It can be seen that the values of α and k0 varied as a function of the initial NO3
--N concentration (C0). Thus, on increasing initial NO3
--N concentration from 10 to 50 mg/L, the values of k0 de-creased from 9.785 to 1.238mL/(g/L) and the values of α increased from 0.2103 to 0.5285. The experimental data did not give a good correlation for low initial NO3
--N concentration (C0= 10mg/L, R2 = 0.8782).
3.6. Thermodynamic Study
To evaluate the thermodynamic feasibility and to confirm the nature of the adsorption process, three basic thermodynamic parameters, standard free energy change (∆G0), standard enthalpy change (∆H0) and standard en-tropy change (∆S0) were calculated in this study to predict the process of adsorption. The Langmuir isotherm was used to calculate thermodynamic parameters using the following equations:
bRTG ln0 −=∆ (11)
RTH
RSb
00
ln ∆−
∆= (12)
where, R is an universal gas constant (8.314 J/(mol·K)), T is the absolute temperature (K), and b is the Langmuir equilibrium constant(L/mol), and the values of b at different temperatures were compiled in Table 3. ∆H0 and ∆S0 were determined from the slope and intercept of the van’t Hoff plots of ln(b) versus 1/T. [30] Figure 7 showed the van’t Hoff plot for the adsorption of NO3
--N onto GFH. Table 3 presented the thermodynamic parame-ters at various temperatures.
5.5
6
6.5
7
7.5
8
0.00326 0.00332 0.00338 0.00344 0.00351/T
ln(b
)
FIGURE 7 - Regressions of van’t Hoff plot for thermodynamic parameters.
TABLE 3 - The values of Langmuir constant b and thermodynamic parameters for the sorption of NO3
--N by GFH using NO3--N con-
centration of 30mg/L
T(K) b(L/mol) ∆G0(kJ/mol) ∆H0(kJ/mol) ∆S0[J/(mol·K)] 288 1785.0 -17.93 293 1359.4 -17.58 298 615.02 -15.91 303 423.36 -15.24
-5.013 -16.35
© by PSP Volume 21 – No 3a. 2012 Fresenius Environmental Bulletin
795
The value of ∆H0 was -5.013 kJ/mol, Kara et al. [31] suggested that the ∆H0 of physisorption was smaller than 40 kJ/mol. Based on ∆H0, this study suggested that the ad-sorption of NO3
--N onto GFH was a physisorption process. Negative ∆H0 value suggested that the adsorption of NO3
--N onto GFH was exothermic, which fact was supported by the decrease in the adsorption of NO3
--N with the in-creasing of temperature. Moreover, the negative ∆S0 indi-cated that a decrease in randomness [32] at the solid-liquid interface during the adsorption of NO3
--N onto GFH. The ∆G0 values were negative at all of the tested temperatures (288-303K), confirming that the adsorption of NO3
--N onto GFH was spontaneous and thermodynamically favorable. Restated, a more negative ∆G0 implied a greater driving force of adsorption, resulting in a higher adsorption capac-ity. When the temperature decreased from 303 to 288K, ∆G0 became a high negative value, suggesting that ad-sorption was more spontaneous at low temperature. Gen-erally, ∆G0 for physisorption is less than that for chemi-sorption. The former is between -20 and 0 kJ/mol and the latter is between -80 and -400 kJ/mol [30]. Therefore, the ∆G0 results implied that physisorption might dominate the adsorption of NO3
--N onto GFH. 4. CONCLUSIONS
The present study showed that it was possible to utilize granular ferric hydroxide as an adsorbent to remove NO3
--N from aqueous solution. The adsorption capacity of GFH for NO3
--N was 4.254mg/g at 298K. The removal process was highly relevant with pH and the best results were obtained at pH 5. The equilibrium data fitted better to a Langmuir model, indicating monolayer nature of NO3
--N sorption onto GFH. The kinetic data followed pseudo-second-order kinetics, and intra-particle diffusion played a major role in the adsorption process. The sorption of NO3
--N onto GFH was found to be a two steps process: the first step may be attributed to the transport of NO3
--N by surface diffusion and the second step was controlled by pore diffusion. The process was thermodynamically fa-vourable, spontaneous, exothermic and physisorption in nature. Experimental data can be further used to guide and optimize pilot scale experiments that can enable the com-mercial exploitation of GFH for NO3
--N removal from drinking water and regeneration of wastewater with low NO3
--N concentration. ACKNOWLEDGEMENTS
This work was supported by the National Natural Science Foundation of China (40102027, 50578151), the Beijing Natural Science Foundation Project (8052017, 8092025), the Beijing Municipal Education Commission School-Enterprise Cooperation Projects (51900265005) and the National Water Pollution Control and Management Major Project of China (2009ZX07419, 2009ZX07207).
REFERENCES
[1] Bhatnagar, A. and Sillanpää, M. (2011) A review of emerging adsorbents for nitrate removal from water. Chem. Eng. J. 168 (2), 493-504.
[2] Ozturk, N. and Bektas, T.E. (2004) Nitrate removal from aqueous solution by adsorption onto various materials. J. Hazard. Mater. 112 (1-2), 155-162.
[3] Bhatnagar, A., Ji, M., Choi, Y.H., Jung, W., Lee, S.H., Kim, S.J., Lee, G., Suk, H., Kim, H.S., Min, B., Kim, S.H., Jeon, B.H. and Kang, J.W.(2008) Removal of nitrate from water by adsorption onto zinc chloride treated activated carbon. Sep. Sci. Technol. 43 (4), 886-907.
[4] Xi, Y.F., Mallavarapu, M. and Naidu, R. (2010) Preparation, characterization of surfactants modified clay minerals and ni-trate adsorption. Appl. Clay Sci. 48(1-2), 92-96.
[5] Hosni, K. and Srasra, E. (2008) Nitrate adsorption from aqueous solution by MII-Al-CO3 layered double hydroxide. Inorg. Mater. 44 (7),742-749.
[6] Orlando, U.S., Baes, A.U., Nishijima, W. and Okada, M. (2002) A new procedure to produce lignocellulosic anion ex-changers from agricultural waste materials. Bioresour. Tech-nol. 83 (3), 195-198.
[7] Wang, Y., Gao, B.Y., Yue, W.W. and Yue, Q.Y. (2007) Prepa-ration and utilization of wheat straw anionic sorbent for the removal of nitrate from aqueous solution. J. Environ. Sci. 19 (11), 1305-1310.
[8] Cengeloglu, Y., Tor, A., Ersoz, M. and Arslan, G. (2006) Re-moval of nitrate from aqueous solution by using red mud. Sep. Purif. Technol. 51(3), 374-378.
[9] Kumar, E., Bhatnagar, A., Ji, M., Jung, W., Lee, S.H., Kim, S.J., Lee, G., Song, H., Choi, J.Y., Yang, J.S. and Jeon, B.H. (2009) Defluoridation from aqueous solutions by granular ferric hydroxide (GFH).Water Res., 43 (2), 490-498.
[10] Bhatnagar, A., Choi, Y.H., Yoon, Y., Shin, Y., Jeon, B.H. and Kang, J.W. (2009) Bromate removal from water by granular ferric hydroxide (GFH). J. Hazard. Mater. 170 (1), 134-140.
[11] Driehaus, W., Jekel, M. and Hildebrandt, U. (1998) Granular ferric hydroxide-a new adsorbent for the removal of arsenic from natural water. J. Water SRT-Aqua. 47, 30-35.
[12] Ernst, M., Sperlich, A., Zheng, X., Gan, Y., Hu, J., Zhao, X., Wang, J. and Jekel, M. (2007) An integrated wastewater treatment and reuse concept for the Olympic Park 2008, Bei-jing. Desalinati. 202 (1-3), 293-301.
[13] Genz, A., Baumgarten, B., Goernitz, M. and Jekel, M. (2008) NOM removal by adsorption onto granular ferric hydroxide: equilibrium, kinetics, filter and regeneration studies. Water Res.42 (1-2), 238-248.
[14] CESP (2002) Standard Methods for the Examination of Wa-ter and Wastewater, thirded., Beijing, 258-268.
[15] Chu, K.H. (2002) Removal of copper from aqueous solution by chitosan in prawn shell: adsorption equilibrium and kinet-ics. J. Hazard. Mater. 90(1), 77-95.
[16] Hansel, C.M., Wielinga, B.W. and Fendorf, S. (2003) Struc-tural and compositional evolution of Cr/ Fe solids after indi-rect chromate reduction by dissimilatory iron-reducing bacte-ria. Geochim. Cosmochim. Acta.67 (3), 401-412.

© by PSP Volume 21 – No 3a. 2012 Fresenius Environmental Bulletin
796
[17] Banerjee, K., Amy G. L., Prevost M., Nour S., Jekel M., Gal-lagher P. M. and Blumenschein C. D. (2008)Kinetic and thermodynamic aspects of adsorption of arsenic onto granular ferric hydroxide (GFH).Water Res. 42(13),3371-3378.
[18] Babel, S. and Kurniawan, T.A. (2003) Low-cost adsorbents for heavy metals uptake from contaminated water: a review. J. Hazard. Mater. 97 (1-3), 219-243.
[19] Aksu, Z. (2005) Application of biosorption for the removal of organic pollutants: a review. Process Biochem. 40(3-4), 997-1026.
[20] Sawalha, M.F., Peralta-Videa, J.R., Romero-Gonzalez, J. and Gardea-Torresdey, J.L. (2006) Biosorption of Cd(II), Cr(III) and Cr(VI) by saltbush (Atriplex canescens) biomass: ther-modynamic and isotherm studies. J. Colloid Interf. Sci., 300(1), 100-104.
[21] Hall, K.R., Eagleton, L.C., Acrivos, A. and Vermeulen, T. (1966) Pore- and solid-diffusion kinetics in fixed-bed adsorp-tion under constant-pattern conditions. Ind. Eng. Chem. Fun-dam. 5 (2), 212-223.
[22] Safarikova M., Pona B. M. R., Mosiniewicz-Szablewska E. Weyda F. and Safarik I. (2008) Dye adsorption on magneti-cally modified chlorella vulgaris cells. Fresen. Environ. Bull. 17(4), 486-492.
[23] Mohapatra, M., Khatun, S. and Anand, S. (2009) Kinetics and thermodynamics of lead (II) adsorption on lateritic nickel ores of Indian origin. Chem. Eng. J. 155(1-2), 184-190.
[24] Lagergren, S. (1898) Zur Theorie der sogenannten Adsorp-tion gelöster Stoffe. Kungliga SVenska Vetenskapsa-kademiens, Handlingar. 24(4), 1-39.
[25] Chen, N., Zhang, Z.Y., Feng, C.P; Li, M., Chen, R.Z. and Su-giura, N. (2010) Removal of fluoride from aqueous solution by adsorption onto Kanuma mud. Water Sci. Technol. 62 (8), 1888-1897.
[26] Ho, Y. S. and McKay, G. (1999) Pseudo-second-order model for sorption processes. Process Biochem. 34 (5), 451-465.
[27] Weber, W.J. and Morris, J.C. (1963) Kinetics of adsorption on carbon from solution. J. Sanit. Eng. Div. Am. Soc. Civ. Eng. 89(2), 31-60.
[28] Aharoni, C. and Ungarish, M. (1977) Kinetics of activated chemisorption. Part 2-theoretical models. J. Chem. Soc. 73,456-464.
[29] Tutem, E., Apak, R. and Unal, C.F. (1998) Adsorptive re-moval of chlorophenols from water by bituminous shale. Wa-ter Res. 32(8), 2315-2324.
[30] Wu, C.H. (2007) Adsorption of reactive dye onto carbon nanotubes: Equilibrium, kinetics and thermodynamics. J. Hazard. Mater. 144(1-2), 93-100.
[31] Kara, M., Yuzer, H., Sabah, E. and Celik, M.S. (2003) Ad-sorption of cobalt from aqueous solutions onto sepiolite. Wa-ter Res. 37(1), 224-232.
[32] Tang, S., Yang, Q., Shang, H.T. and Sun, T. (2010) Removal of nitrate by autosulfurotrophic denitrifying bacteria: optimi-zation, kinetics and thermodynamics study. Fresen. Environ. Bull. 19(12b), 3193-3198.
Received: September 27, 2011 Revised: November 02, 2011 Accepted: November 04, 2011 CORRESPONDING AUTHOR
Qi Yang School of Water Resources and Environment China University of Geosciences (Beijing) Xueyuan Road No. 29 100083 Beijing P.R. CHINA Phone.: 86-10-82320291 Fax: 86-10-82321081 E-mail: [email protected]
FEB/ Vol 21/ No 3a/ 2012 – pages 789 - 796

© by PSP Volume 21 – No 3a. 2012 Fresenius Environmental Bulletin
797
SUBJECT INDEX
A acetaldehyde 685 acetylsalicylic acid 685 activated charcoal 755 acute toxicity 748 adsorption capacity 713 adsorption isotherm 789 air sample 755 air-drying 672 alkaline phosphatase activity 672 amino acid synthesis 665 ammonium assimilation 665 analysis 755 apoptosis 769 arsenate 713 ascorbate peroxidase 743 aspirin 685
B Bacillus megaterium 704 β-D-glucosidase 723 bioaccumulation 748 bioaccumulation 761 braided river 774 Brassica napus L. 761
C cadmium 665 cadmium 695 chloride 755 chloroplast pigments 723 contamination 748 Cr(III) 761
D Dabaoshan mine 695 dairy wastewater 736 dispersion modeling 781 Drosophila melanogaster 685
E earthworms 748 Eisenia fetida 748 empirical equation 774 endocrine disrupting compounds 731 enzymes 665 equilibrium phosphorus concentration 672 estrogenic activity 731 exposure 781
F fecundity 685 fertility 685 filamentous cyanobacteria 679 fish 769
F flavonoids 723 flow cytometry 679 FT-IR spectroscopy 713
G granular ferric hydroxide 789
H heavy metal 769 hematotoxicity 769 human health 695
I invertase 723 isolation buffers 679 Istanbul 781
K kinetics 789
L lake sediment 672 landfill VOC 781 lipid peroxidation 743 longitudinal dispersion 774
M methodology 679
N nitrate removal 789 nitrogen fertilization 665 nitrogen 736 nodule 704
O organic matter 672
P peroxidase 743 phenolic 723 phosphate 713 phosphorus sorption 672 phosphorus 736 photocatalysis 731 photosynthetic pigments 761 polycyclic aromatic hydrocarbons 748 poly-β-hydroxybutyrate (PHB) 704 probability analysis 781 production characteristics 761 proliferation 769
R red mud 713
© by PSP Volume 21 – No 3a. 2012 Fresenius Environmental Bulletin
798
R risk assessment 695 16S rRNA 704
S secondary effluent 731 selenium 743 sequential indicator simulation 695 solubilization 736
T thermal analysis 713 thermodynamics 789 titanium dioxide 731
U ultrasonic wave irradiation 736
V VITEK2 system 704
subject-index
AUTHOR INDEX
A Afef, Nasraoui Hajaji 665 Aghdam, Alireza Mohamadi 736 Akbulut, Gulcin Beker 743 Azevedo, Raquel 679
B Bayram, Dilek 743 Bednářová, Ivana 748 Beklová, Miroslava 748 Blaško, Jaroslav 761
C Cao, Xiu-Yun 672 Castaldi, Paola 713 Chiraz, Chaffei-Haouari 665 Chu, Ke-jian 774
D Deiana, Salvatore 713 Demir, Selami 781
E Ercan, Ozgen 755
F Figueiredo, Daniela 679
G Garau, Giovanni 713 Gok, Yetkin 743 Gu, Li 774
H Habib, Ghorbel Mohamed 665 Houda, Gouia 665 Houda, Maaroufi Dghimi 665 Hua, Zu-lin 774 Huo, Lei 789
K Karaboz, Ismail 704 Karataş, Ayla 685 Keser, Duygu 685 Kondera, Elżbieta 769 Kráľová, Katarína 761 Kubiś, Jan 723 Kuzu, S. Levent 781
L Li, Guoping 731 Li, Yi 731
M Mao, Kai 731

© by PSP Volume 21 – No 3a. 2012 Fresenius Environmental Bulletin
799
M Mehrdadi, Nasser 736
O Omeroglu, Esra Ersoy 704 Ozyildiz, Figen 704
P Peixoto, Francisco 679 Peško, Matúš 761
Q Qin, Jianqiao 695
R Rodriguez, Eleazar 679 Rybus-Zając, Magdalena 723
S Santos, Conceição 679
Saral, Arslan 781 Shang, Haitao 789 Shen, Shili 695 Silvetti, Margherita 713 Song, Chun-Lei 672 Štilárková, Edita 748 Stoupalová, Michaela 748
V Vávrová, Milada 748
W Witeska, Małgorzata 769 Wu, Dan 774
X Xia, Beicheng 695 Xiao, Wen-Juan 672
Y Yang, Qi 789 Yasini, Azadeh Aghajani 736 Yigit, Emel 743
Z Zahedi, Ali 736 Zhang, Wenlong 731 Zhao, Huarong 695 Zhao, Peng 695 Zhou, Xu 695 Zhou, Yi-Yong 672
author-index
Copyright © 2022 FDOKUMEN