Los Alamos processes Pu-238 materials for both defense-related ...
15
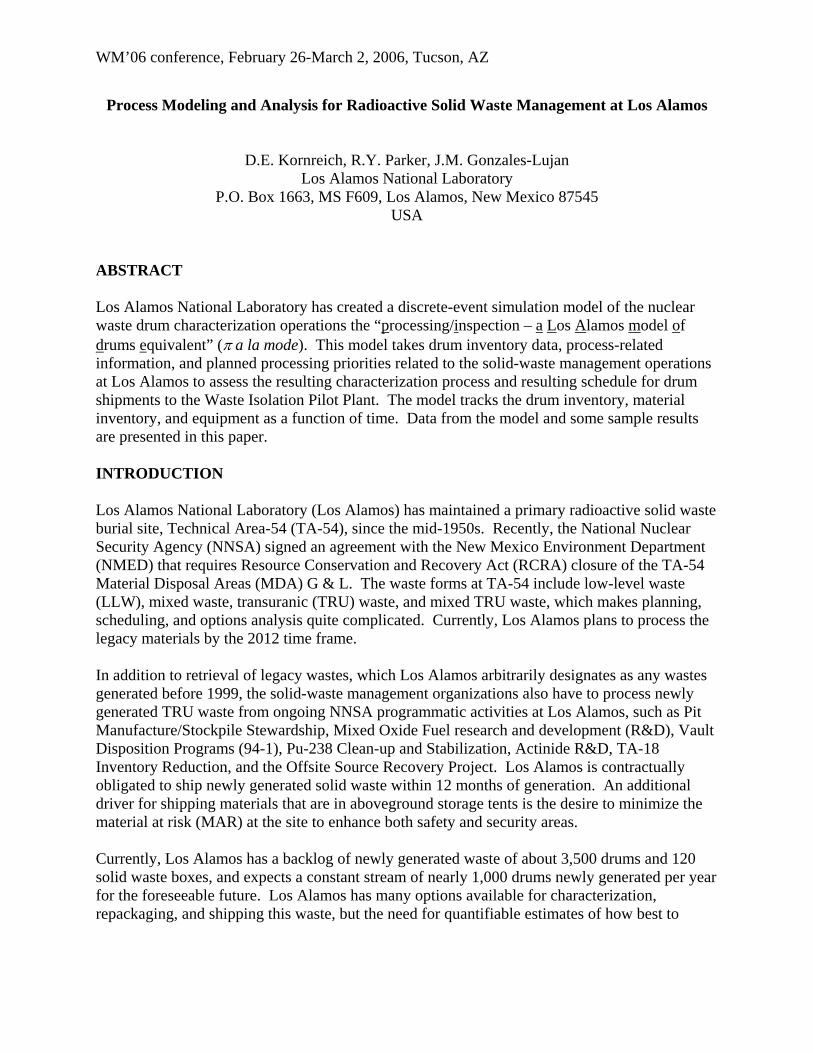
WM’06 conference, February 26-March 2, 2006, Tucson, AZ Process Modeling and Analysis for Radioactive Solid Waste Management at Los Alamos D.E. Kornreich, R.Y. Parker, J.M. Gonzales-Lujan Los Alamos National Laboratory P.O. Box 1663, MS F609, Los Alamos, New Mexico 87545 USA ABSTRACT Los Alamos National Laboratory has created a discrete-event simulation model of the nuclear waste drum characterization operations the “p rocessing/i nspection – a L os A lamos m odel o f d rums e quivalent” (π a la mode). This model takes drum inventory data, process-related information, and planned processing priorities related to the solid-waste management operations at Los Alamos to assess the resulting characterization process and resulting schedule for drum shipments to the Waste Isolation Pilot Plant. The model tracks the drum inventory, material inventory, and equipment as a function of time. Data from the model and some sample results are presented in this paper. INTRODUCTION Los Alamos National Laboratory (Los Alamos) has maintained a primary radioactive solid waste burial site, Technical Area-54 (TA-54), since the mid-1950s. Recently, the National Nuclear Security Agency (NNSA) signed an agreement with the New Mexico Environment Department (NMED) that requires Resource Conservation and Recovery Act (RCRA) closure of the TA-54 Material Disposal Areas (MDA) G & L. The waste forms at TA-54 include low-level waste (LLW), mixed waste, transuranic (TRU) waste, and mixed TRU waste, which makes planning, scheduling, and options analysis quite complicated. Currently, Los Alamos plans to process the legacy materials by the 2012 time frame. In addition to retrieval of legacy wastes, which Los Alamos arbitrarily designates as any wastes generated before 1999, the solid-waste management organizations also have to process newly generated TRU waste from ongoing NNSA programmatic activities at Los Alamos, such as Pit Manufacture/Stockpile Stewardship, Mixed Oxide Fuel research and development (R&D), Vault Disposition Programs (94-1), Pu-238 Clean-up and Stabilization, Actinide R&D, TA-18 Inventory Reduction, and the Offsite Source Recovery Project. Los Alamos is contractually obligated to ship newly generated solid waste within 12 months of generation. An additional driver for shipping materials that are in aboveground storage tents is the desire to minimize the material at risk (MAR) at the site to enhance both safety and security areas. Currently, Los Alamos has a backlog of newly generated waste of about 3,500 drums and 120 solid waste boxes, and expects a constant stream of nearly 1,000 drums newly generated per year for the foreseeable future. Los Alamos has many options available for characterization, repackaging, and shipping this waste, but the need for quantifiable estimates of how best to
-
Upload
khangminh22 -
Category
Documents
-
view
1 -
download
0
Transcript of Los Alamos processes Pu-238 materials for both defense-related ...
WM’06 conference, February 26-March 2, 2006, Tucson, AZ
Process Modeling and Analysis for Radioactive Solid Waste Management at Los Alamos
D.E. Kornreich, R.Y. Parker, J.M. Gonzales-Lujan Los Alamos National Laboratory
P.O. Box 1663, MS F609, Los Alamos, New Mexico 87545 USA
ABSTRACT Los Alamos National Laboratory has created a discrete-event simulation model of the nuclear waste drum characterization operations the “processing/inspection – a Los Alamos model of drums equivalent” (π a la mode). This model takes drum inventory data, process-related information, and planned processing priorities related to the solid-waste management operations at Los Alamos to assess the resulting characterization process and resulting schedule for drum shipments to the Waste Isolation Pilot Plant. The model tracks the drum inventory, material inventory, and equipment as a function of time. Data from the model and some sample results are presented in this paper. INTRODUCTION Los Alamos National Laboratory (Los Alamos) has maintained a primary radioactive solid waste burial site, Technical Area-54 (TA-54), since the mid-1950s. Recently, the National Nuclear Security Agency (NNSA) signed an agreement with the New Mexico Environment Department (NMED) that requires Resource Conservation and Recovery Act (RCRA) closure of the TA-54 Material Disposal Areas (MDA) G & L. The waste forms at TA-54 include low-level waste (LLW), mixed waste, transuranic (TRU) waste, and mixed TRU waste, which makes planning, scheduling, and options analysis quite complicated. Currently, Los Alamos plans to process the legacy materials by the 2012 time frame. In addition to retrieval of legacy wastes, which Los Alamos arbitrarily designates as any wastes generated before 1999, the solid-waste management organizations also have to process newly generated TRU waste from ongoing NNSA programmatic activities at Los Alamos, such as Pit Manufacture/Stockpile Stewardship, Mixed Oxide Fuel research and development (R&D), Vault Disposition Programs (94-1), Pu-238 Clean-up and Stabilization, Actinide R&D, TA-18 Inventory Reduction, and the Offsite Source Recovery Project. Los Alamos is contractually obligated to ship newly generated solid waste within 12 months of generation. An additional driver for shipping materials that are in aboveground storage tents is the desire to minimize the material at risk (MAR) at the site to enhance both safety and security areas. Currently, Los Alamos has a backlog of newly generated waste of about 3,500 drums and 120 solid waste boxes, and expects a constant stream of nearly 1,000 drums newly generated per year for the foreseeable future. Los Alamos has many options available for characterization, repackaging, and shipping this waste, but the need for quantifiable estimates of how best to

WM’06 conference, February 26-March 2, 2006, Tucson, AZ
support this workload and meet deadlines has driven the interest in constructing a simulation of these operations. Los Alamos National Laboratory is currently processing the legacy wastes at Technical Area (TA)-54 and the newly generated waste streams, characterizing and certifying the drums (repackaging where needed), and shipping the wastes to the Waste Isolation Pilot Plant (WIPP) or to other appropriate waste disposal sites. To support the planning of these operations, both in terms of throughput and safety analysis, Los Alamos has initiated an effort to establish a high-level discrete-event process simulation model of the waste characterization and certification operations. Los Alamos has used process models in the past to support analysis of facility throughputs and operating characteristics, several of which have been of interest to the materials disposition and waste management communities [1,2,3]. Several years ago, a model of the TRU drum processing operation was constructed using Extend™ [4]. This paper described an initial mode of the waste drum handling procedure, with a focus on estimating the cost and capacity of the various flowsheet components for dispositioning drums to WIPP. Use of that model was discontinued shortly afterward. Recently, personnel associated with the solid waste management operations constructed a detailed spreadsheet model of the process; however, because of the complexity of the flowsheet, including several feedback loops, it was decided to pursue a modeling effort using a tool better suited for such an analysis. The spreadsheet model will still prove valuable as an analysis and verification tool. SIMULATION MODELS Discrete-event simulation modeling is used in several industries such as automobile and silicon microchip manufacturing and in transportation analyses. Only in the past several years has there been a significant effort to use such tools for analysis of operations involving nuclear materials. Some of the advantages of using a discrete-event simulation over a more simplistic spreadsheet model include the ability to explicitly include stochastic processes and schedules in the model as well as recycle and failure loops for which a deterministic spreadsheet model is inadequate. They are especially useful when examining system behavior at large throughput rates, where component interactions can become problematic for simpler models. One of the primary simulation tools that we use at Los Alamos, Extend™ (version 6), is a discrete-event-capable package that uses a graphical object-based interface. The structure of an Extend™ model is manipulated through a graphical interface that contains icons representing the functions of the process being modeled. Extend™ has the capability of imbedding its components hierarchically, so that complex functions can be displayed as visually simple model components. The icons, commonly called “blocks,” require input such as process time, scheduled downtime information, unscheduled downtime information (e.g., breakdowns), and item flow information. In addition, Extend™ uses an attribute system where material form and mass can be tracked through the system. As mentioned above, process models are used in many industries, and developing the models that can perform a mass balance is of particular interest to nuclear materials processing operations. We have used Extend™ for modeling many nuclear-materials operations at Los Alamos, including weapon-component production [5] and analysis for the mixed-oxide fuels lead-test-assembly fabrication [6].
WM’06 conference, February 26-March 2, 2006, Tucson, AZ
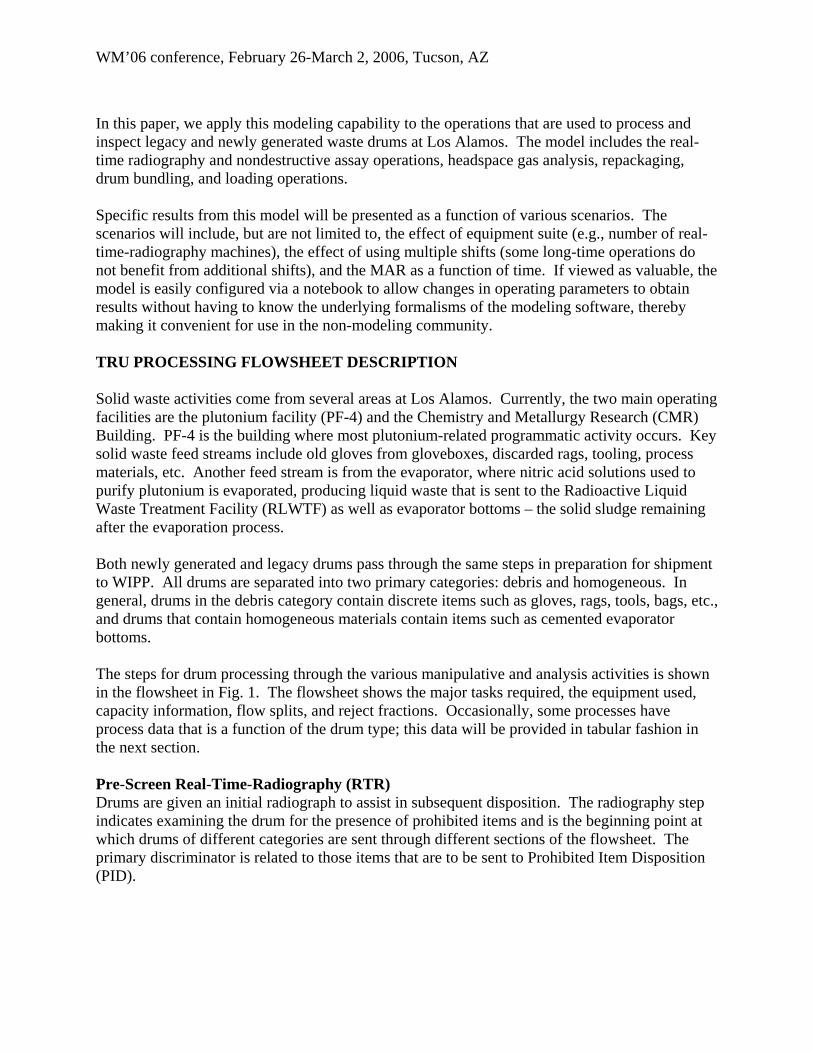
In this paper, we apply this modeling capability to the operations that are used to process and inspect legacy and newly generated waste drums at Los Alamos. The model includes the real-time radiography and nondestructive assay operations, headspace gas analysis, repackaging, drum bundling, and loading operations. Specific results from this model will be presented as a function of various scenarios. The scenarios will include, but are not limited to, the effect of equipment suite (e.g., number of real-time-radiography machines), the effect of using multiple shifts (some long-time operations do not benefit from additional shifts), and the MAR as a function of time. If viewed as valuable, the model is easily configured via a notebook to allow changes in operating parameters to obtain results without having to know the underlying formalisms of the modeling software, thereby making it convenient for use in the non-modeling community. TRU PROCESSING FLOWSHEET DESCRIPTION Solid waste activities come from several areas at Los Alamos. Currently, the two main operating facilities are the plutonium facility (PF-4) and the Chemistry and Metallurgy Research (CMR) Building. PF-4 is the building where most plutonium-related programmatic activity occurs. Key solid waste feed streams include old gloves from gloveboxes, discarded rags, tooling, process materials, etc. Another feed stream is from the evaporator, where nitric acid solutions used to purify plutonium is evaporated, producing liquid waste that is sent to the Radioactive Liquid Waste Treatment Facility (RLWTF) as well as evaporator bottoms – the solid sludge remaining after the evaporation process. Both newly generated and legacy drums pass through the same steps in preparation for shipment to WIPP. All drums are separated into two primary categories: debris and homogeneous. In general, drums in the debris category contain discrete items such as gloves, rags, tools, bags, etc., and drums that contain homogeneous materials contain items such as cemented evaporator bottoms. The steps for drum processing through the various manipulative and analysis activities is shown in the flowsheet in Fig. 1. The flowsheet shows the major tasks required, the equipment used, capacity information, flow splits, and reject fractions. Occasionally, some processes have process data that is a function of the drum type; this data will be provided in tabular fashion in the next section. Pre-Screen Real-Time-Radiography (RTR) Drums are given an initial radiograph to assist in subsequent disposition. The radiography step indicates examining the drum for the presence of prohibited items and is the beginning point at which drums of different categories are sent through different sections of the flowsheet. The primary discriminator is related to those items that are to be sent to Prohibited Item Disposition (PID).

WM’06 conference, February 26-March 2, 2006, Tucson, AZ
Rate: 30 drums/shift
Equip: RTR
Pre-Screen Real-Time Rad. (RTR)
WM-TRU-001
Rate: 30 drums/shift
Equip: Manual
Replace Filter
WM-TRU-002
Rate: N drums/shift
Equip: Manual
Prohibited Item Disposition (PID)/
repackaging
WM-TRU-003
Rate: 50 drums/shift
Equip: Counters
Pre-Screen Nondestructive
Assay (NDA)
WM-TRU-004
Rate: 20 drums/shift
Equip: RTR
Carlsbad Central Char. Project
(CCP)-RTR
WM-TRU-005
Rate: 30 drums/shift
Equip: Counters
CCP-NDA
WM-TRU-006
Rate: 30 drums/shift
Equip: Visual
Visual Examination (VE)
Determination
WM-TRU-008
Rate: 30 drums/shift
Equip: HSG
Los Alamos Headspace Gas (HSG) Analysis
WM-TRU-007
Rate: 30 drums/shift
Equip: Computer
CCP Certification (hold for
paperwork)
WM-TRU-009
Rate: 30 drums/shift
Equip: RTR
Drum Bundling
WM-TRU-010
1% reject
2% reject5% reject
1% reject1% reject
~2% return for VE (PID rate = 2 drums/shift)
Post VE Return
Y%
Fig. 1. Radioactive solid waste drum processing/inspection flowsheet
X%
Z%
LLW
5% 5%
MMnT
Y% to PID:High 238 = 100%Other Debris: Legacy or QTW = 95%, NG = 40%Homogeneous: Legacy or QTW = 30%, NG = 20%
X% to Replace Filter:10% of what does not go to PID goes to Replace Filter
Z% to Pre-NDA:Everything else
3 mixed-measureable, nonTRU (MMnT) drums are bundled with 1 other drum of same waste type into an SWB
(4% MLLW, 1% LLW) (5% MLLW)
Rate: varies
Equip: Station
Waste Loading
WM-TRU-011
Others
QTW
QTW
Others
WM’06 conference, February 26-March 2, 2006, Tucson, AZ
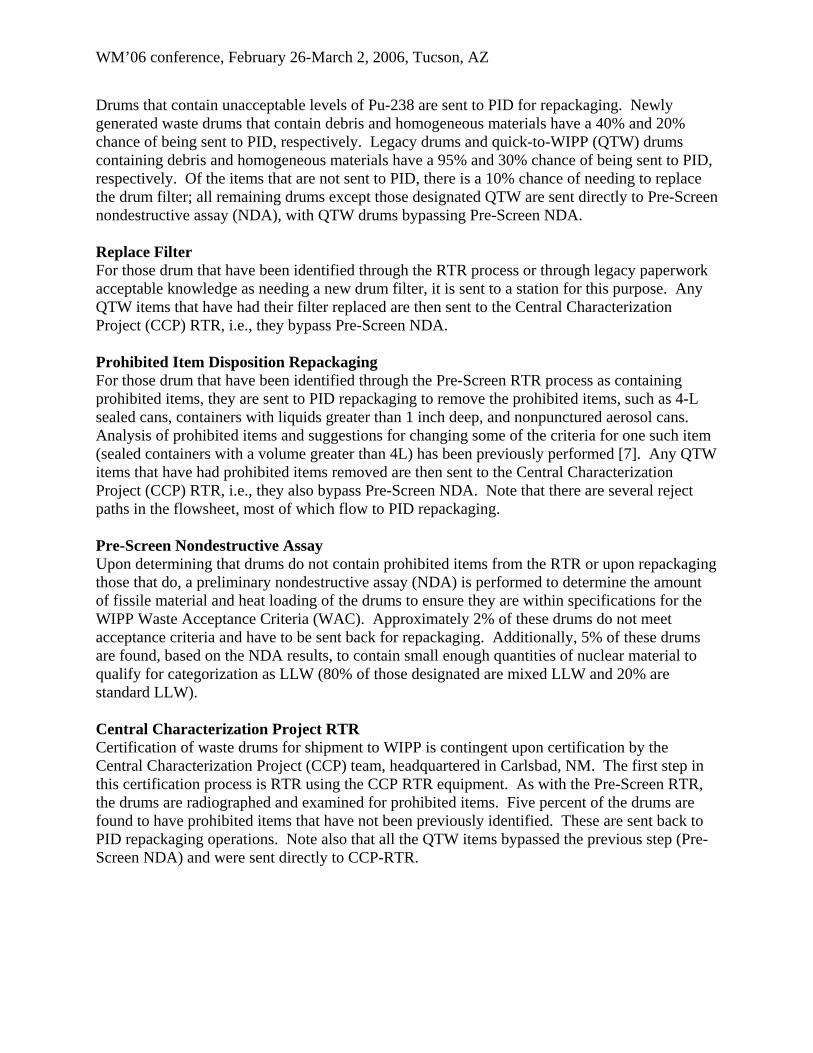
Drums that contain unacceptable levels of Pu-238 are sent to PID for repackaging. Newly generated waste drums that contain debris and homogeneous materials have a 40% and 20% chance of being sent to PID, respectively. Legacy drums and quick-to-WIPP (QTW) drums containing debris and homogeneous materials have a 95% and 30% chance of being sent to PID, respectively. Of the items that are not sent to PID, there is a 10% chance of needing to replace the drum filter; all remaining drums except those designated QTW are sent directly to Pre-Screen nondestructive assay (NDA), with QTW drums bypassing Pre-Screen NDA. Replace Filter For those drum that have been identified through the RTR process or through legacy paperwork acceptable knowledge as needing a new drum filter, it is sent to a station for this purpose. Any QTW items that have had their filter replaced are then sent to the Central Characterization Project (CCP) RTR, i.e., they bypass Pre-Screen NDA. Prohibited Item Disposition Repackaging For those drum that have been identified through the Pre-Screen RTR process as containing prohibited items, they are sent to PID repackaging to remove the prohibited items, such as 4-L sealed cans, containers with liquids greater than 1 inch deep, and nonpunctured aerosol cans. Analysis of prohibited items and suggestions for changing some of the criteria for one such item (sealed containers with a volume greater than 4L) has been previously performed [7]. Any QTW items that have had prohibited items removed are then sent to the Central Characterization Project (CCP) RTR, i.e., they also bypass Pre-Screen NDA. Note that there are several reject paths in the flowsheet, most of which flow to PID repackaging. Pre-Screen Nondestructive Assay Upon determining that drums do not contain prohibited items from the RTR or upon repackaging those that do, a preliminary nondestructive assay (NDA) is performed to determine the amount of fissile material and heat loading of the drums to ensure they are within specifications for the WIPP Waste Acceptance Criteria (WAC). Approximately 2% of these drums do not meet acceptance criteria and have to be sent back for repackaging. Additionally, 5% of these drums are found, based on the NDA results, to contain small enough quantities of nuclear material to qualify for categorization as LLW (80% of those designated are mixed LLW and 20% are standard LLW). Central Characterization Project RTR Certification of waste drums for shipment to WIPP is contingent upon certification by the Central Characterization Project (CCP) team, headquartered in Carlsbad, NM. The first step in this certification process is RTR using the CCP RTR equipment. As with the Pre-Screen RTR, the drums are radiographed and examined for prohibited items. Five percent of the drums are found to have prohibited items that have not been previously identified. These are sent back to PID repackaging operations. Note also that all the QTW items bypassed the previous step (Pre-Screen NDA) and were sent directly to CCP-RTR.

WM’06 conference, February 26-March 2, 2006, Tucson, AZ
Central Characterization Project NDA Items that pass the CCP RTR analysis are then sent to the NDA operations for the CCP team. Neutron and gamma counters are used to determine the amount of fissile material and heat loading of the drums to ensure they are within specifications for the WIPP WAC. Approximately 1% of the drums do not meet NDA specifications and are sent to PID repackaging. Approximately 5% of these drums are found, based on the CCP-NDA results, to contain small enough quantities of nuclear material to qualify for categorization as mixed LLW. Los Alamos Headspace Gas Analysis The final physical examination of the drums is a headspace gas (HSG) analysis. A gas sample is taken from the drum and analyzed with a mass spectrometer to ensure the composition is such that excess gas is not present (pressurization hazard) or that radiolytic decomposition of organic materials is not appreciably contributing to the gas content of a drum. Approximately 1% of the drums do not pass the HSG analysis and are returned to the PID repackaging area. Note that the HSG sampling requirements, as they related to the drum age criteria (DAC), will change in October 2007. At this point, 25% of the drums that meet the DAC will need to be tested for HSG (as opposed to 100% at the beginning of the simulation). Visual Examination Determination About two percent of the drums need to be redirected back to repackaging as a required quality control measure. However, once these drums are repackaged, they do not need to perform the RTR and NDA steps again and are passed along in the flowsheet. Central Characterization Project Certification Essentially, this is a nonfunctional step where drums are held awaiting final paperwork from CCP that details the analyses that have been performed and certifies that drum meet the WIPP WAC and are ready for shipment. Drum Bundling Occasionally, drums of a specific category need to be bundled with other drums into a standard waste box (SWB) to meet the WIPP WAC. Specifically, mixed measurable nonTRU drums are held until another drum of the same type (debris or homogeneous) comes along, at which point they are bundled in a SWB and sent for transportation loading. All other drum types bypass this step and proceed to loading. Waste Loading The waste drums (and SWBs) are loaded into TRUPACT-IIs in a loading area awaiting shipment to WIPP. Π A LA MODE MODEL CONSTRUCTION A model of the waste processing activities is implemented in the discrete-event simulation package Extend™. The process model provides insight into many aspects of the waste characterization, certification, and loading process, such as performance sensitivity, process interdependencies, and trends. The model is organized hierarchically, with different functional areas “buried” at various levels of graphical detail. The model uses several underlying

WM’06 conference, February 26-March 2, 2006, Tucson, AZ
assumptions and inputs at each stage of the waste characterization and disposition process such as processing rates, equipment capacities, reject rates, downtime periods, and general work flow logic to represent the system. The model can be used to perform many different kinds of analyses and to quantify various metrics including:
• Material and mass balances, especially the amount of material that is above ground at a given time to support safety analyses (estimate of MAR);
• Equipment requirements (utilizations, bottlenecks, etc.); • Item inventories (within the constraints of the operating rules); • Reject quantities (measure of how many rejects result from inspection operations); • Effects of machine failures (on equipment requirements or throughput); and • Throughputs (items per unit time, cumulative item count, etc.).
Other DOE sites have used models of varying fidelity to simulate their solid waste activities. Some models are at a spreadsheet level and track individual drums by unique ID, thereby providing a status of waste disposal activities. A discrete-event model like that described here provides unique capability to execute a suite of scenarios on a more macroscopic level to gauge the effects of equipment downtime or increases in equipment efficiency. In tandem, it allows Los Alamos to estimate the requirement to meet a desired schedule or quantify the consequences of changing priorities, funding, or other resources (such as personnel). In the π a la mode model, we consider items as being in the form of “drums equivalent,” i.e., all items are considered to be drums and larger items are given a larger numerical weight to relate them to drums. The initial inventory for the model execution is provided in Table I. Note that there are effectively four categories, each of which is split into homogeneous and debris categories. Of the 19,695 (legacy) and 3,066 (inventory) items that are classified as debris, 2,000 items have been identified as QTW, i.e., that they have met requirements for QTW status and are set at a high priority for shipment, and of these 2,000 QTW items, 270 items have been identified, generally through historical documentation, as possibly containing unacceptable levels of Pu-238. Table I. Initial Drum-Equivalent Inventory for TRU Processing Model
Initial Inventory Category
Above Ground?
Number of Drums Equivalent
Nonretrieved Legacy-Debris Y 19,695 Nonretrieved Legacy-Homogeneous Y 10,370 Newly Generated Inventory-Debris Y 3,066 Newly Generated Inventory-Homogeneous Y 767 Retrieved Legacy-Debris (High Pu-238) N 9,179 (730) Retrieved Legacy-Homogeneous N 2,757 To-Be-Generated –Debris N/A 4,000 To-Be-Generated-Homogeneous N/A 1,000
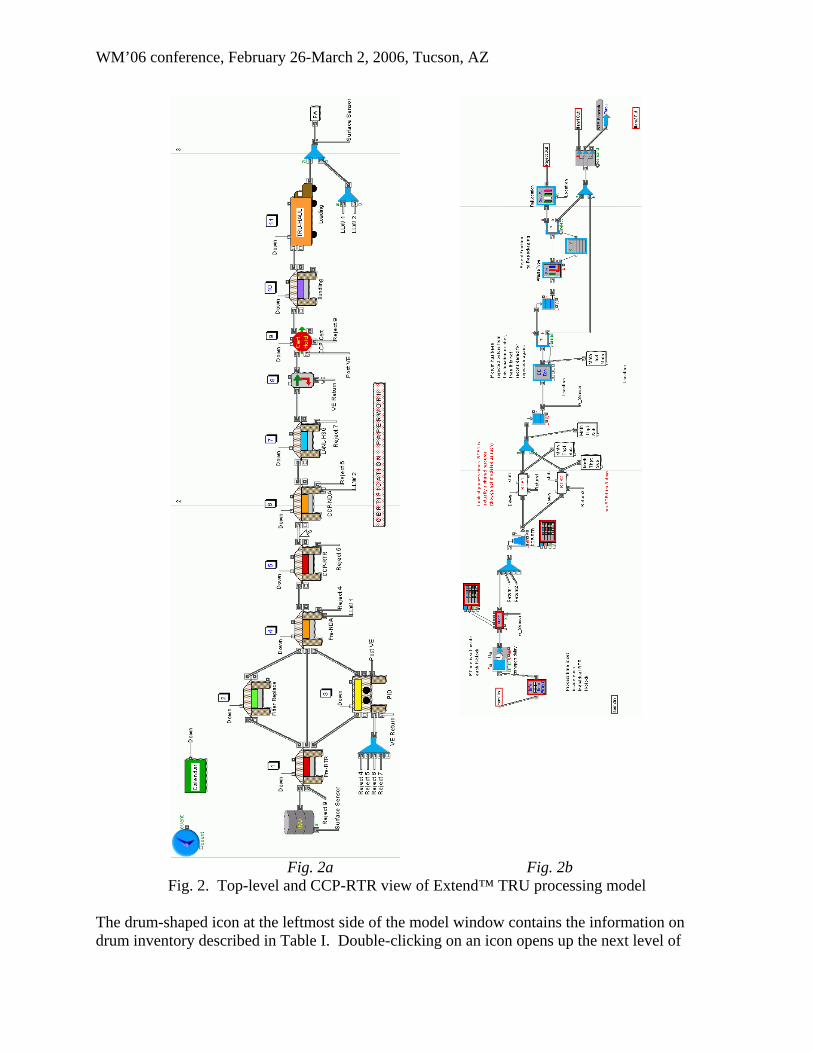
A view of the top-level Extend™ model is shown in Fig. 2a. The major steps in the flowsheet are shown as icons and item flow paths are shown as connectors between the icons.
WM’06 conference, February 26-March 2, 2006, Tucson, AZ
Fig. 2a Fig. 2b
Fig. 2. Top-level and CCP-RTR view of Extend™ TRU processing model The drum-shaped icon at the leftmost side of the model window contains the information on drum inventory described in Table I. Double-clicking on an icon opens up the next level of

WM’06 conference, February 26-March 2, 2006, Tucson, AZ
detail at which the actual modeling logic is housed. An example of this level is shown in Fig. 2b, which is the next level of detail for the CCP-RTR icon. This logic includes material flow/splits, calendar information, queues, combiners, equipment, downtime information, etc., i.e., all the information necessary for an accurate representation of the process being modeled. In the particular case of the CCP-RTR step, the two RTR instruments are seen in the middle of the flow paths as white boxes with the text “RTR1” and “RTR2”. These are actually hierarchical blocks that lead to further detailed modeling constructs. A primary capability of a discrete-event model is to analyze the time-varying throughput of the system. In addition, modeling tools like Extend™ allow time-varying equipment, source terms, etc. In the case of the π a la mode tool, we have both equipment and source streams that vary with time. Regarding equipment, some existing equipment is slated to be phased out while newer equipment is scheduled to be installed. The model assumes that all the equipment is available as a function of time according to the data provided in Table II. That is, some equipment in the model is not available at the beginning of the simulation, and some is removed from the simulation at a particular time. This models the purchase and startup of new equipment and the decommissioning of older equipment. Table II. Equipment as a Function of Time
Step # Items On Time Off Time Pre-Screen RTR 2 always -- Filter Replace 1 always -- PID Repackaging WCCR GB 1 start – 2 y 2 y – end WCCR walk-in 1 start – 2 y 2 y – end Permacon 224 1 always -- Permacon 231 1 always -- Mork 1 1 2y – end start – 2 y Mork 2 1 2y – end start – 2 y MOVER 1 16 mo – end start – 16 mo Pre-Screen NDA 3 always -- CCP-RTR 2 always -- CCP-NDA CCP HENC 1 always -- PTGS 1 start-10 mo 10 mo – end IQ3 1 13 mo – end start – 13 mo Los Alamos HENC 1 13 mo – end start – 13 mo Crate Counter 1 2 y – end start – 2 y Headspace Gas 1 always -- Visual Inspection 1 always -- Bundling 1 always -- Drum Loading RANT 1 start – 10 mo, 14 mo – end 10 mo – 14 mo Dome 375 1 10 mo – end start – 10 mo RANT Outdoor 1 always --
Most input for the model is organized to provide triangular distribution information if available, i.e., the user can specify minimum, maximum, and most likely values. In general, however, the nature of existing data is such that details like this are not available and therefore discrete process data is used by making the minimum, maximum, and most likely values equal. However, as the

WM’06 conference, February 26-March 2, 2006, Tucson, AZ
process matures, this data can be collected and input to the model to support stochastic analysis for schedule risk calculations. Most processes occur on a drum-by-drum basis with no significant batching taking place. Two exceptions are the HSG analysis, where batches of 60 drums are processed as a batch, and drum loading. In the loading operation, if drums have been placed into standard waste boxes (SWBs), each shipment will contain 6 SWBs. For QTW or High Pu-238 items, 20 drums/shipment are processed. For generic debris and homogeneous drums, there are 30 and 28 drums/shipment, respectively. Most processing rates for the individual processing steps are shown on the flowsheet; however, some processing rates are dependent on the machine being used or the type of drum being analyzed. Processing rates on the flowsheet are given in units of drums/shift, which is per equipment item. If there are addition pieces of equipment, like in Pre-Screen RTR, each RTR has a capacity of 30 drums/shift. To provide a more accurate representation of capacity and throughput, we have included equipment failure mechanisms and processing delays where data is available, either through an equipment surveillance program or from expert judgment. Without this equipment failure information, the model yields results that are more like maximum theoretical results. Because we want to determine realistic scheduling information, this feature is a valuable component of the model. Other general assumptions in the model include a two shift (8 h/shift) 6 day/w schedule for all operations in the flowsheet. Processing rates for the operations are shown in Table III. Additionally, the process model follows the certification paperwork through the system. At the completion of the CCP-RTR, CCP-NDA, HSG, and visual examinations, paperwork information moves into the “Certification Paperwork” block. This paperwork is combined to produce a final certification release package that is required before drum bundling or loading. In the top-level view of the model, there is a certification hold icon between visual inspection and bundling where this paperwork is combined with the drums to allow them to be shipped. Interestingly, we have data for the time it takes certification paperwork to be processed in the format necessary to support a triangular distribution. This data is provided in Table IV.

WM’06 conference, February 26-March 2, 2006, Tucson, AZ
Table III. Equipment Processing Rates
Task
Processing Rate [drums/shift]
Pre-Screen RTR 30 Filter Replacement 30 PID Repackaging WCCR GB 6 WCCR Walk-in 6 Permacon 224 10 Permacon 231 10 Mork 1 4.8 Mork 2 4.8 MOVER 2.4 From VE 2 Pre-Screen NDA 50 CCP-RTR 20 CCP-NDA CCP HENC 8 PTGS 5 IQ3 10 Los Alamos HENC 8 Crate Counter 1.5 Headspace Gas Analysis 1*
*HSG process includes a 72-h cook time for batches of 20-60 drums. Table IV. Certification Paperwork Processing Rates
Item
MIN Processing
Time [days]
Most Likely Processing
Time [days]
MAX Processing
Time [days] CCP-RTR Paperwork 4 7 14 CCP-NDA Paperwork 10 16 21 HSG Paperwork 4 10 17 VE Paperwork 4 9 16 Lot Evaluation 1 2 4 WWIS 1 2 4
SAMPLE RESULTS As mentioned, the π a la mode model is useful for tracking several important quantities such as drums through the system as a function of time, the amount of material above ground, queue lengths, etc. In this section, we provide some sample results of the model execution. From a safety perspective, we first consider the amount of material that is above ground. During the May 2000 Cerro Grande Fire at Los Alamos, one of the key concerns was that the fire might reach the above-ground storage areas for radioactive solid waste drums and resulting in a material dispersal. Based on current data, there is a very large amount of material above ground presently. This is a driving criterion for the Quick-to-WIPP program, by which we are prioritizing the removal of 2,000 of the drums that contain large amounts of material. The results
WM’06 conference, February 26-March 2, 2006, Tucson, AZ
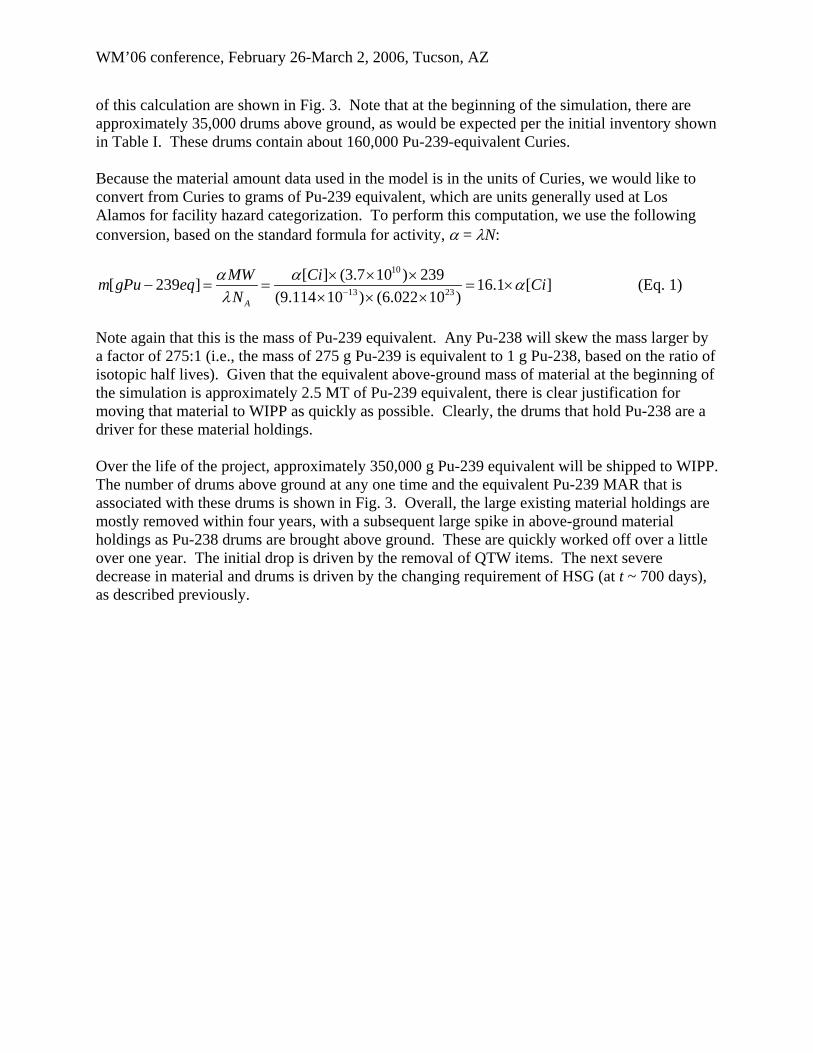
of this calculation are shown in Fig. 3. Note that at the beginning of the simulation, there are approximately 35,000 drums above ground, as would be expected per the initial inventory shown in Table I. These drums contain about 160,000 Pu-239-equivalent Curies. Because the material amount data used in the model is in the units of Curies, we would like to convert from Curies to grams of Pu-239 equivalent, which are units generally used at Los Alamos for facility hazard categorization. To perform this computation, we use the following conversion, based on the standard formula for activity, α = λN:
10
13 23
[ ] (3.7 10 ) 239[ 239 ] 16.1 [ ](9.114 10 ) (6.022 10 )A
MW Cim gPu eq CiN
α α αλ −
× × ×− = = = ×
× × × (Eq. 1)
Note again that this is the mass of Pu-239 equivalent. Any Pu-238 will skew the mass larger by a factor of 275:1 (i.e., the mass of 275 g Pu-239 is equivalent to 1 g Pu-238, based on the ratio of isotopic half lives). Given that the equivalent above-ground mass of material at the beginning of the simulation is approximately 2.5 MT of Pu-239 equivalent, there is clear justification for moving that material to WIPP as quickly as possible. Clearly, the drums that hold Pu-238 are a driver for these material holdings. Over the life of the project, approximately 350,000 g Pu-239 equivalent will be shipped to WIPP. The number of drums above ground at any one time and the equivalent Pu-239 MAR that is associated with these drums is shown in Fig. 3. Overall, the large existing material holdings are mostly removed within four years, with a subsequent large spike in above-ground material holdings as Pu-238 drums are brought above ground. These are quickly worked off over a little over one year. The initial drop is driven by the removal of QTW items. The next severe decrease in material and drums is driven by the changing requirement of HSG (at t ~ 700 days), as described previously.

WM’06 conference, February 26-March 2, 2006, Tucson, AZ
0
20000
40000
60000
80000
100000
120000
140000
160000
0
20000
40000
60000
80000
100000
120000
140000
160000
0 500 1000 1500 2000 2500 3000 3500 4000Time (days)
Pu-239 Equivalent - Ci
Drums-Equivalent
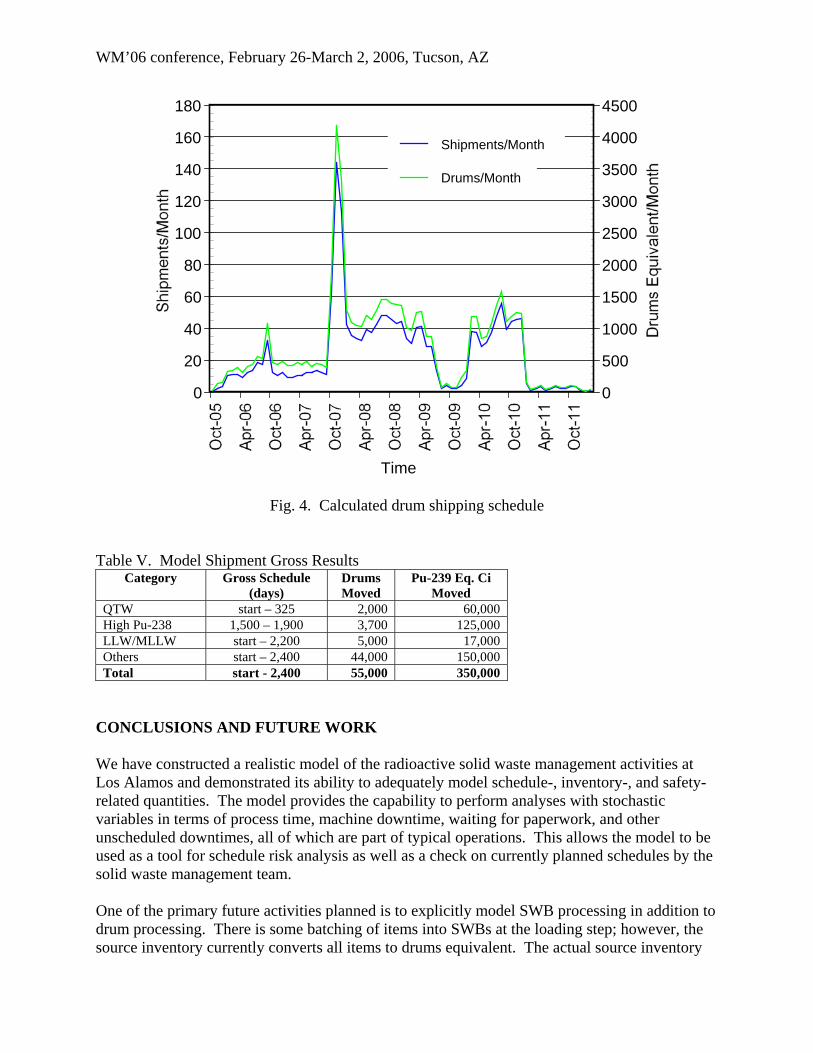
Fig. 3. MAR estimate for above-ground drums The overall shipment schedule, by shipments/month and the number of drums shipped per month is shown in Fig. 4. We have presumed that the start of shipment occurs in October 2005 for Fig. 4 (note that the other time scales are in days to allow an arbitrary start date). Note that initially, there are not very many shipments (10-20/mo), yet per Fig. 3 there is a sharp decline in the amount of aboveground material being shipped out. Again, this displays the large material holding of the few drums categories as QTW. This chart is also useful for planners to show the need for some load leveling. The current model estimates indicate that Los Alamos will need to support 120-140 shipments/month between October and December 2007, which is clearly unrealistic (as expected, this is the result of the reduction in HSG requirements beginning in October 2007). The remainder of the shipment schedule has about 40 shipments per month, which is slightly over one per day. This is still an aggressive campaign, but is within reason in terms of practicality. Thus, scheduling personnel should begin to examine means to eliminate this short-term spike is planned shipments. We have also proved a gross tabular summary of the major items of interest in Table V. We show, in days, the general time frame when drums of a specific category are being moved, the number of drums moved, and the amount of associated material moved.
WM’06 conference, February 26-March 2, 2006, Tucson, AZ
0
20
40
60
80
100
120
140
160
180
0
500
1000
1500
2000
2500
3000
3500
4000
4500
Time
Shipments/Month
Drums/Month
Fig. 4. Calculated drum shipping schedule Table V. Model Shipment Gross Results
Category Gross Schedule (days)
Drums Moved
Pu-239 Eq. Ci Moved
QTW start – 325 2,000 60,000 High Pu-238 1,500 – 1,900 3,700 125,000 LLW/MLLW start – 2,200 5,000 17,000 Others start – 2,400 44,000 150,000 Total start - 2,400 55,000 350,000
CONCLUSIONS AND FUTURE WORK We have constructed a realistic model of the radioactive solid waste management activities at Los Alamos and demonstrated its ability to adequately model schedule-, inventory-, and safety-related quantities. The model provides the capability to perform analyses with stochastic variables in terms of process time, machine downtime, waiting for paperwork, and other unscheduled downtimes, all of which are part of typical operations. This allows the model to be used as a tool for schedule risk analysis as well as a check on currently planned schedules by the solid waste management team. One of the primary future activities planned is to explicitly model SWB processing in addition to drum processing. There is some batching of items into SWBs at the loading step; however, the source inventory currently converts all items to drums equivalent. The actual source inventory

WM’06 conference, February 26-March 2, 2006, Tucson, AZ
includes drums, SWBs, large boxes, and corrugated metal pipes (CMPs), each of which will follow a slightly different operational path, and some equipment may not be suited for working with these items. Also, this model could easily be coupled, at least via intermediate data collection, with other process models that produce a source stream. For example, other modeling efforts now are focused on modeling plutonium supply operations for programs at Los Alamos. The supply operations, namely pyrochemical and aqueous recovery operations, are a key source stream of waste drums. Another addition that would assist the current organization is to include personnel resource calculations in the model. This would help cost estimators as well as line organizations with staffing plans. Overall, this is an excellent start to a comprehensive model of solid waste management operations at Los Alamos. REFERENCES
1. Kornreich, D.E., et al., “Process Modeling and Analysis for Recovery of PuBe Sources at Los Alamos,” WM’01, February 2001.
2. Choi, M.M., T.J. Farish, and V.P. Worland, “Modeling of TA-50 Radioactive Liquid Waste Processing,” WM’04, February 2004.
3. Choi, M.M., T.J. Farish, and V.P. Worland, “Evaluation of Los Alamos National Laboratory’s Transuranic Radioactive Liquid Waste Treatment Capability and Recommendations for its Future Design,” WM’05, February 2005.
4. Kosiewicz, S.T., I.R. Triay, P.S.Z. Rogers, and D.V. Christensen, “Los Alamos National Laboratory Accelerated Transuranic Waste Workoff Strategies,” WM’97, March 1997.
5. Burnside, R.J. et al., “Simulation of Plutonium Material Processing Operations,” Institute for Nuclear Materials Management conference, July 1999.
6. Parker, R.Y., R.F. Farman, and N.S. DeMuth, “Simulation Modeling of Mixed Oxide Lead Test Assembly Pellet Fabrication,” Institute for Nuclear Materials Management conference, July, 2000.
7. Popa-Simil, L., A. Adams, D.R. Janecky, “The Volume Distribution of Cans Used in TRU Waste Measured by VE and its Possible Economic Implications,” WM’04 Conference, February 2004.