Erläuterungsteil IFRS Englisch 06.qxp - Fresenius
155
CONSOLIDATED FINANCIAL STATEMENTS AND MANAGEMENT REPORT OF FRESENIUS AG, BAD HOMBURG V.D.H. at December 31, 2006 applying § 315a HGB in accordance with International Financial Reporting Standards
-
Upload
khangminh22 -
Category
Documents
-
view
0 -
download
0
Transcript of Erläuterungsteil IFRS Englisch 06.qxp - Fresenius
CONSOLIDATED FINANCIAL STATEMENTS AND
MANAGEMENT REPORT OF
FRESENIUS AG, BAD HOMBURG V. D.H.
at December 31, 2006
applying § 315a HGB in accordance with
International Financial Reporting Standards

2 MANAGEMENT REPORT
44 CONSOLIDATED FINANCIAL STATEMENTS
45 Consolidated statement of income
46 Consolidated balance sheet
48 Consolidated cash flow statement
50 Consolidated statement of equity
52 Segment reporting
56 Notes
147 AUDITOR’S REPORT
148 REPORT OF THE SUPERVISORY BOARD
152 MANAGEMENT BOARD
153 SUPERVISORY BOARD
CONTENTS

2 Management Report22
MANAGEMENT REPORT
b Sales up 37%, net income up 49%.
b At € 1,443 million, EBIT exceeds the one billion mark for the first time.
b Operating cash flow of €1,058 million achieved.
b Outlook 2007: Strong sales and earnings increase expected.

3Management Report
The Fresenius Group had an excellent year 2006. We not only achieved record levels in
sales and earnings but also improved our profitability. The two major acquisitions – HELIOS
Kliniken and Renal Care Group – have been successfully integrated. At the same time,
our existing business expanded strongly and margins further improved. Acquisition spend-
ing, mainly financed through debt, remained at a high level.
OPERATIONS AND BUSINESS ENVIRONMENT
GROUP STRUCTURE AND BUSINESS
Fresenius is an international healthcare group with products
and services for dialysis, the hospital and outpatient medical
care. In addition, Fresenius focuses on hospital operations
and offers engineering and services for hospitals.
The operating business comprises the business seg-
ments Fresenius Medical Care, Fresenius Kabi and Fresenius
ProServe, which are all legally independent entities and
managed by the operating parent company, Fresenius AG.
The corporate structure remained unchanged in 2006.
Fresenius Medical Care mainly focuses on dialysis care
and manufactures and markets products for the treatment of
patients with end stage renal disease (ESRD). Fresenius Kabi
specializes in the production and sale of products for infu-
sion therapy, clinical nutrition and transfusion technology.
Fresenius ProServe operates hospitals and provides manage-
ment services for hospitals and other health care facilities.
The segment Corporate/Other comprises the holding activities
of Fresenius AG, the IT service provider Fresenius Netcare
and Fresenius Biotech. Fresenius Biotech is active in research
and development in the field of antibody and cell therapies.
Corporate/Other also includes the consolidation measures
conducted between the business segments.
Fresenius operates internationally and all business segments
have a regional and decentralized structure. Responsibilities
are clearly defined in line with the Company’s “entrepreneur
in the enterprise” management principle. Additionally, man-
agement accountability is reinforced by an earnings orien-
tated and target-linked compensation system.
Fresenius has an international marketing and production
network with more than 60 production sites worldwide. Key
production sites are located in the United States, Japan,
Germany and Sweden. Fresenius also has production plants
in other European countries, Latin America, Asia and South
Africa. The international production network allows us to
implement our business model while meeting the most exact-
ing logistics and regulatory requirements. The decentralized
structure of the production sites also substantially reduces
transportation costs and currency exposure.
Management and control
The corporate organs of the Group are the Management
Board, the Supervisory Board and the Annual General Meet-
ing. In accordance with the German Stock Corporation Act
(AktG), Fresenius AG has a dual management and control
system consisting of the Management Board and the Super-
visory Board. These two boards work independently of each
other. No one is allowed to be a member of both organs
simultaneously.

4 Management Report44
The Management Board conducts the business and represents
the Company in dealings with third parties. The Manage-
ment Board has five members. According to the Management
Board’s rules of procedure, each member is accountable for
their own area of responsibility. However, the members have
joint responsibility for the management of the Group. The
Management Board is required to report to the Supervisory
Board regularly, in particular on its corporate policy and
strategies, the profitability of the business, current operations
and any other matters that could be of significance for the
Company’s profitability and liquidity.
The Supervisory Board appoints the members of the Man-
agement Board and advises and supervises the Management
Board in its management of the Company. The Management
Board’s rules of procedure require it to obtain the Supervisory
Board’s approval for specific activities, however, the Super-
visory Board is fundamentally prohibited from managing the
Company. The Supervisory Board is comprised of six share-
holders’ representatives and six employees’ representatives.
The shareholders’ representatives are elected by the Annual
General Meeting. The employees’ representatives are elected
in accordance with the German Co-Determination Act
(MitBestG). The Supervisory Board must meet at least twice
per calendar half-year.
The appointment and dismissal of the members of the
Management Board is regulated in accordance with Sections
84 and 85 of the German Stock Corporation Act (AktG). The
articles of association of Fresenius AG also provide that dep-
uty members of the Management Board may be appointed.
For information on compensation, please see pages 141
to 144 of the Notes.
Key products, services and business processes
Fresenius Medical Care offers a comprehensive range of
products for hemodialysis and peritoneal dialysis and provides
dialysis care in its own dialysis clinics. Dialysis products are
sold to Group clinics as well as to external dialysis care pro-
viders. Fresenius Kabi is one of the few companies to offer
a comprehensive portfolio of enteral and parenteral nutrition
therapies. The company also offers a broad spectrum of prod-
ucts for fluid and blood volume replacement as well as a
portfolio of intravenously administered (IV) generic drugs.
Fresenius Kabi sells its products mainly to hospitals. Fresenius
ProServe is active as a hospital operator, primarily in Germany,
through HELIOS Kliniken Group. The HELIOS Kliniken Group
consists of HELIOS Kliniken GmbH, Wittgensteiner Kliniken
GmbH and HUMAINE Kliniken GmbH. Fresenius ProServe
also provides engineering and services for hospitals and
health care facilities through VAMED.
Important markets and competitive position
Fresenius operates in more than 60 countries through its
subsidiaries. The main markets are North America and
Europe where Fresenius generates 45% and 43% of its
sales, respectively.
Fresenius Medical Care is the largest dialysis company in
the world. Fresenius Kabi holds leading positions in Europe
and in the growth markets of Asia-Pacific, Latin America and
South Africa. Fresenius ProServe is a leading private hospital
operator in Germany through HELIOS Kliniken Group.
Legal and economic factors
The markets of the Fresenius Group are fundamentally stable
and relatively independent of economic cycles because of
the central importance of the life-saving and life-sustaining
products and treatments that the Group offers. Furthermore,
the markets in which we offer products and services are
expanding mainly for two reasons: demographics and the
demand for innovative therapies in the industrialized coun-
tries and the increasing availability of high-quality health care
in the developing and newly industrializing countries.
The statement of income and the balance sheet can
be influenced by currency translation effects as a result of
exchange rate fluctuations, especially in the rate of the US
dollar to the euro. This element had only a small effect on
our statement of income in 2006 since the average annual
exchange rate between these currencies was little changed:
1.2558 in 2006 versus 1.2442 in 2005. Our balance sheet,
however, was significantly affected because the closing rate
as of December 31, 2006 was 1.3170, compared to 1.1797 as
of December 31, 2005.

5Management Report
There were no legal aspects that significantly impacted the
business performance in 2006.
Capital, shareholders, articles of association
The summary below shows the subscribed capital of
Fresenius AG. On December 4, 2006 the Extraordinary Gen-
eral Meeting of Fresenius AG approved a share split with
capital increase from the Company’s funds. These resolutions
were entered in the Commercial Register on January 24, 2007.
As a result, the Company’s subscribed capital increased by
€ 22.6 million and the number of shares outstanding tripled.
The share split does not affect the preference dividend or
the minimum dividend payable on preference shares. Three
preference shares now represent the preference that one
preference share previously denoted.
The shares of Fresenius AG are no-par-value bearer shares.
The subscribed capital is divided into an equal number of
ordinary and preference shares. Shareholders’ rights are reg-
ulated by the German Stock Corporation Act (AktG). Addi-
tionally, as of December 4, 2006, the articles of association
of Fresenius AG contain the following three rules for the
holders of non-voting preference shares: First, from retained
earnings for the year they will receive a dividend of at least
€ 0.02 per preference share and higher by € 0.01 per prefer-
ence share than that for an ordinary share. Second, the min-
imum dividend payable on preference shares takes precedence
over payment of a dividend on ordinary shares. Third, if the
retained earnings of one or more fiscal years is not sufficient
to pay a dividend of € 0.02 per preference share, the amounts
not distributed will be paid in arrears without interest from
the retained earnings in subsequent fiscal years, after distrib-
uting the minimum preference dividend for those fiscal years
and before payment of a dividend on the ordinary shares.
The deferred payment right is a constituent of the share of
profits from retained earnings of that fiscal year for which the
deferred payment is made.
The Management Board is authorized, with the consent
of the Supervisory Board, to increase the subscribed capital
of Fresenius AG in accordance with the Annual General Meet-
ing’s resolutions on approved capital. This involves two
authorizations:
b Authorization to increase the subscribed capital by a max-
imum nominal amount of € 12,800,000 by May 9, 2011
through one or more issues of bearer ordinary shares
and/or nonvoting bearer preference shares against cash
contribution (Approved Capital I).
b Authorization to increase the subscribed capital by a max-
imum nominal amount of € 5,496,115.20 by May 9, 2011
through one or more issues of ordinary bearer shares
and/or nonvoting preference bearer shares against cash
contribution and/or assets in kind (Approved Capital II).
Shareholders’ preemptive rights of subscription can be
excluded.
In addition, there is the following conditional capital:
b The subscribed capital is increased conditionally by a max-
imum nominal amount of € 1,971,966.00 by the issuance
of new bearer ordinary shares and nonvoting bearer
preference shares (Conditional Capital I). The conditional
capital increase will be executed only to the extent that
subscription rights to ordinary and preference shares are
issued under the 1998 Stock Option Plan and the holders
of these subscription rights exercise these rights.
January 24, 2007 December 31, 2006 December 31, 2005
Number ofshares
(million)
Subscribedcapital
(€ million)
% ofSubscribed
capital
Number ofshares
(million)
Subscribedcapital
(€ million)
Number ofshares
(million)
Subscribedcapital
(€ million)
Ordinary shares/capital 77.18 77.18 50% 25.73 65.86 25.36 64.92
Preference shares/capital 77.18 77.18 50% 25.73 65.86 25.36 64.92
Total 154.36 154.36 100% 51.46 131.72 50.72 129.84

6 Management Report66
b The subscribed capital is increased conditionally by a
maximum nominal amount of € 5,104,962.00 by the issu-
ance of new bearer ordinary shares and nonvoting bearer
preference shares (Conditional Capital II). The conditional
capital increase will be executed only to the extent that
bonds convertible into ordinary and preference shares are
issued under the 2003 Stock Option Plan and the holders
of these convertible bonds exercise their conversion
rights.
Fresenius AG does not have a share buyback program.
Direct and indirect ownership interests in Fresenius AG
are listed on pages 111 and 112 of the Notes. The Else Kröner-
Fresenius-Stiftung notified the Company in May 2005 that
an ownership interest in Fresenius AG is attributable to it
pursuant to Section 22 (2) sentence 1, first half-sentence of
the German Securities Trading Act (WpHG). In addition, the
executors of the will of Ms. Else Kröner notified the Company
in January 2007 that an ownership interest in Fresenius AG
is attributable to them pursuant to Section 22 (1) No. 6 of
the WpHG and Section 22 (2) of the WpHG.
Changes to the articles of association are made in accord-
ance with Sections 133 and 179 of the German Stock Corpo-
ration Act (AktG). The articles of association of Fresenius AG
authorize the Supervisory Board to make changes to the
Company’s articles of association in its respective relevant
version that relate to their wording without a resolution by the
Annual General Meeting.
Material agreements embodying contingent conditions
in the event of a change of control as the result of a take-
over bid exist in respect of some of our long-term financing
agreements. These agreements contain customary change of
control clauses that grant creditors the right of premature
call in the event of a change of control, whereby, generally,
the change of control has to be followed by a downgrading
of the Company’s rating.
CORPORATE PERFORMANCE CRITERIA,
GOALS AND STRATEGY
The Management Board controls the business segments by
setting strategic and operative targets and through various
financial ratios. In line with our growth strategy, organic
growth is a key indicator. Operating income (EBIT – earnings
before interest and taxes) is another useful yardstick for
measuring the profitability of the business segments.
The Management Board believes that, in addition to oper-
ating income, EBITDA (earnings before interest and taxes,
depreciation and amortization) is a good indicator of the
business segments’ ability to achieve positive financial results
and to service their financial commitments. The operating
cash flow contributions of our business segments are con-
trolled on the basis of days sales outstanding (DSO) and inven-
tory turnover.
Financing is a central Group function over which the busi-
ness segments have no control. Therefore, interest expenses
resulting from financing activities are not included in the
financial targets for the business segments. The same applies
to tax expenses. At Group level we use return on operating
assets (ROOA) and return on invested capital (ROIC) as bench-
marks to evaluate our business segments and their contribu-
tion to the value of the Group.
ROIC decreased slightly to 7.4% from 8.0% in 2005 due
to the strong acquisition activity. Same was true for ROOA,
which was 10.3% in 2006 (2005: 11.7%). The decrease is
attributable to the acquisition of Renal Care Group. For the
future we expect to see a continuous improvement in ROIC
and ROOA.
Another key performance indicator at Group level is the net
debt/EBITDA ratio.
The key elements of Fresenius Group’s strategy and goals
are:
b To expand our market position: Fresenius’ goal is to
ensure the long-term future of the Company as a leading
international provider of products and services in the
health care industry and to improve its market position.
Fresenius Medical Care is the largest dialysis company in
the world. The acquisition of Renal Care Group as of

7Management Report
March 31, 2006 has further strengthened our position in
the United States. Future opportunities in dialysis will
arise from international expansion in dialysis care and
in dialysis-related drugs. Fresenius Kabi is the European
market leader in infusion therapy and clinical nutrition.
The company plans to roll out more products from its
portfolio in growth markets in order to strengthen this
position. The company is also aiming to win further market
share through the launch of new products in the field of
intravenously administered generic drugs and new medi-
cal devices for infusion therapy and clinical nutrition.
Through HELIOS Kliniken Group, Fresenius ProServe is
in a strong position to take advantage of further growth
opportunities as the privatization process in the German
hospital market continues.
b To extend our global presence: In addition to sustained
organic growth in markets where Fresenius is already
established, our strategy is to diversify into new growth
markets worldwide, especially in Asia-Pacific and Latin
America. With our brand name, product portfolio and
existing infrastructure, we intend to focus on markets
that offer attractive growth potential. Fresenius plans
to make further selective acquisitions to improve the
Company’s market position and to diversify its business
geographically.
b To strengthen innovation in the development of new
products and technologies: Fresenius’ strategy is to con-
tinue building on its strong position in technology, its
competence in patient care and its ability to manufacture
cost-effectively. We are convinced that we can leverage
our competence in research and development to develop
products and systems that can be tailored to individual
patient needs at the same time providing a high level of
safety and user-friendliness. We intend to continue to
meet the requirements of best-in-class medical standards
by developing and producing more effective products
and treatment methods for the critically ill. Fresenius
ProServe’s goal is to widen brand recognition for its health
care services and innovative therapies.
b To enhance profitability: Our goal is to continue to improve
Group profitability. On the costs side, we are concentrat-
ing particularly on making our production plants more
efficient, exploiting economies of scale, leveraging the
existing marketing and distribution infrastructure more
intensively and practicing strict cost control. Focusing on
operating cash flow with efficient working capital man-
agement will increase our flexibility for making invest-
ments and improve our balance sheet ratios. Another
goal is to optimize our weighted cost of capital by deliber-
ately employing a balanced mix of equity and debt funding.
RESEARCH AND DEVELOPMENT
Fresenius focuses its R & D efforts on its core activities.
These are:
b Dialysis and other extracorporeal therapies
b Infusion and nutrition therapies as well as medical devices
b Antibody and cell therapies
Apart from products, we are concentrating on developing
optimized or completely new therapies, treatment methods
and services. In 2006, we successfully continued numerous
projects and several new products were launched.

8 Management Report88
Fresenius Medical Care continued to work hard to improve
dialysis therapies. Our projects’ main focus was on the further
development of dialyzers and market-specific adaptations
to our new 5008 hemodialysis machine. Another important
area was peritoneal dialysis and extracorporeal liver support.
Fresenius Kabi focused on developing new products and
product enhancements in its core areas of infusion therapy,
clinical nutrition and medical devices. Main areas included
the development work on a novel product for blood volume
substitution and on intravenously administered drugs.
Important projects at Fresenius Biotech involved trifunc-
tional antibody therapies: In 2006, phase II clinical studies on
the treatment of patients with breast and gastric cancer were
started. A phase II/ III study in the indication of malignant
ascites on patients with ovarian cancer was completed, with
positive results.
Expenditure on research and development was € 166
million in 2006, 13% more than the € 147 million spent
the previous year. In 2006, we invested about 5% of our prod-
uct sales in R&D. The pie chart shows the R & D expenses
by business segment. Increases were at Fresenius Kabi, from
€ 64 million in 2005 to € 75 million in 2006, and in the seg-
ment Corporate/Others from € 40 million to € 49 million.
The latter increase was mainly for the clinical development of
the trifunctional antibody at Fresenius Biotech.
As of December 31, 2006, 911 people were employed in
research and development in the Group (December 31, 2005:
856). Of that number, 356 were employed at Fresenius
Medical Care (2005: 353), 467 at Fresenius Kabi (2005: 432)
and 88 at Fresenius Biotech (2005: 71). The table shows a
historical comparison of R & D expenses and the number of
employees working in R & D.
Our main research sites are in Europe. Production-related
research is also carried out in the United States and China.
Our research and development projects are mainly conducted
in-house. External research is commissioned only on a limited
scale.
OVERALL BUSINESS DEVELOPMENT
Economic environment
The upward trend in the global economy continued in 2006.
With growth of 5.0% in global gross domestic product (GDP),
the dynamic of the global economy well exceeded expecta-
tions at the beginning of the year, and marked the second
highest growth rate, after 2000, of the last 15 years. Interna-
tional trade was again a key growth driver. The world economy
benefited from continued favorable monetary conditions in
the main economic areas, despite increases in interest rates
by a number of central banks. Record high levels of oil and
industrial commodity prices had especially negative impacts
on the economy. In addition to the dynamic economies of
Asia and the United States, the Eurozone also witnessed a
marked upturn in 2006.
b Europe
With a rate of 2.7%, GDP growth in the Eurozone exceed-
ed the 2.0% mark for the first time in six years (2005:
1.5%). At the same time, the differences in the rates of
Fresenius
Medical Care 25%
Fresenius Kabi 45%
Corporate/Fresenius
Biotech 30%
R & D EXPENSES BY SEGMENT
2006: € 166 million
2006 2005 2004 2003 2002
R & D-expenses (in million € ) 166 147 122 121 138
R & D employees 911 856 819 790 711from 2004 onwards IFRS; 2003 and 2002 US-GAAP

9Management Report
growth among the larger member states narrowed. Spain
for instance posted GDP growth of 3.8% (2005: 3.5%),
Germany and France 2.5% and 2.0% respectively
(2005: 0.9% and 1.2%) and Italy 1.8% (2005: 0.0%).
Private consumption in the Eurozone picked up much
more strongly than in the previous years. This is mainly
due to the positive trend of the labor market. Higher prop-
erty values and the associated wealth effects contributed
in large part to the growth in consumption, especially in
France, Spain and Italy. Exports were buoyant thanks to
the robustness of the global economy. Companies’ positive
earnings accelerated investment activity in the corporate
sector. Prime rate increases by the European Central Bank
(ECB) scarcely dampened economic development in 2006.
Germany witnessed its strongest GDP growth since
2000. Unlike the past, the upswing was not driven solely
by exports but also by a positive development at home.
The momentum came from a largely consolidated eco-
nomic basis – and benefited from a number of atypical
occurrences (such as the anticipated impact of the value
added tax increase as from January 1, 2007).
The economic dynamic of the new EU member states
continued undiminished, with an aggregate GDP growth
of 5.5% (2005: 4.3%).
b United States
GDP grew by 3.3% in 2006 (2005: 3.2%). Private con-
sumer spending, at about 70% the largest component of
GDP in the United States, lost momentum as an economic
growth driver in the course of the year. Purchasing power
slowed, mainly as a result of sharply increased energy
prices. The property market also clouded over, with the
result that the wealth effects which had previously bol-
stered private consumption faded. Once more, the current
account deficit increased slightly, also due to the oil price,
and reached a new record level in relation to nominal gross
domestic product.
b Asia
Asia (excluding Japan) was once again the world’s fastest
growing region with GDP growth of 8.8% (2005: 8.5%).
China sustained its impressive pace of expansion, with
GDP growth of 10.6% in 2006 (2005: 10.4%). Exports
continued to play an important role. In India, the services
sector was again the strongest part of the economy. With
GDP growth of 9.0% in 2006 (2005: 8.4%), India con-
tinues to be one of the main growth centers of the world.
The growth momentum in Southeast Asia slowed a little,
mainly due to high commodity prices. Here, too, the
countries profited from the strength of the world economy,
but mainly from the stimulus emanating from China.
Exports are also likely to have benefited from currency
weakness in some of these countries. Japan’s economy
saw its fifth year of continued growth. However, its eco-
nomic dynamic slowed down in the course of the year,
leading to a GDP growth of 2.1%, roughly on a par with
the previous year (1.9%). The main drivers were exports
and domestic and foreign investment.
b Latin America
Economic growth in Latin America remained robust in
2006, with GDP growth of 4.9% (2005: 4.5%). Argentina
posted GDP growth of 8.5% (2005: 9.2%), Brazil 2.7%
(2005: 2.3%) and Mexico 4.6% (2005: 3.0%). Domestic
growth was bolstered by global economic growth and
the sustained demand for raw materials, from which the
commodity-exporting countries of Latin America profited.
As a whole, exports and domestic demand were the main
drivers. In Brazil and Mexico, interest rate cuts boosted
investment activity and consumption, while inflation
remained moderate. Argentina faced higher inflation as
a result of its dynamic economic development.
Source: German Council of Economic Exports Annual Report 2006/2007, bank research

10 Management Report1010
Health care industry
The health care sector is one of the world’s most stable indus-
tries and, compared with other sectors, has set itself apart
through years of continuous growth and its relative insensi-
tivity to economic fluctuations. Aging populations, demand for
innovative medicine especially in industrialized nations and
the demand for primary care in emerging markets are the
main contributing factors.
At the same time, the cost of health care is rising and is
claiming an ever increasing share of national income. Health
care spending in the OECD countries has climbed from an
average of 7.1% of GDP in 1990 to an average of 8.9% in
2004. In 2004, the United States had the highest health care
spending relative to GDP of 15.3% (2003: 15.0%), followed
by Switzerland with 11.6% (2003: 11.5%) and Germany with
10.9% (2003: 11.1%). The decline in expenditure relative
to GDP in Germany is the result of cost dampening effects
of the health care reform which came into force on January 1,
2004.
Reforms and cost-control measures are the main reactions
to the explosion in costs in the health care systems. The main
concern is to make patient care more efficient and improve
the quality of medical services, and at the same time insuring
that the health care system can be financed. The quality of
treatment is a crucial factor in improving medical results
and reducing treatment costs. Against this background, ever
greater importance is being attached to disease prevention
programs and innovative reimbursement models where the
quality of treatment is the key parameter.
Our most important markets developed as follows:
b The dialysis market
The number of dialysis patients worldwide increased by
about 6% in 2006. At the end of the year approximately
1.53 million patients worldwide receive regular dialysis
treatment. More than 89% of these are treated with hemo-
dialysis, while about 11% choose peritoneal dialysis.
Kidney failure has a number of causes. Diseases such as
diabetes and high blood pressure are the leading causes
of terminal kidney failure. Aging populations, improved
treatments and higher living standards in the industrialized
countries are additional reasons for the increase in patient
numbers.
The prevalence, or the number of patients treated for
terminal kidney failure as a proportion of the population,
differs widely from region to region. The 20 strongest
economies, which include the two largest dialysis markets,
the United States and Japan, have an average prevalence
of more than 1,000 per million population. In countries
with lower economic success, the prevalence is about 500
patients per million population and in countries with weak
economies it is less than 100 patients per million popula-
tion. These figures show that the economic situation of
a country has a significant impact on access to life-saving
dialysis treatment.
In 2006, about 22% of the world’s dialysis patients
were treated in the United States, 18% each in Japan and
the European Union and the remaining 42% in various
other regions of the world. The majority of hemodialysis
patients are treated in dialysis clinics. There are about
25,000 dialysis centers worldwide with an average of 55
hemodialysis patients per clinic. In the United States,
most of the approximately 5,000 clinics are run privately,
with fewer than 1% publicly operated. By contrast, some
60% of the approximately 5,000 dialysis clinics in the

11Management Report
European Union are publicly owned. In Japan, about 80%
of the dialysis clinics are run by private nephrologists.
In 2006, the global dialysis market grew by about 5%
and was worth approximately US$ 55 billion. Dialysis prod-
ucts accounted for about US$ 9 billion of the total market.
The most important products are dialyzers, hemodialysis
machines, concentrates and dialysis solutions and products
for peritoneal dialysis. Fresenius Medical Care is the
world leader in dialysis care as well as in dialysis products.
In dialysis products the company has a market share of
about 30%. With the acquisition of Renal Care Group,
Fresenius Medical Care further expanded its market
leadership in dialysis care in the United States, to a market
share of 34%. Together, Fresenius Medical Care and
the second largest dialysis care provider DaVita operate
about two-thirds of all the dialysis clinics in the United
States. Outside the United States, the markets for dialysis
care are significantly more fragmented.
Because treatment costs in the United States are cov-
ered primarily by public health insurers, providers mainly
compete on quality and availability. In most countries
outside the United States, Fresenius Medical Care com-
petes mainly with independent clinics and clinics that
are affiliated to hospitals.
Changes in the reimbursement system came into force
in the United States in 2006. Among other things, the
reimbursement rate per dialysis treatment (Composite
Rate) was increased by 1.6% and the reimbursement
procedure for dialysis-related drugs that have to be billed
separately was changed. New rules for the treatment of
anemia in dialysis patients also apply as from April 2006.
Overall, these changes had a slightly positive effect on
Fresenius Medical Care’s operating performance.
b The market for infusion therapy and clinical nutrition
In Fresenius Kabi’s market for infusion therapy and clin-
ical nutrition, demographic changes, the resulting higher
need for medical services and the demand for innovative
therapies are the main growth drivers. However, market
conditions vary widely from region to region.
In Central and Western Europe, cost-saving measures
and health care reforms are the key factors affecting the
public health systems. Therapies that lead to better clin-
ical results while reducing the length of hospital stays are
gaining in importance in these countries. At the same
time, cost pressure in hospitals, budget caps and health
care cost-containment schemes are leading to a shift
away from inpatient treatment to more outpatient care.
In Central and Western Europe the total market for
infusion therapy and clinical nutrition is growing at a low
single-digit rate. The market for intravenously adminis-
tered generic drugs for the hospital is growing at a mid
single-digit rate. The increasing use of generic drugs and
the expiration of patents for many original drugs will fur-
ther accelerate this growth in the future.
The overall market for medical devices for infusion
therapy and clinical nutrition in Europe is continuing
to grow at mid single-digit rates. Here, the main growth
drivers are technical innovations that focus on treatment
safety and efficiency of therapies.
In the growth regions of Asia-Pacific, Latin America,
and Eastern Europe, the main focus is on the provision
of primary health care to the population. This leads to
increasing demand for life-saving and live-prolonging
health care services. Growth rates in our products markets
here are in the high single to double digits.

Source: German Federal Ministry of Health, German Federal Statistics Office, OECD Indicators –
2006 Edition, Krankenhaus-Barometer Survey 2006, Steria Mummert Consulting Survey (July 2006)
12 Management Report1212
b The German hospital market
Annual health care expenditure in Germany is in the range
of € 240 billion. The hospital market is the biggest seg-
ment, accounting for more than € 60 billion, or about one
quarter of the total. In 2005, the German hospital market
consisted of 2,139 hospitals, with a total of 523,824 beds
and treating about 16.9 million inpatients a year. As in the
other OECD countries, the number of hospital beds per
capita is declining in Germany. In 2004, there were 6.4
acute care beds per 1,000 population. This was still well
above the OECD average of 4.1 (United States: 2.8). The
average stay of a patient in an acute care clinic (excluding
specialized psychiatric clinics) has dropped by about
one day between 2000 and 2005 and was 8.6 days at the
end of 2005. The average length of stay at the HELIOS
acute care clinics in 2005 was only 7.1 days, a result of its
efficient processes.
For acute care hospitals, 2006 was marked by contin-
ued activities for the switch to the DRG (Diagnosis Related
Groups) reimbursement system. This reimbursement
system which in future will be applied on a standardized
basis in each federal state, will lead to an increase in
competition among hospitals. Medical quality will become
a key criterion. Moreover, clinics with unfavorable cost
structures and that operate inefficiently will be at a dis-
advantage.
According to a study published by Steria Mummert
Consulting, almost half of the German hospitals have
restructured their business. Clinics also hope to unlock
additional cost-cutting potential by setting up interdisci-
plinary medical centers. One in every two clinics plans
to merge previously separate faculties and departments
and expand them into specialized interdisciplinary units.
By merging operating units, processes can be made more
efficient and patient care optimized. Synergies can be
realized, for instance, by sharing infrastructure, medical
equipment, or laboratories. At the same time, hospitals
will be seeking to strengthen their market position exter-
nally to make themselves more attractive to patients and
those who refer them.
The demand for medical staff is rising despite the
financial constraints faced by hospitals. The trend toward
the recruitment of new staff is largely due to the new
agreements on working hours for hospital doctors now
that standby duty is to be counted as normal working
hours.
The annual survey by the German Hospital Institute
showed that the number of inpatient cases in 2005
remained more or less unchanged compared to 2004.
Hospitals with less than 100 beds registered fewer cases
than in 2004 (a decrease of 6%). Case numbers also
tended to decline at hospitals with 100 to under 300 beds.
In contrast, larger hospitals generally reported higher case
numbers, indicating that as a whole there has been a
shift towards larger institutions. In 2005, case numbers at
the HELIOS acute care clinics were slightly below previous
years’ figures (not taking Wittgensteiner Kliniken into
account). These numbers were achieved despite stiffer
competition and the growing pressure from health insur-
ers to provide more health care services on an outpatient
basis.
Quality is the key competitive factor in the hospital
market. To promote transparency in hospital services, the
German government has introduced a system of struc-
tured quality reports. All acute care hospitals had to submit
these reports for the first time in 2005. The reports include
key data on hospital operations, such as the type and
number of treatments and information on quality manage-
ment. Patients can find out on the Internet which hospital
in their area specializes in the treatment of a given dis-
ease, how often a hospital has performed specific opera-
tions and which had a particularly low rate of complica-
tions. HELIOS Kliniken has been publishing quality reports
since 1999 and also publishes figures for mortality rates.

13Management Report
The Management Board’s assessment of the effect of gene-
ral economic developments and developments in the health
care sector for Fresenius
On the whole, the global economy and the health care sector
– in the mature and the growth markets – developed positively
for Fresenius in 2006. While these factors were responsible
for much of the Group’s growth, strong demand for its prod-
ucts and services enabled Fresenius to outpace the growth of
the health care industry as a whole.
Significant factors affecting operating performance
In 2006, the Group statement of income was affected to a
large extent by the consolidation of HELIOS Kliniken as of
December 31, 2005 and the consolidation of Renal Care Group
as of April 1, 2006. In addition, Clinico Group was consoli-
dated as of December 31, 2005, the Australian company
Pharmatel as of January 1, 2006, and HUMAINE Kliniken as
of July 1, 2006. Our positive development was also driven by
very good performance from the business segments’ existing
activities, where significant increases in sales as well as in
earnings were achieved. The balance sheet of the Fresenius
Group as of December 31, 2006 was mainly affected by the
first-time consolidation of Renal Care Group and HUMAINE
Kliniken and their financing.
The Management Board’s assessment of the business results
The Management Board is of the opinion that the economic
development of the Fresenius Group in 2006 was excellent.
The two business segments Fresenius Medical Care and
Fresenius Kabi especially profited from the continued strong
demand for products and services and generally outperformed
the market. This was reflected in sustained strong organic
growth and higher profitability. Fresenius ProServe also per-
formed well, achieving improved earnings. Moreover, the
two major acquisitions, HELIOS Kliniken and Renal Care
Group, were successfully integrated. We consider it to be
an exceptional achievement to have swiftly integrated these
two companies and, at the same time, to have expanded our
existing business strongly, with organic growth of 9% and
further margin improvements.
Comparison of the actual business results with the forecasts
As the summary below shows, all the targets set by Fresenius
for 2006 were either achieved or exceeded.
Group*
Targets for 2006announced in February
2006
Raised targetsannounced inAugust 2006
Raised targetsannounced in October 2006
Achieved in 2006
Sales (in constant currency) € ~10.5 billion € ~10.7 billion € > 10.7 billion € 10.8 billion
Net income (growth, in constant currency) > 30% ~40% 40-45% 49%
Capital expenditure € 550-600 million € 606 million
Net debt/EBITDA ~3.5 3.0
* Targets according to US GAAP

14 Management Report1414
With sales of approximately € 10.8 billion, Fresenius fully
achieved its forecast of growth to more than € 10.7 billion.
The guidance for net income growth, which had been raised
again at the end of October to 40 to 45% in constant currency,
was exceeded with 49%. This was mainly attributable to the
even better than expected performance of Fresenius Medical
Care and Fresenius Kabi. At 3.0 as at December 31, 2006,
the net debt/EBITDA ratio was below the targeted 3.5. The
balance sheet as of December 31, 2006 includes the debt
for the acquisition of Renal Care Group, however, this business
is only included in the statement of income as from April 1,
2006. We have therefore included Renal Care Group’s
EBITDA in the net debt/EBITDA calculation on a full-year
basis. Please see page 24 of the Management Report and
page 80 of the Notes for more details.
RESULTS OF OPERATIONS, FINANCIAL POSITION,
ASSETS AND LIABILITIES
Fresenius completed the following significant acquisitions in
2006:
Effective March 31, 2006, Fresenius Medical Care acquired
Renal Care Group, Inc., Nashville, Tennessee, one of the
leading private dialysis care providers in the United States.
Renal Care Group achieved revenues of US$ 1.57 billion and
net income of US$ 130 million in 2005. The purchase price
for all the outstanding shares of Renal Care Group was US$ 3.5
billion plus the company’s indebtedness. The acquisition
was entirely debt financed.
The expansion in the German hospital market continued
in 2006 with the acquisition of a 60% interest in HUMAINE
Kliniken GmbH. HUMAINE operates six acute and post-
acute care hospitals in the areas of neurology, oncology and
traumatology, with a total of 1,850 beds, 1,530 of these for
acute care. HUMAINE achieved revenues of € 197 million
and an EBIT of € 14 million in 2005.
RESULTS OF OPERATIONS
Sales
In 2006, we increased Group sales by 37% to € 10,776 million
(2005: € 7,889 million). Organic growth reached an excellent
9%, while acquisitions contributed 29% to the growth in
sales. This growth was mainly attributable to the consolidation
of Renal Care Group and HELIOS Kliniken. Divestitures had
an effect of -1%. Currency translation in total had no impact.
The table shows the different influences on Fresenius Group
sales. There were no significant consequences from changes
in product mix. Price effects in the dialysis care business
contributed positively. In the foreseeable future no significant
changes of these items are expected.
The largest regions in the Group were North America,
which contributed 45% of total sales and Europe with a con-
tribution of 43%. These were followed by Asia-Pacific with
6%, Latin America with 4% and Africa with 2%. Germany
contributed 22% to Group sales.
We increased sales in all regions of the world. The consol-
idation of Renal Care Group had a considerable influence on
sales growth in North America. Very good organic growth of
9% was achieved in this region. In Europe, the consolidation
of HELIOS Kliniken Group was responsible for much of the
growth. However, Fresenius also achieved very good organic
growth of 5%. Excellent growth rates of 25% were reached
in the Asia-Pacific region, 27% in Latin America and 16% in
Africa.
ReportedDivestituresAcquisitionsOrganic growth
SALES GROWTH ANALYSIS
9%
-1% 37%29%

15Management Report
Sales performance by business segment was as follows:
b Fresenius Medical Care achieved a substantial sales
increase of 24% to € 6,767 million (2005: € 5,443 million)
in 2006. This was driven by high organic growth of 10%
and the consolidation of Renal Care Group. Currency
translation effects had an impact of -1%. Fresenius
Medical Care achieved strong growth especially in dialysis
care, driven also by the first-time consolidation of Renal
Care Group. In dialysis products, Fresenius Medical Care
also achieved a remarkable increase of 11%.
b Fresenius Kabi increased its sales by 13% to € 1,893
million (2005: € 1,681 million). The company achieved
strong organic growth of 8%. Acquisitions added another
4% to sales. Most of this was attributable to the consol-
idation of the Clinico Group and the Australian company
Pharmatel. Currency translation had a positive effect, con-
tributing 1%. Performance in Asia-Pacific and in Latin
America was excellent. Here, Fresenius Kabi achieved
strong growth of 41% and 27%, respectively.
b Fresenius ProServe achieved sales of € 2,155 million in
2006 (2005: € 809 million). On a comparable basis (2005
including HELIOS Kliniken: € 2,009 million), this was
an increase of 7%. The growth was driven partly by the
acquisition of HUMAINE Kliniken, which was consolidated
as from July 1, 2006. Fresenius ProServe achieved organic
growth of 3%.
Order intake and order backlog were well above the
previous year’s levels. Order intake in Fresenius ProServe’s
engineering business rose 19% to € 407 million (2005:
€ 341 million), while order backlog at year-end was also up
19% to € 428 million (December 31, 2005: € 360 million).
in million € 2006 2005 ChangeOrganicgrowth
Currency translation
effectsAcquisitions/
Divestitures% of total
sales
Fresenius Medical Care 6,767 5,443 24% 10% -1% 15% 63%
Fresenius Kabi 1,893 1,681 13% 8% 1% 4% 17%
Fresenius ProServe* 2,155 2,009 7% 3% - 4% 20%
* 2005: including HELIOS Kliniken
in million € 2006 2005 ChangeOrganicgrowth
Currency translation
effectsAcquisitions/
Divestitures% of total
sales
Europe 4,535 3,030 50% 5% 0% 45% 43%
North America 4,862 3,746 30% 9% -1% 22% 45%
Asia-Pacific 696 557 25% 19% 0% 6% 6%
Latin America 452 356 27% 21% 3% 3% 4%
Africa 231 200 16% 18% -3% 1% 2%
Total 10,776 7,889 37% 9% 0% 28% 100%
SALES BY REGION
SALES BY BUSINESS SEGMENT

16 Management Report1616
b Fresenius Medical Care increased EBIT by 39% to
€ 1,046 million from € 755 million in 2005. The EBIT
margin was 15.5% (2005: 13.9%). EBIT includes a gain
of € 32 million from the divestitures of dialysis clinics in
the United States. EBIT also includes a total of € 49 million
for one-time expenses, e.g. for the integration of Renal
Care Group. The strong increase in operating profit was
driven mainly by the performance of the dialysis care
business in the United States as well as significant
improvements in the international business.
b In 2006, Fresenius Kabi sustained the excellent earnings
performance achieved in 2005. EBIT increased by 29%
to € 296 million (2005: € 229 million). The EBIT margin
improved to 15.6%, from 13.6% in 2005. The growth
was driven by a good operating performance in all regions
and by cost optimization and efficiency improvement
measures, especially in production.
b Fresenius ProServe achieved a good EBIT performance,
too. This business segment closed 2006 with EBIT
of € 152 million (2005: € 20 million). Including HELIOS
Kliniken in the figure for 2005, this corresponds to a
strong increase of 20% (2005 including HELIOS Kliniken:
€ 127 million).
Development of other major items in the statement of income
Gross profit increased to € 3,437 million, exceeding the
€ 2,595 million in 2005 by 32% (33% in constant currency).
The gross profit margin was 31.9% (2005: 32.9%). The
lower margin compared to 2005 is a result of the first-time
consolidation of HELIOS Kliniken and is due to the different
structure of this business. The cost of goods sold rose 39%
to € 7,339 million. This is 68.1% of Group sales, compared
to 67.1% in 2005. Selling, general and administrative
expenses consist primarily of personnel costs, marketing and
distribution costs and depreciation and amortization. These
expenses rose by 23% to € 1,828 million in 2006 (2005:
€ 1,481 million). Depreciation and amortization were € 406
in million € 2006 2005 Change
Fresenius Medical Care 1,046 755 39%
Fresenius Kabi 296 229 29%
Fresenius ProServe 152 20 --
Earnings structure
We achieved excellent growth rates in net income in 2006.
Group net income rose 49% to € 330 million. All business
segments contributed to this success. Group net income
includes a total of € 26 million for one-time expenses. Cur-
rency translation had in total no impact. Inflation had no
significant effect on results of operations in 2006.
Group earnings before interest, taxes, depreciation and
amortization (EBITDA) increased 43% to € 1,849 million
(2005: € 1,292 million). Group EBIT rose 50% in constant
currency and 49% at actual exchange rates to € 1,443 million
(2005: € 967 million). EBIT includes a gain of € 32 million from
the divestitures of dialysis clinics in the United States. The
sale was a condition of the US Federal Trade Commission
for approval of the Renal Care Group acquisition. EBIT also
includes a total of € 49 million for one-time expenses at
Fresenius Medical Care.
EBIT of the business segments developed as follows:

17Management Report
million (2005: € 325 million). As a percentage of sales, depre-
ciation and amortization dipped slightly from 4.1% in 2005
to 3.8% in 2006.
Group net interest expense was € -395 million. This is
€ 192 million more than the figure of € -203 million in 2005.
This change is mainly due to the debt financing of the acqui-
sitions of Renal Care Group and HELIOS Kliniken. Net inter-
est, however, also includes one-time expenses of € 30 milli-
on associated with the early refinancing of Group debt.
The tax rate was 39.4% in 2006 (2005: 38.4%). It was
substantially influenced by the tax expense associated with
the divestiture of the dialysis clinics in the United States
because the goodwill attributable to the divested clinics is not
considered for tax purposes. Excluding this effect, the tax rate
was 37.1%.
Minority interest increased from € 249 million in 2005 to
€ 305 million in 2006, mainly due to the excellent earnings
situation of Fresenius Medical care. Of this, 93% was attrib-
utable to the minority interest in Fresenius Medical Care.
Earnings per ordinary share rose to € 2.15 from € 1.76
in 2005 and earnings per preference share to € 2.16 from
€ 1.77. This is an increase of 22% for both share classes and
is lower than the growth in net income due to the higher aver-
age number of shares outstanding. The number of shares
had risen mainly as a result of the capital increases to finance
the acquisitions of HELIOS Kliniken and HUMAINE Kliniken.
Moreover, the number of shares outstanding has tripled
because of the share split executed in February 2007. Previous
year’s numbers were adjusted accordingly.
in million € 2006 2005 ChangeChange in
constant currency
Sales 10,776 7,889 37% 37%
Cost of goods sold -7,339 -5,294 -39% -39%
Gross profit 3,437 2,595 32% 33%
Operating expenses -1,994 -1,628 -22% -23%
EBIT 1,443 967 49% 50%
Net interest -395 -203 -95% -96%
Income taxes -413 -293 -41% -42%
Minority interest -305 -249 -22% -23%
Net income 330 222 49% 49%
Earnings per ordinary share (in €) 2.15 1.76 22% 22%
Earnings per preference share (in €) 2.16 1.77 22% 22%
EBITDA 1,849 1,292 43% 44%
Depreciation and amortization 406 325 25% 25%
STATEMENT OF INCOME (SUMMARY)

18 Management Report1818
Profitability also improved significantly in 2006, as the table
below shows:
Value added
The value added statement shows Fresenius’ total output in
2006 less goods and services purchased and less depreciation
and amortization. The value added of the Fresenius Group
amounted to € 5,490 million in 2006 (2005: € 3,518 million).
This is an increase of 56%. The distribution statement shows
that, at € 3,959 million or 72%, the largest portion of our
value added went to our employees. Governments and lend-
ers came next with € 501 million and € 395 million, or 9%
and 7% respectively. Shareholders received € 89 million and
minority interest € 305 million. The Company retained € 241
million for reinvestment.
FINANCIAL POSITION
Financial management policies and goals
Ensuring financial flexibility is key to the financing strategy
of the Fresenius Group. We achieve this flexibility through a
broad spectrum of financing instruments and a wide diversi-
fication of our investors. The maturity profile is characterized
by a broad spread of maturities with a large proportion of
mid to long-term financing.
Sufficient financial cushion is assured for the Fresenius
Group by the revolving syndicated credit lines that are
only partly drawn and the unused bilateral credit lines at our
disposal. Market capacity, investor diversification, flexibil-
ity, qualification requirements and the current maturity pro-
file are all taken into consideration when selecting financing
instruments. At the same time, we seek to optimize our
financing costs.
In line with the Group’s structure, the financing for
Fresenius Medical Care and for the rest of the Fresenius Group
is conducted separately. There are no joint loans or credit
agreements and no mutual guarantees. The Fresenius Kabi
and Fresenius ProServe business segments are financed
primarily through Fresenius AG in order to avoid any structural
subordination.
in million € 2006 % 2005 %
Creation
Company output 10,798 100 7,907 100
- Materials and services purchased 4,902 45 4,064 51
Gross value added 5,896 55 3,843 49
- Depreciation and amortization 406 4 325 4
Net value added 5,490 51 3,518 45
Distribution
Employees 3,959 72 2,479 71
Governments 501 9 365 10
Lenders 395 7 203 6
Shareholders 89 2 76 2
Company and minority interest 546 10 395 11
Net value added 5,490 100 3,518 100
VALUE ADDED STATEMENT
in % 2006 2005
EBITDA margin 17.2 16.4
EBIT margin 13.4 12.3
Return on sales (before taxes and
minority interest) 9.7 9.7

19Management Report
Financing
Fresenius meets its financing needs through a combination
of operating cash flows generated in the business segments
and short, mid and long-term debt. In addition to conven-
tional bank loans, important financing instruments include
the issuance of bonds, trust preferred securities and the
commercial paper program.
The main Group financing activities in 2006 were to
refinance the bridge loan for the HELIOS acquisition at the
end of 2005 and to finance the Renal Care Group acquisition
completed on March 31, 2006. Financing commitments from
banks had already been in place when the acquisitions were
announced. The positive acceptance of our business strategy
in the financial market and the financing mix enabled us to
secure advantageous conditions for the individual financing
measures. Our good business performance and sustained
cash flows also had a positive effect on the financing condi-
tions. The significant reduction in debt in recent years and the
much improved financial ratios have strengthened investor
confidence in Fresenius. The generally positive environment
in the banking and bond markets was also beneficial.
In May 2005, Fresenius Medical Care received financing
commitments from Bank of America and from Deutsche Bank
for the Renal Care Group acquisition for a credit line to be
provided by a syndicate of banks as well as a loan from a
syndicate of banks and institutional investors. Under the new
credit agreement concluded on March 31, 2006 senior credit
facilities of US$ 4.6 billion were then made available to pay
the purchase price of Renal Care Group, to refinance existing
loans under Fresenius Medical Care’s 2003 credit agreement,
to service certain liabilities of Renal Care Group, and for
general corporate purposes.
The new senior credit facilities comprise a US$ 1 billion
revolving credit line with a maturity of 5 years, a loan (Term
Loan A) of US$ 1.85 billion with a maturity of 5 years, and
a loan (Term Loan B) of US$ 1.75 billion with a maturity of
7 years.
The interest payable on the new senior bank loans is
based on the prevailing market reference rates plus a spread.
The spread is variable and depends on the ratio of Fresenius
Medical Care’s debt to EBITDA. Fresenius Medical Care has
largely limited its risk exposure to higher interest payments
from rising variable reference rates through appropriate
interest hedging instruments. The credit agreements contain
covenants that limit Fresenius Medical Care’s debt ratio and
require it to meet certain fixed-cost coverage ratios. There
are other restrictions, too, regarding collateral, asset disposals,
levels of capital expenditure, dividend payments, etc.
Fresenius Medical Care, Fresenius AG and HELIOS Kliniken
have long-term credit facilities with the European Investment
Bank (EIB). The agreements on the loans and credit lines
were concluded in 2005 and 2006. Under these facilities
Fresenius Medical Care has a credit line of € 221 million and
Fresenius AG a credit line of € 96 million until 2013. The
HELIOS Kliniken facility provides a credit line of € 100 million
and is due for repayment in 2019. The credit lines, which are
still only partly drawn, provide additional room for maneuver
and, because of their structure, allow greater financing flexi-
bility.

20 Management Report2020
In January 2006, a bond was issued to partially finance the
HELIOS acquisition. This bond generated gross proceeds of
€ 1 billion. The size of the issue was initially € 700 million
but was increased in order to exploit an advantageous oppor-
tunity to refinance a € 300 million bond issued in 2003 and
due in 2009. We offered to redeem this bond at 105.168%
of its nominal value in January 2006. This offer was accepted
by bondholders representing 71%, or about € 212 million of
the issue. We exercised our call option on the remaining
€ 88 million, enabling us to redeem the outstanding volume
on April 30, 2006.
The new bond comprises one tranche with a nominal value
of € 500 million, a maturity of 7 years and an annual interest
rate of 5.0% and a second tranche with a nominal value of
€ 500 million, a maturity of 10 years and an annual interest
rate of 5.5% as well as a call option for the issuer after five
years.
The terms of the bond contain the usual conditions. These
limit certain payments, such as dividends and share buy-
backs and place restrictions on increasing debt beyond refi-
nancing and on an agreed financing cushion if the EBITDA/-
interest ratio falls below 2.5. We believe this agreement gives
us enough room to maneuver and achieve our goals without
limiting our financial flexibility.
The HUMAINE Kliniken acquisition was partly financed
by a capital increase against assets in kind. 176,540 ordinary
shares and 176,540 preference shares were issued. The cap-
ital increase was recorded in the Commercial Register on
November 17, 2006.
Fresenius AG has a commercial paper program under
which up to € 250 million in short-term notes can be issued.
No commercial papers were outstanding as of December 31,
2006 (December 31, 2005: € 22 million).
On October 13, 2006 Fresenius AG signed a syndicated credit
agreement in an amount of € 350 million with a group of
banks. This is a revolving credit line with a tenor of five years.
It was not utilized in 2006. This credit line replaces a € 100
million syndicated credit facility of Fresenius AG and a € 115
million syndicated credit line of HELIOS Kliniken GmbH.
The Fresenius Group has drawn about € 3.4 billion of
bilateral and syndicated credit lines. In addition, on December
31, 2006 the Group had more than € 1.9 billion in unused
credit lines at its disposal (including confirmed credit lines
of € 1.4 billion). These credit facilities are generally used for
covering corporate purposes and are – except the Fresenius
Medical Care credit agreement – usually unsecured.
As of December 31, 2006, both Fresenius AG and Fresenius
Medical Care AG, including all subsidiaries, complied with the
covenants under all the credit agreements.
Effect of off-balance-sheet financing instruments on the
financial position and assets and liabilities
Fresenius is not involved in any off-balance-sheet transactions
that could have or will have a significant impact on its financial
position, expenses or earnings, results of operations, liquidity,
investments, assets, or capitalization.
Liquidity analysis
In 2006, key sources of liquidity were operating cash flow
and short, medium and long-term debt. Cash flow from oper-
ations is influenced by the profitability of Fresenius’ business
and by working capital, especially accounts receivable. Cash
flow can be generated from short-term borrowings through
the sale of receivables under the Fresenius Medical Care
accounts receivable securitization program, which is included
in the balance sheet, as well as through the use of the com-
mercial paper program. Medium and long-term funding is
provided by the revolving credit facilities of Fresenius Medical
Care, the revolving credit facilities of Fresenius AG, bonds
issued by Fresenius AG, bilateral bank credit agreements

21Management Report
and trust preferred securities issued by Fresenius Medical
Care. Fresenius believes that the existing and new credit
facilities as well as the operating cash flow and additional
short-term borrowings are sufficient to meet the Company’s
foreseeable liquidity needs.
Dividend
The Management and Supervisory Boards will propose a
dividend increase to the Annual General Meeting. For 2006,
a dividend of € 0.57 per ordinary share and € 0.58 per prefer-
ence share is proposed. This is an increase of about 15%
on the basis of the dividend of € 0.49 per ordinary share and
€ 0.50 per preference share for 2005 adjusted for the share
split. The total dividend distribution will be € 88.8 million
(2005: € 75.8 million).
Cash flow analysis
The Group cash flow statement shows a positive development.
Group cash flow increased by 33% to € 1,050 million in
2006 (2005: € 792 million) due to the excellent growth in
net income. The change in working capital was € 8 million
(2005: € -8 million). This was mainly due to improvements in
working capital management whereas net tax payments and
other payments related to the divestiture of dialysis clinics
and the Renal Care Group acquisition, as well as by an US tax
payment for the years 2000 and 2001 had a negative effect.
Operating cash flow was € 1,058 million in 2006 (2005:
€ 784 million). It was more than sufficient to meet all the
financing needs for investing activities, excluding acquisi-
tions. Cash used for capital expenditure totaled € 595 mil-
lion, while proceeds from the sale of property, plant and
in million € 2006 2005
Net income before minority interest 635 471
Depreciation and amortization 406 325
Change in pension provisions 9 -4
Cash flow 1,050 792
Change in working capital 8 -8
Operating cash flow 1,058 784
Property, plant and equipment -595 -357
Proceeds from the sale of property, plant and equipment 18 22
Cash flow before acquisitions and dividends 481 449
Cash used for acquisitions/proceeds from disposals -3,219 -1,606
Dividends -171 -132
Free cash flow after acquisitions and dividends -2,909 -1,289
Cash provided by/used for financing activities (without dividends paid) 2,931 1,388
Effect of exchange rate changes on cash and cash equivalents -13 13
Change in cash and cash equivalents 9 112
The detailed cash flow statement is shown in the consolidated financial statements.
CASH FLOW STATEMENT (SUMMARY)

22 Management Report2222
equipment amounted to € 18 million (2005: € 357 million and
€ 22 million, respectively). Cash flow before acquisitions
and dividends came to € 481 million (2005: € 449 million),
sufficient to finance all Group dividends of € 171 million and
10% of the net acquisitions in 2006. The remaining balan-
ce was financed with debt.
Cash from financing activities (including dividend pay-
ments) amounted to € 2,760 million in 2006 (2005: € 1,256
million). In 2006, these were primarily influenced by the
financing related to the acquisition of Renal Care Group. In
addition to the acquisition spending, Group dividend pay-
ments led to a cash outflow of € 171 million in 2006 (2005:
€ 132 million), with the Fresenius AG dividend accounting
for € 76 million (2005: € 56 million). Cash and cash equiva-
lents amounted to € 261 million on December 31, 2006
(December 31, 2005: € 252 million).
Investments and acquisitions
The Fresenius Group invested € 4,320 million in 2006 (2005:
€ 2,251 million). Investment in property, plant and equipment
and in intangible assets amounted to € 606 million (2005:
€ 357 million). Acquisitions accounted for € 3,714 million
(2005: € 1,894 million). Of the total investment volume in 2006,
14% was invested in property, plant and equipment and in
intangible assets. 86% was invested in acquisitions.
The table below shows the distribution of investments by
business segment. The chart shows the regional breakdown.
The high cash outflow for acquisitions related mainly to
the acquisition of Renal Care Group. Funds were also invested
for the expansion of our global dialysis care business and in
dialysis-related drugs at Fresenius Medical Care. At Fresenius
ProServe, the expenditure was primarily for the acquisition of
HUMAINE Kliniken.
in million € 2006 2005
Thereof property,plant and
equipment andintangible assets
Thereof acquisitions Change % of total
Fresenius Medical Care 3,934 361 373 3,561 - 91%
Fresenius Kabi 131 355 117 14 -63% 3%
Fresenius ProServe 245 1,519 106 139 -84% 6%
Corporate/Other 10 16 10 0 -38% 0%
Total 4,320 2,251 606 3,714 92% 100%
INVESTMENTS BY BUSINESS SEGMENT
CASH FLOW STATEMENT IN MILLION €
Change in working capital
Operating cash flow
Capital expenditure (net)
Cash flow (before acquisitions and dividends)
Acquisitions and dividends
Free cash flow (after acquisitions and dividends)
1,050
8
1,058
577
- 2,909
Cash flow
INVESTMENTS BY REGION
North America 88%
Other regions 1%
Asia-Pacific 1%
2006: € 4,320 million
Europe 10%
3,390
481

23Management Report
The main investments in property, plant and equipment and
in intangible assets were as follows:
b Start-up of new dialysis clinics, primarily in the United
States, and expansion and modernization of existing
clinics
b Expansion and modernization of production sites at
Fresenius Medical Care and Fresenius Kabi
b Hospital modernization at Fresenius ProServe. The largest
single investment is the construction of the new clinic in
Berlin-Buch.
Investments in property, plant and equipment of € 149 milli-
on will be made in 2007 to continue with major investment
projects that were already underway on the reporting date.
These are chiefly investment obligations for hospitals at
Fresenius ProServe as well as investments to expand and
optimize production plants. These projects will be financed
from operating cash flow.
ASSETS AND LIABILITIES
Asset and liability structure
The total assets of the Group rose by € 3,422 million (29%)
to € 15,024 million (December 31, 2005: € 11,602 million). At
constant exchange rates, this was an increase of 38%. Of this
strong growth, 33% is attributable to the acquisitions of 2006,
especially Renal Care Group. The expansion of existing
business activities accounted for 5% of the increase in total
assets. Inflation had no significant impact on the assets of
Fresenius.
Non-current assets were € 11,176 million (2005: € 8,259
million). Based on the exchange rates as of December 31,
2005, this was an increase of 45%, and was driven mainly by
additions to property, plant and equipment as well as good-
will. Goodwill from acquisitions in 2006 was € 2,813 million
as at December 31, 2006, of which € 2,679 million resulted
from the acquisition of Renal Care Group.
Current assets rose by 15% to € 3,848 million (2005:
€ 3,343 million). At constant exchange rates this is an increase
of 21%. Within current assets, trade accounts receivable
rose to € 2,088 million, primarily due to business expansion
resulting from acquisitions (2005: € 1,871 million). Adjusted
for currency effects, receivables grew by 18%. Benefits
resulted from more efficient receivables management. Days
sales outstanding improved further to 71 days (2005: 79 days).
Scope of inventory was also improved in 2006 to 38 days
(2005: 48 days). These improvements were mainly driven
by the consolidation of the Renal Care Group and HELIOS
Kliniken.
DEVELOPMENT OF INVESTMENTS,
OPERATING CASH FLOW, DEPRECIATION AND
AMORTIZATION IN MILLION €
Investments Operating cash flow Depreciation and amortization
2006
IFRS
2002
US GAAP
2004
IFRS
325
4,320
406341
1,058
697
2003
US GAAP
2005
IFRS
860
317
2,251
776 784
325
507 430 432

24 Management Report2424
Shareholders’ equity including minority interest rose by 11%
to € 5,798 million (2005: € 5,204 million). Adjusted for cur-
rency effects, the increase was 19%. Group net income
increased shareholders’ equity by € 330 million. The capital
increase against assets in kind in the fourth quarter of 2006
to partly finance the HUMAINE Kliniken acquisition had
an effect of € 42 million. The equity ratio, including minority
interest decreased from 44.9% as of December 31, 2005 to
38.6% at the end of 2006.
The liabilities and equity side of the balance sheet shows
a solid financing structure. Shareholders’ equity of the Group
including minority interest covers 52% of non-current assets
(2005: 63%). The change versus 2005 is due to the debt
financing of the Renal Care Group acquisition. Shareholders’
equity, minority interest and long-term liabilities encompass
all non-current assets and inventories.
Long-term liabilities amounted to € 6,177 million as of
December 31, 2006, an increase of € 2,857 million or 86%
compared with the previous year’s figure of € 3,320 million
(see pages 19 and 20 – Financing). In constant currency, the
increase was 97%. Short-term liabilities were € 3,049 mil-
lion, 1% below the previous year’s figure of € 3,078 million
(5% in constant currency).
The Group has no significant accruals. The largest single
accrual is to cover the settlement of fraudulent conveyance
claims and all other legal matters relating to the National
Medical Care 1996 transaction resulting from the bankruptcy
of W.R. Grace. This accrual amounts to US$ 115 million
(€ 87 million). Please see page 116 of the Notes for details.
Bank loans, Eurobonds, Euro Notes and trust preferred
securities of the Group increased, primarily as a result of
the acquisition of Renal Care Group, to € 5,879 million
(December 31, 2005: € 3,502 million); in constant currency:
€ 6,294 million. Of the Group’s financial liabilities, 60% are
in US dollars. Liabilities due in less than one year amounted
to € 603 million (December 31, 2005: € 1,047 million), while
liabilities with a remaining tenor of one to five years and over
five years amounted to € 5,276 million (December 31, 2005:
€ 2,455 million).
The net debt to equity ratio including minority interest
(gearing) now stands at 96.9% due to the debt financing of
the Renal Care Group acquisition (2005: 62.5%). The return
on equity after taxes reached 10.3% (2005: 11.2%). The
return on total assets after taxes and before minority interest
was 4.3% in 2006 (2005: 4.9%). In calculating the profitability
ratios, Renal Care Group business was included in the respec-
tive items of the statement of income on a full-year basis.
The table below shows other key asset and capital ratios:
Currency and interest risk management
On December 31, 2006, the nominal value of all foreign cur-
rency hedging contracts was € 1,186 million. These contracts
had a market value of € 4 million. The nominal value of interest
rate hedging contracts was € 2,911 million. These contracts
had a market value of € 35 million. Please see the Risk Report
on page 32 and the Notes on pages 120 to 125 for further
details.
Dec 31, 2006 Dec 31, 2005
Debt/EBITDA* 3.1 2.5
Net debt/EBITDA* 3.0 2.3
EBITDA*/interest ratio** 4.6 6.4
* includes EBITDA of Renal Care Group for the full year 2006, excluding EBITDA and proceedsfrom the sale of the US dialysis clinics
** before one-time refinancing expenses

25Management Report
NON-FINANCIAL PERFORMANCE INDICATORS
AND OTHER SUCCESS FACTORS
EMPLOYEES
The Fresenius Group had 104,872 employees worldwide at
the end of 2006, an increase of 12,901 or 14% (December 31,
2005: 91,971). This is mainly due to the Renal Care Group
acquisition.
The numbers of employees in the business segments were
as follows:
In the segment Corporate/Other the increase was attributable
to e.g. Fresenius Netcare and Fresenius Biotech.
The chart shows the distribution of our employees by
region. These percentages roughly correspond to the sales
contributions of the respective continents. In Germany, 31,955
people are employed (2005: 29,975). The increase in Germany
is mainly due to the acquisition of HUMAINE Kliniken.
Personnel expenses for the Fresenius Group came to
€ 3,959 million in 2006 (2005: € 2,479 million). Personnel
expenses per employee were € 39,700 (2005: € 34,700).
HELIOS Kliniken was the first private hospital group to nego-
tiate a group wage tariff agreement with the trade union
Marburger Bund in December 2006 and with the trade union
ver.di in January 2007 for all employees of the clinics covered
so far. Otherwise, there were no significant changes to com-
pensation or employment agreements in 2006.
PROCUREMENT
The efficient procurement of goods and services is important
for Group profitability since the health care sector faces cost
containment pressure from health insurers as well as price
pressure. We are constantly striving to optimize our pur-
chasing processes, to tap new procurement sources and to
achieve the best possible pricing structures while remaining
flexible and maintaining our strict quality and safety stand-
ards. Fresenius coordinates global procurement centrally
enabling us to bundle similar requirements and negotiate
global framework agreements. These central coordinating
offices organize purchasing for the production sites and
arrange comprehensive quality and safety checks of pur-
chased goods. Current market and price developments are
analyzed on an ongoing basis. We are also endeavoring to
optimize our procurement logistics.
North America 37%
Europe 49%
Asia-Pacific 5%
Latin America and
other regions 9%
2006: 104,872
EMPLOYEES BY REGION
Number of employees Dec 31, 2006 Dec 31, 2005 Change
Fresenius Medical Care 59,996 50,250 19%
Fresenius Kabi 15,591 14,453 8%
Fresenius ProServe 28,615 26,664 7%
Corporate/Other 670 604 11%
Total 104,872 91,971 14%

26 Management Report2626
Since the supply agreements for electricity and gas at Fresenius
Medical Care had been concluded when market prices were
still low, purchasing prices were held stable in 2006. Oil price
rises prevented savings in our sourcing of plastics even
at higher volumes and bundling effects. We were similarly
impacted with regard to various types of foil used in product
packaging.
In 2006, Fresenius Medical Care concluded a five-year
agreement with the biotechnology firm Amgen for the supply
of EPOGEN and Aranesp in the United States and Puerto Rico.
Amgen is the only supplier of these two products in the United
States. The new agreement replaces the previous supply agree-
ment and runs from October 1, 2006 to December 31, 2011.
At Fresenius Kabi, too, sharply increased prices for heating
oil, gas and electricity were a central focus of negotiations in
2006. Through sourcing projects it was possible to conclude
supply contracts for 2006 at prices well below the market level.
Energy prices were also a key issue for products requiring a
high energy input, such as glass for packaging and aluminum
for fastenings. By bundling requirements we were able to keep
the rise in prices at a moderate level.
Products derived directly from crude oil were also heavily
affected by the increase in oil prices. Here, a supply contract
concluded in 2005 for certain plastics allowed prices to be
adjusted to market levels on a quarterly basis during the year
2006. However, this still led to much higher prices than in
2005.
Marked benefits have been felt from a multiyear supply
agreement concluded at the end of 2003 for cardboard boxes.
The agreement prevented a number of increases in paper
prices implemented in the past, leading to a moderate price
rise only in 2006.
Various projects for the strategic sourcing of active sub-
stances used in our drugs are producing very good results.
We have been able to bundle requirements and now procure
a number of goods directly from the manufacturer, achieving
substantial price reductions. Tapping new sources has also had
a positive effect.
The synergy project for starch derivatives implemented world-
wide between Fresenius Kabi and Fresenius Medical Care
has been very successful. Since we had already fixed the
prices back in 2004, some of our purchasing prices in 2006
were partly well below the prevailing market level despite the
rise in energy and grain prices. Further synergy projects were
initiated within the Fresenius Group in 2006.
QUALITY MANAGEMENT
Our process-oriented quality management fulfills ISO 9001:
2000 standards and is designed to meet the demands of our
customers. The quality of our products as well as the business
processes and additional services and therapies that we pro-
vide are all covered. The quality management system inte-
grates all product groups, such as drugs, medical products
and nutrition, and also includes clinics. The system is regularly
evaluated through internal quality audits and external certifi-
cation bodies. Its effectiveness was again confirmed in 2006.
Our products are closely controlled already at the devel-
opment stage. Our drugs are subject to regulatory approval,
so that appropriate documentation has to be submitted to the
regulatory authorities for scrutiny. Medical devices undergo
a conformity assessment procedure that documents compliance
with the appropriate norms. In enteral nutrition, we already
follow the Hazard Analysis Critical Control Point (HACCP)
principle during the development process.
We have established quality assurance systems in all our
production facilities. In addition to the controlled use of raw
materials, validated production procedures as well as ambience
and in-process controls, each batch also undergoes final con-
trols and a formal release procedure. Our production facilities
are regularly inspected by regulatory authorities or other
independent institutions. All audits and inspections led to the
renewal of the respective manufacturing authorization or
certification.

27Management Report
Sales and marketing are also an integral part of the quality
management system. For example, at any given time we are
able to trace which batch was supplied to which customer.
ISO 9001:2000 quality management standards were intro-
duced in about 40 more European dialysis clinics in 2006.
Approximately 65% of Fresenius Medical Care’s clinics in
Europe are now certified – compared to about 55% in 2005.
To assess quality in dialysis care, we use the generally
accepted quality parameters customary in dialysis, such as the
hemoglobin values. Hemoglobin mainly serves to transport
oxygen from the respiratory organs to the body tissues that
use oxygen. Our patients should have a hemoglobin level of
at least 11 grams per deciliter of blood. The average hemoglo-
bin value for healthy people is only slightly above that. Other
indicators we use to assess treatment quality include phos-
phate level and the so-called Kt/V value, which measures the
effectiveness of the dialysis treatment on the basis of the fil-
tration rates for certain given toxic molecules in relation to
the length of the treatment. Another important indicator for
treatment quality is the number of days which the dialysis
patients have to spend in the hospital.
At Fresenius Kabi, the Clinico sites acquired at the end
of 2005 were integrated into the quality management system.
All processes at the four locations were reviewed in an inter-
nal quality audit. In addition, all of Fresenius Kabi’s European
sales organizations were included in the ISO 9001:2000 certi-
fication process.
In India, our production site in Ranjangaon, which already
manufactures according to local and WHO-GMP standards,
was certified to European Good Manufacturing Practice (EU-
GMP) standards. This plant is the third production facility in
the Asia-Pacific region to receive this certification. Among
other things, Ranjangaon produces intravenously administered
drugs. The Chinese plants in Wuxi and Beijing already have
this certification.
The plant in Graz, Austria, which specializes in the production
of parenteral nutrition and intravenously administered drugs,
is already certified to EU-GMP, WHO-GMP, ISO 9001:2000 and
ISO 13485:2003 standards. In 2006, this production site was
also inspected successfully by the US Food and Drug Adminis-
tration (FDA). The FDA examines whether the manufacturing
facilities and procedures for a given product comply with US
standards. When this “pre-approval” inspection and the regu-
latory approval process have been completed, the product can
be exported to the United States. This inspection took place
in 2006 and we expect to receive an official approval of the
production facility in 2007.
SALES, MARKETING AND LOGISTICS
Long-term, trustful cooperation with our customers is an
essential basis for sustainable growth. We strive to guarantee
to our customers top quality and top service together with
reliable logistics and product availability. Thanks to its broad
product portfolio and long experience, Fresenius has been
able to build and maintain close relationships with its custom-
ers worldwide. Close cooperation between Sales and Research
and Development enables the Company to integrate concepts
and ideas generated by the sales force regarding the devel-
opment of products. Fresenius has its own sales organizations
with trained salespersons. The sales teams coordinate direct
sales promotion measures, including visits to doctors, medical
specialists, hospitals and clinics. The Company also employs
external distributors in countries where we do not have our
own sales force.

28 Management Report2828
Fresenius’ products are shipped by the production plants
to central warehouses, which are mostly located not far from
the production sites. These central warehouses dispatch
the products to the regional warehouses which then distribute
them to the clinics and other customers, or directly to a
patient’s home.
The business segments offer after-sales services, training
in the local language, technical support, servicing &mainte-
nance and warranty arrangements in every country in which
Fresenius sells its products. Product training is also provided
at the Company’s production sites. Regional service centers
are operated, which are responsible for day-to-day interna-
tional service support.
The business segments have the following customer
structure:
Dialysis clinics and hospitals are Fresenius Medical Care’s
main customers in its products business. In dialysis care,
approximately 38% of Fresenius Medical Care’s revenues are
derived from the US Government’s Medicare/Medicaid pro-
grams, about 62% from private and other heath care payors
and from hospitals.
Fresenius Kabi has a broadly diversified customer base.
This includes hospitals, wholesalers, purchasing associations,
medical and similar institutions, hospital operators and home
care patients. There is no significant dependence on one
source of revenue.
In the hospital operations business, Fresenius ProServe’s
customers are social security institutions, health insurers and
private patients. In the engineering and services business, cus-
tomers include public and private hospitals and other health
care facilities.
OVERALL ASSESSMENT OF THE BUSINESS
SITUATION
At the time this Group Management Report was prepared, the
Management Board continued to assess the development of
the Fresenius Group as positive. Our products and services
are in strong demand around the world. Operating perform-
ance in the first weeks of 2007 has been fully in line with our
expectations, with further increases in sales and earnings.
OPPORTUNITIES AND RISK REPORT
Through the expansion, especially in international markets,
and the complexity and dynamics of our business, the
Fresenius Group is exposed to a number of risks. These risks
are directly related to business activity and have to be accom-
modated if opportunities are to be exploited.
As a provider of often life-saving products and services for
the severely and chronically ill, we are relatively independent
of economic cycles. Our experience in the development and
manufacture of products as well as in our markets serves as
a solid basis for a reliable assessment of risks. At the same
time, the health care market offers the Fresenius Group wide-
ranging opportunities for sustainable growth and expansion of
which we will continue to take advantage of.
OPPORTUNITIES MANAGEMENT
Managing opportunities is an ongoing, integral part of corpo-
rate activity aimed at securing the Company’s long-term suc-
cess. In this way we can tap new potential and consolidate and
improve on what we have already achieved. Opportunities
management is linked to the Fresenius Group’s long-term
strategy and medium-term planning. The Group’s decentral-
ized and regional management structure enables early iden-
tification of trends and requirements in our often fragmented
markets, and we can respond to them flexibly and in line with
local market needs. Furthermore, we maintain regular con-

29Management Report
tact and dialogue with research groups and institutions, and
keep a close watch on markets and competitors in order to
identify opportunities. Within the Group, opportunities and
synergies can be tapped through continuous communication
involving the exchange of information and know-how between
the various business segments.
We will continue to exploit all available opportunities.
Anticipated future opportunities for the Fresenius Group are
discussed in the Outlook starting at page 35.
RISK MANAGEMENT
Like opportunities management, risk management is a con-
tinuous process. Identifying, analyzing and controlling risks
are key tools of Group management. The Fresenius risk man-
agement system is closely linked to the corporate strategy and
is based on its guidelines. Through the combination of our
internal monitoring system, our risk controlling and an early-
warning system derived from our risk management system,
we can identify and counteract at an early stage those potential
developments which could threaten the companies’ future.
Responsibilities for the processes and for monitoring risks
in the individual business segments have been assigned as
follows:
b Risk situations are evaluated regularly using standard-
ized processes and compared with given requirements.
Responses can be initiated at an early stage should neg-
ative developments emerge.
b The managers responsible are required to report any
relevant changes in the risk profile without delay to
the Management Board.
b Markets are kept under constant observation and close
contacts maintained with customers, suppliers and
institutions. These practices allow us to swiftly identify
and react to changes in our business environment.
Risk management measures are supported both at Group level
and in the individual business segments by our risk controlling
measures as well as our management information system.
Based on detailed monthly and quarterly financial reports,
deviations in earnings and assets from budget figures can
be identified and analyzed. In addition to risk management,
a monitoring system has been established comprising organ-
izational processes and measures as well as internal controls
and audits. Our risk management system is regularly evaluated
and, if necessary, adjusted to allow prompt reaction to changes
in the markets. This system has proved effective to date.
The international operations of the Fresenius Group expose
us to a variety of currency risks. In addition, the financing of
the business exposes us to certain interest rate risks. We use
derivative financial instruments as part of our risk management
to avoid possible negative impacts of these risks. However,
we limit ourselves to non-exchange traded, marketable instru-
ments, used exclusively to hedge our operations and not for
trading or speculative purposes.
The Fresenius Group’s currency and interest rate risk
management activities are based on a policy approved by the
Management Board that defines the targets, organization and
handling of the risk management processes. In particular, the
guidelines assign responsibilities for risk determination, the
execution of hedging transactions and for the regular reporting
of risk management activities. These responsibilities are coor-
dinated with the management structures in the other business
areas of the Group. Hedging transactions using derivatives
are carried out solely by the Corporate Treasury Department
of the Fresenius Group, apart from a few exceptions in order
to adhere to foreign currency regulations, and are subject
to stringent internal controls. This policy ensures that the
Management Board is fully informed of all significant risks
and current hedging activities.

30 Management Report3030
The functionality and effectiveness of the risk management
system is reviewed as part of the audit of the annual financial
statements. Conclusions arising from the audit are taken into
account in the ongoing refinement of our risk management
system.
RISK AREAS
The main risk areas for the operations of the Fresenius Group
are as follows:
b General economic risks
From today’s point of view, the development of the global
economy presents no significant risk to the Fresenius
Group. In 2007, we expect overall economic growth to con-
tinue. For the Fresenius Group, we therefore expect con-
tinued strong demand for our life-saving and life-sustain-
ing products and services.
b Risks in the general operating framework
The risk situation for each business segment depends on
the development of its markets. Therefore, political, legal
and financial conditions are monitored and evaluated
carefully. In addition, the growing internationalization of
our markets requires us to keep abreast of country-specific
risks.
b Risks in the health care sector
Risks related to changes in the health care market are of
major importance to the Fresenius Group. The main risks
are the development of new products and therapies by
competitors, the financing of health care systems and
reimbursement in the health care sector. This applies
especially in the United States, where a large portion of
our sales are generated, and where e.g. changes in the
reimbursement system could have an impact on our busi-
ness. The same is true for the hospital market in Germany.
Hospitals will have to contribute with a lump-sum toward
improving the finances of the German public health insur-
ance system. The introduction of Diagnosis Related Groups
is intended to increase the efficiency of hospitals while
reducing expenditure in the health care system. Patients
are largely assigned to hospitals by the public health and
pension insurers. It is therefore especially important for
the Company that the contracts between its hospitals and
the insurers and health care institutions are maintained.
For this reason, we not only continually monitor legislative
changes but proactively work together with governmental
health care institutions. Furthermore, our close ties with
the medical and scientific communities allow us to identify
and support relevant technological innovations and keep
abreast of current developments in alternative treatment
methods. This allows us to evaluate and adjust our corpo-
rate strategy if necessary.
b Operating risks
b Production, products and services
We confront potential risks in production and services with
the following measures: Compliance with product and
manufacturing regulations is ensured by quality man-
agement systems in accordance with the internationally
recognized quality standards ISO 9001 and ISO 9002
and the corresponding internal standards as defined, for
example, in our quality and work procedure manuals.
Regular audits are carried out by quality management offi-
cers at the Group’s production sites and dialysis clinics in
order to test compliance with all regulations in all areas –
from management and administration to production and
clinical services and patient satisfaction. Our production
facilities comply with the international “Good Manufac-
31Management Report
turing Practice” (GMP) guidelines and other internationally
and nationally recognized standards. In addition, the
quality management and compliance programs document
and ensure that business is performed in line with high
ethical standards and in accordance with official proce-
dures. Internal and external audits review the legality
and efficiency of our operations and the effectiveness of
our internal monitoring systems. Potential risks, such as
those arising from the start-up of a new production site
or the introduction of new technologies, are countered
through careful planning, regular analysis and continual
progress reviews.
Performing medical procedures on patients in our hos-
pitals and postacute care clinics presents inherent risks;
at the same time operational risks, e.g. the need for strict
hygiene and sterile conditions can arise. We counteract
these risks with strict operating procedures, continuous
personnel training and patient-oriented working methods.
Risks can also arise from increasing pressure on our
product prices and from price increases on the procure-
ment side. For instance, changes in the United States in
the regulations concerning the reimbursement of erythro-
poetin (EPO), or a change in the dosage, could have a sig-
nificant impact on the sales and earnings of Fresenius. EPO
is a hormone used in dialysis that stimulates the production
of red blood cells. An interruption in supply or worsening
procurement conditions for EPO could also reduce
revenues and significantly increase Fresenius’ costs.
Fresenius Medical Care has entered an agreement with
Amgen for the supply of EPO in the United States and
Puerto Rico. Amgen is the sole supplier of EPO in the
United States. The agreement runs until December 31, 2011.
Reimbursement and revenues from the administration of
EPO accounted for approximately 9% of total sales of the
Fresenius Group in 2006.
b Research and development
The development of new products and therapies always
carries the risk that the development target is not achieved.
Regulatory approval of new products requires comprehen-
sive, cost-intensive preclinical and clinical studies. The
Fresenius Group spreads its risk widely by conducting
development activities in various product segments. We
also counteract risks from research and development pro-
jects by regularly analyzing and assessing development
trends and examining the progress of research projects.
We also strictly comply with the legal regulations for clin-
ical and chemical-pharmaceutical research and develop-
ment.
b Risks from the integration of acquisitions
The integration of acquisitions or potential acquisitions
carries risks that can adversely affect assets and liabilities,
the financial position and results of operations of Fresenius.
Following an acquisition, the infrastructure of the acquired
company must be integrated while legal questions and
contractual obligations are clarified. Marketing, patient
services and logistics must also be unified. Ongoing busi-
ness processes as well as relationships with customers
can be harmed by losing key managers during integration.
The integration process could prove to be more difficult
and cost-intensive or last longer than expected. Risks could
arise from the operations of the newly acquired company
that Fresenius believed to be insignificant or was unaware
of. An acquisition may also prove to be less beneficial than
initially expected.

32 Management Report3232
b Personnel risks
Risks in personnel marketing are not considered to be
significant. Nevertheless, the Group uses comprehensive
recruiting and personnel development programs to coun-
teract a possible shortage of skilled personnel. Fresenius
counters the general shortage of specialized hospital
personnel through targeted personnel marketing measures
to recruit a qualified and dedicated workforce, and thus
ensure the high standards of treatment quality. At the same
time, young people should become qualified and be com-
mitted to the Company. At the end of 2006 for instance,
HELIOS Kliniken signed the first-ever group wage tariff
agreement in Germany that pays medical students a
monthly compensation during their one-year internship.
This has put HELIOS at a considerable competitive advan-
tage over other hospital operators in recruiting staff.
b Financial risks
Potential financial risks can arise from exposure to foreign
currencies and interest rates. Controlling and limiting these
risks is an integral part of our risk management. We also
use derivative financial instruments to hedge against
interest rate and foreign currency risks. However, these
instruments are used solely for hedging current operations
and are not used for trading or speculative purposes.
Please see pages 120 to 125 of the Notes for further details.
The Fresenius Group is protected to a large extent
against currency and interest rate risks. As at December 31,
2006, 79% of the Fresenius Group’s debt is protected
against increases in interest rates either by fixed-rate
financing arrangements or by interest rate hedges. Only
21% or € 1,245 million is exposed to an interest rate risk.
A rise of 0.5% in the reference rates relevant for Fresenius
would have a less than 1% impact on Group net income.
As a globally active company, Fresenius has production
facilities in all the main currency areas. Consequently,
the increase in exposure to currency risks arising from
increased business activities is far lower than the growth
rate in sales.
Potential financial risks that could arise from acquisi-
tions and investments in property, plant and equipment and
intangible assets are assessed in advance. We perform
careful and in-depth reviews of the projects, sometimes
with the support of external consultants.
As a globally active company, Fresenius is widely
exposed to translation effects due to foreign exchange
rate fluctuations. The exchange rate of the US dollar to
the euro is of particular importance due to our extensive
operations in the United States.
Fresenius’ debt could limit its ability to pay dividends
or to implement its corporate strategy.
b Government reimbursement payments
Fresenius is subject to comprehensive government regu-
lations in nearly all countries where it is active. This is
especially true in the United States and Germany. In addi-
tion, Fresenius has to comply with general rules of law,
which differ from country to country. There could be far-
reaching legal repercussions if Fresenius fails to comply
with any of these laws or regulations. A large part of Group
revenue derives from government reimbursement pro-
grams such as the federal dialysis reimbursement pro-
grams in the United States under Medicare and Medi-
caid. Changes in law, or changes in the reimbursement
method, could affect the amounts of these payments
and could have a significant adverse impact on the assets
and liabilities, financial position and results of operations
of the Group.

33Management Report
b Legal risks
Risks that arise from legal issues are continually identified,
analyzed and communicated. At the beginning of 2003, a
definitive agreement was signed regarding the settlement
of fraudulent conveyance claims and all other legal matters
in connection with the National Medical Care transaction
in 1996 arising from the bankruptcy of W.R. Grace & Co.
Under the settlement agreement, Fresenius Medical Care
will pay a total of US$ 115 million into the W.R. Grace&Co.
bankruptcy estate or as otherwise directed by the court
upon plan confirmation. The settlement agreement has
been approved by the court. Also, subject to the confirma-
tion of the W.R. Grace & Co settlement agreement, claims
made out of court by certain private US health insurers
were also settled by an agreement. Consequently, all legal
issues resulting from the NMC transaction have been con-
cluded subject to plan confirmation. Please see pages 116
and 117 of the Notes for details.
In October 2004, Fresenius Medical Care Holdings, Inc.,
and its subsidiaries, received subpoenas from the U.S.
Department of Justice, Eastern District of New York. The
subpoenas require production of a broad range of docu-
ments relating to the companies’ operations, with specific
attention to documents relating to a certain hormone
test and vitamin D therapies for dialysis patients. Further-
more, in April 2005 Fresenius Medical Care Holdings, Inc.,
received a subpoena from the U.S. Department of Justice
in St. Louis (Missouri) in connection with civil and criminal
investigations. Documentation must be provided on clinical
quality programs, business development activities, com-
pensation of clinic managers, contractual relationships
with doctors, joint ventures, and our anemia treatment
therapy. Please see pages 118 and 119 of the Notes for
further details.
Furthermore, the Fresenius Group is involved in various
legal issues resulting from business operations and,
although it is not possible to predict the outcome of these
disputes, none is expected to have a significant adverse
impact on the assets and liabilities, financial position and
results of operations of the Group.
b Other risks
Other risks, including those involving our IT systems, are
not considered to be significant. IT risks are countered
through security measures such as controls and monitor-
ing. In addition, we counter these risks with constant
investment in hardware and software as well as by improv-
ing our system expertise.

34 Management Report3434
ASSESSMENT OF OVERALL RISK
The basis for evaluating overall risk is the risk management
system that is regularly audited by management. Potential risks
for the Group include factors outside or only partially within
its control, such as the development of national and global eco-
nomies, which Fresenius constantly monitors. Risks also
include factors immediately within its control, such as operat-
ing risks, which the Company anticipates and reacts to appro-
priately. Currently, there are no recognizable risks regarding
future performance that appear to present a long-term and
material threat to the assets and liabilities, financial position
and results of operations of the Group. We have created organ-
izational structures that include all the conditions needed to
quickly alert us to emerging risk situations.
CORPORATE RATING
The acquisition of Renal Care Group, Inc., which was financed
entirely with debt, led to a downgrade in the ratings of
Fresenius Medical Care and Fresenius AG. Standard&Poors
revised the ratings from BB+ to BB with “negative outlook”.
Moody’s lowered the ratings of Fresenius Medical Care and
Fresenius AG before the closing of the acquisition from Ba1
to Ba2. The outlook is “stable”. Given our intention to finance
the acquisition with debt, we had anticipated these down-
grades.
SUBSEQUENT EVENTS
CONVERSION OF FRESENIUS AG INTO A EURO-
PEAN COMPANY (SOCIETAS EUROPAEA, SE)
The Extraordinary General Meeting on December 4, 2006
approved the Management and Supervisory Boards’ proposal
to convert Fresenius AG into a European Company (SE). An
SE is a public limited company under European law.
After the successful expansion of the Group’s international
business and the strong growth in recent years, the conversion
is a consistent step in the Company’s development. The SE
is a modern legal form which underlines the Group’s interna-
tional business focus and facilitates the development of an
open and international corporate culture. The conversion
does not have any effect on the Company’s corporate structure
and management organization. The two-tier system consisting
of Management Board and Supervisory Board will remain
unchanged. The future Fresenius SE will continue to have a
Supervisory Board with twelve members and parity represen-
tation just like Fresenius AG today. However, the legal form
of an SE allows representatives of the employees from various
European countries to be represented on the Supervisory
Board. Retaining the present size of the Supervisory Board
will ensure that the efficiency and flexibility of the Company’s
corporate governance is preserved. Without the conversion to
an SE, the number of Supervisory Board members of Fresenius
AG would have had to be increased by eight to twenty because
of the increased number of employees in Germany. The change
of legal form will therefore enable Fresenius to continue its
well-proven corporate governance.
Fresenius will continue to be based and have its registered
office in Germany. Fresenius AG’s conversion to an SE will not
lead to the Company’s liquidation nor to the formation of a
new legal entity. The Company’s legal and economic identity
will be preserved. All shareholder’s stakes in Fresenius will
remain unchanged.
Rating Outlook
Standard&Poors BB negative
Moody’s Ba2 stable
RATING OF FRESENIUS AG

35Management Report
It is expected that the SE will be registered in the Commer-
cial Register in the third quarter of 2007, following the conclu-
sion of the employee participation procedure.
SHARE SPLIT WITH CAPITAL INCREASE FROM THE
COMPANY’S FUNDS
The Extraordinary General Meeting on December 4, 2006
approved a share split with capital increase from the Compa-
ny’s funds, tripling the number of shares outstanding. This
measure was registered in the Commercial Register on January
24, 2007, and the conversion of the stock quotation took
place on February 2, 2007. See page 5 of the Management
Report for further details. The share split is intended to pro-
mote trading activity in Fresenius shares and to increase the
shares’ attractiveness for a broader group of investors. The
share split arithmetically reduces the share price without affect-
ing the overall value for shareholders.
SALE OF PHARMAPLAN GMBH
In December 2006, Fresenius ProServe signed an agreement
for the sale of its subsidiary Pharmaplan GmbH to NNE A/S,
a subsidiary of Novo Nordisk A/S, Copenhagen. Pharmaplan
provides consulting, engineering and qualification/validation
services for production plants for the pharmaceutical industry
worldwide. The transaction is expected to be completed in
the first quarter of 2007 after approval by the antitrust author-
ities.
The Pharmaplan subsidiary Pharmatec, which is not part
of the transaction, is to be sold at a later date. Pharmatec
manufactures high quality pure steam, pure water and sterili-
zation equipment for the pharmaceutical industry.
With this divestitures, Fresenius ProServe is focusing on its
business with hospitals and other health care facilities through
HELIOS Kliniken Group and VAMED.
FRESENIUS MEDICAL CARE EXPANDS IN ASIA
Fresenius Medical Care has acquired a 51% stake in the
dialysis services provider Jiate Excelsior Co. Ltd. (Excelsior),
Taiwan. Excelsior is the leading provider of dialysis care in
Taiwan, with a market share of about 14%, and currently treats
over 6,500 patients in 90 dialysis clinics. Fresenius Medical
Care expects Excelsior to contribute about US$ 80 million to
sales in 2007 and to be accretive to earnings. The price of the
51% stake is US$ 38 million. The acquisition still has to be
approved by the antitrust authorities in Taiwan.
Otherwise, no major changes in the situation of the Company
or our sector have occurred since the beginning of 2007. There
are also no plans for major changes to the structure and
administration of the Group or in human resources. No
other events of material importance have occurred since the
close of the fiscal year.
OUTLOOK*
This Management Report contains forward-looking statements,
including statements on future sales, expenses and invest-
ments as well as potential changes in the health care sector,
our competitive environment and our financial situation.
These statements were made on the basis of the expectations
and assessments of the Management Board regarding events
that could affect the Company in the future. Such forward-
looking statements are subject as a matter of course to risks,
uncertainties, assumptions and other factors, so that the actual
results, including the financial position and profitability of
Fresenius, could therefore differ materially – positively or nega-
tively – from those expressly or implicitly assumed or described
in these statements. For further information, please see our
Risk Report on pages 28 f.
* Targets according to US-GAAP

36 Management Report3636
GENERAL OUTLOOK
The outlook for the Fresenius Group for the coming years
continues to be very positive. Going forward, we expect sales
growth of 6 to 8% in constant currency. Earnings are expected
to rise at a higher rate, with further improvements in profit-
ability.
Acquisitions have led to a much higher level of debt within
the Group, with related effects on net interest. Our goal is to
improve the Group’s debt ratios.
Excellent growth opportunities for Fresenius are presented
above all by
b the sustained growth of the markets in which we operate
b the development of innovative products and therapies
b the expansion of our regional presence
b the broadening of our services business, and
b selective acquisitions to strengthen our product portfolio
and regional presence.
ECONOMIC OUTLOOK
The present dynamic of the world economy is likely to weaken
slightly in 2007. However, the expansion in Europe and in the
emerging countries of Asia should continue, despite slightly
slower growth rates, and largely compensate for the more
pronounced downturn in the United States and Japan. The rel-
atively strong growth dynamic in countries such as China and
India should help to keep the expected dip in growth in the
industrial countries fairly short. Inflation rates should remain
low in 2007. With the slowdown expected in the United States,
the US dollar will probably depreciate both against the euro
and against the Asian currencies.
b Europe
The economic trend in the Eurozone will remain robust in
2007, but growth will be more moderate than in 2006. A
slight dip is expected at the beginning of 2007. However,
this should be overcome again in the second half of the
year at the latest. GDP growth of about 2% should be with-
in reach for the full year. A weakening global economy and
a further appreciation of the euro could be factors leading
to the expected slower economic growth in the Eurozone.
As a result of the more restrictive fiscal policy, the upturn
in domestic demand is also expected to be damped down.
Economists predict GDP growth of 1.5% for Germany.
The main reasons for the lower growth as compared with
2006 are seen in the economic slowdown in the United
States and the VAT increase in Germany.
b United States
Growth in private consumer spending should be somewhat
more moderate in 2007 due to static property prices
and slower growth in employment. Consumer spending
is also likely to be curbed by a rise in the savings ratio.
Since weaker growth should dampen inflation, the Fed-
eral Reserve will probably lower rates in the course of the
year. The budget deficit should stabilize in 2007, helped
not least by the slightly higher savings ratio expected. All
in all, GDP growth of about 2.0% is forecast for 2007.
b Asia
GDP growth in Asia is expected to be about 8% in 2007
(without Japan). China’s growth will continue in 2007 at
an only marginally slower pace. Despite declining demand
from the United States, the country’s export dynamic will
barely weaken thanks to its highly competitive export
industry. Growth of 9.5% is forecast for China. Japan’s

37Management Report
economy could see a temporary dip in growth. Less stimu-
lus from monetary policy and budget consolidation efforts
in the form of lower government spending will have a
dampening effect. GDP growth of about 1.8% is forecast
for Japan.
b Latin America
Economic growth in Latin America should continue at a
slightly weaker pace in 2007. On the one hand, commodity
and energy prices are not expected to rise further. On the
other, the stimulus from the world economy, especially from
the United States, are expected to weaken. GDP growth
should be about 4.0%. The strong demand for commod-
ities and the resulting stable price trend should continue
to support Brazil’s economy. In Mexico, a continued strong
export dynamic could have a positive effect on domestic
demand. In Argentina, on the other hand, the pace of GDP
growth is expected to slacken a little.
HEALTH CARE SECTOR AND MARKETS
b The dialysis market
We expect the number of dialysis patients to rise 5 to 7%
in the coming years, although significant regional differ-
ences are anticipated. In the industrialized nations such as
the United States, Japan and the countries of Central and
Western Europe where people already have broad access
to dialysis treatment, we expect below-average patient
growth. In many developing nations, where the needs of
patients with chronic kidney failure are still not met suffi-
ciently, we expect above-average growth rates of up to
10% in these markets. That about 80% of the world’s
population lives in these growth countries highlights the
enormous potential of the dialysis market in the developing
countries.
The reimbursement schemes for dialysis treatment vary
from country to country. They may depend for instance
on regional specifics, the method of treatment, regulatory
aspects or the status of the dialysis care provider. The
reimbursement of dialysis treatment according to quality-
based criteria, defined individually for each patient, also
remains a central issue. In this reimbursement model, the
quality of treatment should increase while the total cost of
treating a dialysis patient should remain constant.
Fresenius Medical Care is active in many countries
with a variety of health care systems and reimbursement
schemes. In the United States, our largest market, patients
covered by the public health insurers Medicare and
Medicaid account for about 58% of Fresenius Medical
Care’s dialysis care revenues.
A bill was introduced toward the end of 2006 in which
the US Congress and Senate proposed a 1.6% increase
in the reimbursement rate as from April 1, 2007. This bill
already became law in 2006.
Source: German Council of Economic Experts Annual Report 2006/2007, bank research

38 Management Report3838
b The market for infusion therapy and clinical nutrition
Demographic developments, medical advances and the
often still insufficient availability of medical care in devel-
oping countries will continue to be the growth drivers in
this market.
We expect further cost containment pressure and health
care reforms, especially in Central and Western Europe.
Despite these trends, we believe that there will be continued
growing demand for innovative and cost-effective therapies
and products. We expect growth in the low single digits
for the infusion therapy and clinical nutrition market in
Central and Western Europe. The market for intravenously
administered drugs generic in Europe should see growth
rates in the mid single digits in the coming years. For
Eastern Europe we expect market growth rates in the high
single digits.
There continues to be high growth potential in Latin
America and in Asia-Pacific, espescially in China. In
China, Fresenius Kabi has been growing at double-digit
rates for years. China is Fresenius Kabi’s third largest
single market in terms of sales. The rising demand for
primary care in hospitals and thus for high-quality thera-
pies, will result in continued strong growth rates in many
countries in these regions in the coming years. We expect
the markets of Asia-Pacific and Latin America to continue
growing at high single to double-digit rates. We also
expect a rising demand for medical devices in these
growth regions.
b The German hospital market
The German health care reform will continue to be a fore-
most topic in early 2007. The main aim of the reform is to
place the financing of the German health care system on
a sustainable basis. Among other things, the hospitals
have to contribute toward improving the finances of the
public health insurance system, mainly by deducting 0.5%
from bills issued to the public health insurers. Apart from
the impact of the health care reform, in 2007 German hos-
pitals will also have to cope with pay rises for hospital
doctors and an increase in VAT from 16% to 19%.
Whatever concrete shape the future reform measures
take, one thing is already clear. Crucial for a clinic’s sur-
vival will be excellent medical standards, well-trained staff,
well-organized processes and a well-structured treatment
spectrum with a focus on high quality, complex medical
services.
Private hospital chains and alliances will tend to be able
to respond to the pressure to improve efficiency better
than public hospitals. Given their traditional orientation
to profitability, they often have more experience in creating
efficient structures and processes and achieving cost
benefits in procurement. In addition, they are generally
better placed to finance the necessary investments. The
process of concentration and privatization, especially
among public hospitals, is therefore expected to further
accelerate. Overall, experts expect the market share of pri-
vate operators in terms of beds to rise from about 11% at
present to nearly 30 to 40% over the next ten years.
Source: Economic Research Allianz Group (July 2005), A.T. Kearney,
Study on Health Care Financing (September 2005)

39Management Report
GROUP SALES AND GROUP EARNINGS
With its international production and sales platform and its
market-oriented products and services the Fresenius Group is
excellently positioned for continued growth. At the same time,
opportunities for profitable growth are indicated by the develop-
ments described in the chapter “Health Care Sector and Mar-
kets.“
In 2007, we therefore expect to increase Group sales by
8 to 10% at 2006 exchange rates. The growth in sales will
be influenced by the consolidation of Renal Care Group and
HUMAINE Kliniken for the full year.
While our traditional markets in Europe and North America
are growing at average low to mid single-digit rates, we see far
stronger growth potential in the Asia-Pacific and Latin America
regions. Here, the demand for our life-saving and life-sus-
taining products continues to be very high due to the still very
limited access to medical care. This will also be reflected in the
development of sales. While we expect single-digit rates of
growth in our major markets of the United States and Europe,
sales in the growth regions should increase at double-digit
rates.
We plan to increase Group net income significantly again
in 2007. We aim to achieve this through sustained sales growth
and ongoing cost-reduction measures, especially in production.
Despite a market environment which continues to be marked
by cost containment and price pressure, we expect to be able
to increase net income by 20 to 25% in constant currency.
SUMMARY OF GROUP TARGETS FOR 2007
Targets 2007 (US GAAP) Fiscal year 2006 (IFRS)
Sales, growth (in constant currency) 8 - 10% € 10.8 billion
Net income, growth (in constant currency) 20 - 25% € 330 million
Capital expenditure € 600 - 700 million € 606 million
Net debt /EBITDA (December 31) 2.8 - 3.0 3.0
Dividend Continued profit-driven
dividend policy
Proposed: ~15% per
ordinary and preference share

40 Management Report4040
SALES AND EARNINGS BY BUSINESS SEGMENT
Overall, we expect good improvements in sales and earnings
in 2007 in each of our business segments. The table below
gives an overview:
The number of dialysis patients should rise by about 5 to
7% again in 2007, leading to a continued growth in demand
for dialysis products and a higher number of treatments. In
2007, Fresenius Medical Care expects sales to grow to about
9.4 billion in US dollars, its reporting currency. For net income
Fresenius Medical Care forecasts US$ 675 to 695 million.
Fresenius Kabi expects its positive operating performance
to continue in 2007. The company estimates an organic sales
growth of about 6 to 8%. Good growth potential is expected
again in Asia-Pacific and Latin America. Based on the positive
sales projection and further cost optimizations, especially in
production, Fresenius Kabi expects further significant earnings
improvement in 2007. The EBIT margin should rise in the 16.0
to 16.5% range.
Fresenius ProServe expects a continued good performance
in the hospital operations business. A good performance is
also expected in the engineering and services business given
the excellent order situation. Sales will be influenced on the
one hand by the full-year consolidation of HUMAINE Kliniken
and on the other by the sale of Pharmaplan GmbH. In 2007,
Fresenius ProServe projects organic sales growth of about 2
to 3%. EBIT is expected to increase to € 160 to 170 million.
Future growth potential is expected from further hospital
privatizations in Germany.
Fresenius Biotech will continue its clinical study program.
We expect that the expenditures for our biotechnology projects
will lead to negative EBIT of about € -50 million in 2007. This
increase is largely due to higher expenditures for clinical
studies.
FINANCING
In 2006, we generated an excellent operating cash flow of
€ 1,058 million. The key drivers were the strong increase in
earnings and further improvements in working capital man-
agement. The cash flow margin was 9.8%. Judged from
today’s point of view, we estimate that this margin will again
be in the high single-digit rate in 2007, especially through
further earnings improvements.
A key performance target figure for the Fresenius Group
is the net debt/EBITDA ratio. On December 31, 2006 this ratio
was at 3.0. Our goal in 2007 is to reach a ratio of 2.8 to 3.0.
To achieve this, we focus on increasing earnings and on a
further positive cash flow development.
2007 FINANCIAL TARGETS BY BUSINESS SEGMENT
Targets 2007 (US GAAP)
Fiscal year 2006(IFRS)
Fresenius Medical Care
Sales US$ ~9.4 billion US$ 8,498 million
Net income US$ 675 - 695 million US$ 535 million
Fresenius Kabi
Sales growth (organic) 6 - 8% € 1,893 million
EBIT margin 16.0 - 16.5% 15.6%
Fresenius ProServe
Sales growth (organic) 2 - 3% € 2,155 million
EBIT € 160 - 170 million € 152 million
Fresenius Biotech
EBIT € ~ -50 million € -45 million

41Management Report
Overall, we have a sufficient financial cushion with substantial
unused credit lines under syndicated or bilateral credit facil-
ities from banks. On December 31, 2006 the receivables
securitization program at Fresenius Medical Care was only
partially utilized and Fresenius Groups’ commercial paper
program of € 250 million had not been utilized at all. (Please
see page 20 of the Management Report for details.)
INVESTMENTS
Fresenius plans to invest in further growth and to increase
capital expenditure in property, plant and equipment. In 2007,
we expect to invest about € 600 to 700 million (2006: € 606
million) in property, plant and equipment and in intangible
assets. The strong increase will mainly be in the Fresenius
Medical Care and Fresenius ProServe business segments.
About 60% of the capital expenditure budgeted will be inves-
ted at Fresenius Medical Care, over 20% at Fresenius ProServe
and about 15% at Fresenius Kabi. The focus of the invest-
ments at Fresenius Medical Care will be on the construction
and expansion of dialysis clinics, and on the expansion and
maintenance of production plants. As an example, we are
expanding our dialyzer production plant in Germany. This will
increase the annual production capacity of this plant from
25 million at present to 35 million dialyzers. Fresenius Kabi
will invest in expanding and maintaining production facilities
and in introducing new manufacturing technologies. These
developments will enable further improvements in production
efficiency. At Fresenius ProServe we will be investing prima-
rily in modernizing hospitals and in hospital equipment. The
regional focus of the investments will be on Europe and North
America, accounting for about 50% and 40%. The remainder
will be invested in Asia, Latin America and Africa. About 30%
of the funds will be invested in Germany.
PROCUREMENT
Procurement optimization, including price and conditions as
well as product quality, is an important component of earnings
growth. We are also focusing on optimizing the procurement
process as well as the cooperation between individual sites.
Procurement alliances across various sectors allow us to
increase purchasing volumes and secure better conditions from
our suppliers.
The situation regarding prices of energy and oil-based
products is unlikely to ease much. This is mainly because
of the continued strong demand for oil and gas, which will
probably be even greater given the rising demand in growth
regions such as China. We therefore do not expect any reduc-
tion in the prices of energy and oil-based products in 2007.

42 Management Report4242
Cost savings can be achieved especially through the further
standardization of products, packaging and packaging materi-
als. This standardization will also simplify logistics since trans-
port can be better coordinated, allowing a more efficient use
of loading capacities.
Fresenius Medical Care plans to optimize its purchasing
of chemicals. From 2007, it intends to bundle demands and
procure products directly from the manufacturers. It plans to
counter rising pallet prices due to timber shortages by swit-
ching to special pallets that contain less wood. Fresenius Kabi
and Fresenius Medical Care are likely to face higher prices for
starch-based products after they had been held significantly
below the market level in 2006 as a result of a multi-year
supply agreement.
RESEARCH AND DEVELOPMENT
Our R&D activities will continue to play a key role in securing
the Group's long-term growth through innovative and new
therapies. We are concentrating our R&D on products for the
treatment of patients with chronic kidney failure. The emphasis
will be on dialysis membranes, dialysis machines and other
products. We are also focusing on other extracorporeal thera-
pies, such as those used in the treatment of patients with liver
disease, as well as our main research areas of infusion and
nutrition therapies. We are also concentrating on targeted
development in the biotechnology sector, mainly in the field
of antibody therapies. Biotechnology research opens up possi-
bilities for treating diseases which cannot be cured today,
and offers Fresenius potential for further growth with innova-
tive cancer therapies. Results of a phase II/III study in the
indication malignant ascites for patients with other than ovarian
cancer are expected to be published in the first quarter of
2007. The phase II study in the indication breast cancer and
the phase II study in gastric cancer are ongoing. Documen-
tation for the registration of the antibody removab® for the
indication malignant ascites is due to be submitted to the
EMEA (European Medicines Agency), the European drug
approval agency, in the second half of 2007.
We are planning to invest more in research and develop-
ment in 2007. The increase should be higher than the forecast
organic growth rate in sales. The number of employees in
research and development will also be increased.
Market-oriented research and development with strict time
to market management processes is crucial to the success of
new products. We continually review our R & D results based
on clearly defined milestones.
Innovative ideas, product development and therapies with
a high level of quality will continue to be the basis for market-
leading products in the future.
CORPORATE LEGAL STRUCTURE AND
ORGANIZATION
The Fresenius Group is divided into three business segments,
each of which is a legally independent entity. The business
segments are organized on a regional and decentralized basis
to provide the greatest flexibility to meet the demands of the
respective markets. The “entrepreneur in the enterprise”
principle with clearly defined responsibilities has proven itself
over many years. We will continue to follow this principle.
On December 4, 2006, the Extraordinary General Meeting
of Fresenius AG approved the conversion of the Company’s
legal form from a public limited company incorporated under
German law into a European Company (SE) (see “Subsequent
Events” on page 34 for more details).

43Management Report
PLANNED CHANGES IN HUMAN RESOURCES
AND THE SOCIAL AREA
The number of employees in the Group will continue to rise in
the future as a result of strong organic expansion. However,
the growth in the number of employees will be held below the
expected rate of organic sales growth. The regional distribution
of our employees will not change significantly – about 50%
will be located in Europe (with about 30% in Germany),
about 35% in North America and about 15% in Asia-Pacific,
Latin America and Africa.
DIVIDEND
Continuity in our dividend policy remains an important prior-
ity. This has been demonstrated impressively by steady divi-
dend increases over the last 13 years. We want to remain true
to this policy in the 2007 fiscal year and offer our shareholders
a dividend in line with our positive earnings forecasts.

Consolidated Financial Statements44
45 Consolidated statement of income
46 Consolidated balance sheet
48 Consolidated cash flow statement
50 Consolidated statement of equity
52 Segment reporting
56 Notes
45
CONTENTS

Consolidated Statement of Income Consolidated Balance Sheet Consolidated Cash Flow Statement Consolidated Statement of Equity Segment Reporting Notes
CONSOLIDATED STATEMENT OF INCOME
45
January 1 to December 31, in million € Note 2006 2005
Sales 3 10,776 7,889
Cost of sales 4 -7,339 -5,294
Gross profit 3,437 2,595
Selling, general and administrative expenses 6 -1,828 -1,481
Research and development expenses 7 -166 -147
Operating income (EBIT) 1,443 967
Interest income 8 23 20
Interest expenses 8 -418 -223
Earnings before income taxes and minority interest 1,048 764
Income taxes 9 -413 -293
Earnings after income taxes and before minority interest 635 471
Minority interest 22 -305 -249
Net income of the Group 330 222
Basic earnings per ordinary share in € 10 2.15 1.76
Fully diluted earnings per ordinary share in € 10 2.12 1.75
Basic earnings per preference share in € 10 2.16 1.77
Fully diluted earnings per preference share in € 10 2.13 1.76
The following Notes are an integral part of the Consolidated Financial Statements.

CONSOLIDATED BALANCE SHEET
Consolidated Balance Sheet 46
ASSETS
as of December 31, in million € Note 2006 2005
Cash and cash equivalents 11 261 252
Trade accounts receivable, less allowance
for doubtful accounts 12 2,088 1,871
Accounts receivable from and loans to related parties 8 15
Inventories 13 761 727
Prepaid expenses and other current assets 14 730 478
I. Total current assets 3,848 3,343
Property, plant and equipment 15 2,715 2,359
Goodwill 16 7,119 4,696
Other intangible assets 16 571 559
Other non-current assets 14 387 362
thereof at equity consolidated financial investments 12 14
Deferred taxes 9 384 283
II. Total non-current assets 11,176 8,259
Total assets 15,024 11,602
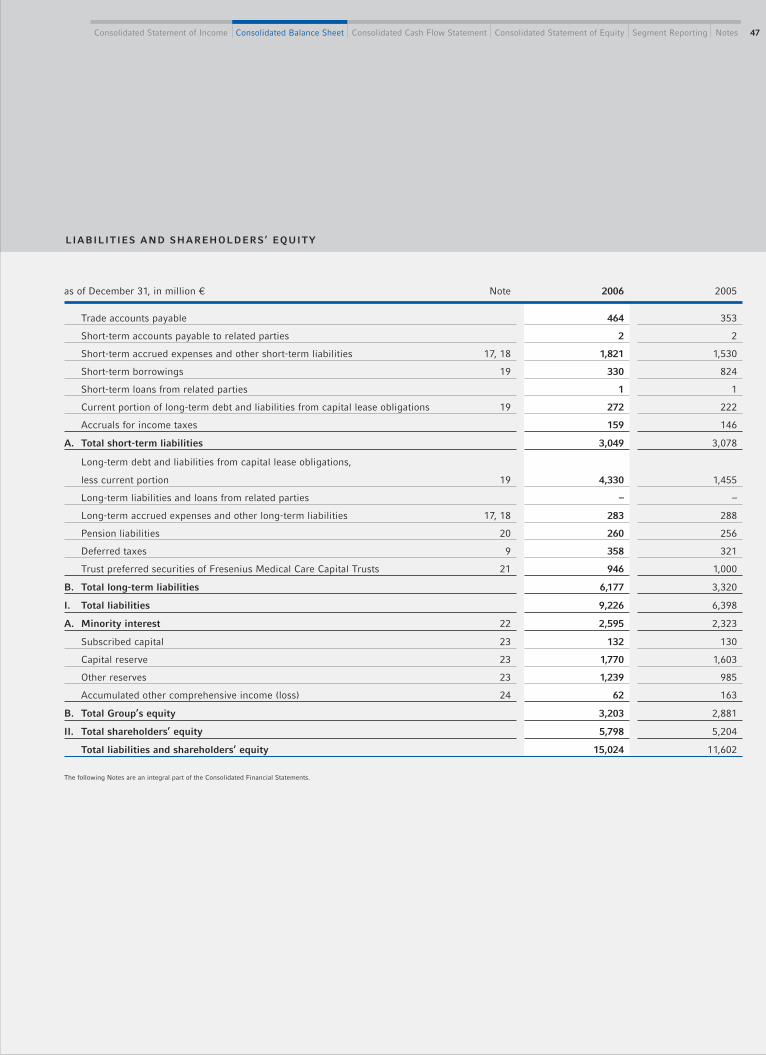
Consolidated Statement of Income Consolidated Balance Sheet Consolidated Cash Flow Statement Consolidated Statement of Equity Segment Reporting Notes 47
LIABILITIES AND SHAREHOLDERS’ EQUITY
as of December 31, in million € Note 2006 2005
Trade accounts payable 464 353
Short-term accounts payable to related parties 2 2
Short-term accrued expenses and other short-term liabilities 17, 18 1,821 1,530
Short-term borrowings 19 330 824
Short-term loans from related parties 1 1
Current portion of long-term debt and liabilities from capital lease obligations 19 272 222
Accruals for income taxes 159 146
A. Total short-term liabilities 3,049 3,078
Long-term debt and liabilities from capital lease obligations,
less current portion 19 4,330 1,455
Long-term liabilities and loans from related parties – –
Long-term accrued expenses and other long-term liabilities 17, 18 283 288
Pension liabilities 20 260 256
Deferred taxes 9 358 321
Trust preferred securities of Fresenius Medical Care Capital Trusts 21 946 1,000
B. Total long-term liabilities 6,177 3,320
I. Total liabilities 9,226 6,398
A. Minority interest 22 2,595 2,323
Subscribed capital 23 132 130
Capital reserve 23 1,770 1,603
Other reserves 23 1,239 985
Accumulated other comprehensive income (loss) 24 62 163
B. Total Group’s equity 3,203 2,881
II. Total shareholders’ equity 5,798 5,204
Total liabilities and shareholders’ equity 15,024 11,602
The following Notes are an integral part of the Consolidated Financial Statements.

CONSOLIDATED CASH FLOW STATEMENT
Consolidated Cash Flow Statement48
January 1 to December 31, in million € Note 2006 2005
Cash provided by/used for operating activities
Net income of the Group 330 222
Minority interest 22 305 249
Adjustments to reconcile net income of the Group to cash and
cash equivalents provided by operating activities
Cash inflow from hedging 9 0
Depreciation and amortization 28 406 325
Loss on sale of investments 2 0
Change in deferred taxes 9 76 14
Loss on sale of fixed assets 14 7
Change in assets and liabilities, net of amounts
from businesses acquired or disposed of
Change in trade accounts receivable, net 12 -86 -42
Change in inventories 13 -49 -12
Change in prepaid expenses and other current and non-current assets 14 -126 -132
Change in accounts receivable from/payable to related parties 4 6
Change in trade accounts payable,
accruals and other short-term and long-term liabilities 582 406
Received interest 8 23 20
Paid interest 27 -393 -208
Change in accruals for income taxes 362 289
Tax payments related to divestitures and acquisitions 27 -52 0
Income taxes paid 27 -349 -360
Cash provided by operating activities 1,058 784
Cash provided by/used for investing activities
Purchase of property, plant and equipment -595 -357
Proceeds from the sale of property, plant and equipment 18 22
Acquisitions and investments, net of cash acquired 2, 27 -3,657 -1,608
Proceeds from divestitures 2 438 2
Cash used for investing activities -3,796 -1,941

Consolidated Statement of Income Consolidated Balance Sheet Consolidated Cash Flow Statement Consolidated Statement of Equity Segment Reporting Notes 49
January 1 to December 31, in million € Note 2006 2005
Cash provided by/used for financing activities
Proceeds from short-term borrowings 19 54 37
Repayments of short-term borrowings 19 -670 -70
Repayments of borrowings from related parties -1 -4
Proceeds from long-term debt and liabilities from capital lease obligations 19 4,301 945
Repayments of long-term debt and liabilities from capital lease obligations 19 -1,228 -310
Changes of accounts receivable facility 19 137 -194
Proceeds from the exercise of stock options 29 75 90
Proceeds from the conversion of Fresenius Medical Care’s
preference shares into ordinary shares 1 258 0
Dividends paid -171 -132
Proceeds from the issuance of bearer ordinary shares 23 0 438
Proceeds from the issuance of bearer preference shares 23 0 481
Payments of additional costs of capital increase 23 0 -22
Change in minority interest 22 1 -1
Exchange rate effect due to corporate financing 4 -2
Cash provided by financing activities 2,760 1,256
Effect of exchange rate changes on cash and cash equivalents -13 13
Net increase in cash and cash equivalents 9 112
Cash and cash equivalents at the beginning of the year 11 252 140
Cash and cash equivalents at the end of the year 11 261 252
The following Notes are an integral part of the Consolidated Financial Statements.

CONSOLIDATED STATEMENT OF EQUITY
Consolidated Statement of Equity50
Ordinary shares Preference shares Subscribed Capital
Note
Numberof shares
(thousand)Amount
(thousand €)
Numberof shares
(thousand)Amount
(thousand €)Amount
(thousand €)Amount
(million €)
As of December 31, 2004 20,486 52,443 20,486 52,443 104,886 105
Issuance of bearer ordinary and bearer preference shares 23 4,700 12,032 4,700 12,032 24,064 24
Proceeds from the exercise of stock options 29 175 449 175 449 898 1
Compensation expense related to stock options 29
Dividends paid 23
Comprehensive income (loss)
Net income of the Group
Other comprehensive income (loss) related to
Cash flow hedges 24, 26
Foreign currency translation 24
Comprehensive income (loss)
As of December 31, 2005 25,361 64,924 25,361 64,924 129,848 130
Issuance of bearer ordinary and bearer preference shares 23 177 453 177 453 906 1
Proceeds from the conversion of Fresenius Medical Care’s
preference shares into ordinary shares 1
Proceeds from the exercise of stock options 29 188 481 188 481 962 1
Compensation expense related to stock options 29
Minimum dividend of ordinary shareholders
Dividends paid 23
Comprehensive income (loss)
Net income of the Group
Other comprehensive income (loss) related to
Cash flow hedges 24, 26
Foreign currency translation 24
Comprehensive income (loss)
As of December 31, 2006 25,726 65,858 25,726 65,858 131,716 132

Consolidated Statement of Income Consolidated Balance Sheet Consolidated Cash Flow Statement Consolidated Statement of Equity Segment Reporting Notes 51
ReservesOther comprehensive
income (loss)
Note
Capitalreserve
(million €)
Otherreserves
(million €)
Foreigncurrency
translation(million €)
Cash flowhedges
(million €)
Totalshare-
holders’equity
(million €)
Minorityinterest
(million €)
Totalequity
(million €)
As of December 31, 2004 696 819 15 -18 1,617 1,766 3,383
Issuance of bearer ordinary and bearer preference shares 23 872 896 0 896
Proceeds from the exercise of stock options 29 25 26 64 90
Compensation expense related to stock options 29 10 10 5 15
Dividends paid 23 -56 -56 -76 -132
Comprehensive income (loss)
Net income of the Group 222 222 249 471
Other comprehensive income (loss) related to
Cash flow hedges 24, 26 32 32 0 32
Foreign currency translation 24 134 134 315 449
Comprehensive income (loss) 222 134 32 388 564 952
As of December 31, 2005 1,603 985 149 14 2,881 2,323 5,204
Issuance of bearer ordinary and bearer preference shares 23 41 42 0 42
Proceeds from the conversion of Fresenius Medical Care’s
preference shares into ordinary shares 1 94 94 164 258
Proceeds from the exercise of stock options 29 31 32 43 75
Compensation expense related to stock options 29 12 12 8 20
Minimum dividend of ordinary shareholders -11 -11 0 -11
Dividends paid 23 -76 -76 -95 -171
Comprehensive income (loss)
Net income of the Group 330 330 305 635
Other comprehensive income (loss) related to
Cash flow hedges 24, 26 16 16 0 16
Foreign currency translation 24 -117 -117 -153 -270
Comprehensive income (loss) 330 -117 16 229 152 381
As of December 31, 2006 1,770 1,239 32 30 3,203 2,595 5,798
The following Notes are an integral part of the Consolidated Financial Statements.

SEGMENT REPORTINGby business segment
Segment Reporting52
Fresenius Medical Care Fresenius Kabi
in million € 2006 2005 Change 2006 2005 Change
Sales 6,767 5,443 24% 1,893 1,681 13%
thereof contribution to consolidated sales 6,762 5,418 25% 1,853 1,651 12%
thereof intercompany sales 5 25 -80% 40 30 33%
contribution to consolidated sales 63% 69% 17% 21%
EBITDA 1,295 958 35% 378 316 20%
Depreciation and amortization 249 203 23% 82 87 -6%
EBIT 1,046 755 39% 296 229 29%
Net interest -280 -139 -101% -70 -51 -37%
Net income of the Group 426 371 15% 146 106 38%
thereof from associates and joint ventures 0 -3 100% 0 -1 100%
Operating cash flow 724 539 34% 206 241 -15%
Cash flow before acquisitions and dividends 365 300 22% 101 167 -40%
Debt 4,243 1,857 128% 880 903 -3%
Other operating liabilities 1,561 1,203 30% 588 545 8%
Total assets 9,917 6,782 46% 1,948 1,856 5%
Capital expenditure 373 253 47% 117 81 44%
Acquisitions 3,561 108 -- 14 274 -95%
Research and development expenses 41 42 -2% 75 64 17%
Employees (per capita on balance sheet date) 59,996 50,250 19% 15,591 14,453 8%
Key figures
EBITDA margin 19.1% 17.6% 20.0% 18.8%
EBIT margin 15.5% 13.9% 15.6% 13.6%
ROOA 11.2%1) 12.6% 17.5% 14.1%
Depreciation and amortization in % of sales 3.7% 3.7% 4.3% 5.2%
1) Calculation is based on the pro forma EBIT excluding the gain on the sale of Fresenius Medical Care’s dialysis clinics (see Note 2, Acquisitions and divestitures)2) Operating assets excluding HELIOS Kliniken

53Consolidated Statement of Income Consolidated Balance Sheet Consolidated Cash Flow Statement Consolidated Statement of Equity Segment Reporting Notes
Fresenius ProServe Corporate/Other Fresenius Group
2006 2005 Change 2006 2005 Change 2006 2005 Change
2,155 809 166% -39 -44 11% 10,776 7,889 37%
2,145 804 167% 16 16 0% 10,776 7,889 37%
10 5 100% -55 -60 8% 0 0
20% 10% 0% 0% 100% 100%
216 45 -- -40 -27 -48% 1,849 1,292 43%
64 25 156% 11 10 10% 406 325 25%
152 20 -- -51 -37 -38% 1,443 967 49%
-40 -10 -- -5 -3 -67% -395 -203 -95%
73 1 -- -315 -256 -23% 330 222 49%
0 1 -100% 0 0 0% 0 -3 100%
177 19 -- -49 -15 -- 1,058 784 35%
74 7 -- -59 -25 -136% 481 449 7%
932 229 -- -176 513 -134% 5,879 3,502 68%
887 819 8% -47 8 -- 2,989 2,575 16%
3,112 2,863 9% 47 101 -53% 15,024 11,602 29%
106 12 -- 10 11 -9% 606 357 70%
139 1,507 -91% 0 5 -100% 3,714 1,894 96%
1 1 0% 49 40 23% 166 147 13%
28,615 26,664 7% 670 604 11% 104,872 91,971 14%
10.0% 5.6% 17.2% 16.4%
7.1% 2.5% 13.4% 12.3%
6.8% 3.5%2) 10.3%1) 11.7%2)
3.0% 3.1% 3.8% 4.1%
The segment reporting is an integral part of the Notes.The following Notes are an integral part of the Consolidated Financial Statements.

SEGMENT REPORTING by region
Segment Reporting54
Europe North Americain million € 2006 2005 Change 2006 2005 Change
Sales 4,535 3,030 50% 4,862 3,746 30%
contribution to consolidated sales 43% 38% 45% 47%
EBIT 499 322 55% 769 533 44%
Depreciation and amortization 217 175 24% 150 112 34%
Total assets 6,257 5,791 8% 7,694 4,752 62%
Capital expenditure 294 182 62% 245 141 74%
Acquisitions 150 1,791 -92% 3,544 62 --
Employees (per capita on balance sheet date) 52,062 48,169 8% 38,597 31,031 24%

55Consolidated Statement of Income Consolidated Balance Sheet Consolidated Cash Flow Statement Consolidated Statement of Equity Segment Reporting Notes
Asia-Pacific Latin America Africa Fresenius Group2006 2005 Change 2006 2005 Change 2006 2005 Change 2006 2005 Change
696 557 25% 452 356 27% 231 200 16% 10,776 7,889 37%
6% 7% 4% 5% 2% 3% 100% 100%
103 59 75% 48 32 50% 24 21 14% 1,443 967 49%
20 22 -9% 16 14 14% 3 2 50% 406 325 25%
573 556 3% 443 428 4% 57 75 -24% 15,024 11,602 29%
25 15 67% 38 17 124% 4 2 100% 606 357 70%
4 33 -88% 13 7 86% 3 1 -- 3,714 1,894 96%
4,968 4,296 16% 8,499 7,772 9% 746 703 6% 104,872 91,971 14%
The segment reporting is an integral part of the Notes.The following Notes are an integral part of the Consolidated Financial Statements.

89 14. Prepaid expenses and other current and
non-current assets
90 15. Property, plant and equipment
91 16. Goodwill and other intangible assets
95 17. Other accrued expenses
96 18. Other liabilities
97 19. Debt and liabilities from capital lease
obligations
104 20. Pensions and similar obligations
110 21. Trust preferred securities
111 22. Minority interest
111 23. Shareholders’ equity
114 24. Other comprehensive income (loss)
115 OTHER NOTES
115 25. Commitments and contingent liabilities
120 26. Financial instruments
126 27. Supplementary information
on cash flow statement
127 28. Notes on segment reporting
131 29. Stock options
140 30. Related party transactions
140 31. Subsequent events
141 NOTES IN ACCORDANCE WITH
THE GERMAN COMMERCIAL CODE
(HGB)
141 32. Compensation report
144 33. Information on the Supervisory Board
145 34. D&O Insurance
145 35. Fees for the auditor
146 36. Corporate Governance
146 37. Proposal for the distribution of earnings
57
88
115
141
82
CONTENTS
57 1. Principles
57 I. Group structure
58 II. Conversion of Fresenius AG into a
European Company (SE) and new
division of the subscribed capital
58 III. Transformation of Fresenius Medical
Care AG’s legal form and conversion of
its preference shares
60 IV. Basis of presentation
60 V. Summary of significant accounting
policies
74 VI. Critical accounting policies
77 2. Acquisitions and divestitures
82 NOTES ON THE CONSOLIDATED
STATEMENT OF INCOME
82 3. Sales
82 4. Cost of sales
82 5. Personnel expenses
83 6. Selling, general and administrative
expenses
83 7. Research and development expenses
83 8. Net interest
84 9. Income taxes
87 10. Earnings per share
88 NOTES ON THE CONSOLIDATED
BALANCE SHEET
88 11. Cash and cash equivalents
88 12. Trade accounts receivable
88 13. Inventories
Notes56

57Consolidated Statement of Income Consolidated Balance Sheet Consolidated Cash Flow Statement Consolidated Statement of Equity Segment Reporting Notes
1. PRINCIPLES
I. GROUP STRUCTURE
Fresenius is a worldwide operating health care group with products and services for dialysis, the
hospital and the medical care of patients at home. Further areas of activity are hospital operations as
well as engineering and services for hospitals. In addition to the activities of the Fresenius AG, the
operating activities are split into the following legally-independent business segments (sub-groups)
as of December 31, 2006:
b Fresenius Medical Care b Fresenius Kabi b Fresenius ProServe
Fresenius Medical Care is the world’s leading provider of dialysis products and dialysis care for the
life-saving treatment of patients with chronic kidney failure. Fresenius Medical Care treats 163,517
patients in its 2,108 own dialysis clinics.
Fresenius Kabi is Europe’s leading company in the field of infusion therapy and clinical nutrition with
subsidiaries and distributors worldwide. Fresenius Kabi’s products are used in hospitals as well as
in out-patient medical care. Fresenius Kabi is also a leading provider of transfusion technology pro-
ducts in Europe.
Fresenius ProServe is a leading German hospital operator. Moreover, the company offers engineering
and services for hospitals and other health care facilities.
Fresenius AG owned 36.6% of the ordinary voting shares of Fresenius Medical Care AG & Co. KGaA
(FMC-AG & Co. KGaA) and Fresenius AG’s share of the total subscribed capital of FMC-AG & Co. KGaA
continued to be 36.1% at the end of the fiscal year 2006. Fresenius Medical Care Management AG
(FMC Management AG), the general partner of FMC-AG & Co. KGaA, is a wholly-owned subsidiary
of Fresenius AG. Due to this structure, FMC-AG & Co. KGaA is fully consolidated in the consolidated
financial statements of the Fresenius Group. Fresenius AG continued to hold 100% of the manage-
ment companies of business segments Fresenius Kabi (Fresenius Kabi AG) and Fresenius ProServe
(Fresenius ProServe GmbH) on December 31, 2006. In addition, Fresenius AG holds interests in compa-
nies with holding functions regarding real estate, financing and insurance, as well as in Fresenius
Netcare GmbH which offers services in the field of information technology and in Fresenius Biotech
Beteiligungs GmbH.
The reporting currency in the Fresenius Group is the euro. In order to make the presentation clearer,
amounts are mostly shown in million euros. Amounts which are lower than one million euros after
they have been rounded are marked with “–”.

Notes58
II. CONVERSION OF FRESENIUS AG INTO A EUROPEAN COMPANY (SE)
AND NEW DIVISION OF THE SUBSCRIBED CAPITAL
On December 4, 2006, at the Extraordinary General Meeting Fresenius AG’s shareholders approved
the proposal to convert the Company’s legal form from a German stock corporation (Aktiengesell-
schaft) into a European Company (Societas Europaea – SE). The conversion becomes effective upon
the registration in the commercial register. This is scheduled for the third quarter of 2007 after the
completion of the procedure for the involvement of the employees. Fresenius AG’s name after the
conversion will be Fresenius SE. The conversion of Fresenius AG into an SE does neither lead to a
liquidation of the company nor the formation of a new legal entity. The Company’s corporate structure
and management organization as well as the interests of the shareholders in the company continue
to exist unchanged because of the identity of the legal entity. In the statutes of the future Fresenius
SE the existing two-tier system consisting of Management Board and Supervisory Board will remain
unchanged. The Supervisory Board of Fresenius SE will continue to have twelve members.
Furthermore, Fresenius AG’s shareholders approved at the Extraordinary General Meeting to conduct
a new division of the subscribed capital of Fresenius AG (share split) in connection with a capital
increase from the company’s funds without the issuance of new shares. As a result, the number of ordi-
nary shares and preference shares issued tripled. The share split in connection with an increase of the
subscribed capital became effective upon the registration in the commercial register on January 24,
2007. The subscribed capital of Fresenius AG amounted to € 131,715,307.52 before the registration in
the commercial register and was divided into 25,725,646 ordinary shares and 25,725,646 prefe-
rence shares. Through a conversion of capital reserves, the subscribed capital was first increased
by € 22,638,568.48 to € 154,353,876.00 and then divided into 77,176,938 ordinary shares and
77,176,938 preference shares. The new proportionate amount of the subscribed capital is € 1,00
per share. After the share split, every holder of an ordinary share holds three ordinary shares and
every holder of a preference share holds three preference shares.
III. TRANSFORMATION OF FRESENIUS MEDICAL CARE AG’S LEGAL FORM AND
CONVERSION OF ITS PREFERENCE SHARES
On February 10, 2006, Fresenius Medical Care completed and registered in the commercial register
of the local court in Hof an der Saale, the transformation of its legal form under German law from a
stock corporation (Aktiengesellschaft) to a partnership limited by shares (Kommanditgesellschaft
auf Aktien) with the name Fresenius Medical Care AG & Co. KGaA (FMC-AG & Co. KGaA). The transfor-
mation was approved by its shareholders during an Extraordinary General Meeting held on August
30, 2005 (EGM). Fresenius Medical Care as a KGaA is the same legal entity under German law, rather
than a successor to the AG. FMC Management AG, a wholly-owned subsidiary of Fresenius AG, the
majority voting shareholder of Fresenius Medical Care AG prior to the transformation, is the general
partner of FMC-AG & Co. KGaA. FMC Management AG assumed the management of Fresenius Medical
Care through its position as general partner. FMC Management AG was formed for the sole purpose

59Consolidated Statement of Income Consolidated Balance Sheet Consolidated Cash Flow Statement Consolidated Statement of Equity Segment Reporting Notes
of serving as the general partner of FMC-AG & Co. KGaA and managing the business of FMC-AG & Co.
KGaA. FMC Management AG has the same duty to FMC-AG & Co. KGaA as the Management Board of
a stock corporation has to the corporation. The Management Board of FMC Management AG must
carefully conduct the business of FMC-AG & Co. KGaA and is liable for any breaches of its obligations.
The Supervisory Board of FMC Management AG, elected by Fresenius AG, must carefully supervise
the Management Board of FMC Management AG in the conduct of the business of FMC-AG & Co. KGaA.
The Supervisory Board of FMC-AG & Co. KGaA, which is elected by Fresenius Medical Care’s sharehol-
ders (other than Fresenius AG), oversees the management of the business of Fresenius Medical Care,
but has less power and scope for influence than the supervisory board of a stock corporation. Upon
effectiveness of the transformation of legal form, the share capital of Fresenius Medical Care AG
became the share capital of FMC-AG & Co. KGaA, and persons who were shareholders of Fresenius
Medical Care AG became shareholders of the company in its new legal form.
This transformation of legal form has no impact on the consolidation of Fresenius Medical Care in
the consolidated financial statements of the Fresenius Group.
Prior to registration of the transformation of legal form, Fresenius Medical Care AG offered holders
of its non-voting preference shares (including preference shares represented by American Depositary
Shares (ADSs)) the opportunity to convert their shares into ordinary shares at a conversion ratio of
one preference share plus a conversion premium of € 9.75 per ordinary share. Fresenius Medical Care
received a total of € 258 million in premiums from the holders upon the conversion of their preference
shares, net of costs of € 2 million.
Several ordinary shareholders challenged the resolutions adopted at the EGM approving the conver-
sion of the preference shares into ordinary shares, the adjustment of the employee participation
programs, the creation of authorized capital and the transformation of the legal form of Fresenius
Medical Care AG, with the objective of having the resolutions declared null and void. On December 19,
2005, Fresenius Medical Care AG and the claimants agreed to a settlement with the participation
of Fresenius AG and FMC Management AG, and all proceedings were terminated. Fresenius Medical
Care agreed to bear court fees and shareholder legal expenses in connection with the settlement.
The total costs of the settlement were estimated to be € 5.9 million. A further part of the settlement
agreement and German law require that these costs be borne by Fresenius AG and FMC Management
AG. Under accounting principles, however, these costs must be reflected by the entity benefiting
from the actions of its controlling shareholder. The actual total costs of all ex gratia payments and
all payments to shareholders who voted against the conversion proposal and who filed written claims
in a timely fashion incurred in the settlement were € 5.2 million. The difference of € 0.7 million was
recorded as a reduction of selling, general and administrative expense and additional paid in capital
within shareholders’ equity in the year 2006.

Notes60
IV. BASIS OF PRESENTATION
Since January 1, 2005, Fresenius AG as a stock exchange listed company with a domicile in a mem-
ber state of the European Union has the obligation to prepare and publish the consolidated financial
statements in accordance with the International Financial Reporting Standards (IFRS) applying
§ 315a of the German Commercial Code (HGB). The consolidated financial statements of Fresenius AG
at December 31, 2006 have been prepared and will be published in accordance with the Standards
valid on the balance sheet date issued by the International Accounting Standards Board (IASB) and
the mandatory Interpretations of the International Financial Reporting Interpretations Committee
(IFRIC), formerly the Standing Interpretations Committee (SIC), which are binding to be applied in
the EU. In addition, the Fresenius Group voluntarily continues to prepare and publish consolidated
financial statements in accordance with United States Generally Accepted Accounting Principles
(US GAAP).
In order to improve clarity of presentation, various items are aggregated in the consolidated balance
sheet and statement of income. These items are analyzed separately in the Notes where this provides
useful information to the users of the consolidated financial statements.
Moreover, the Notes include information required by HGB according to § 315a (1) sentence 1 HGB.
The consolidated financial statements include a management report according to § 315a HGB in con-
junction with § 315 HGB.
The consolidated balance sheet contains all information required to be disclosed by IAS 1 (Presenta-
tion of Financial Statements) and is in accordance with RIC 1 (Balance Sheet Classification according
to current/non-current Distinction in compliance with IAS 1 Presentation of Financial Statements)
classified on the basis of the liquidity of assets and liabilities following the consolidated balance sheet
in accordance with US GAAP; the consolidated statement of income is classified using the cost-of-sales
accounting format.
At February 23, 2007, the Management Board authorized the consolidated financial statements for
issue and passed it through to the Supervisory Board. The Supervisory Board has to control and
approve the consolidated financial statements.
V. SUMMARY OF SIGNIFICANT ACCOUNTING POLICIES
a) Priciple of consolidation
The financial statements of consolidated entities have been prepared using uniform accounting
methods in accordance with IAS 27 (Consolidated and Separate Financial Statements).
Capital consolidation is performed according to IFRS 3 (Business Combinations) by offsetting invest-
ments in subsidiaries against the underlying revaluated equity at the date of acquisition. The identi-
fiable assets and liabilities of subsidiaries are recognized at their fair values. Any remaining debit
balance is recognized as goodwill and is tested at least once a year for impairment.

61Consolidated Statement of Income Consolidated Balance Sheet Consolidated Cash Flow Statement Consolidated Statement of Equity Segment Reporting Notes
The equity method is applied in accordance with IAS 28 (Investments in Associates).
All significant intercompany revenues, expenses, income, receivables and payables are eliminated.
Profits and losses on items of property, plant and equipment and inventory acquired from other group
entities are also eliminated.
Deferred tax assets and liabilities are recognized on temporary differences resulting from consoli-
dation procedures.
Minority interest comprises the interest of minority shareholders in the consolidated equity of group
entities, including profits and losses attributable to the minority shareholders.
b) Composition of the Group
Besides Fresenius AG, the consolidated financial statements include all material subsidiaries in
which Fresenius AG, directly or indirectly, holds a majority investment or the majority of the voting
power and has the possibility of control.
Special purpose entities as defined by SIC 12 (Consolidation – Special Purpose Entities) are consoli-
dated if they are controlled by a Fresenius Group company, i. e. risk and rewards remain with the
Group.
Joint ventures and entities in which Fresenius AG, directly or indirectly, holds between 20% and
50% of the voting power and can exercise a significant influence over their financial and operating
policies, are consolidated using the equity method.
The consolidated financial statements of the year 2006 include, in addition to Fresenius AG,
123 (2005: 117) German and 838 (2005: 634) foreign companies.
The composition of the Group changed as follows:
13 companies (2005: 17) were accounted for under the equity method.
The complete list of the investments of Fresenius AG will be submitted to the Commercial Register
of the District Court of Bad Homburg v.d.H. under the number HRB 2617.
Germany Abroad Total
December 31, 2005 117 634 751
Additions 16 246 262
of which newly founded 2 4 6
of which acquired 9 235 244
Disposals 10 42 52
of which no longer consolidated 4 36 40
of which merged 6 6 12
December 31, 2006 123 838 961

c) Classifications
Certain items in the prior year’s consolidated financial statements have been reclassified to conform
with the current year’s presentation. In the year 2005, the reclassification includes € 100 million
relating to rents for clinics of Fresenius Medical Care which were removed from selling, general and
administrative expenses and included in its cost of sales. The calculation of earnings per share (see
Note 10, Earnings per share) has been adjusted due to the share split of Fresenius AG recorded in
the commercial register on January 24, 2007, for the increased number of shares in the fiscal years
2006 and 2005.
d) Sales recognition policy
Sales from services are recognized at amounts estimated to be received under the reimbursement
arrangements. Sales are recognized on the date services and related products are provided and the
payor is obligated to pay.
Product sales are recognized when title to the product passes to the customers either at the time of
shipment, upon receipt by the customer or upon any other terms that clearly define passage of title.
As product returns are not typical, no return allowances are established. In case of a return, an
appropriate reduction to sales, cost of sales and accounts receivable is made . Sales are stated net of
discounts, allowances, settlement discounts and rebates.
In the business segment Fresenius ProServe, sales for long-term production contracts are recognized
depending on the individual agreement, using the percentage-of-completion (PoC) method when the
conditions of IAS 18 (Revenue) and IAS 11 (Construction Contracts) are met. The sales to be recog-
nized are calculated as a percentage of the costs already incurred based on the estimated total cost of
the contract, milestones laid down in the contract or according to the proportion of work completed.
Profits are only recognized when the outcome of a production contract accounted for using the PoC
method can be measured reliably.
e) Government grants
In accordance with IAS 20 (Accounting for Government Grants and Disclosure of Government Assis-
tance), public sector grants are not recognized until there is reasonable assurance that the respective
conditions are met and the grants will be received. At first, the grant is recorded as a liability and as
soon as the asset is acquired it is offset against the acquisition costs. Expense-related grants are
recognized as income over the periods necessary to match them with the related costs which they
are intended to compensate.
Notes62

63Consolidated Statement of Income Consolidated Balance Sheet Consolidated Cash Flow Statement Consolidated Statement of Equity Segment Reporting Notes
f) Research and development costs
Research costs are incurred in conjunction with original and planned investigation undertaken with
the prospect of gaining new scientific or technical knowledge. Development is the technical and
commercial implementation of research results. Research costs are expensed as incurred. This also
applies to non-capitalizable development costs that do not fully meet the criteria for the recognition
of an intangible asset set out in IAS 38 (Intangible Assets).
g) Impairment
The Fresenius Group reviews the carrying amount of its property, plant and equipment, its intangible
assets with definite useful lives as well as other non-current assets for impairment whenever events
or changes in circumstances indicate that the carrying amount is higher than the asset’s net realiz-
able value or its value in use in accordance with IAS 36 (Impairment of Assets). The net realizable
value of an asset is defined as its fair value less costs to sell. The value in use is the present value of
future cash flows expected to be derived from the relevant asset. If it is not possible to estimate the
future cash flows from the individual assets, impairment is tested on the basis of the future cash
flows of the corresponding cash generating units (CGUs).
Impairment losses, except impairment losses recognized on goodwill, are reversed as soon as the
reasons for impairment no longer exist.
In accordance with IFRS 5 (Non-current Assets Held for Sale and Discontinued Operations) assets
held for sale are reported at the lower of their carrying amount and fair value less costs to sell. As
long as the company intends to sell the asset, it is not depreciated. Assets to be disposed of other
than by sale are considered to be held and used until disposal.
h) Interest
The Fresenius Group includes capitalized interest as part of the cost of the asset if they are directly
attributable to the acquisition, construction or manufacture of qualifying assets in accordance with
IAS 23 (Borrowing Costs).
For the fiscal years 2006 and 2005, interest of € 5 million and € 2 million, based on an average interest
rate of 7.9% and 7.2%, respectively, was recognized as a component of the cost of assets.

Notes64
i) Deferred taxes
In accordance with IAS 12 (Income Taxes), deferred tax assets and liabilities are recognized for the
future consequences attributable to temporary differences between the financial statement carrying
amounts of existing assets and liabilities and their respective tax basis as well as on consolidation
procedures affecting net income. Deferred tax assets also include claims to future tax reductions
which arise from the expected usage of existing tax losses available for carryforward where future
recoverability is probable.
Deferred taxes are computed using enacted or planned tax rates which are expected to apply in the
relevant national jurisdictions when the amounts are recovered.
The carrying amount of a deferred tax asset is reviewed at each balance sheet date. The carrying
amount of a deferred tax asset is reduced to the extent that it is no longer probable that sufficient
taxable profit will be available to allow the benefit of part or all of that deferred tax asset to be utilized.
The reduction is reversed to the date and extent that it becomes probable that sufficient taxable profit
will be available (see Note 9, Income taxes).
j) Earnings per ordinary share and preference share
Basic earnings per ordinary share and preference share are computed in accordance with IAS 33
(Earnings per Share). Basic earnings per ordinary share is computed by dividing net income of the
group less preference amounts by the weighted-average number of ordinary shares and preference
shares outstanding during the year. Basic earnings per preference share is derived by adding the
preference per preference share to the basic earnings per ordinary share. Diluted earnings per share
include the effect of all potentially dilutive instruments on ordinary shares and preference shares that
would have been outstanding during the year. The awards granted under Fresenius’ and Fresenius
Medical Care’s stock incentive plans (see Note 29, Stock options) can result in a dilutive effect.
k) Cash and cash equivalents
Cash and cash equivalents comprise cash funds and all short-term, liquid investments with original
maturities of up to three months.
l) Trade accounts receivable
Trade accounts receivable are stated at their nominal value less allowance for doubtful accounts.
Allowances are estimated individually and mainly on the basis of payment history to date, the age
structure of balances and the contractual partner involved. In order to assess the appropriateness of
allowances, checks are carried out at regular intervals by the Fresenius Group, to determine whether
there have been any divergences to previous payment history.
Receivables with maturities exceeding one year and receivables which bear no or lower-than-market
interest are discounted.

65Consolidated Statement of Income Consolidated Balance Sheet Consolidated Cash Flow Statement Consolidated Statement of Equity Segment Reporting Notes
m) Inventories
In accordance with IAS 2 (Inventories), inventories comprise all assets which are held for sale in the
normal course of business (finished products), in the process of production for such sale (work in
progress) or consumed in the production process or in the rendering of services (raw materials and
supplies).
Inventories are measured at the lower of acquisition or manufacturing cost (determined by using
the average or first-in, first-out method) or net realizable value. Manufacturing costs comprise
direct costs, production and material overhead, including depreciation charges.
n) Property, plant and equipment
Property, plant and equipment are stated at acquisition and manufacturing cost less accumulated
depreciation. Significant improvements are capitalized; repair and maintenance costs that do not
extend the useful lives of the assets are charged to expense as incurred. Depreciation on property,
plant and equipment is calculated using the straight-line method over the estimated useful lives of
the assets ranging from 5 to 50 years for buildings and improvements (with a weighted-average life
of 15 years) and 3 to 15 years for machinery and equipment (with a weighted-average life of 10 years).
o) Intangible assets with definite useful lives
In accordance with IAS 38 (Intangible Assets), intangible assets with definite useful lives, for example
technology, patents and distribution rights, are amortized over their respective useful lives to their
residual values and reviewed for impairment in accordance with IAS 36 (Impairment of Assets) (see
Note 1.V.g, Impairment). They could be purchased and internally generated intangible assets. Non-
compete agreements have useful lives ranging from 7 to 25 years with an average useful life of 8 years.
Technology has a useful live of 15 years. All other intangible assets are amortized over their indivi-
dual estimated useful lives between 3 and 40 years.
Impairment losses are recognized in the event of losses in value of a lasting nature and are reversed
when the reasons for impairment no longer exist.
Development costs are capitalized as manufacturing costs when the recognition criteria set out in
IAS 38 (Intangible Assets) are met.
For development costs of dialysis machines manufactured by Fresenius Medical Care, the timing of
the recognition as assets is based on the technical utilizability of the machines. Capitalized develop-
ment costs are amortized on a straight-line basis over a useful life of 10 years.
Fresenius Kabi capitalizes development costs after the registration of a new product. Costs are depre-
ciated on a straight-line basis over a useful life of 5 years.

Notes66
p) Goodwill and other intangible assets with indefinite useful lives
Intangible assets such as tradenames and certain qualified management contracts acquired in a pur-
chase method business combination are recognized and reported apart from goodwill, pursuant to
the criteria specified by IAS 38 (Intangible Assets). They are recorded at acquisition costs. Goodwill
and intangible assets with indefinite useful lives are not amortized but tested for impairment
annually or when an event becomes known that could trigger an impairment (impairment test).
To perform the annual impairment test of goodwill, the Fresenius Group identified several cash gene-
rating units (CGUs) in accordance with IAS 36 (Impairment of Assets) and determined the carrying
amount of each CGU by assigning the assets and liabilities, including the existing goodwill and intan-
gible assets, to those CGUs. A CGU is usually defined one level below the segment level according to
regions or legal entities. Six CGUs were identified in the segment Fresenius Medical Care (Europe,
Latin America, Asia-Pacific, North America Dialysis Products, North America Dialysis Services, North
America Laboratory Services), while only one CGU exists in the segment Fresenius Kabi. The segment
Fresenius ProServe is divided into three CGUs (HELIOS Group, VAMED Group, Pharmaplan-Group). At
least once a year, the Fresenius Group compares the fair value of each CGU to the CGU’s carrying
amount. The fair value of a CGU is determined using a discounted cash flow approach based upon the
cash flow expected to be generated by the CGU. In case that the fair value of the CGU is less than its
carrying amount, the difference is at first recorded as an impairment of the fair value of the goodwill.
To evaluate the recoverability of separable intangible assets with indefinite useful lives, the Fresenius
Group compares the fair values of these intangible assets with their carrying amounts. An intangible
asset’s fair value is determined using a discounted cash flow approach and other appropriate methods.
The recoverability of goodwill and other separable intangible assets with indefinite useful lives recorded
in the Group’s consolidated balance sheet was verified. As a result, the Fresenius Group did not record
any impairment losses in 2006 and 2005.
Impairment losses recognized on goodwill in prior years are not reversed at a later date if the reasons
for impairment no longer exist.
Any excess of the net fair value of identifiable assets and liabilities over cost still existing after re-
assessing the purchase price allocation is recognized immediately in profit or loss.

67Consolidated Statement of Income Consolidated Balance Sheet Consolidated Cash Flow Statement Consolidated Statement of Equity Segment Reporting Notes
q) Leases
Leased assets assigned to the Fresenius Group based on the risk and rewards approach (finance leases)
are recognized as property, plant and equipment in accordance with IAS 17 (Leases) and measured
on receipt date at their fair values as long as the present values of the lease payments are not lower.
Leased assets are depreciated in straight-line over their useful lives. If there is doubt as to whether
title to the asset passes at a later stage and there is no purchase option the asset is depreciated over
the lease term, if this is shorter. The payment obligations relating to future lease installments are recog-
nized as financial liabilities. An impairment loss is recognized if the recoverable amount is lower than
the amortized cost of the leased asset. The impairment loss is reversed if the reasons for impairment
no longer exist.
Finance lease liabilities are measured at the present value of the future lease payments.
Property, plant and equipment, which is rented by the Fresenius Group is accounted at its purchase
costs. Its depreciation is calculated using the straight-line method over the leasing time and its
expected residual value.
r) Derivative financial instruments
In accordance with IAS 39 (Financial Instruments: Recognition and Measurement), derivative finan-
cial instruments which primarily include foreign currency forward contracts and interest rate swaps
are recognized as assets or liabilities at fair value in the balance sheet. Changes in the fair value of
derivative financial instruments classified as fair value hedges and in the corresponding underlyings
are recognized periodically in earnings. The effective portion of changes in fair value of cash flow
hedges is recognized in accumulated other comprehensive income (loss) in shareholders’ equity
(see Note 26, Financial instruments). The non-effective portion of cash flow hedges is recognized in
earnings immediately.
s) Liabilities
At the balance sheet date, liabilities are stated in accordance with IAS 39 (Financial Instruments:
Recognition and Measurement) at amortized cost which normally corresponds to the settlement
amount. As general rule, short-term liabilities are measured at their repayment amount.
t) Legal contingencies
From time to time, during the ordinary course of Fresenius Group's operations, the Fresenius Group
is party to litigation and arbitration and is subject to investigations relating to various aspects of its
business. The Fresenius Group regularly analyzes current information about such claims for probable
losses and provides accruals for such matters, including the estimated legal expenses, as appropriate.
The Fresenius Group utilizes its internal legal department as well as external resources for these

Notes68
assessments. In making the decision regarding the need for loss accrual, the Fresenius Group con-
siders the degree of probability of an unfavorable outcome and its ability to make a reasonable esti-
mate of the amount of loss. These accruals include expenses for legal and consulting services in con-
nection with these legal issues.
The filing of a suit or formal assertion of a claim or assessment, or the disclosure of any such suit or
assertion, does not necessarily indicate that accrual of a loss is appropriate.
u) Other accrued expenses
In accordance with IAS 37 (Provisions, Contingent Liabilities and Contingent Assets), accruals for
taxes and other obligations are recognized when there is a present obligation to a third party arising
from past events, it is probable that the obligation will be settled in the future and a reliable estimate
can be made of the amount.
Tax accruals include obligations for the current year and for prior periods.
Non-current accruals with a remaining period of more than one year are discounted to the present
value of the expenditures expected to settle the obligation.
v) Pension liabilities and similar obligations
Pension obligations for post-employment benefits are measured in accordance with IAS 19 (Employee
Benefits) sing the projected unit credit method, taking into account future salary and trends for pen-
sion increase. Actuarial gains and losses that exceed a corridor of 10% of the present value of the
defined benefit obligation are spread over the expected average remaining working lives of the
employees participating in the plans, adjusted for fluctuation.
w) Debt issuance costs
Debt issuance costs are amortized over the term of the related obligation.
x) Stock option plans
The total cost of stock options and convertible equity instruments granted to members of the Manage-
ment Board and executive employees of the Fresenius Group at the grant date is measured in accor-
dance with IFRS 2 (Share-based Payment) using an option pricing modell and recognized as expense
over the vesting period of the stock option plans.

69Consolidated Statement of Income Consolidated Balance Sheet Consolidated Cash Flow Statement Consolidated Statement of Equity Segment Reporting Notes
y) Self-insurance programs
The largest subsidiary of the Fresenius Group in North America is partially self-insured for professional,
product and general liability, auto liability and worker’s compensation claims under which the Fresenius
Group assumes responsibility for incurred claims up to predetermined amounts above which third
party insurance applies. Reported balances for the year include estimates of the anticipated expense
for claims incurred (both reported and incurred but not reported) based on historical experience and
existing claim activity. This experience includes both the rate of claims incidence (number) and claim
severity (cost) and is combined with individual claim expectations to estimate the reported amounts.
z) Foreign currency translation
The reporting currency is the euro. The Fresenius Group follows the provisions of IAS 21 (The
Effects of Changes in Foreign Exchange Rates). Substantially all assets and liabilities of the foreign
subsidiaries are translated at year-end exchange rates, while revenues and expenses are translated
at average exchange rates. Adjustments due to foreign currency translation fluctuations are excluded
from net earnings and are reported in accumulated other comprehensive income (loss). In addition, the
translation adjustments of certain intercompany borrowings, which are considered foreign equity in-
vestments, are also reported in accumulated other comprehensive income (loss).
Gains and losses arising from the translation of foreign currency positions as well as those arising
from the elimination of foreign currency intercompany loans are recorded as selling, general and
administrative expenses, as far as they are not considered foreign equity instruments. Out of this
transaction only immaterial gains resulted in the fiscal year 2006.
The exchange rates of the main currencies affecting foreign currency translation developed as follows:
Year-endexchange rate*
Dec 31, 2006
Year-endexchange rate*
Dec 31, 2005
Averageexchange rate
2006
Averageexchange rate
2005
US dollar per € 1.3170 1.1797 1.2558 1.2442
Pound sterling per € 0.6715 0.6853 0.6817 0.6839
Swedish krona per € 9.0404 9.3885 9.2530 9.2816
Chinese renminbi per € 10.2793 9.5204 10.0099 10.1639
Japanese yen per € 156.93 138.90 146.06 136.86
* mid-closing rate on balance sheet date
Notes70
aa) Use of estimates
The preparation of consolidated financial statements in conformity with IFRS requires management
to make estimates and assumptions that affect the reported amounts of assets and liabilities, the
disclosure of contingent assets and liabilities at the date of consolidated financial statements and
the reported amounts of revenues and expenses during the reporting period. Actual results could
differ from those estimates.
bb) Receivables management
The entities of the Fresenius Group perform ongoing evaluations of the financial situation of their
customers and generally do not require a collateral from the customers for the supply of products
and provision of services. Approximately 24% and 25% of the sales of the Fresenius Group were
earned and subject to the regulations under governmental health care programs, primarily Medicare
and Medicaid, administered by the United States government in 2006 and 2005, respectively.
cc) Recent pronouncements and accounting changes
The Fresenius Group has prepared its consolidated financial statements at December 31, 2006 in
conformity with IFRS that have to be applied for fiscal years starting on January 1, 2006.
The Fresenius Group applies the following standards, as far as they are relevant for the Fresenius
Group’s business, for the first time in 2006:
b Amendment to IAS 21 (Effects of Changes in Foreign Exchange Rates)
b Amendment to IAS 39 (Financial Instruments: Recognition and Measurement
1. Fair Value Option
2. Financial Guarantee Contracts) and IFRS 4 (Insurance Contracts)
b IFRIC 4 (Determining whether an Arrangement contains a Lease)
The application of the standards is in compliance with the respective transition principles. As far as it
is not explicitly mentioned and subsequently separately allowed, changes are applied retroactively.
That means the prior periods are presented as if the new accounting policy had always been applied.
Amounts of prior years are adjusted accordingly.
In the following, the effects on the consolidated financial statements of the fiscal year 2006 are
shown in detail:
In December 2005, the IASB issued an amendment to IAS 21 (The Effects of Changes in Foreign Ex-
change Rates). The amendment simplifies the recognition of exchange differences of certain mone-
tary items that form part of a net investment in a foreign operation.

71Consolidated Statement of Income Consolidated Balance Sheet Consolidated Cash Flow Statement Consolidated Statement of Equity Segment Reporting Notes
In June 2005, the IASB issued the amendment to IAS 39 (Financial Instruments: Recognition and
Measurement): Fair Value Option. This amendment restricts the use of the fair value option on finan-
cial instruments that meet specific criteria.
In August 2005, the IASB issued the amendment to IAS 39 (Financial Instruments: Recognition and
Measurement) and to IFRS 4 (Insurance Contracts) addressing the accounting for financial contracts.
Under the amendments, the issuer generally accounts for financial guarantee contracts as a financial
liability. The amendments define a financial guarantee contract as a contract, that requires the issuer
to make specified payments to reimburse the holder of the contract for a loss that the holder incurs
because a specified debtor fails to make payments when due.
In December 2004, IFRIC issued IFRIC Interpretation 4 (Determining whether an Arrangement
contains a Lease) (IFRIC 4). IFRIC 4 results in the application of IAS 17 (Leases) when an arrange-
ment is place which does not take the legal form of a lease (a so called undisclosed lease agreement)
but which qualifies as a lease under the definition contained in IAS 17. A contract is a lease or con-
tains a lease if fulfilment of the arrangement is dependent on the use of a specific asset or specific
assets.
dd) New accounting standards
The IASB or IFRIC issued the following for the Fresenius Group relevant new standards and interpre-
tations, which are mandatory for fiscal years commencing on or after January 1, 2007.
b Amendment to IAS 1 (Presentation of Financial Statements)
b IFRS 7 (Financial Instruments: Disclosures)
b IFRS 8 (Operating Segements)
b IFRIC 7 (Applying the Restatement Approach under IAS 29
(Financial Reporting in Hyperinflationary Economies))
b IFRIC 8 (Scope of IFRS 2)
b IFRIC 9 (Reassessment of Embedded Derivatives)
b IFRIC 10 (Interim Financial Reporting and Impairment)
b IFRIC 11 (IFRS 2 – Group and Treasury Share Transactions)
b IFRIC 12 (Service Concession Arrangements)
In August 2005, the IASB issued the amendment to IAS 1 (Presentation of Financial Statements).
The changes to IAS 1 require an entity to disclose certain quantitative information about its objec-
tives, policies and processes for their capital management. Application of this amendment is manda-
tory for fiscal years commencing on or after January 1, 2007. The first time adoption of IAS 1 in the
fiscal year 2007 will result in additional notes.

Notes72
In August 2005, the IASB issued IFRS 7 (Financial Instruments: Disclosures). IFRS 7 introduces new
requirements to improve the information on financial instruments with regard to risk management,
besides the already existing disclosures (about approach/definition, presentation and measurement
of financial instruments) in the IFRS-consolidated financial statements. IFRS 7 is effective for fiscal
years beginning on or after January 1, 2007. The first time adoption of this standard in the fiscal year
2007 will result in additional notes on financial instruments.
In November 2006, the IASB issued IFRS 8 (Operating Segments) which replaces IAS 14 (Segment
Reporting). IFRS 8 requires an entity to provide certain information about its operating segments in
its annual and interim financial statements. Operating segments are determined under IFRS 8 using
the financial information provided to and evaluated by the chief operating decision maker (CODM) for
the purpose of allocating the entity’s resources and evaluating the entity’s performance. A reportable
segment may include one or more operating segments. However, certain criteria must be met to
include more than one operating segment in a reportable segment. IFRS 8 requires the disclosure of
specific financial information (e.g. profit or loss and assets) for each reportable segment as well as a
reconciliation of certain reportable segment information (e.g. total reportable segment revenues) to
the corresponding amount in the entity’s financial statements. IFRS 8 requires further disclosures
as well, such as information about the revenues generated by an entity’s products or services and in-
formation about its application of IFRS 8 (e.g. how did the entity determine its operating segments).
IFRS 8 is effective for fiscal years beginning on or after January 1, 2009. The Fresenius Group’s seg-
ment reporting has already met the requirements of IFRS 8.
In November 2005, the IFRIC issued IFRIC Interpretation 7 (Applying the Restatement Approach
under IAS 29 (Financial Reporting in Hyperinflationary Economies)) (IFRIC 7). The interpretation
clarifies the requirements of IAS 29 relating to two issues that constituents had raised with the IFRIC.
The first requirement is how comparative amounts in financial statements should be restated when
an entity identifies the existence of hyperinflation in the economy of the currency in which its finan-
cial statements are measured (its functional currency). The second requirement is how deferred tax
items in the opening balance sheet should be restated. IFRIC 7 shall be applied for fiscal years begin-
ning on or after March 1, 2006. The Fresenius Group is currently analyzing the potential impact of
the interpretation, if any, on the Group’s consolidated financial statements.
In January 2006, the IFRIC issued IFRIC Interpretation 8 (Scope of IFRS 2) (IFRIC 8). The interpreta-
tion clarifies that IFRS 2 (Share-based Payment) applies to arrangements where an entity makes share-
based payments for non or inadequate consideration. IFRIC 8 explains that, if the identifiable conside-
ration given appears to be of less value than the equity instruments granted or liability incurred, this

73Consolidated Statement of Income Consolidated Balance Sheet Consolidated Cash Flow Statement Consolidated Statement of Equity Segment Reporting Notes
situation typically indicates that other consideration has been or will be received. IFRS 2 therefore
applies. In accordance with IAS 8 (Accounting Policies, Changes in Accounting Estimates and Errors),
IFRIC 8 shall be applied retroactively for fiscal years beginning on or after May 1, 2006. The Fresenius
Group is currently analyzing the potential impact of the interpretation, if any, on the Group’s consoli-
dated financial statements.
In March 2006, the IFRIC issued IFRIC Interpretation 9 (Reassessment of Embedded Derivatives)
(IFRIC 9). This interpretation clarifies the treatment of embedded derivatives after first time recognition.
The conditions as explained in IAS 39 regulate, if an embedded derivative has to be recognized sepa-
rately and to be measured as a derivative financial instrument. IFRIC 9 shall be applied for fiscal
years beginning on or after June 1, 2006. The Fresenius Group is currently analyzing the potential
impact of the interpretation, if any, on the Group’s consolidated financial statements.
In July 2006, the IFRIC issued IFRIC Interpretation 10 (Interim Financial Reporting and Impairment)
(IFRIC 10). IFRIC 10 addresses the interaction between certain requirements in IAS 34 (Interim
Financial Reporting) and the requirements of IAS 36 (Impairment of Assets) on the recognition of
impairment losses on goodwill and the requirements of IAS 39 (Financial Instruments: Recognition
and Measurement) on certain financial assets, and the effect of those interactions on subsequent
interim and annual financial statements. IFRIC 10 states that any such impairment loss recognized
in an interim financial statement must not be reversed in subsequent interim or annual financial
statements. The IFRIC explicitly concluded that this consensus should not be extended to address
potential conflicts between IAS 34 and other standards. IFRIC 10 shall be applied for fiscal years
beginning on or after November 1, 2006. The interpretation has currently no impact on the Group’s
consolidated financial statements.
In November 2006, the IFRIC issued IFRIC Interpretation 11 (IFRS 2 – Group and Treasury Share
Transactions) (IFRIC 11). The interpretation addresses how to apply IFRS 2 to share-based payment
arrangements involving an entity’s own equity instruments or equity instruments of another entity of
the same group. The interpretation requires a share-based payment arrangement in which an entity
receives goods or services as consideration for its own equity instruments to be accounted for as an
equity-settled share-based payment transaction, regardless of how the equity instruments needed are
obtained. The interpretation also provides guidance on whether share-based payment arrangements
should be accounted for as cash-settled or equity-settled in the entity’s financial statements, if equity
instruments of the parent company are granted. IFRIC 11 shall be applied for fiscal years beginning
on or after March 1, 2007. The Fresenius Group is currently analyzing the potential impact of the
interpretation, if any, on the Group’s consolidated financial statements.

In November 2006, the IFRIC issued IFRIC Interpretation 12 (Service Concession Arrangements)
(IFRIC 12). Service concessions are arrangements whereby a government or other public sector entity
grants contracts for the supply of public services – such as roads, airports, prisons, and energy and
water supply and distribution facilities – to private sector operators. Control of the assets remains in
public hands, but the private sector operator is responsible for construction activities, as well as for
operating and maintaining the public sector infrastructure. IFRIC 12 addresses how service concession
operators should apply existing IFRS to account for the obligations they undertake and rights they
receive in service concession arrangements. IFRIC 12 shall be applied for fiscal years beginning on
or after January 1, 2008. The Fresenius Group is currently analyzing the potential impact of the inter-
pretation, if any, on the Group’s consolidated financial statements.
The endorsements of IFRIC 10 and IFRIC 11 by the EU Commission are still outstanding.
VI. CRITICAL ACCOUNTING POLICIES
In the opinion of the Management of the Fresenius Group, the following accounting policies and
topics are critical for the consolidated financial statements in the present economic environment. The
influences and judgements as well as the uncertainties which affect them are also important factors
to be considered when looking at present and future operating earnings of the Fresenius Group.
a) Recoverability of goodwill and intangible assets with indefinite useful lives
Fresenius Group’s acquisitions in the fiscal year have created a significant amount of intangible assets,
including goodwill, tradenames and management contracts. At December 31, 2006 and December
31, 2005, the carrying amount of goodwill and non-amortizable intangible assets with indefinite useful
lives amounted to € 7,469 million and € 5,085 million, respectively, which represented 50% and 44%,
respectively, of total assets.
In accordance with IFRS 3 (Business Combinations), an impairment test of goodwill and non-amor-
tizable intangible assets with indefinite useful lives is performed at least once a year, or if events
occur or circumstances change that would indicate the carrying amount might be impaired (impair-
ment test).
To comply with the regulation of IFRS 3 and determine possible impairments of these assets, the fair
value of the cash generating units (CGUs) is compared to the CGUs’ carrying amount. The fair value
of each CGU is estimated using estimated future cash flows for the unit discounted by a weighted-
average cost of capital (WACC) specific to that CGU. Estimating the discounted future cash flows involves
significant assumptions, especially regarding future reimbursement rates and sales prices, number of
Notes74

75Consolidated Statement of Income Consolidated Balance Sheet Consolidated Cash Flow Statement Consolidated Statement of Equity Segment Reporting Notes
treatments, sales volumes and costs. In determining discounted cash flows, the Fresenius Group
utilizes for every CGU its three-year budget, projections for years four to ten and a corresponding
growth rate for all remaining years. These growth rates are for Fresenius Medical Care between 0%
and 4%, for Fresenius Kabi 2% and for Fresenius ProServe 1%. This discount factor is determined
by the WACC of the respective CGU. The Fresenius Medical Care’s WACC consists of a basic rate of
6.83% for 2006. This basic rate is then adjusted by a country specific risk rate within each CGU for
determining the CGU’s fair value. In 2006, this rate ranged from 0% to 9%. In the business segments
Fresenius ProServe and Fresenius Kabi, the WACC amounts to 6.75%, country specific adjustments
did not occur. In case that the fair value of the CGU is less than its carrying amount the difference is
at first recorded as an impairment of the fair value of the goodwill. In case that the fair value of the
CGU is less than its carrying amount, the difference is at first recorded as an impairment of the fair
value of the goodwill.
A prolonged downturn in the health care industry with higher than expected costs for providing health
care services could adversely affect the estimated future cash flows of certain countries or segments.
Future adverse changes in a reporting unit’s economic environment could affect the discount rate.
A decrease in the estimated future cash flows and/or a decline in the reporting unit`s economic envi-
ronment could result in impairment charges to goodwill and other intangible assets with indefinite
lives which could materially and adversely affect the Group’s future operating results.
b) Legal contingencies
The Fresenius Group is involved in several legal matters arising from the ordinary course of Fresenius
Group’s business. For details, please see Note 25, Commitments and contingent liabilities.
The Fresenius Group regularly analyses current information including its legal defenses and provides
accruals for probable contingent losses including the estimated legal expenses to resolve the matters.
Fresenius uses the resources of its internal legal department as well as external lawyers for the assess-
ment. In making the decision regarding the need for loss accrual, the degree of probability of an unfa-
vorable outcome and the ability to make a reasonable estimate of the amount of loss is considered.
The filing of a suit or formal assertion of a claim or assessment, or the disclosure of any such suit or
assertion, does not necessarily indicate that accrual of a loss is appropriate.

Notes76
c) Allowance for doubtful accounts
Trade accounts receivable are a significant asset and the allowance for doubtful accounts is a signifi-
cant estimate made by the Management. Trade accounts receivable were € 2,088 million and € 1,871
million in 2006 and 2005, respectively, net of allowance. More than two thirds of receivables derives
from the business segment Fresenius Medical Care and mainly relates to the dialysis care business in
North America.
The allowance for doubtful accounts was € 218 million and € 200 million as of December 31, 2006
and December 31, 2005, respectively.
Sales are invoiced at amounts estimated to be receivable under reimbursement arrangements with
third party payors. Estimates for the allowance for doubtful accounts are mainly based on historic
collection experience, taking into account the aging of accounts receivable and the contract partners.
The Fresenius Group believes that these analyses result in a well-founded estimate of allowances for
doubtful accounts. From time to time, the Fresenius Group reviews changes in collection experience
to ensure the appropriateness of the allowances.
Deterioration in the aging of receivables and collection difficulties could require that Fresenius
increases the estimates of allowances for doubtful accounts. Additional expenses for uncollectible
receivables could have a significant negative impact on future operating results.
d) Self-insurance programs
The largest subsidiary of the Fresenius Group in North America is partially self-insured for professional,
product and general liability, auto liability and worker’s compensation claims under which the
Fresenius Group assumes responsibility for incurred claims up to predetermined amounts above
which third party insurance applies. Reported balances for the year include estimates of the antici-
pated expense for claims incurred (both reported and incurred but not reported) based on historical
experience and existing claim activity. This experience includes both the rate of claims incidence
(number) and claim severity (cost) and is combined with individual claim expectations to estimate
the reported amounts.
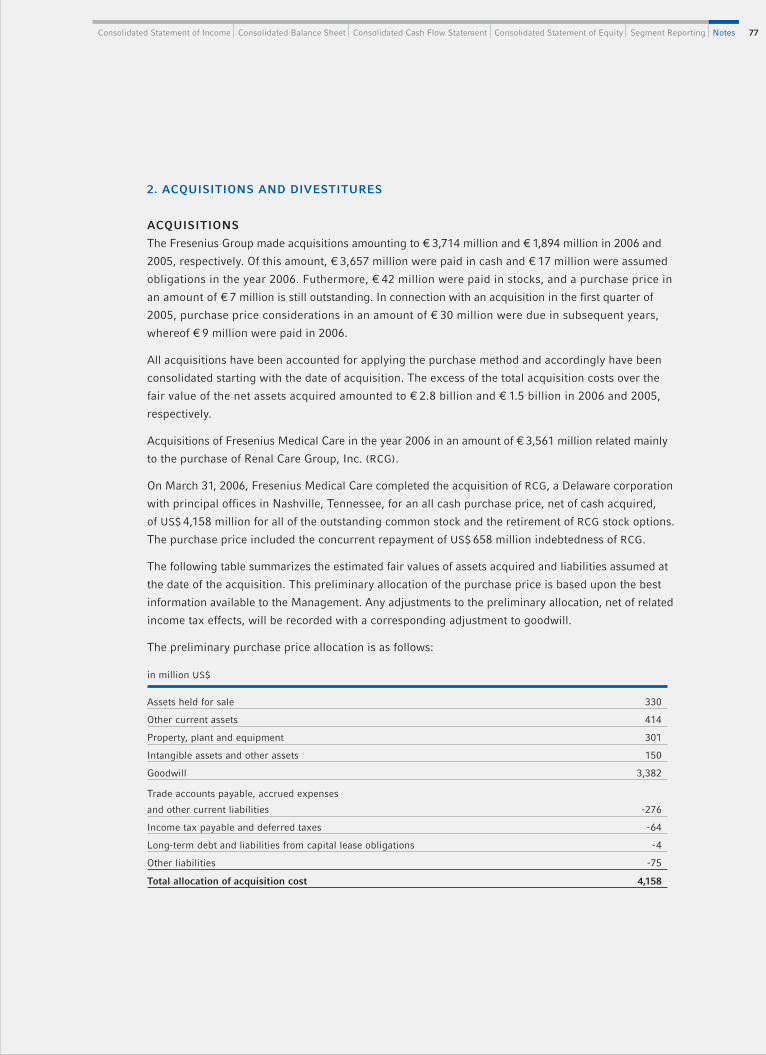
77Consolidated Statement of Income Consolidated Balance Sheet Consolidated Cash Flow Statement Consolidated Statement of Equity Segment Reporting Notes
2. ACQUISITIONS AND DIVESTITURES
ACQUISITIONS
The Fresenius Group made acquisitions amounting to € 3,714 million and € 1,894 million in 2006 and
2005, respectively. Of this amount, € 3,657 million were paid in cash and € 17 million were assumed
obligations in the year 2006. Futhermore, € 42 million were paid in stocks, and a purchase price in
an amount of € 7 million is still outstanding. In connection with an acquisition in the first quarter of
2005, purchase price considerations in an amount of € 30 million were due in subsequent years,
whereof € 9 million were paid in 2006.
All acquisitions have been accounted for applying the purchase method and accordingly have been
consolidated starting with the date of acquisition. The excess of the total acquisition costs over the
fair value of the net assets acquired amounted to € 2.8 billion and € 1.5 billion in 2006 and 2005,
respectively.
Acquisitions of Fresenius Medical Care in the year 2006 in an amount of € 3,561 million related mainly
to the purchase of Renal Care Group, Inc. (RCG).
On March 31, 2006, Fresenius Medical Care completed the acquisition of RCG, a Delaware corporation
with principal offices in Nashville, Tennessee, for an all cash purchase price, net of cash acquired,
of US$ 4,158 million for all of the outstanding common stock and the retirement of RCG stock options.
The purchase price included the concurrent repayment of US$ 658 million indebtedness of RCG.
The following table summarizes the estimated fair values of assets acquired and liabilities assumed at
the date of the acquisition. This preliminary allocation of the purchase price is based upon the best
information available to the Management. Any adjustments to the preliminary allocation, net of related
income tax effects, will be recorded with a corresponding adjustment to goodwill.
The preliminary purchase price allocation is as follows:
in million US$
Assets held for sale 330
Other current assets 414
Property, plant and equipment 301
Intangible assets and other assets 150
Goodwill 3,382
Trade accounts payable, accrued expenses
and other current liabilities -276
Income tax payable and deferred taxes -64
Long-term debt and liabilities from capital lease obligations -4
Other liabilities -75
Total allocation of acquisition cost 4,158

Notes78
The purchase price for the acquisition of RCG amounted to US$ 4,158 million plus US$ 57 million
for net cash. The purchase price includes additional expenses in amount of US$ 48 million. The
balance sheet total according to IFRS prior to the acquisition of US$ 1,754 million has been reduced
by US$ 869 million. This effect primarily results from redemption of goodwill and intangible assets
amounting to US$ 922 million, which was partly offset by the revaluation of assets in the amount of
US$ 53 million. In addition, liabilities increased by US$ 152 million. These liabilities were not
recorded in the balance sheet of RCG. Due to the revaluation of the assets and liabilities, the equity
(before minority interest) in an amount of US$ 751 million prior to the acquisition has been reduced
by US$ 1,021 million to US$ -270 million. The difference between the purchase price including addi-
tional expenses and net cash and the proportional equity in an amount of US$ 4,485 million results
from reimbursement of acquired indebtedness (US$ 655 million) and acquired liabilities in connection
with stock options (US$ 203 million). The remaining difference corresponds to the capitalized intan-
gible assets (US$ 74 million), the capitalized goodwill (US$ 3,364 million) (less deferred tax liabilities
in an amount of US$ 2 million) and assets which were sold in connection with the divestiture of clinics
of RCG (US$ 191 million) in the second quarter of 2006.
On November 14, 2006, Fresenius Medical Care acquired the worldwide rights to the PhosLo® phos-
phate binder product business and its related assets of Nabi Biopharmaceuticals, Inc. PhosLo® is an
oral application calcium acetate phosphate binder for treatment of hyperphosphatemia primarily in
end-stage renal disease patients. Fresenius Medical Care paid cash of US$ 65.3 million including
related direct costs of US$ 0.3 million plus a US$ 8 million milestone payment in December 2006 and
a US$ 2.5 million milestone payment in 2007. An additional milestone payment of US$ 10.5 million will
be paid over the next two to three years, contingent upon the achievement of certain performance
criteria. The purchase price was allocated to technology with an estimated useful live of 15 years
(US$ 64.8 million), and in-process research and development project (US$ 2.8 million) which is imme-
diately expensed, goodwill (US$ 7.3 million) and other net assets (US$ 0.9 million).
In connection with the transaction, Fresenius Medical Care also acquired worldwide rights to a new
product formulation currently under development, which Fresenius Medical Care expects will be
submitted for approval in the United States during 2007. Following the successful launch of this new
product formulation, Fresenius Medical Care will pay Nabi Biopharmaceuticals, Inc. royalties on
sales of the new product formulation commencing upon the first commercialization of the new product
and continuing until November 13, 2016. Total consideration, consisting of initial payment, milestone
payments and royalties will not exceed US$ 150 million.

79Consolidated Statement of Income Consolidated Balance Sheet Consolidated Cash Flow Statement Consolidated Statement of Equity Segment Reporting Notes
In 2005, Fresenius Medical Care made acquisitions amounting to € 108 million, of which € 101 million
was paid in cash. Purchase prices in an amount of € 7 million will be paid in subsequent years. The
majority of this amount (€ 76 million) was used to purchase dialysis clinics.
In 2006, Fresenius Kabi made acquisitions of € 14 million, referring mainly to subsequent costs for
the acquisition of Endomed Laboratório Farmacéutico Ltda., Brazil, as well as the taking over of a
distributor in South Africa. In September 2006, Fresenius Kabi has agreed to acquire all stakes in
Filaxis, Argentina, and made a down payment. The acquisition still requires approval by the antitrust
authorities.
In the year 2005, Fresenius Kabi made acquisitions of € 274 million, referring mainly to the acquisition
of the Portuguese company Labesfal – Laboratório de Especialidades Farmacêuticas Almiro S.A.
(Labesfal), the Czech company Infusia a.s., the acquisition of the remaining 35% shares of Beijing
Fresenius Kabi Pharmaceutical Co., Ltd., China and the business of Clinico GmbH, Bad Hersfeld,
Germany (Clinico).
Fresenius ProServe made acquisitions in an amount of € 139 million, which mainly refers to the acqui-
sition of stakes in the HUMAINE Kliniken GmbH (HUMAINE) by HELIOS Kliniken GmbH (HELIOS)
and additional stakes in HELIOS in 2006. Initially, 60% of the shares of HUMAINE were acquired, for
the remaining 40% HELIOS received an option. Since the beginning of the third quarter of 2006,
HUMAINE has been consolidated.
In 2005, Fresenius ProServe made acquisitions of € 1,507 million, referring mainly to the acquisition of
HELIOS. In December 2005, Fresenius AG first acquired HELIOS and then assigned its share in HELIOS
to Fresenius ProServe GmbH. The purchase price for 100% of the HELIOS shares was € 1.5 billion
plus € 100 million for the net cash position. Fresenius AG acquired 94% of the HELIOS shares.
In the last quarter of 2006, Fresenius Biotech signed a contract to acquire additional shares of Trion
Pharma GmbH, Germany in an amount of € 9 million. Contingent upon the achievement of certain
performance criteria, additional contractual milestone payments in a maximum amount of € 14 million
have been agreed. The acquisition was closed in the first quarter of 2007. In 2005, Fresenius Biotech
paid additional costs in an amount of € 4 million for the shares of Trion Pharma GmbH acquired in 2002.

Notes80
IMPACTS ON THE FRESENIUS GROUP RESULTING FROM ACQUISITIONS
The acquisitions completed in 2006, or which were included in the consolidated statements for the
first full year, contributed the following amounts to the development of sales and earnings:
in million € 2006
Sales 2,202
EBITDA 378
EBIT 308
Net interest -186
Net income 71
The acquisitions increased the total assets of the Fresenius Group by € 3.8 billion mainly due to the
acquisition of RCG (€ 3.5 billion).
The following unaudited financial information, on a pro forma basis, reflects the consolidated results
of operations as if the acquisition of RCG, the main acquisition in the year 2006, and the divestitures
of the clinics described below had been consummated at the beginning of 2006. The pro forma infor-
mation includes adjustments mainly for interest expense on acquisition debt and income taxes. The
pro forma financial information is not necessarily indicative of the results of operations as it would
have been had the acquisition of RCG been consummated at the beginning of the respective period.
in million € as reported pro forma
Sales 10,776 11,023
Net income 330 330
Basic earnings per ordinary share in € 2.15 2.15
Fully diluted earnings per ordinary share in € 2.12 2.12
Basic earnings per preference share in € 2.16 2.16
Fully diluted earnings per preference share in € 2.13 2.13

81Consolidated Statement of Income Consolidated Balance Sheet Consolidated Cash Flow Statement Consolidated Statement of Equity Segment Reporting Notes
DIVESTITURES
Fresenius Medical Care was required to divest a total of 105 renal dialysis centers, consisting of both
former Fresenius Medical Care clinics (legacy clinics) and former RCG clinics, in order to complete
the RCG acquisition in accordance with a consent order issued by the United States Federal Trade
Commission (FTC) on March 31, 2006. Fresenius Medical Care sold 96 of such centers on April 7,
2006 to a wholly-owned subsidiary of DSI Holding Company, Inc. (DSI) and sold DSI the remaining 9
centers effective as of June 30, 2006. Separately, in December 2006, Fresenius Medical Care also
sold the former laboratory business acquired in the RCG acquisition receiving cash consideration of
US$ 9 million. Fresenius Medical Care received cash consideration of US$ 516 million, net of related
expenses, for all centers divested and for the divested laboratory, subject to customary post-closing
adjustments. Pre-tax income of US$ 40 million on the sale of the legacy clinics was recorded in income
from operations. Due to basis differences, tax expense of US$ 44 million was recorded, resulting in a
net loss on sale of US$ 4 million.

Notes82
NOTES ON THE CONSOLIDATED STATEMENT OF INCOME
3. SALES
Sales by activity are as follows:
An analysis of sales by business segment and region is shown in the segment information on pages
52 to 55.
4. COST OF SALES
Cost of sales comprises the following:
5. PERSONNEL EXPENSES
Cost of sales, selling, general and administrative expenses and expenditure on research and develop-
ment include personnel expenses amounting to € 3,959 million and € 2,479 million in the year 2006
and 2005, respectively.
in million € 2006 2005
Sales of services 7,017 4,462
Sales of products and related goods 3,426 3,113
Sales from long-term production contracts 333 314
Other sales – –
Sales 10,776 7,889
in million € 2006 2005
Costs of services 5,241 3,373
Manufacturing cost of products and related goods 1,829 1,668
Cost of long-term production contracts 269 253
Other cost of sales – –
Cost of sales 7,339 5,294
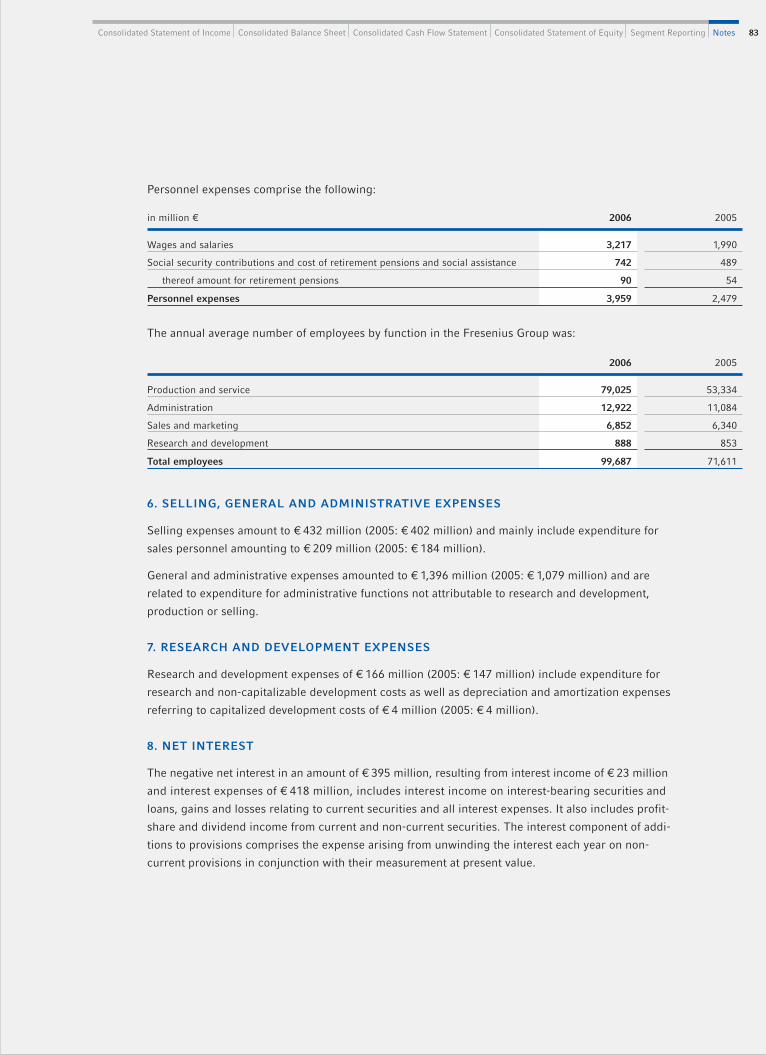
83Consolidated Statement of Income Consolidated Balance Sheet Consolidated Cash Flow Statement Consolidated Statement of Equity Segment Reporting Notes
The annual average number of employees by function in the Fresenius Group was:
6. SELLING, GENERAL AND ADMINISTRATIVE EXPENSES
Selling expenses amount to € 432 million (2005: € 402 million) and mainly include expenditure for
sales personnel amounting to € 209 million (2005: € 184 million).
General and administrative expenses amounted to € 1,396 million (2005: € 1,079 million) and are
related to expenditure for administrative functions not attributable to research and development,
production or selling.
7. RESEARCH AND DEVELOPMENT EXPENSES
Research and development expenses of € 166 million (2005: € 147 million) include expenditure for
research and non-capitalizable development costs as well as depreciation and amortization expenses
referring to capitalized development costs of € 4 million (2005: € 4 million).
8. NET INTEREST
The negative net interest in an amount of € 395 million, resulting from interest income of € 23 million
and interest expenses of € 418 million, includes interest income on interest-bearing securities and
loans, gains and losses relating to current securities and all interest expenses. It also includes profit-
share and dividend income from current and non-current securities. The interest component of addi-
tions to provisions comprises the expense arising from unwinding the interest each year on non-
current provisions in conjunction with their measurement at present value.
in million € 2006 2005
Wages and salaries 3,217 1,990
Social security contributions and cost of retirement pensions and social assistance 742 489
thereof amount for retirement pensions 90 54
Personnel expenses 3,959 2,479
2006 2005
Production and service 79,025 53,334
Administration 12,922 11,084
Sales and marketing 6,852 6,340
Research and development 888 853
Total employees 99,687 71,611
Personnel expenses comprise the following:

Notes84
Income tax expense (benefit) for the years 2006 and 2005 consists of the following:
9. INCOME TAXES
Earnings before income taxes and minority interest is attributable to the following geographic regions:
In the years 2006 and 2005, Fresenius AG is subject to German federal corporation income tax at a
base rate of 25% plus a solidarity surcharge of 5.5% on federal corporation taxes payable.
A reconciliation between the expected and actual income tax expense is shown below. The expected
corporate income tax expense is computed by applying the German corporation tax rate (including
the solidarity surcharge) and the effective trade tax rate on income before income taxes and minority
interest. The respective combined tax rates are 37.36% for the fiscal year 2006 and 37.31% for the
fiscal year 2005.
in million € 2006 2005
Germany 191 80
Abroad 857 684
Total 1,048 764
in million € Germany Abroad2006Total Germany Abroad
2005Total
Current taxes 119 218 337 37 242 279
Deferred taxes -27 103 76 -13 27 14
Income taxes 92 321 413 24 269 293
in million € 2006 2005
Computed “expected” income tax expense 391 285
Increase (reduction) in income taxes resulting from:
Items not recognized for tax purposes 18 31
Foreign tax rate differential -25 -23
Tax-free income -26 -18
Taxes for prior years 47 23
Taxes in connection with divestitures 23 0
Other -15 -5
Income tax 413 293
Effective tax rate 39.4% 38.4%

85Consolidated Statement of Income Consolidated Balance Sheet Consolidated Cash Flow Statement Consolidated Statement of Equity Segment Reporting Notes
The tax effects of the temporary differences that give rise to deferred tax assets and liabilities at
December 31 are presented below:
in million € 2006 2005
Deferred tax assets
Accounts receivable 36 25
Inventories 39 39
Other current assets – 7
Other non-current assets 60 32
Accrued expenses 211 179
Other short-term liabilities 17 14
Other liabilities 21 10
Pension obligations 17 21
Losses carried forward from prior years 67 50
Deferred tax assets 468 377
Deferred tax liabilities
Accounts receivable 10 10
Inventories 11 12
Other current assets – 3
Other non-current assets 297 270
Accrued expenses 58 50
Other short-term liabilities 32 47
Other liabilities 34 23
Deferred tax liabilities 442 415
Accumulated deferred taxes 26 -38
in million € 2006 2005
Deferred tax assets 384 283
Deferred tax liabilities 358 321
Accumulated deferred taxes 26 -38

Notes86
The total remaining operating losses of € 357 million can mainly be carried forward for an unlimited
period.
In assessing the realizability of deferred tax assets, the Management considers whether it is more
likely than not that some portion or all of the deferred tax assets will not be realized. The ultimate
realization of deferred tax assets is dependent upon the generation of future taxable income during
the periods in which those temporary differences become deductible. The Management considers
the scheduled reversal of deferred tax liabilities and projected future taxable income in making this
assessment. Based upon the level of historical taxable income and projections for future taxable income
over the periods in which the deferred tax assets are deductible, the Management of Fresenius Group
believes it is more likely than not that the Fresenius Group will realize the benefits of these deductible
differences, net of the existing valuation allowances at December 31, 2006.
Provision has not been made for additional taxes on approximately € 846 million undistributed earn-
ings of foreign subsidiaries of Fresenius Medical Care as these earnings are considered permanently
reinvested.
The expiration of net operating losses is as follows:
for the fiscal years in million €
2007 12
2008 6
2009 5
2010 10
2011 10
2012 5
2013 2
2014 1
2015 0
2016 0
Subsequent years 12
Total 63

87Consolidated Statement of Income Consolidated Balance Sheet Consolidated Cash Flow Statement Consolidated Statement of Equity Segment Reporting Notes
10. EARNINGS PER SHARE
The following table is a reconciliation of the numerators and denominators of the basic and diluted
earnings per share computations and shows the basic and fully diluted earnings per ordinary and
preference share, retroactively considering the share split of Fresenius AG entered into the commercial
register on January 24, 2007, for the years ending December 31.
The owners of preference shares are entitled to a preference of € 0.01 per bearer preference share
per fiscal year.
in million €, except amounts per share (€) 2006 2005
Numerators
Net income 330 222
less preference on preference shares 1 1
less effect from dilution due to Fresenius Medical Care shares 1 –
Income available to all classes of shares 328 221
Denominators (number of shares)
Weighted-average number of ordinary shares outstanding 76,503,006 60,820,624
Weighted-average number of preference shares outstanding 76,503,006 60,820,624
Weighted-average number of shares outstanding of all classes 153,006,012 125,641,248
Potentially dilutive ordinary shares 758,400 488,247
Potentially dilutive preference shares 758,400 488,247
Weighted-average number of shares outstanding of all classes assuming dilution 154,522,812 126,617,742
Weighted-average number of ordinary shares outstanding assuming dilution 77,261,406 63,308,871
Weighted-average number of preference shares outstanding assuming dilution 77,261,406 63,308,871
Basic earnings per ordinary share 2.15 1.76
Preference per preference share 0.01 0.01
Basic earnings per preference share 2.16 1.77
Fully diluted earnings per ordinary share 2.12 1.75
Preference per preference share 0.01 0.01
Fully diluted earnings per preference share 2.13 1.76

Notes88
NOTES ON THE CONSOLIDATED BALANCE SHEET
11. CASH AND CASH EQUIVALENTS
As of December 31, cash and cash equivalents are as follows:
As of December 31, 2006 and December 31, 2005, committed funds in an amount of € 32 million and
€ 10 million, respectively, are included in cash and cash equivalents
12. TRADE ACCOUNTS RECEIVABLE
As of December 31, trade accounts receivable are as follows:
All trade accounts receivable are due within one year.
13. INVENTORIES
As of December 31, inventories consist of the following:
Reversals of write downs of inventory amounted to € 3 million in the year 2006 and 2005, respectively.
The companies of the Fresenius Group are obligated to purchase approximately € 260 million of raw
materials and purchased components under fixed terms, of which € 172 million is committed at
December 31, 2006 for 2007. The terms of these agreements run one to eight years. Advance pay-
ments from customers of € 27 million have been offset against inventories.
in million € 2006 2005
Cash 259 209
Securities (with a maturity of up to 90 days) 2 43
Cash and cash equivalents 261 252
in million € 2006 2005
Trade accounts receivable 2,306 2,071
less allowance for doubtful accounts 218 200
Trade accounts receivable, net 2,088 1,871
in million € 2006 2005
Raw materials and purchased components 191 176
Work in process 103 117
Finished goods 512 465
less reserves 45 31
Inventories, net 761 727

89Consolidated Statement of Income Consolidated Balance Sheet Consolidated Cash Flow Statement Consolidated Statement of Equity Segment Reporting Notes
Inventories as of December 31, 2006 and December 31, 2005 include approximately € 35 million and
approximately € 23 million, respectively, of the product Erythropoietin (EPO), which is supplied by a
single source supplier in the United States. Delays, stoppages, or interruptions in the supply of EPO
could adversely affect the operating results of Fresenius Medical Care. In October 2006, Fresenius
Medical Care entered into a five-year exclusive sourcing and supply agreement with its EPO supplier.
Revenues from EPO accounted for approximately 9% and 10% of total sales of the Fresenius Group
for 2006 and 2005, respectively.
14. PREPAID EXPENSES AND OTHER CURRENT AND NON-CURRENT ASSETS
As of December 31, prepaid expenses and other current and non-current assets comprise the
following:
The receivables resulting from the German “Krankenhausfinanzierungsgesetz” primarily contain
approved but not yet received earmarked subsidies of Fresenius ProServe’s hospital operations. The
approval is evidenced in a letter written by the granting authorities.
Depreciations of € 6 million and € 3 million were recognized on other non-current assets in the
fiscal years 2006 and 2005, respectively. In the year 2006 as well as in the year 2005, there were
no reclassifications to other non-current assets.
in million €2006
thereof short-term2005
thereof short-term
Accounts receivable resulting from German
“Krankenhausfinanzierungsgesetz” 220 160 175 105
Tax receivables 126 124 118 115
Prepaid expenses 74 13 39 10
Derivative financial instruments 64 10 52 9
Investments and long-term loans 54 0 72 0
Re-insurance claims 23 0 24 0
Advances made 17 17 43 22
Accounts receivable from management contracts in clinics 10 10 18 18
Other assets 537 403 306 205
Prepaid expenses and other assets, gross 1,125 737 847 484
less allowances 8 7 7 6
Prepaid expenses and other assets, net 1,117 730 840 478

Notes90
15. PROPERTY, PLANT AND EQUIPMENT
As of December 31, the acquisition and manufacturing costs and accumulated depreciation of prop-
erty, plant and equipment consist of the following:
ACQUISITION AND MANUFACTURING COSTS
in million €
As ofJanuary 1,
2006
Foreigncurrency
translation
Changes inentities
consolidated AdditionsReclassifi-
cations Disposals
As ofDecember 31,
2006
Land and land facilities 166 -3 9 3 -1 3 171
Buildings and improvements 1,525 -67 149 90 50 66 1,681
Machinery and equipment 2,044 -82 96 229 41 146 2,182
Machinery, equipment and rental
equipment under capital leases 135 -1 6 5 -4 9 132
Construction in progress 257 -14 13 263 -98 9 412
Property, plant and equipment 4,127 -167 273 590 -12 233 4,578
DEPRECIATION
in million €
As ofJanuary 1,
2006
Foreigncurrency
translation
Changes inentities
consolidated AdditionsReclassifi-
cations Disposals
As ofDecember 31,
2006
Land and land facilities 0 0 0 0 0 0 0
Buildings and improvements 504 -29 0 112 2 38 551
Machinery and equipment 1,211 -39 0 231 -6 138 1,259
Machinery, equipment and rental
equipment under capital leases 52 0 0 8 -2 6 52
Construction in progress 1 0 0 0 0 0 1
Property, plant and equipment 1,768 -68 0 351 -6 182 1,863
CARRYING AMOUNTS
in million € December 31, 2006 December 31, 2005
Land and land facilities 171 166
Buildings and improvements 1,130 1,021
Machinery and equipment 923 833
Machinery, equipment and rental equipment under capital leases 80 83
Construction in progress 411 256
Property, plant and equipment 2,715 2,359

91Consolidated Statement of Income Consolidated Balance Sheet Consolidated Cash Flow Statement Consolidated Statement of Equity Segment Reporting Notes
Depreciation on property, plant and equipment for the years 2006 and 2005 amounted to € 351 million
and € 276 million, respectively.
LEASING
Included in property, plant and equipment as of December 31, 2006 and 2005 were € 142 million and
€ 111 million, respectively, of peritoneal dialysis cycler machines which Fresenius Medical Care leases
to customers with end-stage renal disease on a month-to-month basis and hemodialysis machines
which Fresenius Medical Care leases to physicians under operating leases.
To a lesser extent, property, plant and equipment are also leased for the treatment of patients by
other business segments.
Depreciation on machinery, equipment and rental equipment under capital leases amounted to
€ 8 million and € 13 million in the years 2006 and 2005, respectively.
For details of minimum lease payments see Note 19, Debt and liabilities from capital lease obligations.
16. GOODWILL AND OTHER INTANGIBLE ASSETS
In connection with the acquisition of RCG (see Note 2, Acquisitions and divestitures), Fresenius
Medical Care and the Fresenius Group performed a detailed review of the identification of intangible
assets related to Fresenius Medical Care’s dialysis clinic operations in the United States. As part of
this review, Fresenius Medical Care and the Fresenius Group considered the conditions for recognition
as an intangible asset apart from goodwill and practices in the dialysis care industry. The amortizable
intangible assets acquired included US$ 64 million for non-compete agreements, US$ 4 million for
acute care agreements, US$ 2 million for lease agreements and US$ 4 million for software.
As a result of the detailed review of the identification of intangible assets related to the RCG acquisition,
Fresenius Medical Care and the Fresenius Group concluded that their past practice to identify certain
intangible assets separate from goodwill should be revisited and adjusted certain amounts, primarily
with respect to patient relationships that had been identified as separate intangible assets in prior
business combinations. Additionally, Fresenius Medical Care and the Fresenius Group identified non-
compete agreements as separate intangible assets. In connection with the adjustments, the carrying
amount of goodwill increased by US$ 35 million, other intangible assets and deferred tax liabilities
decreased by US$ 37 million and US$ 2 million, respectively, as of the beginning of the current year.
This accounting treatment did not result in a material understatement of Fresenius Medical Care’s
and Fresenius Group’s results of operations or shareholders’ equity in prior years.

Notes92
AMORTIZATION
in million €
As ofJanuary 1,
2006
Foreigncurrency
translation
Changes inentities
consolidated AdditionsReclassifi-
cations Disposals
As ofDecember 31,
2006
Goodwill 4 0 0 0 0 0 4
Tradenames 0 0 0 0 0 0 0
Non-compete agreements 0 -5 0 13 85 3 90
Technology 0 0 0 0 0 0 0
Capitalized development
costs 10 0 0 4 0 1 13
Patient relationships 96 -6 0 0 -90 0 0
Other 152 -7 0 32 3 26 154
Goodwill and other
intangible assets 262 -18 0 49 -2 30 261
ACQUISITION COST
in million €
As ofJanuary 1,
2006
Foreigncurrency
translation
Changes inentities
consolidated AdditionsReclassifi-
cations Disposals
As ofDecember 31,
2006
Goodwill 4,700 -406 2,777 129 16 93 7,123
Tradenames 204 -19 0 0 0 0 185
Non-compete agreements 0 -8 58 0 107 3 154
Technology 0 -3 52 0 0 0 49
Capitalized development
costs 30 0 0 5 0 1 34
Patient relationships 137 -8 0 0 -129 0 0
Other 446 -32 20 11 -5 34 406
Goodwill and other
intangible assets 5,517 -476 2,907 145 -11 131 7,951
As of December 31, the acquisition cost and accumulated amortization of intangible assets consist of
the following:

93Consolidated Statement of Income Consolidated Balance Sheet Consolidated Cash Flow Statement Consolidated Statement of Equity Segment Reporting Notes
CARRYING AMOUNTS
in million € December 31, 2006 December 31, 2005
Goodwill 7,119 4,696
Tradenames 185 204
Non-compete agreements 64 0
Technology 49 0
Capitalized development costs 21 20
Patient relationships 0 41
Other 252 294
Goodwill and other intangible assets 7,690 5,255
The split of intangible assets into regularly amortizable and non-regularly amortizable intangible
assets is shown in the following table:
NON-REGULARLY AMORTIZABLE INTANGIBLE ASSETS
December 31, 2006 December 31, 2005
in million €Acquisition
costAccumulatedamortization
Carryingamount
Acquisitioncost
Accumulatedamortization
Carryingamount
Tradenames 185 0 185 204 0 204
Management contracts 165 0 165 185 0 185
Subtotal 350 0 350 389 0 389
Goodwill 7,123 4 7,119 4,700 4 4,696
Total 7,473 4 7,469 5,089 4 5,085
REGULARLY AMORTIZABLE INTANGIBLE ASSETS
December 31, 2006 December 31, 2005
in million €Acquisition
costAccumulatedamortization
Carryingamount
Acquisitioncost
Accumulatedamortization
Carryingamount
Non-compete agreements 154 90 64 0 0 0
Technology 49 0 49 0 0 0
Capitalized development costs 34 13 21 30 10 20
Patient relationships 0 0 0 137 96 41
Other 241 154 87 261 152 109
Total 478 257 221 428 258 170
The accumulated amortization of non-amortizable intangible assets is due to impairments in accor-
dance with IAS 36 (Impairment of Assets).

Notes94
The carrying amount of goodwill has developed as follows:
The increase in the carrying amount mainly results from the addition of the goodwill due to the RCG
acquisition of approximately € 2.7 billion.
Fresenius Medical Care capitalized development costs in an amount of € 13 million for the fiscal year
2006 (2005: € 13 million). Capitalized development costs are amortized on a straight-line basis over a
useful life of 10 years. The amortization expense for the fiscal year 2006 amounted to € 1 million
(2005: € 1 million).
In the case of Fresenius Kabi, costs capitalized amounted to € 8 million in the fiscal year 2006
(2005: € 7 million). Amortization is recorded on a straight-line basis over a useful life of 5 years and
amounted to € 3 million for the fiscal year 2006 (2005: € 3 million).
in million € 2007 2008 2009 2010 2011
Estimated amortization expenses
for the next five fiscal years 45 41 36 34 32
in million €
Carrying amount as of January 1, 2006 4,696
Additions/disposals, net 2,813
Reclassifications 16
Foreign currency translation -406
Carrying amount as of December 31, 2006 7,119
Amortization on intangible assets amounted to € 49 million and € 46 million for the years 2006 and
2005, respectively.
In 2002, in connection with an acquisition, the Fresenius Group acquired research results which have
an alternative future use. The costs of € 12 million were recognized as assets and are being amortized
over their estimated useful life. In 2005, € 4 million were recognized as subsequent acquisition cost.
Estimated regular amortization expenses of intangible assets for the next five years are shown in the
following table:

95Consolidated Statement of Income Consolidated Balance Sheet Consolidated Cash Flow Statement Consolidated Statement of Equity Segment Reporting Notes
17. OTHER ACCRUED EXPENSES
As of December 31, other accrued expenses consist of the following:
in million €2006
thereof short-term2005
thereof short-term
Personnel expenses 301 293 254 242
Advances received 96 96 84 84
Self-insurance programs 94 94 64 64
Special charge for legal matters 87 87 100 100
Legal matters, advisory and audit fees 49 49 23 23
Bonuses and discounts 47 47 38 38
Warranties and complaints 26 22 21 21
Commissions 20 20 20 20
Physician compensation 14 14 18 18
All other accrued expenses 302 219 271 193
Other accrued expenses 1,036 941 893 815
in million €
As ofJanuary 1,
2006
Foreigncurrency
translation
Changes inentities
consolidated AdditionsReclassifi-
cations Utilized Reversed
As ofDecember 31,
2006
Personnel expenses 254 -15 -3 184 -8 -100 -11 301
Advances received 84 – -1 78 -4 -49 -12 96
Self-insurance programs 64 -9 – 40 – -1 – 94
Special charge for
legal matters 100 -10 0 0 0 -3 0 87
Legal matters, advisory
and audit fees 23 -1 – 43 -2 -12 -2 49
Bonuses and discounts 38 – – 41 – -29 -3 47
Warranties and complaints 21 1 1 20 – -14 -3 26
Commissions 20 1 – 15 – -14 -2 20
Physician compensation 18 -2 0 0 -2 – 0 14
All other accrued expenses 271 -6 -16 136 8 -66 -25 302
Total 893 -41 -19 557 -8 -288 -58 1,036
The following table shows the development of other accrued expenses in the fiscal year:
Accruals for personnel expenses mainly refer to bonus, severance payments, contribution of partial
retirement as well as holiday entitlements.

Notes96
In 2001, Fresenius Medical Care recorded a US$ 258 million special charge to address legal matters
relating to transactions pursuant to the Agreement and Plan of Reorganization dated as of February 4,
1996 by and between W.R. Grace & Co. and Fresenius AG (Merger), estimated liabilities and legal
expenses arising in connection with the W.R. Grace& Co. Chapter 11 proceedings (Grace Chapter 11
Proceedings) and the cost of resolving pending litigation and other disputes with certain commercial
insurers. During the second quarter of 2003, the court supervising the Grace Chapter 11 Proceedings
approved a definitive settlement agreement entered into among Fresenius Medical Care, the committee
representing the asbestos creditors and W.R. Grace& Co. Under the settlement agreement, Fresenius
Medical Care will pay US$ 115 million (€ 87 million) upon plan confirmation (see Note 25, Commit-
ments and contingent liabilities). With the exception of the proposed US$ 115 million settlement pay-
ment, all other matters included in the special charge have been resolved.
18. OTHER LIABILITIES
As of December 31, other liabilities consist of the following:
The liabilities resulting from the German “Krankenhausfinanzierungsgesetz” primarily contain
earmarked subsidies received but not yet spent by Fresenius ProServe´s hospital operations. This
unspent amount is classified as liability.
Of the total amount of other non-current liabilities amounting to € 188 million at December 31, 2006,
€ 143 million are due in between one and five years and € 45 million are due later than five years. The
balance sheet line item “long-term accrued expenses and other long-term liabilities” of € 283 million
also includes long-term accrued expenses of € 95 million as of December 31, 2006.
in million €2006
thereof short-term2005
thereof short-term
Accounts payable resulting from German
“Krankenhausfinanzierungsgesetz” 194 168 174 129
Personnel liabilities 94 91 114 111
Tax liabilities 89 86 80 77
Interest liabilities 64 64 27 27
Advance payments from customers 63 58 87 82
Derivative financial instruments 25 13 39 15
Accounts receivable credit balance 18 13 11 7
All other liabilities 521 387 393 267
Other liabilities 1,068 880 925 715

97Consolidated Statement of Income Consolidated Balance Sheet Consolidated Cash Flow Statement Consolidated Statement of Equity Segment Reporting Notes
19. DEBT AND LIABILITIES FROM CAPITAL LEASE OBLIGATIONS
SHORT-TERM BORROWINGS
Lines of credit and short-term borrowings
Short-term borrowings of € 330 million and € 824 million at December 31, 2006, and 2005, respec-
tively, consisted of the accounts receivable facility described below and € 128 million borrowed by
certain subsidiaries of the Fresenius Group under lines of credit with commercial banks. The average
interest rates on these borrowings (excluding the accounts receivable facility) at December 31, 2006
and 2005 were 4.45% and 4.66%, respectively.
Excluding amounts available under the Fresenius Medical Care 2006 Senior Credit Agreement (as
described below), the Fresenius Group had additional approximately € 1 billion available under such
commercial bank agreements, which were unused at December 31, 2006. This includes a syndicated
credit facility in an amount of € 350 million with a tenor of five years which Fresenius AG concluded
with a group of banks on October 13, 2006. In some instances, lines of credit are secured by assets of
the Fresenius Group’s subsidiary that is party to the agreement or may require the guarantee of the
holding company of the respective business segment. In exceptional circumstances, the subsidiary may
be required to meet certain covenants. In addition, Fresenius AG has a commercial paper program
under which up to € 250 million in short-term notes can be issued. No commercial papers were out-
standing as of December 31, 2006.
Accounts receivable facility
Fresenius Medical Care has an asset securitization facility (accounts receivable facility), which is typi-
cally renewed in October of each year and was most recently renewed and increased in October 2006.
The accounts receivable facility currently provides borrowings up to a maximum of US$ 650 million
(€ 494 million) (US$ 460 million (€ 349 million) through October 18, 2006). Under the accounts recei-
vable facility, certain receivables are sold to NMC Funding Corp. (NMC Funding), a wholly-owned sub-
sidiary of Fresenius Medical Care. NMC Funding then assigns undivided ownership interests in the
accounts receivable to certain bank investors. Under the terms of the accounts receivable facility, NMC
Funding retains the right to recall all transferred interests in the accounts receivable assigned to the
banks under the facility. As Fresenius Medical Care has the right at any time to recall the then out-
standing interests, the receivables remain on the consolidated balance sheet and the proceeds from
the transfer of undivided interests are recorded as short-term borrowings.
At December 31, 2006, there are outstanding short-term borrowings under the accounts receivable
facility of US$ 266 million (€ 202 million). NMC Funding pays interest to the bank investors, calculated
based on the commercial paper rates for the particular tranches selected. The average interest rate
at December 31, 2006 was 5.31%. Annual refinancing fees, which include legal costs and bank fees
(if any), are amortized over the term of the facility.

Notes98
Bridge loan facility
In October 2005, Fresenius AG entered into an agreement pursuant to which two banks agreed to
provide a loan facility in the amount of € 700 million with a term of 364 days to bridge the issuance
of a bond. The loan facility was guaranteed by Fresenius Kabi AG and Fresenius ProServe GmbH
and was used in addition to the proceeds from the capital increase placed at the end of 2005 to fund
the acquisition of HELIOS Kliniken GmbH and the business of Clinico GmbH. From December 1, 2005,
the bridge loan facility was reduced by € 100 million to € 600 million because the proceeds from
the capital increase exceeded the amount according to the original finance concept. At the end of
December 2005, the loan facility was fully used for the payment of the purchase prices of the acqui-
sitions, and was repaid at the end of January 2006 using the proceeds of the bond issuance.
LONG-TERM DEBT AND LIABILITIES FROM CAPITAL LEASE OBLIGATIONS
As of December 31, long-term debt and liabilities from capital lease obligations consist of the following:
Aggregate annual repayments applicable to the above listed long-term debt and liabilities from capi-
tal lease obligations for the five years subsequent to December 31, 2006 are:
in million € 2006 2005
Fresenius Medical Care 2006 Senior Credit Agreement 2,707 0
Euro Bonds 1,100 400
Euro Notes 366 460
European Investment Bank Agreements 169 41
Capital lease obligations 39 40
Fresenius Medical Care 2003 Senior Credit Agreement 0 399
Other 221 337
Subtotal 4,602 1,677
less current portion 272 222
Long-term debt and liabilities from capital lease obligations,
less current portion 4,330 1,455
for the fiscal years in million €
2007 272
2008 175
2009 451
2010 143
2011 1,054
Subsequent years 2,507
Total 4,602

99Consolidated Statement of Income Consolidated Balance Sheet Consolidated Cash Flow Statement Consolidated Statement of Equity Segment Reporting Notes
in % 2006 2005
Liabilities to banks 6.1 6.8
Capital lease obligations 5.9 5.7
in million US$
Maximum Amount Available Balance Outstanding
2006 2005 2006 2005
Revolving Credit 1,000 750 68 46
Term Loan A/A-1 1,760 425 1,760 425
Term Loan B 1,737 0 1,737 0
Total 4,497 1,175 3,565 471
Interest rate risks in connection with liabilities mentioned above are generally hedged with interest
rate swaps (for details on interest rate hedges see Note 26, Financial instruments).
Fresenius Medical Care 2006 Senior Credit Agreement
Fresenius Medical Care entered into a new US$ 4.6 billion syndicated credit agreement (Fresenius
Medical Care 2006 Senior Credit Agreement) with Bank of America, N.A. (BofA); Deutsche Bank AG
New York Branch; The Bank of Nova Scotia; Credit Suisse, Cayman Islands Branch; JP Morgan Chase
Bank, National Association; and certain other lenders (collectively the Lenders) on March 31, 2006
which replaced the existing credit agreement (Fresenius Medical Care 2003 Senior Credit Agreement).
The following table shows the available and outstanding amounts under the Fresenius Medical Care
2006 Senior Credit Agreement at December 31, 2006 and under the Fresenius Medical Care 2003
Senior Credit Agreement at December 31, 2005:
In addition, at December 31, 2006, US$ 85 million and at December 31, 2005, US$ 80 million were
utilized as letters of credit which are not included as part of the balances outstanding at those dates.
The Fresenius Medical Care 2006 Senior Credit Agreement consists of:
b A 5-year US$ 1 billion revolving credit facility (of which up to US$ 250 million is available for letters
of credit, up to US$ 300 million is available for borrowings in certain non-US currencies, up to
US$ 150 million is available as swing line loans in US dollars, up to US$ 250 million is available as
a competitive loan facility and up to US$ 50 million is available as swing line loans in certain non-
US currencies, the total of which cannot exceed US$ 1 billion) which will be due and payable on
March 31, 2011.
The weighted-average interest rates at the balance sheet date for long-term liabilities are shown in
the following table:

Notes100
b A 5-year term loan facility (Loan A) of US$ 1,850 million, also scheduled to mature on March 31,
2011. The Fresenius Medical Care 2006 Senior Credit Agreement requires 19 quarterly payments
on Loan A of US$ 30 million each that permanently reduce the term loan facility which began
June 30, 2006 and continue through December 31, 2010. The remaining amount outstanding is
due on March 31, 2011.
b A 7-year term loan facility (Loan B) of US$ 1,750 million scheduled to mature on March 31, 2013.
The terms of the Fresenius Medical Care 2006 Senior Credit Agreement require 28 quarterly pay-
ments on Loan B that permanently reduce the term loan facility. The repayment began June 30,
2006. The first 24 quarterly payments will be equal to one quarter of one percent (0.25%) of the
original principal balance outstanding, payments 25 through 28 will be equal to twenty-three and
one half percent (23.5%) of the original principal balance outstanding with the final payment due
on March 31, 2013, subject to an early repayment requirement on March 1, 2011 if the Trust Pre-
ferred Securities due June 15, 2011 are not repaid or refinanced or their maturity is not extended
prior to that date.
Interest on these facilities will be, at Fresenius Medical Care’s option, depending on the interest periods
chosen, at a rate equal to either LIBOR plus an applicable margin or the higher of (a) BofA’s prime
rate or (b) the Federal Funds rate plus 0.5%, plus an applicable margin.
The applicable margin is variable and depends on Fresenius Medical Care’s consolidated leverage
ratio which is a ratio of its consolidated funded debt less up to US$ 30 million cash and cash equiva-
lents to consolidated EBITDA (as these terms are defined in the Fresenius Medical Care 2006 Senior
Credit Agreement).
In addition to scheduled principal payments, indebtedness outstanding under the Fresenius Medical
Care 2006 Senior Credit Agreement will be reduced by mandatory prepayments utilizing portions of
the net cash proceeds from certain sales of assets, securitization transactions other than Fresenius
Medical Care’s existing accounts receivable facility, the issuance of subordinated debt other than
certain intercompany transactions, certain issuances of equity and excess cash flow.
The obligations under the Fresenius Medical Care 2006 Senior Credit Agreement are secured by
pledges of capital stock of certain material subsidiaries in favor of the lenders.

101Consolidated Statement of Income Consolidated Balance Sheet Consolidated Cash Flow Statement Consolidated Statement of Equity Segment Reporting Notes
The Fresenius Medical Care 2006 Senior Credit Agreement contains affirmative and negative cove-
nants with respect to Fresenius Medical Care and its subsidiaries and other payment restrictions.
Certain of the covenants limit indebtedness of Fresenius Medical Care and investments by Fresenius
Medical Care, and require Fresenius Medical Care to maintain certain financial ratios defined in the
agreement. Additionally, the Fresenius Medical Care 2006 Senior Credit Agreement provides for a
limitation on dividends and other restricted payments which is US$ 240 million for dividends paid in
2007, and increases in subsequent years. Fresenius Medical Care paid dividends of US$ 154 million
(€ 120 million) in May of 2006 which was in compliance with the restrictions set forth in the Fresenius
Medical Care 2006 Senior Credit Agreement. In default, the outstanding balance under the Fresenius
Medical Care 2006 Senior Credit Agreement becomes immediately due and payable at the option of
the Lenders. As of December 31, 2006, Fresenius Medical Care is in compliance with all financial
covenants under the Fresenius Medical Care 2006 Senior Credit Agreement.
Fresenius Medical Care incurred fees of approximately US$ 86 million in conjunction with the Fresenius
Medical Care 2006 Senior Credit Agreement which will be amortized over the life of this agreement
and wrote off approximately US$ 15 million in unamortized fees related to its prior Fresenius Medical
Care 2003 Senior Credit Agreement in the year 2006.
Euro Bonds
In April 2003, Fresenius Finance B.V. issued Euro Bonds for a total amount of € 400 million in two
tranches in order to repay short-term bank loans. Both tranches have a tenor of six years. The first
tranche of € 300 million bore interest at 7.75% p. a. and was callable by the issuer for the first time
on April 30, 2006. The redemption prices were fixed at the date of issue. The Fresenius Group issued
a tender offer to repurchase the bonds in January 2006 and 71% of the volume of the first tranche
were actually repurchased. At the end of March, Fresenius Finance B.V. has exercised its option to
redeem the remaining outstanding amount. The redemption price was 103.875% or € 1,038.75 per
€ 1,000 nominal value of the Notes, plus accrued interest. The redemption was effective on April 30,
2006 and payment was made on May 2, 2006. The second tranche of € 100 million bears interest at
7.5% p. a. and is not callable before maturity.
In January 2006, Fresenius issued a bond with a total value of € 1 billion through its wholly-owned
subsidiary Fresenius Finance B.V. The new bond comprises one tranche with a nominal value of
€ 500 million, a tenor of seven years and an annual coupon of 5.0% and a second tranche with a
nominal value of € 500 million, a tenor of ten years and an annual coupon of 5.5% as well as a call
option for the issuer after five years. The above mentioned bridge loan facility was repaid by the
proceeds of this bond issuance.

Notes102
The Euro Bonds of Fresenius Finance B.V. are guaranteed by Fresenius AG, Fresenius Kabi AG and
Fresenius ProServe GmbH. Fresenius AG has agreed to a number of covenants to provide protection to
the bondholders, which, under certain circumstances, partly restrict the scope of action of Fresenius AG
and its subsidiaries (excluding FMC-AG & Co. KGaA and its subsidiaries). These covenants include,
amongst other things, restrictions in the amount of further debt that can be raised, the payment of
dividends, the volume of capital expenditure, the redemption of subordinated liabilities and the mort-
gaging or sale of assets. Some of these restrictions are lifted automatically when the rating of the
company reaches investment grade. In the event of non-compliance with the terms of the Euro Bonds,
the bondholders (owning in aggregate more than 25% of the outstanding Euro Bonds) are entitled
to call the Euro Bonds and demand immediate repayments plus interest. As of December 31, 2006,
the Fresenius Group is in compliance with all of its covenants.
Euro Notes
The Euro Notes (Schuldscheindarlehen) issued by Fresenius Finance B.V. amounting to € 166 million
will mature in 2007 and 2008. The Euro Notes bear variable interest rates and are fully hedged by
means of interest rate swaps (for further information on interest rate swaps see Note 26, Financial
instruments).
On July 27, 2005, Fresenius Medical Care issued new Euro Notes (Schuldscheindarlehen) totaling
€ 200 million with a € 126 million tranche at a fixed interest rate of 4.57% and a € 74 million tranche
with a floating rate at EURIBOR plus applicable margin resulting in an interest rate of 5.49% at
December 31, 2006. The Euro Notes mature on July 27, 2009. The proceeds were used to liquidate
€ 129 million of Euro Notes issued in 2001 that were due in July 2005 and for working capital.
European Investment Bank Agreements
Fresenius Medical Care entered into various credit agreements with the European Investment Bank
(EIB) in July 2005 and December 2006 amounting to € 131 million and € 90 million. The July 2005
agreements consist of a term loan of € 41 million (US$ 49 million) and a revolving facility of € 90 million
(US$ 116 million). Both agreements have a maturity of 8 years. The December 2006 term loan allows
distribution of proceeds for up to 6 separate tranches until June 2008. Each tranche will mature 6 years
after the disbursement of proceeds for the respective tranche. Fresenius Medical Care had borrow-
ings under the July 2005 agreements of € 41 million (US$ 49 million) and € 28 million (US$ 36 mil-
lion) under the term loan and the revolving facility, respectively at December 31, 2006. All advances
under these agreements can be denominated in certain foreign currencies including US dollars.

103Consolidated Statement of Income Consolidated Balance Sheet Consolidated Cash Flow Statement Consolidated Statement of Equity Segment Reporting Notes
As of December 31, 2006, a subsidiary of Fresenius ProServe had borrowings of € 60 million under a
term loan agreement with the EIB. The total amount of this term loan agreement is € 100 million which
can be drawn down in several tranches. The term loan will mature in December 2019 and will be
permanently reduced with constant half-yearly payments starting in December 2007. In addition,
Fresenius AG has a revolving credit line of € 96 million provided by the EIB which had been utilized
as of December 31, 2006 with € 40 million. This revolving credit facility is available until June 2013.
The above mentioned loans bear variable interest rates that change quarterly. The US dollar borrow-
ings of Fresenius Medical Care had an interest rate of 5.29% as of December 31, 2006, the euro
borrowings of Fresenius AG and of the subsidiary of Fresenius ProServe bore an interest rate of 3.65%
as of December 31, 2006. The borrowers have options to convert those interest rates into fixed rates.
The loans under these EIB Agreements are secured by bank guarantees and have customary covenants.
The EIB is a not-for-profit long-term lending institution of the European Union and loans funds at
favorable rates for the purpose of capital investment and R & D projects, normally for up to half of the
funds required for such projects. The facilities were granted to refinance certain R & D projects, to
make investments in expansion and optimization of existing production facilities in Germany and for
the construction of a hospital.
Capital lease obligations
Details of capital lease obligations are given below:
in million € 2006
Capital lease obligations (minimum lease payments) 47
due within one year 7
due between one and five years 22
due later than five years 18
Interest component included in future minimum lease payments 8
due within one year 1
due between one and five years 4
due later than five years 3
Present value of capital lease obligations (minimum lease payments) 39
due within one year 6
due between one and five years 18
due later than five years 15

Notes104
20. PENSIONS AND SIMILAR OBLIGATIONS
GENERAL
The Fresenius Group recognizes pension costs and related pension liabilities for current and future
benefits to current and former employees of the Fresenius Group. Fresenius Group’s pension plans
are structured differently according to the legal, economic and financial circumstances in each country.
The Fresenius Group currently has two types of plans, defined benefit and defined contribution plans.
In general, plan benefits in defined benefit plans are based on all or a portion of the employees’ years
of services and final salary. Plan benefits in defined contribution plans are usually determined by the
employer but may be limited by legislation.
Upon retirement under defined benefit plans, the Fresenius Group is required to pay defined benefits
to former employees when the defined benefits become due. Defined benefit plans may be funded or
unfunded. The Fresenius Group has funded defined benefit plans in particular in the United States,
Norway, the United Kingdom, the Netherlands and Austria.
Actuarial assumptions generally determine benefit obligations under defined benefit plans. The
actuarial calculations require the use of estimates. The main factors used in the actuarial calculations
affecting the level of the benefit obligations are: assumptions on life expectancy, the discount rate,
salary and pension level trends. Under Fresenius Group’s funded plans, assets are set aside to meet
future payment obligations. An estimated return on the plan assets is recognized as income in the
respective period. Actuarial gains and losses are generated when there are variations in the actuarial
assumptions and differences between the actual and the estimated return on plan assets for that year.
A company’s pension liability is impacted by these actuarial gains or losses.
In the case of Fresenius Group’s funded plans, the defined benefit obligation is offset against plan
assets. A pension liability is recognized in the balance sheet if the defined benefit obligation exceeds
the fair value of plan assets. A pension asset is recognized (and reported under other assets in the
balance sheet) if the fair value of plan assets exceeds the defined benefit obligation and if the Fresenius
Group has a right of reimbursement against the fund or a right to reduce future payments to the fund.

105Consolidated Statement of Income Consolidated Balance Sheet Consolidated Cash Flow Statement Consolidated Statement of Equity Segment Reporting Notes
Under defined contribution plans, the Fresenius Group pays defined contributions during the
employee’s service life which satisfies all obligations of the Fresenius Group to the employee. The
Fresenius Group has a defined contribution plan in North America.
DEFINED BENEFIT PENSION PLANS
One half of the pension obligations totaling € 268 million relates to the “Versorgungsordnung der
Fresenius-Unternehmen“ established in 1988, which applies for most of the German entities of the
Fresenius Group. The other half of the benefit obligations relates to individual plans from mostly non-
German Group entities.
As of December 31, 2006, the current portion of the pension liability in an amount of € 8 million is
recognized as a current liability in the line item “short-term accrued expenses and other short-term
liabilities” in the balance sheet. The non-current portion of € 260 million is recorded as non-current
pension liability in the balance sheet.
Plan benefits are generally based on an employee’s years of service and final salary. Consistent with
predominant practice in Germany, the pension obligations of the German entities of the Fresenius
Group are unfunded. The German pension plan does not have a separate pension fund.
Fresenius Medical Care currently has two principal pension plans, one for German employees, and
the other covering employees in the United States. During the first quarter of 2002, Fresenius Medical
Care’s North America subsidiary, Fresenius Medical Care Holdings, Inc. (FMCH), curtailed its defined
benefit and supplemental executive retirement plans. Under the curtailment amendment for substan-
tially all employees eligible to participate in the plan, benefits have been frozen as of the curtailment
date and no additional defined benefits for future services will be earned. FMCH has retained all
employee benefit obligations as of the curtailment date. Each year FMCH contributes at least the
minimum amount required by the Employee Retirement Income Security Act of 1974, as amended.
There was no minimum funding requirement for FMCH for the defined benefit plan in the year 2006.
FMCH voluntarily contributed US$ 11 million (€ 9 million) during the year 2006.
The benefit obligation (DBO) of the Fresenius Group amounting to € 553 million (2005: € 571 million)
includes € 235 million (2005: € 232 million) which is funded by plan assets and € 318 million (2005:
€ 339 million) which is covered by pension provisions.

Notes106
in million € 2006 2005
Benefit obligations at the beginning of the year 571 434
Changes in entities consolidated 2 40
Foreign currency translation -20 26
Service cost 18 14
Interest cost 26 24
Other changes in plans 1 1
Transfer of plan participants – –
Change in amendments -6 -6
Actuarial losses -19 49
Benefits paid -13 -11
Divestitures -7 0
Benefit obligations at the end of the year 553 571
thereof vested 481 478
Fair value of plan assets at the beginning of the year 232 178
Changes in entities consolidated 0 -1
Foreign currency translation -18 21
Actual return on plan assets 19 14
Employer contribution 12 24
Employee contribution 1 1
Transfers -6 0
Benefits paid -5 -5
Fair value of plan assets at the end of the year 235 232
Funded status as of December 31 318 339
thereof used by the employees of the companies
(real estate and other assets) 0 0
thereof invested in companies of the Fresenius Group 0 0
The following table shows the changes in benefit obligations, the changes in plan assets and the funded
status of the pension plans. Benefits paid as shown in the changes in benefit obligations represent
payments made from both the funded and unfunded plans while the benefits paid as shown in the
changes in plan assets include only benefit payments from Fresenius Group’s funded benefit plans.
The funded status has developed as follows:
The discount rates for all plans are derived from an analysis and comparison of yields of portfolios
of highly rated equity and debt instruments with maturities that mirror the plan’s benefit obligation.
Fresenius Group’s discount rate is the weighted-average of these plans based upon their benefit
obligation at December 31, 2006.

107Consolidated Statement of Income Consolidated Balance Sheet Consolidated Cash Flow Statement Consolidated Statement of Equity Segment Reporting Notes
in million € 2006 2005
Funded status 318 339
Unrecognized actuarial loss -53 -85
Unrecognized prior service cost 3 2
Net amount recognized 268 256
As of 31 December 2006 and 2005, respectively, the pension liability is calculated as follows:
The following weighted-average assumptions were utilized in determining benefit obligations as of
December 31:
As of December 31, the three-years-analysis is as follows:
Defined benefit pension plans gave rise to a net periodic benefit cost of € 30 million (2005: € 24 million)
for the Fresenius Group, comprising the following components:
2006 2005 2004
Pension obligation 553 571 434
Plan assets 235 232 178
Funded status 318 339 256
Actuarial gains/losses -53 -85 -35
in % 2006 2005
Discount rate 5.0 4.7
Rate of compensation increase 3.8 3.5
Rate of pension increase 1.6 1.4
in million € 2006 2005
Components of net periodic benefit cost
Service cost 18 14
Interest cost 26 24
Expected return on plan assets -16 -14
Amortization of unrealized actuarial losses, net 4 1
Settlement loss -2 –
Amortization of prior service costs – -1
Net periodic benefit cost 30 24
Net periodic benefit cost is allocated as personnel expense to each of the income statement function
lines.

Notes108
Changes in the discount factor, inflation and mortality assumptions used for the actuarial computation
resulted in actuarial losses in the year 2006 which increased the fair value of the defined benefit
obligation. Unrecognized actuarial losses outside the 10% corridor for each defined benefit plan
amounted to € 53 million (2005: € 85 million).
The following table shows the expected future benefit payments:
in % 2006 2005
Discount rate 4.7 5.3
Expected return of plan assets 7.1 7.1
Rate of compensation increase 3.5 3.7
The Fresenius Group uses December 31 as the measurement date in determining the funded status
of all plans.
Pension liabilities at December 31, 2006 and 2005 relate to the following geographical regions:
The following weighted-average assumptions were used in determining net periodic benefit cost for
the year ended December 31:
for the fiscal years in million €
2007 14
2008 15
2009 16
2010 18
2011 19
2012 to 2016 124
Total expected benefit payments for the next 10 years 206
in million € 2006 2005
Germany 214 199
Europe (excluding Germany) 54 55
North America 0 2
Asia-Pacific 0 0
Latin America 0 0
Africa 0 0
Total pension liabilities 268 256
Approximately two thirds of beneficiaries are located in North America, approximately one quarter
in Germany and the remainder throughout the rest of Europe and other continents.

109Consolidated Statement of Income Consolidated Balance Sheet Consolidated Cash Flow Statement Consolidated Statement of Equity Segment Reporting Notes
Plan investment policy and strategy
For the North America funded plan, Fresenius Group periodically reviews the assumptions for long-
term expected return on pension plan assets. As part of the assumptions review, independent consult-
ing actuaries determine a range of reasonable expected investment returns for the pension plan as a
whole based on their analysis of expected future returns for each asset class weighted by the allocation
of the assets. The range of returns developed relies both on forecasts, which include the actuarial
firm’s expected long-term rates of return for each significant asset class or economic indicator, and
on broad-market historical benchmarks for expected return, correlation, and volatility for each asset
class. As a result, the expected rate of return on pension plan assets was 7.5% for the year 2006.
The investment policy, utilizing a target investment allocation of 36% equity and 64% long-term
US bonds, considers that there will be a time horizon for invested funds of more than five years.
The total portfolio will be measured against a policy index that reflects the asset class bench-
marks and the target asset allocation. The Plan policy does not allow investments in securities of
FMC-AG & Co. KGaA or other related party securities. The performance benchmarks for the separate
asset classes include: S & P 500 Index, Russell 2000 Growth Index, MSCI EAFE Index, Lehman U.S.
Long Government/Credit bond Index and the HFRI Fund of Funds Index. The Fresenius Group
expects to contribute US$ 1 million (€ 0.8 million) to plan assets during 2007.
The following schedule describes Fresenius Group´s allocation of its funded plans.
in % Allocation 2006 Allocation 2005 Target allocation
Categories of plan assets
Equity securities 40 43 39
Debt securities 57 55 59
Real estate 1 1 1
Other 2 1 1
Total 100 100 100
The overall expected long-term rate of return on assets of the Fresenius Group amounts to 7.0%
compounded annually. Contributions to plan assets for the fiscal year 2007 are expected to amount
to € 6 million.
DEFINED CONTRIBUTION PLANS
Fresenius Group’s total expense under defined contribution plans for the years 2006 was € 18 million
(2005: € 14 million). The main part relates to the 401(k) savings plan, which most employees of FMCH
are eligible to join. Employees can deposit up to 75% of their pay up to a maximum of US$ 15,500
if under 50 years old (US$ 20,500 if 50 or over) under this savings plan. Fresenius Medical Care will
match 50% of the employee deposit up to a maximum Company contribution of 3% of the employee’s
pay. Fresenius Medical Care’s total expense under this defined contribution plan for the years ended
December 31, 2006 and 2005 was € 16 million and € 12 million, respectively.

Notes110
21. TRUST PREFERRED SECURITIES
Fresenius Medical Care issued trust preferred securities through Fresenius Medical Care Capital
Trusts, statutory trusts organized under the laws of the State of Delaware/USA. FMC-AG & Co. KGaA
owns all of the common securities of these trusts. The sole asset of each trust is a senior subordinated
note of FMC-AG & Co. KGaA or a wholly-owned subsidiary of FMC-AG & Co. KGaA. FMC-AG & Co. KGaA,
Fresenius Medical Care Deutschland GmbH and Fresenius Medical Care Holdings, Inc. have guaran-
teed payment and performance of the senior subordinated notes to the respective Fresenius Medical
Care Capital Trusts. The trust preferred securities are guaranteed by FMC-AG & Co. KGaA through
a series of undertakings by Fresenius Medical Care and Fresenius Medical Care Holdings, Inc. and
Fresenius Medical Care Deutschland GmbH.
The trust preferred securities entitle the holders to distributions at a fixed annual rate of the stated
amount and are mandatorily redeemable after ten years. Earlier redemption at the option of the
holders may also occur upon a change of control followed by a rating decline or defined events of
default including a failure to pay interest. Upon liquidation of the trusts, the holders of trust preferred
securities are entitled to a distribution equal to the stated amount. The trust preferred securities do
not hold voting rights in the trust except under limited circumstances.
The indentures governing the notes held by the Fresenius Medical Care Capital Trusts contain affirm-
ative and negative covenants with respect to Fresenius Medical Care and its subsidiaries and other
payment restrictions. Some of the covenants limit Fresenius Medical Care’s indebtedness and its
investments, and require Fresenius Medical Care to maintain certain ratios defined in the agreement.
As of December 31, 2006, Fresenius Medical Care is in compliance with all financial covenants under
all trust preferred securities agreements.
The trust preferred securities outstanding as of December 31, 2006 and 2005 are as follows:
Yearissued
Statedamount Interest rate
Mandatoryredemption
date2006
in million €2005
in million €
Fresenius Medical Care Capital Trust II 1998 US$ 450 million 77/8% Feb 1, 2008 330 366
Fresenius Medical Care Capital Trust III 1998 DM 300 million 73/8% Feb 1, 2008 154 154
Fresenius Medical Care Capital Trust IV 2001 US$ 225 million 77/8% Jun 15, 2011 165 183
Fresenius Medical Care Capital Trust V 2001 € 300 million 73/8% Jun 15, 2011 297 297
Trust preferred securities 946 1,000

111Consolidated Statement of Income Consolidated Balance Sheet Consolidated Cash Flow Statement Consolidated Statement of Equity Segment Reporting Notes
Minority interest increased in the year 2006 by € 272 million to € 2,595 million. The change resulted
from the minorities’ share of profit of € 305 million, dividend payments of € 95 million and from
negative currency effects, capital measures as well as first-time consolidations in a total amount of
€ 62 million.
23. SHAREHOLDERS’ EQUITY
SUBSCRIBED CAPITAL
Development of subscribed capital
The Management Board resolved on October 25, 2005, and on November 15, 2005, with the approval
of the Supervisory Board on the same dates, to increase the issued share capital for cash consideration
by € 24,064,000 from € 105,785,036.80 to € 129,849,036.80 by issuing 4,700,000 new bearer ordinary
shares (new ordinary shares) and 4,700,000 new bearer preference shares (new preference shares).
The new ordinary shares and the new preference shares were offered to the shareholders at a ratio of
9:2 in each case. The subscription price per new ordinary share and per new preference share was
€ 93 and € 102, respectively. The capital increase generated gross proceeds of € 919 million. The
registration of the capital increase with the commercial register in Bad Homburg v.d.H. took place
on November 29, 2005.
In the course of the acquisition of HUMAINE Kliniken GmbH in the third quarter of 2006, the sub-
scribed capital was increased against contribution in kind in an amount of € 903,884.80 by issuing
176,540 bearer ordinary shares and 176,540 bearer preference shares in the fourth quarter of 2006.
The registration of the capital increase with the commercial register took place on November 17, 2006.
During the fiscal year 2006, 375,932 stock options were exercised.
Accordingly, at December 31, 2006, the subscribed capital of Fresenius AG is divided into 25,725,646
bearer ordinary shares and 25,725,646 non-voting bearer preference shares. The shares are issued as
non-par value shares with a proportionate amount of the subscribed capital of € 2.56.
22. MINORITY INTEREST
As of December 31, minority interest in the Group is as follows:
in million € 2006 2005
Minority interest in FMC-AG & Co. KGaA 2,398 2,182
Minority interest in the business segments
Fresenius Medical Care 57 12
Fresenius Kabi 24 25
Fresenius ProServe 118 104
Corporate/Other -2 –
Total minority interest 2,595 2,323

Notes112
Notification in accordance with § 25 of the German Securities Trading Act (WpHG)
In a letter dated May 19, 2005, Vermögensverwaltungsgesellschaft Nachlass Else Kröner mbH notified
Fresenius AG that, effective May 12, 2005, the voting rights held by it in Fresenius AG, fell below the
50% threshold and that it no longer holds any of the company‘s voting rights. Also in a letter dated
May 19, 2005, Else Kröner-Fresenius-Stiftung, Bad Homburg v.d.H., which owns 100% of Vermögens-
verwaltungsgesellschaft Nachlass Else Kröner mbH, notified the company that, effective May 12, 2005,
the voting rights held by it in Fresenius AG continued to exceed the 50% threshold and that it still
owns 74.241% of the voting rights. However since May 12, 2005, 67.286% of the voting rights are no
longer attributable according to § 22 (1) No. 1 of the German Trade Securities Act (WpHG) but are led
directly – just as 2.226% of the voting rights have been. 4.729% of the shares continue to be attribu-
table to the Foundation in accordance with § 22 (2) sentence 1, 1st half-sentence of the German Securi-
ties Trading Act (WpHG).
In a letter dated November 21, 2005, Allianz AG, Munich, notified Fresenius AG in accordance with
§ 21 (1) and § 24 of the WpHG that the number of Fresenius AG voting rights held by AZ-Argos 19 AG
– that in future will operate under the name Allianz Deutschland AG, Königinstraße 28, 80802 Munich
– exceeds the 5% threshold on November 17, 2005 due to an internal reorganization of the group
and that it now owns 9.73% of the voting stock. These voting rights are allocated to AZ-Argos 19 AG
in accordance with § 22 (1) sentence 1 No. 1 of the WpHG. The number of the voting rights of Fresenius
AG, Bad Homburg v.d.H. held by Allianz Aktiengesellschaft, Königinstraße 28, 80802 Munich, has
changed in a manner that does not require notification.
Dipl.-Kfm. Winfried Baranowski, Germany, has assumed the office as co-executor of the will of Else
Kröner and, performing that office, has, on January 4, 2007, exceeded the 5%, 10%, 25% and 50%
thresholds of the voting rights of Fresenius AG. Acting as co-executor, 60.359% of the voting
rights are allocated to Mr. Baranowski in accordance with § 22 (1) No. 6 of the German Securities
Trading Act and 3.769% are allocated to him in accordance with § 22 (2) of the German Securities
Trading Act – in total 64.128% of the voting rights of Fresenius AG.
APPROVED CAPITAL
By resolution of the Annual General Meeting on May 10, 2006, the previous Approved Capital II was
revoked. The Management Board of Fresenius AG was authorized, with the approval of the Super-
visory Board, until May 9, 2011,
b to increase Fresenius AG’s subscribed capital by a nominal total amount of up to
€ 12,800,000.00 through a single or multiple issue of new bearer ordinary shares and/or non-
voting bearer preference shares against cash contributions (Approved Capital I). A subscription
right must be granted to shareholders.
b to increase Fresenius AG’s subscribed capital by a nominal total amount of up to
€ 6,400,000.00 through a single or multiple issue of new bearer ordinary shares and/or non-
voting bearer preference shares against cash contributions and/or contributions in kind (Approved
Capital II). The Management Board is authorized, with the consent of the Supervisory Board, to
decide on the exclusion of the shareholders’ subscription right (§§ 203 (2), 186 (3) sentence 4
German Stock Corporation Act (AktG)).

113Consolidated Statement of Income Consolidated Balance Sheet Consolidated Cash Flow Statement Consolidated Statement of Equity Segment Reporting Notes
As of December 31, 2006, the Approved Capital II decreased by € 903,884.80 to € 5,496,115.20 due
to the payment in shares in connection with the aquisition of HUMAINE.
CONDITIONAL CAPITAL
By resolution of the Annual General Meeting on May 28, 2003, the previous conditional capital
(Conditional Capital I) of € 4,448,010.24 was reduced to € 3,296,010.24, divided into 643,752 bearer
ordinary shares and 643,752 bearer preference shares. This amount is required to secure the sub-
scription rights in connection with the stock options on bearer ordinary shares and bearer preference
shares authorized by the Annual General Meeting on June 18, 1998.
In order to enable the Fresenius AG 2003 Stock Option Plan to be executed, the subscribed capital
was increased conditionally (Conditional Capital II) by up to € 4,608,000.00 through the issue of up
to 900,000 bearer ordinary shares and 900,000 non-voting bearer preference shares. The issue of
bearer ordinary shares and non-voting bearer preference shares is made at the specified conversion
price. The conditional capital increase can only be carried out to the extent that the convertible bonds
are issued and the owners of the convertible bonds exercise their conversion rights.
The following table shows the development of the conditional capital:
in € Ordinary shares Preference shares Total
Conditional Capital I Fresenius AG Stock Option Plan 1998 1,246,248.96 1,246,248.96 2,492,497.92
Conditional Capital II Fresenius AG Stock Option Plan 2003 2,254,433.28 2,254,433.28 4,508,866.56
Total conditional capital as of January 1, 2006 3,500,682.24 3,500,682.24 7,001,364.48
Fresenius AG Stock Option Plan 1998 – options exercised -404,876.80 -404,876.80 -809,753.60
Fresenius AG Stock Option Plan 2003 – options exercised -76,316.16 -76,316.16 -152,632.32
Total conditional capital as of December 31, 2006 3,019,489.28 3,019,489.28 6,038,978.56
CAPITAL RESERVES
Capital reserves comprise the premium paid on the issue of shares and stock options (additional
paid-in capital).
In the year 2006, the capital reserve increased by € 41 million in connection with the aquisition of
HUMAINE. The costs of the share capital increase of € 23 million in 2005 have been set off against
the capital reserves directly without any impact on the consolidated statement of income.
OTHER RESERVES
Other reserves comprise earnings generated by group entities in prior years to the extent that they
have not been distributed.

Notes114
CHANGE IN SHAREHOLDERS’ EQUITY AFTER THE BALANCE SHEET DATE
On December 4, 2006, at the Extraordinary General Meeting, Fresenius AG’s shareholders approved
a new division of the subscribed capital in connection with a capital increase from the company’s
funds. The registration in the commercial register took place on January 24, 2007. Through a
conversion of capital reserves, the subscribed capital was first increased by € 22,638,568.48 to
€ 154,353,876.00 and then divided into 77,176,938 ordinary shares and 77,176,938 preference shares.
The new proportionate amount of the subscribed capital is € 1.00 per share. The conditional capital
increased in the same proportion as the subscribed capital by operation of law (cf. § 218 sentence 1
of German Stock Corporation Act (AktG)) and is divided into Conditional Capital I in an amount
of € 1,971,966.00 and Conditional Capital II in an amount of € 5,104,962.00 after the share split
(see Note 1.II, Conversion of Fresenius AG into a European Company (SE) and new division of the sub-
scribed capital).
DIVIDENDS
Under the German Stock Corporation Act, the amount of dividends available for distribution to share-
holders is based upon the unconsolidated retained earnings of Fresenius AG as reported in its balance
sheet determined in accordance with the German Commercial Code (HGB).
At the Annual General Meeting on May 10, 2006, a resolution was passed to pay a dividend of € 1.48
per bearer ordinary share and € 1.51 per bearer preference share, i. e. a total dividend of € 76 million
was resolved.
24. OTHER COMPREHENSIVE INCOME (LOSS)
Other comprehensive income (loss) comprises all amounts recognized directly in equity resulting
from the currency translation of foreign subsidiaries’ financial statements and the effects (net of tax)
of measuring financial instruments at their fair value.
Changes in the components of other comprehensive income (loss) in the years 2006 and 2005 were
as follows:
in million €Amount
before taxes Tax effect
2006 Amount
after taxesAmount
before taxes Tax effect
2005 Amount
after taxes
Unrealized gains/losses on securities – – – – – –
Change in unrealized gains/losses – – – – – –
Realized gains/losses due
to reclassifications – – – – – –
Changes in unrealized gains/losses on
derivative financial instruments 24 -8 16 55 -23 32
Change in unrealized gains/losses 21 -7 14 56 -23 33
Realized gains/losses due
to reclassifications 3 -1 2 -1 – -1
Foreign currency translation adjustment -117 0 -117 134 0 134
Other comprehensive income (loss) -93 -8 -101 189 -23 166

115Consolidated Statement of Income Consolidated Balance Sheet Consolidated Cash Flow Statement Consolidated Statement of Equity Segment Reporting Notes
As of December 31, 2006, reconstruction obligations exist up to the year 2010 from the acquisition
contracts for hospitals at projected costs of up to € 99 million. Thereof € 79 million relate to the year
2007.
Besides the above mentioned contingent liabilities, the amount of other commitments is immaterial.
OTHER NOTES
25. COMMITMENTS AND CONTINGENT LIABILITIES
CONTINGENT ASSETS AND LIABILITIES
As of December 31, 2006, the Fresenius Group does not have any contingent assets. Contingent liabi-
lities are not material.
OPERATING LEASES AND RENTAL PAYMENTS
The companies of the Fresenius Group lease office and manufacturing buildings as well as machinery
and equipment under various lease agreements expiring on dates through 2026. Rental expense
recorded for operating leases for the years ended December 31, 2006 and 2005 was € 369 million
and € 297 million, respectively.
Future minimum rental payments under non-cancellable operating leases for the five years succeeding
December 31, 2006 and thereafter are:
for the fiscal years in million €
2007 267
2008 232
2009 202
2010 167
2011 140
Subsequent years 496
Total 1,504

Notes116
LEGAL PROCEEDINGS
Commercial litigation
Fresenius Medical Care was originally formed as a result of a series of transactions it completed
pursuant to the Merger. At the time of the Merger, a W.R. Grace & Co. subsidiary known as
W.R. Grace & Co.-Conn. had, and continues to have, significant liabilities arising out of product-
liability related litigation (including asbestos-related actions), pre-Merger tax claims and other claims
unrelated to National Medical Care, Inc. (NMC), which was W.R. Grace&Co.’s dialysis business prior
to the Merger. In connection with the Merger, W.R. Grace&Co.-Conn. agreed to indemnify Fresenius
Medical Care, Fresenius Medical Care Holdings, Inc. (FMCH) and NMC against all liabilities of
W.R. Grace&Co., whether relating to events occurring before or after the Merger, other than liabilities
arising from or relating to NMC’s operations. W.R. Grace&Co. and certain of its subsidiaries filed for
reorganization under Chapter 11 of the U.S. Bankruptcy Code (the Grace Chapter 11 Proceedings)
on April 2, 2001.
Prior to and after the commencement of the Grace Chapter 11 Proceedings, class action complaints
were filed against W.R. Grace&Co. and FMCH by plaintiffs claiming to be creditors of W.R. Grace&Co.-
Conn., and by the asbestos creditors’ committees on behalf of the W.R. Grace&Co. bankruptcy estate
in the Grace Chapter 11 Proceedings, alleging among other things that the Merger was a fraudulent
conveyance, violated the uniform fraudulent transfer act and constituted a conspiracy. All such cases
have been stayed and transferred to or are pending before the U.S. District Court as part of the Grace
Chapter 11 Proceedings.
In 2003, Fresenius Medical Care reached agreement with the asbestos creditors’ committees on behalf
of the W.R. Grace&Co. bankruptcy estate and W.R. Grace&Co. in the matters pending in the Grace
Chapter 11 Proceedings for the settlement of all fraudulent conveyance and tax claims against it and
other claims related to Fresenius Medical Care that arise out of the bankruptcy of W.R. Grace&Co.
Under the terms of the settlement agreement as amended (Settlement Agreement), fraudulent
conveyance and other claims raised on behalf of asbestos claimants will be dismissed with prejudice
and Fresenius Medical Care will receive protection against existing and potential future W.R. Grace&Co.
related claims, including fraudulent conveyance and asbestos claims, and indemnification against
income tax claims related to the non-NMC members of the W.R. Grace&Co. consolidated tax group
upon confirmation of a W.R. Grace& Co. final bankruptcy reorganization plan that contains such pro-
visions. Under the Settlement Agreement, Fresenius Medical Care will pay a total of US$ 115 million
to the W.R. Grace & Co. bankruptcy estate, or as otherwise directed by the Court, upon plan confir-
mation. No admission of liability has been or will be made. The Settlement Agreement has been

117Consolidated Statement of Income Consolidated Balance Sheet Consolidated Cash Flow Statement Consolidated Statement of Equity Segment Reporting Notes
approved by the U.S. District Court. Subsequent to the Merger, W.R. Grace&Co. was involved in a
multi-step transaction involving Sealed Air Corporation (Sealed Air, formerly known as Grace Holding,
Inc.). Fresenius Medical Care is engaged in litigation with Sealed Air to confirm its entitlement to
indemnification from Sealed Air for all losses and expenses incurred by Fresenius Medical Care relating
to pre-Merger tax liabilities and Merger-related claims. Under the Settlement Agreement, upon con-
firmation of a plan that satisfies the conditions of Fresenius Medical Care’s payment obligation,
this litigation will be dismissed with prejudice.
On April 4, 2003, FMCH filed a suit in the U.S. District Court for the Northern District of California,
(Fresenius USA, Inc., et al., v. Baxter International, Inc., et al.), Case No. C 03-1431, seeking a declar-
atory judgment that FMCH does not infringe on patents held by Baxter International, Inc. and its
subsidiaries and affiliates (Baxter), that the patents are invalid, and that Baxter is without right or
authority to threaten or maintain suit against FMCH for alleged infringement of Baxter’s patents. In
general, the alleged patents concern touch screens, conductivity alarms, power failure data storage,
and balance chambers for hemodialysis machines. Baxter filed counterclaims against FMCH seeking
monetary damages and injunctive relief, and alleging that FMCH willfully infringed on Baxter’s patents.
On July 17, 2006, the court entered judgement in favor of FMCH finding that all the asserted claims of
the Baxter patents are invalid as obvious and/or anticipated in light of prior art. On February 13, 2007,
the court granted Baxter’s motion to set aside the jury’s verdict in favor of FMCH and retry certain
aspects of the case. Fresenius Medical Care will appeal the court’s rulings. An adverse judgment in
any new trial could have a material adverse impact on the business, financial condition and results of
operations of Fresenius Medical Care.
Fresenius Medical Care AG & Co. KGaA’s Australian subsidiary, Fresenius Medical Care Australia Pty
Limited (hereinafter referred to as Fresenius Medical Care Australia) and Gambro Pty Limited and
Gambro AB (hereinafter referred to as the Gambro Group) are in litigation regarding infringement
and damages with respect to the Gambro AB patent protecting intellectual property in relation to a
system for preparation of dialysis or replacement fluid, the Gambro bicart device in Australia (Gambro
Patent). As a result of the commercialisation of a system for the preparation of dialysis fluid based on
the Fresenius Medical Care Bibag device in Australia, the Australian courts concluded that Fresenius
Medical Care Australia infringed the Gambro Patent. The parties are still in legal dispute with respect
to the issue of potential damages related to the patent infringement. As the infringement proceedings
have solely been brought in the Australian jurisdiction any potential damages to be paid by Fresenius
Medical Care Australia will be limited to the potential losses of the Gambro Group caused by the patent
infringement in Australia.

Notes118
Other litigation and potential exposures
RCG has been named as a nominal defendant in a second amended complaint filed September 13,
2006, in the Chancery Court for the State of Tennessee Twentieth Judicial District at Nashville
against former officers and directors of RCG which purports to constitute a class action and derivative
action relating to alleged unlawful actions and breaches of fiduciary duty in connection with the RCG
Acquisition and in connection with alleged improper backdating and/or timing of stock option grants.
The amended complaint is styled Indiana State District Council of Laborers and Hod Carriers Pension
Fund, on behalf of itself and all others similarly situated and derivatively on behalf of RCG, Plaintiff,
vs. RCG, Gary Brukardt, William P. Johnston, Harry R. Jacobson, Joseph C. Hutts, William V. Lapham,
Thomas A. Lowery, Stephen D. McMurray, Peter J. Grua, C. Thomas Smith, Ronald Hinds, Raymond
Hakim, and R. Dirk Allison, Defendants. The complaint seeks damages against former officers and
directors and does not state a claim for money damages directly against RCG. Fresenius Medical Care
anticipates that the individual defendants may seek to claim indemnification from RCG. Fresenius
Medical Care is unable at this time to assess the merits of any such claim for indemnification.
FMCH and its subsidiaries, including RCG (prior to the RCG acquisition), received subpoenas from
the U.S. Department of Justice, Eastern District of Missouri, in connection with a joint civil and criminal
investigation. FMCH received its subpoena in April 2005. RCG received its subpoena in August 2005.
The subpoenas require production of a broad range of documents relating to FMCH’s and RCG’s oper-
ations, with specific attention to documents related to clinical quality programs, business development
activities, medical director compensation and physician relationships, joint ventures, anemia man-
agement programs, RCG’s supply company, pharmaceutical and other services that RCG provides to
patients, RCG’s relationships to pharmaceutical companies, and RCG’s purchase of dialysis equipment
from FMCH. Fresenius Medical Care is cooperating with the government’s requests for information.
An adverse determination in this investigation could have a material adverse effect on Fresenius
Medical Care’s business, financial condition and results of operations.
In October 2004, FMCH and its subsidiaries, including RCG (prior to the RCG acquisition), received
subpoenas from the U.S. Department of Justice, Eastern District of New York, in connection with a
civil and criminal investigation, which requires production of a broad range of documents relating to
FMCH’s and RCG’s operations, with specific attention to documents relating to laboratory testing for
parathyroid hormone (PTH) levels and vitamin D therapies. Fresenius Medical Care is cooperating
with the government’s requests for information. While Fresenius Medical Care believes that it has
complied with applicable laws relating to PTH testing and use of vitamin D therapies, an adverse
determination in this investigation could have a material adverse effect on Fresenius Medical Care’s
business, financial condition, and results of operations.

119Consolidated Statement of Income Consolidated Balance Sheet Consolidated Cash Flow Statement Consolidated Statement of Equity Segment Reporting Notes
In May 2006, RCG received a subpoena from the U.S. Department of Justice, Southern District of
New York, in connection with an investigation into RCG’s administration of its stock option programs
and practices, including the procedure under which the exercise price was established for certain of
the option grants. The subpoena requires production of a broad range of documents relating to the
RCG stock option program prior to the RCG acquisition. Fresenius Medical Care is cooperating with
the government’s requests for information. The outcome and impact of this investigation cannot be
predicted at this time.
Accrued special charge of Fresenius Medical Care for legal matters
At December 31, 2001, Fresenius Medical Care recorded a pre-tax special charge of US$ 258 million
to reflect anticipated expenses associated with the defense and resolution of pre-Merger tax claims,
Merger-related claims, and commercial insurer claims. The costs associated with the Settlement
Agreement and settlements with insurers have been charged against this accrual. With the exception
of the proposed US$ 115 million (€ 87 million) payment under the Settlement Agreement, all other
matters included in the special charge have been resolved. While Fresenius Medical Care believes
that its remaining accrual reasonably estimates its currently anticipated costs related to the continued
defense and resolution of this matter, no assurances can be given that its actual costs incurred will
not exceed the amount of this accrual (see Note 17, Other accrued expenses).
Furthermore, the Fresenius Group is involved in various legal disputes arising from the ordinary
course of its business. Although the ultimate outcome of these legal disputes cannot be predicted,
the Fresenius Group does not expect any material adverse effects on the business, financial condition
and results of operations of the Group.

Notes120
26. FINANCIAL INSTRUMENTS
MARKET RISK
I.) General
The Fresenius Group is inevitably exposed to effects related to foreign exchange fluctuations in con-
nection with its international business activities that are denominated in various currencies. In order
to finance its business operations, the Fresenius Group issues bonds, trust preferred securities and
commercial papers and concludes mainly long-term credit agreements and mid-term Euro Notes
(Schuldscheindarlehen) with banks. Due to these financing activities, the Fresenius Group is exposed
to interest risk caused by changes in variable interest rates and the risk of changes in the fair value of
balance sheet items bearing fixed interest rates.
In order to manage the risks of interest rate and foreign exchange rate fluctuations, the Fresenius
Group enters into appropriate hedging transactions with highly rated financial institutions as author-
ized by the Management Board. Derivative financial instruments are not used for trading purposes.
In general, the Fresenius Group conducts its derivative financial instrument activities under the con-
trol of a single centralized department. The Fresenius Group has established guidelines derived from
best practice standards in the banking industry for risk assessment procedures and supervision con-
cerning the use of financial derivatives. These guidelines require amongst other things a clear segre-
gation of duties in the areas of execution, administration, accounting and controlling.
The Fresenius Group calculates benchmarks for individual exposures in order to quantify interest and
foreign exchange risks. The benchmarks are derived from achievable and reasonable market rates.
Depending on the individual benchmarks, appropriate hedging strategies are determined and imple-
mented as scheduled.
As of December 31, 2006, the notional amounts of Fresenius Group’s foreign exchange derivatives
amounted to € 1,186 million and the notional amounts of interest rate derivatives amounted to
€ 2,911 million. In the case of interest rate derivatives, it should be noted that the notional amounts
generally only represent the base for contract specific computations and not necessarily the exchange
of those amounts by the parties. Therefore, a potential risk resulting from the use of interest rate
derivatives cannot be measured solely on the bases of the notional amounts of the contracts.
The after tax losses of € 14 million deferred in accumulated other comprehensive income (loss) at
December 31, 2005 had a low negative currency impact.
Earnings of the Fresenius Group were not materially affected by hedge ineffectiveness in the reporting
period since the critical terms of the interest and foreign exchange derivatives matched the critical
terms of the underlying exposures.

121Consolidated Statement of Income Consolidated Balance Sheet Consolidated Cash Flow Statement Consolidated Statement of Equity Segment Reporting Notes
II.) Fair value of financial instruments
The following table presents the carrying amounts and fair values of the Group’s financial
instruments as of December 31.
The carrying amounts in the table (except derivatives), are included in the consolidated balance
sheet under their corresponding line item. Derivatives were recognized at gross values as other
current assets in an amount of € 64 million and other liabilities in an amount of € 25 million.
in million € Carrying amount2006
Fair value Carrying amount2005
fair value
Non-derivatives
Assets
Cash and cash equivalents 261 261 252 252
Accounts receivable 2,088 2,088 1,871 1,871
Liabilities
Trade accounts payable (including related parties) 466 466 355 355
Income taxes payable 159 159 146 146
Long-term loans (excluding trust preferred securities,
notes and bonds) 3,136 3,136 817 817
Short-term loans (including related parties) 331 331 825 825
Trust preferred securities 946 1,005 1,000 1,082
Euro Notes 366 368 460 460
Bonds 1,100 1,124 400 427
Derivatives
Foreign exchange contracts 4 4 -3 -3
thereof short-term 4 4 -2 -2
Dollar interest rate hedges 34 34 19 19
thereof short-term – – – –
Euro interest rate hedges 1 1 -1 -1
thereof short-term – – – –
Other interest rate hedges – – – –
thereof short-term – – – –

Notes122
Estimation of fair values
The significant methods and assumptions used to estimate the fair values of financial instruments are
as follows:
Short-term financial instruments are valued at their carrying amounts, which are reasonable estimates
of the fair value due to the relatively short period to maturity of the instruments. This approach applies
to cash and cash equivalents, receivables and accounts payables, including income tax payables.
Long-term bank debt of Fresenius Medical Care is valued at its carrying amount because the actual
drawings under the Fresenius Medical Care 2006 Senior Credit Agreement carry interest on a variable
basis, mainly with an interest rate fixed for three months. The interest rates reflect actual money
market conditions, plus specific margins which represent company-related financial ratios as well as
the entire set of terms and conditions including covenants as determined in the Fresenius Medical
Care 2006 Senior Credit Agreement.
The fair value of the bonds and trust preferred securities is calculated based on market prices on the
balance sheet date. The fair value of the Euro Notes (Schuldscheindarlehen) is calculated as the differ-
ential between the coupon and the market quotation at the reporting date including a company specific
margin. Due to the relatively short period between reporting date and the issuance of the notes, the
specific margin changes since inception are deemed to be immaterial.
The fair value of financial instruments is defined as the amount at which the instrument could be
exchanged between willing parties. Market quotes are available for all material financial instruments
of the Fresenius Group.
III.) Accounting for and reporting of non-derivative financial instruments
The carrying amounts of the non-derivative financial instruments are included in the consolidated
balance sheet under their related item.
IV.) Accounting for and reporting of derivative financial instruments (and hedge accounting)
Foreign exchange risk management
The Fresenius Group has determined the euro as its financial reporting currency. Therefore, foreign
exchange translation risks resulting from the fluctuation of exchange rates between the euro and the
local currencies in which the financial statements of the foreign subsidiaries are maintained, have
an impact on results of operations and financial positions reported in the consolidated financial state-
ments.
Fresenius Group’s foreign exchange transaction risks mainly relate to transactions such as sales
and purchases as well as project business denominated in foreign currency. Particularly products
manufactured in Fresenius Group’s worldwide production sites are mainly denominated in the local
currency of the respective manufacturer and are delivered worldwide to various Fresenius Group

123Consolidated Statement of Income Consolidated Balance Sheet Consolidated Cash Flow Statement Consolidated Statement of Equity Segment Reporting Notes
entities. These intragroup sales are mainly denominated in euro, US dollar and yen. Group companies
are therefore exposed to changes of the foreign exchange rates between the invoicing currencies and
the local currencies in which they conduct their businesses. For the purpose of hedging existing and
foreseeable foreign exchange transaction exposures, the Fresenius Group enters into foreign exchange
forward contracts and, on a small scale, foreign exchange options. Foreign exchange forward con-
tracts and options are not used for purposes other than hedging foreign exchange exposures. As at
December 31, 2006, the Fresenius Group had no foreign exchange options.
In connection with intercompany loans in foreign currency, the Fresenius Group normally uses foreign
exchange swaps thus assuring that no foreign exchange risks arise from those loans.
The hedge-effective portion of changes in the fair value of foreign exchange forward contracts that
are designated and qualified as cash flow hedges is reported in accumulated other comprehensive
income (loss). These amounts are subsequently reclassified into earnings as a component of cost of
sales, of selling, general and administrative expenses or as interest income or expenses in the same
period in which the hedged transaction affects earnings.
Recognition in equity
Cash flow hedgesof forecasted
product purchases
Cash flow hedges associated with foreign
currency denominated inter-company financing transaction
Balance sheet date in million €
affectingnet incomeprobably in in million €
affectingnet incomeprobably in
Income/loss before tax December 31, 2006
December 31, 2005
2.9
-6.7
2007
2006-2009
–
–
–
–
Income/loss after tax December 31, 2006
December 31, 2005
1.7
-5.0
2007
2006-2009
–
–
–
–
Recognition in the consolidated statement of income
Cash flow hedges of forecasted
product purchases
Cash flow hedges associated with foreign
currency denominated inter-company financing transaction
Fiscal year in million € in million €
Income/loss before tax 2006
2005
1.0
0.7
–
–
Income/loss after tax 2006
2005
0.7
0.6
–
–

Notes124
As of December 31, 2006, the notional volume and fair value of foreign exchange contracts relating
to foreign currency intercompany loans amounted to € 654 million and € 0 million, respectively. Hedge
accounting is not applied to these foreign exchange contracts. Accordingly, the respective foreign
exchange contracts are recognized as assets or liabilities and changes in fair values are recognized
against earnings, thus offsetting with changes in fair values of the underlying foreign currency
denominated intercompany loans.
As of December 31, 2006, the notional amounts of foreign exchange forward contracts in place to
hedge risks from operational business totalled € 532 million with a fair value of € 4 million.
As of December 31, 2006, the Fresenius Group was party to foreign exchange contracts with a
maximum maturity of 36 months.
Interest rate risk management
Fresenius Group’s interest rate risks mainly arise from money market and capital market transactions
of Fresenius Group for financing its business activities. Interest rate hedging transactions are primarily
concluded by Fresenius AG and FMC-AG & Co. KGaA.
The Fresenius Group enters into interest rate swaps and, on a small scale, into interest rate options
in order to hedge against interest rate exposures arising from short-term and long-term borrowings
and accounts receivable securitization programs at variable rates by swapping them into fixed rates
or to hedge against changes of the fair value of the underlying fixed rate financial liabilities.
Cash Flow Hedge
The Fresenius Group enters into interest rate swaps that are designated as cash flow hedges effectively
converting certain variable interest rate payments, resulting from existing revolving loans, Euro Notes
(Schuldscheindarlehen) and an accounts receivable facility mainly denominated in US dollar or euro,
into fixed interest rate payments. The US dollar interest rate swaps with a notional volume of US$ 3,165
million expire at various dates between 2007 and 2012. The Euro interest rate swaps with a notional
volume of € 166 million expire in 2007 and 2008. The US dollar interest rate swaps bear an average
interest rate of 4.50% and the Euro interest rate swaps bear an average interest rate of 3.06%, plus
an applicable margin each.
At December 31, 2006, after-tax gains of € 28.0 million (pre-tax € 44.7 million) were recognized in
accumulated other comprehensive income (loss). At December 31, 2005, the equivalent amounts
were € 18.8 million and € 30.6 million. Interest payables and interest receivables under the swap
agreements are accrued or deferred as appropriate and recorded as an adjustment to the interest
expense at each reporting date.

125Consolidated Statement of Income Consolidated Balance Sheet Consolidated Cash Flow Statement Consolidated Statement of Equity Segment Reporting Notes
Fair Value Hedge
Fresenius Medical Care entered into US dollar interest rate swaps designated as fair value hedges to
hedge the risk of changes in the fair value of parts of its fixed rate borrowings. These interest rate
swaps effectively convert the fixed interest payments on Fresenius Medical Care Capital Trust II trust
preferred securities denominated in US dollars into variable interest rate payments. Since the critical
terms of the interest rate swap agreements are identical to the terms of Fresenius Medical Care Capital
Trust II trust preferred securities, the hedging relationship is expected to be highly effective and no
ineffectiveness affects earnings. The interest rate swaps are reported at fair value in the balance sheet.
The reported amount of the hedged portion of fixed rate trust preferred securities includes an adjust-
ment representing the change in fair value attributable to the interest rate risk being hedged. Changes
in the fair value of interest rate swap contracts and trust preferred securities offset each other in the
income statement. At December 31, 2006, the notional volume of these swaps at Fresenius Medical
Care was US$ 450 million (€ 342 million).
CREDIT RISK
The Fresenius Group is exposed to potential losses in the event of non-performance by counterparties
to financial instruments but does not expect any counterparty to fail to meet its obligations as the
counterparties are highly rated financial institutions. In the opinion of Fresenius Group’s Management,
all other credit risks are covered by the allowance for doubtful accounts in an amount of € 218 million
(see Note 12, Trade accounts receivable).

Notes126
27. SUPPLEMENTARY INFORMATION ON CASH FLOW STATEMENT
The cash flow statements of the Fresenius Group for the fiscal years 2006 and 2005 are shown on
pages 48 to 49.
Cash funds reported in the cash flow statement comprise all cash and cash equivalent items reported
in the balance sheet (i. e. cash in hand, cheques, central bank balances, securities and cash at bank)
which are readily convertible within three months and are subject to insignificant risk of changes in
value.
The following summaries provide additional information with regard to the consolidated cash flow
statement:
The increase in interest paid related mainly to higher interest payments in connection with the acqui-
sition of RCG, payments in connection with the issuance of the Eurobond 2006, the repurchase of the
Eurobond 2003 as well as interest payments for the financing of the acquisition of HELIOS Kliniken.
The increase in income taxes paid mainly referred to one-time effects. In 2006, Fresenius Medical
Care made a single tax payment of € 52 million (US$ 64 million) related to the acquisition of RCG as
well as tax payments of € 79 million (US$ 99 million) for tax audit adjustments related to Fresenius
Medical Care’s 2000 and 2001 US tax filings. In the previous year, Fresenius Medical Care made a
single tax payment of € 96 million (US$ 119 million). Without these one-time effects, the income taxes
paid were nearly unchanged.
Cash paid for acquisitions consists of the following:
in million € 2006 2005
Interest paid 393 208
Income taxes paid 401 360
in million € 2006 2005
Assets acquired 4,196 2,697
Liabilities assumed -402 -605
Minority interest -45 -60
Notes assumed in connection with acquisitions -24 -193
Cash paid 3,725 1,839
Cash acquired -68 -231
Cash paid for acquisitions, net 3,657 1,608

127Consolidated Statement of Income Consolidated Balance Sheet Consolidated Cash Flow Statement Consolidated Statement of Equity Segment Reporting Notes
28. NOTES ON SEGMENT REPORTING
GENERAL
The segment reporting tables shown on pages 52 to 55 of this annual report are an integral part
of the Notes.
The Fresenius Group has identified the business segments Fresenius Medical Care, Fresenius Kabi
and Fresenius ProServe which corresponds to the internal organizational and reporting structures
(Management Approach) at December 31, 2006.
The key data disclosed in conjunction with segment reporting correspond to the key data of the internal
reporting system in place across the Fresenius Group. Internal and external reporting and accounting
correspond to each other; the same key data and definitions are used.
Sales and proceeds between the segments are indicative of the actual sales and proceeds agreed
with third parties. Administrative services are billed in accordance with service level agreements.
The business segments were identified in accordance with IAS 14 (Segment Reporting), which defines
the segment reporting requirements in annual financial statements and interim reports with regard
to the operating business, product and service businesses and regions. The business segments of the
Fresenius Group are as follows:
Fresenius Medical Care is the world’s leading provider of dialysis products and dialysis care for the
life-saving treatment of patients with chronic kidney failure. Fresenius Medical Care treats 163,517
patients in its 2,108 own dialysis clinics.
Fresenius Kabi is Europe’s leading company in the field of infusion therapy and clinical nutrition with
subsidiaries and distributors worldwide. Fresenius Kabi’s products are used in hospitals as well as in
out-patient medical care. Fresenius Kabi is also a leading provider of transfusion technology products
in Europe.
Fresenius ProServe is a leading German hospital operator. Moreover, the company offers engineering
and services for hospitals and other health care facilities.

Notes128
The segment Corporate/Other mainly comprises the holding functions of Fresenius AG as well as
Fresenius Netcare GmbH, which provides services in the field of information technology as well as
Fresenius Biotech, which does not fulfill the characteristics of a reportable segment. In addition, the
segment Corporate/Other includes intersegment consolidation adjustments.
Segment reporting by region takes account of geographical factors and the similarity of markets in
terms of opportunities and risks. The allocation to a particular region is based on the domicile of the
customers.
NOTES ON THE BUSINESS SEGMENTS
The key figures used by the Management Board to assess segment performance, have been selected
in such a way that they include all items of income and expenses which fall under the area of respon-
sibility of the business segments. The Management Board is convinced that the most suitable perform-
ance indicator is the operating income (EBIT). The Management Board believes that, in addition to
the operating income, the figure for earnings before interest, taxes and depreciation/amortization
(EBITDA) can also help investors to assess the ability of the Fresenius Group to generate cash flows
and to meet its financial obligations. The EBITDA figure is also the basis for assessing Fresenius
Medical Care’s compliance with the terms of the 2006 Senior Credit Agreement and other obligations
concerning trust preferred securities, the credit agreement with the European Investment Bank and
that of Fresenius AG in conjunction with the Eurobonds.
Depreciation and amortization is presented for the intangible assets with definite useful lives and
property, plant and equipment of the respective business segment as well as impairment losses on
goodwill.
Net interest comprises interest and other similar expenses and income.
Net income is defined as earnings after income taxes and minority interest.
The operating cash flow comprises net income, minority interest, depreciation and amortization and
the change in working capital.
The cash flow before acquisitions and dividends is the operating cash flow less net capital expenditure.
Debt comprises bank loans, bonds, trust preferred securities, liabilities from capital lease obligations,
liabilities relating to outstanding acquisitions as well as intercompany liabilities.

129Consolidated Statement of Income Consolidated Balance Sheet Consolidated Cash Flow Statement Consolidated Statement of Equity Segment Reporting Notes
Capital expenditure includes additions to intangible assets and property, plant and equipment.
Acquisitions refer to both the purchase of shares in legally-independent companies and the acquisition
of business divisions. The key figures shown with regard to acquisitions present the contractual
purchase prices comprising amounts paid in cash, debts assumed and the issuance of shares, whereas
for the purposes of the cash flow statement, only cash purchase price components less acquired cash
and cash equivalents are reported.
The EBITDA margin is calculated as a ratio of EBITDA to sales.
The EBIT margin is calculated as a ratio of EBIT to sales.
The return on operating assets (ROOA) is defined as the ratio of EBIT to average operating assets.
Operating assets are defined as total assets less deferred tax assets, trade accounts payable and
advance payments from customers.
In addition, the key indicator “Depreciation and amortization as a percentage of sales” is also disclosed.
Reconciliation of key figures to consolidated earnings
in million € 2006 2005
Total EBITDA of reporting segments 1,889 1,319
Depreciation and amortization -406 -325
General corporate expenses Corporate/Other -40 -27
Interest expenses -418 -223
Interest income 23 20
Total earnings before income taxes and minority interest 1,048 764
Total EBIT of reporting segments 1,494 1,004
General corporate expenses Corporate/Other -51 -37
Interest expenses -418 -223
Interest income 23 20
Total earnings before income taxes and minority interest 1,048 764
Depreciation and amortization of reporting segments 395 315
Depreciation and amortization Corporate/Other 11 10
Total depreciation and amortization 406 325

Notes130
Non-current assets by geographical region
in million € December 31, 2006 December 31, 2005
Germany 2,317 2,175
Europe (excluding Germany) 1,659 1,600
North America 6,302 3,692
Asia-Pacific 266 166
Latin America 162 265
Africa 32 33
Total non-current assets* 10,738 7,931
* The aggregate amount of net non-current assets is the sum of non-current assets less deferred tax assets and derivative financial instruments.
Reconciliation of net debt
in million € December 31, 2006 December 31, 2005
Short-term borrowings 330 824
Short-term liabilities and loans from related parties 1 1
Current portion of long-term debt and liabilities from capital lease obligations 272 222
Long-term debt and liabilities from capital lease obligations,
less current portion 4,330 1,455
Trust preferred securities of Fresenius Medical Care Capital Trusts 946 1,000
Debt 5,879 3,502
less cash and cash equivalents 261 252
Net debt 5,618 3,250

131Consolidated Statement of Income Consolidated Balance Sheet Consolidated Cash Flow Statement Consolidated Statement of Equity Segment Reporting Notes
29. STOCK OPTIONS
COMPENSATION COST IN CONNECTION WITH STOCK OPTION PLANS
OF THE FRESENIUS GROUP
The Fresenius Group accounts for its stock option plans in accordance with IFRS 2 (Share-based
Payment). As such, compensation cost is calculated by multiplying the fair value on the issuing date
with the number of issued options. For stock incentive plans which are performance based, the
Fresenius Group recognizes compensation cost over the vesting periods, based on the then current
market values of the underlying stock.
The Fresenius Group recognized compensation cost of € 20 million in the year 2006 for stock options
granted since 1998.
FAIR VALUE OF STOCK OPTIONS
Fresenius Group’s determination of the fair value of grants is based on the Black-Scholes option pricing
model. The Black-Scholes option pricing model was developed for use in estimating the fair values of
options that have no vesting restrictions. Option valuation models require the input of highly subjective
assumptions including expected stock price volatility. Fresenius Group’s assumptions are based upon
its past experiences, market trends and the experiences of other entities of the same size and in similar
industries. Fresenius Group’s stock options have characteristics that vary significantly from traded
options and changes in subjective assumptions can materially affect the fair value of the option.
The weighted-average assumptions for the calculation of the fair value of grants made during the
year ending December 31, 2006 are as follows:
Weighted-average assumptions of Fresenius Medical Care 2006
Expected dividend yield 1.64%
Risk-free interest rate 3.78%
Expected volatility 30.03%
Expected life of options 7 years
Exercise price per option in € 91.63
Weighted-average assumptions of Fresenius AG 2006
Expected dividend yield 1.50%
Risk-free interest rate 3.80%
Expected volatility 35.50%
Expected life of options 5.3 years
Exercise price per option in € 121.36

Notes132
The weighted-average assumptions for the calculation of the fair value of grants made during the
year ending December 31, 2005 are as follows:
The expected volatility results from the historical volatility calculated over the expected live of options.
The volatility was determined when the fair value of stock options was calculated for the first time
and since then has been controlled every year upon issuance of a new tranche.
FRESENIUS AG STOCK OPTION PLANS
Description of the Fresenius AG stock option plans in place
On December 31, 2006, Fresenius AG has two stock option plans in place; the stock option based
plan of 1998 and the currently active plan from the year 2003 which is based on convertible bonds.
The latter is currently the only plan under which options in the form of convertible bonds are granted.
Under the Fresenius AG Stock Option Plan 2003 (2003 Plan), convertible bonds with a principal of up
to € 4.6 million may be issued to the members of the Management Board, to members of the manage-
ment of affiliated companies, to employees of the company and to employees of its affiliated companies
representing grants for up to 900,000 bearer ordinary shares and up to 900,000 non-voting bearer
preference shares. Members of the Management Board and employees of FMC-AG & Co. KGaA and
its affiliated companies which are only affiliated with the company through FMC-AG & Co. KGaA are
excluded. Members of the Management Board of Fresenius AG are entitled, in total, up to 400,000
convertible bonds given the right to subscribe up to 200,000 bearer ordinary shares and the same
number of non-voting bearer preference shares. Employees are entitled, in total, up to 1,400,000
convertible bonds given the right to subscribe up to 700,000 bearer ordinary shares and the same
number of non-voting bearer preference shares.
Weighted-average assumptions of Fresenius Medical Care 2005
Expected dividend yield 2.88%
Risk-free interest rate 2.76%
Expected volatility 40.00%
Expected life of options 5.3 years
Exercise price per option in € 62.36
Weighted-average assumptions of Fresenius AG 2005
Expected dividend yield 2.10%
Risk-free interest rate 2.50%
Expected volatility 40.00%
Expected life of options 5.3 years
Exercise price per option in € 92.26

133Consolidated Statement of Income Consolidated Balance Sheet Consolidated Cash Flow Statement Consolidated Statement of Equity Segment Reporting Notes
The convertible bonds have a par value of € 2.56 and bear interest at a rate of 5.5%. Except for the
members of the Management Board, eligible employees may purchase the bonds by issuing a non-
recourse note with terms corresponding to the terms of the convertible bond. Fresenius AG has the
right to offset its obligation on a bond against the employee’s obligation on the related note; therefore,
the convertible bond obligations and employee note receivables represent stock options issued by
Fresenius AG and are not reflected in the consolidated financial statements. The options expire in ten
years and one third of them can be exercised beginning after two, three and four years, respectively.
Bonds issued to members of the Management Board, to members of the management of affiliated
companies, to employees of Fresenius AG and to employees of its affiliated companies who did not
issue a note to Fresenius AG are recognized as a liability on Fresenius Group’s consolidated balance
sheet.
Upon issuance of the option, the employees have the right to choose options with or without a stock
price target. The conversion price of options subject to a stock price target corresponds to the stock
exchange quoted price of the ordinary or preference shares upon the first time the stock exchange
quoted price exceeds the initial value by at least 25%. The initial value is the joint average stock
exchange price of bearer ordinary shares and non-voting bearer preference shares during the last 30
trading days prior to the date of grant. The conversion price of options without a stock price target is
the initial value. In the case of options not subject to a stock price target, the number of convertible
bonds awarded to the eligible employee would be 15% less than if the employee elected options
subject to the stock price target. Each option entitles the holder thereof, upon payment of the respective
conversion price, to acquire one ordinary or one preference share. Up to 20% of the total amount
available for the issuance of awards under the 2003 Plan may be issued each year. At December 31,
2006, the number of outstanding stock options issued under the 2003 Plan was 962,850, thereof
139,886 were exercisable.
During 1998, Fresenius AG adopted a stock incentive plan (1998 Plan) for Fresenius AG’s key manage-
ment and executive employees. This stock incentive plan was replaced by the 2003 Plan and no options
have been granted since 2003. Under the 1998 Plan, eligible employees have the right to acquire
ordinary and preference shares of Fresenius AG. Options granted under this plan have a ten-year term,
and one third of them vest on each of the second, third and fourth anniversaries of the award date.
One ordinary or one preference share can be acquired for each option. At December 31, 2006, the
number of outstanding and exercisable stock options issued under the 1998 Plan was 430,754.

Notes134
Changes due to capital measures
Due to the capital increase completed in December 2005 which involved the granting of subscription
rights to stockholders, the exercise prices under the 1998 Plan and, for the past, the conversion prices
of the 2003 Plan were reduced in line with the provisions of both stock option plans. The amount of
reduction corresponded to an amount calculated on the basis of the average price of the stockholders‘
subscription right during their entire trading period on the Frankfurt Stock Exchange – rounded to
the nearest full € 0.05. For ordinary shares, this meant a reduction of the exercise or conversion price
of € 1.90 per share and for preference shares of € 2.05 per share.
At December 4, 2006, the Extraordinary General Meeting of Fresenius AG resolved to newly divide the
subscribed capital of Fresenius AG at a ratio of 1 (previously) : 3 (in the future) (share split). Further-
more, the General Meeting agreed to a capital increase from Fresenius AG’s funds in order to attain,
after the share split, a proportionate nominal value of € 1.00 per ordinary and preference share to
the subscribed capital. The entry of both measures into the commercial register on January 24, 2007
resulted in the following consequences for the two stock option plans:
Under the 1998 Plan, upon exercise, one granted option now entitles to receipt of three instead of
one ordinary or preference share of Fresenius AG, respectively. The maximum number of ordinary
or preference shares to be issued to the members of the Management Board or senior employees of
Fresenius AG is adjusted accordingly. The calculation of the exercise price remains unaffected.
Under the 2003 Plan, a convertible bond granted prior to entry of the share split in the commercial
register but converted after the commercial registration, now entitles to receipt of three instead of
one ordinary or preference share of Fresenius AG, respectively. The calculation of the conversion price
remains unaffected for all convertible bonds without stock price target.
Regarding convertible bonds with stock price target, the stock price target is reached if the applicable
stock price target has been reached prior to the commercial register entry of the share split, or if,
after the commercial registration, the stock exchange quoted average price of the ordinary and
preference shares reaches on one day a 25% increase against one third of the average stock exchange
rate of the ordinary and preference shares on the grant date. The calculation of the conversion price
remains unaffected if the stock price target has been reached prior to the date of entry into the com-
mercial register. If the stock price target is reached for the first time after the commercial registration
the conversion price for receipt of three ordinary shares or preference shares, respectively, per each
convertible bond, shall be the triple of one third of the initial value.
After entry of the share split into the commercial register, each convertible bond granted has a
nominal value of € 1.00, instead of previously € 2.56. The number of convertible bonds with a nominal
value of € 1.00 each, still to be issued under the 2003 Plan, increases to 1,080,000, of which 240,000
are attributable to the members of the Management Board and 840,000 to the senior employees.

135Consolidated Statement of Income Consolidated Balance Sheet Consolidated Cash Flow Statement Consolidated Statement of Equity Segment Reporting Notes
Transactions during the year 2006
In the year 2006, the Fresenius Group awarded 300,920 stock options, including 36,550 to members
of the Management Board of Fresenius AG, at a weighted-average exercise price of € 121.36, a
weighted-average fair value of € 47.99 each and a total fair value of € 14 million, one third of which
will be amortized evenly over two, three and four years, respectively.
At December 31, 2006, of 430,754 outstanding options issued under the 1998 Plan, 17,200 were
held by the members of the Fresenius AG Management Board. The number of outstanding stock
options issued under the 2003 Plan was 962,850, of which 131,580 were held by the members of the
Fresenius AG Management Board.
During the year 2006, Fresenius AG received € 32 million from the exercise of 375,932 stock options.
The intrinsic value of options exercised in the year 2006 was € 19 million.
Stock option transactions are summarized as follows:
Ordinary shares December 31 Number of optionsWeighted-averageexercise price in €
Number of optionsexercisable
Balance 2004 836,265 72.75 433,251
Granted 155,101 90.49
Exercised 175,621 70.71
Forfeited 50,450 74.12
Balance 2005 765,295 73.67 361,980
Granted 150,460 119.93
Exercised 187,966 77.61
Forfeited 30,987 73.25
Balance 2006 696,802 83.90 285,320
Preference shares December 31 Number of optionsWeighted-averageexercise price in €
Number of optionsexercisable
Balance 2004 836,265 79.72 433,251
Granted 155,101 94.03
Exercised 175,621 78.28
Forfeited 50,450 82.13
Balance 2005 765,295 80.91 361,980
Granted 150,460 122.78
Exercised 187,966 90.72
Forfeited 30,987 73.16
Balance 2006 696,802 87.64 285,320

Notes136
At December 31, 2006, there was € 14 million of total unrecognized compensation costs related to
non-vested options granted under the Fresenius AG plans. These costs are expected to be recognized
over a weighted-average period of 2.2 years.
FRESENIUS MEDICAL CARE STOCK OPTION PLANS
Fresenius Medical Care AG & Co. KGaA Stock Option Plan 2006
On May 9, 2006, the Fresenius Medical Care AG & Co. KGaA Stock Option Plan 2006 (2006 Plan) was
established by resolution of FMC-AG & Co. KGaA’s annual general meeting with a conditional capital
increase up to € 13 million subject to the issue of up to five million no par value bearer ordinary shares
with a nominal value of € 2.56 each. Under the 2006 Plan, up to five million options can be issued,
each of which can be exercised to obtain one ordinary share, with up to one million options desig-
nated for members of the Management Board of FMC Management AG, FMC-AG & Co. KGaA’s General
Partner, up to one million options designated for members of management boards of direct or indi-
rect subsidiaries of FMC-AG&Co. KGaA and up to three million options designated for managerial staff
members of FMC-AG & Co. KGaA and such affiliates. With respect to participants who are members
of FMC Management AG’s Management Board, its Supervisory Board has sole authority to grant stock
options and exercise other decision making powers under the 2006 Plan (including decisions regarding
certain adjustments and forfeitures). FMC Management AG has such authority with respect to all other
participants in the 2006 Plan.
Options under the 2006 Plan can be granted the last Monday in July and/or the first Monday in
December. The exercise price of options granted under the 2006 Plan shall be the average closing
price on the Frankfurt Stock Exchange of FMC-AG & Co. KGaA’s ordinary shares during the 30 calendar
days immediately prior to each grant date. Options granted under the 2006 Plan have a seven-year
term but can be exercised only after a three-year vesting period. The vesting of options granted is
subject to satisfaction of success targets measured over a three-year period from the grant date.
The following table provides a summary of fully vested options outstanding and exercisable for both
preference and ordinary shares at December 31, 2006:
Numberof options
in thousand
Weighted-average remaining contractual life
in years
Weighted-averageexercise price
in €
Aggregateintrinsic value
in million €
Options for ordinary shares 285,320 4.73 72.28 23
Options for preference shares 285,320 4.73 81.21 23

137Consolidated Statement of Income Consolidated Balance Sheet Consolidated Cash Flow Statement Consolidated Statement of Equity Segment Reporting Notes
For each such year, the success target is achieved if FMC-AG & Co. KGaA’s adjusted basic income
per ordinary share (EPS), as calculated in accordance with the 2006 Plan, increases by at least 8%
year over year during the vesting period, beginning with EPS for the year of grant as compared to
EPS for the year preceding such grant. Calculation of EPS under the 2006 Plan excludes, among
other items, the costs of the transformation of Fresenius Medical Care’s legal form and the conversion
of preference shares into ordinary shares. For each grant, one-third of the options granted are for-
feited for each year in which EPS does not meet or exceed the 8% target. The success target for the
year 2006 was met. Vesting of the portion or portions of a grant for a year or years in which the
success target is met does not occur until completion of the entire three-year vesting period. Upon
exercise of vested options, FMC-AG & Co. KGaA has the right to issue ordinary shares it owns or
that it purchases in the market in place of increasing capital by the issuance of new shares.
Options granted under the 2006 Plan to US participants are non-qualified stock options under the
United States Internal Revenue Code of 1986, as amended. Options under the 2006 Plan are not
transferable by a participant or a participant’s heirs, and may not be pledged, assigned, or otherwise
disposed of.
Fresenius Medical Care 2001 International Stock Option Plan
Under the Fresenius Medical Care 2001 International Stock Incentive Plan (2001 Plan), options
in the form of convertible bonds with a principal of up to € 10 million were issued to the members
of the Management Board and other employees of FMC-AG & Co. KGaA representing grants for up to
four million non-voting preference shares. The convertible bonds have a par value of € 2.56 and bear
interest at a rate of 5.5%. Except for the members of the Management Board, eligible employees
may purchase the bonds by issuing a non-recourse note with terms corresponding to the terms of
and secured by the bond. FMC-AG & Co. KGaA has the right to offset its obligation on a bond against
the employee’s obligation on the related note; therefore, the convertible bond obligations and employee
note receivables represent stock options issued by FMC-AG & Co. KGaA and are not reflected in the
consolidated financial statements. The options expire ten years from issuance and can be exercised
beginning two, three or four years after issuance. Compensation costs related to awards granted under
this plan are amortized on a straight-line basis over the vesting period for each separately vesting
portion of the awards. Bonds issued to Management Board members who did not issue a note to
FMC-AG & Co. KGaA are recognized as a liability on Fresenius Group’s balance sheet.

Notes138
Upon issuance of the option, the employees had the right to choose options with or without a stock
price target. The conversion price of options subject to a stock price target corresponds to the stock
exchange quoted price of the preference shares upon the first time the stock exchange quoted price
exceeds the initial value by at least 25%. The initial value is the average price of the preference shares
during the last 30 trading days prior to the date of grant. In the case of options not subject to a stock
price target, the number of convertible bonds awarded to the eligible employee would be 15% less
than if the employee elected options subject to the stock price target. The conversion price of the
options without a stock price target is the initial value. Each option entitles the holder thereof, upon
payment of the respective conversion price, to acquire one preference share. Effective May 2006, no
further grants can be issued under the 2001 Plan and no options were granted under the 2001 Plan
during the year 2006.
Transactions during the year 2006
During the year 2006, Fresenius Medical Care awarded 772,280 options, including 132,800 to members
of the Management Board of FMC Management AG, at a weighted-average exercise price of € 91.63,
a weighted-average fair value of € 29.65 each and a total fair value of € 23 million, which will be
amortized on a straight line basis over the three year vesting period.
At December 31, 2006, the Management Board members of FMC Management AG held 548,197 stock
options for ordinary shares and employees of FMC-AG & Co. KGaA held 2,525,659 stock options for
ordinary shares and 122,697 stock options for preference shares.
During the year 2006, FMC-AG & Co. KGaA received € 37 million from the exercise of stock options
and € 6 million from a related tax benefit. The intrinsic value of options exercised in the year 2006
was € 22 million.
In connection with the conversion of FMC-AG & Co. KGaA’s preference shares into ordinary shares,
holders of options to acquire preference shares had the opportunity to convert their options so that
they would be exercisable to acquire ordinary shares. Holders of 3,863,470 options converted result-
ing in 2,849,318 options for ordinary shares (see Note 1.III, Transformation of Fresenius Medical
Care AG’s legal form and conversion of its preference shares). Holders of 234,311 options elected not
to convert.

139Consolidated Statement of Income Consolidated Balance Sheet Consolidated Cash Flow Statement Consolidated Statement of Equity Segment Reporting Notes
The table below provides reconciliations for options outstanding at December 31, 2006, as compared
to December 31, 2005 taking in consideration the conversion, options exercised and forfeited.
Number of optionsin thousand
Weighted-averageexercise price in €
Balance at December 31, 2005 (options for preference shares) 4,103 47.88
Forfeited prior to conversion 5 41.00
Eligible for conversion 4,098 47.94
Options not converted 235 49.18
Options converted 3,863
Reduction due to impact of conversion ratios 1,014
Balance of options outstanding after conversion into options
for ordinary shares as of February 10, 2006 2,849 64.22
Granted 772 91.63
Exercised 520 61.39
Forfeited 27 68.94
Balance at December 31, 2006 (options for ordinary shares) 3,074 61.18
Balance of options not converted as of February 10, 2006 235 49.18
Exercised 104 49.82
Forfeited 8 50.61
Balance at December 31, 2006 (options for preference shares) 123 48.56
The following table provides a summary of fully vested options outstanding and exercisable for both
preference and ordinary shares at December 31, 2006:
Numberof options
in thousand
Weighted-average remaining contractual life
in years
Weighted-averageexercise price
in €
Aggregateintrinsic value
in million €
Options for ordinary shares 959 4.86 59.10 40
Options for preference shares 71 3.63 43.37 4
At December 31, 2006, there was € 29 million of total unrecognized compensation costs related to
non-vested options granted under all plans. These costs are expected to be recognized over a weighted-
average period of 1.7 years.

Notes140
30. RELATED PARTY TRANSACTIONS
Dr. Gerhard Rupprecht, a member of the Supervisory Board of Fresenius AG, is the Chief Executive
Officer of Allianz Deutschland AG. Dr. Gerd Krick, chairman of the Supervisory Board of Fresenius AG,
is a member of the Supervisory Board of Allianz Private Krankenversicherungs-AG. In the year 2006,
the Fresenius Group paid € 2.1 million for insurance premiums to the Allianz Group. Furthermore,
the Allianz Group received € 2.15 million for services mainly in connection with the commitment
relating to the new Fresenius Medical Care 2006 Senior Credit Agreement and the issuance of a
corporate bond.
Dr. Gerd Krick is also a member of the Advisory Board of HDI Haftpflichtverband der deutschen
Industrie V. a. G. In the year 2006, this insurance company received € 6.3 million for insurance pre-
miums.
Dr. Dieter Schenk is a member of the Supervisory Board of Fresenius AG and a partner in the law
firm Nörr Stiefenhofer Lutz that provides legal services to the Fresenius Group. In the year 2006, the
Fresenius Group paid this law firm € 1.9 million.
31. SUBSEQUENT EVENTS
There have been no significant changes in the group position or environment sector since the end of
the year of 2006. At present, the Fresenius Group is not planning to carry out any significant changes
in its structure, administration or legal form or in the area of personnel.

141Consolidated Statement of Income Consolidated Balance Sheet Consolidated Cash Flow Statement Consolidated Statement of Equity Segment Reporting Notes
NOTES IN ACCORDANCE WITH THE GERMAN COMMERCIALCODE (HGB)
32. COMPENSATION REPORT
COMPENSATION OF THE MANAGEMENT BOARD OF FRESENIUS AG
The compensation report of Fresenius AG summarizes the principles applied to the determination of
the compensation of the Management Board members of Fresenius AG and explains the amount and
structure of the Management Board compensation. The compensation report is based mainly on
the recommendations of the German Corporate Governance Code and also provides the information
which is part of the notes (§ 285 German Commercial Code) and the consolidated notes (§ 314 German
Commercial Code) or the management report (§ 289 German Commercial Code) and the consolidated
management report (§ 315 German Commercial Code) according to the German Act on the Disclosure
of Management Board Compensation.
The principles for the compensation of the Management Board were determined by the Supervisory
Board of Fresenius AG, its structure and amount by the personnel committee of the Supervisory
Board of Fresenius AG. The personnel committee is composed of the Supervisory Board members
Dr. Gerd Krick, Dr. Karl Schneider and Volker Weber.
The objective of the compensation system is to enable the members of the Management Board to
participate in the development of the business in accordance with their tasks and performance and
the successes in the structuring of the economic and financial situation of the company taking
account of its comparable environment.
The compensation of the Management Board is, as a whole, performance oriented and consists in
the fiscal year 2006 of three elements:
b non-performance-related compensation (basic salary)
b performance-related compensation (variable bonus)
b long-term incentive elements (stock options, convertible bonds)
Furthermore, in the period under report, there is a valid pension commitment applicable to one
member of the Management Board.
The composition of the individual elements is as follows:
The non-performance-related compensation was paid in fiscal year 2006 in twelve monthly install-
ments as non-performance-related basic salary. In addition, the members of the Management Board
received additional benefits consisting mainly of insurance premiums, the private use of company
cars, special payments such as rent supplements and refunds of charges and contributions to pension
and health insurance.
The performance-related compensation will be granted for the fiscal year 2006 as a variable bonus.
The amount of the bonus in each case depends on the achievement of the individual targets relating
to the net income of the Fresenius Group and its segments. For the total performance-related com-
pensation, the maximum achievable bonus is fixed.

Notes142
For the fiscal year 2006, the amount of cash payment of the Management Board of Fresenius AG
consists of the following:
As elements of long-term incentives in the fiscal year 2006, convertible bonds and stock options on
the basis of the Fresenius AG Stock Option Plan 2003 and the Fresenius Medical Care AG & Co. KGaA
Stock Option Plan 2006 were granted. The principles of both plans are described in Note 29, Stock
options.
For the fiscal year 2006, the number and value of convertible bonds and stock options issued and the
value of the share price-related compensation is shown in the following table:
The values of convertible bonds and stock options granted to members of the Management Board in
the fiscal year 2006 stated above correspond to their fair value at the time of their having been granted,
namely a value of € 47.90 per convertible bond of Fresenius AG and € 29.67 per stock option of
FMC-AG & Co. KGaA. The exercise price for the granted convertible bonds of Fresenius AG is € 120.38
and for the granted stock options of FMC-AG & Co. KGaA is € 91.48.
Non-performance related compensationPerformance related
compensation
Cash compensation(without long-term
incentive components)
Salary€ thousand
Other1)
€ thousandBonus
€ thousand € thousand
Dr. Ulf M. Schneider 600 41 954 1,595
Rainer Baule 425 43 825 1,293
Andreas Gaddum 325 86 498 909
Dr. Ben Lipps 2) 836 150 1,627 2,613
Stephan Sturm 425 87 756 1,268
Total 2,611 407 4,660 7,678
1) Includes insurance premiums, private use of company cars, contributions to pension and health insurance and other benefits.2 Dr. Ben Lipps receives his compensation only by Fresenius Medical Care, of which Fresenius AG held 36.1% of the total subscribed capital. As Dr. Ben Lipps is a member
of the Management Board of Fresenius AG, his compensation has to be included in the compensation report of the Fresenius Group.
Components with long-term incentive effects
Number Value in € thousand
Dr. Ulf M. Schneider 14,620 700
Rainer Baule 7,310 350
Andreas Gaddum 7,310 350
Dr. Ben Lipps1) 33,200 985
Stephan Sturm 7,310 350
Total 69,750 2,735
1) Dr. Ben Lipps received stock options under the Fresenius Medical Care stock option plan.
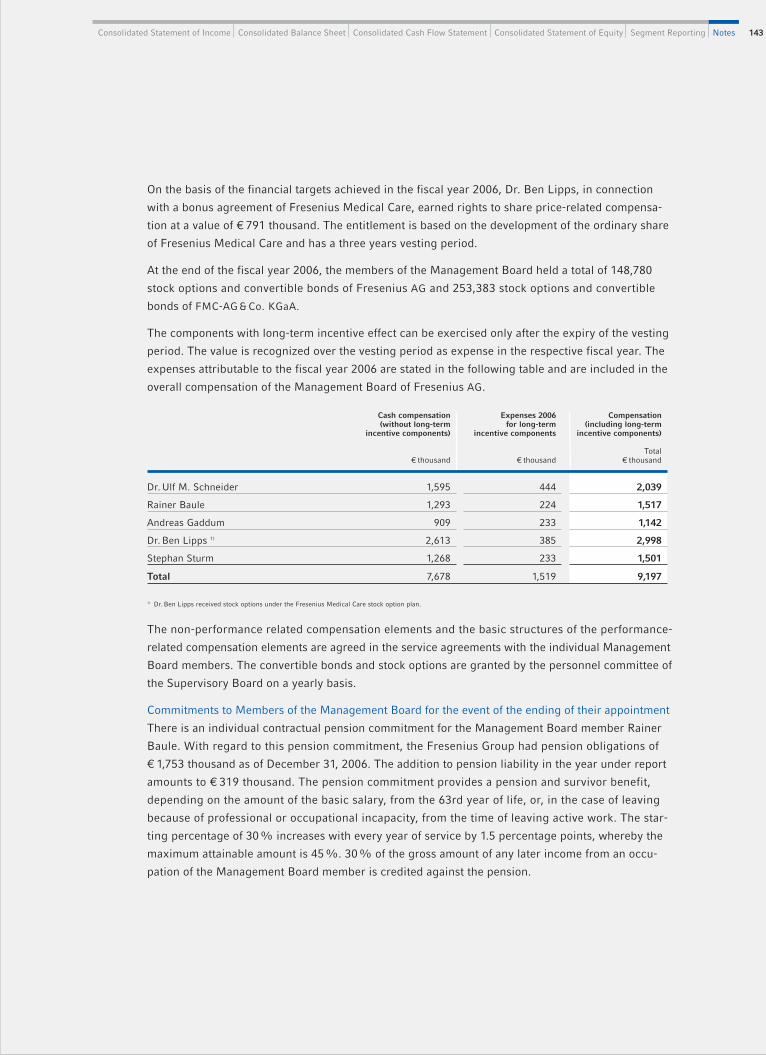
143Consolidated Statement of Income Consolidated Balance Sheet Consolidated Cash Flow Statement Consolidated Statement of Equity Segment Reporting Notes
On the basis of the financial targets achieved in the fiscal year 2006, Dr. Ben Lipps, in connection
with a bonus agreement of Fresenius Medical Care, earned rights to share price-related compensa-
tion at a value of € 791 thousand. The entitlement is based on the development of the ordinary share
of Fresenius Medical Care and has a three years vesting period.
At the end of the fiscal year 2006, the members of the Management Board held a total of 148,780
stock options and convertible bonds of Fresenius AG and 253,383 stock options and convertible
bonds of FMC-AG & Co. KGaA.
The components with long-term incentive effect can be exercised only after the expiry of the vesting
period. The value is recognized over the vesting period as expense in the respective fiscal year. The
expenses attributable to the fiscal year 2006 are stated in the following table and are included in the
overall compensation of the Management Board of Fresenius AG.
The non-performance related compensation elements and the basic structures of the performance-
related compensation elements are agreed in the service agreements with the individual Management
Board members. The convertible bonds and stock options are granted by the personnel committee of
the Supervisory Board on a yearly basis.
Commitments to Members of the Management Board for the event of the ending of their appointment
There is an individual contractual pension commitment for the Management Board member Rainer
Baule. With regard to this pension commitment, the Fresenius Group had pension obligations of
€ 1,753 thousand as of December 31, 2006. The addition to pension liability in the year under report
amounts to € 319 thousand. The pension commitment provides a pension and survivor benefit,
depending on the amount of the basic salary, from the 63rd year of life, or, in the case of leaving
because of professional or occupational incapacity, from the time of leaving active work. The star-
ting percentage of 30% increases with every year of service by 1.5 percentage points, whereby the
maximum attainable amount is 45%. 30% of the gross amount of any later income from an occu-
pation of the Management Board member is credited against the pension.
Cash compensation(without long-term
incentive components)
Expenses 2006 for long-term
incentive components
Compensation (including long-term
incentive components)
€ thousand € thousandTotal
€ thousand
Dr. Ulf M. Schneider 1,595 444 2,039
Rainer Baule 1,293 224 1,517
Andreas Gaddum 909 233 1,142
Dr. Ben Lipps 1) 2,613 385 2,998
Stephan Sturm 1,268 233 1,501
Total 7,678 1,519 9,197
1) Dr. Ben Lipps received stock options under the Fresenius Medical Care stock option plan.

Notes144
With the Management Board member Dr. Ben Lipps an individual agreement exists instead of a
pension provision, to the effect that, taking account of a competitive restriction after the ending of
the service agreement between him and Fresenius Medical Care Management AG, he can, for a peri-
od of ten years, act in a consultative capacity for the company. The consideration to be granted by
Fresenius Medical Care Management AG in return would amount per annum in value to approximately
46% of the non-performance related compensation elements paid to him in the fiscal year 2006.
The service agreements of the Management board members contain no express provisions for the
case of a change of control and for the event of the ending of their service agreement.
Miscellaneous
In the fiscal year 2006, no loans or advance payments of future compensation components were
made to members of the Management Board of Fresenius AG. No member of the Management Board
received in the fiscal year 2006 payments or commitments from third parties in relation to his work
as Management Board member.
Fresenius AG undertook, to the extent legally admissible, to indemnify the members of the Manage-
ment Board against claims against them arising out of their work for the company and its affiliates, if
such claims exceed their responsibilities under German law. To secure such obligations, the com-
pany concluded a Directors’ & Officers’ insurance (D & O insurance) with an appropriate excess. The
indemnity applies for the time in which each member of the Management Board is in office and for
claims in this connection after the ending of the membership of the Management Board in each case.
To former members of the Management Board and their surviving dependents € 588 thousand was
paid in the year 2006. The pension obligation for these persons amounts to € 9,696 thousand.
33. INFORMATION ON THE SUPERVISORY BOARD
The Supervisory Board appoints the members of the Management Board and supervises and advises
the Management Board in managing the company. However, the Supervisory Board is fundamentally
prohibited from managing the company in any way. The remuneration of the Supervisory Board
is determined by the Annual General Meeting and is subject to the provisions contained in § 13 of
the statutes of Fresenius AG. The total remuneration of the members of the Supervisory Board of
Fresenius AG in 2006 was € 1,127 thousand. This included € 253 thousand relating to fixed and € 874
thousand relating to variable components. The fixed remuneration per Supervisory Board member
was equivalent to € 13 thousand, whereby the Chairman receives double of this amount and the deputy

145Consolidated Statement of Income Consolidated Balance Sheet Consolidated Cash Flow Statement Consolidated Statement of Equity Segment Reporting Notes
to the Chairman receives one and half times the amount of a Supervisory Board member. The
members of the Audit Committee and the Personnel Committee of the Supervisory Board receive an
additional € 10 thousand each and the Chairman of the committee receives a further € 10 thousand.
For each full fiscal year, the variable remuneration increases by 10% for each percentage point that
the dividend paid on each ordinary share for that year (gross dividend according to the resolution of
the Annual General Meeting) exceeds 13% of the amount equal to the subscribed capital divided
by the number of non-par value shares; residual amounts are interpolated. Thus, the variable remu-
neration per Supervisory Board member amounted to € 73 thousand for the year 2006. All members
of the Supervisory Board receive appropriate compensation for costs of travel and accommodation
incurred in connection with their duties as members of the Supervisory Board.
One subsidiary paid € 11 thousand to the surviving dependents of a former Supervisory Board member.
34. D & O INSURANCE
Fresenius AG has concluded a consequential loss liability insurance policy (D & O insurance), on an
excess amount basis, for the members of the Management Board and the Supervisory Board of
Fresenius AG and for all representative bodies of affiliates in Germany and elsewhere. The D & O
policy applies throughout the world and runs until the end of June 2007. The policy covers the legal
defense costs of a member of a representative body when a claim is made and, where relevant, any
damages to be paid which are covered by the policy.
35. FEES FOR THE AUDITOR
In 2006 and 2005, fees for the auditor in Germany were expensed as follows:
in million € 2006 2005
Audit fees 4 4
Tax consulting fees – –
Audit-related fees – –
Other fees – 1
Total auditor fees 4 5

Notes146
Bad Homburg v.d.H., February 27, 2007
The Management Board
Dr. U. M. Schneider R. Baule A. Gaddum Dr. B. Lipps S. Sturm
36. CORPORATE GOVERNANCE
The members of the Management Boards and the Supervisory Boards of Fresenius AG and
FMC-AG & Co. KGaA have submitted the Declaration of Compliance pursuant to § 161 of the German
Stock Corporation Act (AktG) in accordance with the German Corporate Governance Code dated
June 12, 2006 and made this permanently available to the shareholders.
37. PROPOSAL FOR THE DISTRIBUTION OF EARNINGS
The Management Board of Fresenius AG proposes to the Annual General Meeting that the earnings
for 2006 of Fresenius AG be distributed as follows:
in €
Payment of a dividend of € 0.57 per bearer ordinary share on the 77,176,938
ordinary shares entitled to dividend 43,990,854.66
Payment of a dividend of € 0.58 per bearer preference share on the 77,176,938
preference shares entitled to dividend 44,762,624.04
Balance to be carried forward 330,806.07
89,084,284.77

147Auditor’s Report
AUDITOR’S REPORT
We have audited the consolidated financial statements prepared by the Fresenius Aktiengesellschaft,
Bad Homburg v. d. Höhe, comprising the balance sheet, the income statement, statement of changes
in equity, cash flow statement and the notes to the consolidated financial statements, together with
the group management report for the business year from January 1 to December 31, 2006. The pre-
paration of the consolidated financial statements and the group management report in accordance
with International Financial Reporting Standards (IFRS), as adopted by the EU, and the additional
requirements of German commercial law pursuant to § 315a Abs. 1 HGB are the responsibility of the
Company’s management. Our responsibility is to express an opinion on the consolidated financial
statements and on the group management report based on our audit.
We conducted our audit of the consolidated financial statements in accordance with § 317 HGB
(Handelsgesetzbuch „German Commercial Code“) and German generally accepted standards for the
audit of financial statements promulgated by the Institut der Wirtschaftsprüfer (IDW). Those stan-
dards require that we plan and perform the audit such that misstatements materially affecting the
presentation of the net assets, financial position and results of operations in the consolidated finan-
cial statements in accordance with the applicable financial reporting framework and in the group
management report are detected with reasonable assurance. Knowledge of the business activities
and the economic and legal environment of the Group and expectations as to possible misstatements
are taken into account in the determination of audit procedures. The effectiveness of the accounting-
related internal control system and the evidence supporting the disclosures in the consolidated finan-
cial statements and the group management report are examined primarily on a test basis within the
framework of the audit. The audit includes assessing the annual financial statements of those entities
included in consolidation, the determination of entities to be included in consolidation, the accoun-
ting and consolidation principles used and significant estimates made by management, as well as
evaluating the overall presentation of the consolidated financial statements and group management
report. We believe that our audit provides a reasonable basis for our opinion.
Our audit has not led to any reservations.
In our opinion, based on the findings of our audit, the consolidated financial statements comply with
International Financial Reporting Standards (IFRS), as adopted by the EU, the additional
requirements of German commercial law pursuant to § 315a Abs. 1 HGB and give a true and fair view
of the net assets, financial position and results of operations of the Group in accordance with these
requirements. The group management report is consistent with the consolidated financial statements
and as a whole provides a suitable view of the Group’s position and suitably presents the opportuni-
ties and risks of future development.
Frankfurt am Main, February 27, 2007
KPMG Deutsche Treuhand-Gesellschaft
Aktiengesellschaft
Wirtschaftsprüfungsgesellschaft
Hölzl Hommel
German Public Auditor German Public Auditor

Report of the Supervisory Board148
REPORT OF THE SUPERVISORY BOARD
In 2006, the Supervisory Board performed the duties assigned to it by law and by the Com-
pany’s Articles of Association, regularly advising and monitoring the Management Board. It
was closely involved in all decisions that were of major importance to the Group.
COOPERATION BETWEEN THE MANAGEMENT BOARD AND
SUPERVISORY BOARD
Carrying out its monitoring and advisory activities, the Supervisory Board was kept regularly
informed by the Management Board – in a timely manner and comprehensively, both in writing
and orally – about the business development, the economic and financial position, and the
profitability of the Company and the Group, the corporate strategy and planning, the risk
situation, and important business events. Before each of the Supervisory Board’s four regular
meetings, detailed Management Board reports and comprehensive approval documents
concerning the agenda were distributed to its members. At its meetings the Supervisory Board
used the Management Board’s reports as the basis for its comprehensive discussions about
business development and important corporate decisions. All matters requiring Supervisory
Board approval were submitted with sufficient time for proper scrutiny. After reviewing the
related approval documents and after detailed consultation with the Management Board, the
Supervisory Board was able to give its approval in all matters submitted to it. The Supervisory
Board was also informed about any important business events occurring between meetings
and, in urgent cases, was requested to pass resolutions by written proceeding in lieu of a
meeting. In addition, the chairman of the Management Board informed in individual discus-
sions the chairman of the Supervisory Board regularly about the latest business developments
and forthcoming decisions. Every member of the Supervisory Board attended more than half
of the Supervisory Board meetings in 2006.

149Report of the Supervisory Board
MAIN FOCUS OF THE SUPERVISORY BOARD’S ACTIVITIES
The Supervisory Board’s monitoring and advisory activities were mainly focused on overall
business operations as well as on business segment investments and acquisitions, or acqui-
sition plans, and any related financing. The Supervisory Board carefully examined the oppor-
tunities and risks relating to acquisitions, such as HUMAINE Kliniken, and was kept informed
by the Management Board about the integration of the strategically important acquisitions,
Renal Care Group and HELIOS Kliniken.
At a special joint meeting with the Management Board on September 22, 2006 the Supervisory
Board discussed in detail the conversion of Fresenius AG into a European Company (SE) and
the new division of the subscribed capital (share split) with a capital increase from Company’s
funds. In particular, the effect of the conversion on corporate governance, especially on
employee co-determination in the Supervisory Board, was discussed intensively. The Supervi-
sory Board approved both measures unanimously on October 11, 2006. They were passed by
the General Meeting on December 4, 2006.
The Supervisory Board also thoroughly reviewed and discussed all other significant business
activities with the Management Board. It approved the budget for 2007 and the Group’s
medium-term planning, following a detailed review and discussions with the Management
Board. At its regular meetings and within the Audit Committee, the Supervisory Board also
kept itself informed about the Group’s risk management activities.
The German Commercial Code (HGB), in pursuant of section 289 (4) and section 315 (4),
requires disclosures, among other things, about the capital of Fresenius AG, voting rights,
and ownership interests. Please see pages 60 to 62 of the Management Report for this
information, which was reviewed and approved by the Supervisory Board.
CORPORATE GOVERNANCE
The further development of the corporate governance at Fresenius was reviewed by the Super-
visory Board with regard to the conversion of Fresenius AG into an SE. This matter was also
examined within the framework of the review of amendments to the rules of procedure of the
Management Board and amendments to the Articles of Association that were proposed for
adoption to the Annual General Meeting of Fresenius AG on May 10, 2006. In accordance with
the German Corporate Governance Code, the Management Board and the Supervisory Board
jointly issued a Declaration of Conformity on November 28, 2006. For further information on
corporate governance at Fresenius, see the Corporate Governance Report issued jointly by the
Management and Supervisory Boards on pages 26 to 29 of this Annual Report.

Report of the Supervisory Board150
WORK OF THE COMMITTEES
In addition to the Mediation Committee, as required by section 27 (3) of the German Co-deter-
mination Act (MitbestG), the Supervisory Board also formed an Audit Committee and a Person-
nel Committee as permanent committees.
The Personnel Committee, which is responsible, among other things, for concluding, amend-
ing, and terminating employment contracts with the members of the Management Board,
held two meetings and one conference call.
The Audit Committee held four meetings. The main focus of its activities was on the preliminary
audit of the annual financial statements of Fresenius AG and the Group for 2005 and discussions
with the auditors about their report and the terms of reference of the audit. The Audit Com-
mittee also reviewed the 2006 quarterly reports and the risk management system.
Following their own meetings, the chairmen of the committees reported regularly to the next
Supervisory Board meeting on the work of the committees.
The Mediation Committee did not meet in 2006.
The Supervisory Board formed an additional committee, “Capital Increase 2006”, on March 17,
2006 in order to insure timely authorization by the Supervisory Board for utilization of the
approved capital in connection with the financing of the HUMAINE Kliniken acquisition. The
Supervisory Board delegated approval of the Management Board’s decisions on share rights
and conditions of issue to this committee. The “Capital Increase 2006” Committee passed the
necessary resolutions by means of a telephone vote. The functions and activities of the “Capital
Increase 2006” Committee ceased with the entry in the Commercial Register of the capital
increase from approved capital on November 17, 2006.
FINANCIAL STATEMENTS AND CONSOLIDATED FINANCIAL STATEMENTS
The accounting records, the Fresenius AG financial statements prepared according to the
German Commercial Code (HGB), and the Fresenius AG Management Report for 2006 were
audited by KPMG Deutsche Treuhand-Gesellschaft Aktiengesellschaft Wirtschaftsprüfungs-
gesellschaft, Frankfurt am Main. They were elected as auditors at Fresenius AG’s Annual
Shareholders’ Meeting on May 10, 2006 and were subsequently commissioned by the Supervi-
sory Board. The auditors issued their unqualified audit opinion for these statements. The
same applies to Fresenius AG’s consolidated financial statements, which were prepared accord-
ing to IFRS accounting principles, and the US GAAP statements, which were prepared volun-
tarily. Management Reports were added to the consolidated financial statements. The financial
statements, consolidated financial statements, Management Reports, and auditors’ reports
were submitted to each Supervisory Board member within the required time. The Supervisory
Board noted and approved the auditors’ findings. The Supervisory Board’s own review found

151Report of the Supervisory Board
no objections to the Fresenius AG financial statements or the consolidated financial statements.
The Supervisory Board equally agrees with the Management Reports and the statements
contained therein with respect to future development.
At its meeting on March 16, 2007 the Supervisory Board approved Fresenius AG’s financial
statements for the fiscal year 2006 as presented by the Management Board, thereby adopting
them as official. The Supervisory Board also approved the consolidated financial statements
prepared according to IFRS standards and the consolidated financial statements prepared
voluntarily according to US GAAP for 2006. The auditors delivered a detailed report on the
results of the audit during this meeting. The auditors attended all four Supervisory Board
meetings and all four meetings of the Audit Committee. The Supervisory Board concurs with
the proposal by the Management Board on the appropriation of the 2006 retained earnings.
PERSONNEL
No changes took place within the Supervisory Board or the Management Board in 2006.
The Supervisory Board, the Management Board, and the employees of Fresenius sadly mourn
the passing of the former Chairman of the Management Board and Honorary Chairman of the
Supervisory Board, Dr. h.c. Hans Kröner, who died on June 27, 2006 at the age of 96. Before
he retired in 1992, Dr. h.c. Hans Kröner had been with Fresenius for more than 40 years. His
commitment was instrumental to the development of the Company. Under his leadership,
Fresenius grew from a medium size firm into a global group, with about 7,000 employees and
sales of approximately DM 1.5 billion in 1992. We are deeply indebted to Dr. h.c. Hans Kröner
for his enormous services to the Company.
The Supervisory Board would like to thank the Management Board and all employees for their
achievements and commitment during the fiscal year 2006.
Bad Homburg v.d.H., March 16, 2007
The Supervisory Board
Dr. Gerd Krick
Chairman

Management Board152
Dr. Ulf M. Schneider
Frankfurt am Main
Chairman
Corporate OfficesSupervisory BoardFresenius Kabi AG (Chairman) Fresenius Medical Care Management AG (Chairman)HELIOS Kliniken GmbH (Chairman)Eufets AG (Chairman)Fresenius Kabi Austria GmbH, Austria Fresenius Kabi España S.A., SpainFresenius Medical Care Groupe France S.A., France(Chairman)Fresenius HemoCare Netherlands B.V., Netherlands Board of DirectorsFHC (Holdings), Ltd., Great Britain
Andreas Gaddum
Mainz
Business Segment Fresenius ProServe
Corporate OfficesSupervisory BoardHELIOS Kliniken GmbHVAMED AG, Austria Wittgensteiner Kliniken GmbH (Chairman)
Dr. Ben Lipps
Boston, Massachusetts (USA)
Business Segment
Fresenius Medical Care
Corporate OfficesManagement BoardFresenius Medical Care AG (Chairman)(until February 10, 2006)Fresenius Medical Care Management AG (Chairman)
Rainer Baule
Ettlingen
Business Segment Fresenius Kabi
Corporate OfficesSupervisory BoardFresenius Kabi Austria GmbH, Austria (Chairman)Fresenius HemoCare Netherlands B.V., Netherlands(Chairman)Fresenius Kabi España S.A., SpainCalea Ltd., CanadaAdministrative BoardFresenius Kabi Groupe France S.A., France (Chairman)Board of DirectorsFHC (Holdings), Ltd., Great Britain
Stephan Sturm
Hofheim am Taunus
Chief Financial Officer and
Labor Relations Director
Corporate Offices Supervisory BoardFresenius Kabi AGHELIOS Kliniken GmbHWittgensteiner Kliniken GmbHFresenius HemoCare Netherlands B.V., Netherlands Board of DirectorsFHC (Holdings), Ltd., Great Britain
MANAGEMENT BOARD

153Supervisory Board
Dr. h. c. Hans Kröner
(† June 27, 2006)
Bad Homburg v. d. H.
Honorary Chairman of the Supervisory
Board
Dr. Gerd Krick
Königstein
Former Chairman of the
Management Board Fresenius AG
Chairman
Chairman of the Personnel CommitteeMember of the Audit CommitteeMember of the Mediation Committee
Offices Supervisory BoardFresenius Medical Care AG & Co. KGaA (Chairman)Fresenius Medical Care Management AGVAMED AG, Austria (Chairman) Allianz Private Krankenversicherungs-AGAdvisory BoardHDI Haftpflichtverband der deutschen Industrie V.a.G.Board of Directors Adelphi Capital Europe Fund, Cayman IslandsBoard of TrusteesDonau-Universität Krems, Austria (until April 30, 2006)
Gerhard Herres
Beckingen-Haustadt
Member of the Trade Union
Deutscher Handels- und Industrie-
angestellten Verband im CGB
Member of the Works Council
St. Wendel plant
(Chairman until April 24, 2006)
Member of the General Works Council
(until April 24, 2006)
Spokesman of the Standing Committee
on Industry and Trade
(until April 24, 2006)
Dr. Gabriele Kröner
Berg
Doctor
Offices Management BoardElse Kröner-Fresenius-Stiftung
Dr. rer. nat. Bernd Mathieu
Bad Homburg v. d. H.
Graduate chemist
Corporate OfficesBoard of DirectorsFresenius Medical Care Japan Co. Ltd., JapanFresenius-Kawasumi Co. Ltd., Japan
Christel Neumann
Schonungen
Chairlady of the Fresenius European
Employee Forum
Chairlady of the Works Council
Schweinfurt plant
Member of the General Works Council
Ilona Oesterle
Waldsolms
Member of the Works Council
Bad Homburg v. d. H.
(Deputy Chairlady until April 23, 2006)
Dr. Gerhard Rupprecht
Gerlingen
Member of the Management Board
Allianz SE
Chairman of the Management Board
Allianz Deutschland AG
OfficesSupervisory BoardHeidelberger Druckmaschinen AGQuelle GmbH (until March 20, 2006)ThyssenKrupp Automotive AGAllianz Lebensversicherungs-AG (Chairman) Allianz Versicherungs-AG (Chairman)Allianz Private Krankenversicherungs-AG (Chairman)Allianz Beratungs- und Vertriebs-AG(since February 24, 2006) (Chairman since March 18, 2006)Allianz Elementar Lebensversicherungs-AG, Austria (Chairman) (until January 16, 2006)Allianz Elementar Versicherungs-AG, Austria (until January 16, 2006)Allianz First Life Insurance Co. Ltd., Korea
Wilhelm Sachs
Friedrichsdorf
Chairman of the General Works Council
Deputy Chairman of the Works Council
Friedberg plant
Deputy Chairman of the Standing
Committee on Industry and Trade
(until July 5, 2006)
Member of the Mediation Committee
Dr. Dieter Schenk
Munich
Lawyer and tax consultant
Member of the Mediation Committee
OfficesSupervisory BoardFresenius Medical Care AG & Co. KGaA (Deputy Chairman)Fresenius Medical Care Management AG(Deputy Chairman)Gabor Shoes AG (Chairman)Greiffenberger AG (Deputy Chairman)TOPTICA Photonics AG (Deputy Chairman) Administrative BoardElse Kröner-Fresenius-Stiftung
Dr. Karl Schneider
Mannheim
Former Spokesman
Südzucker AG
Member of the Personnel Committee
OfficesAdministrative BoardElse Kröner-Fresenius-Stiftung (Deputy Chairman)
Volker Weber
Löhnberg
Deputy Chairman
Full-time Secretary of the Trade Union
IG Bergbau, Chemie, Energie
Member of the Personnel CommitteeMember of the Audit CommitteeMember of the Mediation Committee
OfficesSupervisory BoardSV Deutschland GmbH (until December 12, 2006)
Dr. Bernhard Wunderlin
Bad Homburg v. d. H.
Former Managing Director
Harald Quandt Holding GmbH
Chairman of the Audit Committee
OfficesSupervisory BoardEquita Management GmbH (since November 15, 2006)Hertie School of GovernanceAugsburger Aktienbank AG (until March 14, 2006)Advisory BoardHarald Quandt Holding GmbH (since May 17, 2006)Von Rautenkranz Nachfolger GbRMarsh&McLennan Deutschland GmbHAdministrative BoardSenckenbergische Naturforschende GesellschaftManagement BoardGemeinnützige Hertie-Stiftung (Deputy Chairman)Foundation CouncilPwC-Stiftung0
SUPERVISORY BOARD

Financial Calendar154
Corporate Head Office
Else-Kröner-Strasse 1
Bad Homburg v. d. H.
Postal address
Fresenius AG
61346 Bad Homburg v. d. H.
Contact for journalists
Corporate Communications
Telephone: ++49 61 72 6 08-23 02
Telefax: ++49 61 72 6 08-22 94
e-mail: [email protected]
Commercial Register: AG Bad Homburg v.d.H.; HRB 2617 Management Board: Dr. Ulf M. Schneider (Chairman), Rainer Baule, Andreas Gaddum, Dr. Ben Lipps, Stephan Sturm Chairman of the Supervisory Board: Dr. Gerd Krick
The German version of this Report is legally binding.
The financial statements of Fresenius AG are available on our website and may be obtained upon request.
You will find further information and current news about our company on our website at: http://www.fresenius-ag.com
Forward-looking statements:This Report contains forward-looking statements. These statements represent assessments which we have made onthe basis of the information available to us at the time. Should the assumptions on which the statements are based onnot occur, or if risks should arise – as mentioned in the risk report – the actual results could differ materially from theresults currently expected.
Report on 1st quarter 2007
Conference call May 2, 2007
Annual General Meeting, Frankfurt am Main (Germany) May 16, 2007
Payment of dividend* May 17, 2007
Report on 1st half 2007
Analysts’ meeting, Bad Homburg v. d. H.
Live webcast August 2, 2007
Report on 1st-3rd quarters 2007
Analysts’ meeting, Bad Homburg v. d. H.
Live webcast
Press conference, Bad Homburg v. d. H.
Live webcast October 31, 2007
* subject to the prior approval by the Annual General Meeting
FINANCIAL CALENDAR
Contact for shareholders
Investor Relations
Telephone: ++49 61 72 6 08-24 85
++49 61 72 6 08-24 86
++49 61 72 6 08-24 87
Telefax: ++49 61 72 6 08-24 88
e-mail: [email protected]