optimisation of green synthetic process
84
A P T I A P T I PAST EDITORS Dr. Nagavi B.G. Mysore 1997 - 2006 • Dr. Rao M.N.A. Manipal 1995-1996 Dr. Gundu Rao P. Manipal 1985-1995 • Dr. Kasture A.V. Nagpur 1981 - 1984 • Dr. Saoji A.N. Nagpur 1980 - 1980 • Dr. Lakhotiya C. L. Nagpur 1979 - 1980 • Dr. Chopde C.T. Nagpur 1978 - 1978 • Dr. Gundu Rao P. Manipal 1975 - 1978 • Dr. Mithal B. M. Pilani 1967 – 1974 EDITOR–IN–CHIEF Dr. Sanjay Pai P. N. [email protected] EDITORIAL OFFICE Abstracted and Indexed in Science Citation Index Expanded (Scisearch), Journal Citation reports, Scopus and Embase • • ASSOCIATE EDITORS ijper Indian Journal of Pharmaceutical Education & Research INDIAN JOURNAL OF PHARMACEUTICAL EDUCATION AND RESEARCH The Official Publication of Association of Pharmaceutical Teachers of India H.Q.: Al-Ameen College of Pharmacy Opp. Lalbagh Main Gate, Hosur Main Road, Bangalore - 560027 INDIA Fax: 080-22225834; 080-22297368; email: [email protected] | Website : www.ijperonline.com Vol. 44(4), Oct - Dec, 2010
Transcript of optimisation of green synthetic process

A
P
T
I
A
P
T
I
PAST EDITORS
Dr. Nagavi B.G.
Mysore
1997 - 2006
•
Dr. Rao M.N.A.
Manipal
1995-1996
Dr. Gundu Rao P.
Manipal
1985-1995
• Dr. Kasture A.V.
Nagpur
1981 - 1984
• Dr. Saoji A.N.
Nagpur
1980 - 1980
• Dr. Lakhotiya C. L.
Nagpur
1979 - 1980
• Dr. Chopde C.T.
Nagpur
1978 - 1978
• Dr. Gundu Rao P.
Manipal
1975 - 1978
• Dr. Mithal B. M.
Pilani
1967 – 1974
EDITOR–IN–CHIEF
Dr. Sanjay Pai P. N. [email protected]
EDITORIAL OFFICE
Abstracted and Indexed in Science Citation Index Expanded (Scisearch),
Journal Citation reports, Scopus and Embase
•
•
ASSOCIATE EDITORS
ijper Indian Journal of Pharmaceutical
Education & Research
INDIAN JOURNAL OF PHARMACEUTICAL EDUCATION AND RESEARCHThe Official Publication of Association of Pharmaceutical Teachers of India
H.Q.: Al-Ameen College of Pharmacy
Opp. Lalbagh Main Gate, Hosur Main Road, Bangalore - 560027 INDIA
Fax: 080-22225834; 080-22297368;
email: [email protected] | Website : www.ijperonline.com
Vol. 44(4), Oct - Dec, 2010

EDITORIAL ADVISORY BOARD
Dr. Betgeri G.V., USA.
Dr. Mrs.Claire Anderson, UK.
Mr. Frank May, USA.
Dr. Gaud R.S., Mumbai.
Dr. Goyal R.K., Ahmedabad.
Dr. Harkishan Singh, Chandigarh.
Dr. Hukkeri V.I., Bangalore.
Dr. Jagdeesh G., USA.
Dr. Katare O.P., Chandigarh.
Dr. Khar R.K., New Delhi.
Dr. Madan A. K., Rohtak.
Dr. Madhusudhan Rao Y., Warangal.
Dr. Manavalan R., Annamalai Nagar.
Dr. Miglani B.D., New Delhi.
Dr. Murthy R.S.R., Vadodara.
Dr. Nagavi B.G., Dubai.
Dr. Pulok K Mukherjee, Kolkata.
Dr. Rao M.N.A., Hyderabad.
Dr. Ravi T.K., Coimbatore.
Prof. Shivananda B.G., Bangalore.
Dr. Shivakumar H.G., Mysore
Dr. Subrahmanyam C.V.S, Hyderabad.
Dr. Suresh B., Ooty.
Dr. Tipnis H.P., Mumbai.
Dr. Udupa N., Manipal.
Dr. Vyas S.P., Sagar.
Note: The Editor does not claim any responsibility,
authors.
INDIAN JOURNAL OF PHARMACEUTICAL EDUCATION AND RESEARCH
The Official Publication of Association of Pharmaceutical Teachers of India
H.Q.: Al-Ameen College of Pharmacy
Opp. Lalbagh Main Gate, Hosur Main Road, Bangalore - 560027 INDIA
Fax: 080-22225834; 080-22297368; email: [email protected] | Website : www.ijperonline.com
liability for statements made and opinions expressed by
Abstracted and Indexed in Science Citation Index Expanded (Scisearch),
Journal Citation reports, Scopus and Embase
Publication Committee
• Pharmaceutics - Dr. Paradkar A.R., Dr. Sarasija Suresh,
Dr. Vavia P.R.
• Pharmaceutical Chemistry and - Dr. Gopal Krishna Rao, Dr. Raghurama Rao A.
Analysis Dr. Valliappan K.
• Pharmacology - Dr. Krishna D.R., Dr. Kshama Devi,
Dr. Sreenivasan B.P.
• Pharmacognosy - Dr. Ganapaty S., Dr. Salma Khanam,
Dr. Swati S.Patil
• Pharmacy Practice - Dr. Nagappa A.N., Dr. Rajendran S.D,
Dr. Shobha Rani R.H.
• Pharmaceutical Education - Dr. Raman Dang, Dr. Unnikrishnan M.K.,
Dr. Bhise S.B.
• Pharmaceutical Marketing - Dr. Burande M.D., Dr. Gayathri Devi S.,
Dr. Kusum Devi V.
ijper Indian Journal of Pharmaceutical
Education & Research Vol. 44(4), Oct - Dec, 2010

CONTENTS
ijper Indian Journal of Pharmaceutical
Education & Research Vol. 44(4), Oct - Dec, 2010
Formulation and Evaluation of Diclofenac Sodium Gels Using Sodium Carboxymethyl Hydroxypropyl Guar and Hydroxypropyl MethylcelluloseSwamy N.G.N., Mazhar Pasha and Zaheer Abbas ..................................................................................... 310 -314
Mucoadhesive films of Losartan Potassium for Buccal delivery: Design and CharacterizationMarina Koland, R.N. Charyulu and Prabhakara Prabhu .......................................................................... 315 - 323
Formulation and Evaluation of Topical Liposomal Gel for FluconazoleB. V. Mitkari, S. A. Korde, K. R. Mahadik and C. R. Kokare ...................................................................... 324 - 333
Development of Fast Dissolving Tablets of Glibenclamide Using Crospovidone and its Kneading MixtureJeevana Jyothi. B and Suneela. G .............................................................................................................. 334 - 340
Stability Indicating HPTLC method for Estimation in the Bulk Drug and Tablet Dosage Form
Effect of Different Acids on the Formation of E and Z Isomers of Doxepin G.K. Rao, A.R. Ramesha, Amit Kumar Jain and B.V. Adavi Rao.................................................................. 345 - 349
Application of Factorial Design in Optimization of Synthetic Reactions: a Novel ApproachPal Tanushree, Somani Rakesh R. and Kadam Vilasrao J. ......................................................................... 350 - 357
Microwave Assisted Synthesis and Biological Evaluation of Pyrazole Derivatives of BenzimidazolesR. Kalirajan, Leela Rathore, S. Jubie, B. Gowramma, S. Gomathy, S. Sankar and K. Elango ................. 358 - 362
Anti-inflammatory and Antioxidant Activities of Methanolic extract of Buchanania Lanzan KernelWarokar A. S., Ghante M. H., Duragkar N. J. and Bhusari K. P. ............................................................... 363 - 368
Phytochemical investigation and evaluation of anthelmintic activity of extract from leaves of Eupatorium odoratum linn. Debidani Mishra, Deb Kumar Sarkar, Bhabani Shankar Nayak, Prasant Kumar Rout, P. Ellaiah and S. Ramakrishna ..................................................................................................................... 369 - 374
Determination of In-vitro Sun Protection Factor (SPF) of Murraya Koenigii L. (Rutaceae) Essential oil Formulation
Rekha B Patil, Shantanu Kale, Devanshi M Badiyani and A.V. Yadav ....................................................... 375 - 379
In vitro and In Vivo evaluation of Stimuli Sensitive Hydrogel for ophthalmic drug deliveryVinod Singh, S.S. Busheetti S Appala Raju , Rizwan Ahmad, Mamta Singh .............................................. 380 - 385,
Total Quality Management in Pedagogy (TQM_P): An UpdateRam Chakkaand G.T. Kulkarni .................................................................................................................. 386 - 390
Trandolapril
Vikas, Rao J.R, Sathiyanarayanan L and Yadav S.S ..................................................................................... 341 - 344
Abstract
In this investigation, Diclofenac sodium gels were formulated employing Sodium carboxymethyl hydroxypropyl guar
and Hydroxypropyl methylcellulose as gelling agents. Hydroxypropyl methylcellulose (K4M) was employed at 5 %
w/w strength whereas, Sodium carboxymethyl hydroxypropyl guar formed a gel at 2.5 % w/w strength. Gels were
subjected for various evaluation tests such as pH measurement, assay, stability study, rheological evaluation, and in-
vitro release studies across hairless albino rat skin. Gels formulated using Sodium carboxymethyl hydroxypropyl
guar displayed a pH value of 7.48 whereas, Hydroxypropyl methylcellulose gels revealed a pH value of 7.26. Stability
studies revealed good physical stability and assay values did not show much variation from the initial drug content in 0 0both the cases with formulations stored at 25 C, 60% RH and 40 C, 70% RH for six months. Hydroxypropyl
methylcellulose at 5% w/w strength revealed shear-thinning property whereas, Sodium carboxymethyl
hydroxypropyl guar at 2.5 % w/w strength revealed both pseudoplastic and thixotropic property. The rheological data
were fitted into Martin and co-workers equation to obtain a linear relationship and from the linear curve fittings, the
'N'- values; the possible flow indices for pseudoplasticity were arrived at. A 'N' value of 4.65 was obtained for Sodium
carboxymethyl hydroxypropyl guar gels in contrast to a 'N' value of 1.52 in case of Hydroxypropyl methylcellulose
gels. When subjected to In-vitro release studies across hairless albino rat skin, Sodium carboxymethyl hydroxypropyl
guar based gels revealed a % cumulative drug release of 25.66 in contrast to a % cumulative drug release of 20.80 in
case of Hydroxypropyl methylcellulose based gels at the end of 6 hours. From the above observations, Sodium
carboxymethyl hydroxypropyl guar seems to be a promising pharmaceutical adjuvant in the formulation of
Diclofenac sodium gels.
Keywords: Diclofenac sodium gels, Sodium carboxymethyl hydroxypropyl guar, Hydroxypropyl methylcellulose,
Rheological evaluation, Pseudoplasticity index
INTRODUCTION1Gels consist of liquids gelled by means of suitable
gelling agents. Gels comprise of homogenous
preparations intended to be applied to the skin or certain
mucous membranes; Gels may contain auxiliary
substances such as antimicrobial preservatives, 2antioxidant and stabilizers. The active ingredients in gel
based formulations are better percutaneously absorbed
than cream or ointment bases. A gel based formulation
can hold/contain more percentage of ethyl alcohol than
ointment and creams. A number of polymers are used to
provide the structural network for gel system. The
polymers are used in the concentration range of 0.5 to
15%. In the present study, two polymers have been used
as gelling agents namely Sodium carboxy methyl 3hydroxy Propyl guar (NaCMHPG) and hydroxy Propyl
4methyl cellulose (HPMC) .5Diclofenac Sodium , a non steroidal antiinflammatory
agent is frequently prescribed for the long term treatment
of rheumatoid arthritis, osteoarthritis and ankylosing 6spondylitis. The drug undergoes substantial first pass
effect and only 50% of drug is available systemically.
Further, the drug is known to induce ulceration and
bleeding of the intestinal wall. To avoid the adverse
effect, alternate routes of administration have been tried 7, 8by investigators . Delivery of Diclofenac sodium via
5skin offers the potential advantage of bypassing hepato-Indian Journal of Pharmaceutical Education and ResearchReceived on 6/4/2010; Modified on 23/7/2010Accepted on 28/8/2010 © APTI All rights reserved
Formulation and Evaluation of Diclofenac Sodium Gels Using
Sodium Carboxymethyl Hydroxypropyl Guar and Hydroxypropyl
Methylcellulose
Swamy N.G.N.*, Mazhar Pasha and Zaheer AbbasDepartment of Pharmaceutics, Government college of Pharmacy, Bangalore – 560 027
*Author for Correspondence: [email protected]
310
Indian J.Pharm. Educ. Res. 44(4), Oct - Dec, 2010
gastrointestinal first pass metabolism associated with
oral administration. The drug is prescribed in a dose of
75 to 150 mg daily in divided doses by oral route. The
dosing frequency can be reduced if patients are instructed
to use topical products along with the conventional
tablets.
Materials and method:
Materials: Diclofenac sodium was obtained as a gift
sample from Bangalore Pharmaceutical and Research
Laboratories. NaCMHPG used in the formulation was
prepared in our laboratory The polymer revealed a DS of 9 10value of 1.5 and sodium content of 10.44%w/w.HPMC
was obtained from Zydus cadila pharmaceuticals limited
Bangalore; Propylene glycol, sodium methyl paraben
and sodium Propyl paraben were obtained from Nice
chemicals.
Method
A quantity of HPMC (gel-I)/NaCMHPG (gel-II) as
specified in table-1 were dispersed separately in about 40
ml of deionised water. In case of HPMC dispersion, it was 11warmed to form a gel . Diclofenac sodium was dispersed
in 40 ml of deionised water. To the drug solution,
propylene glycol and preservatives (sodium salts of
methyl paraben and Propyl paraben) were added and
stirred until the solutioning was effected. The drug,
humectant and preservatives solution was added to the
polymer solution in small increments with constant
stirring using a propeller mixer. Stirring speed was
adjusted to minimize the air entrapment in the gel and
deionised water was added to adjust the gel weight to 100
grams. The agitation was continued until a uniform gel
resulted. The prepared gels were filled in empty
collapsible tubes and sealed by crimping the ends and
preserved in a cool and dry place until further use.
EVALUATION OF DICLOFENAC SODIUM GELS
The Diclofenac sodium gels were subjected for extensive
rheological evaluation, drug content estimation.pH
measurement, stability study and drug release study
across hairless albino rat skin.
Rheological studies: Brookfield synchrolectric 12 13 viscometer , analog model was used for the studies.
First, the spindle was dipped into the gel till the notch on
the spindle touched the gel surface.100 g each of gel I and
gel II was used in the study. The spindle no.7 was selected
based on the viscosity of the (gel for) both the
formulations. This spindle was rotated at 0.5 rpm, and
dial reading was recorded until 2 consecutive similar
readings were obtained. Similarly dial readings were
recorded at 1.0, 2.5, 5.0, 10.0, 20.0, and 50.0 and up to
100 rpm. As soon the sample was sheared at the highest
rate, another set of dial readings were recorded by
reducing the spindle rotation in the decreasing order to
the pool the data on the down curve. Rheograms were
constructed by plotting the dial readings on the X-axis
and rpm values along the Y-axis. Rheological data were
pooled for (i) polymer dispersion in preservative solution
(ii) dispersion of polymer and drug in preservative
solution (iii) dispersion of polymer and humectant in
preservative solution (iv) all together.
Drug content estimation: An accurately weighed 1 gm
quantity of the gel was transferred into a 250ml stoppered
volumetric flask and shaken vigorously with 2x25 ml
quantity of methanol to extract the drug. The contents
were filtered into a 50 ml volumetric flask and volume
was made up to the mark with methanol. From the above
solution, 0.5 ml was pipetted in to a 25 ml volumetric
flask and volume was made up to 25 ml with methanol.
Finally, the UV absorbance of the resulting solution was
measured at 280 nm against the blank solution of
methanol.14Diclofenac sodium obeys Lambert's beers law in the
concentration range of 2 to 16 µg/ml. A calibration curve
was constructed which revealed a slope value of 0.0421
and intercept value of 0.0025. These values were used in
finding the drug content in the formulation after
extracting the drug in suitable dilutions and recording the
absorbance at 280 nm.15,16pH measurement: The pH measurement was carried
out by using a calibrated digital type pH meter by dipping
the glass electrode and the reference electrode
completely into the gel system so as to cover the
electrodes.17In-vitro release studies: The hairless albino rat skin
obtained from the discards of the animal sacrifice at the
pharmacology department in the college was used. The 18skin was soaked in 0.32 N ammonium hydroxide
solution for 30 to 35 minutes to remove subcutaneous fat
and hair. The skin was rinsed well with saline followed by
distilled water.19Franz diffusion cell was used for permeability study: 1 g
Indian J.Pharm. Educ. Res. 44(4), Oct - Dec, 2010
311

Indian J.Pharm. Educ. Res. 44(4), Oct - Dec, 2010
of the gel was uniformly spread over the rat skin
membrane and tied over the donor compartment. The
skin was placed with stratum corneum facing the donor
compartment and the dermis facing the receptor
compartment containg 100ml distilled water. At hourly
intervals, 5ml of sample was withdrawn from the receptor
and replaced with fresh 5ml distilled water.The 5 ml
withdrawn sample was made up to 25 ml with distilled
and the absorbance was recorded at 280nm. The receptor
medium was magnetically stirred for uniform
distribution and was maintained at a temperature of 37°C
± 0.2°C .
Stability study
Stability studies for Diclofenac sodium gels were carried 20out as per ICH guidelines .
0 0The gel samples were stored at 25 C, 60% RH and 40 C,
70% RH, in stability chambers for a period of 6 months,
samples were drawn at regular interval for stability
analysis. At the end of 6 months assay was carried out to
find out if there is any interaction between the drug and
other ingredients of the formulation upon storage.
RESULTS AND DISCUSSION
1%w/w Diclofenac sodium gels were formulated using
two different polymers namely NaCMHPG and HPMC at
2.5% w/w and 5% w/w respectively. A 5% w/w
dispersion of HPMC containing 10% w/w humectant and
0.2% w/w of preservatives in water revealed a viscosity
of 1, 44,000 cps units when sheared at 5 rpm using
spindle-7 in Brookfield synchrolectric viscometer RVT
make, analog model in contrast to a value of 1,52,000 cps
units for a 2.5% w/w NaCMHPG dispersion of similar
composition when sheared under similar conditions.
From the rheological investigations, it is observed that
while HPMC gels have revealed only shear thinning
property, NaCMHPG gels have revealed both thixotropic
as well as pseudoplastic behavior. The rheological
behavior for the gel samples is depicted in fig 1. Further,
based on martin and co-worker’s equation, the 21rheological data are transposed to a linear plot by
construction of a log- log graph to obtain the value for
'N'. Such plots were constructed to know the influence of
drug, humectant and the preservative on variations in 'N'
value in the system. The NaCMHPG gels by virtue if its
higher intrinsic viscosity and improved interaction co-
efficient have revealed a higher value of 'N' compared to
HPMC gels. The log-log plot for NaCMHPG and HPMC
gels is shown in fig 2 .The N values for HPMC based gels
(gel-1) varied between 1.49 to 1.52, whereas, for
NaCMHPG based gels (gel-2), the value varied between
4.52 - 4.65. This is indicative of the fact that, the
contributions by the components towards the N values
are insignificant.
Gels prepared using NaCMHPG had a pH value 7.48
whereas HPMC based gels revealed a pH of 7.46. The
gels which have pH value in the range of 5.5 to 7.5 are
most ideal, as they near the pH of the skin and do not
cause irritation.
In-vitro release study for the drug across hairless albino
rat skin with NaCMHPG based gels revealed a % CDR of
25.66 while, HPMC based gels revealed a % CDR of 2220.80 at the end of 6 hrs .The drug release pattern is
depicted in fig 3. The release of drug from both the 23formulations followed zero-order kinetics . Stability
studies for gels revealed good physical stability, color and
consistency for the formulations. The drug content
remained the same as was seen in the gel formulations
before being subjected for the stability study.
CONCLUSION
A 1% w/w gel of Diclofenac sodium in a 5% w/w
dispersion of HPMC gel base revealed shear thinning
qualities only whereas, in a gel base of 2.5% w/w
NaCMHPG, both pseudoplastic as well as thixotropic
properties were observed. The NaCMHPG based
Diclofenac sodium gels with a higher 'N' value are
expected to have better ease of application. Further, better
speardability is expected in case of NaCMHPG based
gels. Since NaCMHPG in half the strength has displayed
better performance in respect to the drug release , in
contrast to HPMC based gels, it can be concluded that
NaCMHPG is a better gelling agent in the formulation of
Diclofenac gels.
ACKNOWLEDGEMENT
The authors wish to thank
(I) Messrs Juggat Pharma Pvt. Ltd, Kumbalagodu,
Bangalore for sponsoring gift sample of propylene oxide
(II) Bangalore Pharmaceutical Research Laboratories for
sponsoring gift sample of Diclofenac sodium.
(III)The Principal, Govt. College of Pharmacy for
permitting to avail the research facilities in the college.
312

Indian J.Pharm. Educ. Res. 44(4), Oct - Dec, 2010
Ingredients Gel-I Gel-II
Diclofenac sodium 1.0 gm 1.0 gm
HPMC 5.0 gm -
NaCMHPG - 2.5 gm
Propylene glycol 10 gm 10 gm
Methyl paraben 0.18 gm 0.18 gm
Propyl paraben 0.02 gm 0.02 gm
Purified water QS 100 gm 100 gm
Table-1: Composition of gels
Fig 1: Rheogram of HPMC gels (5% w/w) and
NaCMHPG gels (2.5% w/w) containing Drug (1% w/w),
Humectant (10% w/w) and preservative (0.2% w/w) .
Fig 2: Log Rheogram of HPMC gels (5% w/w) and
NaCMHPG gels (2.5% w/w) containing Drug (1% w/w),
Humectant (10% w/w) and preservative (0.2% w/w) )
Fig 3: Comparative in-vitro release studies of Diclofenac
gels formulated using NaCMHPG and HPMC
% d
rug
reta
ined
in
the
gel
Comparative Release Rate Profile for Diclofenac Sodium from Gel I and Gel II Prepared using NaCMHPG and HPMC
313
Indian J.Pharm. Educ. Res. 44(4), Oct - Dec, 2010
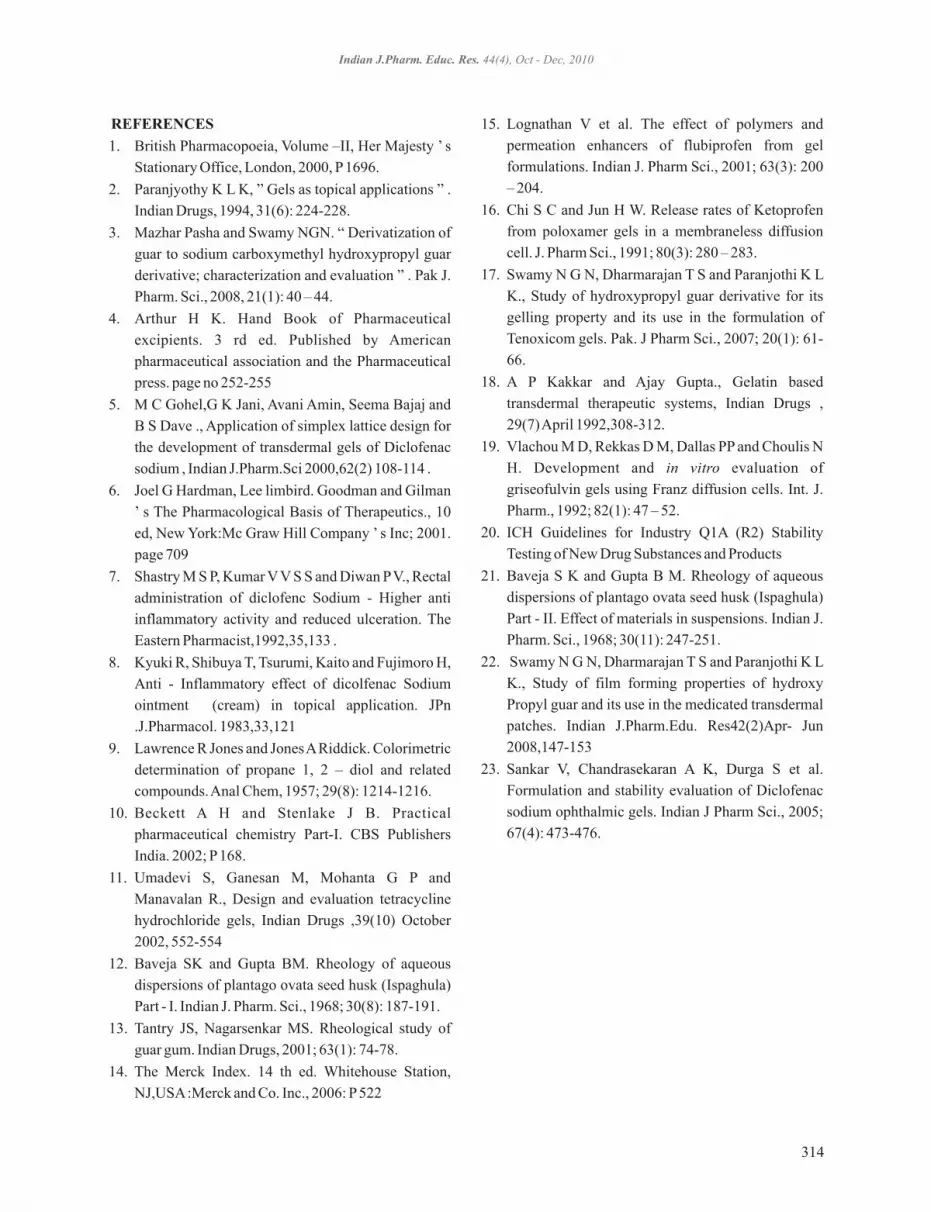
REFERENCES
1. British Pharmacopoeia, Volume –II, Her Majesty ’ s
Stationary Office, London, 2000, P 1696.
2. Paranjyothy K L K, ” Gels as topical applications ” .
Indian Drugs, 1994, 31(6): 224-228.
3. Mazhar Pasha and Swamy NGN. “ Derivatization of
guar to sodium carboxymethyl hydroxypropyl guar
derivative; characterization and evaluation ” . Pak J.
Pharm. Sci., 2008, 21(1): 40 – 44.
4. Arthur H K. Hand Book of Pharmaceutical
excipients. 3 rd ed. Published by American
pharmaceutical association and the Pharmaceutical
press. page no 252-255
5. M C Gohel,G K Jani, Avani Amin, Seema Bajaj and
B S Dave ., Application of simplex lattice design for
the development of transdermal gels of Diclofenac
sodium , Indian J.Pharm.Sci 2000,62(2) 108-114 .
6. Joel G Hardman, Lee limbird. Goodman and Gilman
’ s The Pharmacological Basis of Therapeutics., 10
ed, New York:Mc Graw Hill Company ’ s Inc; 2001.
page 709
7. Shastry M S P, Kumar V V S S and Diwan P V., Rectal
administration of diclofenc Sodium - Higher anti
inflammatory activity and reduced ulceration. The
Eastern Pharmacist,1992,35,133 .
8. Kyuki R, Shibuya T, Tsurumi, Kaito and Fujimoro H,
Anti - Inflammatory effect of dicolfenac Sodium
ointment (cream) in topical application. JPn
.J.Pharmacol. 1983,33,121
9. Lawrence R Jones and Jones A Riddick. Colorimetric
determination of propane 1, 2 – diol and related
compounds. Anal Chem, 1957; 29(8): 1214-1216.
10. Beckett A H and Stenlake J B. Practical
pharmaceutical chemistry Part-I. CBS Publishers
India. 2002; P 168.
11. Umadevi S, Ganesan M, Mohanta G P and
Manavalan R., Design and evaluation tetracycline
hydrochloride gels, Indian Drugs ,39(10) October
2002, 552-554
12. Baveja SK and Gupta BM. Rheology of aqueous
dispersions of plantago ovata seed husk (Ispaghula)
Part - I. Indian J. Pharm. Sci., 1968; 30(8): 187-191.
13. Tantry JS, Nagarsenkar MS. Rheological study of
guar gum. Indian Drugs, 2001; 63(1): 74-78.
14. The Merck Index. 14 th ed. Whitehouse Station,
NJ,USA :Merck and Co. Inc., 2006: P 522
15. Lognathan V et al. The effect of polymers and
permeation enhancers of flubiprofen from gel
formulations. Indian J. Pharm Sci., 2001; 63(3): 200
– 204.
16. Chi S C and Jun H W. Release rates of Ketoprofen
from poloxamer gels in a membraneless diffusion
cell. J. Pharm Sci., 1991; 80(3): 280 – 283.
17. Swamy N G N, Dharmarajan T S and Paranjothi K L
K., Study of hydroxypropyl guar derivative for its
gelling property and its use in the formulation of
Tenoxicom gels. Pak. J Pharm Sci., 2007; 20(1): 61-
66.
18. A P Kakkar and Ajay Gupta., Gelatin based
transdermal therapeutic systems, Indian Drugs ,
29(7) April 1992,308-312.
19. Vlachou M D, Rekkas D M, Dallas PP and Choulis N
H. Development and in vitro evaluation of
griseofulvin gels using Franz diffusion cells. Int. J.
Pharm., 1992; 82(1): 47 – 52.
20. ICH Guidelines for Industry Q1A (R2) Stability
Testing of New Drug Substances and Products
21. Baveja S K and Gupta B M. Rheology of aqueous
dispersions of plantago ovata seed husk (Ispaghula)
Part - II. Effect of materials in suspensions. Indian J.
Pharm. Sci., 1968; 30(11): 247-251.
22. Swamy N G N, Dharmarajan T S and Paranjothi K L
K., Study of film forming properties of hydroxy
Propyl guar and its use in the medicated transdermal
patches. Indian J.Pharm.Edu. Res42(2)Apr- Jun
2008,147-153
23. Sankar V, Chandrasekaran A K, Durga S et al.
Formulation and stability evaluation of Diclofenac
sodium ophthalmic gels. Indian J Pharm Sci., 2005;
67(4): 473-476.
314

Abstract
Buccal delivery is considered to be an important alternative to the peroral route for the systemic administration of
drugs. Losartan potassium is an angiotensin II receptor antagonist with an oral bioavailability of only 33% due to
extensive first pass metabolism. Mucoadhesive buccal films of losartan potassium were prepared using
hydroxypropyl methyl cellulose (HPMC) and retardant polymers ethyl cellulose (EC) or eudragit RS 100. Thermal
analysis by DSC of formulations show no interaction between drug and polymers. Ex vivo permeation studies of
losartan potassium solution through porcine buccal mucosa showed 90.2 % absorption at the end of 2 hours. The
films were subjected to physical investigations such as uniformity of thickness, weight, drug content, folding
endurance, tensile strength, elongation at break, surface pH and mucoadhesive strength. Films were flexible and
those formulated from EC were smooth whereas those prepared from Eudragit were slightly rough in texture. The
mucoadhesive force, swelling index, tensile strength and percentage elongation at break was higher for those
formulations containing higher percentage of HPMC. In vitro drug release studies reveal that all films exhibited
sustained release in the range of 90.10 to 97.40 % for a period of 6 hours. The data was subjected to kinetic analysis
which indicated non fickian diffusion for all formulations except E2. Ex vivo permeation studies through porcine
buccal mucosa indicate that films containing higher percentage of the mucoadhesive polymer HPMC showed slower
permeation of the drug for 6-7 hours.
Keywords: Losartan, eudragit, ethyl cellulose, buccal mucosa
Indian J.Pharm. Educ. Res. 44(4), Oct - Dec, 2010
INTRODUCTION
Buccal drug delivery has lately become an important
route of drug administration. The rich vascularization of
the oral mucosa and its permeability to many drugs
makes this route an attractive alternative to the oral and
parenteral routes for systemic drug delivery. Absorption
of therapeutic agents from the oral mucosa overcomes
premature drug degradation due to enzyme activity and
pH of the gastrointestinal tract, avoids active drug loss
due to first-pass hepatic metabolism and therapeutic
plasma concentration of the drug can be rapidly 1achieved . The buccal mucosa permits a prolonged
retention of a dosage form especially with the use of
mucoadhesive polymers without much interference in
activities such as speech or mastication unlike the sub-2lingual route . Various bioadhesive mucosal dosage
forms have been developed which include tablets, gels,
patches and films all of which make use of polymers such
as carbopols, hydroxy propyl methyl cellulose etc. that
prolong the residence time of the dosage form. A few
examples of such formulated dosage forms by various
investigators are shown in Table 1. Mucoadhesive buccal
films or patches are preferred in terms of flexibility,
comfort, patient compliance and better adhesion of the 8system to the oral mucosa . The antihypertensive,
Losartan potassium is an angiotensin II receptor (type
AT ) antagonist, orally active and undergoes substantial 1
first-pass metabolism by cytochrome P450 enzymes. The
terminal half-life of losartan is about 2 h. The drug is
orally administered as 25 mg tablets once or twice daily
with total daily doses ranging from 25 to 100 mg.
Following oral administration, losartan is well absorbed
(based on absorption of radiolabeled losartan) and
undergoes substantial first-pass metabolism; the
systemic bioavailability of losartan is approximately 933% . In view of these facts, this drug can be considered
Indian Journal of Pharmaceutical Education and ResearchReceived on 29/9/2009; Modified on 21/1/2010Accepted on 23/7/2010 © APTI All rights reserved
Mucoadhesive films of Losartan Potassium for Buccal delivery:
Design and Characterization
Marina Koland*, R.N. Charyulu and Prabhakara PrabhuNitte Gulabi Shetty Memorial Institute of Pharmaceutical Sciences, Derelakatte, Mangalore,
Karnataka-574160
*Author for Correspondence: [email protected]
315

as a suitable candidate for buccal delivery. In this study,
an attempt is made to investigate the feasibility of
mucoadhesive buccal films as a medium for the sustained
delivery of losartan potassium with better bioavailability.
MATERIALS AND METHODS
Losartan Potassium was generously gifted to us by Sun
Pharmaceutical Industries Ltd. Vapi, Gujarat. Ethyl
cellulose and HPMC were procured from Merck India
Ltd., Mumbai. Organic solvents used were of analytical
grade and other chemicals of Laboratory grade.
Preparation of Polymeric films of Ethyl cellulose (EC)
and Hydroxypropylmethyl cellulose (HPMC):
Films were prepared by the solvent casting method
using EC and HPMC in the ratios of 1:0.5, 1:1 and 0.5: 1.
Higher levels of EC gave films which could not be
removed from the Petri dish. Propylene glycol was used
as the plasticizer. Losartan potassium was dissolved in 10
ml of ethanol. EC was then added to this solution and
stirred till dissolved. To this solution, 8 ml of
dichloromethane was added, followed by the HPMC. The
mixture was constantly stirred on a magnetic stirrer until
the polymers had completely gone into solution and a
clear gel was obtained. Propylene glycol was mixed and
the volume was adjusted to 20 ml with alcohol. The
vessel was closed and kept aside for a few hours until all
the entrapped air had escaped. The solution was then cast
into a glass Petri dish of 9 cm diameter and allowed to dry
overnight at room temperature. The films were removed
carefully and circular patches of 15mm diameter were
punched out so that each patch contained 10 mg of the
drug. The samples were packed in aluminum foil and
stored in a glass container maintained at room
temperature and 58% relative humidity. This condition
maintained the integrity and elasticity of the patches.
Preparation of Polymeric films of Eudragit RSPO
and HPMC:
Films were prepared as above but using Eudragit RSPO
in the place of EC. The composition of various films is
shown in Table 2.
Evaluation of prepared buccal films:
Uniformity of weight:
The individual weight each of 10 samples of each
formulation was determined. The average weight was
calculated.
Thickness:
The thickness of each of 10 patches of each type of
formulation was measured using a micrometer screw
gauge and the average was determined as shown in Table
3. Surface pH:
The surface pH of the films was determined in order to
investigate the possible side effects due to change in pH
in vivo, since an acidic or alkaline pH may cause irritation
to the buccal mucosa. The film to be tested was placed in a
Petri dish and was moistened with 0.5 ml of distilled
water and kept for 1 h. The pH was noted after bringing
the electrode of the pH meter in contact with the surface
of the formulation and allowing equilibrating for 1.0 10min . The average of three determinations for each
formulation is shown in Table 3.
Thermal Analysis:
The ethyl cellulose and eudragit films were subjected to
thermal analysis by Differential Scanning Calorimetry
(DSC) to confirm the absence of any interactions
between drug and excipients.
Folding Endurance:
The folding endurance was determined by repeatedly
folding one patch at the same place till it broke or folded
up to 300 times which is considered satisfactory to reveal
good film properties. The number of times the film could
be folded at the same place without breaking gives the 11value of the folding endurance .
Uniformity of drug content:
This parameter was determined by dissolving one patch
of 15 mm diameter designed to contain 10 mg of losartan
potassium by homogenization in a mixture of 5 ml ethyl
alcohol and 2ml of dichloromethane for 5 h with
occasional shaking and diluted to 50 ml with distilled
water. After filtration to remove insoluble residue, 1 ml of
the filtrate was diluted to 10 ml with simulated saliva of
pH 6.8. The absorbance was measured at 250 nm using an
UV spectrophotometer. The experiments were carried out
in triplicate for the films of all formulations and average
values were recorded as shown in Table1.
Measurement of Swelling Index:
The studies for Swelling Index of the films were
conducted in simulated salivary fluid of pH 6.8. The film 2 sample (surface area: 1.75 cm ) was weighed and placed
in a preweighed stainless steel wire sieve of
approximately 800 µm mesh. The mesh containing the
Indian J.Pharm. Educ. Res. 44(4), Oct - Dec, 2010
316

film sample was then submerged into 15 ml of the
simulated salivary medium contained in a porcelain dish.
At definite time intervals, the stainless steel mesh was
removed, excess moisture removed by carefully wiping
with absorbent tissue and reweighed. Increase in weight
of the film was determined at each time interval until a
constant weight was observed. The degree of swelling
was calculated using the formula:
S.I = (w -w )/w t 0 0
Where S.I is the Swelling Index, w is the weight of film at t
8time t and w is the weight of the film at time 0 .0
Measurement of bioadhesive strength:
Satisfactory bioadhesion is essential for successful
application of bioadhesive drug delivery systems in order
to increase the residence time at the site of application and
hence to provide the prolonged release of the drug. The
tensile strength required to detach the bioadhesive patch
from the mucosal surface was applied as a measure of the
bioadhesive performance. Several techniques have been
reported in literature for measurement of bioadhesive
strength. In the present work a specially fabricated
assembly based on published literature was used. Porcine
cheek pouch was used as the model surface for
bioadhesion testing. After the cheek pouch was excised
and trimmed evenly, it was then washed in simulated
salivary fluid and then used immediately.
Fabrication of the test assembly: The working of a
double beam physical balance formed the basis of the
bioadhesion test assembly. The left pan was removed and
hung with a stainless steel chain. A Teflon block with 1.5
in height and 1.5 in diameter was hung with the stainless
steel chain to balance the weight of the other pan. The
height of the total set up was adjusted to accommodate a
glass container or beaker below it leaving a head space of
about 0.5 cm in between. Another Teflon block of 2 in
height and 1.5 in diameter was kept inside the glass
vessel, which was then positioned below the top hung
Teflon block. Suitable weights were added (15.0 g) on the 11right pan to balance the beam of the balance .
Method: The porcine cheek membrane was attached
with the mucosal side upward onto the lower Teflon block
which was then placed in the glass vessel. Sufficient
simulated salivary fluid was filled into the beaker so that
the surface of the fluid just touches the mucosal surface to
keep it moist. The beaker was positioned below the upper
Indian J.Pharm. Educ. Res. 44(4), Oct - Dec, 2010
Teflon block. The film under test was fixed to the surface
of the upper block with glue. The 15.0 g weight on the
right pan was removed and this lowers the upper Teflon
block with film, so that it is in contact with mucosal
surface. A load of 20.0 g was placed as initial pressure on
the upper block for 3 min. Slowly weights were added
onto the right pan starting from 500 mg at 30 s time
intervals. The total weight at which detachment of the
film from the mucosal surface takes place is noted and the
bioadhesion force was calculated per unit area of the
patch as follows:
F = (W x g)/Aw
2Where F is the bioadhesion force (kg/m/s ), W is the w
mass applied (g), g is the acceleration due to gravity 2 2(cm/s ) and A is the surface area of the patch (cm ). The
results are tabulated in Table 3 for all formulations.
Tensile Strength Measurement:
This mechanical property was evaluated using Instron
universal testing instrument (Model 1121, Instron Ltd.,
Japan, NITK, Suratkal) with a 5-kilogram load cell. Film
strips in special dimension and free from air bubbles or
physical imperfections were held between two clamps
positioned at a distance of 3 cm. During measurement,
the strips were pulled by the top clamp at a rate of 100
mm/m; the force and elongation were measured when the
film broke. Results from film samples, which broke at
and not between the clamps, were not included in the
calculations. Measurements were run in triplicate for
each film.
Two mechanical properties, namely, tensile strength and
% elongation were computed for the evaluation of the
film. Tensile strength is the maximum stress applied to a
point at which the film specimen breaks and can be
computed from the applied load at rupture as a mean of
three measurements and cross sectional area of fractured 8film as described from the following equation .
Tensile strength =Force at break (N)
2Initial cross sectional area of the sample (mm )
Percent elongation can be obtained from the following
equation
%Elongation at break= Increase in length
Original length× 100
Values for tensile strength and percentage elongation for
all formulations are shown in Table 3.
317

Indian J.Pharm. Educ. Res. 44(4), Oct - Dec, 2010
Ex vivo mucoadhesion time:
The ex vivo mucoadhesive time was performed by
application of the film on freshly cut porcine buccal
mucosa. The porcine tissues were fixed on the internal
side of a beaker with cyano acrylate glue. The film was
wetted with 50 µl of simulated saliva fluid and was pasted
to the porcine buccal tissue by applying a light force with
a finger tip for 20 s. The beaker was filled with 200 ml 0 simulated saliva fluid and kept at 37 C. After 2 minutes,
a 50 rpm stirring rate was applied to simulate the buccal
cavity environment and during the test, the time taken for
the film to completely erode or detach from the mucosa 5was observed as the ex vivo mucoadhesion time .
In vitro drug release studies:
In vitro release studies were carried out by a slight
modification of the method suggested by Ilango et al and
Perioli L., et al. A buccal film was attached to the wall of
the dissolution vessel such as a 250 ml beaker, midway
from the bottom with instant adhesive or cyanoacrylate
glue. After 2 min, the vessel was filled with 200 ml of
simulated saliva of pH 6.8 and placed on a magnetic
stirrer. The temperature of the dissolution medium was 5, 12maintained at 37 ± 0.5º C and stirred at 50 rpm .
Samples of 3ml were withdrawn at predetermined time
intervals and replaced with fresh medium. The samples
were filtered through 0.45µm Whatman filter paper and
after appropriate dilutions with simulated saliva were
assayed spectrophotometrically at 250 nm. Four film
samples of each formulation were subjected to drug
release studies in this manner and the average cumulative
percentage drug released was determined.
Ex Vivo Drug permeation studies:
Permeation studies were carried using the modified Franz
diffusion cell of internal diameter of 2.5 cm. porcine oral
mucosa was used as the model membrane. The buccal
pouch of the freshly sacrificed pig was procured from the
local slaughter house. The buccal mucosa was excised
and trimmed evenly from the sides and then washed in
isotonic phosphate buffer of pH 6.6 and used
immediately. The membrane was stabilized before
mounting in order to remove the soluble components.
The mucosa was mounted between the donor and
receptor compartments. The receptor compartment was
filled with 200 ml of isotonic phophate buffer of pH 7.4
which was maintained at 37 ± 0.2º C and the
hydrodynamics were maintained by stirring with a 13, 14magnetic bead at 50 rpm .
Permeation of losartan potassium from aqueous
solution:
Before the film formulations are actually subjected to ex
vivo buccal permeation studies, it was considered
necessary to determine whether losartan potassium was
able to penetrate the buccal mucosa at all and what would
be the extent of permeation. For this study, the drug in the
most available form, i.e. an aqueous solution (10 mg in
5ml of simulated saliva) was placed in the donor
compartment. At predetermined time intervals, a 1ml
sample was withdrawn and analysed using an UV
spectrophotometer at λ of 250 nm. The experiments max
were performed in triplicate and the profile is shown in
Figure 3.
Permeation of losartan potassium from formulated
films:
Since the percentage of drug permeated from solution is
appreciable. It can be concluded that losartan potassium
does have sufficient buccal permeability and is therefore
suitable for further study from film formulations. The
patch was placed in intimate contact with the mucosal
surface of the membrane that was previously moistened
with a few drops of simulated saliva. The donor
compartment was filled with 1 ml of simulated saliva of
pH 6.8. The fluid in the receptor compartment was
replaced with fresh medium and the experiment was
conducted as described above.
RESULTS AND DISCUSSION
Preparation of film formulations:
All the film formulations containing EC or Eudragit
RSPO as the retardant polymer and HPMC as the
mucoadhesive polymer with propylene glycol as
plasticizer were readily prepared by solvent casting. A
solvent mixture of ethanol and dichloromethane was
required to keep both polymers in solution. Films with
higher percentage of EC or the Eudragit could not be
prepared since they could not be removed easily from the
Petri dish in which they were cast and tended to fragment.
Evaluation of Prepared Films:
From the results of the tests for physical characterization
conducted, it is observed that the weight and thickness of
all film samples was uniform within each formulation.
Films formulated from EC were smooth whereas those
318
prepared from Eudragit were slightly rough in texture. All
films were translucent and flexible. All film formulations
exhibited good folding endurance exceeding 300,
indicating that they are tough and flexible.
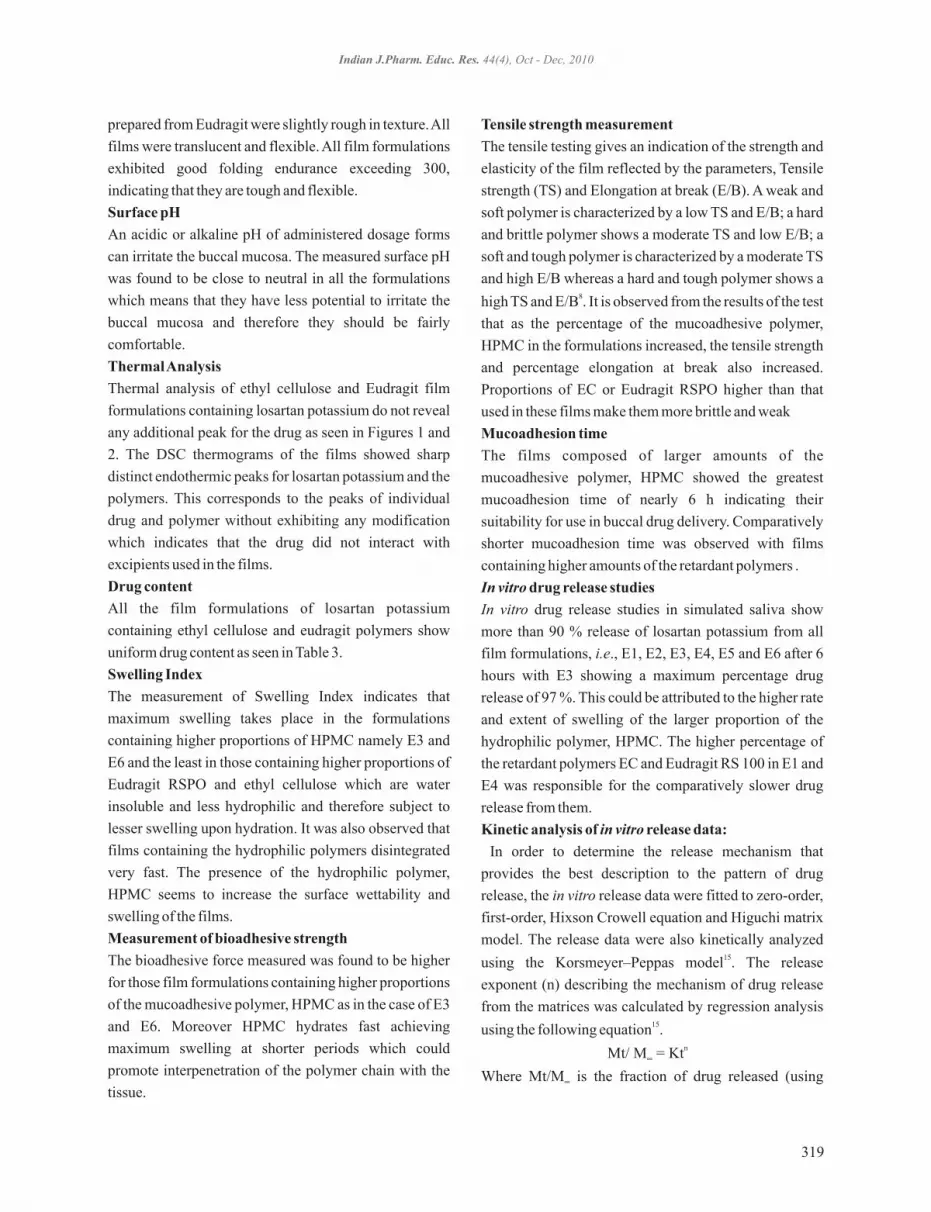
Surface pH
An acidic or alkaline pH of administered dosage forms
can irritate the buccal mucosa. The measured surface pH
was found to be close to neutral in all the formulations
which means that they have less potential to irritate the
buccal mucosa and therefore they should be fairly
comfortable.
Thermal Analysis
Thermal analysis of ethyl cellulose and Eudragit film
formulations containing losartan potassium do not reveal
any additional peak for the drug as seen in Figures 1 and
2.
indicates that the drug did not interact with
excipients used in the films.
Drug content
All the film formulations of losartan potassium
containing ethyl cellulose and eudragit polymers show
uniform drug content as seen in Table 3.
Swelling Index
The measurement of Swelling Index indicates that
maximum swelling takes place in the formulations
containing higher proportions of HPMC namely E3 and
E6 and the least in those containing higher proportions of
Eudragit RSPO and ethyl cellulose which are water
insoluble and less hydrophilic and therefore subject to
lesser swelling upon hydration. It was also observed that
films containing the hydrophilic polymers disintegrated
very fast. The presence of the hydrophilic polymer,
HPMC seems to increase the surface wettability and
swelling of the films.
Measurement of bioadhesive strength
The bioadhesive force measured was found to be higher
for those film formulations containing higher proportions
of the mucoadhesive polymer, HPMC as in the case of E3
and E6. Moreover HPMC hydrates fast achieving
maximum swelling at shorter periods which could
promote interpenetration of the polymer chain with the
tissue.
The DSC thermograms of the films showed sharp
distinct endothermic peaks for losartan potassium and the
polymers. This corresponds to the peaks of individual
drug and polymer without exhibiting any modification
which
Tensile strength measurement
The tensile testing gives an indication of the strength and
elasticity of the film reflected by the parameters, Tensile
strength (TS) and Elongation at break (E/B). A weak and
soft polymer is characterized by a low TS and E/B; a hard
and brittle polymer shows a moderate TS and low E/B; a
soft and tough polymer is characterized by a moderate TS
and high E/B whereas a hard and tough polymer shows a 8high TS and E/B . It is observed from the results of the test
that as the percentage of the mucoadhesive polymer,
HPMC in the formulations increased, the tensile strength
and percentage elongation at break also increased.
Proportions of EC or Eudragit RSPO higher than that
used in these films make them more brittle and weak
Mucoadhesion time
The films composed of larger amounts of the
mucoadhesive polymer, HPMC showed the greatest
mucoadhesion time of nearly 6 h indicating their
suitability for use in buccal drug delivery. Comparatively
shorter mucoadhesion time was observed with films
containing higher amounts of the retardant polymers .
In vitro drug release studies
In vitro drug release studies in simulated saliva show
more than 90 % release of losartan potassium from all
film formulations, i.e., E1, E2, E3, E4, E5 and E6 after 6
hours with E3 showing a maximum percentage drug
release of 97 %. This could be attributed to the higher rate
and extent of swelling of the larger proportion of the
hydrophilic polymer, HPMC. The higher percentage of
the retardant polymers EC and Eudragit RS 100 in E1 and
E4 was responsible for the comparatively slower drug
release from them.
Kinetic analysis of in vitro release data:
In order to determine the release mechanism that
provides the best description to the pattern of drug
release, the in vitro release data were fitted to zero-order,
first-order, Hixson Crowell equation and Higuchi matrix
model. The release data were also kinetically analyzed 15using the Korsmeyer–Peppas model . The release
exponent (n) describing the mechanism of drug release
from the matrices was calculated by regression analysis 15using the following equation .
Where Mt/M is the fraction of drug released (using ∞
nMt/ M = Kt∞
Indian J.Pharm. Educ. Res. 44(4), Oct - Dec, 2010
319

Indian J.Pharm. Educ. Res. 44(4), Oct - Dec, 2010
showed nearly 90% permeation in less than 2 h,
indicating the suitability of formulating losartan
potassium for buccal delivery. Ex vivo permeation studies
of losartan potassium from the film formulations indicate
slow and sustained permeation of the drug for 6-7 h as
seen in Figure 6. The rank order of drug permeation from
films was found to be E4>E1>E5>E2>E3>E6.
CONCLUSION
This investigation shows that it is possible to formulate
mucoadhesive films of losartan potassium with the
intention of obtaining better therapeutic efficiency by
controlling drug release thereby improving patient
compliance and increasing bioavailability with
decreased dosing and fewer side effects. The use of
retardant polymers succeeded in delaying drug release,
however higher percentage of these tended to decrease
the mucoadhesive properties. Ex vivo permeation studies
through porcine buccal mucosa revealed the possibility
of permeation through human oral mucosa also.
ACKNOWLWDGEMENTS
The authors would like thank the Nitte University,
Mangalore and the National Institute of Technology,
Karnataka for providing the necessary facilities for
carrying out this investigation.
values of M/M within the range 0.10–0.60) at time t and ∞
K is a constant incorporating the structural and geometric
characteristics of the release device. A value of n=0. 5
indicates case I (Fickian) diffusion, 0.5<n<1 indicates
anomalous (non-Fickian) diffusion, and n=1 indicates
case II transport (Zero order release), n>1 indicates Super
case II transport. From the mathematical treatment of the
in vitro release data of losartan potassium from buccal 2films, the values of K, n and R (coefficient of
determination) has been obtained as presented in Table 5.
The values of n were obtained by the linear regression of
log (Mt/M ) vs. log t and were between 0.5 to 1 indicating ∞
non fickian diffusion or anomalous transport for
formulations E1, E2, E5 and E6. In the case of E3 and E4,
values of n close to 0.5 were obtained indicating possible
fickian diffusion as the release mechanism. The best fit 2with the highest correlation r and determination R
coefficients was shown by Korsmeyer and Peppas model
closely followed by the Higuchi matrix model and then
the first order equation and the Hixson-Crowell equation.
All the formulations follow Peppas model, except E2
whose drug release conforms to matrix model.
Ex vivo drug permeation studies:
Drug permeation studies through porcine buccal mucosa
conducted on the aqueous solution of the pure drug
S.No Mucoadhesive dosage form Drug Polymers used 31. Tablet Propranolol Hydrochloride Sodium CMC,
Carbopol 934 42 Tablet Nicotine HPMC K 4M, Sodium-
Alginate, Carbopol 934 53 Film Ibuprofen PVP, Sodium CMC
64 Film Glibenclamide Chitosan 7 5 Gel Triamcinolone acetonide Carbopol 934,
Poloxamer 407
Table 1. Drugs and use of polymers in mucoadhesive dosage forms reported in literature.
Ingredients in g. E1 E2 E3 E4 E5 E6
Losartan potassium 0.36 0.36 0.36 0.36 0.36 0.36
Ethyl cellulose 0.5 0.5 0.25 --- --- ---
Eudragit RSPO --- --- --- 0.5 0.5 0.25
Hydroxypropylmethyl cellulose 0.25 0.5 0.75 0.25 0.5 0.75
Propylene glycol 1.0 1.0 1.0 1.0 1.0 1.0
Table 2. Composition of drug loaded films
320
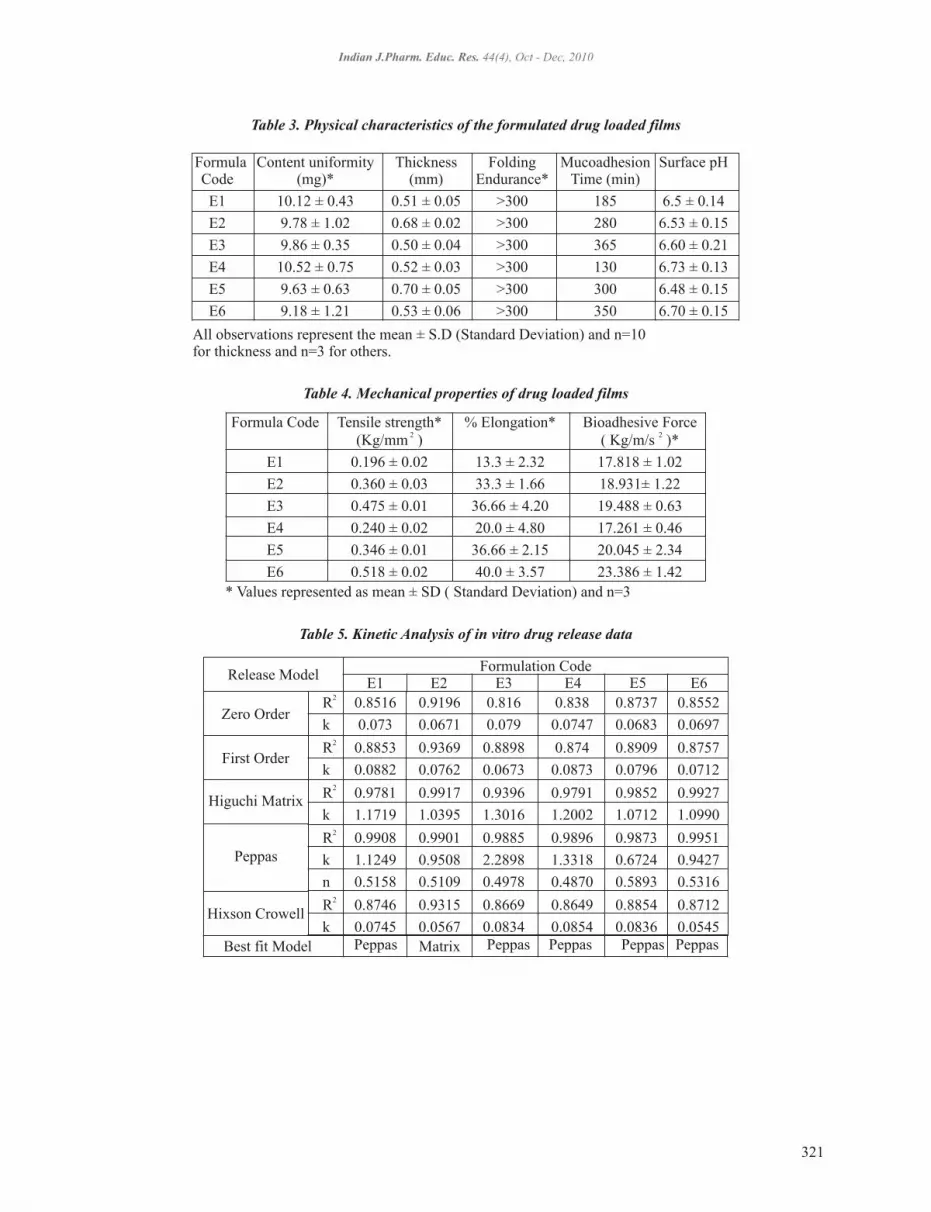
Indian J.Pharm. Educ. Res. 44(4), Oct - Dec, 2010
Formula Content uniformity Thickness Folding Mucoadhesion Surface pHCode (mg)* (mm) Endurance* Time (min)
E1 10.12 ± 0.43 0.51 ± 0.05 >300 185 6.5 ± 0.14
E2 9.78 ± 1.02 0.68 ± 0.02 >300 280 6.53 ± 0.15
E3 9.86 ± 0.35 0.50 ± 0.04 >300 365 6.60 ± 0.21
E4 10.52 ± 0.75 0.52 ± 0.03 >300 130 6.73 ± 0.13
E5 9.63 ± 0.63 0.70 ± 0.05 >300 300 6.48 ± 0.15
E6 9.18 ± 1.21 0.53 ± 0.06 >300 350 6.70 ± 0.15
Table 3. Physical characteristics of the formulated drug loaded films
All observations represent the mean ± S.D (Standard Deviation) and n=10 for thickness and n=3 for others.
Formula Code Tensile strength* % Elongation* Bioadhesive Force 2 2(Kg/mm ) ( Kg/m/s )*
E1 0.196 ± 0.02 13.3 ± 2.32 17.818 ± 1.02
E2 0.360 ± 0.03 33.3 ± 1.66 18.931± 1.22
E3 0.475 ± 0.01 36.66 ± 4.20 19.488 ± 0.63
E4 0.240 ± 0.02 20.0 ± 4.80 17.261 ± 0.46
E5 0.346 ± 0.01 36.66 ± 2.15 20.045 ± 2.34
E6 0.518 ± 0.02 40.0 ± 3.57 23.386 ± 1.42
Table 4. Mechanical properties of drug loaded films
* Values represented as mean ± SD ( Standard Deviation) and n=3
2 R 0.8516 0.9196 0.816 0.838 0.8737 0.8552
k 0.073 0.0671 0.079 0.0747 0.0683 0.0697 2R 0.8853 0.9369 0.8898 0.874 0.8909 0.8757
k 0.0882 0.0762 0.0673 0.0873 0.0796 0.0712 2R 0.9781 0.9917 0.9396 0.9791 0.9852 0.9927
k 1.1719 1.0395 1.3016 1.2002 1.0712 1.0990 2 R 0.9908 0.9901 0.9885 0.9896 0.9873 0.9951
k 1.1249 0.9508 2.2898 1.3318 0.6724 0.9427
n 0.5158 0.5109 0.4978 0.4870 0.5893 0.5316 2R 0.8746 0.9315 0.8669 0.8649 0.8854 0.8712
k 0.0745 0.0567 0.0834 0.0854 0.0836 0.0545
E1 E2 E3 E4 E5 E6Formulation Code
Zero Order
First Order
Higuchi Matrix
Peppas
Hixson Crowell
Best fit Model Peppas Matrix Peppas Peppas Peppas Peppas
Release Model
Table 5. Kinetic Analysis of in vitro drug release data
321

Fig. 1: DSC curves of film formulation E3,
ethyl cellulose, HPMC and Losartan potassium
Fig. 2: DSC curves of film E6, Eudragit RSPO,
HPMC and Losartan potassium
Fig 3: Swelling profile of different film
formulations in simulated saliva
Fig. 4: In vitro release profile of Losartan potassium in simulated saliva
Indian J.Pharm. Educ. Res. 44(4), Oct - Dec, 2010
322

Fig.5: Ex vivo permeation profile of losartan
potassium from aqueous solution through
porcine buccal mucosa
Fig.6: Ex vivo drug permeation profile from
film formulations through porcine buccal mucosa
REFERENCES
1. Jian-Hwa G, Karsten C. Development of
Bioadhesive Buccal Patches. Swarbrick J,
Mathiowitz E, editors, Bioadhesive Drug Delivery
Systems: Fundamentals, Novel Approaches and
Development. Marcel Dekker Inc., 1999: 541-59.
2. Swarbrick J, Boylan JC, editors. Buccal Absorption
of Drugs. Encyclopedia of Pharmaceutical
Technology; Vol.2. Marcel Dekker Inc., 1990:189-
208.
3. Patel VM, Prajapati BG, Patel MM. Formulation,
Evaluation, and Comparison of Bilayered and
Multilayered Mucoadhesive Buccal Devices of
Propranolol Hydrochloride. AAPS PharmSciTech.
2007; 8(1): Article 22.
4. Lewis S, Subramanian G, Pandey S, Udupa N.
Design, evaluation and pharmacokinetic study of
mucoadhesive buccal tablets of nicotine for smoking
cessation. Indian J Pharm Sci 2006; 68: 829-31.
5. Perioli L, Ambrogi V, Angelici F, Ricci M,
Giovagnoli S, Capuccella M, Rossi C. Development
of mucoadhesive patches for buccal administration
of ibuprofen. J Control Rel 2004; 97: 269-79.
6. Manvi FV, Rajashree M, Chaitanya GY, Roopesh
K. Design and evaluation of mucoadhesive buccal
patches of glibenclamide. The Indian Pharmacist
2004; 27(3): 55-58.
7. Sang-Chul Shin, Ja-Young Kim. Enhanced
permeation of triamcinolone acetonide through the
buccal mucosa. Eur J Pharm Biopharm 2000; 50(2):
217-20
8. Peh KK, Wong CF. Polymeric fims as vehicles for
buccal delivery: Swelling, Mechanical and
Bioadhesive properties. J Pharm Pharmaceut Sci
1999; 2(2): 53-61
9. Martindale, The Extra Pharmacopoeia, 31st ed., The
Pharmaceutical Press, London 1996, p. 427-428.
10. Bottenberg P, Cleymaet R, Muynck CD, Remon JP,
Coomans SD, Michotte Y, Slop D. Development and
testing of bioadhesive and fluoride containing slow
release tablets for oral use. J Pharm Pharmacol 1991;
43: 457.
11. Nafee NA, Boraie NA, Ismail FA, Mortada LM.
Design and characterization of mucoadhesive
buccal patches containing Cetylpyridinium
chloride. Acta Pharm 2003; 53:199-212.
12. Ilango R, Kavimani S, Mullaicharam AR, Jayakar B.
In vitro studies on buccal strips of Glibenclamide
using Chitosan. Indian J Pharm Sci 1997; 59(5):
232-35.
13. Patel MV, Prajapati BG, Patel MM. Effect of
hydrophilic polymers on buccoadhesive Eudragit
patches of Propranolol hydrochloride using factorial
design. AAPS PharmSciTech 2007; 8(2) Article 45.
14. Chandra Sekhar K, Naidu KVS, Vamshi Vishnu Y,
Ramesh G, Kishan V, Madhusudan Rao Y.
Transbuccal delivery of chlorpheniramine maleate
from mucoadhesive buccal patches. Drug Delivery
2008; 15(3): 185-91.
15. Peppas NA, Analysis of Fickian and non Fickian
drug release from polymers, Pharm. Acta Helv.
60(1985) 110–111.
Indian J.Pharm. Educ. Res. 44(4), Oct - Dec, 2010
323

Abstract
Liposomal carriers, well known for their potential in topical drug delivery have been choosen to help fluconazole
molecules in the skin layers. In the present work statistical study for the formulation of liposomes for topical delivery
of fluconazole using the factorial design approach was undertaken. Amount of phospholipid (PL 90H) and
cholesterol (CH) were taken at three different levels and liposomes were prepared using film hydration technique.
Gels containing liposomes (optimized batch) were prepared in Carbopol® 934 NF and were characterized for
rheology, spreadability, permeation and drug deposition in the rat skin. Results of regression analysis revealed that
vesicle size and entrapment efficiency were dependant on the cholesterol and lipid concentration. Rheological studies
of all liposomal gels prepared with 1%, 1.5%, and 2% w/w carbopol gave a clear idea of concentration of carbopol
required. Liposomal dispersion and gels were found to increase the skin permeation and deposition compared to
control and marketed gel. Liposome dispersion and gel formulation were found to be stable for 60 days.
Key Words: Factorial design; fluconazole; liposomes; gels; topical
Indian J.Pharm. Educ. Res. 44(4), Oct - Dec, 2010
INTRODUCTION
Topical drug delivery is an attractive route for local and 1systemic treatment . The delivery of drugs onto the skin is
recognized as an effective means of therapy for local
dermatologic diseases. Fluconazole, a synthetic
antifungal agent, is a triazole derivative. It is used in the
treatment of oropharyngeal, esophageal, or vulvovaginal
candidiasis as well as other serious systemic candidal
infections. It is also effective against superficial fungal 2infections and dermatophytoses . Fluconazole is
available commercially as tablets and injections only in
spite of its well known adverse effects including nausea,
vomiting, bloating and abdominal discomfort. Oral
fluconazole cannot be taken in conjunction with a
number of medications. In order to bypass these
disadvantages, the liposomal gel formulations have been
proposed as topical application.
Liposomes are acceptable and superior carriers and have
ability to encapsulate hydrophilic and lipophilic drugs 3,4 and protect them from degradation . It also has affinity
to keratin of horny layer of skin and can penetrate deeper
into skin and hence give better absorption. In the
formulation of topical dosage forms, attempts are being
made to utilize drug carriers that ensure adequate
localization or penetration of drug within or through the
skin in order to enhance the local and minimize the
systemic effects or to ensure adequate percutaneous 5absorption . Applied on the skin, liposomes may act as a
solublizing matrix for poorly soluble drugs, penetration
enhancer as well as local depot at the same time
diminishing the side effects of these drugs. Topical
liposome formulations could be more effective and less 6 toxic than conventional formulations . Fluconazole was
7successfully incorporated by Singh et al (1993) into
multilamellar (MLV) and large unilamellar liposomes
(LUV). Hence liposomal carriers, well known for their
potential in topical drug delivery have been chosen to 7help fluconazole molecules in the skin layers . These
vesicles are also expected to provide lipid enriched
hydrating conditions to retain the drug molecules within
the dermal layers. With this objective fluconazole loaded
liposomal systems have been prepared and their topical
performance has been compared with non liposomal
systems containing fluconazole.Indian Journal of Pharmaceutical Education and ResearchReceived on 3/11/2009; Modified on 17/5/2010Accepted on 3/7/2010 © APTI All rights reserved
Formulation and Evaluation of Topical Liposomal Gel for Fluconazolea a a a,bB. V. Mitkari , S. A. Korde , K. R. Mahadik and C. R. Kokare *
aDepartment of Pharmaceutics, Bharati Vidyapeeth Deemed University, Poona College of Pharmacy,
Pune– 411038, India.bDepartment of Pharmaceutics, STES, Sinhgad Institute of Pharmacy, Narhe, Pune-411041, India
*Author for Correspondence: [email protected]
324

MATERIALS AND METHODS
Materials
Fluconazole (Glenmark Pharmaceutical Industries, Goa)
and saturated soy lecithin (PC; Phospholipon 90H) was a
generous gift from Nattermann phospholipids GmbH,
Germany. Cholesterol (CHOL), Stearic acid (SA) was
purchased from Qualigens Fine Chemicals, Mumbai,
India and Research Lab, Mumbai, India, respectively.
Marketed Flucos gel was procured from local market.
Carbopol® 934 NF (poly acrylic acid polymer) was gift
sample from Noveon, India. All other chemicals used
were of HPLC or analytical grade.
Liposome preparation
Aqueous liposomal formulations were prepared by 8,9conventional lipid film hydration method . Different
weight ratio of phospholipids: choleseterol and stearic
acid were weighed and dissolved in chloroform:
methanol mixture (2: 1 v/v) in 250 ml round bottom flask.
A thin film was formed on the inner side of round bottom
flask by evaporating organic solvent under vacuum in
rotary evaporator at 45-50 °C. Subsequently, the flask
was kept overnight under vacuum to ensure the complete
removal of residual solvent. The dry lipid film was
hydrated with 20 ml phosphate buffer solution (pH 7.4)
containing fluconazole at a temperature of 60±2 °C. The
dispersion was left undisturbed at room temperature for
2-3 h to allow complete swelling of the lipid film and
hence to obtain vesicular dispersion.
Effect of variables
To study the effect of variables on liposome performance
and characteristics, different batches were prepared using 2the 3 factorial design approach. Amount of PL 90H and
CH were selected as two independent variables. Vesicle
sizes, entrapment efficiency (EE) were selected as
dependent variables. Amount of SA (30 mg) and
fluconazole (30 mg) were kept constant. Values of all
variables and batch codes are shown in Table 1.
Size distribution
Prepared liposomal batches were monitored for their 10 morphological attributes using optical microscope .
Mean vesicle size and size distribution profile of
liposome was determined by using Malvern particle size
analyzer model SM 2000, which follows Mie's theory of
light scattering. Diluted liposome suspension was added
to the sample dispersion unit containing stirrer and stirred
at 2000 rpm in order to reduce the interparticle
aggregation, and laser obscuration range was maintained
between 10-20%. The average particle size was measured
after performing the experiment in triplicate.
Entrapment efficiency
Fluconazole associated with liposome was separated 11 from unentrapped drug using centrifugation method .
Liposomes were centrifuged at 20000 rpm for 1 h at ocontrolled temperature of 4 C. Supernatant containing
unentrapped fluconazole was withdrawn and measured
UV spectrophotometrically at 260 nm against phosphate
buffer saline (pH 7.4). The amount of fluconazole
entrapped in liposome was determined as follow
EE (%) = [(C -C )/C ] 100 (1)d f d
Where C is concentration detected of total fluconazole d
and C is concentration of free fluconazole. The f
entrapment efficiency was obtained by repeating the
experiment in triplicate and the values were expressed as
mean standard deviation.
Zeta potential ( ζ ) determination
Charge on empty and drug loaded vesicles surface was
determined using Zetasizer 300HSA (Malvern
Instruments, Malvern, UK). Analysis time was kept for
60 s and average zeta potential and charge on the
liposome was determined.
Skin permeation and drug deposition studies
Rat was sacrificed by exposing to excess chloroform. To
the abdominal skin, depilatory (Anne French, India) was
applied and kept for 10 m to remove the hair from the
skin. After 10 m of application, skin was washed with
water. Skin was excised from rat with scalpel and fatty
layer was removed by keeping the skin in warm water at 060 C. After 2 m, fatty layer was peeled off gently and skin
was washed with water and kept for saturation in
phosphate buffer saline pH 7.4 for about 30 m before it
was used for permeation studies. Fresh skin was used
every time. Skin permeation studies with fluconazole
containing liposome formulations were carried out using
abdominal rat skin, employing modified Franz-diffusion 12cells . The results obtained were compared with that of
non-liposomal formulations of fluconazole. The skin was
prepared by mounting on the receptor chamber with 2cross-sectional area of 3.91 cm exposed to the receptor
compartment. The receptor compartment was filled with
Indian J.Pharm. Educ. Res. 44(4), Oct - Dec, 2010
325
(22 ml) phosphate buffer pH 7.4. It was jacketed to 0maintain the temperature 37 + 0.5 C and was kept stirring
at 50 rpm. Prior to application of formulations, the skin
was allowed to equilibrate at this condition for 1 h.
Liposomal or non-liposomal fluconazole formulation
(amount equivalent to 5 mg of drug) was applied
uniformly on the dorsal side of skin. Aliquots of 2 ml
were withdrawn periodically and replaced with same
amount of saline solution to maintain the receptor phase
volume at a constant level. The samples were quantified
spectrophotometerically at a λ of 260 nm.max
For determination of drug deposited in skin, cell was
dismantled after a period of 8 h and skin was carefully
removed from the cell. The formulation applied on skin
surface was swabbed first with phosphate buffer pH 7.4
and then with methanol. The procedure was repeated
twice to ensure no traces of formulation are left onto skin
surface. The skin was then cut into small pieces and drug
present in skin was extracted in phosphate buffer pH 7.4
u s i n g b a t h s o n i c a t o r a n d d e t e r m i n e d
spectrophotometrically after suitable dilution and 2filtration .
Preparation of liposomal gel
On the basis of factorial design approach, liposome batch
(LPE) was selected for further formulation studies of 13 liposomal gel . Gel was prepared using carbopol® 934
NF (1, 1.5 and 2%). The appropriate quantity of carbopol
934 powder was dispersed into distilled water under
constant stirring with a glass rod, taking care to avoid the
formation of indispersible lumps and allowed to hydrate
for 24 h at room temperature for swelling. Topical
liposome gel formulations were prepared by
incorporation of liposome's containing fluconazole
(separated from the unentrapped drug) were mixed into
the carbopol gel with a mechanical stirrer (25 rpm, 2 m).
The dispersion was neutralized using triethanolamine
(0.5% w/w). Control gels were made under the same 14conditions .
Rheological studies
While considering the stable liposome dispersion or any
other delivery system they usually need to be
incorporated into convenient dosage for to obtain
formulation with desired semisolid consistency for ease
in topical and transdermal application. It is important and
controls the flow properties to ensure product quality and
Indian J.Pharm. Educ. Res. 44(4), Oct - Dec, 2010
15,16 effectiveness of the production . It helps in selection of
dermatological formulation that will progress to clinical
efficacy. In present study liposomal gels were prepared
using carbopol 934 as gelling agent.
Rheological analysis of liposome loaded carbopol gels
were performed using a stress control rheometer
(Viscotech Rheometer , Rheologica Instruments AB,
Lund, Sweden), equipped with stress rheologic basic
software, version 5, using cone-plate geometry with a
diameter of the cone being 25 mm and a cone angle of 10,
operating in the oscillation and static mode. Rheological
analysis was performed at room temperature. The
following parameters were carried out for rheology
measurement.
Oscillation stress sweep:
Dynamic oscillation stress sweep was performed to
determine the linear viscoelastic region (LVR). LVR is
the region where the elastic modulus (G') was
independent of applied stress because destruction in the 17 structure of gels occurs at high shear stress . Analysis of
viscoelastic material was designed not to destroy the
structure so that measurement can provide the
information about intermolecular and interparticle forces
in the material. This test gives idea about the critical stress
beyond which the sample may show significant structural
changes, and therefore the consequent choice of the stress
value to be used in other in other oscillation tests. The
samples were exposed to increasing stress (0.5 to 150 Pa)
at a constant frequency of 0.1 Hz.
The three main parameters determined in this test were
the storage modulus G', loss modulus G” and loss tangent
tan δ. The end point of the linear viscoelastic region was
determined as a stress, when the G' value was dropped
10% from the linear level that indicated a significant 18 change in the structure gel samples .
Oscillation frequency sweep:
The samples were exposed to stepwise increasing
frequency (0.1 to 100 Hz) at a constant stress in the field
of LVR and elastic moduli (G') as well as viscous 19 modulus (G?) were recorded against frequency .
Creep-recovery:
The creep recovery test was used to determine the
viscoelastic properties of the selected silk fibroin gel 20,21 samples . The samples were exposed to the selected
averaged stress of the stress sweep mode for 50 s. It was
326
followed by relaxation period for 100 s for recovery. The
creep compliance Jc (defined as the ratio of measured
strain to the applied stress) was monitored against time.
Drug content and content uniformity
The gel sample (100 mg) was withdrawn and drug
(fluconazole) content was determined using UV
spectrophotometer at 260 nm. Similarly, the content
uniformity was determined by analyzing drug
concentration in gel taken from 3 to 4 different points
from the container. In case of liposomal gel, it was shaken
with sufficient quantity of methanol to extract the drug
and then analyzed by using UV spectrophotometer at 260
nm.
Stability studies
The ability of vesicles to retain the drug (i.e., drug
retentive behavior) was assessed by keeping the
liposomal suspensions and liposomal gel at two different
temperature conditions, i.e., 4-8 °C (Refrigerator; RF),
25±2 °C (Room temperature; RT), for a period of 60 days.
Samples were withdrawn periodically and analyzed for
the drug content and particle size for liposomal
suspension and drug deposition for liposomal gel in the
manner described under entrapment efficiency and 22 particle size distribution studies .
RESULTS AND DISCUSSION
Amount of PL 90H and CH were found to be critical in
preparation and stabilization of liposomes and hence 2selected as variables in the 3 factorial designs (Table 1).
In a preformulation study the optimum concentrations of
PL 90H, CH, and SA were determined to obtain stable
liposomes devoid of aggregation, fusion and
sedimentation. The 30 mg of SA was found to be
optimum to prevent aggregation of liposomes.
Liposomes were prepared using film hydration technique
and method was found to be well suited for the production
of liposomes without aggregation. Responses of different
batches were obtained by using factorial design (Table 2).
Obtained data were subjected to multiple regression
analysis using PCP Disso v3\Factorial-3^2.xls" software
and obtained data were fitted in Eq. (2).
Y = β0 + βX1 + β2X2 + β11X1X1 + β22X2X2 +
β12X1X2 (2)
Effect of variables on particle size
The most important parameter, which needs to monitor
during liposome preparation its best performance, is the
vesicle size and size distribution of liposomes. From the
number of reports, it was observed that the size and size
distribution of the liposome determines their in vivo or
ex-vivo performance. There are some reports, which
showed the effect of liposome size on the drug release as 5well as drug deposition in the skin . Thus for the effective
delivery, the selected method should result in optimum
size range and homogeneous population. In the present
study, film hydration technique found to produce
polydispersity index of less than 0.893 indicates obtained
liposome population have narrow size distribution (Table
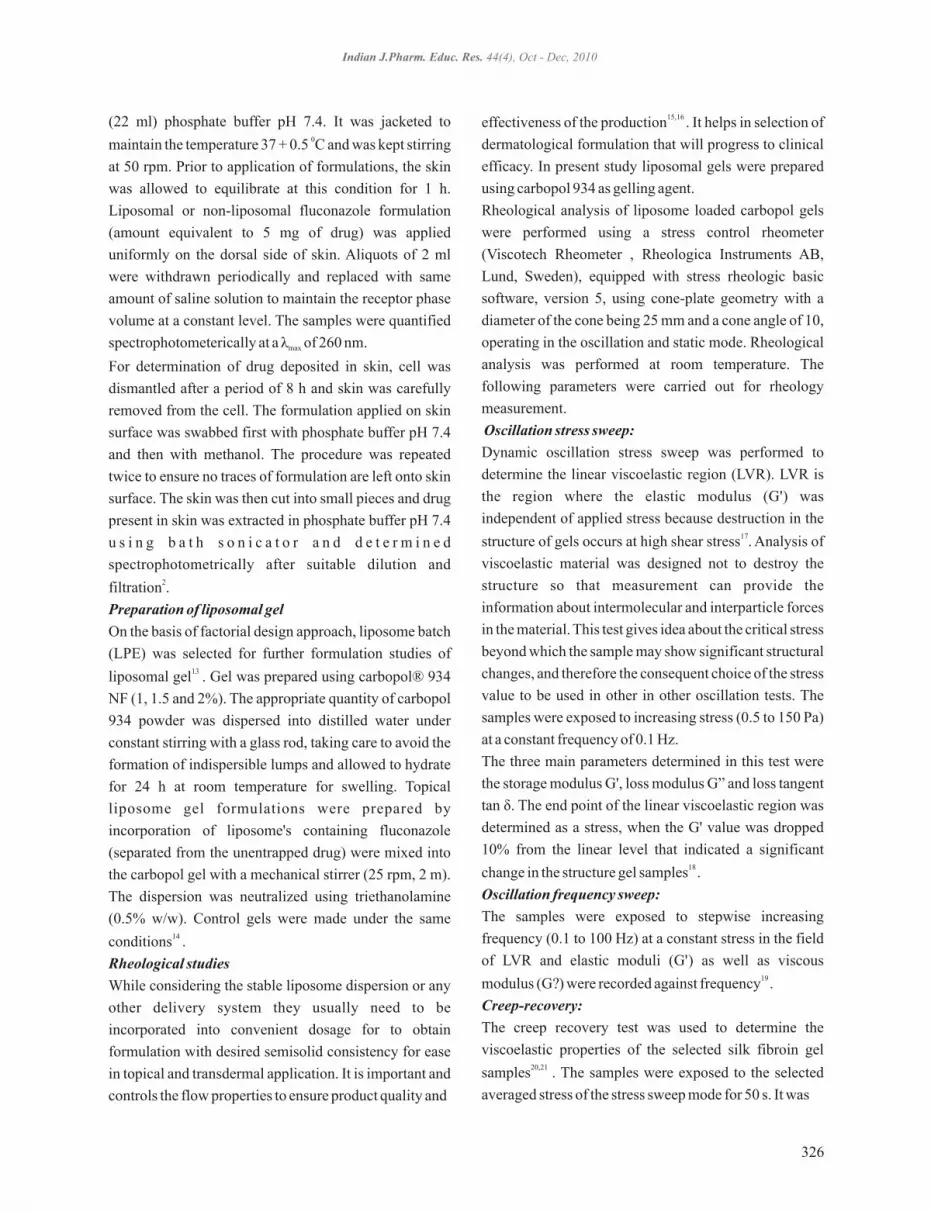
2). It was observed that the relative amount of PL 90H and
CH was found to play important role in vesicle size
(Fig.1). Size of vesicles found to be in the range of 3.01 to
7.32 m. To understand the effect of lipid concentration on
vesicle size, coefficient observed for liposome size fitted
in Eq. (3)
Y = 4.50 + 1.038 X + 1.028 X (3)1 2
A positive correlation was observed for the both variables
X (PL 90H) and X (CH) in case of liposome vesicle size 1 2
2(Eq. 3; r = 0.8356015) Thus, with increase in the .
concentration of PL 90H & CH vesicle size was found to
be increased. The coefficient value of both the variables
observed that the effect of PL 90H was slightly more
prominent than effect of CH.
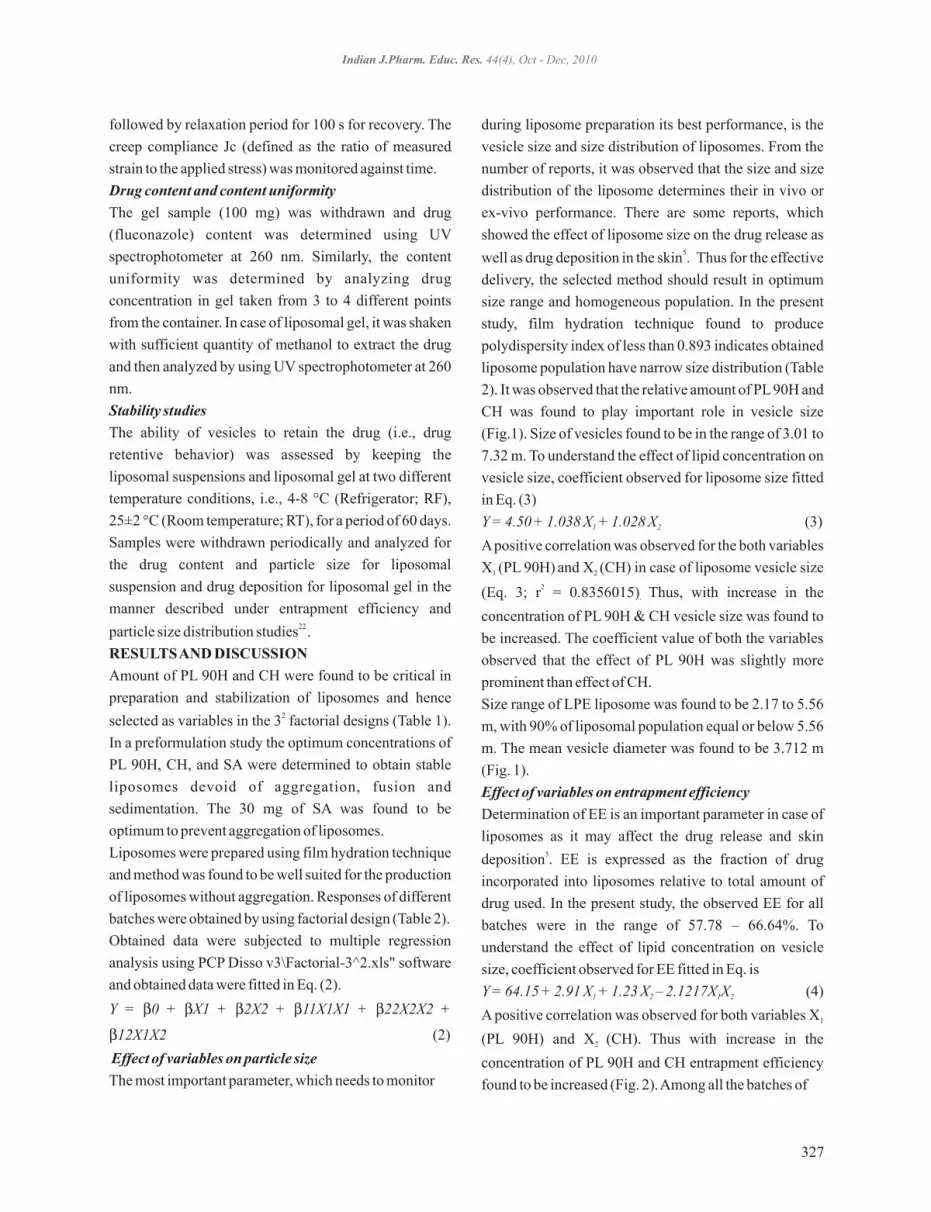
Size range of LPE liposome was found to be 2.17 to 5.56
m, with 90% of liposomal population equal or below 5.56
m. The mean vesicle diameter was found to be 3.712 m
(Fig. 1).
Effect of variables on entrapment efficiency
Determination of EE is an important parameter in case of
liposomes as it may affect the drug release and skin 5deposition . EE is expressed as the fraction of drug
incorporated into liposomes relative to total amount of
drug used. In the present study, the observed EE for all
batches were in the range of 57.78 – 66.64%. To
understand the effect of lipid concentration on vesicle
size, coefficient observed for EE fitted in Eq. is
Y = 64.15 + 2.91 X + 1.23 X – 2.1217X X (4)1 2 1 2
A positive correlation was observed for both variables X1
(PL 90H) and X (CH). Thus with increase in the 2
concentration of PL 90H and CH entrapment efficiency
found to be increased (Fig. 2). Among all the batches of
Indian J.Pharm. Educ. Res. 44(4), Oct - Dec, 2010
327

LPE, which had minimum vesicle size and intermediate
EE%, selected for the further study of gel formulation.
Small particle size liposomes can cover the skin surface
more compared to larger paricle size. Also, the
polydispersity index of LPI was higher compared to that
LPE which indicates wide particle size distribution,
which was not desirable. Hence, the batch with less
particle size and less polydispersity index was selected as
optimized batch ahead of the batch with more % EE
(Table 2).
Determination of zeta ?ζ potential
In the present study the ζ obtained for liposomes are
shown in Table 2. The values of ζ potential (-54.1 - 63.6
mV for vesicles) showed prepared liposome have
sufficient charge to avoid aggregation of vesicles.
Rheological study
The semisolid preparations should flow or deform after
applying the force and regain its elasticity as the force is
removed. Thus, to understand the rheological properties
of liposomal gels and for selection of optimum
concentration of carbopol having desired rheological
properties, different concentrations (1, 1.5, 2% w/w) of
carbopol 934 were used to prepare liposomal gels at 25 °C 15with neutralization method . The rheologies of all
samples were determined to identify the minimum
concentration of carbopol required for the formation of
gel with good viscoelastic properties.
Oscillation stress sweep:
During stress sweep, it was observed that there was
linearity between stress and strain produced all over the
applied stress range, which indicate that system was
working in correct range. Liposomal gel with 2% w/w of
carbopol had shown maximum G' and LVR as compared
to other system and it was comparatively more stable
over applied stress range. In oscillatory stress sweep test,
system with higher LVR and G' were considered as more 23elastic . Solid modulus (G') of other system has shown
greater dependence on applied stress. The degree of
dependence of G' over applied stress is critical parameter
to determine the gel strength; higher is degree, lower is
gel strength. Both 1% and 1.5% w/w systems were
presented lower G' and LVR and higher degree of
dependence of G' over applied stress indicating formation
of weak gel. It clearly indicated (Fig. 3) that for 2%
system, G' was greater than G'' over all applied stress,
while for 1% and 1.5% system, G' was higher than G'' at
lower stress (data not shown).The trend of G'>G'' is for 18gel and solid like materials has been studied . The phase
angle is good indicator of viscoelastic nature of system,
being measure of the lag in sine response after an
oscillatory stress has been applied to the sample. For
perfectly elastic system, phase degree must be close to 0° 24 and for viscous system it must be close to 90°. Both
liposomal gels containing 1% and 1.5% carbopol was
shown phase transition at higher stress (data not shown).
These systems have presented the change of behavior
from elastic to viscous one, thus proving the instability of
the system. Therefore, from stress sweep, it was
concluded that liposomal gel prepared with 2% w/w
carbopol was more stable and elastic one.
Oscillation frequency sweep:
Fig. 4, presents the behavior of G' over the applied
frequency range. It was concluded that 2% system had
shown independent behavior of G' over applied
frequency, while 1 and 1.5% system have exhibited a
monotonous increase in solid component. It is possible
that monotonic increase in G' at higher frequencies means
the partial breakage of the interconnected network,
inferred from the existence of the plateau region at lower
frequencies, which represents a true cross-linked
polymer gel network. It concluded that the gel network
was retained at low frequencies and, on the other hand,
destroyed by the more frequent changes of the
displacement at higher frequencies due to the formation 19 of too rigid and brittle structures . It was clear that 2%
system had shown low (Fig. 4) dependency on frequency
for viscous moduli and phase degree than 1 and 1.5%
system. The value of phase degree for 2% was well in
viscoelastic region. The increase in G'' and phase degree
clearly indicated the weak structure of breaking structure
for 1 and 1.5% systems.
In frequency sweep test a new terminology was
introduced i. e. loss tangent (tan δ). It is the ratio of loss
modulus (G'') and storage modulus (G''). The higher the
loss tangent less elastic is the material. Previous studies
shown that system with values of tan δ <1 characterize a
predominant elastic behavior and values of tan δ >1 23indicate a prevailing viscous behavior . For liposomal
gel containing 2% carbopol, tan δ was clearly below 1,
Indian J.Pharm. Educ. Res. 44(4), Oct - Dec, 2010
328

while for 1 and 1.5% system it was much higher than 1
(Fig. 5). With this prospective, only 2% system is elastic
and stable one. Torres, et al. (2007) has presented
guideline for determination of stability of gel structure.
According to his proposal, in frequency sweep, there
must be non-dependency of both G' and G'' over the
applied frequency and condition of G'>G'' must be 17prevalent over all range . Considering these criteria,
liposomal gel containing 2% carbopol was again
emerged as stable and elastic one.
Creep recovery:
The creep-recovery percent for liposomal gel containing
1%, 1.5% and 2% carbopol was 43.89%, 65.87%, 71.7%,
respectively. As the 2% has highest elastic recovery, it is
said to highly stable and easy to process, store and apply
system (Fig. 6).
From graph, it was clearly seen that 2% system had
lowest compliance value i. e. J. Tadros, (2007) defined
that lower the compliance, higher is elasticity. Therefore,
from creep recovery test, it was inferred that, all system
have shown considerable elastic and viscoelastic
recovery, liposomal gel with 2% w/w carbopol had
presented highest recovery and lowest compliance (J).
From oscillatory rheological measurement, it was
observed that liposomal gel prepared from 2% w/w
carbopol was highly elastic and stable. It was having high
recovery capacity. From these rheological properties, it
can be concluded that this system having good flow
properties, good spreadibility and applicability. Hence,
further studies were performed with liposomal gel with
2% w/w of carbopol.
Drug content uniformity and pH measurement
There was no significant difference observed in the %
drug at various locations, indicating that the method used
to disperse the liposomal dispersion in the gel base is
satisfactory. The pH of the developed formulations was in
accordance with that of human skin pH rendering them
more acceptable. The developed formulations had pH
near to that of skin. So, we can conclude that prepared
liposomal gel was suitable for topical application.
Skin permeation and drug deposition studies
Results obtained from in-vitro drug permeation studies
conducted with different formulations of fluconazole are
shown in Table 3. Significant augmentation in the skin
permeation of fluconazole has been observed (Fig. 7)
with liposomal formulations vis-à-vis aqueous solution
or plain carbopol gel. The amount of fluconazole
permeated in eight hour was found to be 32.47% and
30.46% from liposomal suspension and liposomal gel,
respectively, whereas only 27.2% and 24.68% of the drug
permeated in case of aqueous solution and plain Carbopol
gel, respectively. Higher values of flux obtained with 2liposomal suspension 0.1754 mg/cm /h, and liposomal
2gel 0.1871 mg/cm /h, than that obtained with marketed 2 2gel 0.1341 mg/cm /h, and carbopol gel 0.1531 mg/cm /h,
clearly vouch for the permeation enhancing effect of
vesiculation on the drug. Results of this study clearly
depict that the amount of drug retained in the skin was
considerably higher in case of liposomal preparations,
than with non-liposomal.
This gave an understanding that liposomes could not only
enhance the penetration of drug molecules but also 12helped localize the drug in the skin . Improved skin
permeation of fluconazole coupled with its enhanced
retention in the skin with liposomal formulation can be
ascribed to the lipo-solublized state of fluconazole
molecules. The latter was achieved in the presence of
aqueous and non-aqueous phase of bilayered systems, a
state most ideally suited for drug penetration. The
liposomal phospholipids (also one of the natural
constituent of skin lipids) helped generating and retaining
the required physico-chemical state of the skin for
enhanced permeation of the fluconazole. The
phospholipid-rich domains of vesicles might have helped
to produce the depot effect for drug molecules. The latter
has been reflected as higher amount of drug retention
within the skin layers in case of liposomal formulations.
Thus, the liposomal fluconazole formulation, with
desired characteristics for topical administration, could
be successfully prepared. The formulated fluconazole
liposomes have shown an appreciably enhanced skin
permeation as well as retention of drug molecules in the
skin.
Stability study
Stability of liposome dispersion (LPE) as well as 2% w/w
carbopol liposomal gel containg 0.5% fluconazole was
carried out for 60 months at 4-8 °C and room temperature.
Responses obtained for different parameters for
liposomal dispersion and liposomal gel during stability
period are as shown in Table 4.
Indian J.Pharm. Educ. Res. 44(4), Oct - Dec, 2010
329
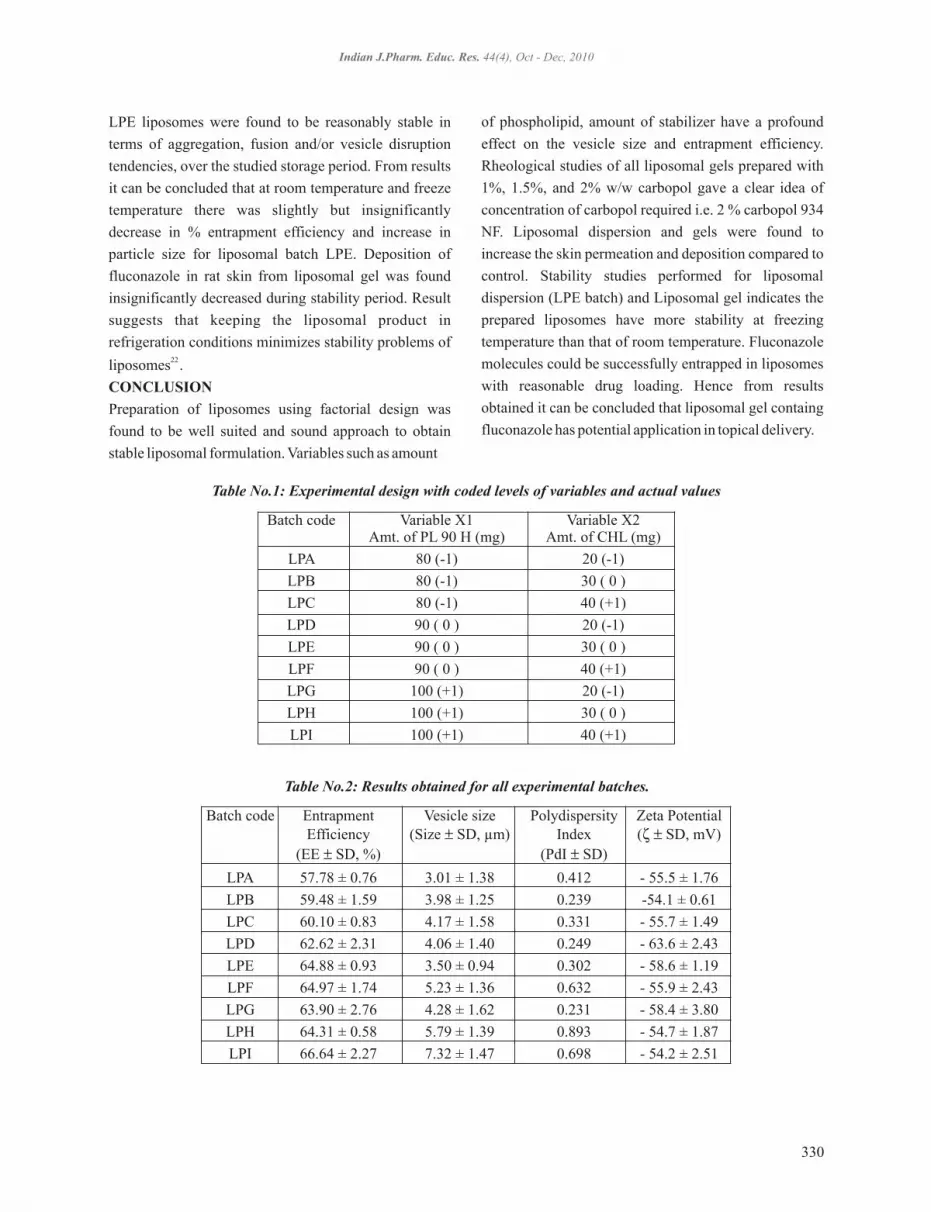
LPE liposomes were found to be reasonably stable in
terms of aggregation, fusion and/or vesicle disruption
tendencies, over the studied storage period. From results
it can be concluded that at room temperature and freeze
temperature there was slightly but insignificantly
decrease in % entrapment efficiency and increase in
particle size for liposomal batch LPE. Deposition of
fluconazole in rat skin from liposomal gel was found
insignificantly decreased during stability period. Result
suggests that keeping the liposomal product in
refrigeration conditions minimizes stability problems of 22 liposomes .
CONCLUSION
Preparation of liposomes using factorial design was
found to be well suited and sound approach to obtain
stable liposomal formulation. Variables such as amount
of phospholipid, amount of stabilizer have a profound
effect on the vesicle size and entrapment efficiency.
Rheological studies of all liposomal gels prepared with
1%, 1.5%, and 2% w/w carbopol gave a clear idea of
concentration of carbopol required i.e. 2 % carbopol 934
NF. Liposomal dispersion and gels were found to
increase the skin permeation and deposition compared to
control. Stability studies performed for liposomal
dispersion (LPE batch) and Liposomal gel indicates the
prepared liposomes have more stability at freezing
temperature than that of room temperature. Fluconazole
molecules could be successfully entrapped in liposomes
with reasonable drug loading. Hence from results
obtained it can be concluded that liposomal gel containg
fluconazole has potential application in topical delivery.
Batch code Variable X1 Variable X2Amt. of PL 90 H (mg) Amt. of CHL (mg)
LPA 80 (-1) 20 (-1)
LPB 80 (-1) 30 ( 0 )
LPC 80 (-1) 40 (+1)
LPD 90 ( 0 ) 20 (-1)
LPE 90 ( 0 ) 30 ( 0 )
LPF 90 ( 0 ) 40 (+1)
LPG 100 (+1) 20 (-1)
LPH 100 (+1) 30 ( 0 )
LPI 100 (+1) 40 (+1)
Table No.1: Experimental design with coded levels of variables and actual values
Batch code Entrapment Vesicle size Polydispersity Zeta PotentialEfficiency (Size ± SD, µm) Index (ζ ± SD, mV)
(EE ± SD, %) (PdI ± SD)
LPA 57.78 ± 0.76 3.01 ± 1.38 0.412 - 55.5 ± 1.76
LPB 59.48 ± 1.59 3.98 ± 1.25 0.239 -54.1 ± 0.61
LPC 60.10 ± 0.83 4.17 ± 1.58 0.331 - 55.7 ± 1.49
LPD 62.62 ± 2.31 4.06 ± 1.40 0.249 - 63.6 ± 2.43
LPE 64.88 ± 0.93 3.50 ± 0.94 0.302 - 58.6 ± 1.19
LPF 64.97 ± 1.74 5.23 ± 1.36 0.632 - 55.9 ± 2.43
LPG 63.90 ± 2.76 4.28 ± 1.62 0.231 - 58.4 ± 3.80
LPH 64.31 ± 0.58 5.79 ± 1.39 0.893 - 54.7 ± 1.87
LPI 66.64 ± 2.27 7.32 ± 1.47 0.698 - 54.2 ± 2.51
Table No.2: Results obtained for all experimental batches.
Indian J.Pharm. Educ. Res. 44(4), Oct - Dec, 2010
330
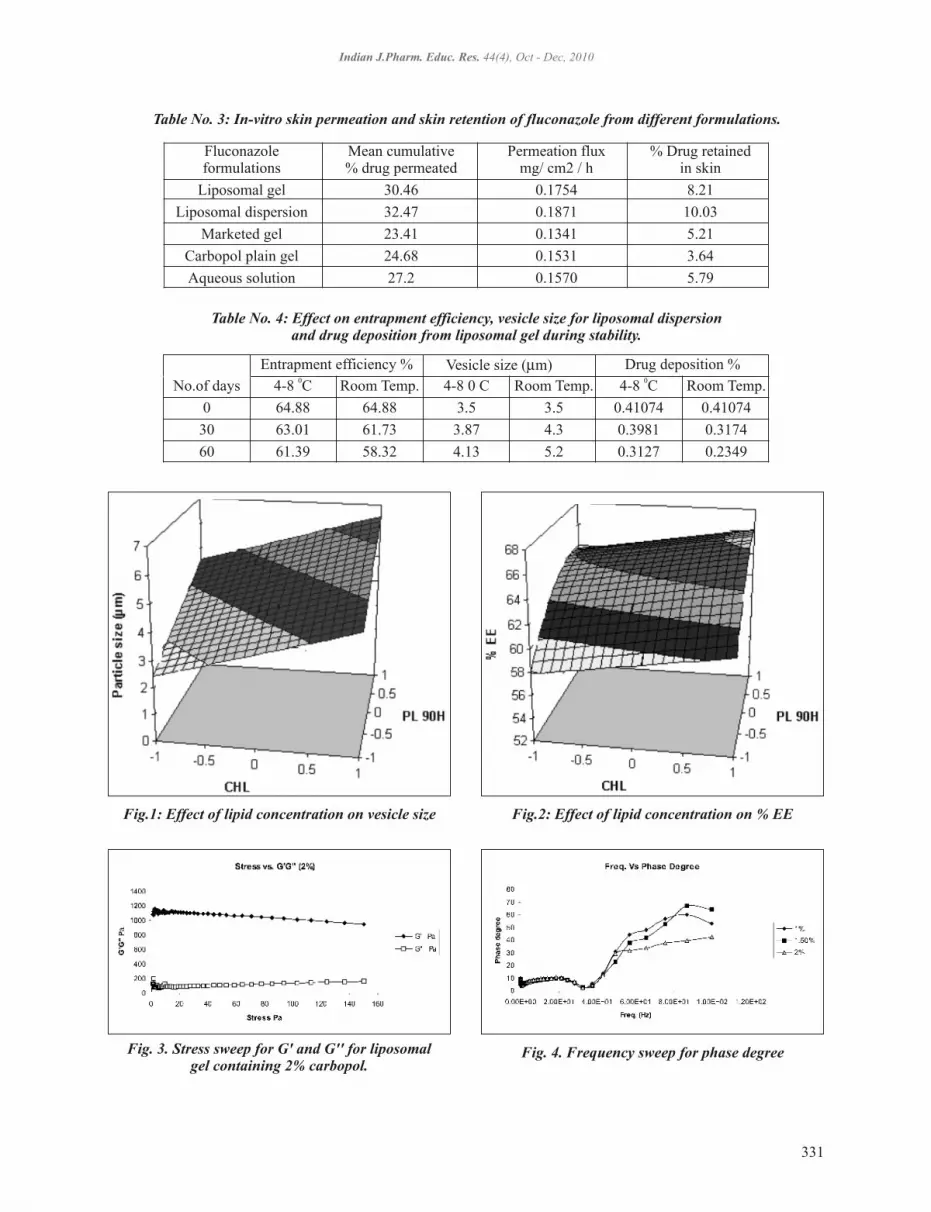
Indian J.Pharm. Educ. Res. 44(4), Oct - Dec, 2010
Fluconazole Mean cumulative Permeation flux % Drug retainedformulations % drug permeated mg/ cm2 / h in skin
Liposomal gel 30.46 0.1754 8.21
Liposomal dispersion 32.47 0.1871 10.03
Marketed gel 23.41 0.1341 5.21
Carbopol plain gel 24.68 0.1531 3.64
Aqueous solution 27.2 0.1570 5.79
Table No. 3: In-vitro skin permeation and skin retention of fluconazole from different formulations.
No.of days Room Temp. 4-8 0 C Room Temp.
0 64.88 64.88 3.5 3.5 0.41074 0.41074
30 63.01 61.73 3.87 4.3 0.3981 0.3174
60 61.39 58.32 4.13 5.2 0.3127 0.2349
0 04-8 C 4-8 C Room Temp.
Entrapment efficiency % Vesicle size (µm) Drug deposition %
Table No. 4: Effect on entrapment efficiency, vesicle size for liposomal dispersion and drug deposition from liposomal gel during stability.
Fig.1: Effect of lipid concentration on vesicle size Fig.2: Effect of lipid concentration on % EE
Fig. 3. Stress sweep for G' and G'' for liposomal gel containing 2% carbopol.
Fig. 4. Frequency sweep for phase degree
331

tan
µ
Freq. Vs. tanµ
Fig. 5: Frequency sweep for tan µ Fig. 6. Creep recovery test
Fig.7. Permeation profile of different fluconazole containing systems
Indian J.Pharm. Educ. Res. 44(4), Oct - Dec, 2010
Refrence
1. Schaeffer HE, Krohn DL. Liposomes in topical drug
delivery. Invest. Ophthalmol. Vis. Sci. 1982;22:220-
227.
2. Abdel-Mottaleb MMA, Mortada ND, Elshamy AA,
Awad GAS. Preparatio and evaluation of
fluconazole gels. Egypt. J. Biomed. Sci.
2007;23:266-286.
3. Mohamed MN. In vitro release of hydrophilic and
hydrophobic drugs from liposomal dispersions and
gels. Act. Pharm. 2006;56:311-324.
4. Kneep VM, Hinz RS, Szoka FSJr, Guy RH.
Controlled drug release from a novel liposomal
delivery system I: investigation of transdermal
potential. J. Control. Rel. 1988;5:211-221.
5. Schmid MH, Korting HC. Therapeutic progress
with topical liposome drugs for skin Disease. Adv.
Drug Del. Rev. 1996;18:335-342.
6. Glavas-Dodov M. Formulation and characterization
of topical liposome gel bearing lidocaine HCl. Bull.
Chem. Tech. Macedonia. 2005;24(1):59-65.
7. Singh M, Singh MP, Maiti SN, Gandhi A, Micetich
RG, Atwal H. Prepartions of liposomal fluconazole
and their in vitro antifungal activity. J.
Microencapsul. 1993;10(2):229-236.
8. Nagarsenker MS. Preparation and evaluation of a
liposomal formulation of sodium cromoglicate. Int.
J. Pharm. 2003;251:49-56.
9. Sriram V, Rhodes CT. Preparation and
chrecterization of liposomes as therapeutic delivery
systems. A review. Pharm Acta Hel. 1995;70:95-
111.
10. Du Plessis J, Ramchandran C, Weiner N, Muller
DG. The influence of particle size of liposomes on
the deposition of drug into skin. Int. J. Pharm.
1994;103:277-282.
11. Jia-You F, Yann-Lii L, Chia-Chun C, Chia-Hsuan L,
Yi-Hung T. Lipid nano/submicron emulsion as
vehicle for topical flurbiprofen delivery. Drug Del.
2004;11:97-105.
12. Bhatia A, Kumar R, Katare, OP. Tamoxifen in
topical liposomes: development, characterization
and in-vitro evaluation. J. Pharm. Sci.
2004;7(2):252-259.
13. Buchard W, Ross-murphy SB. Physical networks:
polymers and gels. Elsevier Applied Sci. London.
1990;204-207.
14. Pavelic Z. Liposomal gel with chloramphenicol:
characterization and invitro release. Act. Pharm
2004;54:319-330.
332

15. Bayarri S, Duran L, Costell E. Influence of
sweetener on the viscoelasticity of hydrocolloids
gelled systems. Food Hydrocolloids. 2004;18:611-
619.
16. Calfors J, Edsman K, Petterson R. Rheological
evaluation of gelrite in situ gels for ophthalmic use.
Eur. J. Pharm. Sci. 1998;6:113-119.
17. Kobayashi M, Ishikawa S, Samejima M.
Application of nonlinear viscoelastic analysis by the
oscillation method to some pharmaceutical
ointments in the Japanese Pharmacopeia. Chem.
Pharm. Bull. 1982;30:4468-4478.
18. Thorgeirsdottira T, Kjoniksenb A, Kenneth DK,
Kristmundsdo´ttira T, Nystromb B. Viscoelastic and
structural properties of pharmaceutical hydrogels
containing monocaprin. Eur. J. Pharm. Biopharm.
2005;59:333-342.
19. Torres LG, Iturbe R, Snowdenb MJ, Chowdhry BZ,
Leharne SA. Preparation of o/w emulsions
s tabi l ized by sol id par t ic les and their
characterization by oscillatory rheology. Colloid
Surfac. 2007;302:439-448.
Indian J.Pharm. Educ. Res. 44(4), Oct - Dec, 2010
20. Tadros T. Application of rheology for assessment
and prediction of thelong-term physical stability of
emulsions. Adv. Colloid Interface. 2007;108 -
109:227–258.
21. Barry BW, Eccleston GM. Influence of gel networks
in controlling consistency of o/w emulsions
stabilized by mixed emulsifiers. J. Texture Stud.
1973;4:53-81.
22. Goindi S, Aggarwal N. Preparation of hydrogels of
griseofulvin for dermal application. Int. J. Pharm.
2006;326:20-24.
23. Korhonen M, Hellen L, Hirvonen J, Yliruusi J.
Rheological properties of creams with four different
surfactant combinations-effect of storage time and
conditions. Int. J. Pharm. 2001;221:187-196.
24. Lippacher A, Muller RH, Mader K. Liquid and
semisolid SLNs dispersions for topical application:
rheological characterization. Eur. J. Pharm.
Biopharm. 2004;58:561-567.
333
Abstract
Glibenclamide (GLB) is a second generation anti-diabetic drug used for the treatment of Type –II Diabetes. The
drawback of the drug is, it is practically insoluble in water and so possesses poor solubility, GI absorption and
bioavailability. Hence the objective of the work is to develop fast dissolving tablets of Glibenclamide using
Crospovidone (CP) as super disintegrating agent. The kneading mixtures of glibenclamide were prepared with
Crospovidone in the weight ratios of 1:0.5, 1:1 and 1:1.5. The mixture, GLB : CP (1:1.5) (KM) exhibited highest
dissolution rate of 99.8% in 45 min. FTIR analysis of the selected kneading mixture indicated the absence of drug-
polymer interaction. Hence the tablets were prepared by using the kneading mixture GLB: CP (1:1.5) (KM) by wet
granulation method. Various formulations were tried and the FDT was selected which possessed optimum 2 characteristics of disintegration time of 20 sec, hardness of 3.5 kg/cm and friability of 0.34±0.61%.There is 99.9% of
drug release in 20 min. The FDTs were stable without any significant changes in their initial properties of hardness,
friability, disintegration time and % drug release upon storage for 4 weeks.
Key words: Glibenclamide, FDTs, Crospovidone, kneading method, Disintegration, Dissolution.
Indian J.Pharm. Educ. Res. 44(4), Oct - Dec, 2010
INTRODUCTION
Fast Dissolving tablets (FDTs) are the recent
developments to present viable dosage alternatives for
patients who have difficulty in swallowing. They are the
products that disintegrate rapidly in the saliva without the
need of water. Fast dissolving / disintegrating tablets are a 1perfect fit for all of the patients . Some tablets are
designed to dissolve in saliva remarkably fast, with in few 2 seconds and are true fast dissolving tablets They contain
agents to enhance the rate of tablet disintegration in the
oral cavity. When placed on tongue, this tablet
disintegrates instantaneously, releasing the drug, which
dissolves or disperses in the saliva. Some drugs are
absorbed from the mouth, pharynx and esophagus, as the
saliva passes down into the stomach. In such cases the
bioavailability of drug is significantly grater than those 3observed from conventional tablet dosage form .
The advantage of fast dissolving dosage forms are
increasingly being recognized in both industry and
academia. Their growing importance was underlined
recently when European Pharmacopoeia adopted the
.
term “Orodispesible tablet” as a tablet that to be placed in 4oral cavity where it disperse rapidly before Swallowing .
Zydis, the best known of fast dissolving / disintegrating
tablet preparations was the first marketed new
technology tablet. A zydis tablet is produced by
lyophilizing or freeze drying the drug in a matrix usually
consisting of gelatin. The product is very light in weight
and fragile, and must be dispensed in a special blister
pack. Several methods like lyophillization, granulation
methods using specific super disintegrating agents have
been utilized to produce the FDTs.
In view of the above information, we have selected
Glibenclamide (GLB), a second generation anti-diabetic
drug to develop as a fast dissolving tablet using
Crospovidone (CP) as a super disintegrating agent. 5Glibenclamide , is a sulphonyl urea derivative used for
the treatment of Type –II Diabetes mellitus. It is
practically insoluble in water and so possesses poor
solubility and subsequent poor GI absorption and
bioavailability. Several investigations revealed the rate
l imi t ing absorpt ion and b ioavai labi l i ty of 6-8Glibenclamide . Hence the objective of the present work
is to enhance the dissolution rate of Glibenclamide by
preparing its kneading mixtures with crospovidone, to
Indian Journal of Pharmaceutical Education and ResearchReceived on 11/2/2009; Modified on 18/5/2009Accepted on 20/5/2010 © APTI All rights reserved
Development of Fast Dissolving Tablets of Glibenclamide Using Crospovidone and its Kneading Mixture
Jeevana Jyothi. B* and Suneela. GInstitute of Pharmaceutical Technology,
Sri Padmavathi Mahila Viswavidyalayam (Women's University), Tirupati(A.P) -517 502.*Author for Correspondence: jeevanajyothib @ yahoo.com
334

develop its fast dissolving tablet from the ideal kneading
mixture possessing faster dissolution and to evaluate the
FDTs.
MATERIALS AND METHODS
Pure and certified sample of Glibenclamide was gifted by
M/s. Karnataka Antibiotics and Pharmaceuticals Ltd,
Banga lo re , INDIA. D ica l c ium Phospha t e ,
Crospovidone, Aspartame, and microcrystalline
cellulose Phosphate were obtained from SD Fine
chemicals Ltd, Mumbai. All other chemicals and reagents
were of analytical grade.
Preparation and evaluation of kneading mixtures of
Glibenclamide and crospovidone (GLB:CP) (KM):
Preparation of kneading mixtures of GLB:CP (KM):
The kneading mixtures of glibenclamide- crospovidone
were prepared by taking various weight ratios of drug to
CP as 1:0.5, 1:1 and 1:1.5 by using kneading method. The
accurately weighed amount of drug and polymer
mixtures were taken in the mortar and triturated by
adding small volume of methanol to get smooth moist
mass. The mass was kneaded for 45 minutes and then
dried in an oven at 35ºC till the constant weight is
reached. The dried mass was pulverized and sifted
through #100 and the collected powder fraction was
stored in 30ml glass vials. In each case, 5 gm of kneading
mixture was prepared. The mixtures were analyzed and 9confirmed for total absence of methanol for further use .
Evaluation of kneading mixtures of GLB: CP:
The prepared kneading mixtures of GLB: CP were
evaluated by
1. In-vitro dissolution studies
2. FTIR spectroscopy
3. X-Ray Diffractometry.
In vitro dissolution studies:
Dissolution studies of pure drugs and the Glibenclamide-
crospovidone Kneading mixtures were carried out in
triplicate with USP dissolution testing apparatus(Paddle
type) (Electrolab, India) using paddle method. The
stirring speed was maintained at of 50 rpm and 900 ml of
pH 7.2 phosphate buffer at 37±1ºC was used as
dissolution medium. Samples of each preparation
equivalent to 50 mg of the drug were added to the
dissolution medium. The sample aliquots each of 5ml
were withdrawn at appropriate time intervals, filtered
through a 0.45µ membrane filter (Millipore, nylon discs).
The initial volume of the dissolution medium was
maintained by replacing with 5ml of the medium to
maintain sink conditions. The filtered aliquots were
suitably diluted and assayed for its drug content
spectrophotemetrically at λ of 232 nm by measuring the max
absorbencies against blank. The mean percent of drug
dissolved and the S.D were calculated and the results are
given in Table.1 and represented in the Fig. 1.
FTIR Spectroscopy:
FTIR spectra of pure Glibenclamide and the selected
mixture containing Glibenclamide: crospovidone
(1:1.5)(KM) were obtained on a perkin-Elmer 841 model
FTIR Spectrometer equipped with a DTSG detector.
Samples were prepared by KBr pressed pellet technique. -1The scanning range was 500-4000 cm and the resolution
-1was 1 cm .The spectra are shown in Fig. 2.
X-Ray Diffractometry:
Powder X-Ray diffraction patterns of pure
Glibenclamide and the selected mixture containing
Glibenclamide: crospovidone (1:1.5)(KM) were
recorded using an automated X-ray diffractometer
(XGEN). The cross sections of the samples were held in
place on quartz plate and subjected to CuK radiations.
The samples were analyzed at room temperature over a 0range of 0-5 at an angle of 2 with sampling interval of
0 00.02 . The scanning rate was 2 C/min. The
diffractogram of the samples are shown in fig .3.
Formulation and Preparation of Fast dissolving
tablets of glibenclamide using selected solid
dispersion, GLB: CP (1:1.5)(KM):
Fast dissolving of Glibenclamide tablets were prepared
by using the selected kneading mixture, i.e. GLB: CP
(1:1.5) (KM) which exhibited a significant improvement
in the dissolution at in vitro level among all the
dispersions. The various formulations were tried to select
the tablet with ideal characteristics of FDTs. The selected
tablet formulation that satisfied all the official parameters
is given in the Table 2.
Glibenclamide and crospovidone kneading mixture
(1:1.5), MCCP, crospovidone and DCP was sifted
through the sieve no:30. Then the mix was granulated by
using 10% Starch solution as binding agent. The wet
mass was passed through # 30 to get the wet granules. The
wet granules were dried in an oven at 60°C for about 20
min. To the dried granules magnesium stearate, talc,
Indian J.Pharm. Educ. Res. 44(4), Oct - Dec, 2010
335

aspartame and pineapple flavor were added and mixed
well. The micomeritic properties of the blend were
satisfactory and are shown in the Table.3.Then the blend
was compressed with 7 mm flat round punches using 16-
station rotary punch machine (Clit Jemkay, CTD 3-16).
Evaluation of fast dissolving tablets of glibenclamide:10The prepared tablets were evaluated for disintegration ,
11 12 13hardness , friability and drug content . Five tablets
collected at random were determined for hardness by
using Monsanto hardness tester. The mean values are
presented in the Table.4. The disintegration time of
tablets was determined by using Thermionic tablet
disintegration test apparatus of USP standard. The results
are given in the Table.4. Friability test was carried out by
using Roche Friabilator (Veego Instruments Ltd., India).
Ten tablets were collected at random from a batch and
their initial average weight (W ) was denoted. Then the 1
tablets were placed in the rotating chamber and subjected
to combined effects of abrasion and shock with revolving
plastic chamber at 100rpm. After completion of
rotations, the tablets were reweighed (W ). The percent 2
loss in weight or friability (f) was determined.
Estimation of Drug content:
Drug content estimation was carried out by collecting ten
tablets from each batch at random. The tablets were
powdered and the fine powder equivalent to 10mg of the
drug was transferred into a 10 ml volumetric flasks. The
volume was made with water and sonicated for 10 min.
The sample was filtered through 0.45m micro pore filter
paper. The results are given in the Table .4.
In vitro dissolution studies of tablets:
In vitro dissolution studies of tablets was carried out
using USP dissolution testing apparatus (Basket type)
(Electrolab, India) using pH 7.2 phosphate buffer as
dissolution medium at 37±1ºC.The stirring speed was
maintained at of 50 rpm. Aliquot samples were
withdrawn at various time intervals, filtered, diluted and
assayed at 232 nm by measuring the absorbencies against
blank. The mean percent of drug dissolved and the S.D
were calculated and the results are given in Table.5 and
represented in the Fig .2.
Stability studies of prepared FDTs of glibenclamide:
The Fast dissolving tablets of glibenclamide were placed
in Stability chamber (Newtronics) at the temperature of 045 C and 75% RH. The tablets were taken after 4 weeks
Indian J.Pharm. Educ. Res. 44(4), Oct - Dec, 2010
and evaluated for hardness, Disintegration time and in-
vitro drug release. Student's t-test was applied to verify
any significant difference after storage.
RESULTS AND DISCUSSION:
The kneading mixtures of glibenclamide and
crosspovidone were prepared in the weight ratios of drug
to polymer as 1:0.5, 1:1 and 1:1.5 by using kneading
method.The dissolution studies were carried out for all
the Kneading mixtures. All the mixtures showed
enhanced dissolution compared to the pure drug as shown
in the Table.1 and Fig .1The pure drug released only
28.3% in 90 min. The mixtures GLB: CP (1:1.5) (KM),
GLB: CP (1:1)(KM) and GLB : CP (1:1.5) (KM) released
90.6%, 99.2% and 99.5% respectively in 90min.The
mixture GLB : CP (1:1.5) (KM) released faster amount of
95.4 in 20 min that is not the case with other two mixtures.
Hence GLB : CP (1:1.5) (KM) was selected was selected
for preparation of Fast dissolving tablets of
glibenclamide. The reason for enhanced dissolution of
Kneading mixtures may be due to effective
disaggregating capacity of crospovidone as a
superdisintegrant and the method used i.e., Kneading
technique, a method among the solid dispersion
techniques which were proved as successful methods to
enhance the dissolution of poorly soluble drugs. The
kneading mixtures were tested for the absence of
methanol as the presence of methanol is toxic and 9harmful . It was found that all the mixtures were totally
free from methanol content. Perhaps the drying of
Kneading mixtures would have led to the complete
removal of methanol from the mixtures.
The IR spectrum of pure glibenclamide in fig. 2(a) -1presents NH stretch at the wave number of 3314 cm , -IAr-H absorption peak at the wave number of 3116cm ,
-1 C=O absorption peaks at 1715 cm . The FTIR spectrum
of selected formulation (1:1.5) (KM) in fig. 2(b), also
presents all the absorption peaks produced by pure
glibenclamide. This indicates the absence of interaction
between the drug and crospovidone.
The X-Ray diffractogram of pure glibenclamide and
selected formulation GLB: CP (1:1.5) (KM) shown in
fig.3(a) and fig.3(b) did not exhibit much variation
revealing unaffected crystal nature of Glibenclamide
upon combination with crosspovidone. Thus it is
concluded that the enhanced solubility may be due to
336
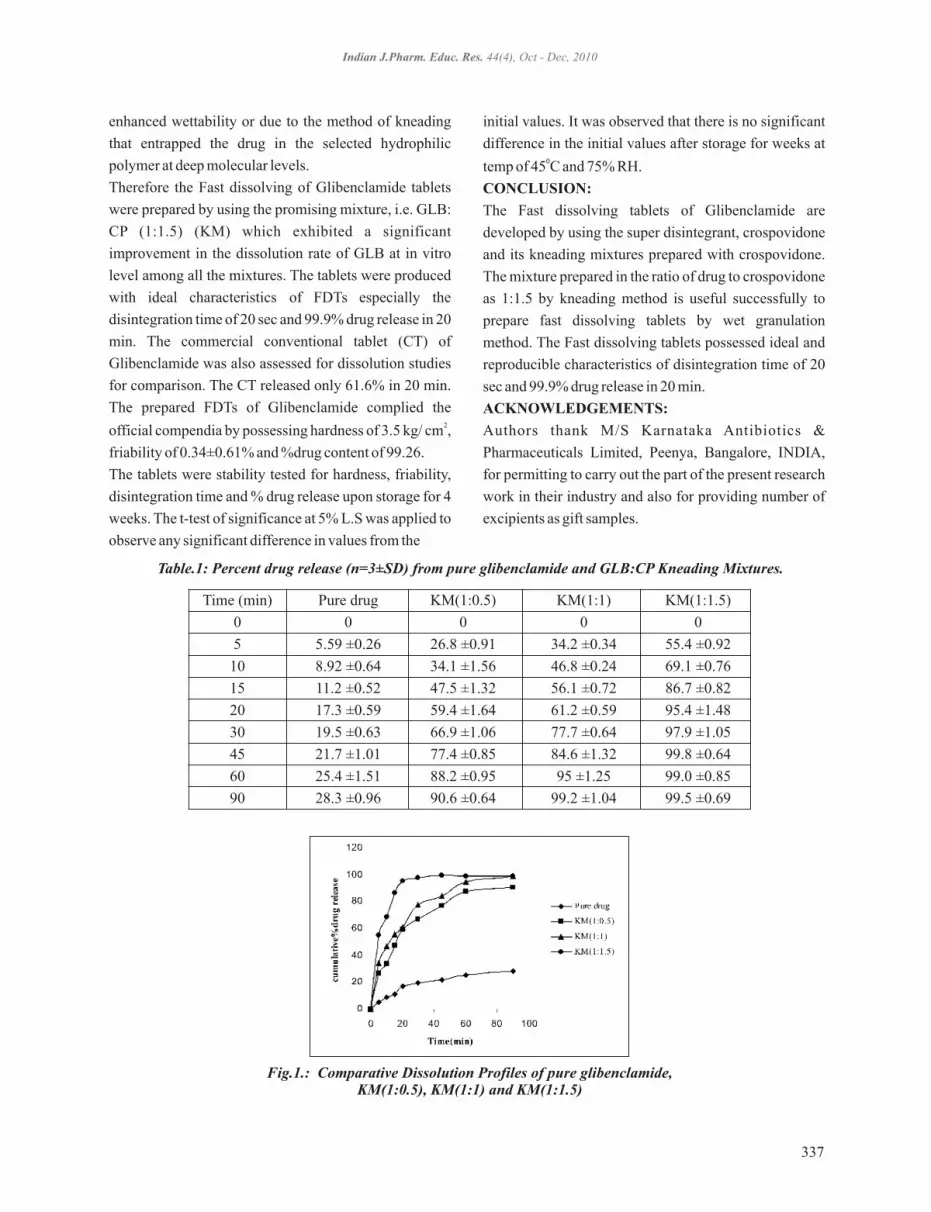
Indian J.Pharm. Educ. Res. 44(4), Oct - Dec, 2010
enhanced wettability or due to the method of kneading
that entrapped the drug in the selected hydrophilic
polymer at deep molecular levels.
Therefore the Fast dissolving of Glibenclamide tablets
were prepared by using the promising mixture, i.e. GLB:
CP (1:1.5) (KM) which exhibited a significant
improvement in the dissolution rate of GLB at in vitro
level among all the mixtures. The tablets were produced
with ideal characteristics of FDTs especially the
disintegration time of 20 sec and 99.9% drug release in 20
min. The commercial conventional tablet (CT) of
Glibenclamide was also assessed for dissolution studies
for comparison. The CT released only 61.6% in 20 min.
The prepared FDTs of Glibenclamide complied the 2official compendia by possessing hardness of 3.5 kg/ cm ,
friability of 0.34±0.61% and %drug content of 99.26.
The tablets were stability tested for hardness, friability,
disintegration time and % drug release upon storage for 4
weeks. The t-test of significance at 5% L.S was applied to
observe any significant difference in values from the
initial values. It was observed that there is no significant
difference in the initial values after storage for weeks at 0temp of 45 C and 75% RH.
CONCLUSION:
The Fast dissolving tablets of Glibenclamide are
developed by using the super disintegrant, crospovidone
and its kneading mixtures prepared with crospovidone.
The mixture prepared in the ratio of drug to crospovidone
as 1:1.5 by kneading method is useful successfully to
prepare fast dissolving tablets by wet granulation
method. The Fast dissolving tablets possessed ideal and
reproducible characteristics of disintegration time of 20
sec and 99.9% drug release in 20 min.
ACKNOWLEDGEMENTS:
Authors thank M/S Karnataka Antibiotics &
Pharmaceuticals Limited, Peenya, Bangalore, INDIA,
for permitting to carry out the part of the present research
work in their industry and also for providing number of
excipients as gift samples.
Time (min) Pure drug KM(1:0.5) KM(1:1) KM(1:1.5)
0 0 0 0 0
5 5.59 ±0.26 26.8 ±0.91 34.2 ±0.34 55.4 ±0.92
10 8.92 ±0.64 34.1 ±1.56 46.8 ±0.24 69.1 ±0.76
15 11.2 ±0.52 47.5 ±1.32 56.1 ±0.72 86.7 ±0.82
20 17.3 ±0.59 59.4 ±1.64 61.2 ±0.59 95.4 ±1.48
30 19.5 ±0.63 66.9 ±1.06 77.7 ±0.64 97.9 ±1.05
45 21.7 ±1.01 77.4 ±0.85 84.6 ±1.32 99.8 ±0.64
60 25.4 ±1.51 88.2 ±0.95 95 ±1.25 99.0 ±0.85
90 28.3 ±0.96 90.6 ±0.64 99.2 ±1.04 99.5 ±0.69
Table.1: Percent drug release (n=3±SD) from pure glibenclamide and GLB:CP Kneading Mixtures.
Fig.1.: Comparative Dissolution Profiles of pure glibenclamide,KM(1:0.5), KM(1:1) and KM(1:1.5)
337
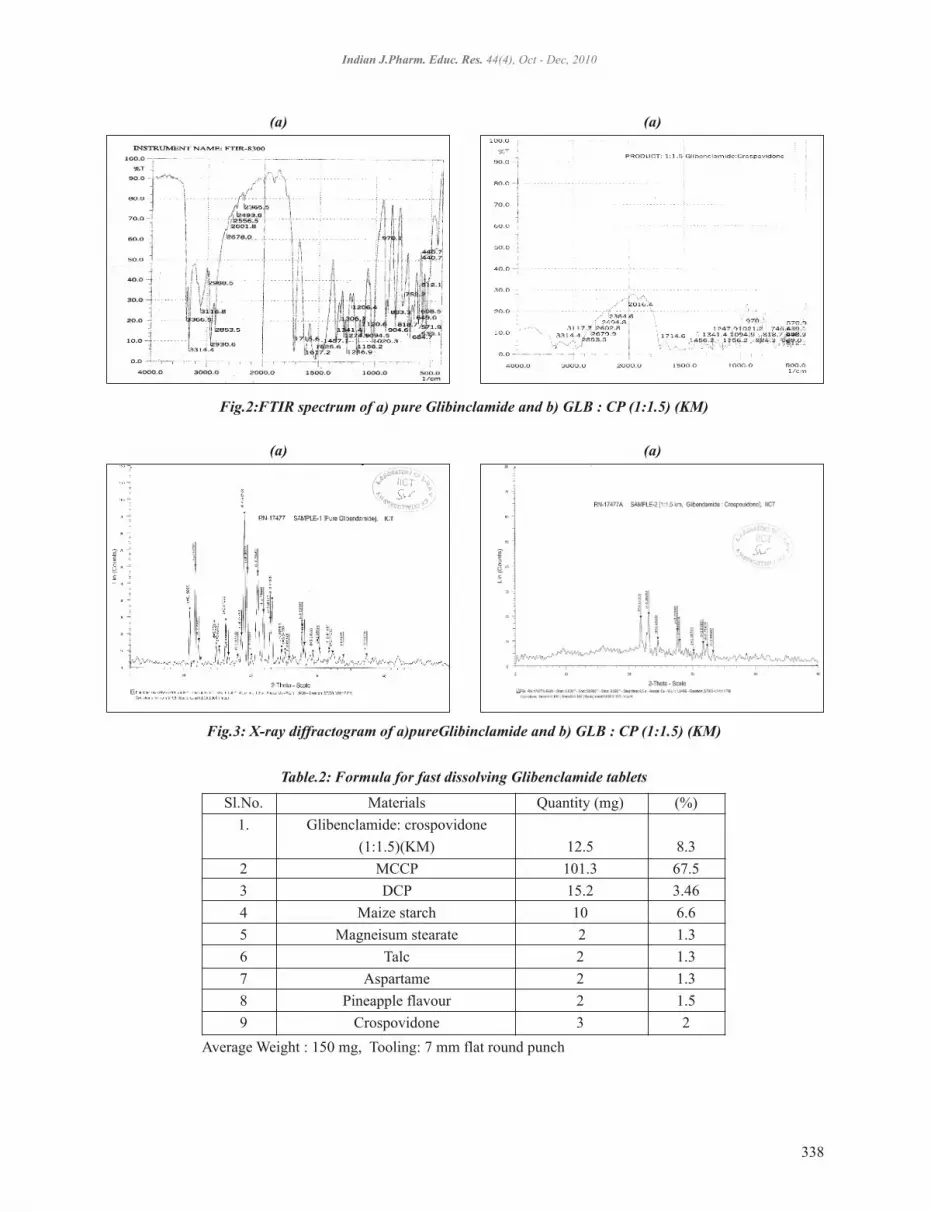
Fig.2:FTIR spectrum of a) pure Glibinclamide and b) GLB : CP (1:1.5) (KM)
(a) (a)
(a) (a)
Fig.3: X-ray diffractogram of a)pureGlibinclamide and b) GLB : CP (1:1.5) (KM)
Sl.No. Materials Quantity (mg) (%)
1. Glibenclamide: crospovidone
(1:1.5)(KM) 12.5 8.3
2 MCCP 101.3 67.5
3 DCP 15.2 3.46
4 Maize starch 10 6.6
5 Magneisum stearate 2 1.3
6 Talc 2 1.3
7 Aspartame 2 1.3
8 Pineapple flavour 2 1.5
9 Crospovidone 3 2
Table.2: Formula for fast dissolving Glibenclamide tablets
Average Weight : 150 mg, Tooling: 7 mm flat round punch
Indian J.Pharm. Educ. Res. 44(4), Oct - Dec, 2010
338

Indian J.Pharm. Educ. Res. 44(4), Oct - Dec, 2010
S.No. Parameter Result
1. Compressibility Index (%) 13
2. Hausner ’ s ratio 1.160
3. Angle of repose 22±0.8°
Table.3: Micromeritic properties of prepared blend.
S.No. Parameter Values (mean ± S.D)
1 Average weight (mg) 150±0.2
2 Drug content (%) 99.26±0.62
3 Hardness (kg/cm 2 ) 3.5±0.07
4 Friability (%) 0.34±0.61
5 Disintegration time (sec) 20±0.25
6 Thickness (mm) 4.6±0.15
Table.4: Evaluation Parameters of Fast dissolving Glibenclamide tablets
Time in Cumulative% Drug Release Cumulative% Drug Release
Minutes fromprepared FDTs from commercial tablets
0 0 0
5 76.7 ± 1.94 29.7±0.91
10 84.2 ± 1.34 42.3±0.78
15 99.7 ± 0.96 49.2±1.56
20 99.9 ± 1.14 61.6±1.66
30 98.9 ± 1.02 81.8±1.05
45 - 87.3±0.98
60 - 98.5±1.65
Table.5: Percent drug release (n=3±SD) from prepared fast dissolving tablets and commercial tablets of glibenclamide.
Fig. 2: Dissolution profiles of pure drug, prepared fast
dissolving and commercial tablets of Glibenclamide.
339

REFERENCES
1. Seager H. Drug Delivery Products and the Zydis
Fast-dissolving Dosage Form. J. Pharm and
Pharmacol. 1998; 50: 375-382.
2. Bradoo R, Shahani S, Poojary S, Deewan B,
Sundarshan. Ind. J. of Pharm. Sci, 2001; 4: 27-31.
3. Habib W, Khankari R, Hontz J. Fast dissolving drug
delivery system. Crit Rev Ther Drug Carrier Syst.
2000;17:61-72.
4. Chang RK, Guo X, Burnside B, Couch R. Fast
dissolving tablets. Pharm Technolo.2000; 24(6): 52-
58.
5. Martindale, The Complete drug reference, 3 rd
Edition Page No: 319
6. Kumar R, Gupta R.B, Betageri G.V. Formulation,
characterization, and in vitro release of glyburide
from proliposomal beads. Drug Delivery. 2001; 8:
25-27. nm
7. Tashtoush B.M, Al-Qashi Z.S, Najib N.M. In vitro
and in vivo evaluation of glibenclamide in solid
dispersion systems. Drug Dev Ind Pharm. 2004; 30:
601-607.
8. Valleri M, Mura P, Maestrelli F, Cirri M, Ballerini R.
Development and evaluation of glyburide fast
dissolving tablets using solid dispersion technique.
Drug Dev Ind Pharm, 2004; 30: 525-534.
9. Kasture AV, Mahadik KR, Wadodkar SG, More HN.
Pharmaceutical analysis.10 th ed. Pune: 2004.
10. Pharmacopoeia of India, Vol-II, 3 rd Ed., The
controller of publication, Delhi, 1985; 501.
11. Banker, G.S. and Anderson, N.R. In: Lachman, L.,
Lieberman, H.A. and Kanig J.L., Eds, Varghese
publishing house, Bombay, 1991; 297.
12. Marshall, K., In : Lachman, H.A. and Kanig, J.L.,
Eds., The theory and practice of Industrial
pharmacy, 3 rd Ed., 4 th Indian Reprint, Varghese
Publishing House, Bombay, 1991; 297.
13. Marshall, K., In : Lachman, H.A. and Kanig, J.L.,
Eds., The theory and practice of Industrial
pharmacy, 3 rd Ed., 4 th Indian Reprint, Varghese
Publishing House, Bombay, 1991; 88.
Indian J.Pharm. Educ. Res. 44(4), Oct - Dec, 2010
340

Abstract
A simple, selective, precise and stability-indicating high-performance thin layer chromatographic method for
analysis of , both as the bulk drug and in a tablet formulation, has been developed and validated.
Aluminium foil TLC plates precoated with silica gel 60F 254 were used as stationary phase and
as mobile phase. A compact band (R ) was obtained F
for . Densitometric analysis was performed in absorbance mode at 220 nm. Linear regression analysis 2revealed a good linear relationship (r = ) between peak area and concentration in the range
ng /spot. The mean values ± SD of the slope and intercept were and , respectively. The
method was validated for precision, recovery, and robustness. The limits of detection and quantitation were and
ng/spot, respectively. was subjected to acid and alkaline hydrolysis, oxidation, and photochemical
and thermal degradation and underwent degradation under all these conditions. Statistical analysis proved the
method enables repeatable, selective, and accurate analysis of the drug. It can be used for identification and
quantitative analysis of in the bulk drug and in tablet formulations.
Key Words: , HPTLC, validation, stability-indicating, degradation
trandolapril (TRA)
trandolapril
Trandolapril
trandolapril
trandolapril
toluene: ethyl
acetate: methanol: formic acid (2.5: 8: 1: 0.5 v/v/v/v) 0.51 ± 0.02
0.9994 ± 0.01 300–1800
2.8006 ± 1.23 71.67 ± 1.11
200
270
Indian J.Pharm. Educ. Res. 44(4), Oct - Dec, 2010
INTRODUCTION
Trandolapril (TRA) 1-[2-[(1-ethoxycarbonyl-3-phenyl-
propyl) amino] propanoyl]-2, 3, 3a, 4, 5, 6, 7,7a octa
hydroindole-2-carboxylic acid, is an angiotensin-
converting-enzyme inhibitor (ACE inhibitor) used to
lower high blood pressure. It is the ethyl ester prodrug of
a nonsulfhydryl angiotensin converting enzyme (ACE) 1 inhibitor, trandolaprilat. Trandolapril has been
determined in combination with other drugs using 2 3 4-5potentiometry , enantioselective analysis , HPLC ,
6- 7liquid chromatography-tandem mass spectrometry , in
pharmaceutical preparations. As far as we are aware, no
stability-indicating high-performance thin-layer
chromatographic (HPTLC) method for analysis of
trandolapril in pharmaceutical dosage forms has been
reported in the literature. The parent drug stability test
guidelines (Q1A) issued by the International Conference
on Harmonisation (ICH) requires that analytical test
procedures for stability samples should be fully validated
8-10and the assays should be stability-indicating .
Accordingly, the objective of this work was to put the
ICH recommendations into practice by subjecting
t to variety of suggested stress test conditions
to establish intrinsic stability of the drug and to develop a
validated stability-indicating HPTLC assay.
working standards was kindly supplied as a
gift sample by
; it was certified to contain 99.67 % (w/w) on dried
basis and was used without purification. All chemicals
and reagent used were of analytical grade and were
purchased from Merck Chemicals, Mumbai, India. Tablet
containing 2 mg of TRA was purchase from local market.
HPTLC Instrumentation and conditions:
Chromatography was performed on 20 cm × 20 cm on
aluminium foil plates precoated with 0.2-mm layers of
silica gel 60F254 (E. Merck, Germany). Before use the
plates were prewashed by development with methanol
then dried in the current of dry air and activated at 110 °C
randolapril
Trandolapril
MATERIALS AND METHOD
Chemicals and reagents:
Ind-Swift Laboratories Limited, Patiyala,
India
Indian Journal of Pharmaceutical Education and ResearchReceived on 24/9/2009; Modified on 30/12/2009Accepted on 6/7/2010 © APTI All rights reserved
Stability Indicating HPTLC method for Estimation in the
Bulk Drug and Tablet Dosage Form
Department of Pharmaceutical Chemistry, Bharati Vidyapeeth University, Poona College of Pharmacy,
Pune – 411038, Maharashtra, India.
*Author for Correspondence: [email protected]
Trandolapril
Vikas, Rao J.R*, Sathiyanarayanan L and Yadav S.S.
341
for 5 min. Samples were applied as bands 6 mm wide, 6
mm apart, by use of a Camag (Switzerland) Linomat IV
equipped with a microlitre syringe. The mobile phase was
toluene: ethyl acetate: methanol: formic acid (2.5: 8:
1:0.5 v/v/v/v). Linear ascending development was
performed in a twin-trough glass chamber previously
saturated with mobile phase vapour for 30 min at room
temperature and relative humidity 60 ± 5%. The
development distance was approximately 80 mm. After
development the plates were dried in current of air by use
of an air dryer. Densitometric scanning, at 220 nm, was
performed with a Camag TLC scanner III in absorbance
mode. The source of radiation was a deuterium lamp
emitting a continuous UV spectrum in the range 190–400
nm. The slit dimensions were 5 mm × 0.45 mm.
Calibration:
A stock solution containing 1000 µg/ml TRA was
prepared in methanol. Different volumes of this solution
were applied to the plate resulting in application of 300-
1800 ng/spot to the plate. Each concentration was applied
seven times to the plate and the plate was developed as
described above. Peak areas were plotted against
corresponding concentrations to furnish the calibration
plot.
METHOD VALIDATION
Precision:
Repeatability of sample application and measurement of
peak area were assessed by chromatography of six
replicates of the same concentration (900 ng /spot TRA).
Intra-day and inter-day variation for determination of
TRA was measured at three different concentrations
(300, 900, 1500 ng/spot).
Robustness:
Small changes in the chromatographic conditions were
introduced and the effects on the results were examined.
Slight changes in the volume of formic acid ( ) and
Limits of Detection and Quantification:
To determine the limits of detection and quantification,
concentrations in the lower part of the linear range of the
calibration plot were used. Stock solution of TRA (1000
µg/ml) was prepared and different volumes in the range
± 0.1 ml
total volume of mobile phase (± 0.5 %) were made and the
peak areas were analysed. The time from spotting to
chromatography and time from chromatography to scan
was varied at 0 and 20 min.
200 to 600 ng were applied in triplicate. Amounts of TRA
per spot were plotted against average response (peak
area) and the regression equation was determined. The
standard deviations (SD) of responses and the average
standard deviations (ASD) were calculated. Detection
limit was calculated as (3.3 × ASD)/b and quantification
limit was calculated as (10 × ASD)/b, where 'b' denotes
the slope obtained in the linearity study.
Specificity:
The specificity of the method was determined by analysis
of drug standards and samples. The band for TRA in the
sample was identified by comparing the R value and F
spectrum of the band with those of the band from a
standard. The peak purity of TRA was assessed by
comparing spectra acquired at three different positions on
the peak, i.e. the peak start (S), peak apex (M), and peak
end (E) positions of the band.
Recovery:
To check the recovery of the drug at different levels in
formulations, analysed samples were spiked with an
extra 80, 100, and 120% of TRA standard and the
mixtures were reanalysed by the proposed method. The
experiment was conducted in triplicate.
Analysis of the Marketed Formulation:
To determine the TRA content of conventional tablets,
twenty tablets were weighed and powdered in a glass
mortar. An amount of powder equivalent to the average
weight of the one tablet TRA was transferred to a 10 ml
volumetric flask, extracted with methanol, sonicated for
30 min, diluted to volume with same solvent. The
resulting solution was filtered through a 0.45 µm filter
(Millifilter; Milford, MA, USA). The solution (800 ng
TRA) was applied to a plate for assay of TRA and the
TRA bands at R were observed in the densitogram F
obtained from tablets. There were no interferences from
the excipients commonly present in the tablets.
FORCED DEGRADATION OF
STANDARD
A stock solution containing 10 mg TRA in 10 ml
methanol was prepared. This solution was used for forced
degradation to provide an indication of the stability-
indicating property and specificity of the method. In all
degradation studies the average peak area of TRA after
application (5000 ng/spot) of seven replicates was
obtained after development and scanning of the plate as
0.51
TRANDOLAPRIL
Indian J.Pharm. Educ. Res. 44(4), Oct - Dec, 2010
342

described above.
Acid and Base-Induced Degradation:
TRA (10 mg) was separately dissolved in 10 ml of
methanolic solution of 1 N HCl and 0.01 N NaOH. These
solutions were refluxed at 80ºC for 6 h in the dark in order
to exclude the possible degradative effect of light. The
solutions (1 ml) were taken and neutralized and then
diluted up to 10 ml with methanol. The resultant solutions
were applied on TLC plate in triplicate (50 µl each, i.e.
5000 ng/spot). The plate was chromatographed as
described above.
Hydrogen Peroxide-Induced Degradation:
TRA (10 mg) was dissolved in 10 ml of methanolic
solution of hydrogen peroxide (30%, v/v) and the mixture
was kept for 48 h at room temperature in the dark, to
exclude the possible degradative effect of light. The
solution (1 ml) was then diluted to 10 ml with methanol
and treated as described for acid and base-induced
degradation.
Dry Heat Degradation:
The powdered drug was stored for 3 days under dry heat
conditions at 50°C. A solution of the treated powder was
then prepared and 5000 ng/spot was applied to a plate in
triplicate. The plate was then chromatographed and
treated as described above.
Photochemical Degradation:
TRA solution was left in sunlight for 7 days. The resultant
solution was treated as described for hydrogen peroxide-
induced degradation.
RESULTS AND DISCUSSION
HPTLC Method Optimisation and Validation:
The TLC procedure was optimised to develop a stability-
indicating method. Both pure drug and the degraded
products were spotted on the plates and chromatographed
with different mobile phases. Initially toluene
methanol in different ratios was tried. The mobile
phase
enabled good resolution, and a sharp and
symmetrical peak of R 0.51 for TRA (Fig. 1) from a F
compact and non-diffuse band. It was observed that
prewashing of TLC plates with methanol (followed by
drying and activation) and pre-saturation of TLC
chamber with mobile phase for 30 min (the optimum
saturation time) ensured good reproducibility and peak
shape of TRA.
: ethyl
acetate:
toluene: ethyl acetate: methanol: formic acid (2.5:
8: 1: 0.5 v/v/v/v)
Indian J.Pharm. Educ. Res. 44(4), Oct - Dec, 2010
VALIDATION
Linearity and range:
The linear regression data for the calibration plots
revealed a good linear relationship over the concentration 2 range of 300–1800 ng/spot (correlation coefficient, r =
0.9994). The results are shown in Table I.
Precision:
The precision of the method was expressed as relative
standard deviation (RSD, %). The results obtained (Table
II) revealed the high precision of the method.
Robustness:
When the standard deviation of peak area was calculated
for each change of conditions RSD was found to be less
than 2%. These low RSD values (Table III) indicated the
method is robust.
Recovery:
When the method was used for extraction and subsequent
analysis of TRA from pharmaceutical dosage forms after
spiking with 80, 100, and 120% of additional drug,
recovery was 99.06-99.31 % (Table IV).
Limits of Detection and Quantification:
The limits of detection and quantification calculated as
described above were 200 and 270 ng/spot, respectively.
This indicates the sensitivity of the method is adequate.
The results obtained from validation of the method are
summarized in Table V.
Specificity
The peak purity was assessed by comparing the spectra at
peak start, middle and apex positions of the spot. ie)., r
(S,M) = 0.9992 and r (M,E) = 0.9997 . Good correlation 2
was observed r = 0.998 between standard and sample.
Assay of Marketed Formulation:
A single spot of R 0. 51 was observed in chromatograms F
obtained from drug samples extracted from conventional
tablets. There was no interference from the excipients
commonly present in the tablets. The drug content was
found to be 99.04 ± 0.3855 . It may, therefore, be
inferred that degradation of TRA had not occurred in the
marketed formulations analysed by this method. The low
value of RSD indicates the method is suitable for routine
analysis of TRA in pharmaceutical dosage forms.
FORCED DEGRADATION
Acid and Base-Induced Degradation:
The chromatograms obtained from TRA contained
additional 2 peaks at R 0.38 and R 0.42 in the acid-F F
%
343

degraded samples and at R 0.38 and R 0.41 in the base-F F
degraded samples (Figures 2 and 3). The concentration of
the drug was different from the initial concentration,
indicating that TRA undergoes degradation under acidic
and basic conditions. The similar Rf values of the
degradation products obtained in both acid and alkali
hydrolysis may lead to the assumption that, TRA
undergoes degradation in similar manner in both
hydrolysis. In a previous study, diacid degradate was 12shown as the degradant in acid and alkali hydrolysis
which can be correlated with one of the degradants of the
TRA in the present study. However further studies needed
to isolate and charcterise the degradants.
Hydrogen Peroxide-Induced Degradation:
The chromatograms obtained from samples degraded
with hydrogen peroxide (Fig. 4) contained an additional 2
peaks at R 0.13 and R 0.19. The spot of the degradation F F
product was well resolved from that of the drug.
Dry Heat Degradation:
There was no significant degradation observed after 3
days under dry heat conditions at 50°C.
Photochemical Degradation:
Significant degradation was not observed in standards
left in daylight for 7 days.
CONCLUSION
The developed HPTLC technique is precise, specific,
accurate and stability indicating. The developed method
is able to discriminate between TRA and its possible
degradation products. Statistical analysis proves that the
method is suitable for the analysis of TRA as bulk drug
and in pharmaceutical formulation without any
interference from the excipients. The method can be used
to determine the purity of drug available from various
sources by detecting any related impurities. Because the
method could effectively separate the drugs from their
degradation products, it can be regarded as stability
indicating.
ACKNOWLEDGEMENTS
The authors are grateful to
providing samples of
as gift. The authors are also grateful to
Bharati Vidyapeeth University, Poona College of
Pharmacy, Pune, India, for providing excellent facilities
for carrying out this research work.
Ind-Swift Laboratories
Limited, Patiyala, India,
trandolapril
REFERENCES
1. http://www.rxlist.com/cgi/generic/trandolapril.htm,
2009 (accessed on 10.09.2009).
2. Stefan RI, Staden JF, Hassan Y. Detection of S-
enantiomers of cilazapril, pentopril and trandolapril
using a potentiometric, enantioselective membrane
electrode. Electroanalysis 1999; 11 : 192-194.
3. Hassan Y, Stefan RI, Radu GL. Biosensor for
enantioselective analysis of S- Cilazapril, S-
Trandolapril, and S-Pentopril. Pharm Develop Tech
1999; 4: 251 – 255.
4. Gumieniczek A, Hopkala H. Development and
validation of a liquid chromatographic method for
the determination of trandolapril and verapamil in
capsules. J Liq Chromatograph Related Tech. 2001;
24: 393 – 400.
5. Gumieniczek A, Hopkala H. High-performance
liquid chromatographic assay of trandolapril in
capsules. Acta Pol Pharm. 2000; 57: 253-5.
6. Nirogi RV, Kandikere VN, Shrivastava W,
Mudigonda K. Quantification of trandolapril and its
metabolite trandolaprilat in human plasma by liquid
chromatography/tandem mass spectrometry using
solid-phase extraction. Rapid Commun Mass
Spectrom. 2006; 20: 3709- 3716.
7. Pistos C, Koutsopoulou M, Panderi I. Liquid
chromatographic tandem mass spectrometric
determination of trandolapril in human plasma. Anal
Chimica Acta. 2005; 540: 375-382.
8. International Conference on Harmonisation (ICH)
of Technical Requirements for the Registration of
Pharmaceuticals for Human Use (2005) Validation
of Analytical Procedures: Text and Methodology Q2
(R1), 2005, pp. 1–13
9. International Conference on Harmonisation (ICH)
of Technical Requirementsfor the Registration of
Pharmaceutical for Human Use (2003) Stability
Testing of New Drugs Substance and Products Q1A
(R2), 2003, pp. 1–18
10. Sethi PD. High performance thin layer
chromatography, quantitative analysis of
pharmaceutical formulations, 2 nd edition, CBS
Publishers and distributors, New Delhi, 1996, 56-63.
Indian J.Pharm. Educ. Res. 44(4), Oct - Dec, 2010
344

Abstract
Doxepin is an important antidepressant drug useful in the treatment of mild to moderate endogenous depression. The
synthesis of doxepin involves acid catalysis leading to the formation of E- and Z- isomers. So herein, we report the use
and effect of various acid catalysts on the formation E- and Z- isomers. Characterization of both the isomers was
achieved by using HPLC and NMR. Both NMR and HPLC analysis showed that E-isomer as the major component.
Key Words: Doxepin, E and Z isomer, NMR and HPLC
Indian J.Pharm. Educ. Res. 44(4), Oct - Dec, 2010
INTRODUCTION
Many important and widely used drugs are marketed as
mixture of optical isomers that often differ in
pharmacological, toxicological and pharmacokinetic 1 2,3properties . Doxepin is a tricyclic antidepressant
compound. It is N, N-dimethyl-3-(dibenz[b,e] oxepin-
11(6H)-ylidene) propylamine. Doxepin exists as a 15:85
mixture of Z- and E- isomers of N,N-dimethyl-3-
dibenz[b,e]-oxepin-11(6H)-ylidene-1-propanamine. The
isomers have been evaluated in various neurochemical
and behavioral tests (e.g., NE and 5-HT uptake in nerve
terminals, antagononistic effects of reserpine, histamine
and 5-HT; effects on amphetamine stereotypy; sleep
potentiation; anticholinergic effects) and in most tests,
the Z-isomer is the more potent. However, the E-isomer is
much more potent than the Z-isomer in inhibiting 5-HT 4,5uptake in platelets .
Doxepin was synthesized using different acid catalysts.
Using NMR technique we were able to identify the
isomers and confirm the E- and Z- isomer formation in
the experiments involving use of various acids. This
study was confirmed by HPLC to know the percentage of 6, 7, 8both the isomers in doxepin .
MATERIAL AND METHOD
The chemicals and reagents used in the present project
were of AR grade and LR grade and are purchased from
Lancaster, Sigma and NRChem. Melting points of the
synthesized compounds were determined in open 1capillary tubes and were found uncorrected. HNMR(400
MHz) spectra were recorded in deuterated chloroform in
Amx-200 liquid state NMR spectrometer (Astra Zeneca,
Bangalore) using TMS as internal standard. HPLC
chromatograms were recorded on Shimadzu SPD10 A
UV—Visible detector, Ray Chemicals Pvt .
Ltd.,Yelahanka, Bangalore.
STEP-1: General procedure for preparation E- & Z-
isomers of N,N-dimethyl-3- (dibenzo[b,e]oxepin-
11(6H) ylidene) propylamine (1a-g):
(11R,S)-11-[3-(Dimethylamino)propyl]-6 ,11-9dihydrodibenzo[b,e]oxepin-11-ol [Compound I] (10g,
0.0333 mol) was taken in a 500 ml round bottom flask, to
which acid (0.0404 mol) and toluene (100 ml) were added
with stirring at 110 °C. The reaction mixture was stirred
for a period of 6-8 hr. After the reaction, the reaction
mixture was extracted with toluene and poured in to 150
ml of water and made basic to pH-9. Basic and toluene
layers were separated. Toluene was distilled out to form a
semisolid product. Acetone was added and made acidic to
pH-2 to obtain the final product. -1IR (KBR) cm :3068(ArC-H str), 2954(aliph C-Hstr),
1602(C=C, str), 1219(C-O-C str), 1107(C-N str)
(Compound 1a).1HNMR (TMS) δ: 6.74-7.41{m, 8H,Ar-H};5.95 {t,1H,
Unsat. C=CH-E-isomer}; 5.88{ t,1H, Unsat. C=CH-Z-
isomer};3.01-3.08{t,2H, CH -O-C }; 2.71-2.76 {s, 6H, 2 2
х CH }[Compound 1c- obtained from Tartaric acidL(+)]3
Indian Journal of Pharmaceutical Education and ResearchReceived on 18/2/2010; Modified on 28/6/2010Accepted on 30/8/2010 © APTI All rights reserved
Effect of Different Acids on the Formation of E and Z Isomers of
Doxepin 1 2 1 1G.K. Rao *, A.R. Ramesha , Amit Kumar Jain and B.V. AdaviRao
1Department of Pharmaceutical Chemistry, Al-Ameen College of Pharmacy-Bangalore2R.L.Fine Chemicals, Yelahanka, Bangalore
*Author for Correspondence: [email protected]
345

Compounds were obtained in the same manner by using
various acids (Table 1).
Determination of percentage of (Z) N,N-dimethyl-3-
(dibenzo[b,e]oxepin-11(6H) ylidene) propylamine
hydrochloride by High Performance Liquid
Chromatography:
Test solution: Dissolved 0.02 g of the N,N-dimethyl-3-
(dibenzo[b,e]oxepin-11(6H)ylidene) propylamine
hydrochloride in the mobile phase and dilute to 20 ml
with the mobile phase. 1 ml of this solution was diluted to
10 ml with the mobile phase.
Chromatographic Procedure:
Separation was carried out on ODS column of length 0.12
m and internal diameter 4mm. The column oven was set oat 50 C and detection was carried out at 254 nm. Mobile
phase comprised of a mixture of 30 volumes of methanol
and 70 volumes of a 30 g/l solution of sodium
dihydrogen phosphate, pH adjusted to 2.5 with
phosphoric acid.
Procedure:
20 µl of the test solution was injected. The system
sensitivity was adjusted so that the height of the principal
peak is at least 50 % of the full scale of the recorder. The
test is not valid unless the resolution between the first
peak (E-isomer) and the second peak (Z-isomer) is at
least 1.5.
The ratio of the area of the peak due to the E-isomer to the
area to the peak due to the Z-isomer is 4.4 to 6.7. The
percentage of both the isomers formed are tabulated in
Table 2.
RESULT AND DISCUSSION
The percentage of E-isomer is found to be higher than Z-
isomer in all the experiments. The conversion of (11R,S)-
1 1 - [ 3 - ( d i m e t h y l a m i n o ) p r o p y l ] - 6 , 1 1 -
dihydrodibenzo[b,e] oxepin-11-ol to E- & Z- N,N-
dimethyl-3-(dibenzo[b,e]oxepin-11(6H) ylidene)
propylamine was complete as shown by IR spectra with -1appearance of C=CH peak at 1602 cm .
1The H-NMR spectral analysis also revealed the
formation of the E- and Z- isomers, N,N-dimethyl-3-
(dibenzo[b,e]oxepin-11(6H) ylidene)propylamine at δ
value 5.95 and 5.88 respectively in all the experiments.
Further confirmation was done by HPLC, which showed
formation of E-isomer in the range of 80-85 % whereas Z-
isomer formation was in the range of 15-19 % for doxepin
Table 2.
Best results were obtained with Indian resin-220 for E-
isomer of doxepin (85%) while the other acids yielded
more than 80%.
CONCLUSION
The main focus of this research work was to understand
the effect of different acid catalysts on the formation of E-
and Z- isomers of Doxepin and to characterize the 1isomers by HNMR and HPLC methods. The yield of E-
isomer of doxepin was achieved in the range of 80-85%.
From the experiments conducted, the maleic acid (1a),
tartaric acid DL (1e), Indian resin-220 (1f) and p-toluyl
sulphonic acid (1g) were found to be ideal reagents for the
dehydration of the alcohol [compound-I] to form E- and
Z- isomers of doxepin. Ratio of E- and Z-isomers of
Doxepin obtained by NMR showed the range of 69:30
and 78:21 whereas in HPLC it was found to be in the
range of 80:19 and 85:15.
ACKNOWLEDGEMENT
The authors would like to thank Prof. B. G. Shivananda,
Principal, Al-Ameen College of Pharmacy, Bangalore
and Mr Anjan K. Roy, Managing Director, R.L.Fine
Chemicals, Bangalore for providing support and
necessary facilities, Department of Inorganic and
Physical Chemistry, Indian Institute of Science,
Bangalore, for providing help in obtaining the various
spectra.
Indian J.Pharm. Educ. Res. 44(4), Oct - Dec, 2010
346

Indian J.Pharm. Educ. Res. 44(4), Oct - Dec, 2010
SCHEME-1
Compound Acid Prac. % M.P.Code catalyst Yield Yield (ºC)
1a Maleic acid 8.5g 90 186-188
1b Oxalic acid 7.6g 81 186-188
1c Tartaric acid L(+) 9.2g 97 181-183
1d Phosphoric acid 8.2g 87 185-187
1e Tartaric acid DL 6.5g 70 187-189
1f Indian Resin-220 8.6g 92 187-189
1g p-Toluyl sulphonic acid 9.2g 98 188-190
Table 1: Percentage yield, Melting point of doxepin obtained with various acids
Sl. No. Compound Acid Used E:Z E:Z
1 1a Maleic acid 69:30 82:17 2 1b Oxalic acid 75:25 82:18
3 1c Tartaric acid L(+) 75:25 80:19
4 1d Phosphoric acid 75:25 82:18
5 1e Tartaric acid DL 78:21 83:17
6 1f Indian resin-220 75:25 85:15
7 1g p-Toluyl sulphonic acid 75:25 84:16
1( H-NMR) (HPLC)
Table 2: Percentage of Doxepin isomers evaluated by 1H-NMR and High performance liquid chromatography
347
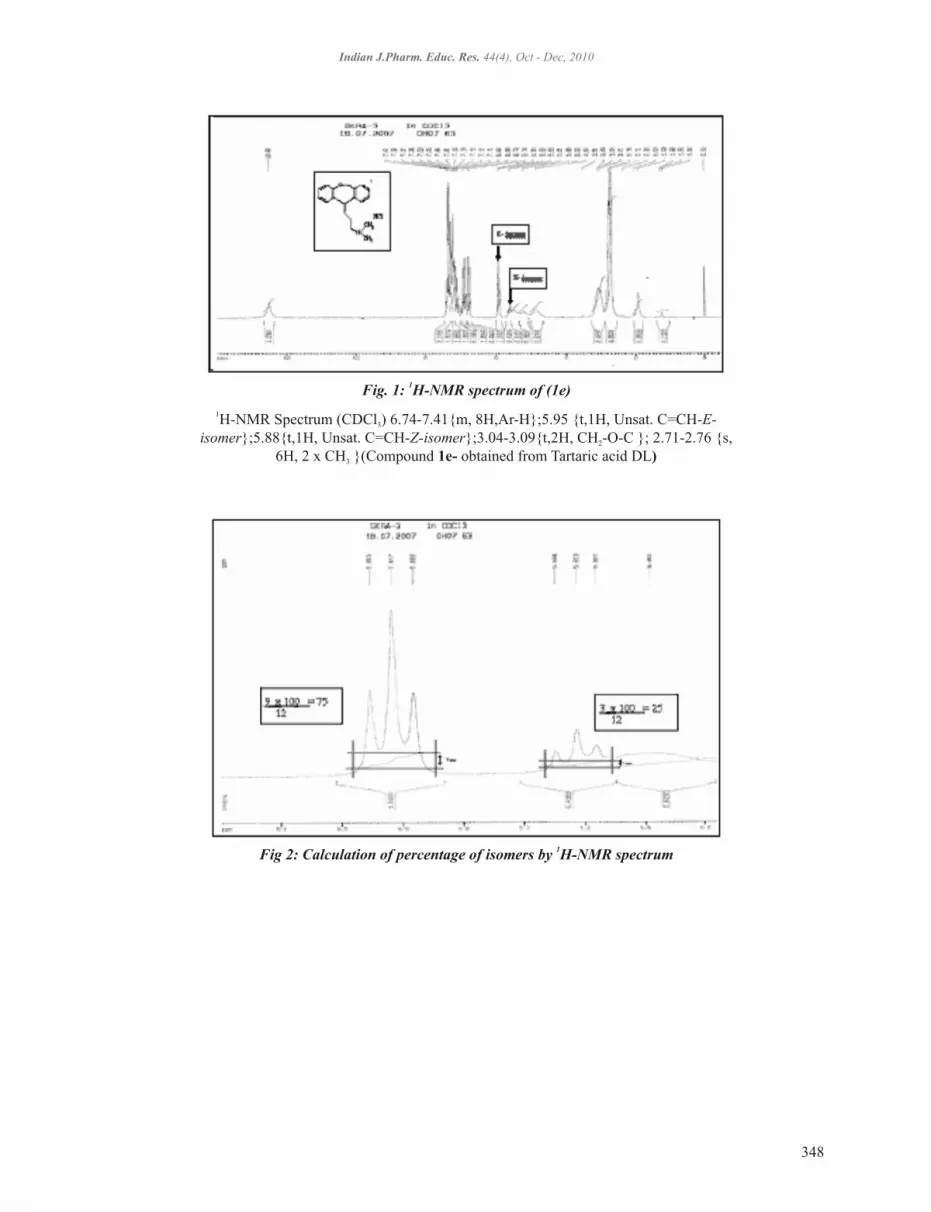
Indian J.Pharm. Educ. Res. 44(4), Oct - Dec, 2010
1Fig. 1: H-NMR spectrum of (1e)
1H-NMR Spectrum (CDCl ) 6.74-7.41{m, 8H,Ar-H};5.95 {t,1H, Unsat. C=CH-E-3
isomer};5.88{t,1H, Unsat. C=CH-Z-isomer};3.04-3.09{t,2H, CH -O-C }; 2.71-2.76 {s, 2
6H, 2 х CH }(Compound 1e- obtained from Tartaric acid DL)3
1Fig 2: Calculation of percentage of isomers by H-NMR spectrum
348

Indian J.Pharm. Educ. Res. 44(4), Oct - Dec, 2010
Refrence
1. Greven J, Defrain W, Glaser K, Meywald K,
Heidenreich O. Studies with the optically active
isomers of the new diuretic drug ozolinone. Eur. J.
Pharm.Sci., 1996; 4: 57-60.
2. Kaiser C, Setler PE. Antidepressants: Burger’s
Medicinal Chemistry and Drug Discovery. Vol-6.
New York. John Wiley and Sons Ltd. 2007: 485-510.
3. Hajak G, Rodenbeck A, Voderholzer U. Doxepin in
the treatment of primary insomnia: a placebo-
controlled, double-blind, polysomnographic study.
J. Clin. Psychiatry. 2001; 62(6):453-463.
4. Lane RM,Baker GB. Chirality and drugs used in
psychiatry: Nice to know or need to know? Cellular
and molecular neurobiology, 1999; 19(3):355-67.
5. Haritos VS, Ghabrial H, Ahokas JT, Ching MS.
Stereoselective measurement of E- and Z- doxepin
and its N-desmethyl and hydroxylated metabolites
by gas chromatography- mass spectrometry. J
Chrom. B. 1999; 736:201-08.
6. Badenhorst D, Sutherland FCW, Jager AD, Scans T,
Hundt HKL, Swart KJ, et al., Determination of
doxepin and desmethyldoxepin in human plasma
using liquid chromatography- tandem mass
spectrometry. J Chrom. B. 2000; 742:91-98.
7. Park YH. Quantitative determination of doxepin and
nordoxepin in urine by high- performance liquid
chromatography. J Chrom. 1986; 375:202-06.
8. Kabra PM, Mar NA, Marton LJ. Simultaneous
liquid chromatographic analysis of amitriptyline,
nortriptyline, imipramine, desipramine, doxepin and
nordoxepin. Clinica Chimica Acta. 1981; 111:123-
32.
9. Lednicer D, Mitscher LA, The organic chemistry of
drug synthesis-Vol-1, John Wiley and Sons Ltd.
New York, 1977, 404.
349

Abstract
Optimization techniques represent analytical tools available for the best possible solution to constrained and
unconstrained problems involved in an experiment. Optimization techniques encompass experimental design,
mathematical model and graphical outcomes which help achieve optimum results. Choices of optimization
techniques depend on the number of responses that are required to be optimized. The purpose of this study was to
develop an optimized formula for microwave synthesis of Schiff's bases by using suitable optimization techniques. A 23 factorial design was employed using the software Statease 7.1.6 for the microwave assisted synthesis of Schiff's
bases with microwave power and molar ratio as independent variables and yield and time required for the reaction as
dependent variables. Reaction of 2-(1H-imidazol-1-yl) acetohydrazide (3) with appropriate aromatic aldehydes in
presence of catalytic amount of glacial acetic acid yielded corresponding derivatives of N'-Substituted-2-(1H-
imidazol-1-yl) acetohydrazide (4a-4h). The microwave assisted organic synthesis of these Schiff's bases made the
procedure economical and eco-friendly thus maintaining the sustainability of Green Synthesis. 2Keywords: Schiff's Bases, Optimization, 3 Factorial design, Statease 7.1.6.
Indian J.Pharm. Educ. Res. 44(4), Oct - Dec, 2010
INTRODUCTION
The search of novel heterocyclic compounds has led to
the discovery of many molecules having tremendous
potential. These heterocyclic compounds have been
proven to be backbone for the discovery of several
biologically active compounds. Imidazole has been
noticed as an important part of many pharmaceuticals.
Substituted imidazoles are reported to possess anti-1-3 4fungal activity along with anti-mycobacterial activity .
Schiff's bases of various heterocyclic scaffolds exhibits 5varieties of biological activities like anti-HIV , anti-
6 7 8 cancer , antibacterial , fungicidal and anti-9inflammatory . Optimization techniques require less
experimentation to achieve optimum results. It yields
“best” solution in presence of competing objectives and
makes problem tracing and rectification easy. In view of
this, various novel derivatives of imidazole based Schiff's
bases were synthesized under microwave radiations and
the reaction parameters were optimized so as to achieve
maximum yield in minimum time without compromising
the purity of the product.
MATERIALS AND METHODS
Starting materials were obtained from commercial
suppliers and used without further purification. Synthesis
was performed using Catalyst Microwave Synthesizer.
All the melting points were determined by open capillary
method on a 'Veego' VMP-D apparatus and are
uncorrected. Silica gel G plates of 3x8 cm (Sigma-
Aldrich) were used for TLC and spots were located by
UV or in iodine chamber. The IR spectra were recorded in -1the 4000-400 cm range using KBr discs on FT-IR 8400
1SHIMADZU spectrometer. H NMR spectra were
recorded on Varian Mercury (300MHz) spectrometer in
CDCl with TMS as an internal standard and values are 3
expressed in δ ppm.
In the present study, imidazole was reacted with ethyl
bromoacetate to obtain ethyl – 2 – (1H-imidazol-1-yl) -
acetate (2) which was further converted to 2-(1H-
imidazol-1-yl) acetohydrazide (3) when reacted with
hydrazine hydrate. This hydrazide was treated with
various aromatic aldehydes in presence of catalytic
amount of glacial acetic acid to afford the Schiff's bases
Indian Journal of Pharmaceutical Education and ResearchReceived on 15/12/2009; Modified on 8/6/2010Accepted on 21/7/2010 © APTI All rights reserved
Application of Factorial Design in Optimization of Synthetic Reactions:
a Novel Approach*Pal Tanushree, Somani Rakesh R . and Kadam Vilasrao J.
Department of Pharmaceutical Chemistry, Bharati Vidyapeeth's College of Pharmacy, Sector 8, C.B.D.,
Navi Mumbai 400614 India.
*Author for Correspondence: [email protected]
350
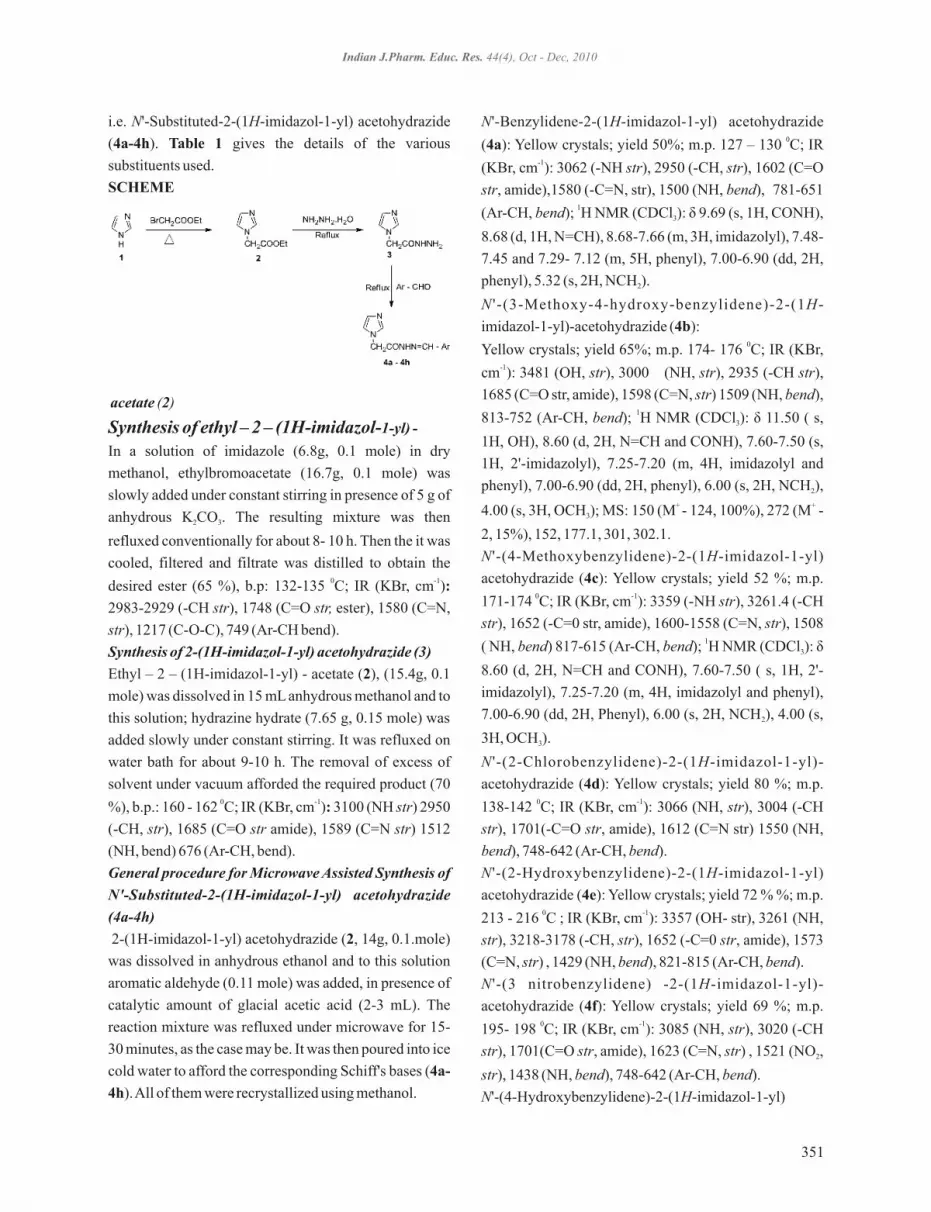
i.e. N'-Substituted-2-(1H-imidazol-1-yl) acetohydrazide
(4a-4h). Table 1 gives the details of the various
substituents used.
SCHEME
N'-Benzylidene-2-(1H-imidazol-1-yl) acetohydrazide 0(4a): Yellow crystals; yield 50%; m.p. 127 – 130 C; IR
-1(KBr, cm ): 3062 (-NH str), 2950 (-CH, str), 1602 (C=O
str, amide),1580 (-C=N, str), 1500 (NH, bend), 781-651 1(Ar-CH, bend); H NMR (CDCl ): δ 9.69 (s, 1H, CONH), 3
8.68 (d, 1H, N=CH), 8.68-7.66 (m, 3H, imidazolyl), 7.48-
7.45 and 7.29- 7.12 (m, 5H, phenyl), 7.00-6.90 (dd, 2H,
phenyl), 5.32 (s, 2H, NCH ).2
N ' -(3-Methoxy-4-hydroxy-benzylidene)-2-(1H-
imidazol-1-yl)-acetohydrazide (4b):0Yellow crystals; yield 65%; m.p. 174- 176 C; IR (KBr,
-1cm ): 3481 (OH, str), 3000 (NH, str), 2935 (-CH str),
1685 (C=O str, amide), 1598 (C=N, str) 1509 (NH, bend), 1813-752 (Ar-CH, bend); H NMR (CDCl ): δ 11.50 ( s, 3
1H, OH), 8.60 (d, 2H, N=CH and CONH), 7.60-7.50 (s,
1H, 2'-imidazolyl), 7.25-7.20 (m, 4H, imidazolyl and
phenyl), 7.00-6.90 (dd, 2H, phenyl), 6.00 (s, 2H, NCH ), 2
+ +4.00 (s, 3H, OCH ); MS: 150 (M - 124, 100%), 272 (M - 3
2, 15%), 152, 177.1, 301, 302.1.
N '-(4-Methoxybenzylidene)-2-(1H-imidazol-1-yl)
acetohydrazide (4c): Yellow crystals; yield 52 %; m.p. 0 -1171-174 C; IR (KBr, cm ): 3359 (-NH str), 3261.4 (-CH
str), 1652 (-C=0 str, amide), 1600-1558 (C=N, str), 1508 1( NH, bend) 817-615 (Ar-CH, bend); H NMR (CDCl ): δ 3
8.60 (d, 2H, N=CH and CONH), 7.60-7.50 ( s, 1H, 2'-
imidazolyl), 7.25-7.20 (m, 4H, imidazolyl and phenyl),
7.00-6.90 (dd, 2H, Phenyl), 6.00 (s, 2H, NCH ), 4.00 (s, 2
3H, OCH ).3
N '-(2-Chlorobenzylidene)-2-(1H-imidazol-1-yl)-
acetohydrazide (4d): Yellow crystals; yield 80 %; m.p. 0 -1138-142 C; IR (KBr, cm ): 3066 (NH, str), 3004 (-CH
str), 1701(-C=O str, amide), 1612 (C=N str) 1550 (NH,
bend), 748-642 (Ar-CH, bend).
N '-(2-Hydroxybenzylidene)-2-(1H-imidazol-1-yl)
acetohydrazide (4e): Yellow crystals; yield 72 % %; m.p. 0 -1213 - 216 C ; IR (KBr, cm ): 3357 (OH- str), 3261 (NH,
str), 3218-3178 (-CH, str), 1652 (-C=0 str, amide), 1573
(C=N, str) , 1429 (NH, bend), 821-815 (Ar-CH, bend).
N '-(3 nitrobenzylidene) -2-(1H-imidazol-1-yl)-
acetohydrazide (4f): Yellow crystals; yield 69 %; m.p. 0 -1195- 198 C; IR (KBr, cm ): 3085 (NH, str), 3020 (-CH
str), 1701(C=O str, amide), 1623 (C=N, str) , 1521 (NO , 2
str), 1438 (NH, bend), 748-642 (Ar-CH, bend).
N'-(4-Hydroxybenzylidene)-2-(1H-imidazol-1-yl)
Indian J.Pharm. Educ. Res. 44(4), Oct - Dec, 2010
acetate (2)
Synthesis of ethyl – 2 – (1H-imidazol-1-yl) -
In a solution of imidazole (6.8g, 0.1 mole) in dry
methanol, ethylbromoacetate (16.7g, 0.1 mole) was
slowly added under constant stirring in presence of 5 g of
anhydrous K CO . The resulting mixture was then 2 3
refluxed conventionally for about 8- 10 h. Then the it was
cooled, filtered and filtrate was distilled to obtain the 0 -1desired ester (65 %), b.p: 132-135 C; IR (KBr, cm ):
2983-2929 (-CH str), 1748 (C=O str, ester), 1580 (C=N,
str), 1217 (C-O-C), 749 (Ar-CH bend).
Synthesis of 2-(1H-imidazol-1-yl) acetohydrazide (3)
Ethyl – 2 – (1H-imidazol-1-yl) - acetate (2), (15.4g, 0.1
mole) was dissolved in 15 mL anhydrous methanol and to
this solution; hydrazine hydrate (7.65 g, 0.15 mole) was
added slowly under constant stirring. It was refluxed on
water bath for about 9-10 h. The removal of excess of
solvent under vacuum afforded the required product (70 0 -1%), b.p.: 160 - 162 C; IR (KBr, cm ): 3100 (NH str) 2950
(-CH, str), 1685 (C=O str amide), 1589 (C=N str) 1512
(NH, bend) 676 (Ar-CH, bend).
General procedure for Microwave Assisted Synthesis of
N'-Substituted-2-(1H-imidazol-1-yl) acetohydrazide
(4a-4h)
2-(1H-imidazol-1-yl) acetohydrazide (2, 14g, 0.1.mole)
was dissolved in anhydrous ethanol and to this solution
aromatic aldehyde (0.11 mole) was added, in presence of
catalytic amount of glacial acetic acid (2-3 mL). The
reaction mixture was refluxed under microwave for 15-
30 minutes, as the case may be. It was then poured into ice
cold water to afford the corresponding Schiff's bases (4a-
4h). All of them were recrystallized using methanol.
351
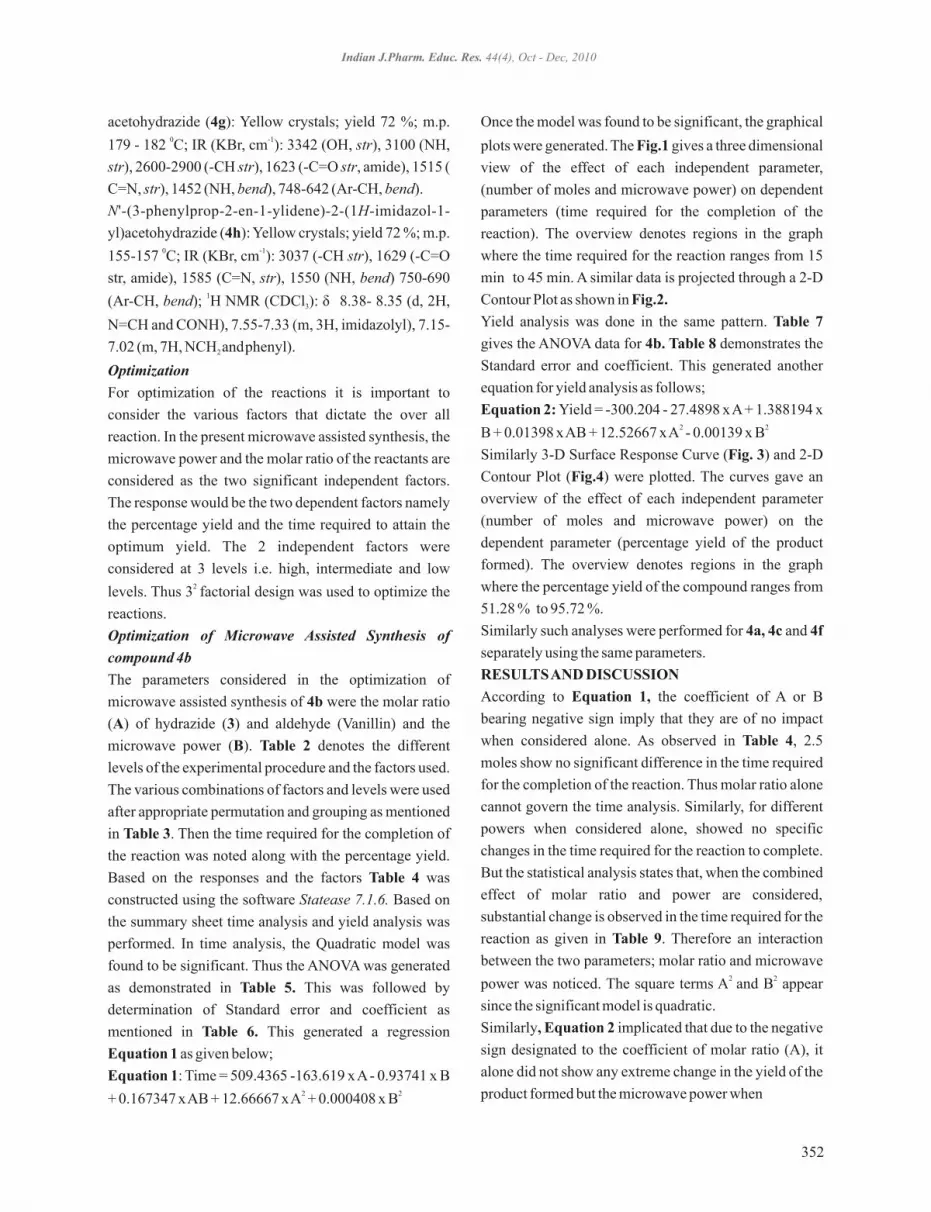
acetohydrazide (4g): Yellow crystals; yield 72 %; m.p. 0 -1179 - 182 C; IR (KBr, cm ): 3342 (OH, str), 3100 (NH,
str), 2600-2900 (-CH str), 1623 (-C=O str, amide), 1515 (
C=N, str), 1452 (NH, bend), 748-642 (Ar-CH, bend).
N'-(3-phenylprop-2-en-1-ylidene)-2-(1H-imidazol-1-
yl)acetohydrazide (4h): Yellow crystals; yield 72 %; m.p. 0 -1155-157 C; IR (KBr, cm ): 3037 (-CH str), 1629 (-C=O
str, amide), 1585 (C=N, str), 1550 (NH, bend) 750-690 1(Ar-CH, bend); H NMR (CDCl ): δ 8.38- 8.35 (d, 2H, 3
N=CH and CONH), 7.55-7.33 (m, 3H, imidazolyl), 7.15-
7.02 (m, 7H, NCH andphenyl).2
Optimization
For optimization of the reactions it is important to
consider the various factors that dictate the over all
reaction. In the present microwave assisted synthesis, the
microwave power and the molar ratio of the reactants are
considered as the two significant independent factors.
The response would be the two dependent factors namely
the percentage yield and the time required to attain the
optimum yield. The 2 independent factors were
considered at 3 levels i.e. high, intermediate and low 2 levels. Thus 3 factorial design was used to optimize the
reactions.
Optimization of Microwave Assisted Synthesis of
compound 4b
The parameters considered in the optimization of
microwave assisted synthesis of 4b were the molar ratio
(A) of hydrazide (3) and aldehyde (Vanillin) and the
microwave power (B). Table 2 denotes the different
levels of the experimental procedure and the factors used.
The various combinations of factors and levels were used
after appropriate permutation and grouping as mentioned
in Table 3. Then the time required for the completion of
the reaction was noted along with the percentage yield.
Based on the responses and the factors Table 4 was
constructed using the software Statease 7.1.6. Based on
the summary sheet time analysis and yield analysis was
performed. In time analysis, the Quadratic model was
found to be significant. Thus the ANOVA was generated
as demonstrated in Table 5. This was followed by
determination of Standard error and coefficient as
mentioned in Table 6. This generated a regression
Equation 1 as given below;
Equation 1: Time = 509.4365 -163.619 x A - 0.93741 x B 2 2+ 0.167347 x AB + 12.66667 x A + 0.000408 x B
Indian J.Pharm. Educ. Res. 44(4), Oct - Dec, 2010
Once the model was found to be significant, the graphical
plots were generated. The Fig.1 gives a three dimensional
view of the effect of each independent parameter,
(number of moles and microwave power) on dependent
parameters (time required for the completion of the
reaction). The overview denotes regions in the graph
where the time required for the reaction ranges from 15
min to 45 min. A similar data is projected through a 2-D
Contour Plot as shown in Fig.2.
Yield analysis was done in the same pattern. Table 7
gives the ANOVA data for 4b. Table 8 demonstrates the
Standard error and coefficient. This generated another
equation for yield analysis as follows;
Equation 2: Yield = -300.204 - 27.4898 x A + 1.388194 x 2 2B + 0.01398 x AB + 12.52667 x A - 0.00139 x B
Similarly 3-D Surface Response Curve (Fig. 3) and 2-D
Contour Plot (Fig.4) were plotted. The curves gave an
overview of the effect of each independent parameter
(number of moles and microwave power) on the
dependent parameter (percentage yield of the product
formed). The overview denotes regions in the graph
where the percentage yield of the compound ranges from
51.28 % to 95.72 %.
Similarly such analyses were performed for 4a, 4c and 4f
separately using the same parameters.
RESULTS AND DISCUSSION
According to Equation 1, the coefficient of A or B
bearing negative sign imply that they are of no impact
when considered alone. As observed in Table 4, 2.5
moles show no significant difference in the time required
for the completion of the reaction. Thus molar ratio alone
cannot govern the time analysis. Similarly, for different
powers when considered alone, showed no specific
changes in the time required for the reaction to complete.
But the statistical analysis states that, when the combined
effect of molar ratio and power are considered,
substantial change is observed in the time required for the
reaction as given in Table 9. Therefore an interaction
between the two parameters; molar ratio and microwave 2 2power was noticed. The square terms A and B appear
since the significant model is quadratic.
Similarly, Equation 2 implicated that due to the negative
sign designated to the coefficient of molar ratio (A), it
alone did not show any extreme change in the yield of the
product formed but the microwave power when
352

considered alone could create noticeable changes in the
percentage yield because the equation denotes a positive
sign for the power B. And the interaction of A and B
together shows considerable difference in the results of
the percentage yield observed.
The optimized solutions obtained for 4b (Table 9) were
compared and it was found that Solution 7 gave the
highest possible yield. But the time required for the
completion of the reaction was more than that of the other
solutions and the power required was less as compared to
others. But the desirability of the reaction is not 1. Thus
the closeness of the response to the target value is not
precise. Looking through all the 7 solutions, solution 5 is
the best possible optimized result and the others were
near about the best possible optimized condition for the
synthesis of the Schiff's base (4b). Thus, molar fraction of
1:1.96- 1:2 with microwave power ranging somewhere
between 535-560 watts gave the best percentage yield of
4b. This yield was achievable within 14.9- 16.22 min,
which made the entire procedure economical and less
time consuming.
Optimized solutions suggested by the software for
microwave assisted synthesis of 4a were use of molar
proportion of 1:2 of the reactants at 560 watts which
afforded maximum yield of 60.41 % within minimum
time of 17.76 min. For 4c, yield ranging from 62-64 %
using molar proportion of 1:1.7-1:1.8 and microwave
power of 552-560 watts in 14.1-14.9 min were the best
possible optimized conditions for the microwave assisted
synthesis. Finally for 4f, the molar proportion ranging
from 1:1.9-1:2 and the power – 510-535 watts helps
achieving the optimum responses of yield 78-79% in
16.4-16.9 min.
CONCLUSION
Traditional method of synthesis is comparatively slow,
non-uniform and inefficient method for transferring
energy into the system because it depends on thermal
conductivity of the various materials. By contrast
microwave irradiation produces efficient internal heating
by direct coupling of microwave energy with polar
molecules. Optimizing the various variables of the
microwave helped achieve an economical and eco-
friendly methodology for the synthesis of the mentioned
azo compounds. Experiments performed showed that
maximum yield was attainable in minimum time when
molar proportion of the reactants was 1:2 (Hydrazide:
aldehyde) used along with the microwave power of 560
watts. The results obtained through the software
confirmed that the optimum condition for the scheme of
reaction lies in the range of molar proportion 1:1.7-1:1.9
and microwave power of 513-560 watts. The results were
more refined in the case of software. Thus it can be
concluded that the optimum solutions are super-
imposable and pose to be the best conditions to
synthesize the series of Schiff's bases under microwave
energy.
4a 4e
4f
HO
CI
2NO
4b
4c
OH
3OCH
3OCH OH4g
4h4d
Indian J.Pharm. Educ. Res. 44(4), Oct - Dec, 2010
Table 1: Various substituents in titled compounds (4a-4h):
353
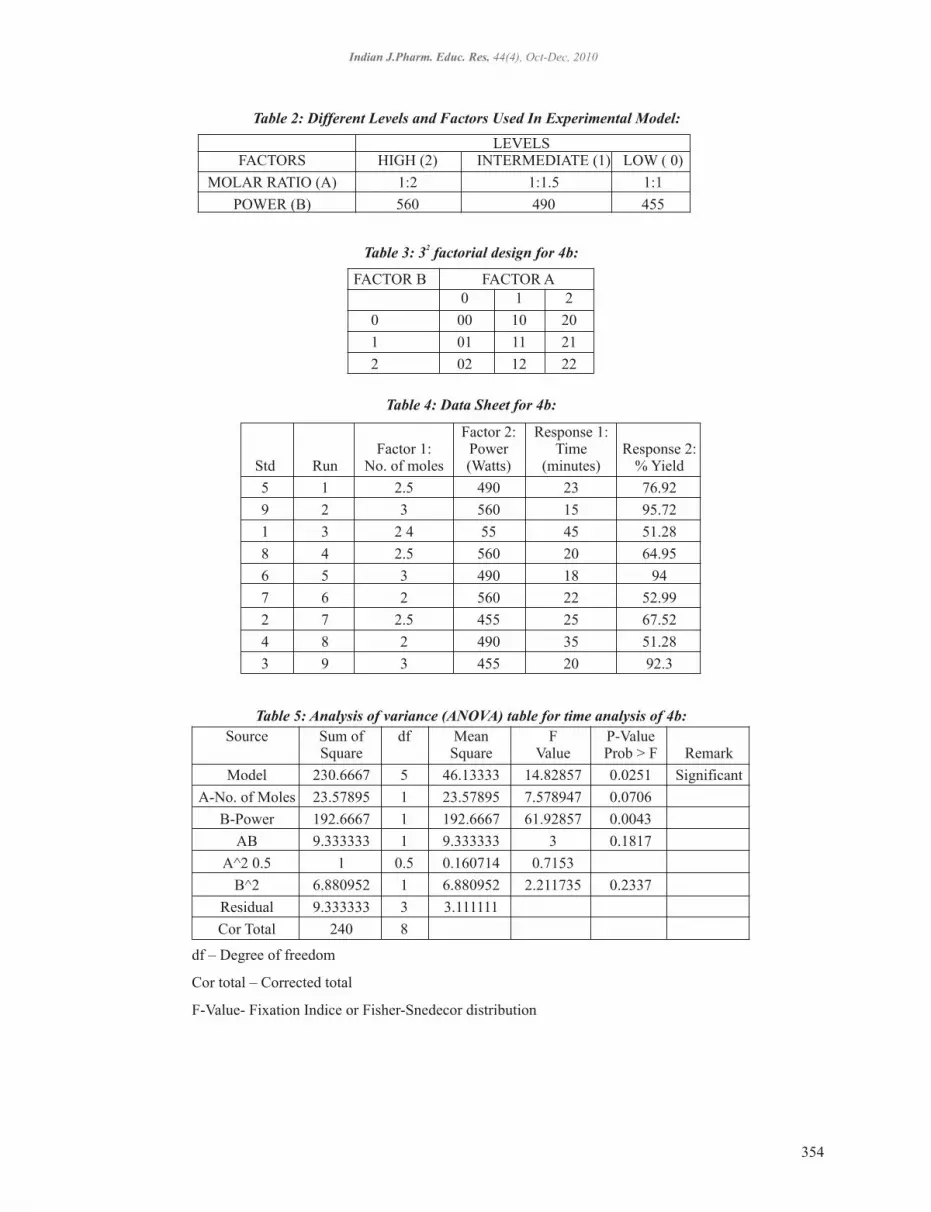
Factor 2: Response 1:Factor 1: Power Time Response 2:
Std Run No. of moles (Watts) (minutes) % Yield
5 1 2.5 490 23 76.92
9 2 3 560 15 95.72
1 3 2 4 55 45 51.28
8 4 2.5 560 20 64.95
6 5 3 490 18 94
7 6 2 560 22 52.99
2 7 2.5 455 25 67.52
4 8 2 490 35 51.28
3 9 3 455 20 92.3
Indian J.Pharm. Educ. Res. 44(4), Oct-Dec, 2010
HIGH (2) INTERMEDIATE (1) LOW ( 0)
MOLAR RATIO (A) 1:2 1:1.5 1:1
POWER (B) 560 490 455
FACTORSLEVELS
Table 2: Different Levels and Factors Used In Experimental Model:
2Table 3: 3 factorial design for 4b:
0 1 2
0 00 10 20
1 01 11 21
2 02 12 22
FACTOR B FACTOR A
Table 4: Data Sheet for 4b:
Source Sum of df Mean F P-Value Square Square Value Prob > F Remark
Model 230.6667 5 46.13333 14.82857 0.0251 Significant
A-No. of Moles 23.57895 1 23.57895 7.578947 0.0706
B-Power 192.6667 1 192.6667 61.92857 0.0043
AB 9.333333 1 9.333333 3 0.1817
A^2 0.5 1 0.5 0.160714 0.7153
B^2 6.880952 1 6.880952 2.211735 0.2337
Residual 9.333333 3 3.111111
Cor Total 240 8
Table 5: Analysis of variance (ANOVA) table for time analysis of 4b:
df – Degree of freedom
Cor total – Corrected total
F-Value- Fixation Indice or Fisher-Snedecor distribution
354

Indian J.Pharm. Educ. Res. 44(4), Oct - Dec, 2010
Factor Coefficient df Standard 95% CI 95% CIEstimate Error Low High VIF
Intercept 21.875 1 1.44391 17.27983 26.47017
A-no. of moles -2 1 0.726483 -4.312 0.311996 1.017857
B-Power -5.66667 1 0.720082 -7.95829 -3.37504 1.037037
AB 1.5 1 0.866025 -1.25608 4.256082 1.017857
A^2 0.5 1 1.247219 -3.46921 4.469211 1
B^2 2.125 1 1.428869 -2.4223 6.672303 1.037037
Table 6: Details of Coefficient and Standard Error for time analysis of 4b :
df – Degree of freedom
CI- Confidence Interval
VIF- Variance Inflation Factor
Source Sum of df Mean F P-Value Square Square Value Prob > F Remark
Model 1944.228 5 388.8455 10.27646 0.0418 Significant
A-No. of Moles 1668.261 1 1668.261 44.08903 0.0070
B-Power 80.44682 1 80.44682 2.12606 0.2409
AB 13.60048 1 13.60048 0.359435 0.5911
A^2 174.16 1 174.16 4.602725 0.1212
B^2 6.302688 1 6.302688 0.166568 0.7106
Residual 113.5154 3 37.83846
Cor Total 2057.743 8
df – Degree of freedomCor total – Corrected totalF-Value- Fixation Indice or Fisher-Snedecor distribution
Table 7: Analysis of variance (ANOVA) table for yield analysis of 4b:
Factor Coefficient df Standard 95% CI 95% CIEstimate Error Low High VIF
Intercept 42.69569 1 5.035576 26.67023 58.72116
A-no. of moles 16.82286 1 2.533579 8.75987 24.88584 1.017857
B-Power 3.661667 1 2.511257 -4.33028 11.65361 1.037037
AB 1.810714 1 3.020227 -7.801 11.42243 1.017857
A^2 -9.33167 1 4.349624 -23.1741 4.51079 1
B^2 2.03375 1 4.98312 -13.8248 17.89228 1.037037
df – Degree of freedom
CI- Confidence Interval
VIF- Variance Inflation Factor
Table 8: Details of Coefficient and Standard Error for yield analysis of 4b:
355

Indian J.Pharm. Educ. Res. 44(4), Oct - Dec, 2010
Solution No. of Power Time %Yield
1 2.996047 559.8151 14.99174 93.555 1
2 2.998895 559.0205 14.98958 93.81591 1
3 3 560 14.92857 93.74996 1
4 2.998514 559.4075 14.97674 93.74483 1
5 2.999939 558.573 14.99638 93.93107 1
6 2.964736 559.9996 15.40871 91.8085 0.972753
7 2.979851 535.8595 16.22988 94.99997 0.918008
Desirability
Moles (Watts) Req. Min.
Table 9: Solution for optimum conditions required for microwave assisted
synthesis of N'-(3-Methoxy-4-hydroxy benzylidene)-2-(1H-imidazol-1-yl) acetohydrazide (4b):
Fig.1: 3D Surface Response curve for time analysis of 4b: Fig. 2: 2D Contour Plot for time analysis of 4b:
Fig. 3: 3D Surface Response curve for yield analysis of 4b: Fig. 4: 2D Contour Plot for yield analysis of 4b
356

Indian J.Pharm. Educ. Res. 44(4), Oct - Dec, 2010
Refrence
1. Dorota O, Justyna Z, Victor L, Roman L, Aleksandra
K, Andrzej F, Lucjusz Z, Synthesis of some N-
substituted nitroimidazole derivatives as potential
antioxidant and antifungal agents, Eur. J. Med.
Chem. 2009; 44: 645-652.
2. Hori K, Csakaguchi A, Kudoh M, Ishida K,
Aoyama Y, Yoshida Y, Structure-Activity
Relationships of a New Antifungal Imidazole, AFK-
108, and Related Compounds. Chem Pharm Bull.
2000; 48(1):60-64.
3. Andriole VT. Current and future antifungal therapy:
new targets for antifungal agents. J Antimicrob
Chemother 1999; 44:151–62.
4. Daniele Z, Maria GM, Luciano V, Elena B, Giuditta
S, Maurizio F, Marco F, Sabrina P. Synthesis,
antifungal and antimycobacterial activities of new
bis-imidazole derivatives, and prediction of their
binding to P450 by molecular docking and 14DM
MM/PBSA method. Bioorg. Med. Chem. 2007;
15(23): 7444-7458.
5. Pandeya SN, Sriram D, Nath G, Clercq E.D.
Synthesis, antibacterial, antifungal and anti-HIV
evaluation of Schiff and Mannich bases of isatin
derivatives with 3-amino-2-methylmercapto
quinazolin-4(3H)-one. Pharm. Acta Helvetiae.
1999; 74(1): 11-17
6. Kuz'min VE, Lozitsky VP, Kamalov GL, Lozitskaya
RN, Zheltvay AI, Fedtchouk AS, Kryzhanovsky
DN. Analysis of the structure-anticancer activity
relationship in a set of Schiff bases of macrocyclic
2,6-bis(2- and 4-formylaryloxymethyl)pyridines.
Acta Biochim Pol. 2000; 47(3):867-875.
7. Nair R, Shah A, Baluja S, Chanda S. Synthesis and
antibacterial activity of some Schiff base complexes.
J. Serbian Chem. Soc. 2006; 71(7): 733-744.
8. Xiao-Hong S, Yan T, Yuan-Fa L, Bang C. Synthesis
and Biological Activities of Substituted
Triazolethione Schiff Base. Chin. J. Chem. 2007;
25(10): 1573-1576.
9. Glenn HH, Leslie DW. Schiff base derivatives of
anti-inflammatory o-substituted hydroxylamines. J.
Pharm. Sci. 1971; 60(6): 925-927
357

Abstract
A series of pyrazole derivatives of benzimidazole were synthesized. Condensation of substituted o-phenylene diamine
with lactic acid under microwave irradiation and further oxidation of the product with potassium dichromate gave
intermediate 2-acetyl benzimidazole which was then reacted with aromatic aldehydes and finally the product was
cyclized with hydrazine to form pyrazole derivatives of benzimidazoles. Compounds IVa,b,c,d,e have shown
significant anti bacterial and compounds IV b,g have shown significant anti cancer activity when compared with
standard drugs.
Key words: benzimidazole, pyrazole, anti cancer and antibacterial
Indian J.Pharm. Educ. Res. 44(4), Oct - Dec, 2010
INTRODUCTION
The benzimidazole and pyrazole nucleus are an
important structures in numerous natural and synthetic
compounds and in medicinal chemistry. Benzimidazole
derivatives are known to possess antifungal, anti-
bacterial, antiviral anthelmintic analgesic, anti-, ,
inflammatory, anti-neoplastic, depressive, hypnotic, 1-8.anti-pyretic and anti-spasmolytic, activities Thus, we
became interested in the synthesis of pyrazole-
substituted benzimidazoles by using microwave
technique and also evaluation of their biological
activities. Microwave assisted reactions have received
great interest because of their simplicity in operation,
enhanced reaction rates, products with high purity and
better yields compared to those conducted by
conventional heating.
MATERIALS AND METHODS9,10Antibacterial activity
The antibacterial activity of the synthesized compounds
was determined by cup plate method. The test organism
chosen were S.aureus (ATCC 25923), E.coli (ATCC
25922) and p.aeruginosa (ATCC 27853) and B.subtillis,.
The concentration of the sample compounds was
100mcg/ml. Gentamycin was used as a standard drug.
The results are reported in the Table no.4.
11Anticancer activity
The anticancer activity of the synthesized compounds
was determined by SRB assay method, against Human
Breast cancer cell line –MCF7. The concentration of the
sample compounds was 100mcg/ml. Doxorubicin
(Adriamycin, ADR) was used as a standard drug. This
study was carried out at TATA memorial centre
(ACTREC), Navi Mumbai and the results are reported in
the Table no.5.
EXPERIMENTAL
Melting points were determined in open capillary method
and are uncorrected. The compounds were routinely
checked by TLC on silica gel G plates for their purity. IR
Spectra (Shimadzu 8400S FTIR Spectrometer) was 1recorded using KBr disc method. H NMR spectrum was
recorded (Bruker NRC 400MHz spectrometer) using
DMSO as a solvent and mass spectra was recorded on a
Shimadzu 2010A LC-MS spectrophotometer. The
reactions were carried out in catalyst synthetic
microwave oven. The physical and spectral data of the
synthesized compounds are reported in the Table no. 2
and 3 respectively.
Synthesis of 1-(1H-Benzo [D] Imidazol-2-Yl) ethanol
(Compound-I)
1-(1H-benzo[d]imidazol-2-yl) ethanol was prepared by
the reaction of 0.1 mol (10g) of o-phenylenediamine
with 0.1 mol (9 ml) of lactic acid. The mixture was Indian Journal of Pharmaceutical Education and ResearchReceived on 21/7/2009; Modified on 11/6/2010Accepted on 23/7/2010 © APTI All rights reserved
Microwave Assisted Synthesis and Biological Evaluation of Pyrazole
Derivatives of Benzimidazoles
R. Kalirajan*, Leela Rathore, S. Jubie, B.Gowramma, S. Gomathy, S. Sankar
and K. Elango 1Department of Pharmaceutical Chemistry, JSS College of Pharmacy, Ooty - 643001, Tamilnadu
*Author for Correspondence: [email protected], [email protected]
358

refluxed in microwave oven in the intensity of 20 %( 210
Watts) for 7 min. The mixture was cooled and added with
10% NaOH until basicity to litmus paper. Then the
product was filtered, dried and recrystallized from hot
water.
Synthesis of 2-Acetyl Benzimidazole (Compound-II)
To a solution of the compound-I (10mmol) in aqueous
acetic acid (5% v/v, 10 ml) was added at room
temperature with the solution of potassium di chromate
(10mmol) in aqueous acetic acid (5% v/v,10 ml) and the
mixture was stirred for 15 min. The separated product
was filtered, washed with water and dried. The dried
product was recrystallized with ethanol.
Synthesis of Aromatic Aldehydes Derivatives of
Benzimidazole (Compounds -IIIa-h)
To a solution of Compound - II (10mmol) in aq.NaOH
(10 %, 30ml) was added with the respective aldehydes
(10mmol) at room temperature. The reaction mixture was
stirred for 30 min and the separated solid was filtered,
washed with water and the crude product was
recrystallized from ethanol.
Synthesis of pyrazole Derivatives of benzimidazoles
(Compounds IV a-h)
A mixture of compound III a-h (0.03 mol), hydrazine
(0.03 mol) were mixed in ethanolic sodium acetate
(25ml) was refluxed under microwave in different
conditions (Table No.1). The mixture was concentrated
in water bath and poured into ice cold water. The
precipitate obtained was filtered, washed and
recrystallized from ethanol.
RESULTS AND DISCUSSION
All the synthesized final compounds were first analyzed
by performing TLC and melting point determination.
Then the synthesized compounds were subjected to 1spectral analysis such as IR, mass and HNMR Spectra to
confirm their structure. All the analytical data showed
satisfactory results.
All the synthesized compounds were screened for their
anti-bacterial activity against two Gram-Positive
bacteria such as B. Subtilis, S. aureus as well as two
Gram-negative bacteria such as P.aeruginosa, E. coli by
the cup and plate method.
Compounds (IV-a,d,e) showed significant activity
against S. aureus as well as B. Subtilis. Compounds (IV-
b,c,d) showed significant activity against E. coli and
Compound (IV-b) showed significant activity against P.
aeruginosa.
All the eight compounds were screened for their
anticancer activity against MCF7 human breast cell line
used in in-vitro methods. Only the Compounds (IV-b, g)
have significant activity when compared with standard
drug.
S.No. Compounds Intensity Power in Watts Reaction time
1 IV-a 20% 210 30 min
2 IV-b 10% 140 32 min
3 IV-c 10% 140 35 min
4 IV-d 20% 210 30 min
5 IV-e 20% 210 30 min
6 IV-f 10% 140 34 min
7 IV-g 20% 210 30 min
8 IV-h 20% 210 30 min
Indian J.Pharm. Educ. Res. 44(4), Oct - Dec, 2010
Table 1: Microwave conditions for synthesis of compounds IV a-h
359

Indian J.Pharm. Educ. Res. 44(4), Oct - Dec, 2010
CH CH(OH)COOH3NH2
NH2
O-Phenylene diamine
M.W, 20%,7min
N
NH
CH3
CH
OH
1-(1H-benzo[d]imidazol-2-yl)ethanol(I)
K Cr O2 2 7 Acetic acid
Ar-CHO
10% NaOH
N
NH
O
C CH CH
Ar(IIIa-h)
N
NH
C
O
CH3
2-Acetyl Benzimidazole(II)
R-NHNH2 CH3COONa / C H OH2 5
N
NH
NN
H
Ar
IV a-h
Compound,IVa- Ar =
Compound,IVb- Ar =
Compound,IVc- Ar =
Compound,IVd, Vid - Ar =
Compound,IVe, - Ar =
Compound,IVf, - Ar =
Compound,IVg, - Ar =
Compound,IVh, - Ar =
CI
CI
CI
CI
NO2
OCH3
OH
H CO3
HC HC
SCHEME
IVa C H N 260.11 160 63 73.83 4.65 21.52 --- --- 16 12 4
IVb C H ClN 294.74 134 71 65.20 3.76 19.01 --- 12.03 16 11 4
IVc C H ClN 294.74 134 70 65.20 3.76 19.01 --- 12.03 16 11 4
IVd C H Cl N 329.18 170 61 58.38 3.06 17.02 --- 21.53 16 10 2 4
IVe C H N O 305.29 220 59 62.95 3.63 22.94 10.48 --- 16 11 5 2
IVf C H N O 290.32 147 58 70.33 4.46 19.29 5.51 --- 16 14 4 2
IVg C H N O 306.32 207 63 66.66 4.61 18.29 10.45 ---17 14 4 2
IVh C H N 286.33 140 60 75.50 4.93 19.57 --- ---18 14 4
Compd Mol. Form. Mol. Melting Yield Elemental Analysis (found)(%)
Wt. point % C H N O Cl
Table 2: Physical data of the Synthesized compounds
360

Indian J.Pharm. Educ. Res. 44(4), Oct - Dec, 2010
3363(N-NH),1604(C=N),1500(C=C),906(CH=CH),
759(ArC-H)
3336(N-NH),1600(C=N),1508(C=C),837(CH=CH),
7596(ArC-H)
3367(N-NH),1608(C=N),1473(C=C),795(CH=CH),
688(ArC-H)
3354(N-NH),1604(C=N),1456(C=C),840(CH=CH),
759(ArC-H)
3329(N-NH),1602(C=N),1456(C=C,CH ),1359(ph-OH,C-O),3
956(CH=CH),759(ArC-H)
3335(N-NH), 1398(ph-OH,CO), 1475(C=C,O-CH ),3
906(CH=CH), 1604(C=N)
3388(N-NH),1604(C=N),1417(C=C), 906(CH=CH),
759(ArC-H)
3396(N-NH),1608(C=N),1521(Ar-NO ), 1456(C=C), 2
840(CH=CH), 756(ArC-H)
3.5(NH),5.0(sN-H),7.22-7.62(mArC-H),
8.05(C-H)
3.5(NH),5.0(sN-H),7.22-7.62(mArC-H),
7.73(sC-H
3.5(NH),5.0(sN-H),7.22-7.62(mArC-H),
7.98(C-H)
3.5(NH), 5.0(sN-H),
7.22-7.62(mArC-H)
3.5(NH), 3.83(CH ),3
5.0(sN-H), 7.22-7.62 (mArC-H)
3.5(NH), 3.83(sCH ),3
5.0(sN-H),5.53(OH),
7.22-7.62(mArC-H)
3.5(NH), 5.0(sN-H),
7.22-7.62(mArC-H)
3.5(NH), 5.0(sN-H),
7.22-7.62(mArC-H)
IVa
IVb
IVc
IVd
IVf
IVg
IVh
Mol.wt. 260.11
m/z =259.2
Mol.wt. 294.74
m/z = 296.7
Mol.wt. 294.74
m/z = 296.7
Mol.wt. 329.18
m/z = 328.1
Mol.wt. 290.32
m/z = 291.4
Mol.wt. 306.2
m/z = 305.4
Mol.wt. 286.33
m/z = 287.3
Mol.wt. 305.29
m/z = 306.1
Compd Mass spectra IR spectra(KBr) NMR spectra(in DMSO)
Table 3: Spectral data of the Synthesized compounds
IVa --- --- 12 15
IVb 14 13 --- ---
IVc 15 --- --- ---
IVd 12 --- 16 12
IVe --- --- 12 16
Ivf --- --- --- ---
IVg --- --- --- ---
IVh --- --- --- ---
Std 20 19 18 18
CompdZone of Inhibition (in mm)
E.coli P.aeruginosa S.Aureus B.Subtillis
Table 4: Anti bacterial activity of the Synthesized compounds
361

Indian J.Pharm. Educ. Res. 44(4), Oct - Dec, 2010
IVa >80 >80 26.0
IVb >80 61.6 15.3 *
IVc >80 >80 47.1
IVd >80 >80 61.8
IVe >80 >80 73.8
Ivf >80 >80 >80
IVg >80 61.8 12.2 *
IVh >80 >80 46.1
Std 66.8 25.5 <10
Compdµg/ml values for
Lc50 TGI Gi50
Table 5: Anti cancer activity of the Synthesized compounds against Human Breast cancer cell line –MCF7
* significant activity
REFERENCES
1. Ashutosh K Bhatt, Hasanali Karadiya Palak R Shah,
Manish P Parmar, Patal HD. Synthesis of
benzimidazole derivatives and their antibacterial
and antifungal activities. Indian J heterocycl Chem
2003;13:187-189.
2. Ramaiah K, Grossert JS, Hooper DL, Dubey PK,
Ramanatham J. Synthesis of 2-acetylbenzimidazole
and related benzimidazole derivatives. J Indian
Chem soc 1999;76:140-144.
3. Ayman El-Faham, Mohamed Chebbo, Mohamed
A b d u l - G h a n i , G h a s s a n Y u n e s .
Chloroformamidinium salt: Efficient reagents for
preparation of 2- aminobenzimidazole, 2-
Aminobenzoxazole and 2-aminobenzothiazole
derivatives. J heterocycl Chem 2006;43:599-606.
4. Rahul R Nagawade, Devanand B Shinde. TiCl 4
Promoted synthesis of benzimidazole derivatives.
Indian J chem 2007;46B:349-351.
5. Kabra SR, Bachute MT, Karale BK, Gill CH.
Microwave induced synthesis of 3-methyl-4[1,
3diphenyl-1h-pyrazol-4-yl]-1-phenyl- pyrazolin-5-
(4H)-ones under solvent free conditions. Indian J
heterocycl Chem 2002;12:73-74.
6. Gernot A Eller, Barbara Datterl, Wolfgang Holzer.
Pyrazolo [4 1 ,3 1 :5,6] pyrano [2,3-b] Quinoxalin-
4(1H)-one: synthesis and characterization of a novel
tetracyclic ring System. J heterocycl chem
2007;44:1139-1143.
7. Primofiore G, Marini AM, Salerno S, Da Settimo F,
Bert ini D, L.Dal la Via. Synthesis and
antiproliferative evaluation of new aryl substituted
pyrido [3 1 , 2 1 :5, 6] thiopyrano [4, 3-c] Pyrazoles. J
heterocycl chem 2005;42:1357-1361.
8. Urmila gupta, Vineeta Sareen, Vineeta Khatri,
Sanjana Chugh. Synthesis and antifungal activity of
New fluorine containing 4-(substituted phenylazo)
pyrazoles and isoxazoles. Indian J heterocycl Chem
2005;14:265-266.
9. Ministry of Health and Family wefare. Indian
Pharmacopoeia. Delhi: The controller of
publication; 1996;II:A100-A108.
10. Gaurav Grover, Suvarna G Kini. Synthesis and
evaluation of new quinazolone derivatives of
nalidixic acid as potential antibacterial and
antifungal agents. Eur J Med Chem 2006;41:256-
262.
11. Va n i c h a Vi c h a i , K a n y a w i m K i r t i k a r a .
Sulforhodamine B colorimetric assay for
cytotoxicity screening. Nature Protocols
2006;1:1112-1116.
362

Abstract
The present study was an endeavor to evaluate anti-inflammatory and antioxidant activity of methanolic extract of
Buchanania lanzan kernel (BLK-ME). The in vivo anti-inflammatory activity was evaluated in rats by using
carrageenan-induced paw edema, as an acute model and formaldehyde induced arthritis as a chronic model,
whereas in vitro antioxidant activity was performed by 1, 1-diphenyl-2-picryl-hydrazyl (DPPH) and reducing power
method. Quantitative estimation of total polyphenolic content of the (BLK-ME) was estimated by Folin-Ciocalteu
method. BLK-ME (200 mg/kg body wt) significantly decreased paw volume, after oral administration of BLK-ME in
carrageenan and formaldehyde injection. BLK-ME also exhibit significant antioxidant activity. Total polyphenolic
content was found to be 16.82 %± 23 mg of GAE/100. Presence of phytochemicals like triterpenoids, saponins and
tannins in the BLK-ME might contribute to the observed anti-inflammatory and antioxidant activity.
Keywords: Buchanania lanzan kernel, Antioxidant, Anti-inflammatory, Polyphenols, DPPH
Indian J.Pharm. Educ. Res. 44(4), Oct - Dec, 2010
Anti-inflammatory and Antioxidant Activities of Methanolic extract of Buchanania Lanzan Kernel
Warokar A. S. *, Ghante M. H., Duragkar N. J. and Bhusari K. P.Sharad Pawar College of Pharmacy, Wanadongari, Hingana road, Nagpur- 441 110.
Author for correspondence: [email protected], [email protected]
INTRODUCTION
Buchanania lanzan Spreng., family Anacardiaceae,
commonly known as Char, Chirauli. It is widely
distributed in hot and dry parts of India. In the Jhansi
district of India, the Buchanania lanzan kernel (BLK) is
used into an ointment, for skin diseases. In Berar, kernels
are pulverized and applied as a remedy for itching. It is
used to apply on glandular swellings of the neck. It is
believed to cure pimples and prickly heat. It is also
employed by women to remove spots and blemishes from
the face. In the Bombay presidency, the kernels were
employed as a tonic and being substituted for the almond.
The oil extracted from the kernels is used as a substitute
for almond oil in native medicinal preparations and 1confectionery.
Although it is a popular traditional medicine in Indian
subcontinent, literature surveys reveals that anti-
inflammatory and antioxidant activity of BLK has not yet
been documented. Its ethnobotanical claim prompted us
to undertake this investigation. Current drugs for
inflammation such as NSAIDs and opiates are not
beneficial in all cases, due to their side effects and 2potency. Hence search for other alternatives seems
necessary and beneficial. Antioxidants help to deal with
3oxidative stress which is caused by free radical damage.
Reactive oxygen species (ROS) and reactive nitrogen
species (RNS), contribute significantly to tissue injury 4and in pathogenesis of asthma, rheumatisms and burns.
Moreover, several studies suggest that natural
antioxidant and anti-inflammatory agents could be
beneficial in the prevention and treatment of these 5, 6 pathologies. This study aimed to investigate in vivo
anti-inflammatory and in vitro antioxidant potential of
methanolic extracts from BLK. Moreover, total
polyphenolic content BLK-ME was determined as per
standardized parameter. Therefore an effort has been
made to corroborate and establish scientific evidence for
its ethnobotanical uses.
MATERIALS AND METHODS
Collection of plant material and extraction
The Buchanania lanzan kernels (BLK) were collected
from the Sakoli, district Bhandara The herbarium was
prepared (Voucher no. 9137) and authenticated by Prof.
Alka Chaturvedi, Department of Botany, R. T. M. Nagpur
University, Nagpur.
Kernels were cleaned and dried well under shade which
was further pulverized using Willey's mill. 500 gm of
coarse powdered BLK was extracted in soxhelet °apparatus exhaustively with petroleum ether (60- 80) C
and finally with methanol to obtain brown sticky residue.
Indian Journal of Pharmaceutical Education and ResearchReceived on 12/6/2009 ; Modified on 8/9/2009Accepted on 9/2/2010
363
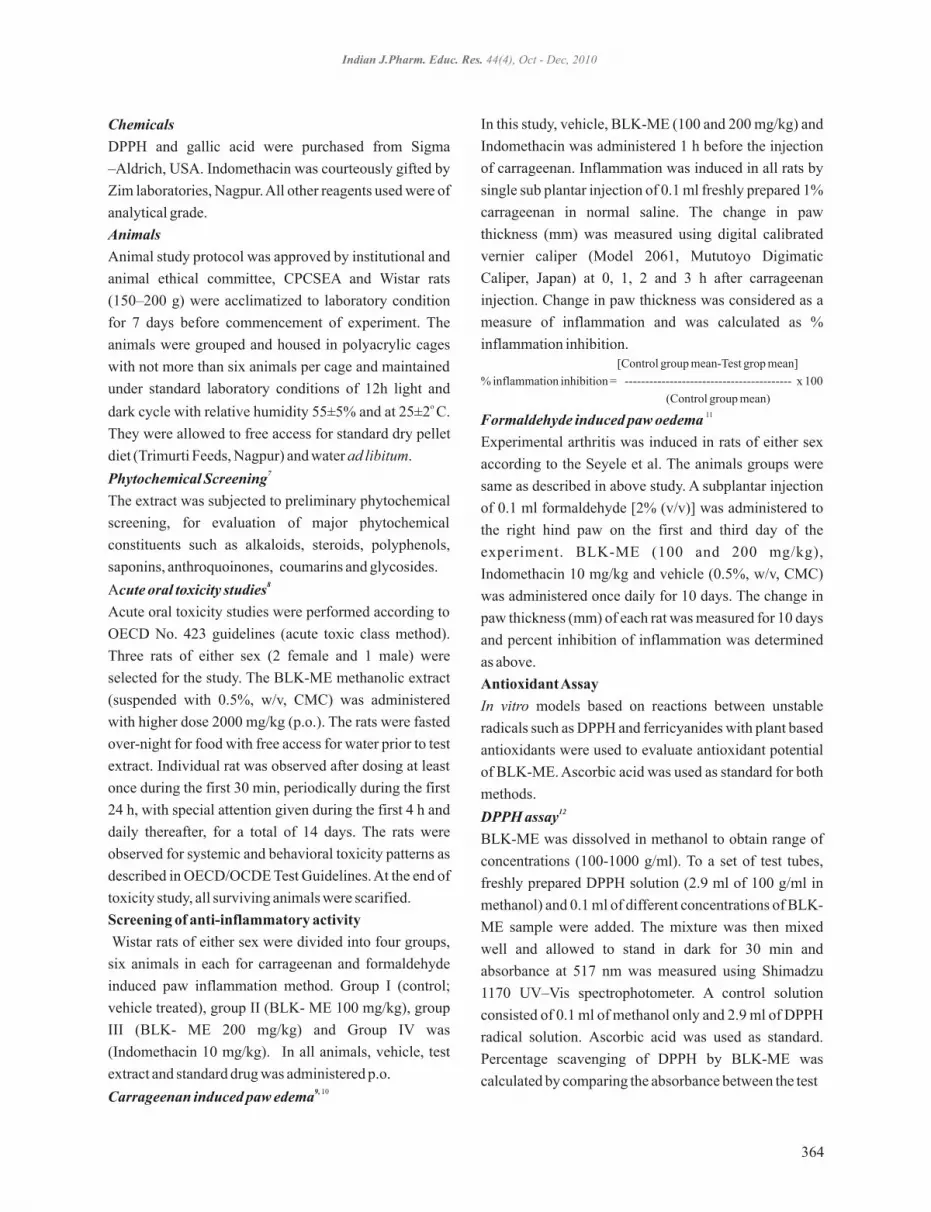
Chemicals
DPPH and gallic acid were purchased from Sigma
–Aldrich, USA. Indomethacin was courteously gifted by
Zim laboratories, Nagpur. All other reagents used were of
analytical grade.
Animals
Animal study protocol was approved by institutional and
animal ethical committee, CPCSEA and Wistar rats
(150–200 g) were acclimatized to laboratory condition
for 7 days before commencement of experiment. The
animals were grouped and housed in polyacrylic cages
with not more than six animals per cage and maintained
under standard laboratory conditions of 12h light and o dark cycle with relative humidity 55±5% and at 25±2 C.
They were allowed to free access for standard dry pellet
diet (Trimurti Feeds, Nagpur) and water ad libitum. 7Phytochemical Screening
The extract was subjected to preliminary phytochemical
screening, for evaluation of major phytochemical
constituents such as alkaloids, steroids, polyphenols,
saponins, anthroquoinones, coumarins and glycosides. 8Acute oral toxicity studies
Acute oral toxicity studies were performed according to
OECD No. 423 guidelines (acute toxic class method).
Three rats of either sex (2 female and 1 male) were
selected for the study. The BLK-ME methanolic extract
(suspended with 0.5%, w/v, CMC) was administered
with higher dose 2000 mg/kg (p.o.). The rats were fasted
over-night for food with free access for water prior to test
extract. Individual rat was observed after dosing at least
once during the first 30 min, periodically during the first
24 h, with special attention given during the first 4 h and
daily thereafter, for a total of 14 days. The rats were
observed for systemic and behavioral toxicity patterns as
described in OECD/OCDE Test Guidelines. At the end of
toxicity study, all surviving animals were scarified.
Screening of anti-inflammatory activity
Wistar rats of either sex were divided into four groups,
six animals in each for carrageenan and formaldehyde
induced paw inflammation method. Group I (control;
vehicle treated), group II (BLK- ME 100 mg/kg), group
III (BLK- ME 200 mg/kg) and Group IV was
(Indomethacin 10 mg/kg). In all animals, vehicle, test
extract and standard drug was administered p.o.9, 10Carrageenan induced paw edema
In this study, vehicle, BLK-ME (100 and 200 mg/kg) and
Indomethacin was administered 1 h before the injection
of carrageenan. Inflammation was induced in all rats by
single sub plantar injection of 0.1 ml freshly prepared 1%
carrageenan in normal saline. The change in paw
thickness (mm) was measured using digital calibrated
vernier caliper (Model 2061, Mututoyo Digimatic
Caliper, Japan) at 0, 1, 2 and 3 h after carrageenan
injection. Change in paw thickness was considered as a
measure of inflammation and was calculated as %
inflammation inhibition. [Control group mean-Test grop mean]
% inflammation inhibition = ----------------------------------------- x 100
(Control group mean)11Formaldehyde induced paw oedema
Experimental arthritis was induced in rats of either sex
according to the Seyele et al. The animals groups were
same as described in above study. A subplantar injection
of 0.1 ml formaldehyde [2% (v/v)] was administered to
the right hind paw on the first and third day of the
experiment. BLK-ME (100 and 200 mg/kg),
Indomethacin 10 mg/kg and vehicle (0.5%, w/v, CMC)
was administered once daily for 10 days. The change in
paw thickness (mm) of each rat was measured for 10 days
and percent inhibition of inflammation was determined
as above.
Antioxidant Assay
In vitro models based on reactions between unstable
radicals such as DPPH and ferricyanides with plant based
antioxidants were used to evaluate antioxidant potential
of BLK-ME. Ascorbic acid was used as standard for both
methods.12DPPH assay
BLK-ME was dissolved in methanol to obtain range of
concentrations (100-1000 g/ml). To a set of test tubes,
freshly prepared DPPH solution (2.9 ml of 100 g/ml in
methanol) and 0.1 ml of different concentrations of BLK-
ME sample were added. The mixture was then mixed
well and allowed to stand in dark for 30 min and
absorbance at 517 nm was measured using Shimadzu
1170 UV–Vis spectrophotometer. A control solution
consisted of 0.1 ml of methanol only and 2.9 ml of DPPH
radical solution. Ascorbic acid was used as standard.
Percentage scavenging of DPPH by BLK-ME was
calculated by comparing the absorbance between the test
Indian J.Pharm. Educ. Res. 44(4), Oct - Dec, 2010
364

mixture and control Percentage scavenging of DPPH was
calculated by using formula.
% scavenging of DPPH = (A - A ) / A X 100cont test cont
13Reducing power method
The reducing power of BLK-ME was evaluated
according to the method of Oyaizu et al 1986. Various
concentrations of BLK-ME (100- 1000 µg/ ml) were
taken. 1.0 ml of test sample was mixed with 2.5 ml
phosphate buffer (0.2 M, pH 6.6) and 2.5 ml of 1%
potassium ferricynide. The mixture was made
homogeneous and incubated at 50º C for 20 min; aliquots
of trichloroacetic acid (2.5 ml, 10%) were added to the
mixture, which was then centrifuged at 1500 rpm for 10
min (2.5 ml) and finally freshly prepared FeCl solution 3
(0.5ml, 1%) was added to this and mixed uniformly. The
absorbance of supernatant was measured at 700 nm.
Increased absorbance of the reaction mixture indicated
increased reducing power. 14Quantitative Estimation of Total Phenolic content
The total phenolic content of BLK-ME was determined
using a modified Folin-Ciocalteu method. A 125 µl of
BLK-ME of known concentrations (100-1000 µg/ml)
was added to the set test of tube and mixed with 0.5 ml of
Folin–Ciocalteu reagent. The tubes were vortexed for 5 0 min and then allowed to stand for 5 min at 20 C. To this
mixture 1.25 ml of sodium carbonate (7%) solution was
added and the mixture was diluted to 3 ml with distilled
water. Absorbance of bluish green coloured solution
developed after 60 min was measured at 760 nm using
Shimadzu 1170 UV–Vis spectrophotometer. The
measured absorbance was compared to a standard curve
of gallic acid solutions and expressed as gallic acid
equivalents (GAE) in milligrams. Triplicate
determinations were performed of each sample.
Statistical analysis
Statistical analysis was performed by using 2 way
ANOVA. Experimental data were expressed as mean
±SD. Student's t-test was applied for expressing the
significance and P value.
RESULTS
Phytochemical screening
BLK-ME showed the presence of alkaloids, triterpenods,
saponins, glycosides and tannins.
Acute toxicity study
BLK-ME did not produce any mortality at the highest
dose employed. Selected doses of BLK-ME were found
to be safe. Two doses (100 and 200 mg/kg, p.o.) of BLK-
ME were selected for further pharmacological studies.
The results obtained with BLK-ME and indomethacin in
the carrageenan- induced edema test are shown in (Table
1)
Table 2).
Among several traditional claims, the utility of
Buchanania lanzan in inflammation and pain has been 1emphasized only in literature. Hence results of present
investigations might give scientific authentication to the
traditional claims. At concentration 125 µg/ml of BLK-
ME, exhibited 83.11 and 88.34 of % scavenging DPPH
and % reducing power respectively which found to be
near to standard antioxidant ascorbic acid
ROS) and reactive nitrogen species (RNS) have been
implicated to failure in the defense mechanisms, damage
to cell structures, DNA, lipids and proteins in tissue.
Furthermore, these reactive species (ROS and RNS) have
been known to cause several inflammatory disorders
such as asthma, rheumatoid arthritis atherosclerosis, 4inflammatory bowel disease . Recent study showed that
several polyphenolic compounds act as a potent
cyclooxygenase inhibitor. Moreover polyphenolics
combat with oxidative stress in the body and maintain
balance between oxidants and antioxidants to improve 1617, 18 human health. Antioxidants have been reported to
work by single or combined mechanisms viz. free
radical-scavenging, reducing activity, complexing of
pro-oxidant, scavenging lipid peroxyl radicals and
quenching of singlet oxygen. This suggests possibility to
reduce the risks of chronic diseases and prevent disease
progression by either enhancing the body's natural
antioxidant defenses or by supplementing with proven 19dietary antiaccident . Antioxidants of natural origin such
as polyphenols (tannins, flavonoids and chalcones), act
by donating electron to the intermediate radicals formed
in oxidative stress or tissue damage which help in
inhibition of lipid peroxidation. The computational
studies also supports that the compounds having more
Anti-inflammatory study
BLK-ME extract exhibited significant inhibition of
inflammation at 200 mg/kg but not shown any significant
effect at 100 mg/kg, the results were same in case of
formaldehyde induced arthritis (
DISCUSSION
(Table-3).
Literature survey suggest that reactive oxygen species
(
,
365
Indian J.Pharm. Educ. Res. 44(4), Oct - Dec, 2010

electron donating potentials are better inhibitors of
hydroperoxides which suggests many of the antioxidant
agents are found to be effectively exhibit anti-20, 21inflammatory activity.
The DPPH approach is simple and widely applied for the 22measurement of antioxidant activity of polyphenolics.
Therefore total polyphenolic content and in vitro DPPH
assay for antioxidant activity were evaluated. The
carrageenan test is long accepted as a useful tool for
investigating new anti-inflammatory drugs similarly
formaldehyde-induced paw edema in rats is widely used
to screen anti-arthritic and anti-inflammatory agents as it 23, 24 closely resemble human arthritis.
BLK-ME in two different
models reduced the paw edema significantly (Tables 1
and 2). Inhibitions of the paw edema in both
inflammatory models were comparable to the standard
reference drug indomethacin . BLK-ME
showed scavenging of DPPH and ferricyanide radicals
near to that of ascorbic acid. In the free radical
scavenging assay, BLK-ME was found to interact with
the DPPH free radical and reduced it. While the reducing
power observed at different concentration of extracts was
Anti-inflammatory
activities of (200 mg/kg)
(10 mg/kg)
satisfactory. Antioxidant capacity of extract was found to
be concentration dependant (Table 3). Quantitative
estimation of total phenolic content of BLK-ME by
Folin-Ciocalteu was found to be 16.82% ± 23 mg of
GAE/100 g. Furthermore, the free radical scavenging
capacity of BLK-ME in the DPPH assay and reducing
power methods suggests that the antioxidant activity may
be one of the mechanisms of its anti-inflammatory
property, because anti-inflammatory processes are
related to an increase of free radicals. Observed results
may be due to the presence of phytochemical constituents
like polyphenols, saponins, triterpenoids, and glycosides.
Thus the results from present study indicate the efficacy
of the BLK-ME as a therapeutic agent in acute as well as
chronic inflammatory conditions and oxidative stress.
Studies are in progress in order to determine in vivo
antioxidant activity identify and isolate the bioactive
Phytoconstituents.
ACKNOWLEDGEMENT:
Authors are greatly thankful to the Principal, Sharad
Pawar College of Pharmacy, Wanadongri, Nagpur for
providing free access to their facilities to carry out
research work.
Control 2.87 ± 0.023 5.94 ± 0.012 3.99±0.020
Indomethacin (10 2.43 ± 0.029 2.29 ± 0.013 1.65±0.009
mg/kg) [15.33]* [61.44] ** [58.64] **
BLK-ME 2.89 ± 0.025 2.91 ± 0.009 1.93 ± 0.007
(100 mg/kg) [51.01] ** [51.62] **
BLK-ME 2.49 ± 0.019 2.34±0.016 [60.60] 1.56 ± 0.011
(200 mg/kg) [13.24] ** ** [60.90] **
Treatment Groups
Change in paw thickness (mm) at [h]
1 3 5
Table 1: Acute anti-inflammatory activity of BLK-ME in carrageenan induced inflammation
Values are expressed as mean ± SD, *P<0.01 and **P<0.001 values are compared with control; square brackets indicates the percent inhibition
(n=6)
Indian J.Pharm. Educ. Res. 44(3), Oct - Dec, 2010Indian J.Pharm. Educ. Res. 44(4), Oct - Dec, 2010
366
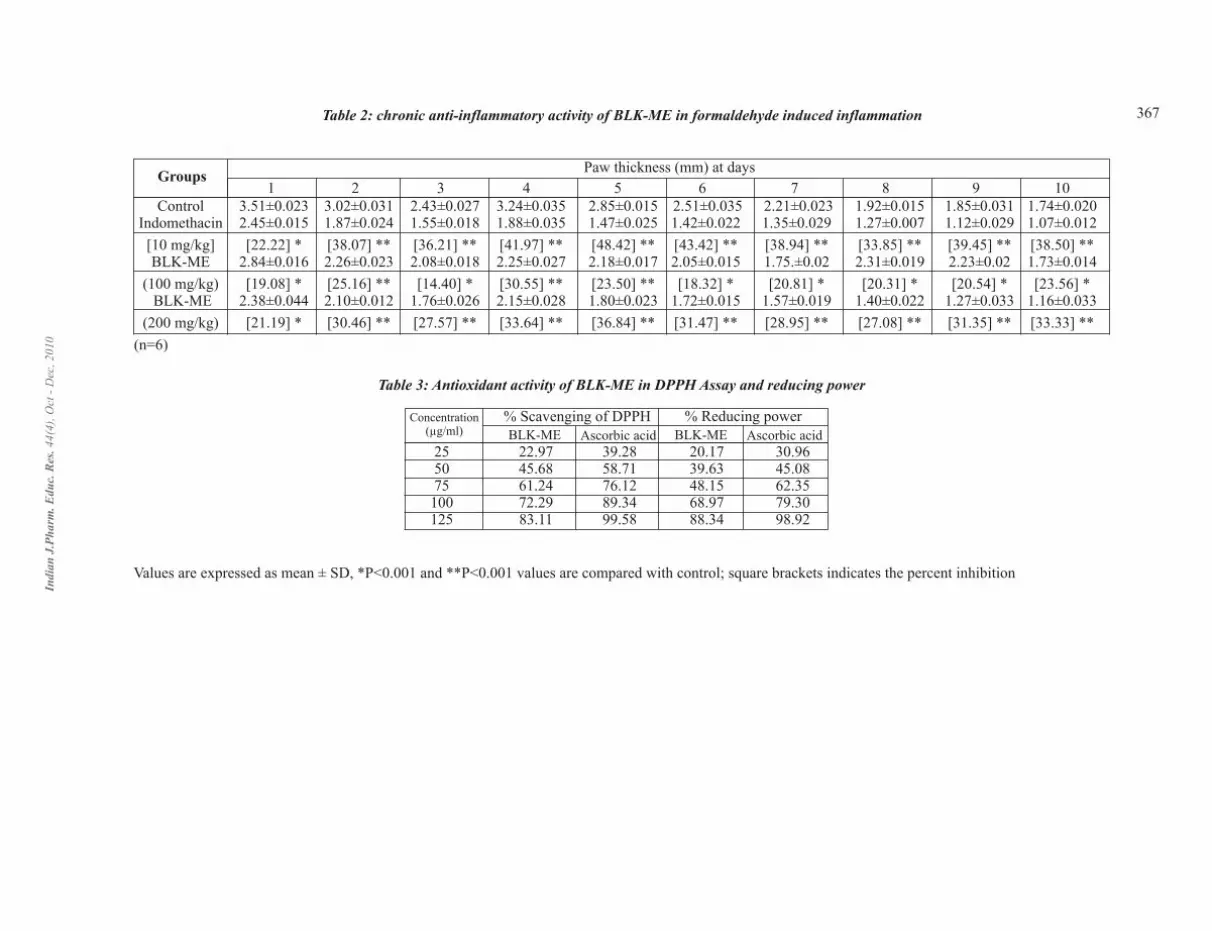
Control 3.51±0.023 3.02±0.031 2.43±0.027 3.24±0.035 2.85±0.015 2.51±0.035 2.21±0.023 1.92±0.015 1.85±0.031 1.74±0.020Indomethacin 2.45±0.015 1.87±0.024 1.55±0.018 1.88±0.035 1.47±0.025 1.42±0.022 1.35±0.029 1.27±0.007 1.12±0.029 1.07±0.012
[10 mg/kg] [22.22] * [38.07] ** [36.21] ** [41.97] ** [48.42] ** [43.42] ** [38.94] ** [33.85] ** [39.45] ** [38.50] ** BLK-ME 2.84±0.016 2.26±0.023 2.08±0.018 2.25±0.027 2.18±0.017 2.05±0.015 1.75.±0.02 2.31±0.019 2.23±0.02 1.73±0.014
(100 mg/kg) [19.08] * [25.16] ** [14.40] * [30.55] ** [23.50] ** [18.32] * [20.81] * [20.31] * [20.54] * [23.56] * BLK-ME 2.38±0.044 2.10±0.012 1.76±0.026 2.15±0.028 1.80±0.023 1.72±0.015 1.57±0.019 1.40±0.022 1.27±0.033 1.16±0.033
(200 mg/kg) [21.19] * [30.46] ** [27.57] ** [33.64] ** [36.84] ** [31.47] ** [28.95] ** [27.08] ** [31.35] ** [33.33] **
GroupsPaw thickness (mm) at days
1 2 3 4 5 6 7 8 9 10
Table 2: chronic anti-inflammatory activity of BLK-ME in formaldehyde induced inflammation
Values are expressed as mean ± SD, *P<0.001 and **P<0.001 values are compared with control; square brackets indicates the percent inhibition
25 22.97 39.28 20.17 30.9650 45.68 58.71 39.63 45.08 75 61.24 76.12 48.15 62.35
100 72.29 89.34 68.97 79.30 125 83.11 99.58 88.34 98.92
Concentration (µg/ml)
% Scavenging of DPPH % Reducing powerBLK-ME Ascorbic acid BLK-ME Ascorbic acid
Table 3: Antioxidant activity of BLK-ME in DPPH Assay and reducing power
(n=6)
Indi
an J
.Ph
arm
. Edu
c. R
es.
44(4
), O
ct -
Dec
, 201
0
367

REFERENCES
1. Kirtikar K.R. and Basu B.D. Indian Medicinal ndPlants. 2 Ed. Vol IV: International Book
Distributors Dehradun; 2005 660-61.
2. Vasudevan M., Gunnam KK and Parle M.
Antinociceptive and anti- inflammatory effects of
Thespesia populnea bark extract. J Ethnopharmcol.
2007; 109: 264–270.
3. Utpal B, Sahu A, Ali SS, Kasoju L, Singh A and
Sharanabasava H, Indian medicinal herbs as sources
of antioxidants. Food Res. Inter. 2008; 41: 1-15.
4. Bauerova K and Bezek A, Role of reactive oxygen
and nitrogen species in etiopathogenesis of
rheumatoid arthritis. J Physio and Biophys. 1999; 18:
15-20.
5. Won L, Kim Y and Chang, L, J Agri and Food Chem.
2003; 51: 72-92.
6. Rahman I. Oxidative stress and gene transcription in
asthma and chronic obstructive pulmonary diseases:
antioxidant therapeutic targets. Current Drug Targets
Inflammation and Allergy. 2002; 1: 291-315.
7. Trease GE and Evans WC. Text Book of
Pharmacognosy. Bailliere Tindall Press. London:
1983; 309–706.
8. Ecobichon DJ. The Basis of Toxicology Testing;
CRC Press, NewYork:1997; 43 86.
9. Dai Y, But PP, Chan Y, Matsuda H and Kubo, M.
Antipruritic and anti-inflammatory effects of
aqueous extract from Si-Wu- Tang. Bio Pharm Bull.
2002; 25, 1175–1178.
10. Kweifio-OG. Anti-inflammatory activities of
Ghanaian antiarthritic herbal preparation. J.
Ethnopharmcol. 1991; 33, 263–267.
11. Selye H. Further studies concerning the participation
of the adrenal cortex in the pathogenesis of arthritis.
Brit Med J. 1949; 2, 1129–1135.
12. Yokozawa T, Chen CP, Dong E, Tanaka T, Nonaka GI
and Nishioka I. Study on inhibitory effect of tannins
and flavonoids against the 1,1-diphenyl-2-
picrylhydrazyl radical. Biochem Pharmacol. 1998;
56: 213-222.
13. Okhawa, H, Ohishi, W and Yagi, K. Assay
formulation lipid peroxides in animal tissues by
thiobarbituric acid reaction. Anal Biochem. 1979; 95,
351.
14. Wolfe K, Wu X, and Liu RH. Antioxidant activity of
apple peels. J Agri and Food Chem. 2003; 51,
609–614.
15. Srivastava RC, Hussain MM, Hasan SK and Athar
M. Green tea polyphenols and tannic acid act as
potent inhibitors of phorbol ester-induced nitric
oxide generation in rat hepatocytes independent of
their antioxidant properties. Cancer Lett. 2000; 153:
1–5.
16. Phan TT, Wang L, See P, Grayer RJ, Chan SY and
Lee ST. Phenolic compounds of Chromolaena
odorata protect cultured skin cells from oxidative
damage: Implication for cutaneous wound healing.
Bio Pharm Bull. 2001; 24: 1373– 379.
17. Adom KK and Liu RH. Antioxidant activity of
grains. J Agri and Food Chem. 2002; 50,
6182–6187.
18. Dragsted LO, Strube M and Larsen JC. Cancer-
protective factors in fruits and vegetables:
biochemical and biological background. Pharmacol
and Toxicol. 1993; 72, 116–135.
19. Burton GW and Ingold KU. The antioxidant
activity of vitamin E and related chain breaking
phenolic antioxidants in vitro. J Am Chem Soc,
1981; 103, 6472–6477.
20. Ali SS, Kasoju N, Luthra A, Singh A,
Sharanabasava H, Sahu A and Bora U, Indian
medicinal herbs as sources of antioxidants. Food
Res Inte 2008; 41, 1–15.
21. Gacche R, Khsirsagar M, Kamble S, Bandgar B,
Dhole N, Shisode K, and Chaudhari A, Antioxidant
and anti-inflammatory related activities of selected,
synthetic Chalcones: structure–activity relationship
studies using computational tools. Chem Pharm
Bul. 2008; 56 (7), 897—901.
22. Cai Y, Sun M and Corke H. Antioxidant activity of
betalains from plants of the Amaranthaceae. J Agri
and Food Chem. 2003; 51, 2288–2294.
23. Just MJ et al. Anti-inflammatory activity of unusual
lupane saponins from Bupleurum fruticescens.
Planta Medica. 1998; 64, 404-407.
24. Greenwald RA. Animal model for evaluation of
arthritic drugs. Methods Find Exp Clin Pharmacol.
1991; 3:75–83.
Indian J.Pharm. Educ. Res. 44(4), Oct - Dec, 2010
368

Abstract
Eupatorium odoratum Linn is found in the tribal area of Koraput district and extensively used traditionally by the
tribal people as anthelmintic, antimicrobial, antifungal and wound healing. The present study is an attempt to
preliminary investigation of phytochemical constituent and to explore the anthelmintic activity of different extracts of
leaves of plant Eupatorium odoratum using petroleum ether, ethanol and chloroform as solvents. The various doses of
extracts were screened for phytochemical constituent and evaluated for their anthelmintic activities on adult Indian
earthworms, Pheretima posthuma. Tests for alkaloid and tannins were positive in all extracts except tannin was
absent in petroleum ether. Tests for saponin, protein, aminoacid and anthraquinone glycoside were negative in all
extracts. All extracts were able to show anthelmintic activity at 2.5 mg/ml concentration. The activities are
comparable with the standard drugs, piperazine citrate and albendazole. All the doses of petroleum ether, ethanol and
chloroform extracts of Eupatorium odoratum showed better anthelmintic activity than the standard drug albendazole
except petroleum ether extract at 2.5 mg/ml of concentration. The extracts of three solvents at concentration of 2.5
and 5.0 mg/ml showed lesser anthelmintic activity than the standard drug piperazine citrate. When the dose of the
extract is increased, a gradual increase in anthelmintic activity was observed. The ethanolic extract showed better
anthelmintic activity in comparison with petroleum ether and chloroform extracts. The data were verified as
statistically significant by using one way ANOVA at 5 % level of significance (p < 0.05).
Key Words: Eupatorium odoratum; Asteraceae; Anthelmintic; Piperazine citrate; Albindazole.
Indian J.Pharm. Educ. Res. 44(4), Oct - Dec, 2010
INTRODUCTION
Helminthiasis, or worm infestation, is one of the most
prevalent disease and one of the most serious public
health problems in the world. Hundreds of millions if not
billions of human infections by helminthes exist
worldwide and with increased world travel and 1immigration from the developing countries .
Eupatorium odoratum Linn. (Asteraceae) is also
commonly called as Christmas bush (English). The plant
is mostly perennial herbs or shrubs, sometimes climbers.
Leaves opposite. There is 15 to 25 tubular florets per
head, white, lavender, or purple colour, cylindrical
glandular often hairy. It is a scrambling shrub. The seeds
are a brownish gray to black achene that is 4mm long with 2,3a pale brown pappus 5 or 6 mm long .
It is used as a traditional medicine in Indonesia. The
young leaves are crushed, and the resulting liquid can be
used to treat skin wounds. In herbal medicine, leaf
extracts with salt are used as a gargle for sore throats and
colds. Extracts of Christmas bush have been shown to
inhibit or kill Neisseriagonorrhoeae (the organism that 4causes gonorrhoea) in vitro In the southern part of .
Nigeria, the leaves are used for wound dressing, skin 5infection and to stop bleeding . The literature survey
reveals that previously work has been done on flower and
leaves in water extract for antimicrobial and anti-6,7inflamatory activity but there were no reports on the
Indian Journal of Pharmaceutical Education and ResearchReceived on 11/4/2009; Modified on 30/1/2010Accepted on 23/6/2010 © APTI All rights reserved
Phytochemical investigation and evaluation of anthelmintic activity of
extract from leaves of Eupatorium odoratum linn. 1 1 1Debidani Mishra *, Deb Kumar Sarkar , Bhabani Shankar Nayak ,
1 1 2Prasant Kumar Rout , P. Ellaiah and S. Ramakrishna .1Department of Pharmacognosy, Faculty of Pharmacy, Jeypore College of Pharmacy, Rondapalli, Jeypore -
764002, Koraput, Orissa, India. 2Department of Pharmacognosy, Faculty of Pharmacy, College of Pharmaceutical Sciences, Mohuda,
Berhampur – 760002, Odisha, India.
*Author for Correspondence: [email protected],
369

anthelmintic activity of the leaves extracts of Eupatorium
odoratum. This prompted us to investigate the
anthelmintic activity of Eupatorium odoratum leaves
extracts.
MATERIALS AND METHODS
Drugs and Chemicals
Albendazole (Micro Lab. Ltd., Goa), piperazine citrate
(Burroughs Wellcome Ltd., Mumbai), petroleum ether
AR (60-80C, Thomas Baker Chemical Pvt. Ltd.),
chloroform GR (Loba Chemicals), ethanol AR (Merck
Pvt. Ltd. Mumbai), normal saline water was used as
control.
Plant material
The leaves of Eupatorium odoratum Linn. (Asteraceae)
were collected from local area of Koraput district (India)
in the month of June 2008. The plant was identified and
authenticated by the Biju Pattnayak Medicinal Plants
Garden and Research Centre, Dr. M.S. Swami Nathan
Research Foundation, Jeypore, Koraput (District), Orissa
(Letter no. MR08/DBT/115, date. 12.06.2008). The
leaves were shade dried under normal environmental
condition. The dried leaves were powdered and stored in
a closed container for further use.
Preparation of Extract
The leaves of Eupatorium odoratum was extracted by
using Soxhlet extraction apparatus. In the extraction
procedure a total amount of 1550 gm powdered leaves
were extracted with each solvent. The solvents are
petroleum ether, chloroform, and ethanol. For each
solvent, 50 cycles were run. Each extract was filtered and
then it was concentrated by distilling of the solvent to
obtain the crude extract. Then it was dried by rotary
evaporator. On successive solvent extraction of leaves of
Eupatorium odoratum with different solvents resulted in
separation of constituents of different polarity range in
different solvent extracts. The percentage yield of
petroleum ether, chloroform and ethanol extract of
Eupatorium odoratum was found to be 0.555 %, 1.052 %
and 0.855 % respectively.
Phytochemical screening
Chemical tests were carried out on all the extracts for the
quali tat ive determination of phytochemical 5,8-11constituents . Total phenolic content was determined
12using Folin-Ciocalteau reagent . Total phenol value was
expressed as mg/g gallic acid equivalent.
Thin Layer Chromatography (TLC) study.
A TLC study of chloroform extract was carried out using
Silica gel GF as stationary phase. Spots were observed 254
under UV-Visible light. Chloroform crude extract of
Eupatorium odoratum was found to contain five spots in
petroleum ether: chloroform (50:50) mobile phase, four
spots in chloroform: ethyl acetate (90:10), two spots in
chloroform: ethyl acetate (80:20), three spots in
chloroform: ethyl acetate (90:10) and two spots in
methanol: ethyl acetate (5:95) respectively.
Animals
Healthy adult Indian earthworm, Pheretima posthuma
(Annelida, Megascolecidae) was used for evaluating the
anthelmintic activity due to its anatomical and
physiological resembles with the intestinal roundworm 13-15parasites of human beings . All earthworms were of
approximately equal size. They were collected from local
place, washed and kept in water.
Anthelmintic Activity
The anthelmintic activity was evaluated on adult Indian
earthworms by the reported methods with slight 16,17modification . Eighteen groups of approximately equal
sized Indian earthworms consisting of six earthworms in
each group were released in to 50 ml of respective
formulation as follows: vehicle (1% gum acacia in
normal saline), piperazine citrate (15 mg/ml),
albendazole (10 mg/ml), petroleum ether extracts (2.5, 5,
10, 25 and 50 mg/ml), chloroform (2.5, 5, 10, 25 and 50
mg/ml), ethanol 2.5, 5, 10, 25 and 50 mg/ml). The wide
range of dose was taken to establish the relationship
between dose and pharmacological activity and also to
find out the minimum and maximum dose that can be
better therapeutically effective in comparison to standard
drug. Observations were made for the time taken to
paralysis and/or death of individual worms. Paralysis was
said to occur when the worms do not revive even in
normal saline water. Death was concluded when the
worms lose their motility followed with fading away of
their body color.
Statistical analysis
The data on biological studies were reported as mean ±
Standard deviation (n = 5). For determining the statistical
significance, standard error mean and analysis of
variance (ANOVA) at 5 % level significance was 18employed. P values < 0.05 were considered significant .
Indian J.Pharm. Educ. Res. 44(4), Oct - Dec, 2010
370

RESULTS AND DISCUSSION
From the TLC study profile, it is concluded that the
mixtures of bioactive fraction of ethanol extract of
Eupatorium odoratum has exhibited the anthelmintic
activity. Table 1 shows the phytochemicals detected in
Eupatorium odoratum leaf extract. Tests for alkaloid and
tannins were positive in all extracts except tannin was
absent in petroleum ether. Tests for saponin, protein,
aminoacid and anthraquinone glycoside were negative in
all extracts. Triterpenoid, sterols, steroids, flavons and
flavonoids are present in petroleum ether and chloroform
extracts but absent in ethanol extracts. Cardiac
glycosides present in ethanol extracts but absent in
petroleum ether and chloroform extracts. Gum mucilage
present in ethanol extracts but absent in petroleum ether
and chloroform extracts. The phytochemicals detected in
the extracts are acting as major role to possess medicinal
properties. Each leaves extracts containing 2.5, 5, 10, 25,
50 mg/ml, produced dose-dependent paralysis ranging
from loss of motility to loss of response to external
stimuli, which gradually progressed to death as shown in
Table 1. The Petroleum-ether extracts of dose 2.5, 5, 10
and 25 mg/ml, produced paralysis within 37.815, 24.841,
17.39, 16.788 min. respectively. Death was noted within
8.877 min. Ethanolic extract at concentration 2.5, 5, 10
and 25 mg/ml produced paralysis within 26.79, 18.83,
15.56, 13.716 min. respectively. The death was noted
with 50 mg/ml concentration within 7.42 minutes.
Chloroform extract also showed dose-dependent
paralysis at concentration of 2.5, 5, 10 and 25 mg/ml,
paralysis was noted at 27.683, 21.433, 17.65, 16.58
minutes respectively, while 50 mg/ml concentration
produced death within 8.11 minutes. The standard drug
Piperazine citrate of concentration 10 mg/ml and
Albendazole of concentration 15 mg/ml shows paralysis
Indian J.Pharm. Educ. Res. 44(4), Oct - Dec, 2010
at 18.50 min and 34.66 min and death occurred after
63.83 min incase of Albendazole. The higher
concentration of each extract produced paralytic effect
more quickly and the time taken to death was shorter. By
employing one-way ANOVA, all data were verified and
found to be statistically significant at 5 % level of
significant (p<0.05).
From the above results, it was observed that the ethanolic
extract was more potent than the other two extracts
(petroleum ether and chloroform) even though all the
three extracts were endowed with anthelmintic property.
The order of activity was ethanol extract greater than
chloroform extract greater than petroleum ether extract.
The activity revealed concentration dependence nature of
the different extracts. Potency of the extracts was found
to be inversely proportional to the time taken for
paralysis/death of the worms.
CONCLUSION
It could be concluded that the ethanolic extract showed
most potent anthelmintic activity. The other two extracts
e.g., petroleum ether and chloroform extracts, exhibited
lesser anthelmintic activity than the ethanolic extract.
The present study revealed that the anthelmintic activity
increases with increasing polarity. Further studies are
required to identify the actual chemical constituents that
are present in the crude extracts of this plant which are
responsible for anthelmintic activity and to establish the
effectiveness and pharmacological rationale for the use
of Eupatorium odoratum as an anthelmintic drug.
ACKNOWLEDGEMENT
Authors wish to thank to local people of Koraput and Biju
Pattnayak Medicinal Plants Garden and Research Centre,
Dr. M.S. Swami Nathan Research Foundation, Jeypore,
Koraput (Dt), Orissa, for providing valuable information
about the plant and its identification.
371

Indian J.Pharm. Educ. Res. 44(4), Oct - Dec, 2010
Phytochemicals Pet. Ether extract Chloroform extract Ethanol extract
Alkaloids + + +
Cardiac glycoside - - +
Anthraquinone glycosides - - -
Gums mucilage - - +
Proteins, amino acids - - -
Tanins-Phenolic compound - + +
Triterpenoid + + -
Steroids & sterols + + -
Saponin - - -
Flavones & flavonoids + + -
Table 1. Phytochemicals detected in extracts of Eupatorium odoratum.
+ = Present and - = Absent
Groups Treatments Concentration Time taken for Time taken for
used (mg/ml) paralysis (min) death (min)
(X±S.D.) (X±S.D.)
1 Vehicle - - -
2 Piperizine citrate 10 18.50 ± 0.31 -
3 Albendazole 15 34.66 ± 0.72 63.83 ± 0.79
4 Pet-ether extract 2.5 37.815 ± 0.81 -
5 Pet-ether extract 5 24.841 ± 1.85 33.08 ± 3.098
6 Pet-ether extract 10 17.39 ± 0.539 28.453 ± 1.065
7 Pet-ether extract 25 16.788 ± 0.378 21.441 ± 1.100
8 Pet-ether extract 50 8.877 ± 0.310 18.11 ± 1.67
9 Ethanol extract 2.5 26.79 ± 1.33 -
10 Ethanol extract 5 18.83 ± 0.805 25.84 ± 0.776
11 Ethanol extract 10 15.56 ± 1.752 25.57 ± 0.6979
12 Ethanol extract 25
13 Ethanol extract 50 7.42 ± 0.589 14.588 ± 0.2733
14 Chloroform extract 2.5 27.683 ± 0.811 -
15 Chloroform extract 5 21.433 ± 0.854 27.783 ± 0.331
16 Chloroform extract 10 17.65 ± 1.075 25.866 ± 0.388
17 Chloroform extract 25 16.58 ± 0.304 20.5 ± 1.165
18 Chloroform extract 50 8.11 ± 0.0813 14.9 ± 0.199
13.7160.596 19.230.855
ANOVA Data df F P-value F crit
50 10.947 0.04896 3.190727
Table 2. Anthelmintic activity of leaves extracts of Eupatorium odoratum.
Each values is represented as mean ± standard deviation (n = 5). Standard error mean < 0.492. Data are found to be significant by testing through one way ANOVA at 5 % level of significance (p < 0.05).
372
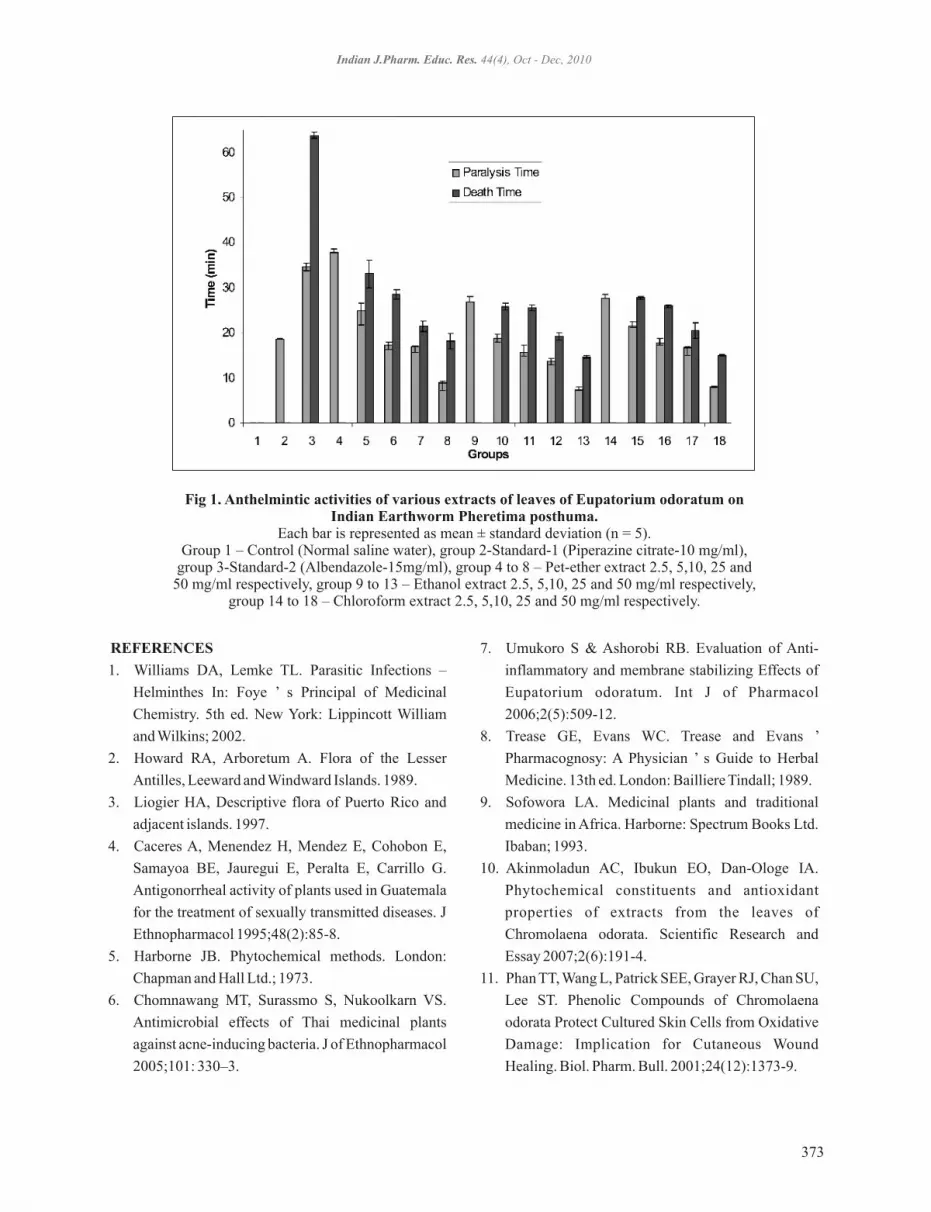
Fig 1. Anthelmintic activities of various extracts of leaves of Eupatorium odoratum on Indian Earthworm Pheretima posthuma.
Each bar is represented as mean ± standard deviation (n = 5). Group 1 – Control (Normal saline water), group 2-Standard-1 (Piperazine citrate-10 mg/ml),
group 3-Standard-2 (Albendazole-15mg/ml), group 4 to 8 – Pet-ether extract 2.5, 5,10, 25 and 50 mg/ml respectively, group 9 to 13 – Ethanol extract 2.5, 5,10, 25 and 50 mg/ml respectively,
group 14 to 18 – Chloroform extract 2.5, 5,10, 25 and 50 mg/ml respectively.
REFERENCES
1. Williams DA, Lemke TL. Parasitic Infections –
Helminthes In: Foye ’ s Principal of Medicinal
Chemistry. 5th ed. New York: Lippincott William
and Wilkins; 2002.
2. Howard RA, Arboretum A. Flora of the Lesser
Antilles, Leeward and Windward Islands. 1989.
3. Liogier HA, Descriptive flora of Puerto Rico and
adjacent islands. 1997.
4. Caceres A, Menendez H, Mendez E, Cohobon E,
Samayoa BE, Jauregui E, Peralta E, Carrillo G.
Antigonorrheal activity of plants used in Guatemala
for the treatment of sexually transmitted diseases. J
Ethnopharmacol 1995;48(2):85-8.
5. Harborne JB. Phytochemical methods. London:
Chapman and Hall Ltd.; 1973.
6. Chomnawang MT, Surassmo S, Nukoolkarn VS.
Antimicrobial effects of Thai medicinal plants
against acne-inducing bacteria. J of Ethnopharmacol
2005;101: 330–3.
7. Umukoro S & Ashorobi RB. Evaluation of Anti-
inflammatory and membrane stabilizing Effects of
Eupatorium odoratum. Int J of Pharmacol
2006;2(5):509-12.
8. Trease GE, Evans WC. Trease and Evans ’
Pharmacognosy: A Physician ’ s Guide to Herbal
Medicine. 13th ed. London: Bailliere Tindall; 1989.
9. Sofowora LA. Medicinal plants and traditional
medicine in Africa. Harborne: Spectrum Books Ltd.
Ibaban; 1993.
10. Akinmoladun AC, Ibukun EO, Dan-Ologe IA.
Phytochemical constituents and antioxidant
properties of extracts from the leaves of
Chromolaena odorata. Scientific Research and
Essay 2007;2(6):191-4.
11. Phan TT, Wang L, Patrick SEE, Grayer RJ, Chan SU,
Lee ST. Phenolic Compounds of Chromolaena
odorata Protect Cultured Skin Cells from Oxidative
Damage: Implication for Cutaneous Wound
Healing. Biol. Pharm. Bull. 2001;24(12):1373-9.
Indian J.Pharm. Educ. Res. 44(4), Oct - Dec, 2010
373

Indian J.Pharm. Educ. Res. 44(4), Oct - Dec, 2010
12. McDonald S, Prenzler PD, Autolovich M, Robards
K. Phenolic content and antioxidant activity of olive
extracts. Food Chem 2001;73:73-84.
13. Triratana T, Suwannuraks R, Naengchomnong W.
Effect of Eupatorium odoratum on blood
coagulation. J of Med Association of Tailand
1991;74(5): 283-7.
14. Thorn GW. Harrison ’ s Principles of Internal
Medicine, New York: Mc Grew Hill; 1977.
15. Vigar Z. Atlas of Medical Parasitology, 2nd ed.
Singapore: Publishing House 1984.
16. Nirmal SA, Malwadkar G, Laware RB.
Anthelmintic activity of Pongamia glabra. J Sci
Technol 2007;3:454-7.
17. Vagdevi HM, Latha KP, Vaidya VP, Vijaykumar
ML, Pai KS, Synthesis and pharmacological
screening of some novel naphtha [2,1-b] furo-
pyrazolines, isoxazoles and isoxazolines. Indian J
Pharm Sci 2001;63:286-91.
18. Bolton S. In Pharmaceutical Statistics-Practical and
Clinical Applications. New York: Marcel Dekker
1997.
374

Abstract
The present study was designed to study the sunscreen activity of herbal formulation. There is no evidence regarding
the sun protection factor studies on essential oil of Curry leaf oil (Murraya koenigii L. Spring., Rutaceae). This study
investigates its in vitro sun protection factor (SPF) by COLIPA method of Curry leaf oil in a cream formulation. The
sun protection factor were analysed by using Optometrics LLC, SPF- 290S is a recording ultraviolet – visible (UV-
VIS) spectrophotometer using samples exposed to Xenon arc lamp. The sun protection factor of Curry leaf oil cream
exhibited less activity (SPF= 2.04±0.02) suggesting it can be used to maintain the natural pigmentation of the skin or
can be used as an adjuent in other formulations to enhance the activity.
Key Words: Essential oil, Murraya koenigii, Curry leaf oil formulation, Sun Protection Factor, UV.
Abbreviations: UV: Ultraviolet, 290-400 nm; UV-B, 280-320 nm; UV-A, 320-400 nm; BED, Biologically Efficient
Dose; MED, Minimal Erythemal Dose; SPF: Sun Protection Factor.
Indian J.Pharm. Educ. Res. 44(4), Oct - Dec, 2010
INTRODUCTION
The purpose of sunscreen product is to prevent the skin
from tanning and burning by screening out the UV-A and 1UV-B radiations in sunlight .The proof of sunscreen
products efficacy is of high importance for the protection
of public health as the UV-B fraction of solar radiation is
t h e m a i n c o n t r i b u t o r t o s k i n s u n b u r n ,
immunosuppression and skin cancer. Evaluation of SPF
has been performed for a long time in vivo on human 2volunteers according to the COLIPA method . It is based
on the minimal erythemal dose (MED) related mainly to 3the biological effect of UV-B irradiation .
Murraya koenigii L. Spring. (Rutaceae) is an aromatic
pubescent shrub or small tree commonly known as curry
leaf in India. It often forms undergrowth in forests
throughout India and in Andaman Island, growing up to 4an altitude of 1500m . In traditional system of medicine,
Murraya koenigii L. Spring. is used as antiemetic,
antidiarrhoeal, in dysentery, febrifuge, blood purifier,
tonic, stomachic, flavouring agent in curries and chutney. 5-8The oil is used externally for bruises, eruption .
The essential oil from leaves of Murraya koenigii L.
9-exhibit strong antibacterial as well as antifungal activity 10. On commercial basis Curry leaf oil may find use as
4fixative for a heavy type of soap and perfume industry .
In aromatherapy, aromatherapists have used Curry leaf
essential oil against diabetes, hair loss and a means of
helping the skin maintain its natural pigmentation.
The present study deals with the determination of sun
protection factor (SPF) as cosmetic use of Murraya
koenigii L. leaf essential oil. The carbapol base cream
formulation containing isolated Curry leaf oil and its in
vitro evaluation for sun protection factor (SPF) by using
COLIPA method.
The study was designed with an objective to in vitro
determination of sun protection factor, using
Optometrics LLC, SPF- 290S, of the investigational
sunscreen cream sample. The SPF 290S is a recording
UV-VIS spectrophotometer designed and optimized for
the in vitro determination of SPF values, on a variety of
sunscreen and cosmetic products.
MATERIAL AND METHODS
2.1 Plant Material:
The plant specimens for the proposed study were
collected from in-house garden in Nashik; district
Nashik, Maharashtra, India. The specimens were
identified and authenticated by Botanical Survey of
Indian Journal of Pharmaceutical Education and ResearchReceived on 15/12/2009; Modified on 14/4/2010Accepted on 3/7/2010 © APTI All rights reserved
Determination of In-vitro Sun Protection Factor (SPF) of Murraya
Koenigii L. (Rutaceae) Essential oil Formulation1 1 1 2Rekha B Patil , Shantanu Kale *, Devanshi M Badiyani and A.V. Yadav
1MGV's Pharmacy College, University of Pune, Pune, Maharashtra, India. 2 Government Pharmacy College, Karad, Shivaji University, Kolhapur, Maharashtra, India.
*Author for Correspondence: [email protected]
375

I n d i a , P u n e , M a h a r a s h t r a , I n d i a . ( R e f . thBSI/WC/TECH/2008/501 Date 15 October, 2008). The
herbarium of the plant was deposited in the BSI against
voucher no. RBMUK1 10/2008.
2.2 Isolation of essential oil:
Fresh Curry leaves (voucher specimen deposited) were
obtained from the in-house garden, were cleaned and
washed thoroughly under running water. The excess
water was drained out completely and the leaves were
dried under shade for 7-8 days. Dried leaves of M.
koenigii L. were coarsely powdered in grinder. Weighed
(550 g) were macerated in alcohoh for 7 days with
frequently shaking, distilled the solvent up to
concentrate. That concentrated mass were subjected to
hydrodistillation in a Clavenger-type apparatus for 8 h.
The distillate was extracted with Diethyl ether, the
ethereal layer was dried over anhydrous sodium sulphate
and ether distilled of on gently heated on water bath. The
yield of the oil obtained was found to be 0.95 %.
2.3 Physico-chemical properties of oil:
After isolation of oil, the physico-chemical parameters
for oil were tested for the identity of oil. Specific gravity: 0 250.8858 g/ml at 25 C, relative density n : 0.993 g/ml, D
0optical rotation: -5.3 , viscosity by Brookfield
viscometer: 13 Cp, acid number: 1.15, saponification
value: 122.8, ester value: 121.03.
2.4 Preparation of cream formulation:
Sun protection formulation is a main issue for
formulators nowadays. Considering the need of the
market, formulations are more difficult to make than for
standard care products. That is a challenge, which is
achieved by preparing a stable formulation by
considering the things: the difficulty to stabilize
components, the interaction between the ingredients,
water resistance, easy spreadibility, pleasant feeling
during and after application, stable formulation and non
irritant. Carbopol 940 has been selected the gel forming
polymer for the preparation of the semi-solid formulation
of curry leaf oil, because the rheological property of
Carbopols have extensively been studied as a function of
Concentration, pH and cross-linked density.
Cream formulation of isolated Curry leaf oil from leaves
of Murraya koenigii L. were prepared using formulae
given in (Table No. 1). For the formulation to prepare
plain gel Carbopol-940 was soaked in Water (80%). After
0that, it was homogenized and then heated to 80 C. In
another 5% quantity of Water was added Disodium
EDTA, Sodium methyl paraben and kept aside. In another
5% quantity of Water was added Triethanolamine and
kept aside. Other is oil phase, was prepared by collecting
and heating Sodium propyl paraben, Cetostearyl alcohol,
Stearic alcohol, Cetomacrogol-1000, along with Cetyl 0alcohol at 80 C. Homogenized heated Carbapol and
added Disodium EDTA, Sodium methyl paraben, in
water and quickly added oil phase and homogenized for
15 minutes. The cream was kept at room temperature.
Then Murraya koenigii L. oil was weighed (5%) and
added in the formed emulsion under constant
homogenization. The cream was once more neutralized
with Triethanolamine under constant stirring. The final
pH of the formulation was 6.0. Whole formulation was
stored in well closed amber coloured glass bottle and was
compounded fresh for all studies.
2.5 Physical parameter of cream tested:
The finished product was evaluated for its safe use, by
studying its sensory evaluation, pH, spreadibility,
specific gravity, heavy metal testing for Lead (Pb), total
aerobic microbial count and patch testing for irritancy:
etc. as per official methods and results are mentioned in
(Table No.2).
2.6 Determination of the in vitro sun protection factor:
Approximately 100 mg of the investigational sample was
applied and spread on 50 sq.cm area to obtain a sample 2film thickness of 2 l/cm on Transpore Tape® to get an
even film as suggested in the operation manual of
Optometrics LLC for the sample preparation and
application technique. The samples thus prepared were
exposed to Xenon arc lamp for determining the sun
protection factor. Scan of the sample were run from 290
nm to 400 nm. This study was performed by
Transmittance Measurement of the sample. The
Optometrics Model SPF–290 Analyzer is a computer-
controlled instrument that is designed to measure the
sunscreen protection factor of sunscreen preparations.
For US FDA standards the protection factor is calculated
over the wavelength range from 290 to 400 nm.
The SPF-290 software uses Trapezoidal Approx.
calculation technique to approximate the integral for SPF
and Erythemal UVA protection factor. These include
UVA/UVB ratio, critical wavelength, cumulative
Indian J.Pharm. Educ. Res. 44(4), Oct - Dec, 2010
376

absorbance, etc. The Average Absorbance method is used
for calculating average protection factor; this method
averages and computes the standard deviation based on
the absorbance scan data. This method of calculation
gives a better average value assuming that sample
thickness is the largest variable in performing a
protection factor measurement. For the calculation of
standard deviation, Diffey's method is used, is based on
B. L. Diffey's paper on using Transpore Tape® as the 11substrate for SPF measurements . Diffey's equation
applies weighting by recognizing that the MPF
(Monochromatic protection factor) measurements for a
set of scans have some distribution. Therefore, the
standard deviations of the MPF measurements at each
wavelength are factored in to the Diffey SPF standard
deviation calculation.
Win SPF has used the following equation for calculating
SPF.
RESULT
The Formulation of essential oil of Murraya koenigii L.
was studied for all parameters of cream as well as for in
vitro sun protection factor. The results of cream and sun
protection factor test summarized in (Table No. 2 and 3)
showed that cream parameters complies as per official
acceptance criteria's and SPF for Curry leaf oil cream
formulation 2.04±0.02 shows minimum sun protection
activity for sunlight and erythema.
DISCUSSION
Determination of SPF in the Curry leaf oil cream
formulation
To initiate an analysis, a reference scan (which consists of
data from the 23 wavelengths) was acquired with the
blank substrate in the incident beam. The samples were
then applied to the substrate and the first sample scan was
made. Data was collected in the same manner as the
reference data, ratioed to the reference and plotted as a
MPF. Ratioing the sample signal to the reference signal
negates any effect of wavelength dependent variables in
the optical system (source, monochromator, and
detector). Up to 6 sample scans were made to compensate
for variables in the substrate and sample application.
Three readings were taken consecutively and its average
value is shown in Table No.2.
There is no evidence regarding the sun protection factor
studies on essential oil of Murraya koenigii L. from the
literature survey it could be found that aromatherapists
have used Curry leaf oil in helping the skin maintain its
natural pigmentation. It is a discovery that Curry leaf oil
shows SPF activity.
CONCLUSION
This study has shown that Curry leaf oil cream shows the
low sun protection factor so the cream can be used in
maintaining the natural skin pigmentation or it can be
used as additives in other formulations to enhance the
activity.
ACKNOWLEDGEMENTS
The author wish to thank the Dr. Mrs. Anupama Wagale,
In charge, The Kelkar Education Trust's, Scientific
Research Center, Mulund (E), Mumbai for technical
guidance about Sun Protection Factor of Formulation.
Indian J.Pharm. Educ. Res. 44(4), Oct - Dec, 2010
377

Sr. No Ingredients Weight (%w/w)
1. Cetostearyl Alcohol 05
2. Stearic Acid 02
3. Cetomacrogol 02
4. Cetyl Alcohol 01
5. Carbopol 940 0.5
6. Disodium EDTA 0.02
7. Sodium Methyl Paraben 0.3
8. Sodium Propyl Paraben 0.06
9. Triethanolamine q.s. (to pH 5-6)
10. Demineralised Water Up to 100.00
11. Murraya koenigii L. Oil 05
Indian J.Pharm. Educ. Res. 44(4), Oct - Dec, 2010
Table No. 1. Formulation content
Sr. No. Parameters Observations
1 Colour Off-White
2 Odour Spicy
3 Spreadibility Good and uniform
4 pH 6.5
5 Specific gravity 0.97
6 Limit test for Lead Passes
7 Viscosity (26 0 C)S 251646.3 (2 rpm)
8 Total microbial count Nil
9 Patch test for irritancy No Irritation Reaction Persist
Table No.2 Physical parameters of Murraya oil Cream formulation
Test Sample Parameters Average value
Curry Leaf Oil SPF 2.04
Cream Standerd Deviation ±0.02
Critical Wavelength 38.37
Table No. 3. Result expressed as the average and S.D. of three determinations replicated of SPF values with critical wavelength.
378
REFERENCES
1. Mitsui T. New Cosmetic Science. 1st Edition;
Netherlands, Amsterdam AE, Elsevier Science BV
1000. 1997;460.
2. COLIPA - Bertil H, CTFA-SA – Jill Gardiner, JCIA
–Toshitaka Makino. International Sun Protection
Factor, (SPF) test method (COLIPA - The European
Cosmetic Toiletry and Perfumery Association;
CTFA-SA - Cosmetic, Toiletry & Fragrance
Association of South Africa; JCIA - Japan Cosmetic
Industry Association) 2006; 5.
3. Bendova H, Akram J, Krejici A, et. al., In vitro
approaches to evaluation of Sun Protection Factor.
Toxicology in vitro 2007;21:1268-75.
4. Anonymous. Wealth of India. CSIR, New Delhi:
NISCAIR press Ltd.; 2005;6:446-8.
5. Kirthikar KR and Basu BD. Indian Medicinal
Plants. 2 nd Edition. Dehra Dun: Bishen Singh
Mahendra Pal Singh; 1935;1:474-5.
6. Drury HC. The Useful Plants of India. 2 nd Edition.
London: Allen; 1978;78.
7. Peter KV. Curry leaf - A good ingredient for
vegetable preparations. Indian Farmers Digest
1978;10:13-4.
8. Prajapati ND, Purohit SS, Sharma AK and Kumar T.
A Handbook of Medicinal Plants. Jodhpur: Agro
bios, 2003;352-3.
9. Goutam MP and Purohit RM. Antimicrobial activity
of the essential oil of the leaves of Murraya koenigii
(Linn) Spreng (Indian Curry leaf). Indian J. Pharm.
1974;36(1);11–12.
10. Kishore N, Dubey NK, Tripathi RD and Singh SK.
Fungitoxic activity of leaves of some higher plants.
Natl. Acad. Sci. Lett. 1982;5(1):9.
11. Diffey BL, Robson J. J. Soc. Cosmet. Chem
1989;40:127-33.
Indian J.Pharm. Educ. Res. 44(4), Oct - Dec, 2010
379

Abstract
Stimuli sensitive hydrogels are hydrophilic , three dimensional networks, which are able to imbibe large amount of
water or biological fluids and undergoes a phase transition after receiving a specific stimulus.
Ophthalmic drug delivery is often impaired by removal mechanism (blinking, tears) and by the barriers of the pre
corneal areas and further patients do not seek medical attention until the disorder is well established because of lack
of symptoms. Conventional topical treatments have measure drawbacks including poor ocular bioavailability i.e. less
than 5 % of administered active drug is absorbed or becomes available at the site of physiological activity. The
reduced therapeutic responses and the poor bioavailability exhibited by the conventional dosage forms are due to
rapid pre corneal elimination of the drug, tear turnover, lacrimal drainage and degradation by enzymes. Low
absorption results in short duration of action and high frequency of eye drop instillation is associated with discomfort
of patients. This problem was solved by using stimuli sensitive hydrogels that are instilled as drops in eye and undergo
a phase transition in cul-de-sac. These hydrogels are able to prolong the residence time of drug in pre corneal cavity
due to enhanced viscosity by stimulation of pH. The developed hydrogels was therapeutically effacious, stable, non-
irritant and In-vitro drug release for 8 hours was observed.
Keywords:Timolol maleate, Stimuli Sensitive Hydrogels , viscosity , carbopols.
Indian J.Pharm. Educ. Res. 44(4), Oct - Dec, 2010
associated with patient non compliance. After instillation
of eye drop, the effective tear drainage and blinking
action of eye results in a 10 times reduction in the drug 4concentration with in 4- 20 min . Due to the tear
drainage, most of the administered dose passes via
nasolacrimal duct into the Gastro Intestinal tract leading
to the side effects . Rapid elimination of the eye drops
often results in a short duration of the therapeutic effect
.The normal volume of tear in the eye is 7 µl whereas a
non blinking eye can accommodate a maximum of 30 5µl of the fluid, the usual single drop size of an instilled
eye drop is upto 50 µl and thus most of the drug instilled
as eye drop is drained away or lost.
Ophthalmic therapy can be improved by increasing the
corneal residence time of drugs. Several drug delivery 6systems are widely used such as ocular inserts, collagen
7shields etc. These systems are able to prolong the
contact time of vehicle on the ocular surface and also
slow down drug elimination. However these systems are
having some disadvantage such as poor compliance,
INTRODUCTION
Stimuli sensitive hydrogels are hydrophilic , three
dimensional networks, which are able to imbibe large
amount of water or biological fluids and undergoes a 1phase transition after receiving a specific stimulus .This
hydrogels approach can be used for the treatment of
Glaucoma in ophthalmic drug delivery. Glaucoma
comprises a group of chronic conditions that is
characterized by progressive deformation of the optic
nerve head and elevated intraocular pressure (IOP), a risk
factor. It affects primarily the middle aged and elderly, the
glaucoma currently constitute second most common 2,3cause of treatable blindness worldwide.
In the ophthalmic drug delivery systems, the
physiologicals constraints imposed by the protective
mechanism of the eye leads to the low absorption of drugs
and results in a short duration of therapeutic action.
Excessive frequency of the eye drops instillation is
Indian Journal of Pharmaceutical Education and ResearchReceived on 05/08/2009; Modified on 22/01/2010Accepted on 03/07/2010 © APTI All rights reserved
In vitro and In Vivo evaluation of Stimuli Sensitive Hydrogel for
ophthalmic drug deliverya* b c d e Vinod Singh , S.S. Busheetti S Appala Raju , Rizwan Ahmad , Mamta Singh,
bLuqman College of Pharmacy, Gulbarga. Karnataka(India).a,d,eSBS PG Institute of Biomedical Sciences & Research , Dehradun, Uttrankhand.(India ).
c HKE's College of Pharmacy, Gulbarga, Karnataka (India).
*Author for Correspondence: [email protected]
380
uncomfort, especially by the elderly people and many
patients sometimes may lose or drop it without noticing
it.
This problem can be overcome by using stimuli sensitive
hydrogels prepared from the polymers that exhibit
reversible phase transition. Stimuli sensitive hydrogels
can be formulated in liquid phase suitable to be
administrated by instillation into the eye cavity and upon
exposure to the stimuli such as pH, temperature, ion
activated etc, changes to the gel phase of high viscosity
and thus improves the corneal residence time and
bioavailability of the drug .
There are various methods used to cause reversible
phase transition on ocular surface such as temp 8,9dependent concept (pluronics) , pH triggered systems
10, (including cellulose acetate hydrogen phthalate latex 11 12 13, carbopols , ion activated systems including gelrite ,
14 15gellan , carbopol /pluronics .
The purpose of the designed work was to develop a
Stimuli sensitive hydrogels which can be used for
ophthalmic therapy and was able to provide a sustained
effect and helps in reduction of frequency of
administration of dose.
In the present work, ophthalmic stimuli sensitive
hydrogels were prepared and evaluated for glaucoma
treatment.
2. MATERIALS AND METHODS:
2.1 MATERIALS & ANIMALS
Timolol maleate is provided by the FDC pvt .ltd,
Mumbai.
Carbopols 934p was provided by the Noveon polymers,
Arihant trading Co. Mumbai. Viscolozers i.e Hydroxyl
propyl methyl cellulose was made available by S.d fine
chem. ltd, Biosar. Triethanolamine. Sodium chloride was
provided by S.d fine chem. pvt. ltd. mumbai. All the
reagents were of the analytical grade. Albino rabbits of
both sexes, weighing between 1.8 kg to 2.2 kg were used
for the study.
The procedure involving animals were reviewed
approved by the animal ethics committee (No.
273/CPCSEA).
2.2 FORMULATIONS DETAILS OF HYDROGELS
Hydrogels were formulated by using Timolol maleate 16(anti glaucoma agent), benzalkonium chloride
(preservative), ethylene diamine tetraacetic acid
17(chelating agent ), sodium chloride (tonicity
contributors ) & viscolizer i.e Hydroxy propyl methyl
cellulose.
Weighed quanties (Table 1 ) of Timolol maleate,
Benzalkonium chloride, EDTA, NaCl, were dissolved in
the pH 4 phosphate buffer under aseptic conditions.
Then poly acrylic acid was slowly added with
continous stirring with digital remi stirrer at speed of
1500- 2000 rpm to minimize the formation of the lumps,
then viscolizers was added with a slow stirring to avoid
the foam formation. Stirring was continued until a clear
dispersion was formed. The prepared hydrogels were
evaluated for the viscosity study in order to identify the
composition suitable for the use.
2.3 EVALUATION OF THE HYDROGELS
2.3.1 RHEOLOGICAL STUDIES
Viscosity determination of the prepared formulation were +determined using Brookfields viscometer LVDV II . The
viscosity of the hydrogel was measured at different rpm.
The correct viscosity of the hydrogel was noted at
particular spindle at which it shows maximum percent
torque value.(Table 2).
Viscosity results indicate that at acidic pH 4 phosphate
buffer, hydrogel were less viscous and at pH 7.4
phosphate buffer (equivalent to pH of eye cavity) it
changes into a highly viscous preparation . The
Literature also suggests that the viscosity value in the 18range of 15 cps to 50 cps significantly improves the
contact time of the formulation on the corneal surface
and higher viscosity values offers no significant
advantage and have a tendency to leave a noticeable
residue on the lid margin .
2.3.2 DRUG POLYMER INTERACTION STUDIES
Drug polymer interaction studies was carried out by
Infrared spectral analysis . Infrared spectra of Timolol
maleate pure drug & formulation were scanned by
using Perkin elenmeyer FTIR 1600, by a thin film
method . The drug Timolol maleate in its infrared -1spectrum exhibited a strong peak at 3445 cm
indicating the presence of -OH group. The absorption
due to the –NH group present molecule is supported
by exhibiton of a shoulder to the main peak around -12100 cm .The drug contain more than one C=N
absorbtion present in the thiadizole moiety of the
heterocylic ring system. When pure drug was
Indian J.Pharm. Educ. Res. 44(4), Oct - Dec, 2010
381

formulated with the carbopol 934p & viscolizers , the
spectrum obtained for this formulated product exhibit a -1 -1 broad absorption peak from 3050 cm to 3500 cm
indicating the participation of the alkali hydroxyl in
forming gel preparation. The increased viscosity leads to
a broadening of peak . The spectral data suggest s that
the inactness of the thiadizole ring structure of the
timolol maleate indicated by the absence of the
additional peaks which confirm the opening of the
thiadizole ring is not taking place. Hence the drug
timolol maleate was not reacting with the polymers used
in the formulation .
2.3.3 INVITRO RELEASE STUDY
Invitro release rate of the timolol maleate from the
stimuli sensitive hydrogels was determined by the
diffusion process. 1 ml of the formulation was kept in
the donar compartment over a cellophane membrane
which was rinsed and soaked for the 24 hours in the
diffusion medium. The donar compartment was
immersed in the receptor compartment containing 50ml
of the phosphate buffer of pH 7.4, the beaker containing
diffusion medium (receptor compartment) was o 19 maintained at 37 C with the constant stirring at 22 rpm
using the magnetic stirrer. One ml aliquots were
withdrawn from the diffusion medium every hour for the
8 hours and same quantity of fresh, prewarmed diffusion
medium was replaced for the amount withdrawn. The
s a m p l e s w i t h d r a w n w e r e a n a l y s e d 20spectrophotometrically at 294 nm for the timolol
maleate using Shimazdu Double beam UV-Visible
spectrophotometer.
2.3.4 STERLITY TESTING
The sterlity testing of the hydrogels were performed for
the aerobic, anaerobic bacteria and fungi by using
alternative thioglycolate medium and soyabean casein
digest medium. The positive control (growth promotion),
negative control (sterlity ) test were also carried out.
Bacillus subtilis was used as a test organism in the case
of aerobic bacteria test. Bacteriodes vulgatus was used
as a test organism in case of anaerobic bacteria test &
candida albicans in fungi test .
Incubation was carried in all cases and growth was
checked. The overall results of the sterlity test showed
that ophthalmic formulation prepared passes the sterlity
test as there was no evidence of the growth found in the
Indian J.Pharm. Educ. Res. 44(4), Oct - Dec, 2010
negative control test tubes. Thus the hydrogels are
sterile in nature.
2.3.5 INVIVO EVALUATION
Glaucoma was induced in the rabbit by the method of 21Bonomi l et. al . In this method, six albino rabbits of both
sexes weighing between 1.8 kg to 2.2 kg were used in
the study & they were checked for normotensiveness,
care was taken to acclimatize the rabbit to the
laboratory conditions. During the experiment food and
water was provided ad libitum. The increase in the
intraocular pressure was achieved by the a
subconjuctival injection of the Betamethasone 4 mg/ml 22every weeks for the 4 weeks . The formulation X2 was
instilled in the conjuctival Cul de sac and the lowering in
the intraocular was measured by using schiotz
tonometer. Statistical evaluation was performed and it
was found significant i.e ( p < 0.05).
Comparative evaluation was also performed with
commercial available eyedrops. The marketed eyedrops
suddenly lowers the intraocular pressure to the minimum
and afterwards there was a sudden increase in the
intraocular pressure to the original reading , where as the
hydrogels lowers the intraocular pressure slowly to the
minimum and there after a gradual increase in the intra
ocular pressure . Thus a sustained effect was maintained
with this stimuli sensitive hydrogels.
2.3.6 OCULAR EYE IRRITATION
In the measurement of injury to the eye, a modification of
the scoring system of Friedenwald, Hughes and
Herrmann (Modified Draize Technique) was used.
Six albino rabbits of both sexes weighing 1.8 to 2.2 Kgs
were used for the study. The method of the study of
ocular irritation was based on a modification of the
Draize technique. 0.1 ml of selected formulation was
instilled in the conjunctival sac of each rabbit and
readings were made at 1, 24 and 48 hours after instillation
of the formulation into the eye and were evaluated on the
guidelines of scale of weighted scores for grading the
severity of ocular lesions.
CONCLUSION
In the present research work, stimuli sensitive hydrogels
was successfully formulated and evaluated for drug
release studies, infra red studies, sterlity studies and in-
vivo studies. The hydrogels provide a sustained drug
release upto 90% upto 8 hours period. Viscosity of the
382

prepared hydrogels lies in the optimum range i.e 25 cps to
50 cps.
Infra red studies shows that there was no interaction of
the thiadizole ring which shows that the drug and
polymer was not reacting together . All the hydrogels
passes the test for the sterlity as growth was not observed
in test tubes. Invivo results clearly shows that the
hydrogels provide a better sustained release of the
drug in comparison to the marketed conventional
dosage form. Thus the hydrogels are safe and provide
therapeutically effacious and provide increased
bioavaliabilty and therapeutic response.
ACKNOWLEDGEMENT
Authors are thankful to the Luqman College of
Pharmacy, and HKE's college of pharmacy, Gulbarga,
Karnataka for providing the help during this work..
Authors are also thankful to SBS Post graduate Institute
of Biomedical Sciences and Research, Balawala,
Dehradun.
Concentration ( %w/v)
Sl.no Ingredients X1 X2 X3 X4 X5 X6
1 Timolol maleate 0.25 0.25 0.25 0.25 0.25 0.25
2 Benzalkonium chloride 0.01 0.01 0.01 0.01 0.01 0.01
3 EDTA 0.1 0.1 0.1 0.1 0.1 0.1
4 NaCl 0.9 0.9 0.9 0.9 0.9 0.9
5 Poly acrylic acid - C 934p 0.3 0.3 0.3 0.35 0.35 0.35
6 HPMC - 0.4 0.5 - 0.4 0.5
7 pH 4 buffer 150 ml 150 ml 150 ml 150 ml 150 ml 150ml
Table 1: Formulation details
Indian J.Pharm. Educ. Res. 44(4), Oct - Dec, 2010
pH X1 X2 X3 X4 X5 X6
4.0 3.84 19.2 30.7 4.02 19.7 33.1
7.4 6.72 34.3 53.9 7.50 41.6 68.4
Viscosity(cps)
Table 2 .Viscosity details of the formulations at pH 4.0 and pH 7.4
Time Log Time Sq. Root Cum % Drug Released Log cum % Drug Released
(Hrs) Time X1 X2 X3 X4 X5 X6 X1 X2 X3 X4 X5 X6
1 0.0000 1.00 35.1 32.7 30.3 35.8 32.6 32.9 1.54 1.51 1.48 1.55 1.51 1.51
2 0.3010 1.4142 54.6 51.1 48.6 50.6 49.3 48.5 1.73 1.73 1.68 1.70 1.69 1.68
3 0.4471 1.7320 68.0 61.1 65.0 62.8 61.5 60.3 1.83 1.83 1.81 1.79 1.78 1.78
4 0.6020 2.0 74.6 67.5 68.0 67.0 66.2 68.2 1.87 1.87 1.83 1.82 1.82 1.83
5 0.6989 2.236 76.8 73.6 74.6 74.0 72.8 74.2 1.88 1.88 1.87 1.86 1.86 1.87
6 0.7781 2.4494 80.56 79.0 79.7 80.3 76.2 78.6 1.90 1.90 1.90 1.90 1.88 1.89
7 0.8450 2.6457 86.81 80.8 82.9 86.8 81.5 80.8 1.93 1.93 1.91 1.93 1.91 1.90
8 0.9030 2.8284 85.31 83.7 84.8 83.7 82.5 81.8 1.93 1.93 1.92 1.922 1.91 1.91
Table 3. Invitro drug release studies of prepared hydrogels
383

0 30 60 90 120 150 180 210 240 270 300R 18.5 18.5 18.5 18.5 18.5 18.5 18.5 18.5 18.5 18.5 18.5L 23.8 23.8 21.9 17.0 15.6 17.0 21.9 22.8 23.8 23.8 23.8 R 18.0 18.0 18.0 18.0 18.0 18.0 18.0 18.0 18.0 18.0 18.0L 21.9 21.9 1 4.6 17.3 21.9 21.9 21.9 21.9 21.9 21.9 21.9
Time (Min)
Hydrogel
Marketed
Table 4. Intra-ocular Pressure (mmHg) measurement in rabbit eye
Figure 1. Viscosity details of hydrogels at different pH . Figure 2. In-vivo study
REFERENCES
1. Bushetti SS, Vinod Singh, Appala Raju S,
AtharJaved, Veermaram. Stimuli Sensitive
hydrogels: A review. Indian J Pharm Educ Res 2009;
43(3):10-19
2. Garway- Health DF, Rudnicka AR, Lowe T.
Measurment of optic disk size: Equivalence of
methods to correct for ocular magnification. Br J
Ophthalmol 1998; 82: 643-649.
3. Thylefors B, Negrel AD. The global impact of
glaucoma . Bull world health organ 1994; 72: 323-
326.
4. Maurice D.M., kinetics of topical applied
drugs , In : sae t tone ,M.S, bucc i ,p , spe ise r
p ( e d s ) . o p h t h a l m i c d r u g d e l i v e r y ,
biopharmaceutical, technological and clinical
aspects. fidia research series vol.11.Padova: liviana
press;1987.19-26.
5. Alfanso R Gennaro. Ophthalmic preparation:
Remington pharmaceutical sciences. 18 th edition.
P e n n s y l v a n i a : M a c k p u b l i s h i n g
company;1990;1581
6. Ding. Recent development in ophthalmic drug
delivery. Pharm. Sci. Technol. Today 1998; 1 : 328 -
335
7. Hill JM, Callaghan RJ, Hobden JA , Kaufman E.,
controlled collagen shield for ocular delivery in. :
Mitra AK ( ed) , ophthalmic drug delivery systems .
New york: Marcel Dekker; 1993. 261 – 275.
8. Desai SD , Blanchard J. In vitro evaluation of
pluronic F 127 based controlled release ocular
delivery system for the pilocarpine. J . Pharm Sci
1998;87: 226- 230
9. Kamel Ah El. Invitro and in vivo evaluation of
pluronic f 127 based ocular delivery system based on
the ocular delivery system for timolol maleate.
International Journal of Pharmaceuticas 2002; 241:
47 – 55 .
10. Gurny R. Preliminary study of prolonged acting
drug delivery system for the treatment of glaucoma.
Pharm. Acta. Helv. 1981;56: 130-132
11. Gurny R, Boye T , Ibrahim H. Ocular therapy with
nanoparticle system for controlled drug delivery . J .
Control Rel 1985; 2 : 353
12. Srividya B, Cardoza RM , Amin PD. Sustained
ophthalmic delivery of the oflaxin from a ph
triggered insitu gelling systems. J.Control Rel 2001;
73: 205
13. Rosier A, Manuel C, Groove J, Plazonet B. Gelrite;
A novel ion activated in situ gelling polymers for
ophthalmic vehicles, effect on bio availability of
Indian J.Pharm. Educ. Res. 44(4), Oct - Dec, 2010
384

Indian J.Pharm. Educ. Res. 44(4), Oct - Dec, 2010
timolol maleate. Int.J. Pharm 1989; 57: 163-168 .
14. Sanzgiri YD, Maschi S , Crescenzi V , Callingaro L,
Top EM, Stella VJ. Gellan based systems for
ophthalmic sustained delivery of methyl
prednisonolone. J. Control Rel 1993; 2:195-201.
15. Lin HR, Sung KC . Carbopol /pluronic phase change
solution for the ophthalmic drug delivery . J. Control
Rel 2000; 69: 379-388.
16. Ainley Wade, Paul J Weller. Benzalkonium chloride.
Handbook of pharmaceutical excipients. 2 nd Ed.
London: Pharmaceutical press; 1994; 27-29
17. Ainley Wade , Paul J Weller. Sodium chloride.
Handbook of pharmaceutical excipients, 2 nd
Ed.London: Pharmaceutical press; 1994;439- 442
18. Alfanso R Gennaro. Ophthalmic preparation.
Remington pharmaceutical sciences , 18 th Ed.
Pennsylvania: Mack Publishing Co.; 1581;1990
19. Asgar Ali , S.N Sharma. Farication of through flow
apparatus for the in vitro determination of drugs
from ophthalmic preparation. Indian Drugs
1991;29(4): 157-160
20. David J Mazzo, Alice E Loper. Timolol maleate .
Analytical profile of the drug substances1987;16:
641- 692
21. Bonomi L, Perfetti S, Noya E, Bellucci R,
Tomazzolli L Experimental corticosteroid ocular
hypertension in the rabbit. Albrecht Von Graefe ’ s
Arch Klin Experimental ophthalmology 1978;
209(2):73-82
22. Drago , Emmi I , Marino V. Effect of beta blockers
association with pilocarpine on rabbit intraocular
pressure and heart rate. Pharmacol .1997;35: 261-
275.
385

Abstract
Total quality management (TQM) is a management strategy which is aimed to embed quality awareness in all the
organizational processes. It is undisputed that TQM is necessary in pedagogy, however, how to go about achieving
this is a larger question. In pedagogy, TQM involves improvement of teaching quality and learning processes. The
paper describes the methods to achieve teaching quality, evaluation of teaching quality by peer-reviewing, student
feedback and evaluation of learning process. The authors propose a new concept of 'teacher-accreditation', which
may be more important over the other accreditations. A scheme is suggested for such accreditation, which may be
refined to make it robust, accurate and acceptable to all parties.
Key Words: Total quality management, pedagogy, professional education, teacher accreditation
Indian J.Pharm. Educ. Res. 44(4), Oct - Dec, 2010
INTRODUCTION
In the recorded history of human civilization, never
before was there so much of scientific and technological
advancements and innovations, all over the world. Vast
knowledge means that it can go out of the grip of mankind
if not absorbed properly with an effective command.
There have not been sufficient efforts on improving the
human capacity for absorbing and utilizing knowledge
effectively. Hence, it is necessary to develop advanced
methods, which can systematize the teaching and
learning process in a dynamic manner, by identifying
bottlenecks and analyzing the reasons for bottlenecks.
Essentially, this needs the integration of scientific
analyses and methods into the art of teaching and
learning. Such an attempt to increase the knowledge
absorption through improvement of teaching and
learning process is the basis for total quality management
in pedagogy (TQM_P).
Total Quality Management (TQM) is a management
strategy aimed at embedding awareness of quality in all 1organizational processes . In any organization, there are
workers, investors, producers, distributors, sellers and
customers, which forms a kind of supply chain. Here,
they are conceived as servers and customers. However,
when TQM philosophy is applied, all participants
become servers and customers at the same time.
The awareness of total quality management (TQM) in
professional and higher education started in early 1980s
and gained a quick popularity. TQM could serve as a
paradigm for improving every aspect of collegiate
functioning from fiscal administration to classroom
instruction. Thus, when TQM is applied to pedagogy, the
governing body, the administrative departments, the
heads of departments, the teaching force and students –
all of them become important parts of the teaching-
learning process, with 'same overall objectives'. It would
be necessary to translate individual objectives to be in
harmony with the overall objectives of the system.
ROLE OF TQM IN PROFESSIONAL AND
HIGHER EDUCATION
Deming (1994) linked the quality management principles 2and education . He had the view that 'improvement of
education and management of education require the
application of the same principles that must be used for
the improvement of any process, manufacturing or
service'. Traditionally, teaching and learning are
considered as arts. But, they can also be subjected to
scientific scrutiny (without causing any harm to the art-
sense), which would require appropriate quantifications
of important qualities of the art and this quantification Indian Journal of Pharmaceutical Education and ResearchReceived on 15/04/2009; Modified on 29/09/2009Accepted on 13/04/2010 © APTI All rights reserved
Total Quality Management in Pedagogy (TQM_P): An Update1 2Ram Chakka and G.T. Kulkarni *
1Department of Information Technology, Meerut Institute of Engineering and
Technology, NH-58 Bypass, Baghpat Crossing, Meerut 250 005 (UP)2Laureate Institute of Pharmacy, Kathog 177 101 (Teh Dehra, Dist. Kangra, HP)
*Author for Correspondence: [email protected]
386

forms the basis for TQM_P.
Many academic programs have tried applying quality
principles in their work. Many quality based models have
been described, which include models for classroom
instructions, department program planning and
administration. Even after more than a decade of such
efforts, TQM has not yet established itself as 'the way'
educational institutions operate. However, there have
been excellent results, particularly in the west, even with 2partial application of the TQM principles .
Total quality management in pedagogy is directly related
to teaching and learning quality. Hence, basic step
towards TQM is to improve the effectiveness of 3teaching . This can be done by adopting teaching
strategies which have been validated by extensive
research. Improvement in teaching requires
identification of problems in the existing academic
practices, followed by utilization of a combination of
sound educational and psychological principles, along
with feedback, to devise better approaches dynamically.
This would, in turn, lead to improvement of institutional
teaching programs, which is a major step towards
achievement of total quality.
Achievement of Teaching Quality through Action
Research
A recent advancement in assurance of education quality 3is Action Research . Action research is a type of applied
experimental research, which is conducted by the teacher
himself / herself for improving his / her own action
(teaching) strategy. It aims at the development of
alternative teaching strategies and changes in the
classroom system that improves the learning skills of the
students. The nature of action research involves aspects
such as - felt need, quick and correct feedback, immediate
result, improvement in levels of knowledge and skill,
experimental approach, localized approach, and 3immediate applicability .
In formulating action research projects, the teachers may
identify a problem, discuss the problem with peers to
sharpen it, formulate and test the hypotheses and draw
conclusions and apply the findings. The problems may be
identified by an individual or a group. The effectiveness
can be observed immediately through improvement in
students' learning and 'feel'.
EVALUATION OF TEACHING PROCESS
Traditionally, teaching is considered as knowledge
transmission. Hence, in the traditional teacher-centered
concept of teaching, only the quality of the knowledge
that the teacher transmits and the quality of the mode of
transmission of knowledge to the students are
considered. Once the focus is shifted from the teacher to
the learner, the above concept gets a radical shift, which
results in measurement of the quality of the learning and
enhanced learning capability, resulting from teaching.
The quality of teaching can be assessed on the basis of
basic qualities of a teacher, which include competence of
the teacher in imparting knowledge, teacher's ability to
facilitate independent thinking and life-long learning,
growth and innovativeness as a teacher and educationist.
Further, inspiring and attracting the students by making
the process of learning an enjoyable experience, can also
be added as another benchmark.
Student Ratings of Teaching: A Tool for Evaluation of
Teaching Quality
Student rating is the most popular method, which gives a 4valid assessment of teaching quality . Student
evaluations have higher levels of reliability, and should
always be a part of the TQM process in education. But, it
cannot be the sole source of teaching assessment, since
students cannot evaluate some of the aspects of course
such as whether course learning objectives are
appropriate, content is current with the state of the art in
the field, and the particular course prepares the students
for subsequent courses in the curriculum. Such aspects
should be evaluated by knowledgeable peers. Hence,
student rating can only be a supplement to the peer 4,5rating .
How to Make the Student Ratings Effective?
The following recommendations from different
educationists need to be considered to improve the 6effectiveness of the student ratings :
1. The rating form should be developed with the
assistance of a person who is knowledgeable in
educational quality.
2. The ratings should be collected from a large number
of students, which should not be less than 2/3 of a class.
3. Decisions should not be made on the basis of ratings
from a single semester. There should be seeming
consistency in the ratings obtained in at least three
semesters.
Indian J.Pharm. Educ. Res. 44(4), Oct - Dec, 2010
387

4. The rating form should be designed so that the
evaluation is affected, only slightly, by factors other than
quality of teaching, such as class size, gender of
instructor, nature of course, etc.
5. Before taking the evaluation forms, students have to
be informed that their ratings will be considered carefully
and may have an impact on teaching assignments. By
this, students will consider the rating seriously.
In many cases, modifications of the criterion for better
evaluation of teaching quality can be done. Some of such
modifications include the following:
1. In certain cases, 'normalization' factors may also be
considered in order to achieve uniformity among
different subjects. That is because some subjects may be
'highly scoring' compared other subjects.
2. Steps may be taken to eliminate certain possible
'outliers' from the students' evaluation results of the
teacher. 6,7LEARNING PROCESS
Traditionally, the learning objectives have been confined
to learning the subject material sufficient enough to get
good marks, complete the program of study successfully,
and to get a good job. In a student-centered program
where TQM principles are applied, different techniques
to improve the learning process are to be applied. Some of
them are given below:1Active Learning : It is the course-related stuff that
students do besides listening to a lecture. They may write,
reflect, discuss, solve problems, assignments, prepare for
tests, etc. They may do it individually or together. As long
as it is something other than watching and listening to the
teaching, it is all active learning.1,2Cooperative Learning : It is a more formal kind of
activity where students work in 'teams' that stay together
for extended periods of time. This involves the following
five criteria:
1. Positive Interdependence: The team members have
to count on one another to do what they are supposed to
do, otherwise everyone loses.
2. Individual Accountability: This means everyone is
held responsible for understanding both their part of the
work and everyone else's parts.
3. Face-to-face Promotive Interaction: In cooperative
learning, although some of the group work may be done
Indian J.Pharm. Educ. Res. 44(4), Oct - Dec, 2010
individually, some must be done interactively, with team
members providing mutual feedback and guidance,
challenging one another, and working towards
consensus.
4. Development of Interpersonal Skills: These are
needed to work effectively in teams, which include the
knowledge of conflict-resolution, communication,
leadership, time management, and so forth.
5. Regular Self-assessment of Group Functioning:
Periodically, teams have to stand back from what they are
doing and ask themselves, 'Well, what are we doing as a
team? Let us list them. What could we be doing better?
What are we going to do differently next time?'
The extent to which a group work has all these five
elements in place, is the extent to which it qualifies as
'cooperative learning'. In a single phrase, cooperative
learning develops the team-spirit of an individual.
Inductive Teaching and Learning: It is the technique in
which students are first presented with challenges
(questions or problems) and learn the course material in
the context of addressing the challenges. Inductive
methods include inquiry-based learning, case-based
instruction, problem-based learning, project-based
learning, discovery learning, and just-in-time teaching.
The best possible learning experience can be offered to
the students not only through participation in lectures,
seminars, tutorials and other formal teaching
arrangements, but also by using library and computer
facilities to maximum advantage by implementing active
and cooperative learning.
Most of the world's great achievements are the successes
of teams and team spirit. Unfortunately, sufficient
emphasis has not been given to the development of team
spirit. Most often, students are tested in these aspects
without even giving formal training. For example, a
student faces a group discussion as part of the
examination procedure required for getting a job. Most of
the times, the students are absolutely not trained in the
basic formalities that must be observed in these group
discussions. The net result is that some one who has been
acquainted with these formalities would get the job and
not the one who is best equipped to do the technical work
concerning the appointment. Hence, as a part of the
process to apply TQM principles, the above mentioned
learning techniques must be applied to prepare the
388

students for team work, which in turn would give the
individual many folds of productivity along with the
qualities such as self-esteem, joy of learning and joy of
working.
WHERE ARE WE IN ALL THIS?
In developed countries, the concept of quality
management entered education system only very
recently, that is, during 1980s. Almost at the same time,
UGC, an Indian statutory body for higher education,
started efforts about improvement of quality of higher
education in the country. After inception of AICTE,
efforts began to improve the technical higher education in
the country. Since then, many efforts have been made by
these two bodies, and some of them proved to be fruitful,
whereas, a lot of areas still need improvement. Recently,
Knowledge Commission has suggested many measures
for the improvement of quality of education.
Another important development that has taken place in
the education system is introduction of accreditation
process. UGC-NAAC and AICTE-NBA are the bodies
that accredit institutions based on their academic quality.
Accreditation process helps in improving the basic
structure of education, introduce the suggested policy
measures in practice and motivate the teachers as well as
educational planners to install the right level of
educational excellence. But, in reality, the situation of
higher and professional education in India is still grim.
The overall improvement in the educational quality has
remained a dream yet, and the education institutions of
the country have to transform this dream into reality.
WHERE DO WE GO? HOW BEST TO GO ABOUT?
TQM_P should not get confined to just a few traditional
methods of teaching and learning, but should involve all
the influencing factors. Data analyses software can be
utilized in pedagogy, for the analysis of the influence of
various external, internal and dynamically changing
factors, on the quality of the teaching and learning
process.
Traditional methods of quality assessment are designed
for the accreditation of the overall teaching process of a
program, which do not cover all components in a
systematic way. TQM_P should involve quality
assessment of all the important and involved
components. Some of them include evaluation of the
teacher, evaluation of the teaching process, teaching
facilities, what is being taught (syllabus, curriculum, etc.)
and quality of the end product (e.g, job-worthiness). Each
of these parameters is complex and has its own
influencing factors. The evaluation should be
accomplished at affordable and minimized cost, should
be dependable and acceptable to all.
Teacher Accreditation: A New Concept towards
TQM_P
The authors are of the opinion that Accreditation of
Teacher is a very important component and should be
introduced in TQM_P. Among the different
accreditations such as accreditation of an institution, a
program of study, teacher, etc., the most dependable and
robust method is the accreditation of teacher. That is
because, a good institution may turn bad if badly
managed; a good program of study may become obsolete
if not updated in pace with changing academics and
industry. However, the probability of a consistently good
teacher turning into a bad teacher is much less probable.
In this context, it is important to induct “accreditation of
teachers” program by the technical education ministry
and concerned governing bodies. In the next paragraphs,
the authors propose a skeleton of one such scheme.
How should one go on evaluating a teacher? The common
methods include peer-reviews and student-evaluations.
The conditions under which these reviews and
evaluations are done, and hence their effectiveness are
indeed somewhat disputable. For example, this kind of
evaluation strategy has given rise to teachers giving more
marks to students just in order to receive back good
ratings. Hence, the methods used for teacher
accreditation should be accurate, easy and cost-effective,
easy to standardize, easy to improve and should be
enjoyed by all the participants. In a country like India,
standard classrooms may first be conceived. This can, for
example, be accomplished in the following way. In case
of technical and pharmacy education, there are perhaps
over 5000 colleges in India, including top-level
institutions like IISc, IITs, NITs, NIPERs, and high
quality private institutions like Birla Institute of
Technology and Science (BITS), Manipal University and
Dhirubhai Ambani Institute of Information and
Communication Technology (DA-IICT). All these
institutions may be divided, say, into 10 levels of merit.
The factors for merit-evaluation can be the percentage of
Indian J.Pharm. Educ. Res. 44(4), Oct - Dec, 2010
389

Indian J.Pharm. Educ. Res. 44(4), Oct-Dec, 2010
students obtaining reasonably good jobs or going for
higher education at high quality institutions, after
completion of their undergraduate course. The factors for
merit-evaluation need not be static; can be dynamically
upgraded utilizing proper feedback. In order to evaluate a
given teacher, one classroom from each level should be
chosen by the random number generator. The teacher
under evaluation would go to each of these 10 classrooms
and teach the students for a substantial time (say 2 or 3
sessions of lecturing, each for an hour) and gets evaluated
by those students. The results (in the form of peer-reviews
and these student-evaluations) obtained by this teacher
would demonstrate his technical skills as well as the
presentation skills, not just one level but at all levels of
standards. These results are obviously 'unbiased' since
the students and peer-reviewers are previously not
connected with the teacher being evaluated. The result is
essentially a vector quantity. If the evaluations obtained
by the teacher are not good enough, one or two more
chances (with different random selections of the
classrooms) may be given, preceded by some special
training if needed. Only upon failing all the evaluations,
the concerned teacher may be asked to look for another
profession. Those who do exceptionally may become part
of a standard pool of Exceptionally Good Teachers of the
Nation.
The results of teacher accreditation would be very useful
for the institutes during recruitment. The rating of an
institution largely depends on the quality levels of the
teachers – this fact must get registered deeply in the
minds of the governing bodies.
CONCLUSIONS
TQM_P systematizes the teaching-learning process in a
dynamic manner. In order to apply TQM, the goals have
to be defined clearly, responsibilities are to be identified
at all levels and all these must be updated dynamically
using the feedback information and according to the
changing conditions and scenarios. Emphasis is needed
towards a student-centered teaching-learning process,
which has repeatedly been shown to be superior to the
traditional teacher-centered approach. A new concept of
teacher-accreditation, suggested by the authors, may also
be given emphasis, which might be more important over
many other accreditations. If all these principles are
applied, education scenario in India would change
dramatically within a short span of time. Hence, it is
strongly recommended to consider these ideas.
REFERENCES
1. Felder RM, Brent R. How to improve teaching
quality?. Quality Management Journal. 1999; 6(2):
9-21.
2. Deming WE. The new economics. 2nd ed.
Cambridge: MIT Center for Advanced Engineering
Studies; 1997.
3. Shabaraya RA, Kulkarni GT, Gowthamarajan K.
Effective Teaching Through Action Research.
Proceedings of the 7th APTI Convention; 2002 Sep
20-22; Panaji, India. Bangalore; APTI; 2002.
4. Kaur K, Singh S, Kaur M. Evaluation of teachers by
students. University News. 2001; 39(15): 5-8.
5. Mathew G. Teachers ’ attitude towards evaluation of
teachers by students. University News. 2001;
39(16): 1-9.
6. Fedler RM, Brent R. Student ratings of teaching –
myths, facts, and good practices. Chemical
Engineering Education. 2008; 42(1): 33-4.
7. Prince MJ, Felder RM, Brent R. Does faculty
research improve undergraduate teaching? an
analysis of existing and potential synergies. Journal
of Engineering Education. 2007; 96(4): 283-94.
390