Global solar radiation in Northeastern Saudi Arabia
12
\ PERGAMON Renewable Energy 06 "0888# 350Ð361 9859Ð0370:88:, ! see front matter Þ 0888 Elsevier Science Ltd[ All rights reserved PII]S9859Ð0370"87#99658Ð0 Global solar radiation in Northeastern Saudi Arabia Ahmet Aksakal\ Sha_qur Rehman The Research Institute\ Kin` Fahd University of Petroleum and Minerals\ Dhahran 20150\ Saudi Arabia Received 08 June 0887^ accepted 12 July 0887 Abstract This paper presents the actual global solar radiation on a horizontal surface along with the prevailing meteorological conditions encountered during the measurement period from 0 JanuaryÐ20 December\ for one complete year\ in the Arabian Gulf Coast near the city of Dhahran[ High resolution\ real time solar radiation and meteorological data were collected\ and processed[ Hourly\ daily\ and monthly statistics of solar radiation was made from the one! minute averaged recorded values[ The highest measured daily\ and monthly mean solar radi! ation were found to be 240 and 217 W:m -1 \ respectively[ The highest one!minute averaged solar radiation values up to 0072 W:m -1 were observed in the summer season\ from MayÐ September[ The highest hourly solar radiation value was recorded as 0942 W:m -1 in the middle of June[ Beside the global solar radiation measurements\ the main observed meteorological parameters were temperature\ pressure\ wind speed\ precipitation\ and relative humidity[ On the other hand\ the estimation of daily and monthly mean global solar radiation was performed based upon two empirical formulas which relate the solar radiation to the sunshine duration\ relative humidity\ maximum temperature\ the latitude of the monitoring location\ sunset hour and declination angles[ The agreement between the measured and estimated solar radiation values was found to be satisfactory[ Nevertheless\ the empirical formula under!estimates the solar radiation values during summer\ and over!estimates during winter[ Þ 0888 Elsevier Science Ltd[ All rights reserved[ 0[ Introduction The region of the Earth between latitudes of 39>N and 39>S is generally referred to as the solar belt\ where an abundant supply of solar radiation falls[ Recent studies Corresponding author
Transcript of Global solar radiation in Northeastern Saudi Arabia
\PERGAMON Renewable Energy 06 "0888# 350Ð361
9859Ð0370:88:, ! see front matter Þ 0888 Elsevier Science Ltd[ All rights reservedPII] S 9 8 5 9 Ð 0 3 7 0 " 8 7 # 9 9 6 5 8 Ð 0
Global solar radiation in Northeastern SaudiArabia
Ahmet Aksakal�\ Sha_qur RehmanThe Research Institute\ Kin` Fahd University of Petroleum and Minerals\ Dhahran 20150\ Saudi Arabia
Received 08 June 0887^ accepted 12 July 0887
Abstract
This paper presents the actual global solar radiation on a horizontal surface along withthe prevailing meteorological conditions encountered during the measurement period from 0JanuaryÐ20 December\ for one complete year\ in the Arabian Gulf Coast near the city ofDhahran[ High resolution\ real time solar radiation and meteorological data were collected\and processed[ Hourly\ daily\ and monthly statistics of solar radiation was made from the one!minute averaged recorded values[ The highest measured daily\ and monthly mean solar radi!ation were found to be 240 and 217 W:m−1\ respectively[ The highest one!minute averagedsolar radiation values up to 0072 W:m−1 were observed in the summer season\ from MayÐSeptember[ The highest hourly solar radiation value was recorded as 0942 W:m−1 in the middleof June[ Beside the global solar radiation measurements\ the main observed meteorologicalparameters were temperature\ pressure\ wind speed\ precipitation\ and relative humidity[ Onthe other hand\ the estimation of daily and monthly mean global solar radiation was performedbased upon two empirical formulas which relate the solar radiation to the sunshine duration\relative humidity\ maximum temperature\ the latitude of the monitoring location\ sunset hourand declination angles[ The agreement between the measured and estimated solar radiationvalues was found to be satisfactory[ Nevertheless\ the empirical formula under!estimates thesolar radiation values during summer\ and over!estimates during winter[ Þ 0888 ElsevierScience Ltd[ All rights reserved[
0[ Introduction
The region of the Earth between latitudes of 39>N and 39>S is generally referred toas the solar belt\ where an abundant supply of solar radiation falls[ Recent studies
� Corresponding author
A[ Aksakal\ S[ Rehman : Renewable Ener`y 06 "0888# 350Ð361351
indicated that the daylight at 14>N is about 3338 h\ and 69) of this is the sunshinetime ð0Ł[ The location of Saudi Arabia is almost centered at the latitude of about14>N\ having about 2003 total sunshine hours in a year[ The main objective of thispaper is to measure the meteorological parameters including actual global solarradiation\ which reach the Earth surface over Northeastern Saudi Arabia[ In thispaper\ the global solar radiation is also estimated from an empirical formula usingtwo di}erent formulas to calculate the available solar energy outside the atmosphere"Ho#[ The empirical formula includes the value of sunshine duration "S:Z#\ relativehumidity "RH#\ maximum temperature "T#\ and the latitude of the location[ In thepast\ several similar empirical formulas have been tested in order to estimate the solarradiation around the world\ ð1Ð5Ł[ Several studies were also conducted to measureand estimate the solar radiation in Saudi Arabia ð6Ł[ In the present study\ the solarradiation measurements were carried out based on the real time high!resolutionmeasurements\ "i[e[\ from the one!minute averaged measurements for one completeyear#\ in Saudi Arabia[
1[ Field experiment
The study area is located on the shoreline of the Arabian Gulf in NortheasternSaudi Arabia\ near Dhahran "15>N^ 49>E#[ This study area in which the data wascollected is representative of the Northeastern part of Saudi Arabia[ The area isconsidered to be semi!desert region due to its extremely low precipitation rate "79mm:year#\ high temperatures "up to 49>C#\ and frequent severe wind!storms "up to35 m:s#[ The region is under the in~uence of an anticyclonic ~ow in January\ butcyclonic ~ow in July ð7Ł[ Occasional heavy sand storms during late spring and summertime cause drift in sand dunes and a}ect the vegetation along the west coast of theArabian Gulf[
The surface air temperature\ global solar radiation\ and relative humidity valueswere measured at 1!m level[ Nevertheless\ the surface pressure measurements weremade at the ground level[ The meteorological parameters were collected every minuteusing a data acquisition system[ The meteorological sensors were checked on aperiodic basis\ and quality control strategies were implemented to ascertain the qualityof the collected data[ The data from the meteorological sensors were acquired at oneminute intervals[ In this paper\ daily surface meteorological data\ rather than hourlyones\ are presented[
2[ Data analysis technique
Meteorological data including global solar radiation were processed using standardstatistical procedures[ The mean\ maximum\ and minimum hourly values were pro!cessed from the raw data stored for every minute[ From the hourly data set\ daily andmonthly statistics were made in order to obtain observed temperature\ humidity\ andsolar radiation data[ On the other hand\ the following empirical formula relating
A[ Aksakal\ S[ Rehman : Renewable Ener`y 06 "0888# 350Ð361 352
solar radiation "H# to the factors of the hours of bright sunshine\ relative humidity"RH#\ air temperature "T# etc[\ is used to estimate the daily and monthly solarradiation in Watt per square meter[ The Eqns 0Ð2\ and 4Ð6 were obtained from ð8Ł\and Eqn 3 was taken from ð09Ł[
H�H9 exp "x# "0#
x�F 0SZ
−RH
9[301−
0T1 "1#
H9 �H90 � "0[64−9[347F# 019Z
0¦9[0F¦C cosF1 "2#
H9 �H91 �13p
Gsc 00¦9[922259n254 1 0cosF cos d sinv¦
1p
259v sinF sin d1 "3#
Z�104
cos−0"− tanF tan d# "4#
v� cos−0"− tanF tan d# "5#
d� 12[34 sin $259"173¦n#
254 % "6#
where^ S is the number of actual daily sunshine hours\ Z is the maximum possibledaylight hours\ RH is the daily mean relative humidity\ T is the daily maximumtemperature in degrees Celsius\ C is the monthly averaged relative humidity factor"Table 0#\ and F is the latitude of the monitoring station[ The humidity factors in thisstudy were taken from ð8Ł[ Moreover\ Gsc is the solar constant\ v is the sunset hourangle\ d is the declination angle\ and n is the day of the year[ In this study\ twodi}erent H9 values as H90 "Eqn 2#\ and H91 "Eqn 3#\ are used in Eqn 0 to estimate theglobal solar radiation[
Table 0The monthly sunshine hours\ humidity factor\ mean relative humidity\ and maximum temperature valuesused in this study
Jan[ Feb[ Mar[ Apr[ May Jun[ Jul[ Aug[ Sep[ Oct[ Nov[ Dec[
S:Z 9[75 9[71 9[68 9[70 9[79 9[75 9[73 9[75 9[78 9[78 9[77 9[76C 9[44 9[54 9[64 9[74 9[83 0[91 0[94 0[93 9[89 9[61 9[51 9[89RH 70[9 72[2 68[2 62[7 57[8 57[2 69[2 58[8 58[3 67[2 66[3 76[5T 16[9 20[9 22[3 25[9 34[3 33[2 31[4 31[7 33[9 28[7 24[9 18[9
A[ Aksakal\ S[ Rehman : Renewable Ener`y 06 "0888# 350Ð361353
3[ Results and discussion
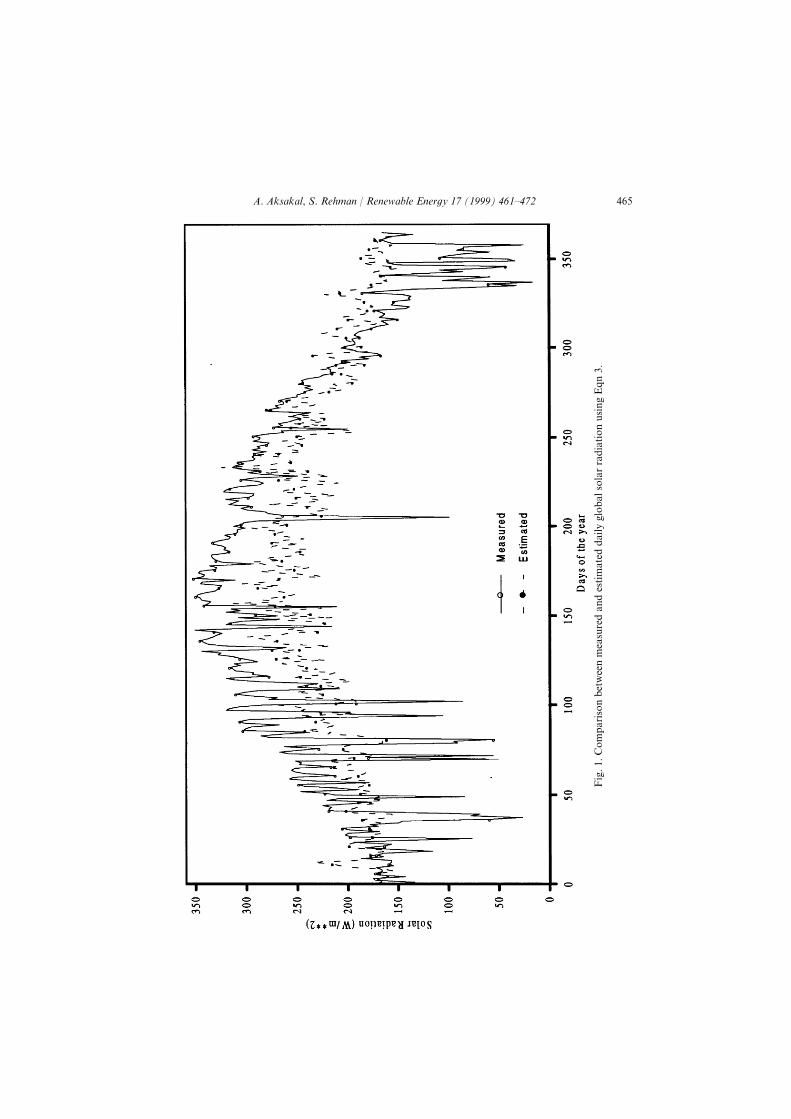
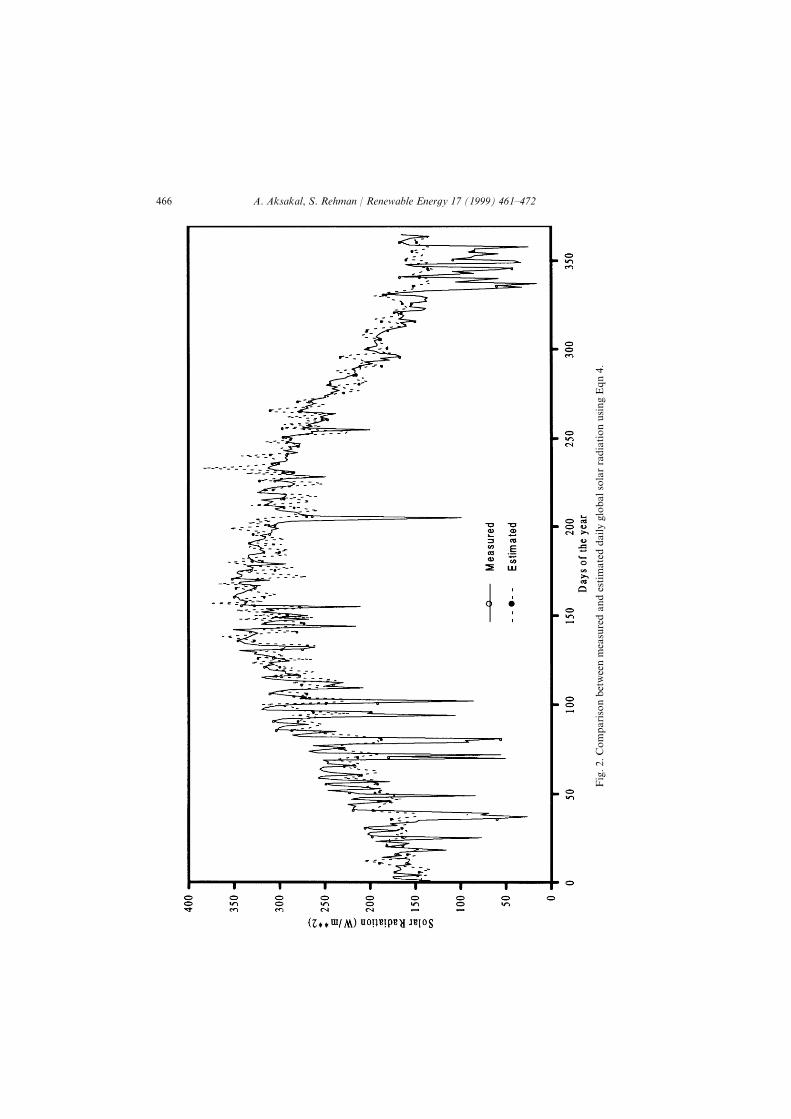
Daily mean and maximum temperatures and solar radiation data indicate that thevalues are higher in the summer months and lower in the winter months[ Figures 0and 1 show the observed and estimated daily mean global solar radiation using Eqn0 with Eqns 2 and 3\ respectively[ The highest one!minute averaged value of 0072W:m−1\ the highest hourly averaged value of 0942 W:m−1\ and the highest daily meanof 240 W:m−1\ were recorded in this region\ respectively[ The highest daily mean of249 W:m−1 was recorded on 11 May 0884[ Thus\ daily mean solar radiation valueswere high during the period of 14[4[Ð14[5[0884[ Maximum temperatures were observedapproximately 0 h after the maximum solar radiation[ In this _gure\ it is evident thatthere are downward excursions in March\ April\ July\ and December\ which may berelated to the sandstorms or rain events[ This type of weather events is strongly relatedto the changes in the surface air temperature and pressure _elds[ The surface pressurewas high "as high as 0939 millibar# in winter and low "as low as 0999 millibar# insummer[ Furthermore\ the di}erence between the daily maximum and daily meansurface pressure values was about 0 millibar[
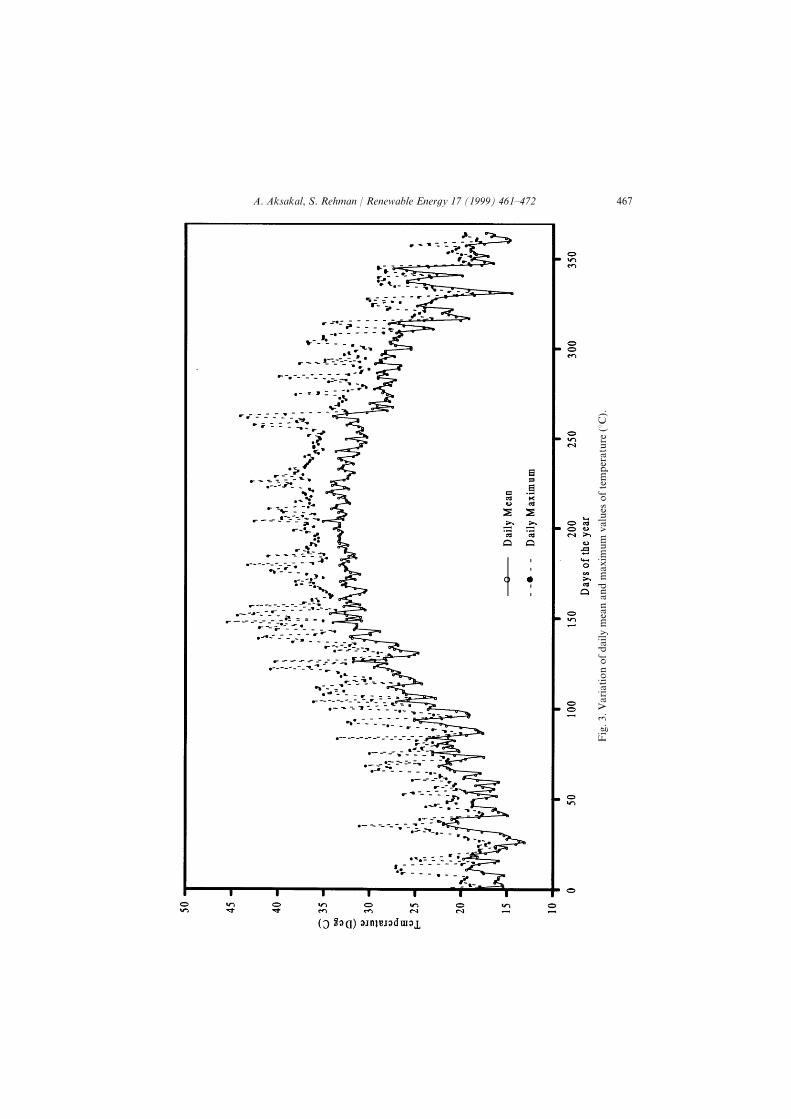
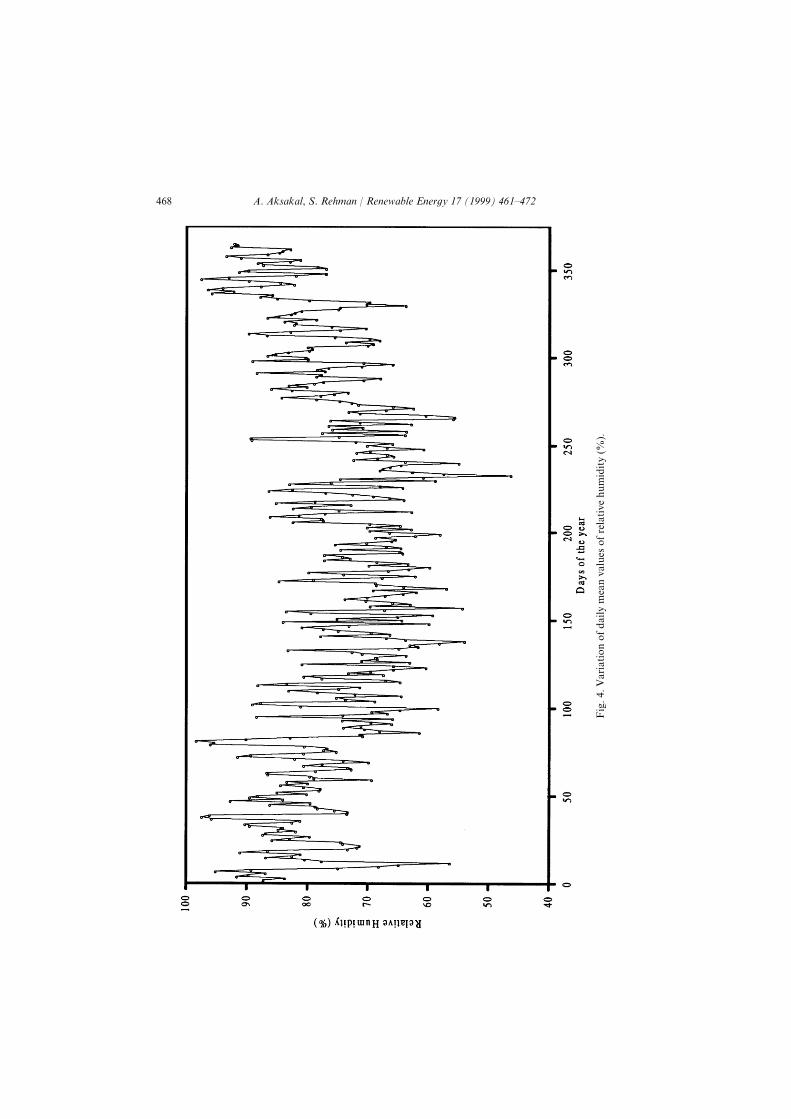
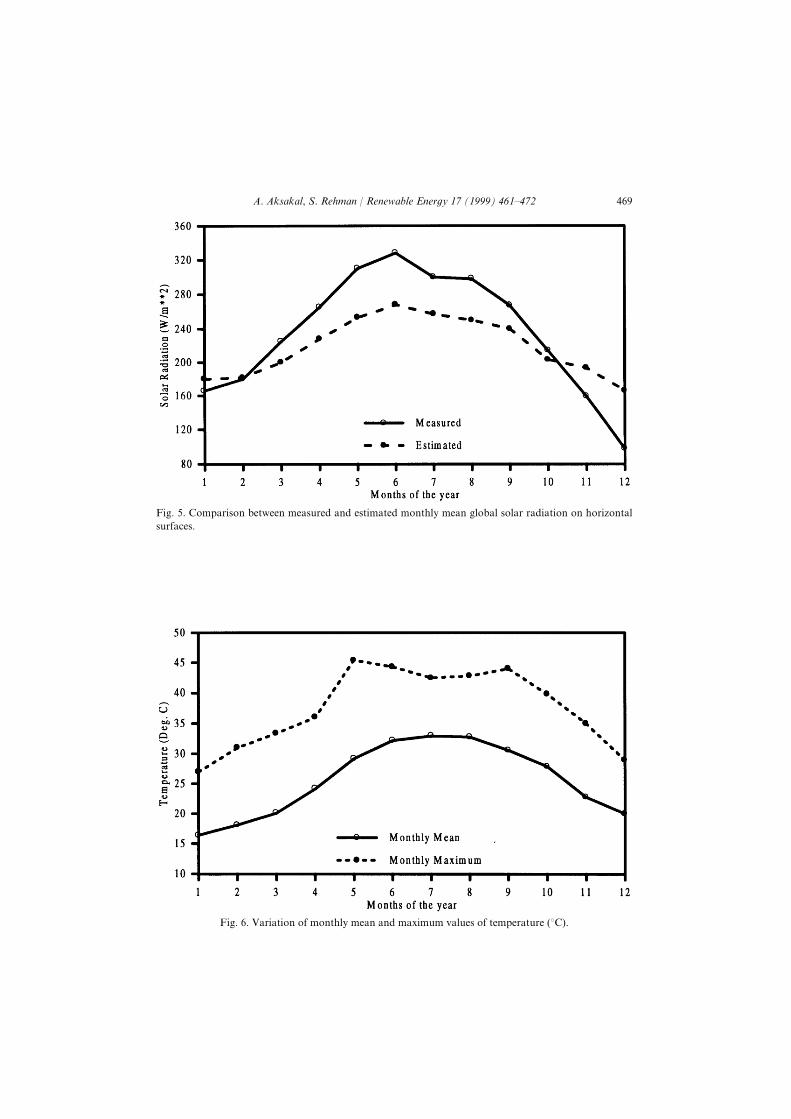
When the solar radiation reached to almost 0099 W:m−1\ the surface air temperaturebecame 34[9>C[ The highest daily mean and maximum temperatures were 24[9 and34[3>C\ Fig[ 2[ The temperature and solar radiation distribution pattern is similar[The daily mean relative humidity ")# is shown in Fig[ 3[ Low relative humidity wasobserved in summer\ and high humidity was evident during winter[ Furthermore\ themonthly measured and estimated solar radiation\ and monthly air temperatures aredepicted in Figs 4 and 5\ respectively[ Equation 0 with Eqn 2 resulted in an over!estimation of solar radiation during winter\ and under!estimation during summer[However\ Eqn 0 with Eqn 3 demonstrated better agreement most of the time\ exceptwhen there was a signi_cant weather event[
The estimated monthly global solar radiation values using the empirical formulawith Eqn 2 are shown in Fig[ 4[ As shown in this _gure\ the estimated values are ingood agreement with the measured ones[ The monthly global solar radiation andtemperature reach their peak values during summer "MayÐJuly# and low values duringwinter "NovemberÐJanuary#[
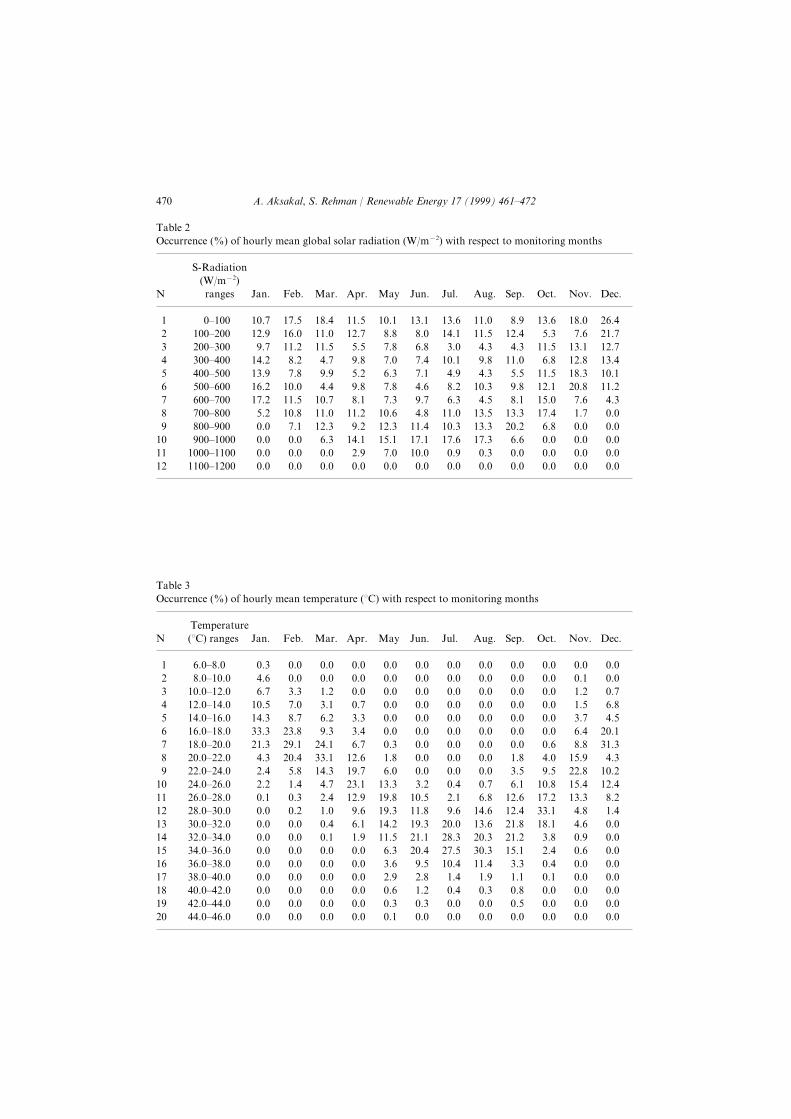
The occurrence of hourly mean global solar radiation and temperature are shownin Tables 1 and 2\ respectively[ The global solar radiation varied from 9Ð0199 W:m−1
throughout the monitoring period[ Twelve equally distributed intervals for the hourlymean solar radiation occurrence are chosen in Table 1[ It is clear from this table thatthe highest three occurrences of 899 W:m−1 and above were 16[0\ 11[0\ and 07[4) inthe months of June\ May\ and July\ respectively[ On the other hand\ the occurrenceof low solar radiation was observed in the months of December and November\respectively[
Table 2 presents the occurrence of hourly mean temperature at the equally dis!tributed 19 intervals[ It is clear from this table that the occurrence of higher tem!perature during the summer months is extremely frequent[ In particular\ the monthof July stands for the highest temperature occurrence and the month of Januaryindicates the lowest temperature occurrence[ The chance of having temperature 17>C
A[ Aksakal\ S[ Rehman : Renewable Ener`y 06 "0888# 350Ð361 354
Fig
[0[C
ompa
riso
nbe
twee
nm
easu
red
and
estim
ated
daily
glob
also
larra
diat
ion
usin
gE
qn2[
A[ Aksakal\ S[ Rehman : Renewable Ener`y 06 "0888# 350Ð361355
Fig
[1[C
ompa
riso
nbe
twee
nm
easu
red
and
estim
ated
daily
glob
also
larra
diat
ion
usin
gE
qn3[
A[ Aksakal\ S[ Rehman : Renewable Ener`y 06 "0888# 350Ð361 356
Fig
[2[V
aria
tion
ofda
ilym
ean
and
max
imum
valu
esof
tem
pera
ture
">C
#[
A[ Aksakal\ S[ Rehman : Renewable Ener`y 06 "0888# 350Ð361357
Fig
[3[V
aria
tion
ofda
ilym
ean
valu
esof
rela
tive
hum
idity
")#[
A[ Aksakal\ S[ Rehman : Renewable Ener`y 06 "0888# 350Ð361 358
Fig[ 4[ Comparison between measured and estimated monthly mean global solar radiation on horizontalsurfaces[
Fig[ 5[ Variation of monthly mean and maximum values of temperature ">C#[
A[ Aksakal\ S[ Rehman : Renewable Ener`y 06 "0888# 350Ð361369
Table 1Occurrence ")# of hourly mean global solar radiation "W:m−1# with respect to monitoring months
S!Radiation"W:m−1#
N ranges Jan[ Feb[ Mar[ Apr[ May Jun[ Jul[ Aug[ Sep[ Oct[ Nov[ Dec[
0 9Ð099 09[6 06[4 07[3 00[4 09[0 02[0 02[5 00[9 7[8 02[5 07[9 15[31 099Ð199 01[8 05[9 00[9 01[6 7[7 7[9 03[0 00[4 01[3 4[2 6[5 10[62 199Ð299 8[6 00[1 00[4 4[4 6[7 5[7 2[9 3[2 3[2 00[4 02[0 01[63 299Ð399 03[1 7[1 3[6 8[7 6[9 6[3 09[0 8[7 00[9 5[7 01[7 02[34 399Ð499 02[8 6[7 8[8 4[1 5[2 6[0 3[8 3[2 4[4 00[4 07[2 09[05 499Ð599 05[1 09[9 3[3 8[7 6[7 3[5 7[1 09[2 8[7 01[0 19[7 00[16 599Ð699 06[1 00[4 09[6 7[0 6[2 8[6 5[2 3[4 7[0 04[9 6[5 3[27 699Ð799 4[1 09[7 00[9 00[1 09[5 3[7 00[9 02[4 02[2 06[3 0[6 9[98 799Ð899 9[9 6[0 01[2 8[1 01[2 00[3 09[2 02[2 19[1 5[7 9[9 9[9
09 899Ð0999 9[9 9[9 5[2 03[0 04[0 06[0 06[5 06[2 5[5 9[9 9[9 9[900 0999Ð0099 9[9 9[9 9[9 1[8 6[9 09[9 9[8 9[2 9[9 9[9 9[9 9[901 0099Ð0199 9[9 9[9 9[9 9[9 9[9 9[9 9[9 9[9 9[9 9[9 9[9 9[9
Table 2Occurrence ")# of hourly mean temperature ">C# with respect to monitoring months
TemperatureN ">C# ranges Jan[ Feb[ Mar[ Apr[ May Jun[ Jul[ Aug[ Sep[ Oct[ Nov[ Dec[
0 5[9Ð7[9 9[2 9[9 9[9 9[9 9[9 9[9 9[9 9[9 9[9 9[9 9[9 9[91 7[9Ð09[9 3[5 9[9 9[9 9[9 9[9 9[9 9[9 9[9 9[9 9[9 9[0 9[92 09[9Ð01[9 5[6 2[2 0[1 9[9 9[9 9[9 9[9 9[9 9[9 9[9 0[1 9[63 01[9Ð03[9 09[4 6[9 2[0 9[6 9[9 9[9 9[9 9[9 9[9 9[9 0[4 5[74 03[9Ð05[9 03[2 7[6 5[1 2[2 9[9 9[9 9[9 9[9 9[9 9[9 2[6 3[45 05[9Ð07[9 22[2 12[7 8[2 2[3 9[9 9[9 9[9 9[9 9[9 9[9 5[3 19[06 07[9Ð19[9 10[2 18[0 13[0 5[6 9[2 9[9 9[9 9[9 9[9 9[5 7[7 20[27 19[9Ð11[9 3[2 19[3 22[0 01[5 0[7 9[9 9[9 9[9 0[7 3[9 04[8 3[28 11[9Ð13[9 1[3 4[7 03[2 08[6 5[9 9[9 9[9 9[9 2[4 8[4 11[7 09[1
09 13[9Ð15[9 1[1 0[3 3[6 12[0 02[2 2[1 9[3 9[6 5[0 09[7 04[3 01[300 15[9Ð17[9 9[0 9[2 1[3 01[8 08[7 09[4 1[0 5[7 01[5 06[1 02[2 7[101 17[9Ð29[9 9[9 9[1 0[9 8[5 08[2 00[7 8[5 03[5 01[3 22[0 3[7 0[302 29[9Ð21[9 9[9 9[9 9[3 5[0 03[1 08[2 19[9 02[5 10[7 07[0 3[5 9[903 21[9Ð23[9 9[9 9[9 9[0 0[8 00[4 10[0 17[2 19[2 10[1 2[7 9[8 9[904 23[9Ð25[9 9[9 9[9 9[9 9[9 5[2 19[3 16[4 29[2 04[0 1[3 9[5 9[905 25[9Ð27[9 9[9 9[9 9[9 9[9 2[5 8[4 09[3 00[3 2[2 9[3 9[9 9[906 27[9Ð39[9 9[9 9[9 9[9 9[9 1[8 1[7 0[3 0[8 0[0 9[0 9[9 9[907 39[9Ð31[9 9[9 9[9 9[9 9[9 9[5 0[1 9[3 9[2 9[7 9[9 9[9 9[908 31[9Ð33[9 9[9 9[9 9[9 9[9 9[2 9[2 9[9 9[9 9[4 9[9 9[9 9[919 33[9Ð35[9 9[9 9[9 9[9 9[9 9[0 9[9 9[9 9[9 9[9 9[9 9[9 9[9
A[ Aksakal\ S[ Rehman : Renewable Ener`y 06 "0888# 350Ð361 360
and above in the month of January is zero\ and the chance of having the temperaturebelow 15>C in the months of July and August is less than 0)[ It has been also noticedfrom Tables 1 and 2 that the maximum global solar radiation was observed in themonth of June\ and the maximum temperature was observed in the month of July\one month later than that of maximum global solar radiation occurrence[
4[ Conclusions
A meteorological study was carried out in order to measure the surface meteoro!logical parameters including global solar radiation on a horizontal surface in North!eastern Saudi Arabia for a period of one complete year[ The meteorological data werecollected based upon one!minute averaged values[ The collected data were thenprocessed according to standard statistical procedures[ This paper presents only solarradiation and meteorological parameters related to the solar radiation values[ Theobservations indicated that the daily mean highest temperature and solar radiationwere observed during the months of MayÐJuly[ One!minute averaged global solarradiation values were recorded in the range of 9Ð0199 W:m−1[ The two highest one!minute averaged radiation values were recorded as 0072 W:m−1\ and 0049 W:m−1 on15 July and 29 May\ respectively[ The highest hourly solar radiation was measuredon 04 June\ between the local hours of 00]99 and 01]99[ Furthermore\ the highestdaily averaged values of 240 W:m−1 was measured a few times during the summertime[
Global solar radiation values were also estimated using two empirical formulasexpressed in the exponential form[ The _rst formula relating meteorological par!ameters to the H9\ the amount of solar energy outside the earth|s atmosphere\ gavean under!estimation during summer and over!estimation in winter[ On the otherhand\ the second formula using standard de_nition of H9 resulted in a fair and betteragreement with the measured values[ Results from both formulas su}ered drasticallywhen there were important weather events passing through[ It is strongly believedthat somehow the cloud coverage and precipitation amount should be considered andincorporated in the empirical formula in order to minimize the di}erences betweenmeasured values and estimated solar radiation[
Acknowledgements
The authors wish to acknowledge the support of the Research Institute of KingFahd University of Petroleum and Minerals\ Dhahran\ Saudi Arabia[
References
ð0Ł Navarra JG[ Atmosphere\ weather and climate[ W[B[ Saunders Company\ 0868[ p[ 2Ð18[ð1Ł Swartman RK\ Ogundale O[ Solar radiation estimates from common parameters[ Solar Energy
0856^00]069Ð061[
A[ Aksakal\ S[ Rehman : Renewable Ener`y 06 "0888# 350Ð361361
ð2Ł Reddy SJ[ An empirical method for the estimation of total solar radiation[ Solar Energy 0860^02]178Ð189[
ð3Ł Barra AO[ Estimation of the total solar radiation from meteorological data in the Italian climate area[Solar Energy 0872^20]316Ð317[
ð4Ł Soler A[ The dependence on solar elevation of the correlation between monthly average hourly di}useand global radiation[ Solar Energy 0877^30]224Ð239[
ð5Ł Rehman S\ Halawani TO[ Global solar radiation estimation[ Renewable Energy 0886^01]258Ð274[ð6Ł Zuhairy A\ Sayigh AM[ Simulation and modeling of solar radiation in Saudi Arabia[ Renewable
Energy 0884^5]096Ð007[ð7Ł Rielhl H[ Climate and weather in the tropics[ Academic Press Inc[\ 0868\ p[ 02[ð8Ł Onyango FN[ On the estimation of global solar insolation[ Solar Energy 0872^20]58Ð60[
ð09Ł Du.e JA\ Beckman WA[ Solar Engineering of Thermal Processes[ New York] Wiley Interscience\0879[