cumulative fatigue damage of plain concrete in compression
276
CUMULATIVE FATIGUE DAMAGE OF PLAIN CONCRETE IN COMPRESSION A Thesis presented for the Degree of Doctor of Philosophy by Pibul Jinawath, B.Eng., M.Sc., A.M.I.E.(Thailand) 9*1 R<?5 & u K o tJ lamp :, L PRAO ftoAt t G, h f I I:>M> 5 K OK 1O THAtUAfJp. Tci. The Department of Civil Engineering The University of Leeds December, 197^
-
Upload
khangminh22 -
Category
Documents
-
view
1 -
download
0
Transcript of cumulative fatigue damage of plain concrete in compression

CUMULATIVE FATIGUE DAMAGE
OF
PLAIN CONCRETE IN COMPRESSION
A Thesis presented for the
Degree of Doctor of Philosophy
by
Pibul Jinawath, B.Eng., M.Sc., A.M.I.E.(Thailand)
9*1 R<?5 & u KotJ l a m p :,
L PRAO ftoAtt
G, h f I I:>M> 5 K OK 1 O
THAtUAfJp. Tci.
The Department of Civil Engineering
The University of Leeds December, 197^

ORIGINAL COPY IS TIGHTLY BOUND ANDTEXT IS CLOSE TO THE
EDGE OF THE PAGE
ABSTRACT
The thesis reports an investigation carried out on more than two
hundred and fifty prismatic specimens to study the cumulative fatigue
damage of plain concrete subjected to constant and variable amplitude cyclic
compressive stresses.
Pulse velocity measurements and strain charecteristics were used to
indicate the extent of progressive fatigue damage. At a given percentage of
the life the amount of damage of a specimen is dependent on the stress level.
Prismatic specimens were also subjected to repeated compressive
stresses according to various load programmes in which the maximum load was
varied between two limits the minimum load being kept constant throughout.
The results were interpreted according to the pulse velocity measurements,
the physical appearance of fractered specimens together with the phenomenon
of progressive fracture itself.
Palmgren-Miner hypothesis was found to give conservative or unsafe
predictions of the fatigue life depending on the load programme. Factors
affecting the accuracy of the hypothesis are discussed and an empirical
design chart is presented.
ACKNOWLEDGEMENTS
The writer wishes to record his gratitude to Dr. E.W. Bennett, M.Sc.,
Ph.D., M.I.C.E., F.I.Struct.E., Reader in Civil Engineering, under whose
supervision the work was carried out, for his valuable advice, continuous
guidance, constructive criticisms and his kindness.
The writer is grateful to Professor A.M.Neville, M.C.,T.D., D.Sc.(Eng.),
Ph.D., M.Sc., C.Eng., F.I.C.E., F.I.Struct.E., F.Am.Soc.C.E., Head of the
Department of Civil Engineering,Leeds University, for providing him the
facilities needed in this investigation.
Thanks are due to Messrs J.S.Higgins, and the technical staff of the
Civil Engineering Department for their help and co-operation during the
experimental work.
The writer is greatly indepted to his parents for their love and
encouragement. He is also indepted to his wife for her part in sharing the
difficulties and her understanding during their university lives. Thanks are
due to his two friends Messrs S. Sirirangkamanont and S. Siwasaranond for their
assistance in the preparation of the thesis.
The writer also wishes to acknowledge gratefully the British Council
for the financial support provided throughout the period of this work under
the Colombo Plan Scholarship.
ABBREVIATIONS
A.C.I.
A.S.C.E.
A.S.M.E.
a . s .t .m .
A . R.C•
b . r .s .
B. S.
C & C.A.
C. E.B. F.I.P.
h .r .b .
I.C.E.M.C.R.P.C.A.
RILEM
R.R.L.
T .R.R.L.
American Concrete Institute.
American Society of Civil Engineers.
American Society of Mechanical Engineers.
American Society for Testing Materials.
Aeronautical Research Council.
Building Research Station.
British Standard.
Cement and Concrete Association.
European Concrete Committee.
International Prestressing Federation.
Highway Research Board.
Institution of Civil Engineers.
Magazine of Concrete Research.
Portland Cement Association.
The International Union of Testing and Research Laboratories
for Materials and Structures.
Road Research Laboratory.
Transport and Road Research Laboratory

NOMENCLATURE AND SYMBOLS
As far as possible the notations used in this thesis are in conformity
with the recommendations of B.S.3518:1962 and the International Organization
for Standardization and the following definitions apply for the terms used;, ! •
Stress cycle =A stress cycle is the smallest section of the stress time func
tion which is repeated periodically and identically.
Stress level,(S)=Percentage of ultimate static prism s tre n g th .
Maximum stress «Highest algebraic value of stress level in the stress cycle.
level,(S ) maxMinimum stress «Lowest algebraic value of stress level in the stress cycle
level'(Sn.in) 1Range of stress=Algebraic difference between the maximum end minimum stress
levels in one cycle.
«Number of loading cycles
«Fatigue life or number of cycles at failure for a given test
condition.
Cycle ratio, «The ratio of the number of applied loading cycles to■the
(n/ft) number of cycles causing failure at the same constant amplitude
stress level.
Fatigue limit «The limiting value, of the stress level below which a materiali
can presumably endure an infinite number of stress cycles.
level,(S ) ’ rn
N
Fatigue strength«The greatest stress level which can be sustained for a given
or Endurance,$Nnumber of stress cycles without failure.
S -N diagram =A semilog plot of stress level against number of cycles at
failure.
S-N*P diagram «A semilog plot of stress level against number of cycles at
failure for different probabilities of failure,P.
a, b, c, d «Constants for empirical relationships, their specific use are
explained as they occur.
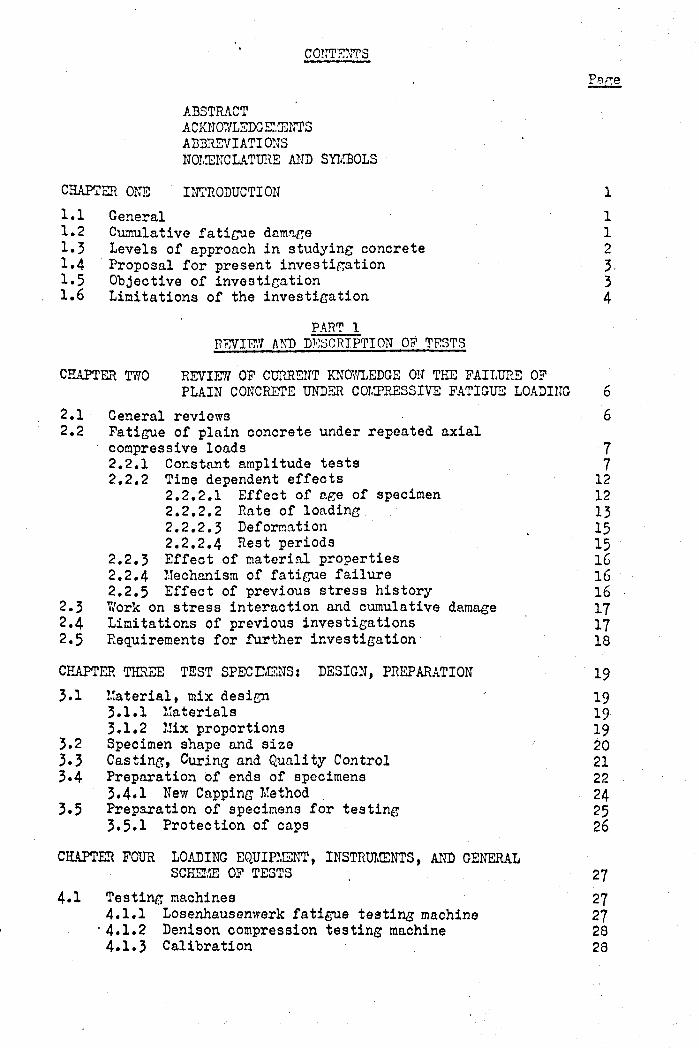
CONTENTSPa ge
ABSTRACT ACKNOWLEDGEMENTS ABBREVIATIONS NOMENCLATURE AND SYMBOLS
CHAPTER ONE INTRODUCTION 11.1 General 11.2 Cumulative fatigue damage 11.3 Levels of approach in studying concrete 21.4 Proposal for present investigation 3-1.5 Objective of investigation 31.6 Limitations of the investigation 4
PART 1REVIE.Y AND D??SCRIPTION 0? TESTS
CHAPTER TWO REVIEW OF CURRENT KNOWLEDGE ON THE FAILURE OFPLAIN CONCRETE UNDER COMPRESSIVE FATIGUE LOADING 6
2.1 General reviews 62.2 Fatigue of plain concrete under repeated axial
compressive loads 72.2.1 Constant amplitude tests 72.2.2 Time dependent effects 12
2.2.2.1 Effect of age of specimen 122.2.2.2 Rate of loading 132.2.2.3 Deformation _ 152.2.2.4 Rest periods ' 15
2.2.3 Effect of material properties 162.2.4 Mechanism of fatigue failure 162.2.5 Effect of previous stress history 16
2.3 Work on stress interaction and cumulative damage 172.4 Limitations of previous investigations 172.5 Requirements for further investigation- 18
CHAPTER THREE TEST SPECIMENS* DESIGN, PREPARATION 193.1 Material, mix design 19
3.1.1 Materials 19.3.1.2 Mix proportions 19
3.2 Specimen shape and size 203.3 Casting, Curing and Quality Control 213*4 Preparation of ends of specimens 22
3.4*1 New Capping Method 243.5 Preparation of specimens for testing 25
3.5.1 Protection of caps 26
CHAPTER FOUR LOADING EQUIPMENT, INSTRUMENTS, AND GENERALSCHEME OF TESTS , 27
4.1 Testing machines 274.1.1 Losenhausenwerk fatigue testing machine 27■ 4.1.2 Denison compression testing machine 284.1.3 Calibration 28
Page
4.2 Selection of strain measuring devices 284.2.1 Method of fixing gauges 294.2.2 Static tests 294.2.3 Dynamic tests 31
4.3 Ultrasonic non-destructive testing equipments 314.3.1 Cawkell Ultrasonic Material Tester 314.3.2 Portable Ultrasonic Non-Destructive Digital
Indicating Tester (PUNDIT) 324.3.3 Experimental techniques 33
4.4 Planning of test programmes 354.5 Fatigue testing methods 36
4.5.1 Constant-amplitude tests 3°4.5*2 Variable-amplitude tests 37
4.6 General Scheme of tests 37
PART 2TESTS UNDER LOADING OF CONSTANT AMPLITUDE
CHAPTER FIVE ANALYSIS OF RESULTS : FATICUE STRENGTH 385.1 Ceneral 395.2 Testing procedures 39
5.2.1 Static tests 385.2.2 Fatigue tests 39
5-3 Necessity for statistical analysis of fatigue test data 405.4 Analysis of test results 40
5.4*1 S-N Diagram 425.4.1.1 Discussion of results 42
5.4.2 S-N-P Diagrams 435.4.2.1 S-N-P diagram from McCall's Model 435.4.2.2 Discussion 44
5.4.3 S-N-P diagram from Modified McCall's Model 455.4.4 S-N-P diagram from the cumulative normal
distribution function 465.5 Comparison of S-N-P diagrams and recommendations 475.6 Conclusions * 40
CHAPTER SIX ANALYSIS OF RESULTS: OTHER EFFECTS 496.1 General 496.2 Test procedure 496.3 Shape of the stress-strain curves 496.4 Hysteresis 516.5 Total strain 526.6 Elastic strain 536.7 Inelastic strain . 5 36.8 Modulus of elasticity 55'6.9 Volumetric strain and Poisson's ratio 556.10 Conclusions 57
CHAPTER SEVEN STUDY OF FATIGUE DAMAGE BY ULTRASONIC PULSEVELOCITY 59
7.1 Introduction 597.2 General reviews 607.3 Testing procedure 61
Pap-e
7.4 Analysis of pulse velocity test results 627.4.1 Static tests 627.4.2 Fatigue tests 63
7.5 Pulse velocity-number of cycles and Pulse velocity-cycleratio relationships 64
7.6 Discussion and conclusions 67
PART 3TFSTS UNDER LOADING OF VARIABLE AMPLITUDE
CHAPTER EIGHT REVIEW OF CURRENT CUMULATIVE FATICUE DAMAGEHYPOTHESES 70
8.1 Introduction 708.2 Stress dependence 718.3 Interaction effects 728.4 General comparison of cumulative damage hypotheses 74
8.4.1 Palmgren-Miner cumulative fatigue damagehypothesis and alliance hypotheses 71+
8.4.2 Stress-dependent and interaction-free hypotheses 758.4.3 Stress-dependent and interaction hypotheses 77
8.5 Conclusions ¿0
CHAPTER NINE TWO STAGE CUMULATIVE DA'tAGE TESTS 829.1 General 829.2 Limitations of Palmgren-Miner hypothesis 829.3 Methods of verification 849*4 Test procedures 86
9.4.1 Selection methods of fatigue specimens 879.4.2 Non-destructive methods of quality control 87
9.5 One step test results 909.6 Analysis and interpretation of results 91
9.6.1 Stress dependence 959*6.2 Stress-interaction effects 100
9.7 Conclusions . 101
CHAPTER TEN MULTIPLE STAGE CUMULATIVE DAMAGE TESTS . 10310.1 Introduction 10310.2 Test procedures 103
10.2.1 Two step tests 10310.2.2 Four step tests 104
10.3 Two step test results iq410.3.1 Analysis of two step test results IO5
10.4 Four step test results IO710.4.1 Analysis of four step test results 108
10.5 Discussion and conclusions IO9CHAPTER ELEVEN DESIGN CONSIDERATIONSj SUMMARY OF CONCLUSIONS
AND SUGGESTIONS FOR FURTHER RESEARCH 11211.1 Design considerations 112
11.1.1 Factors affecting the accuracy of 2 derivedfrom the Palmgren-Miner hypothesis, 112à.Effects of stress dependence and interaction 112 b.Effect of low-level stress cycles 113
11.2 A conceptual damage-cycle ratio relationship 11411.3 Summary of conclusions and suggestions for further research 116
11.3.1 Suggestions for further research 118REFERENCEStables :FIGURES ,
CHAPTER ONE
INTRODUCTION
1.1 General
Most structures are subjected to fluctuating and repetitive loads,
such as those caused by the wind, occupants, mobile equipment, or
moving vehicles (live loads). When a structural member is subjected
to a sufficiently large number of loading cycles, failure may occur
even though the stress due to loading is lower than the ultimate
static strength (determined by a single loading) of a similar member.
This phenomenon, termed fatigue failure, is found to exist in concrete
as in most structural materials and has been under investigation by
various research organizations since the beginning of the present century.
There are, nevertheless, many aspects of the behaviour of concrete under
repetitive loading that need further investigation, among them the problem
of cumulative fatigue damage.
1.2 Cumulative fatigue damage
As the stress induced by repeated loading fluctuates in the material
of a structure, physical changes occur. If the variation of stress is
sufficiently great, permanent damage may result although this damage is
not normally discernible. The progressive increase of this damage under
repeated cycles of stress is termed fatigue damage and eventually leads
to visible deterioration and fatigue failure.
There are three main problems in designing any structure subjected
to complex live loads so that the accumulation of fatigue damage does
not threaten safety:-
(1) Predicting and describing the fatigue producing stress variations
that the structure will experience.
- 2 -
(2) Evaluation of cumulative damage.
(3) Accounting for the wide scatter in fatigue life that is observed
for seemingly identical test specimens and structures.
The evaluation of cumulative damage is a problem because the stress
cycles in actual structures vary so greatly in magnitude, number and
order that it is practically impossible to perform enough experiments
to cover all variations. Therefore, the total fatigue damage has to be
evaluated by summation of the effects of individual cycles. If the progressive
damage mechanism during each stress cycle was fully understood, this
summation to determine the cumulative effect, would present no problem.
The other alternative is to employ one of the proposed cumulative fatigie
damage hypotheses (to be examined in chapter 8),however, none of them
has been experimentally proved to be sufficiently reliable when applied
to concrete.
An investigation of how a concrete element is progressively damaged
under both uniform and repetitive loadings of varying amplitude, leading
to fatigue failure, is therefore of considerable value.The practical
application of the resulting knowledge would be advantageous not only
in the safe and serviceable design of structures such as bridge girders,
slabs, pavements, machine foundation, off-shore structures subject to
heavy wave action, or prestressed railway sleepers, but also for the
economical use of structural materials.
1.3 Levels of approach in studying concrete
There are three levels of approach in studying any deformable body of
a composite material, i.e. the phenomenological or large scale level,
the fundamental or structural level, and the molecular or atomic level]
For the study of fatigue in concrete, two levels of approach, the funda-4
2mental and the phenomenological have been suggested.
The fundamental level is concerned with the behaviour and interaction
of the contituent parts of concrete with the purpose of explaining the
- 3 -
observed characteristics such as strength or fatigue behaviour in terms
of phase interaction. This type of research adds to the basic knowledge
of the mechanism of behaviour of condrete, but does not necessarily find
an immediate application to any specific problem.
The phenomenological level is concerned with the behaviour of concrete
as a whole such as, for example, its stress level-fatigue life relation
ship. The results of this type of research may find direct application
in practical problems, mostly in the form of empirical information. Indeed
most fatigue tests of concrete to date have been carried out in order to
give practical information to engineers. However, this kind of information
alone cannot give satisfactory explanation of the mechanism of the be
haviour of concrete. It is from the combination of information obtained
from these two levels of study that a real understanding of the nature of
fatigue in concrete begins to emerge, as has occurred in the study of
metal fatigue.
1.4 Froposal for present investigation
Since the available information regarding cumulative fatigue damage
in concrete in compression is very scarce the approach to this investigation
will be at both levels though predominantly phenomenological. In this way
it is hoped that, besides producing some empirical data of practical
application, the knowledge gained from the more fundamental observations
may help towards an improved understanding of the nature of fatigue in
concrete.
1.5 Objective of investigation
The purpose and scope of the investigation is to examine the cumulative
fatigue damage of high strength concrete under a cycling compressive load
between a constant lower stress level and both constant and systematically
varied upper stress levels. The work consists of three parts as followsj-
- 4 -
Part 1 : Review and description of tests.
Part 2 : Tests under loading of constant amplitude.
The objective of this part of the work are as follows:
1. To study the effect upon the gross behaviour of a particular concrete
of various constant amplitude cyclic loadings with a view to correlating
the parameters, namely maximum stress level; number of cycles to failure;
and probability of failure.
2. To investigate the effects of the cyclic loadings on various properties,
namely shape of stress-strain curve; elastic and inelastic strain; Modulus
of elasticity, etc.
3. To study by ultrasonic pulse velocity technique, the mechanism of
static and fatigue crack initation and propagation which can indicate the
extent of damage and the relative rates of accumulation of fatigue damage
and to examine the relationship between pulse velocity and number of cycles
of stress in the relation to the total fatigue life.
Part 3 : Tests under loading of variable amplitude.
The objective of this part of the work are as follows:
1. To investigate possible alternative damage concepts of cumulative damage
and cumulative fatigue damage theories with particular reference to the
Palmgren-Miner cumulative damage hypothesis.
2. To investigate the limitations of the Palmgren-Miner hypothesis in
order that engineers may have a better appreciation of the circumstances
in which the hypothesis is unsafe, or safe, and to suggest and investigate
possible modifications in order to improve the accuracy.
A practical cumulative fatigue concept is put forward and the validity
of the concept is verified in the light of the conclusions drawn from the
present investigation.
1.6 Limitations of the investigation

- 5 -
In order to investigate as many variations of repeated loading as
possible the following variables were maintained constant throughout the/
programme of tests.
,, 1. Mix proportions, range of age of concrete and environmental
conditions.
2. Wave form of loading cycle (sinusoidal).
3. Frequency of loading.
4. Minimum stress level.
5. Maximum stress level (Between 65% and 85% of the ultimate
static strength of concrete).
The effects that variations in mix, age of concrete, type and rate
of loading, etc. will have on the cumulative fatigue damage in concrete
in compression are beyond the scope of this study, and must be left until
more is known about the nature of emulative fatigue damage under the
above simplified conditions.

- 6 -
: i CHAPTER T7/0
REVIEW OF CURRENT KNOWLEDGE OK THE FAILURE OF PLAIN CONCRETE
UNDER COMPRESSIVE FATIGUE LOADING
2.1 General Reviews
Studies of the fatigue behaviour of concrete under repeated loading
now extend over more than 70 years. However, the majority of them, being
exploratory investigations, have been fragmentary and of limited scope and
it is difficult to draw many firm conclusions from the available information
which is based on the results of tests conducted on different types of
specimens subjected to various loading conditions.
The information concerning fatigue properties of concrete may be divided
into the three categories of plain, reinforced, and prestressed concrete.
The current knowledge of the fatigue properties of concrete, reinforcing
bars, welded reinforcing mats, prestressing tendons is now published by the
A.C.I. Committee 215^ and will not be covered here. The purpose of this
chapter is to summarise the relevant important work and to indicate its
limitations and requirements for further research, with particular reference
to the fatigue behaviour of plain concrete under axial compressive fatigue
loading.
Reviews of the earlier work were published by Mills and Dawson^ in 1927, c 6 7by Cassie7 in 1939 and in more detail, by Nordby, and by Bate' in 1958.
8In I960, the A.C.I. produced an exhaustive annotated bibliography covering9the period up to the end of 1958. In February 1965» Murdock7 published a
comprehensive and critical review of fatigue research on plain concrete
in which he summarised the state of knowledge at that time and suggested
some recommendations for future research. Neal and Kesler]^ later in the
same year, published a report on the fatigue of plain concrete in which
they summarised the state of knowledge with particular reference to the
extensive investigations at the University of Illinois. In 1968, as a
- 7 -
preliminary part of a comprehensive research programme on plain concrete
to "be undertaken by the Transport and Road Research Laboratory, Raithby
and V/hiffin11 published an extensive literature review and outlined some
recommendations for future research. In March 1974# the A.C.I. committee
215 published a report^ which provided the most updated information concern -
ing the fatigue properties of component materials, namely, concrete, rein-12forcing bars, etc. More recently, the A.C.I. published a special publication
(ACI-SF41) in which 15 papers presented at the Abe3.es symposium 'Fatigue of
Concrete' in November 1972, were included. A concise review of the current
state of knowledge on fatigue in concrete was also published by Eennett^ in
May, 1974.
2.2 Fatigue of plain concrete under repeated axial compressive loads
In reviewing the work that has been done on concrete it is convenient
to use the following broad headings:
(1) Constant amplitude tests.
(2) Time dependent effects (i.e., specimen age, rate of loading
rest periods, etc).
(3) Effect of Material properties.
(4) Mechanism of fatigue failure.
(5) Effect of previous stress history.
(6) Stress interaction and cumulative damage.
2.2.1' Constant amplitude tests
1ASome of the earliest work on fatigue was reported by Van Omum H in
1903, mainly on 5lnim neat Portland cement cubes four weeks old but also
including some concrete cubes, tested in repeated compression at four cycles
per minute. In 1907^ tests on 127x127x305mm prisms aged both one month
and one year at frequencies of two to four cycles per minute were described.
The scope of the tests was limited to lives of less than about 10^ cycles.
Van Ornum's work merits attention because it established the existence of

- 8 -
the fatigue phenomenon for concrete and recorded the observation of pro
gressive failure. The slope of the stress-strain relationship varied with
the! number of load cycles applied, initially being convex but later . change-
ing to linear and to concave, with a progressive decrease in stiffness, and
finally near failure it became S-shaped. His tests indicated that concrete
has no fatigue limit as in the case of metal but he concluded that the
fatigue strength under repeated loading could be stated to be about 55 per
cent of the static ultimate strength for a fatigue life of 7000 cycles. He
appeared also to be the first to have expressed the fatigue strength of cement
mortar and concrete in form of an S-N diagram (Fig2.l).
; !Williams, in 1920, tested cylinders at six to eight cycles per day.
Limited data indicated a slight increase in the modulus of elasticity of
concrete with repetitions of load.
In the thirty years following Van Ornum's tests, there were several
investigations which followed similar lines, notably by Probst and his stud-*17 18 19 20 21ents '* and by Ban 7 and Graf and Brenner ’ at Karlsruhe, Germany. These
investigations were mainly concerned with progressive deformation Tinder fatigue
loading and particular attention has been paid to recording stress-strain
diagrams at various stages of the tests. Although the number of specimens
was small, it was possible to extend the observations to longer lives than
those of Van Ornum. Consideration was also given at thi3 time to the inter
relation between fatigue strain and creep, following earlier observations 22by Berry, and to the implications of partial strain recovery on the removal
of the load.
20The investigation by Graf and Brenner was significant because it in
troduced a modified Goodman diagram for the firsi time into concrete study,
describing the effect of rangeoFstress on the fatigue behaviour of concrete.
Only a limited number of points was covered but some typical results are given
in Fig 2.2.

- 9 -
These German investigations,'although more detailed and meticulous
than Van Ornum^ did relatively little more than substantiate his results.
However, they do provide a firm basis for continued work which may provide
a better understanding of the mechanism of fatigue failure. The work of
Graf and Brenner, * in particular, included the effect of a number of
variables, namely, cross-section, speed of testing, mix proportions, curing^
range of stress and specimen age.
For almost a quarter of a century from 1956 to 1959» no further reports
of fatigue tests under direct compression appeared. In 1959* Antrim and
McLaughlin reported a study of fatigue behaviour of air-entrained and non
air-entrained concrete. Tests were made on 76x152mm cylinders subjected
to repeated axial compression at a frequency of loading of 1000 cycles per
minute. The data indicated when extrapolated, a fatigue strength of about
55 percent of the static ultimate strength at 10 million cycles without any
significant differencès between the fatigue strength of the two types of
concrete; and no evidence of a fatigue limit v;as found (see Fig. 2.3.). In a
subsequent study carried out in 1961, Gray, McLaughlin and Antrim^ extended
the investigation to include lightweight aggregate concretes at frequencies
of 500 and 1000 cycles per minute and again the specimens where 76xl5?mm
cyclinders. No fatigue limit was found and no effect of speed of testing
was discernible. There was no significant difference between the fatigue
strength between lightweight concrete and that of conventional concrete (see
Fig. 2.4). Although the results were limited in scópe, and the number of tests
was relatively small, the main contribution of these tests was in the exten
sion of fatigue knowledge to a different type of concrete and to higher fre
quencies of loading used.OC
In 1965* Linger and Gillespie ^ reported a study in which axial load
tests were performed on cylinders both in direct compression and in split-
cylinder indirect tension. The results obtained were very similar to those
- 10 -t 1
of Van Omuni, although covering a much wider range of lives. No significant
difference; in fatigue life was found between tensile and compressive load
ing when , the; applied load was expressed in terms of percentage of the ultimate
staticistrength and there also appeared to be slightly less scatter in'the
results for the tensile splitting tests (see Fig 2.5). The Goodman diagrams
were also used to fehow the results, which although were limited by the small
number of relevant test points, indicated a consistency in fatigue strength
between compressive and indirect tensile loading, therefore, suggesting a
similarity in the mechanism of failure.
At the university of Leeds, Muir conducted a programme of fatigue tests
on high strength concrete 76x76x203mm prisms loaded in compression at fre-
quencies between 190 to 340 c.p.m. and the published test results' indicated
a fatigue strength at one million cycles of between 66 and 71 percent of the
static ultimate strength, when the lower load limit was maintained at 8.62
N/mm . When corrected by the modified Goodman diagram, this corresponds to
60 percent at 1 million cycles and when extrapolated, 61 and 57 percent at
2 million and 10 million cycles respectively. The results were generally
in good agreement with the previous investigators of the 1930's and establish
ed a definite trend of a slightly lower value for the high strength concrete,
28Raju in 1968, of the same university, conducted an extensive programme
of tests, on high strength concrete 76x76x203mm prisms with the main object
ive of studying the mechanism of fatigue failure of plain, concrete and the29published test results ' indicated a fatigue strength of concrete of about
62 percent of static ultimate strength at 2 million cycles when the lower load
limit was maintained at 1.4-1.7 N/mm, The results were in agreement of the
previous investigations except the average static strength of the concretep p p*7
used was 40 N/mra compared to;39“63 N/mm of Bennett and Muir, The testtis 30data also has been analysed on a statical basis using McCall's' model intro
ducing the probability of failure to the conventional S-N diagram.
11
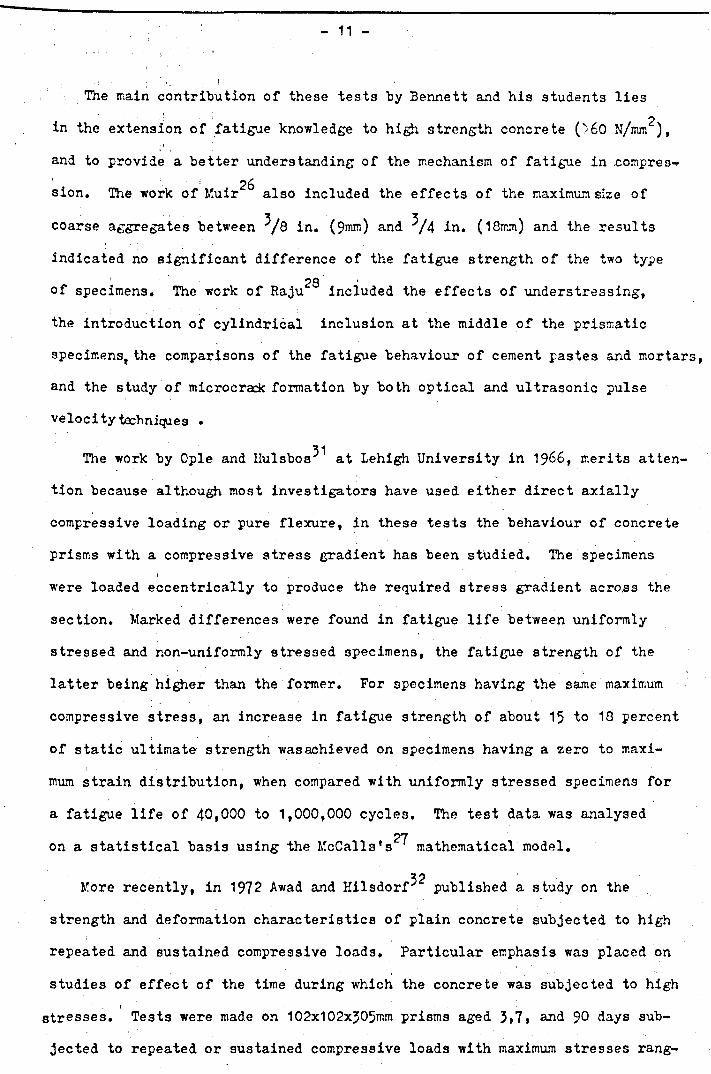
The main contribution of these tests by Bennett and his students lies
in the extension of fatigue knowledge to hig^ strength concrete (>60 N/mm ),
and to provide a better understanding of the mechanism of fatigue in .compres-f
sion. The work of Muir also included the effects of the maximum size of
coarse aggregates between in. (9mm) and ^/4 in. (18mm) and the results
indicated no significant difference of the fatigue strength of the two type
of specimens. The work of Raju included the effects of understressing,
the introduction of cylindrical inclusion at the middle of the prismatic
specimens^ the comparisons of the fatigue behaviour of cement pastes and mortars,
and the study of microcrack formation by both optical and ultrasonic pulse
velocity techniques •
The work by Ople and Hulsbos^ at Lehigh University in 1$66f merits atten
tion because although most investigators have used either direct axially
compressive loading or pure flexure, in these tests the behaviour of concrete
prisms with a compressive stress gradient has been studied. The specimens
were loaded eccentrically to produce the required stress gradient across the
section. Marked differences were found in fatigue life between uniformly
stressed and non-uniformly stressed specimens, the fatigue strength of the
latter being higher than the former. For specimens having the same maximum
compressive stress, an increase in fatigue strength of about 15 to 18 percent
of static ultimate strength wasachieved on specimens having a zero to maxi
mum strain distribution, when compared with uniformly stressed specimens for
a fatigue life of 40,000 to 1,000,000 cycles. The test data was analysed27on a statistical basis using the McCalls's mathematical model.
52More recently, in 1972 Awad and Hilsdorf published a study on the
strength and deformation characteristics of plain concrete subjected to high
repeated and sustained compressive loads. Particular emphasis was placed on
studies of effect of the time during which the concrete was subjected to high
stresses. Tests were made on 102x102x305mm prisms aged 3*7» and 90 days sub
jected to repeated or sustained compressive loads with maximum stresses rang

12 -
ing from 80 to 95 percent of the static ultimate strength and rates of load-2ing of 4.14,41.36 and 413*68 N/mm /min. The results indicated that the re
sponse of concrete to high repeated loads was to a large extent controlled
by the duration of time during whidh the concrete had to resist stresses
higher than its sustained load strength. Therefore, the speed of testing
had a substantial influence on the fatigue life of concrete, this is discussed
further in Section 2.2.2.2 p. 13« An analytical procedure was also developed
to predict the number of cycles to failure for concrete subjected to various
stress ranges at various rates of loading.
2.2.2 Time dependent effects.
2.2.2.1 Effect of age of specimen
Little work appears to have been done hitherto on the effects of age on
compressive fatigue performance of concrete. The sole systematic research
appears to be that of Linger and Gillespie. J who conducted tests on cylind
rical specimens in repeated compression. The limited results indicated that
for specimens less than 3 months old, fatigue strength increased with age,
theincrease being approximately linear over an age of 40 to 84 days. The
results showed the fatigue strength at one million cycles to be 0*64 of the
static strength at 40 days increasing to 0f82 at 84 days. No data was avail
able for ages greater than 84 days.
The only other attempt to investigate the effects of age on the fatigue
strength of concrete was by Raithby and Galloway^ of the T.R.R.L. who con
ducted flexural fatigue tests on small concrete beams with the objectives of
stuping the effects of moisture state, age in terms of curing time and rate
of loading on the fatigue performance of three types of concrete used in high- .
way construction. The results of these flexural tests are not directly relevant
but it is of interest that they indicated the fatigue performance to be strongly
dependent on the age of the concrete. They also suggested that a reasonably
good prediction of long term performance of concrete of ages up to 3 years
might be obtained by extrapolation from the results of short term tests under
- 1 3 -
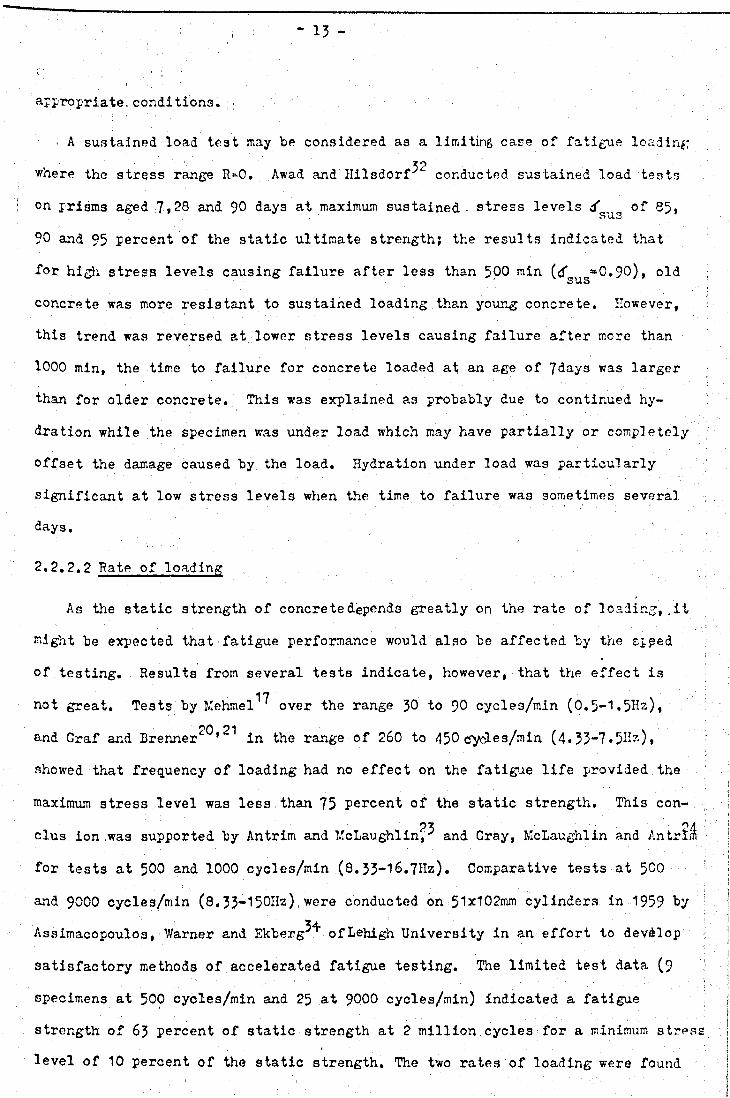
appropriate, conditions.
i A sustained load test may be considered as a limiting case of fatigue loading
where the stress range R=0. Awad and Hilsdorf^ conducted sustained load tests
on prisms aged 7,28 and 90 days at maximum sustained - stress levels , of 85»
90 and 95 percent of the static ultimate strength; the results indicated that
for high stress levels causing failure after less than 5p0 min *0.90), old
concrete was more resistant to sustained loading than young concrete. However,
this trend was reversed at lower stress levels causing failure after more than
1000 min, the time to failure for concrete loaded at an age of 7days was larger
than for older concrete. This was explained as probably due to continued hy
dration while the specimen was under load which may have partially or completely
offset the damage caused by the load. Hydration under load was particularly
significant at low stress levels when the time to failure was sometimes several
days. '
2.2.2.2 Rate of loading
As the static strength of concrete depends greatly on the rate of loading,,it
might be expected that fatigue performance would also be affected by the spped
of testing. Results from several tests indicate, however, that the effect is
not great. Tests; by Mehmel1 over the range 30 to 90 cycles/min (0.5-1.5Hz),
and Graf and Brenner^’^ in the range of 260 to 450 cycles/min (4.55-7•5Hz),
showed that frequency of loading had no effect on the fatigue life provided the
maximum stress level was less than 75 percent of the static strength. This con-
clu3 ion .was supported by Antrim and McLaughlin^ and Cray, McLaughlin and AntrirS
for tests at 500 and 1000 cycles/min (8.33-16.7Hz). Comparative tests at 500
and 9000 cycles/min (8.33-150Hz),were conducted on 51x102mm cylinders in 1959 ty
Assimacopoulos,■Warner and EkbergyT of Lehigh University in an.effort to develop
satisfactory methods of accelerated fatigue testing. The limited test data (9
specimens at 500 cycles/min and 25 at 9000 cycles/min) indicated a fatigue
strength of 63 percent of static strength at 2 million cycles for a minimum stres
level of 10 percent of the static strength. The two rates of loading were found

- 14 -
to have no significant effect on the fatigue life despite the fact that at 9C00
cycles/min a considerable temperature rise (in some cases from room temperature
of 78°P to 175°F) occurred due to internal friction in the specimen.
However, the conclusions drawn from the above investigations cannot be re
garded as being very reliable due to the fact that the number of specimens tested,
and the range of frequencies covered were too small. The individual results
were somewhat inconclusive and showed enormous scatter (as much as 1000 to 1
of Kax^Tin life at particular stress levels).
For higher stress levels (00 to 95 percent of static strength) a significant
influence of rate of loading has been observed by Awad and Hilsdorf?^ Under
such conditions, creep effects became more important, leading to a reduction
in fatigue strength with decreasing rate of loading. It was found that a de
crease of rate of loading by one order of magnitude resulted in a decrease of
the fatigue life by almost one order of magnitude (rate of loading V.S log N).
3sWork has recently been completed by Sparks and Menzies in which com
pressive fatigue tests were performed on 102x102x203mm prisms with maximum load
levels between JC/f« and of the static strength in a triangular wave form at
rate of 0,5 and 50 N/mm'/sec and the minimum load level was maintained constant
at one third of the static strength tested at the rate of loading specified
in BS 1881: 1970 (0.25 N/mm^/sec). The results indicated that the rate of
loading did infact affect the fatigue strength of plain concrete in compression.
The degree to which the fatigue life was enhanced in the tests, by the more1
rapid application of loading was dependent upon the level of the maximum load.
Although it was not possible to put an exact figure on the improvement of life,
it was generally of lower order than the increase in the rate of loading.
The typical result showed that a hundred-fold increase in the rate of loading
produced a tenfold improvement in fatigue life. The conclusions drawn from
this work together with those of Awad and Hilsdorf are of importance because
it means that accelerated fatigue testing of concrete in compression may
1 - 15 -\;;i :
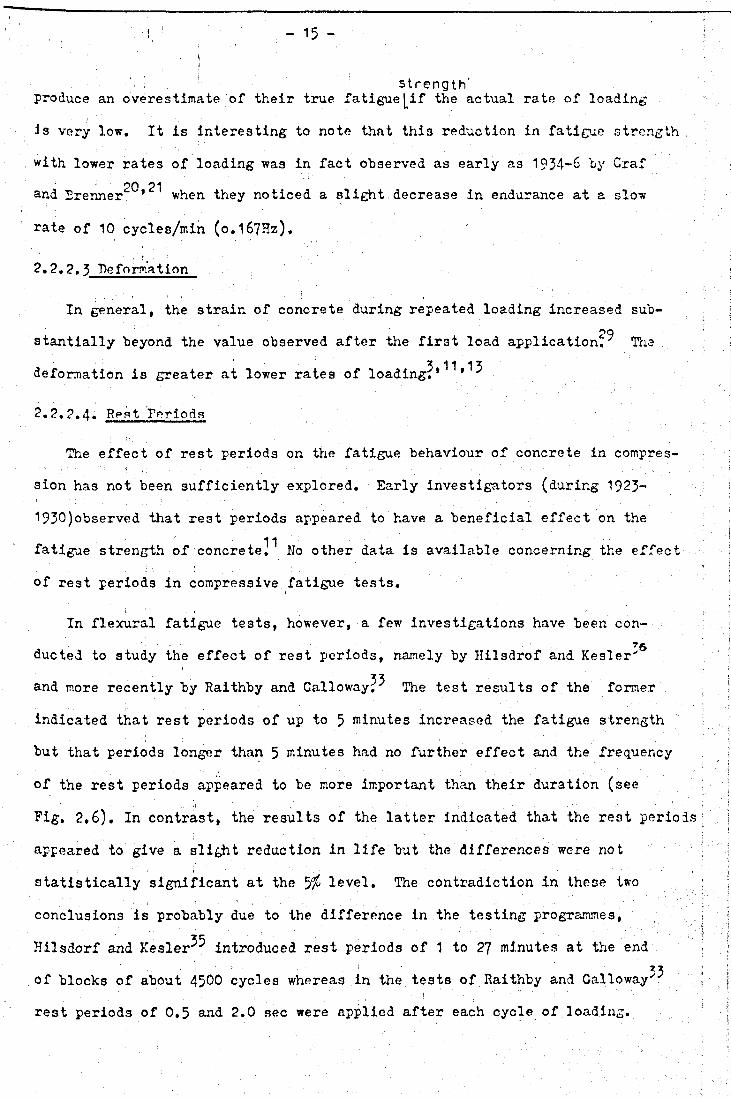
' ; s t r e n g t h 'produce an overestimate of their true fatigue[if the actual rate of loading
is very low. It is interesting to note that this reduction in fatigue strength
with lower rates of loading was in fact observed as early as 1934-6 by Graf
and Brenner ’ when they noticed a slight decrease in endurance at a slow
rate of 10 cycles/min (o .167Hz ),
2.2.2 .5 Deformation
In general, the strain of concrete during repeated loading increased sub-29stantially beyond the value observed after the first load application. The
deformation is greater at lower rates of l o a d i n g ^ * ^
2.2.2.4. Rest Periods
The effect of rest periods on the fatigue behaviour of concrete in compres
sion has not been sufficiently explored. Early investigators (during 1923-
1930)observed that rest periods appeared to have a beneficial effect on the
fatigue strength of concrete]"' No other data is available concerning the effect
of rest periods in compressive fatigue tests.
In flexural fatigue tests, however, a few investigations have been con
ducted to study the effect of rest periods, namely by Hilsdrof and Keeler' 6
and more recently by Raithby and Galloway^ The test results of the former
indicated that rest periods of up to 5 minutes increased the fatigue strength
but that periods longer than 5 minutes had no further effect and the frequency
of the rest periods appeared to be more important than their duration (see
Pig. 2,6). In contrast, the results of the latter indicated that the rest periods
appeared to give a slight reduction in life but the differences were not
statistically significant at the 5^ level. The contradiction in these two
conclusions is probably due to the difference in the testing programmes,
Hilsdorf and Kesler^ introduced rest periods of 1 to 27 minutes at the end
of blocks of about 4500 cycles whereas in the tests of Raithby and Galloway^
rest periods of 0.5 and 2.0 sec were applied after each cycle of loading.

- 16 -
2.2.3 Effect of material properties
Test reports as early as 1936 indicated that the fatigue strength decreas
ed sli^itly with an increase in the static strength; however, the reduction
with an increase in static strength appeared to he too small to he of practical
importance]^ It has also been found that cement paste and cement-sand mortar
specimens, of the same proportions as in concrete specimens did not differ
significantly from the concrete in fatigue strength^
Fatigue testing has been extended to include air-entrained concrete*^ and
light-weight aggregate concretes of high and low strength?^ In each case the
fatigue characteristics were similar to thoseof normal concrete; no fatigue
limit was found under 10 million cycles, at which duration the extrapolated
fatigue strength was about 55 percent of the static ultimate strength when the
minimum stress is zero.
2,2./», ,. Mechanism of fatigue failure.
The fatigue of concrete is a process of progressive permanent internal
cracks of microscopic width at the cement natrix/aggregate interface and the
matrix itself when subjected to repeated stresses. Fatigue fracture of con
crete is more extensive and characterised by considerably larger strains and
microcracking as compared to the somewhat similar cracking accompanying con
crete under static compressive loading]*^ The internal cracking of the concrete
could be detected by the decrease in the pulse velocity of an ultrasonic pulse
in lateral direction. Another effect of fatigue on the properties of concrete
is the concavity of the stress-strain curves prior to failure, thi3 could be
the result of some of the cracks at right angles to the direction of loading,29tending to close under increasing stress.
2.2,5 Effect of previous stress history
The application of repeated compressive stresses at a level below the
fatigue strength at 10 million cycles i.e., less than 55 percent of the static
strength, which is known as 'Understressing', has been found to have a margin
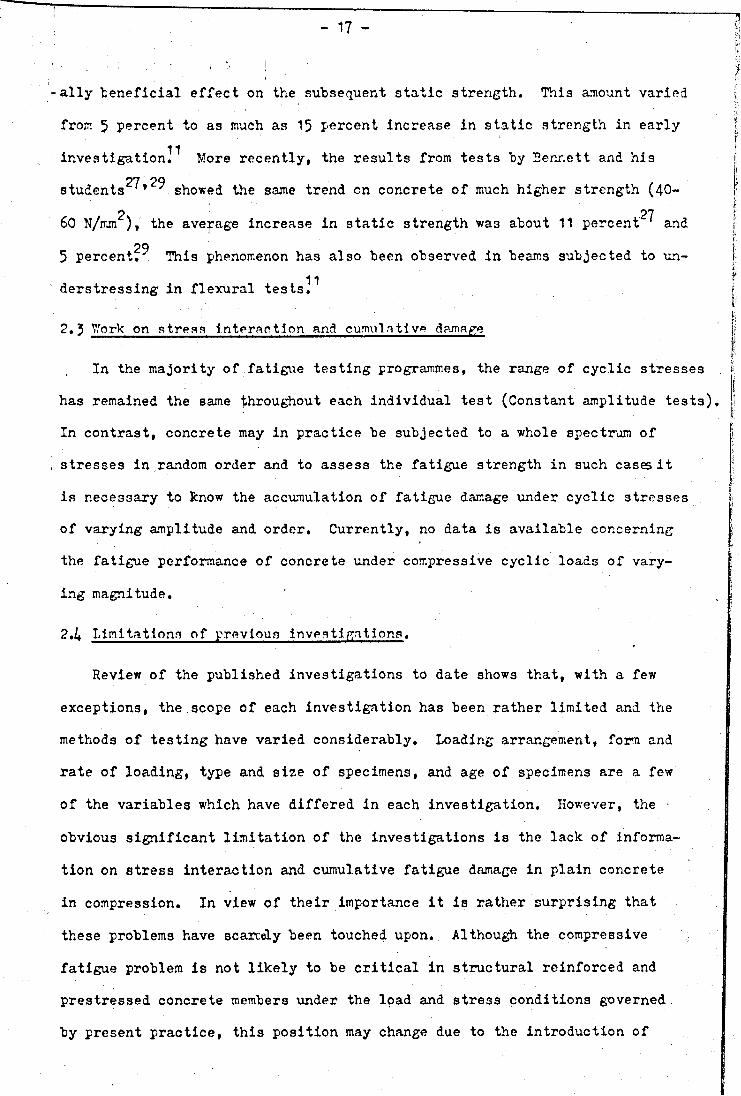
- 17 -
ally beneficial effect on the subsequent static strength. This amount varied
from 5 percent to as much as 15 percent increase in static strength in early
investigation]"* More recently, the results from tests by Bennett and his
students2^*2^ showed the same trend on concrete of much higher strength (40-2 2760 N/rrim ), the average increase in static strength was about 11 percent and
295 percent. This phenomenon has also been observed in beams subjected to un
derstressing in flexural tests]"*
2.3 V'ork on stress interaction and cumulative damage
In the majority of fatigue testing programmes, the range of cyclic stresses
has remained the same throughout each individual test (Constant amplitude tests).
In contrast, concrete may in practice be subjected to a whole spectrum of
stresses in random order and to assess the fatigue strength in such cases it
is necessary to know the accumulation of fatigue damage under cyclic stresses
of varying amplitude and order. Currently, no data is available concerning
the fatigue performance of concrete under compressive cyclic loads of vary
ing magnitude,
2,It Limitations of previous investigations.
Review of the published investigations to date shows that, with a few
exceptions, the .scope of each investigation has been rather limited and the
methods of testing have varied considerably. Loading arrangement, form and
rate of loading, type and size of specimens, and age of specimens are a few
of the variables which have differed in each investigation. However, the •
obvious significant limitation of the investigations is the lack of informa
tion on stress interaction and cumulative fatigue damage in plain concrete
in compression. In view of their importance it is rather surprising that
these problems have scarcely been touched upon. Although the compressive
fatigue problem is not likely to be critical in structural reinforced and
prestressed concrete members under the load and stress conditions governed
by present practice, this position may change due to the introduction of
- 18 -
advanced design procedures and increasing use of high strength material, for
example, more slender columns, piles, more flexible machine bases and off
shore structures etc.
Furthermore, precise information is needed to enable a reliable evaluation
to be made of fatigue damage in an actual structure. It is doubtful whether
the present practice in estimating the fatigue performance from the limited
knowledge gained from constant amplitude tests will always result in a safe
and serviceable structure.
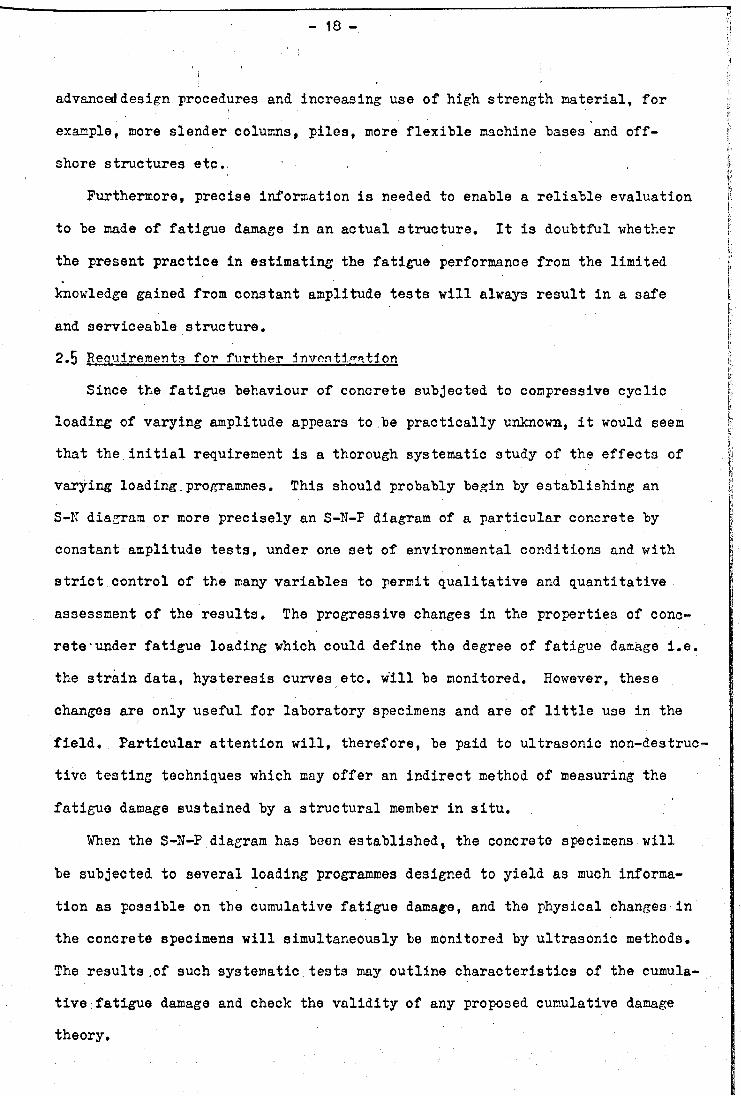
2.5 Requirements for further investigation
Since the fatigue behaviour of concrete subjected to compressive cyclic
loading of varying amplitude appears to be practically unknown, it would seem
that the initial requirement is a thorough systematic study of the effects of
varying loading.programmes. This should probably begin by establishing an
S-N diagram or more precisely an S-N-P diagram of a particular concrete by
constant amplitude tests, under one set of environmental conditions and with
strict control of the many variables to permit qualitative and quantitative
assessment of the results. The progressive changes in the properties of conc
rete ‘under fatigue loading which could define the degree of fatigue damage i.e.
the strain data, hysteresis curves etc. w'ill be monitored. However, these
changes are only useful for laboratory specimens and are of little use in the
field. Particular attention will, therefore, be paid to ultrasonic non-destruc
tivc testing techniques which may offer an indirect method of measuring the
fatigue damage sustained by a structural member in situ.
When the S-N-P diagram has been established, the concrete specimens will
be subjected to several loading programmes designed to yield as much informa
tion as possible on the cumulative fatigue damage, and the physical changes in
the concrete specimens will simultaneously be monitored by ultrasonic methods.
The results ,of such systematic;tests may outline characteristics of the cumula
tive :fatigue damage and check the validity of any proposed cumulative damage
theory.
- 19 -
CHAPTER 3
TEST SPECIMENS: DESIGN, PREPARATION
j !
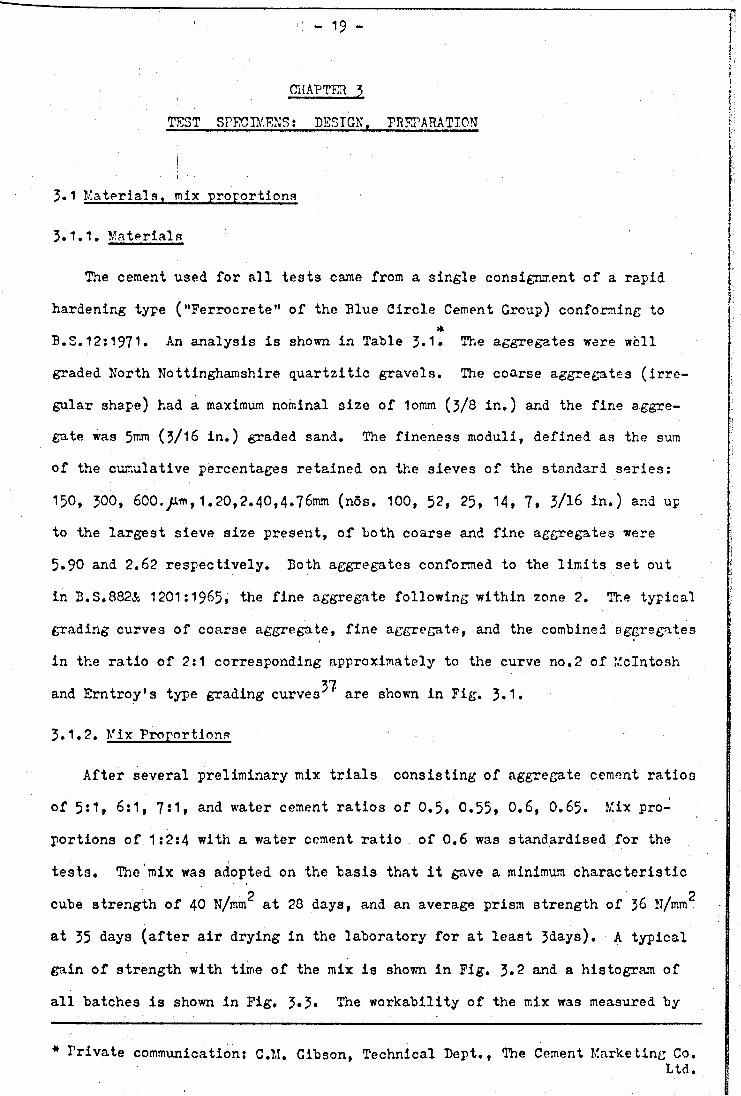
3.1 Materials, mix proportions
3.1.1. Materials
The cement used for all tests came from a single consignment of a rapid
hardening type ("Ferrocrete" of the Blue Circle Cement Group) conforming to*
B.S.12:1971. An analysis is shown in Table 3*1» The aggregates were well
graded North Nottinghamshire quartzitic gravels. The coarse aggregates (irre
gular shape) had a maximum nominal size of 1omm (3/8 in.) and the fine aggre
gate was 3mm (3/16 in.) graded sand. The fineness moduli, defined as the sum
of the cumulative percentages retained on the sieves of the standard series:
150, 300, 600,jxm,1.20,2.40*4.76mm (nos. 100, 52, 25* 14, 7» 3/16 in.) and up
to the largest sieve size present, of both coarse and fine aggregates were
5.90 and 2.62 respectively. Both aggregates conformed to the limits set out
in 3.S.8823; 1201:1965, the fine aggregate following within zone 2. The typical
grading curves of coarse aggregate, fine aggregate, and the combined aggregates
in the ratio of 2:1 corresponding approximately to the curve no,2 of McIntosh37and Erntroy's type grading curves^ are shown in Fig. 3.1.
3.1.2. Mix Proportions
After several preliminary mix trials consisting of aggregate cement ratios
of 5:1* 6:1, 7:1* and water cement ratios of 0.5, 0.55, 0.6, O.65. Mix pro
portions of 1:2:4 with a water cement ratio . of 0.6 was standardised for the
tests. The mix was adopted on the basis that it gave a minimum characteristic2 2 cube strength of 40 N/mm at 28 days, and an average prism strength of 36 N/mrrr
at 35 days (after air drying in the laboratory for at least 3days). A typical
gain of strength with time of the mix is shown in Fig. 3.2 and a histogram of
all batches is shown in Fig. 3*3« The workability of the mix was measured by
* Private communication: C.M. Gibson, Technical Dept., The Cement Marketing Co.Ltd.
20 -
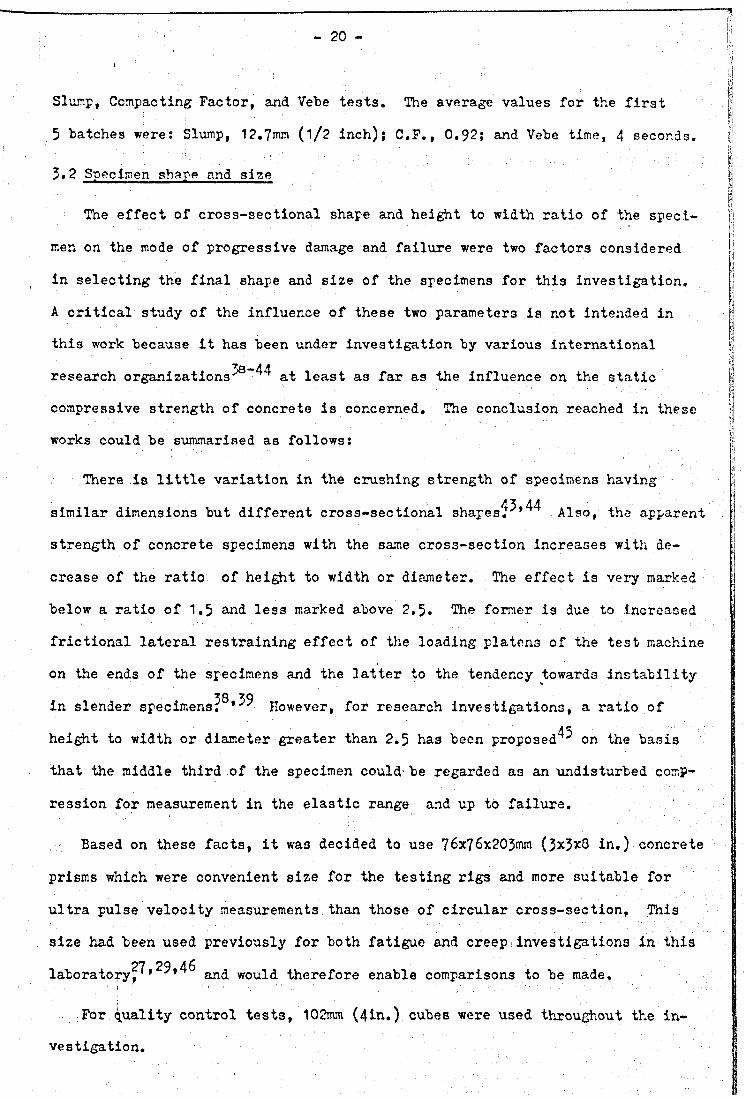
Slump, Compacting Factor, and Vebe tests. The average values for the first
5 hatches were: Slump, 12.7mm (1/2 inch); C.F., 0.92; and Vebe time, 4 seconds.
3.2 Specimen shape and size
The effect of cross-sectional shape and height to width ratio of the speci
men. on the mode of progressive damage and failure were two factors considered
in selecting the final shape and size of the specimens for this investigation.
A critical study of the influence of these two parameters is not intended in
thi3 work because it has been under investigation by various international
research organizations'^ ■ at least as far as the influence on the static
compressive strength of concrete is concerned. The conclusion reached in these
works could be summarised as follows:
There is little variation in the crushing strength of specimens having
similar dimensions but different cross-sectional shapes. Also, the apparent
strength of concrete specimens with the same cross-section increases with de
crease of the ratio, of height to width or diameter. The effect is very marked
below a ratio of 1.5 and less marked above 2.5. The former is due to increased
frictional lateral restraining effect of the loading platens of the test machine
on the ends of the specimens and the latter to the tendency towards instability
in slender specimens?®’^ However, for research investigations, a ratio of
height to width or diameter greater than 2.5 has been proposed^ on the basis
that the middle third of the specimen could- be regarded as an undisturbed comp
ression for measurement in the elastic range and up to failure.
Based on these facts, it wa3 decided to use 76x76x203mm (3x3x8 in.) concrete
prisms which were convenient size for the testing rigs and more suitable for
ultra pulse velocity measurements than those of circular cross-section, This
size had been used previously for both fatigue and creep investigations in this
laboratory^»^9i46 would therefore enable comparisons to be made.
For quality control tests, 102mm (4in.) cubes were used throughout the in
vestigation.
- 21
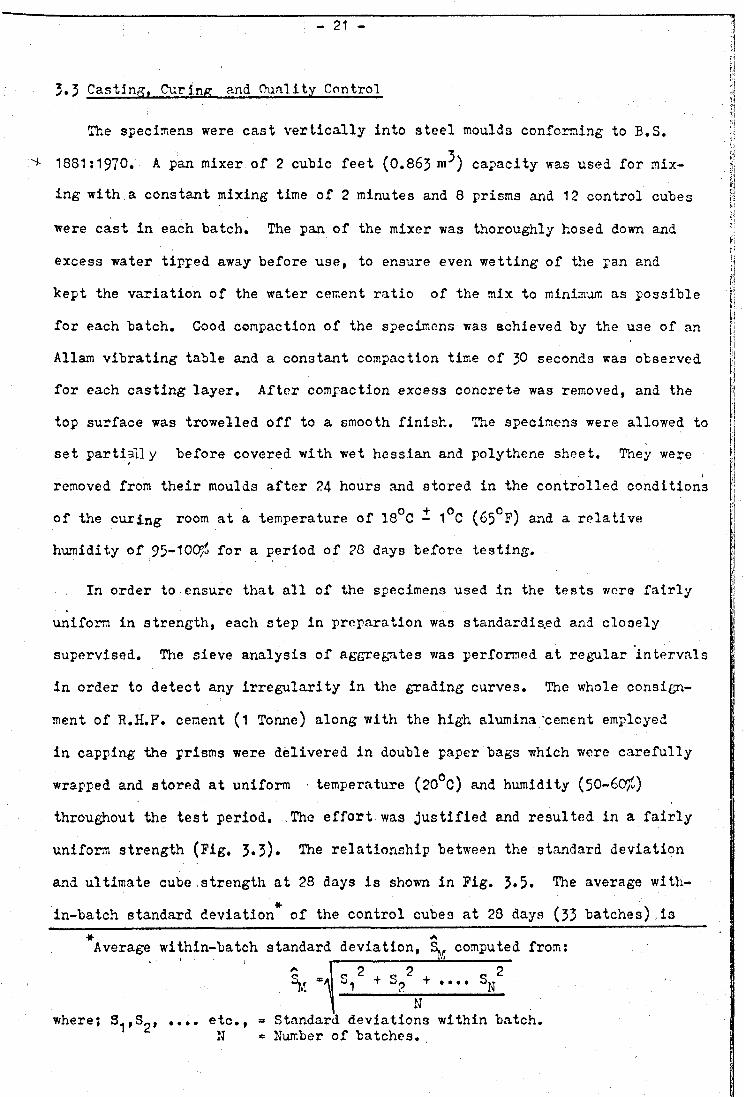
3.3 Casting, Curing and Quality Control
The specimens were cast vertically into steel moulds conforming to B.S.
1881:1970. A pan mixer of 2 cubic feet (O.863 m^) capacity was used for mix
ing with a constant mixing time of 2 minutes and 8 prisms and 12 control cubes
were cast in each batch. The pan of the mixer was thoroughly hosed down and
excess water tipped away before use, to ensure even wetting of the pan and
kept the variation of the water cement ratio of the mix to minimum as possible
for each batch. Good compaction of the specimens was achieved by the use of an
Allam vibrating table and a constant compaction time of J>0 seconds was observed
for each casting layer. After compaction excess concrete was removed, and the
top surface was trowelled off to a smooth finish. The specimens were allowed to
set partially before covered with wet hessian and polythene sheet. They were
removed from their moulds after 24 hours and stored in the controlled conditions
of the curing room at a temperature of 18°C - 1°C (65°F) and a relative
humidity of 95-100a> for a period of 28 days before testing.
In order to ensure that all of the specimens used in the tests v/ore fairly
uniform in strength, each step in preparation was standardis.ed and closely
supervised. The sieve analysis of aggregates was performed at regular intervals
in order to detect any irregularity in the grading curves. The whole consign
ment of R.H.F. cement (1 Tonne) along with the high alumina "cement employed
in capping the prisms were delivered in double paper bags which were carefully
wrapped and stored at uniform • temperature (20°C) and humidity (50-60^)
throughout the test period. The effort was justified and resulted in a fairly
uniform strength (Fig. 3*3). The relationship between the standard deviation
and ultimate cube strength at 28 days is shown in Fig. 3*5. The average with-
in-batch standard deviation* of the control cubes at 28 days (33 batches) .is* AAverage within-batch standard deviation, computed from:
^ * 1
2 2 2+ Sp + .... SN*N
where; S..,S-, .... etc., = Standard deviations within batch.N » Number of batches.
- 22 -
p1.26 N/mm (coefficient of variation is 2.937S) which is well below the value
recommended by the working groupl set up by a joint CEB/CIB/FIF/RILR.1 committee^' j
(Fig. 3.4).
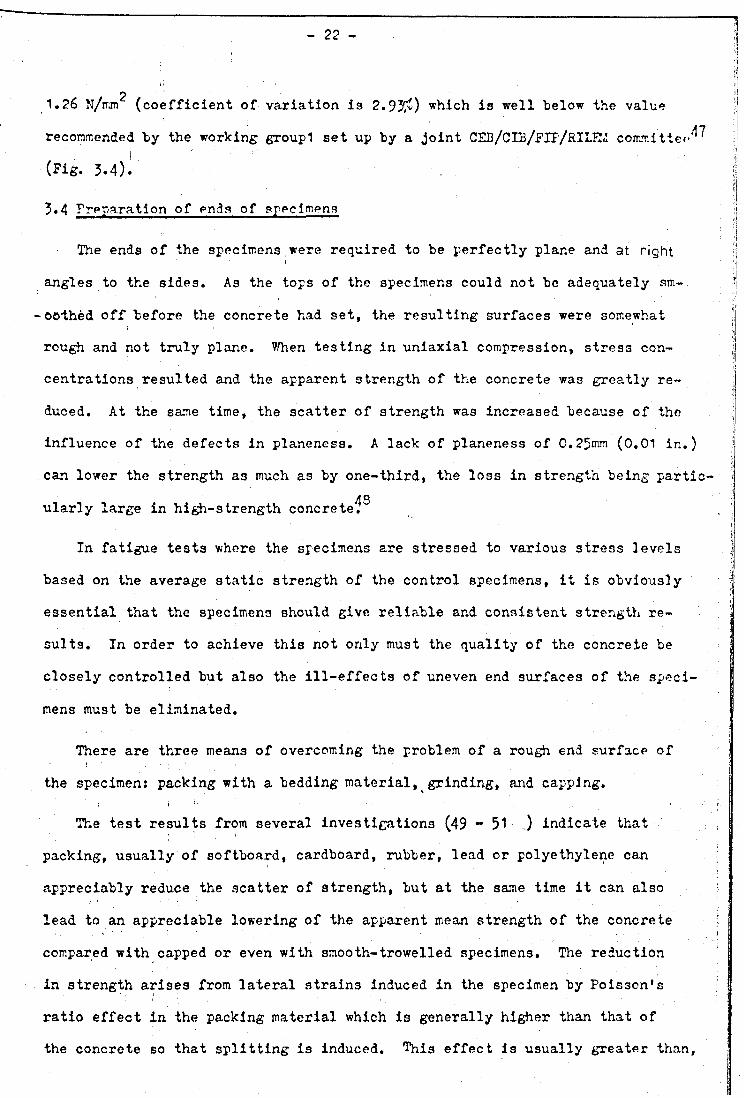
3*4 Preparation of ends of specimens
The ends of the specimens were required to be perfectly plane and at rightlangles to the sides. As the tops of the specimens could not be adequately sm-
-oothed off before the concrete had set, the resulting surfaces were somewhatfrough and not truly plane. When testing in uniaxial compression, stress con
centrations resulted and the apparent strength of the concrete was greatly re
duced. At the same time, the scatter of strength was increased because of the
influence of the defects in planencss. A lack of planeness of 0.25mm (0.01 in.)
can lower the strength a3 much as by one-third, the loss in strength being partic-48ularly large in high-strength concrete.
In fatigue tests where the specimens are stressed to various stress levels
based on the average static strength of the control specimens, it is obviously
essential that the specimens should give reliable and consistent strength re
sults. In order to achieve this not only must the quality of the concrete be
closely controlled but also the ill-effects of uneven end surfaces of the speci
mens must be eliminated.
There are three means of overcoming the problem of a rough end surface of
the specimen: packing with a bedding material,^grinding, and capping.
The test results from several investigations (49 “ 51 .) indicate that
packing, usually of softboard, cardboard, rubber, lead or polyethylene can
appreciably reduce the scatter of strength, but at the same time it can also
lead to an appreciable lowering of the apparent mean strength of the concrete
compared with capped or even with smooth-trowelled specimens. The reduction
in strength arises from lateral strains induced in the specimen by Poisson's
ratio effect in the packing material which is generally higher than that of
the concrete so that splitting is induced. This effect is usually greater than,
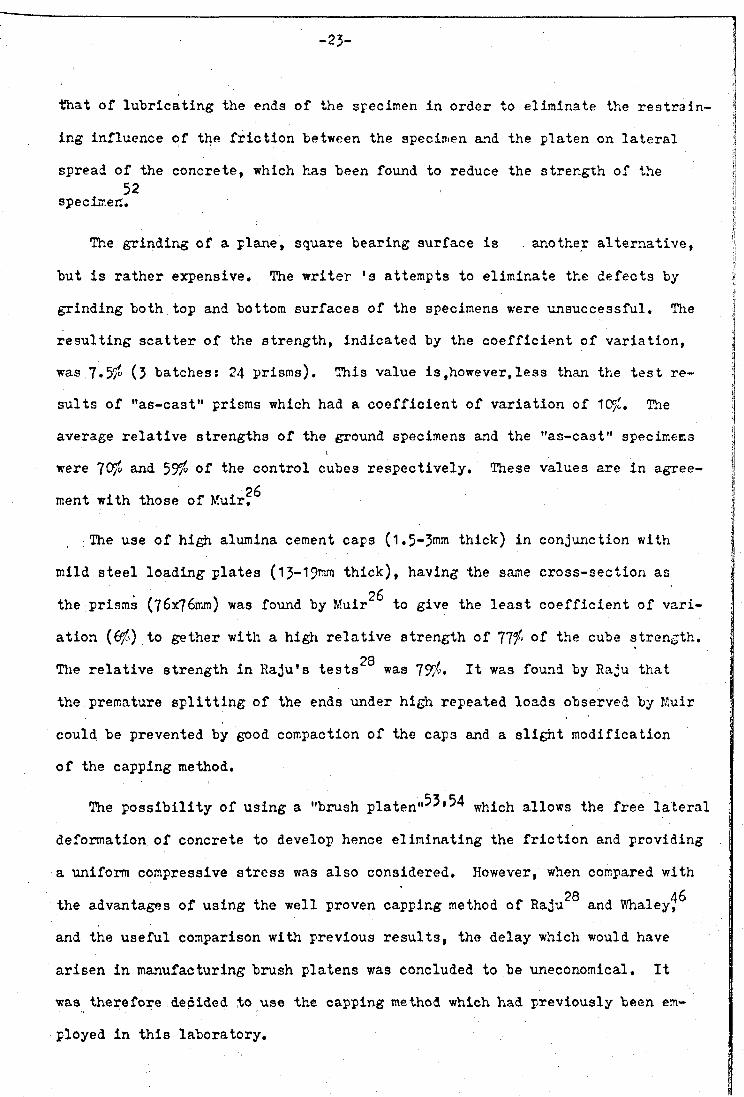
-23-
that of lubricating the ends of the specimen in order to eliminate the restrain- «
ing influence of the friction between the specimen and the platen on lateral
spread of the concrete, which has been found to reduce the strength of the i52 \
specimen. ;
The grinding of a plane, square bearing surface is another alternative,
but is rather expensive. The writer 1 s attempts to eliminate the defects by i
grinding both top and bottom surfaces of the specimens were unsuccessful. The
resulting scatter of the strength, indicated by the coefficient of variation, j
was 7*5/" (5 batches: 24 prisms). This value is,however,less than the test re
sults of "as-cast" prisms which had a coefficient of variation of 10?£. The *
average relative strengths of the ground specimens and the "as-cast" specimens ;f, l
were 70?» and 59?“ of the control cubes respectively. These values are in agree- j26 !ment with those of Muir.
The use of high alumina cement caps (1.5-5™° thick) in conjunction with jmild steel loading plates (13-19™° thick), having the same cross-section as ]
26 ' Ithe prisms (76x76mm) was found by Muir to give the least coefficient of vari- i
ation (6?S) to gether with a high relative strength of 77aIn of the cube strength. |
The relative strength in Raju's tests was 79? « It was found by Raju that
the premature splitting of the ends under high repeated loads observed by Muir
could be prevented by good compaction of the caps and a slight modification
of the capping method.
The possibility of using a "brush platen"^'^ which allows the free lateral
deformation of concrete to develop hence eliminating the friction and providing
a uniform compressive stress was also considered. However, when compared with
the advantages of using the well proven capping method of Raju^® and V/haleyf^
and the useful comparison with previous results, the delay which would have
arisen in manufacturing brush platens was concluded to be uneconomical. It
was therefore decided to(use the capping method which had previously been em
ployed in this laboratory.
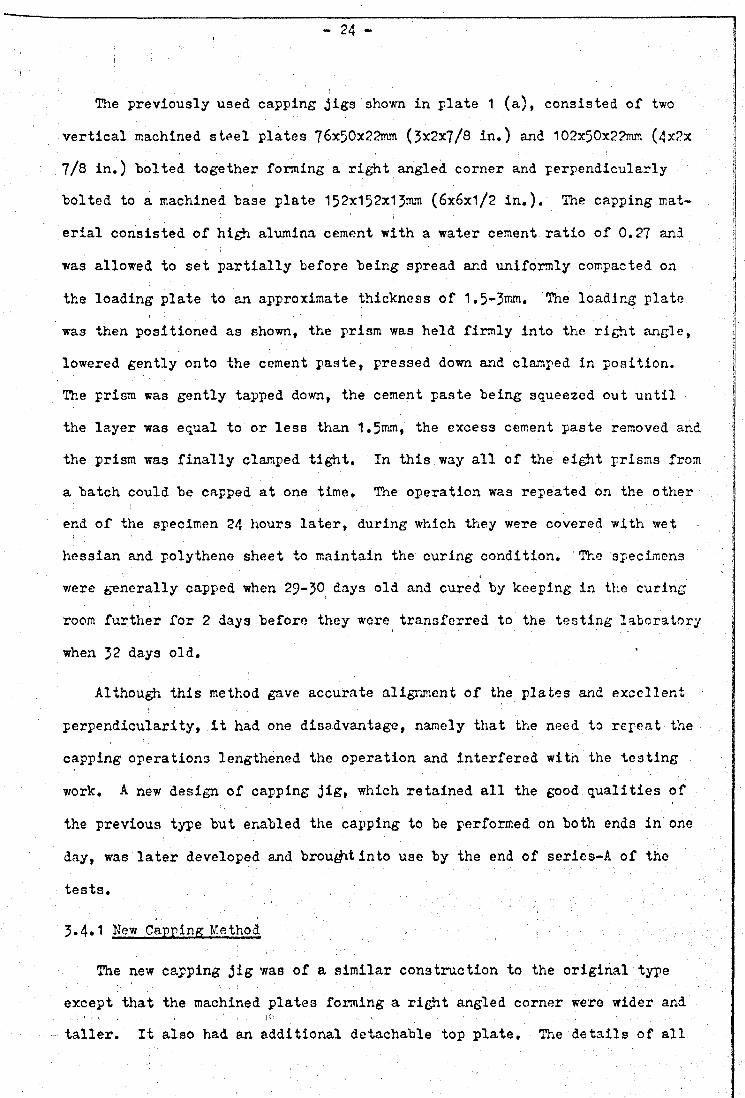
- 24 -
The previously used capping jigs shown in plate 1 (a), consisted of two
vertical machined steel plates 76x50x22mm (5x2x7/8 in.) and 102x50x22mm (4x2x
7/8 in.) bolted together forming a right angled corner and perpendicularly
bolted to a machined base plate 152x152x1Jmm (6x6xl/2 in.). The capping mat
erial consisted of high alumina cement with a water cement ratio of 0.27 and
was allowed to set partially before being spread and uniformly compacted on
the loading plate to an approximate thickness of 1.5-Jmm. The loading plate
wa3 then positioned as shown, the prism was held firmly into the right angle,
lowered gently onto the cement paste, pressed down and clamped in position.
The prism was gently tapped down, the cement paste being squeezed out until
the layer was equal to or less than 1,5mm, the excess cement paste removed and
the prism was finally clamped tight. In this way all of the eight prisms from
a batch could be capped at one time. The operation was repeated on the other
end of the specimen 24 hours later, during which they were covered with wet
hessian and polythene sheet to maintain the curing condition. The specimens
were generally capped when 29-JO day3 old and cured by keeping in the curing
room further for 2 days before they were transferred to the testing laboratory
when J2 days old.
Although this method gave accurate alignment of the plates and excellent
perpendicularity, it had one disadvantage, namely that the need to repeat the
capping operations lengthened the operation and interfered with the testing
work. A new design of capping jig, which retained all the good qualities of
the previous type but enabled the capping to be performed on both ends in one
day, was later developed and brought into use by the end of series-A of the
tests.
3.4.1 New Capping Method
The new capping jig was of a similar construction to the original type
except that the machined plates forming a right angled corner were wider and
taller. It also had an additional detachable top plate. The details of all
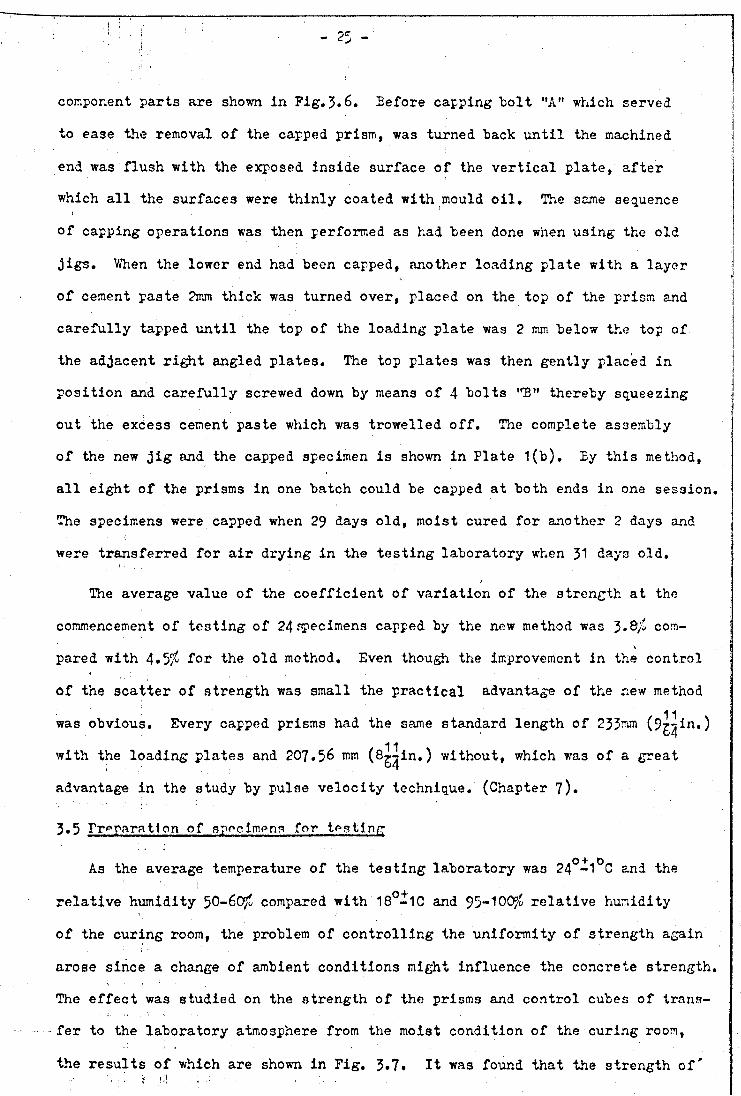
■ ' : : \ j . ■ - ? 5
I' !
cor.ponent parts are shown in Fig.3.6. Before capping holt "A" which served
to ease the removal of the capped prism, was turned hack until the machined
end was flush with the exposed inside surface of the vertical plate, afterI 'which all the surfaces were thinly coated with mould oil. The same sequence
of capping operations was then performed as had been done when using the old
jigs. When the lower end had been capped, another loading plate with a layer
of cement paste 2mm thick was turned over, placed on the top of the prism and
carefully tapped until the top of the loading plate was 2 mm below the top of
the adjacent right angled plates. The top plates was then gently placed in
position and carefully screwed down by means of 4 bolts "B" thereby squeezing
out the excess cement paste which was trowelled off. The complete assembly
of the new jig and the capped specimen is shown in Plate 1(b). By this method,
all eight of the prisms in one batch could be capped at both ends in one session.
The specimens were capped when 29 days old, moist cured for another 2 days and
were transferred for air drying in the testing laboratory when 31 days old.
The average value of the coefficient of variation of the strength at the
commencement of testing of 24specimens capped by the new method was 3.8/i com
pared with 4.5$ for the old method. Even though the improvement in the control
of the scatter of strength was small the practical advantage of the new method
was obvious. Every capped prisms had the same standard length of 233mm (9g^in.)
with the loading plates and 207.56 mm (8g^in.) without, which was of a great
advantage in the study by pulse velocity technique. (Chapter 7)»
3.5 Preparation of specimens for testing
As the average temperature of the testing laboratory was 24°-1°C and the
relative humidity 50-60ji compared with 18°-1C and 95-100?' relative humidity
of the curing room, the problem of controlling the uniformity of strength again
arose since a change of ambient conditions might influence the concrete strength.
The effect was studied on the strength of the prisms and control cubes of trans
fer to the laboratory atmosphere from the moist condition of the curing room,
the results of which are shown in Fig. 3»7» It was found that the strength of'
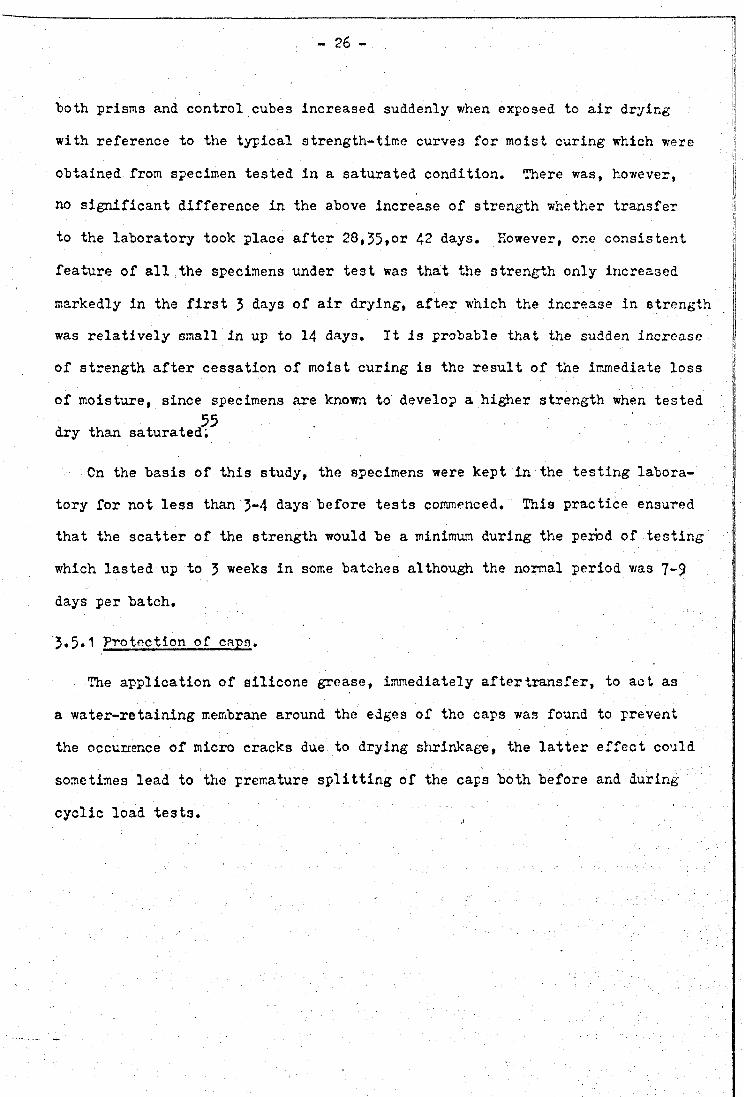
"both prisms and control cubes increased suddenly when exposed to air drying
with reference to the typical strength-time curves for moist curing which were
obtained from specimen tested in a saturated condition. There was, however,
no significant difference in the above increase of strength whether transfer
to the laboratory took place after 28,35>or 42 days. However, one consistent
feature of all the specimens under test was that the strength only increased
markedly in the first 3 days of air drying, after which the increase in strength
was relatively small in up to 14 days. It is probable that the sudden increase
of strength after cessation of moist curing is the result of the immediate loss
of moisture, since specimens are known to develop a higher strength when tested55dry than saturated;
Cn the basis of this study, the specimens were kept in the testing labora
tory for not less than 3-4 days before tests commenced. This practice ensured
that the scatter of the strength would be a minimum during the period of testing
which lasted up to 3 weeks in some batches although the normal period was 7-9 days per batch.
3.5«1 Protection of caps.
The application of silicone grease, immediately after transfer, to act s.3 a water-retaining membrane around the edges of the caps was found to prevent
the occurrence of micro cracks due to drying shrinkage, the latter effect could
sometimes lead to the premature splitting of the cap3 both before and during
cyclic load tests.
. - 2 6 -
1 - 2 7 -
CHAPTER FOUR
LOADING EQUIPMENT, ■ INSTRUMENTS. AND
GENERAL SCHH/E OP TESTS
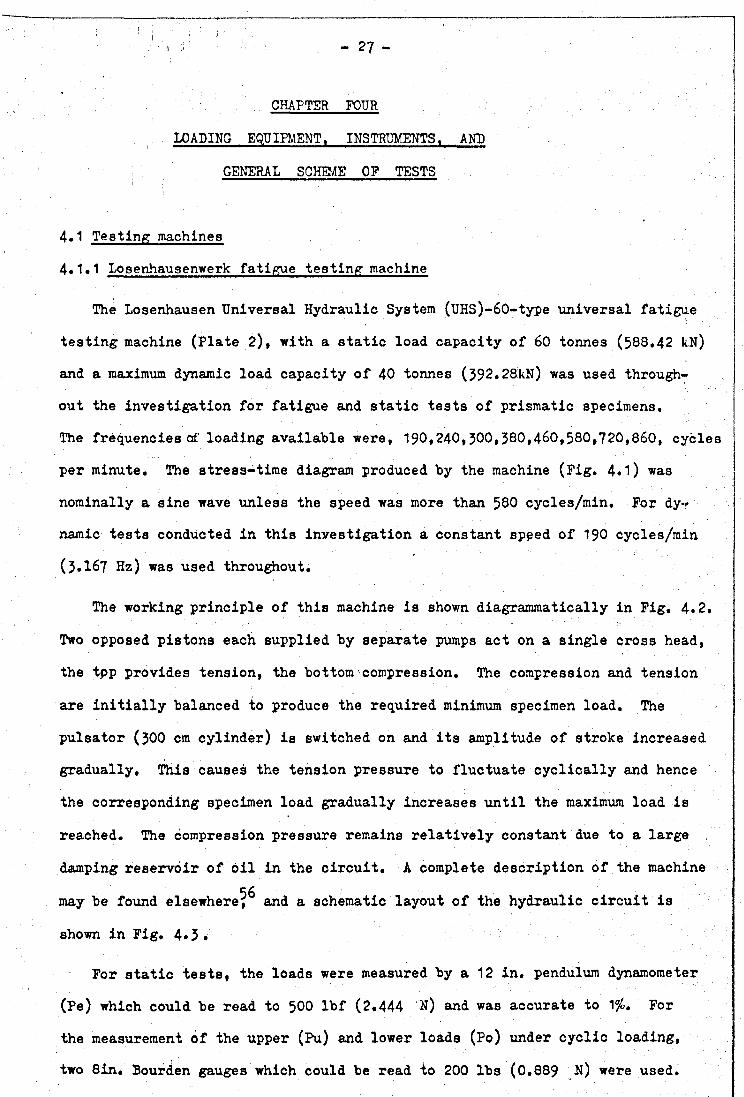
4.1 Testing machines
4.1.1 Losenhausenwerk fatigue testing machine
The Losenhausen Universal Hydraulic System (UHS)-60-type universal fatigue
testing machine (Plate 2), with a static load capacity of 60 tonnes (588.42 kN)
and a maximum dynamic load capacity of 40 tonnes (392.28kN) was used through-,
out the investigation for fatigue and static tests of prismatic specimens.
The frequencies of loading available were, 190,240,500,380,460,580,720,860, cycles
per minute. The stress-time diagram produced by the machine (Fig. 4.1) was
nominally a sine wave unless the speed was more than 580 cycles/min. For dy
namic tests conducted in this investigation a constant spaed of 190 cycles/min
(3.167 Hz) was used throughout.
The working principle of this machine is shown diagrammatically in Fig. 4.2,
Two opposed pistons each supplied by separate pumps act on a single cross head,
the tpp provides tension, the bottom compression. The compression and tension
are initially balanced to produce the required minimum specimen load. The
pulsator (300 cm cylinder) is switched on and its amplitude of stroke increased
gradually. This causes the tension pressure to fluctuate cyclically and hence
the corresponding specimen load gradually increases until the maximum load is
reached. The compression pressure remains relatively constant due to a large
damping reservoir of oil in the circuit. A complete description of the machineeg
may be found elsewhere, and a schematic layout of the hydraulic circuit is
shown in Fig. 4.3.
For static tests, the loads were measured by a 12 in. pendulum dynamometer
(Pe) which could be read to 500 lbf (2.444 N) end was accurate to 1 %, For
the measurement of the upper (Pu) and lower loads (Po) under cyclic loading,
two 8in. Bourden gauges which could be read to 200 lbs (0.889 N) were used.
28 -
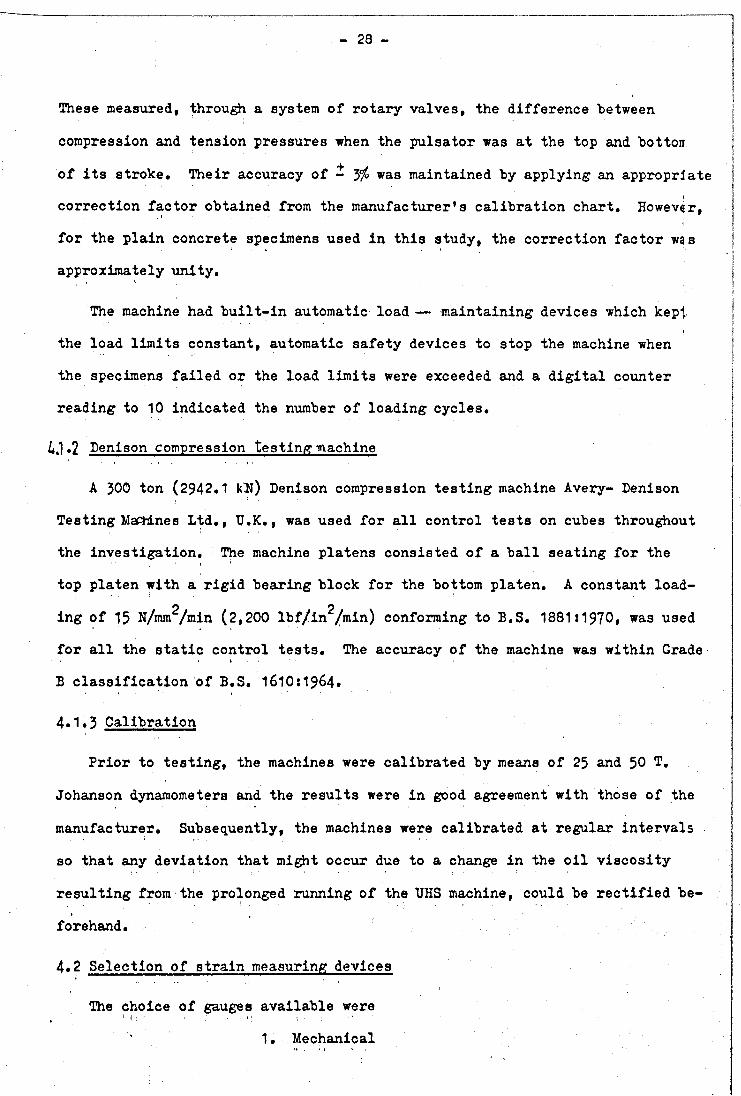
These measured, through a system of rotary valves, the difference between
compression and tension pressures when the pulsator was at the top and bottom
of its stroke. Their accuracy of i Jffo was maintained by applying an appropriate
correction factor obtained from the manufacturer's calibration chart. However,i
for the plain concrete specimens used in this study, the correction factor was
approximately unity.
The machine had built-in automatic load— maintaining devices which kept
the load limits constant, automatic safety devices to stop the machine when
the specimens failed or the load limits were exceeded and a digital counter
reading to 10 indicated the number of loading cycles.
¿,1.2 Denison compression testing machine
A 300 ton (2942.1 kN) Denison compression testing machine Avery- Denison
Testing Machines Ltd., TJ.K., was used for all control tests on cubes throughout
the investigation. The machine platens consisted of a ball seating for the
top platen with a rigid bearing block for the bottom platen. A constant load-
ing of 15 N/mm /min (2,200 lbf/in /min) conforming to B.S. 1881:1970, was used
for all the static control tests. The accuracy of the machine was within Grade
B classification of B.S. 1610:1964.
4.1.3 Calibration
Prior to testing, the machines were calibrated by means of 25 and 50 T.
Johanson dynamometers and the results were in good agreement with those of the
manufacturer. Subsequently, the machines were calibrated at regular intervals
so that any deviation that might occur due to a change in the oil viscosity
resulting from the prolonged running of the UHS machine, could be rectified be
forehand.
4.2 Selection of strain measuring devices
The choice of gauges available were. 1 P '! 1 1’ 1. Mechanical

- 29 -
2. Electrical Resistance
Preliminary tests were made using demountable mechanical gauges (Demec) deve-57loped by Morice and Base, detachable Lamb's 4 in. mirror roller extensometers
(A. Macklow-Smith Ltd., London) and electrical resistance strain gauges (e.r.s.)
both in static and dynamic tests to study the relative merits of the strain
measuring devices.
4.2.1 Method of fixing gauges.
For Demec gauges, stainless steel seating discs were fixed on the specimen
at the desired gauge lengths by means of Amco F 88 dental cement using the supp
lied standard gauge bar. Due to the quick setting action resulting from the
evaporation of the solution, the discs were ready for use within 10-15 minutes.
When using Lamb's 4 in. mirror roller extensometer, two gauges were clamped
on opposite sides of the specimen, the rollers and the angles of the mirrors
were carefully positioned until the reflected images of an illuminated cross
from a slide projector were shown on a millimetre scale at a distance of 1-85
m • from the prism. The schematic arrangement is shown in Fig. 4.4.
Before fixing the e.r.s. gauges, a selected surface area of the specimen
was smoothed by fine emery paper and wiped clean to provide a plain surface
which was then coated with a thin layer of the special adhesive supplied by
the manufacturers. A second layer of the adhesive was placed on the dried
primer layer and the gauge with the leads connected was placed in position anl
pressed down smoothly under the protective plastic sheet to expel the trapped
air bubbles and the surplus aclhesive. A minimum of 24 hours was allowed for
the adhesive to harden before testing commenced.
4.2.2 Static tests.
It was hot possible to measure both longitudinal and lateral strain on the
same specimen with the Lamb's extensometers on account of the size of
the instrument! When employed for longitudinal measurement, they could give

an accuracy determined by the accuracy of machining of the roller. The mean
diameter of the roller was quoted by the manufacturers of the instrument as
0.149755 in., assuming that this is correct to - 0.00001 in. This would re
present an accuracy of - 0.001$ although it is doubtful whether such a high
standard would be achieved on account of error introduced at the knife-edge
and contact surfaces. The resolution was 2.5x10”** strain for a scale distance
of 185 cm. In a static test to destruction, it was necessary to remove the!
instrument in order to avoid costly damage prior to failure. This and the
fact that they had to re-mounted on each specimen intum made them unsuitable
for the tests. However, they mi#it have been useful in a test where long-termt
strain under a non-destructive static load was required i.e. a creep test.
Exploratory tests were conducted on the prismatic specimens by using PL
30 (30 mm) e.r.s. gauges with a resolution of 5x10*” for longitudinal and lat
eral strains. For comparison 4 in. and 2 in. Demec gauges were also used for
strain measurements the former for longitudinal and the latter for lateral
strains, these had resolutions of 20 and 25x10”^ strain respectively.
For longitudinal compressive strain, the difference between the e.r.s. and
Demec gauge reading was about 5$» "the difference was probably due to the diff
erence in the gauge lengths employed. A small error of 1-2 divisions in read
ing the Demec gauges was considered to be insignificant in view of the fact
that the longitudinal strain at failure was about 2000 micro- strain.
For lateral tensile strain, the 2 in. Demec gauges were found to be insën-
itive to small changes in lateral strain which were about one-tenth to one-
fifth of that in compression and the error of 1-2 divisions in reading was
considerable. In contrast, the e.r.s gauges were more sensitive and gave more
consistent results. Hence it was decided to adopt the PL30 e.r.s gauges for
static tensile strain measurements.
For longitudinal strain measurements, it was decided to use the 4 in. Demec
gauges on the grounds that the e.r.s. gauge length of 30mm is not sufficient
- 50 -
to give accurate, consistent strains when compared with the longer measuring
length of 4 in. of the former.
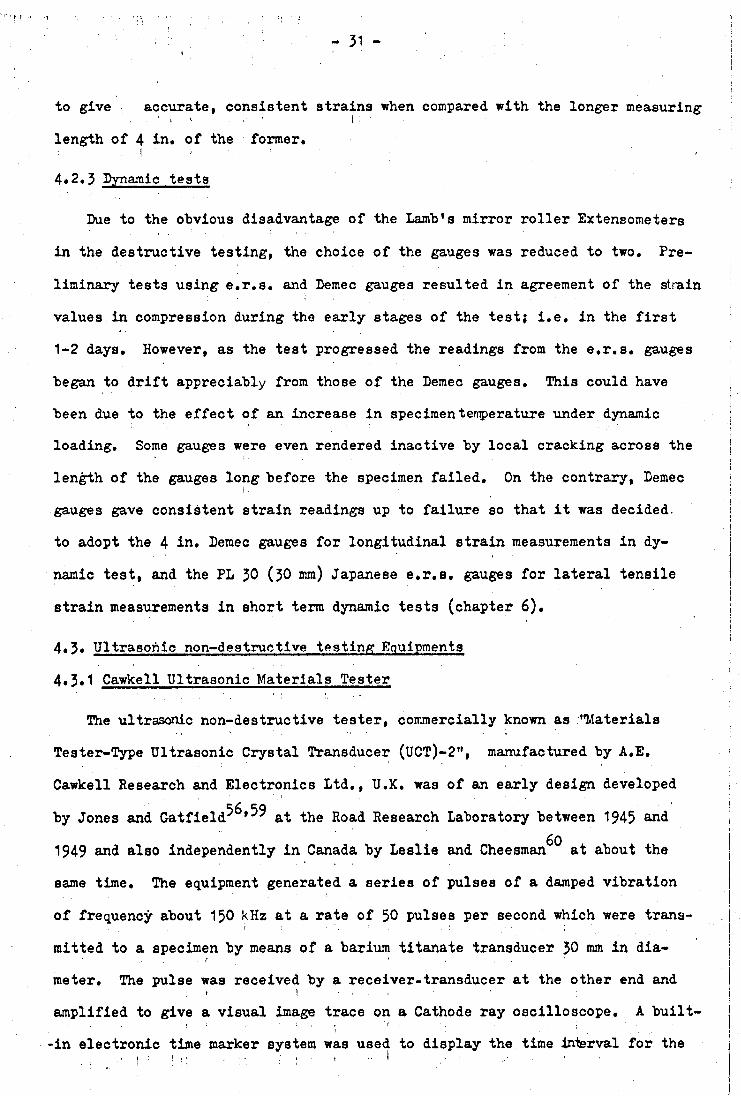
4«2.3 Dynamic tests
Due to the obvious disadvantage of the Lamb's mirror roller Extensometers
in the destructive testing, the choice of the gauges was reduced to two. Pre
liminary tests using e.r.s. and Demec gauges resulted in agreement of the strain
values in compression during the early stages of the test; i.e. in the first
1-2 days. However, as the test progressed the readings from the e.r.s. gauges
began to drift appreciably from those of the Demec gauges. This could have
been due to the effect of an increase in specimen temperature under dynamic
loading. Some gauges were even rendered inactive by local cracking across the
length of the gauges long before the specimen failed. On the contrary, Demecigauges gave consistent strain readings up to failure so that it was decided,
to adopt the 4 in. Demec gauges for longitudinal strain measurements in dy
namic test, and the PL 30 (30 mm) Japanese e.r.s. gauges for lateral tensile
strain measurements in short term dynamic tests (chapter 6).
4.3« Ultrasonic non-destructive testing Equipments
4,3.1 Cawkell Ultrasonic Materials Tester
The ultrasonic non-destructive tester, commercially known as "Materials
Tester-Type Ultrasonic Crystal Transducer (UCT)-2", manufactured by A.E.
Cawkell Research and Electronics Ltd., U.K. was of an early design developed
by Jones and Gatfield^’” at the Road Research Laboratory between 1945 and
1949 and also independently in Canada by Leslie and Cheesman^0 at about the
same time. The equipment generated a series of pulses of a damped vibration
of frequency about 150 kHz at a rate of 50 pulses per second which were trans
mitted to a specimen by means of a barium titanate transducer 30 mm in dia
meter. The pulse was received by a receiver-transducer at the other end andi )amplified to give a visual image trace on a Cathode ray oscilloscope. A built-, . . . , ¡. : i .-in electronic time marker system was used to display the time interval for the
- 32 -
ij!
measurement of the time in microseconds for the wave to transverse the specimen.i : .... i ■Depending on the experience of the operator, it was possible to read the equip-j . . ‘ment to an accuracy of i 0.1 microseconds.
For an efficient transmission of the pulse from the transducer to the speci
men, it is essential to provide a proper contact between the transducer faces
and the surfaces of the specimen. To achieve this, a small holding frame was
developed using two 40x150x12 mm aluminium plates and two 6 mm mild steel bars
300 mm long threaded at the ends. The transducers were held against the opposite
faces of the specimen by thumbscrews and washers, and isolated from the frame
by 2 rubber washers. An application of thin layers of silicone grease between
the transducer faces and the surfaces of the specimen ensured a sharp and steady
pulse signal during the tests with minimum loss of energy at the interfaces.
A typical arrangement of the Cawkell ultrasonic tester with transducers, hold
ing frame and the specimen is shown in plate 3«
4.3.2 Portable Ultrasonic Non-Destructive Digital Indicating
Tester. (PUNDIT)
The PUNDIT non-destructive tester, manufactured by C.N.S. Instruments Ltd.,
London,U.K. was of a new design employing up-to-date integrated circuits and
silicon semiconductors throughout. The equipment consisted of a pulse recur- '
rence generator, set reference delay, receiver amplifier, timing pulse oscillator,
gateAdecade units, and two piezoelectric crystals. A simplified system dia-' i ■ .
gram is shown in Fig. 4.4 and a typical testing arrangement of the equipment
with the transducers is also shown in Plate 2. . j
Both transducers consisted of lead zirconate titanate (PZT4) ceramic piezo- :j
electric elements mounted in stainless steel case 50 mm in diameter and 42 mm ||
in depth. The pulse generator generated a peak voltage of 800 Volts operating
for 2 microsecs to the transmitting transducer which by virtue of its piezo-
jelectric property vibrated mechanically at its resonant frequency equal to 50 j
KHz with a pulse repetition frequency of 10 pulses per seconds. After trans- [.

- 3 3 -
mission through the specimen under test the ultrasonic pulse was converted
to an electrical signal in the receiving transducer, amplified and processed
through the gate control unit and the transmission time taken by the pulse• i.
to pass through the specimen was displayed in the form of 3 digits on three
'in - line' numerical indicator tubes. Two ranges of time measurement were
available on the instrument, namely -
a) 0.5 to 499*5 microsecs in units of 6.5 microseconds.
b) 1 to 999 microsecs in units of 1 microsecond.
The accuracy of transit time measurement was generally not less than the
direct reading values indicated on the display. When a good transducer coupling
was made by means of silicone grease with the surface of the material tested
and the pulses were not unduly attenuated, the last digit would either remain
at a steady value or would oscillate between two adjacent values. In the latter
case, the mean reading was used enabling transmission times to be read to the
nearest 0.25 microsecs for the 0.5 microsec range. The manufacturers claimed
an accuracy of not less than t 1 °/o for very good surface coupling conditions
and a minimum path length of 3 in. in testing medium to high strength concrete.
4.3*3 Experimental techniques
With the Cawkell ultrasonic material tester, the recommended method of
setting the start of the return pulse to the left hand edge of the appropriate 59 ' ’time marker ' was used to obtain the correct alignment. Much care was needed,
however, to read the onset of the return pulse on the cathode ray oscilloscope,
as it very much depended on personal judgement.
The Pundit ultrasonic tester was far easier to operate. A one to four
microsecond variable delay control was incorporated to set the zero of the in
strument each time it was used. The zero was likely to change particularly
when different types of transducers were used and the delay control would enable
the instrument to be adjusted to read correctly (the design of the receiving

- 3 4 -
amplifier unit of the Pundit allowed it to be used with transducers over a fre
quency range from 20.kHz to 250kHz; normally a frequency of 50 kHz was used). The
variable delay was used in conjunction with a standard reference bar supplied
with the instrument and had an accurately known transmission time of about 50
microseconds. This time was affected by the ambient temperature and the correct
time was given against a built-in thermometer on the reference bar. Due to the
easier reading, the holding frame was discarded and the transducers were held
firmly against the opposite faces of the specimen by hands.
Pilot tests were conducted to assess the relative merits of the two testers
in measuring the transmission time of a pulse through control cubes and prisms
under both static and dynamic loadings. In General, the readings of the trans
mission time were in agreement, the difference being only 0.5-1?». However,
with the Cawkell tester, the initial no-load pulse velocity measurements were
generally slightly higher than those indicated by the Pundit. This was probably
due to the differing sizes of the transducer crystals, differences in the spread
of the pulses, the differences in accuracy, and the higher frequency of the
Cawkell crystals. It had,been observed by Shah and Chandra that the initial
no-load velocity of the ultrasonic pulse increases with an increasing frequency
of the crystal. It should be mentioned that Leslie and Chessman^ concluded
that the pulse velocity was independent of the frequency. However, their range
of frequencies (10 to 50 kHz) was much smaller than that used by Shah and Chandra
(25 to 2250 kHz).
It was not possible to measure the transmission time during the dynamic tests
by the Cawkell instrument because it was impossible to read the onset of the
return pulse due to its fluctuating patterns. In contrast, the Pundit instrum
ent gave a reliable, accurate, consistent reading during the dynamic tests from
the no-load measurement to shortly before failure. It was, therefore, decided
to adopt the Pundit tester for the measurements of ultrasonic pulse velocity
in static and dynamic tests on the ground that it gave accurate, consistent
and most important, reproducable readings. It was easier to operate, independ

- 35 -
ent of personal judgement, portable, and could be used in continuous monitoring f: I
of pulse velocity without interfering with the tests. !
4.4 Planning of test programmes
At present, there are no special standards laid down for the fatigue test
ing of concrete, but it would.appear reasonable to adopt the available standards
for the fatigue testing ofmetafl’ as a general guild in planning.
As described in Section 1.6 (p.5 ) a number of variables which were known I;
to affect the fatigue properties of concrete were maintained constant through- |j. ! i ■ ■ - i . r
out the tests. Even when these conditions are fulfilled, there remain a number
of unknown and uncontrollable factors which produce a large scatter in the jj
fatigue life, even of seemingly identical specimens. In the past, this scatter jj
in fatigue life was not regarded as a problem and only a few specimens were j
used to determine the fatigue life, or the relation between load (stress level)
and life, as a result of which the validity of the conclusions was disputable.
It is now generally accepted that scatter is an inherent feature of the fatiguetcharacteristics of concrete, so that a large number of specimens is required
to obtain correct information on the fatigue life. Tests must, therefore, be
planned so that the errors arising from the uncontrollable factors are as small
as possible and the data must be statistically interpreted in order to draw
correct conclusions.
Findley^'** section 5) 8Uggested that at least ten specimens be tested for
an S-N diagram, but that a larger number of speciems (20 to 50) would be desir
able to establish the S-N diagram accurately and to indicate the variability j.
of the material. Weibull 31 experimentally verified that, even if the num- j
bei of specimens tested had a self-evident iJifluence on the accuracy of the |
parameters computed from the observations, other factors might be of equal J
importance. He proposed that at least six specimens should be tested at any i:
stress level or 20-30 specimens altogether in order to establish an acceptable
S-N diagram. The efficiency of a test series in this respect depends upon the !,
choice of the stress levels, on the testing machine and possibly on other 1

- 3 6 -
factors. Accordingly, in this study, specimens were assigned from each batch
at random for control static tests and fatigue test groups, the number depend-1 -
ing upon the objective of the test.. !
4.5 Fatigue testing methods.
The simplest form of fatigue loading is obtained by applying a fluctuating
stress of a constant amplitude to the specimen until total failure occurs.
Different specimens of the test series may be subjected to different stress
amplitudes, but for each individual specimen the amplitude will never be varied.
This type of fatigue testing is called a constant-amplitude test.4.5*1 Constant-amplitude tests
Depending upon the choice of stress levels, constant-amplitude tests may
be classified into three categories^ providing that the rate of loading is not
more than 70 N/mm/s which is the case of impact loading.! ; i .■ . : ■ t ;(1) The routine or normal fatigue test, where applied stresses are
chosen in such a way that all specimens are expected to fail after a moderatet 7number of cycles, say 10 to 10; A few run-outs, although not intended, may
occur.
(2) The short-life or low cycling fatigue test, where the maximum
stress levels are usually between 85-95$ of the static ultimate strength. All
specimens are expected to fail at less than 1000 cycles and some may even fail
statically on the first application of the load.
(3) The long-life test where stress cycles are near the anticipated6 Tfatigue strength for a given number of cycles, usually between 10 and 10' and
a number of the specimens (run-outs) do not fail.
The short-life test and the long-life test were usually performed to supple
ment the information obtained from the normal fatigue test. For obvious reasons,
constant-amplitude, normal fatigue test to failure were used in the second part
of this investigation.
- 37 -
4.5*2 Variable-amplitude tests
Complicated forms of loading would be required in order to simulate the
stresses to which concrete is subjected in actual service and in order to in
vestigate the laws relating to the accumulation of fatigue damage in a specimen
subject to fluctuating stresses of different amplitudes, the programmes of load
ing must be simplified. These tests termed variable-amplitude tests comprise
the third part of the investigation. In these tests only two stress levels
were used but with systematically varying sequences of loading. The cumulative
damage tests will be dealt with in detail in chapter 8-10.
4.6.General Scheme of tests
It was necessary to set out a general scheme for the investigation, compris
ing the different series of tests to achieve the different objectives detailed
in section 1.5 (p.3 )• Table 4.1 presents a summary of each series showing
the number of specimens used for control and fatigue tests under both constant
and varying amplitude loading together with a short description of the objective
of the investigation.
CHAPTER 5
ANALYSIS OF RESULTS: FATIGUE STRENGTH
5#1 General
The experimental programme for the phenomenological studies, consisted of
static control tests and normal fatigue tests as defined in Section 4.5*1-(l)»
p.56 . The former were necessary so that an estimate of the ultimate static
compressive strength of the concrete in each hatch could he obtained on which
basis the specimens were assigned to different- stress levels expressed on per
centage of the static strength,
5.2 Testing procedures
5*2.1 Static tests.
For each hatch, 3 sets of 4 control cubes selected at random were tested
respectively at 28 days, at the commencement and at the completion of the test
at the standard rate of loading specified in BS 1881:1970 (0.25 N/mm /sec) in
the 300 Tonne Denison compression testing machine. The results of the static
tests made on 102mm cubes are shown in Table 5*1«
For an estimate of the compressive strength of concrete used in each batch
3 prisms were selected at random and loaded to failure at a uniform rate in
the Losenhausenwerk universal testing machine which was also used for the
fatigue tests and the mean value of their results was taken as the basis for
fixing the stress levels for the specimens to be tested in fatigue. One prism
was tested statically at the completion of the fatigue tests as a check on
the strength gain during the tests. The results of the static tests on 76x76x
203mm prisms are shown in Table 5*2
The summary of the average of the ultimate static strength at different
ages of the control cubes and the prisms, average of with-in batch standard
deviation and coefficient of variation are shown in Table 5«3
The mean ratio of prism to cube strength at the time of the commencement
of the tests was 0.72 which was not in agreement with the higher values of
0.77 of Muir ' and 0.79 of Raju. This was probably due to their method of
not breaking the bond between the mild steel loading plates and the high alumina
cement caps, whereas in the present tests, the loading plates were detached
prior to testing, and placed in position when setting up for the tests.
5*2.2 Fatigue tests
Four prisms from each batch were tested in fatigue at different stress levels.
The choice of stress levels depended upon the purpose for which the data were
required. In the normal fatigue tests in which concrete specimens were expected x 7to fail at 10 to 10 cycles, the maximum stress levels employed in the investi
gation varied from 60-85 percent with an increment of 5 percent. A nominal
stress of 1.8 to 2.0 N/mm corresponding to a minimum stress level of 5 to 6
percent was used in the fatigue tests throughout, in order to avoid impact load
ing on the specimen during cyclic loadings. A typical arrangement for both
static and fatigue tests is shown in plate 2.
One preliminary static load cycle was performed on the specimen with the
maximum load corresponding to the maximum stress level in the fatigue tests to
determine the modulus and area of the hysteresis loop. Thereafter strain measure
ments were made at specified intervals during thefatigue test until the end of
the test or shortly prior to failure of the specimen. The lower load was then
applied and the pulsator was set to the constant frequency of 190 cycles per
minute (3.167Hz). Because of the nature of the machine the amplitude of the
load cycle could only be gradually increased to the maximum load value, the
process taking about 3-400 cycles, the number of cycles was counted from the
point at which the maximum load value was reached.
The specimens which did not fail in fatigue after 3 x 10^ cycles were con
sidered as ’run-out’ and were not included in the analysis. These were subse
quently loaded statically to failure, A total of 44 prisms comprising series

- 4 0 -
A were tested in the first phase of the investigation and the summary of the
results of the fatigue tests is shown in Table 5*4.
5.3. Necessity for statistical analysis of fatigue test data
An examination of the results of fatigue tests presented in Table 5*4 clearly28indicates the nonreproducable aspects of fatigue. Raju observed that with
ledcarefully controlAconditions in fatigue testing of plain concrete in compress
ion, a range of between 3 to 1 and 38 to 1 in the number of cycles to failure
at the same stress-level was not unusual. The summary of the range in thev
number of cycles to failure at each stress level in the work is shown in Table
5.5 below;
TABLE 5.5 SUMMARY OP RANGE OP NO. OP CYCLES TO FAILURE
Range of nò of cycles to failure
Stress levelB in percent85 80 75 70 65
Minimum 3*1. 4.6:1 3.6:1 1.06:1 2.63:1
Maximum 13*1 87:1 31:1 6.14:1 5.37*1
With the exception of a maximum of 87:1 at 80$ stress level, the variation
was within 30:1 in other stress levels. It was, therefore, obvious that the
approach to the scatter of test results was bound to affect seriously the
validity of conclusions drawn from the normal fatigue tests.
In view of the widely varying fatigue characterisics observed in the tests,
the present fatigue data have been analysed on a statistical basis as recomm
ended by B.S. 3518} Part 5*1986, to improve the validity of the conclusions
drawn from them.
5.4 Analysis of test results.
The fatigue strength characteristic of plain concrete subjected to repeated
compressive stress of constant amplitude is normally represented by the S-N
diagram, in which N the number of cycles to failure is plotted, usually on
a logarithmic scale, against S the stress level, and since the relationship

- 41
of S to log N is sensibly linear up to at least 10 million cycles, a linear
regression analysis may be employed.
One of the fundamental assumptions of linear regression analysis is that
the dependent variable,{-in this case the fatigue life) has approximately the
same (normal) distribution for every value of the independent variable, (the
stress level). The shape of the frequency distribution of fatigue life at any
stress level cannot be accurately determined from a small number of tests but
can only be estimated'from*the results of previous investigations. No exact
data is available for the character of this distribution of concrete mainly65due to the great number of specimens required.for tests. Weibull ■ argued
that even the testing of 100 specimens at each stress level could not yield
sufficient information for the distribution to be accurately determined, for i
which several thousand specimens might be needed.
The cummulative frequency distribution for any particular investigation28will approximately reveal, the shape of the distribution diagram. Raju
found that the distribution of fatigue life of plain concrete specimens at
a given stress level was skewed suggesting the log normal relationship.
Consequently, in the analysis of the fatigue data in this study, the fit of
a log normal distribution for fatigue life was investigated.
The fatigue life of the specimens tested at a give stress level was analysed
by ranking the specimens in the order of N and the probability of failure *p»
at a smaller number of cycles than each value of "N, was calculated by dividing
the rank of each specimen 'to' by (n+1), where ' n’ was the total number of
specimens tested at a given value of S. The calculated value of *P* with the
ranking of the specimens are shown in Table 5*6 , In calculating 'P' the reason
for dividing by (n+1), rather than by 'n' is to avoid obtaining a probability
of failure of 1.0 for the specimen having the greatest fatigue life in the
group. The probability,that all future specimens will fail at this same number
of cycles is not 1.0 however closely it may approach the limit. The ratio of

42-
m/(n+l) appears to give the best estimate of 'P* as proposed by Weibull^ and67 28 50 65 68Gumbel , and had been used by several other investigators,; ¡ i . , . ; i
For each stress level the logarithm of the test value of fatigue life was
plotted against the cumulative frequency of the probability of failure. Fig,
5.1 shows the fitted straight lines for different stress levels. From the
statistics in Table it is evident that the test values of fatigue life at
lower stress levels fit the log normal distribution better than those at higherr , (
stress levels, and with less scatter.
This analysis clearly shows that the distribution of fatigue life of con
crete specimens tested at stress levels from 65 to 85 percent can be reasonably
approximated to log normal,
5.4.1 S-N Diagram
The plot of the fatigue life test data suggested a straight line relation
ship between the two variables which had to be established by a linear regression Ï
analysis. In this analysis the stress level S was taken as the independent
variable and the logarithm of the fatigue life log N as the dependent variable.
The latter may be assumed to be normally distributed as has been discussed in
Section 5»3«
The line of regression of the stress level S upon Log N is shown in Fig 5»2.
This line had a correlation coefficient of 0.940788 which was significant at a level of 0.1 percent. The statistics of the results of the regression analy
sis are presented in Table 5*8. Run-out specimens were excluded from these com- j
putations.
5.4.1*1 Discussion of results.
The S-N diagram which is statistically reliable only between the stress
levels of 65 and 85 percent, indicates a fatigue strength of 62.6 percent for ¡I6 7 . j2 x10 cycles and, when extrapolated, 58.6 percent for 10' cycles. These
'27 29 Î!values are comparable to those of earlier investigations by Muir and Raju ' jy : ' ' fi
È

- 4 3 -
which are summarized in table 5*9*
TABLE 3.9 FATIGUE OF HIGH-STRENGTH CONCRETE IN COMPRESSION
Static Fatigue strength ratio or stress levelSOURCE Strength
( N/mm ](S) in percent 62 x 10 cycles 10 x 10“ cycles
muir 39-63 66 63" (Corrected by Goodman diagram) 39-63 61 57
RAJU 40 62 58JINAWATH 36 63 59
From Table 5*9» it appears that the fatigue strength ratio slightly-
decreased as the static strength increased. However, the decrease of the
fatigue strength ratio with the increase in static strength appeared to be
too small to be of practical importance.
The S-N diagram also indicated the high sensitivity of fatigue life to
small changes in the maximum stress levels. A decrease in stress level of
only 6 percent resulted in an increase in the fatigue life, from about 95»000
cycles to 1.1 x 10^cycles.
5.4*2 S-N-P diagrams
The S-N diagrams discussed in Section 5.4.1 provide at best an approxi
mate indication of the trend of the relationship between the variables,
stress level and fatigue life within an undefined broad range of probability
values. This conventional representation of fatigue tests neglected an im
portant characteristic aspect of all fatigue data, namely their scatter.28 65In view of this feature, it is now accepted by investigators *' * 3 that
the S-N diagram should be extended to include the probability of failure P
as a third variable, enabling the number of cycles at a given stress level
to be determined for a chosen probability of failure.
5.4.2.1 S-N-P diagram from McCall’s Model
McCall^0 in 1958 published the first report in which the dimension of
1
- 44 -
eprobability was added to the fatigue studies of concrete. The mathematical
model proposed to establish a relationship between the Stress level S, the
fatigue life N and the probability of failure P can be represented as:
I . 10- a s W N ) ° .........(1)
■Where L - Probability of a specimen surviving 'N' repetitions of load.
“ (1-P)* where p - Probability of failure ■ m/(n+l)
S» Ratio of the maximum repeated stress to static strength.
a,b,and c are experimental constants
Hence, log (-log L) » log a + b log S + c log log N ........ (2)
For ease in computation, this was used in the linear form,
Z - A + BX + CY ........ (3)
Where Z - log (log N){ X - log S; Y - log (-log L){
A »-log a ; B ■-b and C -c c c
The fit of the present test data to the model was investigated by con
ducting a multiple regression analysis with 'X' and 'Y' as independent
variables and 'Z' as a dependent variable. The constants determined by the
regression analysis were,
z - 6.933756 - 3.350850X + 0»119501Y (4)
and 10-9.49 * 10“59S28,04(log N)8,568 (5)
These two equations correspond to Eq(3) and (1) respectively. A
measure of the degree of correlation of the variables S, N, and L was obtain
ed by calculating the multiple correlation coefficient which had a value of
0.981468 while the standard error of estimate was 0.0293957« The statistics
of the results of the regression analysis are presented in Table 5*10«
3.4.2.2 Discussion. ' 1 ' • . i ! '
The test results are compared with those predicted by the model in Fig.

- 4 5 -
5.3« While the test results compare favourably with the model prediction
for a stress level of 75 percent, there are large deviations for the in
creasing and decreasing stress levels. In McCalls model dY/dZ is constant
so that the graphical representation of Y against Z for discrete values of
S results in a series of parallel straight lines representing the various
stress levels. The fatigue test data indicate that the range of scatter of
log N at higher stress levels is greater than that at the lower stress levels
(Table 5*5* p.40 ). A close examination of the test data plotted in Fig. 5*3
suggests that the slope dY/dZ of the lines representing the various stress
levels should decrease with the increase in stress level and vise versa.
5.4.5-S-N-P diagram from Modified McCall's Model*^
In order to accommodate the phenomenon of scatter associated with any
stress level as indicated by the fatigue test data, it was necessary to modify28the logarithmic form of the model suggested by McCall. Raju proposed a form
as follows:
Z - A + BX + CY + DXY ........ (6)
where the symbols had the same meaning as in the previous section with 1D'
as an additional constant. The last factor ' DXY' represented the variation
in the scatter. The fit of this equation to the present fatigue data was
investigated and the constants evaluated by a multiple regression analysis
of the fatigue data were found to be :
A * 5.637252, B - -2.659922, C - -2.151478 and D - 1.210185
The modified form is compared with the test data in Fig 5.4» and is found
to give a somewhat better fit to the experimental results as indicated by the
multiple correlation coefficient which improved from 0.981468 to 0.989958,
while the standard error of estimate decreased from 0.0294 to 0,0220. • The% • . X .
statistics of the multiple regression analysis are shown in Table 5.M .
5.4.4. S-N-P diagram from the cumulative normal distribution function
An alternative approach was made to derive the S-N-P diagrams by using
the’conventional S-N relation discussed in Section 5*4.1 and the cumulative
normal distribution function^ The regression equation,
log N - 17.422118-0.177616S
can be used to predict the fatigue life ' N’ for any given stress level * S*
with a 50 percent probability as it is derived from a least square analysis.
The relationship of S,N and P is given by the cumulative normal distribution
function as :x
P - 1 . { expf-Cx^^AS^tiX ........ (7)s J W T " )» - oc
Where: P - Probability that failure will occur at a number of cycles equal
to or less than N.
X - log N
yU *» ( 1 7 .422118-0.177616s) S ■« Maximum stress level ;AS ■ Estimate of the standard deviation of the population found to be
0.461153 (Table 5.8)
Eq (7) can be used in the simplified form for computation as follows:
lo g N ■ Ks . . . . . . . . . . . . . . . . ( 8 .)The estimate of fatigue life at a given stress level for the required
probability of failure can be made by using suitable values of 'K' from a70standard statistical table. The S-N-P diagrams shown in Fig 5.5 were
derived in this manner for probabilities ranging from 0.01 to 0.99 and stress
levels from 65 to 85 percent using the following values of K:-
K
-2.526
-1,645
-1.282 -0.524
28
P
0.010.05
0.10
0.30
0.50 0.0
- 47 -
0.70 +0.524
0.90 +1.282
0.95 +1.645
0.99 +2.J26
5.5 Comparison of S-N-P diagrams and recommendations
The comparisons of the three sets of S-N-P diagrams derived from McCall's
model, the modified McCalls's model and from the cumulative normal distribution
function representing probabilities of failure range from 0.05 to 0.95 and
0.01 and 0.99 are shown in Pig 5.6 and 5*7 respectively. The selection of
any set of diagrams for estimation of fatigue life depends mainly on the exact
nature of the variation of scatter associated with the stress level; this can
not be accurately done on the information gained from a small number of tests.
Diverse trends had been observed by different investigators but, again, all71involved limited number of tests. Venuti in an investigation of fatigue strength
of prestressed concrete beams observed that the variability of logarithmic29fatigue life increased with the increase of stress level. The results of Raju,
Antrim and Mclaughlin? showed similar trends in the tests of high strength con
crete, ordinary and air-entrained concrete in compression, while the fatigue
tests of Ople and Hulsbos^ indicated the reverse trend of decreasing variability
in the fatigue life with the increase in stress level. Little evidence is avail
able from other sources to explain this anomaly; therefore, it is important that
the comparison of the results of previous tests carried out under widely diff-
erent conditions be made with caution. Raju' ' suggested that the S-N-P diagrams
derived from the cumulative normal distribution function appeared to be generally
valid on the ground that they covered the scatter of test results reasonably
well at stress levels between 65 and. 85 percent. However, his conclusion came
from a graph in which several'groups of previous test results were plotted against
the probability limits obtained from the analysis of his own test data. Act
ually every group of test results will have different probability limits, and
▼
should he analysed individually, which is beyond the scope of this investi
gation. Nevertheless, this work provided a good comparison with the other
available evidence and showed clearly the difficult task involved.
As discussed in Section 5.4.P-42, the results of the present investigation showed the trend to wider scatter at higher stress levels. In fig. 5.6 and
particularly fig. 5.7» this was in agreement with the diagrams derived from
the modified McCall's model in which the scatter band at any stress level
representing the range of variability of fatigue life increased with an in
crease in stress level, whereas in McCall's model the scatter band increased
with a decrease in stress level. The diagrams derived from the cumulative
normal distribution function show a uniform scatter at all stress levels and
alone of the three diagrams covered all the test resultsin the present study.
In view of the high variability of fatigue life and in the absence of
any reliable data regarding the scatter, it is recommended that prediction of
fatigue life should be made by the S-N-P diagrams derived from the cumulative
normal distribution function based on constant scatter at all stress level.
5.6 Conclusions
1) The fatigue life distribution of plain concrete specimens at a given
stress level is approximately log normal.
2) A satisfactory relationship between the two variables, predicted; i .fatigue life and maximum stress level can be achieved by a linear regression
analysis.
3) In an estimation of the fatigue life, the probability of failure
should be included as an additional variable in the light of the high variabil-• 4 • * -ity inherant in the fatigue test data.
4) Pending the availability of more extensive test results regarding the■ - l . ' i » ' .scatter, the S-N-P diagrams derived from the cumulative normal distribution
■< tfunction using the conventional S-N diagram, may be accepted for stress levels
between 65 and 85 percent.
- 4 8 -
CHAPTER SIX
ANALYSIS OP RESULTS: OTHER EFFECTS
6.1 General
As has been described earlier in Chapter 2, the fatigue behaviour
of concrete is related to some of its other characteristics which undergo
changes when a stress is applied. The progressive changes of these
characteristics with time, under the effect of a repeated cyclic stress,
may give some further indication of the degree of accumulation of fatigue
damage.
6.2 Test procedure
For a detailed examination of the relationship between these changes
and the fatigue life, the first three of the four prisms comprising the
series B, were tested at maximum stress levels, of 80, 75 and 70 percent of
ultimate static strength with a lower stress of 5 per cent. The last prism
in the series was used as a pilot specimen, tested Under variable amplitude
cyclic loading, (the results of which will be discussed in detail in Chapters
9 - 10). These tests in series B were conducted in addition to the tests
in series A with the purpose of gathering more information especially in
regard to lateral strains. The average static strength of the batch of
concrete is shown in Table 6.1. A static loading cycle was conducted
before the start of the fatigue test with strain measurements on all four
sides of the specimens for regular increments of load, up to a maximum
corresponding to the maximum stress level assigned to the specimens.
Thereafter a static load cycle was applied at suitable intervals by
interrupting the fatigue test, and the stress-strain curves shown in Figures
6.1 - 6.5 were obtained.
6.3 Shanes of stress-strain curves
The first stress-strain branch on loading in compression is convex
towards the stress axis. This is due to the development of bond cracksat
between matrix and aggregate oriented parallel to the direction of73application of load and is absent in neat cement paste. The effect is
confirmed by the decrease in pulse velocity in the lateral direction ■
perpendicular to the loading axis (Fig. 6.1) to which no corresponding62decrease has been observed in neat cement specimens. After a few cycles
of loading the loading branch becomes straight and gradually reverses itsdScurvature (i.e. concave towards the stress axis), the slope (— ) becoming
steeper in the upper ranges of stress. (Figs, 6.2 - 6.4). This has been
similarly reported by several investigators * 7 and indeed these changes
were observed in the earliest fatigue studies.^4>15 The reversal of
curvature is attributed by Mehmel^ (confirmed by Bennett and Raju)2'* to
the existence and development of bond cracks perpendicular to the direction
of loading} their closing leads to a progressive increase in stiffness
(termed low-strain stiffness) as the load is increased. At the same time
the pulse velocity measurement in the lateral direction which will be
discussed in Chapter 7» indicated that during this closing stage of
horizontally oriented cracks, the existing vertically oriented cracks were
also widening under the influence of the load (Fig, 6.1). When the
horizontal cracks were closed this tended to arrest the widening of the
vertical cracks hence d S/d£ became steeper as the load increased.
Provided that the stress level was less than about 85$ there was no further
cracking in the direction parallel to the load at least not during the statio
loading. Mehmel also found that there was no low-strain stiffness effect
in neat cement. The second reversal of the stress-strain loading branch
to become S-shaped when approaching failure, which was first reported byII 1C
Van Ornum 7 was also observed to occur in the present work for the, 1
highly-stressed specimens (Figs. 6.1, 6.2). From Fig. 6.1, it can be
observed that this is due to the development of more vertically oriented< • : ' tcracks as indirectly indicated by further decrease in pulse velocity in the
- 51 -
lateral direction after the existing vertically oriented cracks have been
arrested. 1
6.4 Hysteresis
The interest in the area enclosed by the loading and unloading
branches of the stress-strain curve for a material (hysteresis loop) arises
from the fact that it represents the energy absorbed within the material
per cycle of load and is manifested by a rise in temperature of the specimen
due to the internal friction.4 Since an application of cyclic stress
always leads to some inelastic deformation resulting from the internal
structural modification, the change in the area of the subsequent hysteresis
loops as compared with the first loop will represent the reduction in the rate
of absorption of energy. The irreversible deformation involved may be
either in the form of crack initiation or irreversible deformation without52a loss of continuity, such as a viscous flow.
Concrete exhibits a large hysteresis area on the first loading cycle
due to the high degree of bond microcracking occurring in this cycle .(Figs.
6.2 - 6.5). Subsequent cyclic loading results in a reduction in area of
the hysteresis loop. The typical changes in the area with cycles of repeated
load, expressed as a percentage of the area of the first loop, are shown
in Fig. 6.6. The variation of the hysteresis area with the fraction of
total fatigue life of the specimens (as denoted by the cycle ratio n/N,
where n • number of applied loading cycles, N - number of loading cycles
at failure) is also shown in Fig. 6.7. From fig. 6.6, it will be observed
that after a few hundred cycles of stress, the hysteresis area was reduced
to about 407.of the original area. The study of Fig. 6.7 will reveal that
this change occurred at as early as 1 percent of the total life. From the
same graph, it can be said that the changes in the hysteresis area consist
of 3 stages, namely rapid decrease of the area as early as n/N - 1 to 10fo (bond microcracking formation - stage 1), followed by a uniform decrease
- 5 2 -
from 10 to 85$ of the total life (manifested by a rise in temperature
coupled with a slow and stable propagation of one or more cracks'^ and
some non-elastic deformation without disruption of continuity of the
material7 - stage 2). Finally, when approaching failure, the hysteresis
area shows a renewed increase due to the extension of microcracking into the 29matrix 7 and hence increased the energy absorption (stage 5). It can also
be concluded that the lower the maximum stress levels the greater the
decrease of the hysteresis area (Fig. 6.7).
6.5 Total strain
Total strain (&) is defined as the sura of the elastic strain,
(the instantaneously recoverable part of the deformation) and the inelastic
strain, £-ine]_» (the delayed recoverable and the irrecoverable part of the
deformation). The variation of the total strain with the number of loading
cycles and with the cycle ratio is shown in Figs. 6.8 - 6.11 for specimens
tested at 80$, 75$» 70$; and 65$ respectively. Generally it can be said
that the total strain gradually increased with increased cycles of load,
the rapid increase observed as failure approached being exaggerated by the
logarithmic scale of the number of cycles (Fig. 6.8 and Fig.6.10). From
the study of the curves in Figs. 6.9 and 6.11,"it can be observed that the
variation of £ with n/N shows the same trend as the changes in the
hysteresis area although of a different order, namely a rapid increase from
0 to about 12$ of the total life, a uniform increase from 12$ to about 90$
of the total life and a slight increase in the rate (d£/d(j|)) from about
90$ to failure. One significant observation which can be derived is that
the amount of the total strain is larger the lower the stress levels (Fig.
6.9 and 6.11). This is probably due to the smaller number of loading
cycles which the highly stressed specimens can sustain before failure as
compared with the low stressed specimens. .
- 53 -
6.6 Elastic strain
Elastic strain, the instantaneously recoverable part of the
deformation, is defined here as the difference between the strain at maximum
stress (total strain) and that at zero stress observed on the unloading
branch of a stress-strain cycle. The typical changes observed in the
elastic strains with the number of loading cycles and with the cycle ratio
of specimens subjected to different stress levels are shown in Fig3. 6.12
and 6.13 respectively. From Fig. 6.12, it is observed that the elastic
strain increased with the number of cycles of load. The strain data plotted
against the cycle ratio (Fig. 6.13) again shows the same trend as the changes
in the total strain, namely a rapid increase from 0 to 10$ of the total life,
a uniform increase from 10 to 85$ of the total life and a slight increase
in the rate (d£e^/d(n/N)) from 85$ to failure. However, the specimen which
was tested at 65$ stress level did not show any sign of rapid increase at
as late as 98$ of the total life. From Fig. 6.13, the results seem to
indicate that the higher the stress level the higher the elastic strain at28failure. This observation is contrary to those of Raju who concluded that
there seemed to be a limiting value of elastic strain near fatigue failure
which was independent of the stress level and hence the number of cycles to
failure. It has been shown that there is a slight increase in both the
total strain and in the elastic strain at about 90$ of the total life to
failure. This probably explains the contradiction between the results of
Raju and of the present tests. Owing to the limited data available and
the absence of an instrument which could record the strain history up to
failure without interrupting the tests the difference cannot be explained
at present.
6.7 Inelastic strain
The component of strain which is not immediately recoverable at any
stage during the course of the fatigue test is here referred to as inelastic
- 5 4 -
strain. This is normally made up of the strain due to viscous flow and
microcracks, which is irrecoverable, and that due to delayed elasticity,
recoverable over a period of time. 1 ^ Figs. 6.14 and 6.15 show the
typical variation of the inelastic strain with the number of loading cycles
and with the cycle ratio of specimens subjected to different stress levels.
It can be observed that the inelastic strain at the first cycle of loading
was larger the greater the stress levels and the strain increased with the
number of cycles of load (Fig. 6.14). Plots of the inelastic strain with
the cycle ratio (Fig. 6.15) with the exception of the specimen which was
tested at 80$, suggested that there was a gradual increase starting from
the first cycle of loading rather than a marked increase in the early
fraction of the total life. The strain showed a greater rate of increase
at about 75 to 85i° of the total life to failure. For the specimen which
was tested at 65f° stress level, the strain showed a marked increase from 0to about 15$ of the total life followed by a uniform increase up to S&fo ofthe total life without showing any sign of rapid increase towards the failure.
The plot of the ratio of the inelastic to elastic strain against the cycle
ratio indicates that the increase in the inelastic strain component is
considerably greater than the elastic component so that the ratio always
increases with the total fatigue life which confirms the observations made
by Mehmel ' and Raju. One significant fact emerging from Figs. 6.14 -6.15 is that in general the lower the stress level the higher the inelasticstrain. It is interesting to note that from the measurements of pulse
velocity in the lateral direction (which will be discussed in Chapter 7)
it will be seen that the lower the stress level the greater the percentage
decrease of the original pulse velocity. In all the specimens which were
tested at a stress level of less than 60°/°t almost all the inelastic strain; 75
was due to the combined effect of viscous flow and microcracking, but the
reduction of pulse velocity is entirely due to microcracking. This,
- 55 -
therefore, indicates that the component of inelastic strain due to micro
cracking is predominant.
6.8 Modulus of elasticity
The secant modulus of elasticity at various stages in the fatigue
tests was calculated using the elastic strain data discussed in section
6.6 and the typical results plotted against the number of cycles and the
cycle ratio are shown in Figs. 6.17 - 6.18 respectively. A progressive
decrease with the number of loading cycles was observed in all specimens
which were tested at 80, 75» 70 and 65$ stress levels (Fig. 6.17). In
Fig. 6.18, with the exception of the specimen tested at 65$ stress level,
it can be said that the higher the stress level the lower the percentage
decrease of the original modulus of the elasticity. The initial decreaseat
is probably due to the development of bond cracks in a load oriented direction,
followed by the uniform decrease from about 10 - 85$ of the total fatigue life
probably as a result of the progressive propagation of the cracks. Finally
a very slight decrease in the modulus prior to failure was observed probably
due to the initiation of matrix cracks, the propagation of which rapidly leads
to failure.\
6.9 Volumetric strain and Poisson's ratio
Figs. 6.19 - 6.21 show the static stress-longitudinal (axial),
lateral,volumetrie strain (defined as equal to the longitudinal strain - 2
lateral strain)' and Poisson's ratio relationships for specimens tested
at 80, 75 and 70$ stress levels respectively. Generally, it can be said
that the higher the stress level the larger the longitudinal, lateral and
volumetric strain. The same conclusion can also be applied to Poisson's1
ratio. The changes of the volumetric strain with time under constant
amplitude cyclic loading are shown in Figs. 6.22 - 6.24. The changes in
the Poisson's ratio with time are also shown in Fig. 6.25 - 6.27. From
Figs. 6.22 - 6.24, it can be observed that the volume of concrete under
- 5 6 -
cyclic loading at stress levels 'between 70 - 80fa starts to increase rather
than decrease after a few hundred cycles of loading (corresponding to
about 15fo to 25f<> of the total life) and the lower the stress level theearlier in its fraction of the life that the volume starts to increase.
This period corresponds to the marked increase in strain values and the
significant decrease in the hysteresis area and modulus of elasticity. The75beginning of the volume dilation was observed by Shah and Chandra to be
related to the sharp increase in the length of continuous cross-linked
microcracks indicating the beginning of slow crack growth. In other words,: f i
the beginning of the volume dilation corresponded to the beginning of the
uniform increase and decrease of the above characteristics. It is inter
esting to mention also that the first loading and unloading branches of the
stress-volumetric strain curves are convex towards the stress axis and
apart from the curve of BP - 3(S - lOfo) the curves showed a slightmojcreversal at the upper range of the stress. This reversal is the point at
which under static loading the volume of concrete starts to increase rather
than decrease. After a few hundred loading cycles the sign of the volumetric
strain changes from contraction to expansion and becomes straight and
gradually reverses its curvature to become concave towards the stress axis.
Shah and Chandra'^- observed that such behaviour was not found in hardened
cement paste specimens; the volume of the paste continued to decrease
until failure occurred. It was observed that there was a very rapid
increase in the strain value when approaching failure. For example, in
Fig. 6.23 the last recorded values of the strain corresponding to about 987»
of the total life was about 3 times the magnitude of the strain value at about 84f<> of the total life.
Figs. 6.25 - 6.27 show that Possion's ratio increases with the number
of loading cycles for all specimens which failed in fatigue. This is in
contrast to the decrease in the ratio with time under both static and
- 5 7 -
cyclic stresses found by Whaley^ and is due to the much lower maximum
stress levels used (30 - 60fo against 'JO - 85$ in the present work) as a
result of which beneficial effects due to understressing namely, redistri
bution of stress from matrix to aggregate as a result of viscous flow etc?^'^
took place. The low-strain stiffness effects can also be observed from the
curves in Fig. 6.26 - 6.28 which show a large decrease in the ratio at low
stress with an increase in stiffness at the higher stress as the number of
cycles increases. It is observed also that at the first cycle of load the
maximum value of the ratio occurs at the maximum point of the increasing
load. However as the number of cycles increases towards failure the minimum
value of the ratio occurs at the maximum stress level. This is probably due
to the closing of the horizontally oriented cracks which causes the marked
increase in the longitudinal strain at low load and hence the decrease in
the ratio.
6.10 Conclusions
The principal feature to emerge from the observations discussed is
that cyclic stresses of constant amplitude have a progressive effect on the
properties of concrete each of which is affected to a varying degree
depending on the level of stress. These changes may be summarised as
follows:
1. The changes in the shape of the stress-strain curves depend on
the maximum stress level and the number of loading cycles. These changes ta
qualitively indicate the phenomenon of progressive damage of fatigue in
compression.
2. Generally, the changes in the characteristics affected by the
application of cyclic loading consist of 3 stages, firstly a rapid decrease
in the area of the hysteresis loop and secant modulus of elasticity and an
increase in the total strain, elastic strain, inelastic strain, volumetric
strain and Poisson's ratio up to 0 - ICffo of the total life. This is followed

by a uniform decrease of the first two and a uniform increase of the other
characteristics mentioned above between about 15 - 9 0fi> of the total fatigue
life. Finally when fatigue failure occurs, there is a slight increase in
the hysteresis area, the total strain, elastic and inelastic strain,
volumetric strain and Poisson's ratio while the secant modulus of elasticity
shows a slight decrease.
3. The lower the maximum stress level the larger the decrease of the
hysteresis area. This observation applies to all the three stages of
changes.
4. The amount of the total strain is larger the lower the stress
level. The same conclusion applies to the inelastic strain.
5. The elastic strain data seemed to indicate that the higher the
stress level the larger the value of the elastic strain at failure.
6. For all specimens which failed in fatigue, the secant modulus
of elasticity decreased with the increase in the number of loading cycles
and the results seemed to indicate that the lower the stress level the
larger the decrease.
7# Y/hen concrete specimens are subjected to cyclic compressive
loading for about 15 - 2 5 of the total fatigue life the volume of concrete
starts to increase rather than continuing to deorease.
8. Poisson's ratio increases with the number of loading cycles for
all specimens which failed in fatigue.

- 5 9 -
CHAPTER SEVER
STUDY OF FATIGUE DAMAGE BY ULTRASONIC
PUT.SE VELOCITY METHOD
7.1 Introduction
In the previous chapter, certain characteristics of concrete have
been shown to be affected by cyclic loading and their relationships with
the cycle ratio have been demonstrated. These relationships, may with
some reservations be employed as indirect indications of how a specimen
undergoes changes (fatigue damage) at a particular constant amplitude cyclic
stress level through-out its life. It is obvious that the relationships
established are only useful in the determination of the damage-cycle ratio
relationship of laboratory specimens and are of little use in actual
structures. Furthermore, owing to the limitations of the available strain
measuring instrument it was necessary to interrupt the cyclic loading at
intervals to measure strain. This practice introduces rest periods.into
the loading programme and may hence affect the results. The fatigue damage
of concrete has been seen to be a process of progressive permanent internal
cracking of microscopic width at the cement matrix/aggregate interface, in
the matrix itself and sometimes extending into the coarse aggregate. Thus
a method of detecting the initiation and propagation of cracks without
interrupting the cyclic loading would be a very useful tool in fatigue
research.
Ultrasonic pulse velocity measurements have been successfully related
to the incidence of cracks and other voids. With the development by
Elvery and others^ of the PUNDIT (Portable Ultrasonic Non-Destructive
Digital Indicating Tester), it is possible for the first time for pulse
velocity measurements to be taken continuously during a cyclic loading test.' W •
In this chapter, the possibility of using ultrasonio measurements
- 6 0 -
as external indicators of changes in the internal microstructure of
concrete subjected to cyclic loads is investigated.
7.2 General reviews
The fultrasonic pulse velocity technique involves measuring the
transit time lof an ultrasonic pulse through a path of known length in a
concrete specimen. Since the velocity of the ultrasonic pulse in a
solid material depends on the density and elastic properties of the material
and is also affected by the presence of cracks, the measured pulse velocity
can be used to indicate these properties. The technique was first intro-77duced by Long, Kurtz and Sandenaw in 1945 and at that stage was
essentially confined to the determination of the elastic properties of a58 59material. An early instrument was also developed by Jones and Gatfield ’
in England and independently in Canada by Leslie and Cheesman^ in 1946-
1950 (Soniscope). It was soon realized that the technique, as a non
destructive testing method, had a definite advantage over the alternative
method of measuring the resonant frequency' in that. it could be used on
any element irrespective of its size and shape. Many investigators,58 79notably Jones in 1949, and 1952, deduced the presence and development
of microcracks from the changes in velocity of an ultrasonic pulse. Jones
showed that in a compression test the cracks are mostly parallel to the
direction of the load. His technique was later used by several other
investigators in the study, of the properties of concrete and the initiation
and propagation of cracks under both tension and compression. Examples
are found in the work of Jones and Gatfield (1955)»^ Rtlsch (1959)80 who81unlike Jones measured pulse amplitude instead of velocity, Kaplan (i960),
• 1 '
82and of Shankar (1963) . More information about extensive work done in
Canada and U.S.A. during the period of 1945-1958 was also published inQi
1959 by the Highway research board. ■' The first authoritative book on
the nondestructive testing of concrete and pulse velocity techniques in

- 6 1 -
particular was published by Jones in 1962®^, and was followed by an ACIQC
Monograph No.2 in 1966. ? A general review of nondestructive testing by
Jones was published posthumously in 1 9 7 0 , in the ICE symposium on
nondestructive testing of concrete and timber (1969) which several
interesting papers were also presented. More recent progress in thisoq 62field was described by Bennett and Raju (19^9). J Shah and Chandra (1970) t
Elvery (1971)»^ and Nwokoye (1973).^ Finally, the British Standard
Institution has issued B.S.4408: Recommendations for Nondestructive Methods90of testing for Concrete in 1971* These have been published in separate
parts and the part concerned with ultrasonic testing is covered by B.S.4408:
Part 5: 1971.
7*3 Testing procedure
The equipment and testing technique for the measurements of pulse
velocity of concrete specimens under static and cyclic loading is described
in Section 4.3» P«31« Since cracks were known to form mostly in the
middle part of a specimen and parallel to the direction of the load under
uniaxial compression, most of the tests were performed with the transducers
on opposite sides at the mid depth of the specimen so as to measure the
pulse velocity in the lateral direction perpendicular to the applied load.
A study of the percentage decrease of the original pulse velocity in the
longitudinal direction parallel to the load was also made on a few specimens
subjected to cyclic loads in order to confirm the presence of cracks
perpendicular to the direction of the load.
It should be noted that all the work referred to in Section 7*2 was
concerned with the properties of concrete and the initiation and propa
gation of cracks under static loading pnly. It is the purpose of this
part of the present work to study crack initiation and propagation tinder
both static loading and cyclic loading. With regard to the latter, the
change in pulse velocity has for the first time been monitored continuously

- 6 2 -
throughout a fatigue test. By this practice the complication arising
from the introduction of rest periods has teen eliminated thus improving
the accuracy of the test results.
7.4 Analysis of pulse velocity test results
7.4.1 Static tests
The changes in pulse velocity in the lateral direction were
measured at intervals during the static control tests and in the first
static loading cycle of the fatigue tests on prismatic specimens. Typical
curves of stress against percentage decrease of the original pulse velocity
for the first few cycles are shown in Figs. 7.1 - 7*4 (also in Fig. 6.1).
It will he seen that there is no unique relationship between the stress
level .and the point where a significant decrease in the pulse velocity
occurred. On the contrary the first decrease in the pulse velocity was
sometimes observed at a stress as low as 20$ and sometimes as high as 70$
of the ultimate static strength. The early decrease is probably due to
the extension of microcracks induced during setting and subsequently on
drying due to local breakdown in the adhesion between the coarse aggregate
and the matrix. The greater the amount of decrease which was observed
at about 60$ of the ultimate is approximately the stage at which the lateral
strain, the volumetric strain and Poisson's ratio increased sharply (Fig3.
6.19 - 6.21), indicating that microcracks of more significant influence on
the elastic properties of concrete are formed and propagate from this
stage onwards. This observation is in agreement with the findings of
several investigators, namely Newman, ' Robinson and Jones and Kaplan^ .87According to N e w m a n , stable crack initiation and propagation occur at
applied stresses below 40$ of the ultimate stress, whereas more significant
cracking occurs between 40 - 60$ of the ultimate. This behaviour was also88inferred from^acoustic and X-ray techniques.
- 6 3 -
It was not possible to observe the maximum decrease of the original
pulse velocity when failure occurred; however, the average maximum decrease
observed when approaching failure was 9 • 10$ of the initial pulse velocity20which is in agreement with about 9$ observed by Raju.
A few measurements of the pulse velocity in the lateral direction
were also made on control cubes. It was observed that the first decrease
in the velocity was at 30 - 37$ of the ultimate and the maximum decrease
when approaching failure was about 15$ of the initial value. It should
be observed that under static loading, the maximum decrease in pulse
velocity depends largely on the height to width ratio of the specimen.
Jones and Gatfield^ observed a total decrease of 15$ in cubes whereas
only half of that was noted for cylinders. The reason for this is that
cylinders (or prisms as in the present work) which are more slender than
cubes have been observed to undergo lateral deformation, when approaching
failure, of only half.the value observed in cubes. ’ For this reason,
together with the above observations, a greater decrease in pulse velocity
relates to a larger degree of deformation resulting from a larger degree
of cracking both as regard with number and size of the cracks. Therefore,
the degree of microcracking (fatigue damage) in both static and fatigue
tests can be comparatively assessed by the magnitude of the decrease in
pulse velocity.
7.4*2 Fatigue tests
The relationships between the stress and percentage decrease of
the original lateral pulse velocity are shown in Figs. 7*1 - 7*4 For
specimens tested at 80, 75» 70 and 65$ 'stress levels respectively. Note
that these measurements were made at suitable intervals in the course of
the fatigue tests in test series A and B in which the need to measure
strain compelled the interruption of the tests at intervals. However, the
rest of the measurements were made throughout the tests in series C, D and
- 6 4 -
E continuously without interruption. An important feature to "be noted
from the figures 7»1 - 7*4 is the progressive growth of microcracks in the
material due to fatigue as indicated by the gradual decrease of pulse
velocity. A study of the figures also revealed that early in the fatigue
life, the decrease of the pulse velocity in each cycle was greater at the
maximum stress and the fact that the decrease of pulse velocity was
linearly proportional to the stress indicated that there was no opening,
closing or propagation of the cracks. After about 25 - 35/° of the total
life, however, there was an indication that microcracks began to "move",
namely to open and close due to the application and removal of the load in
each cycle as shown by the loop in the stress-velocity decrease diagram.
At the same time there was a transition of the relationship namely,
minimum decrease of pulse velocity corresponded to maximum stress as the
number of loading cycles increased. It should be noted that this trans
ition corresponds to the stage where low-strain stiffness effects also
take place (Figs. 6.2 - 6.5)» and corresponds to the convexity and concavity
of the stress-strain curves (Figs. 7«1 - 7*4)» The similarity between
the two relationships implies firstly, that the variation of the stress-
strain curves relates to the initiation and propagation of microcracks.
Secondly, it indicates that the decrease of pulse velocity is a valid
comparative method of monitoring internal changes in a specimen under
cyclic loading.
7.5 Pulse velocity-number of cycles and Pulse velocity-cycle ratio
relationships
The relationships between the decrease of pulse velocity and the
number of loading cycles (n) are shown in Figs. 7*5» 7*7» 7*9 and 7*11
for the specimens tested at 80, 75» 70 and 6 5 maximum stress level
respectively. For comparison, the relationships between the decrease
of pulse velocity and the cycle ratio (ratio of the total fatigue life,
- 6 5 -
n/N) are also shown respectively in Figs. 7.6, 7.8, 7*10 and 7*12. For
clarity, all of the relationships except that for the specimen tested at
75$ stress level, are shown for the maximum decrease of original pulse
velocity. To give a complete record, in Fig. 7*7 and 7*8 the relations
for both maximum and minimum decrease of pulse velocity are shown.
Generally, it can be said that the decrease of pulse velocity increases
with the number of cycles and the cycle ratio. And on the average, the
lower the stress level the greater is the decrease of pulse velocity. In
Figs. 7*6» 7.8, 7.10 and 7*12, it will be noticed that there are 3 stages
in the progress of the decrease of pulse velocity with the cycle ratio.
Firstly, there is a sharp decrease of about 15 - 20$ of the original velocity
at about n/N - 10 - 20$ (stage l), followed by a gradual decrease of pulse
velocity from n/N ■ 20$ to 85 - 90$ (stage 2). ' Finally, the rate of
decrease of pulse velocity becomes slightly greater when approaching
failure. There also seem to be unique relationships between the two pairs
of variables represented by the equations:
V - a(n)b ..... (7.1)
and V - a(n/N)b ......(7.2)
where; V - maximum percentage decrease of original pulse velocity
n ■ number of loading cycles in cycles
n/N - the cycle ratio in percent
N - the number of loading cycles where failure occurred
a,b ■ experimental constants which can be evaluated by a regression
analysis.
These equations are used extensively in the analysis of the problem
of cumulative damage, both under constant amplitude and variable amplitude
tests using the data illustrated in the Figs. 7.1 - 7*11» which will be
discussed in detail in Chapters 9 and 10. However, it can be said at this
stage that the relationships established can be used to estimate the extent
- 6 6 -
of fatigue damage suffered by the material, and that the relationships
established are significant at the 0,1% level.
In addition to the study of the variation in the pulse velocity in
the lateral1 direction, changes in the pulse velocity in the direction of
the load were observed on two prisms in series B, the variation of which is
shown in relation to the cycle ratio in Fig. 7*13. It can be seen that
there is also a progressive decrease in the pulse velocity in the direction
of the load and the decrease is greater as the cycle ratio increases. Note
that the magnitude of the decrease of pulse velocity in the longitudinal
direction parallel to the load was only about 15 - 2J% compared with 40 -
50% of the original in the lateral direction. This proves that the majority
of the microcracks formed during cyclic loading in compression are aligned
in the direction parallel to the load and have been confirmed by the study29of cracks by Bennett and Raju , The frequently observed phenomenon of
t
low-strain stiffness is also explained by the fact that horizontally
oriented cracks exist and their closing,together with the opening of the at
vertically oriented cracks,causes the pronounced downward convexity of the
stress-strain curve for low stress levels.
It is of interest also to note that there is a large difference
between static and cyclic loading tests in the decrease of pulse velocity
when approaching failure. The decrease of pulse velocity in fatigue
tests is about 4 to 5 times that observed in.static tests. This implies
that the degree of cracking under repeated loads is significantly greater
than that under static load. This observation is in agreement with those
of several investigators 7' * and is best confirmed in Plate 6 and
Fig. 9*24 in which the cracking mode at failure under a static load and
cracking mode under a cyclic loading test are shown respectively. It will
be clearly seen that cracking developed under static load is much less
extensive than in the fatigued specimens.
- 6 7 -
7.6 Discussion and conclusions
The study of fatigue damage (microcracking) by ultrasonic pulse
velocity method investigated in this chapter has demonstrated that the
method can be a very useful tool for detecting the development and growth
of microcracks under repeated load as shown by the progressive decrease
of original pulse velocity and its analogy to the stress-strain relation
ships, and from visual observation of the cracks themselves. The method
offers far more useful features in the study of microcracking than the92 28other techniques, namely, the use of a powerful microscope'7 ’ together
92with the assistance of strain gauges and extensometer to locate the
SURFACE cracks; slicing of specimens after applying a given number of
loading cycles then grinding, dyeing, polishing and inspecting under a 29 95microscope ’ . The former method was often very tedious and confined
the observation on the surface only whereas in the latter the revelation
of the location and length of the cracks were at the expense of loss of
continuity of the specimens inherent in a slicing technique. Furthermore,
the propagation of microcracks cannot be observed from one stage of test
to the next.
There are also several other techniques in the field of logical
nondestructive methods of testing in the study of the initiation and88propagation of cracks namely, X-rays and fluorescent-dye technique
andwhich sometimes required the specimen to be sawn,^therefore, suffered the
same draw back in slicing. Another promising approach lies in acoustic
methods which work on the principle that the formation or propagation of a
microcrack is associated with the release of energy. When a crack forms
or spreads, part of the original strain energy is dissipated in the form
of heat, mechanical vibrations, and in the creation of new surfaces. The
mechanical, vibrations component can be detected by acoustic methods and
recorded, hence microcracking may be detected by studying sounds emitted
- 6 8 ' -
from the concrete. Unfortunately, these methods require expensive
equipment, trained personnel, specific size and shape of the material
and involve difficult setting up of the equipment. The pul3e velocityl
technique in comparison with the above methods, has considerable advantages
in ease of setting up and operation in the laboratory or field; the method
permits an assessment of the condition of concrete along the entire path
length under both static and cyclic loading continuously through the test.
The use of the suggested relationships determined from tests on
small specimens such as those used in the present tests to predict the
remaining life of larger structural element requires caution. More tests
are needed to study the effects of size, age, mix proportions etc., on
pulse velocity in relation to the total fatigue life. The prospect of
using the pulse velocity technique in the study of progressive fatigue
damage of a brittle material is, however, much more promising and will be
used extensively in the next part of the present work involving the study
of the emulative damage under variable loading conditions. It is felt
that knowledge thus gained will be of value in assessing the remaining
life of a partially fatigued structural element in the field so that the
strengthening or replacement could be effected whenever the need arises.
The following conclusions are drawn from the research investigation:
1. Under the usual test conditions, with the specimens in contact
with the steel platens, the onset of significant cracks was detected at
different proportions of the ultimate load for different shapes of specimen,
i.e, about 33% for cubes and about 60% for prisms.
2. When approaching failme, more cracks were developed in cubes
than in prisms and were mostly parallel to the direction of the load.
3. A significant decrease in the pulse velocity occurs in both the
lateral and longitudinal directions for concrete prisms subjected to

- 6 9 -
cyclic compressive loads of intensity 65 to 85 percent of the ultimate
strength. The decrease becomes greater as the number of cycles increases.
4. Failure in all fatigued specimens is preceded by cracks mostly
parallel to the direction of loading, as indicated by the magnitude of the
decrease in the pulse velocity in the lateral direction which is nearly
four to five times greater than that under static load.
5* The lower the stress level the greater the'decrease in pulse
velocity.
6. There are unique relations between the decrease of pulse velocity
and the number of loading cycles and between the decrease of pulse velocity
and the cycle ratio. Empirical relationships established between the
parameters were significant at the O.lfi level and can be used in the detailed
study of cumulative fatigue damage in compression.
- 7 0 -
CHAPTER EIGHT
REVIEW OF CURRENT CUMULATIVE FATIGUE
DAMAGE HYPOTHESES
8.1 Introduction
As has been described in Chapter 2, the majority of investigations of the
fatigue performance of plain concrete have been conducted by means of constant
amplitude tests. However, the need to design for the fatigue life at one con
stant stresss level occurs very rarely in an actual structure, since the stress
cycles in service vary greatly in magnitude, number and order. Owing to the
complication of the stress variations, it is not practicable to perform enough
tests to cover all stress variations, so that the fatigue performance of the
actual structure can be accurately evaluated, particularly at the design stage,
when the sizes of the structural elements are chosen. Moreover, there will al
ways be some uncertainty in predicting and determining the fatigue-producing
stress variations that the structure will experience before the structure has
actually been built and put into service.
It is, therefore, necessary to employ a cumulative damage hypothesis for
the prediction of the fatigue life of any structure subjected to a spectrum of
stresses in random order. Despite the multiplicity of hypotheses available for
the design of metal structures the original Palmgren-Miner cumulative damage94'' 13
hypothesis, (Miner's rule) is still generally adopted. There are several
reasons for this. Firstly, it is simple to use and is often regarded as giving
a conservative (safe) prediction, although this is. not necessarily correct and
has to be verified experimentally. Secondly, conventional S-N diagrams are
commonly available and most of the practical alternative methods of life pre-
diction require additional data which in many cases would be expensive to obtain.
Finally none of the subsequent hypotheses has yet been proved sufficiently re
liable to outweigh the probable increased complication of their use. For this
reason, much of Part 3 of the present work will be devoted to the investigation
of the limitations of Palmgren-Miner hypothesis with particular, reference to
its application to the problem of cumulative fatigue damage in concrete in com
pression.26
Only a limited amount of work has been done.on the problem of cumulative
fatigue damage in concrete. Therefore, it is reasonable to review some of the
proposed cumulative hypotheses in the more thoroughly studied field of metal
fatigue since it may be possible to adapt one or more of these to explain the
behaviour of concrete subjected to varying amplitude fatigue loading, In the
review of the hypotheses two criteria have been suggested in order to classify95 .
them, namely stress dependence and interaction effects.
8.2 Stress dependence
A distinguishing feature of various cumulative-damage hypotheses is the manner
in which the course of damage depends on the stress amplitude. This is probably
due to the fact that the number of cycles to failure depends on the stress am
plitude i.e., the higher the stress amplitude or stress level, the less the
number of cycles to failure and vice-versa. However, as will be described be
low, certain cumulative damage hypotheses can be termed "stress-independent
hypotheses". Stress independent, in this case, means that equal amounts of
damage are produced at equal fractions of the total life for all stress ampli
tudes. However, care is required in defining the terms "damage" and "life".
In a simple, constant amplitude test, the specimen is subjected to a constant
stress range thoughout each individual test. After undergoing a number of stress
cycles, or in some cases even after the first or second repetition of the stress
cycle, fatigue damage occurs although it is not usually discernible. This dam
age is progressive in nature, (see Section 2.2.4.P.16. Mechanism of fatigue
failure) and eventually leads to visible deterioration end the disintegation
of the specimen (fatigue failure). At this stage, damage may be described as
complete, or 100 percent. The process is depicted schematically in Pig. 8.1
- 72 -
Figure 8.2 shows the effect of the stress amplitude on the number of cycles
to failure for several levels of stress. On the curves, equal amounts of damage
as defined above are not equivalent in an absolute sense, because the damage
at failure (indicated either by total strain at failure or by decrease in the
ultrasonic pulse velocity in the lateral direction) has been observed to be
different for differing stress amplitudes; greater ultimate damage occurs when29the stress amplitude is small and the number of cycles to failure is larger.
(Chapter 6-7).
The damage measured must, therefore, be revised so that equal ordinates re
present the same amount of damage. In the consideration of stress cycles of
varying amplitudes in varying order, the amount of damage at failure for the
highest stress in the spectrum can be used as a reference so that if the damage
at failure for any stress amplitude is divided by the reference value, the re
sulting relationships between damage and number of cycles (fig. 8.3) will indicate
the same true damage at equal values of the ordinate. With the damage measured
as shown in Fig. 8.3, the number of cycles to failure in a constant amplitudet
test; N p should be replaced by N^, the number of cycles that produces an amount
of damage equal to the damage at failure at the highest stress amplitude S^.
If the curvesi.in Fig. 8.3 are adjusted by dividing n, the number of cycles
applied, by the number of cycles that produce the selected damage level
(damage at failure at the highest stress amplitude), oneor other of the two
possibilities shown in Fig. 8.4 and Fig. 8.5, will result. The cumulative dam
age hypotheses that are stress-independent result in Fig. 8.4» while the cumula
tive damage hypotheses that reduce to the representation of Fig. 8.5 are stress-
dependent. Note that the curves in Fig. 8,5 do not necessarily have to be non
intersecting between the origin and point 1,1.
8.3 Interaction effects.
The other important factor to be taken into account in a cumulative-damage
hypdthesis is interaction. If the relationship between damage and the number
of cycles at a specified stress amplitude is assumed to be" valid irrespective
- 7 3 -
of what other stress amplitudes are applied, the cumulative-damage hypotheses
is termed an "interaction-free hypothesis11. On the other hand, a hypothesis
that assumes that the previous application of other stress amplitudes change
the course of damage due to the given stress amplitude is an interaction hypoth
esis.
For example, consider a concrete specimen which has undergone sufficient
stress cycles of varying amplitudes to produce a certain amount of damage after
which one more stress cycle is applied, e.g. of amplitude S^. For an interaction-
free cumulative damage hypothesis, the increment of damage produced by this addi
tional cycle would be the slope of the damage-cycle ratio curve for the given
stress amplitude (S^) at the level of damage which has already occurred multi
plied by the increment of the cycle ratio. For an additional cycle, the incre
ment in the cycle ratio , d(n/N), would be 1/Ny In equation form:
D - dD , 1 (8.1)
d<8> n3
where dD/d(n/N) is determined at the appropriate level or the damage curve
for the stress ampitude, S^. The cumulative damage hypotheses in which the
above expression is not valid for the incremental damage are interaction hy
potheses.
The definition of interaction-free hypotheses applies equally well to either
the stress-independent hypotheses of Fig. 8.4 or the stress-dependent hypotheses
of Fig. 8.5.
- 7 4 -
8.4. General comparison of cumulative damage hypotheses
8.4.1. Palmgren-Miner cumulative fatigue damage hypotheaig
and alliance hypotheses
The most generally known cumulative damage hypothesis, usually attributed 94
to Miner, will be used as a basis comparison. Miner's hypothesis was orgin-
ally applied to cumulative damage before the appearance of the first crack.
However, there is no fundamental reason why it cannot be applied to life up to
any state of damage (but the accuracy of prediction may well depend on the dam
age state considered).96
Actually Palmgren had presented cumulative damage equations identical
to Miner's hypothesis some 20 years earlier, apparently as the result,of a9 5 .
purely intuitive approach, but it was Miner who made this hypothesis famous
by presenting attractively simple cumulative damage equations supported by/
experimental work.
Palmgren-Miner hypothesis (Fig. 8.6) simply states that, irrespective of the
magnitude of the stress, each and every stress cycle has some influence on the
ultimate endurance of, and is responsible for a certain amount of fatigue dam
age to a specimen, component or structure. It specifically assumes that, for
each stress amplitude, there is a linear rate of fatigue damage irrespective of
the order of load application, and failure occurs when the sum of the damage,
increments at each stress level accumulates to unity, i.e, damage is proport
ional to n/N, the condition for failure being represented by the equations
i-m
2i«i
n1 - n1 + n2N. N1
n, n__ + __2 + • • • • jmN2 N3 Nm
- 1 (8 .2 )
where: N. to N - the number of cycles to failure at stress level S. to I m i
^m >
to the number of stress cycles actually applied at each stress
level in sequence.
Classification and comparison of the cumulative-damage hypotheses can be
made by using the two characteristics distinguished in the previous sections
namely, stress dependence and interaction effects, as follows:-
1. The cumulative damage hypotheses that reduce to a stress-independent
damage-cycle ratio relationship when adjusted in the manner of Pig. 8.4 and
are interaction-free are equivalent to the Palmgren-Miner hypothesis.95,97
?. It has been proved that the cumulative damage hypotheses that are
stress-dependent, reducing to the form shown in Pig. 8.5 when adjusted, and are
interaction-free' will predict shorter life under random spectrum loading than
would be predicted by the Palmgren-Miner.hypothesis.
3. In order for a cumulative damage hypothesis to predict longer life than
does the Palmgren-Miner’- hypothesis, it must obviously be an interaction type
of cumulative damage hypothesis (and can be either stress-dependent or stress-
independent). Interaction-type damage hypotheses can be constructed so as to
predict either shorter or,longer life than does the Palmgren-Miner hypothesis.
The hypotheses studied were selected as being representative of the breadth
of the possibilities, not as being necessarily superior to the others that
have been proposed. Those considered and the conclusions drawn from them are
as follows: ]
Under the same classification as the Palmgren-Miner hypotheses of the valid
ity of linear summation of the cycle ratios (stress-independent and interaction9 8 99
free.) are those of Langer 1937 J Poland, Richard, and Work 1949» Valluri 100
1961 in a much more complicated approach, proposed a hypothesis based on dis
location theory and plastic deformation of metal which is not relevent to this
work. However,<: this ■ theory is found to be equivalent to Palmgren-Miner hypo the
is if certain restrictions concerning definition of fatigue damage are observed

- 7 6 -
8.4.2 Stress-dependent and interaction-free hypotheses101
As modified Palmgren-Miner hypotheses, Newmark (1951)> and in particular102
Marco and Starkey (1954) have proposed hypotheses of cummulative damage based
on the experimental observations of the fracture appearance of the specimens
tested. The following was assumed.
1. Fatigue damage is representable by the terra D, and is a variable, beginn
ing from zero when no cyclic-stress history exists in a specimen and becoming
unity when the specimen has finally failed (i.e. completly fractured) under the
influence of cyclic stressing.
2. Damage may be expressed quantitatively as a function of the cycle ratio
number n^/N^
The general equation (8.3) is finally replaced by the exponential relationship
The equation (8.4) when shown diagrammatically is similar to Fig. 8.5. These
empirical damage-cycle ratio relationships, when used in the prediction of the
life of a specimen will predict shorter life in a simple,one step test (eg. 2
stages of loading) of high-low sequence namely, tested at for n^/N then load
ed at to failure (S^Sg) and vice versa. More generally, when applied to vari
able amplitude loading, this hypothesis will also predict a shorter life than the94,97
Palmgren-Miner hypothesis. ’ '103. ,
Grover (i960) ' has proposed a stress-dependent, interaction-free hypothesis '
that differs from the Palmgren-Miner hypothesis in that it postulates a two-stage
damage process. It is assumed that cracks are initiated during an initfel stage of
damage as stress cycles are applied. In a single-level or constant amplitude test
this initial stage is completed at some fraction denoted by "a", of the total
cycles to failure* In the second stage, propagation of cracks to failure occurs
in the course of application of the fraction (1-a) of the total number of-cycles
102,
Thus, D - f(n^/Ni) (8.5)
(8.4)
- 7 7 -
to failure. It is assumed that the value of "a" for any stress amplitude is
constant whether or not cycles of other stress amplitudes are applied (i.e.95
interaction-free). It was pointed out by Kaechele that the essential features
of this theory are contained in the method proposed by Langer.
For cumulative-damage calculations under spectrum loading, it is assumed that
the Palmgren-Miner hypothesis applies to each stage, which results in two equat
ions:
and
where n ■ no of cycles applied during the initial stage,
; m « no of cycles applied during the second stage.103
As originally noted , if a^ is the same for all stress amplitudes in the
spectrum, this theory is equivalent to the Palmgren - Miner hypothesis.
The normalized damage-cycle ratio relationships postulated by this hypoth
esis are shown in Fig. 8.7. It will be clearly seen that the hypothesis is
stress-dependent,-since the damage curves in Fig. 8.7 differ for different stress/ •
amplitude. Thus, it will predict failure in fewer cycles than will the Palmgren-
Miner hypothesis when appliedto the well-mixed stress spectrum.
2 — aiNi
m.2 J L
( 1 - a ^ - 1
(8.5)
(8.6)
There are insufficient data to provide a meaningful determination of-; the
value of the parameter "a" and how it varies with stress amplitude. However,
the hypothesis is still viable in its application in the field of metal fatigue
where it has been proposed that the fatigue life of metal consists of several 104
stages.
Q .4.3 Stress-dependent and interaction hypotheses104 • '
Corten and Dolan (1956) proposed an interaction hypothesis which involves the
attractive assumption that interaction effects can be determined from fairly
■i
.1■1:j
! j
1-¡j
%
1£*
I

1,
- 78 -
simple fatigue tests at two stress levels (one-step tests). As originallyT04
presented , the general form of this hypothesis includes both stress-dep <-105,106
endence and interaction effects. Subsequent experimental work in
connection with the theory, however, led to the formulation of a stress-indep
endent, interaction theory.
In the original presentation, the expression for damage as a function of
applied cycles for stress amplitude was given by:
Di ■ mirini (8.7)
where m - some number of "damage nuclei"
r^- a crack-propagation constant,
a^« Constant
These expressions are assumed constant for a specified stress amplitude
(in a constant amplitude loading test) but may be different for different stress
amplitudes. Damage at failure is prescribed as unity (or 100 per cent), giving
Dn - mA T± Na A -1 (8.8)
By dividing m^ r^ N ^ i
damage is obtained:
- 1 into Eq. (8*7)t the following expression for
»1 T < Ì >i (8.9)
The damage-cycle ratio relationship derived from this equation can be shown
as in Fig. 8.4 or 8.5. As mentioned above, it was. concluded that a^ was in
dependent of stress for the materials (cold-drawn steel wire) and stress spectra
used in the work; thus the case of Fig. 8.4.
Interaction effects are introduced into this theory, leading to the possibil
ity of predictions that differ from the Palmgren-Miner hypothesis. It follows
from the assumption that the number of damage nuclei produced by the highest
stress in a spectrum will affect the growthVat other, lower stress amplitudes.
J
i
'i
i

It is assumed that the damage growth at lower stress amplitudes will be faster
after a higher stress amplitude has been applied than when the lower amplitude
is applied alone. In other words, m is considered to be larger for the higher
stress than for the lower stress. With the interaction effect included, the
damage Eq. becomes
m.D . - r - ( d ) &i1 m. (8 .10)
where m^ ■ the damage - nuclei number for the highest stress
in the spectrum (assumed to be applied early in the test)
•th,ra - the damage-nuclei number for the i (lower)
stress amplitude.
By defining a new parameter as
Mm.lm~
1
a ,
(8 .11)
The damage relationship of Eq. (8.10) can be written as
D .i
ain.
MiNi<
(8 . 12)
N- which is equal to M.N., is a revised (because of interaction) number * th\of cycles to failure at the i amplitude which should be used in the damage
equation when the ith amplitude is mixed together with a higher stress amplitude
For design purpose, a fictitious S-N diagram for use with spectrum loading
can be constructed as a straight line passing through (the cycles to failure
at the highest stress in the spectrum determined from constant amplitude tests)
and through a point N, at a lower stress amplitude. The value for N, is1i i
determined from one-step tests containing the two stress levels and S^. As
- 8 0 -
was observed in the original work,104 a^ was independent of stress levels;
therefore, cumulative damage could then be assessed for any spectrum by using
the Palmgren-Miner hypothesis with the interaction S-N diagram thus obtained.
Apart from the above mentioned work, there are several proposed interaction107 108
hypotheses namely, the Freudenthal-Heller hypothesis, Shanley's hypothesis,109 •
Henry's hypothesis etc. These hypotheses which in some instances were based
on experimental findings and in others were purely theoretical relations intro-i ! . . .duced interaction effects in a more complex way, and mostly concerned the fati
gue behaviour of metal and attempted to relate the cumulative damage to such
factors as "Critical crack length", "Mean grain size", "Residual stress due to
manufacturing process", etc. which are not very relevant to the study of plain
concrete.
More critical reviews and analysis of the cumulative hypotheses as applied95,97,101
to the problem of metal fatigue up to 1971 can be found elsewhere. Currently,97
there are at least 22 proposed hypotheses for the metal fatigue problem.
8.5 Conclusionsto
1) There are two key assumptions with whichAdetermine general trends of
the life prediction by cumulative damage hypotheses, namely stress-dependence
and interaction effects.
2) Cumulative fatigue damage hypotheses may be stress-dependent or stress-
independent. That is the amount of fatigue damage by a certain cycle ratio may
be the same for all stress amplitudes (stress-independent) or different (stress-
dependent).
3) There may also be interaction or interaction-free hypotheses. The
course of damage at one stress amplitude may be changed by other stress ampli
tudes (interaction), or it may be unaffected (interaction-free).
4) The Palmgren-Miner hypothesis simply states that when a spectrum of
stress amplitudes is applied, fatigue failure will occur when the fractions of
life expended at each stress amplitude which is the ratio of the number applied
- 81
at that amplitude (n^) to the number that would cause fatigue failure at that
amplitude (N^); add up to one.
5) From the study of the key assumptions, it can be concluded that Palmgren
Miner hypothesis is a stress-independent, interaction-free hypothesis, and other
hypotheses that have these assumptions are therefore equivalent to the Palmgren-
Miner hypothesis.
6) Stress-dependent, interaction-free cumulative fatigue damage hypotheses
when used to predict the life of a concrete specimen subjected to random load
ing of varying amplitude will predict' a shorter life than the Palmgren-Miner
hypothesis. ■ . . i '
7) Interaction oriented hypotheses can predict a shorter or longer life
than the Palmgren-Miner hypothesis and have to be verified experimentally.

- 82 -
CHAPTER NINE
TWO STAGE CUMULATIVE DAMAGE TESTS
9.1 General
At the design stage of engineering structures it is sometimes necessary
to obtain a first estimate of fatigue life for any fatigue-sensitive structural
elements. In many cases, such as loading in off-shore structures subjected to
heavy wave action and loading in machine bases supporting heavy reciprocating
metal presses, the service loading is of variable amplitude, and it is here
that the need to employ a cumulative damage hypothesis arises.
The design of concrete structures subjected to complex service loading is
frequently based on the Palmgren-Miner hypothesis'^1 which assumes that each
cycle in a constant amplitude test consumes the same percentage of the fatigue
life of a specimen. If different maximum stress levels are applied within one
test, failure occurs when:
■ 1 ........................ ( 9 . 1 )
i - 1,2, ..
m n .2 r 1
>m
Where n^ is the number of loading cycles at a stress level S^,
and N^ is the fatigue life of a specimen tested at S^.
9.2 Limitation of Palmgren-Miner hypothesis
It is apparent from a study of the literature that the Palmgren-Miner
hypothesis can.give highly inaccurate estimates of fatigue life under variable
amplitude loading. For example, in the only attempt to verify this hypothesisnexperimentally in flexural fatigue tests of concrete, values of 2 _t varyingN_,
from 0.01 to 2 have been reported. There also axe many cases of metal fatigue
tests where the values of2n./N. have been shown to differ significantly fromno
unity, ranging from 0.01 to over 20. ' The fact that Miner’a data used in sup
port of the hypothesis were derived from tests conducted solely on aluminium-
alloy specimens, together with several doubtful basic assumptions in the
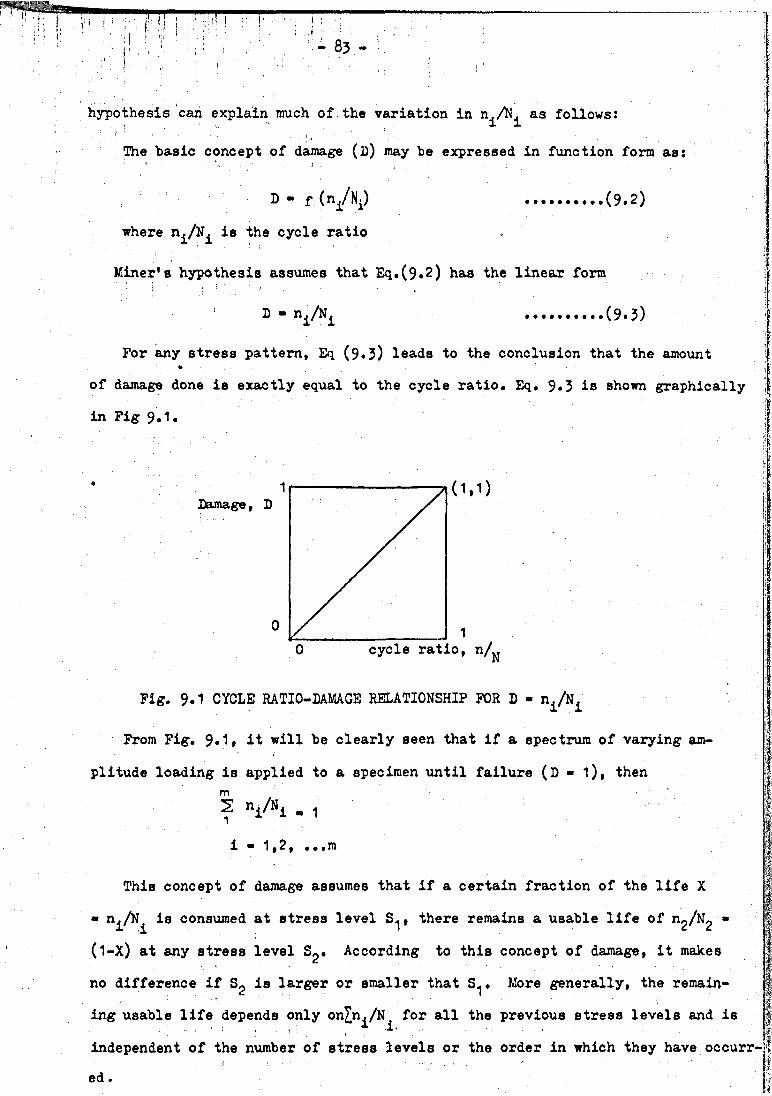
hypothesis can explain much of.the variation in n^A.^ as follows:
The basic concept of damage (2)) may be expressed in function form as:
D - f.(n/Nj) ......... (9.2)
where n^/N^ is the cycle ratio
Miner's hypothesis assumes that Eq.(9.2) has the linear form
D - n ^ ......... (9.3)
For any stress pattern, Eq (9*3) leads to the conclusion that the amount
of damage done is exactly equal to the cycle ratio. Eq. 9*3 i8 shown graphically
in Fig 9.1.
Damage,( 1 , 1 )
o, n/.N
Fig. 9.1 CYCLE RATIO-DAMAGE RELATIONSHIP FOR D - n ^ ^
From Fig. 9*1» it will be clearly seen that if a spectrum of varying am
plitude loading is applied to a specimen until failure (D - 1), then
2 ni/N1 m 1 ■
i - 1,2, ...m
This concept of damage assumes that if a certain fraction of the life X
■ nj/N^ is consumed at stress level S^, there remains a usable life of ng/N^ ■
(1 —x) at any stress level S^. According to this concept of damage, it makes
no difference if is larger or smaller that . More generally, the remain
ing usable life depends only onJn^/N^ for all the previous stress levels and is
independent of the number of stress levels or the order in which they have occurr-H
The hypothesis does not make allowances for the effects of understressing,
neither does it take account of the application of an occasional high load
which could cause severe damage at a point of stress concentration and the
introduction of residual stresses as a consequence.
9.3 Methods of Verification
Many investigations had been carried out to determine the applicability of
the hypothesis under a number of loading conditions. In metal fatigue studies,
specimens were usually subjected to a sequence of stress cycles in which the
amplitude and maximum stress level were maintained constant at one set of
values for a fraction of the estimated life, then at another set of values for
another fraction of the life, and so on until failure resulted (Step tests).
However, in each case a limited number of tests has been run and usually only%one specimen has been tested for a given stress pattern. In Miner's work,
tests were performed on single specimens for each sequence of loading, con
sisting of one, two, three, or four steps (VIZ, two, three, four, or five
stages) in the sequence and the range of values for2 n^/N^ was from 0.61 to
1.49» with an average value close to unity. On the basis of the same tests99Dolan, Richart, and Work reported a much larger range of values forEnj/N^ihowever
an average value of approximately unity was also indicated by these tests.102 in.
Marco and Starkey reported, on the basis of tests by Kibbey, in which single
specimens were tested with 2,3,4»5»6 and 7 steps, that the average value of
^n./N. was 1.49 for ascending load, and 0,78 decending load. Marco and Starkey102
also confirmed in their own work' that^n^/N^ was less than unity in one step
tests of decending load and more than unity in onestep tests of ascending
load.
36In the field of concrete, the results of Hilsdorf and Kesler, quoted above,
were obtained from one-step tests performed on single beam specimens for each
sequence of loading. The block programme loading similar to the type used by104. < ■
Coten and Dolan «was employed in which a test load was applied in repeated
block each of which consisted of n^ cycles at stress level , n? at S2 ig.9.2)
The reported results indicated thatSn^/N^ was sometimes greater and sometimes
less than unity. *
In view of the variation and wide range of values ofSn^/N^,reported in
these investigations and the uncertainty regarding the effect of the number of
the steps in a sequence of loading and the order in which they are applied, a
series of tests was conducted by the writer in an attempt to determine whether
these factors would effect the value of2 n^/N^ thus checking the validity and
limitations of the Palmgren-Miner hypothesis.
The tests reported in Chapters 9 and 10 have been of two main types. First
reported in this chapter, are the 'Step' tests, where testing commences tinder
constant amplitude loading at one maximum stress level and the level is changed
once after a fixed cycle ratio (n^/N^) to a second stress level which is maintained
until total failure of the specimen has occurred. The minimum stress level is
kept constant throughout, the maximum stress level being either decreased or
increased from the first to the predetermined second stress level.
The second type of test is the mixed spectrum test ('spectrum' refers to
amplitudes), which approximates more closely to service loading conditions. In
such tests there are two or more steps, and after the final step repeated load
ing is continued to failure at the predetermined stress level. The difference
between this and the first type of test is that although the stress level (viz.
7(#> and 8($) are kept constant, they are repeated in "saw-tooth" formation.
The results of the writer's tests of this'type will be discussed in chapter 10.
The validity of the Palmgren-Miner hypothesis is generally judged by the
cumulative cycle ratio , for example 2 n./N.; at failure, and usually written ini i
the abbreviated form 2 n/N.
- 85 - ■
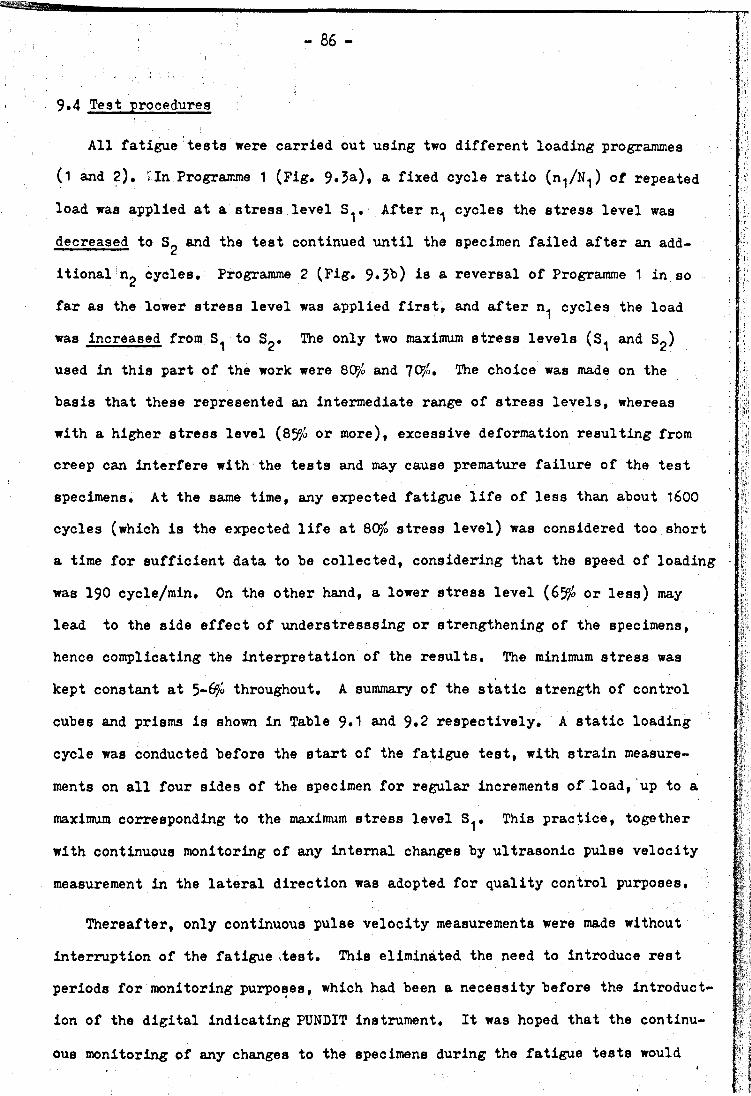
9.4 Test procedures
- 86 -
All fatigue tests were carried out using two different loading programmes
(1 and 2). Tin Programme 1 (Pig. 9«3a), a fixed cycle ratio (n^N^) of repeated
load was applied at a stress level S^. After n1 cycles the stress level was
decreased to and the test continued until the specimen failed after an add
itional ng cycles. Programme 2 (Pig. 9«3b) ia a reversal of Programme 1 in so
far as the lower stress level was applied first, and after n^ cycles the load
was increased from to S^. The only two maximum stress levels (S^ and S2)
used in this part of the work were 80¡o and 70^. The choice was made on the
basis that these represented an intermediate range of stress levels, whereas
with a higher stress level ( 8 % or more), excessive deformation resulting from
creep can interfere with the tests and may cause premature failure of the test
specimens. At the same time, any expected fatigue life of less than about 1600
cycles (which is the expected life at QQP/o stress level) was considered too short
a time for sufficient data to be collected, considering that the speed of loading
was 190 cycle/min. On the other hand, a lower stress level (659l° or less) may
lead to the side effect of understresssing or strengthening of the specimens,
hence complicating the interpretation of the results. The minimum stress was
kept constant at 5-6a/o throughout. A summary of the static strength of control
cubes and prisms is shown in Table 9*1 and 9*2 respectively, A static loading
cycle was conducted before the start of the fatigue test, with strain measure
ments on all four sides of the specimen for regular increments of load, up to a
maximum corresponding to the maximum stress level S^. This practice, together
with continuous monitoring of any internal changes by ultrasonic pulse velocity
measurement in the lateral direction was adopted for quality control purposes.
Thereafter, only continuous pulse velocity measurements were made without
interruption of the fatigue stest. This eliminated the need to introduce rest
periods for monitoring purposes, which had been a necessity before the introduct
ion of the digital indicating PUNDIT instrument. It was hoped that the continu
ous monitoring of any changes to the specimens during the fatigue tests would

improve the accuracy in interpretation of the results since it wa3 known that11.»)rest periods can cause a lengthening of the fatigue life of the specimens.
9*4.1 Selection Methods for fatigue specimens
Several pilot batches of specimens were tested with the loading programmes
1 and 2, selecting the specimens by the method outlined in section 5*2 chapter
5, p. 38 . As was expected, inconsistencies among the results were encountered.
Indeed, after a few batches had been tested, the inconsistencies were found to
be so great that it was hardly possible to draw any conclusion from the experi
mental values of^n/N and n^/Ng. It was finally decided that apart from certain
factors arising from the uncontrollable working charecteristics of the LOS
Machine (e,g. the automatic load maintainer devices can introduce a variation
in final loading of - y/o)\ the main source of these inconsistencies was the
variation in strength of the control prisms and the fatigue specimens. There
fore, more precise methods of selection of fatigue specimens were developed and
thereafter used throughout this part of the work.
9.4.2 Nondestructive method of quality control
The previous method and the new method developed may be summarised as •
follows.
Previous method: Out of 8 prisms in a batch, 3 control prisms were randomly
selected and tested to determine the likely average static strength of the
batch on which basis the stress levels were calculated and randomly assigned to
4 fatigue specimens. The last prism was tested statically at the completion of
the fatigue teststo check the gain of strength during the period of the tests.
Note; This method was sometimes changed to the following pattern; 2 control
prisms before, 1 during and 1 at the completion of the tests. This was adopted
especially when the period of testing was longer than the normal 7-9 days/batch,
in order that a slight gain in strength during the test period could be detected
and the assigned load adjusted accordingly.
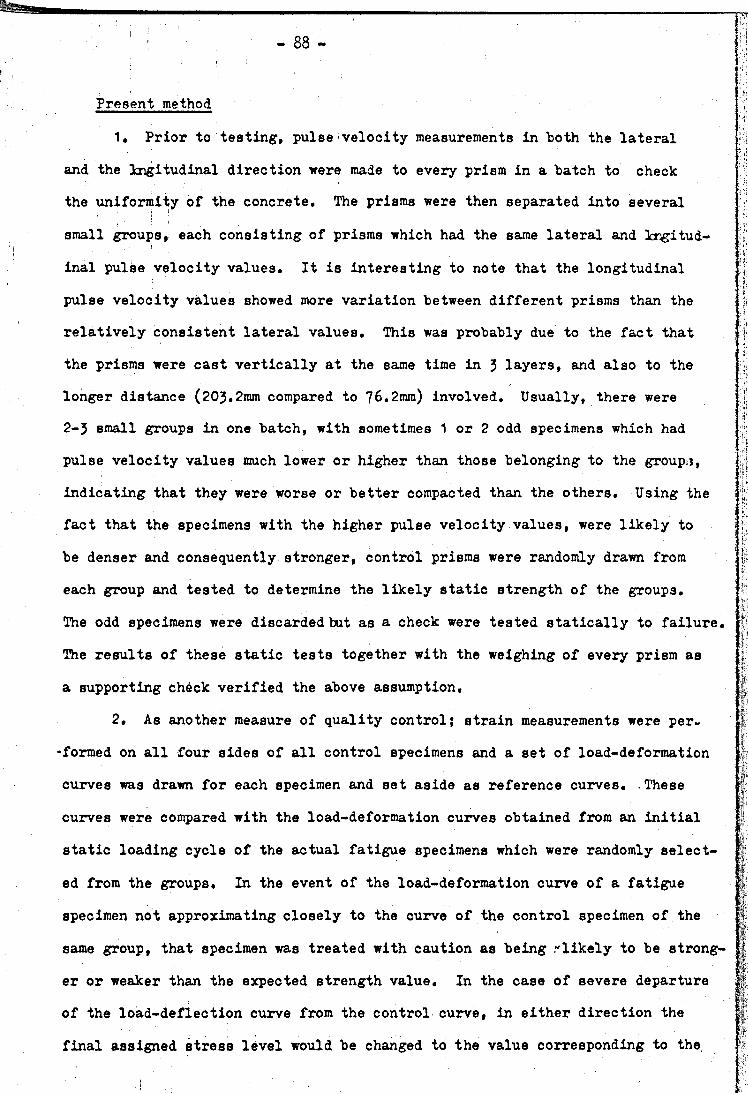
Present method
1. Prior to testing, pulse velocity measurements in both the lateral
and the Ingitudihal direction were made to every prism in a batch to check
the uniformity of the concrete. The prisms were then separated into several
small groups, each consisting of prisms which had the same lateral and lngitud- >'■ ij!
inal pulse velocity values. It is interesting to note that the longitudinal X
pulse velocity values showed more variation between different prisms than the )i
relatively consistent lateral values. This was probably due to the fact that
the prisms were cast vertically at the same time in 3 layers, and also to the
longer distance (203.2mm compared to 76.2mm) involved. Usually, there were j!
2-3 small groups in one batch, with sometimes 1 or 2 odd specimens which had
pulse velocity values much lower or higher than those belonging to the groupu, h
indicating that they were worse or better compacted than the others. Using the j.
fact that the specimens with the higher pulse velocity values, were likely to ii
be denser and consequently stronger, control prisms were randomly drawn from ! f
each group and tested to determine the likely static strength of the groups. :
The odd specimens were discarded but as a check were tested statically to failure.
The results of these static tests together with the weighing of every prism as
a supporting check verified the above assumption.
2. As another measure of quality control} strain measurements were per-
-formed on all four sides of all control specimens and a set of load-deformation 1
curves was drawn for each specimen and set aside as reference curves. These §
curves were compared with the load-deformation curves obtained from an initial |
static loading cycle of the actual fatigue specimens which were randomly select
ed from the groups. In the event of the load-deformation curve of a fatigue
specimen not approximating closely to the curve of the control specimen of the
same group, that specimen was treated with caution as being ."likely to be strong- 1
er or weaker than the expected strength value. In the case of severe departure
of the load-deflection curve from the control curve, in either direction the
final assigned stress level would be changed to the value corresponding to the |
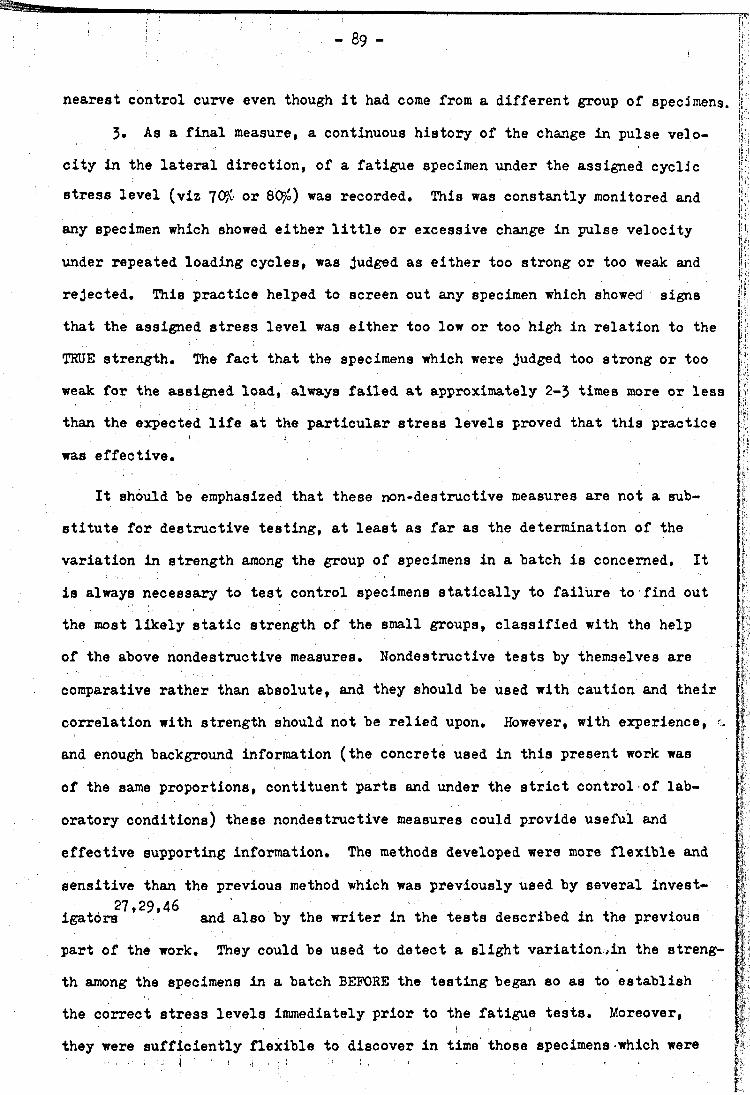
- 8 9 -
nearest control curve even though it had come from a different group of specimens
3. As a final measure, a continuous history of the change in pulse velo
city in the lateral direction, of a fatigue specimen under the assigned cyclic
stress level (viz 70?v or QO’/o) was recorded. This was constantly monitored and
any specimen which showed either little or excessive change in pulse velocity
under repeated loading cycles, was judged as either too strong or too weak and
rejected. This practice helped to screen out any specimen which showed signs
that the assigned stress level was either too low or too high in relation to the
TRUE strength. The fact that the specimens which were judged too strong or too
weak for the assigned load, always failed at approximately 2-3 times more or less
than the expected life at the particular stress levels proved that this practice
was effective.
It should be emphasized that these non-destructive measures are not a sub
stitute for destructive testing, at least as far as the determination of the
variation in strength among the group of specimens in a batch is concerned. It
is always necessary to test control specimens statically to failure to find out
the most likely static strength of the small groups, classified with the help
of the above nondestructive measures. Nondestructive tests by themselves are
comparative rather than absolute, and they should be used with caution and their
correlation with strength should not be relied upon. However, with experience,
and enough background information (the concrete used in this present work was
of the same proportions, contituent parts and under the strict control of lab
oratory conditions) these nondestructive measures could provide useful and
effective supporting information. The methods developed were more flexible and
sensitive than the previous method which was previously used by several invest- 27,29,46igators and also by the writer in the tests described in the previous
part of the work. They could be used to detect a slight variation.>in the streng
th among the specimens in a batch BEFORE the testing began so as to establish
the correct stress levels immediately prior to the fatigue tests. Moreover,■ ; r , ! : (
they were sufficiently flexible to discover in time those specimens-which were

!•>-| .
wrongly loaded at the commencement of the teats.' 1V't9.5 One-step test results ?.i.
lU.:The results of the one-step tests are summarised in Table 9.3. It will
be observed that four specimens were tested for each set of values of 5^2 and <>i
n^/N^ and a total number of twelve specimens were tested in each programme of 'y•:s
tests. The column marked and S£ indicated the first and second stress ampli- *j;
tudes used in the test programmes. The value of2(n/N) gives the average for ,s-ja v ' «: j
all the specimens tested with a given set of values of S? and n1/N^. Also
in the columns marked Hg/Ng and2n/N, the results of each test are shown in in-
creasing order of magnitude. The values of n^/N^f ng/Ng and2n/N shown in the y’ if!
Table 9.3 were computed by using the mean (probability of failure «* 0.5) value !|Vf: j
of N1 and Ng as determined from the S-N-P diagrams derived from the cumulative L‘j
distribution function discussed in Chapter 5« ;1■ • iifi*f;
Curves showing the relationship between the percentage decrease of original
pulse velocity (V) in maximum and minimum and the number of applied cycles (n)
both in linear and logarithmic scale are shown in Pig. 9*4-9«5 for tests of n.j/N.j
- 0.25 (S^Sg). It will be observed that the two types of graph showed different
trends due to the different scales used. .It was sometimes necessary to use the
logarithmic scale in plotting n because of the large number of cycles involved,
coupled with the rapid change of V in the early stages. However, this would be
misleading in interpreting the results. Therefore, the plot of V against cumula
tive cycle ratio (2n/N)was investigated (Fig. 9*6) and it was found that there
was a clearer relationship between V (which can be used as an indirect means to
define fatigue damage) and fatigue life (Sn/N), In subsequent tests, therefore,
the relationships between V (damage) and fatigue life were represented in this
way. (Fig. 9.7-9.11) The summary of all the results is shown in Fig. 9*12.
*1•J
f.C
h%
■*,y
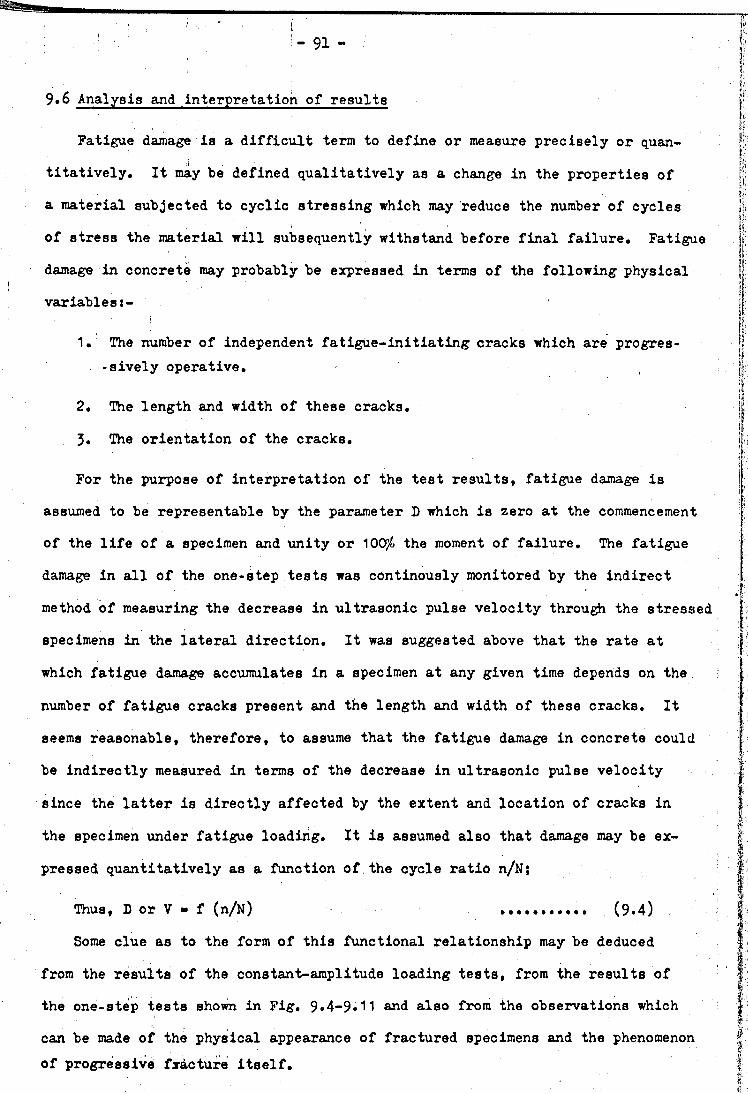
- 91 -
9.6 Analysis and interpretation of results
Fatigue damage is a difficult term to define or measure precisely or quan
titatively. It may be defined qualitatively as a change in the properties of
a material subjected to cyclic stressing which may reduce the number of cycles
of stress the material will subsequently withstand before final failure. Fatigue
damage in concrete may probably be expressed in terms of the following physical
variables:-
1. The number of independent fatigue-initiating cracks which are progressively operative.
2. The length and width of these cracks.
3* The orientation of the cracks.
For the purpose of interpretation of the test results, fatigue damage is
assumed to be representable by the parameter D which is zero at the commencement
of the life of a specimen and unity or 100^ the moment of failure. The fatigue
damage in all of the one-step tests was continously monitored by the indirect
method of measuring the decrease in ultrasonic pulse velocity through the stressed
specimens in the lateral direction. It was suggested above that the rate at
which fatigue damage accumulates in a specimen at any given time depends on the
number of fatigue cracks present and the length and width of these cracks. It
seems reasonable, therefore, to assume that the fatigue damage in concrete could
be indirectly measured in terms of the decrease in ultrasonic pulse velocity
since the latter is directly affected by the extent and location of cracks in
the specimen under fatigue loading. It is assumed also that damage may be ex
pressed quantitatively as a function of the cycle ratio n/N{
Thus, D or V - f (n/N) .......... (9.4)
Some clue as to the form of this functional relationship may be deduced
from the results of the constant-amplitude loading tests, from the results of
the one-step tests shown in Fig. 9.4-9.11 and also from the observations which
can be made of the physical appearance of fractured specimens and the phenomenon of progressive fracture! itself.
- 92 -
Evidence from the curves of the relationship between V and n in log scale;
V and cycle ratio (n/N) for specimens tested at different stress levels and V
and 2 n/N in one-step tests together with Raju's plots of V against percentage
of life (n/N)2^ seems to suggest that the functional form of D or V ■ f (n/N)
may be represented by the exponential relationship.
D - a(n/N)b ......... (9-5)
Where a and b are experimental constants
In view of the large scatter of the results obtained it seems that only
statistical methods of analysis of the data could make possible any proper in
terpretation of the results. Therefore, the fit of the data points of V against
n in log scale; V against n/N for results obtained from constant amplitude tests
(chapter 7) and V against2n/N in one-step tests was investigated using Non
linear regression to obtain the best fitting curve of the form y - axb where
n is the independant variable (n , n/N or2n/N) and y is the observed dependent
variable (Damage or V)
The problem is reduced to one of linear regression by taking the log of
both sides of the equation (9.5)
Thus, log D - log (a) + b log (n) ;
or log D - log (a) + b log (n/N) ;
or log D - log (a ) + b log (2 n/N) ;
and substituting Y' - log D, X'»log(n); log (n/N) or log (In/N),
and A' - log a $Hence, Y' - A' + BX’
a linear regression analysis(by the method of least squares) was performed
to determine A' and B', then A was determined byA'A ■ e
The formulea are as follows: 11V
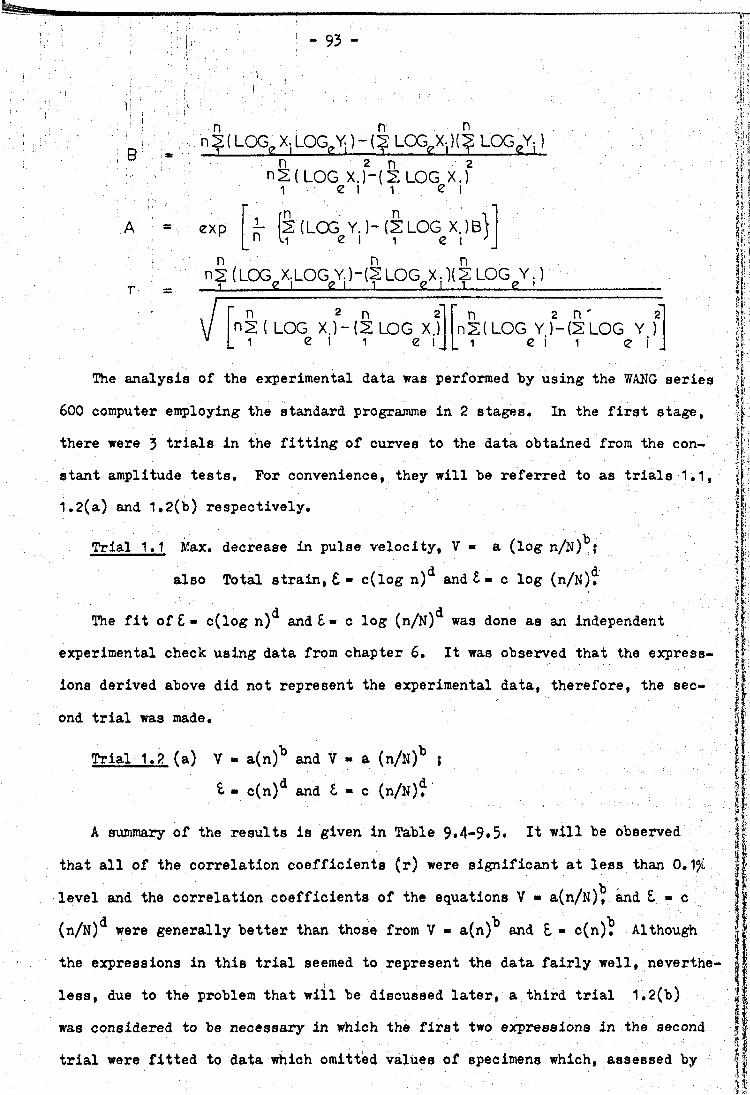
- 93 -
B
A
r- =
n 2 ( LQ G ^ X- LO G ^Y,) - ( | LOG^X-,) ( | LO G ^Y,n 2 n 2
n 2 ( LO G X .)—( 2 LO G X .)1 e i 1 e i
exp i s (LOG Y . ) - ( 2 LOG X . ) b \ n U e i 1 e i ;
n § ( LOG^Xj LO G^Y.) - ( 2 L O G ^X , ^ L O G '^Y ; )
n 2 n i n 2 n ' 2r>2 ( LO G X .) -■ (2 LO G X.) n2 ( LO G Y . ) - ( 2 LO G Y )
1 e i 1 2 I _ 1 2 i 1 e i
The analysis of the experimental data was performed by using the WANG series
600 computer employing the standard programme in 2 stages. In the first stage,
there were 3 trials in the fitting of curves to the data obtained from the con
stant amplitude tests. For convenience, they will be referred to as trials 1.1,
1.2(a) and 1.2(b) respectively.
Trial 1.1 Max. decrease in pulse velocity, V • a (log n/N)*5;
also Total strain, £ - c(log n) and£- c log (n/N).
The fit of £ - c(log n)^ and £ ■* c log (n/N)^ was done as an independent
experimental check using data from chapter 6. It was observed that the express
ions derived above did not represent the experimental data, therefore, the sec
ond trial was made.
Trial 1.2 (a) V - a(n)*5 and V ■ a (n/N)*5 ;
£ - c(n)^ and l - c (n/N)^
A summary of the results is given in Table 9*4-9»5* It will be observed
that all of the correlation coefficients (r) were significant at less than 0,1i
level and the correlation coefficients of the equations V - a(n/N)^ and £ - c
(n/N) were generally better than those from V - a(n) and £ ■ c(n). Although
the expressions in this trial seemed to represent the data fairly well, neverthe'
less, due to the problem that will be discussed later, a third trial 1.2(b)
was considered to be necessary in which the first two expressions in the second
trial were fitted to data which omitted values of specimens which, assessed by

the method described on p. 88 » were excessively weak or strong. The results
are also summarised in Table 9*4—9•5• Again, the correlation coefficients (r)
were all significant at less than 0.1$ level indicating that there is a valid
association between the two variables of the relationships established. It will
be noticed that the r values have improved on account of the more consistent
data. Curves showing the relationship derived from these equations and from
the last two equations in trial 1.2(a) at different stress amplitudes are shown
in Pig. 9.13-9.16.
it• .1
After the data of the constant amplitude tests were analysed, the data from
the one-step tests were analysed in the second stage which for convenience, they
will be referred as 2.1, 2.2, and 2.3 as follows:
2.1 Curves of the equations V ■ a(n)^ and V - a(n/N)^ were fitted to all
the data from specimens tested at stress levels of 80$ and 70$ respectively in
the first stages of the one-step tests. This was done as an independent experi
mental check of the expressions derived from the constant amjlitude test over the
full life of the specimens. The results are shown in comparison with the results
from stage 1 in Table 9.4-9.5» and graphically shown in Pig. 9.17-9.18» The
values of r, in this stage of analysis show an improvement over those in the
first stage probably on account of the more scrupulous control of the tested
specimens.
2.2 For the purpose of detailed analysis and interpretation of the results
of the one-step tests, the above equations were fitted to the data obtained from
specimens tested at S1 - 80$ and S1 - 70$ for n1/N1 - 0.25»0.5. and 0.75 separat
ely. This enabled the course of damage in the first stage of the tests to be
established from the same four specimens,that continued into the second stage.
The summary of the results are shown in Table 9.6. The values of r which are
significant at the 0.1$ level provide an adequate assurance of the relationship
established. ' - ’
It will be observed that in the second stage of analysis (Table 9*6) all
' i "i ! ')
J i. !

- 95 -
the values of N, both at 80$ and 70$ stress levels, derived by extrapolation
of the relationships established from all the data predicted lives of 1,689
cycles and 96f40O cycles. These are very close to those given by the S-N-P
diagrams at P - 0.5 which are 1,632 cycles at S ■ 80$ and 971486 cycles at 3 -
70$. This observation is significant in two ways. Firstly, it implies that
the results of the statistical analysis of the S-N-P diagram which was derived
from all the data are still valid when applied to the more strictly controlled
specimens. 0a the other hand, it also implies that the non-destructive method
of quality control suggested in Section 9*4»2 of this chapter is an effective
means for detecting variation in strength of the specimens prior to testing
and providing a very sensitive means of predicting with accuracy the approximate
number of cycles to failure of a specimen at a given stress level. Secondly,
it improves the validity of the conclusions drawn from the results on one-step
tests by increasing the accuracy with which the stress levels were applied in
each test.
2.3 In order to determine the course of damage at the second stage of the
one-step tests, the equations:
V2 - a(n2)b and V2 - (n2/N2)b
where V_ - The maximum decrease in pulse velocity value^ \
due to n2 at S2
n2 - number of cycles at S2
n2/N2« cycle ratio at S2
were fitted to the group of data at S2 - 70$ and 80$ after ■ 0.25;
0.5 ; 0.75 respectively. The summary of the results is shown in Table 9*7 and
9.8.
9.6.1 Stress Dependence
One of the problems in the investigation of fatigue damage in concrete is
to determine whether or not the damage-cycle ratio relationship (D or V against
n/N) is stress-dependent. The method of analysis suggested in chapter 8 was
employed to check the relationship using the expressions obtained from the
regression analysis in trial 1.2(a) as follows:b d.
a) The plot of ■ a^(n/N) and £ - c^(n/N) at different stress
amplitudes (indicated by the suffix i) were first investigated and the values
of and t at the end of the fatigue life (n/N - 10Q£) were determined from
the equations. (Pig. 9»19a)
b) The values of Vui and as above were substituted in the equationsbi d^
Vi - a^(n) and ■ c^(n) to arrive at the best estimate of the fatigue life
at each stress amplitude. These values were used to establish the terminalb i d ipoints (N^f Vui> and (Ni*^ui) of the curves - a^(n) and - c^(n) (Pig.
9 . i 9 . b )
c) The ultimate damage for a stress level of 80/ was also assumed for the
other stress levels, and normalised curves of V or £ against n/N were drawn.(Fig. 9*19.C)
The normalised curves (see Fig. 20) clearly indicate that the fatigue dam
age of concrete in compression is infact stress-dependent, that is to say the
amount of damage at a given cycle ratio depends on the stress amplitude. It
will be observed that the course of damage represented by plots of V against
n/N was convex upward and with the exception of the damage curve at a stress
amplitude of 75/, the trend was that during the early part of the life fatigue
damage progressed more quickly at low than at high stress amplitudes while
during the later stages of the life the opposite was the case. The seemingly
identical damage-cycle ratio relationship at 65/- and 70/ stress amplitudes and
the anomalous trend of damage at 75/ were probably a reflection of the large
scatter of the ecperimental data of the former and the limited data available
for the latter. This was examined further in trial 1.2(b) where the data from
obviously weak or strong specimens (assessed by the method described on P-88
were excluded from the analysis. Using the steps outlined above and the norma
lised damage (V) - cycle ratio curves (Pig. 9«21) at each stress amplitude
- 9 7 -
clearly indicate different damage curves at 80$, 70$ and 65$ stress amplitude.
Apart from the exceptional curve at 75$, the general trend is the same as in
trial 1.2(a) (Pig. 9»20). Plots of normalised £ against n/N from results of trial
1.2(a)(Pig.9.22) and normalised V against n/N from 1-step test results (Fig. 9.23)
showed the sama trends of stress-dependence.
Evidence from the visual ovservations of the phenomena of progressive crack
ing of specimens tinder test at different stress amplitudes, together with a
study of the physical appearance of the fractured specimens, confirms the relative
values of Vui and the trend of the normalised damage-cycle ratio relationships.
The observation showed that there were no visible cracks up to a certain fraction
of the life for specimens tested at high stress amplitudes (85-80$) (In fact,
as indirectly indicated by the decrease in ultrasonic pulse velocity, some minute
internal cracks must have existed.) As suggested earlier in this chapter, the
rate at which the fatigue damage accumulates in a specimen at any given time
depends on the number, length and width of the fatigue cracks. Therefore, this
is a clear indication that fatigue damage in specimens which were stressed at
high levels took place more slowly during the early part of its life than in
specimens tested at low stress amplitudes (70-65$) but was higher during the
later stages of the life of the specimens. It was observed that when the de
crease in pulse velocity reached about 27-29$ of the original velocity (at about
70-85$ of its fatigue life) hairline cracks (about 0.1-0.2mm width) became vis
ible to the naked eye on the surfaces in the middle portion of the specimens.
Prom this moment until failure, cracking developed at a very rapid pace, mainly
by lengthening and widening of the existing cracks rather than by the formation
of new cracks. Thus the ends of the fractured specimens which were tested at
high stress levels consistently showed less traces of visible damage (both vis
ible cracks on the surfaces and bond failure at the aggregate-cement matrix in
terfaces) than specimens tested at low stress levels, as clearly illustrated by
Plate 4« The curve of, 80$ in Fig. 9*21 represents the progress of fatigue damage
in a highly stressed specimen.
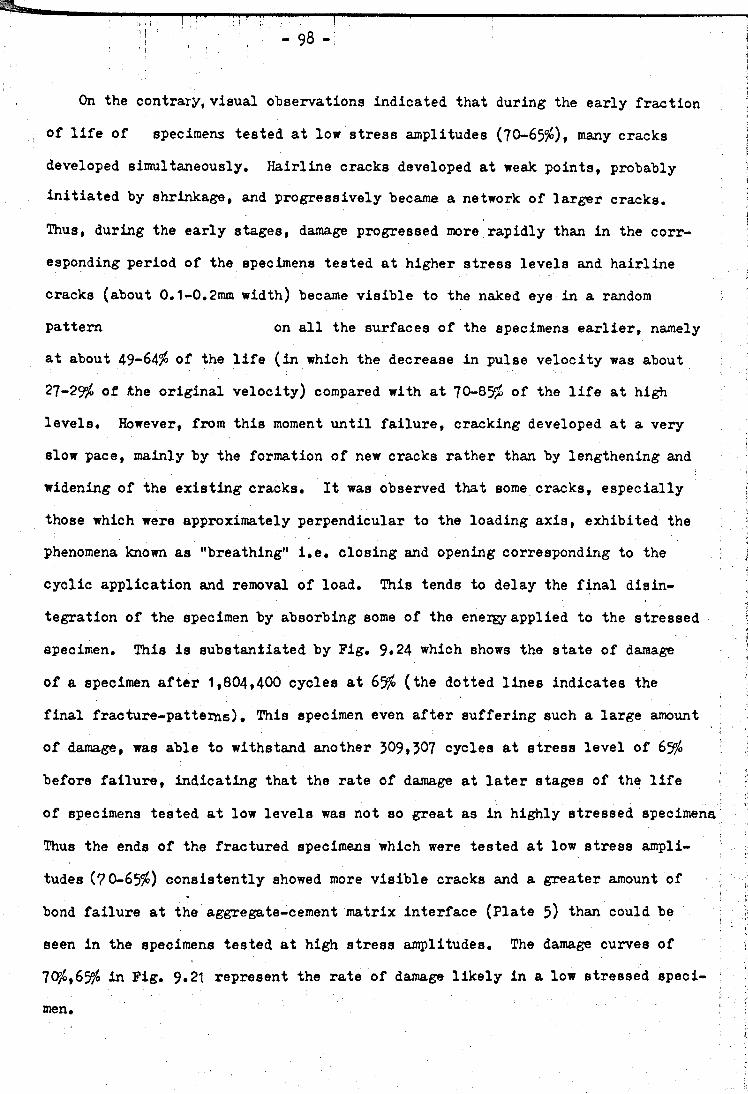
On the contrary, visual observations indicated that during the early fraction
of life of specimens tested at low stress amplitudes (70-65%), many cracks
developed simultaneously. Hairline cracks developed at weak points, probably
initiated by shrinkage, and progressively became a network of larger cracks.
Thus, during the early stages, damage progressed more rapidly than in the corr
esponding period of the specimens tested at higher stress levels and hairline
cracks (about 0.1-0.2mm width) became visible to the naked eye in a random
pattern on all the surfaces of the specimens earlier, namely
at about 49-64% of the life (in which the decrease in pulse velocity was about
27-29% of the original velocity) compared with at 70-85% of the life at high
levels. However, from this moment until failure, cracking developed at a very
slow pace, mainly by the formation of new cracks rather than by lengthening and
widening of the existing cracks. It was observed that some cracks, especially
those which were approximately perpendicular to the loading axis, exhibited the
phenomena known as "breathing" i.e. closing and opening corresponding to the
cyclic application and removal of load. This tends to delay the final disin
tegration of the specimen by absorbing some of the eneigy applied to the stressed
specimen. This is substantiated by Fig. 9«24 which shows the state of damage
of a specimen after 1,804,400 cycles at 65% (the dotted lines indicates the
final fracture-patterns). This specimen even after suffering such a large amount
of damage, was able to withstand another 309,507 cycles at stress level of 65%
before failure, indicating that the rate of damage at later stages of the life
of specimens tested at low levels was not so great as in highly stressed specimens
Thus the ends of the fractured specimens which were tested at low stress ampli
tudes (70-65%) consistently showed more visible cracks and a greater amount of
bond failure at the aggregate-cement matrix interface (Plate 5) than could be
seen in the specimens tested at high stress amplitudes. The damage curves of
70%,65% in Fig. 9«21 represent the rate of damage likely in a low stressed speci
men

- 99 -Ti! i i
i
It may be concluded from the analysed values of the coefficient of corre
lation, r, which were generally significant at less than 0.1$, that the relation
ships D (either measured in terms of the maximum decrease in pulse velocity in
lateral direction, V, or total strain,l,) - a(n)b , a(n/N)b or - c(n)d ,c(2)dwereI
quite adequate|to express the accumulation of the fatigue damage of concrete
specimens subjected to cyclic stresses in compression. It also may be concluded
that as the stress level increases, in the relationships: V - a(fi)b andt- c(n)d j
all of the constants (a,b,c and d) increase, a and b being greater than and c
and d less than unity. On the other hand as the stress level increases, in the
relationships: V - a(n/N)b and£- c(n/N)d; a and c are greater than unity and
decrease, while b and d are less than unity.
•*-j
i ;
An examination of Table 9.3 clearly establishes one significant fact. In
every series of tests in which the stress amplitude was decreased from a high
value to a low value, the value of2(n/N) was less than unity, (i.e. less thaqOTthe fatigue life predicted by the Palmgren-Miner hypothesis), that is the hypo
thesis is not safe when applied to this loading programme. On the other hand
in every series of tests in which the stress amplitude was increased from a low
to a high value, the value of2(n/N) was greater than unity showing the fatigue
life predicted by the hypothesis to be conservative. Thus the hypothesis did not
accurately predict the fatigue life of the specimens tested in this investigation* 1
It is of interest to mention that in the ohly other cumulative fatigue damagewhich 1/5
investigation of concreteAwas done in flexural tests, the opposite trends appear
ed to apply. It was found that when cyclic loading at a high stress was followed
by loading at a lower stress the fatigue life (2 n/N) achieved was more than
unity, but that it was less than unity when the first stress level was less than
the second. The contradiction between the conclusions from these flexural tensile
tests and those from the present investigation cannot easily be explained but
suggests radically different modes of fatigue damage under the two different
types of loading.
fl-:i'ik
iif
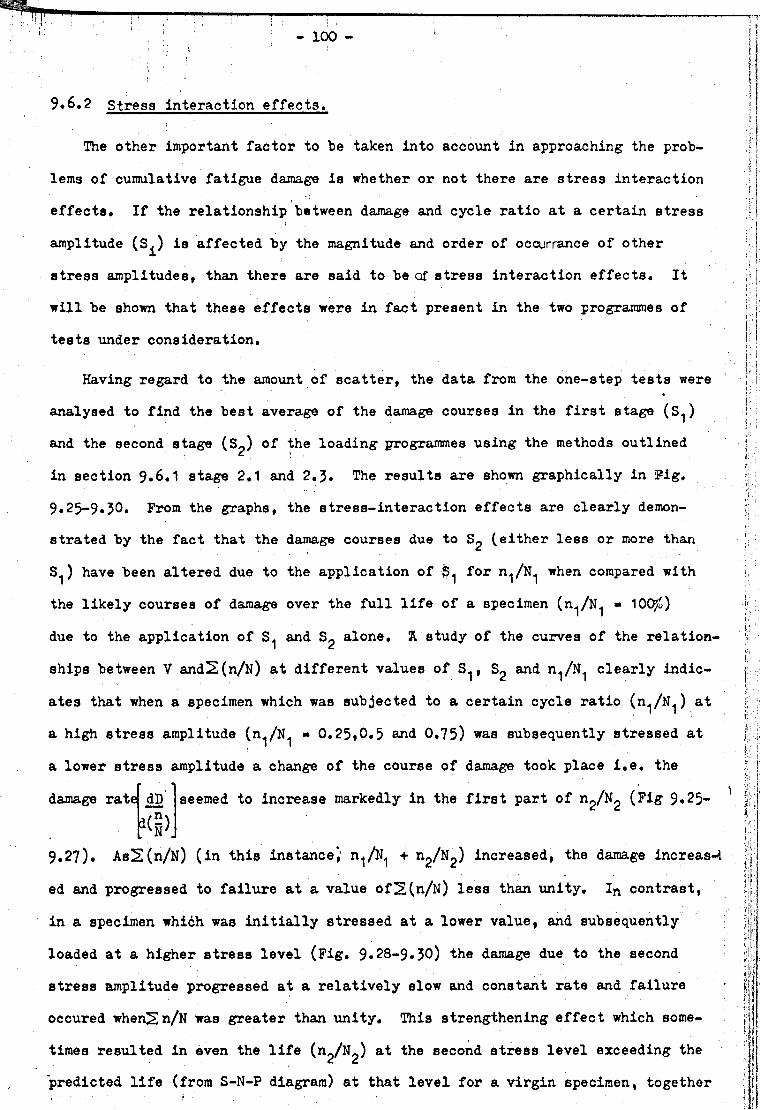
t.
9.6.2 Stress interaction effects.
The other important factor to be taken into account in approaching the prob
lems of cumulative fatigue damage is whether or not there are stress interaction
effects. If the relationship between damage and cycle ratio at a certain stress
amplitude (S^) is affected by the magnitude and order of occurrance of other
stress amplitudes, than there are said to be of stress interaction effects. It
will be shown that these effects were in fact present in the two programmes of
tests under consideration.
- 1 0 0 - '
Having regard to the amount of scatter, the data from the one-step tests were
analysed to find the best average of the damage courses in the first stage (S^)
and the second stage (S0) of the loading programmes using the methods outlinedC. *in section 9.6.1 stage 2.1 and 2.3. The results are shown graphically in Pig.
9.25-9.30. Prom the graphs, the stress-interaction effects are clearly demon
strated by the fact that the damage courses due to (either less or more than
S.j) have been altered due to the application of for n^/l^ when compared with
the likely courses of damage over the full life of a specimen (n^/N^ ■ 100^)
due to the application of and S2 alone. K. study of the curves of the relation
ships between V and2(n/N) at different values of S^, S2 and n1/N1 clearly indic
ates that when a specimen which was subjected to a certain cycle ratio (n^/N^) at
a high stress amplitude (n^/N1 « 0.25,0.5 and 0.75) was subsequently stressed at
a lower stress amplitude a change of the course of damage took place i.e. the
damage rate dD
W>)j
seemed to increase markedly in the first part of n2/N2 (Pig 9»25—
9.27). As2(n/N) (in this instance’,' n^/l^ + n2/N2) increased, the damage increas-4
ed and progressed to failure at a value of2(n/N) less than unity. In contrast,
in a specimen whidh was initially stressed at a lower value, and subsequently
loaded at a higher stress level (Fig. 9.28-9.30) the damage due to the second
stress amplitude progressed at a relatively slow and constant rate and failure
occured when2n/N was greater than unity. This strengthening effect which some
times resulted in even the life (n^/Ng) at the second stress level exceeding the
predicted life (from S-N-P diagram) at that level for a virgin specimen, together

- 1 0 1 -
with the above behaviour, indicated that there was indeed a stress-interaction
effect under compressive cyclic loading of varying amplitudes.
It is interesting to mention that the phenomenon known as ’understressing1
which causes the strengthening of a concrete specimen as have been reported 11 27 29elsewhere * ’’ ^(section 2.2.5,p»l6) has been observed to occur when the speci
men is subjected to about lO^cycles of a constant amplitude loading of a magni-n
tude less than the fatigue strength at 10’cycles(about 55 %)•
It is of importance to know the effect of the stage at which the stress amp
litude was changed(i.e. the value of n^/N^). It was demonstrated earlier in this
Chapter that the magnitude of the stress levels in the loading programme 1 and 2
(namely, or S < S 2) affected the damage to a specimen and the accuracy of
the predicted life using the Palmgren-Miner hypothesis. It also could be seen
from Figs. 9.25-9.30 that for loading programme 1 (Figs.9.25-9*27), the longer
the specimen was subjected to S^, the higher the rate of damage(dD/d(n/N))at S^.
The same conclusion can also be applied to loading programme 2 although,the
magnitude of the rate of damage in the former is much more than the latter.
(Figs. 9.28-9.30).
9.7 Conclusions
9*7*1 Cumulative fatigue damage of concrete under constant amplitude loading
1) A satisfactory relationship between the two variables namely, the damage
(D), indirectly indicated by the maximum decrease in pulse velocity in the
lateral direction (V) and the cycle ratio can be achieved by a power
function regression analysis, Y = aX .
2) Damage of a highly stressed specimen (S > 8($) accumulates more slowlymaxthan that of a low-stressed specimen (sma^ 70$) in the early fraction of life,
but progresses more quickly than the latter in the later part of the life.
3) The amount of fatigue damage produced by a given cycle ratio is not the
same for all stress levels but depends on the stress level to which the concrete
is subjected (Stress dependence).
. ' ! ¡1 |

- 102
I9.7*2 Cumulative fatigue damage of concrete under variable amplitude loading
1) The Palmgren-Miner hypothesis did not predict with accuracy the lives
of specimens subjected to the loading programmes 1 and 2 used in this part of
the study.
2) The specimens subjected to the loading programme 1 (high-low) had
shorter lives than predicted by the hypothesis, which could not therefore be
safely applied.
3) The hypothesis was too conservative when used to predict the life of a
specimen subjected to the loading programme 2 (low-high sequence).
k) From the curves showing the relationship between V and2n/N of one-step
tests indicated that stress interaction effects existed and the magnitude and
the order of application of the stress levels in a loading programme affected
the fatigue behaviour.
5) The application of a high stress level(i.e. 80 %) to a specimen for a
certain cycle ratio was found to cause a marked increase of the damage rate
(dD/d(n/N)) at a second and lower stress level so that Actual life (£n/N)______Life predicted by Palmgren
; I :
_____________________ < ! •-Miner hypothesis
6) The application of a low stress level(i.e. 70 %) to a specimen before
it was subsequently loaded at a higher stress level was found to have a benefi
cial effect so much so that the actual life at the second stress level (n^/N^)
sometimes exceeded the life predicted by the S-N-P diagram.
7) The longer the specimen was subjected to the first stress level, the
higher the rate of damage dD/d(n/N) at the second stress level. This is parti
cularly true in the loading programme 1.

- 103 -
CHAPTER TEN
13JLTIPLB STAGE CUMULATIVE DAMAGE TESTS
10.1 Introduction
In Chapter $, the results of one step tests in which the maximum
stress level was changed only once (loading programme 1 and 2 in Pigs.
9.3a and 9»3b)»have been discussed and compared with the predictions
derived from the Palmgren-Miner hypothesis. Such tests are not truely
representative of the actual conditions to which a structural member may be
exposed. Furthermore, there is a possibility that one-step tests may
engender strong emphasis on interaction effects that could be less signifi
cant in randomly variable loading conditions. It has also been seen that
this type of test, especially the low-high one-step test, appears to
accentuate the amount of .scatter normally encountered in fatigue experiments.
In order to test under conditions closer to the varying load spectrums
encountered in service, a number of multiple stage (i.e, 2-step and 4-step)
cumulative damage tests were performed by the writer and will be discussed
in this chapter. The test programmes were also designed with the objective
of studying whether the number and order of application of the steps in a
loading programme would affect the value of the cumulative cycle ratio
(2n./N^), that is the total fatigue life.
10.2 Test procedure
There are 2 main types of multi-step test reported in this Chapter.
They are as follows:
10.2.1 Two-step tests (D-series, part A and B) Five specimens were
tested for each loading programme (Programme 3 and 4 in Tables 10.7 and
10.8) which consists of a sequence of two changes of the maximum load
between.the ;two; stress levels - 80$ and Sg - 70$ of; the ultimate.
In programme 3 (D-series, part A), n^ cycles of repeated loads were applied

- 104 -
at a stress level S^. After n^ cycles the stress level was decreased
to $ 2 for a further cycles. Finally, the stress level was increased
to Sj (which is equal to S^) and the test continued until the specimen
failed after an additional n^ cycles. Program 4 (D-series part B) is an
inversion of Program 3 insofar as the lower stress level (iCf/o) was applied
first, and after n^ cycles the load was increased from 70% to QO% for
another n2 cycles. Finally, the load was decreased from 80% to 1[0%j and
test continued until failure occurred after an additional n^ cycles.
10.2.2 Four-step tests (E-series, part A and B) Five specimens were also
tested for each loading programme (Programme 5 and 6 in Tables 10.9 and
10.10) which consists of a sequence of four changes of the maximum load
between the two stress levels » 80/£ and S2 ■ 70% of the ultimate. In
programme 5 (E-series part A), n^, n2, n^, n^ of repeated load3 were applied
at stress levels 80, 70, 80, and 70% respectively. The number of cycles
n^ to n^ were assigned so that they corresponded to about one-fifth of the
fatigue life at 80% and 70$ stress levels. After n^ cycles at 70% the
stress level was increased to 80^ and the test continued until the specimen
failed after an additional n^ cycles. Program 6 is the inversion of
Programme 6 insofar as the lower stress level was applied first and
continued until failure occurred in the fifth and final stage.
The method of selecting the fatigue specimens was the same as in
section 9*4.2. The ultimate static strength of cubes and prisms of test
series D and E are summarised in Tables 10.1 - 10.2 and 10.3 - 10.4
respectively.
10.3 Two-step test results
The results of both loading programme 3 and 4 are summarised in
Table 10.5* The columns S^, S2 and indicate the first, second and
third stress levels used in the sequence and the columns n^/N^, n2/l\T2 and
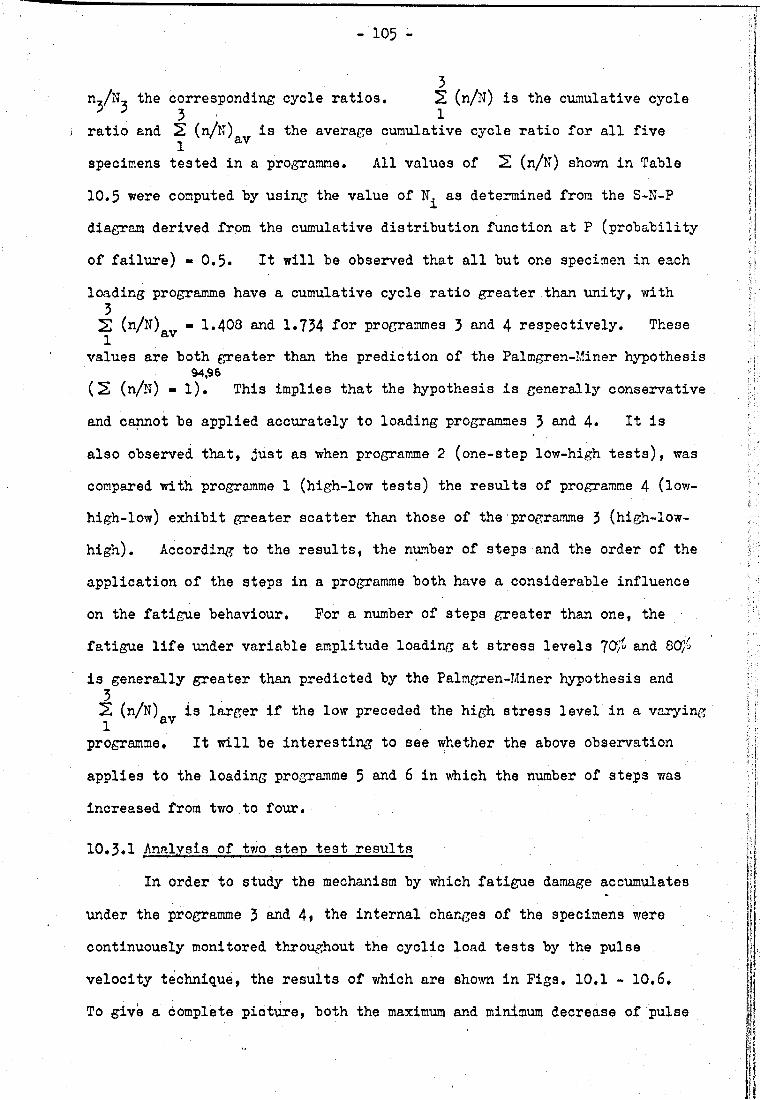
- 105 -
n,/N, the corresponding cycle ratios. 2 (n/N) is the cumulative cycleV 5 3 1
ratio and 2 (n/N) is the average cumulative cycle ratio for all five avspecimens tested in a programme. All values of 2 (n/N) shown in Table
10.5 were computed by using the value of N^ as determined from the S-N-P
diagram derived from the cumulative distribution function at P (probability
of failure) - 0.5. It will be observed that all but one specimen in each
loading programme have a cumulative cycle ratio greater than unity, with 32 (n/N) - 1.408 and 1.734 lor programmes 3 and 4 respectively. These1 av
values are both greater than the prediction of the Palmgren-Miner hypothesis 94,96
( 2 (n/N) - l). This implies that the hypothesis is generally conservative
and cannot be applied accurately to loading programmes 3 arid. 4* It is
also observed that, just as when programme 2 (one-step low-high tests), was
compared with programme 1 (high-low tests) the results of programme 4 (low-
high- low) exhibit greater scatter than those of the programme 3 (high-low-
high). According to the results, the number of steps and the order of the
application of the steps in a programme both have a considerable influence
on the fatigue behaviour. For a number of steps greater than one, the
fatigue life under variable amplitude loading at stress levels 70/“ and 80/
is generally greater than predicted by the Palmgren-Miner hypothesis and32 (n/N) is larger if the low preceded the high stress level in a varying 1 av
programme. It will be interesting to see whether the above observation
applies to the loading programme 5 and 6 in which the number of step3 was
increased from two to four.
10.3.1 Analysis of two step test results
In order to study the mechanism by which fatigue damage accumulates
under the programme 3 and 4» the internal changes of the specimens were
continuously monitored throughout the cyclic load tests by the pulse
velocity technique, the results of which are shown in Figs. 10,1 - 10.6.
To give a complete pioture, both the maximum and minimum decrease of pulse
3
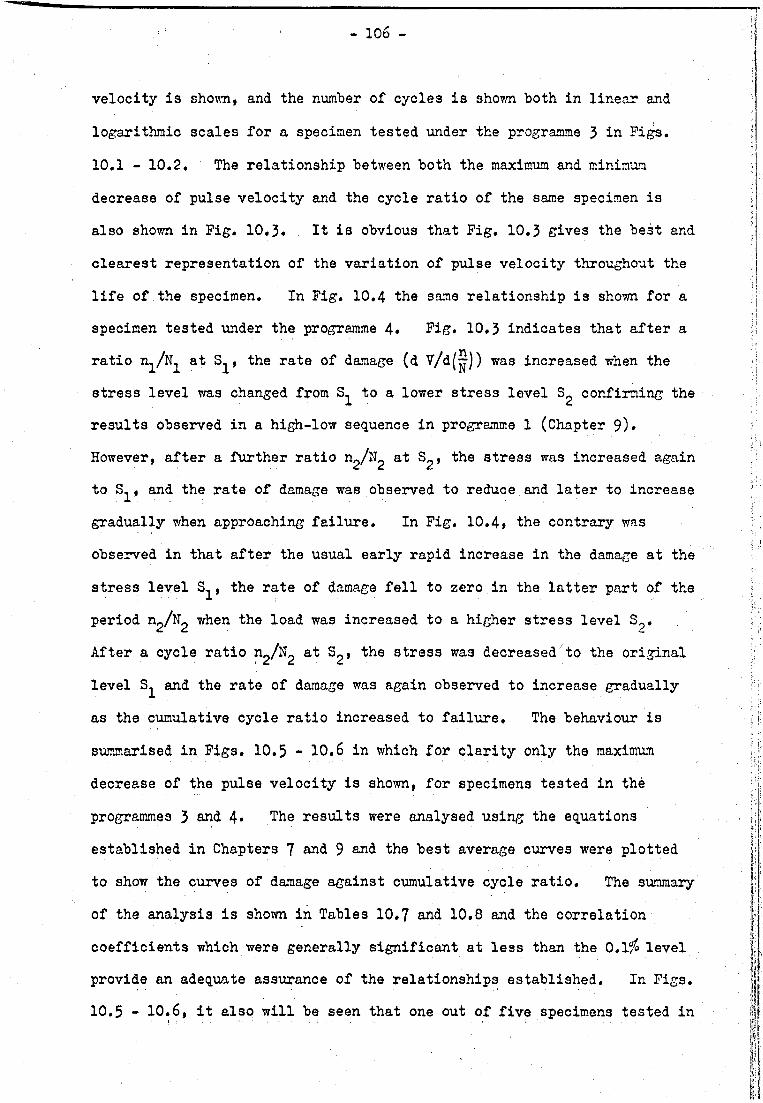
- 1 0 6 -
velocity is shown, and the number of cycles is shown both in linear and
logarithmic scales for a specimen tested under the programme 3 in Figs.
10.1 - 10.2. The relationship between both the maximum and minimum
decrease of pulse velocity and the cycle ratio of the same specimen is
also shown in Fig. 10.3. . It is obvious that Fig. 10.3 gives the best and
clearest representation of the variation of pulse velocity throughout the
life of the specimen. In Fig. 10.4 the same relationship is shown for a
specimen tested under the programme 4. Fig. 10.3 indicates that after a
ratio n^/N^ at S^, the rate of damage (d V/d(^)) was increased when the
stress level was changed from to a lower stress level confirming the
results observed in a high-low sequence in programme 1 (Chapter 9).
However, after a further ratio n2/U2 at S^, the stress was increased again
to S^, and the rate of damage was observed to reduce and later to increase
gradually when approaching failure. In Fig. 10.4, the contrary was
observed in that after the usual early rapid increase in the damage at the
stress level S^, the rate of damage fell to zero in the latter part of the
period n2/N2 when the load was increased to a higher stress level S^.
After a cycle ratio n2/N2 at S2, the stress was decreased to the original
level and the rate of damage was again observed to increase gradually
as the cumulative cycle ratio increased to failure. The behaviour is
summarised in Figs. 10.5 - 10.6 in which for clarity only the maximum
decrease of the pulse velocity is shown, for specimens tested in thè
programmes 3 and 4« The results were analysed using the equations
established in Chapters 7 and 9 and the best average curves were plotted
to show the curves of damage against cumulative cycle ratio. The summary
of the analysis is shown in Tables 10.7 and 10.8 and the correlation
coefficients which were generally significant at less than the 0.1$ level
provide an adequate assurance of the relationships established. In Figs.
10.5 - 10.6, it also will be seen that one out of five specimens tested in
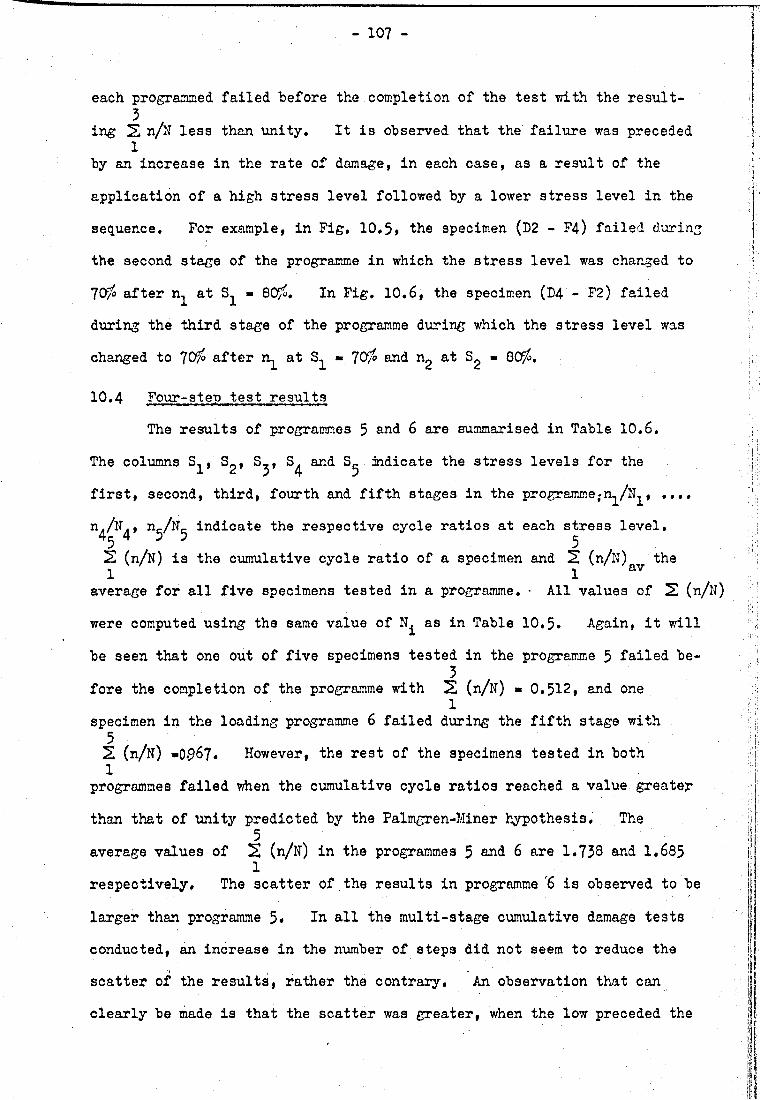
- 107 -
each programmed failed before the completion of the test with the result- 3
ing 2 n/N less than unity. It is observed that the failure was preceded 1
by an increase in the rate of damage, in each case, as a result of the
application of a high stress level followed by a lower stress level in the
sequence. For example, in Fig. 10.5* the specimen (D2 - F4) failed during
the second stage of the programme in which the stress level was changed to
70$ after at - 80$. In Fig. 10.6, the specimen (D4 - F2) failed
during the third stage of the programme during which the stress level was
changed to 70$ after at - 70$ and rx at - 80$.
10.4 Four-step test results
The results of programmes 5 and 6 are summarised in Table 10.6.
The columns S,, S„, S,, S, and Sc indicate the stress levels for the1 2’ y 4 5first, second, third, fourth and fifth stages in the programme;n^/N^, ....
V v n^/N^ indicate the respective cyole ratios at each stress level.
2 (n/N) is the cumulative cycle ratio of a specimen and 2 (n/N) the 1 1 av
average for all five specimens tested in a programme. • All values of 2 (n/N)
were computed using the same value of as in Table 10.5. Again, it will
be seen that one out of five specimens tested in the programme 5 failed be-3
fore the completion of the programme with 2 (n/N) * 0*512, and one1
specimen in the loading programme 6 failed during the fifth stage with 52 (n/N) »0.967* However, the rest of the specimens tested in both 1
programmes failed when the cumulative cycle ratios reached a value greater
than that of unity predicted by the Palmgren-Miner hypothesis. The5
average values of 2 (n/N) in the programmes 5 and 6 are 1.738 and 1.6851
respectively. The scatter of the results in programme '6 is observed to be
larger than programme 5* In all the multi-stage cumulative damage tests
conducted, an increase in the number of steps did not seem to reduce the
scatter of the results, rather the contrary. An observation that can
clearly be made is that the scatter was greater, when the low preceded the

- 108 -
high stress level in any alternating single or multiple step cycle loading
test, than in the opposite loading arrangement. With the exception of5
the average value of 2 (n/ll) in the programme 5» the observation made in1
section 10.5 applies to the four-step tests, that is to say an increase in
the number of the steps in a sequence leads to a slight increase in the
average value of the cumulative cycle ratio at failure which is generally
greater than the prediction of the Palmgren-Miner hypothesis.
10.4*1 Analysis of four-sten test results
The internal changes in each of the specimen tested in the
programme 5 and 6 as indicated by the decrease of the original pulse
velocity are shown against the cumulative cycle ratio in Figs. 10.7 and
10.8 respectively. The cumulative damage behaviour in the two programmes
is also summarised by the maximum decrease of pulse velocity in Figs. 10.9
- 10.10. The data were analysed using the method outlined in Chapters 7
and 9 and the best average curves derived from the analysis were fitted
to the data as shown in the figures. The summary of the results of the
analysis is also presented in Tables 10.9 and 10.10.
From Figs. 10,7 and 10.9» it will be observed that when was 80$,
the rate of damage increased markedly when the stress level was changed
to Sg - 70$. However, this sharp increase was reduced to a uniform rate
when the stress level was changed to - 80$. During the fourth stage
of the test, the load was decreased from to « 70$» and it was
observed that the rate of damage was again increased markedly due to the
influence of the previous loading history of the cycle ratio n^/U^ at>
stress Sj, but the rate was not as great as during at S2» Finally,
the load was increased to Sc - 80$ and the test continued to failure.
During this final stage the damage increased uniformly to failure. In
Figs. 10.8 and 10.10, it was observed that when the stress was increased
from - 70$ to ■> 80$ after n^/N^ «0.2, the rate of damage fell from
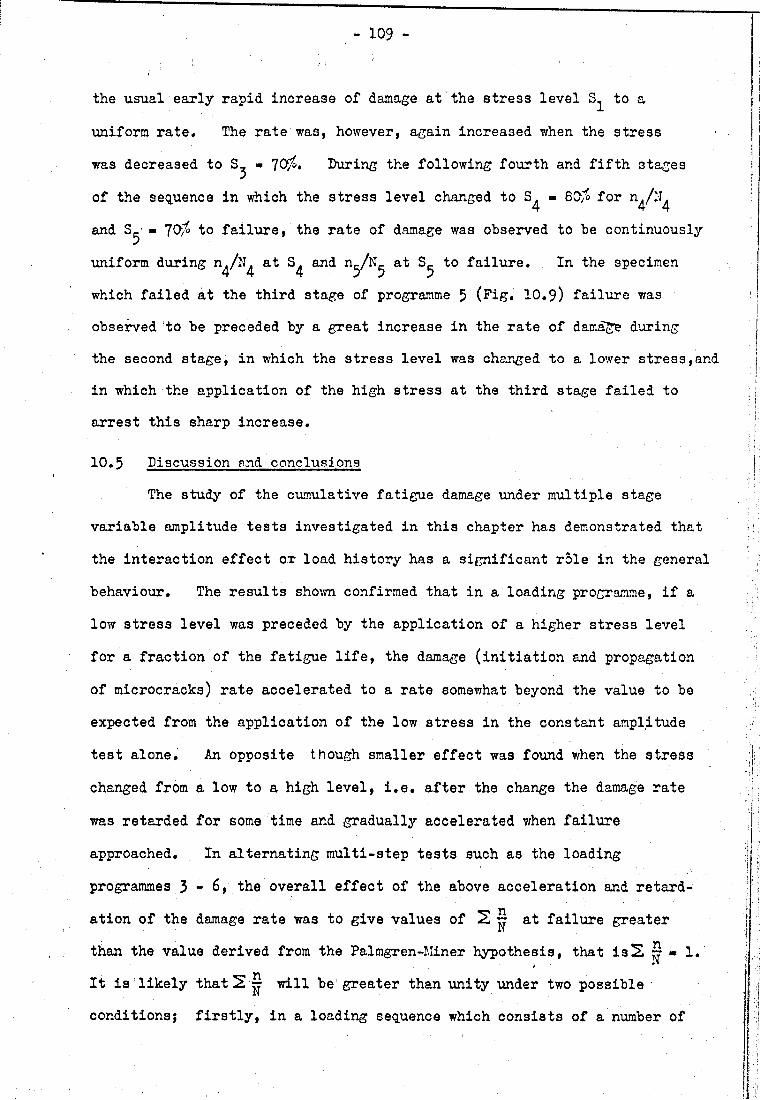
- 109 -
the usual early rapid increase of damage at the stress level to a
uniform rate. The rate was, however, again increased when the stress
was decreased to - 70$. During the following fourth and fifth stages
of the sequence in which the stress level changed to « 80$ for n /lf
and Sj.; - 70$ to failure, the rate of damage was observed to be continuously
uniform during n^/N^ at and ny/Nj. at S. to failure. In the specimen
which failed at the third stage of programme 5 (Fig. 10.9) failure was
observed to be preceded by a great increase in the rate of damage during
the second stage, in which the stress level was changed to a lower stress,and
in which the application of the high stress at the third stage failed to
arrest this sharp increase.
10.5 Discussion end conclusions
The study of the cumulative fatigue damage under multiple stage
variable amplitude tests investigated in this chapter has demonstrated that
the interaction effect or load history has a significant role in the general
behaviour. The results shown confirmed that in a loading programme, if a
low stress level was preceded by the application of a higher stress level
for a fraction of the fatigue life, the damage (initiation and propagation
of microcracks) rate accelerated to a rate somewhat beyond the value to be
expected from the application of the low stress in the constant amplitude
test alone. An opposite though smaller effect was found when the stress
changed from a low to a high level, i.e. after the change the damage rate
was retarded for some time and gradually accelerated when failure
approached. In alternating multi-step tests such as the loading
programmes 3 - 6, the overall effect of the above acceleration and retard
ation of the damage rate was to give values of at failure greater
than the value derived from the Palmgren-Miner hypothesis, that is2 ^ - 1.
It is likely that 2 will be1 greater than unity under two possible
conditions? firstly, in a loading sequence which consists of a number of

long periods at low stress level interrupted by occasional short periods
at high stress level (S 80$)» and secondly, when there are alternating
short periods of low and high stress levels. — can also be improved
by the initial application of a low cyclic stress for a short period of
about 20 - 30 per cent of the fatigue life at that stress level followed
by mixed cyclic stresses. These assumptions are, however, confined to
the speed of loading, maximum stress level and constant environmental
conditions observed in this investigation and their applicability to
concrete of . other mix proportions, age, etc. and environmental conditions
requires caution and has to be justified experimentally.
To explain the above behaviour, i.e. retardation and acceleration
in the damage rate in stepped tests requires more detailed fundamental
studies of the behaviour and interaction of the constituent component of
concrete - aggregate, water, and cement gel. However, a probable
phenomenological explanation of the above characteristics will be attempted
here:
Under cyclic load tests, assuming the specimen to have some fatigue
life, the applied maximum'stress level may not be sufficient to favour the
propagation of the existing microcracks induced during setting and
subsequently on drying due to local breakdown in the adhesion between the
aggregates and the matrix. However, concrete as a heterogeneous material
is not perfectly elastic} some energy is therefore stored in the material
with cyclic loading and this build-up of energy as manifested by an
increase in the internal temperature, when it reaches a sufficient magnitude
favours the growth of cracks. Because of the lower constant stress
amplitude and hence limited store of energy, it is more likely that a
larger number of new cracks forms, favoured by local discontinuities,
under a low cyclic stress compared to a fewer, well defined cracks in the
- Ill -
case of high stress (Chapter 9)» The greater decrease of pulsevelocity
at low than high cyclic stress also confirms the formation of such cracks.
If the applied stress is decreased from high to low after a fraction of
life, the excess energy after losses will mainly help towards the growth
of the existing cracks hence there is a rapid decrease in the pulse
velocity. On the other hand, if the high stress is preceded by a low
stress in a cyclic load test, most of the energy will be absorped by the
closing of a large number of microcracks and the energy demand required
for the formation and propagation of the existing microcracks will not be
met within a reasonable period of time unless the test is continued to
failure at the second and higher cyclic stress. This may probably explain
the retardation in the decrease of the pulse velocity (damage rate). It
should be emphasized that the above explanation is empirical and has yet
to be proved fundamentally.
The following conclusions can be drawn from the research
investigation:
1. The Palmgren-Miner hypothesis does not accurately predict the
fatigue life and generally gives too conservative a value of 2 for
multiple Step' loading programmes.
2. Stress interaction effects are significant in the cumulative
fatigue study of multiple stages and generally give2 ~ > 1 at failure.
3« The fatigue life of concrete subjected to cyclic loads of
varying amplitude is influenced by the number of steps and the order in
which they are applied. Generally, a larger number of short steps gives
a higher value of 2 Also, a low followed by a high cyclic stress innstep-tests gives a higher value of 2 jj.
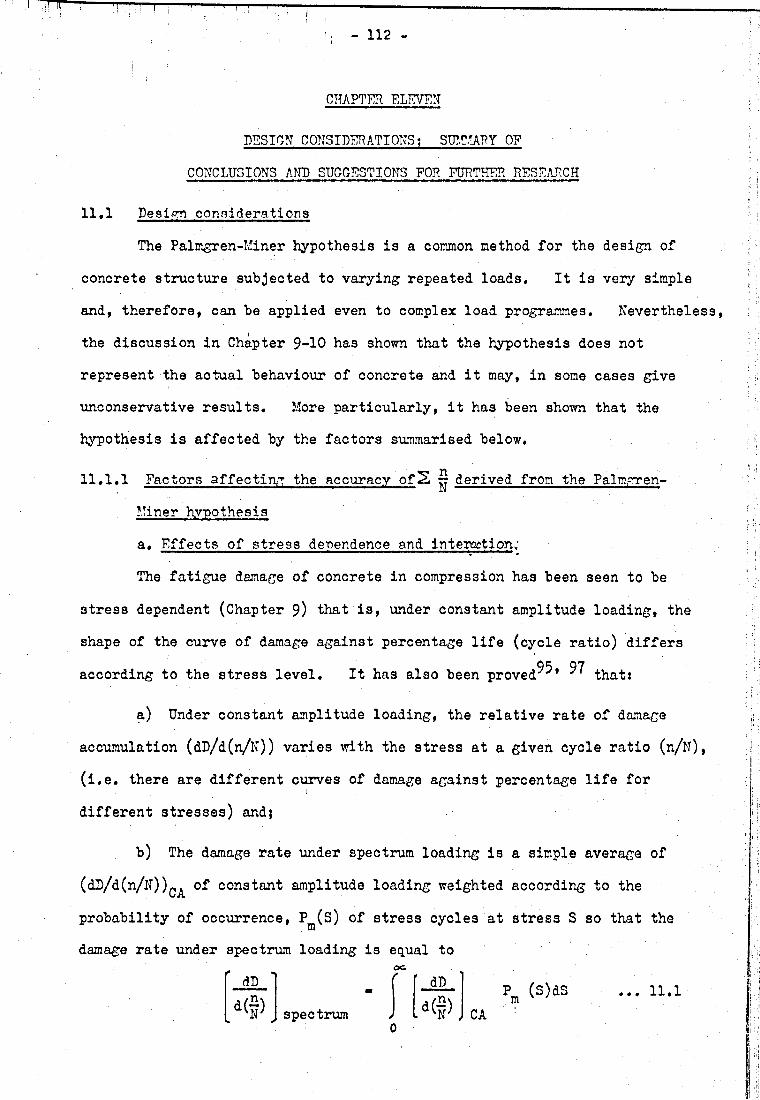
- 1 1 2 -
CHAPTER ELEVEN
RESIGN CONSIDERATIONS; SUMMARY OE
CONCLUSIONS AND SUGGESTIONS FOR FURTHER RESEARCH
11.1 Design considerations
The Palmgren-Miner hypothesis is a common method for the design of
concrete structure subjected to varying repeated loads. It is very simple
and, therefore, can be applied even to complex load programmes. Nevertheless,
the discussion in Chapter 9-10 has shown that the hypothesis does not
represent the actual behaviour of concrete and it may, in some cases give
unconservative results. More particularly, it has been shown that the
hypothesis is affected by the factors summarised below.
11.1.1 Factors affecting the accuracy ofS ~ derived from the Palmgren-
Miner hypothesis
a. Effects of stress dependence and interaction;
The fatigue damage of concrete in compression has been seen to be
stress dependent (Chapter 9) that is, under constant amplitude loading, the
shape of the curve of damage against percentage life (cycle ratio) differs95 97according to the stress level. It has also been proved77’ 7 that:
a) Under constant amplitude loading, the relative rate of damage
accumulation (dD/d(n/N)) varies with the stress at a given cycle ratio (n/N),
(i.e. there are different curves of damage against percentage life for
different stresses) and;
b) The damage rate under spectrum loading is a simple average of
(dD/d(n/N))CA of constant amplitude loading weighted according to the
probability of occurrence, Pm(S) of stress cycles at stress S so that the
damage rate under spectrum loading is equal to
dD
spectrum
OC
0
P (S)dS m ' ' « • • 11*1
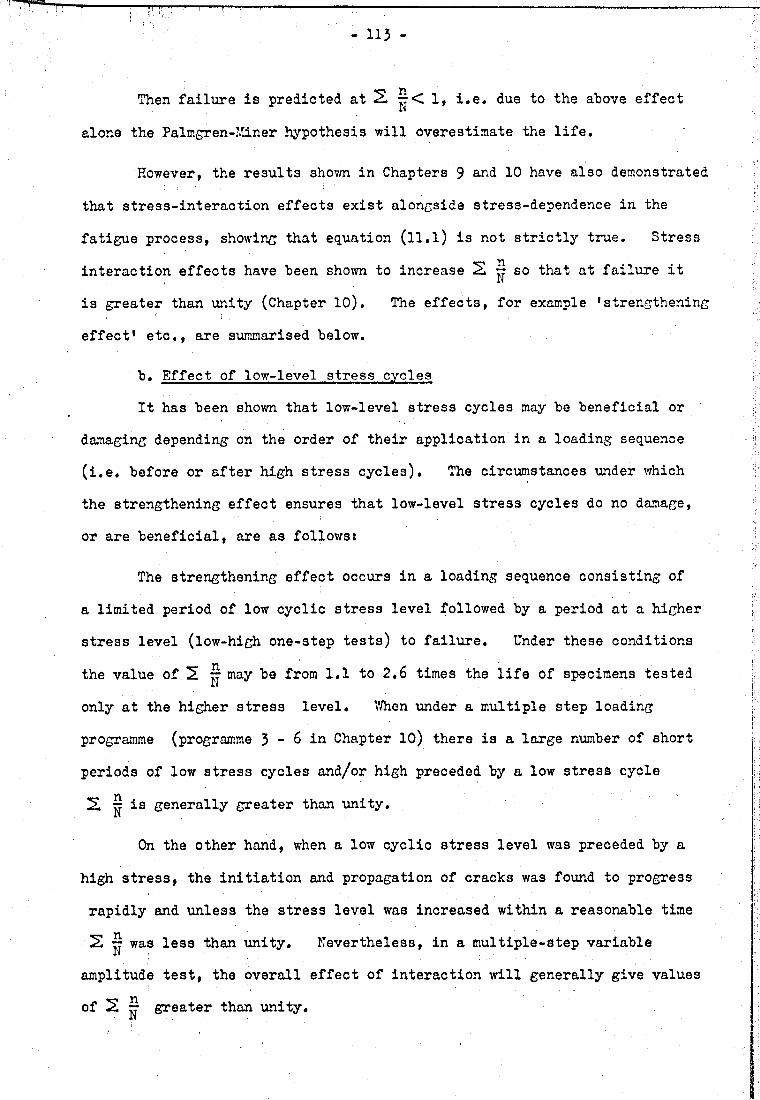
113 -
Then failure is predicted at 2 1, i.e, due to the above effect
alone the Palmgren-Iiiner hypothesis will overestimate the life.
¡However, the results shown in Chapters 9 and 10 have also demonstrated
that stress-interaction effects exist alongside stress-dependence in the
fatigue process, showing that equation (ll.l) is not strictly true. Stress
interaction effects have been shown to increase 2 — so that at failure it
is greater than unity (Chapter 10). The effects, for example •strengthening
effect' etc., are summarised below.
b. Effect of low-level stress cycles
It has been shown that low-level stress cycles may be beneficial or
damaging depending on the order of their application in a loading sequence
(i.e. before or after high stress cycles). The circumstances under which
the strengthening effect ensures that low-level stress cycles do no damage,
or are beneficial, are as follows:
The strengthening effect occurs in a loading sequence consisting of
a limited period of low cyclic stress level followed by a period at a higher
stress level (low-high one-step tests) to failure. Under these conditions
the value of 2 ^ may be from 1.1 to 2.6 times the life of specimens tested
only at the higher stress level. 7/hen under a multiple step loading
programme (programme 3 - 6 in Chapter 10) there is a large number of short
periods of low stress cycles and/or high preceded by a low stress cycle
2, ^ is generally greater than unity.
On the other hand, when a low cyclic stress level was preceded by a
high stress, the initiation and propagation of cracks was found to progress
rapidly and unless the stress level was increased within a reasonable time
2 ^ was less than unity. Nevertheless, in a multiple-step variable
amplitude test, the overall effect of interaction will generally give values
of 2 | greater than unity.

- 114 -
11.2 A conceptual damage-cycle ratio relationship
A mathematical formulation of the more sophisticated hypothesis
which allows for both stress-dependence and interaction, such as a
modification of Coten-Dolan^^ hypothesis, will result in expressions far
too complicated to be used as a design tool. A simpler empirical damage
concept to express the cumulative fatigue behaviour of concrete under
variable cyclic compression is presented in the following:
Fatigue damage, D, can be defined as a variable, beginning at zero
at the start of the fatigue life of a specimen and reaching unity at failure.
The curve of damage against percentage life (or cycle ratio) at one selected
constant amplitude cyclic stress can be given an arbitrary form. For
example, in Fig. 11.1 which is derived from the present series of one-step
tests the curve for the 70$ stress level is represented by a straight line.
This line, together with the curve marked 80$ (l) are the two curves to be
used in the evaluation of the fatigue life in high-low one-step tests.
The 70$ line is used with the curve marked 80$ (2) to determine the fatigue
life in low-high one step tests. The two curves 80$ (l) and (2) are
derived from the average of the results of one-step tests (Chapter 9)* and
the fact that there are two and not one 80$ curve is a clear proof of inter
action. The procedures for the determination of the fatigue life are as
follows:
a. For a programme consisting of two main levels in high-low sequence,
draw a vertical line from the value of n^/N^ (the fraction of the life at
the first stress level) to intercept the 80$ (l) line. From this point
draw a line parallel to the horizontal axis to the right to intercept the
70$ line and read the value of (the fraction of the life at constant
amplitude loading at the second stress level) from the scale below.2 n/N
is equal to n^/N^ + n2^2 will always be less than 'unity.
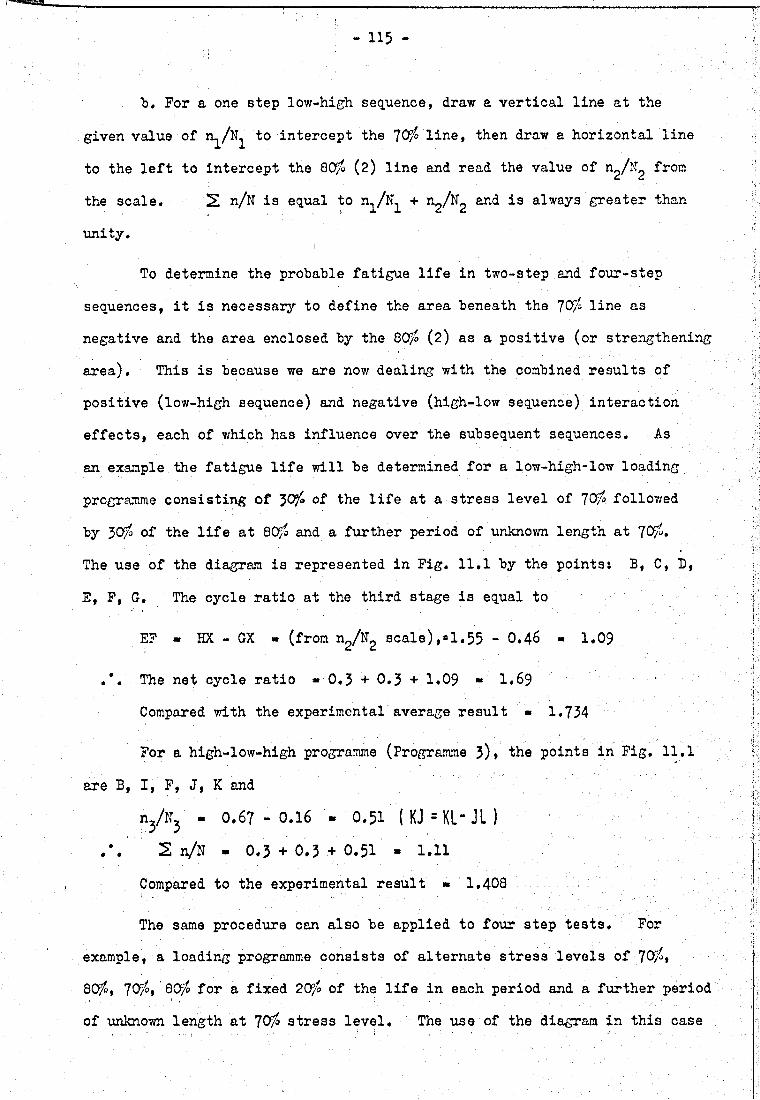
115 -
"b. For a one step low-high sequence, draw a vertical line at the
given value of n^/N^ to intercept the 70$ line, then draw a horizontal line
to the left to intercept the 80$ (2) line and read the value of n^N, from
the scale. 2 n/N is equal to n^/N^ + n2/N2 and is always greater than
unity. I
To determine the probable fatigue life in two-step and four-step
sequences, it is necessary to define the area beneath the 70$ line as
negative and the area enclosed by the 80$ (2) as a positive (or strengthening
area). This is because we are now dealing with the combined results of
positive (low-high sequence) and negative (high-low sequence) interaction
effects, each of which has influence over the subsequent sequences. As
an example the fatigue life will be determined for a low-high-low loading
programme consisting of 50$ of the life at a stress level of 70$ followed
by 50$ of the life at 80$ and a further period of unknown length at 70$•
The use of the diagram is represented in Fig. 11.1 by the points: B, C, D,
E, F, G. The cycle ratio at the third stage is equal to
EF - HX - GX - (from n2/N2 scale),»1.55 - 0.46 - 1.09
The net cycle ratio » 0 . 5 + 0 . 5 + 1 . 0 9 « I .69
Compared with the experimental average result » 1.734
For a high-low-high programme (Programme 5)» the points in Fig. 11.1
are B, I, F, J, K and
nj/Nj' - 0.67 - 0.16 - 0.51 ( K J = K L “ J l )2 n/N - 0.5 + 0.5 + 0.51 - 1.11
Compared to the experimental result ■ 1.408
The same procedure can also be applied to four step tests. For
example, a loading programme consists of alternate stress levels of 70$,
8C$, 70$, 80$ for a fixed 20$ of the life in each period and a further period
of unknown length at 70$ stress level. The use of the diagram in this case
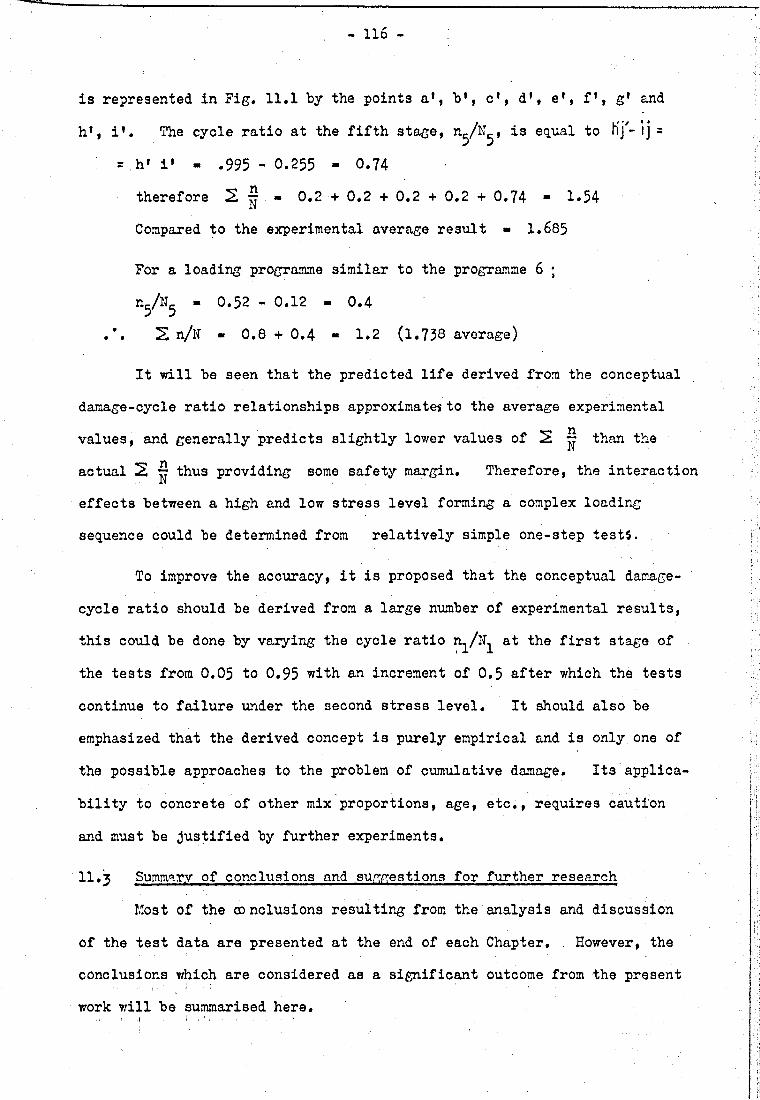
- 1 1 6 -
is represented in Fig. 11.1 by the points a', b', c', d', e', f', g' and
h', i'. The cycle ratio at the fifth stage, n^/K^, is equal to Ij =
= h' i' - .995 - 0.255 - 0.74
therefore 2 | - 0.2 ■+ 0.2 + 0.2 + 0.2 + 0.74 - 1*54
Compared to the experimental average result - 1.685
For a loading programme similar to the programme 6 ;
TL./llr- - 0.52 » 0.12 - 0.4 5 5.*. 2 n/N - 0.8 + 0.4 « 1.2 (1.758 average)
It will be seen that the predicted life derived from the conceptual
damage-cycle ratio relationships approximates to the average experimental
values, and generally predicts slightly lower values of 2 ^ than the
actual 2 ^ thus providing some safety margin. Therefore, the interaction
effects between a high and low stress level forming a complex loading
sequence could be determined from relatively simple one-step tests.
To improve the accuracy, it is proposed that the conceptual damage-
cycle ratio should be derived from a large number of experimental results,
this could be done by varying the cycle ratio n /lT at the first stage of
the tests from 0.05 to 0.95 with an increment of 0.5 after which the tests
continue to failure under the second stress level. It should also be
emphasized that the derived concept is purely empirical and is only one of
the possible approaches to the problem of cumulative damage. Its applica
bility to concrete of other mix proportions, age, etc., requires caution
and must be justified by further experiments.
11»3 Summary of conclusions and suggestions for further research
Most of the cd nclusions resulting from the analysis and discussion
of the test data are presented at the end of each Chapter. . However, the
conclusions which are considered as a significant outcome from the present
work will be summarised here.
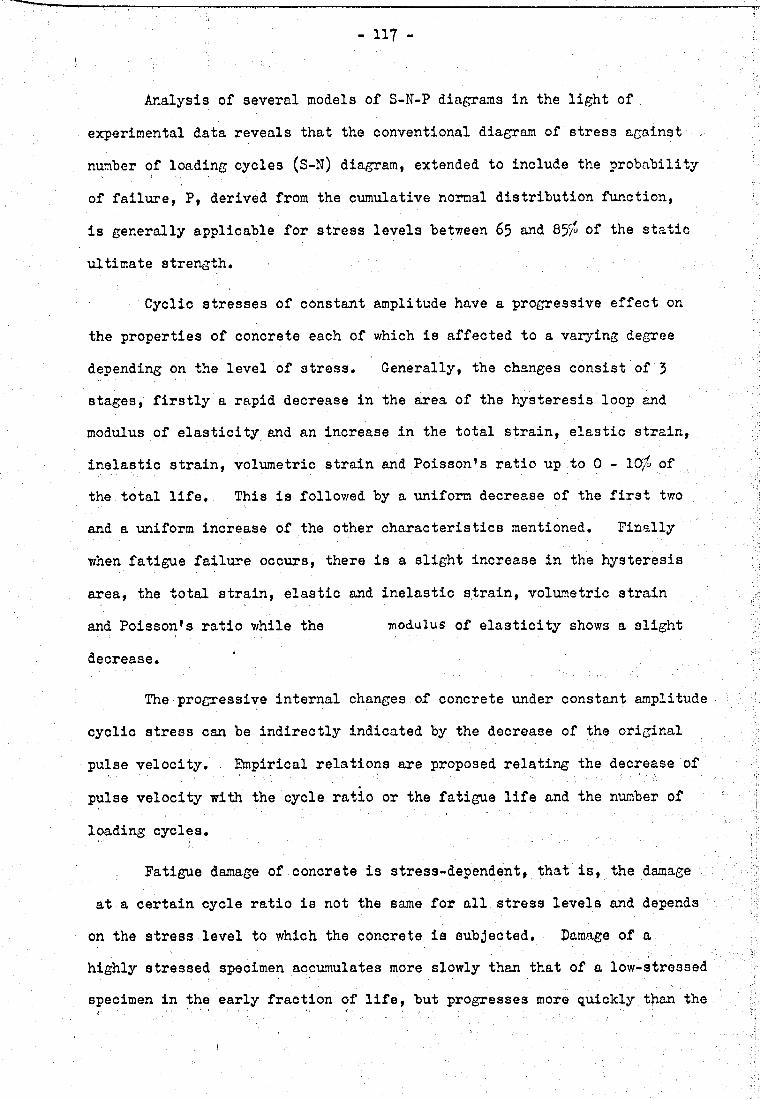
- 117 -
Analysis of several models of S-N-P diagrams in the light of
experimental data reveals that the conventional diagram of stress against
number of loading cycles (S-N) diagram, extended to include the probability
of failure, P, derived from the cumulative normal distribution function,
is generally applicable for stress levels between 65 and 85y* of the static
ultimate strength.
Cyclic stresses of constant amplitude have a progressive effect on
the properties of concrete each of which is affected to a varying degree
depending on the level of stress. Generally, the changes consist of 3
stages, firstly a rapid decrease in the area of the hysteresis loop and
modulus of elasticity and an increase in the total strain, elastic strain,
inelastic strain, volumetric strain and Poisson's ratio up to 0 - I0f° of
the total life. This is followed by a uniform decrease of the first two
and a uniform increase of the other characteristics mentioned. Finally
when fatigue failure occurs, there is a slight increase in the hysteresis
area, the total strain, elastic and inelastic strain, volumetric strain
and Poisson's ratio while the modulus of elasticity shows a slight
decrease.
The progressive internal changes of concrete under constant amplitude
cyclic stress can be indirectly indicated by the decrease of the original
pulse velocity. Empirical relations are proposed relating the decrease of
pulse velocity with the cycle ratio or the fatigue life and the number of
loading cycles.
Fatigue damage of concrete is stress-dependent, that is, the damage
at a certain cycle ratio is not the same for all stress levels and depends
on the stress level to which the concrete is subjected. Damage of a
highly stressed specimen accumulates more slowly than that of a low-stressed
specimen in the early fraction of life, but progresses more quickly than the
f
- 118
latter in the later part of the life. The magnitude of the stress levels
and the order in which they are applied also affects the general fatigue
behaviour (stress-interaction) when the concrete is subjected to variable
amplitude cyclic loading.
The Palmgren-Kiner hypothesis is a stress-dependent, interaction-
free hypothesis, and therefore, does not accurately predict the fatigue life
of concrete subjected to multiple step variable amplitude loading
programmes as conducted in the present work. Generally, it gives toonconservative a value of 2 jj, but sometimes it gives an unsafe prediction
by over-estimating of the actual value of 2 ~.
A conceptual damage-cycle ratio relationship is proposed in which the
stress-interaction effects is introduced and generally fair agreement is ,
obtained from its use with multi-step sequence at two stress levels.
There are, however, some difficulties that must be resolved by further
experimental justification.
H . 3 .I Suggestions for further research
1. This investigation was restricted to one mix and one set of
environmental conditions. It would be advantageous to establish whether
the same findings occur independent of these parameters.
2. Pulse velocity measuring instruments are now available with
facilities for connection to a chart recorder and it is hence possible
to record the decrease in pulse velocity continuously throughout failure.
It would be useful to establish whether there is a limiting value of the
decrease of pulse velocity at failure for specimens tested at constant and
variable amplitude tests. If there is, the decrease of pulse velocity and
the fatigue life relationships established could be used to determine the
true amount of damage at any given value of the fatigue life.
3. The acceleration and suppression of the decrease of pulse
- 119 -
velocity observed, when a low cyclic stress was preceded by a high level
and vice versa in stepped tests was attributed to the growth of the exist
ing well-defined cracks and the absorption of energy by a large number of
microcracks. Supporting evidence from crack studies, i.e. studies with
inclusions of different shape and'orientation, cracking in partially
fatigued specimens, etc., will be needed to prove the assumption.
4. A more extensive investigation of the cumulative fatigue
damage behaviour under variable amplitude cyclic stresses .other than the
two maximum stress' levels used in the present work is required to establish
whether the interaction effects vary with the range of stress.
5. It will be advantageous to check the validity of the proposed
empirical damage concept when applied to other types of variable amplitude
loading, i.e. random, and/or block loading programmes.
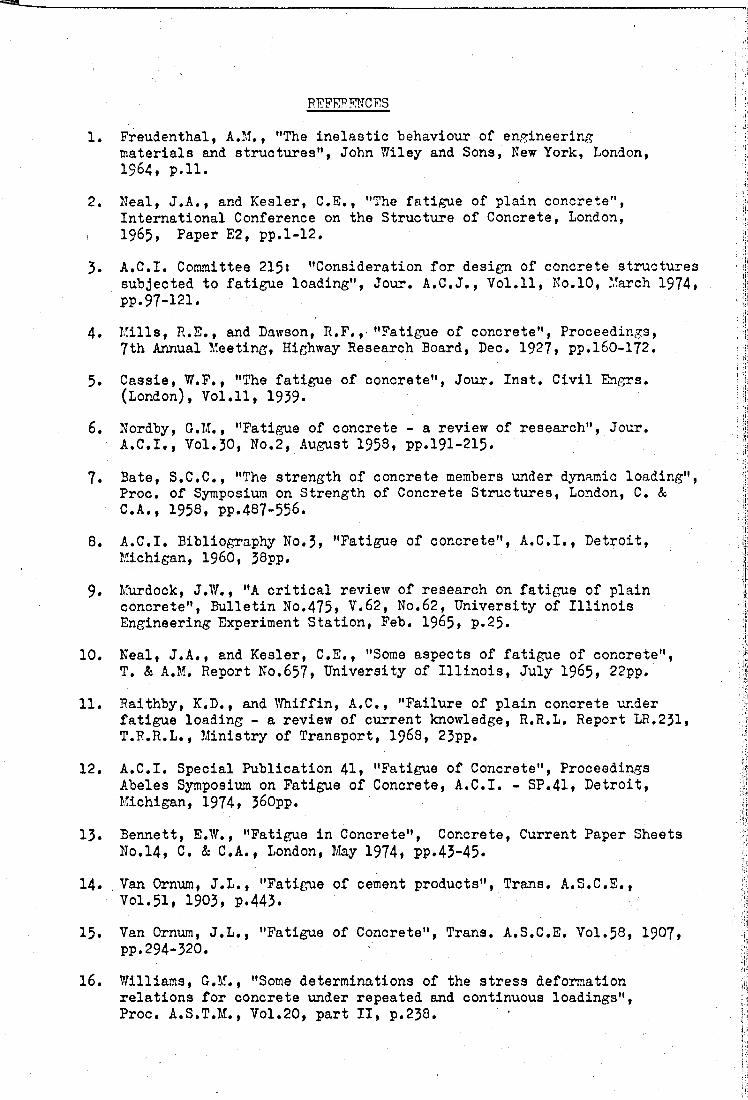
REFERENCES
1. Freudenthal, A.M., "The inelastic behaviour of engineering materials and structures", John Wiley and Sons, New York, London,1964, p.ll.
2. Neal, J.A., and Kesler, C.E., "The fatigue of plain concrete", International Conference on the Structure of Concrete, London,1965» Paper E2, pp.1-12.
3. A.C.I. Committee 215» "Consideration for design of concrete structures subjected to fatigue loading", Jour. A.C.J., Vol.ll, No.10, March 1974» pp.97-121.
4. Mills, R.E., and Lawson, R.F.,• "Fatigue of concrete", Proceedings,7th Annual Meeting, Highway Research Board, Lee. 1927» pp.160-172.
5. Cassie, W.F., "The fatigue of concrete", Jour. Inst. Civil Engrs. (London), Vol.ll, 1939-
6. Nordby, G.M., "Fatigue of concrete - a review of research", Jour. A.C.I,, Vol.30, No.2, August 1958» pp.191-215.
7. Bate, S.C.C., "The strength of concrete members under dynamic loading", Proo. of Symposium on Strength of Concrete Structures, London, C. &C.A., 1958, p p .487-556.
8. A.C.I. Bibliography No.3, "Fatigue of concrete", A.C.I., Letroit, Michigan, i960, 38pp.
9. Murdock, J.W., "A critical review of research on fatigue of plain concrete", Bulletin No.475» V.62, No.62, University of Illinois Engineering Experiment Station, Feb. 1965» p.25.
10. Neal, J.A., and Kesler, C.E., "Some aspects of fatigue of concrete",T. & A.M. Report No.657* University of Illinois, July 1965* 22pp.
11. Raithby, K.L., and Whiffin, A.C., "Failure of plain concrete under fatigue loading - a review of current knowledge, R.R.L. Report LR.231, T.R.R.L., Ministry of Transport, 1968, 23pp.
12. A.C.I. Special Publication 41» "Fatigue of Concrete", Proceedings Abeles Symposium on Fatigue of Concrete, A.C.I. - SP.41» Letroit, Michigan, 1974* 360pp.
13. Bennett, E.W., "Fatigue in Concrete", Concrete, Current Paper Sheets No.14» C. & C.A., London, May 1974» pp.43-45*
14. Van Ornum, J.L., "Fatigue of cement products", Trans. A.S.C.E.,Vol.51, 1903, P.443.
15. Van Ornum, J.L., "Fatigue of Concrete", Trans. A.S.C.E. Vol.58, 1907» pp.294-320.
16. Williams, G.M., "Some determinations of the stress deformation relations for concrete under repeated and continuous loadings",Proc. A.S.T.M., Vol.20, part II, p.238.
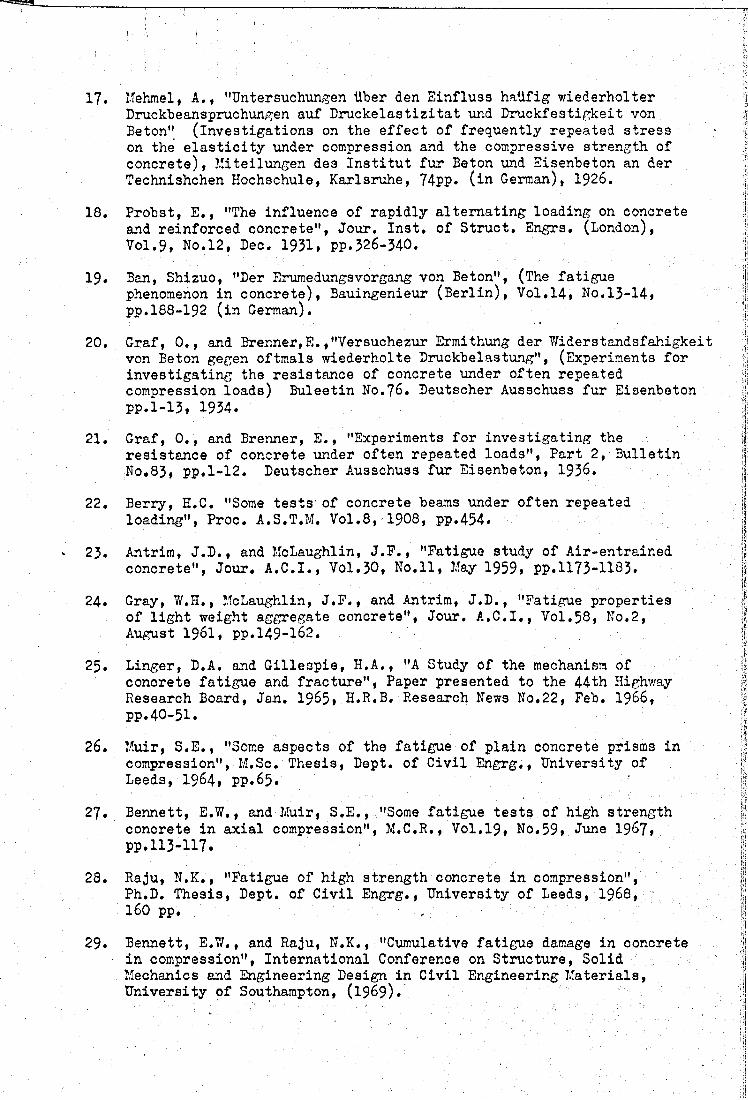
17. Mehmel, A., "Untersuchungen über den Einfluss haüfig wiederholter Druckbeanspruchungen auf Druckeiastizitat und Druckfestigkeit von Beton" (investigations on the effect of frequently repeated stress on the elasticity under compression and the compressive strength of concrete), Miteilungen des Institut fur Beton und Eisenbeton an der Technishchen Hochschule, Karlsruhe, 74pp. (in German), 1926.
18. Probst, E., "The influence of rapidly alternating loading on concrete and reinforced concrete", Jour. Inst, of Struct. Engrs. (London),Vol.9, No.12, Dec. 1931, pp.326-340.
19. Ban, Shizuo, "Der Erumedungsvorgang von Beton", (The fatigue phenomenon in concrete), Bauingenieur (Berlin), Vol.14, No.13-14, pp.188-192 (in German).
20. Graf, 0., and Brenner,E.»"Versuchezur Ermithung der Widerstandsfähigkeit von Beton gegen oftmals wiederholte Druckbelastung", (Experiments for investigating the resistance of concrete under often repeated compression loads) Buleetin No.76. Deutscher Ausschuss fur Eisenbeton PP.1-13, 1934.
21. Graf, 0., and Brenner, E., "Experiments for investigating the resistance of concrete under often repeated loads", Part 2, Bulletin No.83, pp.1-12. Deutscher Ausschuss fur Eisenbeton, 1936.
22. Berry, H.C. "Some tests' of concrete beams under often repeated loading", Proc. A.S.T.M. Vol.8, 1908, pp.454.
23. Antrim, J.D., and McLaughlin, J.F., "Fatigue study of Air-entrained concrete", Jour. A.C.I., Vol.30, No.11, May 1959, pp.1173-1183»
24. Gray, W.H., McLaughlin, J.F., and Antrim, J.D., "Fatigue properties of light weight aggregate concrete", Jour. A.C.I., Vol.58, No.2,August 1961, pp.149-162.
25. Linger, D.A. and Gillespie, H.A., "A Study of the mechanism of concrete fatigue and fracture", Paper presented to the 44th Highway Research Board, Jan. 1965, H.R.B, Research News No.22, Feb. 1966, pp.40-51.
26. Muir, S.E., "Some aspects of the fatigue of plain concrete prisms in compression", M,Sc. Thesis, Dept, of Civil Engrg., University of Leeds, 1964, PP.65.
27. Bennett, E.W., and Muir, S.E., "Some fatigue tests of high strength concrete in axial compression", M.C.R., Vol,19, No.59, June 1967» pp.113-117.
28. Raju, N.K., "Fatigue of high strength concrete in compression",Ph.D. Thesis, Dept, of Civil Engrg., University of Leeds, 1968,160 pp. ,
29. Bennett, E.W., and Raju, N.K., "Cumulative fatigue damage in concrete in compression", International Conference on Structure, Solid Mechanics and Engineering Design in Civil Engineering Materials, University of Southampton, (1969).
30. McCall, John, T., "Probability of fatigue failure of plain concrete", Jour. A.C.I. Vol.55, Aug. 1958» PP*233-244.
31. Ople, P.S. and Hulsbos, C.L., "Probable fatigue life of plain concrete with stress gradient", Jour. A.C.I. Vol.63, No.l, Jan. i960,pp.51-81.
32. Awad, M.E. and Hilsdorf, H.K., "Strength and deformation characteristics of plain concrete subjected to high repeated and sustained loads", Abeles Symposium on Fatigue of Concrete, A.C.I. Special publication -41* A.C.I., Detroit, Michigan, 1974* pp.1-9»
33* Raithby, K.D. and Galloway, J.W., "Effects of moisture condition,age, and rate of loading on fatigue of plain concrete", Abeles Symposium on Fatigue of Concrete, A.C.I. S.P.-41, A.C.I., Detroit, Michigan, 1974, pp.15-25.
34* Assinacopoulos, M., Warner, R.F., and Ekberg, Jr., C.E., "High speed fatigue tests on small specimens of plain concrete", Jour. P.C.I.V0I.4, No.2, Sept. 1959, PP.53-70.
35* Sparks, P.R. and Menzies, J.B., "The effect of rate of loading on plain concrete", Building Research Establishment Current Paper, CP. 23/73, 1973, also M.C.R. Vol.25, No.83, June 1973, pp.73-80.
36. Hilsdorf, H. and Kesler, E., "Fatigue strength of concrete under varying flexural stresses. Proc. A.C.I. Vol.63, No.10, Oct. 1966,pp. 1059-1075. ;
37. McIntosh, J.D. and Erntroy, H.C., "The workability of concrete withinch aggregates", C, & C.A. Research Report No.2, London, June 1955*
38. Gonnerman, H.F., "Effect of size and shape of test specimen on compressive strength of concrete", Proc. A.S.T.M..Vol.25, Part II,1925, pp.237-250.
39» Johnson, J.1I. "Effect of height of test specimens on compressive strength of concrete", Bulletin, A.S.T.M., No.120, Jan. 1943,pp.19-21.
40. Kesler, C.E., "Effect of length to diameter ratio on compressive strength", Proc. A.S.T.M. Vol.59, 1959, pp.1216-1228.
41. Kuezynski, W., "Strength of concrete studied on specimens of various shapes and dimensions", International Union of testing and Research Laboratories for Materials and Structures, (RILEM), Bulletin No.8,New series, Sept, i960, pp.77-92.
42. Rilem Commission for Concrete, "Correlation factors between the strength of different specimen types", Rilem Bulletin No.39, 1957, pp.81-105, No.12, New series, Sept. 1961, pp.155-156.
43* Hansen, H.K., Nielson, A. and Thavlow, S., "Compressive strength of concrete cube or cylinder", Rilem Bulletin No.17, New series, Dec.1962, pp.32-30. . u
44. Gyengo,T., "Effect of type of test specimen and gradation of aggregate on compressive strength of concrete", Proc. A.C.I. Vol.34, 1938,pp.269-282.
45» Neman, K. and Lachance, L., "The testing of brittle materials under uniform uniaxial compressive stress", Proc. A.S.T.M., Vol.64, pp.1044-1067.
46. Whaley, C.P., "The creep of concrete under cyclic uniaxial compression", Ph.D. Thesis, Dept, of Civil Engrg., University of Leeds, 1971» 110pp.
47. Teychenne, D.C., "Recommendations for the treatment of the variations of concrete strength in code of practice", RILEM's Materials and Structures, Vol.6, No.34» July-Aug. 1973» pp.259-267.
48. Gonnerman, H.F., "Effect of end condition of cylinder on compressive strength of concrete", Proc. A.S.T.M. 24, Part II, p.1036, 1924.
49. Ahmed, S., "Effect of capping on the compressive strength of concrete cubes", M.C.R., Vol.7, No.19, March 1955, pp.21-24.
50. Werner, G., "The effect of type of capping material on the compressive strength of concrete cylinders", Proc. A.S.T.M., Vol.58,1958, pp.1166-1181.
51. Thaulow, S., "Apparent compressive strength of concrete as affected by height of test specimen and friction between the load surfaces", RILEM Bulletin No.17, New series, Dec. 1962, pp.31-33.
52. Neville, A.M., "Properties of Concrete", Sir Isaac Pitman and Sons Ltd., London, 1973, 689pp.
53. Kupfer, H., Hilsdorf, H.K., and Rtlsch, H., "Behaviour of concrete under biaxial stresses", Jour. A.C.I., Vol.66, No.52, August 1969,pp.656-665.
54. Nelissen, L.J.M., "Biaxial testing of normal concrete", HERON,Stevin Laboratory Technological University, Delft, Vol.18, No.l,1972, 90pp.
55. Butcher, W.S., "The effect of air drying before test: 28 days . strength of concrete", Constructional Review, Sydney, Dec.1958,PP.31-32.
56. Losenhausenwerk Fatigue Testing Machine Manual.
57. Morice, P.B. and Base, G.D., "The design and use of a demountable mechanical strain gauge for concrete structures", M.C.R., No.13,August 1953, PP.37-42.
58. Jones, R., "The non-destructive testing of concrete", M.C.R., No.2,June 1949, pp.67-78.
59» Jones, R., and Gatfield, E.N., "Testing concrete by an ultrasonic pulse technique", R.R.L., Technical Paper No.34, H.M.S.O., London,1955.
60. Leslie, J.R., and Chessman, W.J., "An ultrasonic method of studying deterioration and cracking in concrete structures", Proc. A.C.I.,Vol.46j No.l, Sept. 1949, pp.17-36.

6 1 . Elvery, R.H., "Non-destructive testing of concrete and its relationship to specifications", Concrete, Vol.5, No.5., May 1971» pp.137-141.
62. Shar, S.P., and Chandra, S., "Mechanical behaviour of concrete examined by ultrasonic measurements", Journal of Material, Vol.5,1970, pp.550-563.
63. "Manual on Fatigue Testing", A.S.T.M. Publication STP.91, 1949*
64. "Method of Fatigue Testings", British Standard 3518: Part I, General Principles: 1962, Part 5» Guide to the application of statistics:1966.
65. Weibull, W., "Fatigue testing and analysis of results", Perganon Press, London, 1961, 305p.
65a. Weibull, W., "Planning and interpretation of fatigue tests", Symposium on statistical aspects of fatigue, A.S.T.M., Special Technical Publication No.121, 1951, p.3-22.
66. Weibull, W., "A statistical representation of fatigue failure in solids", Transactions, Royal Institute of Technology (Stockholm),No.27, 1949.
67. Gumbel, E.J., "Statistical control-curves for flood-discharges", Transactions, American Geophysical Union, V.23, 1942, p.489.
68. Sinclair, G.M., and Dolan, T.J., "Effect of stress amplitude on statistical variability in fatigue life of 75 S - T6 Aluminium Alloy", Transactions, A.S.M.E. Vol.75» July 1953» pp.867-872.
69. Dixon, W.J., and Massey, F.J., "Introduction to statistical analysis", McGraw-Hill Book Co., New York (1957).
70. Hald, A., "Statistical Tables and Formulas", John Wiley & Sons,New York (1952).
71. Venuti, W.J., "A statistical approach to the analysis of fatigue of prestressed concrete beams", Jour. A.C.I. Vol.62 No.11, Nov. 1965» pp.1375-1393.
72. Raju, N.K., "Prediction of the fatigue life of plain concrete in compression", Build. Sci., Vol.4, pp.99-102. Pergamon Press 1969.
73* Hsu, T.C.C., "Inelastic behaviour of concrete under short timeloading", Colloquium on the nature of inelasticity of concrete and its structural effects. Report No.322, Cornell University, Ithaca, New York, Nov. 1965» pp.6.
74« Lloyd, J.P., Lott, J.L., and Kesler, C.E., Final summary report:fatigue of concrete, T. & A.M, Report No.675»Department of Theoretical and Applied Mechanics, University of Illinois, Sept. 1967» PP.33.
75. Kaplan, M.F., "Strains and Stresses of concrete at initiation of cracking and near failure", Proc. Journal of A.C.I., Vol.60, No.7»July 1963, PP.853-880.
76. Reinius, Earling, "A theory of the deformation and the failure of concrete", Magazine of Concrete Research, Vol.8, No.24, Nov. 1956,pp.157-160.
77* Long, B.G., Kurtz, H.J., and Sandenaw, T.A., "An instrument andtechnique for field determination of the modulus of elasticity and flexural strength of concrete pavements", Proc. A.C.I., Vol.41,1945, PP.217-231.
78. Thomson, W.T., "Measuring changes in physical properties of concrete hy the dynamic method", Proc. A.S.T.M., V0I4O, 1940, pp.1113-1121.
79* Jones, R., "A method of studying the formation of cracks in amaterial subjected to stress", British Journal of Applied Physics,Vol.3, July 1952, pp.229-232.
80. Rlisch, H., Physikaalische Pragen der Betonprtifung (Physical problems in the testing of concrete), Zement-Kalk-Gips. Vol.12, No.l., Jan.1959» London, C. & C.A., March i960, pp.21. Library Translation Cj.86.
81. Kaplan, M.P., "The relationship between ultrasonic pulse velocity and the compressive strength of concretes having the same workability but different mix proportions. M.C.R., Vol.12, No.34, March i960, pp.3-8.
82. Shankar, K.N., "Non-destructive testing of concrete by ultrasonic methods", Indian Concrete Journal, July 1964» pp.261-263.
83. Highway Research Board Bulletin 206, "Effects of concrete characteristics on the pulse velocity", A SYMPOSIUM. Jan. 6-10, 1958, Washington D.C., Highway Research Board, 1959» PP*74.
84. Jones, R., "Non-destructive testing of concrete", Cambridge University Press, 1962.
85. Whitehurst, E.A., "Evaluation of concrete properties from sonic tests", Detroit, A.C.I., I966, pp.ix, 94* A.C.I. Monograph No.2.
86. Jones, Ronald, "A review of the non-destructive testing of concrete," symposium on non-destructive testing of concrete and timber, London,June 1969. London Institution of Civil Engineers, 1970» pp.1-7»
87. Newmark, K., "Criteria for the behaviour of plain concrete under complex states of stress." The structure of concrete and its behaviour under load. Proceedings of an International Conference, London, Sept. 1965» London, C. & C.A., 1968, pp.225-274*
88. Robinson, S.G., "Methods of detecting the formation and propagation of microcracks in concrete". The structure of concrete and its behaviour under load. Proc. of an International Conference, London, Sept. 1965, London, C. & C.A., 1968, pp.225-274.
89. Nwokoye, N.D., "Prediction and assessment of concrete properties from pulse-velocity tests", M.R.C., Vol.25, No.82, March 1973» pp.39-46.
90. British Standard Institution: B.S.4408s 1971. Recommendations for Non-destruotive Methods of Test for Concrete.
91. Jones, R., and Kaplan, M.F., "The effect of coarse aggregate 0n the mode of failure of concrete in compression andfLexure." M.C.R.,Vol.9, No.26, 1957. p p .89-94.
92. Evans, R.H., "Extensibility and modulus of rupture of concrete",The Structural Engineer, Vol24, 1946, pp.639-657*
93. Hsu, T.T.C., Slate, F.O., Sturman, G.M., and 7/inter, G., "Microcracking of plain concrete and the shape of the stress-strain curves. Proc. Jour. A.C.I., Vol60, No.2, Feb. 1963, pp.209-224.
94* Miner, M.A., "Cumulative damage in Fatigue", Journal of Applied Mechanics, Vol.12, No.3, Sept. 1945, PP.A-I59/A-I64.
95» Kaechele, L., "Review and analysis of cumulative fatigue damagehypotheses", Rand Corporation. Memorandum RM-365O-PR, August 1963.
96. Palmgren, A., "Die Lebensdauer von Kugellagern", Zeitschrift des Vereines Deutscher Ingenieure, Vol.68, N0 .I4 , 1924, PP.339-341.
97* Edwards, P.R., "Cumulative damage in fatigue with particularreference to' the effects of residual stresses", Aeronautical Research Council, Current Paper No.1185 (London, E.M.S.O., 1971).
93. Langer, B.F., "Fatigue failures from stress cycles of varyingamplitude", Trans. A.S.M.E., Vol.59, 1937, P.A160; also J. Appl.Mech. V0I.4, No.4, Dec. 1937*
99* Doland, T.J., Richard, F.E., and Work, C.E., "The influence offluctuations in stress amplitude on the fatigue of metals", Proc. A.S.T.M., Vol.49, p.646, 1949.
100. Valluri, S.A., "A unified engineering theory of high stress level fatigue", Aerospace Engineer, vol.20, No.10, Oct. 1961.
101. Newmark, N.M., "A review of cumulative damage in fatigue", Fatigue and Metal, 1952, p.197* Edited by W.M. Murray (John Wiley and Sons, Inc., N.Y.).
102. Marco, S.M., and Starkey, W.L., "A concept of fatigue damage",Trans. A.S.M.E., May 1954, pp.627-632.
103. Grover, H.J., "An observation concerning the cycle ratio in cumulativedamage", Symposium on fatigue of aircraft structures", A.S.T.M. Special
Technical Publication, No.274, I960.
104. Corten, H.T. and Dolan, T.J., "Cumulative fatigue damage", International conference on fatigue of metals, I.M.E. and A.S.M.E., 1956, pp.235-240.
105. Liu, H.W. and Dolan, T.J., "Fatigue damage during complex stress histories", NASA TN D-256, Nov. 1959.
106. Liu, H.W. and Corten, H.T., "Fatigue damage under varying stress amplitudes", NASA TN D-647, Nov. i960.
107. Freudenthal, A.M., and Heller, R.A., "On stress interaction in fatigue and emulative damage rule," Journal of Aerospace, Vol.26, No.7, July 1959.
108. Shanley, F.R., "A theory of fatigue based on unbonding during reversed slip", The HAND Corporation, p.350, Nov. 11, 1952.
109. Henry, D.L., "A theory of fatigue-damage accumulation in steel." Trans. A.S.M.E. Vol.77, August 1955* pp.913-918.
110. Mann, J.Y., "Fatigue of Materials", Melbourne University Press, 1967, 155PP.
111. Kibbey, D.R., "emulative Damage in fatigue in steel", Thesis in Mechanical Engineering, The Ohio State University, 1949.
112. Roscoe, John, T., "Fundamental Research Statistics", Holt Rinehart and Winston, Inc., 1969» P.273.

Table 3,1 is on the same page as Fig, 3,1

TABLE 4.1 SUMMARY OF TEST PROGRAMME
SERIES SIZE OF NUMBER OF SPECIMENSDESIGNATION SPECIMENS CONTROL TESTS FATIGUE OBJECT OF TESTS
4 "CUBE PRISMS TESTS -
A 12 X 11 4 X 1 1 4 X 1 1 S.N.P. Relation-Stress Strain-Characteristics-Hysteresis Changes-Modulus of Elasticity-Pulse Velocity Changes in Concrete, under constant amplitude loading.
Effect of constant amplitude loading on LongitudinalB
76.2X76.2 X203.2mm. (3X3X8in)
12 4 4 and Lateral Strain, Volumetric Strain and Poisson's Ratio.
C 12 X 13 4 X 1 3 4 X 1 3
Verification of the Palmgren-Miner Cumulative Fatigue-
D 12 X 4 4 X 4 4 X 4Damage Hypothesis for concrete under variable amplitude
.... E 1 2 X 4 4 X 4 4 X 4 cyclic loadings.
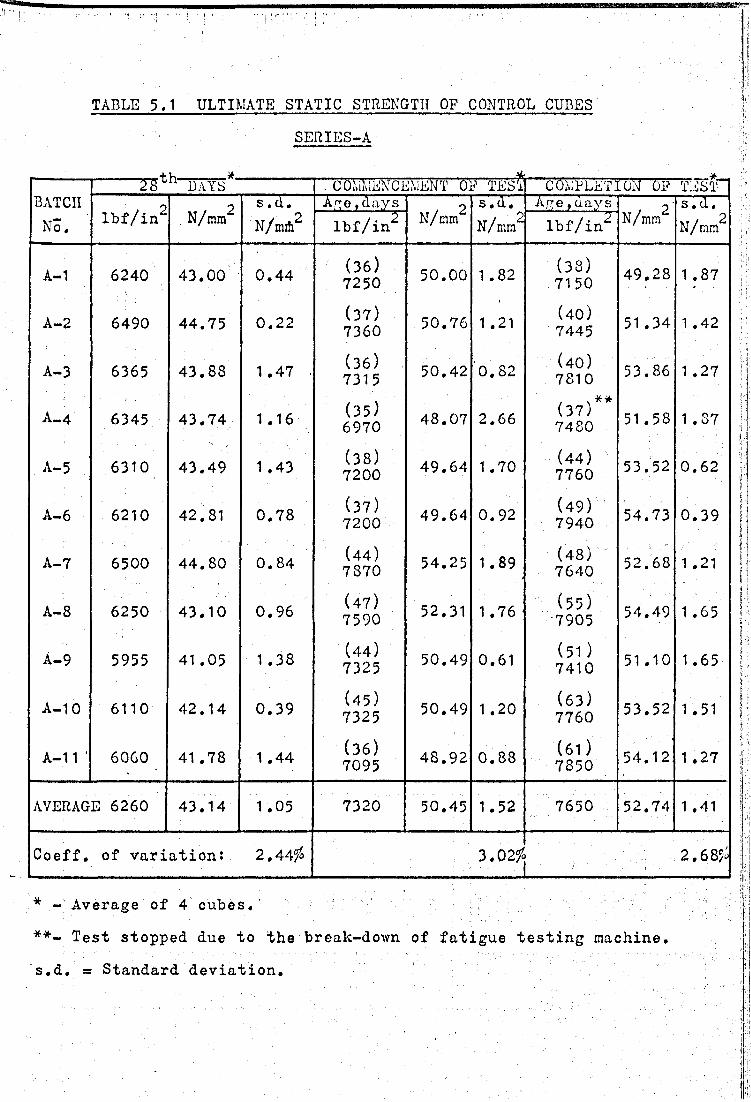
SERIES-A
TABLE 5.1 ULTIMATE STATIC STRENGTH OF CONTROL CUBES
----- u DAYS . COMMENCEMENT 0]b’ TEST COMPLET]:ox o p TEST Ib a t c h , o , o s.d. Age.days / 2 s.d. Age,days . o s.d.IOÏ5 lbf/in N/mm“ N/mih2 lbf/in2 N/mm N/mm2 lbf/in2 N/mm N/mm2
A-1 6240 43.00 0.44 (36)7250 50.00 1.82 (38)
7150 49.28 1.87
A-2 6490 44.75 0.22 (37)7360 50.76 1 .21 (40)
7445 51.34 1 .42
A-3 6365 43.88 1.47 • (36)7315 50.42 0.82 (4 0)
7810 53.86 1 .27
A-4 6345 43.74 1.16 (35)6970 48.07 2.66
\ * ** (37)7480 51.58 1.87
A-5 6310 43.49 1 .43 (38) ’ 7200 49.64 1 .70 (44)
7760 53.52 0.62
A-6 6210 42.81 0.78 (37)7200 49.64 0.92 (49)
7940 54.73 0.39
A-7 6500 44.80 0.84 (44)7870 54.25 1.89 (48)
7640 52.68 1.21
A-8 6250 43.10 0.96 (47)7590 52.31 1.76 (55)
•7905 54.49 1 .65
A-9 5955 41 .05 1 .38 (44)7325 50.49 0.61 (51 )
7410 51.10 1 .65
A-10 6110 42.14 0.39 (45)7325 50.49 1 .20 (63)
7760 53.52 1.51
A-11 ' 6060 41 .78 1 .44 (36)7095 48.92 0.88 (61)
7850 54.12 1 .27
AVERAGE 6260 43.14 1.05 7320 50.45 1.52 7650 52.74 1 .41
Coeff. of variation: 2,44$ 3.02^ 2,6 8/-
* - Average of 4 cubes,'
**- Test stopped due to the break-down of fatigue testing machine,
s.d. = Standard deviation.
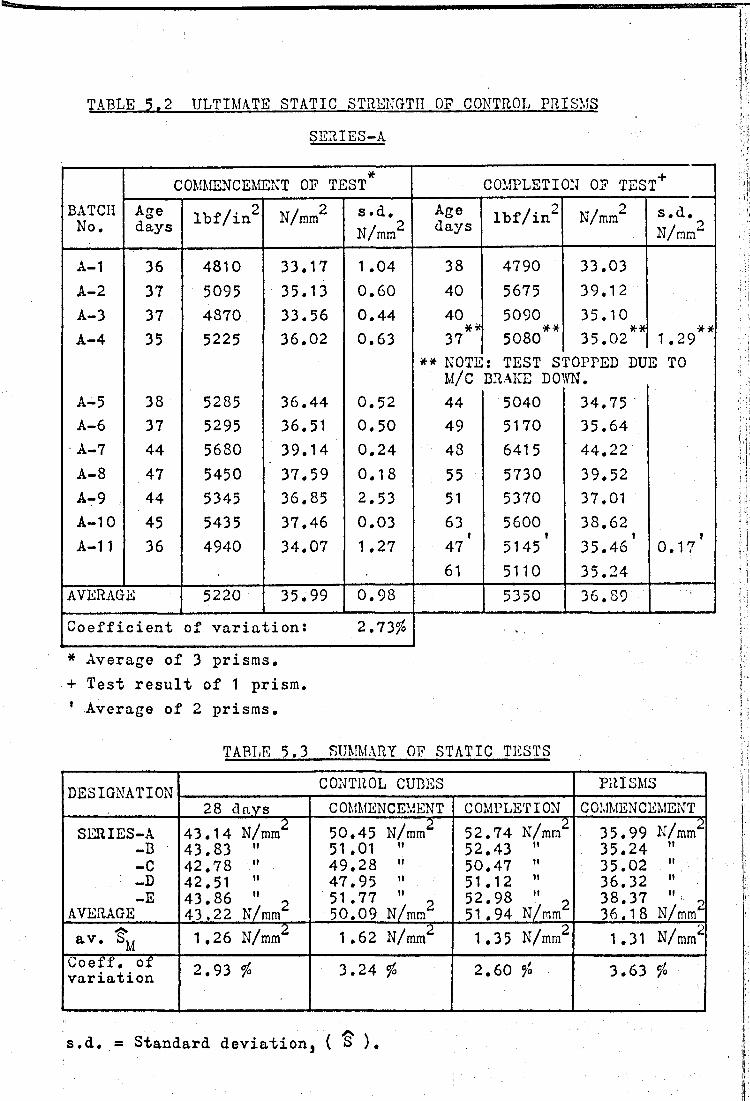
TABLE 5.2 ULTIMATE STATIC STRENGTH'OF CONTROL PRISMSSERIES-A
COMMENCEMENT OF TEST* COMPLETION OF TEST+BATCHNo.
Agedays lbf/in2 N/mm2 s.d.
N/mm2Agedays lbf/in2 N/mra2 s.d.
N/mm4"
A-1 36 4810 33.17 1 .04 38 4790 33.03A-2 37 5095 35.13 0.60 40 5675 39.12A-3 37 4870 33.56 0.44 40 5090 35.10
** *# ##A-4 35 5225 36.02 0.63 37 5080 35.02 I 1.29
** NOTE : TEST STOPPED DUE TOM/C BRAKE DOWN.
A - 5 38 5285 36.44 0.52 44 5040 34.75A -6 37 5295 36.51 0.50 49 5170 35.64A-7 44 5680 39.14 0.24 48 6415 44.22A -8 47 5450 37.59 0.18 55 5730 39.52A - 9 44 5345 36.85 2.53 51 5370 37.01A - 10 45 5435 37.46 0.03 63 5600 38.62
35.46' 0.17*A- 1 1 36 4940 34.07 1.27 47' 5145 *61 5110 35.24
AVERAGE 5220 35.99 0.98 5350 36.89
Coefficient of variation: 2,73$ ■ ■ ■
* Average of 3 prisms.+ Test result of 1 prism. ' Average of 2 prisms.
TABLE 5.3 SUMMARY OF STATIC TESTS
DESIGNATION CONTROL CUBES PRISMS28 days COMMENCEMENT COMPLETION COMMENCEMENT
SERIES-A-B-C-D-E
AVERAGE
43.14 N/mm2 43.83 " 42.78 " 42.51 " 43.86 " « 43,22 N/mrn
50.45 N/mm2 51.01 " 49.28 »47.95 "<51 77 "50!09 N/mm2
52.74 N/mm2 52.43 " 50.47 " 51. 12 " 52.98 " 3 51.94 N/mrri
35.99 N/mm2 35.24 " 35.02 " 36.32 " 38.37 " 0 36.1 8 N/mm*-
1,26 N/mm2 1.62 N/mm2 1.35 N/mm2 1.31 N/ mm4"Coeff. of variation 2.93 $ 3 .24/ 0 2.60 / 3.63 /
s.d. = Standard deviation. ( § ).
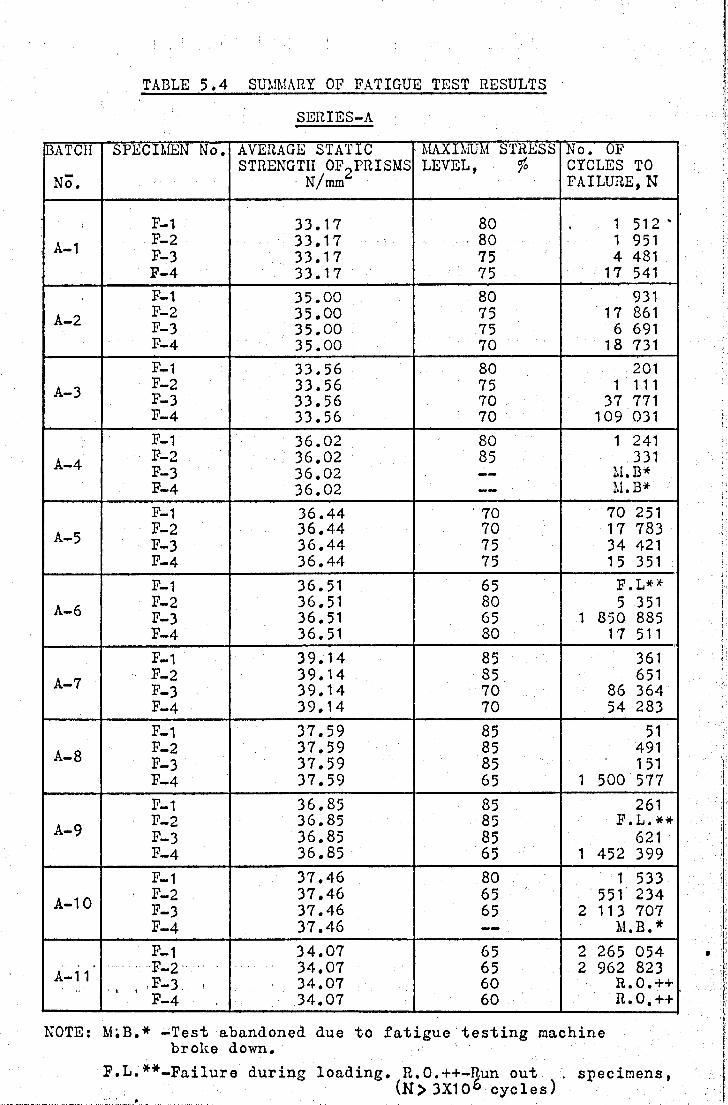
TABLE 5.4 SUMMARY OF FATIGUE TEST RESULTSSERIES-A
BATCH SPECIMEN No. AVERAGE STATIC MAXIMUM STRESS No. OFSTRENGTH OF-PRISMS LEVEL, ■ fo CYCLES TO
No. N/mm FAILURE,N
F-1 33.17 80 . 1 512'A-1 F-2 33.17 80 1 951
F-3 33.17 75 4 481F-4 33.17 75 17 541F-1 35.00 80 931
A 0 F-2 35.00 75 17 861F-3 35.00 75 6 691F-4 35.00 70 18 731F-1 33.56 80 201
A -i F-2 33.56 75 1 111A — J F-3 33.56 70 37 771F-4 33.56 70 109 031F-1 36.02 80 1 241
A — A F-2 36.02 85 331A —»*+ F-3 36.02 — — M.B*F-4 36.02 — M.B*F-1 36.44 ' 70 70 251
A er F-2 36.44 70 17 783A — 0 F-3 36.44 75 34 421F-4 36.44 75 1 5 351F-1 36.51 65 F.L**
A-6 F-2 36.51 80 5 351F-3 36.51 65 1 850 885F-4 36.51 80 17 511F-1 39.14 85 361F-2 39.14 85 651A— í F-3 39.14 70 86 364F-4 39.14 70 54 283F-1 37.59 85 51
A-8 F-2 37.59 85 491F-3 37.59 85 151F-4 37.59 65 1 500 577F-1 36.85 85 261
A-9 F-2 36.85 85 F.L.**F-3 36.85 85 621F-4 36.85 65 1 452 399F-1 37.46 80 1 533
A-10 F-2 37.46 65 551 234F-3 37.46 65 2 113 707F-4 37.46 — M.B.*F-1 34.07 65 2 265 054
34.07 65 2 962 823A-11 : x-2 'F-3 34.07 60 R .0. + +
' ’ F-4 34.07 60 R.0,+ +
NOTE: M;B.* -Test abandoned due to fatigue testing machine broke down.
F.L.**-Failure during loading. R.O.++-Run out . specimens,(N> 3X10° cycles)

Table 5 3 is on page 40
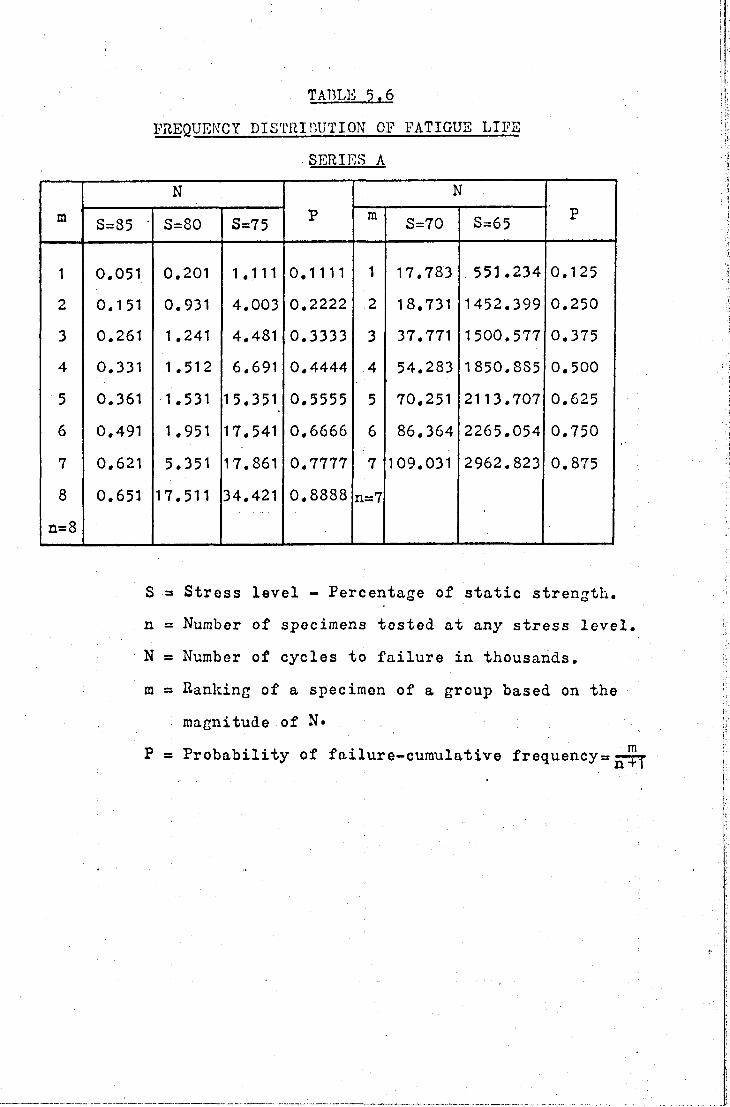
TABLE 5.6FREQUENCY DISTRIBUTION OF FATIGUE LIFE
■ SERIES A
mN
PN
PS=85 ' S=80 S=75
m S=70 S=65
1 0.051 0.201 1.111 0.1111 1 17.783 .551 .234 0.125
2 0.151 0.931 4.003 0.2222 2 18.731 1452.399 0.250
3 0.261 1.241 4.481 0.3333 3 37.771 1500.577 0.375
4 0.331 1.512 6.691 0.4444 4 54.283 1850.8S5 0.500
5 0.361 1.531 15.351 0.5555 5 70.251 2113,707 0.625
6 0.491 1.951 17.541 0,6666 6 86.364 2265.054 0.750
7 0.621 5.351 17.861 0.7777 7 109.031 2962.823 0.875
8 0.651 17.511 34.421 0.8888 n=7
00IIa
S = Stress level - Percentage of static strength,
n = Number of specimens tested at any stress level.
N = Number of cycles to failure in thousands,
m = Ranking of a specimen of a group based on the
magnitude of N.
P = Probability of failure-cumulative frequency=
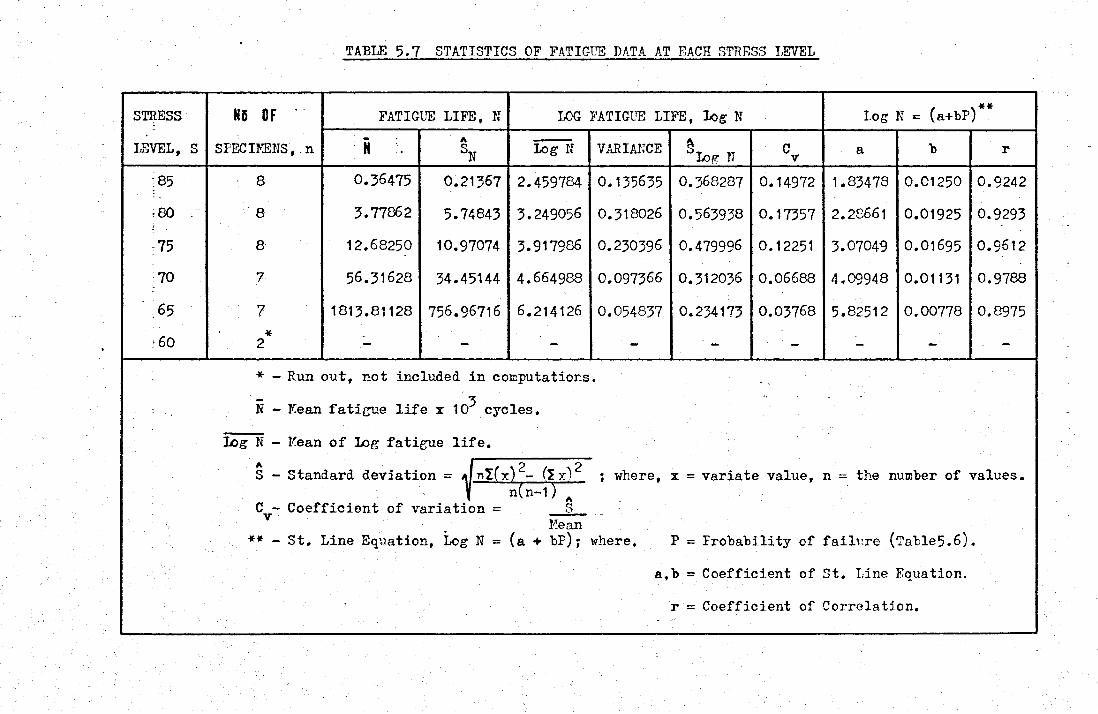
TABLE 5.7 STATISTICS OF FATIGUE DATA AT EACH STRESS LEVEL
STRESS
LEVEL, S
H i O FSPECIMENS, n
FATIGUE LIFE, N LOG FATIGUE LIFE, log E Log N = (a+bP)
H A
V Log N VARIANCE §log N CV a b r
85 8 0.36475 0.21367 2.459784 0.135635 0.368287 0.14972 1.83478 0.01250 0.9242
■80 8 3.77862 5.74843 3.249056 0.318026 0.563938 0.17357 2.28661 0.01925 0.9293
75 8 12.68250 10.97074 3.917986 0.230396 0.479996 0.12251 3.07049 O.OI695 0.9612
70 7 56.31628 34.45144 4.664988 0.097366 O .3 1 2 0 3 6 0.06688 4.09948 0.01131 0.9788
-,&5 7 1813.81128 756.96716 6.214126 0.054837 0.234173 0.03768 5.82512 0.00778 0.8975
60 *2 - - - - ' - - - -
* - Run out, not included in computations.- 3N - Kean fatigue life x 10 cycles.
log N - Kean of log fatigue life.
S'- Standard deviation =
C - Coefficient of variation = v
Jnï(x)^- (Sx)2 1 n(n-1T where, x = variate value, n = the number of values.
Kean** - St. Line Equation, Log N = (a + bp); where, P = Probability of
a,b = Coefficient of
r = Coefficient of
failure (Table5.6).
St. Line Equation.
Correlation.

TABLE 5.8STATISTICS OF LINEAR REGRESSION ANALYSIS
S-N DIAGRAM
Regression Coefficients:
a = 17.422118
b - 0.177616
Mean of ’S' = 75.000000
Mean of 'LogN' = 4.101188
SOURCE SUM OP SO. DEGREE OF FREEDOM MEAN SQ.Regression 58.965158 1 58.965158
Residual 7.655837 36 0.212662
Total 66.620995 37
F-Test for r, p r^(n-2) r “ l-r^ 277.271525
Coefficient of Determination = r2 = 0.885084
Coefficient of Correlation = r = -0.940788
Standard Error of Estimate = 0.461153
Regression Equation:
L 0gN = 17.422118 - 0.177616 S
This equation is statistically reliable for 65 < S < 8 5 .
Table 5» 9 is on page k3
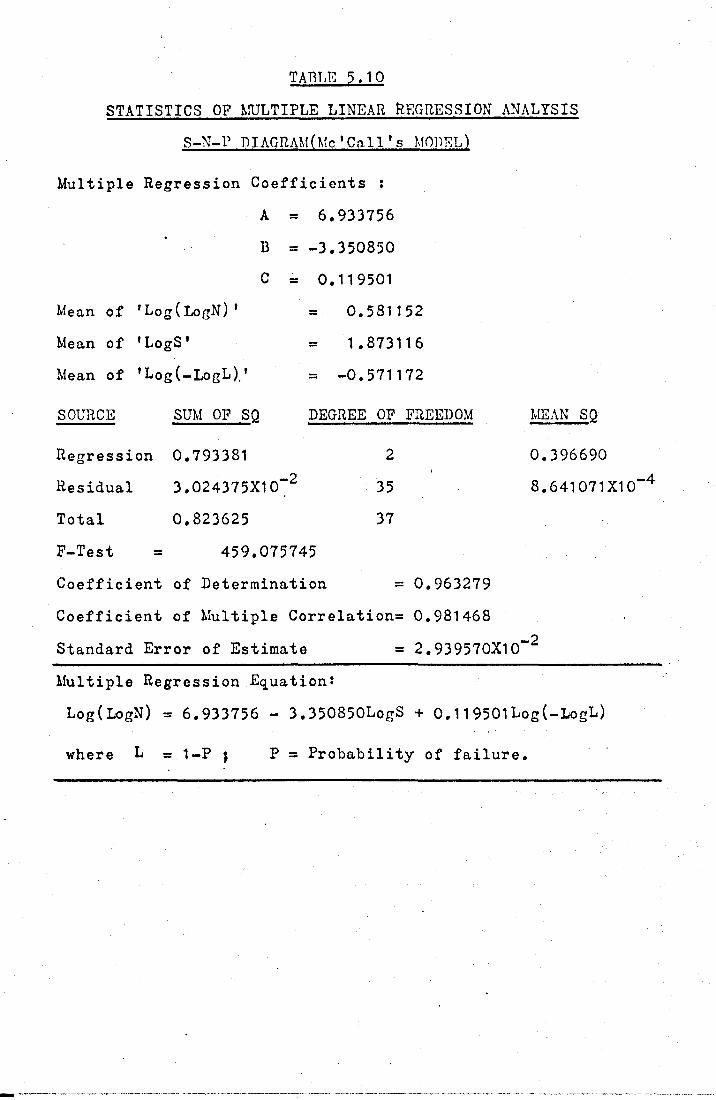
TAUT .K 5.10
STATISTICS OF MULTIPLE LINEAR REGRESSION ANALYSIS
S-N-P DIAGRAMfMc 'Call * s MODEL.)
Multiple Regression Coefficients :
A
B
C
Mean of 'Log(LogN)’
Mean of 'LogS'
Mean of ' Log(-LogL),'
6.933756
-3.350850
0.119501
= 0.581152
= 1.873116
= -0.571172
SOURCE
Regression
Residual
Total
F-Test
Coefficient
Coefficient
SUM OF SQ DEGREE OF FREEDOM
0.793381
3.024375X1O”2
0.823625
459.075745
of Determination
235
37
= 0.963279
of Multiple Correlations 0.981468
MEAN SQ-
0.396690
8.641071X10"4
Standard Error of Estimate 2.939570X1O"2
Multiple Regression Equation?
Log(LogN) = 6.933756 - 3.350850LOgS + 0.119501Log(-LogL)
where L = 1-P j P = Probability of failure.
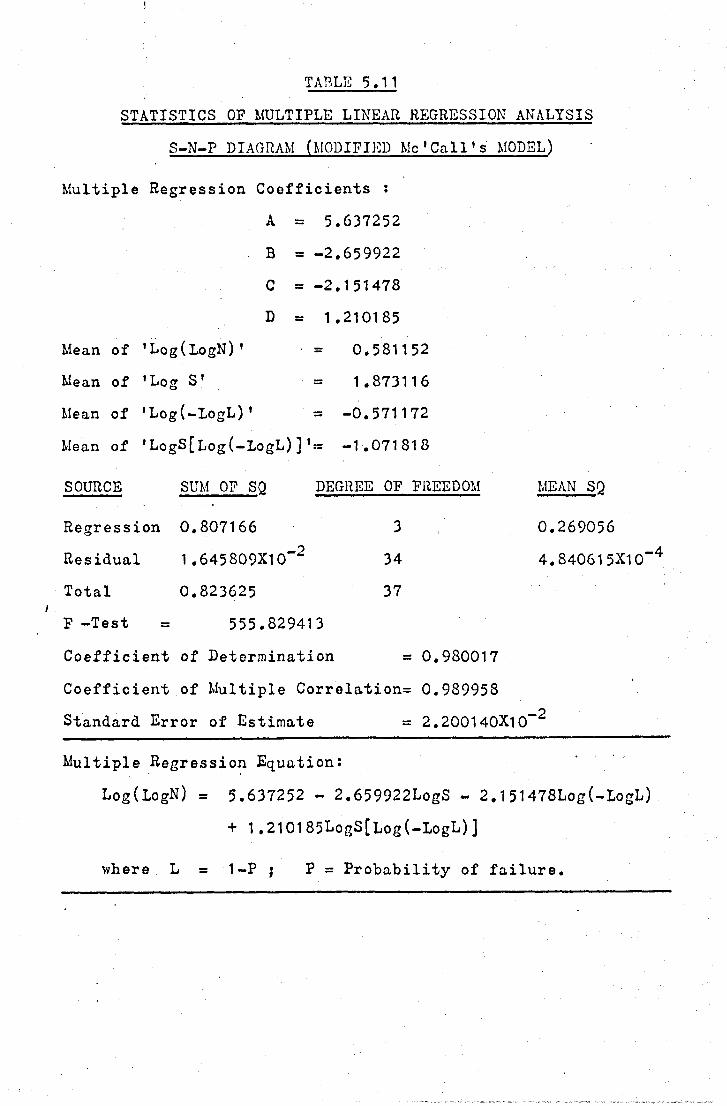
TABLE 5.11STATISTICS OF MULTIPLE LINEAR REGRESSION ANALYSIS
S-N-P DIAGRAM (MODIFIED M c C a l l ' s MODEL)
Multiple Regression Coefficients :
Mean of
Mean of
Mean of
Mean of
A
B
C =
D =
'Log(LogN)'
'Log S'
'Log(-LogL)'
’LogS[Log(-LogL)]
5.637252
-2.659922
-2.151478
1.210185
- 0.581152
= 1.873116
a -0.571172
'= -1.071818
SOURCE SUM OP SQ DEGREE OF FREEDOM MEAN SQ
Regression 0,807166
Residual 1.645809X10"2
Total 0.823625
F -Test = 555.829413
3 0.269056
34 4.840615X10
37
Coefficient of Determination = 0.980017
Coefficient of Multiple Correlation= 0.989958
Standard Error of Estimate = 2.200140X10“2
Multiple Regression Equation:
Log(LogN) = 5.637252 - 2.659922LogS - 2.151478Log(-LogL)
+ 1 ,210185LogS[Log(-LogL)]
where L = 1-P ; P = Probability of failure.
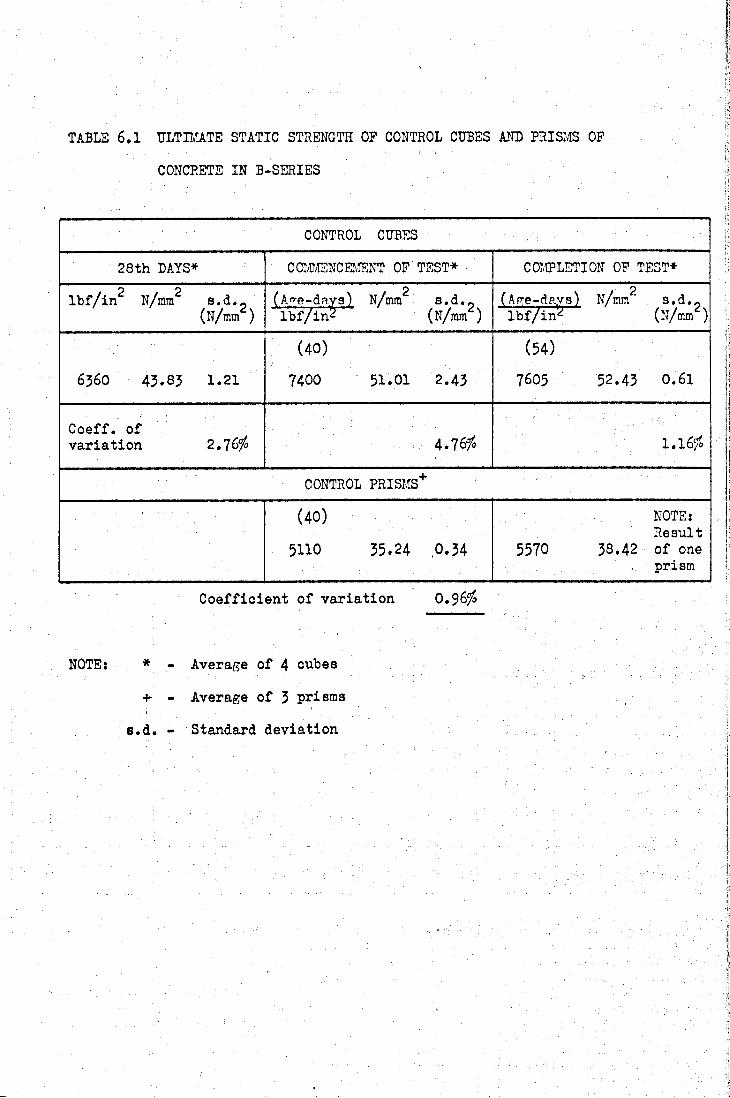
TABLE 6.1 ULTIMATE STATIC STRENGTH OP CONTROL CUBES AND PRISMS OP
CONCRETE IN B-SERIES
CONTROL CUBES
28th DAYS* COMMENCEMENT OF TEST* COMPLETION OP TEST*
lbf/in2 N/mm2 s.d. « (N/mm )
(A^e-days) N/mm s.d.«p
(Age-da^) N/mm' s.d.«lbf/in2 (N/mm“*) lbf/in^1 (N/mm^)
6360 43.83 1.21
(40)
7400 51.01 2.43
(54)
7605 52.43 0.61
Coeff. ofvariation 2.76/ 4.76/o 1.16/
CONTROL PRISMS+
(40)
5110 35.24 0.34
NOTE:Result
5570 38.42 of one prism
Coefficient of variation O.96/
NOTEs * - Average of 4 cubes
+■ - Average of 3 prisms
s.d. - Standard deviation
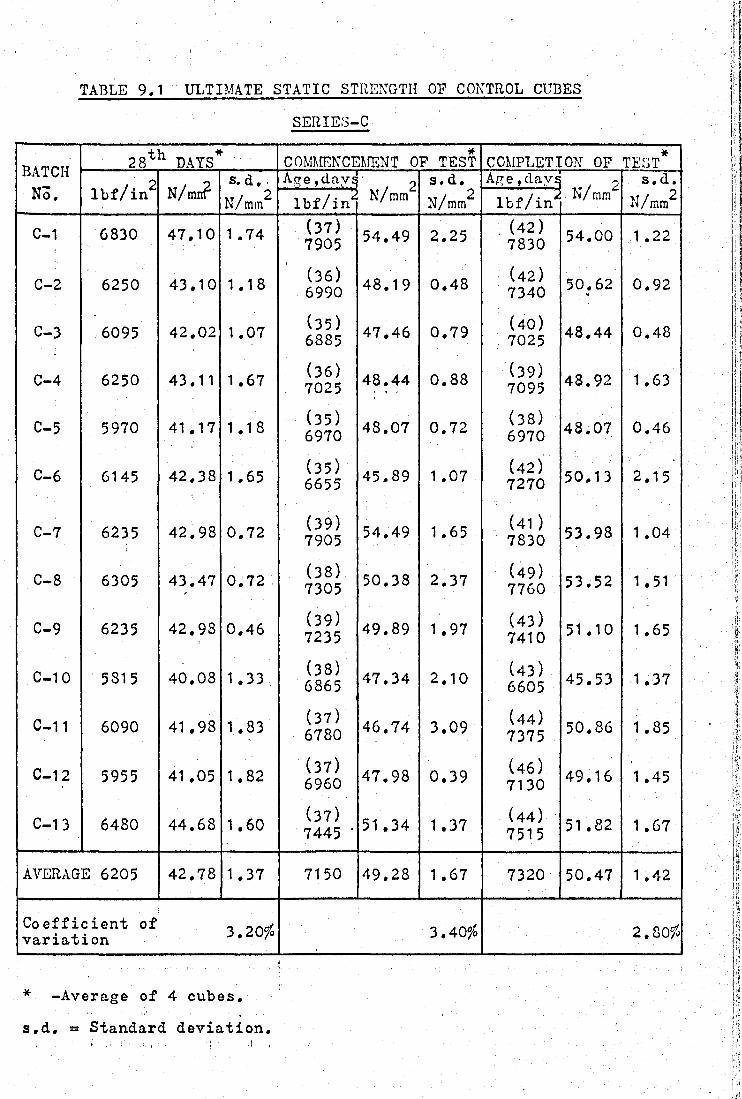
TABLE 9.1 ULTIMATE STATIC STRENGTH OF CONTROL CUBESSERIES-C
BATCH+ h *28xn DAYS COMMENCEMENT OF TEST COMPLETION OF TEST*
lbf/in2 N/mn?s. d. A g e ,days . 2 s.d. A g e ,day£
■N/mm2s.d.
No. N/mm2 lbf/in* N/mm N/mm2 lbf/in N/mm2
C-1 6830 47.10 1 .74 (37)7905 54.49 2.25 : (4 2)
7830 54.00 1 .22
C-2 6250 43.10 1.18 (36)6990 48.19 0.48 (42)
7340 50.62 0.92
C-3 6095 42.02 1 .07 (35)6885 47.46 0.79 (40)
. 7025 48.44 0.48
C-4 6250 43.11 1 .67 (36)7025 48.44 0.88 (39)
7095 48.92 1.63
C-5 5970 41 .17 1.18 (3 5)6970 48.07 0.72 (38)
6970 48.07 0.46
C-6 6145 42.38 1.65 (35)6655 45.89 1.07 (42)
7270 50.13 2.15
C-7 6235 42.98 0.72 (39)7905 54.49 1 .65 (41)
7830 53.98 1 .04
C-8 6305 43.47 0.72 (38)7305 50.38 2.37 (49)
7760 53.52 1.51
C-9 6235 42.98 0.46 (39)7235 49.89 1.97 (43)
7410 51.10 1 .65
C-10 5815 40.08 1.33 (38)6865 47.34 2.10 (43)
6605 45.53 1.37
c- 1 1 6090 41 .98 1 .83 (37)6780 46.74 3.09 (44)
7375 50.86 1.85
C-1 2 5955 41.05 1.82 (37)6960 47.98 0.39 (46)
7130 49.16 1 .45
C-1 3 6480 44.68 1 .60 (37) 7445 ’ 51.34 1 .37 (44)
7515 51 .82 1 .67
AVERAGE 6205 42.78 1.37 7150 49.28 1.67 7320 50.47 1.42
Coefficient of variation 3.20$ 3.40$ 2.80$
* -Average of 4 cubes,
s.d. = Standard deviation.
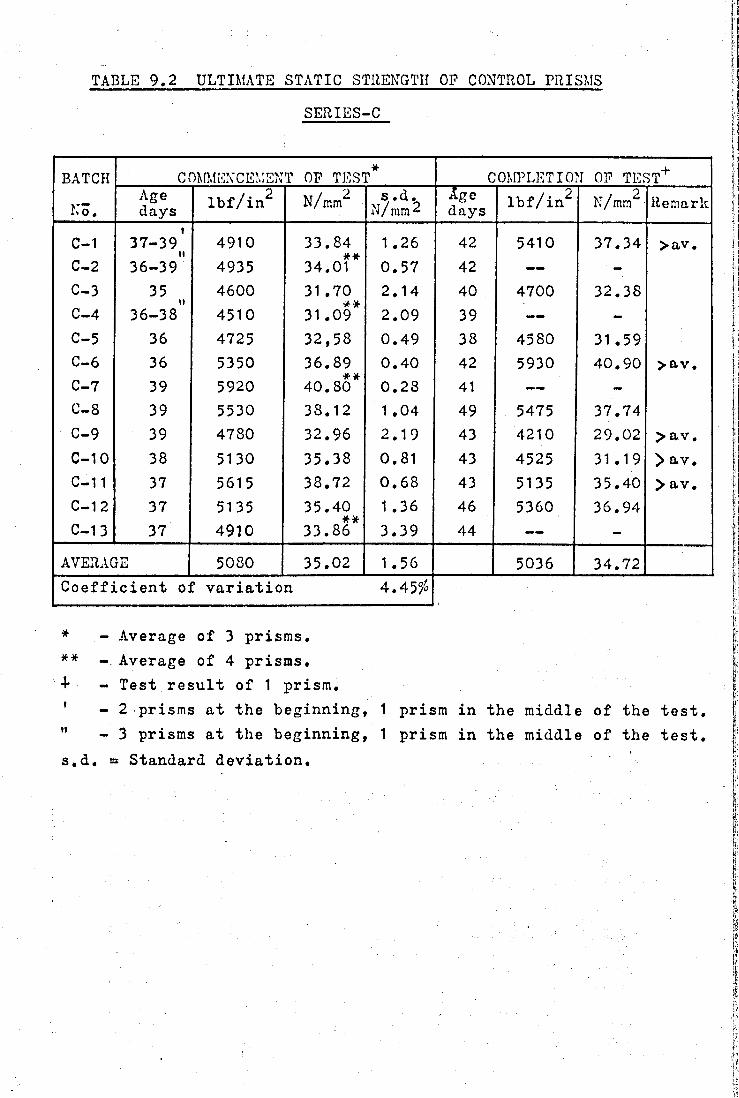
SERIES-C
TABLE 9.2 ULTIMATE STATIC STRENGTH OF CONTROL PRISMS
BATCH COMMENCEMENT OP TEST* COMPLETION OF TEST+
•lo
Agedays lbf/in2 N/mm2 s.d.
N/mm 2Agedays lbf/in2 N/mm2 Remark
C-1 37-39' 4910 33.84 1.26 42 5410 37.34 >av.I I **
C-2 36-39 4935 34.01 0.57 42 — -C-3 35 4600 31 .70 2.14 40 4700 32.38
I t **C-4 36-38 4510 31.09 2.09 39 — -C-5 36 4725 32,58 0.49 38 4580 31.59C-6 36 5350 36.89 0.40 42 5930 40.90 >av.
*#C-7 39 5920 40.80 0.28 41 — -C-8 39 5530 38.12 1 .04 49 5475 37.74C-9 39 4780 32.96 2.19 43 4210 29.02 >a.v.C-10 38 5130 35.38 0.81 43 4525 31.19 > av.C-11 37 5615 38.72 0.68 43 5135 35.40 > av.C-1 2 37 5135 35.40 1 .36 46 5360 36.94*#C-1 3 37 4910 33.86 3.39 44 — -
AVERAGE 5080 35.02 1.56 5036 34.72Coefficient of variation 4.45%
***+
- Average of 3 prisms.-. Average of 4 prisms.- Test result of 1 prism.
1 - 2 prisms at the beginning, 1 prism in the middle of the test." - 3 prisms at the beginning, 1 prism in the middle of the test,s.d. = Standard deviation.
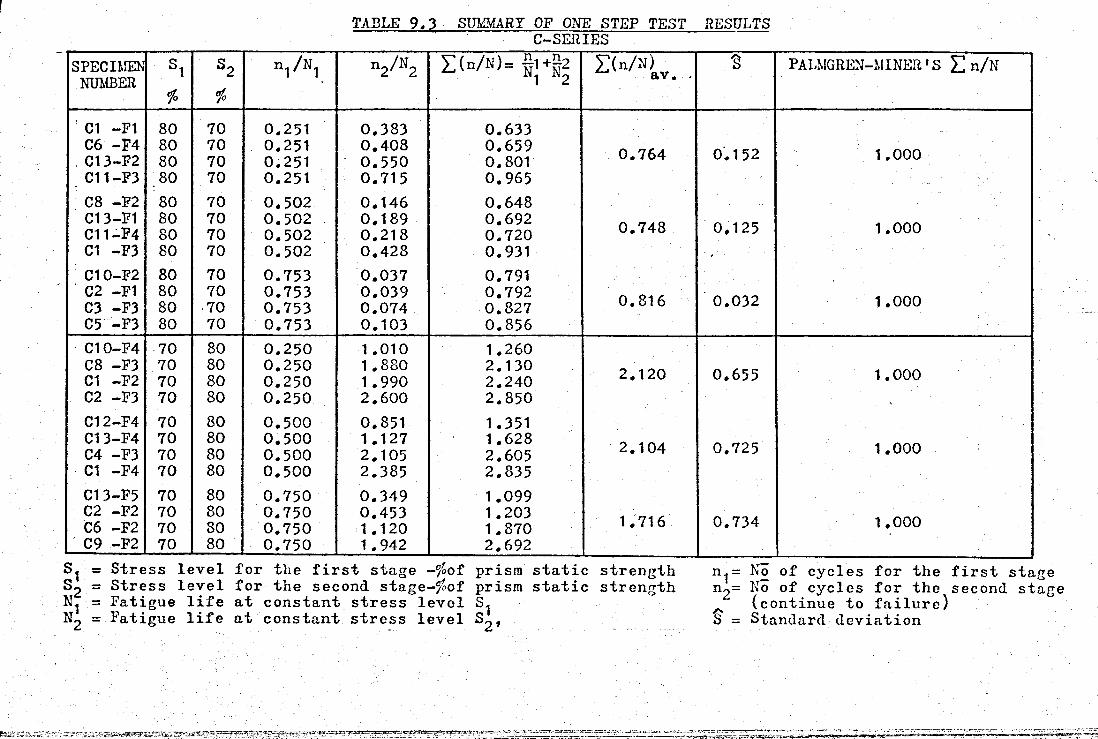
TABLE 9.3 SUMMARY OF ONE STEP TEST RESULTSC-SERIES
SPECIMEN si S2 V Ni V N2 E(n/N)= §1+1*2 2 PALMGREN-MINER'S £ n/NNUMBER
1o1 12
1°
C1 -F1 80 70 0.251 0.383 0.633C6 -F4 C13-F2
8080
7070
0.2510.251
0.4080.550
0.6590.801 0.764 0.152 1.000
C11-F3 80 70 0.251 0.715 0.965C8 -F2 80 70 0.502 0.146 0.648C13-F1 C11-F4
8080
7070
0.502 . 0.502
0.1890.218
0.6920.720 0.748 0.125 1.000
C1 -F3 80 70 0.502 0.428 0.931C10-F2 80 70 0.753 0.037 0.791C2 -F1 C3 -F3
8080
7070
0.7530.753
0.0390.074
0.7920.827 0.816 0.032 1.000
C5 -F3 80 70 0.753 0.103 0.856C10-F4 70 80 0.250 1.010 1.260C8 -F3 C1 -F2
7070
8080
0.2500.250
1 .880 1.990
2.1302.240 2.120 0.655 1.000
C2 -F3 70 80 0.250 2.600 2.850 NC12-F4 70 80 0.500 0.851 1.351C13-F4 70 80 0.500 1.127 1.628 2.104 0.725 1.000C4 -F3 70 80 0.500 2.105 2.605C1 -F4 70 80 0.500 2.385 2.835C13-F5 70 80 0.750 0.349 1.099C2 -F2 70 80 0.750 0.453 1.203 1.716 0.734 1.000C6 -F2 70 80 0.750 1.120 1.870C9 -F2 70 80 0.750 1.942 2.692
S.j — Stress level for the first stage -foof prism static strength n^= No of cycles for the first stageS2 = Stress level for the second stage-^of prism static strength n~= No of cycles for the second stagN.j = Fatigue life at constant stress level S. ^ (continue to failure)N2 = Fatigue life at constant stress level Si>, § = Standard deviation
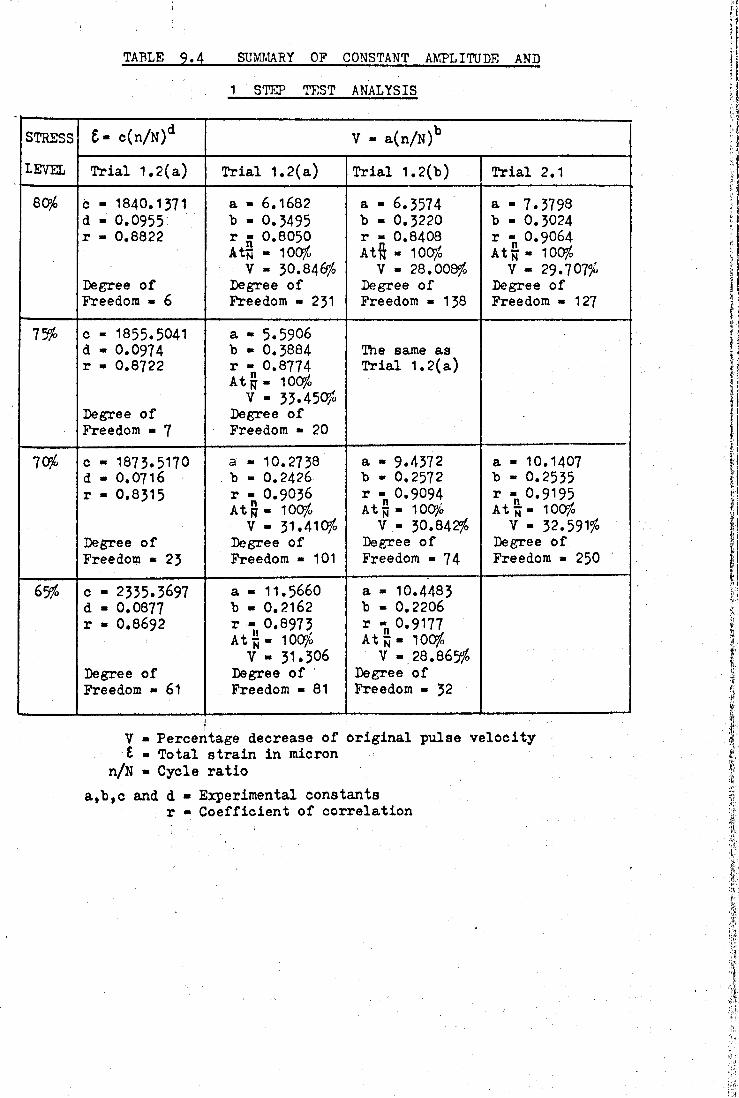
TABLE 9.4 SUMMARY OF CONSTANT AMPLITUDE AND
1 STEP TEST ANALYSIS
STRESS
le v e l
£ - c(n/N)d V - a(n/N)b
Trial 1.2(a) Trial 1.2(a) Trial 1.2(b) Trial 2.1
80$ c - 1840.1371 d - 0.0955r - 0.8822
Degree of Freedom - 6
a - 6.1682 b - 0.3495 r - 0.8050 At* - 1005IS
v - 30.846/0Degree of Freedom - 231
a - 6.3574 b - 0.3220 r - 0.8408 Atft - 100$
V - 28.008$ Degree of Freedom « 138
a - 7.3798 b - 0.3024 r - 0.9064At ft « 100$
v - 29.707$Degree of Freedom «127
75$ c - 1855.5041 d - 0.0974 r - 0.8722
Degree of Freedom « 7
a - 5.5906 b - 0.3884 r - 0.8774 Atjj- 100$
V - 33.450/ Degree of Freedom - 20
The same as Trial 1.2(a)
10fo c - 1873.5170 d - 0.0716 r - 0.8315
Degree of Freedom » 2 3
a - 10.27 38 b - 0.2426 r - O.9O36 At ft - 100$
v - 3 1 .4 1 0 /Degree of Freedom « 101
a - 9.4372 b - 0.2572 r - 0,9094 Atjj - 100$
v - 30.842$Degree of Freedom - 74
a - 10.1407 b - 0.2535 r - 0.9195 At U - 100$
v « 32.591$Degree of Freedom ■ 250
65$ c - 2335.3697 d - 0.0877 r - 0.8692
Degree of Freedom « 61
a - 11.5660 b - 0.2162 r -0.8973 At jj - 100$
v - 31.306Degree of Freedom - 81
a - 10.4483 b - 0.2206 r - 0.9177 At n - 100$
V «,28.865$Degree of Freedom « 32
V - Percentage decrease of original pulse velocity £ • Total strain in micron
n/N « Cycle ratioa,b,c and d - Experimental constants
r - Coefficient of correlation
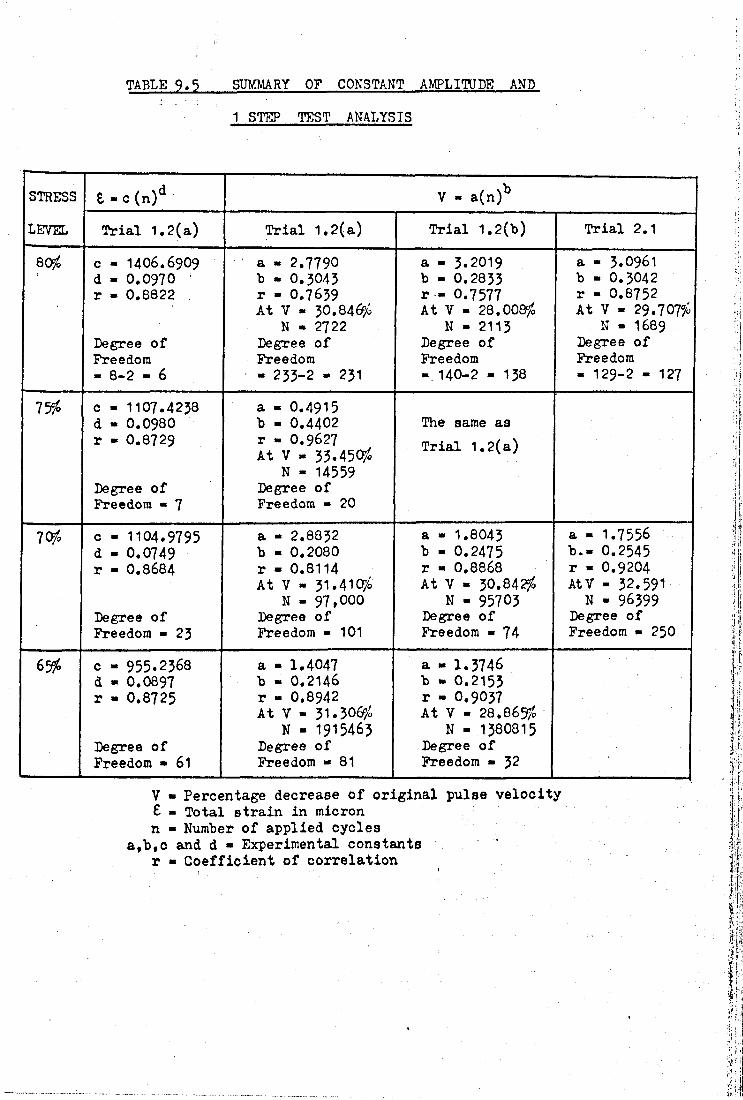
TABLE 9.5 SUMMARY OF CONSTANT AMPLITUDE AND
1 STEP TEST ANALYSIS
STRESS £ ■ c (n)^ V - a(n)k
LEVEL Trial 1.2(a) Trial 1.2(a) Trial 1.2(b) Trial 2.1
80$ c - 1406.6909 a - 2.7790 a - 3.2019 a » 3.0961d - 0.0970 b - 0.3043 b - 0.2833 b - 0.3042r - 0.8822 . r - 0.7639 r - 0.7577 r - 0.8752
At V - 30.846?; At V - 28.008$ At V - 29.707$N - 2722 N - 2113 N - 1689
Degree of Degree of Degree of Degree ofFreedom Freedom Freedom Freedom- 8-2 - 6 - 233-2 - 231 » 140-2 - 138 - 129-2 - 127
75$ c - 1107.4238 a - 0.4915d - 0.0980 b - 0.4402 The same asr - 0.8729 r - 0.9627
At V - 33.450$ Trial 1.2(a)N - 14559
Degree of Degree ofFreedom « 7 Freedom - 20
70$ c - 1104.9795 a - 2.8832 a - 1.8043 a - 1.7556d - 0.0749 b - 0.2080 b - 0.2475 b.- 0.2545r - 0.8684 r - 0.8114 r - 0.8868 r - 0.9204
At V - 31.410$ At V - 30.842$ AtV ■ 32.591N - 97,000 N - 95703 N - 96399
Degree of Degree of Degree of Degree ofFreedom - 23 Freedom »101 Freedom - 74 Freedom ■ 250
6$ c - 955.2368 a - 1.4047 a - 1.3746d - 0.0897 b - 0.2146 b - 0.2155r - 0.8725 r - 0.8942 r - 0.9037
At V - 31.306$ At V - 28.865?;N - 1915463 N - 1380815
Degree of Degree of Degree ofFreedom » 61 Freedom - 81 Freedom - 32
V - Percentage decrease of original pulse velocity £ - Total strain in micron n - Number of applied cycles
a,btc and d - Experimental constants r - Coefficient of correlation
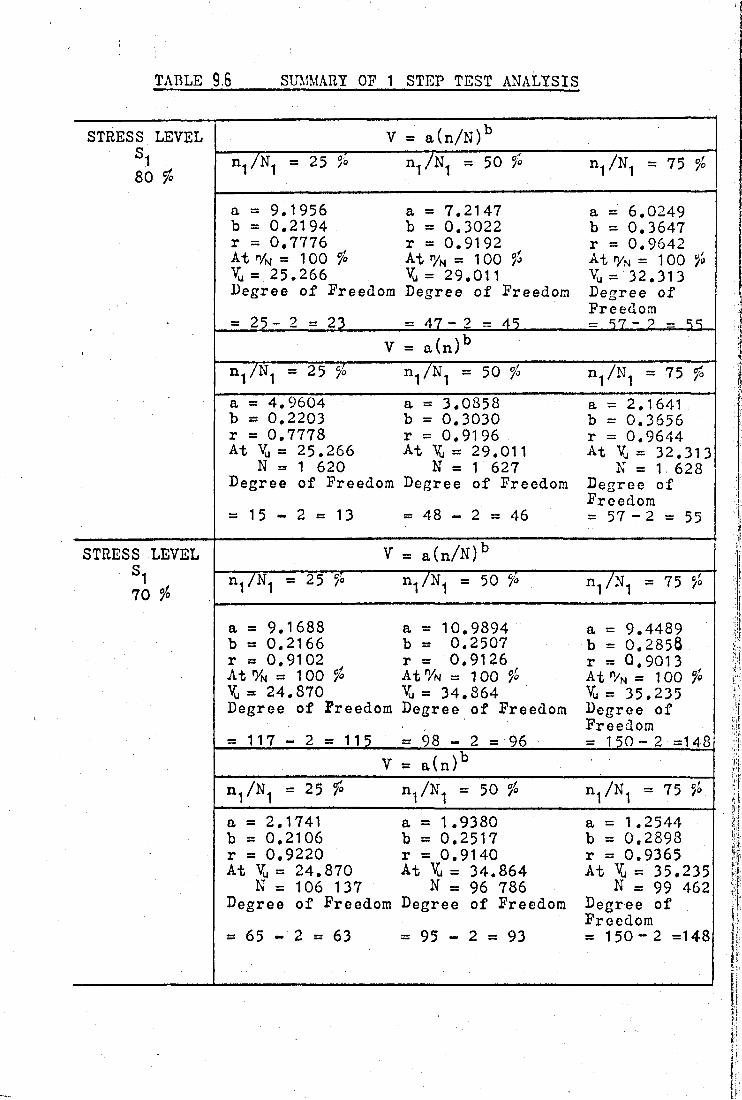
TABLE 9.6 SUMMARY OF 1 STEP TEST ANALYSIS
STRESS LEVEL S 180 #
STRESS LEVEL S170 °/o
V = a(n/N)bn , / ^ = 25 # n1 /N-j = 50 # V N 1 = 75
a = 9.1956 a = 7.2147 a = 6,0249b = 0.2194 b = 0.3022 b = 0.3647r = 0.7776 r = 0.9192 r = 0.9642At n/N = 1 00 # At yH = 1 00 # At rAi = 1 0 0 #X = 25.266 X = 29.011 Vu = 32.313Degree of Freedom Degree of Freedom Degree of
Freedomo'»CMIICM1ICNCMII ___ = 47 - 2 = 45_______ = 5 7 - 2 = 5^V = a(n)b
n^/N^ = 2 5 °p n 1/N1 = 50 # = 75 #
a = 4.9604 a = 3.0858 a = 2.1641b = 0.2203 b = 0.3030 b = 0.3656r = 0.7778 r = 0.9196 r = 0.9644At Vu = 25.266 At X = 29.011 At Vu = 32.313
N = 1 620 N = 1 627 N = 1 628Degree of Freedom Degree of Freedom Degree of
Freedom= 1 5 - 2 = 1 3 = 48 - 2 = 46 = 57 - 2 = 55
V = a (n/N)b= 25 # n 1/N1 = 50 c/o /N1 = 75 #
a = 9.1688 a = 10.9894 a = 9.4489b = 0.2166 b = 0.2507 b = 0.285Ör = 0.9102 r = 0.9126 r = 0.9013At % = 100 # At % i = 100 °/o At % = 1 0 0 #X = 24.870 X = 34.864 X = 35.235Degree of Freedom Degree of Freedom Degree of
Freedom= 117 - 2 = 115 = 9 8 - 2 = 9 6 = 150- 2 =148V = a(n)b
= 25 # = 50 # n 1/N1 = 7 5 #a = 2.1741 a = 1.9380 a = 1.2544b = 0.2106 b = 0.2517 b = 0.2898r = 0.9220 r = 0.9140 r = 0.9365At X = 24.870 At X = 34.864 At Vu = 35.235
N = 106 137 N = 96 786 N = 99 462Degree of Freedom Degree of Freedom Degree of
Freedom= 65 - 2 = 63 = 95 - 2 = 93 = 1 5 0 - 2 =148

TABLE 9.7 SUMMARY OF 1 STEP TEST ANALYSIS
STRESS LEVEL io io V~ = a( \ & n 0 ;
S! S2 n,/N,V N2 a b
£r
80 io 70 Ì 25.1 TUFAILURE 0.1968 0.4436 0.9007
(51.30) DEGREE OF. FREEDOM = 70-2 = 68
5 0 . 2 TOFAILURE 0.0888 0.5386 0.9532
(24.60) DEGREE OF FREEDOM = 63-2 = 61
75.3 TOFAILURE 0.6543 0.3559 0.7100
( 6.23) DEGREE OF FREEDOM = 50-2 = 48
70 io 80 io 25 TOFAILURE 0.01867 0.8308 0.9401
(187.00) DEGREE OF FREEDOM = 62-2 = 60
50 TOFAILURE 0.0266 0.8434 0.9252
(160.40) DEGREE OF FREEDOM = 83-2 = 81
75 TOFAILURE 0.1275 0.5737 0.8006
(196.60) DEGREE OF FREEDOM = 42-2 = 40
V 2 = Maximum decrease in ultrasonic pulse velocity in percent
due to n 2 at S2 .
n 2 = Actual loading cycles at S2 after at •
a,b as Experimental constants,
r = Coefficient of correlation.
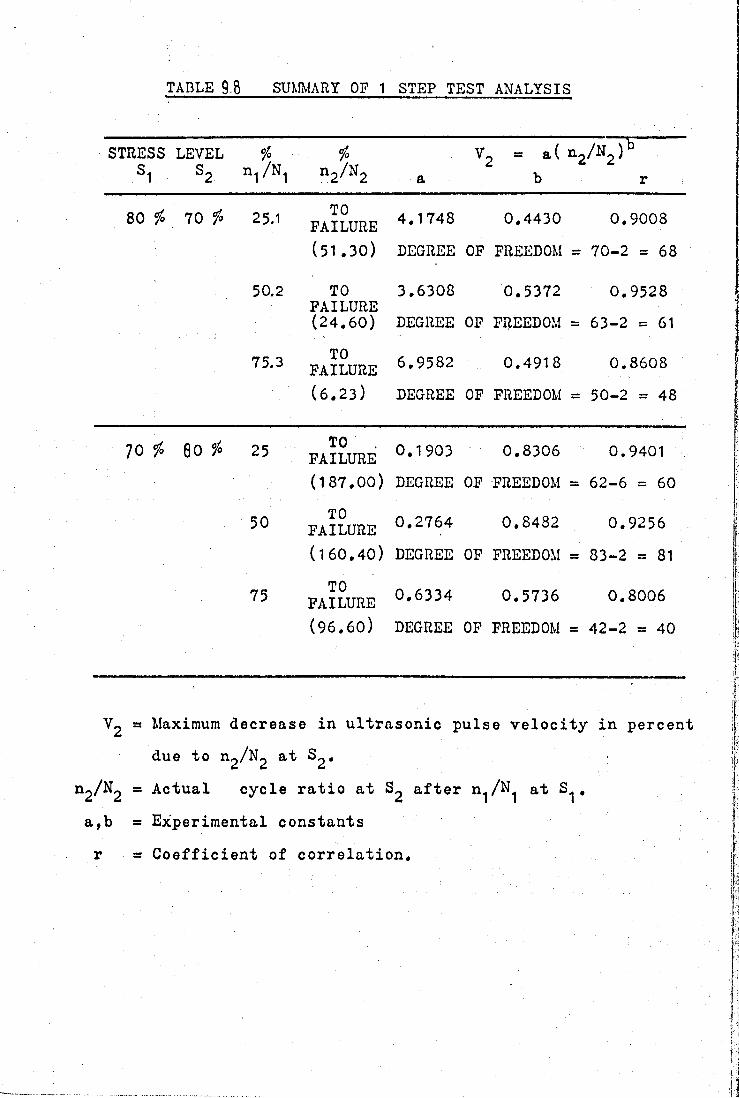
TABLE 9.8 SUMMARY OP 1 STEP TEST ANALYSIS
STRESS LEVEL * * V, a= a( n 2/N )bsi S2 n,/N, n 2/N2 a b r
80 1o 70 fo 25.1 TOFAILURE 4.1748 0.4430 0.9008
(51.30) DEGREE OF FREEDOM = 70-2 = 6 8
50.2 TO 3.6308 0.5372 0.9528FAILURE(24.60) DEGREE OF FREEDOM = 63-2 = 61
75.3 TOFAILURE 6.9582 0.4918 0.8608
(6.23) DEGREE OF FREEDOM = 50-2 = 48
70 1° 80 °/° 25 TOFAILURE 0.1903 0.8306 0.9401
(187.00) DEGREE OF FREEDOM = 62-6 = 60
50 TOFAILURE 0.2764 0.8482 0.9256
(160.40) DEGREE OF FREEDOM = 83-2 = 81
75 TOFAILURE 0.6334 0.5736 0.8006
(96.60) DEGREE OF FREEDOM = 42-2 = 40
V 2 = Maximum decrease in ultrasonic pulse velocity in percent
due to ^2 / ^ 2 ^2*
n2 ^ 2 = Actual cycle ratio at after n -j/ -j at ,
a,b = Experimental constants
r ■« Coefficient of correlation.
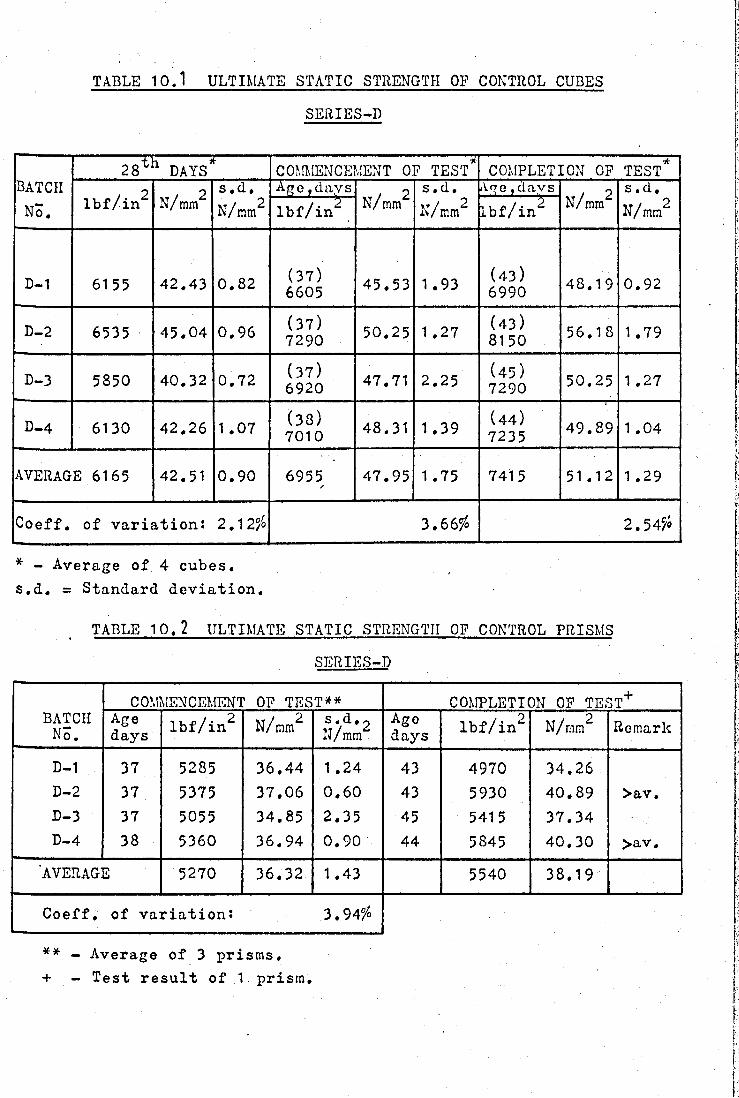
TABLE 10.1 ULTIMATE STATIC STRENGTH OF CONTROL CUBES
SERIES-D
BATCHNo.
28th DAYS* COMMENCEMENT 0!F TEST* c o m p l e t :[ON OF TEST*
lbf/in2 N/mm2s.d.N/mm2
Age »daysN/mm2
s.d.N/mm2
Age,davsN/mm2
s.d.N/ mm*1.lbf/in^ Ibf/in2
D-1 6155 42.43 0.82 (37)6605 45.53 1.93 (43)
6990 48.19 0.92
D-2 6535 45.04 0.96 (37)7290 50.25 1 .27 (43)
8150 56.18 1 .79
D-3 5850 40.32 0.72 (37)6920 47.71 2.25 (45)
7290 50.25 1 .27
D-4 6130 42.26 1 .07 (38)7010 48.31 1.39 (44)
7235 49.89 1 .04
AVERAGE 6165 42.51 0.90 6955 47.95 1 .75 7415 51.12 1 .29
Coeff. of variation: 2.125» 3.66 % 2.54e/»
* - Average of 4 cubes, s.d. = Standard deviation.
TABLE 10.2 ULTIMATE STATIC STRENGTH OF CONTROL PRISMS
SERIES-D
BATCHNÖ.
C0MMENCEMEN3 OF TEST** COMPLETION OF TEi3T+Agedays lbf/in2 N/mm2 s.d.«
N/mmAgedays lbf/in2 N / mm" Remark
D-1 37 5285 36.44 1 .24 43 4970 34.26D-2 37 5375 37.06 0.60 43 5930 40.89 >av.D-3 37 5055 34.85 2.35 45 5415 37.34D-4 38 5360 36.94 0.90 44 5845 40.30 >av.
'AVERAGE 5270 36.32 1.43 5540 38.19
Coeff. of variation: 3.94°/»
** - Average of 3 prisms,+ - Test result of 1 prism.

TABLE 10.3 ULTIMATE STATIC STRENGTH OP CONTROL CUBESSERIES-E
b a t c h+ h * 28xnDAYS COMMENCEMENT OP TEST* COMPLETION OP 1UCST
. 2 , 2 s.d. A g e ,days . 2 s.d. Age,davsN/mm2
s.d.
ol • lbf/in N/mm N/ mm2 lbf/in2 N/mm N/mm2 lbf/in2 N/mm2
E-1 6375 43.95 1 .07 (37)7375 50.86 0.88 (44)
7620 52.55 0.48
E-2 6165 42.52 2.00 (38)7410 51.10 1.21 (45)
7620 51.10 1.65
E-3 6585 45.41 2.47 (39)7750 53.42 0.57 (46) .
8050 55.50 0.34
E-4 6325 43.59 0.42 (42)7500 51.70 2.10 (44)
7655 52.79 1.38
a v e r a g e 6365 43.86 1 .68 7510 51 .77 1 .32 7685 52.98 1 .11Coeff.of variation: 3.855» 2.55# 2.10#
* -Average of 4 cubes.
TABLE 10.L ULTIMATE STATIC STRENGTH OF CONTROL PRISMS
SERIES-E
BATCH
No.
COMMENCEME NT OP TEST** COMPLETION OP TEST+Agedays lbf/in2 N/mm2 s.d.
N/mm^Agedays lbf/in2 N/mm2 Remark
E-1 37 5845 40.30 1.09 44 mm ' — —
E-2 38 5190 35.78 0.69 45 -E-3 39 5940 40.96 1 .60 46 7215 49.72' > ay.E-4 42 5285 36.44 1 .47 44 - —
AVERAGE 5565 38.37 1 .26 \
Coefficient of variation 3.29#
** - Average of 3 prisms.+ - Test result of 1 prism.' - Average of 2 prisms." - Average of 5 prisms,s.d. = Standard deviation.
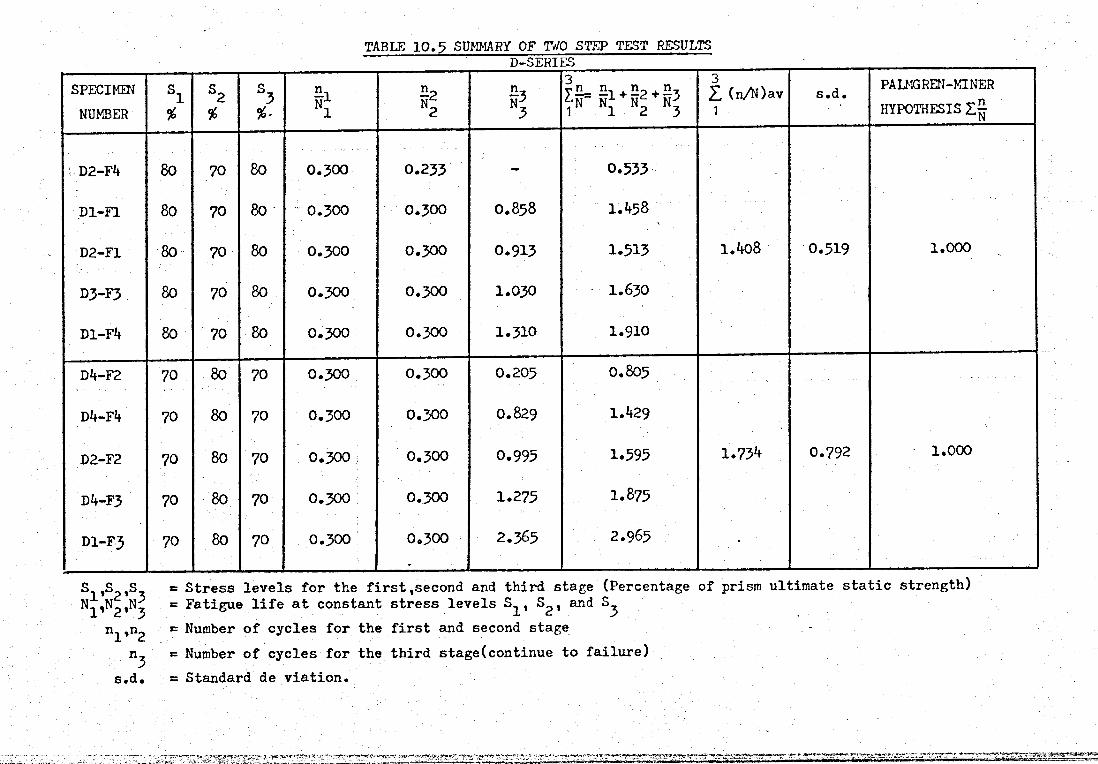
T A B LE 1 0 .5 SUMMARY O F TWO S T E P T E ST RESULTSD - S E R I E S
SPECIMENNUMBER
si*
S2%
S3%■ Ni —2
N2—3N3
vH r: Up + -2 + —3 ~ N N j N | N^
3Z (n/ti)av 1
s.d. PALMGREN-NINER HYPOTHESIS Z|J
D2-F4 80 7° 80 0.300 0.233 0.533
Dl-Fl 80 70 80 0.300 0.300 0.858 1.458
D2-F1 80 70 80 0.300 0.300 0.913 1.513 1.408 0.519 1.000
D3-F3 80 70 8o 0.300 0.300 1.030 1.630
D1-F4 80 70 80 0.300 0.300 1.310 1.910
D4-F2 70 80 70 0.300 0.300 0.205 0.805
D4-F4 70 80 70 0.300 0.300 0.829 1.429
D2-F2 70 80 70 0.300 0.300 0.995 1.595 I .734 0.792 1.000
D4-F3 70 80 70 0.300 0.300 1.275 1.875
D!-F3 7° 80 70 0.300 0.300 2.365 2.965 •
SN 3
3nl*n2
n3s*d*
b Stress levels for the first,second and third stage (Percentage of prism ultimate static strength) e Fatigue life at constant stress levels S^, S^, and S^= Number of cycles for the first and second stage*= Number of cycles for the third stage(continue to failure)= Standard de viation.
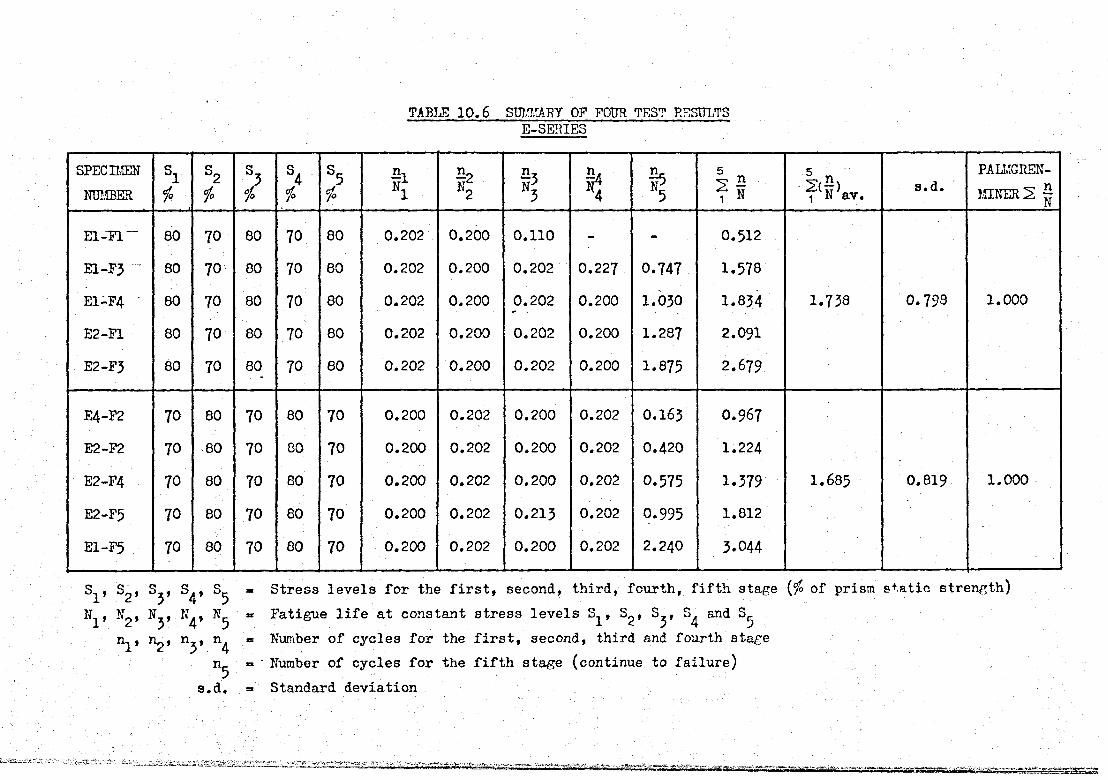
TABLE 10.6 SUMMARY OF FOUR TEST RESULTSE-SERIES
SPECIMENNUMBER
S11°
S2*
S3 V1°
S5*
Sin i
s2N2
a3i
n.<
£5 52 - 7 »
5 V, 2(-)1 N ;av. s.d.
PALMGREN-MINER2 $N
El-FI~ 80 7° 80 70 80 0.202 0.200 0.110 - - O .5 1 2
E1-F3 : 80 70 80 70 80 0.202 0.200 0.202 0 .2 2 7 0.747 1.578
E1-F4 • 80 70 80 70 80 0.202 0.200 0.202 0.200 1.030 1.834 1.738 0.793 1 . 0 0 0
E2-F1 80 70 80 70 80 0.202 0.200 0.202 0.200 1.287 2 .0 9 1
E2-F3 80 70 80 70 80 0.202 0.200 0.202 0.200 1.875 2.679
E4-F2 70 80 70 80 70 0.200 0.202 0.200 0.202 0.163 0.967
E2-F2 7 0 80 70 80 70 0.200 0.202 0.200 0.202 0 .4 2 0 I .2 2 4
E2-F4 7 0 80 70 80 70 0.200 0.202 0.200 0.202 0.575 1.379 1.685 0.819 1.000
E2-F5 7 0 80 70 80 70 0.200 0.202 0.213 0.202 0.995 1.812
E1-F5 70 80 70 80 70 0.200 0.202 0.200 0.202 2 .2 4 0 3 .0 4 4
sl’ S2’ V
CO
S5V V V V
nl’ n2, V n4nc5
Stress levels for the first, second, third, fourth, fifth stage {fo of prism static strength) Fatigue life at constant stress levels S^, S^, S^, S^ and S^Number of cycles for the first, second, third and fourth stage Number of cycles for the fifth stage (continue to failure)Standard deviation
1» SSSSSSSSS8SSS3
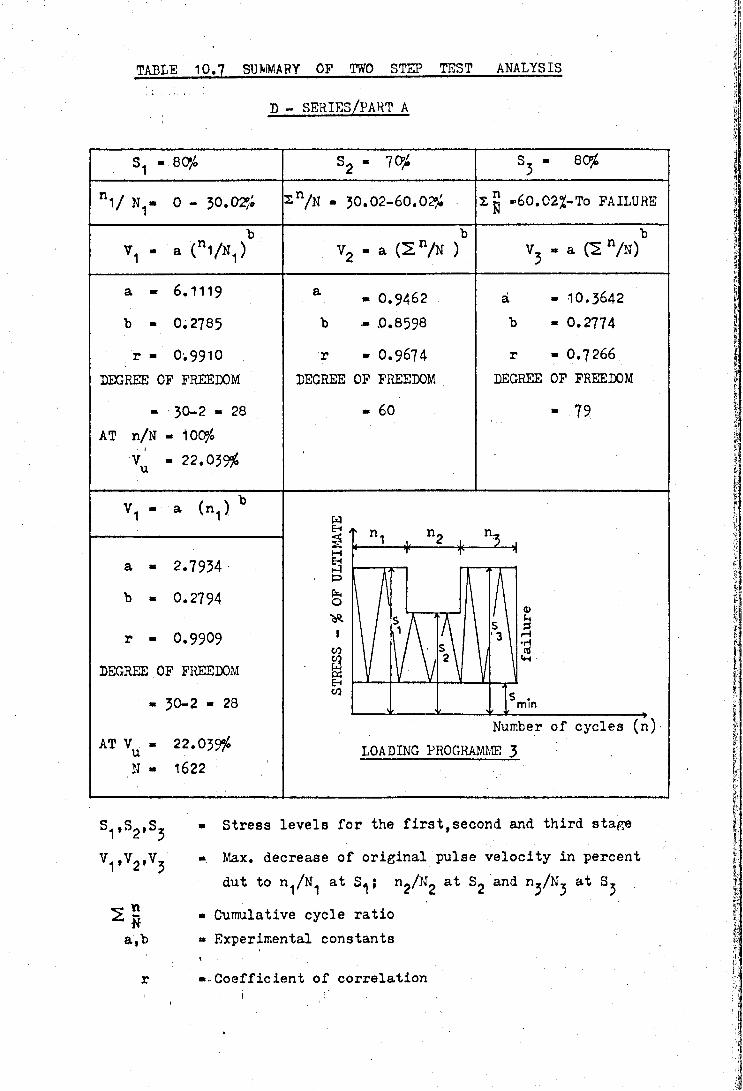
TABLE 10.7 SUMMARY OF TWO STEP TEST ANALYSIS
D - SERIES/PART A
S1 - 80j4 s 2 - 1 0/, Sj - 8 $
nl/ N.J- 0 - 30.0$ 2 n/N - 30.02-60.0$ • E g »60.022-To FAILURE
V1 - a (n 1 /N1 )b
V2 - a ( 2 n/N ) V3 - a (3 n/N)
a « 6.1119
b - 0.2785
r - 0.9910DEGREE OP . FREEDOM
= 30-2 - 28 AT n/N - 1 0 $
vu - 22.03$
a » 0.9462 b - 0.8598
r - 0.9674DEGREE OP FREEDOM .
- 60
à ■ 10.3642 b - 0.2774
r - O .7266DEGREE OP FREEDOM
- 7?
V1 - a (n^) b wS t n, n* n,
a
b
2.7934
0.2794
r - 0.9909
DEGREE OP FREEDOM
- 30-2 - 28
AT Vu - 22.03$N - 1622
Number of cycles (n)- LOADING PROGRAMME 3
» Stress levels for the first,second and third stage
•. Max. decrease of original pulse velocity in percent dut to n^N^ at ; n^/Ng at Sg and n^/N^ at
■ Cumulative cycle ratio■ Experimental constants
r -Coefficient of correlation
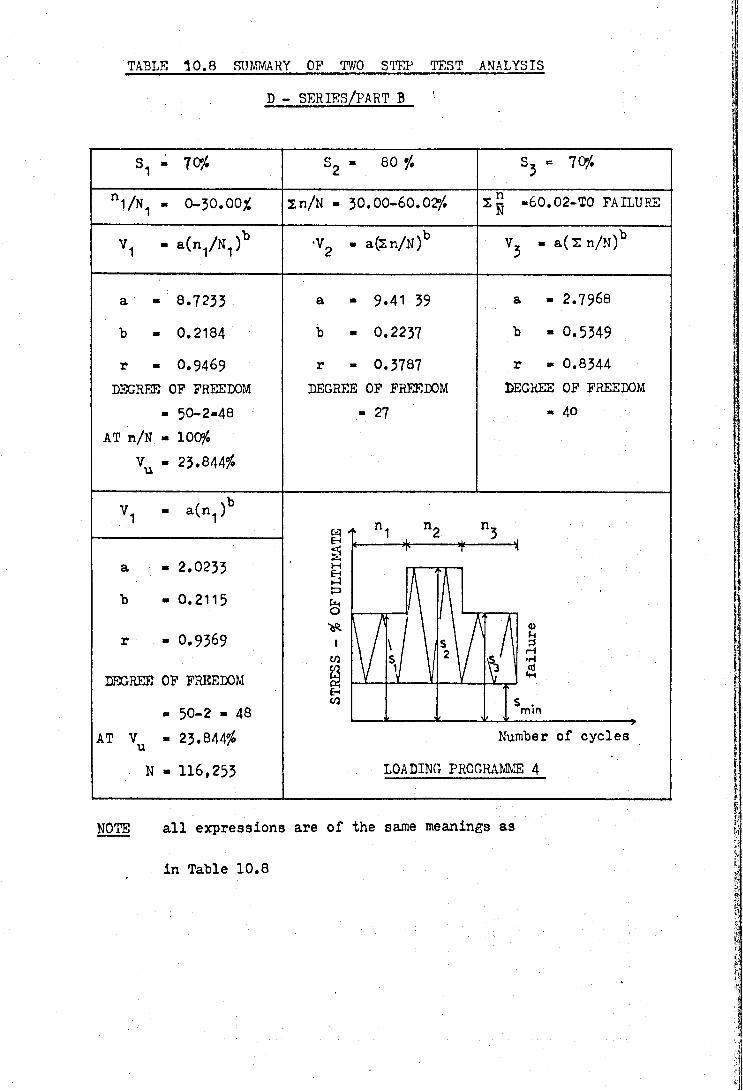
TABLE 10.8 SUMMARY OP TWO STEP TEST ANALYSIS
D - SERIES/PART B '
S1 - 70$ S2 - 80 $ Sj = 7 0$
ni/N1 - 0-30.00* 2 n/N - 30.00-60.02$ -60.02-T0 FAILURE
V1 - a(n1/N1)b •V? - a(2n/N)b Vj ■ a(2n/N)b
a - ’ 8.7233 a - 9.41 59 a - 2.7968
b - 0.2184 b - 0.2237 b - 0.5549
r - O .9 4 6 9
DEGREE OP FREEDOM - 50-2-48
AT n/N - 100$Vu - 23.844$
r - 0.3787DEGREE OP FREEDOM
- 27
r - 0.8344 DEGREE OF FREEDOM
. 40
1 a(n1)'
a ■ - 2.0233
b - 0.2115
r - 0.9569
DEGREE OP FREEDOM
- 50-2 - 48 AT Vu - 23.844$
N - 116,255 LOADING PROGRAMME 4
NOTE all expressions are of the same meanings as
in Table 10.8
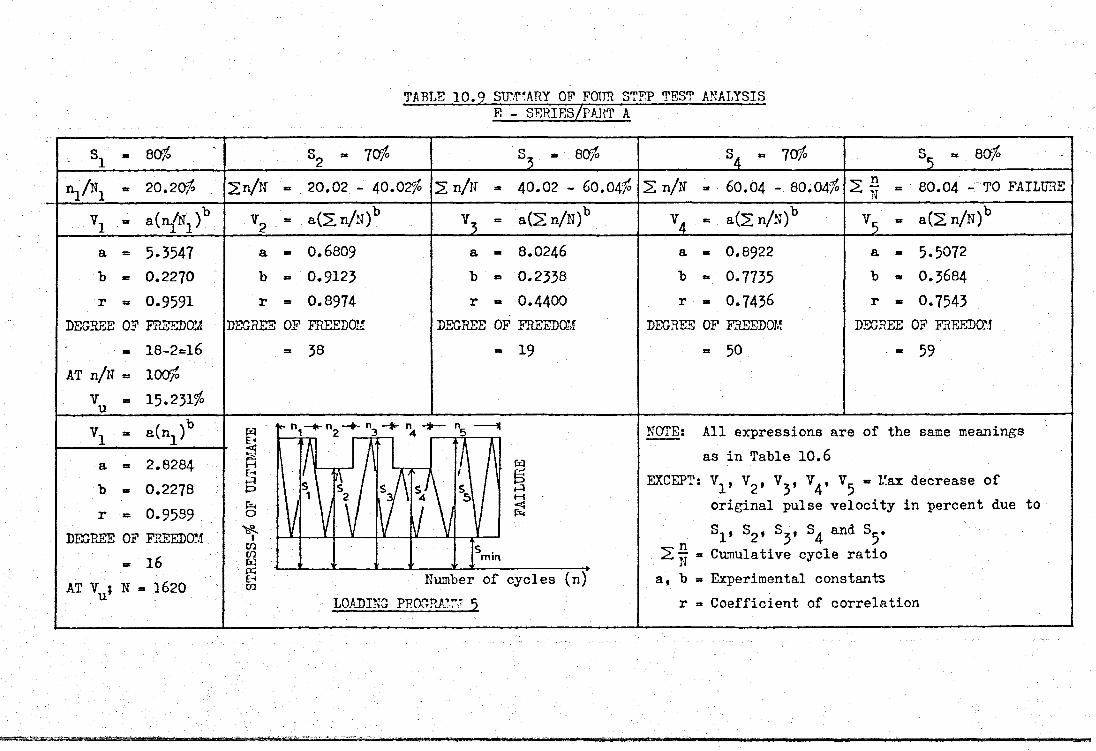
TABLE 10.9 SUMMARY OF FOUR STEP TEST ANALYSISE - SERIES/PART A
80?° 10?° 8 Qf?o 10?° Q0?°
ni/"i 20.20?° 2 n/N - 20.02 - 40.0256 2 n/N 40.02 - 60.04?® 2 n / S - 60.04 - 80.0456 2 -^ N 80.04 - TO FAILÜHÏ
V2 = a(2n/N)‘ a (2 n/N) a(2 n/N) V5 » a(2n/N)'
abr
DEGREE
AT n/NYu
- 5.3547« 0 .2 2 7 0
- 0.9591 OF FREEDOM- 18- 2=16 = 10056= I5.2315S
a - 0.6809b - 0.9123 r = 0.8974
DEGREE OF FREEDOM - 33
a = 8.0246b = 0.2338r = 0.4400
DEGREE OF FREEDOM = 19
a = 0.8922 b = 0.7735 r = 0.7436
DEGREE OF FREEDOM= 50
a = 5.5072 b = 0.3684 r = 0.7543
DEGREE OF FREEDOM- 59
t( v
abr
DEGREE
A T Y u;
= 2.8284 » 0.2278
- 0.9589OF FREEDOM tx 16
N = 1620
NOTE; All expressions are of the same meanings as in Table 10.6
Max decrease oforiginal pulse velocity in percent due to
EXCEPT; V1, Vy V5
£>1* S^» Sj, S4 and S^.2 = Cumulative cycle ratio
b = Experimental constants r = Coefficient of correlation

TABLE 10.10 SU?!MAEY OF FOUR STEP TEST ANALYSIS E - SERIS5/PART B
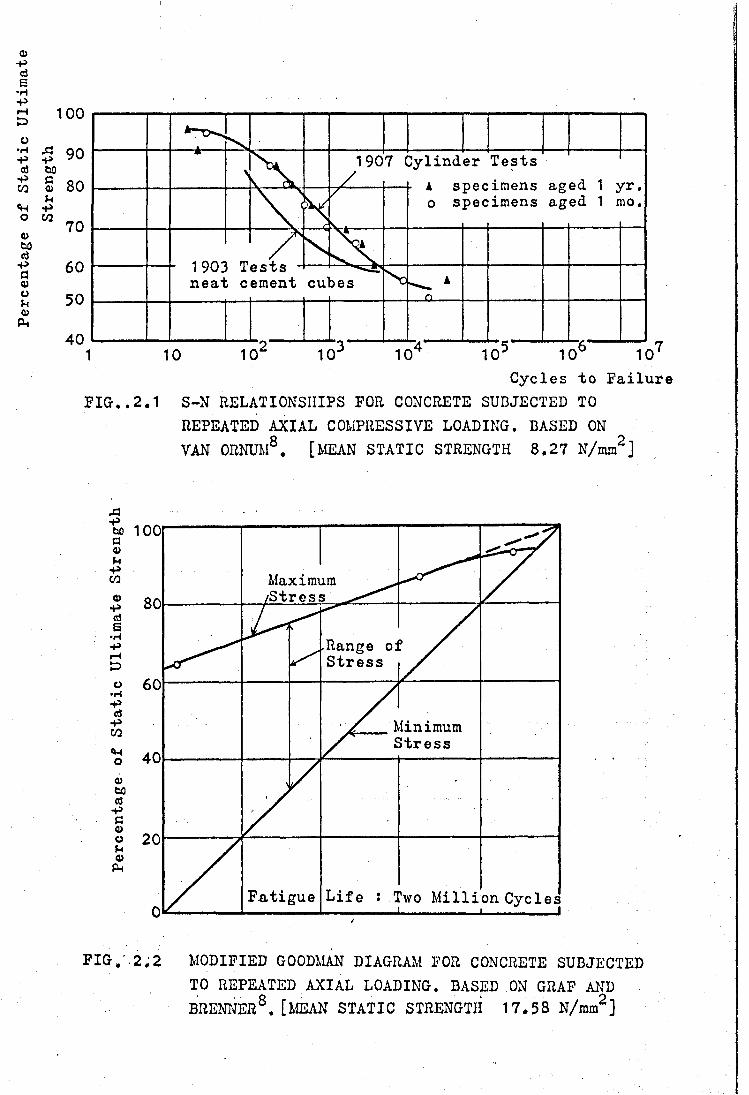
Perc
enta
ge of
Sta
tic
Ulti
mate
St
reng
th
REPEATED AXIAL COMPRESSIVE LOADING. BASED ON VAN ORNUM8 . [MEAN STATIC STRENGTH 8.27 N/mm2 ]
Xi
PIG. 2.2 MODIFIED GOODMAN DIAGRAM FOR CONCRETE SUBJECTED TO REPEATED AXIAL LOADING. BASED .ON GRAF AND BRENNER8 .[MEAN STATIC STRENGTH 17.58 N/ram2 ]
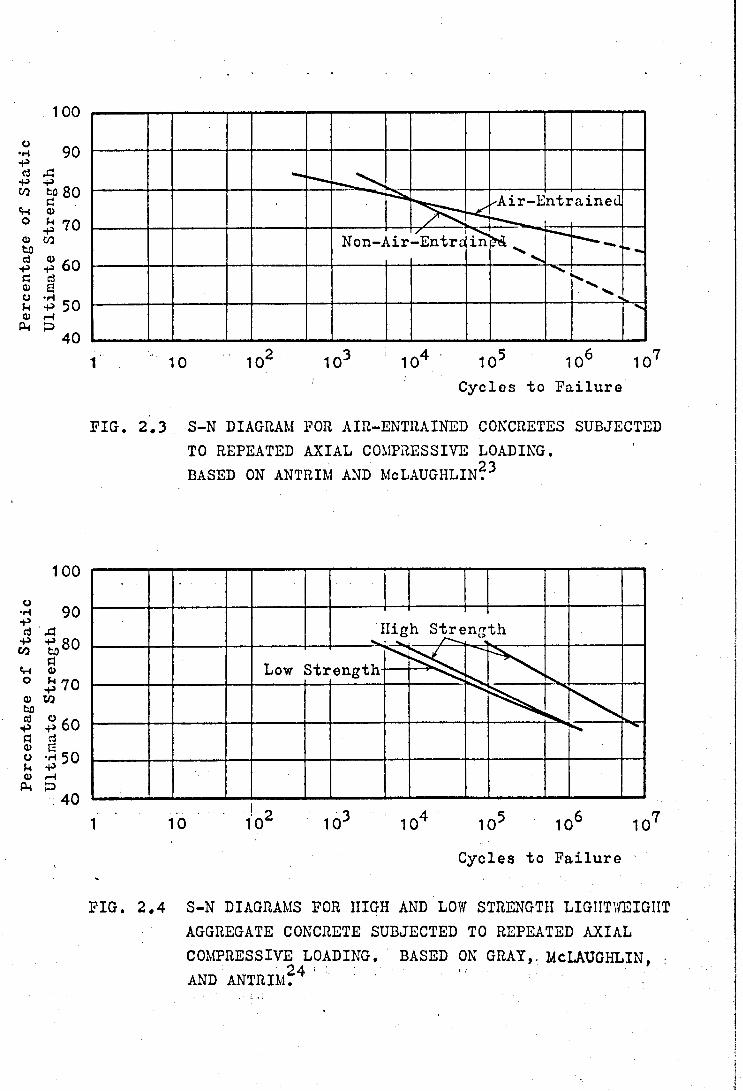
Perc
enta
ge of
Sta
tic
Perc
enta
ge of
Sta
tic
Ulti
mate
Str
engt
h Ul
tima
te S
tren
gth
1 0 0
Cycles to Failure
FIG. 2.3 S-N DIAGRAM FOR AIR-ENTRAINED CONCRETES SUBJECTED TO REPEATED AXIAL COMPRESSIVE LOADING.BASED ON ANTRIM AND McLAUGHLIN?3
Cycles to Failure
FIG. 2.4 S-N DIAGRAMS FOR HIGH AND LOW STRENGTH LIGHTWEIGHT AGGREGATE CONCRETE SUBJECTED TO REPEATED AXIAL COMPRESSIVE LOADING. BASED ON GRAY,. McLAUGHLIN, : AND ANTRIM?4 '
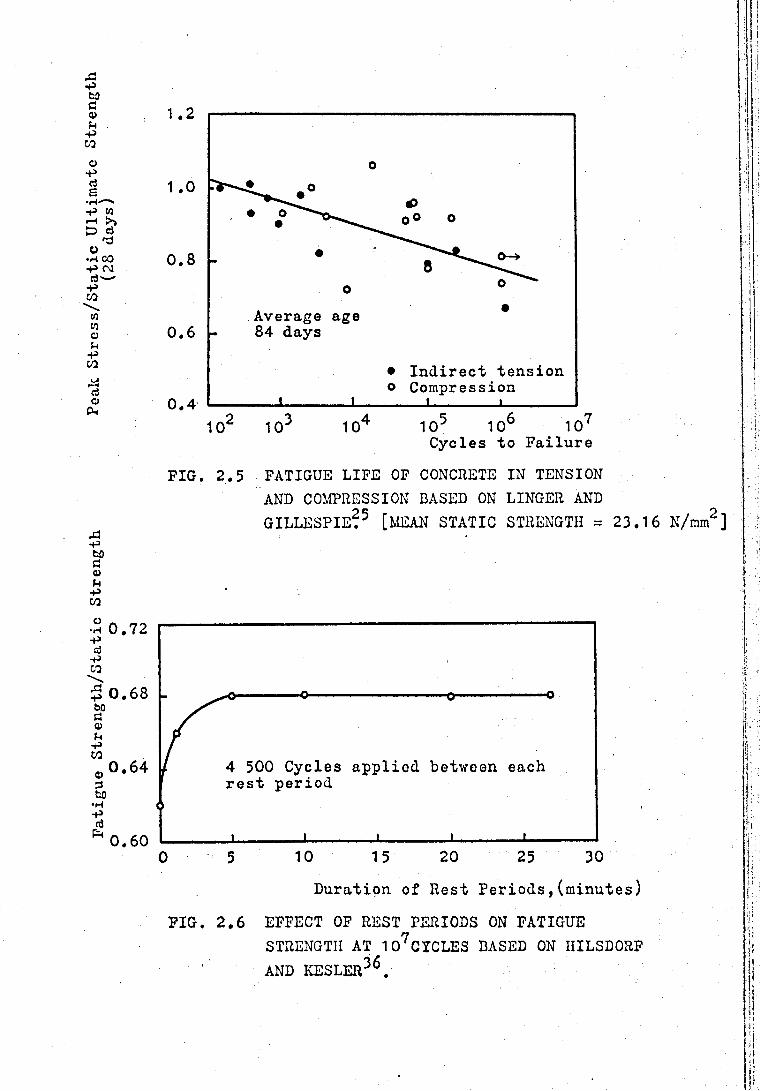
APfcOa0)u•pcooPd6p CO <H >> C3 d dJ o•ri CO P (M d -— -P COCOCOopCO
dop*
P3PbOaoPipco
Cycles to Failure
FIG. 2.5 FATIGUE LIFE OF CONCRETE IN TENSION AND COMPRESSION BASED ON LINGER AND GILLESPIE?5 [MEAN STATIC STRENGTH = 23.16 N/mm2 ]
FIG. 2.6 EFFECT OF REST PERIODS ON FATIGUESTRENGTH AT 107CICLES BASED ON IIILSDORF AND KESLER36.
¡:U¿I;li t‘ t3*ir> .I •
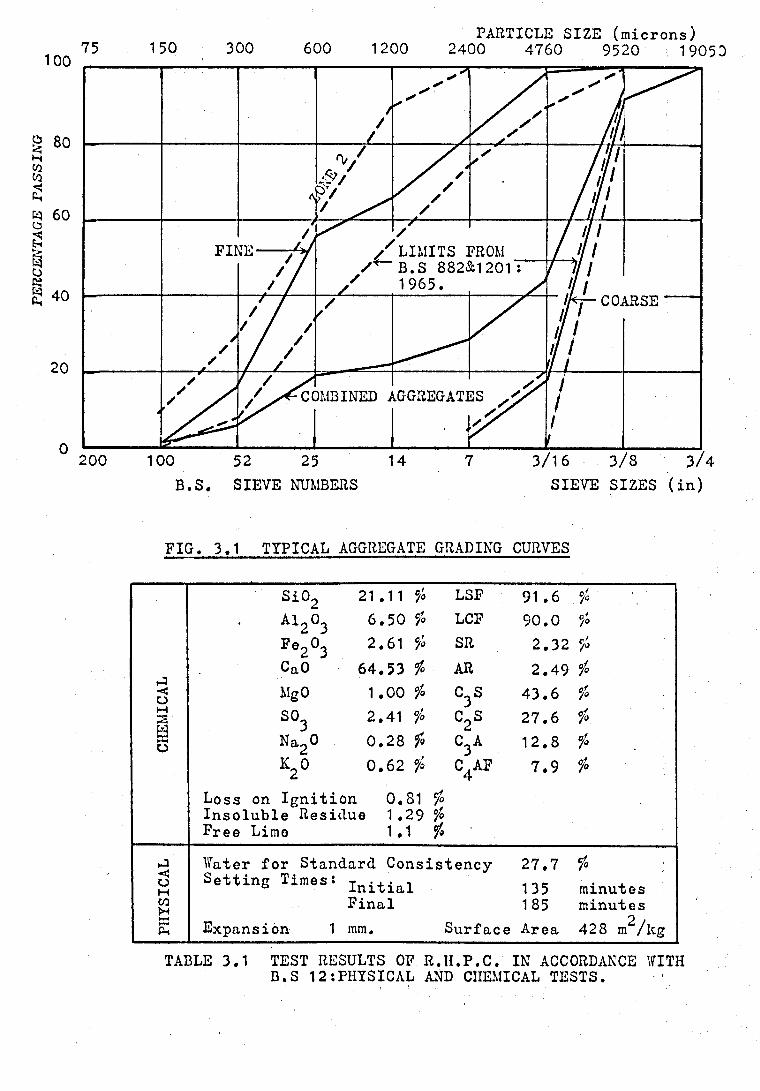
PERC
ENTA
GE P
ASSIN
GPARTICLE SIZE (microns)
FIG. 3.1 TYPICAL AGGREGATE GRADING CURVES
Si02 21.11 °/o LSF 91.6A L O 6.50 f LCF 90.0 °/°Fe2°3 2.61 c/° SR 2.32 c/oCa0 64.53 % AR 2.49 °/°
1.00 °/°o MgO °3S 43.6 foM2 S°3 2.41 °/o C2S 27.6 °/>
O Na20 0.28 f c 3a 12.8
V 0.62 f C .AF 4 7.9 1°
Loss on Ignition 0.81 <foInsoluble Residue 1 .29 7°Free Lime 1.1 % '
Water for Standard Consistency 27.7•*$OM Setting Times: Initial 135 minutesCOH Final 185 minutesHIPi Expansion 1 mm. Surface Area 428 m^/kg
TABLE 3.1 TEST RESULTS OF R.H.P.C. IN ACCORDANCE WITH B.S 12:PHYSICAL AND CHEMICAL TESTS.
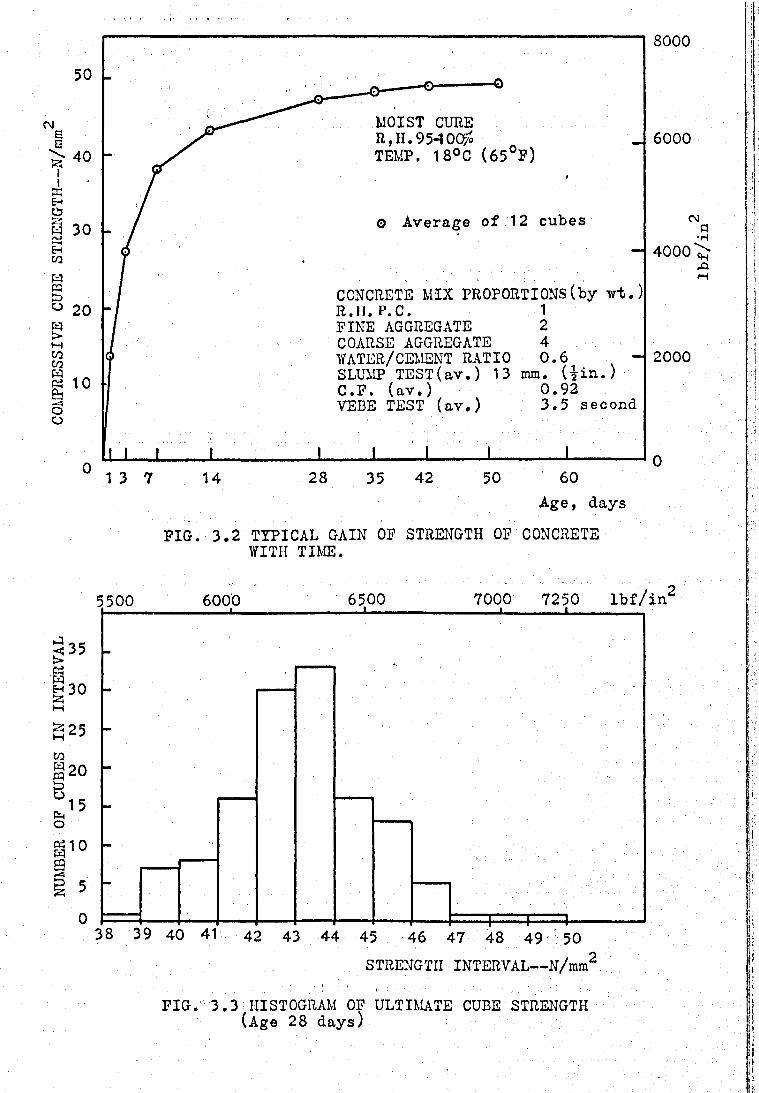
NUMB
ER O
F CU
BES
IN I
NTER
VAL
COMP
RESS
IVE
CUBE
STR
ENGT
H—N/ram
8000
50
CM40 -
30
20 -
10
0 1 3 7 14
MOIST CURE R,H.9540<#TEMP. 18°C (65°P)
O Average of . 12 cubes
_ 6000
CONCRETE MIX PROPORTIONS(by wt.) R.H. P.C. 1FINE AGGREGATE 2COARSE AGGREGATE 4VATER/CEMENT RATIO 0.6 -SLUMP TEST(av. ) 13 mm. ( H O C.F. (av.) 0.92VEBE TEST (av.) 3.5 second
CM- 4000
2000
028 35 42 50 60
Age, days
FIG. 3.2 TYPICAL GAIN OF STRENGTH OF CONCRETE WITH TIME.
F I G . 3.3 HISTOGRAM OF ULTIMATE CUBE STRENGTH (Age 28 days)
lbf/
in
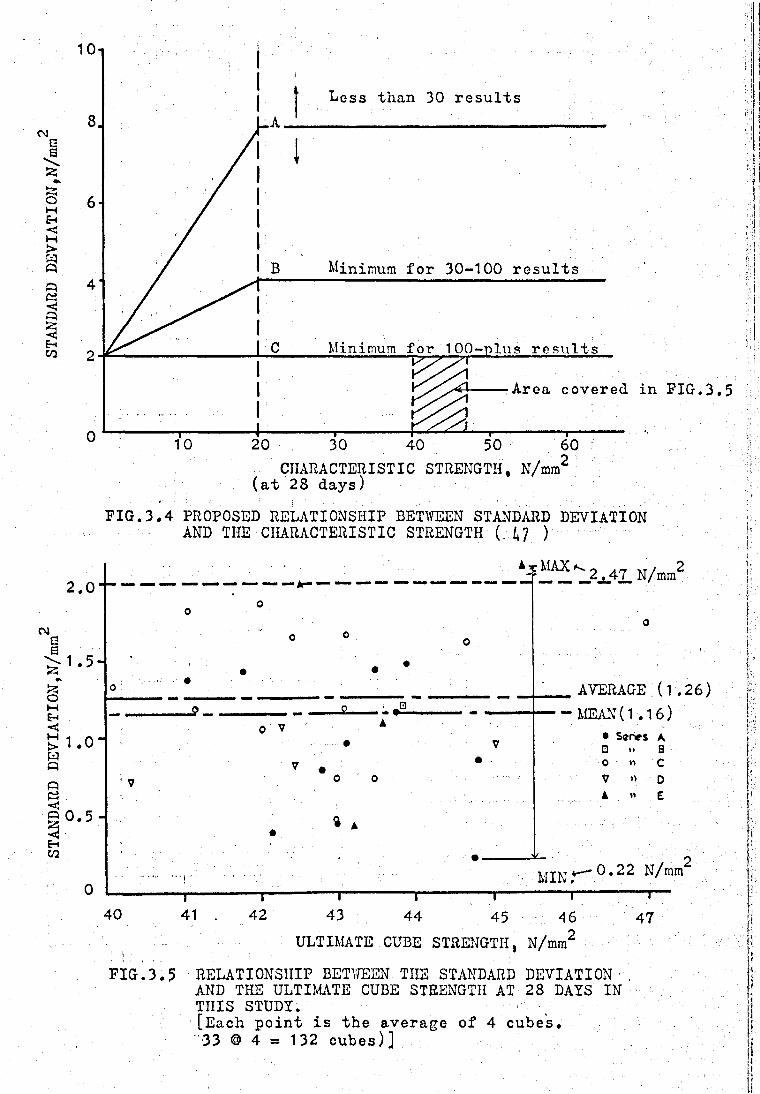
STAN
DARD
DEV
IATI
ON,N
/mm
STAN
DARD
DEV
IATI
ON,N
/mra
F I G.3.4 PROPOSED RELATIONSHIP BETWEEN STANDARD DEVIATIONAND THE CHARACTERISTIC STRENGTH {. Ul )
2.0
1.5-
o 0
0 o 0
A * MAX 2_j47. N/mm2
o
1 .0
o
7
0 V
0.5 % k
AVERAGE (1.26) MEAN(1.16)
• Series A Q •> B o » C 7 *> Dk « E
o L-40
-,... MIN ^ *22 • /mra7”------------- 1 I I........ .. 7“ I I T~*41 42 43 44 45 46 47
ULTIMATE CUBE STRENGTH, N/mm2
FIG.3.5 RELATIONSHIP BETWEEN THE STANDARD DEVIATION AND THE ULTIMATE CUBE STRENGTH AT 28 DAIS IN THIS STUDY. - ^[Each point is the average of 4 cubes.33 @ 4 = 132 cubes)]

FIG. 3.6 NEW CAPPING JIG [Scale 1:2] All dimensions are in inches ( 1 inch = 25.4 m m . )
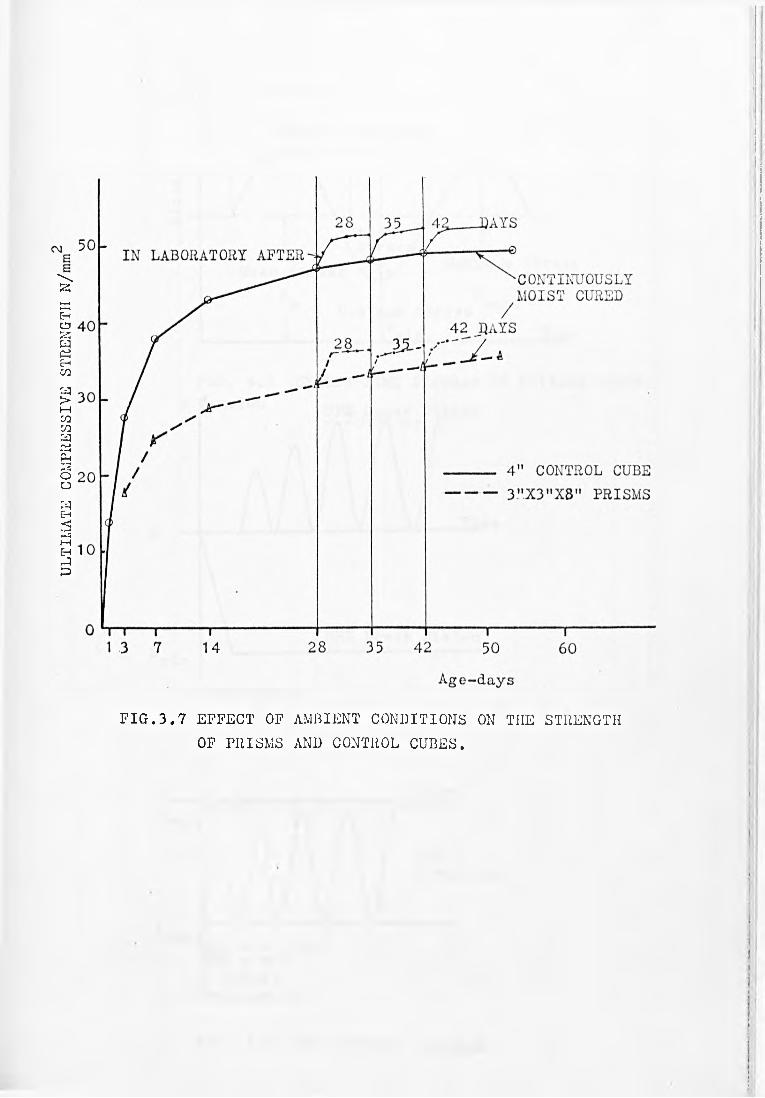
ULTI
MATE
COM
PRES
SIVE
STR
ENGT
H N/
F IG.3.7 EFFECT OF AMBIENT CONDITIONS ON THE STRENGTH OF PRISMS AND CONTROL CUBES.

Stress
FIG. 4.1 STRESS-TIME DIAGRAM IN FATIGUE TESTS
- Compression + Tension
FIG. 4.2 UHS LOADING DIAGRAM

TESTING MACHINE
FIG. 4.3 SCHEMATIC LAYOUT OF LOSENHAUSEN UHS 60 FATIGUE TESTING MACHINE.

o c a l e
FIG. 4.4 SCHEMATIC ARRANGEMENT OF LAMB'S
EXTENSOMETER EQUIPMENT.
FIG. 4.5 PUNDIT SYSTEM DIAGRAM
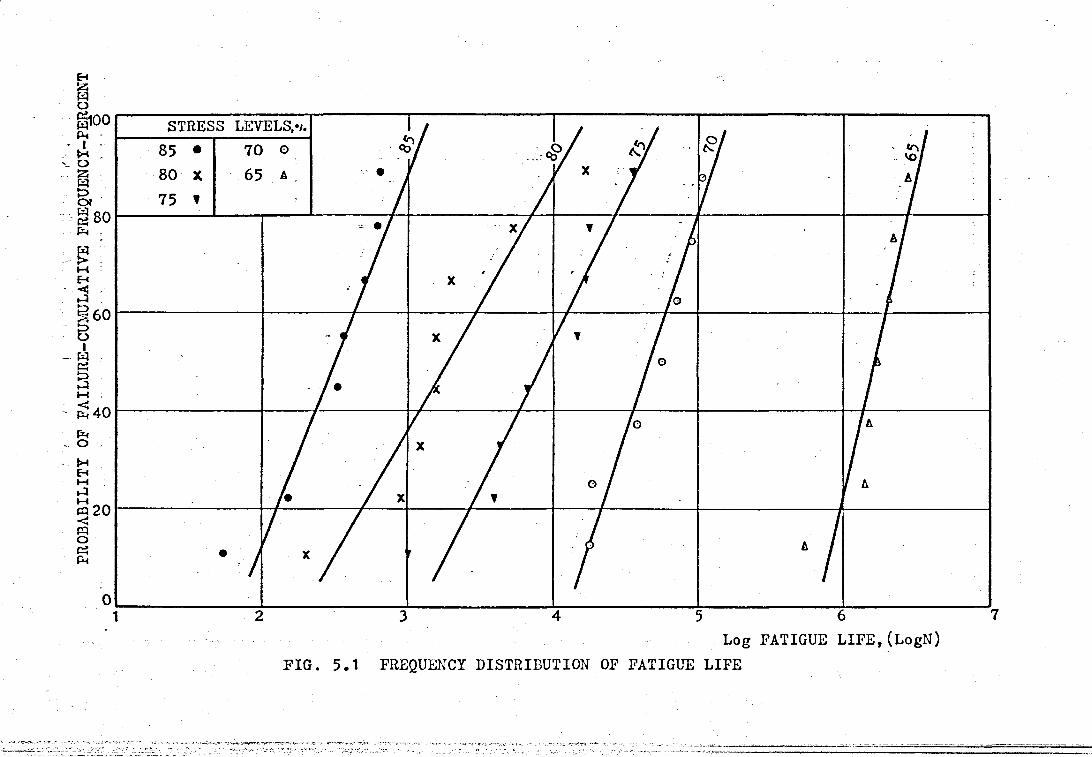
PROB
ABIL
ITY
OF F
AI LU
RE- C
UMUL
AT I V
E FR
EQUE
NCI-
PETÌ
C

00
90
80
70
60
50
40
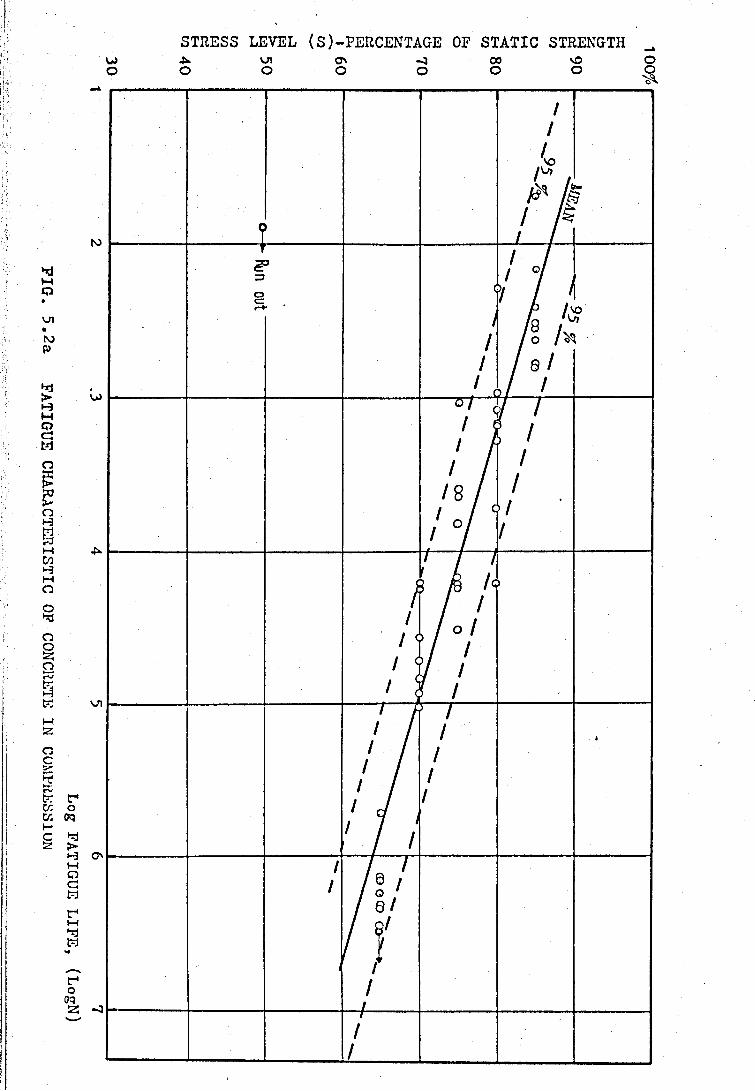
PIG. 5.2a
FATIGUE CHARACTERISTIC OF CONCRETE IN COMPRESSION
STRESS LEVEL (S )-PERCENTAGE OF STATIC STRENGTHW 4* Ui ON -q 00 OO O O O O O O 5^
001
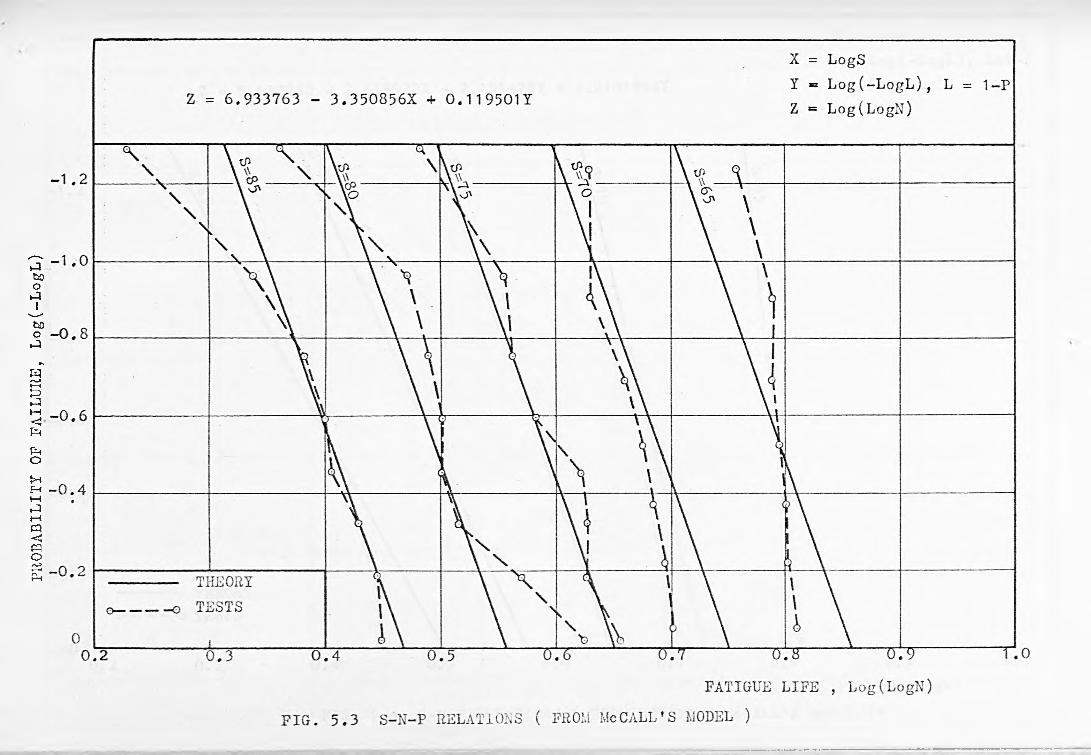
PROB
ABIL
ITY
OP F
AILU
RE,
Log(
-Log
L)
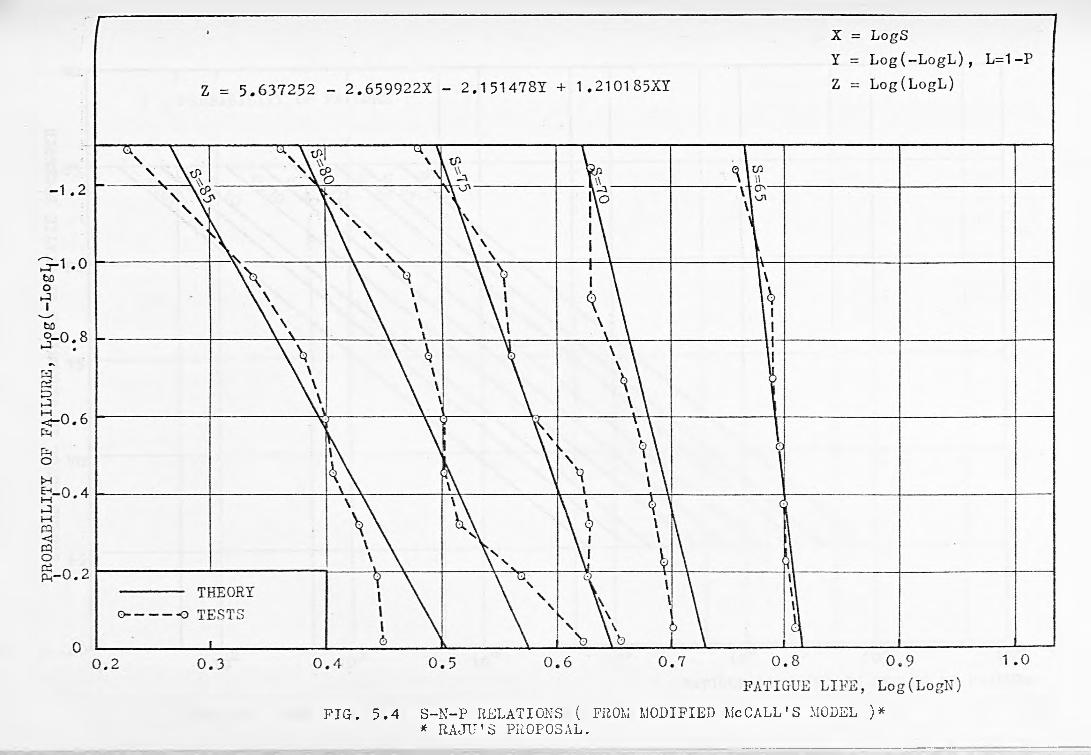
FIG. 5.4 S-N-P RELATIONS ( FROM MODIFIED McCALL'S MODEL )* * RAJU'S PROPOSAL.
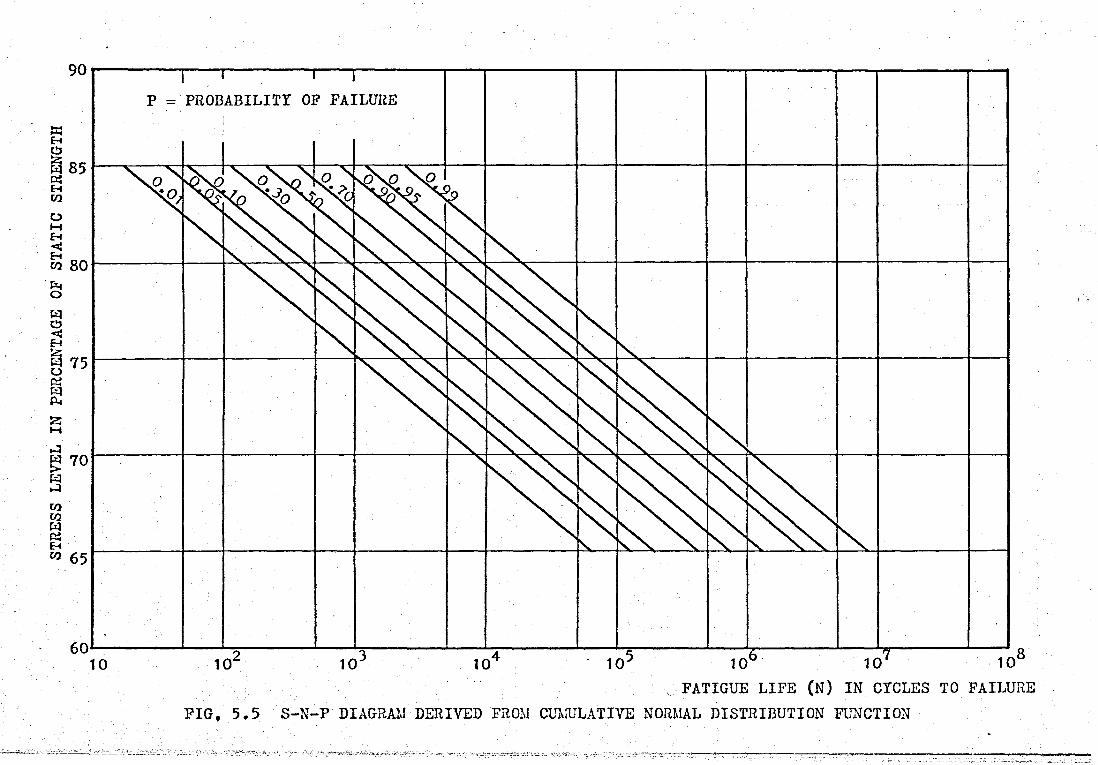
90
EhC5U 85«EhC OOMEh«JEhco 80Phowe>EHis;« 75 owfitis;
g 70»-3C OC OW«EhC O 65
60
FIG, 5,5 S-N-P DIAGRAM DERIVED FROM CUMULATIVE NORMAL DISTRIBUTION FUNCTION

90---------MeCALL'S MODEL-------- MODIFIED McCALL'S
60|___________________________ _______________________________________ ________ ____________________________________ L10 102 103 104 105 106 107 108
FATIGUE LIFE (N) IN CYCLES TO FAILURE FIG. 5.6 S-N-P DIAGRAMS DERIVED FROM 3 MODELS
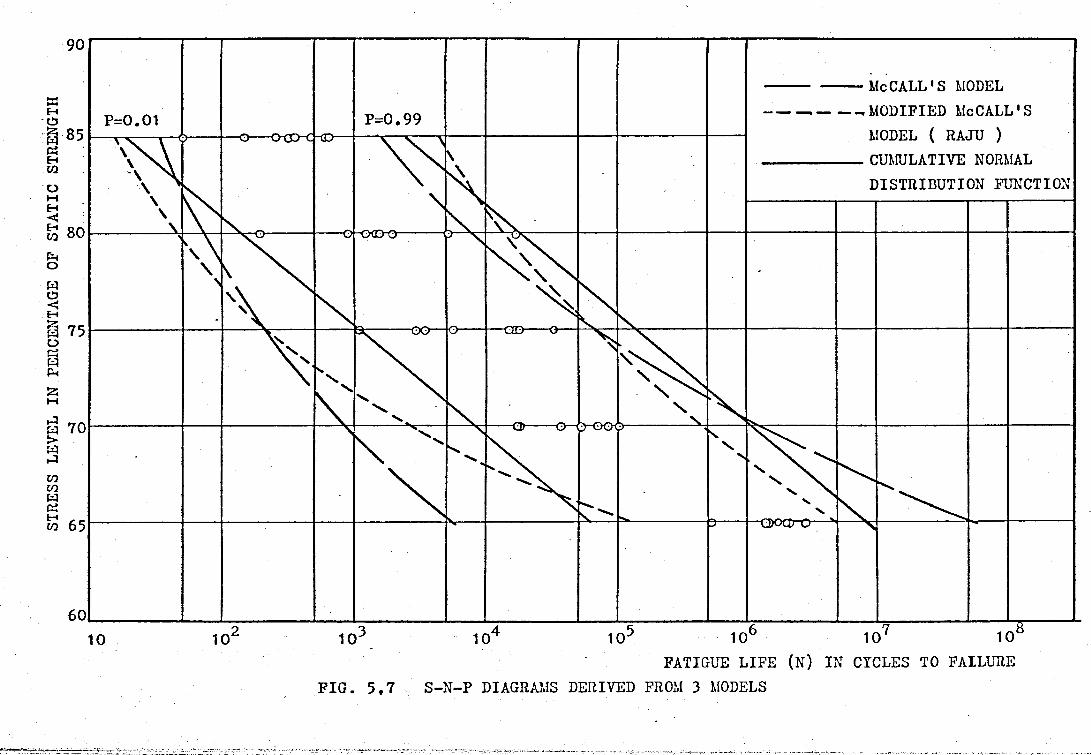
90
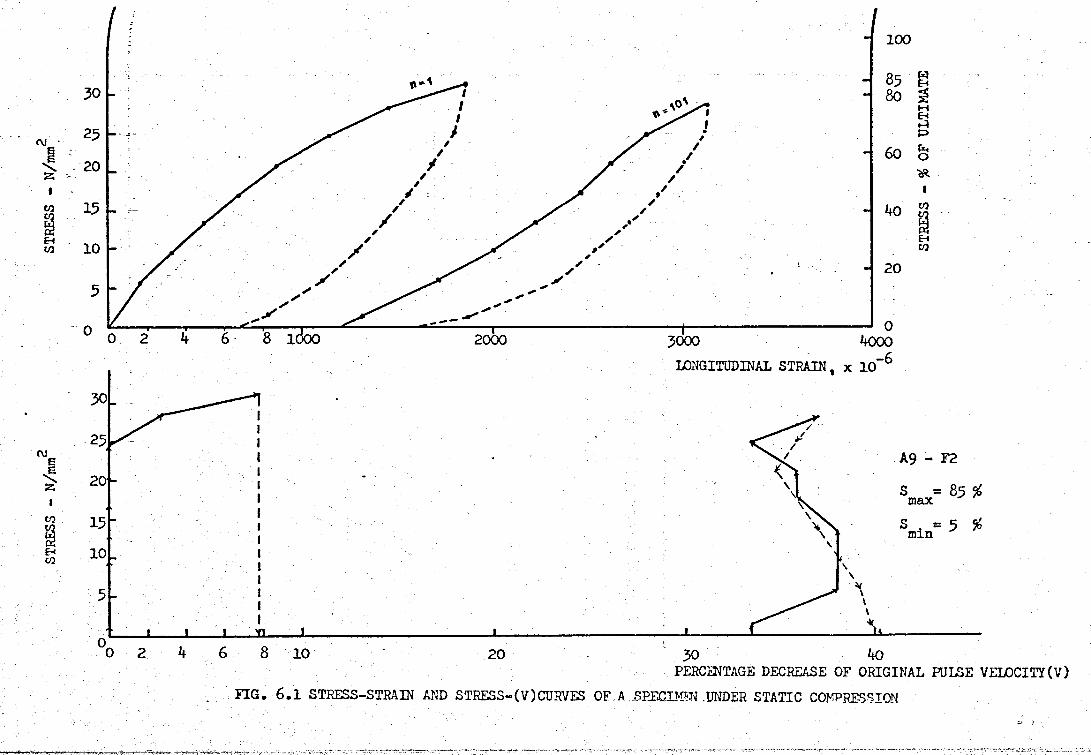
STRE
SS -
N/mra
STRE
SS -
N/m
m<\j •
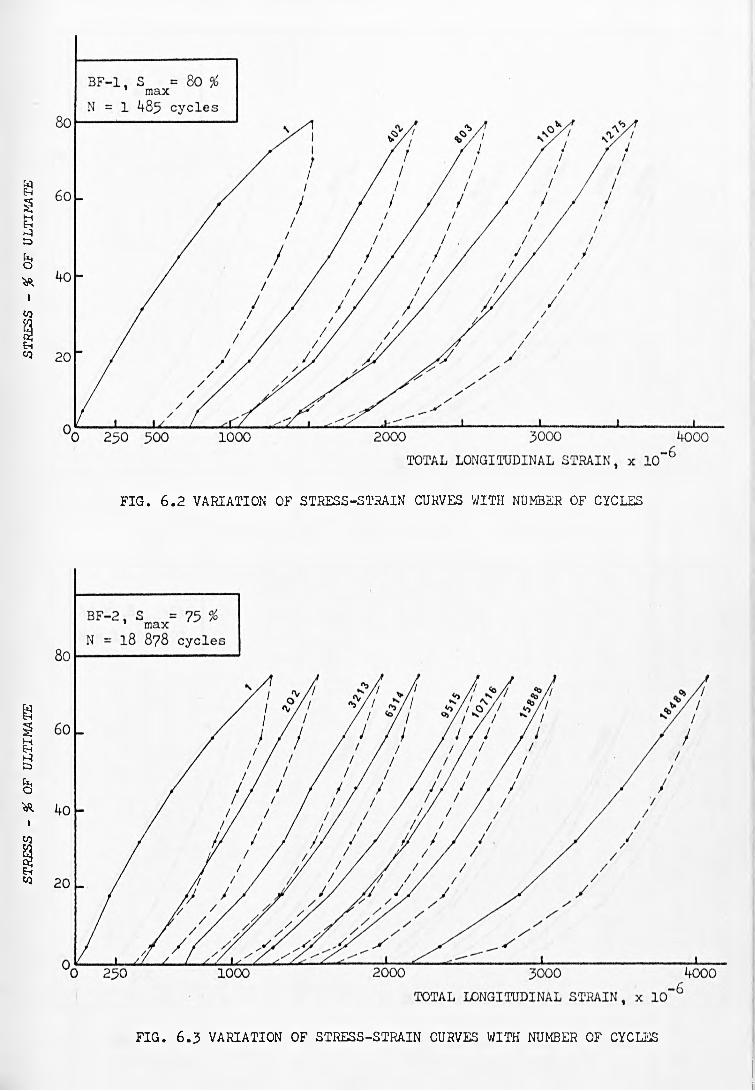
ST
RE
SS
-
%
OF
U
LT
IMA
TE
S
TR
ES
S
- %
O
F
UL
TIM
AT
E
FIG. 6.2 VARIATION OF STRESS-STRAIN CURVES WITH NUMBER OF CYCLES
FIG. 6.3 VARIATION OF STRESS-STRAIN CURVES WITH NUMBER OF CYCLES
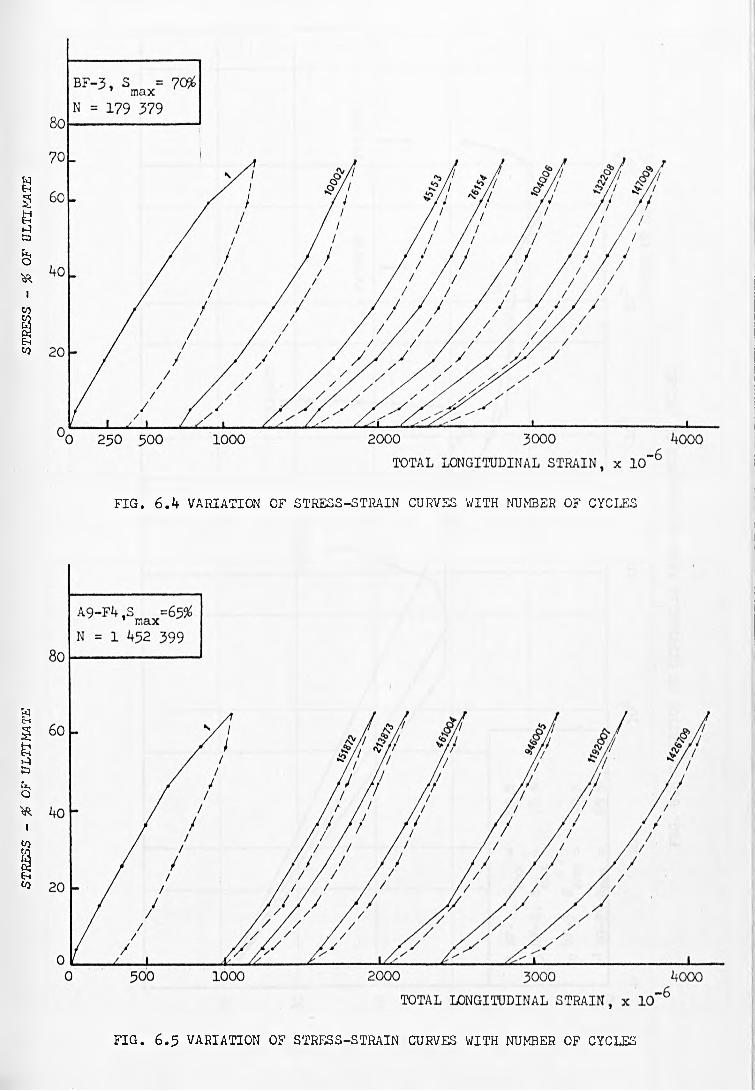
ST
RE
SS
-
%
OF
UL
TIM
AT
E
ST
RE
SS
-
%
O
F
UL
TIM
AT
E
F IG . 6 . if VARIATION OF STRESS-STRAIN CURVES WITH NUMBER OF CYCLES
FIG. 6.5 VARIATION OF STRESS-STRAIN CURVES WITH NUMBER OF CYCLES
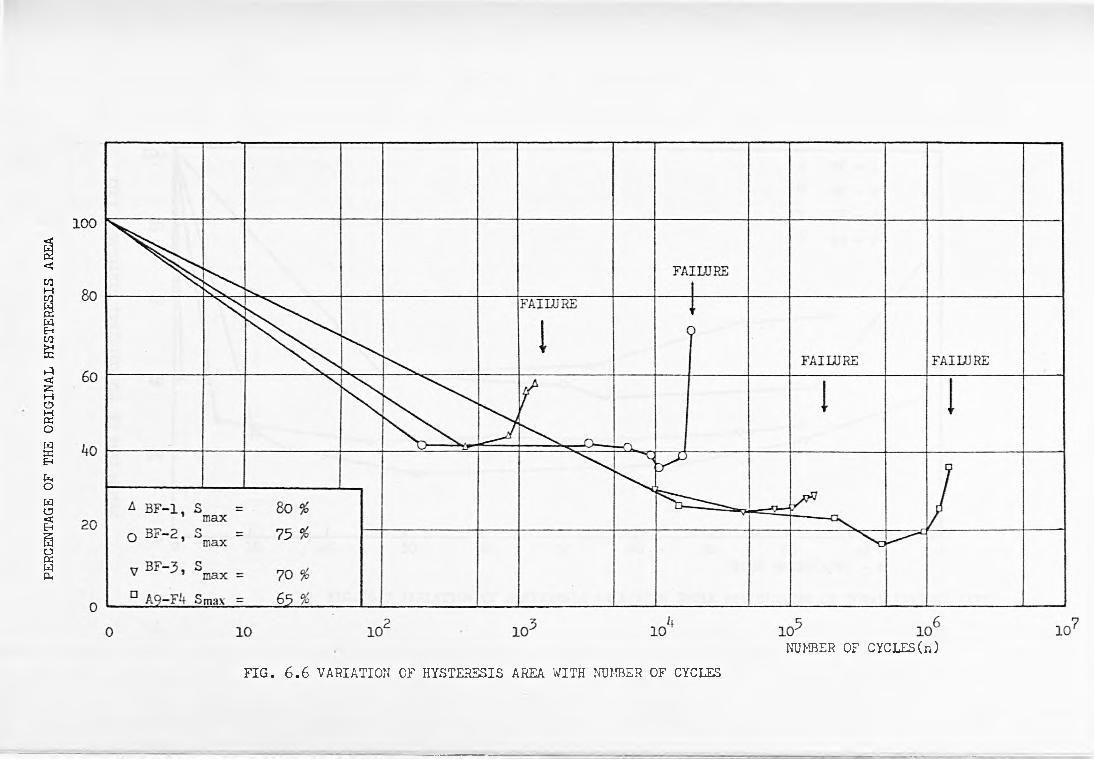
PERC
ENTA
GE
OF
THE
OR
IGIN
AL
HY
STER
ESIS
A
REA
NUMBER OF CYCLES(n)
FIG. 6.6 VARIATION OF HYSTERESIS AREA WITH NUMBER OF CYCLES
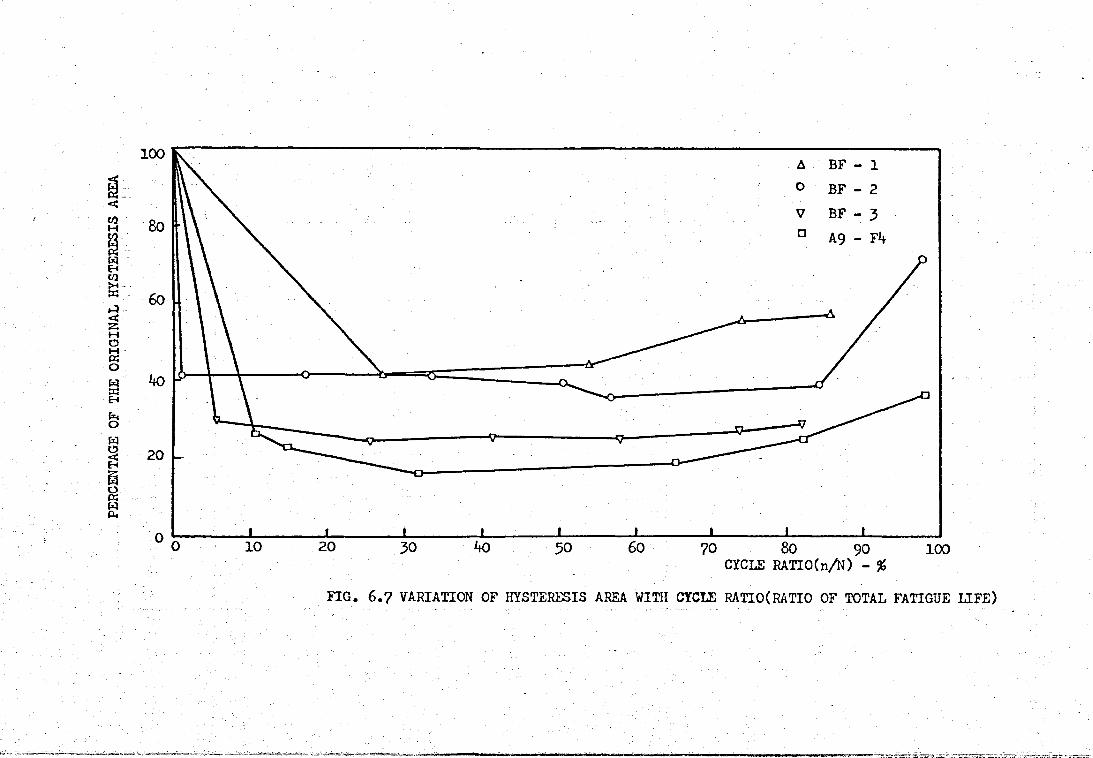
PERC
ENTA
GE O
F TH
E OR
IGIN
AL HYS
TERE
SIS
AREA
FIG. 6.7 VARIATION OF HYSTERESIS AREA WITH CYCLE RATIO (RATIO OF TOTAL FATIGUE LIFE)

TOTA
L LO
NG
ITU
DIN
AL
STR
AIN
(£
),
6000
V£>IOi—!
5000
^000 -
5000
2000
1000
010" 10NUMBER OF CYCLES(n)
FIG. 6.8 VARIATION OF TOTAL LONGITUDINAL STRAIN WITH NUMBER OF CYCLES
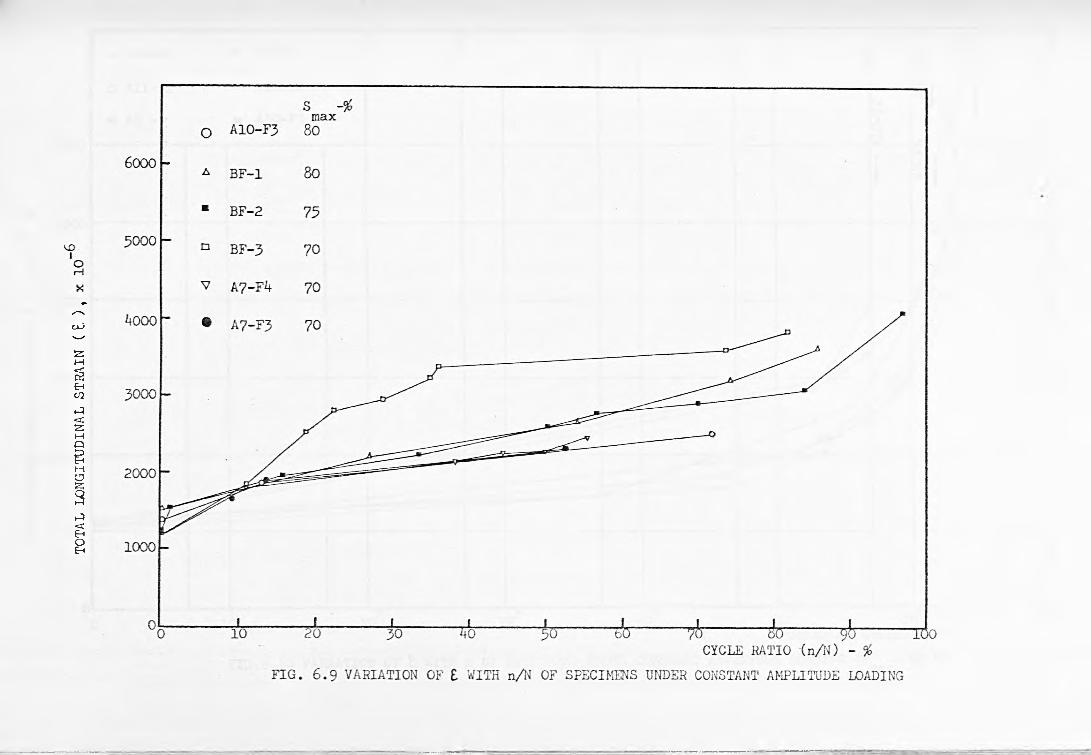
TOTA
L LO
NG
ITU
DIN
AL
STR
AIN
( E. ) ,

TOTA
L LO
NG
ITU
DIN
AL
STR
AIN
(
î )
,

TOTA
L LO
NG
ITU
DIN
AL
STR
AIN
(
í ),
F IG . 6 .1 1 VARIATION OF i WITH n/N OF SPECIMENS UNDER CONSTANT AMPLITUDE LOADING (S = 6 5$ )may

ELA
ST
IC
STR
AIN
(£
,)
FIG. 6.12 VARIATION CF EMSTIC STRAIN WITH NUMBER OF CYCLES
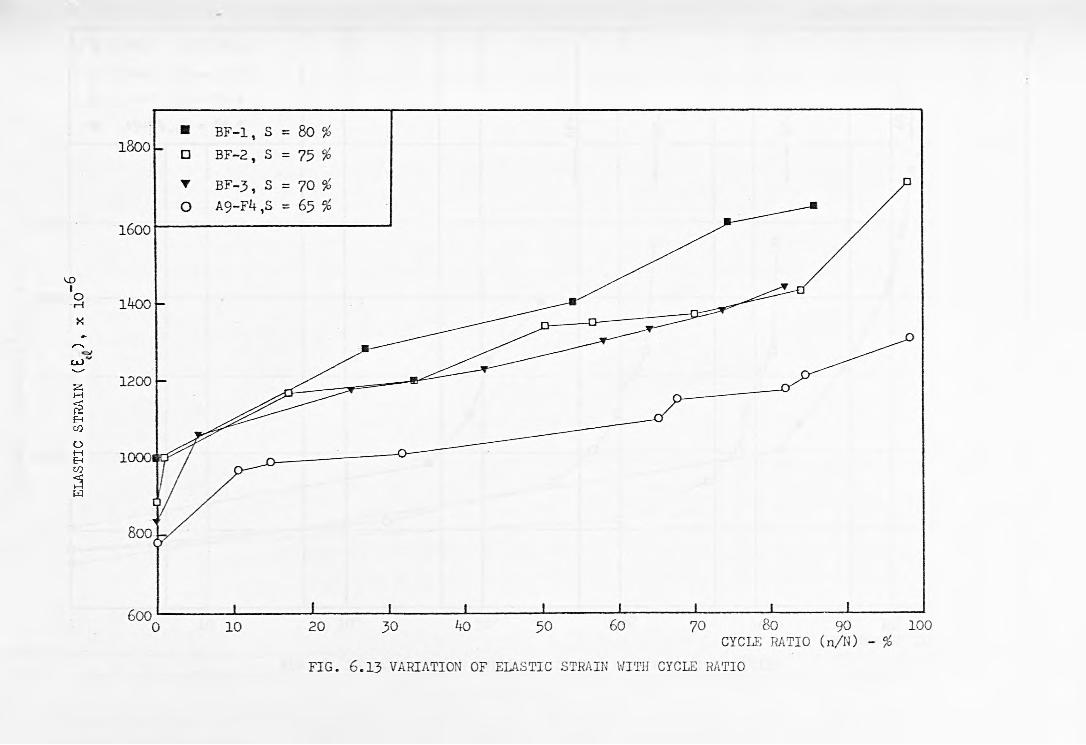
ELA
ST
IC
STR
AIN
(E
),
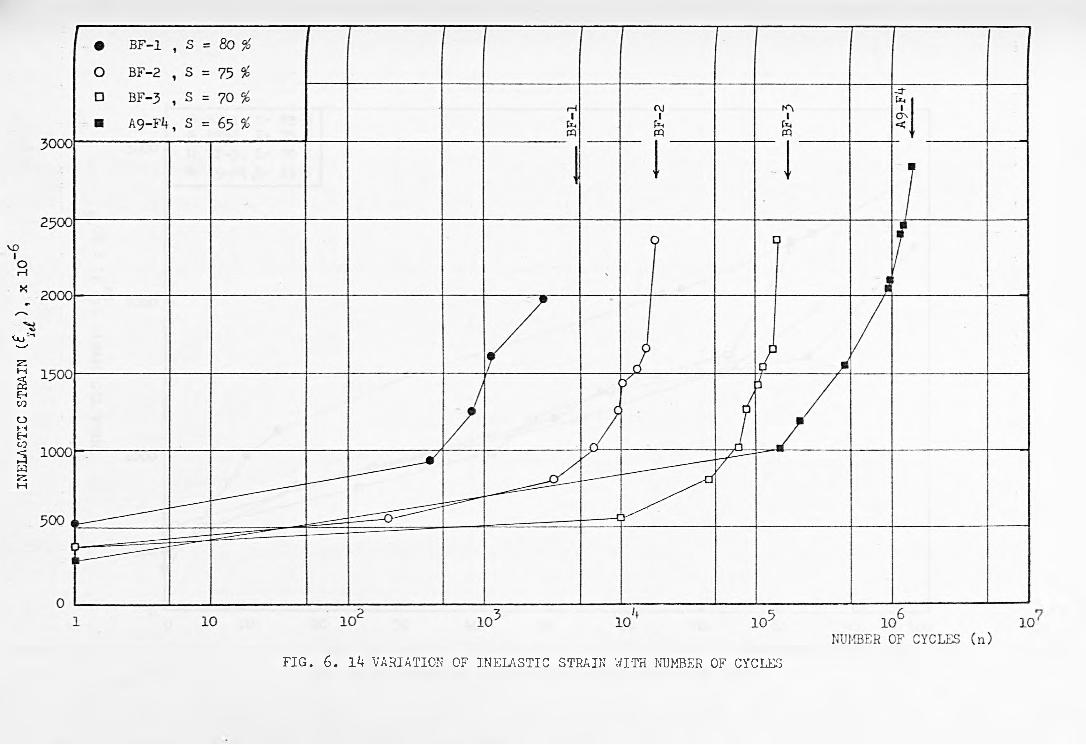
INE
LAS
TIC
ST
RA
IN
(f
FIG. 6. I k VARIATION OF INELASTIC STRAIN WITH NUMBER OF CYCLES
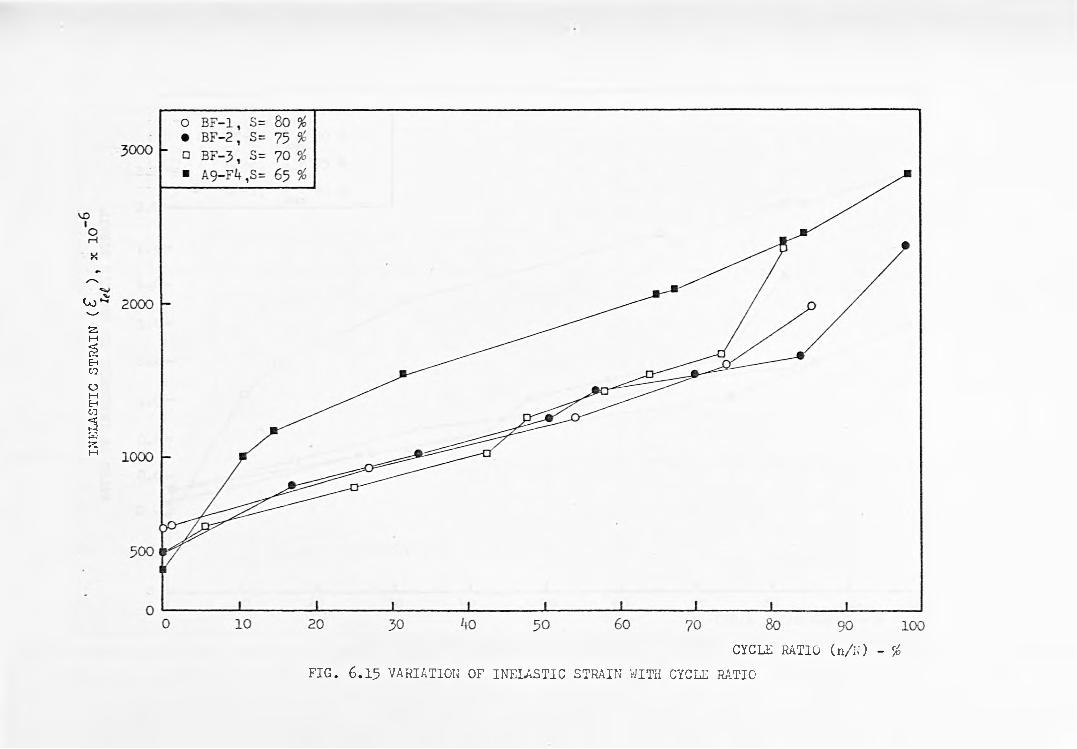
INE
LAS
TIC
ST
RA
IN
(£
CYCLE RATIO (n /N ) - %
F IG . 6 .1 5 VARIATION OF IN ELASTIC STRAIN WITH CYCLE RATIO

RA
TIO
O
F IN
ELA
ST
IC
TO
ELA
ST
IC
STR
AIN
F IG . 6 .1 6 VARIATION OF RATIO OF INELASTIC TO ELASTIC STRAIN WITH CYCLE RATIO
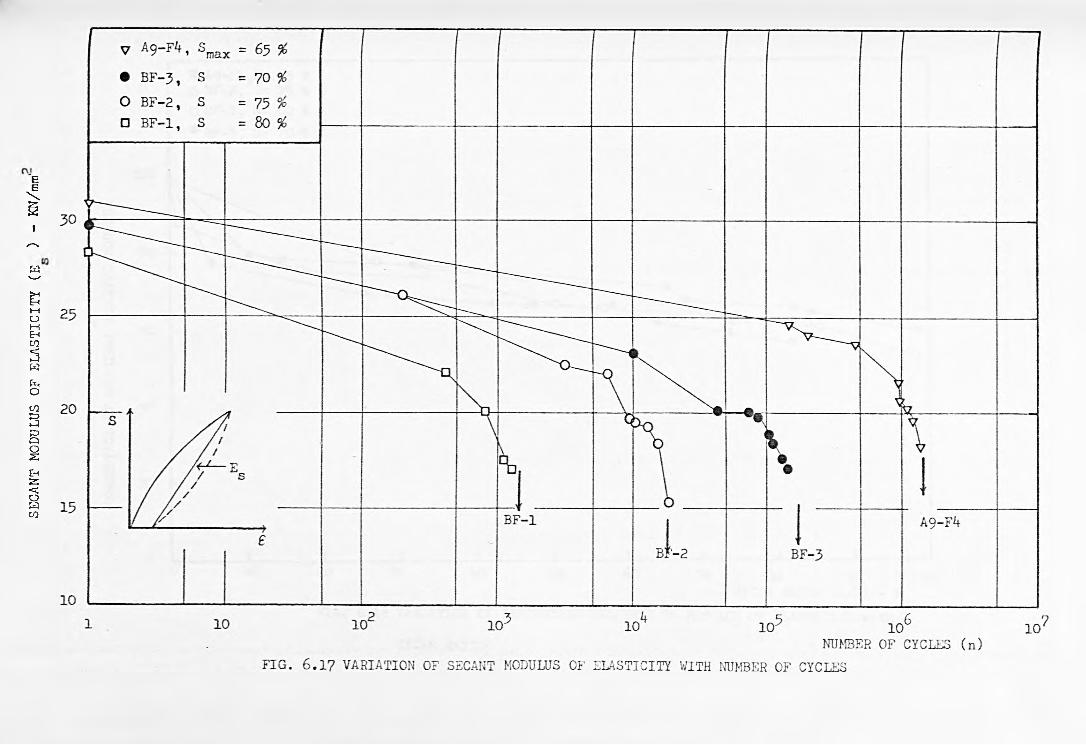
SECA
NT
MO
DULU
S O
F E
LAS
TIC
ITY
(E
)
- KN
/mm
'
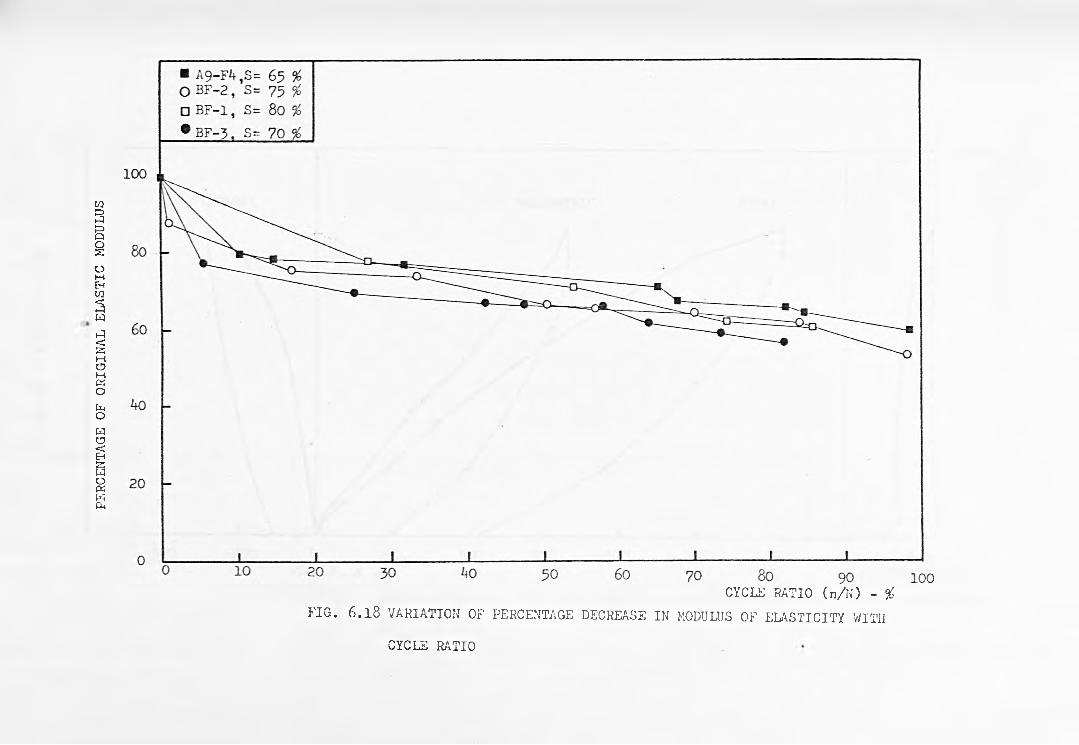
PERC
ENTA
GE
OF
OR
IGIN
AL
ELA
ST
IC
MO
DULU
S
CYCLE RATIO (n /N ) - %
F IG . 6 . l8 VARIATION OF PERCENTAGE DECREASE IN MODULUS OF ELASTICITY WITH
CYCLE RATIO
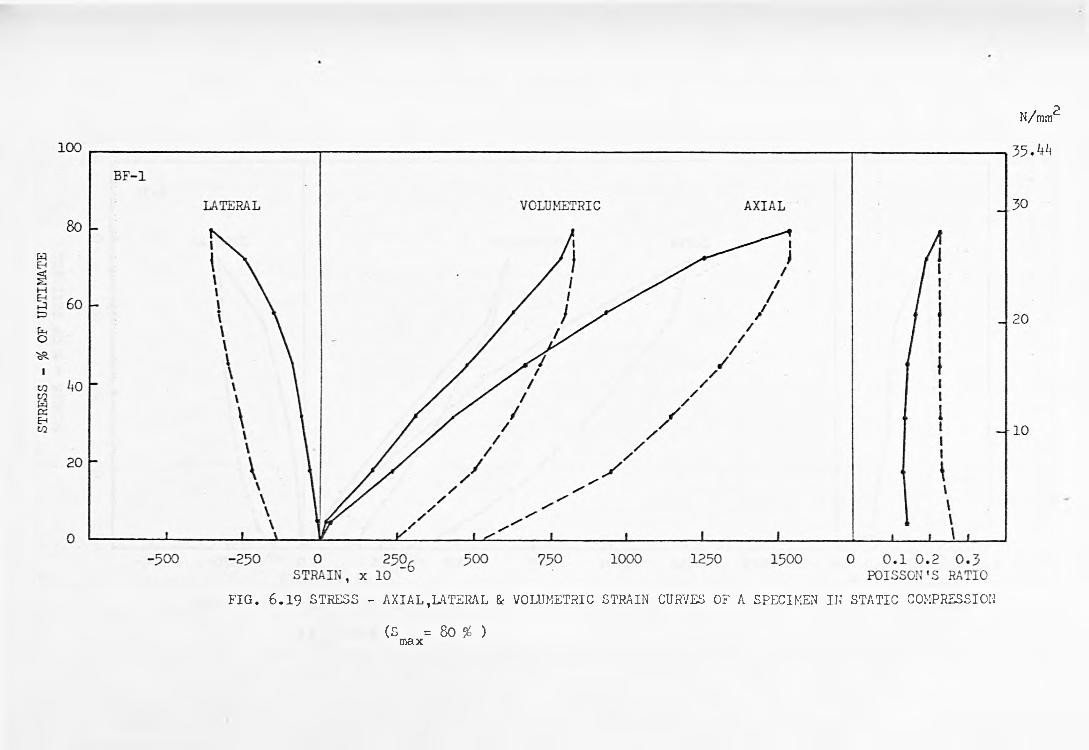
N/mm^
(s = 8o % )m ax
FIG. 6 .1 9 STRESS - AXIAL,LATERAL & VOLUMETRIC STRAIN CURVES OF A SPECIMEN IN STATIC COMPRESSION
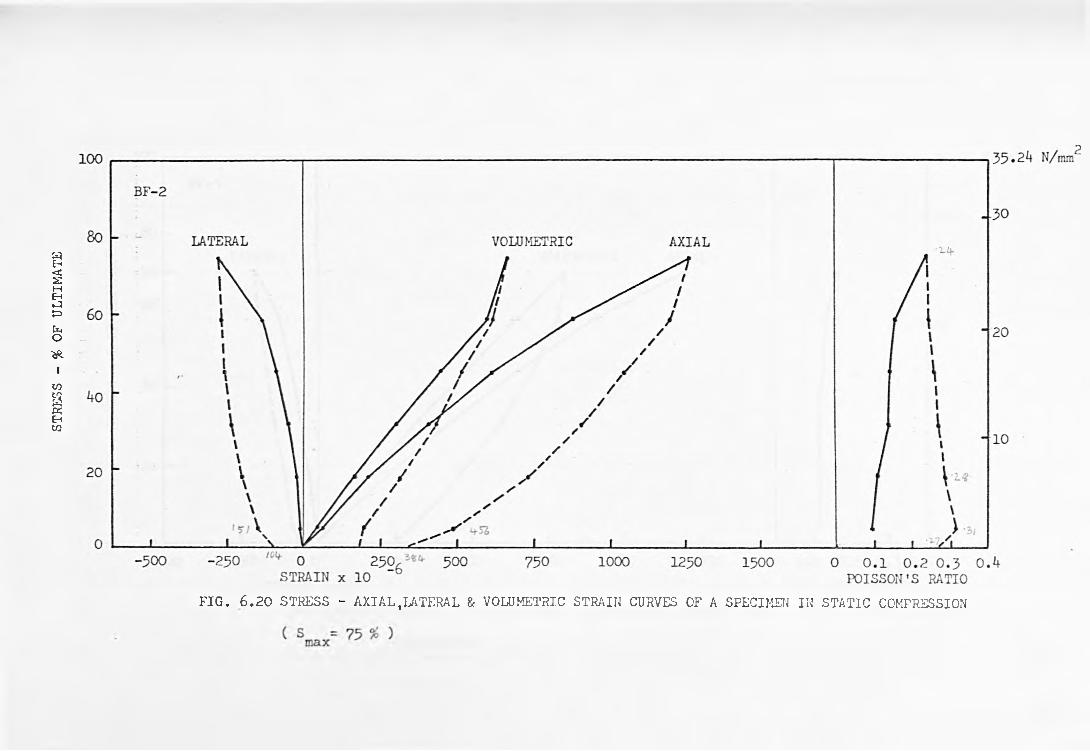
STR
ESS
- %
OF
ULT
IMA
TE
FIG. 6.20 STRESS - AXIAL,LATERAL & VOLUMETRIC STRAIN CURVES OF A SPECIMEN IN STATIC COMPRESSION
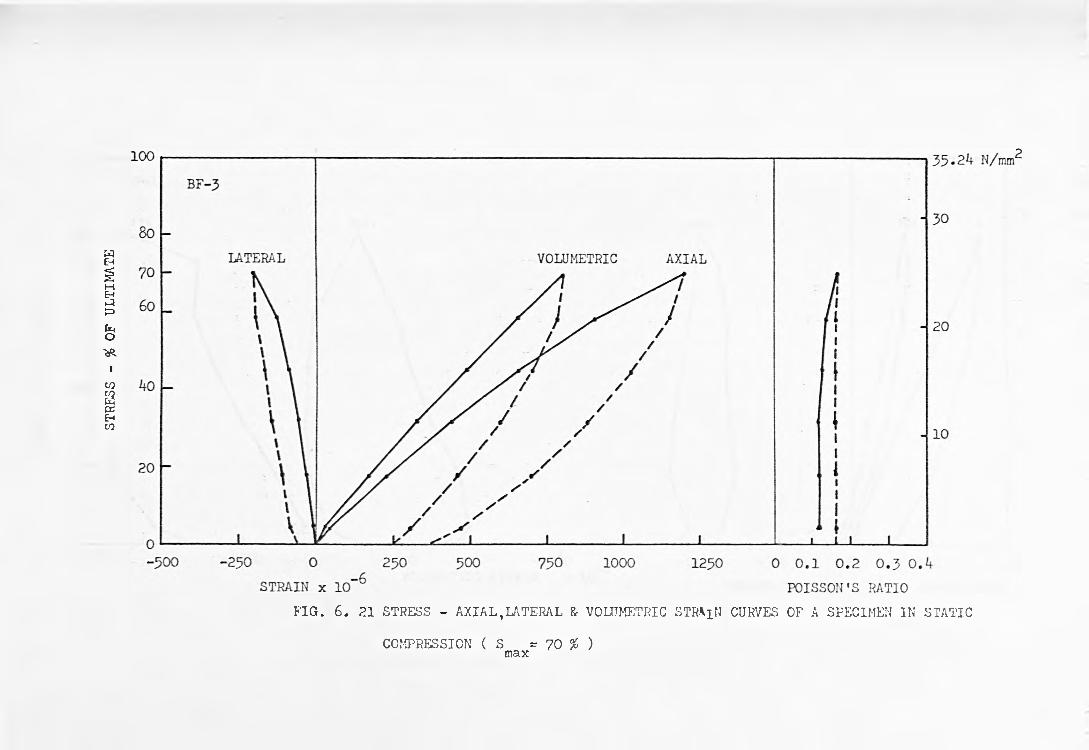
STR
ESS
- %
O
F U
LTIM
ATE
COMPRESSION ( S = 70 % ) m ax
FIG. 6. 21 STRESS - AXIAL,LATERAL & VOLUMETRIC STRAiN CURVES OF A SPECIMEN IN STATIC

N/im m ^
FIG. 6.22 STRESS - VOLUMETRIC STRAIN CURVES OF A SPECIMEN IN CYCLIC COMPRESSION (S = 80 %)max
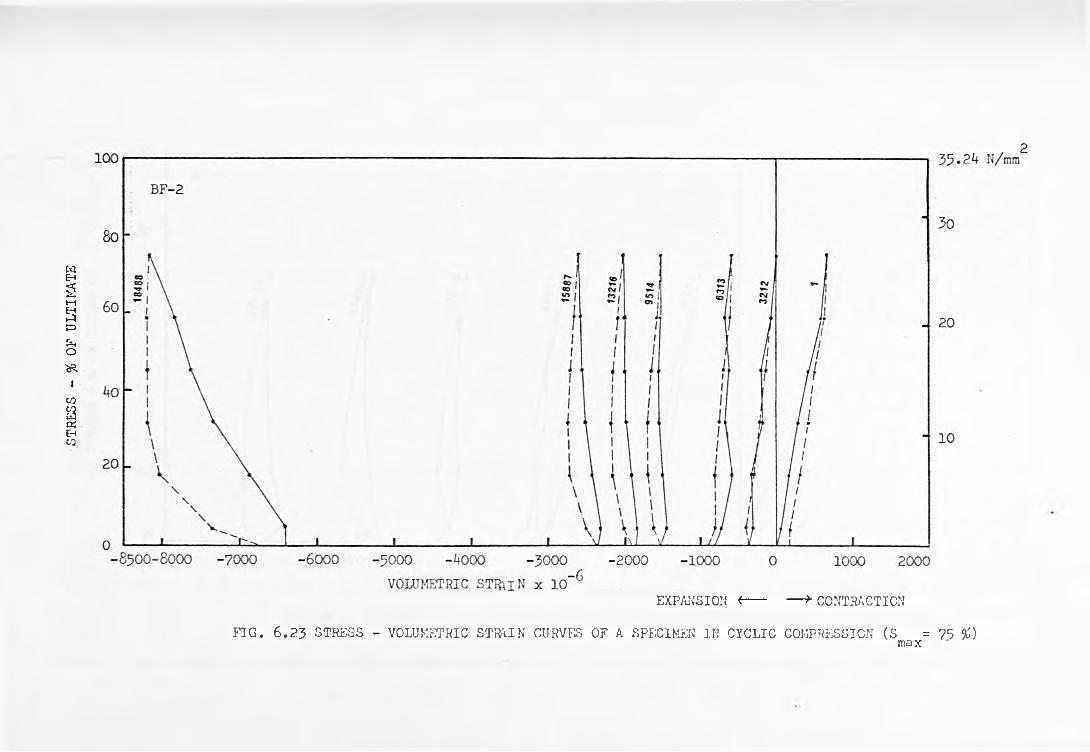
TRES
S -
% O
F U
LTIM
ATE
EXPANSION i----- — > CONTRACTION
FIG. 6.23 STRESS - VOLUMETRIC STRAIN CURVES OF A SPECIMEN IN CYCLIC COMPRESSION (S = 75 %)max
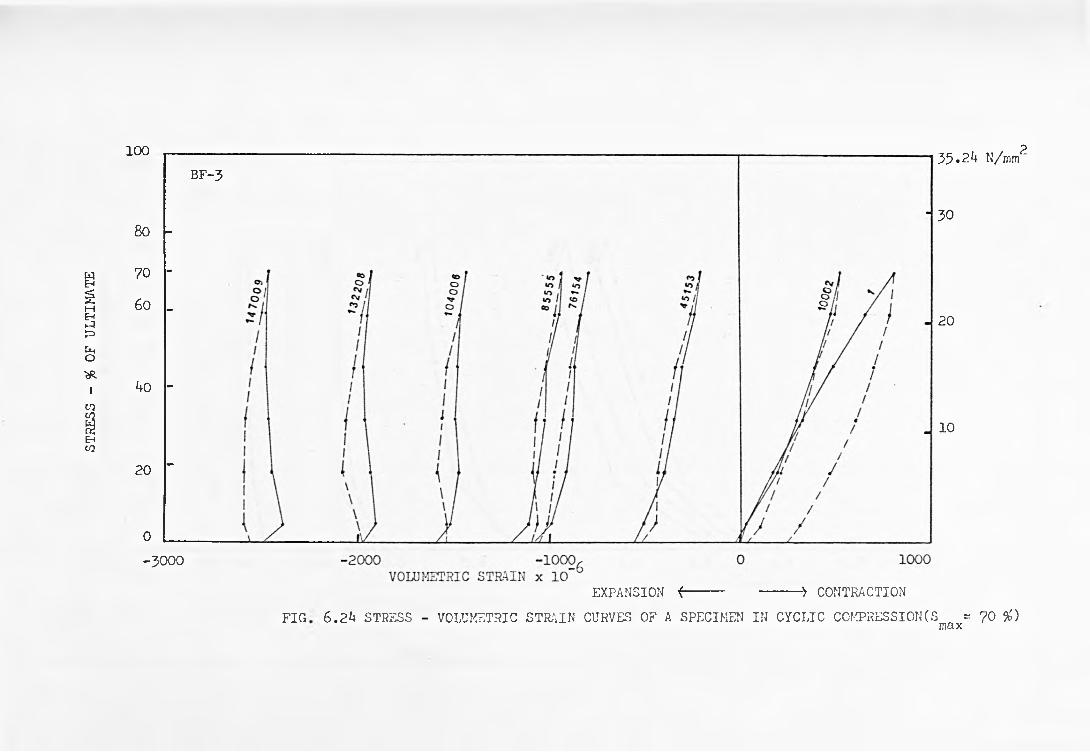
STR
ESS
- %
O
F U
LTIM
ATE
100
80 -
70 -
6 0 _
ko -
20 ”
0 __- 3 0 0 0
B F -3
F IG
35 . 2^ N/mm2
30
20
10
EXPANSION i --------- --------- * CONTRACTION
6.2A STRESS - VOLUMETRIC STRAIN CURVES OF A SPECIMEN IN CYCLIC COMPRESSIONS = 70 %)max

STR
ESS
- %
OF
ULT
IMA
TE
100
8o
60 '
bo
20
00 0.1 0 .2 l . b 1.6 1.8
POISSON'S RATIO
F IG . 6 . 25 STRESS - POISSON'S RATIO CURVES OF A SPECIMEN IN CYCLIC COMPRESSION
(s = 8o %)m ax
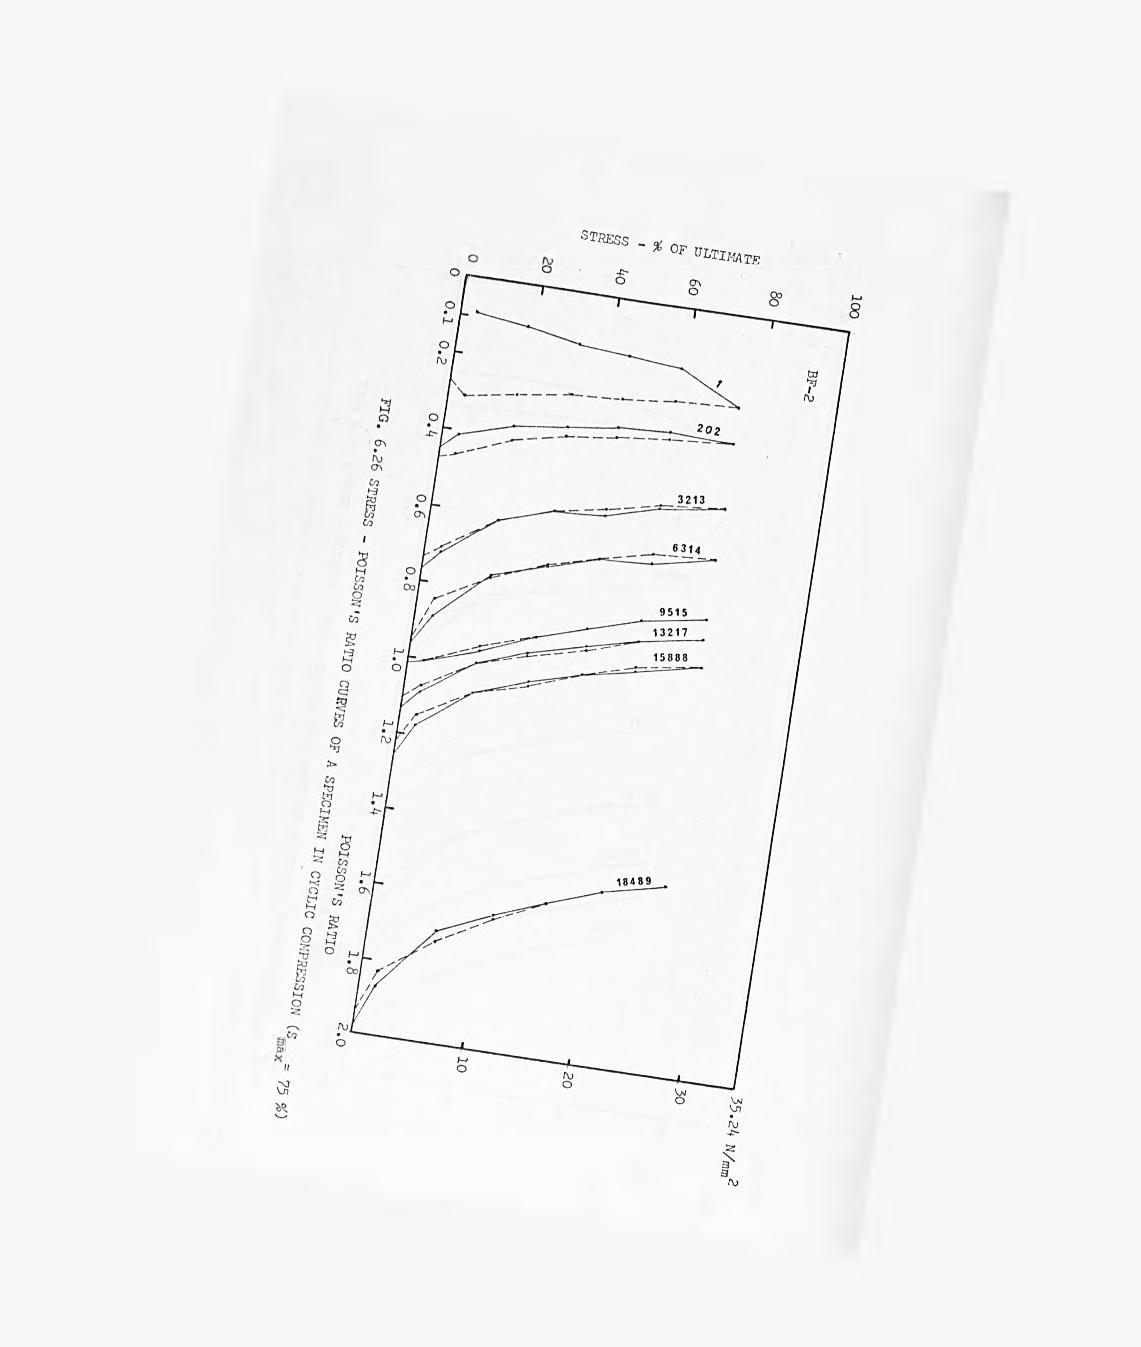
STRESS - * nt.* 0F ultimate

STR
ESS
- %
OF
ULT
IMA
TE
3 5 .2 ^ N /W
F IG . 6 .2 7 STRESS - POISSON'S RATIO CURVES OF A SPECIMEN IN CYCLIC COMPRESSION( S = 70 % )m ax

FIG. 7.1 VARIATION OF STRESS - PERCENTAGE DECREASE OF THE ORIGINAL PULSE VELOCITY CURVES WITH
NUMBER OF CYCLES
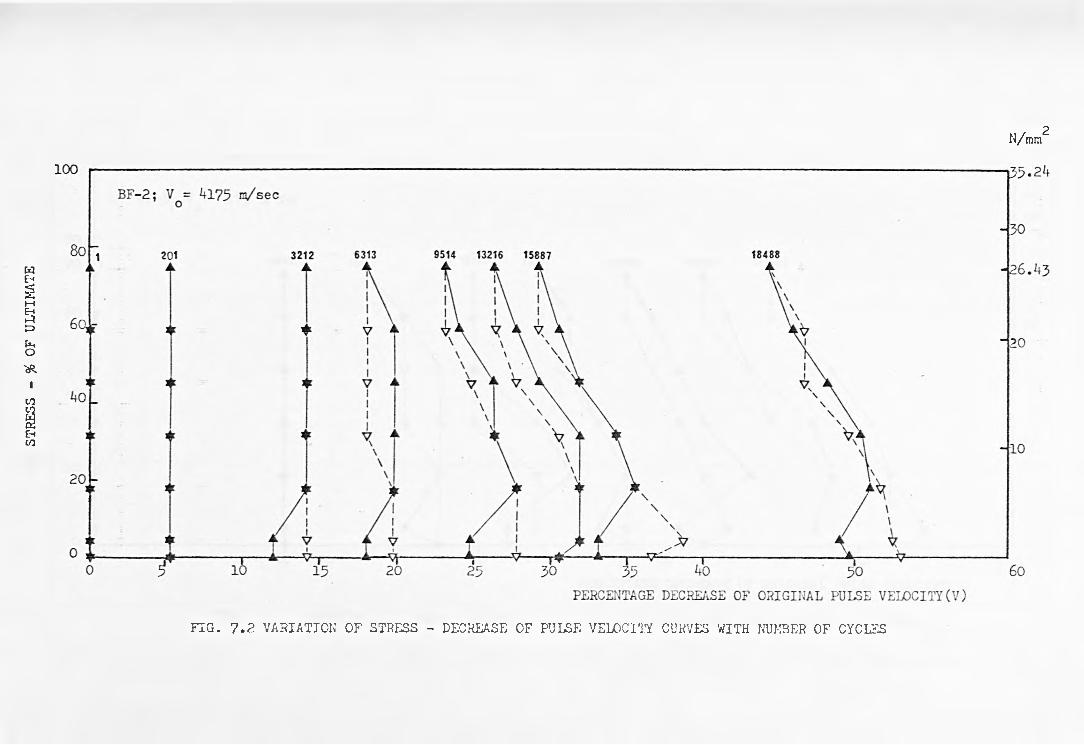
STR
ESS
- %
OF
ULT
IMA
TE
N/im ra^
FIG. 7.2 VARIATION OF STRESS - DECREASE OF PULSE VELOCITY CURVES WITH NUMBER OF CYCLES
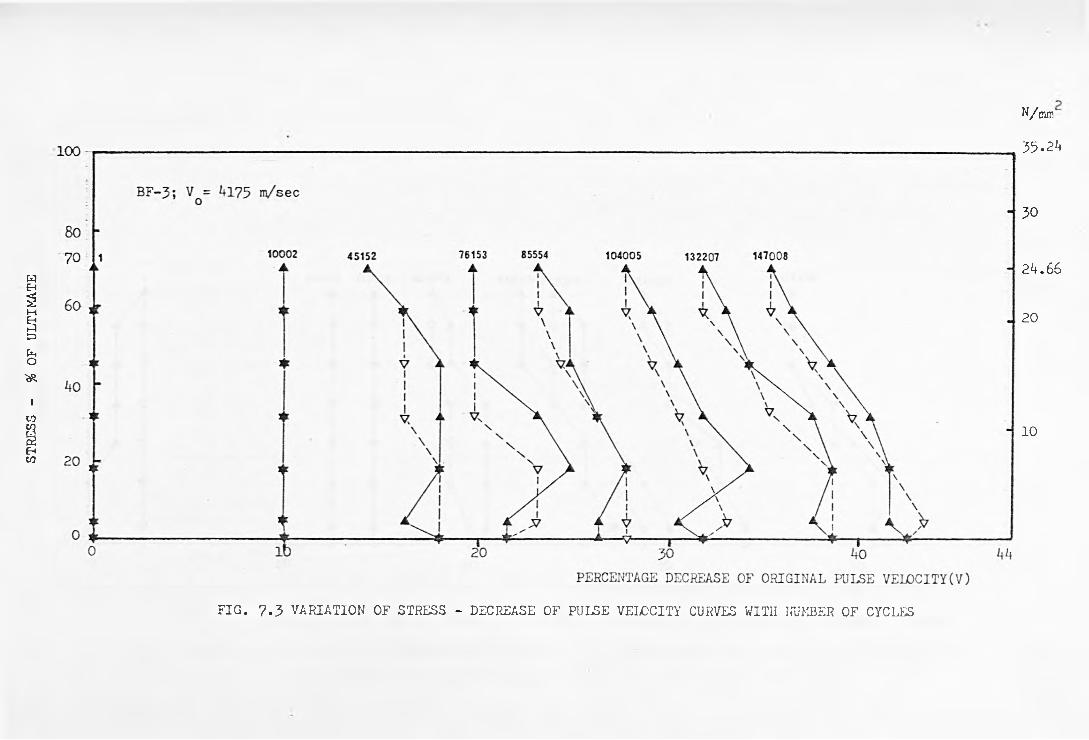
STR
ESS
- %
O
F U
LTIM
ATE
N/min
35*2*4
30
2*4.66
20
10
FIG. 7.3 VARIATION OF STRESS - DECREASE OF PULSE VELOCITY CURVES WITH NUMBER OF CYCLES
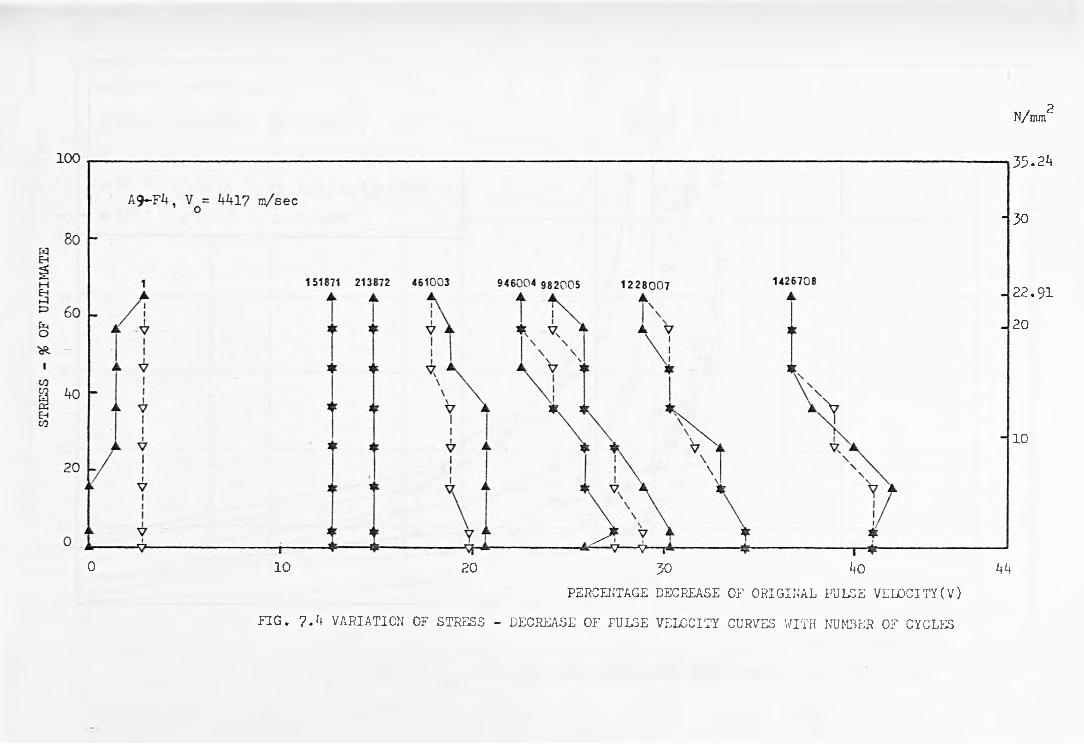
N/ram2
0 10 20 JO ¿40 *4*4
PERCENTAGE DECREASE OF ORIGINAL PULSE VELO CITY(V)
35*2*4
30
2 2 .9 1
20
10
FIG. 7.*+ VARIATION OF STRESS - DECREASE OF PULSE VELOCITY CURVES WITH NUMBER OF CYCLES

FIG
. 7
.5
VA
RIA
TIO
N
OF
V
W
ITH
n
O
F
SP
EC
IME
NS
T
ES
TE
D
UN
DE
R
CO
NST
AN
T
AM
PL
ITU
DE
S
TR
ES
Sm
ax
MAXIMUM D ECREASE OF O R IG IN A L P U L SE V E L O C IT Y (V ) - PERCENT1T13.X
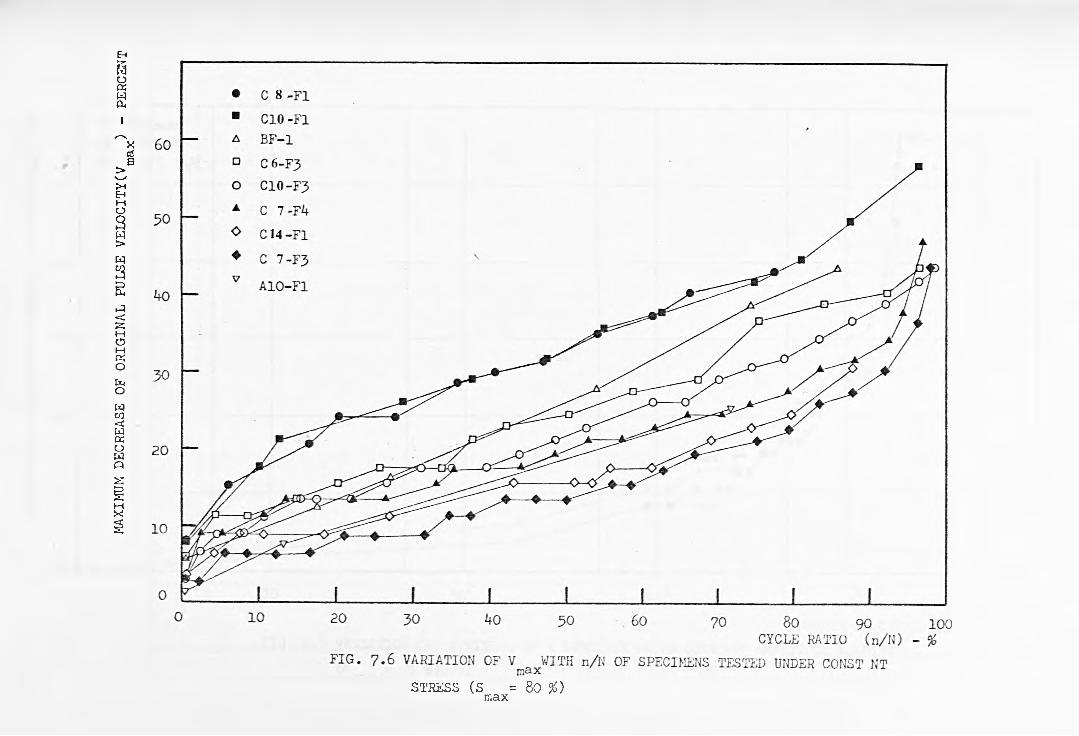
MA
XIM
UM
D
EC
RE
AS
E
OF
O
RIG
INA
L
PU
LS
E
VE
LO
CIT
Y(V
)
-
PE
RC
EN
Tm
ax
STRESS (S = 8 0 %)max
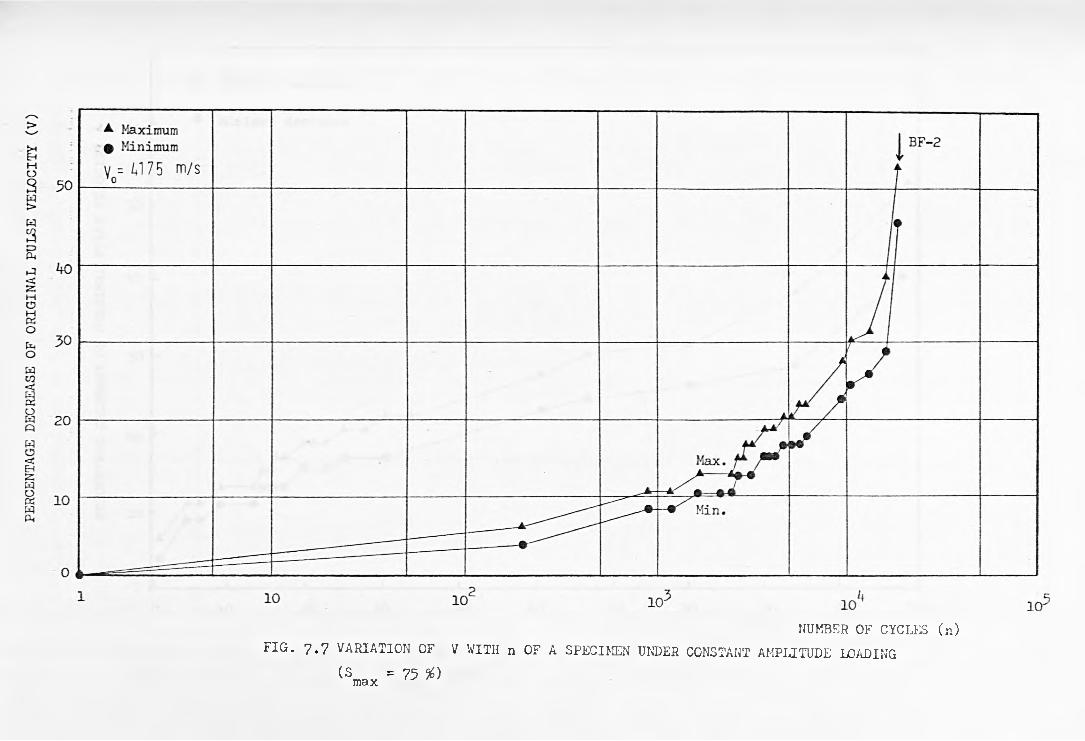
NUMBER OF CYCLES (n )
F IG . 7 . 7 V A R IA T IO N OF V WITH n OF A SPECIM EN UNDER CONSTANT AM PLITUDE LOADING
(S = 75 %)m ax
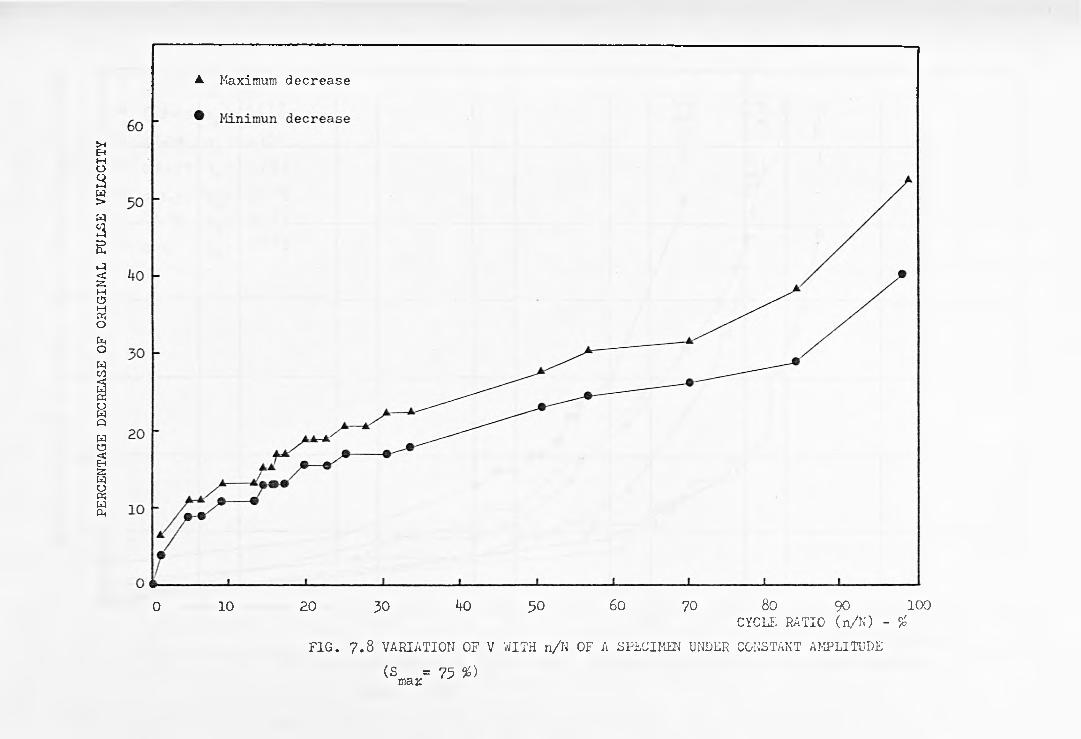
PERC
ENTA
GE
DEC
REA
SE O
F O
RIG
INA
L PU
LSE
VEL
OC
ITY
A Maximum decrease
0 10 20 30 ko 50 60 70 80 90 100 CY CLE R A T IO ( n / N ) - %
F IG . 7 .8 V A R IA T IO N OF V WITH n /N OF A SPECIM EN UNDER CONSTANT AM PLITUDE
(S = 75 %)max
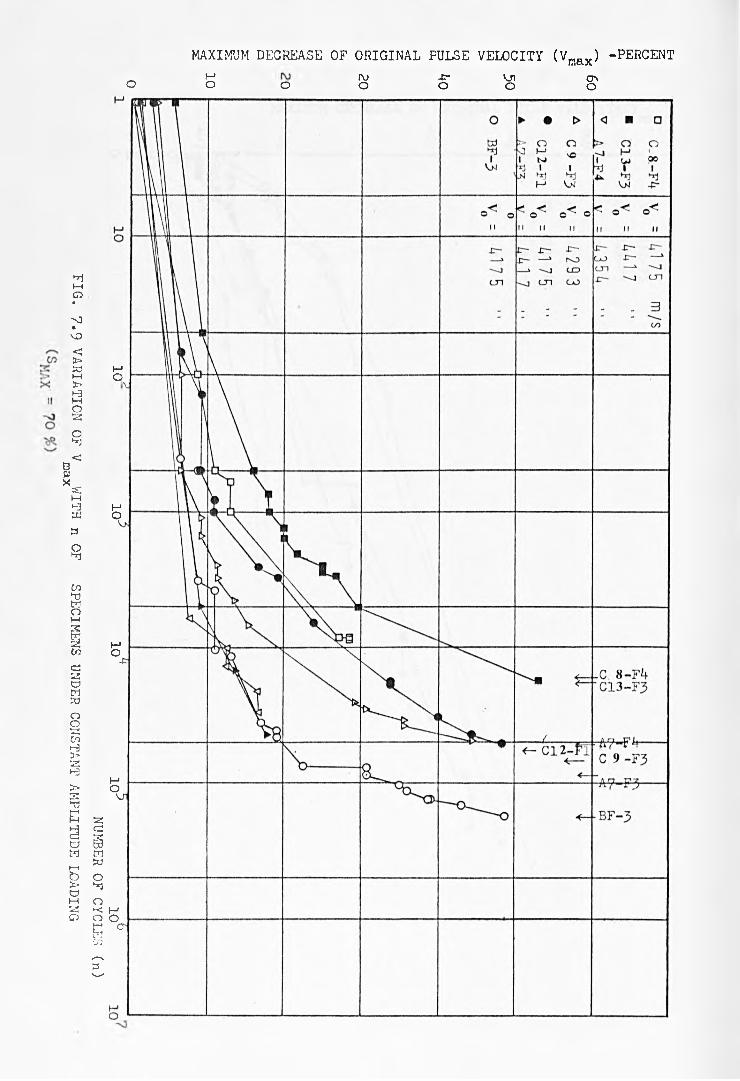
10 lCK
10" 10-'
10°N
UM
BE
R
OF
C
YC
LE
S
(n)
FIG
. 7
.9
VA
RIA
TIO
N
OF
V
W
ITH
n
O
F
SP
EC
IME
NS
U
ND
ER
C
ON
STA
NT
A
MP
LIT
UD
E
LO
AD
ING
max
MAXIMUM DECREASE OF ORIGINAL PULSE VELOCITY (Vmax) -PERCENTo
i-1o O ro
o-P*o
VPo
ONo
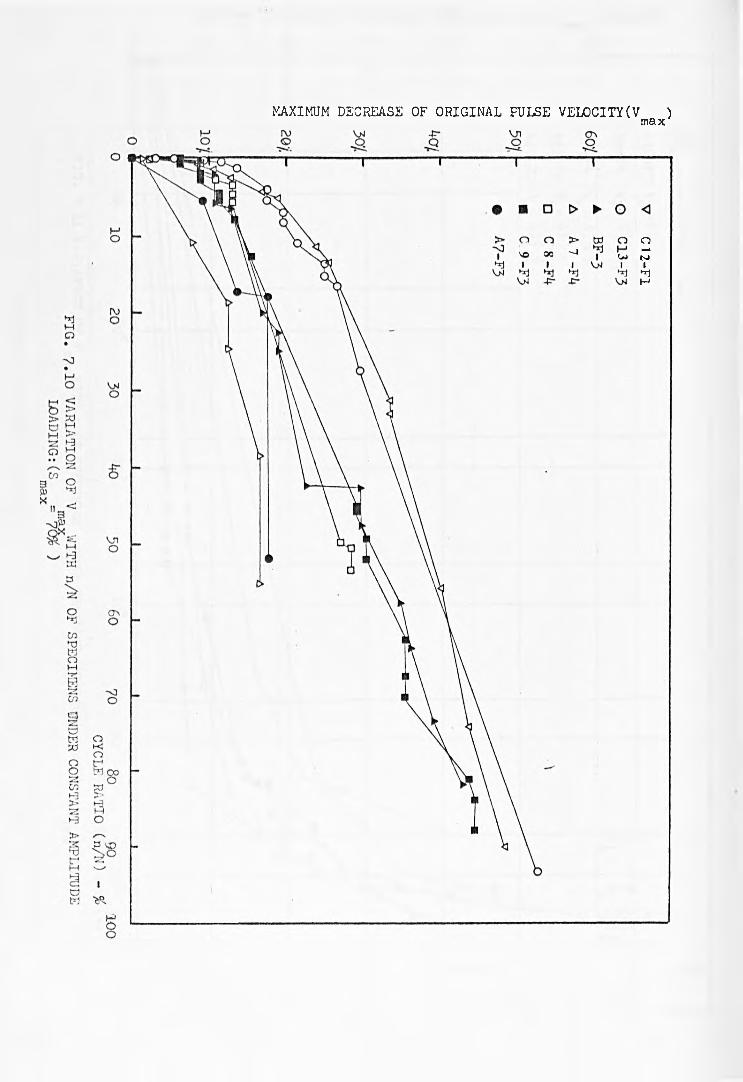
MAXIMUM DECREASE OF ORIGINAL PULSE VELOCITY(V )maxC
12-F
1

MAX
IMUM
DEC
REA
SE O
F O
RIG
INA
L PU
LSE
VE
LOC
ITY
(V
)-
PERC
ENT
max
FIG. 7.11 VARIATION OF V WITH n OF SPECIMENS UNDER CONSTANT AMPLITUDE LOADING (S = 65 %)max max ^

MAX
IMU
M
DE
CR
EA
SE
OF
OR
IGIN
AL
P
UL
SE
VE
LO
CIT
Y(V
)-P
ER
CE
NT
mcix
<3 m ax = '6 5 %)
FIG. 7.12 VARIATION OF V WITH n/N OF SPECIMENS UNDER CONSTANT AMPLITUDE LOADINGmax
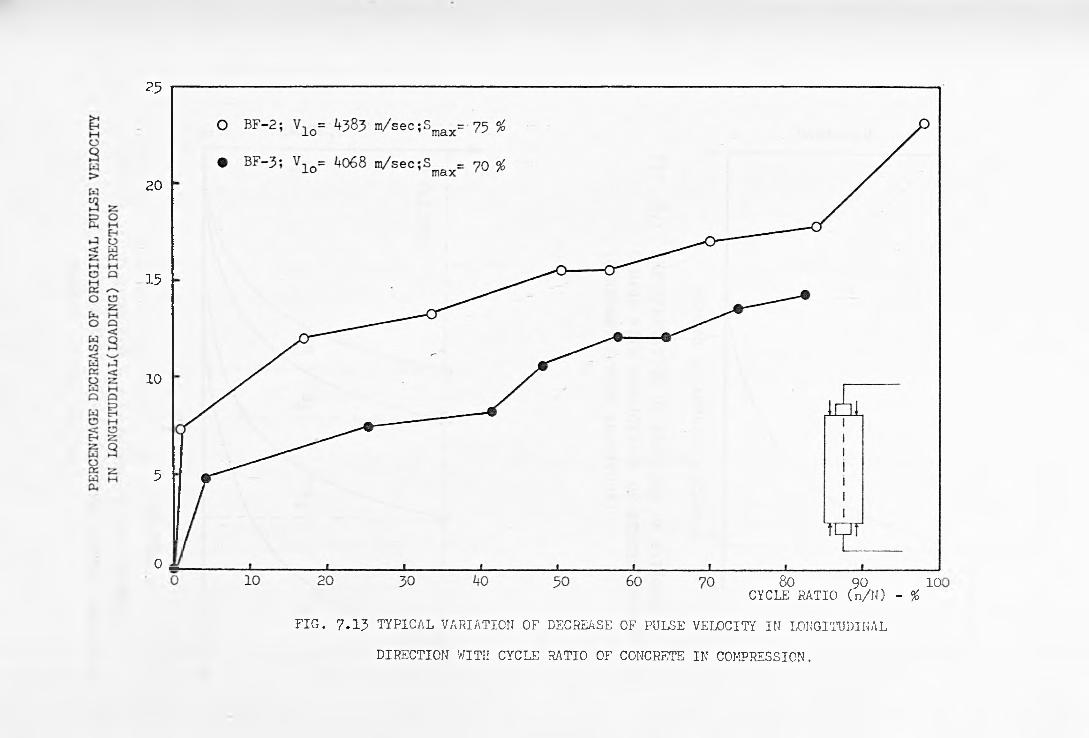
25
20
15
10
5
08o 90 10
CYCLE RATIO (n/N ) - %
FIG. 7 .1 5 TYPICAL VARIATION OF DECREASE OF PULSE VELOCITY IN LONGITUDINAL
DIRECTION WITH CYCLE RATIO OF CONCRETE IN COMPRESSION.
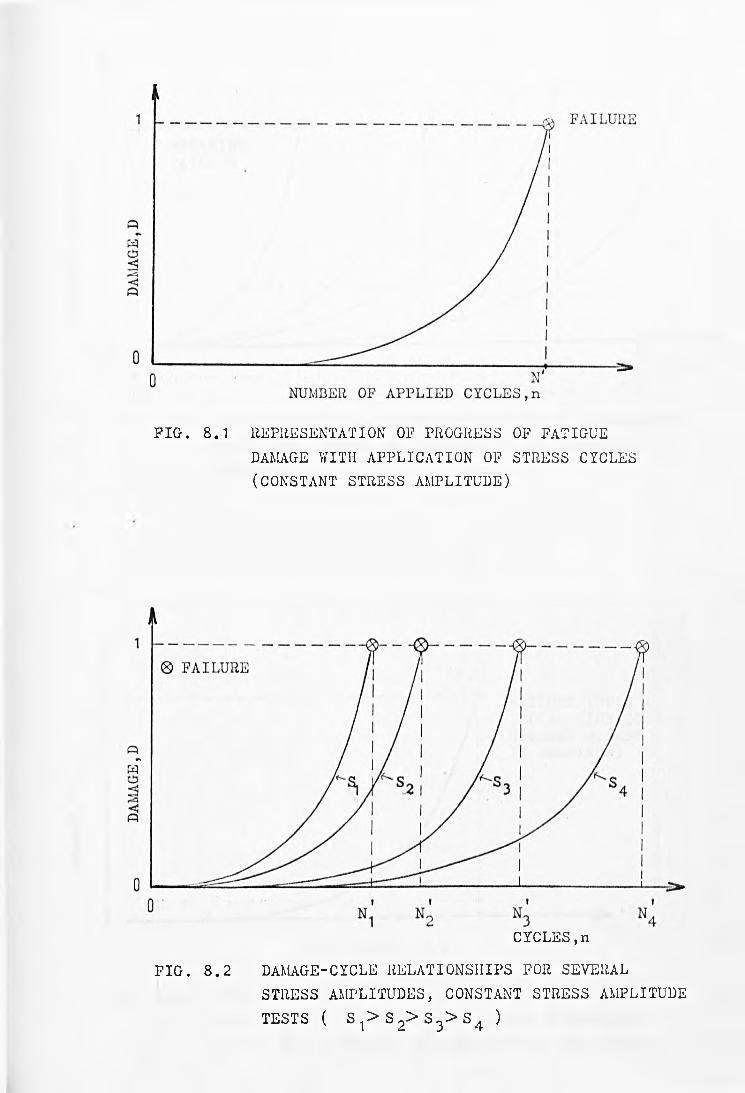
FIG. 8.1 REPRESENTATION OF PROGRESS OF FATIGUEDAMAGE WITH APPLICATION OF STRESS CYCLES (CONSTANT STRESS AMPLITUDE)
CYCLES,n
FIG. 8.2 DAMAGE-CYCLE RELATIONSHIPS FOR SEVERALSTRESS AMPLITUDES, CONSTANT STRESS AMPLITUDE TESTS ( S 1> S 2> S 3> S 4 )

DAMA
GE,D
RE
LATI
VE D
AMAG
E,D
FIG. 8.3 DAMAGE-CYCLE RELATIONSHIPS FROM F I G .8. 2 NORMALIZED TO FAILURE DAMAGE AT HIGHEST STRESS AMPLITUDE IN SPECTRUM, S.I •
FIG. 8.4 TYPICAL STRESS INDEPENDENT DAMAGE-CYCLE RATIO RELATIONSHIP (FIG. 8.3 WITH CYCLES NORMALIZED; CURVES ARE IDENTICAL FOR ALL STRESS AMPLITUDES)
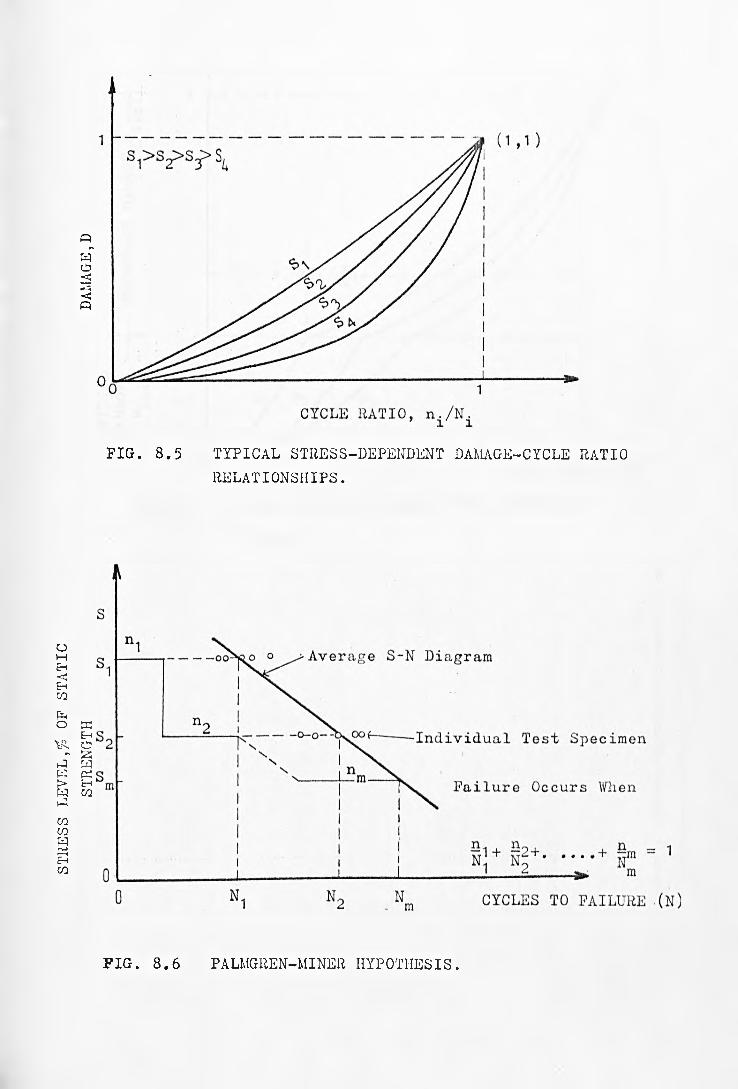
STRE
SS L
EVEL
,fi OF
STA
TIC
STRE
NGTH
DA
MAGE
,D
FIG. 8.5 TYPICAL STRESS-DEPENDENT DAMAGE-CYCLE RATIO RELATIONSHIPS.
FIG. 8.6 PALMGREN-MINER HYPOTHESIS.
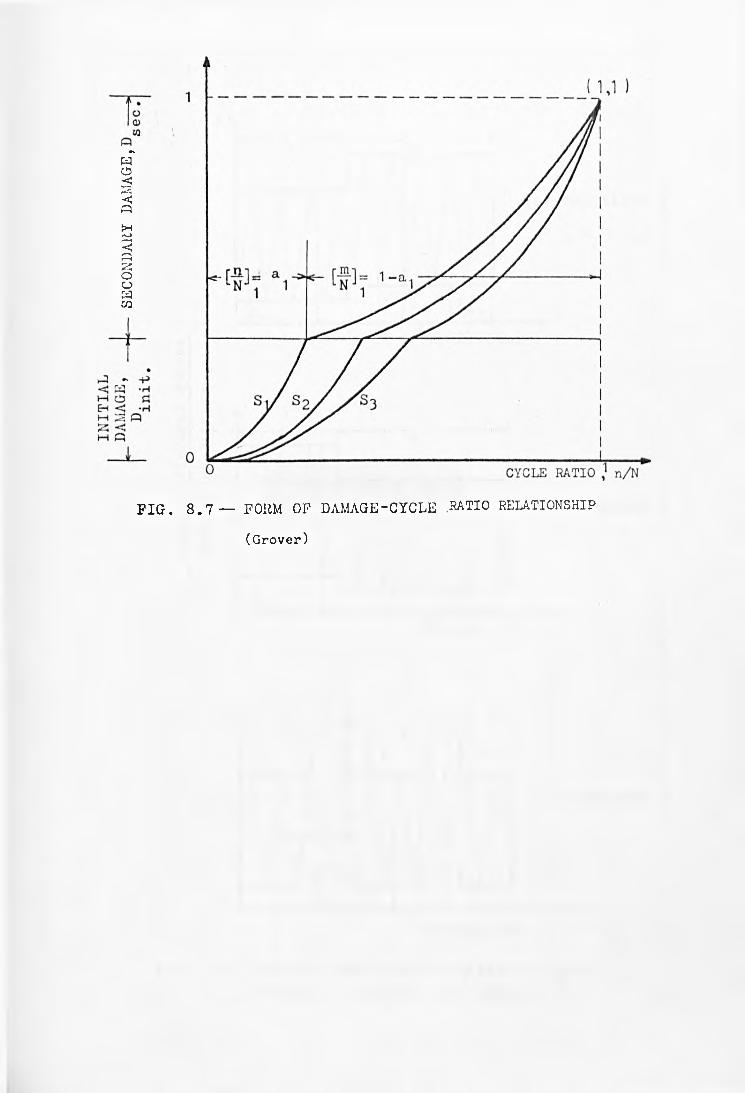
SECO
NDAR
Y DA
MAGE
,
FIG. 8 . 7 — FORM OF DAMAGE-CYCLE .R A TIO R E L A T IO N SH IP
( G r o v e r )
Fig. 9*1 is on page 83

Nomi
nal
Flex
ural
St
ress
FIG. 9.2 LOADING SEQUENCES FOR VARIABLE LOAD STUDIES ( HILSDORF AND KESLER ) 36.

STRE
SS L
EVEL
, 10
0 S/
S ST
RESS
LEV
EL,
100
S/S
FIG. 9.3 a DESCRIPTION OF VARIABLE AMPLITUDE LOADING[ PROGRAMME 1]
FIG.9.3 b DESCRIPTION OF VARIABLE AMPLITUDE LOADING
[ PROGRAMME 2 ]
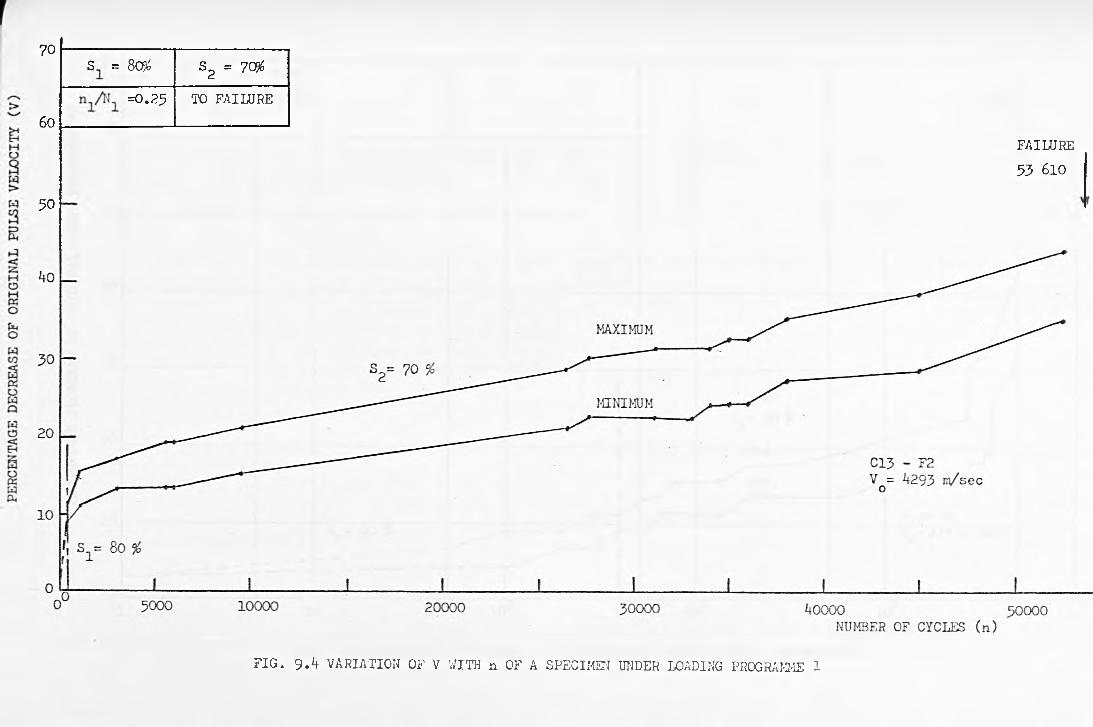
70
6050
s = 8c#
=0*25
S2 = 7<#
TO F A IL U R E
F A IL U R E 53 610
FIG. 9.if VARIATION OF V WITH n OF A SPECIMEN UNDER LOADING PROGRAMME 1
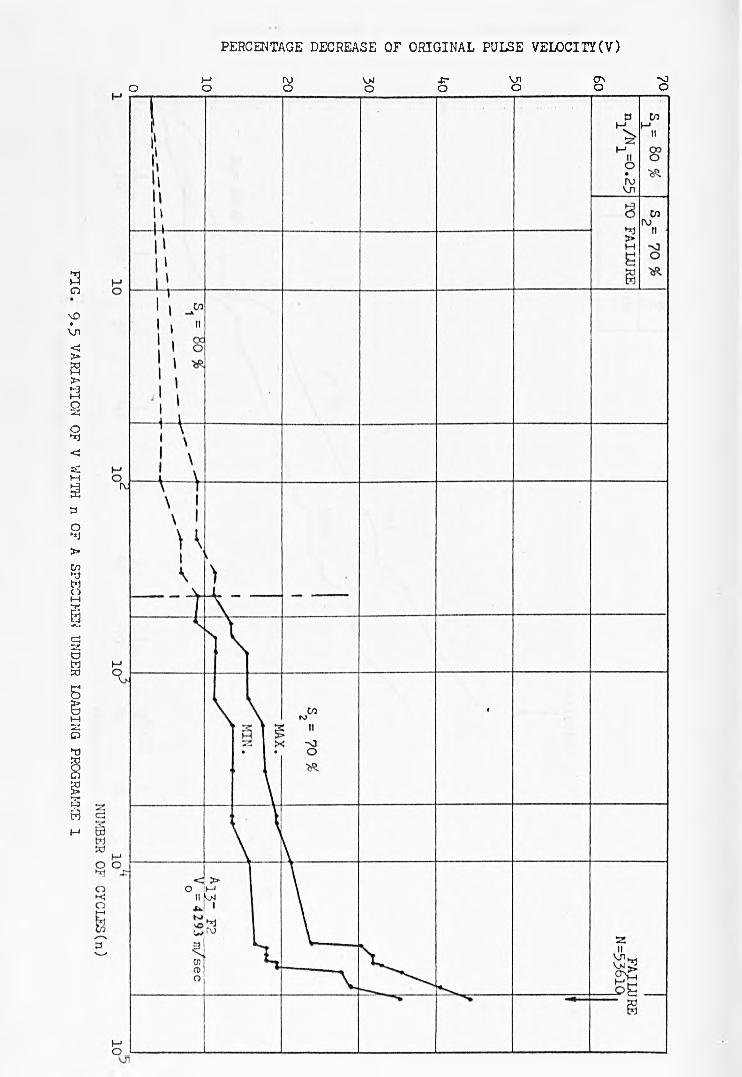
9.5
V
AR
IAT
ION
O
F
V
WIT
H
n
OF
A
S
PE
CIM
EN
U
ND
ER
L
OA
DIN
G
PRO
GR
AM
ME
1
PERCENTAGE DECREASE OF ORIGINAL PULSE VELOCITY(V)
3a
l-< r\J VH -fr Vjlo o o o o o
CTi 'Oo o
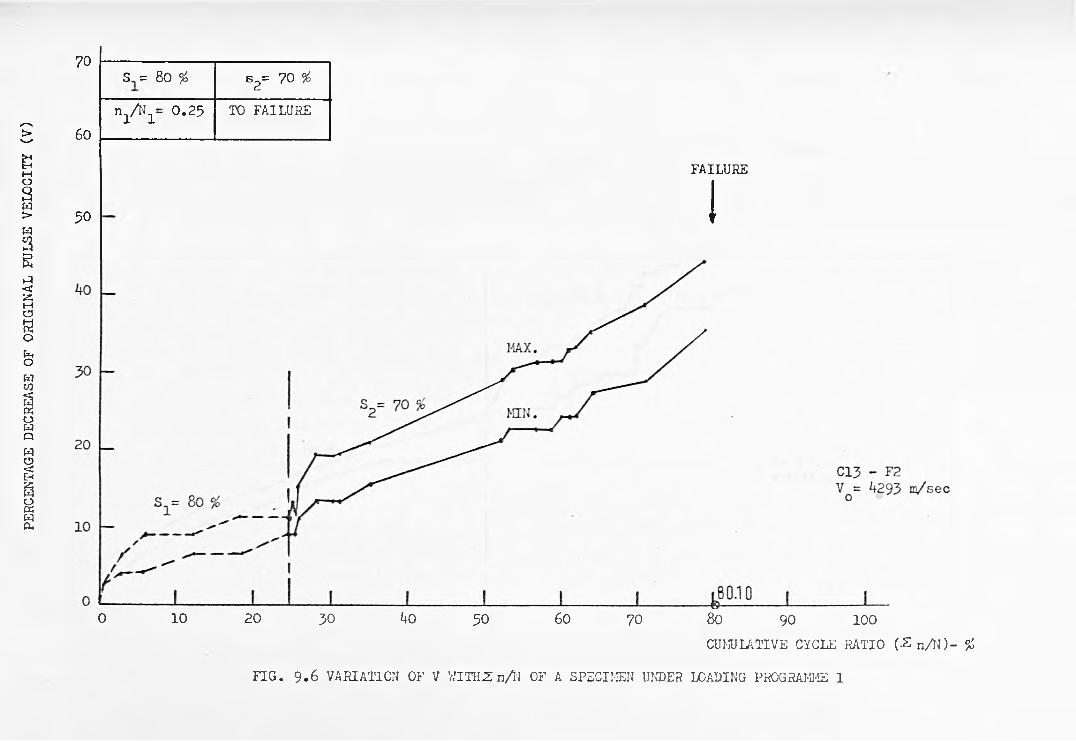
PE
RC
EN
TA
GE
D
EC
RE
AS
E
OF
O
RIG
INA
L
PU
LS
E
VE
IßC
ITY
(V
)
70
60
50
s = 8o % s 2 = 70 %
n i / N r 0 , 2 5TO F A IL U R E
F A IL U R E
I
0 10 20 30 ko 50 60 70 80 90 100CUM ULATIVE C Y C L E R A T IO (-2 n / N ) - %
FIG. 9.6 VARIATION OF V V.'ITKZ n/U OF A SPECIMEN UNDER LOADING PROGRAMME 1

PE
RC
EN
TA
GE
D
EC
RE
AS
E
OF
O
RIG
INA
L
PU
LS
E
VE
LO
CIT
Y(V
)
7 0
6 0
8 0 % s 2 = 7 0 %
“ l ^ l ^ O ^ O TO F A IL U R E
FAILURE
0 1 0 2 0 3 0 ko 5 0 6 0 7 0 80 9 0 1 0 0
CUMULATIVE CYCLE RATIO (£ n /N )- %
FIG. 9.7 VARIATION OF V WITH2 n/li OF A SPECIMEN UNDER LOADING PROGRAMME 1

PE
RC
EN
TA
GE
D
EC
RE
AS
E
OF
O
RIG
INA
L
PU
LS
E
VE
LO
CIT
Y
(V)
70
60
S = 80 % S 2 = 70 %
n 1 / N 1 = 0.75 TO F A IL U R E
50 -
*+0
30
20
10
0
FA IL U R E
MAX.
S = 80 %
/ / /
S2= 70 %
C IO - F 2V = 4293 m /s o
0 10 20 30 ko 50 6oi 9 2 I
70 75 8o 90 looCUMULATIVE C Y C L E R ATIO ( Z n / N ) - %
FIG. 9.8 VARIATION OF V WITH I n/N OF A SPECIMEN UNDER LOADING PROGRAMME 1
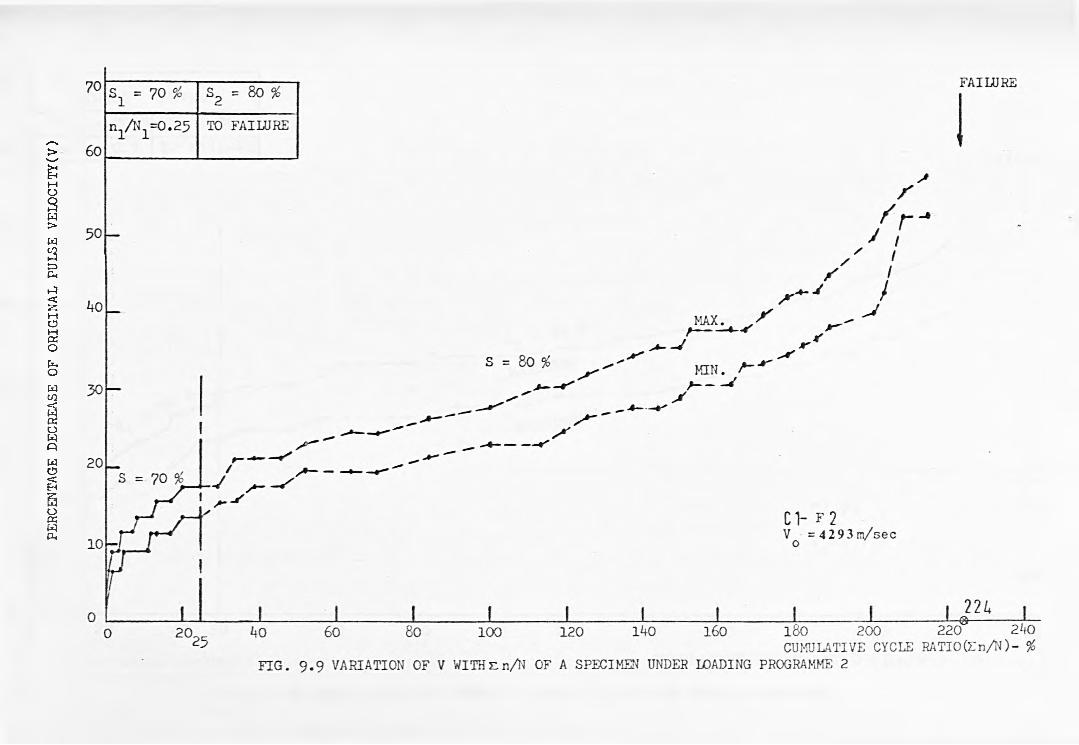
PERC
ENTA
GE
DEC
REA
SE
OF
OR
IGIN
AL
PULS
E V
ELO
CIT
Y(V
)
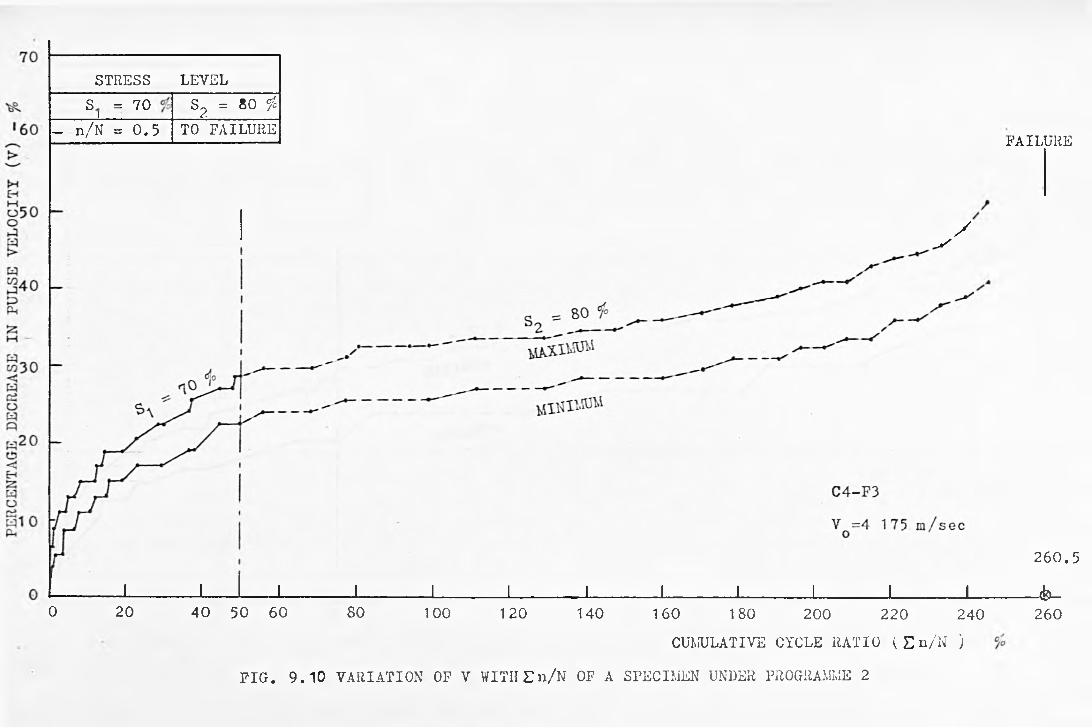
STRESS LEVELOD'IlCO~ S? = 80 fc
- n/N = 0.5 TO FAILURE
ys
__________ I__________ I__________ I__________ !__________ !__________ I_________ J __________ !__________ !__________ I__________ !__________ I__0 20 40 50 60 80 100 120 140 160 180 200 220 240
CUMULATIVE CYCLE RATIO ( £ n/N )
FAILURE
260.5
-è-260
FIG. 9.10 VARIATION OF V WITH E n/N OF A SPECIMEN UNDER PROGRAMME 2
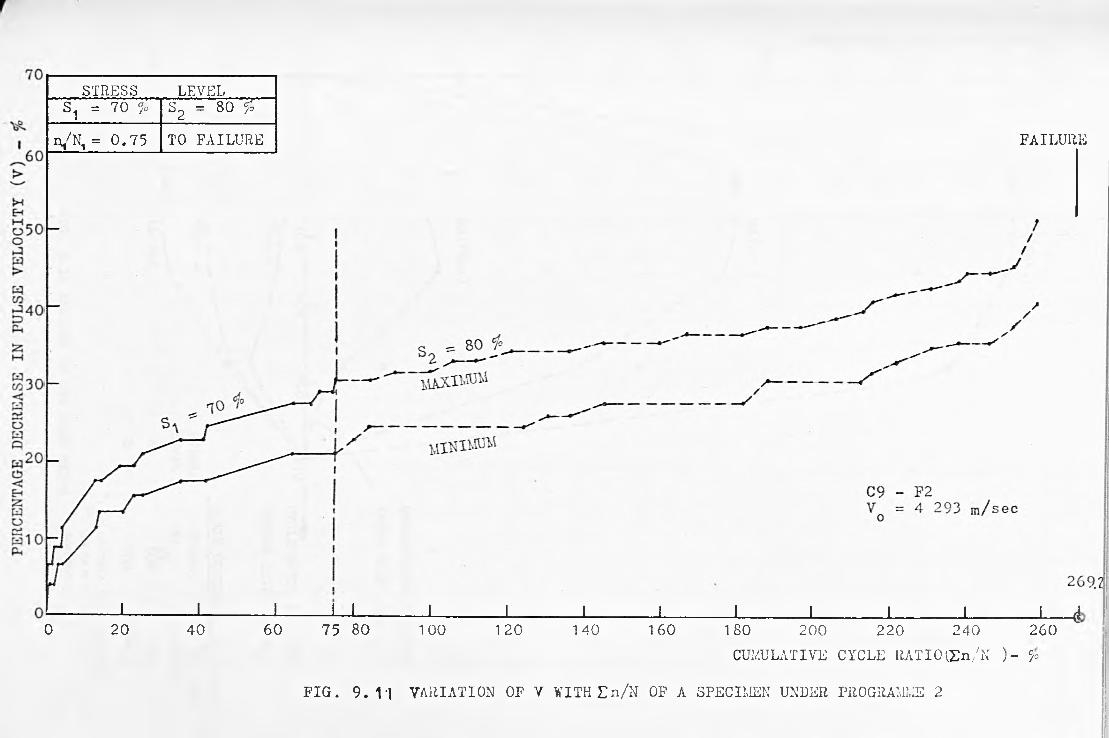
STRESS LEVELS1 = 7 0 % w ro ll C
O o *
V N, = 0.75 TO FAILURE FAILURE
----- 1----- 1----- 1----Li----- 1_____ i_____ !_____ I_____ !_____ I_____ I_____ I_____ 1__40 2 0 4 0 6 0 7 5 8 0 1 0 0 1 2 0 1 4 0 1 6 0 1 8 0 2 0 0 2 2 0 2 4 0 2 6 0
CUMULATIVE CYCLE RATIO (Sn/N )- cp
FIG. 9. 11 VARIATION OF V WITH £n/N OF A SPECIMEN UNDER PROGRAMME 2
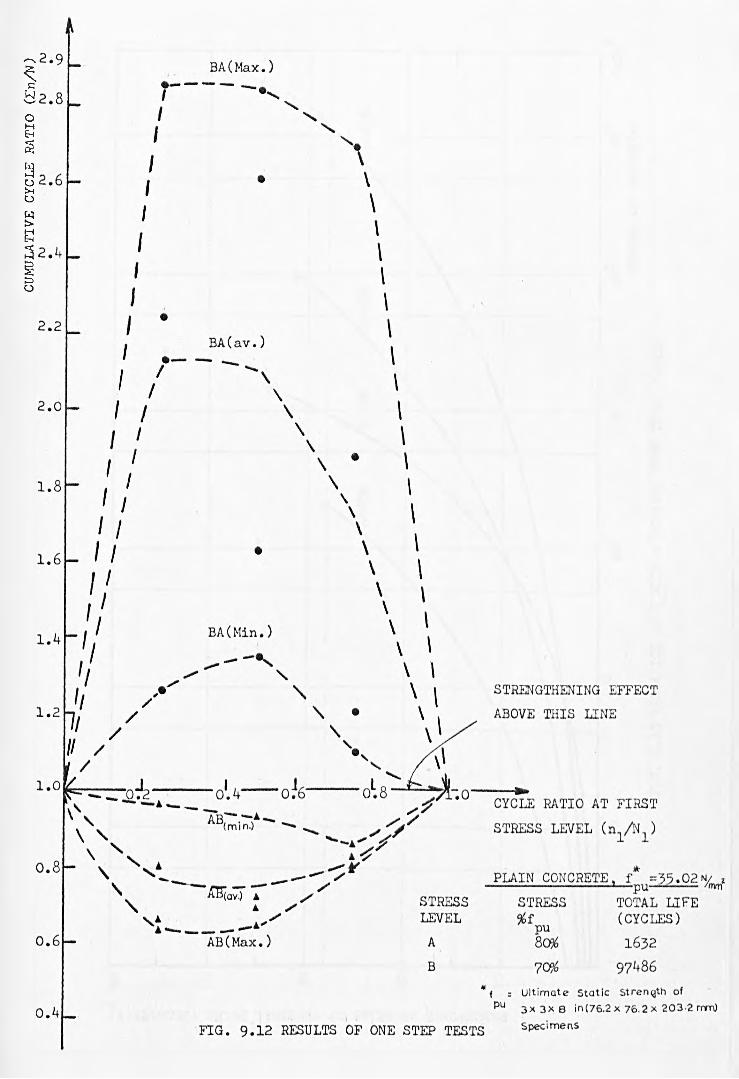
CU
MU
LA
TIV
E
CY
CL
E
RA
TIO
(Z
n/N
)
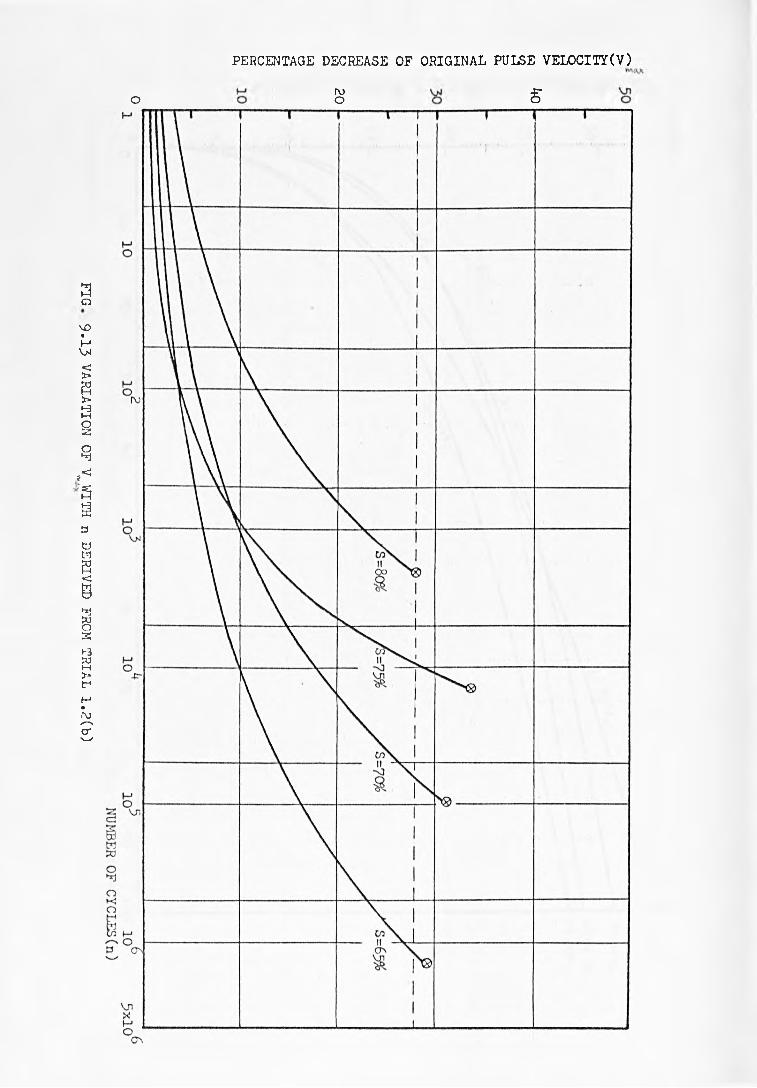
9.1
3 V
AR
IATIO
N
OF V W
ITH
n D
ERIV
ED
FROM
TR
IAL 1
.2(b
)*
w».
PERCENTAGE DECREASE OF ORIGINAL PULSE VELOCITY(V)
3o
oroo s
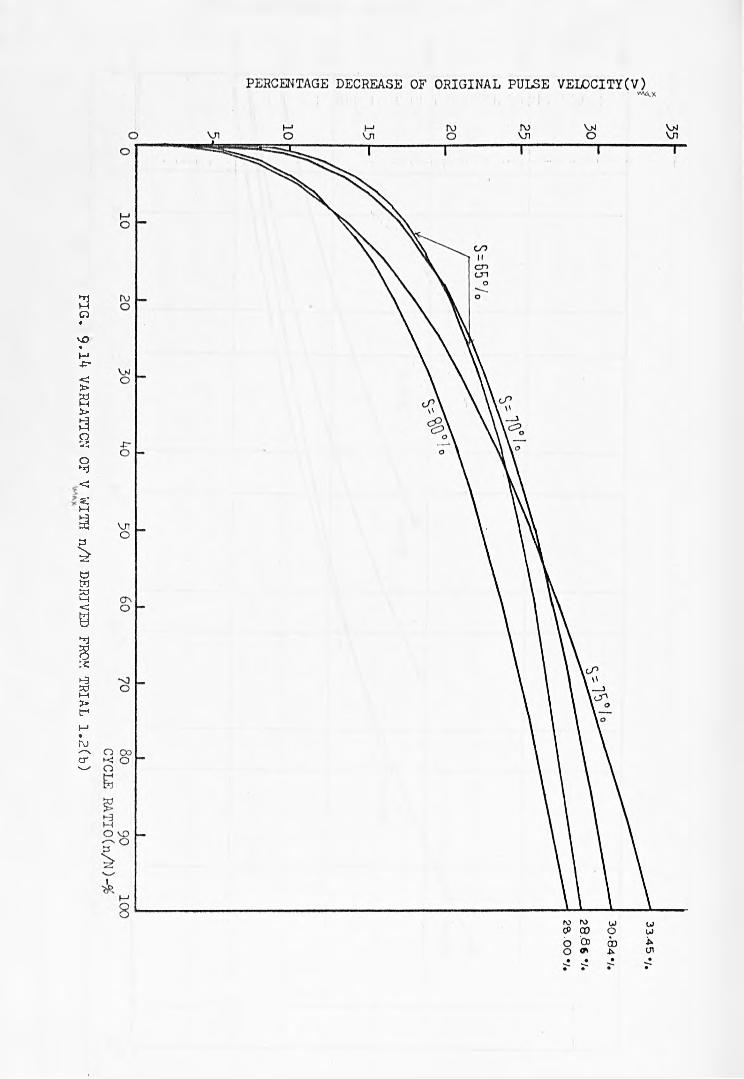
FIG
. 9
.14 V
AR
IATIO
N
OF V
WITH
n/N
D
ERIV
ED
FROM
TR
IAL
1.2
(b)
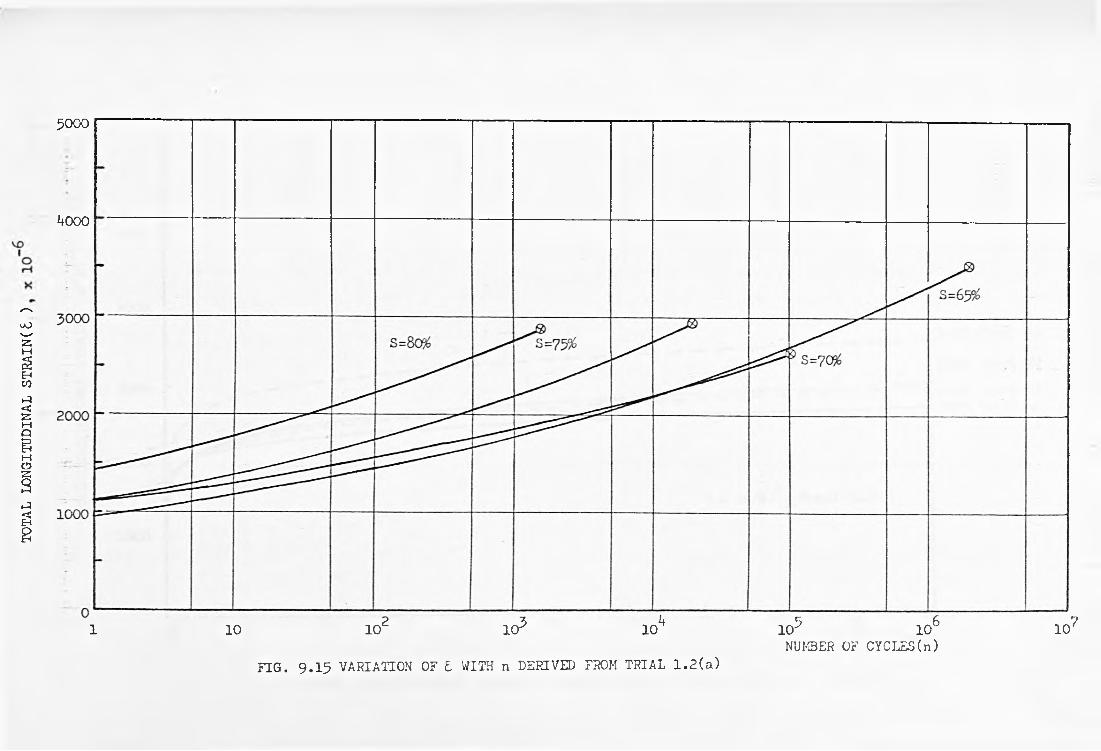
TOTA
L LO
NGIT
UDIN
AL S
TRAI
N(£
)
5 0 0 0
4000
2 5 4 5 6 71 1 0 1 0 1 0 p 1 0 H T 1 0 1 0 '
NUMBER OF CYCLES(n )FIG. 9 .I5 VARIATION OF t WITH n DERIVED FROM TRIAL 1.2(a)

TOTA
L LO
NGIT
UDIN
AL STRAIN,
FIG. 9.16 VARIATION OF TOTAL STRAIN WITH n/N DERIVED FROM TRAIL 1.2(a)
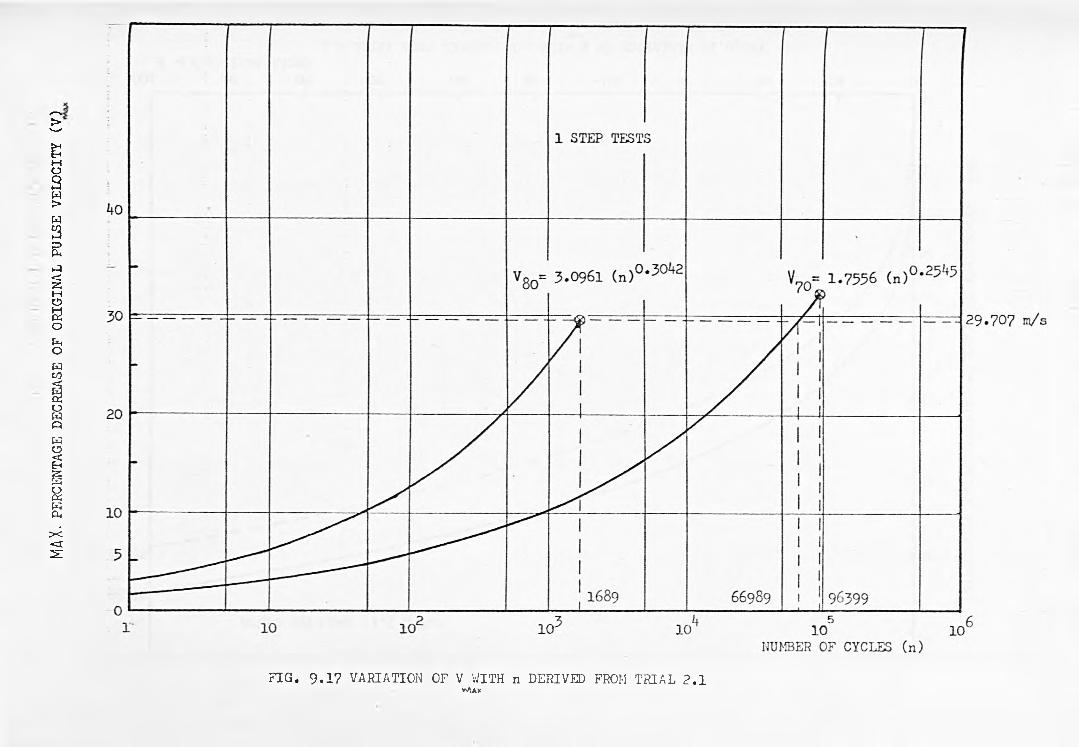
MAX. PERC
ENTA
GE
DEC
REA
SE O
F O
RIG
INA
L PU
LSE
VEL
OC
ITY
(V
)
F IG . 9 . 1 7 VARIATION OF V WITH n DERIVED FROM TRIAL 2 .1WIA.X

35
30
25
20
15
10
5
0
TRIAL 2.1; ONE STEP TESTS
J_________I_________I_________I_________I_________ 1_________!_________ I_________ I________10 20 30 i+0 50 60 70 80 90
F IG .9 .1 8 VARIATION OF V WITH n/N DERIVED FROM TRIAL 2 .1*U/CYCLE RATIO(n/N)- %

PERC
ENTA
GE DEC
REAS
E OF
ORI
GINA
L PU
LSE VELO
CITY
(MAX).O
9 . 19 . a
9 . 19 . b
u>
F I G . 9.19 S T E P S IN A N A L Y S IS O F S T R E S S DEPENDENCE

FIG
. 9
.20
NO
RMA
LISED D
AM
AG
E(V)-C
YC
LE RA
TIO
RELA
TION
SHIP
PERCENTAGE DECREASE OF ORIGINAL PULSE VELOCITY(V)"VI*
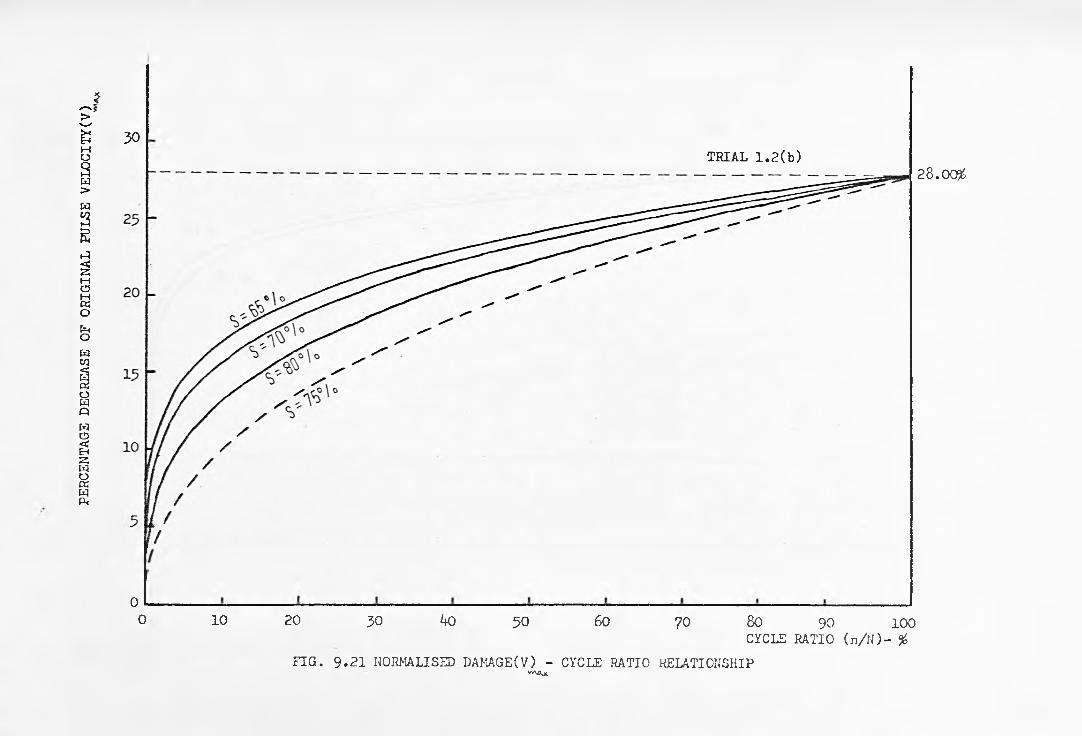
PERC
ENTA
GE
DEC
REA
SE O
F O
RIG
INA
L PU
LSE
VE
LOC
ITY
(V)
30
0
TRIAL 1 .2 ( b )28.00&
0 10 20 30 40 50 60 70 8o 90 100CYCLE RATIO ( n / N ) - %
F IG . 9 .2 1 NORMALISED DAMAGE(V) - CYCLE RATIO RELATIONSHIPVAÛoc
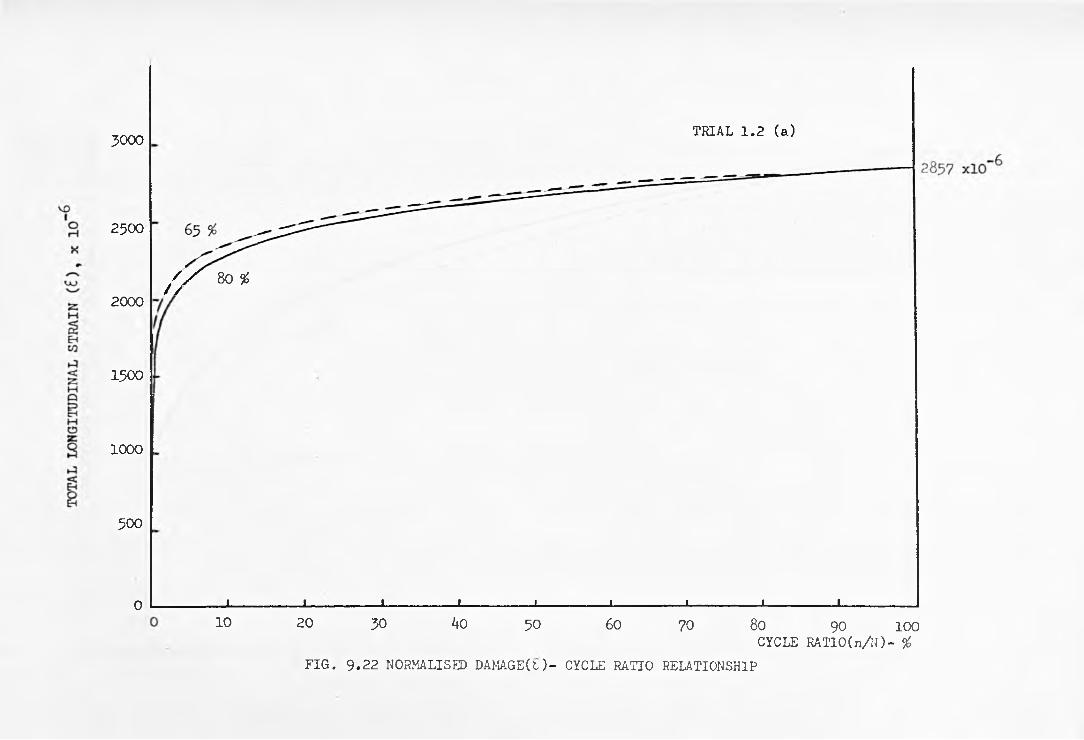
3000
2500
2000
1500
1000
500
0
TRIAL 1.2 (a)
f / 8o %
_J _____________ !______________I_____________ I_____________ !_____________ I----------------- 1----------------- 1_____________ 1______________
10 20 30 ifO 50 60 70 80 90 100CYCLE RA TIO (n/TO - %
FIG. 9.22 NORMALISED DAKAGE(t)- CYCLE RATIO RELATIONSHIP

PERC
ENTA
GE
DEC
REA
SE
OF
OR
IGIN
AL
PULS
E V
ELO
CIT
Y(V
)
FIG. 9.23 NORMALISED DAMAGE(V) — CYCLE RATIO RELATIONSHIP
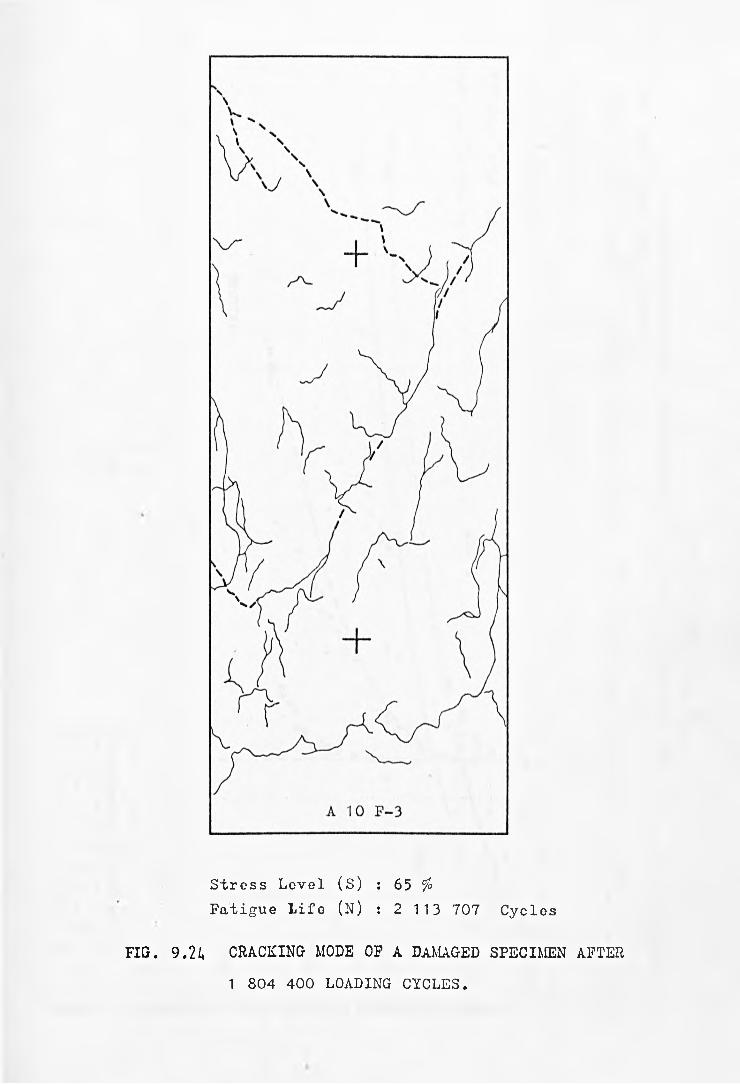
Stress Level (S) : 65 f t
Fatigue Life (N) : 2 113 707 Cycles
FIG. 9.2i* CRACKING MODE OF A DAMAGED SPECIMEN AFTER
1 804 400 LOADING CYCLES.
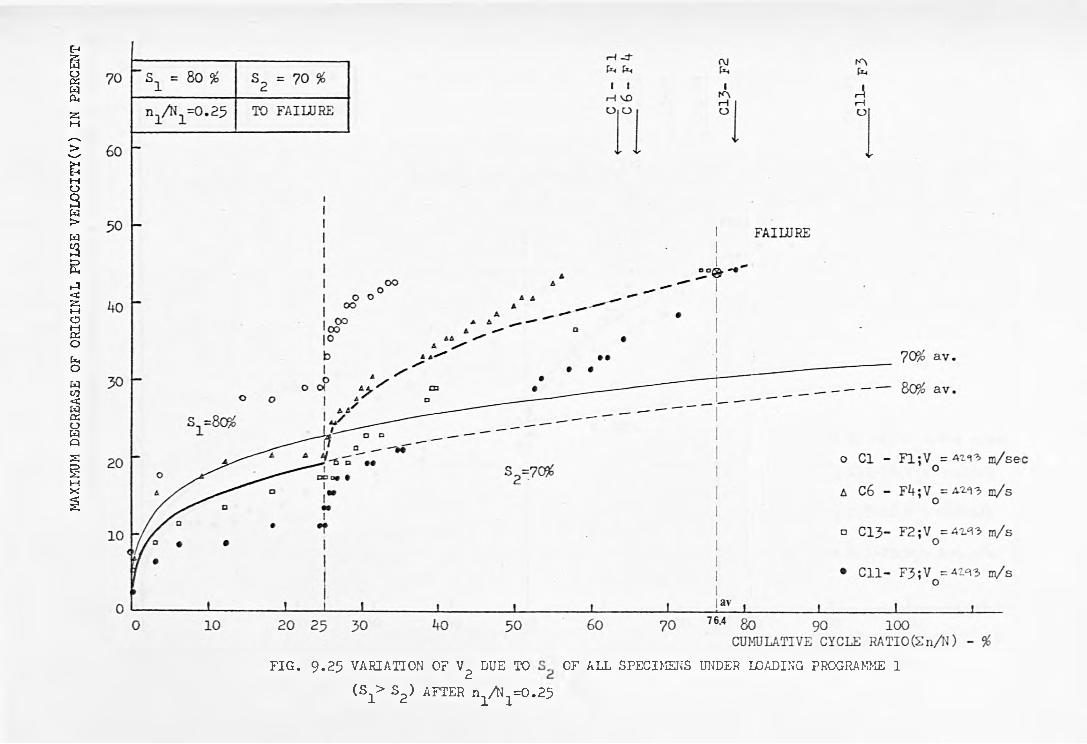
MAX
IMUM
DEC
REA
SE
OF
OR
IGIN
AL
FULS
E V
ELO
CIT
Y(V
) IN
PE
RCEN
T
F IG . 9 .2 5 VARIATION OF V2 DUE TO OF ALL SPECIMENS UNDER LOADING PROGRAMME 1
( S i > S 2 ) AFTER n 1/N 1 = 0 .2 5

MAX
IMUM
DEC
REA
SE O
F O
RIG
INA
L FU
LSE
VE
LOC
ITY
(V)
IN
PERC
ENT
70 s = 80 % S2 = 70 %
n l /N l =0*50 TO FAILURE
OJ t—f -3-1 1 1rH 1
00 rH rH f—10 O O O>C
50 FAILURE
( S l > S 2 ) AFTER n1/N 1 = O.5 0
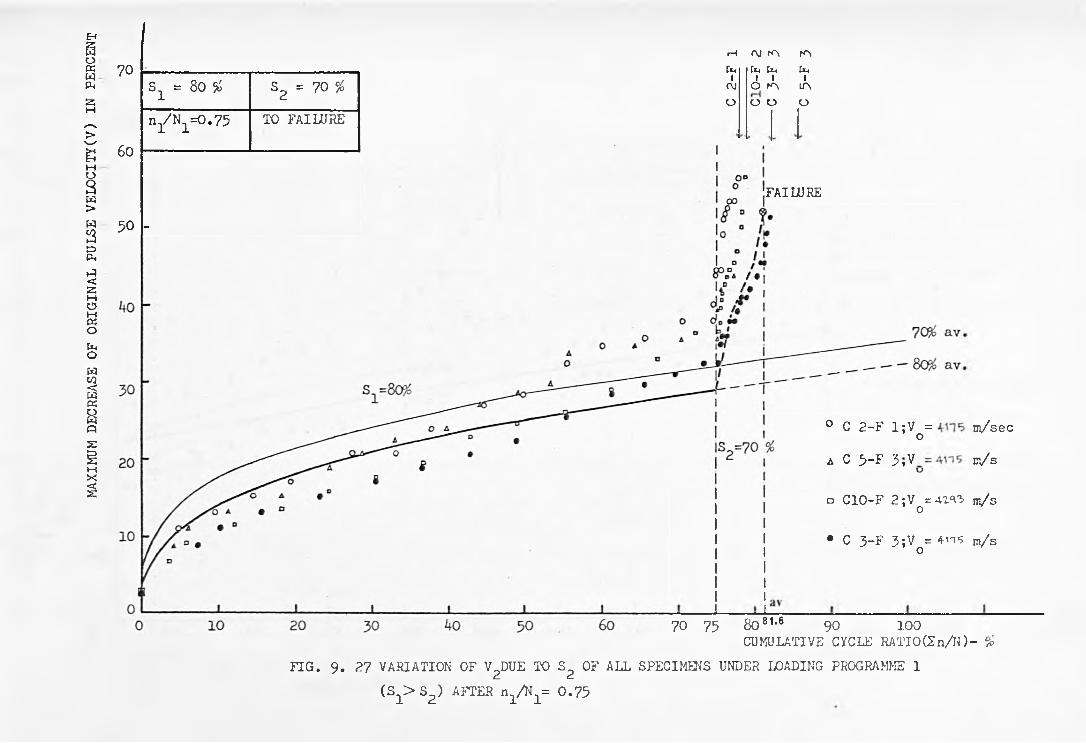
MAX
IMUM
DEC
REA
SE
OF
OR
IGIN
AL
PULS
E V
ELO
CIT
Y(V
) IN
PE
RCEN
T
r—I C\J f A N"\
70
60
S1 = 8o % S2 = 70 %
n /Ni=0.75 TO FAILURE
50 -
fuIf\lfa fa faI I IO K'v IA
o o o o
FAILURE
° C 2- F 1 ;V = m / s e c o
a C 5~F 3 *V m /s
□ C10- F 2 ;V = 41^3 m /s o
* C 3- F 3 ;V = i n ? m/ s o
70 75 8 o 81-6 90 100CUMULATIVE CY CLE R A T I0 (2 n / N ) - %
FIG. 9 . 27 V A R IA T IO N OF V 2 DUE TO S, O F A L L SPECIM EN S UNDER LOADING PROGRAMME 1
( S ^ S ^ AFTER n 1 A 1 = 0.75
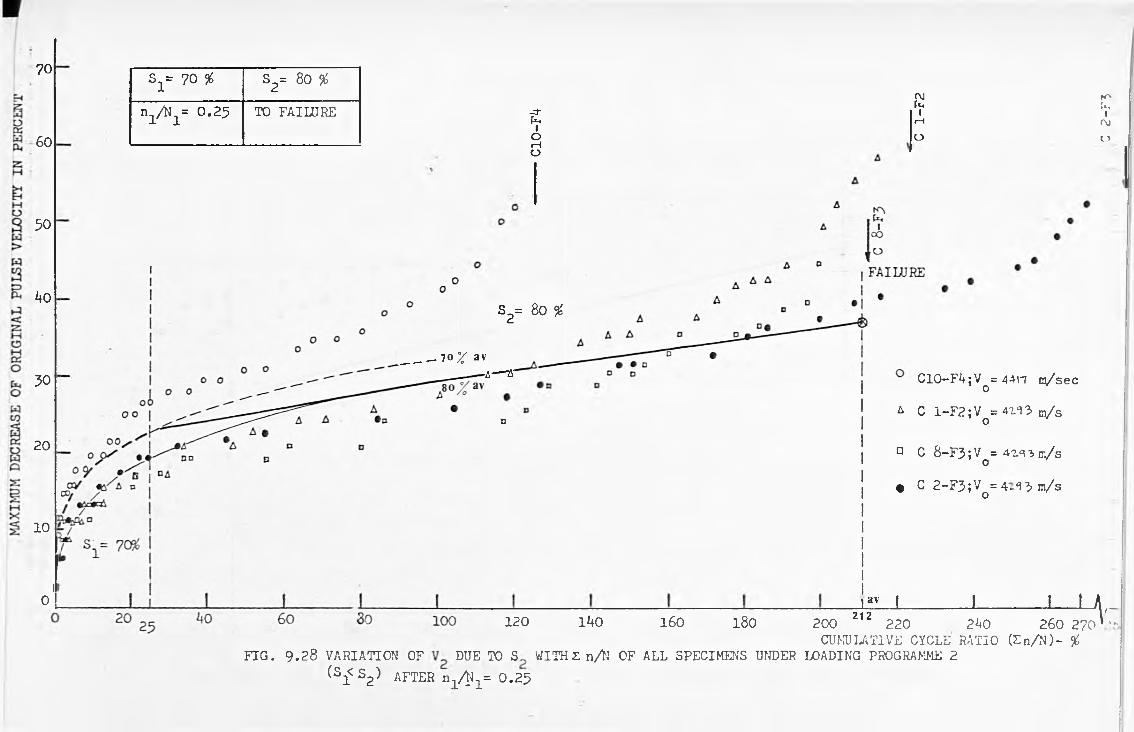
70
60
50
ko
50
20
10
l0
s1= 70 # s2= 80 %
niA i= 0.25 TO FAILURE -cf[*-(IorHO
rvj K >Wa [ i,
1 1rH r u
O 0
___ - 7 0 ^ av■6— &
D
s2= 80 %
C 10 -F 4 ;V = A M I ns/sec oa C 1 -F 2 ;V =4X^3 c / s o
a C 8 - F 3 ; V = 4 z i i n i / s o• C 2 -F 3 ;V = 4 -^ 3 m/s
o
av 1 ± J___L120 1*40 160 180 2 1 2 v
FIG. 9.28 VARIATION OF DUE TO S WITHZn/N OF ALL SPECIMENS UNDER LOADING PROGRAMME 2
200 220 2*40 260 270CUMULATIVE CYCLE RATIO (£ n /N )- %
( S 1<S2 ) AFTER n-LA '1 = 0 .2 5
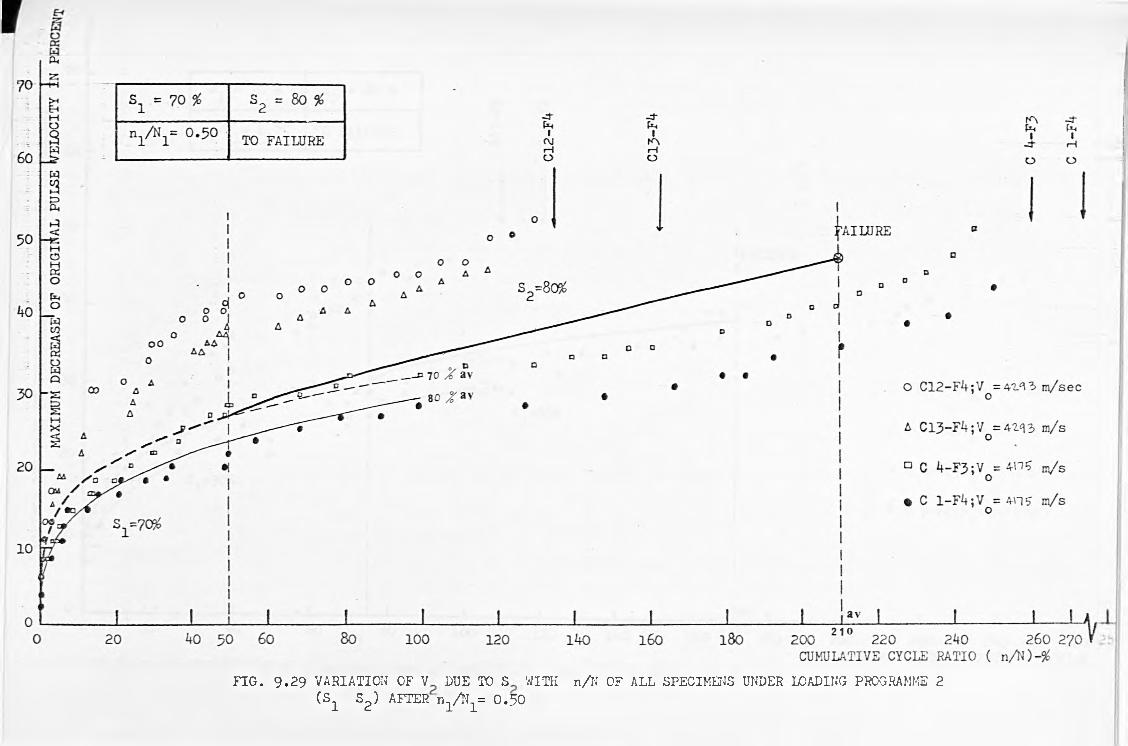
F IG . 9 .2 9 VARIATION OF V DUE TO S WITH n/N OF ALL SPECIMENS UNDER LOADING PROGRAMME 2 (S 1 S2 ) AFTER n 1/N 1 = 0 .5 0
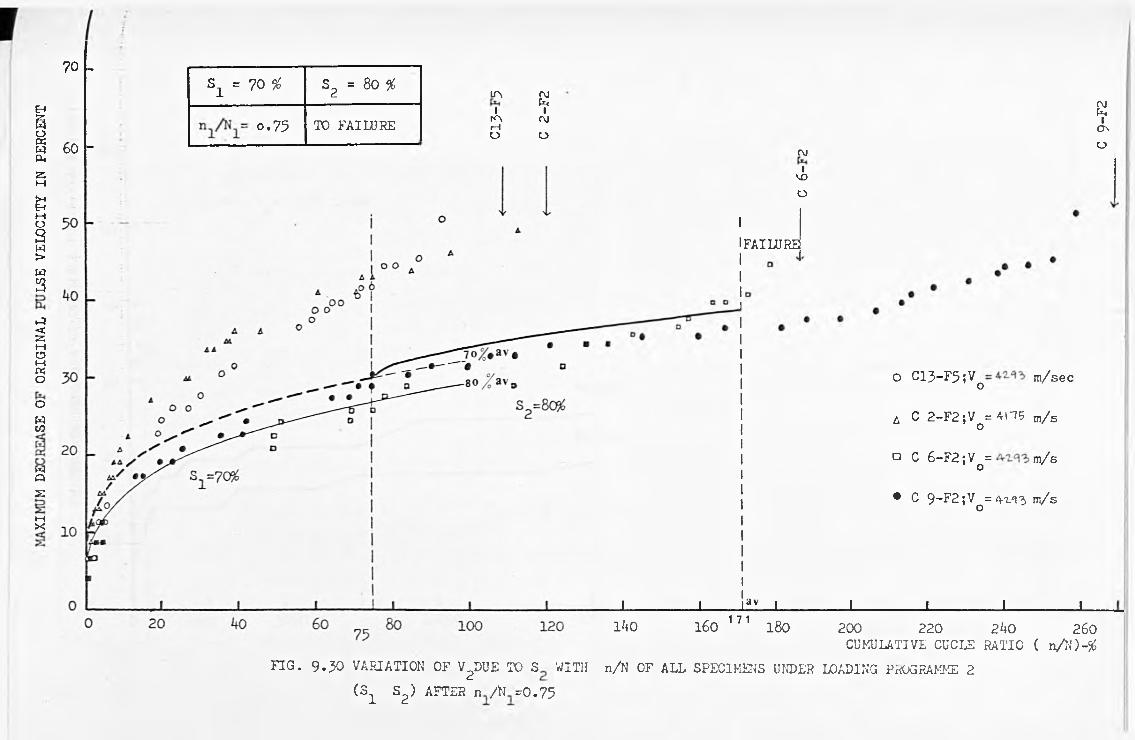
70 -
EH§£WCU2M£MOsW>wa
1-1<c2MOM«OowCO
WQ2:
MX
60 -
S1 = 70 % S2 = 80 %
° - 7 5 TO FAILURE
ir»iK'vrHa
£!I(\Jo
F IG . 9 .5 0 VARIATION OF V ^ U E TO S WITH
(S 1 S2 ) AFTER n / K =0 .7 5
c\j1VDO
f a i m r e ;
O C 1 3 -F 5 ;V m /seco
A C 2 -F 2 ;V =41-75 m/ s o
0 C 6-F2;V = m/s ’ o
• C 9~F2;V = 4.7.« m/s o
I____________________________ 1 ' a v 1___________________________1___________________________ I___________________________ I____________________________L _1^0 160 171 180 200 220 2 k 0 260
CUMULATIVE CUCLE RATIO ( n / N ) -%
n/N OF ALL SPECIMENS UNDER LOADING PROGRAMME 2
C 9
-F2
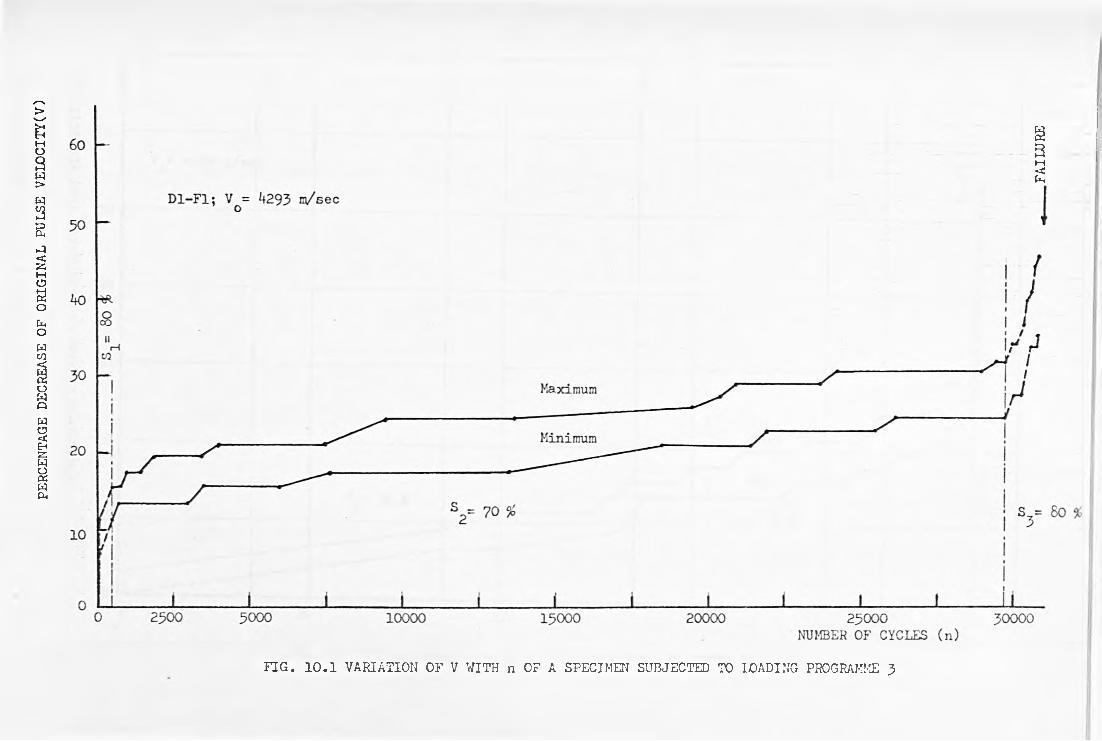
PERC
ENTA
GE
DEC
REA
SE O
F O
RIG
INA
L PU
LSE
VE
LOC
ITY
(V)
FIG. 10.1 VARIATION OF V WITH n OF A SPECIMEN SUBJECTED TO LOADING PROGRAMME 3
FAIL
UR
E

FIG
. 10
.2
VA
RIA
TION
OF V W
ITH
n OF A
SPECIMEN
SUBJECTED
TO
LO
ADON
G PRO
GRAMM
E 3
PERCENTAGE DECREASE OF ORIGINAL PULSE VELOCITY (V)
x

FIG
. 10
. 3
VA
RIA
TION
O
F V WIT
H2
n/N
O
F A
SPECIMEN
SU
BJECTED
TO
LOA
DIN
G
PROGRAM
ME
3
PERCENTAGE DECREASE OF ORIGINAL PULSE VELOCITY(V)
t—*o o
roo 5
o
rv>o
-c-o
S'
s
f—1oo
rvo
s
0M1
<O IIJrrvM3
<cnnn
-+
OC3§£H3M<MO►<o
Sg» -ioM3
CTNO
s
I
FAILU
RE
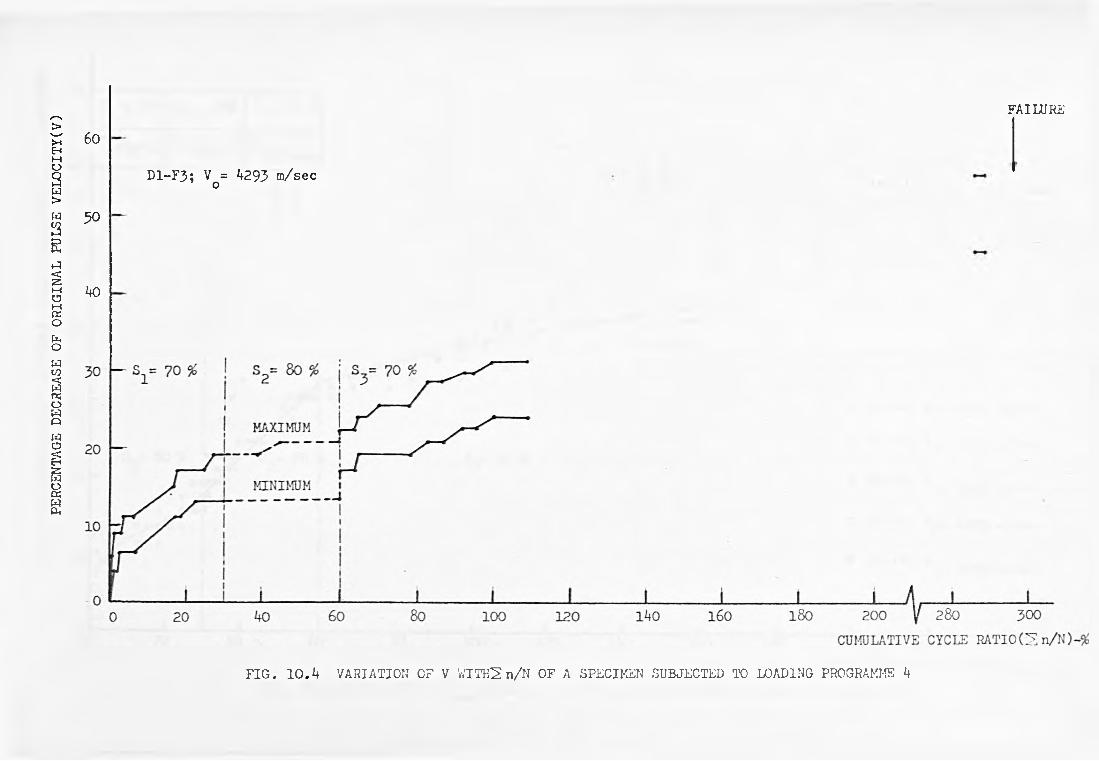
PERC
ENTA
GE
DEC
REA
SE
OF
OR
IGIN
AL
PULS
E V
ELO
CIT
Y(V
) FAILURE
6o
50
bo
D 1 -F 3 ; VQ= 1+293 m /sec
FIG. 1 0 . b VARIATION CF V WITH2 n/N OF A SPECIMEN SUBJECTED TO LOADING PROGRAMME b
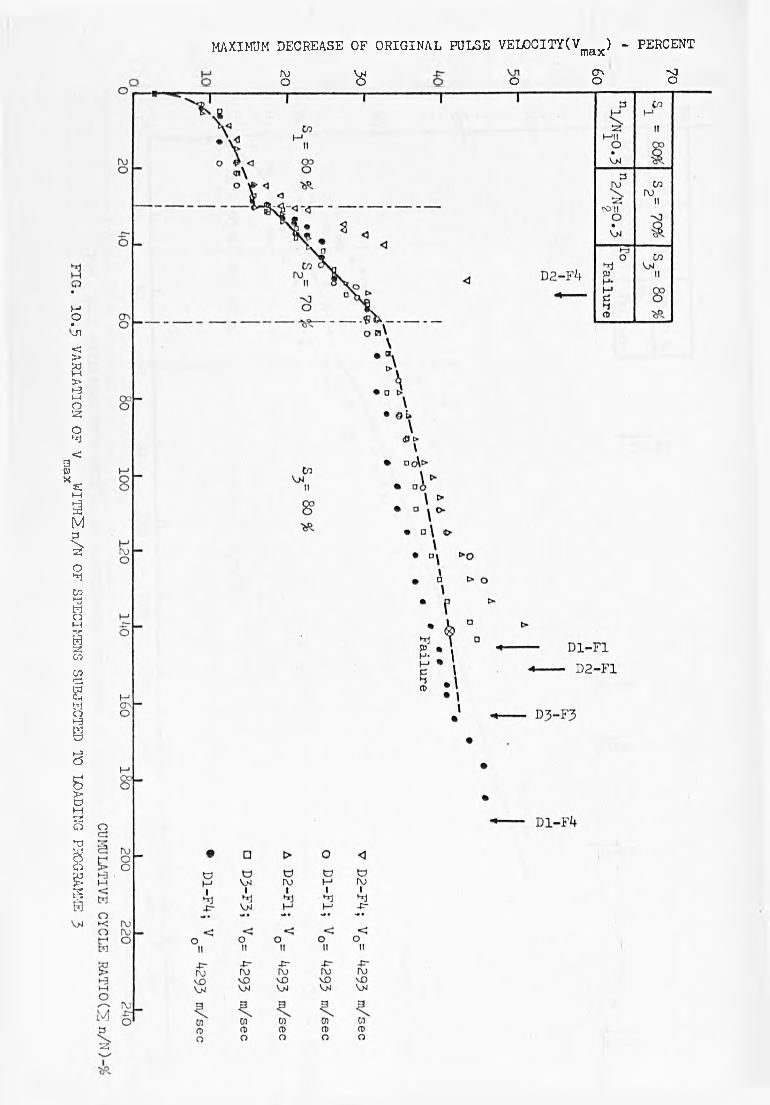
10.5
V
AR
IATIO
N O
F V W
illis n
/N O
F SPECIMEN
S SU
BJECTED
TO
LOA
DIN
G
PROG
RAM'
max
MAXIMUM DECREASE OF ORIGINAL PULSE VELOCITY(Vm&x) - PERCENTrv>o « o
O'.o
-oo

FIG. 10.6 VARIATION OF V WITH2n/N OF SPECIMENS SUBJECTED TO LOADING PROGRAMME
k
MAXIMUM DECREASE OF ORIGINAL PULSE VELOCITY(V ) - PERCENTmax
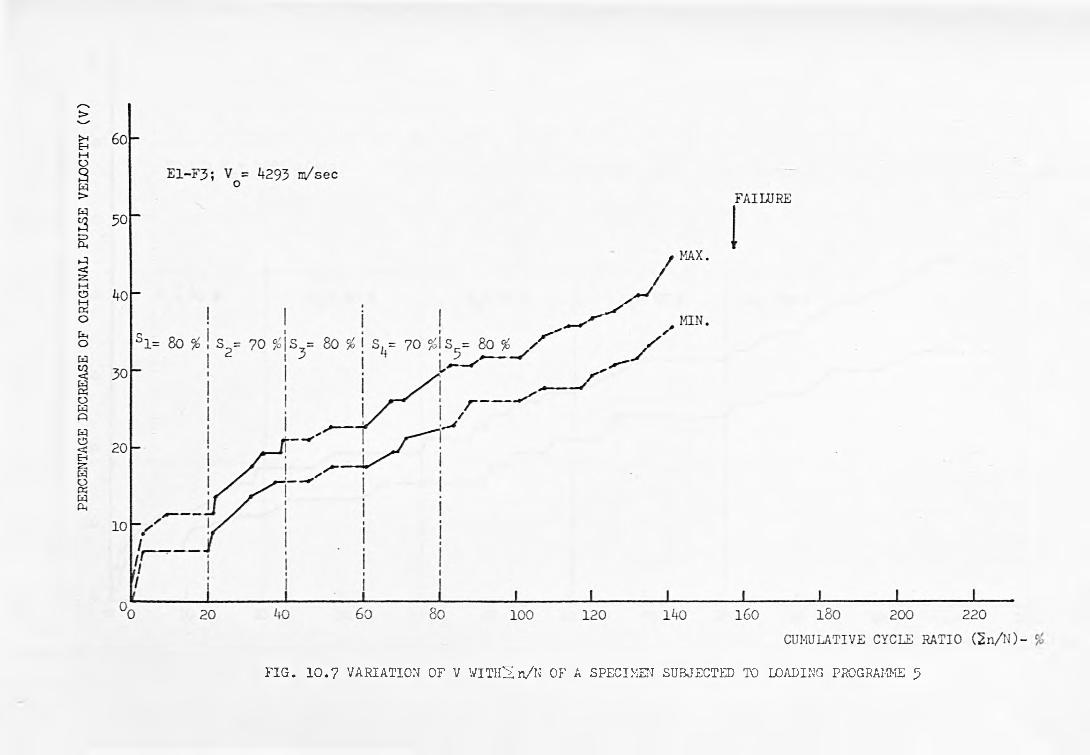
FIG. 10.7 VARIATION OF V WITHS n/N OF A SPECIMEN SUBJECTED TO LOADING PROGRAMME 5
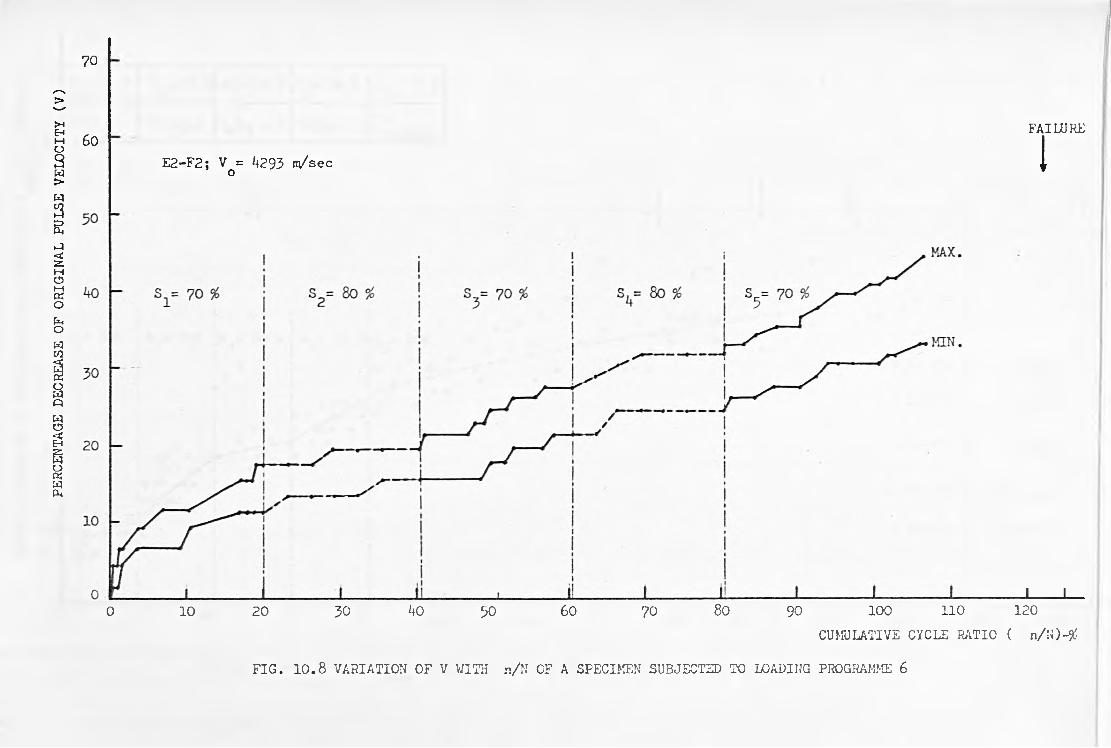
PERC
ENTA
GE
DEC
REA
SE O
F O
RIG
INA
L PU
LSE
VEL
OC
ITY
(V
)70
60E 2 -F 2 ; V = k293 m /sec o
0 10 20 30 kO 50 60 70 80 90 100 110
CUMULATIVE CYCLE RATIO
FAILURE
1
_i___I_120
( n/U)-%
FIG. 10.8 VARIATION OF V WITH n/N OF A SPECIMEN SUBJECTED TO LOADING PROGRAMME 6

EhwoKWO. 6o
S = 80 % s2= 70 % S y 80 % S y 70 % s = 8o % 5
ni A 1 n2/N=0.2 V N | 0.2 nA/N 0.2 ToF a ilu r e
xaB
>HEhMOs>wa£<SsMoMPSoP.Owto
owa
50
kO
30
20
10
SI U-IOJLU
oo a D
0
o ovV na O 4f/t •
V E l- F l ; V = ¿+¿+17 m /s
O E 1 -F 3 ; Vo= 4293 m /s
A E l-F A ; Vq= A293 m /s
• v o= 4293 rn/s
a E 2 -F 3 ; Vq= 4293 m /s
_1_ ± -L____l0 20 ho 60 80 100
F IG . 1 0 .9 VARIATION OF V W ITH Smax
120 lAO 160 180
n/N OF SPECIMENS SUBJECTED TO LOADING PROGRAMME 5
200 220 2 h 0 260CUMULATIVE CYCLE RATIO ( 2 n/N )-%
E2-F
3
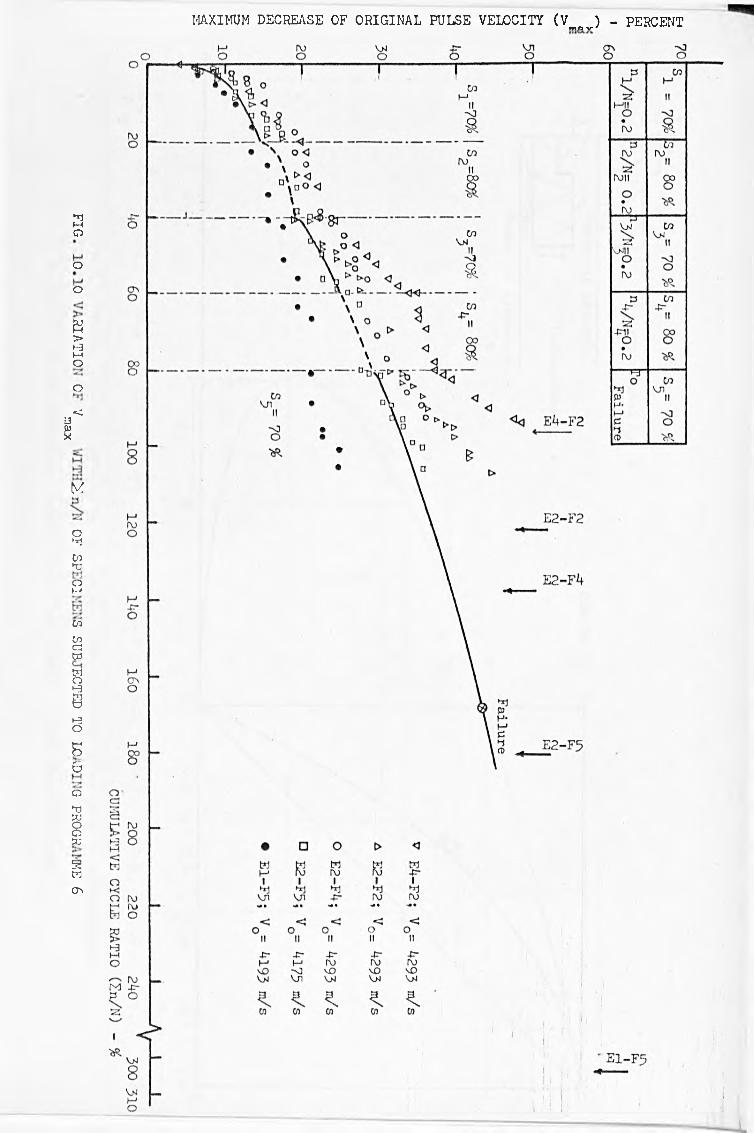
3o
oO
B>H3nOO<a
s
M
o•nCnTloMcococ«So1-3
eH3O56oTJS38S3
2WO
MAXIMUM DECREASE OF ORIGINAL PULSE VELOCITY (V ) - PERCENTma y *

S-'.
F IG . 1 1 . 1 CONCEPTUAL DAMAGE - CYCLE RATIO RELATIONSHIPS ( FROM ONE STEP TESTS )
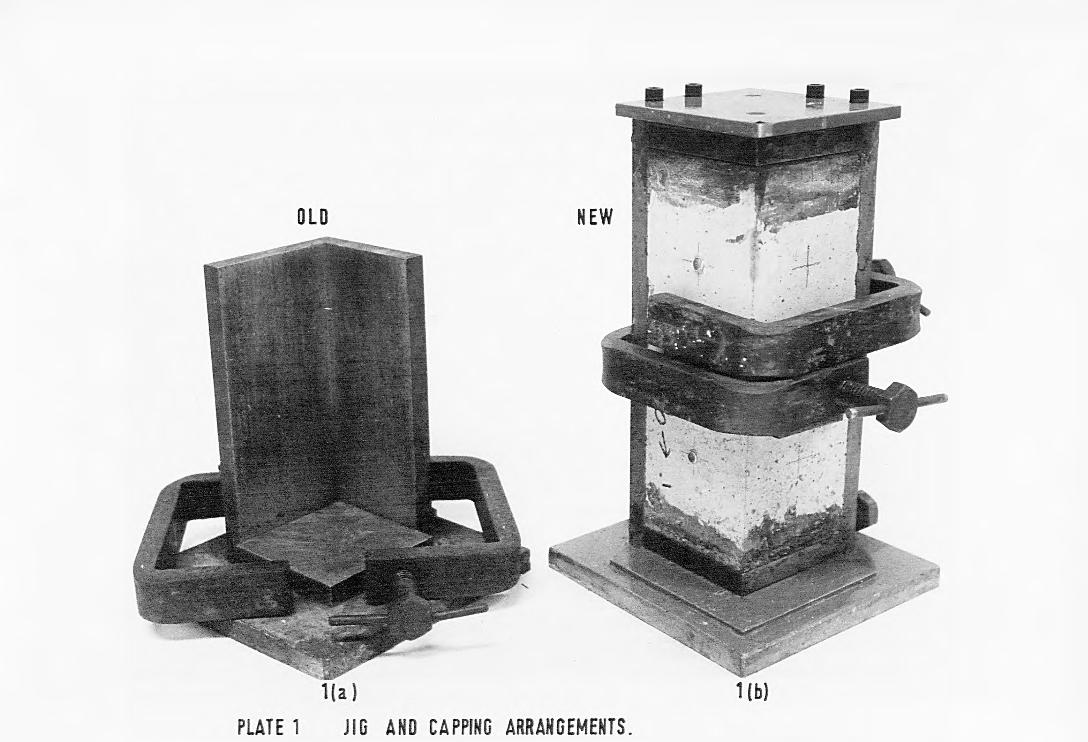

A. "PUNDIT" instrument
■ - r

P L A T E 2 . L O S . F A T I G U E T E S T I N G M A C H I N E .
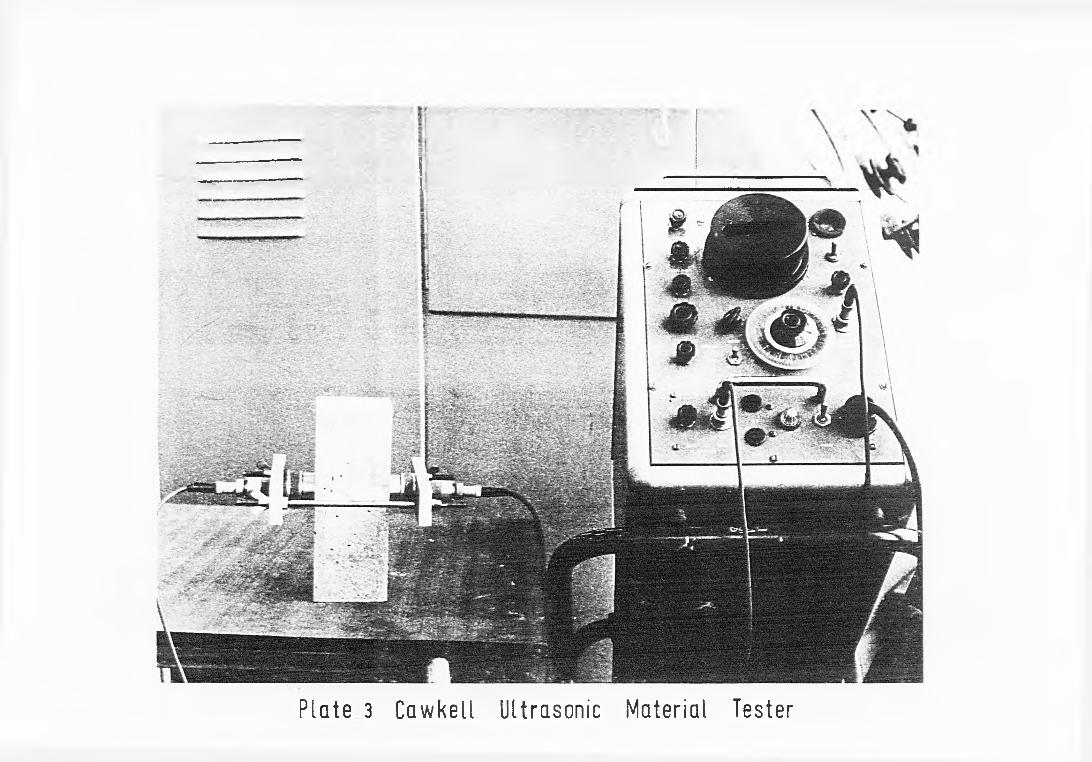
P l a t e 3 C a wk e l l Ul t rasoni c Materi al Tester
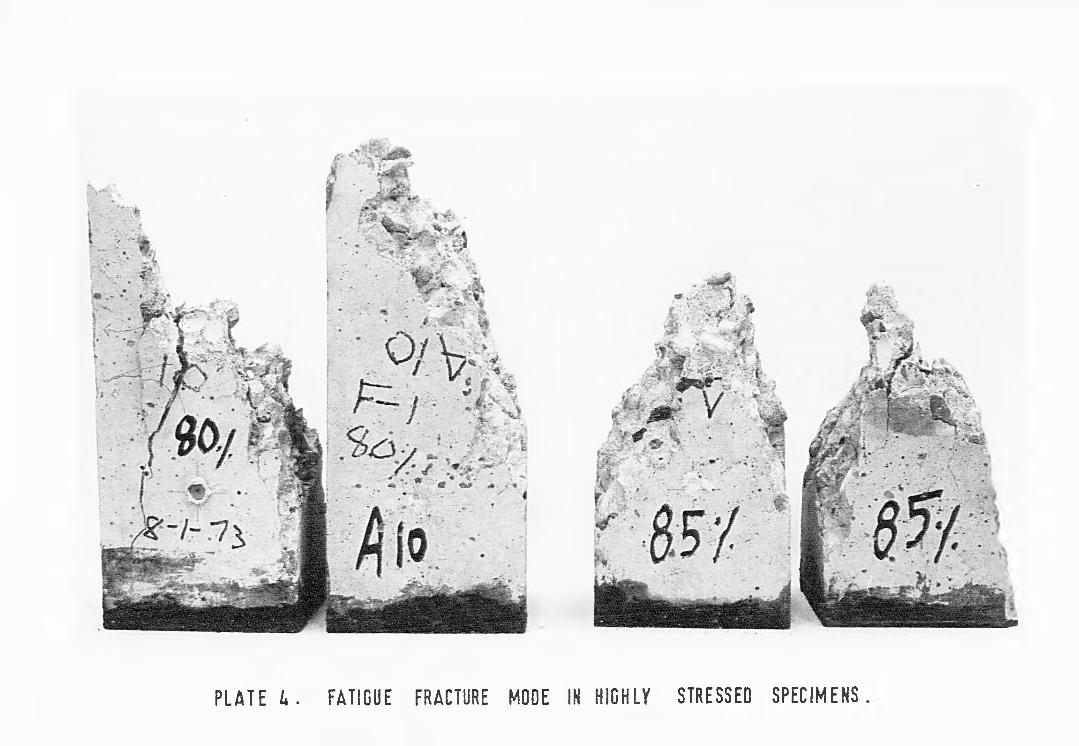
P L A T E l* . F A T I G U E F R A C T U R E M O D E IN H I G H L Y S T R E S S E D S P E C I M E N S
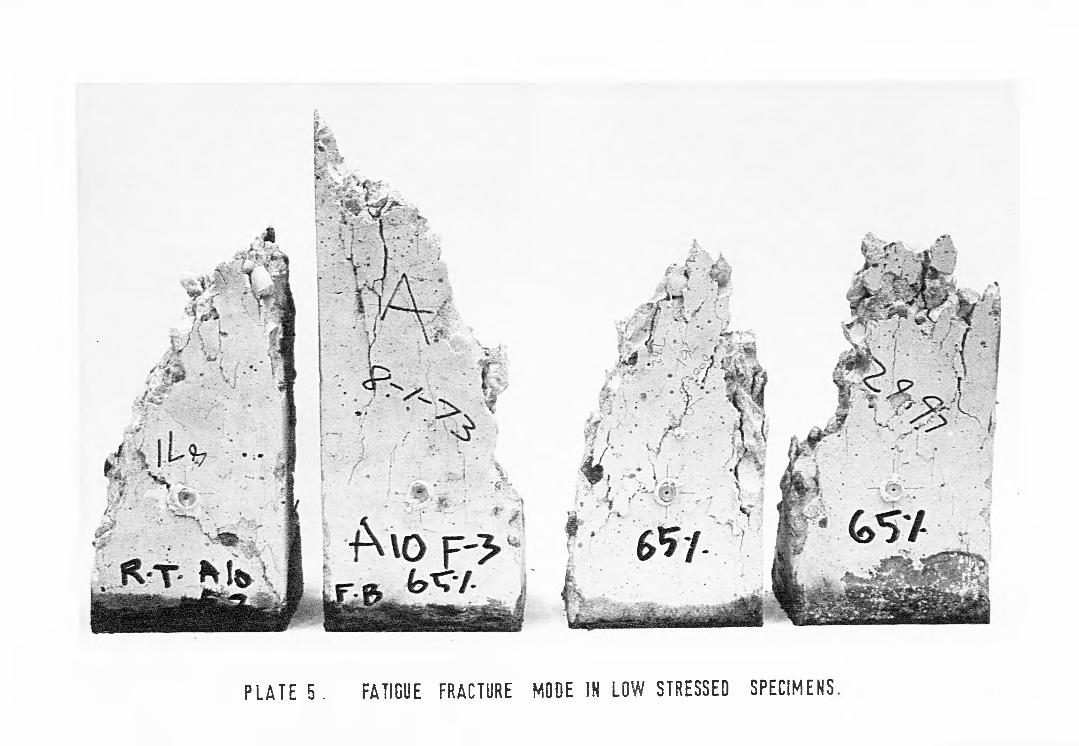
P L A T E 5 . F A T I G U E F R A C T U R E M O D E IN L O W S T R E S S E D S P E C I M E N S
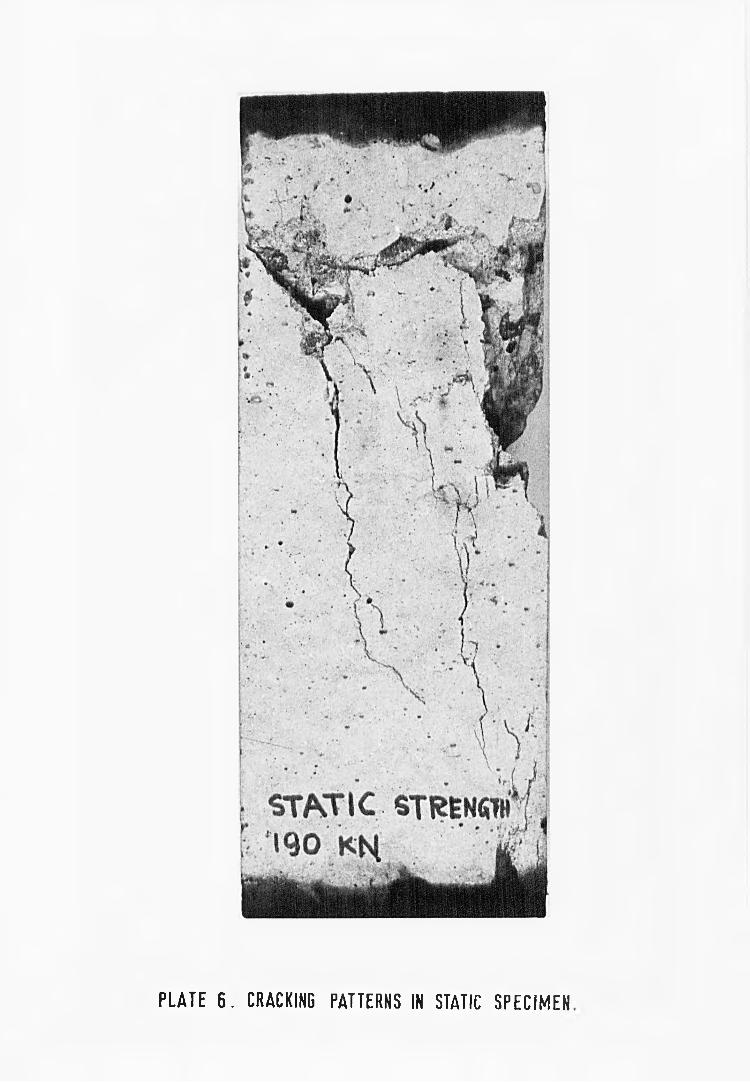
P L A T E 6 . C R A C K I N G P A T T E R N S IN S T A T I C S P E C I M E N

P L A T E 7 . F A I L U R E M O D E IN F A T I G U E S P E C I M E N
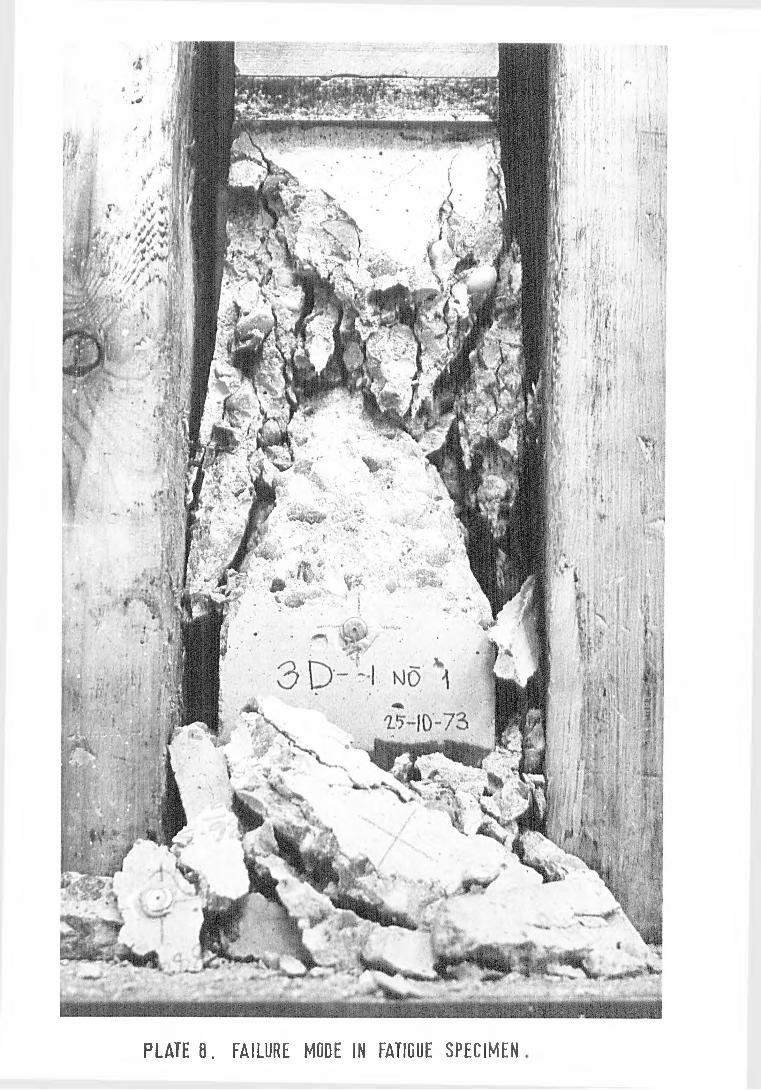
P L A T E 0 . F A I L U R E M O D E IN F A T I G U E S P E C I M E N
mm