
reliability of rock slopes with wedge mechanisms - MIT's DSpace

EARTH SURFACE PROCESSES AND LANDFORMSEarth Surf. Process. Landforms 36, 1809–1824 (2011)Copyright © 2011 John Wiley & Sons, Ltd.Published online 23 August 2011 in Wiley Online Library(wileyonlinelibrary.com) DOI: 10.1002/esp.2203
Runoff generation and sediment yield onhomogeneous dune slopes: scale effectand implications for analysisGiora J. Kidron*Institute of Earth Sciences, The Hebrew University of Jerusalem, Jerusalem, Israel
Received 12 December 2010; Revised 10 June 2011; Accepted 20 June 2011
*Correspondence to: Giora J. Kidron, Institute of Earth Sciences, The Hebrew University of Jerusalem, Givat Ram Campus, Jerusalem 91904, Israel.E-mail: [email protected]
ABSTRACT: Data concerning runoff and sediment yield in arid zones is of prime importance for hydrologists, geomorphologists,pedologists, ecologists and landscape engineers. For data comparison and extrapolations, runoff and sediment yield are oftenpresented in mass per unit area. Runoff and sediment yield collected on dune slopes over a wide range of plot sizes during 1990–1994 in the Negev Desert, Israel, showed that the contributing area was mainly confined to a narrow belt at the bottom of the slopes.It was therefore hypothesized that the very short rain bursts, capable of runoff generation, may result in a scale effect (SE). Indeed,average duration of duration of consecutivemedium and high rain intensities which are potentially above the surface infiltration rate rangedbetween 2.2 and 3.0 minutes, implying that flow connectivity is largely limited. Based on the intermittent character of the rain spellscapable of runoff generation it is argued that SE is an inherent outcome of the rain properties. Yet, it is further argued that the mag-nitude of the SE is surface-dependent. As a result, it is argued that the conventional way for runoff and sediment yield presentation asmass per unit area implies theoretical misconceptions and may cause gross overestimation in extrapolation and the presentation ofrunoff and sediment yield in mass per unit width of the slope is suggested. The accuracy of the two extrapolation methods are comparedto the actual runoff and sediment yield collected in the field. The data show that extrapolation based on runoff (or sediment) yield per plotwidth deviates from the actual amounts collected by a factor of 1�1 to 1�3 onlywhile deviating by a factor of 4�2 to 5�6 and 10�7 to 11�8 if theextrapolation is based on large and small plots, respectively. Theoretical and practical reasons for presentation of runoff and sediment yieldas mass per unit width are discussed. Copyright © 2011 John Wiley & Sons, Ltd.
KEYWORDS: runoff; sediment yield; scale effect; microbiotic crust; sand dunes; Negev Desert
Introduction
Measurements of runoff and sediment yield along slopes mayprovide essential information regarding fluvial processes inhumid (Hewlett and Hibbert, 1967; Dunne and Black, 1970;Dunne et al., 1975; de Ploey, 1977; Rutin, 1983) and arid(Tadmor and Shanan, 1969; Yair and Lavee, 1985; Abrahamset al., 1988; Morin et al., 1993; Kosovsky, 1994) environments.However, runoff and sediment yield data from aridenvironments are scarce (Bracken et al., 2008). The lack ofan adequate database is especially crucial due to theunpredictable and hazardous nature of desert floods.Data published on runoff are usually presented in volume
(Dunne and Black, 1970; Yair and Lavee, 1985; Frot et al.,2008), in volume per unit area or as runoff coefficients (Evenariet al, 1975; Abrahams et al., 1988; Ceballos and Schnabel,1998; van Wesemael et al., 2000; Cerdà and Lasanta, 2005).Similarly, sediment yield is usually presented in weight orweight per unit area (Abrahams et al., 1988; Cerdà and Lasanta,2005). The presentation of runoff in volume and sedimentyield in weight does not necessitate any a priori assumptionsconcerning the actual plot size responsible for runoff
generation, but it may pose severe limitations on any attemptto compare different size plots and to use the data for extrapo-lation. Whereas runoff coefficients may facilitate the compari-son between plots, one may assume that the presentation ofspecific runoff (in volume per unit surface area) or specificsediment yield (as weight per unit surface area) may facilitateextrapolation. However, these values are calculated based onthe surface area of the entire plot and involve an inherentassumption that runoff and consequently sediment yield areevenly contributed throughout the entire length of the plot.
Data presented from arid and semi-arid environments oftenpointed to the fact that only a limited portion of the plotsactually participate in runoff and sediment production, therebybeing responsible for a scale effect, SE (Dunne and Dietrich,1980a; Lavee, 1982; Seyfried and Wilcox, 1995; Bergkampet al., 1996; Bull et al., 2000; van Wesemael et al., 2000;Cammeraat, 2004; Yair and Bar-Yassif, 2004; Bracken andKikby, 2005). While some researchers attributed the SE alsoto the spatial variability of rain (Langbein and Schumm,1958), most researchers attributed the SE mainly to surfaceheterogeneity. Accordingly, different field cells have differentabsorption capacity, which may be responsible for the SE.

1810 G. J. KIDRON
Thus, different proportions of soil and rock fragments (Poessenet al., 1994; van Wesemael et al., 2000), rock and soil (Yair andLavee, 1985; Ceballos and Schnabel, 1998; van Wesemaelet al., 1998; Frot et al., 2008), or soil and vegetation (Bergampet al., 1996; Cammeraat, 2004; Cerdà and Lasanta, 2005) resultin a mosaic of runoff and runon zones. This mosaic-like patternis also accentuated based on variable soil properties whichaffect runoff (and hence sediment yield) such as the soil depth(Cammeraat, 2002, 2004), bulk density (van Wesemael et al.,2000), texture and especially the clay content (Puigdefábregaset al., 1998; Ruiz-Sinoga and Martinez-Murillo, 2009), storagecapacity (Cammeraat, 2002), microrelief (Cammeraat, 2004),cracks (Solé-Benet et al., 1997), aggregate stability (Ruiz-Sinogaand Martinez-Murillo, 2009), hydrophobicity (Gomi et al.,2008) or the surface capability to form a physical crust(Cammeraat, 2004). At given slopes land use and management(Ruiz-Sinoga and Martinez-Murillo, 2009) as well as grazing(Romero-Diaz et al., 1999) also affect runoff.Yet, plant cover and plant pattern were often seen to play a
cardinal role (Cammeraat, 2004). Open inter-shrub areas wereoften assumed to contribute runoff to adjacent down slopeshrubs (Tongway and Ludwig, 1990; Abrahams et al., 1995;Bergkamp et al., 1996; Aguiar and Sala, 1999; Casermeiroet al., 2004; Muelleret al., 2008; Smets et al., 2008). Facilitatingonly part of the runoff to reach the collecting buckets or thechannel, connectivity, or the lack of connectivity, was thusseen responsible for the SE (Cammeraat, 2002; Kirkby et al.,2002), hitherto reported from many parts of the world(Bergkamp et al., 1996; Ceballos and Schnabel, 1998; vanWesemael et al., 1998; Bull et al., 2000; van de Giesen et al.,2000; Cerdan et al., 2004; Frot et al., 2008). Due to surfaceheterogeneity, different field cells have different absorptioncapacity, which gave rise to the scale approach during whichrain–runoff relations were examined at different scales (Poesenet al., 1994; Cammeraat, 2004; Puigdefábregas, 2005). Yet, asnoted by Cammeraat ELH (2002) and Boix-Fayos et al.(2006), no simple relationships were found between the scales,and thus this approach had only a limited success.In order to assess whether surface heterogeneity is
responsible for the SE, or whether it is an inherent phenomenonlinked to rainfall properties, measurements should be confinedto non-heterogeneous surfaces. Indeed, crusted surfaces inthe Nizzana research station (NRS) in the Negev may beconsidered relatively homogenous surfaces. The dunes arecomprised of relatively homogenous sand with similar fines (siltand clay) content of ~5%. Many variables that may be relevantfor other environments such as differences in cracks, aggregatestability, soil depth, rock outcrops or rock fragment do notapply to the dune environment. Yet, while physical crust isnot common and hydrophobicity was not detected (Kidron,1999), a close link was found between runoff generationand the chlorophyll content of the microbiotic crusts. Whilenon-crusted areas at the dune summit did not yield runoff(Kidron, 1999), runoff was generated from the crusted lowerflanks of the dune following medium intensities as low as9–12mm/h (Kidron and Yair, 1997). Runoff generation waslinked to the crust biomass (commonly presented by its chloro-phyll content) and therefore produced also on crusted surfacesunderneath the shrub canopy (Kidron, 1995). A positive linearrelationship was found between the crust’s chlorophyll contentand runoff yield in the four cyanobacterial crusts defined in theresearch site (Kidron et al., 2003). Furthermore, due to thespotty distribution of the vegetation on the slopes (Tielbörger,1997), and the fact that all crust types were mapped andthoroughly studied (Kidron et al., 2010), an attempt to assessthe actual plot area that participates in runoff production andto evaluate the nature of the SE was possible.
Copyright © 2011 John Wiley & Sons, Ltd.
The confinement of runoff to the lower parts of the plots (Kidronand Yair, 1997) albeit the relatively homogeneous dune surfaces,brought about the notion that rain properties may be responsiblefor the SE. Moreover, it was also hypothesized that soil propertiessuch as antecedent surface wetness may also determine themagnitude of the SE. It was therefore further hypothesized thatrunoff (or sediment yield) presentation in volume (or weight) persquare meter may lead to gross inaccuracies once extrapolationfrom small- to large-scale areas is executed. These hypotheseswere explored in the present study.
Analysis conducted in the current study is based uponpublished data from 10 large plots (defined herein as> 25m2)of up to 1100m–2 (Kidron and Yair, 1997, 2001; Kidron,1999), and upon additional data from one plot (56m2) and16 mini plots (1–24m2).
Study Area and Methodology
Rainfall, runoff and sediment yield were measured on north-facing slopes (NFS) and south-facing slopes (SFS) of longitudinaldunes in the NRS in Sede Hallamish, western Negev Desert,Israel, during 1990–1994 (Figure 1). These dunes, trendingwest-east, are up to 15–20m high, divided by 100–200m wideinterdunes. Average annual precipitation is c. 95mm, fallingduring November–April (Rosenan and Gilad, 1985). Microbioticcrusts, mainly cyanobacterial (Lange et al., 1992), 1–3mmthick, cover the lower 20–50m of the dune slopes, facilitatingrunoff production. Chlorophyll a content of the crusts ranged,for the most parts, between 15 to 20mg/m2 and 30 to 40mg/m2
at SFS and NFS, respectively. The crusts overlay relativelyhomogenous sand, having 3-7% of silt and clay. Owing to therelatively homogenous vegetal cover of 10 to 20% and itsspotty distribution, the lack of pebbles, and the similar proper-ties of the crusts within each exposure, a good comparison ofrunoff obtained from different sizes of plots was possible.
Rain measurements were carried out with a Texas Electronics(USA) tipping-bucket rain recorder (0�1mm resolution, whichimplies a resolution of 6mm/h) connected to a Campbell CR-10(USA) data logger. In order to evaluate the potentiality of thedifferent rain spells to produce runoff, all the rain data wereanalyzed. By assuming that alternating intensities of 6 and12mm/h for instance imply rather a constant intensity of 9mm/h,a resolution as low as 3mm/h was possible. For the present calcu-lation, the lower possible intensities capable of runoff generation(9mm/h lasting for consecutive two minutes; see Kidron and Yair,1997) and one minute-long high (20mm/h) and convective(30mm/h) intensities were divided into rain segments and theiroverall duration of each of these segments was calculated. Inthis way, the duration of segments which may be potentiallyabove the infiltration threshold was assessed. In addition, smallorifice rain gauges located next to the plots served to collect thehydrological rain, i.e. the effective rain, incident to the slopeangle (Sharon, 1980).
Runoff and sediment collection were carried out on plots andmini plots ranging in size from 1 to 1100m2 (Tables I and II;Figure 2), as part of a large project, attempting to understandthe impact of crust distribution on runoff and sediment yield(Kidron, 1995). The analysis included seven and four plots(> 25m2) with≥95% crust cover at NFS and SFS, respectively,and 10 and six mini plots (< 25m2) of≥ 98% crust cover and<10% vegetation cover at NFS and SFS, respectively. Owingto the fact that non-crusted dune sections at the dune summitsfailed to generate runoff, and areas with patchy crust cover atthe dune midslopes yielded only negligible amounts (reflectingdiscontinuity in runoff flow when runoff generated at thecrusted patches infiltrates at the non-crusted patches; Kidron,
Earth Surf. Process. Landforms, Vol. 36, 1809–1824 (2011)

Figure 1. Research site location and layout. For plot and mini plot characteristics see Tables I and II.
Table I. Plot characteristics.
Exposurea Plot Area (m2) Length (m) Width (m) Azimuth (deg.) Angle (deg.) Crust cover (%)
Number Name Stabilized Total Stabilized Total Stabilized TotalNFS 1 N1 73�7 73�7 13�9 13�9 5�3 5�3 355 11–16 99NFS 2 N2 306�8 306�8 20�7 20�7 14�8 14�8 5 11–17 97NFS 3 N3 478�4 1157�9 27�0 54�9 18�0 21�1 350 <23 95NFS 4 N4 1092�5 1642�7 49�0 66�5 22�3 24�7 350 <16 95NFS 5 C1 187�6 187�6 18�7 18�7 10�0 10�0 350 6–21 96NFS 6 C4 237�8 237�8 21�6 21�6 11�0 11�0 12 9–19 98NFS 7 C5 56�1 56�1 9�5 9�5 5�9 5�9 175 12–17 99SFS 8 S1 30�4 30�4 7�2 7�2 4�2 4�2 170 9–12 97SFS 9 S2 410�6 616�2 28�6 39�0 14�3 15�8 175 <16 97SFS 10 S3 198�0 198�0 19�0 19�0 10�4 10�4 180 10–20 98SFS 11 S4 799�4 1460�0 25�0 40�0 32�0 39�5 170 7–11 95
aNFS, north-facing slopes; SFS, south-facing slopes.
Table II. Characteristics of mini plots.
Exposurea Mini plot number Date of construction Area (m) Length (m) Width (m) Azimuth (deg.) Angle (deg.) Surface propertiesb-
SFS I 1�90 4�2 2�1 2�0 235 7 vsSFS II 1�90 3�9 2�2 1�8 200 9 sSFS III 1�92 1�5 1�9 0�8 170 8 vsSFS IV 1�92 1�5 1�9 0�8 170 8 vsSFS V 1�92 1�0 1�4 0�7 180 12 sSFS VI 1�92 6�6 4�7 1�4 172 5 sNFS VII 1�90 3�6 2�0 1�8 335 13 rsNFS VIII 9�90 6�3 3�5 2�15 360 13 sNFS IX 9�90 4�1 2�4 2�1 9 15 sNFS X 9�90 6�6 3�5 2�15 360 16 sNFS XI 1�92 1�6 1�6 1�0 360 12 sNFS XII 1�92 2�6 2�0 1�3 353 18 sNFS XIII 1�92 1�4 2�0 0�7 336 13 sNFS XIV 1�92 1�7 1�7 1�0 5 10 sNFS XV 1�92 24�0 6�0 4�0 2 15 rNFS XVI 1�92 6�3 4�2 1�5 355 23 r
aNFS, north-facing slopes; SFS, south-facing slopes.br, rough; s, smooth; rs, relatively smooth; vs, very smooth.
1811RUNOFF AND SEDIMENT YIELD: SCALE EFFECT
Copyright © 2011 John Wiley & Sons, Ltd. Earth Surf. Process. Landforms, Vol. 36, 1809–1824 (2011)

Figure 2. General view and the central dune that includemini plots VIII–XII (mid-photograph). This figure is available in colour online at wileyonlinelibrary.com/journal/espl
1812 G. J. KIDRON
1999), only plots with≥ 95% crust cover were included in thecurrent analysis. Whereas all plots at SFS extended on one crusttype having a chlorophyll a content of approximately 20mg/m2,all plots at NFS extended over crusts C and D, having a chloro-phyll a content of 30 to 40mg/m2, and consequently exhibitedsimilar runoff coefficients (Kidron et al., 2003). In the case oflarge plots that extended throughout the entire slope and in-cluded also non-crusted (mobile) sand at their top and a patchycrust cover at their midslope (plots, N2, N4 at NFS and S2 andS4 at SFS), only the lower dune slopes with≥ 95% crust coverwas taken as a potentially contributing area (Table I). In thisway, variability that results from variable degrees of crust coverwas avoided.Most plots were equipped with water containers that collected
the total runoff and sediment yield. Four of the plots (N2 and N3at NFS and S2 and S3 at SFS) were also equipped with pressuretransducers (connected to data loggers), as described elsewhere(Kidron and Yair, 1997), allowing for simultaneous rain andrunoff measurements within one minute intervals. These plotsfacilitated the detection of the runoff threshold and velocity,and by comparing the volume of water expected to be gener-ated as runoff (i.e. above the runoff threshold) and the actualrunoff amounts, estimation of the contributing area and thelength of plot participating in runoff yield was possible.While all runoff and sediments from the small plots were
collected within large containers (with a capacity of 60 to120 l), sediments from the large plots were allowed to settle in30 to 120 l containers. Out of the remaining runoff andsediments that were allowed to flow out of the containers10% were captured and the total runoff and sediments werecalculated accordingly. The sediments were collected fromthe containers into buckets, along with the runoff, allowed tosettle for several days (to allow the sediments to sink at the bot-tom of the bucket) and than brought to the laboratory, oven driedat 105�C until reaching a constant weight and then weighed.A total of 10 plots and mini plots at NFS and six plots and
mini plots at SFS have been in operation since the summer of1990, recording all 13 events of runoff during the researchperiod. All plots, i.e. 11 large plots and 16 mini plots wereoperating from January 1992 until the end of the winter of1994, allowing for runoff and sediment collection during sixconsecutive runoff events.In order to determine the impact of the surface upon runoff and
sediment yield, the chlorophyll content of the crusts [which isaspect dependent, see Kidron et al. (2010), and is significantlycorrelated with runoff yield, see Kidron et al. (2003)] wasdetermined. Chlorophyll a was determined following thecollection of 12 samples, 1 cm2 and 1 cm thick, taken from
Copyright © 2011 John Wiley & Sons, Ltd.
each plot in the end of the rainy season. Chlorophyll a(thereafter chlorophyll) was extracted by hot methanol (70 �C,20 minutes) in the presence of magnesium carbonate (MgCO3,0�1% w/v) in sealed test tubes and assayed according to Wetzeland Westlake (1969).
Multiple regression analysis was executed in order toevaluate the main factors responsible for runoff yield, whiletwo-way analysis of variance (ANOVA) was executed in orderto study the relationships between plot size and the chlorophyllcontent to runoff yield.
In addition, in order to evaluate the possibility thatshrubs may serve as runon zones for the non-vegetated upslopeinter-shrub areas (Cerdà, 1997), two 1m-wide transects, oneat SFS and one at NFS were demarcated at the lower flanksof the dune slopes, and (a) the number of shrubs in eachvegetated patch, (b) their diameter, (c) the presence and heightof the under-canopy surface in comparison to its surroundingsand (d) the distance to the nearest vegetated patch weremonitored. Owing to the shrub tendency to accumulate wind-blown minerals and the fact that mounds cannot serve asrunon zones, it was assumed that shrubs having under-canopy mounds would not serve as runon zones. It was alsohypothesized that the patch diameter is limited in size andtherefore allows the runoff to bypass the vegetated patches.
Results
Shrub distribution
Most of the patches (~70%) consisted of a single shrub, withaverage plant number per patch ranging between 1�4 and 1�6(Table III). The average diameter of the patch ranged between0�9 and 1�1m with an average distance to the nearest patchranging between 1�3 and 1�5m. While no significant differencecharacterize the number of the shrubs per patch, patch diame-ter and the distance to the closest patch at NFS and SFS, signif-icant differences characterized the under-canopy mounds, withaverage height at NFS being 0�17 cm in comparison to 0�11 cmat SFS. Yet only 8�8% (for NFS) and 11�9% (for SFS) lackedmounds, pointing to the fact that for ~90% of the cases, un-der-canopy habitat cannot serve as a runon zones.
Rain and runoff characteristics
Rainfall during 1990/1991 and 1991/1992 was above average(119�7 and 131�4mm, respectively), slightly below average
Earth Surf. Process. Landforms, Vol. 36, 1809–1824 (2011)

Table III. Patch properties.
Property SFS(N=42) NFS(N=47)
Number of plants per patch 1�36(0�69) 1�57(1�02)Patch diameter 0�89(0�52) 1�07(0�61)Mound height* 0�11(0�06) 0�17(0�11)Distance from nearest patch 1�51(0�65) 1�33(0�62)Note: NFS, north-facing slopes; SFS, south-facing slopes. Numbers inparentheses indicate one standard deviation. Significant differencesare marked by an asterisk.
eface)
andonestan
darddeviatio
noftheintensity,am
ountan
dduratio
noftherain
spellsduring1990–
1994.
≥9mm/h
≥20mm/h
≥30mm/h
90/91
91/92
92/93
93/94
90–
94
90/91
91/92
92/93
93/94
90-94
90/91
91/92
92/93
93/94
90–9
4
13�2 7�3
11�7 4�3
12�8 7�8
12�2 3�5
12�5 6�0
33�6
11�3
26�8
5�9
35�6 8�6
30�7 6�1
31�9
9�1
44�0 8�6
37�5
2�1
36�0
10�1
40�0
11� 3
39�9 8�6
0�67
0�64
0�47
0�45
0�76
1�76
1�11
1�70
0�66
1�04
1�09
0�83
0�89 0�70
2�33
3�26
1�60
0�80
1�34
1�50
1�26
0�90
1�25
0�07
2�23
3�06
1�60 0
1�61
1�68
3�0 2 �12�3 1�6
2�9 3�1
4�8
6�03�0 2�9
2�1
1�4
1�8 1�1
3�3
3�9
3�0
1�02�4 1�9
1�6
0�9
2�0 0
3�0 3�4
2�5
0�7
2�2
1�9
%)
43�1
44�6
26�9
11�8
37�3
70�0
40�0
50� 0
66�7
59�1
80�0
100�0
50�0
50�0
69�2
1813RUNOFF AND SEDIMENT YIELD: SCALE EFFECT
for 1992/1993 (85�3mm), and substantially below average dur-ing 1993/1994 (46�9mm). Average precipitation during theseyears was 95�8mm, similar to the long-term average of95mm. Over 60% of the 10–20 recorded annual rainstormsyielded less than 5mm of precipitation per rainstorm with1–3 large storms yielding over 20mm a year (Kidron and Pick,2000).The rainstorms were characterized by separate rain segments
of variable intensities (Table IV; Figure 3). Most of the intensitieswere low. Approximately 80% of the intensities were ≤9–10mm/h (Kidron and Pick, 2000). Analysis of all rain seg-ments highlighted the patchiness of each rain segment. As can beseen in Figure 3, consecutive one minute-long intensities of≥ 9mm/h, i.e. capable of runoff generation, were limited in dura-tion, usually lasting for a few minutes only (with the most fre-quent duration lasting for two minutes). Subsequently, runoffgeneration was intermittent, being generated following rainbursts of medium and high intensities (Figure 4). Rain intensi-ties of 9 to 12mm/h, lasting for at least 1–2 minutes, werefound necessary (i.e. ‘above threshold’ intensities) for runoffinitiation once the crusts were saturated (Kidron and Yair,1997). Unsaturated crusts did not yield runoff even duringhigher intensities. Thus for instance, intensities of 24mm/h (0�4mm/min) did not generate runoff during the onset of the stormof January 1–3, 1992, whereas during the course of the storm,intensities of 12mm/h (0�2mm/min) sufficed to produce runoff(Figure 4). Yet, the higher the rain intensity the higher the like-lihood that the rain spell will produce runoff. While on averageonly 37�3% of the medium intensities (defined as≥ 9–10mm/h) produced runoff, 59�1% of the high intensities (≥ 20mm/h)and 69�2% of the convective intensities (≥ 30mm/h) producedrunoff (Table IV).Table IV also depicts the short duration of the intensities
capable of runoff generation. Thus, even if assuming antecedentsurface wetness duration during which surface responsiveness ismaximal and during which intensities as low as 9mm/h suffice ingenerating runoff (Kidron and Yair, 1997), average duration ofeach segment lasted consecutively for only 3�0, 2�4, 2�9 and4�8 minutes, for the years 1990/1991, 1991/1992, 1992/1993and 1993/1994, respectively. When all data were averaged,the duration during which consecutive ‘above threshold’ inten-sities (i.e. which were potentially above the infiltration rates)was only 3�0 minutes. It was only 2�2 minutes for convective(> 30mm/h) intensities.
TableIV.
Average
(inita
lictyp
Prope
rtiesofrain
spells
Rainintensity
(mm/h)
RainAmou
nt(m
m)
Rainduratio
n(m
inutes)
Run
offeven
tsoutofrain
spells(
Calculating plot length that contributes runoff
Calculation of plot area responsible for runoff yield, runoff ve-locities, and the length of plot participating in runoff yield areshown in Table V. Even during the most extreme rain bursts,the actual contributing area was< 18%, and on an averageonly 6�6% (� 5�7%), implying, for most cases, a participationof only 4–6m of the plot length in runoff production, with an
Copyright © 2011 John Wiley & Sons, Ltd. Earth Surf. Process. Landforms, Vol. 36, 1809–1824 (2011)

Figure 3. Histograms showing the duration of consecutive one-minute long≥9mm/h rain spells capable of runoff generation during 1990–1994.Bars represent one standard error.
Figure 4. Rainfall–runoff relation at plot N2 during the rainstorm ofJanuary 1–3, 1992.
1814 G. J. KIDRON
average of 5.0m (� 2.3m). That was so although the plotlength capable of runoff generation (i.e. having a continuouscrust cover of≥ 95%) extended up to 19�0–28�6m (Table I).Based on the plot surface area that contributes runoff and thetime span between the onset of the runoff and the hydrographpeak, estimated runoff velocities ranged between 3�3 and5�5m/min (Table V).
Copyright © 2011 John Wiley & Sons, Ltd.
Runoff and sediment yield at variable size plots
Runoff coefficient and yield as obtained onNFS during three sep-arate rainstorms is shown in Figure 5. Three different cases areshown. During the first case (the rainstorm of 22–23/3/91), 16different rain bursts that exceeded runoff threshold (of 9mm/h)occurred (Table VI). During the second and the third case runoffoccurred as a result of a single rain burst that exceeded runoffthreshold. Whereas this high intensity rain burst hit the wetground during the 17/2/92 (following the 35�7mm rainstorm of6–11/2/92), it fell on a dry ground (after over two months of noprecipitation) during 12.5.93.
A decrease in runoff coefficient and specific yield with anincrease in surface area characterized all rainstorms, with r2
being equal or slightly higher for runoff coefficient than forspecific runoff yield. Both relationships best fitted an exponen-tial equation pointing to a pronounced SE. Whereas runoffcoefficients ranged between 3�9 to 64�3% in the 17/2/92 rain-storm, it ranged between 0�2 to 34�4% in the 12/5/93 rainstormwith mid range of 0�8 to 25�2% in the 22–23/3/91 rainstorm.Significant relationships characterized runoff coefficients andrunoff yield with the plot surface area. However, non-signifi-cant relationships were obtained when runoff yield per plotwidth and the plot surface area were compared, pointing tothe lack of an apparent link between runoff and plot length.
Earth Surf. Process. Landforms, Vol. 36, 1809–1824 (2011)
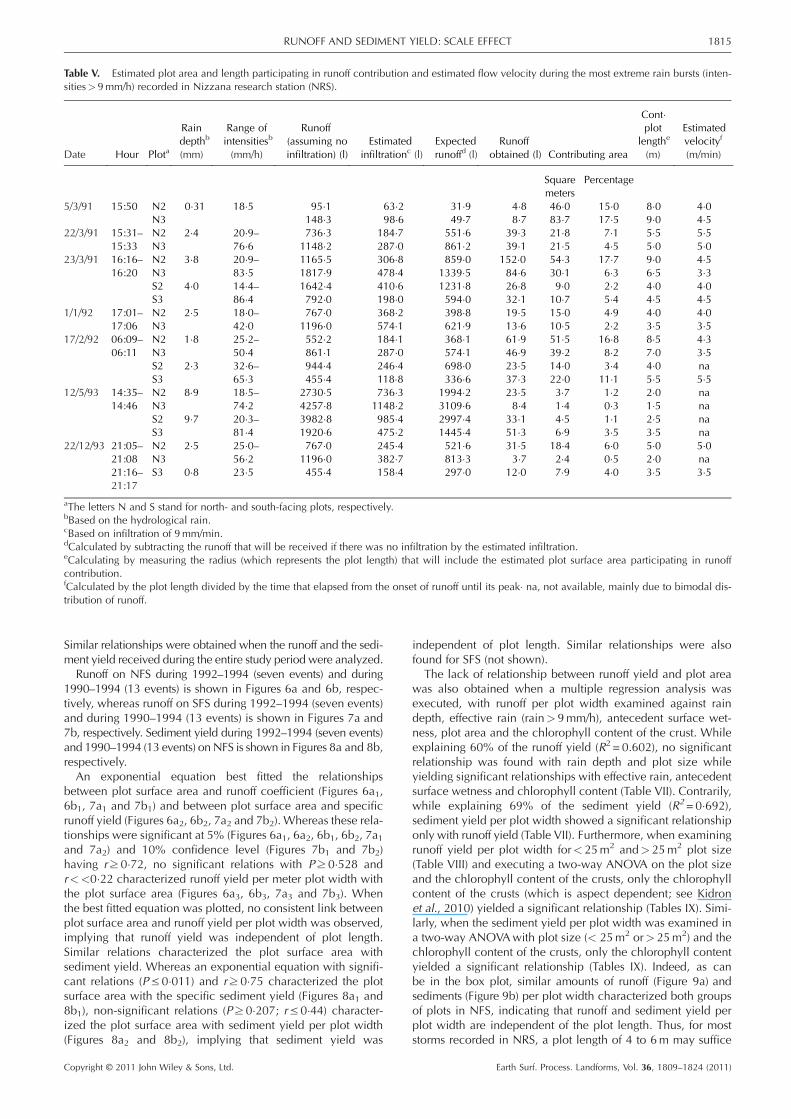
Table V. Estimated plot area and length participating in runoff contribution and estimated flow velocity during the most extreme rain bursts (inten-sities>9mm/h) recorded in Nizzana research station (NRS).
Date Hour Plota
Raindepthb
(mm)
Range ofintensitiesb
(mm/h)
Runoff(assuming noinfiltration) (l)
Estimatedinfiltrationc (l)
Expectedrunoffd (l)
Runoffobtained (l) Contributing area
Cont�plot
lengthe
(m)
Estimatedvelocityf
(m/min)
Squaremeters
Percentage
5/3/91 15:50 N2 0�31 18�5 95�1 63�2 31�9 4�8 46�0 15�0 8�0 4�0N3 148�3 98�6 49�7 8�7 83�7 17�5 9�0 4�5
22/3/91 15:31– N2 2�4 20�9– 736�3 184�7 551�6 39�3 21�8 7�1 5�5 5�515:33 N3 76�6 1148�2 287�0 861�2 39�1 21�5 4�5 5�0 5�0
23/3/91 16:16– N2 3�8 20�9– 1165�5 306�8 859�0 152�0 54�3 17�7 9�0 4�516:20 N3 83�5 1817�9 478�4 1339�5 84�6 30�1 6�3 6�5 3�3
S2 4�0 14�4– 1642�4 410�6 1231�8 26�8 9�0 2�2 4�0 4�0S3 86�4 792�0 198�0 594�0 32�1 10�7 5�4 4�5 4�5
1/1/92 17:01– N2 2�5 18�0– 767�0 368�2 398�8 19�5 15�0 4�9 4�0 4�017:06 N3 42�0 1196�0 574�1 621�9 13�6 10�5 2�2 3�5 3�5
17/2/92 06:09– N2 1�8 25�2– 552�2 184�1 368�1 61�9 51�5 16�8 8�5 4�306:11 N3 50�4 861�1 287�0 574�1 46�9 39�2 8�2 7�0 3�5
S2 2�3 32�6– 944�4 246�4 698�0 23�5 14�0 3�4 4�0 naS3 65�3 455�4 118�8 336�6 37�3 22�0 11�1 5�5 5�5
12/5/93 14:35– N2 8�9 18�5– 2730�5 736�3 1994�2 23�5 3�7 1�2 2�0 na14:46 N3 74�2 4257�8 1148�2 3109�6 8�4 1�4 0�3 1�5 na
S2 9�7 20�3– 3982�8 985�4 2997�4 33�1 4�5 1�1 2�5 naS3 81�4 1920�6 475�2 1445�4 51�3 6�9 3�5 3�5 na
22/12/93 21:05– N2 2�5 25�0– 767�0 245�4 521�6 31�5 18�4 6�0 5�0 5�021:08 N3 56�2 1196�0 382�7 813�3 3�7 2�4 0�5 2�0 na21:16–21:17
S3 0�8 23�5 455�4 158�4 297�0 12�0 7�9 4�0 3�5 3�5
aThe letters N and S stand for north- and south-facing plots, respectively.bBased on the hydrological rain.cBased on infiltration of 9mm/min.dCalculated by subtracting the runoff that will be received if there was no infiltration by the estimated infiltration.eCalculating by measuring the radius (which represents the plot length) that will include the estimated plot surface area participating in runoffcontribution.fCalculated by the plot length divided by the time that elapsed from the onset of runoff until its peak� na, not available, mainly due to bimodal dis-tribution of runoff.
1815RUNOFF AND SEDIMENT YIELD: SCALE EFFECT
Similar relationships were obtained when the runoff and the sedi-ment yield received during the entire study period were analyzed.Runoff on NFS during 1992–1994 (seven events) and during
1990–1994 (13 events) is shown in Figures 6a and 6b, respec-tively, whereas runoff on SFS during 1992–1994 (seven events)and during 1990–1994 (13 events) is shown in Figures 7a and7b, respectively. Sediment yield during 1992–1994 (seven events)and 1990–1994 (13 events) onNFS is shown in Figures 8a and 8b,respectively.An exponential equation best fitted the relationships
between plot surface area and runoff coefficient (Figures 6a1,6b1, 7a1 and 7b1) and between plot surface area and specificrunoff yield (Figures 6a2, 6b2, 7a2 and 7b2). Whereas these rela-tionships were significant at 5% (Figures 6a1, 6a2, 6b1, 6b2, 7a1and 7a2) and 10% confidence level (Figures 7b1 and 7b2)having r≥0�72, no significant relations with P≥ 0�528 andr<<0�22 characterized runoff yield per meter plot width withthe plot surface area (Figures 6a3, 6b3, 7a3 and 7b3). Whenthe best fitted equation was plotted, no consistent link betweenplot surface area and runoff yield per plot width was observed,implying that runoff yield was independent of plot length.Similar relations characterized the plot surface area withsediment yield. Whereas an exponential equation with signifi-cant relations (P≤0�011) and r≥ 0�75 characterized the plotsurface area with the specific sediment yield (Figures 8a1 and8b1), non-significant relations (P≥ 0�207; r≤0�44) character-ized the plot surface area with sediment yield per plot width(Figures 8a2 and 8b2), implying that sediment yield was
Copyright © 2011 John Wiley & Sons, Ltd.
independent of plot length. Similar relationships were alsofound for SFS (not shown).
The lack of relationship between runoff yield and plot areawas also obtained when a multiple regression analysis wasexecuted, with runoff per plot width examined against raindepth, effective rain (rain>9mm/h), antecedent surface wet-ness, plot area and the chlorophyll content of the crust. Whileexplaining 60% of the runoff yield (R2 = 0.602), no significantrelationship was found with rain depth and plot size whileyielding significant relationships with effective rain, antecedentsurface wetness and chlorophyll content (Table VII). Contrarily,while explaining 69% of the sediment yield (R2=0�692),sediment yield per plot width showed a significant relationshiponly with runoff yield (Table VII). Furthermore, when examiningrunoff yield per plot width for< 25m2 and> 25m2 plot size(Table VIII) and executing a two-way ANOVA on the plot sizeand the chlorophyll content of the crusts, only the chlorophyllcontent of the crusts (which is aspect dependent; see Kidronet al., 2010) yielded a significant relationship (Tables IX). Simi-larly, when the sediment yield per plot width was examined ina two-way ANOVAwith plot size (< 25m2 or> 25m2) and thechlorophyll content of the crusts, only the chlorophyll contentyielded a significant relationship (Tables IX). Indeed, as canbe in the box plot, similar amounts of runoff (Figure 9a) andsediments (Figure 9b) per plot width characterized both groupsof plots in NFS, indicating that runoff and sediment yield perplot width are independent of the plot length. Thus, for moststorms recorded in NRS, a plot length of 4 to 6m may suffice
Earth Surf. Process. Landforms, Vol. 36, 1809–1824 (2011)

Figure 5. Runoff coefficient (a), runoff yield per square meter (b) and runoff yield per plot width (c) as obtained on plot N2 at NFS during 22–23/3/91,17/2/92 and 12/5/93 rainstorms. Please note the different scale of the y-axis.
Table VI. Properties of three runoff-induced rainstorms.
DateDuration
(h)Amount(mm)
Rain bursts≥9mm/h
Number per storm Duration (min) Rain amounts (mm) Intensities (mm/h) Average intensity (mm/h)
22–23/3/91 41 38�8 10 3–7 0�6–3�7 9–72 9�0–31�717/2/92 0�5 2�2 1 3 1�7 24–48 34�012/5/93 0�5 9�7 1 16 9�3 9–72 34�9
1816 G. J. KIDRON
to facilitate a good estimation concerning the expected annualrunoff and sediment yield at the footslopes (Table V).
Discussion
Only small parts of the plots participated in runoff production.Runoff yield was confined to the bottom plot sections, withmaximal length participating in runoff production of≤9m,and average contributing length of 5�0m (� 2�3m) (Table V).Average flow velocity in all runoff events ranged between 3�3and 5�5m/min, with an average of 4�3 (� 0�7) m/min, similarto flow velocities reported in the literature of 4 to 5m/min(Kirkby and Chorely, 1967).Overall, a consistent pattern of behavior characterized the
plots. Higher frequencies of runoff production and higher pro-portions of the plot participated in runoff production at NFS,in agreement with the higher crust biomass (Kidron et al.,2003) and longer surface moisture retention that facilitaterapid pore clogging (Kidron, 1999). Within each exposure,the contributing area and the plot length participating in runoff
Copyright © 2011 John Wiley & Sons, Ltd.
production in each rain burst was higher in N2 and S3 thanin N3 and S2, respectively. This fact is mainly attributed tovariability in the plot microrelief, which was found to signifi-cantly affect runoff yield even at small differences of only1mm/cm (Kidron, 2007). Thus, the smoother surfaces thatcharacterize N2 and S3 (Table I) which also resulted in higherflow velocities at these plots (Table V), are seen responsiblefor the higher runoff yield of plots N2 and S3. The only devia-tion occurred during the 5/3/91 rainstorm, explained by the factthat the 5/3/91 rainstorm succeeded the 3�5mm rainstorm of27–28/2/91. Presumably, whereas the N2 surface already driedout following the rainstorm of 27–28/2/91, the steeper bottompart of N3 (20º as opposed to 12º of N2), retained some ofthe moisture. Reaching surface saturation more rapidly, plotN3 thus produced higher runoff yield than N2.
A pronounced SE characterized runoff coefficients and thespecific runoff yield. SE characterized all rainstorms, regardlessof the duration of the runoff-induced rain spells, explained bythe short rain burst capable of runoff generation (Kidron andYair, 1997, 2002). The data presented herein may provide themissing link noted by Puigdefábregas (2005) who commented
Earth Surf. Process. Landforms, Vol. 36, 1809–1824 (2011)

Figure 6. Runoff during seven events (based on plots 1–7 and mini plots VII–XVI) during 1992–1994 (I) and 13 events (based on plots 1–6 and miniplots VII–X) during 1990–1994 (II), as presented in volume (a), volume per square meter (b) and volume per meter plot width (c) on NFS. For plot andmini plots numbers and characteristics see Tables I and II. For location see Figure 1.
1817RUNOFF AND SEDIMENT YIELD: SCALE EFFECT
that the rain-induced SE was hitherto shown only in a theoreti-cal model. The current data attest to the fact that SE is an inher-ent characteristic of the rain properties. Yet, one should notethat the slope section that participates in runoff and sedimentproduction reflect the regional rain regime. Thus, monsoonalsummer rains in south-western United States or in Africa mayhave substantially longer ‘above-threshold’ rain spells capableof runoff generation, and as a result the slope section that parti-cipates in runoff generation may be substantially longer. Thus,according to van de Giesen et al. (2000) rain bursts capableof runoff generation (50–150mm/h) may last between 15 and40 minutes.While it is argued that the nature of the ‘above threshold’ rain
burst may be principally responsible for SE (Kidron and Yair,2002, Wainwright and Parsons, 2002) surface properties mayaffect its magnitude, as was evident during the three runoffevents shown in Figure 5. Thus, a relatively low range of runoffcoefficients characterized the 17/2/91 rainstorm explained bythe high responsiveness of the wet surface that resulted inimmediate runoff. On the contrary, although characterized bythe longest medium and high intensity rain burst, a relativelyhigh range characterized the 12/5/93 rainstorm which was alsocharacterized by a very small slope length that contributedrunoff, presumably due to the low responsiveness of the drysurface to runoff generation.The spotty distribution of the shrubs in NRS had only a small
effect on the magnitude of the SE. Approximately 90% of theshrubs had under-canopy mounds that did not facilitate runoff
Copyright © 2011 John Wiley & Sons, Ltd.
contribution to the under-canopy loci. Furthermore, the major-ity (60%) of the shrubs that did not have under-canopy moundshad a single stem and therefore their effectiveness in haltingrunoff would have been highly limited. Small terracettes andsediment depositions noted in other zones (Sanchez andPuigdefábregas, 1994; Bergkamp et al., 1999) were not ob-served. This was supported by chlorophyll measurements of thecrusts. Following (a) the close link between crust type and wetnessduration (Kidron et al., 2009, 2010), (b) the rapid recovery ratesof the crusts (Kidron et al., 2008), and (c) the expected outcomethat the upslope section of the shrubs should be wetter oncereceiving additional water (Cammeraat ELH, 2004), any contri-bution of water at the upslope position of the shrub shouldresult in high-chlorophyll crusts at these upslope loci. Thishowever was not the case (Kidron, unpublished). High chloro-phyll crusts characterized the entire under-canopy mound andconsequently also participated in runoff contribution (Kidron,1995). But as specifically shown (Kidron, 2009, 2010), thiswas not connected to runoff events but rather to lower evapora-tion rates that characterized the under-canopy habitat and theresultant prolonged wetness duration at this habitat. Indeed,contrary to much clustered distribution of vegetation in wetterareas which provide barriers for runoff and sediments, thiswas not the case in NRS. Whereas banded vegetation (Valentinand Herbès, 1999; Valentin et al., 1999) or vegetation havingclumps (Boer and Puigdefábregas, 2005) or tussocks (Cerdà,1997), may provide an efficient barrier to runoff and sedimentyield, the small diameter of the plant patches in NRS
Earth Surf. Process. Landforms, Vol. 36, 1809–1824 (2011)

Figure 7. Runoff during seven events (based on plots 8–11 and mini plots I–VI) during 1992–1994 (I) and 13 events (based on plots 8–11 and miniplots I and II) during 1990–1994 (II), as presented in volume (a), volume per square meter (b) and volume per meter plot width (c) on SFS. For plot andmini plots numbers and characteristics see Tables I and II. For location see Figure 1.
1818 G. J. KIDRON
(0�9–1�1m in comparison to 2–5m in Spain for instance; seeBergkamp et al., 1999) do not provide an efficient barrier andthus their disruption to surface connectivity is rather limited.The confinement of runoff (and hence sediment yield) to a
narrow belt at the footslopes was supported by the fact thatno significant correlations were found between runoff or sedi-ment yield per meter width with plot surface area. The datathus suggested that runoff yield per meter width is independentof plot size and hence of plot length. This implies that rain andsurface characteristics determine the actual slope lengthresponsible for runoff (and hence sediment) yield. The currentdata are in agreement with data presented by Bracken andKirkby (2005) that showed that surface characteristics, asreflected by the lithology, determines sediment yield. They alsoshowed that the increase in sediment transport by surfacerunoff increases until a point where erosion is high enough toform rills and gullies, giving additional credence to the currentfindings that showed the limited travel distance of surfacerunoff and hence of runoff-induced sediments.The confinement of the runoff contributing areas to the
bottom slope sections has been long noted in the literature inarid and humid regions. Whether referring directly (Freeze,1972; Branson and Owen, 1979; Dunne et al., 1991; Govers,1991; Poesen, 1992; van Wesemael et al., 1998; Cerdanet al., 2004), or indirectly (Betson, 1964; Kirkby and Chorely,1967; Dunne and Black, 1970; Campbell, 1977; Onstadet al., 1979) to SE, the subject was mentioned in a range ofenvironments. Likewise, most researchers agree that sediment
Copyright © 2011 John Wiley & Sons, Ltd.
yield per unit area decreases with surface area or slope length(Langbein and Schumm, 1958; Wischmeier and Smith, 1978;Walling, 1983; Singh et al., 1985; Lal, 1994; Walling andWebb, 1996). Thus, the factor L in the Universal Soil LossEquation (USLE), and its revised form (RUSLE), is consideredthe most problematic of all (Renard et al., 1994). Although theequation predicts an increase in soil loss with slope length, theincrease calculated for each percent of change for this variableis only a quarter of that of the slope angle for instance (Renardet al., 1994), and the value calculated for the bottom slopesegment is larger than the average by 50% (Toy and Osterkamp,1995). Furthermore, Wischmeier and Smith (1978) admit thatslope length does not necessarily increase soil loss in theoriginal User Manuel. Singh et al. (1985) reached similarconclusions following 15 years of erosion measurements.
Many reasons were seen responsible for the SE, especiallywhen large areas were considered. Thus, Langbein andSchumm, (1958) raised doubts concerning the ability of asingle rainstorm to cover the whole drainage basin. They alsopostulated that the lower angles of large basins may decreaserunoff yield. Most researchers pointed to the fact that higherstorage capability is available with an increasing surface area(Wischmeier and Smith, 1978; Walling, 1983; Scoging, 1989;van Wesemael et al., 1998), whereas others attributed theresults to an increase in infiltration losses (Amerman andMcGuinness, 1968; Boers et al., 1986; Abu-Awwad andShatanawi, 1997). Govers (1991) attributed the high infiltrationto larger macro pores available along runoff paths, while
Earth Surf. Process. Landforms, Vol. 36, 1809–1824 (2011)

Figure 8. Sediment yield during seven events (based on plots 1–7 and mini plots VII–XVI) during 1992–1994 (I) and 13 events (based on plots 1–6and mini plots VII–X) during 1990–1994 (II), as presented in weight (a), weight per square meter (b) and weight per meter plot width (c) on NFS. Forplot and mini plots numbers and characteristics see Tables I and II. For location see Figure 1.
Table VII. Multiple regression analysis between (a) runoff per plot width and (b) sediment yield per plot width and between rain depth, effective rain(> 9mm/h), antecedent surface wetness, plot area, and the chlorophyll content of the crusts.
Variables Unstandardized coefficients Standardized coefficients P-Value
B Standard error Beta(a) Runoff per plot widthRain depth �0�007 0�035 �0�026 0�838Effective rain 0�329 0�099 0�419 0�002Antecedent surface wetness 5�211 1�013 0�504 <0�001Plot area 0�137 0�820 0�016 0�868Chlorophyll 0�083 0�039 0�204 0�040(b) Sediment yield per plot width and between rain depthRunoff 35�00 5�28 0�817 <0�001Rain depth 0�44 1�26 0�037 0�728Effective rain �5�96 3�94 �0�177 0�137Antecedent surface wetness 51�45 45�52 0�116 0�264Plot area �58�90 29�36 �0�158 0�057Chlorophyll 0�89 1�48 0�051 0�551
1819RUNOFF AND SEDIMENT YIELD: SCALE EFFECT
Dunne and Dietrich (1980b) suggested that with runoff thick-ness more elevated areas (having higher infiltration capacity)are inundated. Dunne and Dietrich (1980b) also postulated thatthe increase in infiltration may result from the destruction of thephysical crust by rain bursts of high kinetic energy, whereasPoesen (1992) suggested that it may stem from the extra hy-draulic head.Our data suggest that the SE is an inherent characteristic of
the rain properties and of the method employed in which runoffcollection (or accumulation) is taking place at a given pointacross the slope (Lane et al., 1978; Scoging, 1989). The inter-mittent character of the runoff-induced medium and high-in-tensity rain spells causes repeated temporally disconnectedrunoff flows. Consequently, areas closer to the collecting buck-ets (or to the gully or channel) contribute most of the runoff
Copyright © 2011 John Wiley & Sons, Ltd.
while runoff produced at the upper slope sections may notreach the buckets as it may infiltrate on the way down slope,as was also previously postulated (Lavee, 1982; Kosovsky,1994; Kidron, 1995; Kidron and Yair, 1997; Wainwright andParsons, 2002). Yet, while most researchers maintain thatshrubs may serve as runon zones for the upslope inter-shrubareas (with the inter-shrub areas serving as runoff zones), thepresence of wind-blown minerals at the shrub under-canopies,which result in under-canopy mounds, exclude such a possibil-ity in ~90% of the cases. Runoff may thus bypass the mounds inits route down the slopes. These results, which were also veri-fied by field observations following the use of dye during natu-ral runoff events (Kidron, unpublished) imply that only a verysmall percentage of the shrubs may potentially serve as runonzones. Consequently, lack of connectivity may principally
Earth Surf. Process. Landforms, Vol. 36, 1809–1824 (2011)

Table VIII. Runoff (a) and sediment yield (b) per plot width of <25m2
and >25m2 plots.
Aspect Plot
< 25m2 > 25m2
(a) Runoff per plot widthNFS Mean 4�1 5�1
Standard deviation (4�4) (6�5)N 13 13
SFS Mean 2�0 1�6Standard deviation (2�8) (1�8)N 13 13
(b) Sediment yield per plot widthNFS Mean 180�3 175�5
Standard deviation (248�8) (222�6)N 13 13
SFS Mean 108�7 26�2Standard deviation (143�1) (34�2)N 13 13
Note: NFS, north-facing slopes; SFS, south-facing slopes.
Table IX. Two-way ANOVA for (a) runoff per plot width and(b) sediment yield per plot width with plot size and the chlorophyllcontent of the crusts.
Source of variation SS df F P-Value
(a) Runoff per plot widthPlot size 0�93 1 0�051 0�823Chlorophyll 100�75 1 5�509 0�023Plot size� chlorophyll 5�77 1 0�315 0�577Within 877�80 48Total 985�20 51(b) Sediment yield per plot widthPlot size 24798 1 0�745 0�392Chlorophyll 158729 1 4�770 0�034Plot size� chlorophyll 19623 1 0�590 0�446Within 1597190 48Total 1800343 51
igure 9. Runoff (a) and sediment yield (b) per plot width of mini plots25m2) and large plots (> 25m2) at NFS as shown by box plots.
1820 G. J. KIDRON
result from the rain properties, i.e. the short duration of themedium and high rain spells.The cessation of runoff mostly within one minute following
the cessation of the medium and high intensity rain spells (asmonitored by us in NRS) and the flow velocity (3�3–5�5m/min)implies that runoff generated during the medium and high rainburst at the slope sections that are 3 to 6m above thecollecting buckets will not reach the buckets following thecessation of the rain burst, being thus responsible for the SE. Thisinherent drawback is not necessarily linked to heterogeneousfield compartments (with alternating runoff and runon zones)as is evident in the current case. However, SE may be accentu-ated by slopes having clusters of shrubs that may serve as runonzones (Morin et al., 1993; Kosovsky, 1994; Sanchez and Puig-defábregas, 1994; Cerdà, 1997; Cerdà and Lasanta, 2005). Inthe Mediterranean zone where large tussocks (Cerdà, 1997)or plant clumps of 2 to 5m each predominate (Bergkampet al., 1999), connectivity may indeed be highly limited.Thus, based on the present research and a large bulk of
literature, and regardless of surface properties, it is argued thatthe presentation of runoff and sediment yield per plot surfacearea may need re-evaluation. It is suggested that especially inarid zones that are characterized by intermittent rain spells
Copyright © 2011 John Wiley & Sons, Ltd.
F(<
(Bell, 1979), runoff and sediment yield presentation shouldavoid a priori assumptions concerning the contributing lengthof the plot, an assumption embedded within the practice ofrunoff presentation as runoff coefficient or runoff per squaremeter. Runoff may rather be presented in volume per plotwidth, as also suggested by Dunne and Dietrich (1980a),whereas sediment yield may rather be presented in weightper unit width, as was also suggested by Luk and Morgan(1981), Rutin (1983), and Nearing et al. (1994). These conclu-sions are in agreement with Kirkby et al. (2002) that stated thatnot the slope length but rather the distance to the nearestchannel determines runoff yield.
This conclusion may also be further supported by practicalconsiderations:
(a) The conventional presentation of runoff in volume, volumeper unit area or as runoff coefficients, is highly dependentupon the plot surface area (Evenari et al., 1975; Kosovsky,1994; Kidron, 1995). One may face severe problems whencomparing different catchments with different surfacecharacteristics, each subjected to different rain properties.This last point is further complicated by the fact that thereis no standard plot size for runoff measurements (Lal,1994). Any reliable comparison between different size plotsin different areas should therefore consider the hydrologicalbehavior of the plots and the resultant expected asymptoticdecline of runoff with plot size. Scarcity of field data mayimpose severe limitations on such a comparison. The presen-tation of runoff in volume per plot width may provide a moreaccurate value for comparison. The above reasons are alsoapplicable for sediment measurements.
(b) Extrapolation of runoff yield may be of paramount impor-tance in arid regions, attempting to predict flood volumes.However, when extrapolating runoff and sediment yielddata presented in mass per unit area to large surface areas,severe problems may be encountered. Multiplying valuesobtained in small runoff plots to large surface areas willtend to result in an overestimation of the expected volumes(Wischmeier and Smith, 1978; Campbell, 1985; Scoging,1989; Govers, 1991; Lal, 1994; Boix-Fayos et al., 2006).
Earth Surf. Process. Landforms, Vol. 36, 1809–1824 (2011)

1821RUNOFF AND SEDIMENT YIELD: SCALE EFFECT
The problem is intensified as different size plots may leadto different estimations. Extrapolation based on runoff vol-ume (and sediment yield weight) per unit width will resultin a more accurate estimation. If for instance we were to es-timate runoff and sediments reaching the stretch of thedune covered by the large plots of our study site (extendingfor 81�1 and 60�9m at the footslopes of NFS and SFS, re-spectively) from 25m long slopes, then, the total volumeexpected based on the specific yield of all the plots wouldhave been by a factor of 4�2 to 5�6 and 4�4 to 4�5 higher forrunoff and sediment yield, respectively, than that based onthe volume per slope width (Tables X and XI). Interestingly,if we were to extrapolate the volume of runoff and sedi-ments based on the mini plots only, then the volumeexpected based on specific yield would have been by afactor of 10�9 to 11�8 and 10�7 to 11�7 higher for runoff asediment yield, respectively, than that extrapolated by vol-ume yield per meter width. In contrast, when comparingthe estimations to the actual amounts of runoff or sedimentscaptured, the estimation based on runoff and sediment
Table XI. Actual and expected sediment yield based on specific sediment ythe mini plots in Nizzana research station (NRS).
Plots examined Aspect
Calculated sedimentyielda
Actualsedimentscapturedb
See
In g/m2 In g/mBasedon g/m
All plots NFS 131�4 748�2 57641 26647SFS 19�3 107�2 5199 2935Total 29582
Mini plots NFS 261�8 614�5 53084SFS 37�6 80�2 5726Total 58810
Note: Calculations were done for 81�1m and 60�9m long stretches that extlength of 25m for each aspect.aFor the calculation for specific runoff or runoff yield per slope width, the annbFor the calculation of the actual runoff captured, all data for all the plots werethe average annual value.
Table X. Actual and expected runoff yield based on specific runoff (l m–2) aNizzana research station (NRS).
Plots examined Aspect
Calculated runoffyielda
Actualrunoff
capturedb
Runoff
In lm–2 In lm–1Basedon lm–2
All plots NFS 3�13 18�63 1331�7 6346�1SFS 1�24 5�57 317�4 1887�9Total 8234�0
Mini plots NFS 5�98 13�69 12124�5SFS 3�02 6�41 4598�0Total 16722�5
Note: Calculations were done for 81�1m and 60�9m long stretches that extlength of 25m for each aspect.aFor the calculation for specific runoff or runoff yield per slope width, the annbFor the calculation of the actual runoff captured, all data for all the plots werethe average annual value.
Copyright © 2011 John Wiley & Sons, Ltd.
yield per plot width deviated only slightly from the actualamounts captured by a factor of 1�1 to 1�3.
(c) Data presentation per unit width may also be more practi-cal for the design of tree planting, enabling a good estima-tion of runoff expected at the footslopes. Such projectswere designed in the Negev Desert, utilizing runoff waterreaching the footslopes for tree growth (Shanan et al.,1970).
The above theoretical and practical considerations may also beof interest in humid environments where relatively small sec-tions of the watershed were found to contribute runoff. Con-trary to the Hortonian overland flow that characterized thearid and the semi-arid regions (associated also with the PartialArea Contribution model; see Betson, 1964; Ragan, 1968), sat-uration overland flow, associated with the Variable Source Areamodel (Hewlett and Hibbert, 1967; Kirkby and Chorely, 1967;Dunne et al., 1975) takes place in humid areas. Since runoffgeneration is confined to saturated areas at the footslopes andalong the river channel, which expand and contract in
ield (in g/m2) and sediment yield per plot width (in g/m) of the large and
dimentsxpected
Ratio
Between sediment� yieldexpected based on g/m2
to that of g/m
Between actual toexpected sediments
2Basedon g/m
Basedon g/m2
Basedon g/m
4 60677 4�39 4�62 1�054 6525 4�50 5�65 1�268 67202 4�40 4�71 1�070 49832 10�651 4882 11�731 54714 10�75end respectively along the footslopes of NFS and SFS assuming a plot
ual average for each plot was calculated and then averaged for all plots.summed up over the entire research period and then divided by four for
nd runoff yield per plot width (lm–1) of the large and the mini plots in
expected
Ratio
Between runoffexpected based
on lm–2 to that of lm–1
Between actual toexpected runoff
Basedon lm–1
Basedon lm–2
Basedon lm–1
1510�9 4�20 4�77 1�13339�2 5�57 5�95 1�071850�1 4�45 4�99 1�121110�3 10�92390�4 11�781500�7 11�14
end respectively along the footslopes of NFS and SFS assuming a plot
ual average for each plot was calculated and then averaged for all plots.summed up over the entire research period and then divided by four for
Earth Surf. Process. Landforms, Vol. 36, 1809–1824 (2011)

1822 G. J. KIDRON
accordance with the precipitation amount (Dunne and Black,1970), presentation of runoff and sediment yield per plot widthin humid areas should also be considered.
Acknowledgments — The research was supported by grant#00R-009 of the International Arid Land Consortium (IALC),by The Arid Ecosystem Research Center of the HebrewUniversity and MINERVA and by DISUM. An earlierversion of this paper that proposed a theoretical model was firstsubmitted 12 years ago. The author would like to thank A. Yairfor his support in the early stages of the research, E. Sachs forassistance, M. Kidron for drawing, and C.A. Kidron for the edit-ing. The author would also like to thank two anonymousreviewers for their most helpful comments.
ReferencesAbrahams AD, Parsons AJ, Luk S. 1988. Hydrologic and sedimentresponses to simulated rainfall on desert hillslops in southernArizona. Catena 15: 103–117.
Abrahams AD, Parsons AJ, Wainwright J. 1995. Controls and determi-nation of resistance to overland flow on semiarid hillslopes, WalnutGulch. Journal of Soil and Water Conservation 50: 457–460.
Abu-Awwad AM, Shatanawi MR. 1997. Water harvesting and infiltra-tion in arid areas affected by surface crust: example from Jordan.Journal of Arid Environments 37: 443–452.
Aguiar MR, Sala OE. 1999. Patch structure, dynamics and implicationsfor the functioning of arid ecosystems. TREE 14: 273–277. DOI.10.1016/S0169-5347(99)01612-2
Amerman CR, McGuinness JL. 1968. Plot and small watershed runoff:its relations to larger areas. Transactions of the ASAE 10: 464–466.
Bell FC. 1979. Precipitation. In Arid Land Ecosystems: Structure,Functioning and Management, Goodall DW, Perry RA (eds).Cambridge University Press: Cambridge; 373–392.
Bergkamp G, Cammeraat ELH, Martinez-Fernandez J. 1996. Watermovement and vegetation patterns shrubland and an abandonedfield in two desertification-threatened areas in Spain. Earth SurfaceProcesses and Landforms 21: 1073–1090. DOI. 10.1002/(SICI)1096-9837(199612)21:12<1073::AID-ESP640>3.0.CO;2-8
Bergkamp G, Cerdà A, Imeson AC. 1999. Magnitude-frequencyanalysis of water redistribution along a climate gradient in Spain.Catena 37: 129–146. DOI. 10.1016/SO341-8162(98)00058-7
Betson RP. 1964. What is watershed runoff? Journal of GeophysicalResearch 69: 1541–1552.
Boer M, Puigdefábregas J. 2005. Effects of spatially structured vegeta-tion patterns on hillslopes in a semiarid Mediterranean environment:a simulation study. Earth Surface Processes and Landforms 30: 149–167.
Boers ThM, Zondervan K, Ben–Asher J. 1986. Micro-catchment waterharvesting (MCWH) for arid zone development. Agricultural WaterManagement 12: 21–39.
Boix-Fayos C, Martinez-Mena M, Arnau-Rosalén E, Calvo-Cases A,Castillo V, Albaladejo J. 2006. Measuring soil erosion by field plots:understanding the source of variation. Earth-Science Reviews 78:267–285. DOI. 10.1016/j.earscirev.2006.05.005
Bracken LJ, Cox NJ, Shannon J. 2008. The relationship between rainfallinputs and flood generation in south-east Spain. HydrologicalProcesses 22: 683–696. DOI. 10.1002/hyp.6641
Bracken LJ, Kirkby MJ. 2005. Differences in hillslope runoff and sedimenttransport rates within two semi-arid catchments in southeast Spain.Geomorphology 68: 183–200. DOI. 10.1016/geomorph.2004.11.013
Branson FA, Owen JB. 1979. Plant cover, runoff, and sediment yieldrelationships on Mancos Shale in western Colorado.Water ResourcesResearch 6: 783–790.
Bull IJ, KirkbyMJ, Shannon J, Hooke JM. 2000. The impact of rainstormonfloods in ephemeral channels in southeast Spain. Catena 38: 191–209.DOI. 10.1016/S0341-8162(99)00071-5
Cammeraat ELH. 2002. A review of two strongly contrasting geomor-phological systems within the context of scale. Earth SurfaceProcesses and Landforms 27: 1201–1222. DOI. 10.1002/esp.421
Cammeraat ELH. 2004. Scale dependent thresholds in hydrologicaland erosion response of a semi-arid catchment in southeast Spain.
Copyright © 2011 John Wiley & Sons, Ltd.
Agriculture, Ecosystems and the Environment 104: 317–332. DOI.10.1016/j.agee.2004.01.032
Campbell IA. 1977. Sediment origin and sediment load in a semi-ariddrainage basin. In Geomorphology in Arid Regions, Doehring DO(ed.). State University of New York: New York; 168–185.
Campbell IA. 1985. The partial area concept and its application to theproblem of sediment source area. In Soil Erosion and Conservation,El-Swaify SA, Moldenhauer WC, Andrew L (eds). Soil ConservationSociety of America: Ankeny, IA; 128–138.
Casermeiro MA, Molina JA, de la Cruz Caravaca MT, Hernando-CostaJ, Hernando-Massanet MI, Moreno PS. 2004. Influence of scrubs onrunoff and sediment loss in soils of Mediterranean climate. Catena57: 91–107. DOI. 10.1016/S0341-8162(03)00160-7
Ceballos A, Schnabel S. 1998. Hydrological behavior of a small catch-ment in the Dehesa landuse system (Extremadura, SW Spain). Journalof Hydrology 210: 146–160. DOI. 10.1016/s0022-1694(98)00180-2
Cerdà A. 1997. The effect of patchy distribution of Stipa tenacissima L.on runoff and erosion. Journal of Arid Environments 36: 37–51.
Cerdà A, Lasanta T. 2005. Long-term erosional responses after fire in thecentral Spanish Pyrenees, 1. Water and sediment yield. Catena 60:59–80. DOI. 10.1016/j.catena.2004.09.006
Cerdan O, Le Bissonnais Y, Govers G, Lecomte V, van Oost K, CouturierA, King C, Dubreuil N. 2004. Scale effect on runoff from experimen-tal plots to catchments in agricultural areas in Normandy. Journal ofHydrology 299: 4–14. DOI. 10.1016/j.jhydrol.2004.02.017
de Ploey J. 1977. Some experimental data on slopewash and windaction with reference to Quaternary morphogenesis in Belgium.Earth Surface Processes and Landforms 2: 101–115.
Dunne T, Black RD. 1970. Partial area contribution to storm runoffin a small New England Watershed. Water Resources Research 6:1296–1311.
Dunne T, Dietrich WE. 1980a. Experimental study of Horton overlandflow on tropical hillslopes, 1. Hydraulic characteristics and hillslopehydrographs. Zeitschrift für Geomorphologie Supplement 35: 60–80.
Dunne T, Dietrich WE. 1980b. Experimental study of Horton overlandflow on tropical hillslopes, 1. Soil conditions, infiltration and frequencyof runoff. Zeitschrift für Geomorphologie Supplement 35: 40–59.
Dunne T, Moore TR, Taylor CH. 1975. Recognition and prediction ofrunoff producing zones in humid regions.Hydrology Science Bulletin20: 305–327.
Dunne T, Zhang W, Aubry BF. 1991. Effects of rainfall, vegetation, andmicrotopography on infiltration and runoff. Water Resources Re-search 27: 2271–2285. DOI. 10.1029/91WR01585
Evenari M, Shanan L, Tadmor N. 1975. The agricultural potential ofloess and loess-like soils in arid and semi-arid zones. In Proceedingof the International Seminar of Land Evolution in Arid and Semi-AridZones of Latin America. IILA, Rome; 489–507.
Freeze BA. 1972. Role of subsurface flow in generating surface runoff 2.Upstream source area. Water Resources Research 8: 1272–1283.
Frot E, vanWesemael B, Solé-Benet A, House M. 2008. Water harvestingpotential in function of hillslope characteristics: a case study from theSierra de Gador, Almeria Province, south-east Spain. Journal of AridEnvironments 72: 1213–1231. DOI. 10.1016/j.jaridenv.2007.12.009
Gomi T, Sidle RC, Ueno M, Miyata S, Kosugi K. 2008. Characteristics ofoverland flow generation on steep forested hillslopes of central Japan.Journal of Hydrology 361: 275–290. DOI. 10.1016/j.jhydrol.2008.07.045
Govers G. 1991. A field study on topographical and topsoil effects onrunoff generation. Catena 18: 91–111. DOI. 10.1016/0341-8162(91)90009-M
Hewlett JD, Hibbert RA. 1967. Factors affecting the response of smallwatersheds to precipitation in humid areas. . Proceedings of the Inter-national Symposium on Forest Hydrology, 1965 Pennsylvania StateUniversity: Pergamon; 275–290.
Kidron GJ. 1995. The Impact of Microbial Crust upon Rainfall–Runoff–Sediment Yield Relationships on Longitudinal Dune Slopes, Nizzana,Western Negev Desert, Israel, PhD Thesis, The Hebrew University,Jerusalem (Hebrew with English summary).
Kidron GJ. 1999. Differential water distribution over dune slopes asaffected by slope position and microbiotic crust, Negev Desert,Israel. Hydrological Processes 13: 1665–1682.
Kidron GJ. 2007. Millimeter-scale microrelief affecting runoff yield overmicrobiotic crust in the Negev Desert. Catena 70: 266–273. DOI.10.1016/j.catena.2006.08.010
Earth Surf. Process. Landforms, Vol. 36, 1809–1824 (2011)

1823RUNOFF AND SEDIMENT YIELD: SCALE EFFECT
Kidron GJ. 2009. The Effect of shrub canopy upon surface temperaturesand evaporation in the Negev Desert. Earth Surface Processes andLandforms 34: 123–132. DOI. 10.1002/esp.1706
Kidron GJ. 2010. Under-canopy microclimate within sand dunes in theNegev Desert. Journal of Hydrology 392: 201–210. DOI. 10.1016/j.jhydrol.2010.08.011
Kidron GJ, Pick K. 2000. The limited role of localized convectivestorms in runoff production in the western Negev Desert. Journal ofHydrology 229: 281–289. DOI. 10.1016/S0022-1694(99)00204-8
Kidron GJ, Vonshak A, Abeliovich A. 2008. Recovery rates of microbioticcrusts within a dune ecosystem in the Negev Desert. Geomorphology100: 444–452. DOI. 10.1016/j.geomorph.2008.01.012
Kidron GJ, Vonshak A, Abeliovich A. 2009. Microbiotic crusts asbiomarkers for surface stability and wetness duration in the NegevDesert. Earth Surface Processes and Landforms 34: 1594–1604.DOI. 10.1002/esp.1843
Kidron GJ, Vonshak A, Dor I, Barinova S, Abeliovich A. 2010. Propertiesand spatial distribution of microbiotic crusts in the Negev Desert.Catena 82: 92–101. DOI. 10.1016/j.catena.2010.05.006
Kidron GJ, Yair A. 1997. Rainfall–runoff relationships over encrusteddune surfaces, Nizzana, western Negev, Israel. Earth Surface Processesand Landforms 22: 1169–1184. DOI. 10.1002/esp.1532
Kidron GJ, Yair A. 2001. Runoff-induced sediment yield from duneslopes in the Negev Desert, 1: quantity and variability. Earth SurfaceProcesses and Landforms 26: 461–474. DOI. 10.1002/esp.191
Kidron GJ, Yair A. 2002. Confinement of runoff and sediment yield tothe footslopes – possible implications. Israel Geographical UnionAnnual Meeting, Bar-Ilan University, Ramat-Gan, Israel; 71.
Kidron GJ, Yair A, Vonshak A, Abeliovich A. 2003. Microbioticcrust control of runoff generation on sand dunes in the NegevDesert. Water Resources Research 39: 1108–1112. DOI. 10.1029/2002WR001561.2003
Kirkby MJ, Bracken L, Reaney S. 2002. The influence of landuse, soilsand topography on the delivery of hillslope runoff to channels in SESpain. Earth Surface Processes and Landforms 27: 1459–1473.DOI.10.1002/esp.441
Kirkby MJ, Chorely RJ. 1967. Throughflow, overland flow, and erosion.International Association of Science Hydrology Bulletin 12: 5–21.
Kosovsky A. 1994. Generation of Runoff In First Order Drainage Basinsin a Semi-arid Region, Lahav Hills, Negev, Israel, MSc Thesis, TheHebrew University, Jerusalem.
Lal R. 1994. Soil erosion by wind and water: problems and prospects.In Soil Erosion Research Methods, Lal R (ed.). St Lucie Press and Soiland Water Conservation Society: Delray Beach, FLl; 1–9.
Lane LJ, Diskin MH, Wallace DE, Dixon RM. 1978. Partial arearesponse on small semiarid watersheds. Water Resources Bulletin14: 1143–1158.
Langbein WB, Schumm SA. 1958. Yield of sediment relation to meanannual precipitation. Transactions of the American GeophysicalUnion 39: 1076–1084.
Lange OL, Kidron GJ, Büdel B, Meyer A, Kilian E, Abeliovich A. 1992.Taxonomic composition and photosynthetic characteristics of thebiological soil crusts covering sand dunes in the Western NegevDesert. Functional Ecology 6: 519–527.
Lavee H. 1982. Distribution of Slope Areas that Contribute Runoff to theStream in an Arid Environment, PhD Thesis, The Hebrew University,Jerusalem (Hebrew with English summary).
Luk S, Morgan G. 1981. Spatial variations of rainwash and runoff withinapparently homogenous areas. Catena 8: 383–402.
Morin J, Goodrich DC, Woolhiser D, Garti R, Karnieli A, Sharon D, YairA. 1993. Evaluating and Predicting of the Spatial and Temporal Var-iability of Storm Runoff Generation in Watersheds of Arid andSemi-arid Regions, report, submitted to BARD by Soil Erosion Re-search Station, Emek Hefer, The Hebrew University, Jerusalem, Israeland USDA-ARS Southwest Watershed Research Center, Tucson, AZ.
Mueller EN, Wainwright J, Parsons AJ. 2008. Spatial variability of soil andnutrient characteristics of semi-arid grasslands and shrublands, JornadaBasin, New Mexico. Ecohydrology 1: 3–12. DOI. 10.1002/eco.1
Nearing MA, Lane LJ, Lopes VL. 1994. Modeling soil erosion. In SoilErosion Research Methods, Lal R (ed.). St. Lucie Press and Soil andWater Conservation Society: Delray Beach, FL; 127–156.
Onstad CA, Young RA, Otterby MA, Holt RF. 1979. Sediment yieldmodeling for 208 planning. In Universal Soil Loss Equation: Past,
Copyright © 2011 John Wiley & Sons, Ltd.
Present, and Future, Peterson AE, Swan JB (eds), SSSA Special Publi-cation 8. Soil Science Society of America: Madison, WI; 25–32.
Poesen JWA. 1992. Mechanisms of overland-flow generation andsediment production on loamy and sandy soils with and withoutrock fragments. In Overland Flow Hydraulics and Erosion Me-chanics, Parsons AJ, Abrahams AD (eds). UCL Press: London;275–305.
Poesen JWA, Torri D, Bunte K. 1994. Effects of rock fragments on soilerosion by water at different spatial scales: a review. Catena 23:141–166. DOI. 10.1016/0341-8162(94)90058-2
Puigdefábregas J. 2005. The role of vegetation patterns in structuringrunoff and sediment fluxes in drylands. Earth Surface Processes andLandforms 30: 133–147. DOI. 10.1002/esp.1181
Puigdefábregas J, del Barrio G, Boer MM, Gutiérrez L, Solé A. 1998.Differential responses of hillslope and channel elements to rainfallevents in semi-arid area. Geomorphology 23: 337–351.
Ragan RM. 1968. An Experimental Investigation of Partial Area Contri-bution. IAHS Publication 76. IAHS: Wallingford; 241–249.
Renard KG, Laflen JM, Foster GR, McCool DK. 1994. The reviseduniversal soil loss equation. In Soil Erosion Research Methods, Lal R(ed.). St Lucie Press and Soil and Water Conservation Society: DelrayBeach, FL; 105–124.
Romero-Diaz A, Cammeraat LH, Vacca A, Kosmas C. 1999. Soil erosion atthree experimental sites in theMediterranean. Earth Surface Process andLandforms 24: 1243–1256. DOI. 10.1002(SICI)1096-9837(199912)
Rosenan N, Gilad M. 1985. Atlas of Israel, Meteorological data, sheetIV/2. Carta, Jerusalem.
Ruiz-Sinoga JD, Martinez-Murillo JF. 2009. Hydrological response ofabandoned agricultural soils along a climatological gradient onmetamorphic parent material in southern Spain. Earth SurfaceProcesses and Landforms 34: 2047–2056. DOI. 10.1002/esp.1890
Rutin J. 1983. Erosional Processes on a Coastal Sand Dune, De Blink,Noordwijkerhout, Publication 35. Physical Geography and Soils Lab-oratory, University of Amsterdam: Amsterdam.
Sanchez G, Puigdefábregas J. 1994. Interactions of plant growthand sediment movement on slopes in a semi-arid environment.Geomorphology 9: 243–260. DOI. 10.1016/0169-555x(94)90066-3
Scoging H. 1989. Runoff generation and sediment mobilization bywater. In Arid Zone Geomorphology, Thomas DSG (ed.). BelhavenPress & Halsted Press: New York; 87–116.
Seyfried MS, Wilcox BP. 1995. Scale and the nature of spatial variability:field examples having implications for hydrologic modeling. WaterResources Research 31: 173–184. DOI. 10.1029/94WR02025
Shanan L, Tadmor NH, Evenari M, Reiniger P. 1970. Runoff farming inthe desert, III. Microcatchments for improvement of desert range.Agronomy Journal 62: 445–449.
Sharon D. 1980. The distribution of hydrologically effective rainfallincident on sloping ground. Journal of Hydrology 46: 165–188.
Singh G, Babu R, Chandra S. 1985. Research on the universal soil lossequation in India. In Soil Erosion and Conservation, El-Swaify SA,Moldenhauer WC, Andrew L (eds). Soil Conservation Society ofAmerica: Ankeny, IA; 498–508.
Smets T, Poesen J, Bochet E. 2008. Impact of plot length on theeffectiveness of different soil-surface covers in reducing runoff andsoil loss by water. Progress in Physical Geography 32: 654–677.DOI. 10.1177/0309133308101473
Solé-Benet A, Calvo A, Cerdà A, Lázaro R, Pini R, Barbero J. 1997.Influences of micro-relief patterns and plant cover on runoff relatedprocesses in badlands from Tabernas (SE Spain). Catena 31: 23–38.DOI. 10.1016/S0341-8162(97)00032-5
Tadmor NH, Shanan L. 1969. Runoff inducement in an arid region byremoval of vegetation. Soil Science Society of American Proceedings33: 790–794.
Tielbörger K. 1997. The vegetation of linear desert dunes in thenorthwestern Negev, Israel. Flora 192: 261–278.
Tongway DJ, Ludwig JA. 1990. Vegetation and soil patterning in semi-arid mulga lands of Eastern Australia. Australian Journal of Ecology15: 23–34.
Toy TJ, Osterkamp WR. 1995. The applicability of RUSLE to geomorphicstudies. Journal of Soil and Water Conservation 50: 498–503.
Valentin C, d’Herbès JM. 1999. Niger tiger bush as a natural water har-vesting system. Catena 37: 231–256. DOI. 10.1016/S0341-8162(99)00061-7
Earth Surf. Process. Landforms, Vol. 36, 1809–1824 (2011)

1824 G. J. KIDRON
Valentin C, d’Herbes JM, Poesen J. 1999. Soil and water components ofbanded vegetation patterns. Catena 37: 1–24. DOI. 10.1016/S0341-8162(99)00053-3
van de Giesen NC, Stomph TJ, de Ridder N. 2000. Scale effects onHortonian overland flow and rainfall–runoff dynamics in a WestAfrican catena landscape. Hydrological Processes 14: 165–175.DOI. 10.1002/(SICI)1099-1085(200001)
van Wesemael B, Mulligan M, Poesen J. 2000. Spatial patterns of soilwater balance on intensively cultivated hillslopes in a semi-arid environ-ment: the impact of rock fragments and soil thickness. HydrologicalProcesses 14: 1811–1828. DOI. 10.1002/1099-1085(200007)
van Wesemael B, Poesen J, Solé-Benet A, Cara Barriouevoss L,Puigdefáregas J. 1998. Collection and storage of runoff from hill-slopes in a semi-arid environment: geomorphic and hydrologicaspects of the aljibe system in Almeria Province, Spain. Journal of AridEnvironments 40: 1–14. DOI. 10.1006/jare.1998.0429
Wainwright J, Parsons AJ. 2002. The effect of temporal variations inrainfall on scale dependence in runoff coefficients. Water ResourcesResearch 38: 1271–1280. DOI. 10.1029/2000WR000188
Copyright © 2011 John Wiley & Sons, Ltd.
Walling DE. 1983. The sediment delivery problem. Journal of Hydrol-ogy 65: 209–237.
Walling DE, Webb BW. 1996. Erosion and sediment yield: a globaloverview. In Erosion and Sediment Yield: Global Perspectives, IAHSPublication 236. IAHS: Wallingford; 3–19.
Wetzel RG, Westlake DF. 1969. Periphyton. In AManual onMethods forMeasuring Primary Production in Aquatic Environments, VollenweiderRA (ed.). Blackwell: Oxford; 33–40.
Wischmeier WH, Smith DD. 1978. Predicting Rainfall Erosion Losses,Agricultural Handbook 537. US Department of Agriculture:Washington, DC.
Yair A, Bar-Yassif N. 2004. Hydrological processes in a small aridcatchment: scale effects of rainfall and slope length. Geomorphology61: 155–169. DOI. 10.1016/j.geomorph.2003.12.003
Yair A, Lavee H. 1985. An investigation of source area of sedimentand sediment transport by overland flow along arid hillslopes. InErosion and Sediment Measurement, Proceedings of the FlorenceSymposium, June 1981, IAHS Publication 133. IAHS: Wallingford;423–446.
Earth Surf. Process. Landforms, Vol. 36, 1809–1824 (2011)
Copyright © 2022 FDOKUMEN