Application of snowmelt runoff model for water resource management
13
HYDROLOGICAL PROCESSES Hydrol. Process. 25, 3735–3747 (2011) Published online 29 April 2011 in Wiley Online Library (wileyonlinelibrary.com) DOI: 10.1002/hyp.8099 Application of snowmelt runoff model for water resource management Mohsin Jamil Butt* and Muhammad Bilal Department of Meteorology, King Abdulaziz University, PO Box 80208, Jeddah 21589, Saudi Arabia Abstract: Snow-covered areas (SCAs) are the fundamental source of water for the hydrological cycle for some region. Accurate measurements of river discharge from snowmelt can help manage much needed water required for hydropower generation and irrigation purposes. This study aims to apply the snowmelt runoff model (SRM) in the Upper Indus basin by the Astore River in northern Pakistan for the years 2000 to 2006. The Shuttle Radar Topographic Mission (SRTM) data are used to generate the Digital Elevation Model (DEM) of the region. Various variables (snow cover depletion curves (SCDCs), temperature and precipitation) and parameters (degree-day factor, recession coefficient, runoff coefficients, time lag, critical temperature and temperature lapse rate) are used as input in the SRM. However, snow cover data are direct and an important input to the SRM. Satellite data from the Moderate Resolution Imaging Spectroradiometer (MODIS) are used to estimate the SCA. Normalized difference snow index (NDSI) algorithm is applied for snow cover mapping and to differentiate snow from other land features. Nash–Sutcliffe coefficient of determination (R 2 ) and volume difference (D V ) are used for quality assessment of the SRM. The results of the current research show that for the study years (2000–2006), the average value of R 2 is 0Ð87 and average volume difference D V is 1Ð18%. The correlation coefficient between measured and computed runoff is 0Ð95. The results of the study further show that a high level of accuracy can be achieved during the snowmelt season. The simulation results endorse that the SRM in conjunction with MODIS snow cover product is very useful for water resource management in the Astore River and can be used for runoff forecasts in the Indus River basin in northern Pakistan. Copyright 2011 John Wiley & Sons, Ltd. KEY WORDS MODIS; SRM; NDSI; SRTM; Upper Indus basin; Astore River; Nash-Sutcliffe coefficient; volume difference Received 3 September 2010; Accepted 8 March 2011 INTRODUCTION Satellite remote sensing of snow cover has been exploited since the start of the 1960s, and its effective application for the prediction of snowmelt runoff was demonstrated by Rango and Martinec in 1979. The importance of a snow-covered area (SCA) was further accentuated with the studies performed by various researchers to develop and apply the runoff models (World Meteorological Orga- nization, 1986, 1992). These models simulate snowmelt runoff by using the SCA and meteorological parame- ters during the melt season, but are less efficient. These models are however less efficient due to high volume difference between simulated and measured runoff val- ues. The snowmelt runoff model (SRM) (Martinec, 1975; Rango and Martinec, 1979), on the other hand, employs a deterministic approach and it runs without calibrating the model parameters. Klemes (1990) pointed out that the SRM needs only six parameters for accurate simula- tion. The SRM, which is also termed as Martinec–Rango model, is a simple conceptual and degree-day model which can be applied to mountain basins of various sizes and elevations. The largest basin on which the SRM has been applied is the Ganges River basin (917 444 km 2 ) * Correspondence to: Mohsin Jamil Butt, Department of Meteorology, King Abdulaziz University, PO Box 80208, Jeddah 21589, Saudi Arabia. E-mail: [email protected] (Seidel et al., 2000). Many agencies, institutes and uni- versities (Martinec et al., 1983, 1994, 1998; Brubaker et al., 1996; Seidel and Martinec, 2004; WinSRM, 2005; DeWalle and Rango, 2008) have successfully applied the SRM on more than 100 basins situated in 29 different countries as shown in Figure 1. The presence of an SCA is very significant in the application of the SRM (Tekeli et al., 2005). It is there- fore important to have near real time information of the SCA. Traditional methods to retrieve snowpack informa- tion are time consuming and are hampered by severe weather conditions. Satellite remote sensing data have solved the problem by providing high-quality spatiotem- poral information of an SCA in near real time. The Mod- erate Resolution Imaging Spectroradiometer (MODIS) offers 36 selected discrete bands/channels in the range of 0Ð4–14Ð38 µm with a spatial resolution from 250 to 1000 m, onboard Terra and Aqua platforms (Barnes et al., 1998; Salomonson et al., 2005). The MODIS detectors acquire images over a scan angle range of 55 ° to C55 ° , resulting in a swath of 2330 km at nadir (Gomez-Landesa et al., 2004; Liu et al., 2008). An SCA is derived from MODIS images and is used as an input for the hydrological models such as the SRM. Due to high geo-location accuracy, as compared to its counter- parts (for example, the geo-location accuracy of MODIS is approximately half a pixel for 500 m spatial resolution Copyright 2011 John Wiley & Sons, Ltd.
-
Upload
globenuist -
Category
Documents
-
view
4 -
download
0
Transcript of Application of snowmelt runoff model for water resource management
HYDROLOGICAL PROCESSESHydrol. Process. 25, 3735–3747 (2011)Published online 29 April 2011 in Wiley Online Library(wileyonlinelibrary.com) DOI: 10.1002/hyp.8099
Application of snowmelt runoff model for water resourcemanagement
Mohsin Jamil Butt* and Muhammad BilalDepartment of Meteorology, King Abdulaziz University, PO Box 80208, Jeddah 21589, Saudi Arabia
Abstract:
Snow-covered areas (SCAs) are the fundamental source of water for the hydrological cycle for some region. Accuratemeasurements of river discharge from snowmelt can help manage much needed water required for hydropower generation andirrigation purposes. This study aims to apply the snowmelt runoff model (SRM) in the Upper Indus basin by the Astore Riverin northern Pakistan for the years 2000 to 2006. The Shuttle Radar Topographic Mission (SRTM) data are used to generatethe Digital Elevation Model (DEM) of the region. Various variables (snow cover depletion curves (SCDCs), temperature andprecipitation) and parameters (degree-day factor, recession coefficient, runoff coefficients, time lag, critical temperature andtemperature lapse rate) are used as input in the SRM. However, snow cover data are direct and an important input to the SRM.Satellite data from the Moderate Resolution Imaging Spectroradiometer (MODIS) are used to estimate the SCA. Normalizeddifference snow index (NDSI) algorithm is applied for snow cover mapping and to differentiate snow from other land features.Nash–Sutcliffe coefficient of determination (R2) and volume difference (DV) are used for quality assessment of the SRM. Theresults of the current research show that for the study years (2000–2006), the average value of R2 is 0Ð87 and average volumedifference DV is 1Ð18%. The correlation coefficient between measured and computed runoff is 0Ð95. The results of the studyfurther show that a high level of accuracy can be achieved during the snowmelt season. The simulation results endorse thatthe SRM in conjunction with MODIS snow cover product is very useful for water resource management in the Astore Riverand can be used for runoff forecasts in the Indus River basin in northern Pakistan. Copyright 2011 John Wiley & Sons,Ltd.
KEY WORDS MODIS; SRM; NDSI; SRTM; Upper Indus basin; Astore River; Nash-Sutcliffe coefficient; volume difference
Received 3 September 2010; Accepted 8 March 2011
INTRODUCTION
Satellite remote sensing of snow cover has been exploitedsince the start of the 1960s, and its effective applicationfor the prediction of snowmelt runoff was demonstratedby Rango and Martinec in 1979. The importance of asnow-covered area (SCA) was further accentuated withthe studies performed by various researchers to developand apply the runoff models (World Meteorological Orga-nization, 1986, 1992). These models simulate snowmeltrunoff by using the SCA and meteorological parame-ters during the melt season, but are less efficient. Thesemodels are however less efficient due to high volumedifference between simulated and measured runoff val-ues. The snowmelt runoff model (SRM) (Martinec, 1975;Rango and Martinec, 1979), on the other hand, employsa deterministic approach and it runs without calibratingthe model parameters. Klemes (1990) pointed out thatthe SRM needs only six parameters for accurate simula-tion. The SRM, which is also termed as Martinec–Rangomodel, is a simple conceptual and degree-day modelwhich can be applied to mountain basins of various sizesand elevations. The largest basin on which the SRM hasbeen applied is the Ganges River basin (917 444 km2)
* Correspondence to: Mohsin Jamil Butt, Department of Meteorology,King Abdulaziz University, PO Box 80208, Jeddah 21589, Saudi Arabia.E-mail: [email protected]
(Seidel et al., 2000). Many agencies, institutes and uni-versities (Martinec et al., 1983, 1994, 1998; Brubakeret al., 1996; Seidel and Martinec, 2004; WinSRM, 2005;DeWalle and Rango, 2008) have successfully applied theSRM on more than 100 basins situated in 29 differentcountries as shown in Figure 1.
The presence of an SCA is very significant in theapplication of the SRM (Tekeli et al., 2005). It is there-fore important to have near real time information of theSCA. Traditional methods to retrieve snowpack informa-tion are time consuming and are hampered by severeweather conditions. Satellite remote sensing data havesolved the problem by providing high-quality spatiotem-poral information of an SCA in near real time. The Mod-erate Resolution Imaging Spectroradiometer (MODIS)offers 36 selected discrete bands/channels in the rangeof 0Ð4–14Ð38 µm with a spatial resolution from 250to 1000 m, onboard Terra and Aqua platforms (Barneset al., 1998; Salomonson et al., 2005). The MODISdetectors acquire images over a scan angle range of�55° to C55°, resulting in a swath of 2330 km at nadir(Gomez-Landesa et al., 2004; Liu et al., 2008). An SCAis derived from MODIS images and is used as an inputfor the hydrological models such as the SRM. Due tohigh geo-location accuracy, as compared to its counter-parts (for example, the geo-location accuracy of MODISis approximately half a pixel for 500 m spatial resolution
Copyright 2011 John Wiley & Sons, Ltd.

3736 M. J. BUTT AND M. BILAL
Figure 1. List of the countries along with the number of times the SRMis applied
while on the other hand, advanced very high resolutionradiometer has š1 pixel at 1000 m spatial resolution),MODIS is preferred and is used as an input variablefor SRMs. Hall et al. (2002) developed an algorithm forsnow cover maps at 500 m spatial resolution for MODISdata which is also useful for the discrimination of snowand low-level clouds. The detail description of MODIScan be found at http://modis.gsfc.nasa.gov/.
The northern parts of Pakistan are abundant withsnow cover. Yet, there is no established continuousoperational snow monitoring system developed in thecountry. MODIS data due to its repetitive coverage, highspectral range and moderate spatial resolution can be veryuseful for the daily snow monitoring in Pakistan.
Few studies have been conducted using the SRM inPakistan. For example, the SRM was applied for the firsttime in Pakistan on the Kabul River (63 657 km2) in 1975by Dey et al. (1989). The purpose of the application waswater resource management for power generation andirrigation systems. The results of the study show a lowervalue of R2 (0Ð66) and a higher value of DV (6%) at theKabul River. Dey et al. (1989) associated the high errorand low R2 values with the peculiar positions of weatherstations. Recently, Immerzeel et al. (2009) successfullyapplied the SRM on the Besham Qila in the Upper Indusbasin in northern Pakistan for the years 2001–2005. Theobjective of their study was to investigate the effects ofreduced SCAs and retreating glaciers on river dischargeof the Upper Indus basin. Their results show that theaverage coefficient of determination (R2) is 0Ð78 and theaverage volume difference (DV) is 0Ð02%.
In Pakistan, the Water and Power DevelopmentAuthority (WAPDA) is responsible for measuring theriver streamflow on a daily basis. Since, the measure-ments are made manually the data are reported to varyand are of moderate quality at best. In the currentstudy, the SRM is applied in the Upper Indus basin bythe Astore River (4025Ð97 km2) in northern Pakistan.
The SRM model, developed to use snow cover map-ping as a direct input variable, has been successfullyapplied in many parts of the world. The SRM modelwas developed by Martinec (1975) at the Swiss Snowand Avalanche Research Institute. It is important that, inapplying the SRM, if the elevation of the basin exceedsthe range of 500 m, the basin should be divided intoelevation zones. The study area receives heavy snow-fall in the winter season (September–March) while thesummer (April–August) is considered as the melting sea-son. However, due to some permanent snow and glaciersin the area, not all the snow melts during summer. Inaddition, the river runoff data indicate that there is littlevariation in the river discharge values during the snowaccumulation season. The MODIS satellite data for themonths of April–August for the years 2000–2006 wereused in this study. Thus, the SRM is applied only for thesnowmelt season for the years 2000–2006. A number ofinput variables and parameters are used in the SRM sim-ulation. For example, temperature, precipitation, degree-day factor, recession coefficient, runoff coefficients, timelag, critical temperature and temperature lapse rate. Theobjective of the SRM application is to investigate therole of the SRM in water resource management as wellas to analyze the effects of seasonal snow cover on riverdischarge.
STUDY AREA
The Astore River is located at 35°330N latitude and74°420E longitude. The Astore River runs through theHindukush, Karakoram and Himalaya (HKH) region. TheHKH region contains permanent snow features dominatedby large glaciers. Monsoon circulation contributes to one-third of the summer snowfall (Wake, 1989) while two-thirds of high altitude snowfall is derived from westerlycirculations and cyclonic storms. The seasonal snowand glacial melting are both major contributors to thedischarge of the Astore River. In the winter, 80–90% ofthe area of the HKH region is covered with snow (Snowand Ice Hydrology Project, 1990). The Astore River, inthe current study, is divided into three elevation zonesfor runoff modeling. There is one meteorological stationsituated at Astore and one hydrological station situated atDoyian in the study area. The study area shows (Figure 2)the location of the Astore River and its three elevationzones in the Upper Indus basin.
The mean elevation of the study area is 3921 m,whereas the only hydrological station (Doyian) is locatedat an elevation of 1583 m. The total drainage area of thestudy region is 4025Ð97 km2 and approximately 612 km2
(16%) is permanently covered with glaciers.
DATASETS USED
Temperature and precipitation data for the years 2000–2006 from the meteorological station, located at anelevation of 2168 m, were acquired from the Pakistan
Copyright 2011 John Wiley & Sons, Ltd. Hydrol. Process. 25, 3735–3747 (2011)

WATER RESOURCE MANAGEMENT 3737
Figure 2. Location of Astore River in the Upper Indus basin in northern Pakistan and its elevation zones
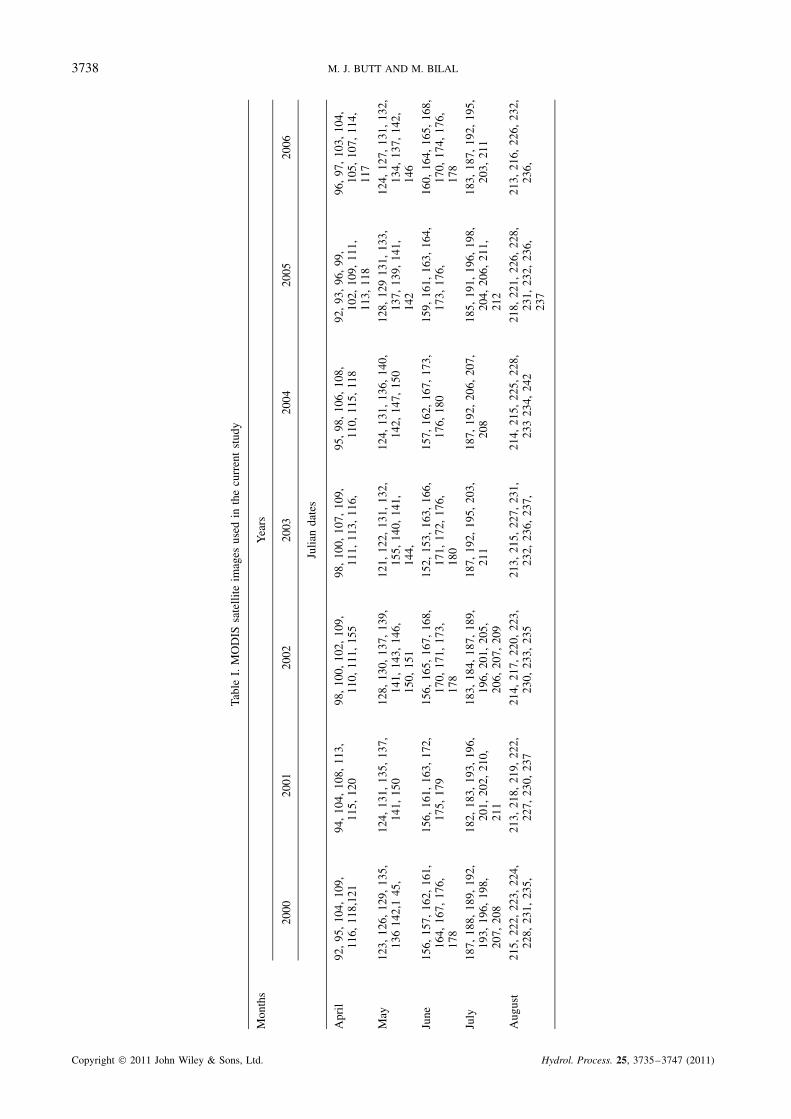
Meteorological Department (PMD). Similarly, in total,253 MODIS L1B (MOD02HKM) swath images areused in this study (Table I). During the data acquisitionthe bowtie effect is introduced in MODIS swath datawhich produces duplicate or sometimes triplicate valuesaway from the center of the swath (near the edges).Thus, MODIS Reprojection Swath Tool (MRT-Swath)data with MOD03 (geo-location) file of each selectedMODIS image were also retrieved to remove the bowtieeffect and geometric distortion. The reflectance model(Equation (2)) is used to convert the scaled integer (SI)values of MODIS swath data into reflectance values. TheSCA, which is the most important input variable in theSRM, is derived from MODIS standard snow cover maps(Hall et al., 2002).
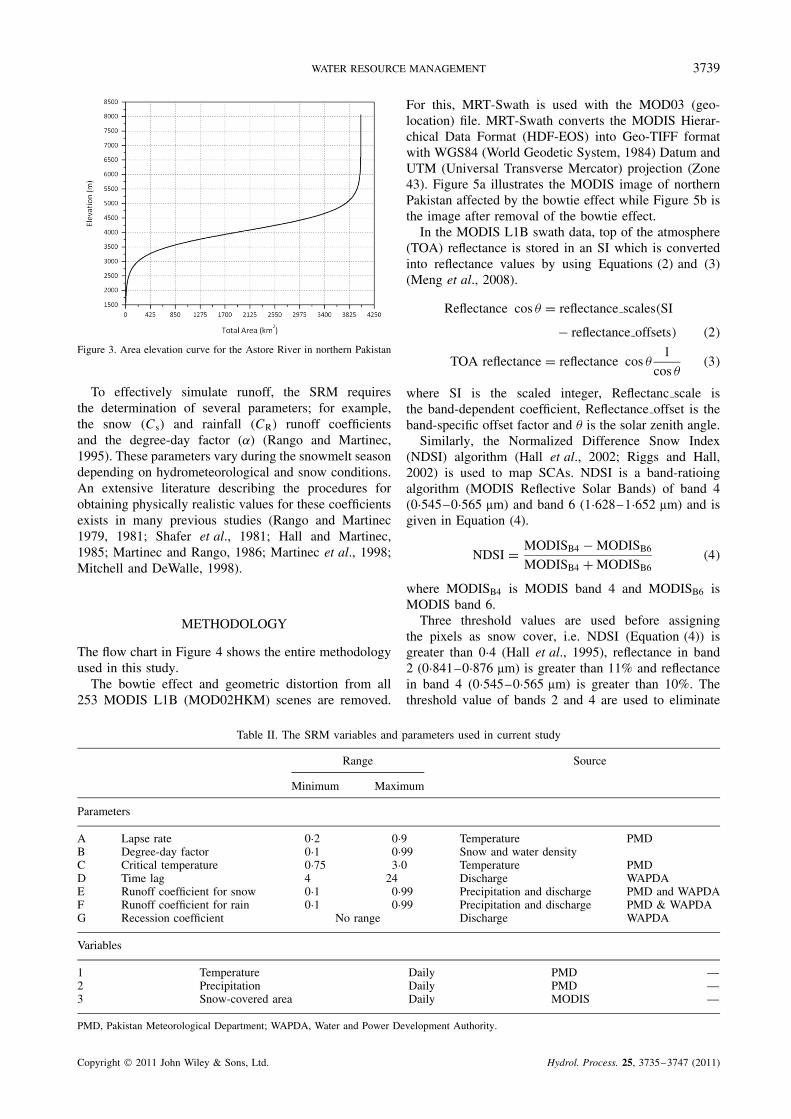
Elevation data are essential to understand the physiog-raphy of the Astore region. For this purpose, the DigitalElevation Model (DEM) data were retrieved from theShuttle Radar Topographic Mission (SRTM) for the studyarea. Elevation data are used to make different eleva-tion zones and an area elevation curve. An area eleva-tion (hypsometric) curve derived for the Astore Riverin the Upper Indus basin is shown in Figure 3. Thiscurve is used to determine the zonal mean hypsomet-ric elevation which is further required to extrapolatethe base station temperature for the calculation of zonaldegree-days.
SNOWMELT RUNOFF MODEL
The variables of the SRM model are temperature, pre-cipitation and snow cover and the input parameters aredegree-day factor, runoff coefficient, temperature lapserate, recession coefficient, critical temperature, time lagand rainfall contributing areas (Ferguson, 1999; Nagleret al., 2008). The SRM used in this study is given inEquation (1) (WinSRM, 2008).
QnC1 D [Csn˛n�Tn C Tn�Sn C CRnPn]A ð 10 000
86 400�1 � knC1�QnknC1 �1�
where A is the area of the basin or zone (km2), n isthe sequence of days, 10 000
86 400 is the conversion from(cm km2 day�1) to (m3 s�1), Q is the average dailydischarge (m3 s�1), T is the number of degree-days ( °Cd), T is the adjustment by temperature lapse rate fromthe station to average hypsometric elevation of the basinor zone ( °C d), Sis the ratio of an SCA to total area, Pis the precipitation contributing to runoff (cm), Cs is therunoff coefficient for snow, CR is the runoff coefficientfor rain, ˛ is the degree-day factor (cm °C�1 d�1) and k isthe recession coefficient indicating the day-to-day declineof discharge in a period without snowmelt or rainfall.
The SRM variables and parameters used in this studyare given in Table II.
Copyright 2011 John Wiley & Sons, Ltd. Hydrol. Process. 25, 3735–3747 (2011)
3738 M. J. BUTT AND M. BILAL
Tabl
eI.
MO
DIS
sate
llite
imag
esus
edin
the
curr
ent
stud
y
Mon
ths
Yea
rs
2000
2001
2002
2003
2004
2005
2006
Julia
nda
tes
Apr
il92
,95
,10
4,10
9,11
6,11
8,12
194
,10
4,10
8,11
3,11
5,12
098
,10
0,10
2,10
9,11
0,11
1,15
598
,10
0,10
7,10
9,11
1,11
3,11
6,95
,98
,10
6,10
8,11
0,11
5,11
892
,93
,96
,99
,10
2,10
9,11
1,11
3,11
8
96,
97,
103,
104,
105,
107,
114,
117
May
123,
126,
129,
135,
136
142,
145
,12
4,13
1,13
5,13
7,14
1,15
012
8,13
0,13
7,13
9,14
1,14
3,14
6,15
0,15
1
121,
122,
131,
132,
155,
140,
141,
144,
124,
131,
136,
140,
142,
147,
150
128,
129
131,
133,
137,
139,
141,
142
124,
127,
131,
132,
134,
137,
142,
146
June
156,
157,
162,
161,
164,
167,
176,
178
156,
161,
163,
172,
175,
179
156,
165,
167,
168,
170,
171,
173,
178
152,
153,
163,
166,
171,
172,
176,
180
157,
162,
167,
173,
176,
180
159,
161,
163,
164,
173,
176,
160,
164,
165,
168,
170,
174,
176,
178
July
187,
188,
189,
192,
193,
196,
198,
207,
208
182,
183,
193,
196,
201,
202,
210,
211
183,
184,
187,
189,
196,
201,
205,
206,
207,
209
187,
192,
195,
203,
211
187,
192,
206,
207,
208
185,
191,
196,
198,
204,
206,
211,
212
183,
187,
192,
195,
203,
211
Aug
ust
215,
222,
223,
224,
228,
231,
235,
213,
218,
219,
222,
227,
230,
237
214,
217,
220,
223,
230,
233,
235
213,
215,
227,
231,
232,
236,
237,
214,
215,
225,
228,
233
234,
242
218,
221,
226,
228,
231,
232,
236,
237
213,
216,
226,
232,
236,
Copyright 2011 John Wiley & Sons, Ltd. Hydrol. Process. 25, 3735–3747 (2011)
WATER RESOURCE MANAGEMENT 3739
Figure 3. Area elevation curve for the Astore River in northern Pakistan
To effectively simulate runoff, the SRM requiresthe determination of several parameters; for example,the snow (Cs) and rainfall (CR) runoff coefficientsand the degree-day factor (˛) (Rango and Martinec,1995). These parameters vary during the snowmelt seasondepending on hydrometeorological and snow conditions.An extensive literature describing the procedures forobtaining physically realistic values for these coefficientsexists in many previous studies (Rango and Martinec1979, 1981; Shafer et al., 1981; Hall and Martinec,1985; Martinec and Rango, 1986; Martinec et al., 1998;Mitchell and DeWalle, 1998).
METHODOLOGY
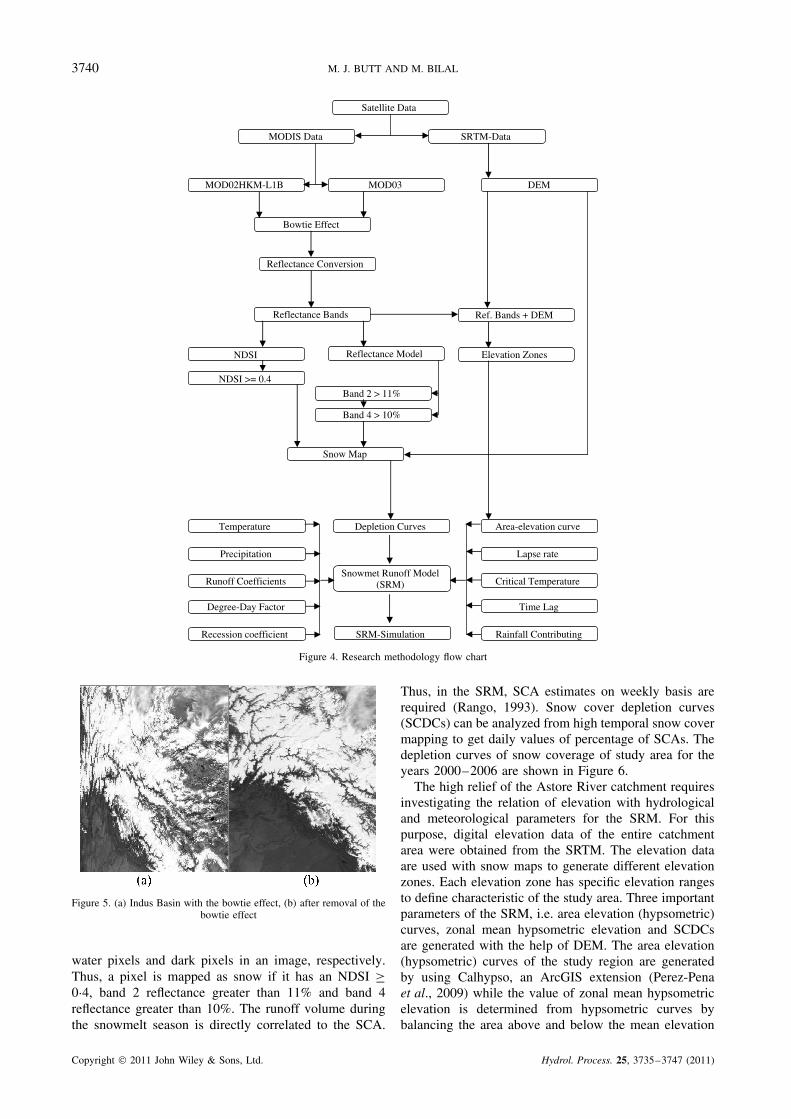
The flow chart in Figure 4 shows the entire methodologyused in this study.
The bowtie effect and geometric distortion from all253 MODIS L1B (MOD02HKM) scenes are removed.
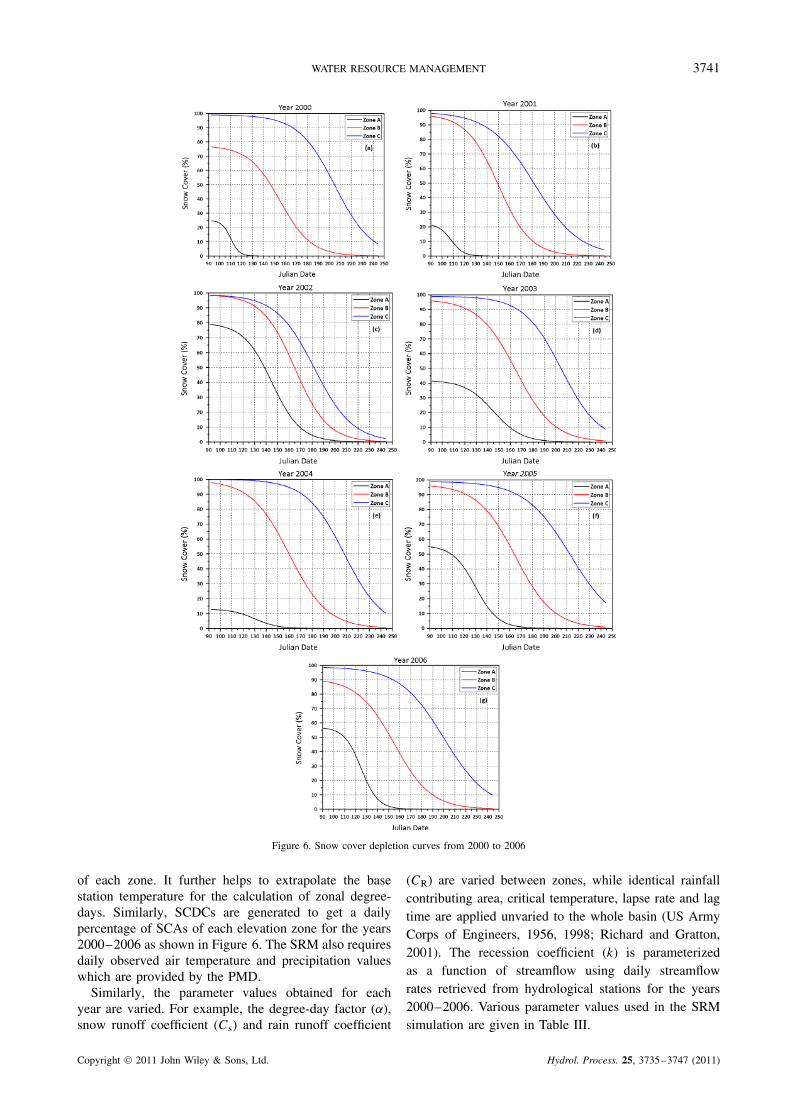
For this, MRT-Swath is used with the MOD03 (geo-location) file. MRT-Swath converts the MODIS Hierar-chical Data Format (HDF-EOS) into Geo-TIFF formatwith WGS84 (World Geodetic System, 1984) Datum andUTM (Universal Transverse Mercator) projection (Zone43). Figure 5a illustrates the MODIS image of northernPakistan affected by the bowtie effect while Figure 5b isthe image after removal of the bowtie effect.
In the MODIS L1B swath data, top of the atmosphere(TOA) reflectance is stored in an SI which is convertedinto reflectance values by using Equations (2) and (3)(Meng et al., 2008).
Reflectance cos � D reflectance scales�SI
� reflectance offsets� �2�
TOA reflectance D reflectance cos �1
cos ��3�
where SI is the scaled integer, Reflectanc scale isthe band-dependent coefficient, Reflectance offset is theband-specific offset factor and � is the solar zenith angle.
Similarly, the Normalized Difference Snow Index(NDSI) algorithm (Hall et al., 2002; Riggs and Hall,2002) is used to map SCAs. NDSI is a band-ratioingalgorithm (MODIS Reflective Solar Bands) of band 4(0Ð545–0Ð565 µm) and band 6 (1Ð628–1Ð652 µm) and isgiven in Equation (4).
NDSI D MODISB4 � MODISB6
MODISB4 C MODISB6�4�
where MODISB4 is MODIS band 4 and MODISB6 isMODIS band 6.
Three threshold values are used before assigningthe pixels as snow cover, i.e. NDSI (Equation (4)) isgreater than 0Ð4 (Hall et al., 1995), reflectance in band2 (0Ð841–0Ð876 µm) is greater than 11% and reflectancein band 4 (0Ð545–0Ð565 µm) is greater than 10%. Thethreshold value of bands 2 and 4 are used to eliminate
Table II. The SRM variables and parameters used in current study
Range Source
Minimum Maximum
Parameters
A Lapse rate 0Ð2 0Ð9 Temperature PMDB Degree-day factor 0Ð1 0Ð99 Snow and water densityC Critical temperature 0Ð75 3Ð0 Temperature PMDD Time lag 4 24 Discharge WAPDAE Runoff coefficient for snow 0Ð1 0Ð99 Precipitation and discharge PMD and WAPDAF Runoff coefficient for rain 0Ð1 0Ð99 Precipitation and discharge PMD & WAPDAG Recession coefficient No range Discharge WAPDA
Variables
1 Temperature Daily PMD —2 Precipitation Daily PMD —3 Snow-covered area Daily MODIS —
PMD, Pakistan Meteorological Department; WAPDA, Water and Power Development Authority.
Copyright 2011 John Wiley & Sons, Ltd. Hydrol. Process. 25, 3735–3747 (2011)
3740 M. J. BUTT AND M. BILAL
NDSI >= 0.4
Depletion CurvesTemperature
Precipitation
Runoff Coefficients
Degree-Day Factor
Recession coefficient
Time Lag
Critical Temperature
Lapse rate
Area-elevation curve
Rainfall Contributing
Snowmet Runoff Model(SRM)
SRM-Simulation
DEMMOD02HKM-L1B
Satellite Data
MODIS Data
Bowtie Effect
SRTM-Data
MOD03
Reflectance Conversion
NDSI
Reflectance Bands
Band 2 > 11%
Band 4 > 10%
Ref. Bands + DEM
Elevation Zones
Snow Map
Reflectance Model
Figure 4. Research methodology flow chart
Figure 5. (a) Indus Basin with the bowtie effect, (b) after removal of thebowtie effect
water pixels and dark pixels in an image, respectively.Thus, a pixel is mapped as snow if it has an NDSI ½0Ð4, band 2 reflectance greater than 11% and band 4reflectance greater than 10%. The runoff volume duringthe snowmelt season is directly correlated to the SCA.
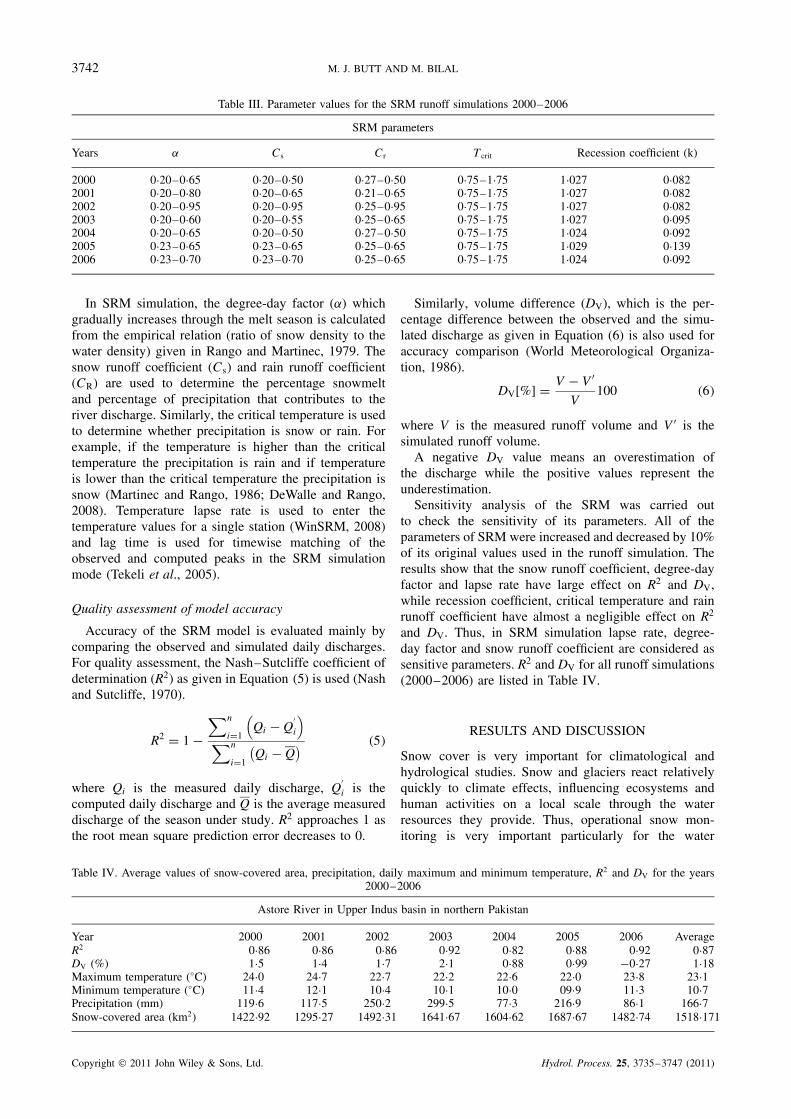
Thus, in the SRM, SCA estimates on weekly basis arerequired (Rango, 1993). Snow cover depletion curves(SCDCs) can be analyzed from high temporal snow covermapping to get daily values of percentage of SCAs. Thedepletion curves of snow coverage of study area for theyears 2000–2006 are shown in Figure 6.
The high relief of the Astore River catchment requiresinvestigating the relation of elevation with hydrologicaland meteorological parameters for the SRM. For thispurpose, digital elevation data of the entire catchmentarea were obtained from the SRTM. The elevation dataare used with snow maps to generate different elevationzones. Each elevation zone has specific elevation rangesto define characteristic of the study area. Three importantparameters of the SRM, i.e. area elevation (hypsometric)curves, zonal mean hypsometric elevation and SCDCsare generated with the help of DEM. The area elevation(hypsometric) curves of the study region are generatedby using Calhypso, an ArcGIS extension (Perez-Penaet al., 2009) while the value of zonal mean hypsometricelevation is determined from hypsometric curves bybalancing the area above and below the mean elevation
Copyright 2011 John Wiley & Sons, Ltd. Hydrol. Process. 25, 3735–3747 (2011)
WATER RESOURCE MANAGEMENT 3741
Figure 6. Snow cover depletion curves from 2000 to 2006
of each zone. It further helps to extrapolate the basestation temperature for the calculation of zonal degree-days. Similarly, SCDCs are generated to get a dailypercentage of SCAs of each elevation zone for the years2000–2006 as shown in Figure 6. The SRM also requiresdaily observed air temperature and precipitation valueswhich are provided by the PMD.
Similarly, the parameter values obtained for eachyear are varied. For example, the degree-day factor (˛),snow runoff coefficient (Cs) and rain runoff coefficient
(CR) are varied between zones, while identical rainfallcontributing area, critical temperature, lapse rate and lagtime are applied unvaried to the whole basin (US ArmyCorps of Engineers, 1956, 1998; Richard and Gratton,2001). The recession coefficient (k) is parameterizedas a function of streamflow using daily streamflowrates retrieved from hydrological stations for the years2000–2006. Various parameter values used in the SRMsimulation are given in Table III.
Copyright 2011 John Wiley & Sons, Ltd. Hydrol. Process. 25, 3735–3747 (2011)
3742 M. J. BUTT AND M. BILAL
Table III. Parameter values for the SRM runoff simulations 2000–2006
SRM parameters
Years ˛ Cs Cr Tcrit Recession coefficient (k)
2000 0Ð20–0Ð65 0Ð20–0Ð50 0Ð27–0Ð50 0Ð75–1Ð75 1Ð027 0Ð0822001 0Ð20–0Ð80 0Ð20–0Ð65 0Ð21–0Ð65 0Ð75–1Ð75 1Ð027 0Ð0822002 0Ð20–0Ð95 0Ð20–0Ð95 0Ð25–0Ð95 0Ð75–1Ð75 1Ð027 0Ð0822003 0Ð20–0Ð60 0Ð20–0Ð55 0Ð25–0Ð65 0Ð75–1Ð75 1Ð027 0Ð0952004 0Ð20–0Ð65 0Ð20–0Ð50 0Ð27–0Ð50 0Ð75–1Ð75 1Ð024 0Ð0922005 0Ð23–0Ð65 0Ð23–0Ð65 0Ð25–0Ð65 0Ð75–1Ð75 1Ð029 0Ð1392006 0Ð23–0Ð70 0Ð23–0Ð70 0Ð25–0Ð65 0Ð75–1Ð75 1Ð024 0Ð092
In SRM simulation, the degree-day factor (˛) whichgradually increases through the melt season is calculatedfrom the empirical relation (ratio of snow density to thewater density) given in Rango and Martinec, 1979. Thesnow runoff coefficient (Cs) and rain runoff coefficient(CR) are used to determine the percentage snowmeltand percentage of precipitation that contributes to theriver discharge. Similarly, the critical temperature is usedto determine whether precipitation is snow or rain. Forexample, if the temperature is higher than the criticaltemperature the precipitation is rain and if temperatureis lower than the critical temperature the precipitation issnow (Martinec and Rango, 1986; DeWalle and Rango,2008). Temperature lapse rate is used to enter thetemperature values for a single station (WinSRM, 2008)and lag time is used for timewise matching of theobserved and computed peaks in the SRM simulationmode (Tekeli et al., 2005).
Quality assessment of model accuracy
Accuracy of the SRM model is evaluated mainly bycomparing the observed and simulated daily discharges.For quality assessment, the Nash–Sutcliffe coefficient ofdetermination (R2) as given in Equation (5) is used (Nashand Sutcliffe, 1970).
R2 D 1 �∑n
iD1
(Qi � Q
0i
)∑n
iD1
(Qi � Q
) �5�
where Qi is the measured daily discharge, Q0i is the
computed daily discharge and Q is the average measureddischarge of the season under study. R2 approaches 1 asthe root mean square prediction error decreases to 0.
Similarly, volume difference (DV), which is the per-centage difference between the observed and the simu-lated discharge as given in Equation (6) is also used foraccuracy comparison (World Meteorological Organiza-tion, 1986).
DV[%] D V � V0
V100 �6�
where V is the measured runoff volume and V0 is thesimulated runoff volume.
A negative DV value means an overestimation ofthe discharge while the positive values represent theunderestimation.
Sensitivity analysis of the SRM was carried outto check the sensitivity of its parameters. All of theparameters of SRM were increased and decreased by 10%of its original values used in the runoff simulation. Theresults show that the snow runoff coefficient, degree-dayfactor and lapse rate have large effect on R2 and DV,while recession coefficient, critical temperature and rainrunoff coefficient have almost a negligible effect on R2
and DV. Thus, in SRM simulation lapse rate, degree-day factor and snow runoff coefficient are considered assensitive parameters. R2 and DV for all runoff simulations(2000–2006) are listed in Table IV.
RESULTS AND DISCUSSION
Snow cover is very important for climatological andhydrological studies. Snow and glaciers react relativelyquickly to climate effects, influencing ecosystems andhuman activities on a local scale through the waterresources they provide. Thus, operational snow mon-itoring is very important particularly for the water
Table IV. Average values of snow-covered area, precipitation, daily maximum and minimum temperature, R2 and DV for the years2000–2006
Astore River in Upper Indus basin in northern Pakistan
Year 2000 2001 2002 2003 2004 2005 2006 AverageR2 0Ð86 0Ð86 0Ð86 0Ð92 0Ð82 0Ð88 0Ð92 0Ð87DV (%) 1Ð5 1Ð4 1Ð7 2Ð1 0Ð88 0Ð99 �0Ð27 1Ð18Maximum temperature (°C) 24Ð0 24Ð7 22Ð7 22Ð2 22Ð6 22Ð0 23Ð8 23Ð1Minimum temperature (°C) 11Ð4 12Ð1 10Ð4 10Ð1 10Ð0 09Ð9 11Ð3 10Ð7Precipitation (mm) 119Ð6 117Ð5 250Ð2 299Ð5 77Ð3 216Ð9 86Ð1 166Ð7Snow-covered area (km2) 1422Ð92 1295Ð27 1492Ð31 1641Ð67 1604Ð62 1687Ð67 1482Ð74 1518Ð171
Copyright 2011 John Wiley & Sons, Ltd. Hydrol. Process. 25, 3735–3747 (2011)

WATER RESOURCE MANAGEMENT 3743
resource management. This article presents the methodof snowmelt runoff modeling for water resource manage-ment on the Astore River in the Upper Indus basin. TheMODIS satellite data products, daily temperature and pre-cipitation data for the simulation period (April–August)for the years 2000–2006 are used in this study. In addi-tion, the SRTM data are used for the generation ofthe DEM.
In order to determine which variable and parameterimpacts the estimated runoff the most, from the SRMsimulation, a sensitive analysis was conducted. Thesensitivity analyses show that the SRM is sensitiveto the lapse rate, degree-day factor and to the snowrunoff coefficient. Thus, in the SRM simulation, thelapse rate, degree-day factor (˛) and the snow runoffcoefficient (Cs) are allowed to vary between zones, whilerainfall contributing area, critical temperature, rain runoffcoefficient (CR), lag time and recession coefficient are notchanged for the entire basin.
For the simulation period (April–August) the averageprecipitation, average maximum and minimum tempera-ture, average SCA, average R2 and average DV for theyears 2000–2006 are given in Table IV. The averagedaily temperature and average SCA for the simulationperiod of 2000, 2001, 2002, 2003, 2004, 2005 and 2006are 17Ð7 °C and 1422Ð92 km2, 18Ð4 °C and 1295Ð27 km2,16Ð55 °C and 1492Ð31 km2, 16Ð15 °C and 1428Ð51 km2,16Ð3 °C and 1604Ð62 km2, 15Ð95 °C and 1687Ð67 km2 and17Ð55 °C and 1482Ð74 km2, respectively. It is evident thatduring the simulation period, the year 2001 has the high-est average temperature and smallest area covered withsnow, whereas, the year 2005 has the lowest averagetemperature and largest area covered with snow. Thus,as expected, the increase in temperature causes moresnow to melt, and consequently, the decrease in SCA isobserved. Similarly, the average daily temperature, SCAand the average difference in measured and computedrunoff for the simulation period of years 2000–2006 aregiven in Table V. It is evident that during the simula-tion period of each year, i.e. from April to August, the
Table V. Average daily temperature (°C), snow-covered area (km2) and difference in measured and computed runoff (m3/s) for thesimulation period of years 2000–2006
Year Month Average temperature Average SCA Average difference in measuredand computed runoff
2000 April 17Ð49 3244Ð57 0Ð47May 24Ð55 2898Ð94 16Ð95June 25Ð25 2156Ð81 �16Ð42July 26Ð37 1247Ð49 �15Ð71August 26Ð50 412Ð63 �0Ð38
2001 April 17Ð36 3489Ð58 12Ð66May 24Ð70 2912Ð08 3Ð90June 26Ð08 1748Ð78 �13Ð32July 27Ð72 715Ð22 �10Ð16August 27Ð45 201Ð28 �5Ð92
2002 April 14Ð34 3841Ð73 �9Ð30May 21Ð20 3454Ð99 �3Ð57June 24Ð66 2216Ð82 �6Ð56July 25Ð76 777Ð24 9Ð47August 27Ð69 155Ð43 �12Ð77
2003 April 15Ð26 3661Ð22 3Ð16May 16Ð74 3374Ð63 �8Ð79June 24Ð98 2564Ð02 6Ð77July 28Ð23 1428Ð51 �23Ð33August 25Ð71 463Ð34 �12Ð03
2004 April 16Ð67 3586Ð59 �5Ð66May 21Ð24 3255Ð08 �10Ð69June 23Ð73 2459Ð21 0Ð13July 26Ð06 1435Ð67 6Ð29August 25Ð34 495Ð78 �2Ð97
2005 April 13Ð56 3698Ð51 �12Ð49May 18Ð04 3338Ð99 22Ð74June 24Ð98 2520Ð74 34Ð94July 26Ð40 1567Ð49 �55Ð59August 27Ð14 687Ð97 �5Ð53
2006 April 14Ð78 3561Ð27 �17Ð88May 24Ð50 3051Ð06 7Ð29June 24Ð41 2156Ð90 14Ð09July 29Ð29 1180Ð20 6Ð61August 26Ð13 429Ð75 �8Ð07
Copyright 2011 John Wiley & Sons, Ltd. Hydrol. Process. 25, 3735–3747 (2011)
3744 M. J. BUTT AND M. BILAL
temperature has an increasing trend while the SCA hasa deceasing trend. Thus, the rise in temperature causesmore snow to melt resulting in less SCA at the endof summer season. Although there are few precipitationevents in the region, the main contribution in the riverrunoff, however, is due to snow melt.
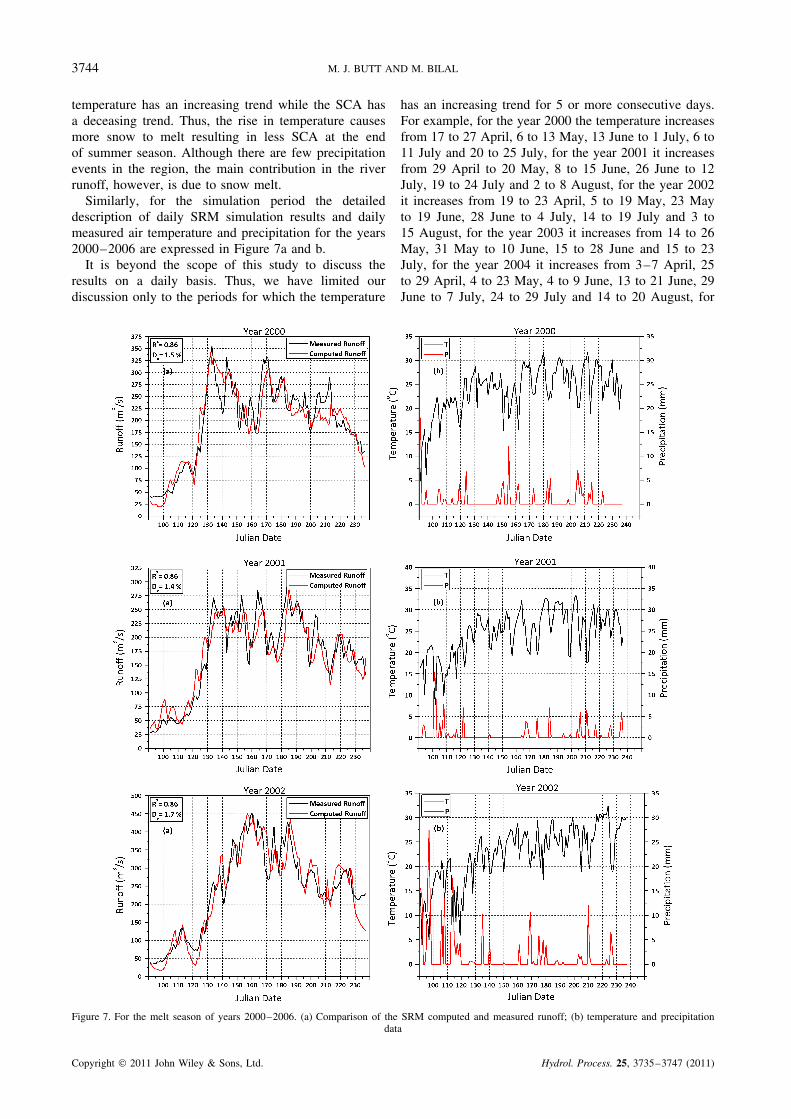
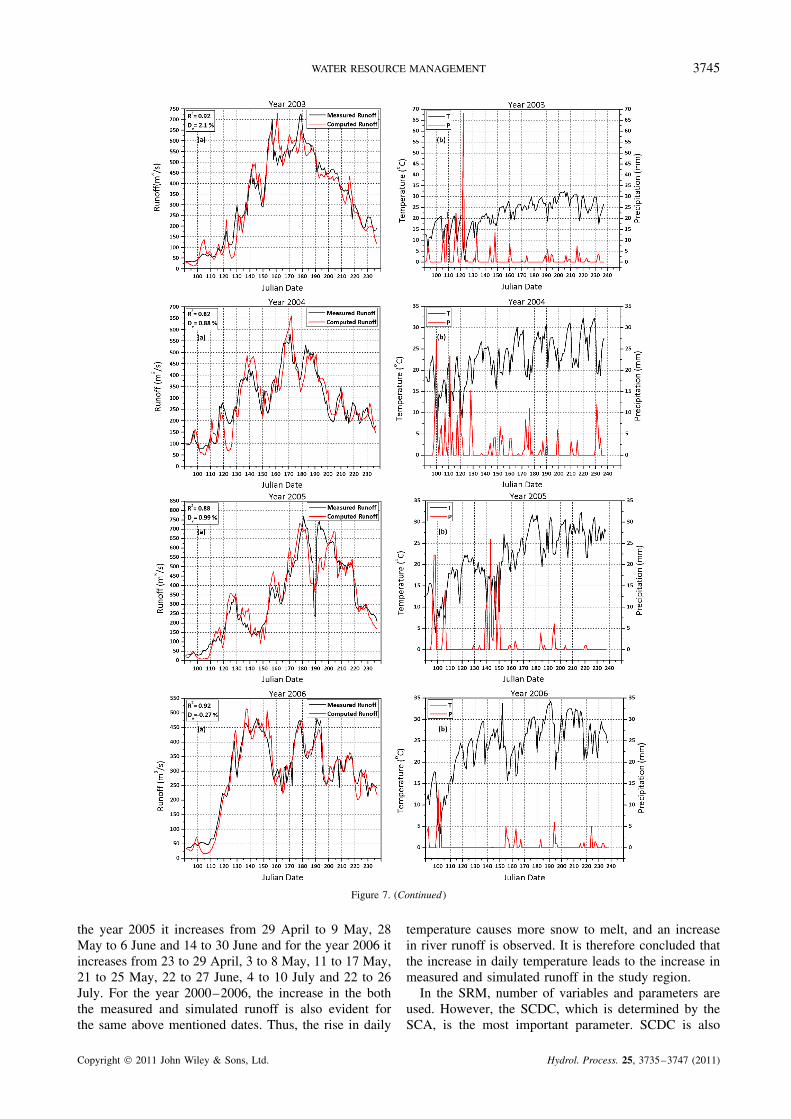
Similarly, for the simulation period the detaileddescription of daily SRM simulation results and dailymeasured air temperature and precipitation for the years2000–2006 are expressed in Figure 7a and b.
It is beyond the scope of this study to discuss theresults on a daily basis. Thus, we have limited ourdiscussion only to the periods for which the temperature
has an increasing trend for 5 or more consecutive days.For example, for the year 2000 the temperature increasesfrom 17 to 27 April, 6 to 13 May, 13 June to 1 July, 6 to11 July and 20 to 25 July, for the year 2001 it increasesfrom 29 April to 20 May, 8 to 15 June, 26 June to 12July, 19 to 24 July and 2 to 8 August, for the year 2002it increases from 19 to 23 April, 5 to 19 May, 23 Mayto 19 June, 28 June to 4 July, 14 to 19 July and 3 to15 August, for the year 2003 it increases from 14 to 26May, 31 May to 10 June, 15 to 28 June and 15 to 23July, for the year 2004 it increases from 3–7 April, 25to 29 April, 4 to 23 May, 4 to 9 June, 13 to 21 June, 29June to 7 July, 24 to 29 July and 14 to 20 August, for
Figure 7. For the melt season of years 2000–2006. (a) Comparison of the SRM computed and measured runoff; (b) temperature and precipitationdata
Copyright 2011 John Wiley & Sons, Ltd. Hydrol. Process. 25, 3735–3747 (2011)
WATER RESOURCE MANAGEMENT 3745
Figure 7. (Continued )
the year 2005 it increases from 29 April to 9 May, 28May to 6 June and 14 to 30 June and for the year 2006 itincreases from 23 to 29 April, 3 to 8 May, 11 to 17 May,21 to 25 May, 22 to 27 June, 4 to 10 July and 22 to 26July. For the year 2000–2006, the increase in the boththe measured and simulated runoff is also evident forthe same above mentioned dates. Thus, the rise in daily
temperature causes more snow to melt, and an increasein river runoff is observed. It is therefore concluded thatthe increase in daily temperature leads to the increase inmeasured and simulated runoff in the study region.
In the SRM, number of variables and parameters areused. However, the SCDC, which is determined by theSCA, is the most important parameter. SCDC is also
Copyright 2011 John Wiley & Sons, Ltd. Hydrol. Process. 25, 3735–3747 (2011)

3746 M. J. BUTT AND M. BILAL
useful to analyze the effect of seasonal snow cover atdifferent elevation zones. The percentage of area coveredwith snow for the years 2000–2006 is 35Ð34, 32Ð15,37Ð07, 40Ð77, 39Ð85, 42Ð02 and 36Ð83%, respectively.The year 2005 has the highest percentage of SCA whilethe year 2001 has the lowest percentage of SCA. TheSRM results shown in Figure 7 for the years 2000–2006show that the Nash–Sutcliffe coefficient of determination(R2) is equal to 0Ð86, 0Ð86, 0Ð86, 0Ð92, 0Ð82, 0Ð88 and0Ð92 while the volume difference (DV) is equal to 1Ð5,1Ð4, 1Ð7, 2Ð1, 0Ð88, 0Ð99 and �0Ð27%, respectively. Theaverage value of R2 for the entire period of study onthe Astore River is 0Ð87 while the average value of DV
is 1Ð18%. Similarly, the value of correlation coefficientbetween measured runoff and simulated runoff is 0Ð95.These results indicate that the SRM accuracy determinedin the current study is quite good and can be appliedfor runoff forecasts in the Indus River basin in northernPakistan for water resource management.
Similarly, the highest average daily temperature duringthe simulation period is observed for the year 2001while the lowest daily average temperature is observedduring the year 2005. As expected, the smallest areacovered with snow is during the year 2001, whereas thehighest area covered with snow is during the year 2005.Similarly, the highest amount of precipitation during thesimulation period is observed for the year 2003 whilethe lowest amount of daily precipitation is observed forthe year 2006. The difference in measured and computedrunoff is highest during the year 2003 while the differencein measured and computed runoff is lowest during theyear 2006. The results of this study show that theamount of SCA is inversely related with average dailytemperature in the region, that is, an increase in averagedaily temperature leads to the less area covered withsnow and vice-versa. This study further shows that withthe increase in average precipitation, the error in themeasured and computed runoff also increases.
CONCLUSION
It is concluded from the results of the current studythat the temperature and SCA are inversely correlated.Due to the rise in temperature from April to August,the runoff is dominated by snow and glacier melt andthus a number of peaks are observed in the simulation.In addition, precipitation events due to the summermonsoon occurred from June to August also contributedto the runoff in the simulation results. The decreaseof simulated discharge which does not agree with themeasured discharge is caused by the overestimation ofthe recession flow. The high accuracy of the SRM runoffsimulations 2000–2006 for the Astore River shows thatthe SRM is suitable for water resource management inthis region. The values of R2 and DV (%) testify that theSRM in combination with SCA derived from MODIS isgood for daily runoff simulations and could be calibratedfor long term runoff simulation for the Astore River.
According to a prevalent regime of affairs in a developingcountry like Pakistan, the SRM is immensely helpful inwater resource management which is emerging as a newdimension of potential security threats.
REFERENCES
Barnes WL, Pagano TS, Salomonson VV. 1998. Prelaunch characteris-tics of the moderate resolution imaging spectroradiometer (MODIS)on EOS AM1. IEEE Transactions on Geosciences and Remote Sensing36(4): 1088–1100.
Brubaker K, Rango A, Kustas W. 1996. Incorporating radiation inputsinto the Snowmelt runoff model. Hydrological Processes 10:1329–1343.
Dewalle DR, Rango A. 2008. Principles of Snow Hydrology . CambridgeUniversity Press: Cambridge, New York.
Dey B, Sharma VK, Rango A. 1989. A test of snowmelt runoff modelfor a major river basin in Western Himalayas. Nordic Hydrology 20:167–178.
Gomez-Landesa E, Rango A, Bleiweiss M. 2004. An algorithm toaddress the MODIS bowtie effect. Canadian Journal of Remote Sensing30(4): 644–650.
Ferguson RI. 1999. Snowmelt runoff models. Progress in PhysicalGeography 23: 205–227.
Hall DK, Martinec J. 1985. Remote Sensing of Ice and Snow , Chapmanand Hall: New York.
Hall DK, Riggs GA, Salomonson VV. 1995. Development of methodsfor mapping global snow covers using moderate resolution imagingspectroradiometer (MODIS) data. Remote Sensing of Environment 54:127–140.
Hall DK, Riggs GA, Salomonson VV, Digirolamo NE, Bayr KJ. 2002.MODIS snow cover products. Remote Sensing of Environment 83:181–194.
Immerzeel WW, Droogers P, De Jong SM, Bierkens MFP. 2009. Largescale monitoring of snow cover and runoff simulation in Himalayanriver basins using remote sensing. Remote Sensing of Environment 113:40–49.
Klemes V. 1990. The modelling of mountain hydrology: the ultimatechallenge. In Hydrology of Mountainous Areas, Proceedings of the HighTatra Symposium, 1988, IAHS Publication No. 190: Oxfordshire, UK;51–59.
Liu CY, Li J, Weisz E, Schmit TJ, Ackerman SA, Huang HL. 2008.Synergistic use of AIRS and MODIS radiance measurements foratmospheric profiling. Geophysical Research Letters 35(21): L21802.
Martinec J. 1975. Snowmelt runoff model for stream flow forecasts.Nordic Hydrology 6: 145–154.
Martinec J, Rango A. 1986. Parameter values for snowmelt runoffmodelling. Journal of Hydrology 84: 197–219.
Martinec J, Rango A, Major E. 1983. The Snow-melt Runoff Model(SRM) User’s Manual . NASA Reference Publication No. 1100,Washington DC, 118.
Martinec J, Rango A, Roberts R. 1994. Snowmelt runoff model (SRM)user’s manual. In Geographica Bernensia , Baumgartner MF (ed).Department of Geography, University of Bern: Bern, Switzerland.
Martinec J, Rango A, Robert R. 1998. Snow Runoff Model (SRM) User’sManual . Available: http://hydrolab.arsusda.gov/cgi-bin/srmhome[Accessed: 2005].
Meng L, Tao L, Li J, Wang C. 2008. A system for automatic processingof MODIS L1B data. 8th International Symposium on Spatial AccuracyAssessment in Natural Resources and Environmental Sciences, June2008, Shanghai, China, 335–343.
Mitchell KM, Dewalle DR. 1998. Application of the snowmelt runoffmodel using multiple parameter landscape zones on the Towandacreek basin, Pennsylvania. Journal of the American Water ResourcesAssociation 34: 335–346.
Nagler T, Rott H, Malcher P, Muller F. 2008. Assimilation ofmeteorological and remote sensing data for snowmelt runoffforecasting. Remote Sensing of Environment 112: 1408–1420.
Nash JE, Sutcliffe JV. 1970. River flow forecasting through conceptmodels, part I—a discussion of principles. Journal of Hydrology 10:282–290.
Perez-Pena JV, Azanona JM, Azor A. 2009. CalHypso: an ArcGISextension to calculate hypsometric curves and their statistical moments.Applications to drainage basin analysis in SE Spain. Computer andGeosciences 35(6): 1214–1223.
Copyright 2011 John Wiley & Sons, Ltd. Hydrol. Process. 25, 3735–3747 (2011)
WATER RESOURCE MANAGEMENT 3747
Rango A. 1993. Snow hydrology processes and remote sensing.Hydrological Processes 7: 121–138.
Rango A, Martinec J. 1979. Application of a snowmelt runoff modelusing Landsat data. Nordic Hydrology 10: 225–238.
Rango A, Martinec J. 1981. Accuracy of snowmelt runoff modelsimulation. Nordic Hydrology 12: 265–274.
Rango A, Martinec J. 1995. Revisiting the degree-day method forsnowmelt computation. Water Resources Bulletin 31(4): 657–669.
Richard C, Gratton DJ. 2001. The importance of the air temperaturevariable for the snowmelt runoff modeling using the SRM.Hydrological Processes 15(18): 3357–3370.
Riggs G, Hall DK. 2002. Reduction of cloud obscuration in the MODISsnow data product. 59th Eastern Snow Conference, 5–7 June 2002,Stowe, Vermont USA, 205–212.
Salomonson VV, Barnes W, Masuoka EJ. 2005. Introduction to MODISand an overview of associated activities. DOI: 10.1007/978-3540-37293-6 2.
Seidel K, Martinec J. 2004. Remote Sensing in Snow Hydrology: RunoffModelling, Effect of Climate Change. Springer: Berlin.
Seidel K, Martinec J, Baumgartner MF. 2000. Modelling runoff andimpact of climate change in large Himalayan basins. In Proceedingsof the International Conference on Integrated Water ResourcesManagement for Sustainable Development, New Delhi, India,1020–1028.
Shafer BA, Jones EB, Frick DM. 1981. Snowmelt runoff simulationsusing the Martinec-Rango model on the South Fork Rio Grandeand Conejos River in Colorado. AgRISTARS Report CP-G1- 04072,Goddard Space Flight Center, Greenbelt, Maryland.
Snow and Ice Hydrology Project. 1990. Snow and Ice Hydrology Project,Upper Indus Basin, Overall Report . WAPDA- IDRC-Wilfrid LaurierUniversity, 179.
Tekeli AE, Akyurek Z, Sorman. AA, Sensoy A, Sorman AU. 2005.Modelling the temporal variation in snow covered area derived fromsatellite images for simulating/forecasting of snowmelt runoff inTurkey. Remote Sensing of Environment 97: 216–230.
US Army Corps of Engineers. 1956. Snow Hydrology: Summary Reportof the Snow Investigations . US Army Corps of Engineers, North PacificDivision: Portland, OR.
US Army Corps of Engineers. 1998. Engineering and Design, Runofffrom Snowmelt. Department of Army . US Army Corps of Engineers:Washington DC.
Wake CP. 1989. Glaciochemical investigations as a tool for determiningthe spatial and seasonal variation of snow accumulation in the CentralKarakorum, Northern Pakistan. Annals of Glaciology 13: 279–284.
WinSRM. 2005. WinSRM User’s Manual . Available: http://hydrolab.arsusda.gov/cgi-bin/srmhome [Accessed: 2007].
WinSRM. 2008. Snowmelt runoff model (SRM) user’s manual. InAgricultural Experiment Station, Special Report 100, College ofAgriculture and Home Economics , Gomez-Landesa E, Bleiweiss MP(eds). New Mexico State University: Las Cruces, New Mexico, USA.
World Meteorological Organization. 1986. Intercomparison of modelsof snowmelt runoff . Operational Hydrology Report 23, Geneva,Switzerland.
World Meteorological Organization. 1992. Simulated real-time intercom-parison of hydrological models . Operational Hydrology Report 38,WMO No. 779, Geneva, Switzerland.
Copyright 2011 John Wiley & Sons, Ltd. Hydrol. Process. 25, 3735–3747 (2011)