Medial Opening Wedge High Tibial Osteotomy in Knee ... - MDPI
Upload
khangminh22Category
view
1download
0
RELIABILITY OF ROCK SLOPES WITH WEDGE MECHANISMS
by
BAK KONG LOW
B.S., Massachusetts Institute of Technology(1979)
SUBMITTED. IN PARTIAL FULFILLMENTOF THE REQUIREMENTS FOR THE
DEGREE OF
MASTER OF SCIENCE
at the
MASSACHUSETTS INSTITUTE OF TECHNOLOGY
(AUGUST, 1979)
Signature of Auth
Certified by.....
Certified by.....
Accepted by......
.... .w.. .... .... .. : . . . ... - .............
Department of Civil Engineerin . ust24,
Herbert H. Einstein, The Supervisor
.. . o# .. ' ......... ..
Daniele Veneziano, Thesis Supervisor
.rchives- - --o -- -- -- -... - --.--...-MASSACHUSETTS INSTITUTE Chairman, Department Committee
OF TECHNOLOGY
NOV 2 6 1979
LIBRARIESV/
o)r.
RELIABILITY OF ROCK SLOPES WITH WEDGE MECHANISMS
by
BAK KONG LOW
Submitted to the Department of Civil Engineering
on August 24, 1979 in partial fulfillment of the requirements
for the Degree of Master of Science
ABSTRACT
A model is presented for reliability of wedge mechanisms in rockslopes. Only potential sliding along the line of intersection isconsidered and limit equilibrium analysis is used. The action of water
and the effect of incomplete joint persistence are included. The factorof safety (ratio between mean resistance and mean driving force) is
calculated as an explicit function of joint orientation angles, height,
slope inclination, water and resistance parameters. If some or all of
these parameters are random, then safety is better measured in termsof the second moment reliability index, 3. A numerical procedure isdeveloped and implemented for the calculation of this index. In
actual calculations, only two sets of uncertain parameters are consi-
dered, one set includes joint orientation angles, the other includesresistance and water parameters.
Thesis SupervisorTitle
Thesis SupervisorTitle
Herbert H. EinsteinAssociate Professor
Daniele VenezianoAssociate Professor

ACKNOWLEDGEMENTS
I would like to thank Professor Herbert H. Einstein and Professor
Daniele Veneziano for their valuable guidance and suggestions in the
course of supervising my thesis.
The helpful discussions with Professor Gregory Baecher, with Mr.
Kevin O'Reilly, and with Mr. Edward Glynn are also acknowledged.
Sally Brunner typed the manuscript of this thesis. Her cooperative
and careful attitude is appreciated.
The partial financial support for the work of this thesis,
provided by the United States Bureau of Mines under Contract No. 027-
5015, is acknowledged.
I am grateful to my parents for their trust in me and their invalu-
able moral support.

4
TABLE OF CONTENTS
page
CHAPTER 1. INTRODUCTION 8
CHAPTER 2. DESCRIPTION OF MODEL 10
2.1 Joint Model 11
2.2 Idealized Water Conditions 15
CHAPTER 3. THE FACTOR OF SAFETY 25
3.1 Derivation of the Equation 25
3.2 Requirements for Sliding Along the 36Line of Intersection
3.3 Safe Regions in the y y2 Plane 40
CHAPTER 4. CALCULATION OF THE SECOND MOMENT RELIABILITY 49INDEX
4.1 The Reliability Index, S 49
4.2 Approximate Calculation of S 52
1. Only Geometric Uncertainty 52
2. Uncertainty on Resistance and Water 75Pressure Only
CHAPTER 5. SUMMARY AND CONCLUSIONS 101
APPENDIX A. KINEMATIC REQUIREMENTS FOR SLIDING ALONG 103THE LINE OF INTERSECTION OF TWO JOINT PLANES
APPENDIX B. AREAS OF BOUNDING TRIANGLES AND VOLUME OF 107WEDGE
REFERENCES 113

LIST OF TABLES
page
1 to 11 Example Runs for Calculation of S. 54(Only Geometric Uncertainty)
12 to 17 Example Runs for Testing Robustness of 67Search Algorithm for One Case with OnlyGeometric Uncertainty
18 to 25 Example Runs for Calculation of .79(Uncertainty on Resistance and WaterPressure Only)
26 to 30 Example Runs for Testing Robustness ofSearch Algorithm - Case 1 (Uncertaintyon Resistance and Water Pressure Only)
31 to 35 Example Runs for Testing Robustness of 96Search Algorithm - Case 2 (Uncertaintyon Re'sistance and Water Pressure Only)

LIST OF FIGURES
page
2.1 Maximum Strength and Residual Failure Envelope 12for Initially Intact Specimens
2.2 Failure Envelopes Expected for Rock Masses 12
2.3 Strength of Intact and Jointed Specimens of 13Quartz Monzonite
2.4 Stress-Strain Relations that Lead to Simultaneous 13Mobilization of Intact Rock and Joint Strength
2.5 Idealized Water Condition 16
2,6 Water Pressure Distribution along the Line of 17Intersection BO
2.7 Water Pressure Distribution on Triangular Plane 19that Bounds the Wedge
hw2.8 Plot of Water Parameter G vs - for Different 24Values of n
w
3.1 Notations 30
3.2 Joint Orientations for Which Wedge Can Slide Along 38the Line of Intersection
3.3 Variation of F.S. = 1 Curves with Joint Orientation 41Angles, for (a2-a1) < 900
3.4 Variation of F.S. = 1 Curves with Joint Orientation 44Angles, for (21 >
3.5 Dependence of the Safe Region on Joint Strength 46
3.6 Variation of the Quantity Volume with y and y 48wit and
4.1 Illustration of f in the Plane 51
4.2 Geometric Uncertainty Only: 30 Runs with Randomized 73Directions During the First Search and Run withDeterministic Directions

4.3 Geometric Uncertainty Only: Reliability 74Index 0 vs F.S. for Two Sets of Cases
4.4 Variation of 6 with Standard Deviations of 76Strike and Dip of the Joint Planes Boundingthe Wedge
4.5 a vs. F.S. Only Joint Resistance and Water 78Parameter Uncertainty
4.6 Only Joint Resistance and Water Pressure 89Uncertainty: 20 Runs with RandomizedDirections During the First Search and Runwith Deterministic Directions - Case 1
4.7 Only Joint Resistance and Water Pressure 90Uncertainty: 20 Runs with RandomizedDirections During the First Search andRun with Deterministic Directions - Case 2
A.1 Kinematic Requirement for Sliding 104
Area of Bounding Planes and Volume of WedgeB. 1 108

CHAPTER 1
INTRODUCTION
The design of stable rock slopes is an important issue in many
civil and mining engineering activities, such as cuts for transporta-
tion corridors, reservoirs, open-pit mine slopes and underground
openings. The design is influenced not only by safety considerations
but also by constraints on environmental impact and economic pressures
to produce resources at low costs.
The present study deals with one aspect of the slope stability
problem, namely the reliability of wedge mechanisms which might slide
along the intersection of two joint planes. Situations where the
wedge may fail by toppling, rotation or sliding on a single plane are
not treated herein.
Chapter 2 described the mechanical model used in this study. A
model for joints is presented first, followed by an idealization of
water-induced forces. Underlying assumptions, limitations of the
models, and alternative interpretation of some of its parameters are
discussed thereafter.
Chapter 3 first shows how the Factor of Safety based on the model
in Chapter 2 can be expressed explicitly as a function of joint orien-
tation angles, height of wedge, and water and resistance parameters.
Section 3.2 discusses the requirements for sliding along the line of
intersection. Section 3.3 presents plots showing how the safe regions

vary with changes in joint orientation angles and in water and
resistance parameters. The physical meaning of the plots is also
discussed.
An algorithm for calculating the second moment reliability index,
3, is proposed in Chapter 4, first for the case of only geometric
uncertainty, and then for the case of only joint resistance and water
parameter uncertainty. Numberical results are given and samples of
computer printout are attached.
A summary and conclusions follow in Chapter 5.
CHAPTER 2
DESCRIPTION OF MODEL
A model is presented herein for the analysis of rock slope
stability with respect to wedge mechanisms. The underlying assumptions
are outlined first, followed by description of rock and joint behavior
and of the action of water.
The following general assumptions are made:
1. The rock mass which is subject to potential sliding failure is
assumed to behave like a rigid body and the stability criterion
is based on limit equilibrium analysis.
2. Water pressure and the weight of the wedge are the only two forces
that may induce failure.
3. The presence of water in a joint has no effect on its strength.
4. Only tetrahedral wedges formed by 2 intersecting joints are
considered. Hence, tension cracks are excluded from the study.
5. Potential sliding is considered only along the intersection of two
joints. Situations where wedges may slide along one plane only are
not analyzed here but they will be considered briefly in Chapter 3.
Failure by rotation or toppling are excluded. The implicit assump-
tion is that the lines of action of all the forces are concurrent
at the centroid of the wedge, so that all moments are zero.
6. The crest of the slope is horizontal.
7. The frictional resistance of the joints and the intact strength of
the rock are mobilized simultaneously when sliding failure occurs.
2.1 Joint Model
The model treats joint planes as consisting of a jointed portion
and a set of intact rock bridges. The fraction of the joint plane area
that is actually discontinuous is called the persistence of the joint
plane; we shall denote this quantity by k. The fraction of the joint
plane that is intact is denoted by I, hence I = 1 - k.
Usually, the relationship between shear strength of intact rock,
Ti, cohesion, cr, and angle of internal friction, can be approxi-
mated by the equation (see Figs. 2.1 and 2.2):
T. = cr +a tan$. (2.1)
where a denotes normal stress at failure.n
For the jointed portion, the shear strength, T, is given by:
T = a tant. (2.2)
where 4. denotes the joint frictional angle.
In order for sliding failure to occur, all intact portions of
the two joint planes have to be broken off. Assuming simultaneous
mobilization of strength (Fig. 2.4), the combined resistance of
jointed and intact portions can be expressed as (in terms of forces
instead of stresses):
Resistance = (Joint Resistance) + (Intact Rock Resistance)
(k1N1tan$ +k2N2tan$2j)+(Crl 1 A1 +1 N tant +Cr2 2A2+I2N2tan$2i

4
r
0 Normal Load, N
Fig. 2.1 Maximum strength and residual failure envelope forinitially intact specimens. (From: Deere, Hendron,Patton, Cording)
Normal Load, N
Fig. 2.2 Failure envelopes expected for rock masses.(From: Deere, Hendron, Patton, Aiyer).

-2 0 2 4 6 8 10 12 14 16 18 20Tensile strength Normal Stress a nlb/in2 x 103)
Fig. 2.3 Strength of intact and jointed speciments of quartzmonzonite. (From: U.S. Corps Engrs.)
0)0
X44to
Friction along joint
r
displacement 6
Fig. 2.4 Stress-strain relations that lead to simultaneousmobilization of intact rock and joint strength.

where Nl, N2 = effective normal force on plane 1 and plane 2
respectively
* , $ 2j = joint frictional angle for plane 1 and plane 2
respectively
* , * .= internal frictional angles for intact rock on planes 1li 2i
and 2.
Figure 2.3 shows that the internal frictional angle for intact
rock, *., may differ substantially from the joint frictional angle,
* . However, stability becomes questionable only when I ~ 0 (when
k ~ 1.0), and under such circumstances the contribution from terms of
the type kNtant dominates that from terms of the form I1 Ntan*.
Therefore, joint resistance will be calculated by setting $ = *
in Equation 2.3. Since k + I = 1, it follows that
(2.4)Resistance = N1tan$ + N2tan$2j + Crl11 A + Cr2 2A2
From now on the subscript j will be dropped, it being understood
that $ denotes the joint frictional angle.
Some typical shear strength parameters of intact rock are given
below, from Stagg and Zienkiewicz (Rock Mechanics in Engineering
Practice):
Granite
Limestone
Sandstone
Cohesion(1000psf)
Range Average
200-840 500
72-720 430
86-864 230-600
$i (degrees)
Range Average
51-58 55
37-58 50
48-50 48

In the equation for the Factor of Safety (Eq. 3.3) it will
become apparent that, due to high cohesion of the intact rock, a very
small value of I is sufficient to ensure stability of the wedge.
2.2 Idealized Water Conditions
Water pressure is assumed to act only along the 2 joint planes, in
direction normal to the planes. Its effect on the safety of tetrahedron
wedges will be shown in this section to depend entirely on dimension-
less parameters G and G , which, in terms of quantities defined inwl w2
Fig. 2.5, are given by
3 hw3wG n0 <n < 1, < <
rhw 3 hwGw2 n w2 h 0 w2 1, 0 < 1
These expressions refer to a horizontal water table (see Fig. 2.5)
at height hw (the same for both joint planes) above the daylighting
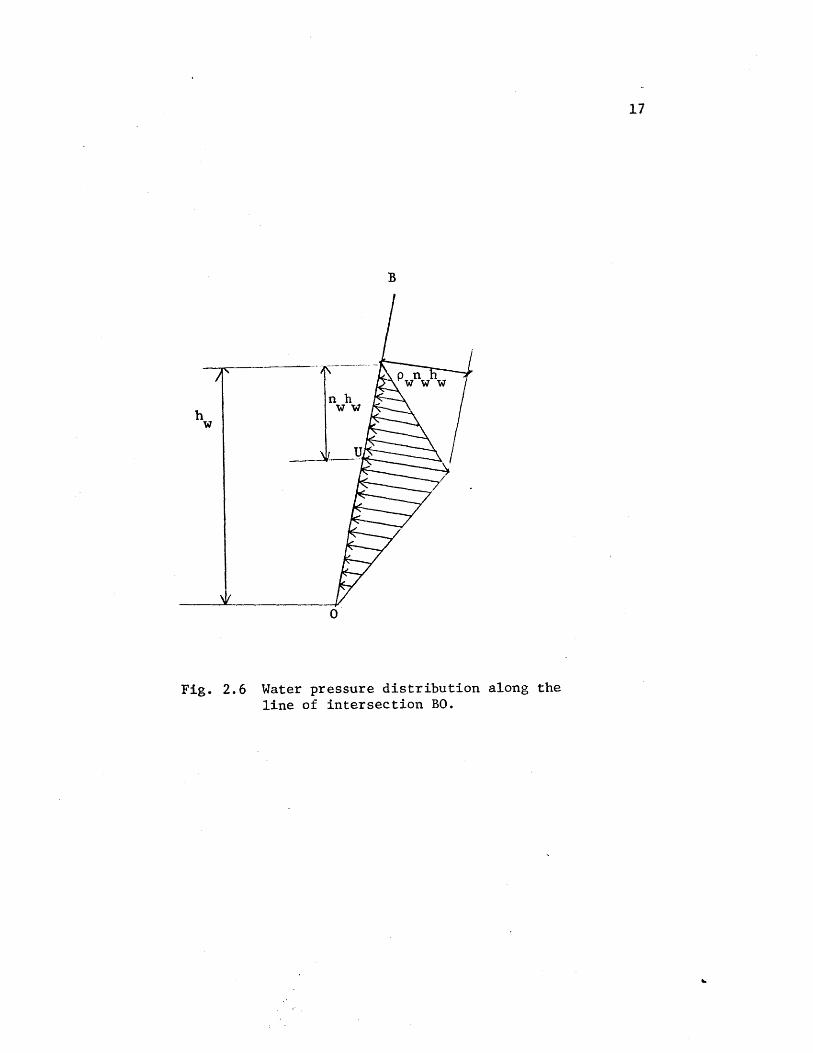
point 0. Along the line of intersection BO, water pressure is assumed
to increase hydrostatically from zero at the water surface to a
maximum at a point U at depth n h below the water table. Waterw w
pressure is assumed to decrease linearly from the maximum value
p n h at U to the value zero at the daylighting point 0 (Fig. 2.6),
and to be zero along the segments EG, GO, OF, FE. The quantities, nwl
and n 2 , can take on different values to reflect different variations
of permeability with depth on the triangular planes that bound the
wedge.

Fig. 2.5 Idealized Water Condition
17
B
p wn h
n hhw
U
0
Fig. 2.6 Water pressure distribution along theline of intersection BO.

18
Within the triangles EGO and FOE, the water pressure distribution
is assumed to be represented by pyramids with EGO and FOE as bases and
with apices at distances pwnwlhw and p nw2hw above points U and U2
respectively (Fig. 2.7).
In Figure 2.7, the height of pyramid, AU1 , is equal to pw n whw
It represents the maximum value of water pressure on plane EGO. The
total water force on that plane is given by the volume of the pyramid,
which is equal to x (Area of Base) x (Height). Thus
31
Total Water Force = - x (Area of EGO) x p n h3 w wl w
By properties of similar triangles, the ratio of area of
triangles EGO to BDO in Fig. 2.5 is given by:
Area EGO hw2
Area BDO h2
Denote by A1 the area BDO, then
Area EGO = ( 2
Hence,Ih2
F '( ) A x Pnhwl Ah 1 Pwnwl w
1 P Anrhw)3w l wl
or F 1 PhAGwl 3 w 1lwl (2.5)

G -
U
0
AU = height of pyramid
= maximum value of water pressure
= p n h
Fig. 2.7 Water pressure distribution on triangularplane that bounds the wedge.

where F denotes the total water force on triangle BDO andwl
3G =n hw) (2.6)wl wl h
Similarly,
F P hA G (2.7)w2 3 wh2 w2
3where Gw2 = n 2 ( ) (2.8)
The water pressure distributions as presented above are idealiza-
tions of the complex groundwater flow process that occurs in reality.
The assumption is that the wedge is impermeable and water acts only
along the two joint planes that bound the wedge. Only steady state
ground-water condition is modeled and transient flow is neglected.
In reality, for porous or highly fractured material, transient varia-
tion in the groundwater regime can be critical, e.g. during rapid
drawdown on reservoir slopes, rapid excavation of open pits and where
there are changes in the groundwater regime brought about by earth-
quake activity or heavy precipitation. Perhaps more important, the
actual variation of permeability on the joint planes has been highly
idealized.
Possible presence of tension cracks and other fractures through
the wedge have been ignored. These cracks and fractures, if present
and filled with water, can greatly reduce the safety of the slope,
e.g. by activating failure mechanisms other than those considered here.

Another water related effect that has not been considered is
the expansive force from frost-wedging when joint water freezes during
the cold season. The cumulative effect of repeated thawing and
freezing can lead to deterioration of the rock and to significant
reduction of wedge safety. More likely, the detrimental effect comes
from breakage of the intact rock bridges on the joint planes and
hence from an increase of joint persistence. Records of rock falls
in a Canadian locality over several decades do show strong positive
correlation between the number of rock fall incidents and the moist
(snow precipitation) winter months.
So far, water pressure distribution around the wedge has been
treated with the implicit assumption that water flows in a non-deform-
able medium. That is, that the joints (and fractures) have rigid,
fixed openings and hence constant permeability in time.
Snow (1968) has discussed the effect of elasticity of fractured
media in response to fluid pressure, Since fracture openings are
very small (e.g. 100 P) and fracture spacings very large (e.g. 10 ft.),
the compression of blocks between fractures and the vertical extension
of the medium that take place due to an increase in water pressure
produces proportionately large increases of fracture openings.
Therefore, for deformable rock masses, a dynamic model of mutual
interaction between permeability and water pressure seems more
appropriate: Permeability affects water pressure, and is in turn
affected by it.
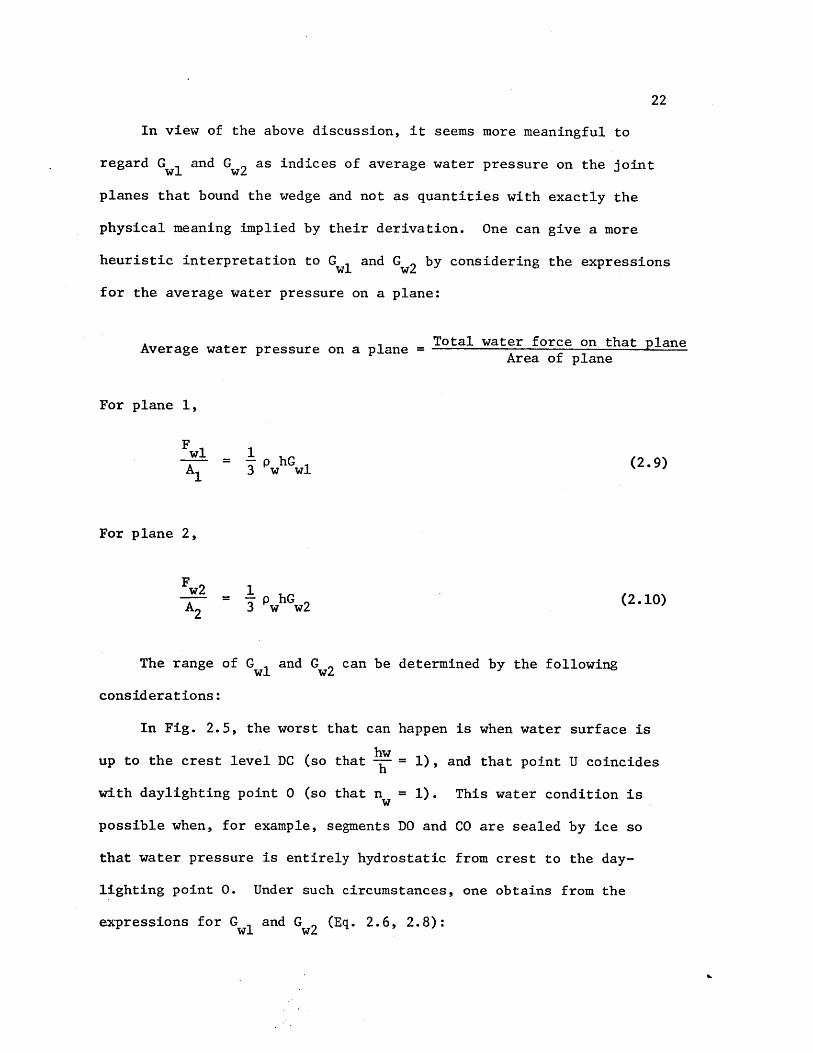
In view of the above discussion, it seems more meaningful to
regard G and Gw2 as indices of average water pressure on the joint
planes that bound the wedge and not as quantities with exactly the
physical meaning implied by their derivation. One can give a more
heuristic interpretation to G and Gw2 by considering the expressions
for the average water pressure on a plane:
Average water pressure on a plane =Total water force on that planeArea of plane
For plane 1,
Fwl 1A1 p whGl (2.9)
For plane 2,
Fw2 1
- p hG (2.10)A2 3 w w2
The range of G and G can be determined by the followingwl w2
considerations:
In Fig. 2.5, the worst that can happen is when water surface is
hwup to the crest level DC (so thatp = 1), and that point U coincides
with daylighting point 0 (so that nw = 1). This water condition is
possible when, for example, segments DO and CO are sealed by ice so
that water pressure is entirely hydrostatic from crest to the day-
lighting point 0. Under such circumstances, one obtains from the
expressions for Gwl and G 2 (Eq. 2.6, 2.8):
G = 1wl
G = 1w2
hwOn the other extreme, when joint planes are dry, = 0, so that
G = 0wl
Gw2= 0
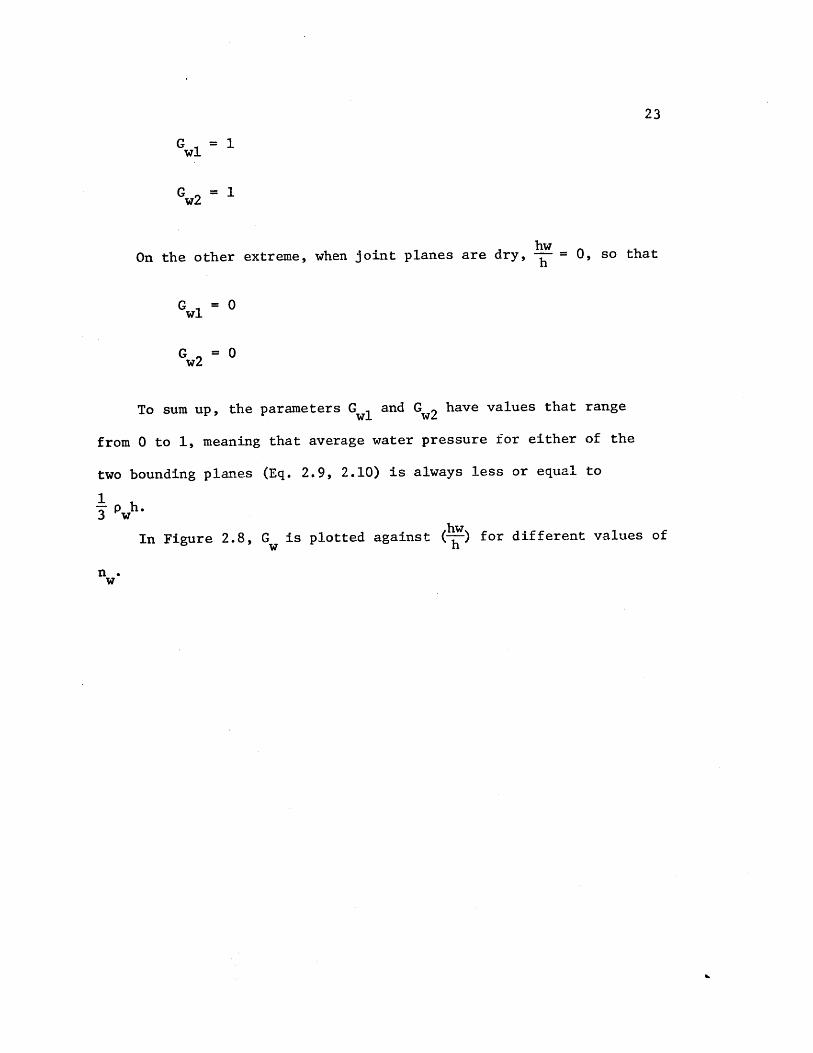
To sum up, the parameters Gwl and Gw2 have values that range
from 0 to 1, meaning that average water pressure for either of the
two bounding planes (Eq. 2.9, 2.10) is always less or equal to
1 h.3 Pw
In Figure 2.8, Gw is plotted against ( ) for different values of
n.w

0.90.8 4.
0.7
0.6
0.5
0.4
0.3-
0.1
0 0.1 0.2 0.3 0.4 0.5 0.6 0.7 0.8 0.9 1.0
hw
h
I. - -
Figure 2.8 Water parameter GW

CHAPTER 3
THE FACTOR OF SAFETY
3.1 Derivation of the Equation
In order for sliding along the line of intersection of two
joint planes to be possible, such a line must daylight both on the
slope and on the crest. For a horizontal crest, it is shown in
Appendix A that this kinematic requirement leads to the following
constraint on the orientation of the joints:
0 < tan21 sin( 2~a1 < a (3.1)sin 2 coty - sin- cotY2
where a is the inclination of the slope.
Wherever this condition is satisfied, the factor of safety for
limit equilibrium analysis is:
F.S. = Resistance/Driving Force (3.2)
(N -Fwl)tan 1+(N2-Ftw2)an*2+Crl A +Cr2 2A2
Tw12
with (N 1-Fw) > 0, (N2 -Fw 2 ) >
where N = Normal force on joint plane due to own weight
Fw = Water force (normal to joint plane)
* = Joint frictional angle
I = 1-k = Fraction of joint plane that is intact
(k = persistence)

A = Area of the triangle that bounds the wedge
T12 = Driving force along the line of intersection.
(Subscripts 1 and 2 identify the joint plane)
The various terms Ni, N2, F , Fw2, A1, A2 and T12 are functions
of combinations of the following:
Orientations of the two joints (S1, y1, 62' Y2
Inclination of the slope (a)
Height of wedge (h)
Water distribution parameters (Gw, Gw2)
Density of rock pr
Density of water pw
It is desirable to express the equation for the factor of
safety as an explicit function of these parameters. Such an expres-
sion makes it possible to make sensitivity considerations about the
Factor of Safety which would otherwise become apparent only after
lengthy numerical work.
In Appendix B, A1, A2 and V are expressed as functions of the
joint orientation angles 1, y1 , 2' Y2 , slope inclination a and h.
These expressions, together with the unit vector along the line of
intersection (Eq. A.7 in Appendix A) are used herein to obtain the
expressions for the following dimensionless terms in Eq. 3.2:
N1 Fwl N2 F C IA1 Cr2 2A2
T12 T 12 T 12 ' 12 T12 12

It is then shown in this chapter that Eq. 3.2 can also be
written as:
Crl 1 a1bGr2 2F.S. = (a-bGwl)tan$ +(a2-b2Gw2) an$2+3bn( ph)+ 3b2 n( phr r
(3.3)
where G = nlh)
G = hw 3Gw2 nw2 h 3
n = = specific density of rockp p__ ec
= density of rock
Cr, I, $ as defined previously
and where al, bl, a2 and b2 are dimensionless coefficients which depend
only on the orientation of the joint planes and on the inclination of
the slope. They are:
Na = T=
12
N2
a2 T =a12
b = w22 T12Gw2
(siny2coty1-cosy 2cos 2 1 ))/[sinsin( 2 -1)]
(cosy 1 cos( 2 - 1 )-siny1 coty2) [sinsin(62 -1)]
= a0 sin2 siny 2
= a sin1 siny
(3.4)
(3.5)
(3.6)
(3.7)
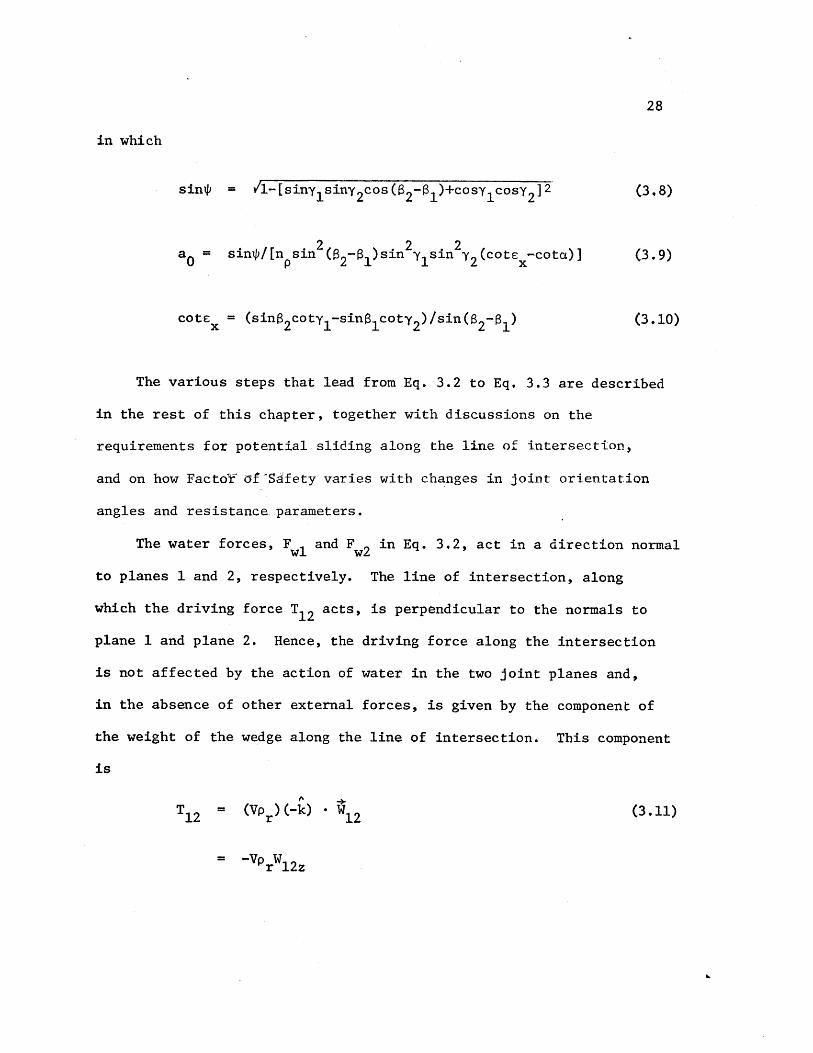
in which
sin$ = /1-[siny 1siny 2cos(6 2 - 1)+cosylcosy2 ]2 (3.8)
a0 = sin$/[n sin ( 2- 1 )sin 2ysin 2y2 (cote -cott)] (3.9)
cote = (sinS2coty 1-sinQ1coty2) /sin(8 2- 1) (3.10)
The various steps that lead from Eq. 3.2 to Eq. 3.3 are described
in the rest of this chapter, together with discussions on the
requirements for potential. sliding along the line of intersection,
and on how Factor of 'Safety varies with changes in joint orientation
angles and resistance parameters.
The water forces, F and FW2 in Eq. 3.2, act in a direction normal
to planes 1 and 2, respectively. The line of intersection, along
which the driving force T12 acts, is perpendicular to the normals to
plane 1 and plane 2. Hence, the driving force along the intersection
is not affected by the action of water in the two joint planes and,
in the absence of other external forces, is given by the component of
the weight of the wedge along the line of intersection. This component
is
T12 (VP(-k) 1 2 (3.11)
= -VPr 12z
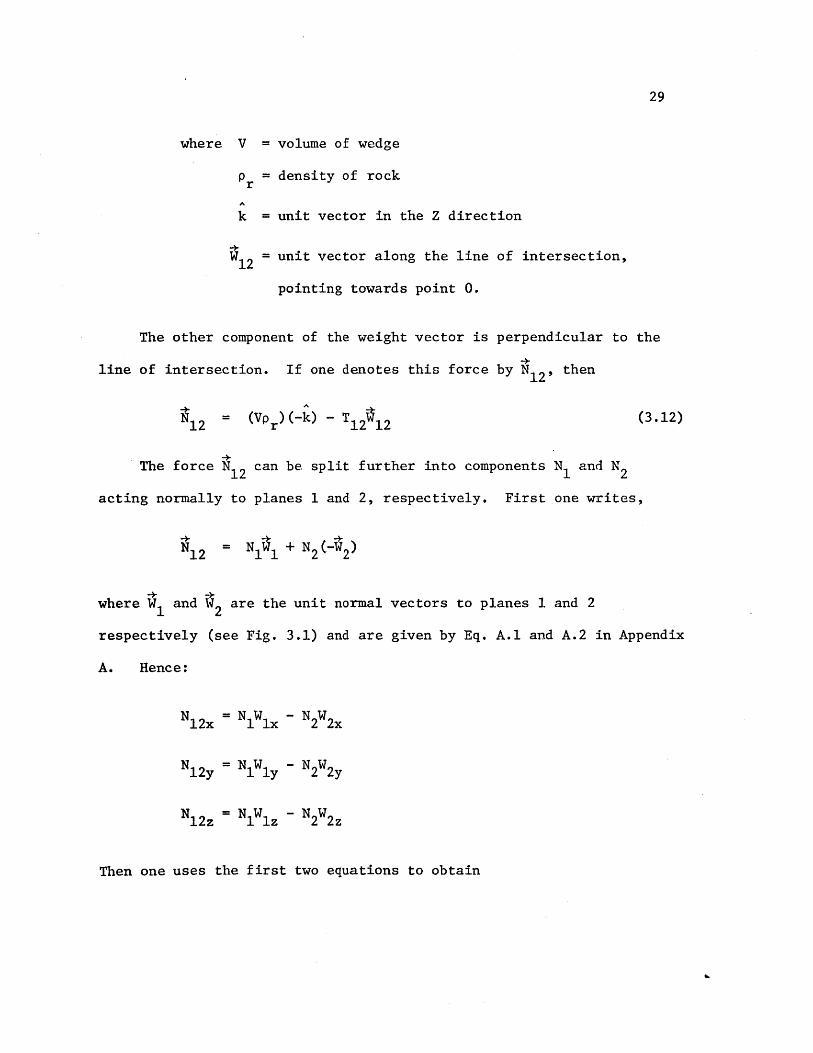
where V = volume of wedge
p = density of rockrA
k = unit vector in the Z direction
W = unit vector along the line of intersection,12Ipointing towards point 0.
The other component of the weight vector is perpendicular to the
line of intersection. If one denotes this force by N12 , then
Nl (VP )(-k) - T k~ 2 (3.12)N12 r 12 1
The force N12 can be split further into components N and N2
acting normally to planes 1 and 2, respectively. First one writes,
N12 W1 + N2 (W2)
where W and W2 are the unit normal vectors to planes 1 and 2
respectively (see Fig. 3.1) and are given by Eq. A.1 and A.2 in Appendix
A. Hence:
N =N W -N W12x 1 lx 2 2x
N = NW -N W12y 1 ly 2 2y
N = N W - N W12z 1llz 2 2z
Then one uses the first two equations to obtain

Q 06
Figure 3.1 Notations

(N12y 2x - 12xW2y1 ly 2x lx 2y
(N W -N W)N 12y lx 12x ly2 (W W2x Wlx 2y
where N12x 12 12x
N12y = -12 12y
(from Eq. 3.12)
The denominator, (W W2x - x W2y), equals X12z, the component
along Z of the vector product (W2 xW 1 X1 2).
N =
[-T1 2W2x W12y - (-T12 2yW 12x)]
x12z
and
N1 [WW -WW IfX
2y 12x 2x 12y 12z
Using Eq. A.7 in Appendix A, one may rewrite this as
N21 y [1 X
T 12 2y 12x 2xX12y X12zsin$]
Substituting from Eq. A.1 - A.5 in Appendix A, one obtains
Hence,

v
siny2cos 2 (cos sinY cosY2 -cos$2 cosy siny2 )-(-siny2 sin$2) (sin$ siny cosy2-sinS2 cosy siny2
sin(S- 2) siny1 siny 2sin$
_Cosa cos$.'cosy2- Cos2 a2siny coty +sin sinS cosy2-sin 2 2siny cotyy
sin(S- 2) sin$
cosy2c os 2~$1- siny 2coty1
sin(S-$2) sin*
siny2coty1 - cosy 2cos($2-0 1)
sin( 2-S1)sinO
N1
T 12
w vw w

This is Equation 3.4, shown earlier in this chapter.
Similarly,
N2T 12
_ ly W12x ~ lx 12yx12 z
cosy1cos(6 2- 1) - siny1coty 2
sin($ 2-Si )sin*
This is Eq. 3.5, shown earlier.
For the water condition assumed herein,
FwlFwi
Fw2
"3 EwhwlA1
= p hG A3 w w2 2
Therefore,
Fwl
T12
-1 13
S hGw A1-Pr W12z
Gwln (-W 1 2 )
hAwith b = (-- )
1 3np (-W12z(3.13)
=b 1G w
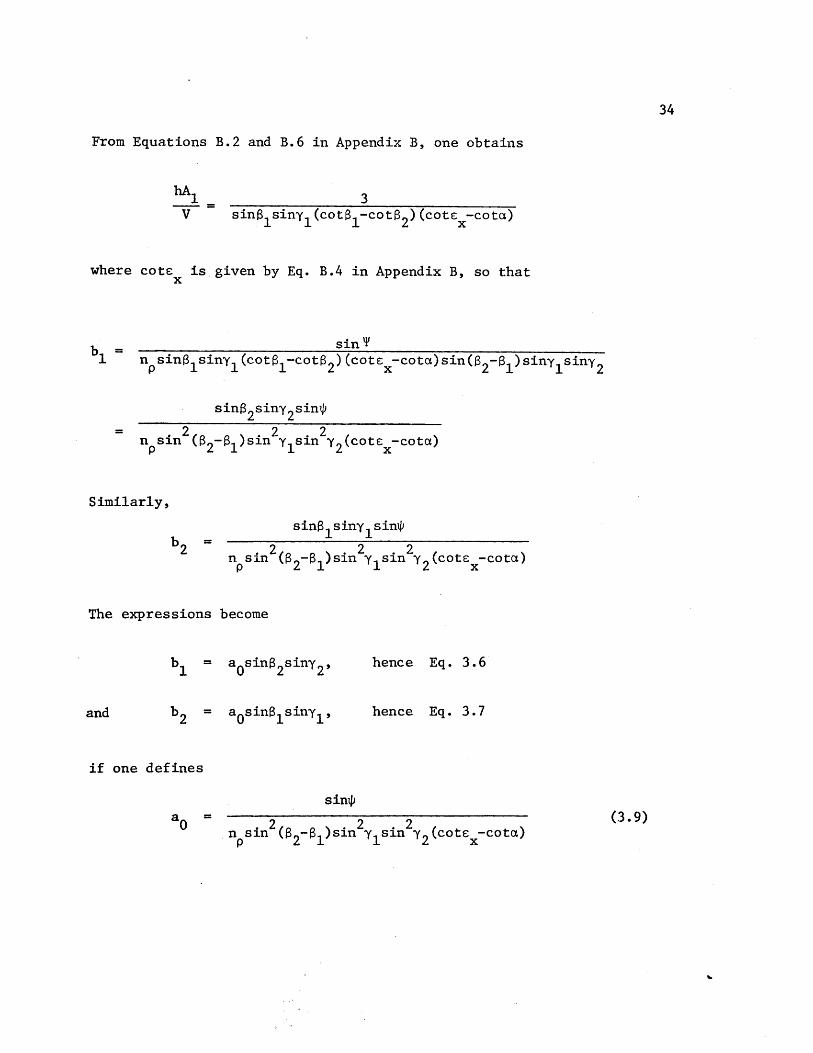
From Equations B.2 and B.6 in Appendix B, one obtains
hA
sin 1siny1 (cotS1 -cotS2) (cote -cota)
where cote is given by Eq. B.4 in Appendix B, so thatx
b =sin'T1 n sin 1 siny1 (cot 1 -cotS 2) (cote -cota)sin( 2- 1)siny 1siny 2
sinS2siny 2sin$
n p sin2 (2~1)sin 2Ysin Y2(cote -cota)
Similarly,
sin 1 siny1 sinO
n si ($2 ~ 1)sin2 y1sin
22 (cote -cota)
The expressions become
b1 = a0sinS 2siny2,
and b 2 = a0sin 1 siny1 ,
if one defines
hence Eq. 3.6
hence Eq. 3.7
sin$
2 2 2n sin (a2 ~ 1)sin y1 sin y2 (cote -cota)
(3.9)

We now proceed to consider the remaining terms of Eq. 3.2.
Dividing the third term of the numerator in Eq. 3.2 by the denominator,
one obtains
C rl11A1 Crl 1A
T12 r 12z
A h Crl 1= (1 ) ( )'-VW12 p rh12zr
From Eq. 3.13,
A h3nb =p 1 -12z
hence,
Crl IA 1 C r 1 1)T 2 = 3n Pb1prh
and similarly,
Cr2 2A2 Cr2 2= 3n b2T12 T r
This completes the rewriting of Eq. 3.2 into Eq. 3.3.

3.2 Requirements for Sliding Along the Line of Intersection
The expressions of the Factor of Safety in Eqs. 3.2 and 3.3
have been derived under the assumption that failure can occur only
by sliding of the wedge along the line of intersection of the
bounding planes. For this to be true, the normal force component on
each joint plane due to the weight of the wedge must exceed the
water force on the same plane, i.e., it should be that
N - F > 0
and N2 -Fw > 0
In the case where F = F = 0, the requirements can bewl w2
expressed as conditions of positivity for the quantities a and a2
in Eqs. 3.4 and 3.5.
Since the terms sinP (Eq. 3.8) and sin(O 2- 1) are always positive,
the requirements are equivalent to:
siny2cotyl - cosy2cos($ 2- 1) > 0 (3.14)
and cosy1cos (62- 1) - siny coty 2 > 0 (3.15)
or, given that 0 < y1 < 900, and 900 < y2 < 1800
|siny2cotylJ + |cosy 2 |cos(6 2- 1) > 0 (3.16)
|cosy 1Icos(62- 1) + jsiny1coty2 > 0 (3.17)and

One concludes that under the present constraints on 1 and y2'
conditions 3.14 and 3.15 are always satisfied if cos( 2- 1) > 0,
i.e. if l- < 90
In order to show what combinations of (2~ 1) > 900, Y and y2
correspond to potential sliding along the line of intersection, we first
rearrange Eqs. 3.14 and 3.15 and write them as:
siny2coty1 > cosy 2cos(2-1)
cosY1cos( 2 - 1) > siny 1coty 2and
(3.18)
(3.19)
Keeping in mind the constraints on y1 , Y2, expression 3.18 can be
further rewritten as
tany2 < tanY 1 cos(2~ l
(3.20)
Similarly, expression 3.19 can be rewritten as
I tanyljtany < (02-
Combining Eqs. 3.20 and 3.21, one obtains
I tany1 11 cos(2- 1 I itany I - I tanyll-21tany2 o s ( 2-SY)|
which is equivalent to the requirement of positivity for a1 and a.2 when
2 > 900.
The plot of Fig. 3.2 shows which combinations of ( 2- 1), m' l 2
(3.21)
(3.22)
tany 2 > Itanyy l cosO (2R 1)]

900
steeper
600
1800-Y2
300
300 600 900
y steeper
D C
0
Figure 3.2 Joint Orientations for which wedge can slidealong the line of intersection.

satisfy the inequality expression 3.22.
In the extreme case when 2-1 approaches 1800, expression 3.22 can
be satisfied only when y2 = 1 , as shown by the 62- 1 = 1600 curves in
Fig. 3.2.
One can show that the condition a 1 >0 is equivalent to CBO < 900
(Fig. 3.2) and that a 2> 0 is equivalent to DBO < 90", so that the
requirements for sliding along the line of intersection actually means (in
the dry state for which G = G = 0) that both DBO and CBO must bewl w2
smaller than 900. The expressions for DBO and CBO are obtained as
follows:
A unit vector along BD, WBO, has components
WBD = (-cosS , -sinS , 0)
Therefore, cosDBO WBD - W12
cosy 1siny2cos(6 2-%) - siny 1cosy 2
sin*
cosY 1cos(2-1) - siny1coty 2
sin/siny2
and cosDBO > 0 if the numerator in the previous expression is itself
greater than 0, i.e. if cosy cos(O2- 1 ) - siny coty2 > 0. This condition
is identical to that in expression 3.15. Similarly, it can be shown that
A0
CBO < 90 if and only if Eq. 3.14 is satisfied.
These conditions make physical sense: a weight placed on a slope
always tends to slide in the dip direction (the direction of maximum
gradient). Therefore, if DBO and CBO are both acute angles, potential

40
sliding is along the line BO; if on the contrary DBO is obtuse, sliding
is away from the line of intersection, on the plane BDO, as shown in the
figure below.B
D > 900
' V
Directionof Slide
0
Given the present constraints on y1 , Y2 , the angles DBO and CBO are
always smaller than 900 if DBC ( 2- 1 ) is less than 900. Hence the
curves in Fig. 3.2.
The shape of the no-daylighting-region changes with Bl and 2. That
shown in Fig. 3.2 corresponds to B = 100. The arrows bordering the
Figure show shifting of the no-daylighting boundary as (62~ 1) increases
from 900 to 1600.
3.3 Safe Regions in the yly2 Plane
This section deals with the variation of the safe regions with
joint orientation angles.
The plots in Fig. 3.3 show contour lines of the factor of safety
function at the level FS = 1 (safe region boundary) on the y1Y2 plane
for different values of wedge angle ( 2~01) and other parameters fixed
to the values given in the figure. The associated non-daylighting
regions vary as ( 2 ~01) increases from 400 to 900 as indicated by the
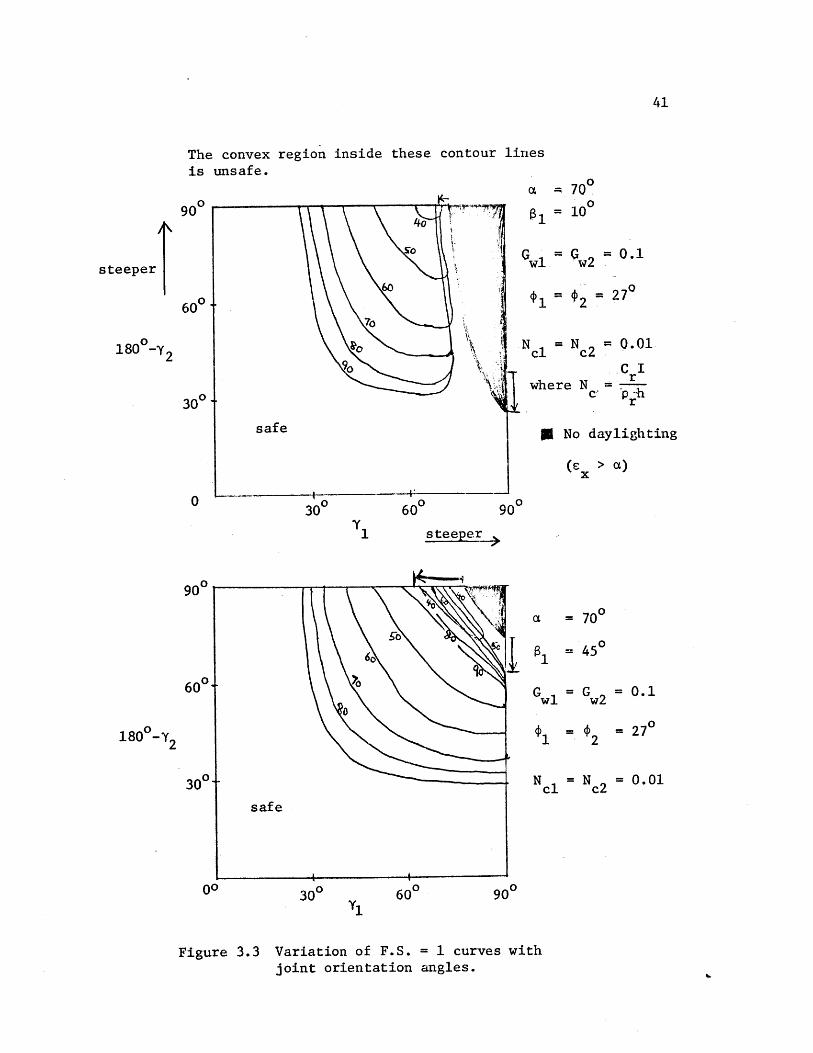
The convex region inside these contour linesis unsafe.
steeperi
90
60 0
300 600
a 700
= 100
G = G 0.1
2 = 270
Nc =N c2=0.01Ncl =c2
.C Iwhere N =
c, p -hr
S No daylighting
(E > a)
900
a 70
6 450
G = G = 0.1wi w2
1 2 = 2701 2
N = N c2=0.01
300 Y, 600 900
Figure 3.3 Variation of F.S. = 1 curves withjoint orientation angles.
180 0 -Y 2
30
0
90
60 0
1800 -Y2
300-
00

0 0'9090 a t = 70
A 0B= 80
0 G =G =0.160 w w2
60
*1 = 2 = 270
104-180 -Y 2 N = N = 0.0130c1
c2 *
3Q0
safe
00 300 60 900
Y1
U Non-daylighting region (for 6 2- 40 0
Boundary of no daylighting region for (62~ 1
Arrows show movements of A and B as (a2- 1) increases.
Figure 3.3 (continued)

43
arrows bordering each figure. The parameter which varies from figure to
figure is S3, with values 100, 450, and 800.
In the calculations that led to the results of Fig. 3.3 as well as
in those for the reliability index in Chapter 4, whenever the water para-
meter G is such that bG > a, the term (a - bG ) in Eq. 3.3 is set equalw w w
to zero and the Factor of Safety calculated accordingly. The reason for
this operation is the likely occurrence of joint dilation, followed by a
decrease in water pressure.
Fig. 3.3 shows that the unsafe region in the y2Y1 plane expands
rapidly as ( 2-61) increases, whereas for the water and strength parame-
ters given in the figure, wedges with (a2~1l) < 300 are safe for any
combinations of y and y2 within the ranges shown.
The plots also show that the safe region in this problem is unlike
those in most other problems because of its non-convexity.
Fig. 3.4 shows FS = 1 contours for (a2-61) > 900. The unsafe regions
shown in the plot are for potential sliding along the line of intersec-
tion only. The dotted lines represent the boundaries between region
where potential sliding is along the intersection and region where
potential sliding is on one plane only (see Fig. 3.2). The lower plot in
Fig. 3.4 shows how one such curve, 2-1 = 110 0, is obtained.
Plots for B = 450 and a, = 800 are nearly identical to those in
Fig. 3.4.
For sliding along one plane only, no frictional resistance is contri-
buted by the other joint plane, while water effect and intact rock on
that plane may still have an influence. If one neglects both water
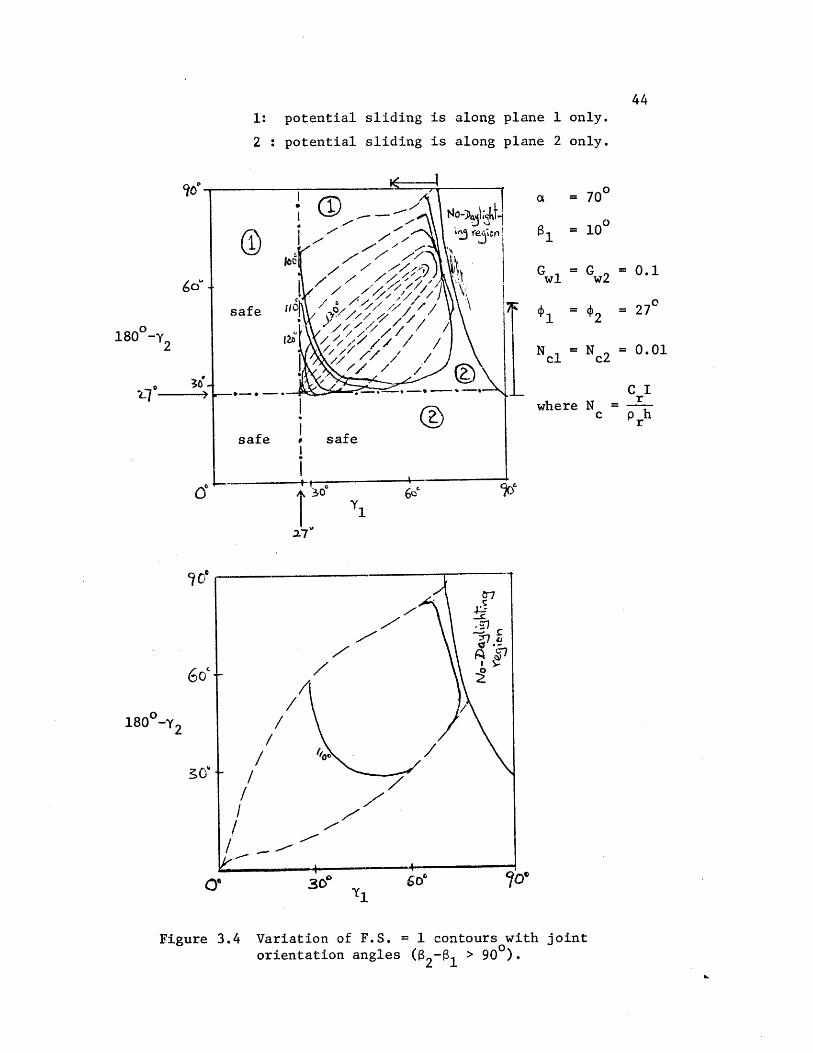
1: potential sliding is along plane 1 only.
2 : potential sliding is along plane 2 only.
180 y2
*.
safe safe
a7
180 0-Y2
Figure 3.4 Variation of F.S.orientation angle
a 70
= 100
G = Gwl w2 = 0.1
t1 = $2 = 270
N = N = 0.01cl c2
C ICr
where Nc p hr
60'
= 1 contours with joint
S02 > (2)~
force and intact rock resistance on the two planes when considering
sliding along one plane, then two lines, corresponding to yl = tl and
Y2 = 02, can be drawn to define the safe boundary. These lines are shown
in Fig. 3.4. They are drawn on the basis that sliding along a single
plane occurs if the plane dips at an angle greater than the frictional
angle, provided there is no water or cohesion effect.
The 3 plots in Fig. 3.3 appear to be quite different primarily
because of the different shape of the non-daylighting zones. For
a = 90 , the non-daylighting region disappears and the 3 plots look very
much the same, each one displaying the contour lines approximately as
concentric loops with center at the top right corner.
From these results, the following conclusions can be drawn:
1. The Factor of Safety exceeds 1 (the wedge is safe) if either one or
the following conditions applies:
y' < 0, or (1800-Y2 < 2
2. For given ( 2-1 ), the Factor of Safety increases as l(900-y )4(909-y 2)2
increases. However, the inequality expression 3.1 should first be
checked to ensure daylighting.
3. The Factor of Safety decreases as (32 f 1 ) increases.
For wedges with different water and resistance parameters, the shape
of the contours FS = 1 is the same except that the contours are compressed
in the direction of the coordinate axis corresponding to the 'stronger'
joint plane. The safe boundaries in Fig. 3.5 illustrate the above
statement.

9 0
Figure 3.5 Dependence of the safe region on 'joint strength'.
Curve R
Reference Case
G = G = 0.1wl w2
t = $2 = 270
Ncl = Nc2 = 0.01
Curve 1
Stronger plane 1Weaker plane 2
G = 0.1, G = 0.3wl w2
,= 0, $ 200
N c =0.01,N 2 =0.005
Curve 2
Stronger plane 2
G = G = 0.1wl w2
$1 = 270, $2 = 450
Nel = Nc2 = 0.01
o 2180 -y
2
30*
qor
6 6.
1800-Y2
In Fig. 3.5, the difference between the boundary of the safe
region for joints with equal strength (curve R) and the same boundary
for joints with unequal strength (curves 1 and curve 2) can be antici-
pated by the following considerations:
Wedges bounded by joint planes with higher strength become unsafe
only for steeper dip. Hence, when compared with curve R, curve 1 (which
corresponds to a stronger joint 1 and a weaker joint 2) is compressed to
the right and extended downwards. On the contrary, curve 2 (which
corresponds to a case with stronger joint 2 but joint 1 with equal
strength as for curve R) is similar to curve R except that it is compres-
sed upwards.
The thin strip of safe region between the non-daylighting zone and
the unsafe zone can be explained by the rapid decrease in volume (and
hence in driving force) as e approaches the inclination of the slope, a.
Cohesion of the intact rock is then sufficient to ensure stability.
Figure 3.6 shows how the quantity (Volume/h 3) varies in the Y2y1 plane.
This term enters the formula for the Factor of Safety through the dimen-
sionless quantity b1 and b2 (Eq. 3,13).
For given height, h, the wedge volumes for a symmetrical wedge with
Y, = 450 and y2 = 1350 and for a wedge bordering the non-daylighting zone
Vcan differ by several orders of magnitude. The expression for -
as given by Eq. B.6 in Appendix B, is
V 1 2= (cota -cotS 2) (cote -cota)2
h
with the square term accounting for dependence on c .

90"
a = 700
61-62 = 900
= 450
a = 700
1- 02 = 60
a = 800
30* 6* 90'
VolumeFigure 3.6. Variation of the quantity 3 with Y1 and y 2h
0180 2
o'
6>0
180 0 -Y2
1.676+
0.5681-
2.864+
1.906
10.08
0.106
0.524-
4.87
0.0044+
0.1186
0.2155+
0.944
3.7934
CHAPTER 4
CALCULATION OF THE SECOND MOMENT RELIABILITY INDEX
4.1 The Reliability Index, S
The probability distribution of joint orientation angles and that of
resistance and water parameters are seldom known. However, the first two
probabilistic moments of such variables can often be obtained with good
accuracy, by processing joint survey data. It is now assumed that this
information is available for the calculation of the so-called second-
moment reliability index, S (Hasofer and Lind, 1974).
Usual design proceeds as follows. Given the mean value of all
parameters, it is required that the factor of safety associated with it
be larger than a given minimum value. This minimum value is larger than
1, to account for errors in the mathematical model and to secure against
adverse values of the uncertain parameters.
A better approach would be to explicitly acknowledge the uncertain-
ties and calculate reliability or at least a reliability index associated
with the design.
Among various indices of reliability, one that is enjoying much
popularity is the index defined by Hasofer and Lind (1974): if safety
depends on the realization of a random vector, x, with mean m and covar-
iance matrix C and if the system fails for x that belongs to a 'failure
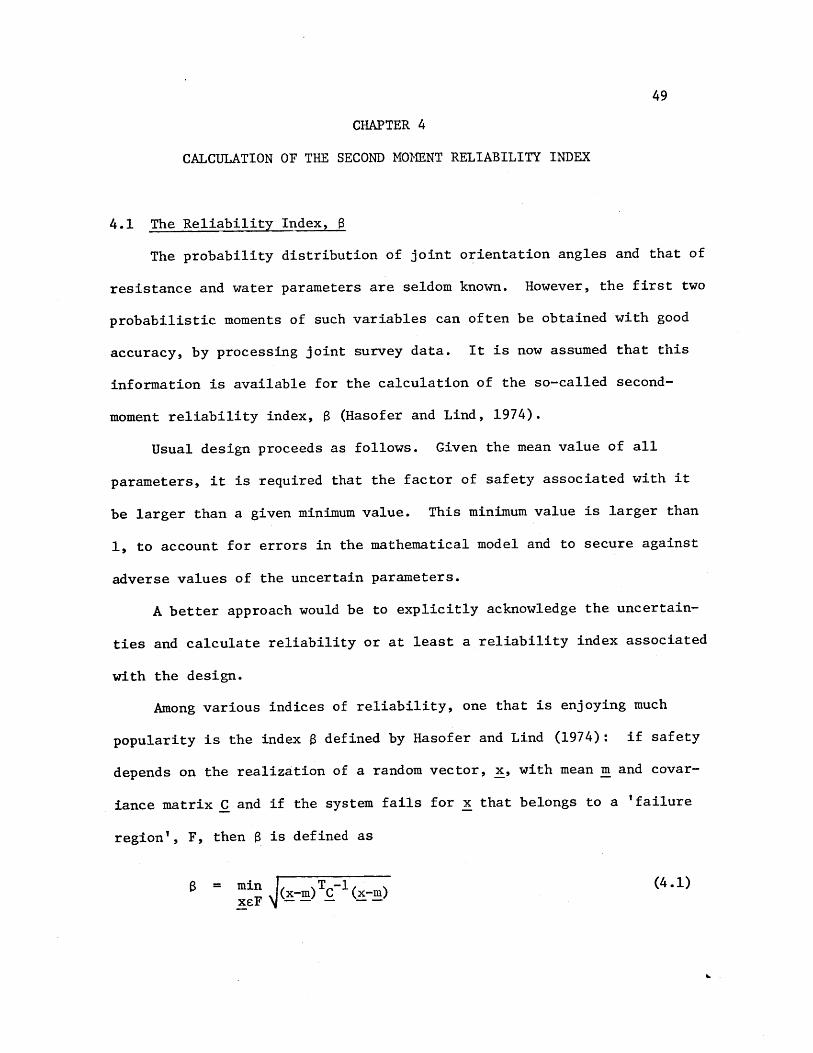
region', F, then 6 is defined as
i= m TC-1 -(4.1)xeF (~~ xm

The geometrical interpretation of a is illustrated in Fig. 4.1.
Grossly speaking, is the distance from m to the boundary of F, in units
of (directional) standard deviations.
In the important case when the components of x are uncorrelated, the
expression for simplified to
2 1(x.-m.) -
min ij. 3 2 (4.2)
xcF 3
In Fig. 4.1, one defines the 1-a dispersion ellipse by the following
equation:
(x-m) _C~ (x-m) < 1 (4.3)
where x is the second-moment vector with two components,
-F-i 2 -aa)
2 a 22x= M= C= 2- x2 - m2 a 1 a2 a 2
Denote by r(e) the distance from m to the boundary of the 1-a
dispersion ellipse (Eq. 4.3 above) in the direction 6, and let R(O) be
the distance between m and the critical region in the same direction.
Then = min (4.4)
The critical direction, er, is defined as the value of 6 that
corresponds to the minimum in Eq. 4.4.

x /2
safe region b
m 22
se
min ( )6
oundary
failure region
1-a dispersionellipse
region
Illustration of in the PlaneFigure 4. 1

4.2 Approximate Calculation of
1. Only geometric uncertainty
We assume here that strength and water parameters and slope inclina-
tion are given, and study wedge reliability with respect to random varia-
tions in the joint orientation parameters, Sl y1 , 2, and y2 '
If these parameters are uncorrelated, as we assume for simplicity,
the boundary of the 1-a dispersion ellipse (an ellipsoid in R ) satisfies
2 2 2 2(__-m al) 2 + 2 -mS 2 ) 2 (Y 1 -mY) 2+(Y2-my2)
2 2 + 2 + 2 -y
As a generalization of angle 0 in Fig. 4.1, the generic direction in
4-dimensional space is characterized by three angles which we denote by
0, Q and $. These angles are such that a unit vector in the direction
identified by them, S(60,$,), has components:
S = cos~sin~sin$
S = sin6sin2sin*
Sz = cos2sin$
Sv = cosIP
The approximate algorithm for the calculation of S discretizes the
search points by giving equal increments to 0, Q, and to y = distance
of the point from the mean value point m. The procedure articulates
into nested searches:
The first search discretizes the entire four-dimensional space
using large increments of the directional angles 0, Q, 4. The critical
Rdirection (the direction with minimum ratio -) is identified and used as
Y

53
the central direction of the second search. This second search uses
as many directional vectors as the first search, but the range of
directions is half that of the first search. A total of 5 nested
searches are made, always using the critical direction of the previous
run as the central direction and each time halving the angular
increments.
The search range and the increments of 0, Q, 1P for each of the 5
searches are as follows:
Search No. Range of Search Increment in 6,,$
1 3600 450
2 1800 22.50
3 900 11.250
4 450 5.630
5 22.5 2.810
In the case where all search vectors miss F (F may be within a
rather small angular region), the critical direction is taken to be
that along which the Factor of Safety is minimum. This is then the
central direction for the next search.
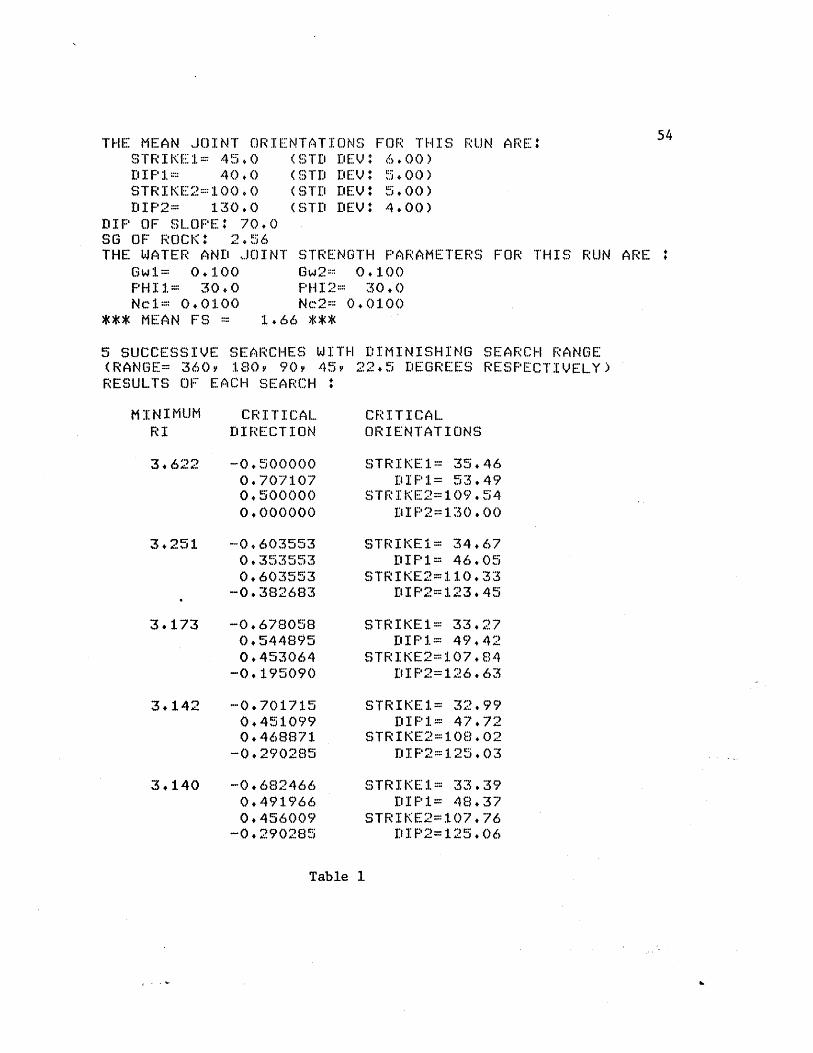
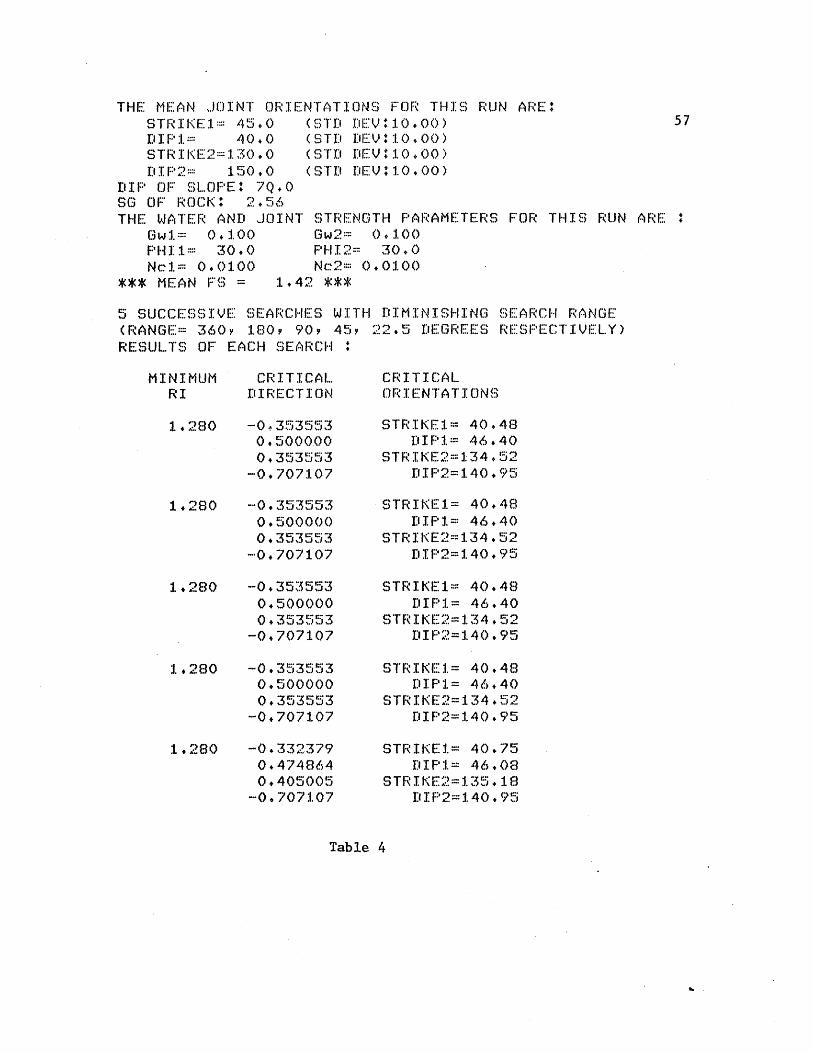
Example runs showing the values of , the critical direction, and
the critical point of each nested search, are given in Tables 1 to
11.
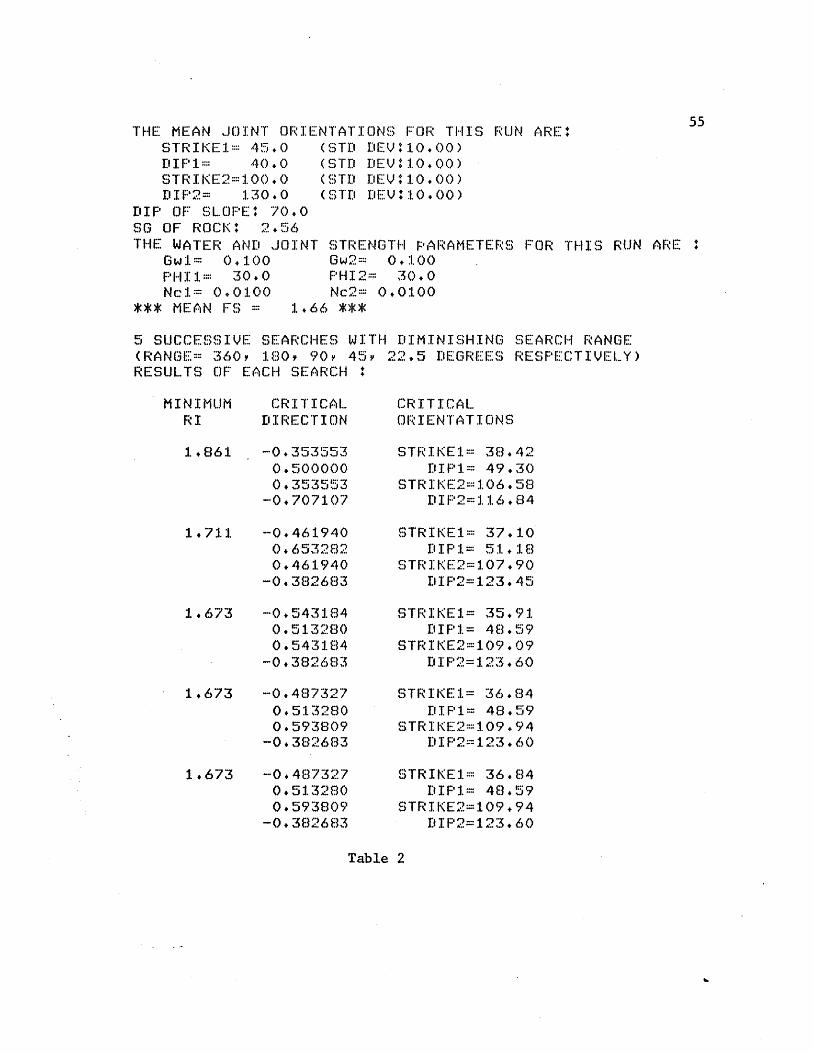
The cases in Tables 1 and 2 have the same mean joint orienta-
tion angles but different standard deviations. Hence they have
THE MEAN JOINT ORIENTATIONS FOR THIS RUN ARE:STR I KE 1= 45.0 (STD DEV 6.00)D1I F' 1. 40.0 ( STD [DEV: 5.00)STRIKE2=1::00.0 (STD' DEV: 5.00)DIP2= 130.0 (STD DEV: 4.00)
DIP OF SLOPE: 70.0SG OF ROCK 2.56THE WATER AND JOINT STRENGTH PARAMETERS FOR THIS RUN ARE
GwI= 0.100PHI1= 30.0Nc1= 0.01.00
*** MEAN FS =
Gw2= 0.100PHI2= 30.0Nc2= 0.0100
1.66 ***
5 SUCCESSIVE SEARCHES WITH DIMINISHING SEARCH RANGE(RANGE= 360Y 180, 90, 45,RESULTS OF EACH SEARCH +
MI N I MUMRI
CRITICALDIRECTION
3.622 -0.5000000.7071070.5000000.000000
3.251 --0.6035530.3535530.603553-0.382683
3.173 -0.6780580.5448950.453064
-0.195090
3.142 -0.7017150.4510990.468871-0.290285
3.140 -0.6824660.4919660.456009
-0.290285
22.5 DEGREES RESPECTIVELY)
CRITICALORIENTATIONS
STRIKE1= 35.46DIP1= 53.49
STRIKE2=109.54DIP2=130.00
STRIKE1= 34.67DIP1= 46.05
STRIKE2=110.33DIF'2=123.45
STRIKE1= 33.27DIP.= 49.42
STRIKE2=107.84DIP2=126.63
STRIKE1= 32.99DIP1= 47.72
STRIKE2=108.02DIP2125.03
STRIKE1= 33.39DIF'1= 48.37
STRIKE2=107.76DIP2= 125 .06
Table 1
THE MEAN JOINT ORIENTATIONS FOR TIIS RUN ARE*STRIKE1= 45.0 (STD DEV::10.00)DIP1 40.0 (STD DEVI:10.00)STRIKE2=1.00.0 (STI1 'EVi 10.00)EIIP2= 1.30.0 (STD EI:'v10.)o
DIP OF SLOPE: 70,0SG OF ROCKI 2.56THE WATER AIND JOINT STRENGTH PARAMETERS FOR THIS RUN ARE
Gw1= 0.100 Gw2= 0.100PHI1= 30.0 PHI2= 30.0Nc1= 0.0100 Nc2= 0.0100
*** MEAN FS = 1.66 ***
5 SUCCESSIVE SEARCHES WITH DIMINISHING SEARCH RANGE(R ANGE= 360Y 180v 90Y 45YRESULTS OF EACH SEARCH :
CRITICALDIRECTION
1.861 -0.3535530.5000000.353553-0.707107
1.711. -0.4619400.6532820. 461940-0.382683
1.673 -0.5431840.5132800.543184-0.382683
1.673 -0.4873270.5132800.593809-0.382683
1,673 -0.4873270.5132800.593809-0.382683
22.5 IiEGREE S RESPECTIVEL Y)
CRITICALORIENTATIONS
STRIKE1= 38.42D'IPI.= 49.30
STRIKE2=106.58DIP2=1 16.4
STRIKE1= 37.10DIP1= 51.18
ST R IK E2=107.90DIP2=123.45
STRIKE1= 35.91DIP1= 48.59
STRIKE2=109.09DIP2=123.60
STRIKE1= 36.84DIF'1= 48.59
STRIKE 2=1.09.94DIF2=123.60
STRIKE1= 36.84DIP1.= 48.59
STRIKE2=1.09.94DIP2=123.60
Table 2
MINIMUMRI

THE MEAN JOINT ORIENTATIONS FOR THIS RIJN ARE4 56STRIKE1 = 4.0 (STD [DEV: 6.00)El I P1 40.0 (STD Ev: 5*00)STRIKE2=130.0 (STD D:1EV 5.00)Dl I F2= 150.0 (STD DEV: 4.00)
DIP OF SLOPE: 70.0SG OF ROCK#I 2.56THE WATER ANI JOI*NT STRENGTH PARAMETERS FOR THIS RUN ARE
Gw=: 0.100 Gw2= 0.100PHI1= 30.0 PHI2= 30.0Nc1= 0.01.00 Nc2= 0.0100
*** MEAN FS = 1.42 ***
5 SUCCESSIVE SEARCHES WITH DIMINISHING SEARCH RANGE(RANGE= 360, 1.80f 90, 45,RESULTS OF EACH SEARCH :
CRITICALDIRECTION
2.736 -0.3535530.5000000.353553-0.707107
2.718 -0.6035530.2705980.250000-0.707107
2.609 -0.5748300,4619400.384089-0.555570
2.598 -0.6467050.3919520.345671-0.555570
2.597 -0.5929840.4274610.396219-0.555570
22.5 DEGREES RESPECTIVELY)
CRITICALORIENTATIONS
STRIKE1=: 40.48DIP1= 46.40
ST RI K E2=1.34.52DIF'2=140.95
STRIKE1= 36.88DIF'1= 43.64
STRIKE2=133.36DIP2=140.49
STRIKE1= 37.37DIP11.= 46.13
STRIKE2=135. 1.0DIF2=142.63
STRIKE1= 36.30DIP1= 45.27
STRIK E2=134 .65DIF'2=142.53
STRIKE1= 37.13DIP1= 45.67
STRIKE2=135.26DIF'2=142.63
Table 3
MINIMUMRI
THE MEAN JOINT OR IENTATIONS FOR TH I'.S RIJN ARE:STRIKE1= 45.0 ( STD DlEV: 10.00) 5DIPF1=:::: 40.0 (STD1l DEv 1 :10.00)STR IKE2= 1. 3 0 0 (STD D EV : 10 00DIP2:= 150.0 (ST:1 DEV# 10.00)
DIP OF SLOPE: 7Q.0SG OF ROCK: 2,56THE WATER AND JOINT STRENGTH PARAMETERS FOR THIS RUN ARE:
Gw.= 0.100 Gw2= 0.100PHI 1 30.0 PH12= 30.0Nc1=: 0.0100 Ne2: 0.0100
*** MEAN FS 1.42 ***
5 SUCCESSIVE SEARCHES WITH DIMINISHING SEARCH RANGE(RANGE:= 360Y 180, 90, 45,YRESULTS OF EACH SEARCH :
CRITICAL.DIRECTION
1.280 -0.3535530.5000000.353553-0.707107
1.280 -0.3535530.5000000.353553-0.707107
1.280 -0.3535530.5000000.353553-0.707107
1.280 -0.3535530.5000000.353553-0.707107
1.280 -0.3323790.4748640.405005-0.707107
22.5 DEGREES RESPECTIVEL.Y)
CRITICALOR IENTATI ONS
STRIKE1= 40.43DIP1:= 46.40
STRIKE2=134+52DIP2=140.95
STRIKE1= 40.48DIPI1= 46+40
STRIKE2=134.52DIP2=140.95
STRIKE1= 40.48DIP1= 46.40
STRIKE'2=134.52DIP2=1.40.95
STRIKE1.= 40.48DIP1= 46.40
STRIKE2=134.52DIF'2=140.95
STRIKE1.= 40.75DIP1.= 46.08
STRIKE2=135.18D1IP2=140.95
Table 4
MINIMUMRI

THE MEAN JOINT ORIENTATIONS F'OR TIIS RUN ARE 58STRIKE1i= 45.0 ST1 DEV* 6.00)DIP1= 60.0 ( STD DIEV: 5.00)STRIK E2=100.0 (STD DEV: 5.00)DIP2= 130.0 (STD DEV: 4.00)
DIP OF SLOPE: 70.0SG OF ROCK+* 2.56THE WATER AND JOINT STRENGTH PARAMETERS FOR THIS RUN ARE :
Gwi= 0.100 Gw2= 0.100PHI1= 30.0 PHI2: 30.0Nc1=: 0.0100 Nc2= 0.0100
*** MEAN FS = 1. 32 ***
5 SUCCESSIVE SEARCHES WITH DIMINISHING SEARCH RANGE(RANGE= 360, 180, 90, 45,RESULTS OF EACH SEARCH :
MINIMUMRI
CRITICALDIRECTION
1.876 -0.7071070.0000000.7071070.000000
1.595 -0.6035530,3535530.603553-0.382683
1.570 -0.7097040.3535530. 474209-0.382683
1,567 -0.7614060.2777850.508755-0.290285
1.561 --0.7120480.3171970.528091-0.336890
22.5 DEGREES RESPECTIVELY)
CRITICALORIENTATIONS
STRIKE1= 37.67DIP1= 60.00
STRIKE2=107.33DIP2=130, 00
STRIKE1= 39.94DIP1= 62.97
STRIKE2=105.06DIP2=:126.79
STRIKE1= 38.98DIP1= 63.00
STRIKE2=104.02DIP2=126.75
STRIKE1= 38.40DIP1= 62.41
STRIKE2=104.41D1I P2 =127.48
STRIKEI= 38.96DIP1= 62.69
STRIKE2=104.48DI P2=127.14
Table 5

THE MEAN JOINT ORIENTATI:ONS FOR THIS RUN ARE:STRIKRE1= 45.0 (STD D1E:V 10.00) 59I F' 1. 60.0 (STD D:EV: 10.00)
STRIKE2=130.0 (STD DEV*:10.00)DIP2= 150.0 (STD DE:V:10.00)
DIP OF SLOPE*+ 70.0SG OF ROCK: 2.56THE WATER AND JOINT STRENGTH PARAMETERS FOR THIS RUN ARE
Gwl=: 0.100 Gw2=: 0.1.00PHI1= 30.0 PH12= 30.0Ncl= 0.0100 Nc2= 0.0100
*** ME A N F'S = 1.23 ***
5 SUCCESSIVE SEARCHES WITH DIMINISHING SEARCH RANGE(RANGE= 360, 1.80, 90, 45,RESULTS OF' EACH SEARCH :
CRITICALDIRECTION
0.698 -0.3535530. 5000000.353553
-0.707107
0.670 -0.2500000.1464470.250000-0.923880
0.661 -0.3266410.3086580.326641-0.831470
0.661 -0.326641.0,3086580.326641
-0.831.470
0.661 -0.326641.0.3086580.326641-0.831470
22.5 DEGREES IVELY)
CRITICALOR I ENTATIONS
STRIKE1.= 42.53DIP1.= 63.49
STRIIK1E:2=1.32. 47DI'P2=145.06
STRIKE1= 43.32DIP1= 60.98
STRIKE2=131 .68DIF'2=143.81
STRIKE1= 42.84DIP1= 62.04
STRIKE2=132.16DI'P2=144.50
STRIKIE1= 42.84DIP1= 62.04
STRIK E2=132. 16DIP2=1.44.50
STRIKE1.= 42.84DIP1= 62.04
STRI KE:2=132. 16DIP2=144.50
Table 6
MINIMUMRI

TH1E MEAN JO I NT 0R I ENTAT I NS FO0R *TH IIS RUN ARE : 60ST RIK (E1= 75.0 (STD) DEV 1.0.00)IP ,1= 40.0 (SiTD 11EV :1.0,00)
STR IKE: 2=100.0 ( STD: DEV 1.0.00)DIF'2= 130.0 (ST) D'EV 10.00)
DIP OF SLOF'E 70.0SG OF ROCK:+ 2. 56THE WATER AND JOINT STRENGTH PARAMETERS FOR THIS RUN ARE 4
Gw I= 0.100F'HI1= 30.0NcI= 0.0100
*** MEAN FS =
Gw2= 0.100PHI2= 30.0Nc2= 0.01.00
3.79 ***
5 SUCCESSIVE SEARCHES WITH DIMINISHING SEARCH RANGE(RANGE-= 360, 180Y 90, 45,RESULTS OF EACH SEARCH :
MINIMUMRI
CRITICALDIRECTION
3.905 -0.3535530.5000000. 353553
-0.707107
3.398 -0.6035530.3535530.603553
-0.382683
3.389 -0.5431840.51.32800.5431.84
-0.382683
3.370 -0.5761.430.43551.40.576143-0,382683
3.370 -0.5761430.4355140.5761.43-0,382683
22.5 DEGREES RESPECTIVE.L.Y)
CRITICALORIENTATIONS
STRIKE1.= 61.19DIIP1.:= 59.52
STRIKE2=113.81DIF'2=102.39
STRIKE1= 54.49DIP1= 52.02
STRIKE2=120.51DIP2=11.6.99
STRI:KEI.= 56.59DIP1= 57.40
STRIKE2=118.41DIP2=117.03
STRIKE1= 55,58DIP1= 54.68
STRIKE2= 11.9.42DIP2=117.10
STRIKE1= 55.58DIP1= 54.68
STRIKE2=11.9.42DI'P2=117. 1.0
Table 7

THE MEAN JOINT ORIENTATIONS FOR THIS RUN ARE: 6STRIKE1= 75.0 (STD TEV4 6.00)DIP1=: 40.0 (STD rIEV 5.00)STRIKE2=1.30.0 (STD DEV 5.00)DiIF'2= 150.0 (STD 11EV4 4.00)
DIP OF SLOPE: 70.0SG OF ROCK: 2.56THE WATER AND JOINT STRENGTH PARAMETERS FOR THIS RUN ARE :
Gwl= 0.100 Gw2= 0.100FHI1= 30.0 PHI2= 30.0Nc~1= 0.0100 Nc2= 0.0100
*** MEAN FS = 2.16 ***
5 SUCCESSIVE SEARCHES WITH DIMINISHING SEARCH RANGE(RANGE= 360, 180, 90, 45,RESULTS OF EACH SEARCH :
CRITICALDIRECTION
5.863 -0.3535530.5000000,353553-0.707107
5.218 -0.7885810.3535530.326641
-0. 382683
5,159 -0.7097040.3535530.474209-0.382683
5.107 -0.6774720.3374970.452673
-0.471.397
5.098 --0.6838220.3770700.409867
-0.471.397
22.5 DEGREES RESPECTIVELY)
CRITICALORIENTATIONS
STRIKE1= 65.30DIP1= 53.71
STRIKE2::139.70DIP2=130.61
STRIKE1= 52.27DIPi= 50.1.9
STRIKE2=139,42IDIP2=138.97
STRIKE1= 55.21DIP1= 49.86
ST RI K E 2 =143.23D I P2139 . 33
STRIKE1= 56.68DIP1= 49.13
ST R I K E2=142. 24D*IPf:2=1.37.2,*5
STRIKEI= 56.50DIP1= 50.20
STRIKE:2=141.09DIP2=137.25
Table 8
MINIMUMRI

THE MEAN JOINT ORIENTATIONS FOR THIS RUN ARE* 62STRIKE1= 75.0 (STD DEV:10.00)DI 1= 60.0 (STD DEV 11. 00)STR I KE2= 130.0 (STD DEV::10.00)D IP2= 130.0 (ST1 DEV:10.00)
DIP OF SLOPE : 70.0SG OF ROCKI 2.56THE WATER AND JOINT STRENGTH PARAMETERS FOR THIS RUN ARE
Gw1= 0.100 Gw2:= 0.100PH1 I= 30.0 PHI2= 30.0Ncl= 0.01.00 Nc2:: 0.01.00
*** MEIAN FS 1. 32 ***
5 SUCCESSIVE: SEARCHES WITH I:IMINISHING SEARCH RANGE(RANGE::= 360Y 180, 90Y 45,RESULTS OF EACH SEARCH ,
CRITICA I...DIRECTION
0.923 -0.3535530.5000000.353553
-0.707107
0.830 -0.6035530.3535530.603553
-0. 382683
0.830 -0.6035530.3535530.603553-0.382683
0.830 -0.6035530.3535530.603553-0.382683
0.830 -0.6035530.3535530.603553-0.382683-
22.5 DEGREES RESPECTIVELY)
CRITICAL0 RI EN TA T I ON S
STRIKE1.= 71,74DIP1= 64.62
S T R IK E2=133 .26DIP2=123.47
STRIKEI= 69.99DIP1= 62.93
STRI'KE2=135.01DIP2= 126.82
STRIKE1= 69.99DIP1= 62.93
STRI:KE2= 135.01DIP2: 126.82
STRIKE1= 69.99DIP1= 62.93
STRIKE2=135.01DIP2=126.82
STRIKE1= 69.99DIP1= 62.93
STR IKE2=135.01DIP2=126.82
Table 9
MINIMUMRI

THE MEAN JOI*NT OR I ENTATIONS FOR TVH IS RUN ARE: 63STRIKE1= 75.0 ( STI:)D DEV:. * 00)DI 1=:::: 40.0 (ST'D DEV+:10.00)cSTR I*. KE2=: 130 .0 (STD D'EEV4:10.00)E I P'2: 150.0 (STID D.iEV : 10.00)
DIP OF SLOF'E: 70.0SG OF* ROCK: 2.56THE WATER AND JOINT STRENGTH PARAMETERS FOR TH1:S RUN ARE :
Gwi.= 0.100 Gw2 0.100I:+11= 30.0 PHI2= 30.0
Nc1:= 0.0100*** MEAN FS =-
Nc2= 0.01.002.1.6 ***
5 SUCCE:SSIVE: SARCHES WITH DIMINISHING SEAiRCH RANGE
(RANGE:= 360Y 1.80, 90Y 45,RESULTS OF EACH SEARCH :
MINIMUMRI
CRITICA 1..DIRECTION
2.742 )-0.3535530. 5000000. 353553
-0.707107
2.723 -0.4619400,2705980.461940
-0. 707107
2.630 -0.4888520.4619400.488852
-0,555570
2.630 -0.4888520.461.9400.488852
-0.555570
2.620 -0.4789390.427461.0,528428-0.555570
22.5 EGREES RESPECT 1 VLY)
CRITICALORIENTATIONS
STRIKEI.= 65.30DIP1= 53.71.
STR IKE2=1.39 . 70IF2=130.61
STRIKIE1.= 62.42DIF'1:::: 47+37
STR IKE2= 142 . 58El I P2 = 130 . 74
STRIKIE1= 62+1.4DIPI1= 52.1.5
STRIKE2=142.86DIF'2= 135.39
STRIKEI=.: 62.14DIP1.= 52.1.5
ST RI K E2=142. 86D I' P21.35. 39
STRIKEI. 62.45DiI P1=:: 51J.,2 0
STRIKE2=143.85SI P 2=1.35 . 4 4
Table 10

THE MEAN JOINT ORIENTATION3 FOR THIS RUN ARE: 64STR IKE 1= 75.0 ( ST DIV 10.00)DIP1= 60.0 (STD EEV * 10. 0)STRIKE2=100.0 (STD DEV+10.00)D IP2= 130.0 (STD DEVY:1.0.00)
DIP OF SLOPE:: 70.0SG OF R : oi : 2.56THE WATER AND JOINT STRENGTH PARAMETERS FOR THIS RUN ARE :
Gw1= 0.100 Gw2= 0.100PH11= 30.0 PH12:: 30.0Nc1= 0.0100
*** MEAN FS =Nc2= 0.0100
3.19 ***
5 SUCCESSIVE SEARCHES WITH DIMINISHING SEARCH RANGE(RANGE= 360, 180, 90, 45,RESULTS OF EACH SIEARCH :
MINIMUMRI
CRITICALDIRECTION
3.005 --0.3535530.5000000.353553
-0.707107
2.620 --0.6035530.3535530,603553-0.382683
2.620 -0.6035530.3535530,603553-0.382683
2.620 -0.6035530.3535530.603553
-0.382683
2.620 -0.6035530.3535530.603553-0.382683
22.5 DEGREES RESPECTIVELY)
CRITICALORIENTATIONS
STRIKE1= 64.38D:IP1= 75.02
STRIKE2=110.62DIF2=108.75
STRIKE1= 59.19DIP1= 69.26
ST R IKE 2:115.81D I P2=11.9.97
STRIKE1= 59.19DIF'1= 69.26
STRIKE2=115.81DIP2=119.97
STRIKE1= 59,19D:IP1= 69.26
STRIKE2=115.81lIP2=11.9.97
STRIKE1= 59.19DIP1= 69.26
S TR I K E 2=115.81DIP2=: 1.19.97
Table 11
different reliability index: 3.14 for the case with smaller 1-a
dispersion volume (Table 1), and 1.67 for the case with larger 1-a
dispersion volume (Table 2). The Factor of Safety (calculated for
the mean joint orientation angles and the given resistance parameters)
is the same for both cases.
It is noticed that sometimes the 6 value appears to be the same
from one search to the next while the critical direction and critical
orientations change by a small amount. For example, between the
third and fourth searches in Table 2 and between the fourth and fifth
searches in Table 4. For such cases, the value of the successive
search is actually slightly smaller than that of the previous search,
but the difference is too small (variation in the fourth or higher
decimal places) to be revealed in the printout which exhibits 3 decimal
places.
In most of the runs, the greatest reduction in the 8 value occurs
between the first and the second search, and becomes quite stable after
the third search.
The equal increments given to 0, 0 and * do not imply that the
solid angles associated with the vectors are the same. This can be
more easily visualized in a 3-D situation, where the direction of the
search vectors are defined by 2 angles, 0 and , e.g., the spherical
coordinates used in defining longitude and latitude on the surface of
the earth. Clearly, the area covered by one degree of latitude and
longitude is much larger near the equator than near the poles.
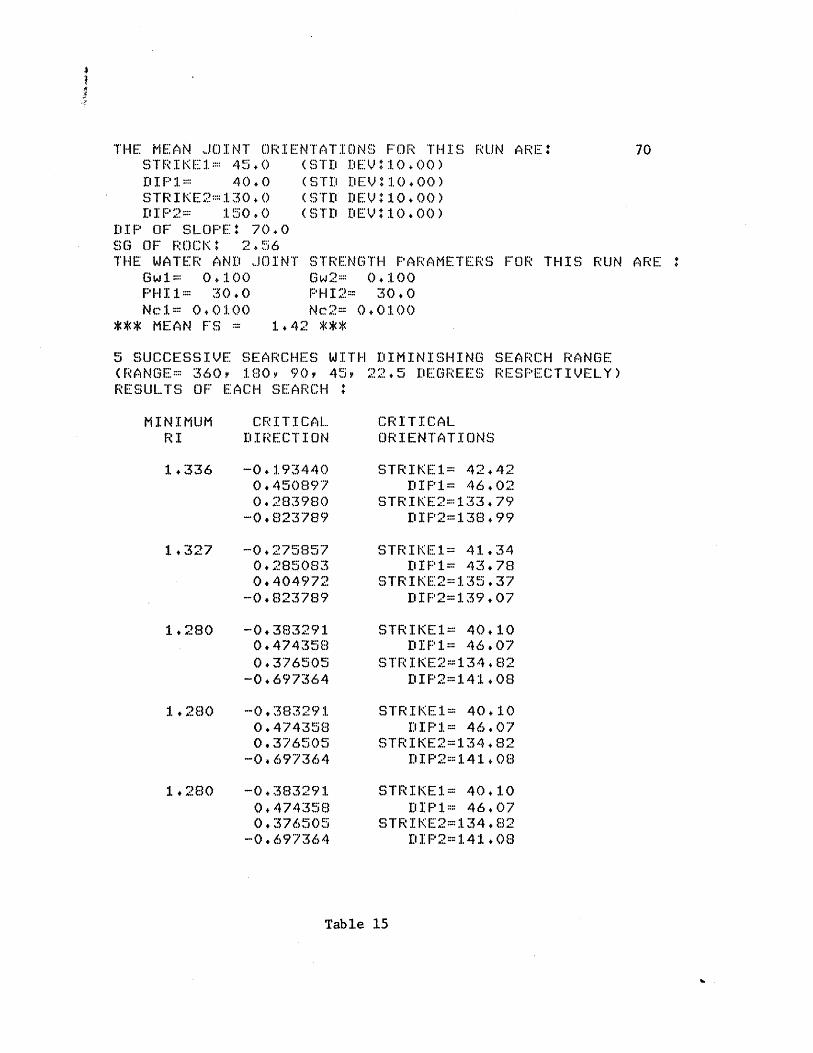
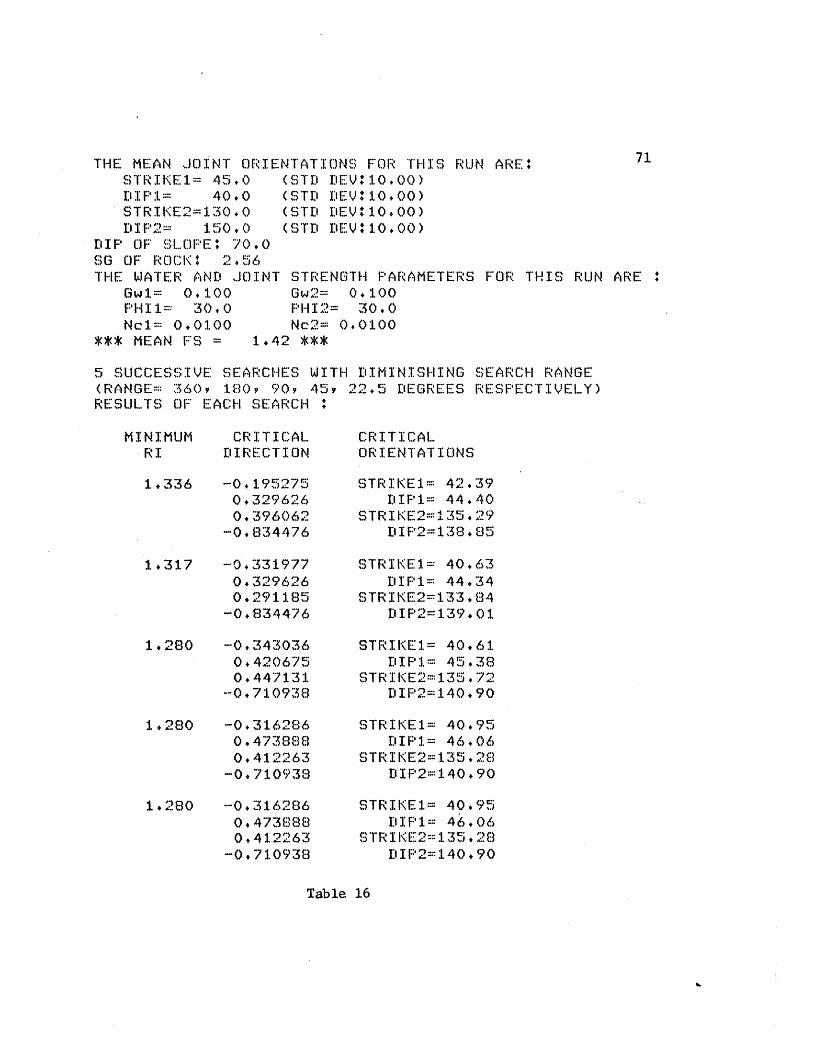
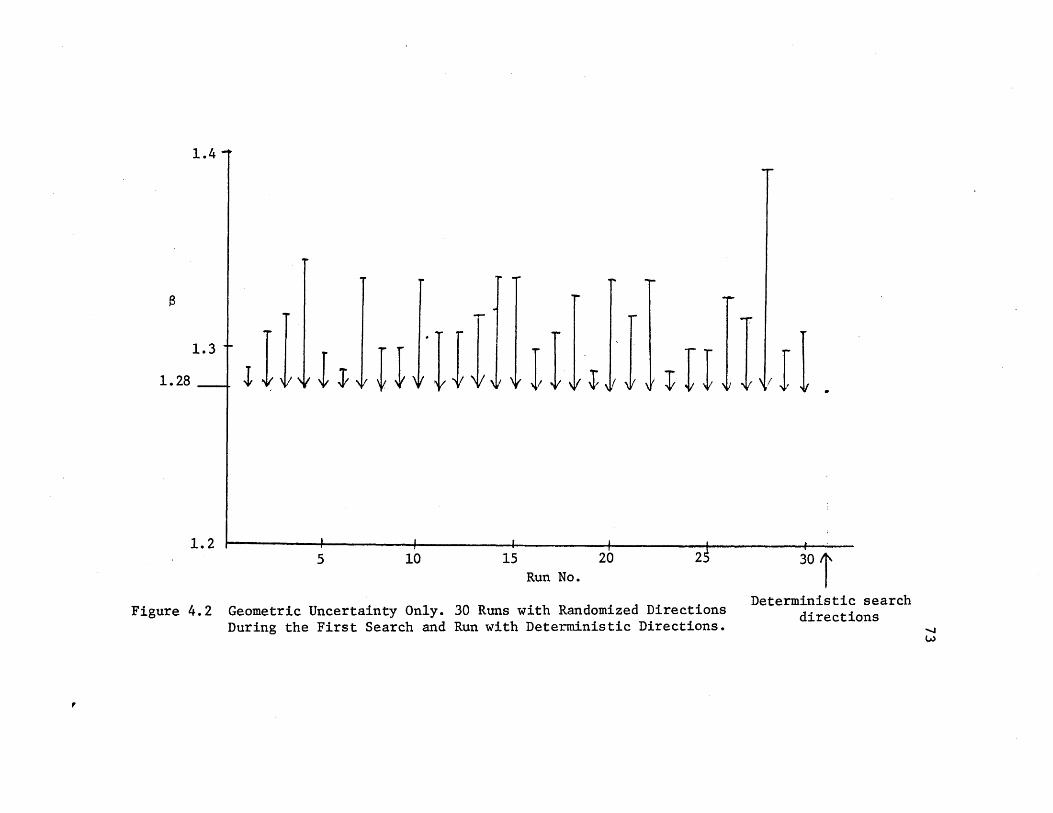
The error in the calculated a value due to discretization of
the search directions has been evaluated by making 30 runs, each
composed of 5 nested searches, holding m, c, water and resistance
parameters constant. For each run, every vector in the first search
was generated randomly with 0, Q and p having independent and uniform
probability distribution within a range of +22.50 from the nominal
values. The case used for this purpose is that of Table 4, and
portions of the 30 runs are shown in Tables 12-17. Results of these
30 runs are summarized in Fig. 4.2, where the tail of each arrow
indicates the value of S obtained in the first search and the head gives
the final value. The final run correponds to non-randomized search
directions (Table 4). The 30 a values show less than 1% variation,
while the angles S%, Y1 3 V2 Y2 associated with the critical points
on the boundary of the safe region each vary within a range of 1.50.
Judging from the stability of these calculated S values using
randomly modified angles, one may conclude that unevenness and discrete-
ness of the search strategy introduces negligible inaccuracies for the
problem at hand. The above statement is also a consequence of the
fact that the boundary of the safe region is a smooth surface, as one
can see from the plots in Chapter 3.
Fig. 4.3 compares two groups of cases, which differ in the values
of the standard deviations. For each pair of points joined by a
vertical line, the mean value, m, and the factor of safety are the
same. Clearly, a is not the same due to the differences in the
standard deviations.

THE MEAN JOINT ORIENTATIONS FOR THIS RUN ARE:STR:IKE1= 45.0 (STD DEVU10.00)lIF'1= 40.0 (STD DEV :10.00)STRIKE2=130.0 (STD DEV10.00)DI P2= 150.0 (STD DEV:10,00)
DIP OF SLOPE** 70.0SG OF ROCKI 2.56THE WATER AND JOINT STRENGTH PARAMETERS FOR THIS RUN ARE
Gw1= 0.100 Gw2= 0.100PHI 1 30.0 PH12= 30.0Nc1= 0.0100 Nc2= 0.0100
*** MEAN FS = 1.42 ***
5 SUCCESSIVE SEARCHES WITH DIMINISHING SEARCH RANGE(RANGE:= 360, 1.80, 90, 45,RESULTS O:: EACH SEARCH :
CRITICALDIRECTION
1.392 -0.5755360.4415690.030631-0.687631
1.280 -0.3853060.4415690.4238625-0.687631
1.280 -0.3853060.4415690.428625-0.687631
1.280 -0.3853060.4415690.428625-0.687631
1.280 -0,3853060.4415690.428625-0.687631
22.5 IEGREES RESPECTIVELY)
CRITICAL.ORIENTATIONS
STRIKE1= 36.99DIP1= 46.15
STRIKE2=130.43DIP2=140.43
STRIKE1= 40.07DIP1= 45.65
STRIKE2=135.49DIF'2=141.20
STRIKE1.= 40.07DIPI1= 45.65
STRIKE2=:135.49DIP2=141.20
STRIKE1= 40.07DIPI1= 45.65
STRIKE2=:135.49DIP2=141.20
STRIKE1= 40.07DIP1= 45.65
STRIKE2=1.35.49DIP2=141.20
Table 12
MINIMUMRI

THE MEAN JOINT ORIENTATIONS FOR THIS RUN ARE* 68STRIKE1= -45.0 (STD DV:v*1.0.00)DI P1=::: 40+0 (STDI DEV :1.0.00)STRIKE2=130.0 (STD -DEV:10.00)I: P2= 150.0 (STD EEV*10.00)
D'IF' OF SLOPE: 70.0SG OF ROCK* 2.56THE WATER AND JOINT STRENGTH PARAMETERS FOR THIS RUN ARE
Gwl= 0.100 Gw2= 0.100PHI1= 30.0 PHI2:= 30.0Ncl= 0.0100 Nc2= 0.0100
*** MEAN FS = 1.42 ***
5 SUCCESSIVE SEARCHES WITH DIMINISHING SEARCH RANGE(RANGE= 360, 180Y 90, 45,RESULTS OF EACH SEARCH :
MINIMUMRI
CRITICALDIRECTION
1.289 -0.3593600.5404780.381717-0.658054
1.289 --0.3593600.5404780.381717-0.658054
1.289 -0.3593600,5404780,381717-0.658054
1.280 -0.3863030.3891080.410337
-0.728689
1.280 -0.3863030.3891080.410337
-0.728689
22.5 DEGREES RESPECTIVELY)
CRITICALORIENTATIONS
STRIKE1= 40.37DIIP1= 46.97
STRIKE2=134,92DIP2=141 .52
STRIKE1.= 40.37DIIP1= 46.97
STRIKE2=134.92DIF'2=141.52
STRIKE1= 40.37DIP1= 46.97
STRIKE2=134.92DIP2=141.52
STRIKE1= 40.06DIP1= 44.98
STRIKE2=135.25DIP2=140.68
STRIKE1= 40.06DIP1= 44,98
STRIKE2=135.25DIP2=140.68
Table 13

THE MEAN JOINT ORIENTATIONS FOR THIS RUN AI*E: 69STRIKE=.**:. 45.0 ( STID DEI.:.V + :1.0 .00)DIP 1= 40.0 (STD DEIV : 10*.00)STRI K E2=:: 130. 0 ( STD' DEV:1.0100)
I P:2 150.0 (STD DEV 10.00)DIP OF SLOPE 70.0SG OF ROCK* 2.56THE WATER AND JOINT STRENGTH PARAMETERS FOR THIS RUN ARE
Gw1: 0.100 G w2: 0.1.00PHI 1= 30.0 PHI2= 30.0Nc1= 0.0100 Nc2= 0.0100
*** MEAN FS 1.42 ***
5 SUCCESSI VE SEARCHES WITH DIMIN NISHING SEARCH RANGE(RANGE=:: 360, 180Y 90 45,RESULTS OF EACH SEARCH
MINIMUMRI
CR I T I CA I.D IRE C TI ON
1.345 -0.4547920.5421410.121259-0.696092
1.298 -0.3737690.5421410.286070-0.696092
1.280 -0.3746410.4398980.426133-0.696092
1.280 -0.3746410.4398980.426133-0.696092
1.280 --0.41.68040.4888740.389414-0,660025
22.5 DEGREES RESPECTIVELY)
CR IT I C ALORIENTATIONS
STRIKE:: 38.88DIF'1.=:: 47.29
STRIKE2:=131.63DIF2=140.64
STRIKE1= 40.15EIF1.= 47.04
ST R IK E 2=133, 71DIF2=1.40.96
STRIKE1= 40.21.DIP1= 45.63
STRIKE2=135.45DIP2=141 .09
STRIKE1= 40.21DIF'1= 45.63
STRIKE2:135.45DIP2=141.09
STRIKE1: 39.67DIP1= 46.26
ST R I KE2= 134.98DIP2=141.55
Table 14
THE MEAN JO I NT 0OR IENTAT1* ONS FOR THIS RUN ARE : 70STRIKE 1:::: 45.0 (STD IE'V11.0.00)DIP1= 40.0 (STD DEV0:10.00)STRIKE2: 130.0 (TD iE'V:10.00)DIP2= 150.0 (STD' DEV410.00)
DIP OF' SLOPE: 70.0SG OF ROC)KI \ 2. 56THE WATER AND JOINT STRENGTH PARAMETERS FOR THIS RUN ARE
Gwl1=: 0.100PHI1= 30.0N*:= 001.00
**ME AN FS =
Gw2= 0,100FHI2:= 30.0Nc2= 0.0100
1. 42 ***
5 SUCCESSIVE SEARCHES WITI DIMINISHING SEARCH RANGE(RANGE= 360Y 180Y 90, 45,RESULTS OF E:ACH SEARCH :
MINIMUMRI
CRITICAL...DIRECTION
1.336 -0.1.934400.4508970.283980
-0.823789
1.327 -0.2758570.2850830.404972
-0.823789
1.280 -0.3832910.4743580.376505-0.697364
1.280 -0.383291.0.4743580,376505-04697364
1,280 -0.3832910.4743580.376505
-0.697364
22.5 DE:'GREES RESF'ECTIVELY)
CRITICALORIENTATIONS
STRIKE1= 42.42rIP1= 46.02
STRIKE2=133.79DIF'2=138,99
STRIKE1.= 41.34DIP1= 43.78
STRIKE2=135.37DIP2=139,07
STRIKE1=:: 40.10DIF'1= 46.07
STRIKE2=134.82DIF'2=141 .08
STRIKE1= 40.10DIP1= 46.07
STRIKE2=134.82DIF'2=141.08
STRIKE1= 40.10DIF1= 46.07
STRIKE2=134.82DI P2--= 1 41.08
Table 15
THE MEAN JOINT ORIENTATIONS FOR THIS RUN ARE*#STRIKE1:: 45.0 (STD DEV10.00)DIP1= 40.0 (STD DEV10.00)STRI1KE2:130.0 (STD DEV010.00)DIP2= 150.0 (STD DEV10,00)
DIP OF SLOF'E: 70.0SG OF ROCK# 2.56THE WATER AND JOINT STRENGTH PARAMETERS FOR THIS RUN ARE
Gw1= 0.100 Gw2= 0.100PH1=1 30.0 PHI2= 30.0Nc::: 0.0100
*** MEAN FS =Nc2= 0.0100
1.42 ***
5 SUCCESSIVE' SEARCHES WITH DIMINISHING SEARCH RANGE(RANGE= 360 180Y 90, 45,RESULTS OF E:ACH SE:ARCH 4
MINIMUM-RI
CRITICALDIRECTION
1.336 -0.1952750.3296260.396062-0.834476
1.317 -0.3319770.3296260.291185-0.834476
1.280 -0.3430360.4206750.447131-0.710938
1.280 -0.3162860.4738880.412263-0.710933
1.280 --0.3162860.4738880. 412263
-0,710938
22.5 DEGREES RESPECTIVELY)
CRITICALORIENTATIONS
STRIKE1= 42.39DIP1= 44.40
STRIKE2=135.29DIP2=138.85
STRIKE1= 40.63DIP1= 44.34
STRIKE2=133.84DIP2=139.01
STRIKE1= 40.61DIP1= 45.38
STRIKE2=:135.72DIP2:=140.90
STRIKE1= 40.95DIP1= 46.06
STRIKE2=135.28DIF'2=140.90
STRIKE1= 40.95DIP1= 46.06
STRIKE2=135.28DIP2=140.90
Table 16

THE MEAN JOINT OR]IENTA0TIONS FOR THIS RUN ARE: 72S T RIKE 1 45 . 0 (STD DEV:10.00)D IP1 40.0 3, 40 10(STD DEV 1.0 . 0 )STR 1' KE:2= 1 30 .0 (STDI DEV 10.00)DiIPF2:=: 150.0 (STD D)1E V 1. 00
D I P OF SLOPF'E: 70 . 0S6 OF ROCK: 2.56THE WATER AND JOINT STRENGTH F'ARAMETERS FOR THIS RUN ARE :
Gwl=:: 0.100PHI1= 30.0Nc1E 0.0100
**MEAN FS =
Gw2:= 0.100PHI2= 30.0Nc2: 0.0100
1. 42 ***
5 SUCCESSIVE SEARCHES WITH DIMINISHING SEARCH RANGE(RANGE=: 360, 180, 90, 45,RESULTS OF EACH SEARCi
MINIMUMRI
CRITICA ..DIRECTION
1.308 -0.4126540. 4478330.525660-0.594007
1.308 -0.41.26540.4478330.525660-0.594007
1,289 -0.3452810.37471.60. 439837-0.739536
1.280 --0.3945300.4277200.338361
-0.739536
1.280 -0.3945300.4277200.338361-0.739536
22.5 DEGREES RESP'ECTIVELY)
CRITICALORIENTATIONS
STRIKE1.= 39.60DIF'1= 45.86
STRIKE2=136.87DIP2=142.23
STRIKE1= 39.60DIF'1= 45.86
STRIKE2=136.87DIP2=142,23
STRIKE1= 40.55DIP1= 44.83
STRIKE2=135. 67D I P2=1.40 .47
STRIKE1= 39.95DIfP1= 45.47
STRIKE2=134.33DIF'2=140.54
STRIKE1= 39.95DIF:'1.= 45,47
STRIKE2=134.33DIP2=140.54
Table 17
* .. ~'.
(lbiT TI / / JYIITr
Run No.
Figure 4.2 Geometric Uncertainty Only. 30 Runs with Randomized DirectionsDuring the First Search and Run with Deterministic Directions.
301Deterministic search
directions
7f ~
1.4 -
1.3 t
1.28 -
1.2
UTN ITI.
-

o: cases with a =
8
7
6~
5-
4-
3-
2-
1 -
CYa = 10 0
a = 10
a = 10 0Y 1
a = 100y2
x: cases with a = a61 = 6
a = 5052a 5
a =2 4
1 2 3 4 5 6
F.S.
Same resistance and w
G = G = 0.1,wl w2$ $ 0
= 2= 30
ater
N
parameter for b
= N = 0.01,cl c2
oth groups:
Figure 4.3 Geometric Uncertainty Only. Reliability Index Svs. F.S. for Two Sets of Cases

It is interesting that, for given values of standard deviation,
the reliability index S does not necessarily increase with the Factor
of Safety (e.g. compare cases A and B in Fig. 4.3, and their correspon-
ding computer printout in Tables 10 and 11). This can only happen
when the boundary of the safe region is nonlinear.
In all cases of Fig. 4.3, the critical direction is towards a
wider angle ( 2-1) and steeper dips y1 , Y2 with respect to the mean
values. This is consistent with intuition and with plots in Chapter 3.
Figure 4.4 illustrates the variation of S with the standard
deviation of the angles Sl, 62' Y1 , and y2. Contour lines on the
a1F2 plane (a, = standard deviation of S1 and 2' a2 = standard
deviation of y and y2) are nearly portions of circular arches.
2. Uncertainty on Resistance and Water Pressure Only
In this section we shall treat cases in which the parameters G, *C I
and n r are uncertain, whereas geometry of slope and wedge arec p hr
given. In order to reduce the number of uncertain variables, we let
G w= G 2 = *2, N =N The search for a is therefore in a 3-Dwl =G 1 cl c2'
space with only 2 angles, 0 and 0, necessary to define search direc-
tions. The procedure is the same as in the previous section, except
that it is much faster, not only because there are only three random
variables but also because the quantities a1 , a2, b1, b2 (all lengthy
functions of joint orientation angles) need to be calculated only once.
The number of nested searches for each run is six.

0.86
110
90
(std. dev
%1, 2)
- i_m ~ m
Ylm Ym 2ULY2
30 5 7 0 ,030 70 9 11
02 (std. dev. of Y 1,Y2)
= 450
= 600G = Gw2 0.100
= 100 1 2 = 30
= 1350 Ni =Nc2 = 0.005
F.S.(m) = 1.35
Figure 4.4 Variation of S with standard deviations of strike and dipof the joint planes bounding the wedge.
0.89 0.88 0.84 0.80

Once more, the plot in Fig. 4.5 shows that higher Factor of
Safety does not necessarily imply higher reliability. Each pair of
points joined by a straight line segment in that figure corresponds to
the same joint orientations, but to different mean values and standard
deviations of G , # and N.w C
Considering only the mean values of G , tan* and Nc , one might
think that cases associated with solid (open) dots in Fig. 4.5 should
be safer than the corresponding cases (same joint orientation)
associated with crosses. However, Fig. 4.5 shows that this may not be
true if one also considers covariances and if safety is measured in
terms of the reliability index 8. Whether one set of mean values and
standard deviations corresponds to higher or lower reliability than
another set depends highly on the value of the fixed orientation
parameters.
If one decides that a should be at least equal to 1.5, then for
the pairs a, b, c and d shown in Fig. 4.5, the cases with apparently
higher resistance, weaker water effect and hence also higher F.S.(m)
(the solid (open) dot cases) should be rejected as insufficiently safe,
while their counterparts (crosses), which appear to be less safe on
the basis of their F.S., are acceptable,
Example runs showing the values of 8, the critical direction and
the critical point of each nested search, are given in Tables 18
to 25.

W Mr1
0 cases with Gwl= G = 0.300
w2
tan$1 = tan$ 2 = 0.7
Nel Nc2 = 0.1
x: cases with G wl = Gw2 = 0.4
tant1 = tan$2 = 0.7
(a=0.150)
(a=O. 30)
(a=0.06)
(a=0.2)
(a=0. 15)
N = N =0.03 (a=0.02)
F vs. F.S. (Only joint resistance and water parameter uncertainty)
0 1 2 3 4 5 6 7 8
F.S.
RRIP4, ., - - , -" I -, I'll , I'll, . , -
Figure 4. 5

Cf = Coefficient of Friction = tan *
THE JOINT ORIENTATIONS FOR -THIS RUN ARE: 79STRIKE1:: 45.0DIP1=: 40.0STRIKE2=100.0DIP2= 130.0
DIP OF SLOPE: 70.0SO OF ROCK:# 2. 56THE WATER AND: RESISTANCE PARAMETERS ARE :
Gw1=Gw2= 0.300 (STD: DEV: 0.150 RANGE: 1.000 0.000 )Cf1.=Cf2= 0.700 (STD 11EV: 0.300 RANGE: 2.000 0.000 )Nc1=Nc2= 0.1000 (STD DEV* 0.0600 RANGE: 1.0000 0.0000 )
*** MEAN FS = 2.86 ***
6 SUCCESSIVE SEARCHES WITH DIMINISHING SEARCH RANGE(RANGE=: 360Y 180Y 90, 45,RESULTS OF EACH SEARCi :
22.5, 11.25 DEGREES RESPECTIVELY)
MINIMUMRI
1.215(min . FS)
1.051(min.FS)
CRITICAL ..DIRECTION
-0.000000-1.000000-0.000000
0.353553-0.853553-0.382684
CRITICALPARAMETERS
Gw = 0.300Cf = 0.000Nc = 0.1000
Gw = 0.392Cf = 0.477Nc = 0.0001
1.351 -0.000000-0.980785-0.195090
0.093797-0.952332-0.290285
0.092287-0.937010-0.336890
0.092287-0.937010-0.336890
Gw 0.330Cf = 0.396Nc 0.0073
Gw = 0.327Cf = 0.426Nc 0.0015
Gw = 0.327Cf = 0.426Nc 0.0015
Table 18
Gw =Cf =Ne -
0.3000.3100.0224
1.114
1.036
1.036
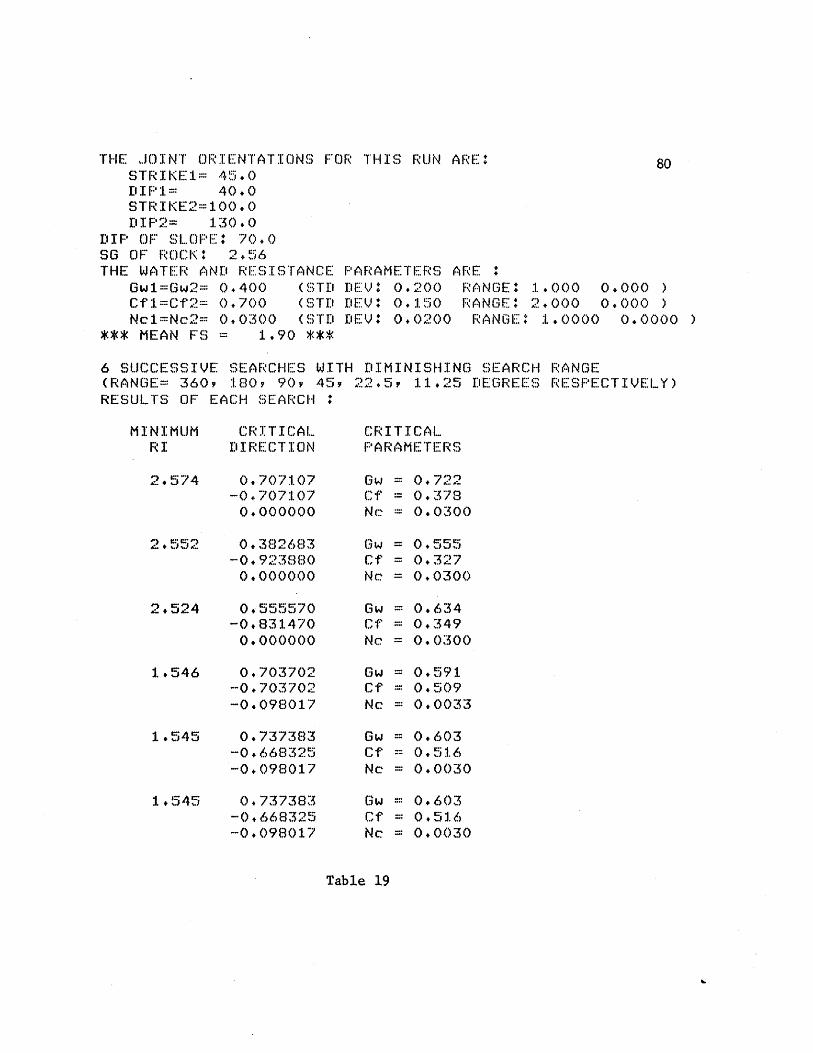
THE JOINT ORIENTATIONS FOR THIS RUN ARE: 80STRIKE1=:: 45.0DIP1= 40.0STRIKE2=100.0DIP2=: 1.30.0
DIP OF SLOPE: 70.0SG OF ROCK4 2.56THE WATER AND RESISTANCE PARAMETERS ARE :
Gw1=Gw2= 0.400 (STD DEV: 0.200 RANGE: 1. .000 0.000 )Cf1=Cf2:= 0.700 (STD DEV: 0.150 RAN GE: 2.000 0.000 )Nc1=Nc2= 0.0300 (STl DEV: 0.0200 RANGE, 1.0000 0.0000 )
*** MEAN FS = 1.90 ***
6 SUCCESSIVE SEARCHES WITH DIMINISHING SEARCH RANGE(RANGE::: 3609 1.80v 90Y 45,RESULTS OF EACH SEARCH :
CRITICALDIRECTION
0.707107--0.707107
0.000000
0.382683-0.923880
0.000000
0.555570-0,831470
0.000000
0. 703702-0.703702-0.098017
0.737383-0.668325-0.098017
0.737383-0.668325--0. 098017
22.5, 11.25 DEGREES RESPECTIVELY)
CRITICALPARAMETERS
Gw = 0.722Cf = 0.378Ne = 0.0300
Gw 0.555Cf = 0.327Ne 0.0300
Gw = 0.634Cf = 0.349Nc = 0.0300
Gw = 0.591Cf = 0.509Nc = 0.0033
Gw = 0.603Cf = 0.51.6Nc = 0.0030
Gw 0.603Cf = 0.51.6Nc 0.0030
Table 19
MINIMUMRI
2.574
2.552
2.524
1.546
1.545
1.545
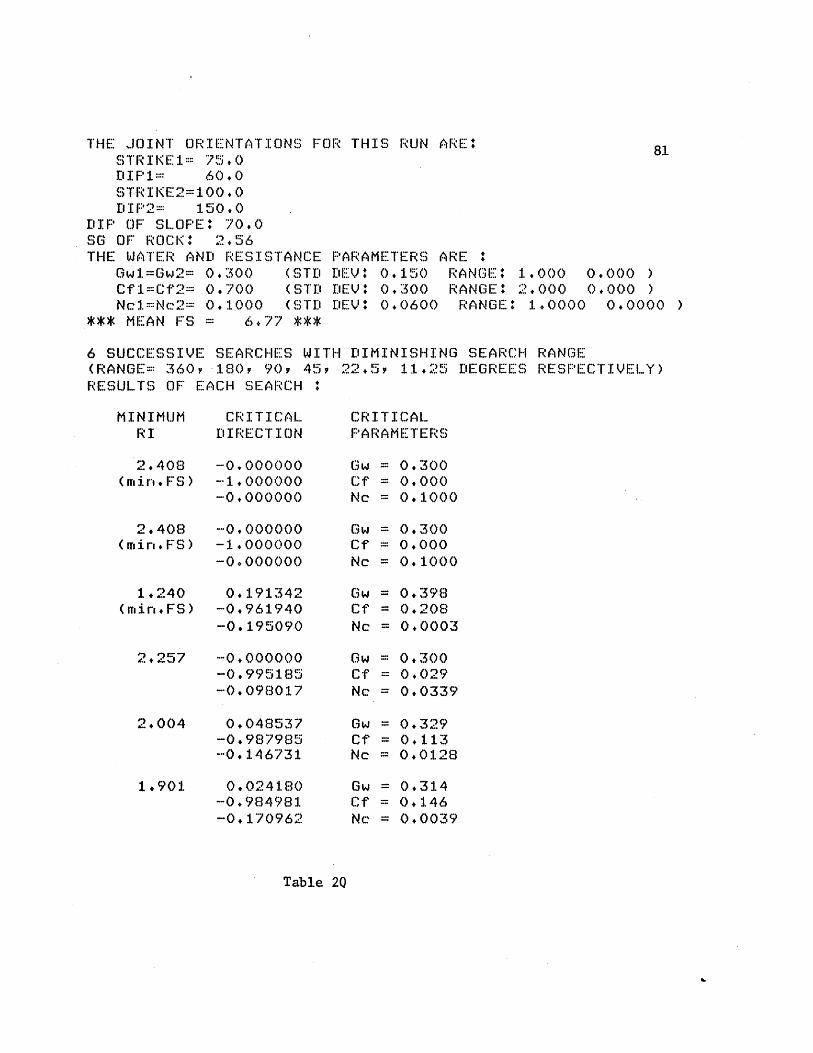
THE: JOINT ORIENTATIONS FOR THIS RUN ARE: 81STRIKE1= 75.0DIPI:=: 60.0ST R IKE 2:= 1.00.0DIP2= 150.0
E I P OF SL.OPE: 70 .0SG OF ROCK 2.56THE WATER AND RESISTANCE PARAMETERS ARE
Gw1=Gw2:= 0.300 (STD DEVi 0.150 RANGE 1.000 0.000 )Cf1=Cf2= 0.700 (STD DEVI 0.300 RANGE: 2.000 0.000 )Nc1.=Nc2:= 0.1000 (STD DEVI 0.0600 RANGE: 1.0000 0.0000 )
*** MEAN FS = 6.77 ***
6 SUCCESSIVE SEARCHES WITH DIMINISHING SEARCH RANGE(RANGE= 360 Y-180Y 90Y 45YRESULTS OF* EACH SEARCH :
22. 5s, 11. 25 DEGREES RESPECTIVELY)
MINIMUMRI
2.408(min,.FS)
2.408(min .FS)
1.240(iin. FS)
CRITICALDIRECTION
-0.000000-1.000000-0.000000
-0.000000-1.000000-0.000000
0.191342-0.961940-0,195090
2.257 -0.000000-0.995185-0.098017
2.004 0.048537-0.987985--0.146731
1.901 0.024180-0.984981-0.170962
CRITICALF'ARAMETERS
Gw = 0,300Cf = 0.000Nc = 0.1000
Gw = 0.300Cf = 0.000Nc = 0.1000
Gw = 0.398Cf = 0.208Nc = 0.0003
Gw = 0.300Cf 0.029Nc 0.0339
Gw 0.329Cf = 0.113Nc = 0.0128
Gw = 0.314Cf = 0.146Nc = 0.0039
Table 20
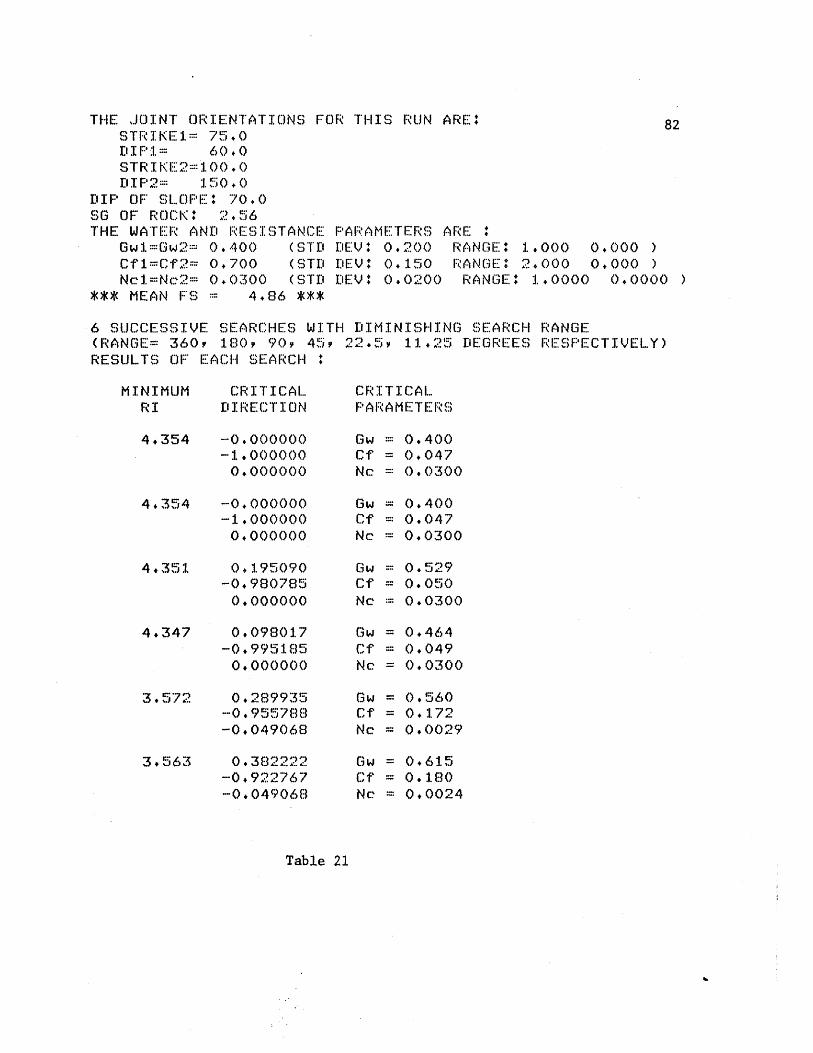
THE JOINT ORIENTATIONS FOR THIS RUN ARE: 82STRIKE1= 75.0D IF1= 60.0STRIKE2=100.0DIP2= 150.0
DIP OF SLOPE: 70.0SG OF ROCK: 2,56THE WATER AND RE:SISTANCE: PARAMETERS ARE *
Gw1=Gw2:= 0.400 (STD DEV4 0.200 RANGE* 1.000 0.000 )Cf1=Cf2= 0.700 (ST11 DEV: 0.150 RANGE: 2.000 0.000 )Nc1=Nc2= 0.0300 (STD DEV: 0.0200 RANGE: 1.0000 0.0000 )
*** MEAN FS = 4.86 ***
6 SUCCESSIVE SEARCHES WITH DIMINISHING SEARCH RANGE(RANGE= 360, 180, 90, 45,RESULTS OF EACH SEARCH +
MINIMUMRI
CRITICAL ..El I RE CT I ON
4.354 -0.000000-1.0000000.000000
4.354 --0.000000-1.0000000.000000
4.351 0.195090-0.9807850.000000
22.5, 11.25 DEGREES RESPECTIVELY)
CRITICAL..F'ARAMETERS
GwCfNc
0.4000.0470. 0300
Gw = 0.400Cf = 0.047Nc = 0.0300
Gw = 0.529Cf = 0.050Nc = 0.0300
0.098017-0.995185
0.000000
0.289935--0.955788-0.049068
0.382222-0.922767-0.049068
GwCfNc
GwCfNc
0.4640.0490. 0300
0.5600.1720.0029
Gw = 0.615Cf = 0.180Ne = 0.0024
Table 21
4,347
3.572
3.563

THE JCINT ORIENTATIONS FOR THIS RUN ARE: 83STRIKE1= 45.0D'IP1.*= 40.0STR I KE2= 1 3(0 .0DIP2= 1.50.0
DIP OF S...OPE 70.0SG OF ROCK: 2.56THE WATER:;V AND: RESISTANCE PARAMFT ERS ARE :
Gwl=:Gw2= 0.400 ( STD DEV 0.200 RANGE: 1.000 0.000 )Cf1=Cf2= 0.700 (STD DEVI 0,1.50 RANGE+ 2.000 0.000 )Nc1=Nc-2= 0.0300 (STD D:EV: 0.0200 RANGE: 1.0000 0.0000 )
*** MEAN FS = 1.62 ***
6 SUCCESSIVE SEARCHES WITH DIMINISHING SEARCH RANGE(RANGE:= 360, :1.80, 90, 45YRESULTS OF EACH SEARCH
MINIMUM CRITICALRI DIRECTION
1.990 0.7071.07-0.7071070.000000
1.990 0.707107-0,7071070.000000
1.974 0.555570-0.8314700.000000
1.214 0.769288-0.631.339-0.098017
1.027 0.794514-0,589252-0,146730
0.956 0.776740-0.606174-0,170962
22.5v 11.25 DEGREES RESPECTIVELY)
CRITICALPA RAM E T ER S
Gw 0.649Cf = 0.451N c 0.0300
Gw 0.649Cf = 0.451.Nc 0.0300
Gw 0.583Cf = 0.426Nc 0.0300
Gw = 0.569Cf = 0.561Nc = 0.0085
Ow = 0.548Cf = 0.590Nc = 0.0026
Gw = 0.534Cf = 0.596Nc = 0.0006
Table 22

THE JOINT ORIENTATIONS FOR THIS RUN ARE: 84STRIKEI.= 45.0DIP1:= 60.0STRIKE 2 =100.0DIP2=: 1.30.0
DIP OF SL OPE: 70.0SG OF' ROCK 2.56TrHE WATER AND REISTANCE P ARA METERS ARE
Gw1=Gw2= 0.400 (STI'D DE V 0.200 RANGE: 1.000 0.000 )Cf1=Cf2= 0.700 (STD DEV* 0.150 RANGE* 24000 0.000Ncl:::Nc2::: 0.0300 (STD DEVv: 0.0200 RANGE* 1.0000 0.0000 )
*** MEAN FS = 1.48 ***
6 SUCCESSIVE SEARCHES WITH DIMINISHING SEARCH RANGE(RANGE:= 360, 180, 90, 45,RESULTS OF EACH SEARCH :
C RIT I C A LDIRECTION
0.707107-0.7071070.000000
0.853553-0.353553-0.382683
0.853553-0.353553-0.382683
0.681734-0.559485-0.471397
0.708366-0.525360-0.471397
0.678593-0.503279-0.534998
22.5, 11. *2'5 DEGREES RESPECTIVELY)
CRITICALPARAMETERS
Gw = 0.598Cf = 0.502Nc = 0.0300
Gw = 0.462Cf = 0,674Nc = 0.0022
Gw = 0.462Cf = 0.674Nc = 0.0022
Gw = 0.441.Cf = 0.666Ne = 0.001.3
Gw = 0.443Cf = 0,668Ne = 0,001.2
Gw = 0.438Cf = 0.672Ne = 0.0003
Table 23
MINIMUMRI
1.586
0.406
0.406
0.379
0,376
0.356

THE JOINT ORIENTATIONS FOR THIS RUN ARE: 85STRIKE1= 45.0DIP:L=: 40.0STRIKE2=100.0DIP2= 1.50.0
DIP OF SLOPE: 70.0SG OF ROCK* 2.56THE WATER AND RESISTANCE PARAMETERS ARE :
Gw1=Gw2= 0.400 (STD LDEV 0.200 -RANGE: 1.000 0.000 )Cfl=Cf2=: 0.700 (STD DEVI 0.150 RANGE: 2.000 0.000 )Nc1=Nc2= 0.0300 (STD DEV: 0.0200 RANGE: 1.0000 0.0000 )
*** MEAN FS = 2.48 ***
6 SUCCESSIVE SEARCHES WITH DIMINISHING SEARCH RANGE(RANGE= 360Y 180Y 90Y 45,RESULTS OF EACH SEARCH :
CRITICALDIRECTION
3.357 -0.000000-1.0000000.000000
0.382683-0.9238800.000000
0.382683-0.9238800.000000
0.382683-0.9238800.000000
0.554901-0.830468-0.049068
0.613565-0.786210-0.073565
22.5v 11.25 DEGREES RESPECTIVELY)
CRITICALPARAMETERS
Gw = 0.400Cf = 0.196Ne = 0.0300
Gw = 0,597Cf = 0.224Nc = 0.0300
Gw = 0.597Cf = 0.224Nc = 0.0300
Gw = 0.597Cf = 0.224Nc = 0.0300
Ow = 0.636Cf = 0.347Nc = 0.0091.
Gw = 0.640Cf = 0.392Nc = 0.0012
Table- 24
MINIMUMRI
3.256
3.256
3.256
2.551
2.302
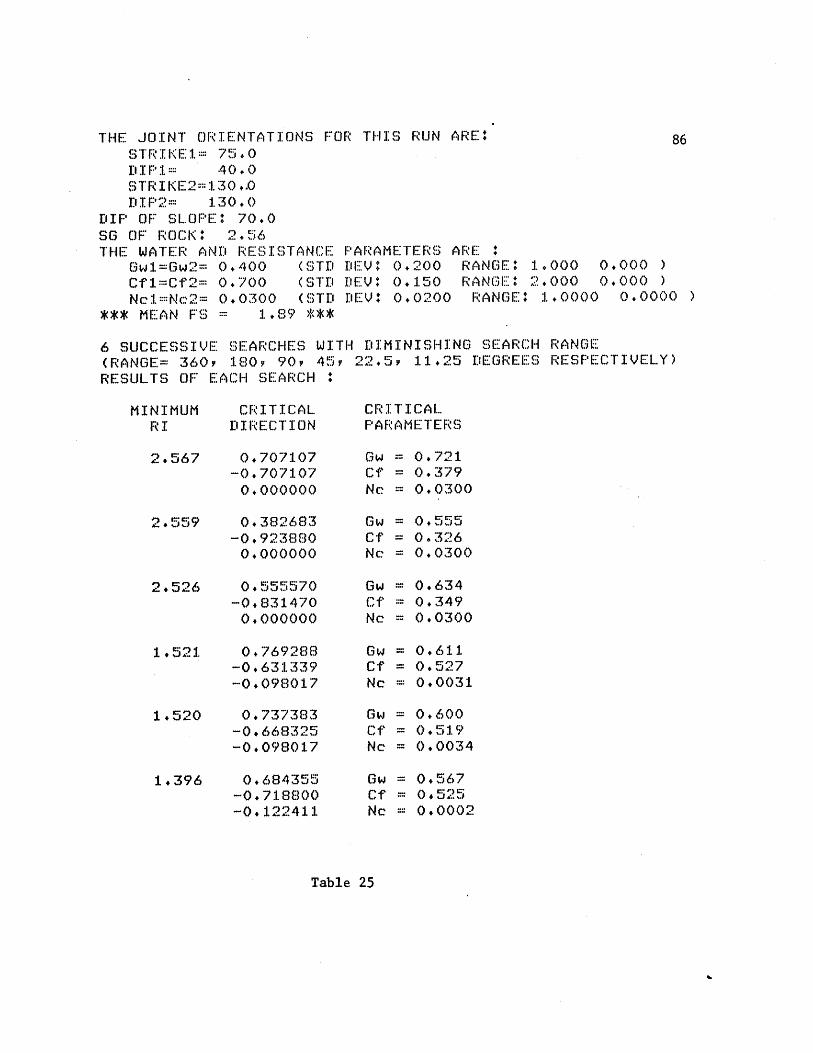
THE JOINT ORIENTATIONS FOR THIS RUN ARE: 86STRIKIE 1= 75.0DIF1= 40.0STRIKE.2=130 ..0DIP2= 130.0
DIP OF SL.OFE: *70.0SG OF ROCK: 2.56THE WATER AND RES ISTANCE:. PARAMETERS ARE
Gw1=(w2= 0.400 (STD DEV 0.200 RANGE: 1.000 0.000 )Cfl=Cf2= 0.700 (STD DEV: 0.150 RANGE: 2.000 0.000 )Nc1=:Nc2= 0.0300 (STI'D D:EV: 0.0200 RANGE: 1.0000 0.0000 )
*** MEAN FS 1.89 ***
6 SUCCESSIVE SEARCHES WITH DIMINISHING SEARCH RANGE(RANGE= 360Y 180Y 90Y 45YRESULTS OF EACH SEARCH +
CRITIC ALDIRECTION
0.707107-0,7071070.000000
0.382683-0.9238800.000000
0.555570-0. 8314700.000000
0.769288-0.631339-0.098017
0.737383-0.668325-0.098017
0.684355-0.718800-0.122411
22.5, 11.25 DEGREES RESPECT IVELY)
CRITICALPA RA MET ER S
Gw = 0.721Cf = 0.379Nc 0.0300
Gw 0,555Cf = 0.326Nc 0.0300
Gw 0,634Cf 0.349Nc = 0.0300
Gw 0.611Cf 0.527Nc 0.0031
Gw = 0.600Cf = 0.51.9Nc = 0.0034
Gw = 0.567Cf = 0#525Nc = 0.0002
Table 25
MINIMUMRI
2.567
2.559
1.521
1.520
1.396

In some of the runs, the first few of the 6 nested searches miss
the F region. Under such circumstances, the lowest factor of safety
encountered is printed below the column "MINIMUIM RI", with the bracketed
term "(min.FS)" printed to indicate that it is the factor of safety,
not the 6 value. Examples are the first and second search in Table 18,
and the first, second and third search in Table 20. It is seen that
even though the first few searches may miss the unsafe region F, each
successive search will bring the critical direction closer to the F
region until finally the F region is hit. For instance in Table 20, the
lowest factor of safety encountered decreased from 2.41 in the initial
search to 1.24 (quite close to the F boundary which is F.S. = 1) in
the third nested search. The next (fourth search) hit the F region,
and the value 2.257 is the S value for that search.
One notices that in all cases in Tables 18-25, the final critical
direction is towards an increase in the water parameter G , and a
decrease in both tan* and N c, as one would expect.
A comparison of the final critical directions between Tables 18.
and 19 shows that in Table 18 the critical direction is mainly
towards a reduction in tan4 , while in Table 19 an increase in water
effect and a decrease in tant are both about equally important. This
has to do with the different mean value and standard deviations of G ,w
$ and N between Tables 18 and 19.c
The two cases corresponding to Tables 18 and 20 have been used to
test the robustness of the search algorithm. This was done by

randomizing uniformly the initial search directions within a range of
+250 from the nominal direction of search, as was done for the cases
of only geometric uncertainty. Figs. 4.6 and 4.7 summarize results of
these two cases, in each of which 20 runs were made. Also shown is the
0 value for the case when directions are not randomized (last run of
each figure).
In both figures, no matter what critical direction is identified
in the first randomized search, the S values and the critical points
on the safe region boundary at the end of the sixth search are practi-
cally all the same (in the range 1.85 to 2.0 for Fig. 4.6 and 1.02 to
1.06 for Fig. 4.7).
Portions of the 20 randomized runs corresponding to Fig. 4.6 are
shown in Tables 26 to 30, and those corresponding to Fig. 4.7, in
Tables 31 to 35.
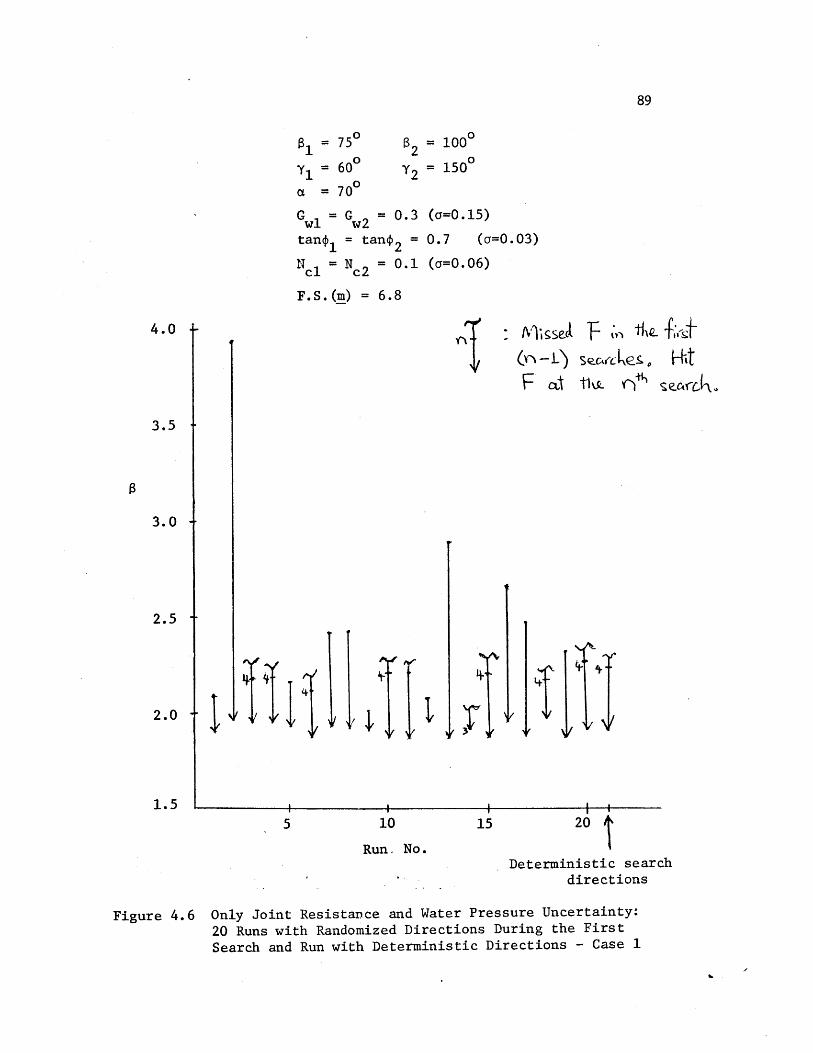
al = 75 0 62
Y1 = 60 0 Y2a = 700
G = G = 0.3wl w2tant1 = tant 2 =N c1 = Ne2 = 0.1
F.S.(m) = 6.8
= 1000
= 1500
(a=0.15)
0.7 (a=0.03)
(a=0. 06)
- Niissea F 0n th Ik1(n -.L) s-c c ke-&, Hit
TIRun. No.
5-.
20
Deterministic searchdirections
Figure 4.6 Only Joint Resistance and Water Pressure Uncertainty:20 Runs with Randomized Directions During the FirstSearch and Run with Deterministic Directions - Case 1
4.0
3.5
3.0 -
2.5 t
2.0 t
1.5

a = 700
= 450
40y= 40
G = G = 0.wl w2
tan 1 = tan 2N = N = 0.
F.S.(m) = 2.8
2.0 L
1.54
1.0 -
12:14,
2 = 1000
y2 = 1300
3 ( =0.15)
= 0.7 ( =0.3)
1 ( =0.06)
~LL /'
0.5 t
Run No.
20 TDeterministic search
direction
Figure 4.7 Only Joint Resistance and Water Pressure Uncertainty:20 Runs with Randomized Directions During the FirstSearch and Run with Deterministic Directions - Case 2
4' / V

THE JOINT ORIENTATIONS FOR THIS RUN ARE: 91STRIKIE1= 75.0DIP1= 60.0STRIKE2=100.0DIP2=: 150.0
DIP OF SLOPE: 70.0SG OF ROCK e 2.56THE WATER AND RESISTANCE PARAMETERS ARE :
Gwl=Gw2= 0.300 (STD DEVf 0.150 RANGE# 1.000 0.000 )Cf1=Cf2= 0.700 (STD DEV 0.300 RANGE: 2.000 0.000 )Nc1=Nc2= 0.1000 (STD DEV: 0.0600 RANGE: 1.0000 0.0000 )
*** MEAN FS = 6.77 ***
6 SUCCESSIVE SEARCHES WITH DIMINISHING SEARCH RANGE(RANGE::: 360, 180Y 90, 45, 22.5, 11.25 DEGREES RESPECTIVELY)RESULTS OF EACH SEARCH #
MINIMUM CRITICAL CRITICALRI DIRECTION PARAMETERS
3.937 0.709621 Gw = 0.959-0.700371 Cf = 0.050-0,072233 Nc = 0.0330
3.937 0.709621 Gw = 0.959-0.700871 Cf = 0.050-0.072233 Ne = 0.0330
3.195 0.559253 Gw = 0.767-0.825844 Cf = 0.010-0.072233 Nc = 0.0396
1.942 0.198255 Gw = 0.412-0.965357 Cf = 0.154-0.169647 Nc = 0.0040
1.906 0.054462 Gw = 0.331-0.983999 Cf = 0.146-0.169647 Nc = 0.0044
1.906 0.030297 Gw = 0.317-0.985039 Cf = 0.145-0.169647 Nc = 0.0044
Table 26

THE JOINT ORIENTATIONS FOR THIS RUN ARE: 92STRIIKE:L= 75.0DIP1= 60.0STRIKE2=100.0DIP2= 150.0
DIP OF SLOPE#+ 70.0SG OF ROCKI 2.56THE WATER AND RESISTANCE PARAMETERS ARE .:
Gw=Gw2= 0.300 (STD DEV 0.150 RANGE: 1.000 0,000 )Cf1=Cf2= 0.700 (STD DEYV 0.300 RANGE: 2,000 0.000 )Nc1:=Nc2= 0.1000 (STD DEV: 0.0600 RANGE* 1.0000 0.0000 )
*** MEAN FS = 6.77 ***
6 SUCCESSIVE SEARCHES WITH DIMINISHING SEARCH RANGE(RANGE=: 360, 180, 90Y 45,RESULTS OF EACH SEARCH :
MINIMUMRI
2.190(min, FS)
2.164(min.FS)
1.452(min.FS)
2.183
1.947
1.946
CRITICALDIRECTION
0.043805-0.998953-0.0131.67
0.422754--0.906149-0.013166
0.042851-0.977193-0,207986
0.043538-0.992854-0.111111
0.043247-0.986211-0.159741
0.019031-0.986975-0.159741
22.5, 1.1.25 DEGREES RESPECTIVELY)
CRITICALPARAMETERS
Gw = 0.331Cf = 0.001Nc = 0.0908
Gw = 0.626Cf = 0.000Nc = 0.0898
Gw = 0.320Cf 0.233Nc 0.0006
Gw = 0.328Cf = 0.054Nc = 0.0277
Gw - 0.325Cf = 0.132Nc 0.0079
Gw = 0.311Cf = 0.131Nc 0.0079
Table 27
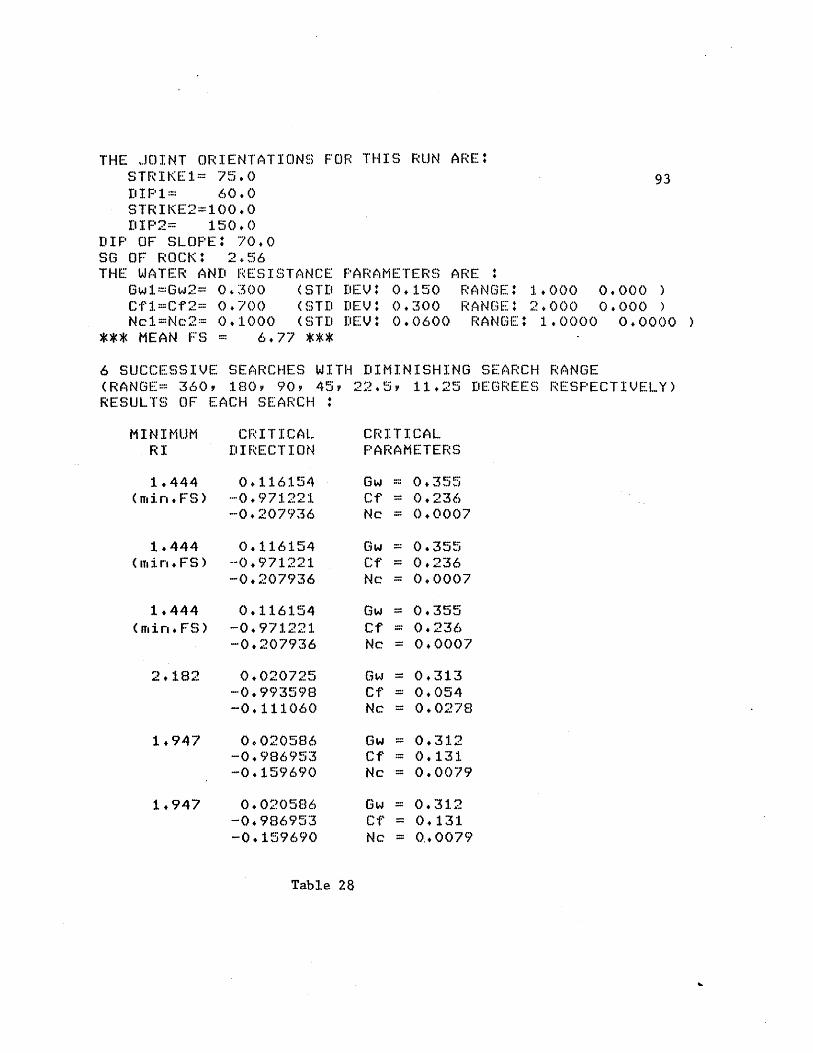
THE JOINT ORIENTATIONS FOFR THIS RUN ARE:STRIKE1= 75.0 93DIP 1= 60.0STRIKE2=100.0DIP2= 150.0
DIP OF SLOPE* 70.0SG OF ROCK+ 2.56THE WATER AND RESISTANCE PARAMETERS ARE
Gwi=Gw2= 0.300 (STD DEV* 0.150 RANGE' 1.000 0.000 )Cf1=Cf2= 0.700 (STD D:EVv: 0.300 RANGE: 2.000 0.000 )Nc1=Nc2= 0.1000 (STD D:EV: 0.0600 RANGE: 1.0000 0.0000 )
*** MEAN FS = 6.77 ***
6 SUCCESSIVE SEARCHES WITH DIMINISHING SEARCH RANGE(RANGE= 360, 180, 90, 45,RESULTS OF EACH SEARCH :
22.5, 11.25 DEGREES RESPECTIVELY)
MINIMUMRI
1.444(min. FS)
1.444(min .FS)
1.444(min .FS)
2.182
1.947
1.947
CRITICALDIRECTION
0.116154-0.971221--0.207936
0.116154-0.971221-0.207936
0.116154-0.971221-0,207936
0.020725-0.993598-0.111060
0. 020586-0.986953-0.159690
0. 020586-0.986953-0.159690
CRITICALPARAMETERS
Gw = 0.355Cf = 0.236Nc = 0.0007
Gw = 0.355Cf = 0.236Nc = 0.0007
Gw =
Cf =Nc =
Gw =Cf =Nc =
Gw =Cf =Nc =
Ow =Cf =Nc =
0.355
0.2360. 0007
0.3130.0540.0278
0.3120,1310.0079
0.3120.1310, 0079
Table 28

THE JOINT ORIENTATIONS FOR THIS RUN ARE: 94STRIKE1= 75.0DIP1.= 60.0STRIKE2=100.0DIP2= 150.0
DIP OF SLOPE#* 70.0SO OF ROCK# 2.56THE WATER AND RESISTANCE PARAMETERS ARE :
Gwl=Gw2= 0.300 (STD DEV 0.150 RANGE* 1.000 0.000 )Cfl:=Cf2= 0.700 (STD DEV 0.300 RANGE: 2.000 0.000 )Nc1=Nc2= 0.1000 (STD DEV 0.0600 RANGE* 1.0000 0.0000 )
*** MEAN FS = 6.77 ***
6 SUCCESSIVE SEARCHES WITH DIMINISHING SEARCH RANGE(RANGE= 360Y 180Y 90'( 45YRESULTS OF EACH SEARCH :
CRITICALDIREECTION
2,086 -0.212192-0.966140-0.146793
0.173686-0.973799-0.146794
2.006 -0.019631-0.988972-0.146794
2.006 --0.019631-0.988972-0.146794
0.028920-0.988744-0.146794
0.028806-0.984846-0,171025
22.5y 11.425 D:'EGREES RESPECTIVELY)
CRITICALF'ARAMETERS
= 0.171= 0.112= 0.0107
= 0.404= 0.119= 0.0124
= 0,288= 0.111= 0.0126
= 0.288= 0,111= 0,0126
GwCfNe
GwCfNc
GwCfNc
GwCfNc
Gw = 0.317Cf = 0.112Nc = 0.0127
GwCfNc
= 0.316= 0.147= 0.0039
Table 29
MINIMUMRI
2.034
2.003
1.900
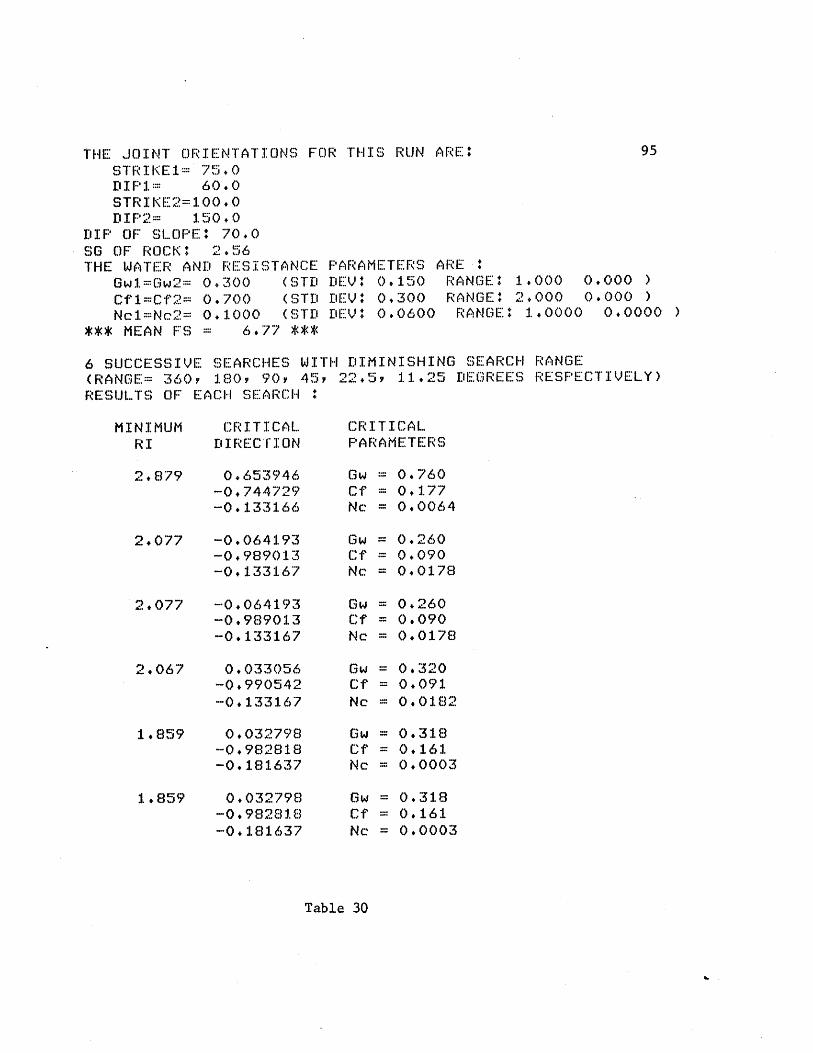
THE JOINT ORIENTATIONS FOR THIS RUN ARE:: 95STRIKE1= 75.0DIP1:= 60.0STRIKE2=100.0DIF'2= 150.0
DIP OF SLOPE: 70.0SG OF ROCK: 2. 56THE WATER AND RESISTANCE PARAMETERS ARE -i
Gw1=Gw2:= 0.300 (STD DEV 0.150 RANGE: 1.000 0.000 )Cf1=Cf2= 0.700 (STD DEY: 0.300 RANGE: 2.000 0.000 )Nc1=Nc2= 0.1000 (STD DEV 0.0600 RANGE 1.0000 0.0000
*** MEAN FS = 6.77 ***
6 SUCCESSIVE SEARCHES WITH DIMINISHING SEARCH RANGE(RANGE= 360, 180y 90, 45,RESULTS OF EACH SEARCH :
CRITICALDIRECTION
0.653946-0.744729-0.133166
2.077 -0.064193-0.989013-0.133167
2.077 -0.064193-0.989013-0.133167
0.033056-0.990542-0.133167
0.032798-0.982818-0.181637
0,032798-0. 982818-0.181637
22.5, 11.25 DEGREES RESPEECTIVELY)
CRITICALF'ARAMETERS
Gw = 0.760Cf = 0.177Nc = 0.0064
Gw = 0.260Cf = 0.090Nc = 0.0178
Gw = 0.260Cf = 0.090Nc = 0.0178
Gw = 0.320Cf = 0.091Nc = 0.0182
Gw = 0.318Cf = 0.161Nc = 0.0003
Ow = 0.318Cf 0,161Nc = 0.0003
Table 30
MINIMUMRI
2.879
2.067
1.859
1.859

THE JO"INT ORIENTATIONS FOR THIS RUN ARE.STRIKE*1.= 45.0DIP1= 40.0STRIKE2=100.0D I F'2:= 130,.0
DIP OF SLOPE I 70.0SG OF ROCKO 2.56THE WATER AND RESISTANCE
Gw1. =Gw2= 0.300 (STDCf 1=-C:f2= 0 . 70(0 (STDNc1=Nc2= 0.1000 ST 1
*** MEAN FS = 2.86 ***
PA RAM E T ER S ARE :D1EV: 0.150 RANGE: 1.000 0.000 )DEV*: 0.300 RANGE: 2.000 0.000 )DEV+ 0.0600 RANGE: 1.0000 0.0000 )
6 SUCCESSIVE SEARCHES WITH DIMINISHING SEARCH RANGE(RANGE=: 360.v 180Y 90Y 45 YRESULTS OF: EACH SEARCH #
CRITICALDIRECTION
0.762670--0.575439-0.295304
0.132392-0.946186-0.295304
0.132392-0.946186-0.295304
0.132392-0.946186-0.295304
0.175735-0.923185-0.341828
0.153026-0*927220-0.341828
22.5y 11.25 DEGRE:ES RESF'ECTIVELY)
PARAMETERS
Gw = 0.554Cf = 0.508Nc = 0.0016
Gw = 0.342Cf = 0.402Nc = 0.0069
G w = 0.342Cf = 0.402Nc = 0.0069
Gw = 0.342Cf = 0.402Nc = 0.0069
Gw = 0.351.Cf = 0.434Nc = 0,001.4
Gw = 0.344Cf = 0.432Nc = 0.0013
Table 31
MINIMUMRI
1.008
1 . 106
1.106
1 .106
1.034
1.032

THE JOINT ORIENTATIONS FOR THIS RUN ARE' 97STRIKE1= 45.,0DI P1= 40.0S T R I K E 2=100. 0DI P2= 130.0
DIP OF SL.C)OPE: 7(0 .0SG OF ROCK 2.56TIE WATER AND REI STANCE PARAMETERS ARE
Gw=l:::Gw2= 0.300 (STD DEV 0.150 RANGE: 1.000 0.000 )Cf 1 =Cf2:= 0.700 (STD D1EV : 0.300 RANGE 2*000 0.000 )Nc1=Nc2= 0.1000 (STD DEV# 0.0600 RANGE: 1.0000 0.0000 )
*** MEAN FS 2.86 ***
6 SUCCESSIVE SEARCHES WITH DIMINISHING SEARCH RANGE(RANGE= 360, 180, 90, 45s,RESULTS OF EACH SEARCH
CRITICALDIRECTION
1.762 -0.520948-0.831.569-0.192630
0.2 19643-0.956374-0.192630
0.028843-0.980847-0.192630
0. 121.841-0.949883- 0.287884
0.073888-0.939485-0,334527
0.073888-0.939485-0.334527
22.5v 11.25 DEGREES RES'PECTIVELY)
CRITICALP AR A METER S
Gw = 0.060Cf = 0.317Nc = 0.0112
Gw = 0.387Cf = 0.322Nc = 0.0238
Gw = 0.312Cf = 0.309Nc = 0.0231
Gw = 0.339Cf = 0.396Nc = 0.0078
Gw = 0.322Cf = 0.424Nc = 0.0016
Gw = 0.322Cf = 0.424Nc = 0.0016
Table 32
MINIMUMRI
1,369
1,355
1.119
1.040
1.040

THE JOINT ORIENTATIONS FOR THIS RUN ARE: 98STRIK E1 45,0DIF'1= 40.0STRIK1:_-1 00 . 0DlIPF,2= 130.0
DIP OF SL..O:E:: 70.0SG OF RC.CK 2.56THE WATER AND RESISTANCE PARAMETERS ARE :
Gw1.:=:Gw2: 0.300 (STD DIEV: 0.1.50 R ANGE: 1. 000 0.000 )Cf1=Cf2= 0.700 (ST11D DEV 0.300 RANGE: 2.000 0.000 )Nc1=N2:= 0.1.000 ( STD DEV: 0.0600 RANGE: 1. .0000 0.0000 )
*** MEAN FS = 2.86 ***
6 SUCCESSIVE SEARCHES WITH DIMINISHING SEARCH RANGE(RANGE= 360Y 1.80Y 90Y 45,RESULTS OF EACH SEARCH :
CRITICALDIRECTION
0.216232-0.936921.-0,274632
0.216232-0.936921-0.274632
0,029293-0.9611.03-0.274632
0*1.23357-0.953604-0.274632
0.075254--0.943921-0,321.482
0.074604-0.935772-0.344624
22.5, 11.25 DEGREES RE:SP'ECT IVELY)
CRITICALPA RAM E T ER S
GwCfNc
= 0.371= 0.393= 0.0100
Gw = 0.371Cf = 0.393Nc = 0.0100
Gw = 0.31.0Cf = 0,382Nc = 0.0090
GwCfNc
GwCfNc
GwCfNc
= 0.341= 0.386= 0.0097
= 0,323= 0,416= 0.0032
= 0.322= 0.430= 0.0005
Table 33
MINIMUMRI
1.156
1 * 156
1.147
1,145
1.060
1,025
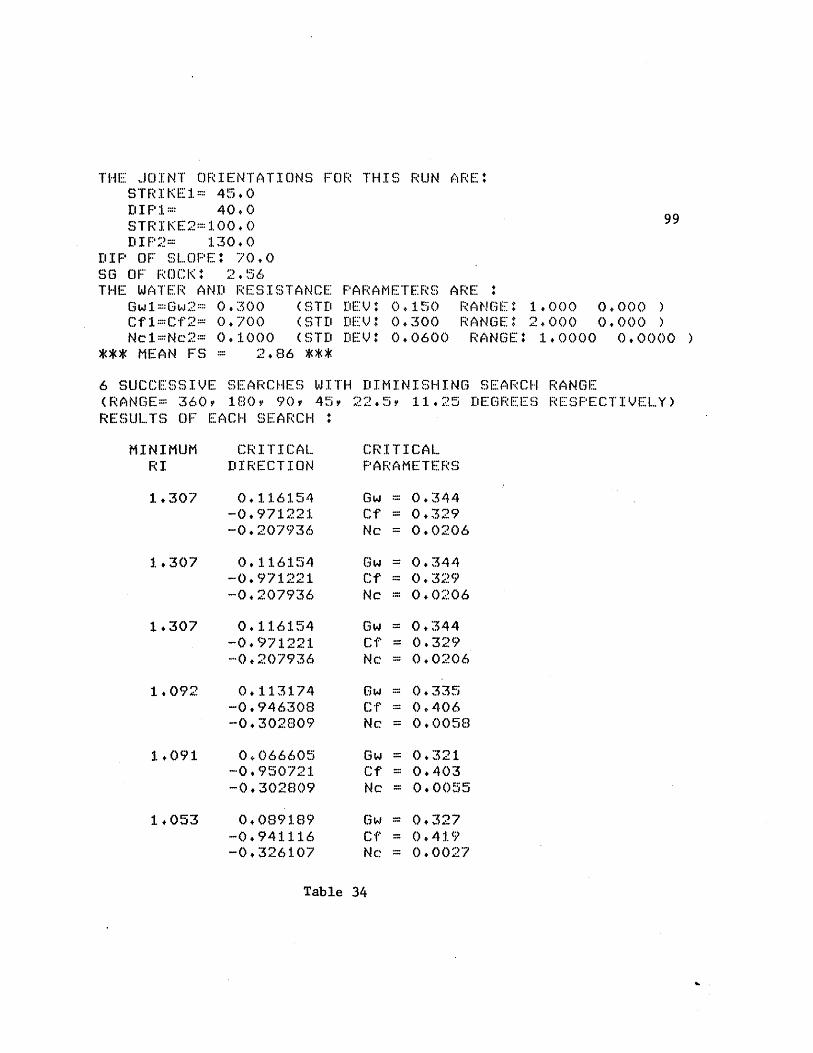
THE JOINT ORIENTATIONS FOR THIS RUN ARE:STR IK1 1=.: 45.0EIP1=: 40.0STRIKE2=100.0 99DI P2 = 130.0
DIP OF SLOPE* 70.0SG :: ROCK 2.56THE WATER AND RESISTANCE 1PARAMETERS ARE
Gw1=Gw2:= 0.300 (STD DEVI 0.150 RANGE 1 .000 0 .000 )Cfl=Cf2= 0.700 (STD DEVI 0.300 RANGE: 2.000 0.000 )Ncl=Nc2= 0.1000 (STD DEV 0.0600 RANGE: 1.0000 0.0000 )
*** MEAN FS = 2.86 ***
6 SUCCESSIVE SEARCHES WITH DIMINISHING SEARCH RANGE(RANGE= 360Y 18 Y 90 Y 45,RESUL.TS OF EACH SEARCH :
CRITICALDIRECTION
0.11.6154-0,971221-0.207936
0.116154-0.971221-0.207936
0.116154-0.971221--0.207936
0.113174-0.946308-0,302809
0.066605-0.950721-0.302809
0.089189-0.941116-0. 326107
22. 5? 11.25 DEGREES RE :SPECTIVELY)
CRITICALPARAMETE RS
Gw = 0.344Cf = 0.329Nc = 0.0206
Gw = 0.344Cf = 0.329Nc = 0.0206
Gw = 0.344Cf = 0.329Nc = 0.0206
Gw = 0.335Cf = 0.406Nc = 0.0058
Gw = 0.321Cf = 0.403Nc = 0.0055
Gw = 0.327Cf = 0.41.9Nc = 0.0027
Table 34
MINIMUMRI
1.307
1.307
1.307
1 092
1.091
1.053
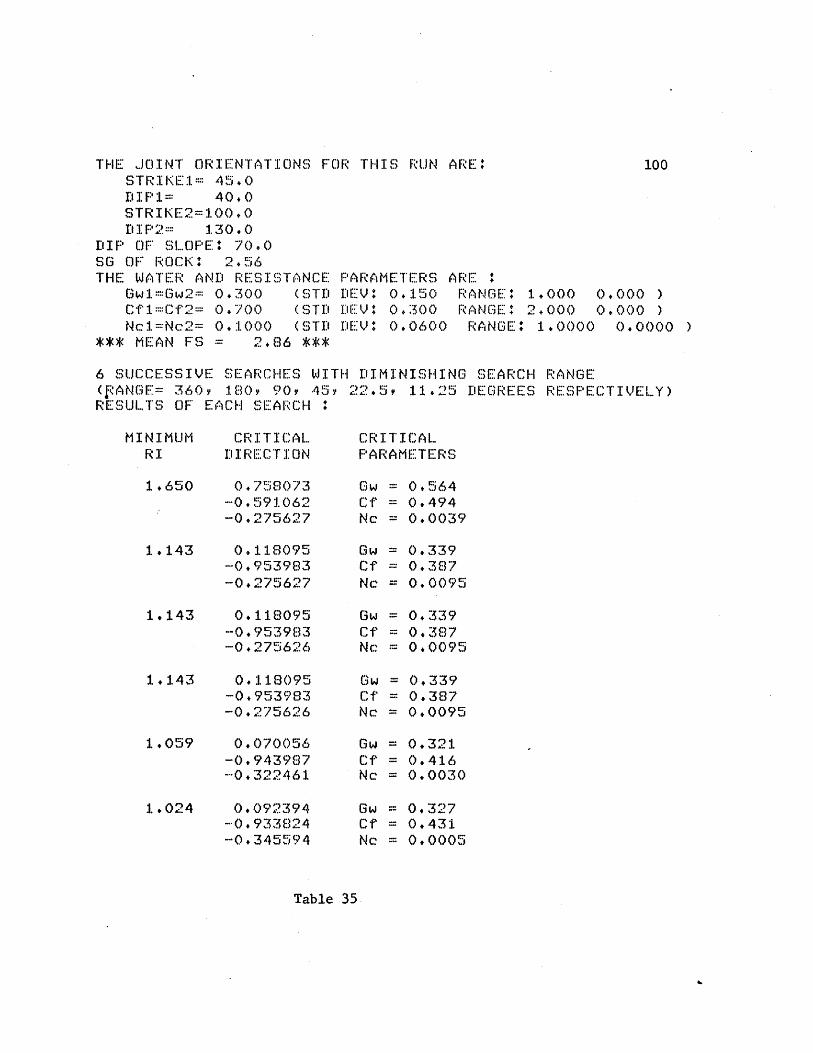
THE JOINT ORIENTATIONS F0R THIS RUN ARE: 100STRIKE.= 45.0DIP1=: 40.0STRIKE2=100.0DIF2= 1.30.0
DIP OF' SLOPE: 70.0SG OF ROCK: 2.56THE WATER AND RESISTANCE PARAMETERS ARE :
Gw1.Gw2:=: 0.300 (STD DEV* 0.150 RANGE:: 1.000 0.000 )Cf 1 =:Cf2= 0.700 (STD DEI .300 RANGE: 2.00 0.000 )Nc1=Nc2= 0.1000 (STD DEV: 0.0600 RANGE: 1 .0000 0.0000 )
*** MEAN FS = 2.86 ***
6 SUCCESSIVE SEARCHES WITH DIMINISHING SEARCH RANGE(fANGE= 360y 1.80, 90, 45,RESULTS OF* EACH SEARCH :
MINIMUM CRITICALRI I RECT I ON
1.650 0.758073-0.591.062-0.275627
1.143 0.118095-0.953983-0.275627
1.143 0.118095--0.953983-0.275626
1.143 0.118095-0.953983-0.275626
1.059 0.070056-0.943987--0.322461
1.024 0.092394-0. 933824-0.345594
22.59 11.25 DEGREES RESPECTIVELY)
CRITICALPAR A METER S
Ow = 0.564Cf = 0.494Nc = 0.0039
Gw = 0.339Cf = 0.387Nc = 0.0095
Gw = 0.339Cf = 0.387Nc = 0.0095
Gw = 0.339Cf = 0.387Nc = 0.0095
Gw = 0.321Cf = 0.416Nc = 0.0030
Gw = 0.327Cf = 0.431Nc = 0.0005
Table 35
ii
101
CHAPTER 5
SUMMARY AND CONCLUSIONS
A model of wedge stability based on limit equilibrium has been
proposed. The associated Factor of Safety against sliding along the
line of intersection is an explicit and relatively simple function of
joint orientation angles, height of wedge, slope inclination and water
and resistance parameters. A computer program has been developed
which calculates the second moment reliability index S, for cases with
only geometric uncertainties and with only water parameter and resis-
tance uncertainties.
The following general conclusions can be drawn:
1. For given resistance and water parameters, the Factor of Safety of
a wedge formed by 2 intersecting joint planes decreases as the
angle (62-a1) increases and as the dips steepen, provided daylight-
ing is still possible.
2. For any combinations of the dips within the range 0 < y 31 90 ,
900 < Y2 < 180 0, sliding will be along the line of intersection
of the two joint planes, provided ( 2~1) < 900. For 21) > 90
there are certain combinations of dips which will lead to sliding
along one plane only. For 2~1~ 1800, sliding along the inter-
section can only be realized if the two joint planes are equally
steep.
3. From results in Chapter 4 on the second-moment reliability index f,

102
uncertainties associated with the water and resistance parameters
are in general more critical than those associated with joint
orientation angles.
The reliability index has been calculated.by assuming no correla-
tion or perfect correlation between the random variables and by separ-
ately testing joint orientation uncertainty and resistance and water
parameter uncertainty. A possible and relatively simple extension of
the study would be to take correlation into account and to increase the
number of random variables that can be considered simultaneously.
Since consequences of wedge failure depend on the volume of the
moving rock body, another possible area of further research is to make
reliability comparisons while also accounting for wedge volume.
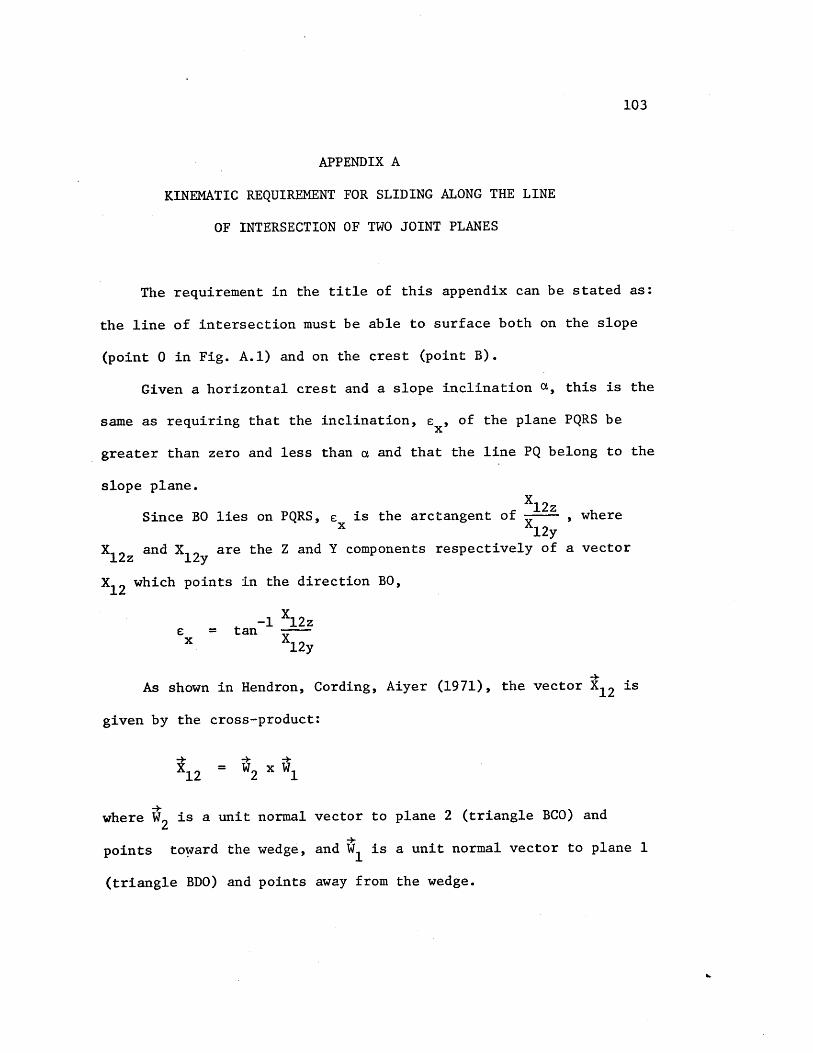
103
APPENDIX A
KINEMATIC REQUIREMENT FOR SLIDING ALONG THE LINE
OF INTERSECTION OF TWO JOINT PLANES
The requirement in the title of this appendix can be stated as:
the line of intersection must be able to surface both on the slope
(point 0 in Fig. A.1) and on the crest (point B).
Given a horizontal crest and a slope inclination a, this is the
same as requiring that the inclination, e , of the plane PQRS be
greater than zero and less than a and that the line PQ belong to the
slope plane.X12 z
Since BO lies on PQRS, e is the arctangent of - , where12y
X12z and X12y are the Z and Y components respectively of a vector
X12 which points in the direction BO,
-l X12ze = tan -x X12y
As shown in Hendron, Cording, Aiyer (1971), the vector X12 is
given by the cross-product:
X12 2 1
where W2 is a unit normal vector to plane 2 (triangle BCO) and
points toward the wedge, and W is a unit normal vector to plane 1
(triangle BDO) and points away from the wedge.

104
* Plane PQRS contains the line of intersection BO andstrikesparallel to the
+ X12-W12 X 1 2 where X12
= X12 /sinO (see
slope.
is a vector along BO.
Fig. A.2 and Eq. A.7)
Figure A.1 Kinematic requirement for sliding.

105
2 = i(-siny2 sin 2 ) + j(siny2 cos" 2 ) + k(-cosy 2 ) (A.1)
W = i(-sinylsinS,) + j(sinylcossl) + k(-cosyl) (A.2)
Therefore,
X12x = cos 1sinylcosy2 - cos 2 cosylsiny2 (A.3)
X12y = sin 1siny1 cosy 2 - sinS 2cosysiny2 (A.4)
X 12z = sin(S1- 2 )siny 1siny2 (A.5)
Using these results, the kinematic requirement becomes
0 < tan 1 sin(a2 ~ 1) < a (A.6)
sina 2cotyl - sinaycoty2I
For later purposes, we calculate also the components of a unit
vector along the line of intersection. Call this vector W12. Then
112 ___ __ __
=1 2 - 2
12 12 2 1 sin$
where p = angle between W2 and W
= dihedral angle of wedge (see Fig. A2).
Since W and W2 are unit vectors, ''2 l = 1 and
W12 12 /sin=1
where sin* = /1 - cos2
106
W2 1
cos$ = 2 1W21 1 1
= W2 W1
= siny 1sinT2 cos(62- ) + cosy 1 cosy 2
Therefore,
W = 1 (A.7)W12 sin$ A7
where sin4 = V-[siny 1siny2 cos(a 2-1)+cosy 1 cosy2] 2

107
APPENDIX B
AREAS OF BOUNDING TRIANGLES AND VOLUME OF WEDGE
To express the Factor of Safety directly in terms of joint
orientation angles, slope inclination and height of wedge, it is
first necessary to have expressions for the areas of bounding
triangles and volume of wedge. This appendix shows how these
expressions (Eq. B.2, B.3, B.6) are obtained. They are needed in
Chapter 3.
The expressions for Al, A2 and V were initially obtained using
vector analysis. For instance
1 + +A = 2 O0D x OBI
Many tedious algebraic manipulations were involved in condensing
the expressions from vectorial cross-products and dot-products. The
condensed expressions have been used herein and checked by direct
geometrical argument.
In Fig. B.1, PQRS is a plane that contains the line of inter-
section BO, and that strikes parallel to the slope.
Denote by d the perpendicular distance from a point p to
a line KL, and by KL the length of the segment from K to L. Then
the area of triangle BOD is:
A = 1- BD - d1 2' - 0,BD

108z
Y
x
12(cots j-Cct)A =Area BDO = 1
2 sin$1siny1
A = Area2
(cote -cota)BCO =-=h
2 sinS 2siny2
V = Volume of tetrahedron BDOCB
= =h3 (cotB-cotS2)(cote -cota)2
Figure B.1 Area of bounding planes and Volume of wedge.

109
The distance d can be calculated as:0,BD
d 0 h/siny1
and BD can be found from the following developments. By geometry,
d=n dBDC
1 BD
Let OZ be the vertical line through point 0, then
d =d -dBDC Bd,0Z DC,0Z
Dividing by h, one gets
d d dDB,DC _B,0Z _-,0h h h
= cote - cota (B.1)
h(cote - cota)xhence BD =
sin$1
with the result that
h(cotE - cota)1 x h1 2 sin% sinY
or
A (cote - cota)1 1 x2 2 sina sinYB
Similarly, one can show that
A (cote - cota)2 x(B.3)
h22 sinS2 siny
110
x12yIn both Eq. (B.2) and Eq. (B.3) cote is given by X '
12z
From Eq. (A.4) and Eq. (A.5), one obtains:
sina2coty, - sine cotY2
COtE = 1 s 2 (B.4)x sin(%2%1
Equations (B2) and (B3) are valid for 0 < e < a which is the
requirement for the line of intersection to daylight both on the
slope face and on the crest.
We now turn to the calculation of the wedge volume. For a
tetrahedron, the volume is given by the product
- (Area of base) - Height
so that for the wedge in Fig. B.1,
V = 3 ( x DCxdB,DC) h (B.5)
where, from Eq. (B.1)
d BDC) h(cote - cota)
Looking in the direction perpendicular to triangle BCD (Fig. B.2),
DC = DX + XC
Hence
= + = cot 1 + cote
BX BX BX
111
= cot 1 - cotS2
and
DC = BX - (cots1 - cotS2
= h(cote - cota)(cot% - cotS 2)
Substituting for dB,DC and DC in Eq. (B.5),
1 1V =. x x h(cotc -cota) (cots -coto2) x h(cote -cota)) x h3x1- 2 x
V 1 2or = e-(cotS -cotS 2)(cote -cota) (B.6)
h
This equation has been proved to be correct for Fig. B.2,
where a is acute and 2 is obtuse. It also remains valid when both
strike angles are acute (Fig. B.3) or when they are both obtuse
(Fig. B.4).

112B
hr 2
Figure B.2
Figure B.3
D C
Figure B.4
0 2

113
REFERENCES
1. Campbell, D.S. (1974), "Analytical Method for Analysis ofStability of Rock Slopes," S.M. Thesis, M.I.T., 134 pp.
2. Deere, D.U., Hendron, A.J. Jr., Palon, F.D., and Cording, E.J.,"Design of Surface and Near-Surface Construction in Rock,"Symposium Rock Mech., 8th, Minnesota, 1966.
3. Glynn, E.F. (1978), "A Probabilistic Approach to the Stabilityof Rock Slopes," Ph.D. Thesis, M.I.T., 463 pp.
4. Hasofer, A.M., and Lind, N.C. (1974), "Exact and InvariantSecond Moment Code Format," Journal of the Engineering MechagicsDivision, ASCE, Vol. 100, No. EM1, Proc. Paper 10376, Feb., 1974,pp. 111-121.
5. Hendron, A.J., Cording, E.J., Aiyer, A.K. (1971), "Analyticaland Graphical Methods for the Analysis of Slopes in Rock Masses,"U.S. Army Engineering Nuclear Cratering Group Technical ReportNo. 36, 168 pp.
6. Hoek, E., and Bray, J. (1977), "Rock Slope Engineering,"Inst. Min. Metall., London, 30 9 pp,
7. Snow, D.T. (1968), "Fracture Deformation and Changes of Permea-bility and Storage Upon Changes of Fluid Pressure," Q. of theColorado School of Mines (63), pp. 201-244.
8. Snow, D.T. (1968), "Hydraulic Character of Fractured MetamorphicRocks of the Front Range and Implications to the Rocky MountainArsenal Well," Q. of the Colorado School of Mines (63), pp. 167-198.
9. Stagg, K.G., and Zienkiewicz, O.C., "Rock Mechanics in EngineeringPractice."
10. U.S. Corps of Engineers, "Strengthening of Rock Against ShockEffects, Piledriver Project," MRD Lab, No. 64/90, U.S. Army CorpsEngrs., Mo. River Div. Lab., Omaha, Nebraska, 1964.
11. Veneziano, D. (1978), "Probabilistic Model of Joints in Rock,"Unpublished Manuscript, Dept. of Civil Engineering, M.I.T.
12. Veneziano, D. (1979), "New Index of Reliability," Journal of theEngineering Mechanics Division, ASCE, Vol. 105, No. EM2, Proc. Pap.14515, April, 1979, pp. 277-296.
Copyright © 2022 FDOKUMEN