Rate of growth of wedge type intercrystalline creep micro ...
Upload
khangminh22Category
view
1download
0
applied sciences
Article
Medial Opening Wedge High Tibial Osteotomy inKnee OsteoarthritismdashA Biomechanical Approach
Nicolae Florin Cofaru 1 Mihai Dan Roman 2 Ileana Ioana Cofaru 3 Valentin Stefan Oleksik 4and Sorin Radu Fleaca 2
1 Department of Industrial Engineering and Management Faculty of Engineering ldquoLucian Blagardquo University550024 Sibiu Romania nicolaecofaruulbsibiuro
2 Department of Orthopedics and Traumatology Faculty of Medicine ldquoLucian Blagardquo University 550024 SibiuRomania mihairomanulbsibiuro (MDR) radufleacaulbsibiuro (SRF)
3 Department of Computer Science and Electrical Engineering Faculty of EngineeringldquoLucian Blagardquo University 550024 Sibiu Romania ioanacofaruulbsibiuro
4 Department of Industrial Machines and Equipment Faculty of Engineering ldquoLucian Blagardquo University550024 Sibiu Romania
Correspondence valentinoleksikulbsibiuro
Received 22 November 2020 Accepted 14 December 2020 Published 16 December 2020
Featured Application This research provides a ldquomini intraoperative guiderdquo for geometrical anddimensional planning of the medial wedge open high tibial osteotomy The values obtained inour study are useful for preventing or minimizing the microfractures that can occur in the centerof the rotation of the angulation (CORA) hinge area
Abstract This paper provides an analysis from a biomechanical perspective of the medial openingwedge high tibial osteotomy surgery a medical procedure commonly used in treating kneeosteoarthritis The aim of this research is to improve the analysed surgical strategy by establishingoptimal values for several very important parameters for the geometric planning of this type ofsurgical intervention The research methods used are numerical and experimental We used finiteelement a numerical method used to study the intraoperative behavior of the CORA area for differentpositions of the initiation point of the cut of the osteotomy plane and for different correction anglesWe also used an experimental method in order to determine the maximum force which causes theoccurrence of cracks or microcracks in the CORA area This helped us to determine the stressesthe maximum forces and the force-displacement variations in the hinge area elements that allowedus to identify the optimal geometric parameters for planning the surgery
Keywords medial opening wedge high tibial osteotomy correction angle osteotomy cutting pointfinite element method (FEM) analysis CORA point
1 Introduction
Knee osteoarthritis is a fairly common condition today and is characterized by the progressivewear of the articular cartilage and the degradation of the knee joint [1ndash4] The disease predominantlyaffects women and usually occurs in people aged over 40 [15ndash8]
The main factors involved in knee osteoarthritis aethiology are mechanical and inflammatoryMechanical factors generate an increase of focal pressure on cartilage while inflammatory conditionsdetermine a decrease of cartilage mechanical strength [19] Any of these conditions lead to an overstressand as a consequence to the rupture of the cartilage tissue Mechanical factors may be intraarticularsuch as fractures consolidated with chondral surface step-offs and meniscal lesions traumatic chondral
Appl Sci 2020 10 8972 doi103390app10248972 wwwmdpicomjournalapplsci
Appl Sci 2020 10 8972 2 of 20
lesions or extraarticular such as axial deviations of the limb in the frontal or the sagittal plane [10]Frequently the cartilage damage usually involving initially one knee compartment (medial or lateral)generates axial deviations of the limb generating a positive feed-back loop which leads to an increasein focal pressure on the already damaged articular cartilage [11]
One of the common situations that can occur in the above described scenarios is medial kneeostoarthrithis with varus knee An important biomechanical effect of this condition is the increase ofthe load in the knee joint Hence if on a healthy knee the maximum forces acting on the knee duringgait can reach up to three times the body weight there are studies [1213] showing that a deviationangle of only 10 degrees varus causes a stress on the medial compartment of up to 74 times bodyweight and a fourfold increase of the risk of ingravescence of the medial osteoarthritis
The medial opening wedge high tibial osteotomy (hereinafter ldquomedial opening wedge HTOrdquo)is one of the procedures used to treat this condition This is a surgical procedure used especially inthe case of young adults with unicompatimental knee osteoarthritis that restores or even overcorrectsthe mechanical limb axis immediately improving the knee function conferring a long time cartilageprotection and relieving the pain [1214ndash18]
The main purpose of this research is to optimize the operative technique for treating kneeosteoarthritis and for correcting the related axial deviations through medial opening wedge HTO
In order to highlight the geometrical parameters that are studied in our research Figure 1 showsthe geometric planning of the surgical intervention using one of the most frequently used methods inthis sense ie the Miniaci method [1920]
ApplSci 2020 10 x FOR PEER REVIEW 2 of 21
traumatic chondral lesions or extraarticular such as axial deviations of the limb in the frontal or the sagittal plane[10] Frequently the cartilage damage usually involving initially one knee compartment (medial or lateral) generates axial deviations of the limb generating a positive feed-back loop which leads to an increase in focal pressure on the already damaged articular cartilage [11]
One of the common situations that can occur in the above described scenarios is medial knee ostoarthrithis with varus knee An important biomechanical effect of this condition is the increase of the load in the knee joint Hence if on a healthy knee the maximum forces acting on the knee during gait can reach up to three times the body weight there are studies [1213] showing that a deviation angle of only 10 degrees varus causes a stress on the medial compartment of up to 74 times body weight and a fourfold increase of the risk of ingravescence of the medial osteoarthritis
The medial opening wedge high tibial osteotomy (hereinafter ldquomedial opening wedge HTOrdquo) is one of the procedures used to treat this condition This is a surgical procedure used especially in the case of young adults with unicompatimental knee osteoarthritis that restores or even overcorrects the mechanical limb axis immediately improving the knee function conferring a long time cartilage protection and relieving the pain [1214ndash18]
The main purpose of this research is to optimize the operative technique for treating knee osteoarthritis and for correcting the related axial deviations through medial opening wedge HTO
In order to highlight the geometrical parameters that are studied in our research Figure 1 shows the geometric planning of the surgical intervention using one of the most frequently used methods in this sense ie the Miniaci method [1920]
Figure 1 Medial open wedge high tibial osteotomy (HTO)mdashmechanical axis of the lower limb (a) main steps (b) and Fujisawa point (c)
Figure 1a shows the the mechanical axis of the lower limb in the case of a healthy knee As can be observed this axis passes through the center of the femoral head through the middle of the knee and through the center of the ankle joint
Figure 1 Medial open wedge high tibial osteotomy (HTO)mdashmechanical axis of the lower limb (a)main steps (b) and Fujisawa point (c)
Figure 1a shows the the mechanical axis of the lower limb in the case of a healthy knee As can beobserved this axis passes through the center of the femoral head through the middle of the knee andthrough the center of the ankle joint
Appl Sci 2020 10 8972 3 of 20
As shown in Figure 1b in the case of a patient with knee osteoarthritis this axis does not passthrough the middle of the knee but intersects the medial compartment overstressing it The purpose ofthe medial opening wedge HTO is that of correcting the axial deviation ie of bringing the mechaningaxis back to the correct position
The main steps for correcting the axial deviation using the Miniaci method [1920] are the following
bull Draw a line (orange) that passes through the center of the femoral head and through a pointknown in the scientific literature as the ldquoFUJISAWA pointrdquo (Figure 1b) [1921ndash23] As can beobserved from Figure 1bc the Fujisawa point is a point positioned at 625 on the medial to lateraltransverse knee line (hereinafter ldquothe FUJISAWA pointrdquo) The precise positioning of this point isstill a controversial topic among specialists It should normally be positioned halfway betweenthe medial compartment and the lateral part (Figure 1c) but due to the predisposition of theaffected patient to a continuous wear of the intra-articular cartilage an overcorrection is preferredin the sense that the point is positioned at 625 of the distance There is also the possibility thatthe surgeon chooses to set this point between 50 and 70 depending on the degree of cartilagewear [21]
bull Determine the position of the ldquohingerdquo point B relative to the tibial plateau and to the lateral cortexof the tibia (Figure 1b) This is the point around which the angulation is made ie the center ofthe rotation of the angulation (hereinafer ldquoCORArdquo) This point is important because one needs astable lateral hinge and a fracture line though the articular surface should be avoided There areno specifically defined values on this matter in the operative technique but rather ranges of valuesare taken into consideration 15ndash20 mm relative to the articular plane and 5ndash10 mm relative to thelateral cortex of the tibia [2024ndash26]
bull Afterwards the point of initiation of the cut for performing the osteotomy situated on themedial cortex is established (depicted as ldquopoint Ordquo in Figure 1b hereinafter ldquocutting pointrdquo)There are no studies suggesting the accurate positioning of the cutting point However given thelimitations generated by the surrounding anatomic structures the cutting point should be placedat a minimum of 30 mm and at a maximum of 50ndash60 mm from the articular line [2024ndash28]The osteotomy line is depicted as BO line in Figure 1b
bull Further on the opening correction angle α is determined (hereinafter ldquocorrection anglerdquo)(Figure 1b) For this a line is drawn from point B to point S the center of the ankle jointand then a circular arc is drawn with the center in point B of radius BS from point S to theintersection with the previously drawn orange line resulting in point Srsquo Angle α formed betweenline BS and line BSrsquo is the correction angle The line joining the center of the femoral head andpoint Srsquo is the new corrected mechanical axis To actually obtain the correction a wedge osteotomy(depicted as ldquoOBOrsquordquo in Figure 1b) is performed having at its tip the angle α which displaces themechanical axis to the desired position The 3D rotation of the proximal fragment of the tibiaaround the hinge is presented in Section 2
From the geometric parameters presented in the above we further focus our attention on thefollowing (depicted also in Figure 1b)
bull The correction anglebull The position of the cutting point relative to the corresponding tibial plateau
The behaviour of the bone at the CORA point can generate fracture lines to the articular surface ofthe lateral plateau and can also generate fracture lines to the lateral cortex of the proximal tibia [29]An important issue regarding this point is that it should allow the opening of the osteotomy but itshould not generate instability that would finally lead to a non-union of the osteotomy gap There arefew objective data in the literature that analyze the influence of the correction angle and of thepositioning of the cutting point on the mechanical behaviour of the bone around the CORA point
The working hypothesis in our research is that the positions of the cutting point and the correctionangle are influencing the mechanical properties of the lateral hinge The final aim of this study is to
Appl Sci 2020 10 8972 4 of 20
determine the optimal positioning of the cutting point relative to the correction angle α by analyzingthe mechanical behaviour of the lateral hinge
The objectives of the research are the following
bull To conduct a numerical research using the finite element method (hereinafter ldquoFEMrdquo) to studythe intraoperative behavior of the CORA area for different positions of the cutting point and fordifferent correction angles The FEM analysis may predict the mechanical stresses developed atthe lateral hinge and the risk of fracture
bull To conduct a similar experiment on mechanical loading behavior
Specifically this paper focuses on providing a ldquomini intraoperative guiderdquo for geometrical anddimensional planning of the medial wedge open HTO with the aid of which surgeons can choosethe best values for the studied geometrical parameters ie the position of the cutting point andthe correction angle so as to avoid or minimize the risk of microfractures that could occur in theCORA area
2 Materials and Methods
To achieve the previously mentioned objectives the main research methods appliedare 3D computer aided design (hereinafter ldquoCADrdquo) modelling computer aided engineering(hereinafter ldquoCAErdquo) simulations and analyses using the finite element method or theexperimental method
21 The Numerical Simulation of the Uniplane Opening Tibial Osteotomy
A first stage of the research is the numerical simulation by the finite element method and consistsof some static analyses of the CORA area The behavior of this area is very important because theoccurrence of micro-cracks or cracks in the CORA area can have consequences on both the smoothconduct of the surgery and on a good subsequent recovery
The software used to perform the analyses is AnsysThe purpose of the performed static analyses is to determine the state of stresses in the CORA area
for the uniplane opening osteotomies taking into account the studied parameteres namely X1mdashtheposition of the cutting point relative to the corresponding tibial plateau (Figure 2a) and X2mdashthe valueof the required correction angle (Figure 2b)
ApplSci 2020 10 x FOR PEER REVIEW 4 of 21
study is to determine the optimal positioning of the cutting point relative to the correction angle α by analyzing the mechanical behaviour of the lateral hinge
The objectives of the research are the following
bull To conduct a numerical research using the finite element method (hereinafter ldquoFEMrdquo) to study the intraoperative behavior of the CORA area for different positions of the cutting point and for different correction angles The FEM analysis may predict the mechanical stresses developed at the lateral hinge and the risk of fracture
bull To conduct a similar experiment on mechanical loading behavior
Specifically this paper focuses on providing a ldquomini intraoperative guiderdquo for geometrical and dimensional planning of the medial wedge open HTO with the aid of which surgeons can choose the best values for the studied geometrical parameters ie the position of the cutting point and the correction angle so as to avoid or minimize the risk of microfractures that could occur in the CORA area
2 Materials and Methods
To achieve the previously mentioned objectives the main research methods applied are 3D computer aided design (hereinafter ldquoCADrdquo) modelling computer aided engineering (hereinafter ldquoCAErdquo) simulations and analyses using the finite element method or the experimental method
21 The Numerical Simulation of the Uniplane Opening Tibial Osteotomy
A first stage of the research is the numerical simulation by the finite element method and consists of some static analyses of the CORA area The behavior of this area is very important because the occurrence of micro-cracks or cracks in the CORA area can have consequences on both the smooth conduct of the surgery and on a good subsequent recovery
The software used to perform the analyses is Ansys The purpose of the performed static analyses is to determine the state of stresses in the CORA
area for the uniplane opening osteotomies taking into account the studied parameteres namely X1mdashthe position of the cutting point relative to the corresponding tibial plateau (Figure 2a) and X2mdashthe value of the required correction angle (Figure 2b)
(a) (b)
Figure 2 Analyzed geometric parameters (a) position of the cutting point (b) the value of the correction angle
Figure 2 Analyzed geometric parameters (a) position of the cutting point (b) the value of thecorrection angle
Appl Sci 2020 10 8972 5 of 20
The characteristics of the materials necessary for performing these analyses resulted fromthe previously conducted bibliographic study [30ndash40] The values for the healthy mature boneas summarized in [41] are the following
bull Youngrsquos modulus (E)mdash12 to 19 GPa for the cortical bone 05 to 15 GPa for the spongy boneand 001 to 0015 GPa for the articular cartilage
bull Poissonrsquos ratiomdash03 to 035 for the cortical bone 016 to 02 for the spongy bone and 02 to 025 forthe cartilage
bull Transverse modulus of elasticity (G)mdash4 to 7 GPa for the cortical bonebull Fracture resistance (Rm)mdash115 to 125 MPa for the cortical bonebull Elongation (A)mdash14 to 28 for the cortical bonebull Porositymdash5 to 10 for the cortical bone 50 to 90 for the trabecular bonebull Densitymdash16 to 19 gcm3 for the cortical bone 02 to 1 gcm3 for the trabecular bone
Considering that the opening osteotomies are made in the epiphyseal tibial areamainly characterized by spongy bone the use of the following mechanical characteristics in the FEManalyses was agreed upon Youngrsquos modulusmdash1000 MPa Poissonrsquos ratiomdash018
In order to ensure the intraindividual variability of the simulations we note that in our calculationwe used the elastic modulus taking into account the dependency relation between the bonersquos densityand the elastic modulus It is already known that researchers use a high variety of dependency relationsbetween the bone density and the elastic modulus (linear laws exponential laws) Out of thesewe considered E = Cmiddotρβ where E is the elastic modulus C is a coefficient and β is an exponent whosevalue varies in accordance to the nature of the bone (cortical or trabecular) Namely the dependencyfunction used was E = 892middotρ183 [42] for a trabecular bone subjected to a compression load By doingso we could estimate what the maximum value of the loads in the bone component was by simplymodifying the value of the elastic modulus
The starting point for obtaining the geometrical models was a 3D model of a human tibiaa component of a professional model of a human inferior leg The model was acquired from theZYGOTE company a world leader in 3D anatomic modelling
Afterwards the modelling of the medial open wedge HTO surgery was achieved by using theCatia V5R20 software As we sought to obtain a CAD-CAE system with a high degree of generality andapplicability the models were achieved through a parametrized and generalized modelling In thissense the main variables that control from a geometric and a dimensional point of view the surgerywere defined as parameters in the 3D modelling By doing so a mere modification of the parametersrsquovalues allowed us to obtain the desired geometrical model
For creating this models we took into account the steps and the geometric elements that are usedin the actual surgery
The relevant elements were positioned on the tibial model (Figure 3a) CORA axis medial cortexand the cutting point We note that during the modelling the cutting point was constrained so as topermanently coincide with the medial cortex and so its position can be defined relative to the tibialplateau (30 40 50 mm in our study) Additionally we note that the line (depicted in blue in Figure 3a)that started from the cutting point and was perpendicular on the CORA axis defined together with theCORA axis the osteotomy plane
To achieve the correction it was necessary to rotate the proximal segment of the tibia around theCORA axis (Figure 3b) The correction angle was measured between the successive positions (beforeand after the rotation) of the blue line (depicted in Figure 3c) that started from the cutting point andwas perpendicular on the CORA axis (Figure 3c)
Appl Sci 2020 10 8972 6 of 20ApplSci 2020 10 x FOR PEER REVIEW 6 of 21
(a) (b) (c)
Figure 3 3D modelling of the medial open wedge HTO surgery (a) geometrical elements (b) 3D rotation (c) correction angle
To achieve the correction it was necessary to rotate the proximal segment of the tibia around the CORA axis (Figure 3b) The correction angle was measured between the successive positions (before and after the rotation) of the blue line (depicted in Figure 3c) that started from the cutting point and was perpendicular on the CORA axis (Figure 3c)
In this way we obtained the geometrical models that were necessary for the FEM analyses models that were later imported in the ANSYS software These are differentiated by parameters X1 and X2 to which the values listed in the table below were assigned (Table 1)
Table 1 Values assigned to the variables and their combinations
No X1 (mm) X2 (degree) 1 30 6 2 30 10 3 30 14 4 40 6 5 40 10 6 40 14 7 50 6 8 50 10 9 50 14
The values assigned to variable X1 were justified by the data collected from scientific literature [2024ndash28] which proves that as mentioned above this distance should not have been smaller than 30 mm nor should it have exceeded 50 to 60 mm Obviously the anatomical dimensions of the bone were also taken into consideration Consequently the values chosen for the FEM analyzes were 30 40 and 50 mm
The second variable X2 was the angle at the tip of the osteotomy wedge which was identical to the correction angle The variable was important because the higher the correction angle was the higher the probability of CORA area cracking was Possible correction angles resulting from literature [2024ndash28] and surgical practice ranged between 4ndash5 degrees to 16ndash18 degrees The boundaries were given by the fact that a value that was too low did not justify the surgery and a value that was too high made the surgery impossible
Figure 3 3D modelling of the medial open wedge HTO surgery (a) geometrical elements (b) 3Drotation (c) correction angle
In this way we obtained the geometrical models that were necessary for the FEM analyses modelsthat were later imported in the ANSYS software These are differentiated by parameters X1 and X2to which the values listed in the table below were assigned (Table 1)
Table 1 Values assigned to the variables and their combinations
No X1 (mm) X2 (degree)
1 30 62 30 103 30 144 40 65 40 106 40 147 50 68 50 109 50 14
The values assigned to variable X1 were justified by the data collected from scientificliterature [2024ndash28] which proves that as mentioned above this distance should not have beensmaller than 30 mm nor should it have exceeded 50 to 60 mm Obviously the anatomical dimensionsof the bone were also taken into consideration Consequently the values chosen for the FEM analyzeswere 30 40 and 50 mm
The second variable X2 was the angle at the tip of the osteotomy wedge which was identicalto the correction angle The variable was important because the higher the correction angle wasthe higher the probability of CORA area cracking was Possible correction angles resulting fromliterature [2024ndash28] and surgical practice ranged between 4ndash5 degrees to 16ndash18 degrees The boundarieswere given by the fact that a value that was too low did not justify the surgery and a value that wastoo high made the surgery impossible
Consequently the values considered appropriate for this research were 6 10 and 14 degreesAs shown in Table 1 all possible combinations between the values of the two variables were consideredthus resulting in nine geometric CAD models
With respect to the degree of precision of the analyses performed by using the finite elementmethod we note that the network of used elements (a network of tetrahedric elements) was generatedso the element size did not exceed 1 mm Hence the meshed model contained 861371 finite elements
Appl Sci 2020 10 8972 7 of 20
connected one to another through 1261857 nodes Moreover the check mesh quality function wasactivated and a 100 obsolete mesh percentage resulted By doing so and by performing a slowtype transition from the large size elements to those of a reduced size we made sure that the errorpercentage did not exceed 3 a unanimously accepted value in the scientific community
Figure 4a shows the model meshed for a cutting point located at 30 mm from the tibial plateauand a correction angle of 14 degrees The method of applying the necessary stresses and constraints onthe model (Figure 4b) considers the angular removal of the two sides of the osteotomy cut in order toachieve the osteotomy wedge at the desired correction angle In this regard a fixed constraint wasconsidered located on the side facing the joint while the other face was subjected to a uniformlydistributed stress
ApplSci 2020 10 x FOR PEER REVIEW 7 of 21
Consequently the values considered appropriate for this research were 6 10 and 14 degrees As shown in Table 1 all possible combinations between the values of the two variables were considered thus resulting in nine geometric CAD models
With respect to the degree of precision of the analyses performed by using the finite element method we note that the network of used elements (a network of tetrahedric elements) was generated so the element size did not exceed 1 mm Hence the meshed model contained 861371 finite elements connected one to another through 1261857 nodes Moreover the check mesh quality function was activated and a 100 obsolete mesh percentage resulted By doing so and by performing a slow type transition from the large size elements to those of a reduced size we made sure that the error percentage did not exceed 3 a unanimously accepted value in the scientific community
Figure 4a shows the model meshed for a cutting point located at 30 mm from the tibial plateau and a correction angle of 14 degrees The method of applying the necessary stresses and constraints on the model (Figure 4b) considers the angular removal of the two sides of the osteotomy cut in order to achieve the osteotomy wedge at the desired correction angle In this regard a fixed constraint was considered located on the side facing the joint while the other face was subjected to a uniformly distributed stress
(a) (b)
Figure 4 (a) Meshing the model and (b) application of stresses and constraints
The static structural analysis was made when the required correction angle was reached It should be noted that the pressure applied on the lower face of the osteotomy was obtained by relating the value of the applied force to the surface on which it was distributed
The value of this force depended on the size of the correction angle Literature [2443] and previous surgical experiences suggest considering the following values 75 N for the 6 degree angle 150 N for the 10 degree angle and 250 N for the 14 degree angle The values of the surfaces on which it acted resulted from using the facilities provided by the Ansys software
After running the numerical simulations the von Mises stresses and the maximum principal stresses were determined
22 Experimental Research on the Study of the Intraoperative Behavior of the Bone Structure in the Case of the Opening Tibial Osteotomies
This subchapter covers an experimental approach to the issues covered in the previous subchapter
The aim of the investigation is to study experimentally this time the CORA area by determining the maximum forcemdashFmax (N)mdashwhich causes the occurrence of cracks or microcracks as well as the variation of force F (N) in relation to the strain required for performing the osteotomy wedge
The input variables were the same as those taken into account in the previous numerical study namely X1mdashthe position of the cutting point relative to the corresponding tibial plateau (Figure 2a) and X2mdashthe value of the required correction angle (Figure 2b) The values of these variables and their
Figure 4 (a) Meshing the model and (b) application of stresses and constraints
The static structural analysis was made when the required correction angle was reached It shouldbe noted that the pressure applied on the lower face of the osteotomy was obtained by relating thevalue of the applied force to the surface on which it was distributed
The value of this force depended on the size of the correction angle Literature [2443] and previoussurgical experiences suggest considering the following values 75 N for the 6 degree angle 150 N forthe 10 degree angle and 250 N for the 14 degree angle The values of the surfaces on which it actedresulted from using the facilities provided by the Ansys software
After running the numerical simulations the von Mises stresses and the maximum principalstresses were determined
22 Experimental Research on the Study of the Intraoperative Behavior of the Bone Structure in the Case of theOpening Tibial Osteotomies
This subchapter covers an experimental approach to the issues covered in the previous subchapterThe aim of the investigation is to study experimentally this time the CORA area by determining
the maximum forcemdashFmax (N)mdashwhich causes the occurrence of cracks or microcracks as well as thevariation of force F (N) in relation to the strain required for performing the osteotomy wedge
The input variables were the same as those taken into account in the previous numerical studynamely X1mdashthe position of the cutting point relative to the corresponding tibial plateau (Figure 2a)and X2mdashthe value of the required correction angle (Figure 2b) The values of these variables andtheir combinations are also identical to those presented in Tables 1 and 2 thus resulting in ninedistinct experiments
The specimens on which the experimental tests were performed were properly prepared bovinetibias taken on the day the animals were slaughtered We opted for this type of bones becausethe bovine knee has many similarities with the human knee regarding bone structure (cortical andspongious bone) bone anatomy meniscus ligaments (both cruciate and collaterals) and extensormechanism As a result of this as far as mechanical loading is concerned the bovine bones behave
Appl Sci 2020 10 8972 8 of 20
similarly to the human bones The ovine and the swine knees which are also similar to the humanknee (considering the properties described) are smaller in dimensions and hence more susceptible togenerating experimental errors Two of the three tibias were collected from the same cow and the thirdcame from a cow originating from the same family
Table 2 The values of the stresses resulted from the finite element method (FEM) analyses
No X1 (mm) X2 (Degree) Von Mises Stress (MPa) Max Principal Stress (MPa)
1 30 6 67195 769052 30 10 11925 1367753 30 14 19661 225494 40 6 6523 746155 40 10 12067 1374656 40 14 19165 2238657 50 6 69085 781258 50 10 12773 1457559 50 14 19816 230905
Using appropriate surgical instruments the soft structures (muscles patellar tendon patellacollateral and cruciate ligaments (anterior and posterior) and menisci) were removed resulting in aclean proximal bovine tibia Both the cleaning of the tibias and the actual performance of the cuts forthe osteotomy were conducted by the orthopedic surgeons who co-authored this article in accordancewith the surgical protocols they use for real surgeries
Thus the position of the CORA point was established followed by its actual materializationby making an anterior and a posterior bore (Figure 5a)
ApplSci 2020 10 x FOR PEER REVIEW 8 of 21
combinations are also identical to those presented in Tables 1 and 2 thus resulting in nine distinct experiments
Table 2 The values of the stresses resulted from the finite element method (FEM) analyses
No X1 (mm) X2 (Degree) Von Mises Stress (MPa) Max Principal Stress (MPa) 1 30 6 67195 76905 2 30 10 11925 136775 3 30 14 19661 22549 4 40 6 6523 74615 5 40 10 12067 137465 6 40 14 19165 223865 7 50 6 69085 78125 8 50 10 12773 145755 9 50 14 19816 230905
The specimens on which the experimental tests were performed were properly prepared bovine tibias taken on the day the animals were slaughtered We opted for this type of bones because the bovine knee has many similarities with the human knee regarding bone structure (cortical and spongious bone) bone anatomy meniscus ligaments (both cruciate and collaterals) and extensor mechanism As a result of this as far as mechanical loading is concerned the bovine bones behave similarly to the human bones The ovine and the swine knees which are also similar to the human knee (considering the properties described) are smaller in dimensions and hence more susceptible to generating experimental errors Two of the three tibias were collected from the same cow and the third came from a cow originating from the same family
Using appropriate surgical instruments the soft structures (muscles patellar tendon patella collateral and cruciate ligaments (anterior and posterior) and menisci) were removed resulting in a clean proximal bovine tibia Both the cleaning of the tibias and the actual performance of the cuts for the osteotomy were conducted by the orthopedic surgeons who co-authored this article in accordance with the surgical protocols they use for real surgeries
Thus the position of the CORA point was established followed by its actual materialization by making an anterior and a posterior bore (Figure 5a)
(a) (b)
Figure 5 Execution of the hole in center of the rotation of the angulation (CORA) (a) and sectioning the osteotomy plane (b) Figure 5 Execution of the hole in center of the rotation of the angulation (CORA) (a) and sectioningthe osteotomy plane (b)
After marking the position of the cutting point two Kirschner pins were used which after beingproperly inserted into the bone structure served as a guide in sectioning the osteotomy plane (Figure 5b)
The tibial specimens were sectioned similarly at the established distances relative to the tibialplateau 30 mm 40 mm and 50 mm A graduated prismatic spacer was used to materialize the othervariable namely the correction angle
Regarding the order in which the information was collected this was established by taking intoaccount the preservation of the adjustments of the tibial part in relation to the loading device andat the same time by seeking to obtain as few assembliesndashdisassemblies of the tibial part as possible
Appl Sci 2020 10 8972 9 of 20
Therefore the nine experimental determinations (corresponding to all the combinations of thevalues of the variables) were made by successively fixing three tibias at distances of 30 40 and 50 mmto the tibial plateau with the correction angles of 6 10 and 14 degrees sequentially achieved for eachtibia by introducing the spacer in the tibia in a controlled manner
The experimental stand used was specially designed and executed modularly for the generalizedstudy of the HTO In this regard the functions that the stand must fulfill were taken into accountduring the design phase orientation and fixation of the tibia actual execution of the osteotomy wedgeat the desired correction angle control of the position of the contact surfaces and of the application offorces and adjustment of the position of the tibia
Since the design of the stand was described in detail in [41] only the important elements arepointed out here (Figure 6ab) Thus the orientation and the fastening of the tibia were achieved in adevice with self-centering clamping and its position was ensured by two U-shaped frames providingthe possibility to adjust the angle up to 120 in each direction For the performance of the osteotomywedge a graduated prismatic spacer was used which allowed us to permanently evaluate the achievedcorrection angle
ApplSci 2020 10 x FOR PEER REVIEW 9 of 21
After marking the position of the cutting point two Kirschner pins were used which after being properly inserted into the bone structure served as a guide in sectioning the osteotomy plane (Figure 5b)
The tibial specimens were sectioned similarly at the established distances relative to the tibial plateau 30 mm 40 mm and 50 mm A graduated prismatic spacer was used to materialize the other variable namely the correction angle
Regarding the order in which the information was collected this was established by taking into account the preservation of the adjustments of the tibial part in relation to the loading device and at the same time by seeking to obtain as few assembliesndashdisassemblies of the tibial part as possible
Therefore the nine experimental determinations (corresponding to all the combinations of the values of the variables) were made by successively fixing three tibias at distances of 30 40 and 50 mm to the tibial plateau with the correction angles of 6 10 and 14 degrees sequentially achieved for each tibia by introducing the spacer in the tibia in a controlled manner
The experimental stand used was specially designed and executed modularly for the generalized study of the HTO In this regard the functions that the stand must fulfill were taken into account during the design phase orientation and fixation of the tibia actual execution of the osteotomy wedge at the desired correction angle control of the position of the contact surfaces and of the application of forces and adjustment of the position of the tibia
Since the design of the stand was described in detail in [41] only the important elements are pointed out here (Figure 6ab) Thus the orientation and the fastening of the tibia were achieved in a device with self-centering clamping and its position was ensured by two U-shaped frames providing the possibility to adjust the angle up to 120deg in each direction For the performance of the osteotomy wedge a graduated prismatic spacer was used which allowed us to permanently evaluate the achieved correction angle
(a) (b)
Figure 6 Opening wedge HTO experimental stand designed and modelled (a) and executed and prepared for the experiment (b) Figure 6 Opening wedge HTO experimental stand designed and modelled (a) and executed andprepared for the experiment (b)
This specialized stand was mounted on the universal traction compression and buckling testingmachine Instron 5587 It has a maximum load capacity of 300 kN and is controlled by hardware andsoftware via the digital signal processor (DSP) interface and the Bluehill 20 specialized software
This universal testing tool facilitated the control of the speed of the mobile crosshead to anaccuracy of 05 and the recording of the force with a precision corresponding to class ASTM E-4or DIN 51221 Class 1 (standard that describes the procedures for the force verification for static orquasi-static for testing machine) The speed of the mobile crosshead ranged from 0001 to 500 mmminThe surface of the machinersquos fixed plate was 1403 times 851 mm
Appl Sci 2020 10 8972 10 of 20
The lower subassembly of the stand where the tibia was fastened was attached to the plate of themachine while the upper subassembly in which the spacer was mounted was attached to the mobilecrosshead which underwent the relative displacement and the effective load
Figure 7 shows a detailed image of the stand with the prismatic spacer 1 inserted into the tibia 2fixed in the self-centering device 3 The ldquoUrdquo type frame 4 ensured the correct orientation of the tibiarelative to the prismatic spacer
ApplSci 2020 10 x FOR PEER REVIEW 10 of 21
This specialized stand was mounted on the universal traction compression and buckling testing machine Instron 5587 It has a maximum load capacity of 300 kN and is controlled by hardware and software via the digital signal processor (DSP) interface and the Bluehill 20 specialized software
This universal testing tool facilitated the control of the speed of the mobile crosshead to an accuracy of 05 and the recording of the force with a precision corresponding to class ASTM E-4 or DIN 51221 Class 1 (standard that describes the procedures for the force verification for static or quasi-static for testing machine) The speed of the mobile crosshead ranged from 0001 to 500 mmmin The surface of the machinersquos fixed plate was 1403 times 851 mm
The lower subassembly of the stand where the tibia was fastened was attached to the plate of the machine while the upper subassembly in which the spacer was mounted was attached to the mobile crosshead which underwent the relative displacement and the effective load
Figure 7 shows a detailed image of the stand with the prismatic spacer 1 inserted into the tibia 2 fixed in the self-centering device 3 The ldquoUrdquo type frame 4 ensured the correct orientation of the tibia relative to the prismatic spacer
Figure 7 Experimental conduct of medial opening wedge HTO
In order to materialize the values established for variable X2mdashcorrection anglemdashthe mobile crosshead of the testing machine performed the necessary displacements in accordance with the gradations marked on the prismatic spacer These displacements were 5 mm for the 6 degree angle 9 mm for the 10 degree angle and 12 mm for the 14 degree angle
The experimental results are presented in the next chapter
3 Results
In this chapter we present the results of the performed simulations and of the experiments
31 The Results of the Numerical Simulation of the Uniplane Opening Tibial Osteotomy
The analysis of the results obtained from the numerical simulations relates to the maximal values and to the distribution of the von Mises stresses and of the main stresses obtained with the purpose of evaluating the two studied parameters (the position of the cutting point and the correction angle) in order to optimally plan from a geometrical and a dimensional point of view the surgery Figure 8ab shows the distributions of the von Mises stresses in the CORA area both on the inner and on the outer surface of the bone for the scenario in which the cutting point was situated at a 30 mm distance to the tibial plateau and there was a 14 degree correction angle
Figure 7 Experimental conduct of medial opening wedge HTO
In order to materialize the values established for variable X2mdashcorrection anglemdashthe mobilecrosshead of the testing machine performed the necessary displacements in accordance with thegradations marked on the prismatic spacer These displacements were 5 mm for the 6 degree angle9 mm for the 10 degree angle and 12 mm for the 14 degree angle
The experimental results are presented in the next chapter
3 Results
In this chapter we present the results of the performed simulations and of the experiments
31 The Results of the Numerical Simulation of the Uniplane Opening Tibial Osteotomy
The analysis of the results obtained from the numerical simulations relates to the maximal valuesand to the distribution of the von Mises stresses and of the main stresses obtained with the purpose ofevaluating the two studied parameters (the position of the cutting point and the correction angle) inorder to optimally plan from a geometrical and a dimensional point of view the surgery Figure 8abshows the distributions of the von Mises stresses in the CORA area both on the inner and on the outersurface of the bone for the scenario in which the cutting point was situated at a 30 mm distance to thetibial plateau and there was a 14 degree correction angle
When observing the results of the analysis one can notice a maximum equivalent stress on theouter wall of the tibia (Figure 8b) reaching 13774 MPa a reasonable value considering the large valueof the correction angle (14 degrees) Regarding the state of the equivalent von Mises stresses inside theCORA hole (Figure 8a) high values of the stresses were observed reaching a maximum of 1967 MPavalues that could lead to the appearance of microcracks The maximum principal stresses had highervalues with a maximum of 22559 MPa achieved inside the CORA area
Appl Sci 2020 10 8972 11 of 20ApplSci 2020 10 x FOR PEER REVIEW 11 of 21
(a) (b)
Figure 8 Equivalent von Mises stress in the CORA areamdashfor X1 = 30 mm X2 = 14 degrees the inner surface (a) and the outer surface (b)
When observing the results of the analysis one can notice a maximum equivalent stress on the outer wall of the tibia (Figure 8b) reaching 13774 MPa a reasonable value considering the large value of the correction angle (14 degrees) Regarding the state of the equivalent von Mises stresses inside the CORA hole (Figure 8a) high values of the stresses were observed reaching a maximum of 1967 MPa values that could lead to the appearance of microcracks The maximum principal stresses had higher values with a maximum of 22559 MPa achieved inside the CORA area
The FEM analyses were performed similarly for the other previously indicated eight combinations of values and the results are summarized in Table 2 where the maximum values are presented for both the equivalent von Mises stresses and for the maximum principal stresses
An increase in the values of these stresses could be noticed with the increase of the correction angle a trend that is normal Regarding the other variable we noticed that the lowest values were recorded for the 40 mm value of the variable X1
An important conclusion is that positioning the cutting point at 40 mm from the intra-articular plane generated the lowest stresses in the CORA area
Figure 9andashd shows the distribution of the von Mises stresses in the CORA area both on the inner and on the outter surface of the bone for the other two scenarios regarding the position of the cutting point (40 mm 50 mm distance to the tibial plateau) and for the same correction angle of 14 degrees
(a) (b)
Figure 8 Equivalent von Mises stress in the CORA areamdashfor X1 = 30 mm X2 = 14 degrees the innersurface (a) and the outer surface (b)
The FEM analyses were performed similarly for the other previously indicated eight combinationsof values and the results are summarized in Table 2 where the maximum values are presented forboth the equivalent von Mises stresses and for the maximum principal stresses
An increase in the values of these stresses could be noticed with the increase of the correctionangle a trend that is normal Regarding the other variable we noticed that the lowest values wererecorded for the 40 mm value of the variable X1
An important conclusion is that positioning the cutting point at 40 mm from the intra-articularplane generated the lowest stresses in the CORA area
Figure 9andashd shows the distribution of the von Mises stresses in the CORA area both on the innerand on the outter surface of the bone for the other two scenarios regarding the position of the cuttingpoint (40 mm 50 mm distance to the tibial plateau) and for the same correction angle of 14 degrees
ApplSci 2020 10 x FOR PEER REVIEW 11 of 21
(a) (b)
Figure 8 Equivalent von Mises stress in the CORA areamdashfor X1 = 30 mm X2 = 14 degrees the inner surface (a) and the outer surface (b)
When observing the results of the analysis one can notice a maximum equivalent stress on the outer wall of the tibia (Figure 8b) reaching 13774 MPa a reasonable value considering the large value of the correction angle (14 degrees) Regarding the state of the equivalent von Mises stresses inside the CORA hole (Figure 8a) high values of the stresses were observed reaching a maximum of 1967 MPa values that could lead to the appearance of microcracks The maximum principal stresses had higher values with a maximum of 22559 MPa achieved inside the CORA area
The FEM analyses were performed similarly for the other previously indicated eight combinations of values and the results are summarized in Table 2 where the maximum values are presented for both the equivalent von Mises stresses and for the maximum principal stresses
An increase in the values of these stresses could be noticed with the increase of the correction angle a trend that is normal Regarding the other variable we noticed that the lowest values were recorded for the 40 mm value of the variable X1
An important conclusion is that positioning the cutting point at 40 mm from the intra-articular plane generated the lowest stresses in the CORA area
Figure 9andashd shows the distribution of the von Mises stresses in the CORA area both on the inner and on the outter surface of the bone for the other two scenarios regarding the position of the cutting point (40 mm 50 mm distance to the tibial plateau) and for the same correction angle of 14 degrees
(a) (b)
ApplSci 2020 10 x FOR PEER REVIEW 12 of 21
(c) (d)
Figure 9 Equivalent von Mises stress in the CORA areamdashfor X1 = 40 mm X2 = 14 degrees the inner surface (a) and the outer surface (b) and for X1 = 50 mm X2 = 14 degrees the inner surface (c) and the outer surface (d)
Another important evaluation made was the comparative analysis of the von Mises stresses on the inner and the outer surfaces of the CORA area for all the three positions of the cutting point (30 mm 40 mm 50 mm) in the case of the highest correction angle namely 14 degrees
As can be observed in Figure 9 the maximum value of the von Mises stress on the outer wall of the tibia is 12752 Mpa for the value X1 = 40 mm and 13651 Mpa for the value X1 = 50 mm By determining what the difference was between the maximal values of the von Mises stresses inside the CORA area (Table 2) and the stresses from the outer wall of the tibia in the same area we could also observe the manner in which the stresses propagated in the CORA area In this sense for the combination X1 = 40 mm X2 = 14 degrees we had the smallest value of the stress on the outer wallmdash 12752 Mpamdashbut also the biggest difference between the stresses on the inner and on the outter surfaces (6413 MPA) from which resulted a smaller speed of propagation of the microfractures
For the other two combinations the obtained values were somewhat similar in the sense that the main tension on the outer wall was 13774 Mpa for X1 = 30 mm X2 = 14 degrees and 13651 Mpa for X1 = 50 mm X2 = 14 degrees and with respect to the differences between the stresses these were 5887 Mpa in the first scenario and 6165 in the second scenario
It is therefore recommended to set the initiation cutting point at a 40 mm distance to the tibial plateau Regarding the other two positions the 50 mm is slightly better than the 30 mm one
32 Experimental Results Regarding the Study of the Intraoperative Behavior of the Bone Structure in the Case of Opening Tibial Osteotomies
A first output variable studied experimentally during the test was as previously mentioned the maximum force Fmax measured during the performing of the osteotomy wedge at the required correction angle
The experimental data were collected in the order in which the testsmdashthe order determined when the experimental program was plannedmdashwere conducted The data are listed in a table and illustrated in self explanatory diagrams Table 3 shows the values of the maximum forces for the nine combinations of the values of the two variables
Table 3 Measured values of the maximum force Fmax
No X1 (mm) X2 (Degrees) Fmax (N) 1 30 6 419774 2 30 10 624373 3 30 14 660231 4 40 6 241172 5 40 10 602558 6 40 14 782012
Figure 9 Equivalent von Mises stress in the CORA areamdashfor X1 = 40 mm X2 = 14 degrees the innersurface (a) and the outer surface (b) and for X1 = 50 mm X2 = 14 degrees the inner surface (c) and theouter surface (d)
Appl Sci 2020 10 8972 12 of 20
Another important evaluation made was the comparative analysis of the von Mises stresses on theinner and the outer surfaces of the CORA area for all the three positions of the cutting point (30 mm40 mm 50 mm) in the case of the highest correction angle namely 14 degrees
As can be observed in Figure 9 the maximum value of the von Mises stress on the outer wallof the tibia is 12752 Mpa for the value X1 = 40 mm and 13651 Mpa for the value X1 = 50 mmBy determining what the difference was between the maximal values of the von Mises stresses insidethe CORA area (Table 2) and the stresses from the outer wall of the tibia in the same area we couldalso observe the manner in which the stresses propagated in the CORA area In this sense for thecombination X1 = 40 mm X2 = 14 degrees we had the smallest value of the stress on the outer wallmdash12752 Mpamdashbut also the biggest difference between the stresses on the inner and on the outter surfaces(6413 MPA) from which resulted a smaller speed of propagation of the microfractures
For the other two combinations the obtained values were somewhat similar in the sense that themain tension on the outer wall was 13774 Mpa for X1 = 30 mm X2 = 14 degrees and 13651 Mpa forX1 = 50 mm X2 = 14 degrees and with respect to the differences between the stresses these were5887 Mpa in the first scenario and 6165 in the second scenario
It is therefore recommended to set the initiation cutting point at a 40 mm distance to the tibialplateau Regarding the other two positions the 50 mm is slightly better than the 30 mm one
32 Experimental Results Regarding the Study of the Intraoperative Behavior of the Bone Structure in the Caseof Opening Tibial Osteotomies
A first output variable studied experimentally during the test was as previously mentionedthe maximum force Fmax measured during the performing of the osteotomy wedge at the requiredcorrection angle
The experimental data were collected in the order in which the testsmdashthe order determinedwhen the experimental program was plannedmdashwere conducted The data are listed in a table andillustrated in self explanatory diagrams Table 3 shows the values of the maximum forces for the ninecombinations of the values of the two variables
Table 3 Measured values of the maximum force Fmax
No X1 (mm) X2 (Degrees) Fmax (N)
1 30 6 4197742 30 10 6243733 30 14 6602314 40 6 2411725 40 10 6025586 40 14 7820127 50 6 3672278 50 10 5556789 50 14 577410
By analyzing the above values we observed that the absolute maximum of the maximum forcesat which the system yields was the case of the variable combination X1 = 40 mm and X2 = 14 degreesThe value of this force was 782012 N The minimum value of the maximum force was recorded for thecombination X1 = 40 mm and X2 = 6 degrees
In order to highlight the variation of the maximum force in relation to each influencing factorthe diagrams shown in Figures 10 and 11 were created
By analyzing the variation of the maximum force in relation to the correction angle (Figure 10)it could be observed that at the 40 mm value of the initiation point of the cutting plane the systemwithstood the highest force in the case of the 14 degree correction angle while it recorded the lowestmaximum force in the case of the 6 degree angle At the average value of the anglemdash10 degreesmdashthemaximum force increased towards the average of the two extremes The other two curves corresponding
Appl Sci 2020 10 8972 13 of 20
to the values of 30 mm and 50 mm of the cutting point were approximately parallel with the maximumforce recording higher values in the case of the 30 mm valueApplSci 2020 10 x FOR PEER REVIEW 13 of 21
Figure 10 Variation of the maximum force in relation to the correction angle
Figure 11 Variation of the maximum force in relation to the position of the cutting point
By analyzing the variation of the maximum force in relation to the correction angle (Figure 10)
it could be observed that at the 40 mm value of the initiation point of the cutting plane the system
withstood the highest force in the case of the 14 degree correction angle while it recorded the lowest
maximum force in the case of the 6 degree angle At the average value of the anglemdash10 degreesmdashthe
maximum force increased towards the average of the two extremes The other two curves
corresponding to the values of 30 mm and 50 mm of the cutting point were approximately parallel
with the maximum force recording higher values in the case of the 30 mm value
The variation in Figure 11 is somewhat natural considering that the achievement of a higher
correction angle requires a greater loading force We also noticed the close values of the maximum
forces in the cases of the 10 degree and the 14 degree correction angles at the 30 and the 50 mm values
Figure 10 Variation of the maximum force in relation to the correction angle
ApplSci 2020 10 x FOR PEER REVIEW 13 of 21
Figure 10 Variation of the maximum force in relation to the correction angle
Figure 11 Variation of the maximum force in relation to the position of the cutting point
By analyzing the variation of the maximum force in relation to the correction angle (Figure 10)
it could be observed that at the 40 mm value of the initiation point of the cutting plane the system
withstood the highest force in the case of the 14 degree correction angle while it recorded the lowest
maximum force in the case of the 6 degree angle At the average value of the anglemdash10 degreesmdashthe
maximum force increased towards the average of the two extremes The other two curves
corresponding to the values of 30 mm and 50 mm of the cutting point were approximately parallel
with the maximum force recording higher values in the case of the 30 mm value
The variation in Figure 11 is somewhat natural considering that the achievement of a higher
correction angle requires a greater loading force We also noticed the close values of the maximum
forces in the cases of the 10 degree and the 14 degree correction angles at the 30 and the 50 mm values
Figure 11 Variation of the maximum force in relation to the position of the cutting point
The variation in Figure 11 is somewhat natural considering that the achievement of a highercorrection angle requires a greater loading force We also noticed the close values of the maximumforces in the cases of the 10 degree and the 14 degree correction angles at the 30 and the 50 mm valuesof the variable respectively Obviously in order to achieve a correction angle of 6 degrees the valuesof the maximum forces would be considerably lower
Appl Sci 2020 10 8972 14 of 20
Another important assessment made during the experiment was the continuous variation offorce F related to the displacement (Figure 12) It is interesting to observe the position in which theCORA hinge yields meaning when the first cracks or microcracks appear which is an identifiableposition when the load suddenly decreases At a first analysis of the three graphs it can be seen thatthe cracking of the CORA area occurred around displacements of about 10 mm when the cutting pointwas positioned at 30 and 50 mm and at about 15 mm when it was positioned at 40 mmApplSci 2020 10 x FOR PEER REVIEW 15 of 21
Figure 12 Variation of force relative to the displacement
In the case of the specimen of tibia where the cutting point was positioned at 30 mm from the tibial plateau the force reached a maximum of 660231 N at a displacement of 989 mm It should be noted that in this case the system yielded before a correction angle of 14 degrees was achieved the maximum achievable value being about 11 to 12 degrees which was still a considerable correction Proceeding with stressing the tibia up to a displacement of 50 mm a displacement imposed in all cases there was a sudden decrease of the force to a value of about 180 N after which the force increased again reaching an absolute maximum of 947534 N at a displacement of 461826 mm During this period the cracks continued to accumulate until the maximum value was reached
Figure 12 Variation of force relative to the displacement
Appl Sci 2020 10 8972 15 of 20
In the case of the specimen of tibia where the cutting point was positioned at 30 mm from thetibial plateau the force reached a maximum of 660231 N at a displacement of 989 mm It shouldbe noted that in this case the system yielded before a correction angle of 14 degrees was achievedthe maximum achievable value being about 11 to 12 degrees which was still a considerable correctionProceeding with stressing the tibia up to a displacement of 50 mm a displacement imposed in all casesthere was a sudden decrease of the force to a value of about 180 N after which the force increasedagain reaching an absolute maximum of 947534 N at a displacement of 461826 mm During thisperiod the cracks continued to accumulate until the maximum value was reached
When the cutting point was positioned at 40 mm from the tibial plateau the values of the forceslightly oscillated at a displacement of 3 to 4 mm The increase was noticeable and continuous reachinga maximum of 782012 N corresponding to a displacement of 12 mm and implicitly to a correctionangle of 14 degrees It is noteworthy that this was the only situation in which the system did not yielduntil a correction angle of 14 degrees was achieved and the graph shows that even larger correctionswould be possible reaching values of about 16 to 18 degrees At further stressing up to a displacementof 50 mm there was a sudden decrease of the force to a value of about 380 N after which the forceincreased smoothly reaching an absolute maximum of 935678 N
Finally for the last presented variation the one in which the cutting point was positioned at50 mm from the tibial plateau the curve was very similar to the one corresponding to the scenario inwhich the cutting point was positioned at 30 mm in both recorded values and the shape of the variationAn increase in force was observed with a maximum of 57741 N at a displacement of 1008 mm At thispoint the system yielded with a sharp decline of the force valued to 110ndash120 N The value remainedconstant for another 15 mm of displacement after which it increased at 43 mm followed by anothersudden decrease of about 100 N The system did not resist until a correction angle of 14 degrees wasreached the maximum achievable value being again 11 to 12 degrees The further application ofstress until achieving a displacement of 50 mm resulted in an absolute maximum of 796470 N reachedat a 49946 mm displacement
4 Discussion
This research contributes to the optimization of the geometric planning of the medial open wedgeHTO and of other types of surgery This is illustrated by the results obtained for the two studiedvariablesmdashX1 the position of the cutting point and X2 the required angle of correctionmdashby using thetwo presented research methods the numerical and the experimental one
Among the studied parameters the value of X2 resulted from the actual axial deviation whereas thevalue of X1 could be appropriately chosen by the surgeon
We want to note that our research focuses on analyzing the intraoperative behavior of theCORA area and more specifically on determining the best combination of parameters (α angle andpositioning of the cutting point) for ensuring the success of the surgery and for limiting the appearanceof microcracks in the CORA area
With respect to the FEM study the sought finality was that of determining the combination ofparameters for which there are the lowest stresses in the CORA area
The values of the von Mises stresses for all the afore mentioned combinations are presented inFigure 13andashc
It can be observed that for small correction angles eg 6 degrees there were only minordifferences between the values of the von Mises stresses The lowest value of the von Mises stress wasrecorded for the scenario in which the cutting point was positioned at 40 mm The value registered forthe 30 mm scenario was also a convenient one as the difference in stresses in the two scenarios (40 mmand 30 mm respectively) was only 1965 MPa
For the 10 degree correction angle the values of the von Mises stresses increased as the valueat which the cutting point was positioned increased Hence the lowest stress was recorded for the
Appl Sci 2020 10 8972 16 of 20
30 mm position whereas the highest stress was recorded for the 50 mm position This made the50 mm position the least recommended oneApplSci 2020 10 x FOR PEER REVIEW 17 of 21
(a) (b)
(c)
Figure 13 Variation of von Mises stresses in relation to the position of the cutting point
It can be observed that for small correction angles eg 6 degrees there were only minor differences between the values of the von Mises stresses The lowest value of the von Mises stress was recorded for the scenario in which the cutting point was positioned at 40 mm The value registered for the 30 mm scenario was also a convenient one as the difference in stresses in the two scenarios (40 mm and 30 mm respectively) was only 1965 MPa
For the 10 degree correction angle the values of the von Mises stresses increased as the value at which the cutting point was positioned increased Hence the lowest stress was recorded for the 30 mm position whereas the highest stress was recorded for the 50 mm position This made the 50 mm position the least recommended one
For higher correction angles as was the case for the 14 degree correction angle it was obvious that it was more favorable to position the cutting point at 40 mm as higher stress values were recorded in the other two scenarios
In the experimental study the correction angulation was achieved for the three positions of the cutting point (30 mm 40 mm 50 mm) For this approach the optimal value of the combination of parameters was dependent on the highest obtained value of the maximum force ie the force for which the first microcracks appearred in the CORA area
Even if for the experimental research bovine bones specimens were used we consider our approach adequate as it is known that the juvenile bovine bones are frequently used in biomechanical studies because their behavior is highly similar to human bones In this sense in article [44] it is confirmed that the long juvenile bovine bones are good study models for the long human bones both from a geometrical and a dimensional point of view and also with respect to their mechanical characteristics For example in accordance to the mentioned study bone density of the juvenile bovine tibias has values (in the cortical area) of 183ndash196 gcm minus3 a range that falls inside the density range of the human tibia as well as the same screw insertion torque and pullout strength In another article [45] it has been noted that it is appropriate to use bovine bones in biomechanical experiments the authors highlighting in this sense the ratios between the longitudinal strength of the bovine bone and that of the human bone (15ndash1) respectively between the fracture toughness of the
Figure 13 Variation of von Mises stresses in relation to the position of the cutting point (a) 6 degree(b) 10 degree (c) 14 degree
For higher correction angles as was the case for the 14 degree correction angle it was obviousthat it was more favorable to position the cutting point at 40 mm as higher stress values were recordedin the other two scenarios
In the experimental study the correction angulation was achieved for the three positions of thecutting point (30 mm 40 mm 50 mm) For this approach the optimal value of the combination ofparameters was dependent on the highest obtained value of the maximum force ie the force forwhich the first microcracks appearred in the CORA area
Even if for the experimental research bovine bones specimens were used we consider ourapproach adequate as it is known that the juvenile bovine bones are frequently used in biomechanicalstudies because their behavior is highly similar to human bones In this sense in article [44] it isconfirmed that the long juvenile bovine bones are good study models for the long human bonesboth from a geometrical and a dimensional point of view and also with respect to their mechanicalcharacteristics For example in accordance to the mentioned study bone density of the juvenile bovinetibias has values (in the cortical area) of 183ndash196 gcm minus3 a range that falls inside the density range ofthe human tibia as well as the same screw insertion torque and pullout strength In another article [45]it has been noted that it is appropriate to use bovine bones in biomechanical experiments the authorshighlighting in this sense the ratios between the longitudinal strength of the bovine bone and that ofthe human bone (15ndash1) respectively between the fracture toughness of the bovine bone and that of thehuman bone (108 to 166) Taking into account the fact that the appearance of cracks was the criterionused to determine the optimal combination of parameters we consider that the obtained results have ahigh degree of applicability for the purposes of our study
Further on we note that bovine bones have also been used for experiments performed inbiomechanical studies relating to human bones in papers [46ndash50]
Appl Sci 2020 10 8972 17 of 20
Reverting to our analysys as resulted from Figure 11 for the 6 degree angle the highest value ofthe maximum force was obtained in the scenario in which the cutting point was positioned at 30 mmfollowed by the force obtained in the scenario in which the cutting point was positioned at 50 mmwhereas the least favorable value was that of 40 mm
For the 10 degree angle it was for the best to position the cutting point at 30 mm followed by the40 mm position and finally the 50 mm position
With respect to the 14 degree angle it was clearly observed that by far the most favorablesolution was that of positioning the cutting point at 40 mm followed by the 30 mm and finallythe 50 mm scenarios
From the two used methods the following joint conclusions result
- For the 14 degree angle (for high correction values) it was clearly favorable to position the cuttingpoint at 40 mm
- For the 10 degree angle (for medium correction values) it was favorable to position the cuttingpoint at 30 mm
- Positioning the cutting point at 50 mm appearred as the least favorable solution for almost all ofthe used combinations of parameters
We note that for the 6 degree angle (for low correction angles) there was a small differencebetween the two sets of results that we obtained in the sense that FEM recommends positioning thecutting point at 40 mm as favorable whereas the experimental method recommends positioningit at 30 mm Considering that the difference in values was small in the case of FEM (the stresseshaving similar values) and large in the case of the experimental method (the value of the force beingconsiderably higher in the 30 mm scenario) we consider that it is more favorable to position the cuttingpoint at 30 mm
We consider that the entire studied issue and the obtained results create good premises for thedevelopment of future research An important direction in this sense relates to continuing the study ofthe intraoperative behavior of the CORA area by taking into account other elements significant for thesuccess of the surgery such as the importance of executing the relief hole in the CORA hinge area andstudying it from a dimensional point of view as well as pursuing and adding to the concerns that existin this field in literature [2851ndash57]
5 Conclusions
The main findings of this study consist in providing concrete information regarding the geometricaland the dimensional planning of the medial wedge open HTO In order to obtain such informationnumerical simulations and an experimental study were performed The results of this study suggestthat for small correction angles the optimal position of the cutting point is at 30 mm while for correctionangles of 14 degrees or more the optimal position of the cutting point is at 40 mm The obtainedvalues can be applied by interpolation for other values as well eg in the 6ndash14 degrees range of thecorrection angle
No animal or human studies were carried out by the authors for this article
Author Contributions Conceptualization NFC MDR IIC VSO and SRF methodology NFC IICand VSO software NFC IIC and VSO validation NFC MDR IIC VSO and SRF formal analysisNFC investigation NFC MDR VSO and SRF resources NFC MDR IIC VSO and SRFdata curation NFC IIC and VSO writingmdashoriginal draft preparation NFC IIC and VSO writingmdashreviewand editing NFC MDR IIC VSO and SRF visualization NFC and VSO supervision NFC VSOand SRF project administration NFC All authors have read and agreed to the published version of themanuscript Authorship must be limited to those who have contributed substantially to the work reported
Funding This research received no external funding
Acknowledgments Project financed from Lucian Blaga University of Sibiu The Research centre for sustainableproducts and processes and Hasso Plattner Foundation research action LBUS-RRC-2020-01
Conflicts of Interest The authors declare no conflict of interest
Appl Sci 2020 10 8972 18 of 20
References
1 Fleaca RS Transplantul Osteocondral Autolog icircnTratamentul Leziunilor Cartilajului Articular PhD ThesisLucian Blaga University of Sibiu Sibiu Romania December 2009
2 Eckstein F Adam C Sittek H Becker C Milz S Schulte E Reiser M Putz R Non-invasivedetermination of cartilage thickness throughout joint surfaces using magnetic resonance imaging J Biomech1997 30 285ndash289 [CrossRef]
3 Eckstein F Winzheimer M Westhoff J Schnier M Haubner M Englmeier KH Reiser M Putz RQuantitative relationships of normal cartilage volumes of the human knee jointmdashAssessment by magneticresonance imaging Anat Embryol 1998 197 383ndash390 [CrossRef]
4 Potter HG Foo LF Magnetic Resonance Imaging of Articular Cartilage Trauma Degeneration and RepairAm J Sports Med 2006 34 661ndash677 [CrossRef] [PubMed]
5 Helminen HJ Kiviranta I Saumlaumlmaumlnen AM Jurvelin J Arokoski J Oettmeier R Abendroth KRoth AJ Tammi M Effect of motion and load on articular cartilage in animal models In Articular Cartilageand Osteoarthritis Keuttner KE Schleyerbach R Peyron JG Eds Raven Press New York NY USA 1992pp 501ndash510
6 Abramson SB The role of COX-2 produced by cartilage in arthritis Osteoarthr Cartil 1999 7 380ndash381[CrossRef]
7 Antonescu DM Pop DM Elemente de Patologie Osteoarticulara Teora Publisher Bucharest Romania 2000pp 7ndash9
8 Brockmeier P Effects of Articular Cartilage Defect Size and Shape on Subchondral Bone Contact Implicationsfor Surgical Cartilage Restoration PhD Thesis The Ohio State University Athens OH USA June 2008
9 Derek T Cooke V Allan Scudamore RA Bryant T Mechanical Factors in the Pathogenesis of OsteoarthritisIn Trends in Research and Treatment of Joint Diseases Springer Science and Business Media LLC Tokyo Japan1992 pp 29ndash34
10 Guilak F Biomechanical factors in osteoarthritis Best Pr Res Clin Rheumatol 2011 25 815ndash823 [CrossRef]11 Mansur H Rocha FA Texeira de Dousa Filho PG De Castro Junior IM Relationship between the knee
and hindfoot axes in patients with severe knee osteoarthritis Acta Ortop Bras 2020 28 229ndash232 [CrossRef]12 Amis AA Biomechanics of high tibial osteotomy Knee Surg Sports Traumatol Arthrosc 2013 21 197ndash205
[CrossRef]13 Floerkemeier S Staubli AE Schroeter S Goldhahn S Lobenhoffer P Outcome after high tibial
open-wedge osteotomy A retrospective evaluation of 533 patients Knee Surg Sports Traumatol Arthrosc2013 21 170ndash180 [CrossRef]
14 Ryohei T Hiroyuki I Masato A Haruhiko B Izumi S Ken K Medial opening wedge high tibialosteotomy with early full weight bearing J Arthrosc Relat Surg 2009 25 46ndash53 [CrossRef]
15 Spahn G Complications in high tibial (medial opening wedge) osteotomy Arch Orthop Trauma Surg 2003124 649ndash653 [CrossRef]
16 Sprenger TR Doerzbacher JF Tibial osteotomy for the treatment of varus gonarthrosis Survival andfailure analysis to twenty-two years J Bone Jt Surg Am 2003 85 469ndash474 [CrossRef]
17 Amendola A Bonasia DE Results of high tibial osteotomy Review of the literature Int Orthop 2010 34155ndash160 [CrossRef]
18 Song EK Seon JK Park SJ Jeong MS The complications of high tibial osteotomy Closing- versusopening-wedge methods J Bone Jt Surg Br 2010 92 1245ndash1252 [CrossRef]
19 Tomofix Medial High Tibial Plate for Medial Tibial Osteotomy Available online httpsynthesvollnwdneto16LLNWMB8INT20MobileSynthes20InternationalProduct20Support20Materiallegacy_Synthes_PDFDSEM-TRM-0115-0288-1_LRpdf (accessed on 15 August 2020)
20 Elson DW Petheram TG Dawson MJ High reliability in digital planning of medial opening wedgehigh tibial osteotomy using Miniacirsquos method Knee Surg Sports Traumatol Arthrosc 2015 23 2041ndash2048[CrossRef]
21 Modern High Tibial Osteotimy Available online httpwwwilizarovorgHTO1pdf (accessed on 15August 2020)
22 Yin Y Li S Zhang R Guo J Hou Z Zhang Y What is the relationship between the ldquoFujisawa pointrdquoandpostoperative knee valgus angle A theoretical computer-based study Knee 2020 27 183ndash191 [CrossRef]
Appl Sci 2020 10 8972 19 of 20
23 Somtua C Aroonjarattham P Aroonjarattham K The correction of Thai varus knee by high tibial osteotomywith Fujisawarsquos point using finite element analysis J Res Appl Mech Eng 2019 7 45ndash59
24 Yang JC Chen CF Luo CA Chang MC Lee OK Huang Y Lin SC Clinical Experience Using a3D-Printed Patient-Specific Instrument for Medial Opening Wedge High Tibial Osteotomy BioMed Res Int2018 2018 1ndash9 [CrossRef]
25 Rudzki JR Medial Opening Wedge High Tibial Osteotomy Arthrex Knee Meeting Los Angeles CA USA12 May 2012 Published on 23 January 2015 Available online httpswwwslidesharenetwashingtonortho
arthrex-hto-talk-51212 (accessed on 20 November 2020)26 Kader D High Tibial Osteotomy and UniKnee Health amp Medicine 2015 Available online httpswww
slidesharenetProfDeiaryFKaderhigh-tibial-osteotomy-and-uniknee-for-post-grad-orth-frcs-course(accessed on 20 November 2020)
27 Lee YS Moon GH Comparative analysis of osteotomy accuracy between the conventional and devisedtechnique using a protective cutting system in medial open-wedge high tibial osteotomy J Orthop Sci 201520 129ndash136 [CrossRef]
28 Kwun JD Kim HJ Park J Park IH Kyung HS Open wedge high tibial osteotomy usingthree-dimensional printed models Experimental analysis using porcine bone Knee 2017 24 16ndash22[CrossRef]
29 Ogawa H Matsumoto K Akiyama H The prevention of a lateral hinge fracture as a complication of amedial opening wedge high tibial osteotomy-a case control study Bone Jt J 2017 99 [CrossRef]
30 Ionescu I Conway T Schonning A Almutairi M Nicholson DW Solid Modeling and Static FiniteElement Analysis of the Human Tibia In Proceedings of the Summer Bioengineering Conference 2003Sonesta Beach Resort Key Biscayne FL USA 25ndash29 June 2003
31 Isaksson HE Mechanical and Mechanobiological Influences on Bone Fracture Repair Identifying ImportantCellular Characteristics PhD Thesis Eindhoven University of Technology Eindhoven The NetherlandsNovember 2007 [CrossRef]
32 Cilingira AC Ucara V Kazana R Three-Dimensional Anatomic Finite Element Modelling ofHemi-Arthroplasty of Human Hip Joint Trends Biomater Artif Organs 2007 21 63ndash72
33 Petersen W Zantop T Anatomy of the anterior cruciate ligament with regard to its two bundlesClin Orthop Relat 2007 454 35ndash47 [CrossRef] [PubMed]
34 Muumlller-Karger C Larrazabal CA Finite Element Bone Model Incorporating Heterogeneity and Anisotropyfrom CT In Proceedings of the ISB XXth Congress of the International Society of Biomechanis and ASB 29thAnnual Meeting of the American Society of Biomechanics Cleveland OH USA 31 Julyndash5 August 2004
35 Galik K The Effect of Design Variations on Stresses in Total Ankle Arthroplasty PhD Thesis University ofPittsburgh Pittsburgh PA USA April 2002
36 Bayraktara HH Morgana EF Nieburb GL Morrisa GE Wonga EK Keaveny TM Comparison ofthe elastic and yield properties of human femoral trabecular and cortical bone tissue J Biomech 2004 3727ndash35 [CrossRef]
37 Kelly DJ Predengast PJ Prediction of the Optimal Mechanical Properties for a Scaffold Used inOsteochondral Defect Repair Tissue Eng 2006 12 2509ndash2519 [CrossRef] [PubMed]
38 Yao J Salo AD Barbu-Mcinnis M Lerner AL Finite Element Modeling of Knee Joint ContactPressures and Comparison to Magnetic Resonance Imaging of the Loaded Knee In Proceedings ofthe IMECErsquo032003 ASME International Mechanical Engineering Congress amp Exposition Washington DCUSA 16ndash21 November 2003
39 Boruah S Subit DL Paskoff GR Shender BS Crandall JR Salzar RS Influence of bone microstructureon the mechanical properties of skull cortical bonemdashA combined experimental and computational approachJ Mech Behav Biomed Mater 2017 65 688ndash704 [CrossRef]
40 Leordean D Dudescu C Marcu T Berce P Balc N Customized implants with specific propertiesmade by selective laser melting Rapid Prototyp J 2015 21 98ndash104 [CrossRef]
41 Cofaru II Research on the Biomechanics of Axial Deviations of the Human Lower Limb and theDevelopment of Related Surgical Equipment PhD Thesis Lucian Blaga University of Sibiu SibiuRomania November 2013
42 Morgan F Bayraktar HH Keaveny TM Trabecular bone modulusndashdensity relationships depend onanatomic site J Biomech 2003 36 897ndash904 [CrossRef]
Appl Sci 2020 10 8972 20 of 20
43 Koh YG Lee JA Lee HY Chun HJ Kim HJ Kang KT Design optimization of high tibial osteotomyplates using finite element analysis for improved biomechanical effect J Orthop Surg Res 2019 14 1ndash10[CrossRef]
44 Fletcher JWA Williams S Whitehouse MR Gill HS Preatoni E Juvenile bovine bone is an appropriatesurrogate for normal and reduced density human bone in biomechanical testing A validation study Sci Rep2018 8 1ndash9 [CrossRef]
45 Sisljacic V Jovanovic S Mrcela T Nikolic V Radic R Wertheimerc V Tanja Kovac T Mrcela MApplicability of bovine tibia as a model in research on various osteosynthesis techniques Period Biol UDC2010 112 59ndash62
46 Bowland P Cowie RM Ingham E Fisher J Jennings M Biomechanical assessment of the stability ofosteochondral grafts implanted in porcine and bovine femoral condyles Proc Inst Mech Eng Part H JEng Med 2019 234 163ndash170 [CrossRef]
47 Akhbar MFA Yuosoff AR Comparison of bone temperature elevation in drilling of human bovine andporcine bone Sci Direct 2019 82 411ndash414 [CrossRef]
48 Hillerya MT Shuaibb I Temperature effects in the drilling of human and bovine bone J MaterProcess Technol 1999 302ndash308 [CrossRef]
49 Brown CP Nguyen TC Moody HR Crawford RW Oloyede A Assessment of common hyperelasticconstitutive equations for describing normal and osteoarthritic articular cartilage Proc Inst Mech Eng PartH-J Eng Med 2009 223 643ndash652 [CrossRef] [PubMed]
50 Demarteau O Pillet L Inaebnit A Borens O Quinn TM Biomechanical characterization and in vitromechanical injury of elderly human femoral head cartilage Comparison to adult bovine humeral headcartilage Osteoarthr Cartil 2006 14 589ndash596 [CrossRef]
51 Koh YG Son J Kim HJ Kwon SK Kwon OR Kim HJ Kang KT Multi-objective designoptimization of high tibial osteotomy for improvement of biomechanical effect by using finite elementanalysis J Orthop Res 2018 36 2956ndash2965 [CrossRef]
52 Russu OM Strnad G Farkas LJ Cazacu R Feier A Gergely I Trambitas C Petrovan CElectrochemical Synthesis of Nanostructured Oxide Layers on Threaded Surfaces of Medical ImplantsRev Chim 2018 69 1636ndash1639 [CrossRef]
53 Andor B Patrascu JM Florescu S Cojocaru D Sandesc M Borcan F Boruga O Bolintineanu SComparison of Different Knee Implants Used on Patients with Osteoarthritis Control Study Mater Plast2016 53 119ndash125
54 Todor A Vermesan D Haragus H Jr Patrascu JM Timar B Cosma DI Cross-cultural adaptation andvalidation of the Romanian International Knee Documentation CommitteemdashSubjective knee form PeerJ2020 8 e8448 [CrossRef]
55 Csernaacutetony Z Kiss L Manoacute S A new technique of wedge osteotomy to diminish undesirable fracturesEur J Orthop Surg Traumatol 2008 18 485ndash488 [CrossRef]
56 Chernchujit B Tharakulphan S Prasetia R Chantarapanich N Jirawison C Sitthiseripratip KPreoperative planning of medial opening wedge high tibial osteotomy using 3D computer-aided designweight-bearing simulated guidance Technique and preliminary result J Orthop Surg 2019 27 [CrossRef][PubMed]
57 Mohamed EA Opening wedge high tibial osteotomy in varus osteoarthritis of the knee without bonegraftcopy Egypt Orthop J 2018 53 38ndash43 [CrossRef]
Publisherrsquos Note MDPI stays neutral with regard to jurisdictional claims in published maps and institutionalaffiliations
copy 2020 by the authors Licensee MDPI Basel Switzerland This article is an open accessarticle distributed under the terms and conditions of the Creative Commons Attribution(CC BY) license (httpcreativecommonsorglicensesby40)
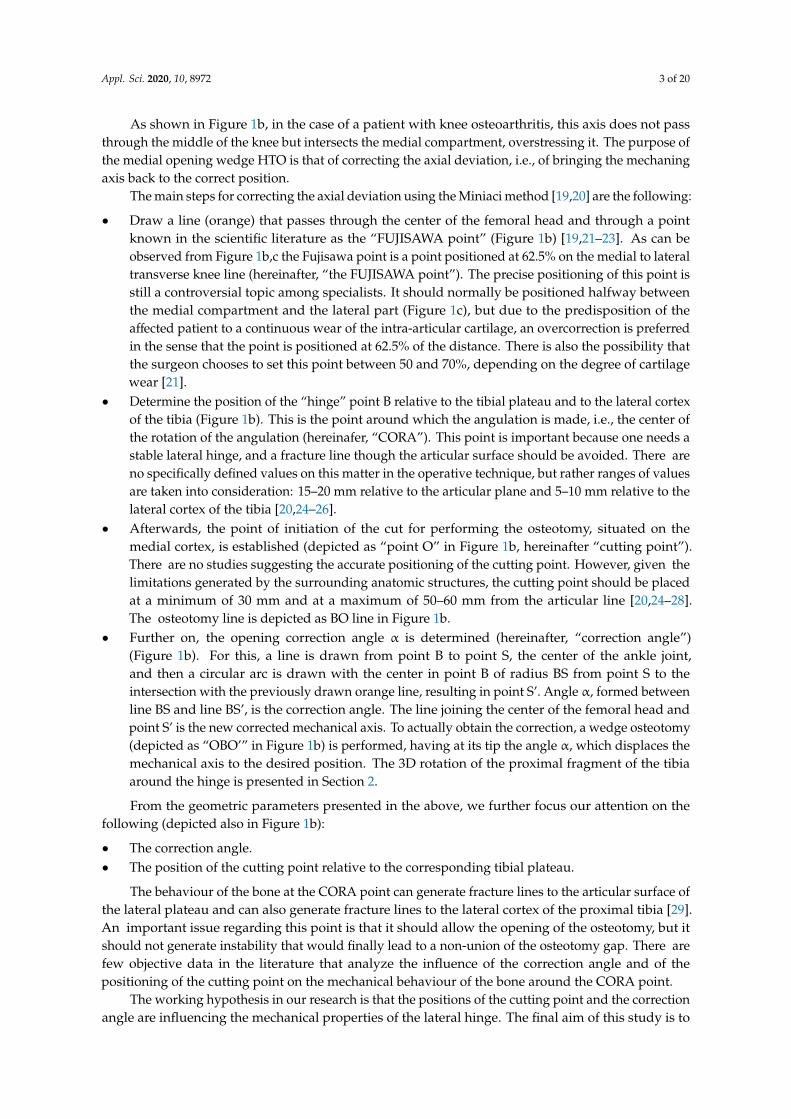
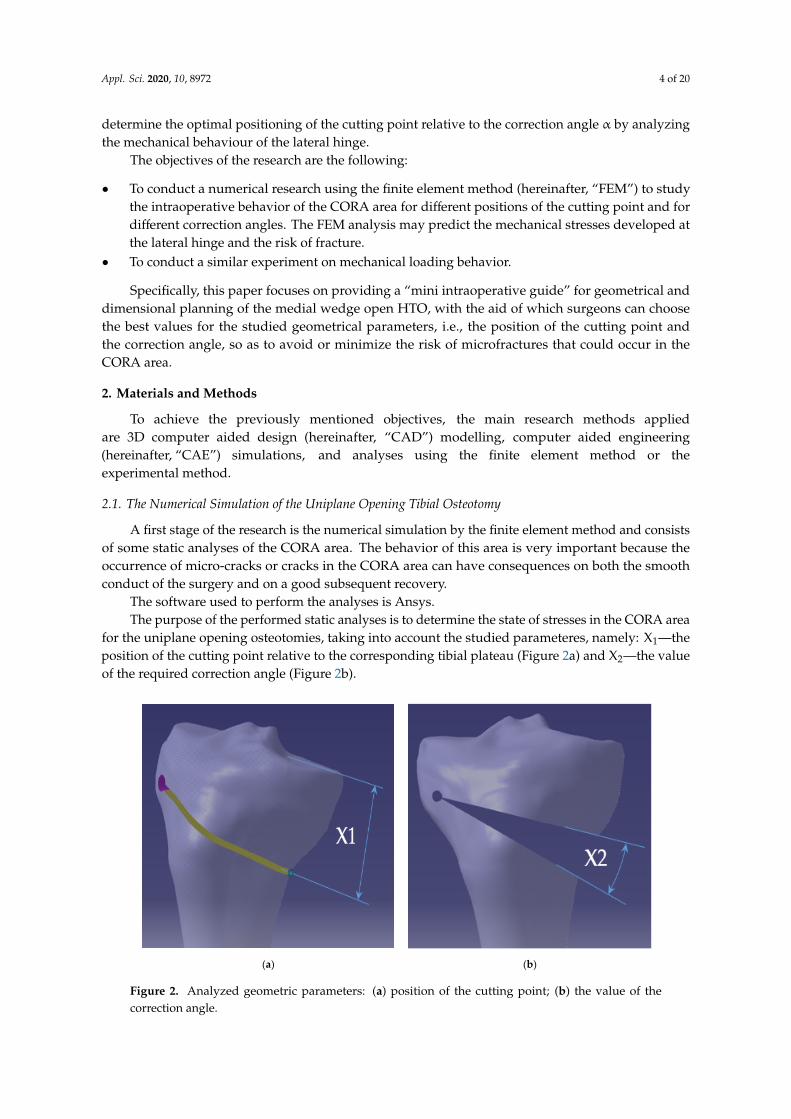
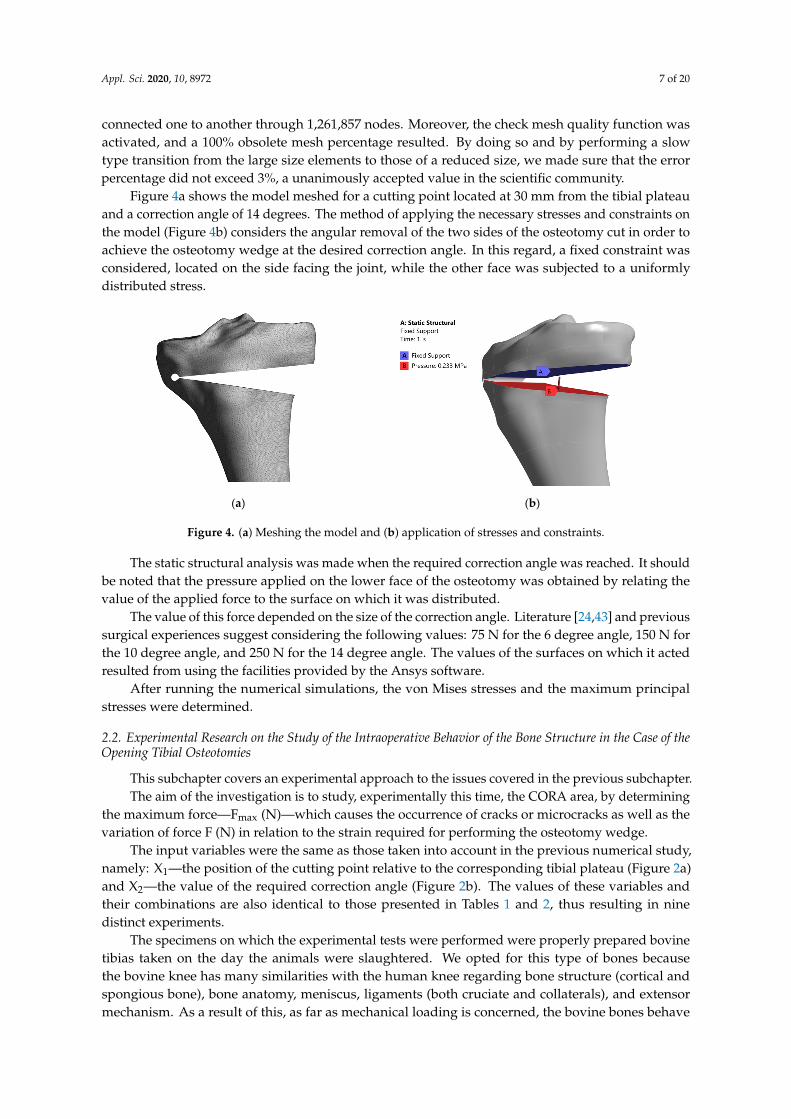
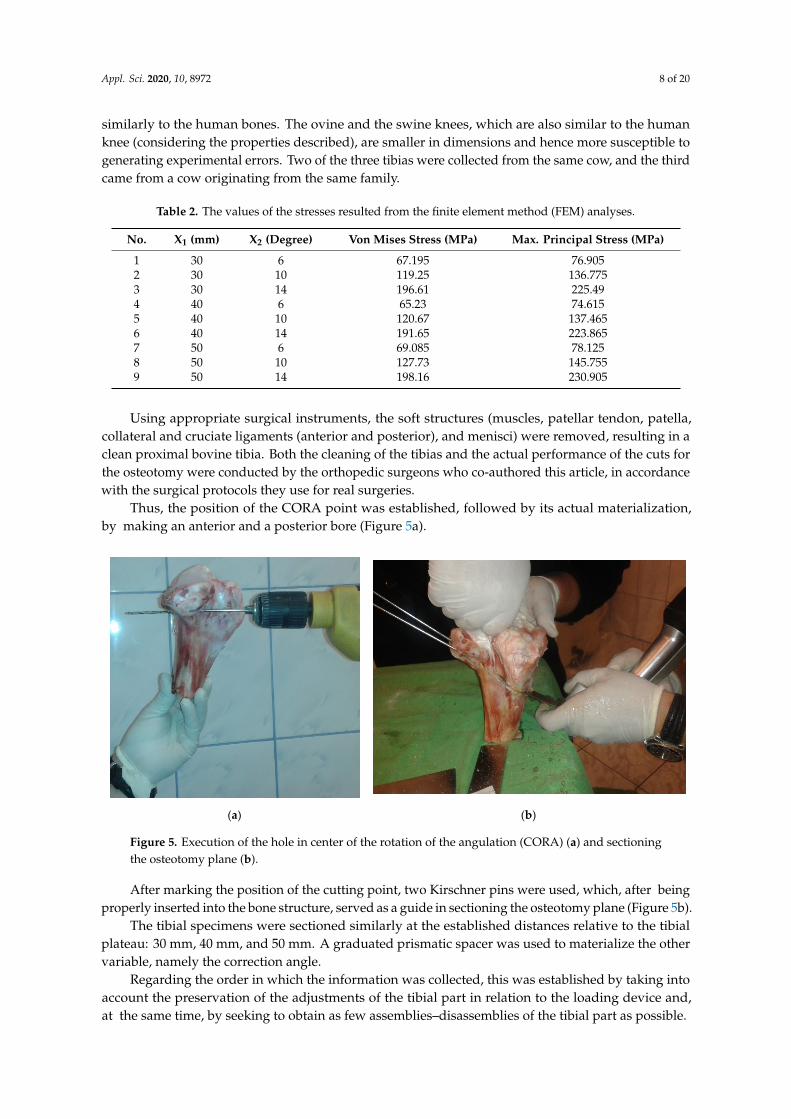
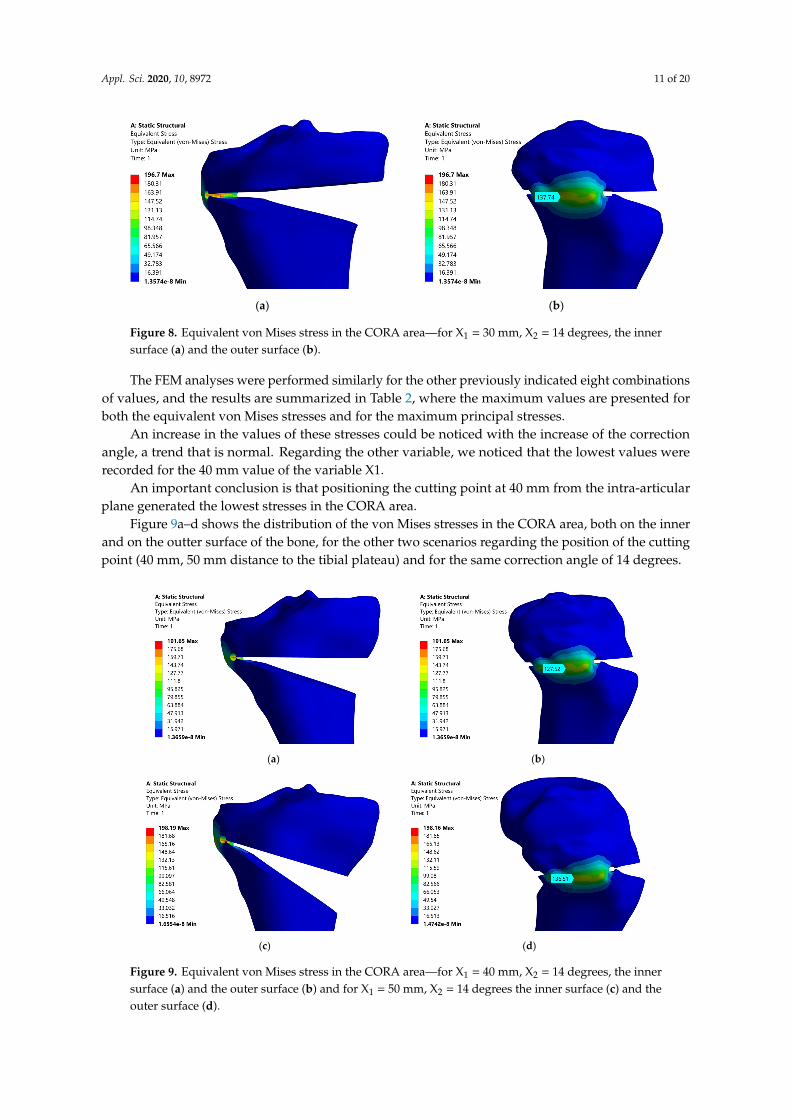
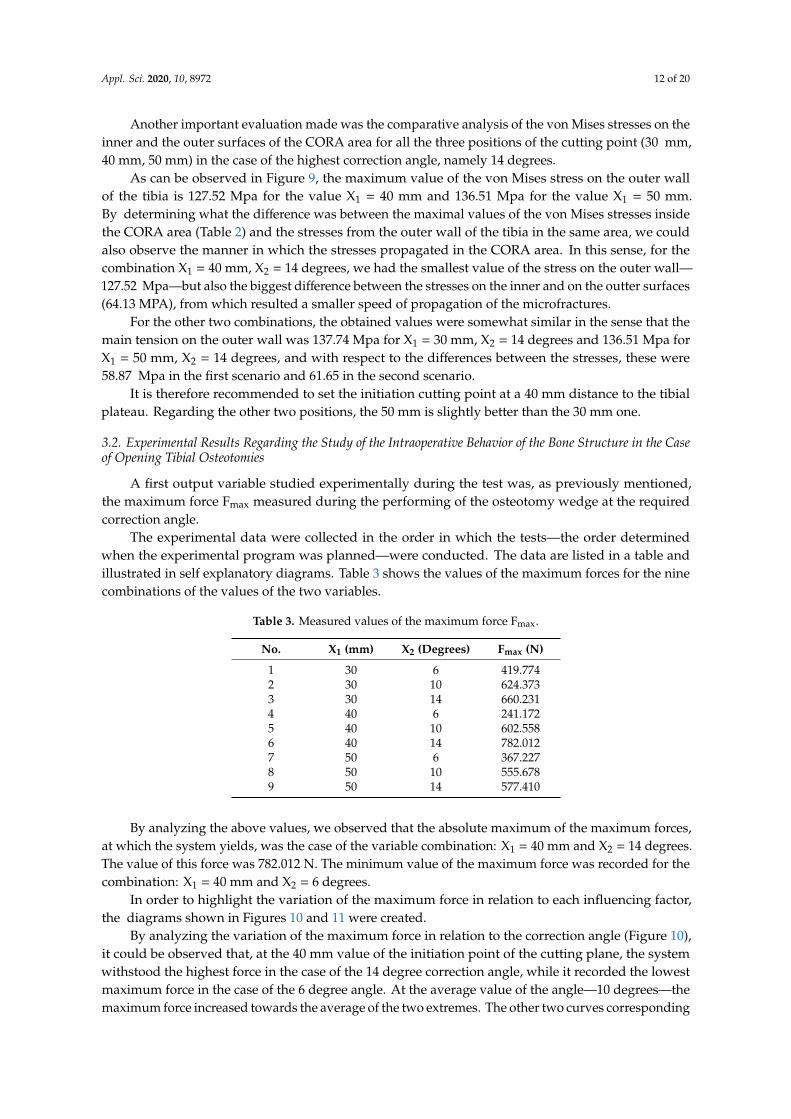
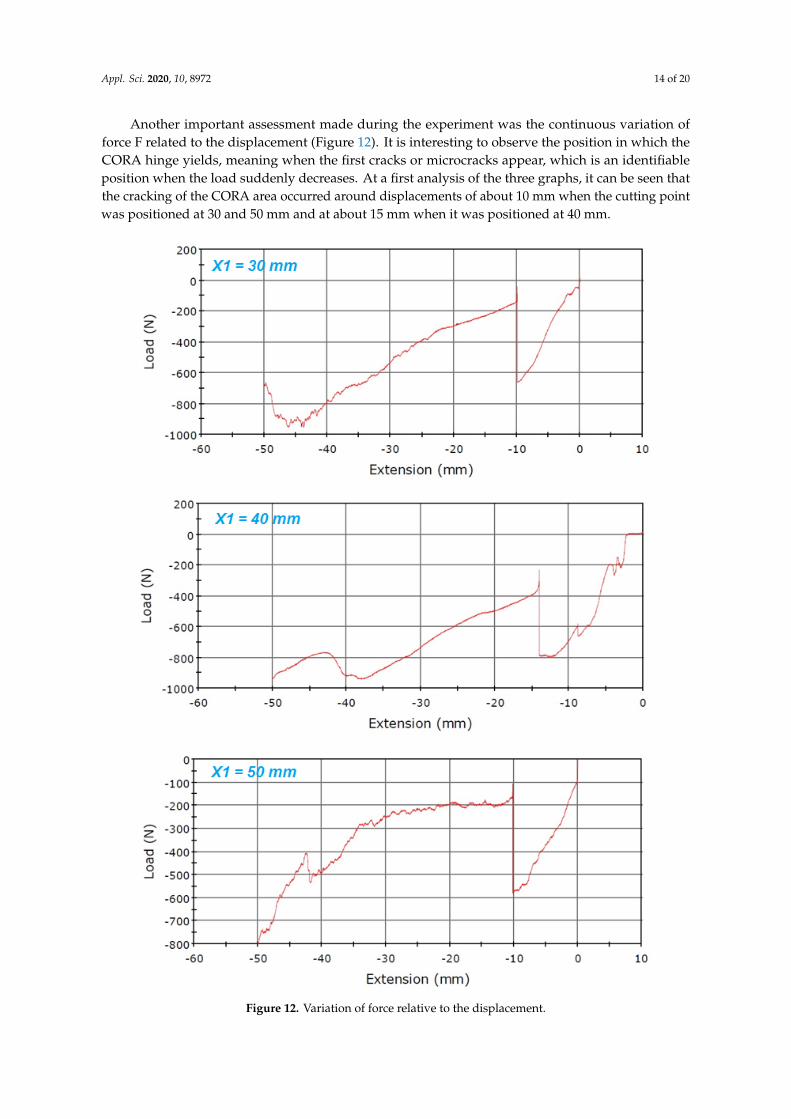
Copyright © 2022 FDOKUMEN