Genome Scanning: An AFM-based DNA - MIT's DSpace
160
Genome Scanning: An AFM-based DNA sequencing technique MASSACHUSETTSINST1ITUTE OF TECHNOLOGY by MAR 0 62006 Ahmed Elmouelhi MR0626 __LIBRARIES Submitted to the Department of Mechanical Engineeri.LBRAR.E in partial fulfillment of the requirements for the degree of Master of Science in Mechanical Engineering at the MASSACHUSETTS INSTITUTE OF TECHNOLOGY February 2003 BARKER @ Ahmed Elmouelhi, MMIII. All rights reserved. The author hereby grants to MIT permission to reproduce and distribute publicly paper and electronic copies of this thesis document in whole or in part. Author ................. /Departmentf Mechanical Engineering February, 2003 Certified by........... Kamal Youcef-Toumi Professor of Mechanical Engineering Thesis Supervisor A ccepted by ............................. Ain A. Sonin Chairman, Department Committee on Graduate Students
-
Upload
khangminh22 -
Category
Documents
-
view
3 -
download
0
Transcript of Genome Scanning: An AFM-based DNA - MIT's DSpace

Genome Scanning: An AFM-based DNA
sequencing technique MASSACHUSETTSINST1ITUTEOF TECHNOLOGY
byMAR 0 62006
Ahmed Elmouelhi MR0626__LIBRARIES
Submitted to the Department of Mechanical Engineeri.LBRAR.Ein partial fulfillment of the requirements for the degree of
Master of Science in Mechanical Engineering
at the
MASSACHUSETTS INSTITUTE OF TECHNOLOGY
February 2003 BARKER
@ Ahmed Elmouelhi, MMIII. All rights reserved.
The author hereby grants to MIT permission to reproduce anddistribute publicly paper and electronic copies of this thesis document
in whole or in part.
Author .................
/Departmentf Mechanical EngineeringFebruary, 2003
Certified by...........Kamal Youcef-Toumi
Professor of Mechanical EngineeringThesis Supervisor
A ccepted by .............................Ain A. Sonin
Chairman, Department Committee on Graduate Students


Genome Scanning: An AFM-based DNA sequencing
technique
by
Ahmed Elmouelhi
Submitted to the Department of Mechanical Engineeringon February, 2003, in partial fulfillment of the
requirements for the degree ofMaster of Science in Mechanical Engineering
Abstract
Genome Scanning is a powerful new technique for DNA sequencing. The methodpresented in this thesis uses an atomic force microscope with a functionalized can-tilever tip to sequence single stranded DNA immobilized to a mica surface. Thefunctionalized cantilever tip hybridizes with only one base type (A, C, T, or G) andresults in distinct peaks in the AFM-produced image. Genome Scanning has beensuccessful at identifying 40 base strands of synthesized DNA and has been shownto detect a particular base type on 48 kilobase strands of lambda DNA. Currently,Genome Scanning is only accurate to 3-26 bases at a time, however, it can achieve asequencing speed of 6000 bases/sec. In other words, Genome Scanning can be usedto sequence the 3 billion bases of the human genome in 5.78 days.
Thesis Supervisor: Kamal Youcef-ToumiTitle: Professor of Mechanical Engineering


Acknowledgments
I would like to first express my thanks to God, who-through his mercy-gave me the
tools and the understanding to carry out this piece of work and to my parents who
raised me to dream bigger and to reach further in life. I would also like to acknowledge
Prof. Kamal Youcef-Toumi for his continual advice and support over the past year
and a half, and my colleagues at the Mechatronics Research Laboratory for their
help and insights into this thesis, especially Osama Elrifaii and Khalid Elrifaii. I
am also grateful to Laurel Ng, Kristin Brodie, and Minhaj Siddiqui for sharing their
expertise in the biochemistry and biology of this project. I am also indebted to
Bernardo Aumond and the other members of Surface Logix, Inc. for their generous
contributions to this thesis. Finally, I would like to thank my good friends at Chicago
Pizza for their tireless delievery trips and their constant company.

6

Contents
1 Introduction
1.1 Problem Statement:Sequencing . . . . . .
1.2 Importance of Personal Genome Scanning
1.3 Prior Sequencing Work . . . . . . . . . . .
1.4 Remaining Technical Challenges . . . . . .
1.5 Genome Scanning . . . . . . . . . . . . . .
1.5.1 Immobilized ssDNA . . . . . . . . .
1.5.2 Modified Sensor Tip: . . . . . . . .
1.5.3 Data Analysis: . . . . . . . . . . .
1.6 Thesis Outline. . . . . . . . . . . . . . . .
2 Background
2.1 Introduction . . . . . . . . . . . . . . . . .
2.2 D N A . . . . . . . . . . . . . . . . . . . . .
2.2.1 DNA Structure . . . . . . . . . . .
2.2.2 Bases . . . . . . . . . . . . . . . . .
2.2.3 Helix dimensions . . . . . . . . . .
2.2.4 Denaturization . . . . . . . . . . .
2.2.5 Function of DNA . . . . . . . . . .
2.3 Fundamentals of Sequencing . . . . . . . .
2.3.1 Southern Blotting . . . . . . . . . .
2.3.2 Sanger Method . . . . . . . . . . .
2.4 Atomic Force Microscopy . . . . . . . . . .
7
21
21
21
23
24
25
25
27
27
28
31
31
31
32
32
32
35
36
36
36
40
43
. . . . . . . . . .
. . . . . . . . . .
. . . . . . . . . . . .
. . . . . . . . . . . .

2.4.1 Cantilever and Tip . . . . .
2.4.2 User Controls . . . . . . . .
2.4.3 Contact Mode . . . . . . . .
2.4.4 Intermittent Contact Mode
2.5 Current State of the Art . . . . . .
2.5.1 Gel Electrophoresis . . . . .
2.5.2 Capillary Electrophoresis . .
2.5.3 Membrane Filtration . . . .
2.5.4 Centrifugal Methods . . . .
2.5.5 Mass Spectrometry . . . . .
2.6 Summary
3 Competing Concepts
3.1 Introduction . . . . . . . . . . . . . . . . . . . . . . . . .
3.2 Whitehead Institute/ MIT Center for Genome Research.
3.3 U.S. Genomics . . . . . . . . . . . . . . . . . . . . . . . .
3.4 Sum m ary . . . . . . . . . . . . . . . . . . . . . . . . . .
4 Genome Scanning
4.1 Introduction . . . . . . . . . . . . . . . .
4.2 Advantages of Genome Scanning . . . .
4.3 Genome Scanning Requirements . . . . .
4.3.1 Base Interaction Forces . . . . . .
4.3.2 DNA Linkage to Mica . . . . . .
4.3.3 Tip Adsorption . . . . . . . . . .
4.4 Predicted Results of Genome Sequencing
4.4.1 DNA Width . . . . . . . . . . . .
4.4.2 DNA Profile . . . . . . . . . . . .
4.5 Summary . . . . . . . . . . . . . . . . .
8
. . . . . . . . . . . . . . . . . . . 4 4
. . .. . . . . . . . . . .. . . . . 4 5
. . .. . . . . . . . . . . .. . . . 4 6
. .. . . . . . . . . . . . .. . . . 5 0
. . .. . . . . . . . . . . .. . . . 5 2
. . .. . . . . . . . . . . .. . . . 5 2
. . .. . . . . . . . . . . . .. . . 5 6
. . .. . . . . . . . . . . . .. . . 5 6
. . .. . . . . . . . . . . . .. . . 5 9
. . .. . . . . . . . . . . . .. . . 6 0
. . . . . . . . . . . . . . . . . . . . . . . . . . . . . . . . . 6 3
65
. . . . . . . 65
. . . . . . . 65
. . . . . . . 69
. . . . . . . 72
73
. . . . . . . . . . . . . . . . 73
. . . . . . . . . . . . . . . . 73
. . . . . . . . . . . . . . . . 74
. . . . . . . . . . . . . . . . 76
. . . . . . . . . . . . . . . . 80
. . . . . . . . . . . . . . . . 82
. . . . . . . . . . . . . . . . 85
. . . . . . . . . . . . . . . . 85
. . . . . . . . . . . . . . . . 87
. ............... 91

5 Experimental Setup 93
5.1 Introduction ........ ................................ 93
5.2 P urpose . . . . . . . . . . . . . . . . . . . . . . . . . . . . . . . . . . 93
5.3 Setup . . . . . . . . . . . . . . . . . . . . . . . . . . . . . . . . . . . . 94
5.3.1 Atomically Flat Background . . . . . . . . . . . . . . . . . . . 94
5.3.2 Linking DNA to Mica . . . . . . . . . . . . . . . . . . . . . . 98
5.3.3 DNA Alignment . . . . . . . . . . . . . . . . . . . . . . . . . . 100
5.3.4 Cantilever Tip Functionalization . . . . . . . . . . . . . . . . . 101
5.4 Experimental Procedures . . . . . . . . . . . . . . . . . . . . . . . . . 106
5.4.1 DNA Preparation . . . . . . . . . . . . . . . . . . . . . . . . . 106
5.4.2 Cleaving Mica . . . . . . . . . . . . . . . . . . . . . . . . . . . 109
5.4.3 Linker Application to Mica . . . . . . . . . . . . . . . . . . . . 110
5.4.4 DNA Immobilization on Mica Surface . . . . . . . . . . . . . . 113
5.4.5 Cantilever Tip Functionalization . . . . . . . . . . . . . . . . . 113
5.4.6 Base Adsorption . . . . . . . . . . . . . . . . . . . . . . . . . 117
5.5 Summary . . . . . . . . . . . . . . . . . . . . . . . . . . . . . . . . . 119
6 Experimental Results and Analysis 121
6.1 Introduction . . . . . . . . . . . . . . . . . . . . . . . . . . . . . . . . 121
6.2 DNA Profile Data . . . . . . . . . . . . . . . . . . . . . . . . . . . . . 121
6.3 Synthesized DNA results . . . . . . . . . . . . . . . . . . . . . . . . . 122
6.4 Lambda DNA Results . . . . . . . . . . . . . . . . . . . . . . . . . . 129
6.4.1 As-is Cantilever . . . . . . . . . . . . . . . . . . . . . . . . . . 129
6.4.2 Adenine Coated Cantilever . . . . . . . . . . . . . . . . . . . . 133
6.5 Accuracy Analysis . . . . . . . . . . . . . . . . . . . . . . . . . . . . 137
6.6 Speed Analysis . . . . . . . . . . . . . . . . . . . . . . . . . . . . . . 138
6.7 Summary . . . . . . . . . . . . . . . . . . . . . . . . . . . . . . . . . 139
7 Conclusions and Recommendations 141
7.1 Conclusions . . . . . . . . . . . . . . . . . . . . . . . . . . . . . . . . 141
7.2 Recommendations . . . . . . . . . . . . . . . . . . . . . . . . . . . . . 141
9

7.2.1
7.2.2
7.2.3
Genome Scanning Accuracy . . . .
Genome Scanning Speed . . . . . .
Multiple Base Scanning . . . . . .
. 142
. 142
. 143
A Protocols 145
A.1 Lambda DNA Dilution Protocol . . . . . . . . . . . . . . . . . . . . . 145
A.2 Lambda DNA Denaturation Protocol . . . . . . . . . . . . . . . . . . 145
A.3 40x T Synthesized DNA Dilution Protocol . . . . . . . . . . . . . . . 146
A.4 40x A Synthesized DNA Dilution Protocol . . . . . . . . . . . . . . . 146
A.5 APES Dilution Protocol . . . . . . . . . . . . . . . . . . . . . . . . . 147
A.6 APES Application Protocol . . . . . . . . . . . . . . . . . . . . . . . 147
A.7 MgCl 2 Dilution Protocol . . . . . . . . . . . . . . . . . . . . . . . . . 147
A.8 DNA Immobilization on Mica Protocol (Mg2+ Linker) . . . . . . . . . 148
A.9 DNA Immobilization on Mica Protocol (APES Linker) . . . . . . . . 148
A.10 1.0mM Base Solution in Ethanol Protocol . . . . . . . . . . . . . . . 149
B DNA theoretical Models 151
B.1 DNA Profile Predictions:Matlab Code . . . . . . . . . . . . . . . . . . 151
C List of Vendors 153
C.1 Chemical Supplies . . . . . . . . . . . . . . . . . . . . . . . . . . . . . 153
C.2 Biological Supplies . . . . . . . . . . . . . . . . . . . . . . . . . . . . 154
C.3 Atomic Force Microscope and Supplies . . . . . . . . . . . . . . . . . 154
C.4 Thin Film Coating . . . . . . . . . . . . . . . . . . . . . . . . . . . . 155
10

List of Figures
1-1 Genome Scanning uses an atomic force microscope (AFM) to scan im-
mobilized DNA. The cantilever deflects in response to base matching
events. A photodiode monitors the movements of the laser beam re-
flected off the cantilever. . . . . . . . . . . . . . . . . . . . . . . . . . 26
2-1 DNA is made of two anti-parallel chains. The chains contain comple-
mentary sequences. Nucleotides, the repeat unit of DNA, are com-
posed of a phosphate group, a deoxyribose sugar, and a base. (http://
medlib.med.utah.edu/ block2/ biochem/ Formosa/ Figures/ Lecturel/
dsD NA .JPG ) . . . . . . . . . . . . . . . . . . . . . . . . . . . . . . . 33
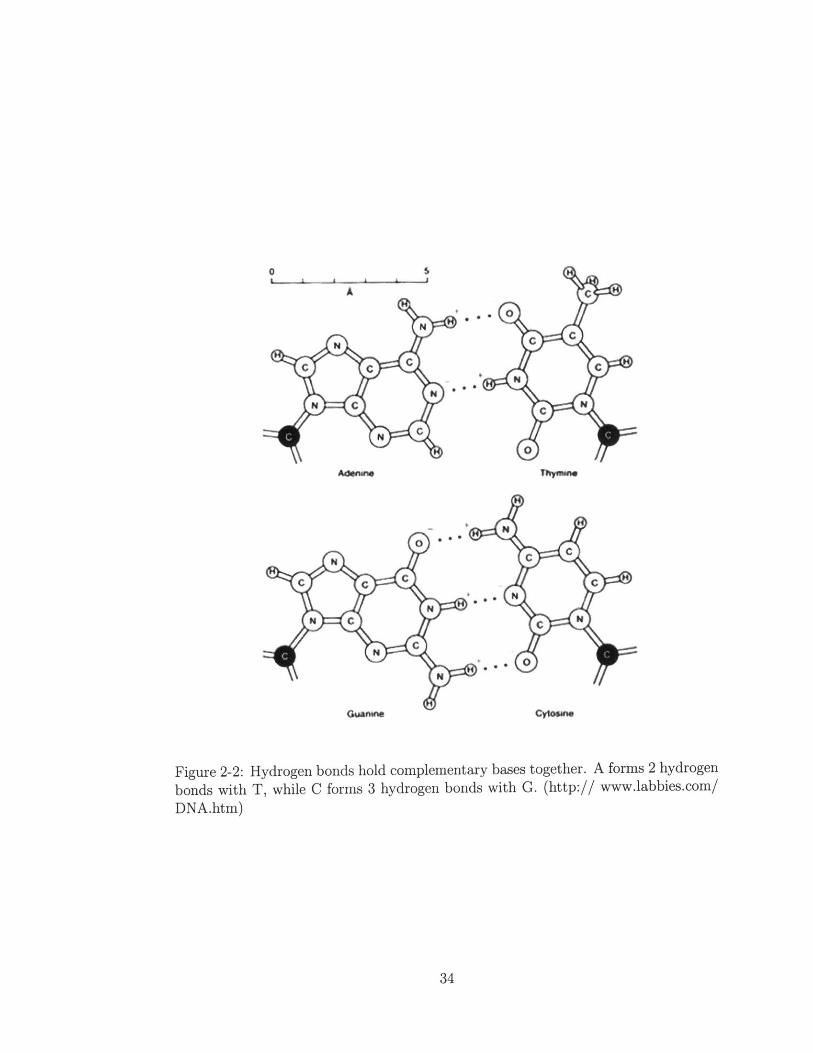
2-2 Hydrogen bonds hold complementary bases together. A forms 2 hydro-
gen bonds with T, while C forms 3 hydrogen bonds with G. (http://
www.labbies.com/ DNA.htm) . . . . . . . . . . . . . . . . . . . . . . 34
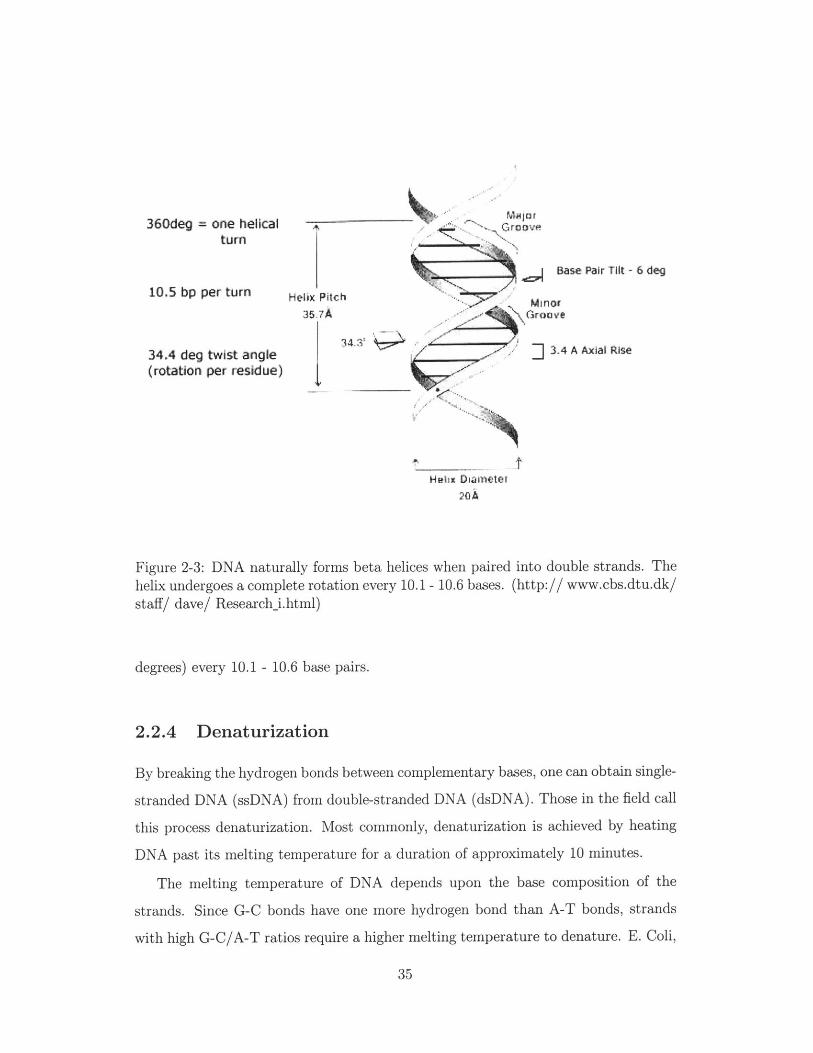
2-3 DNA naturally forms beta helices when paired into double strands.
The helix undergoes a complete rotation every 10.1 - 10.6 bases. (http://
www.cbs.dtu.dk/ staff/ dave/ Research i.html) . . . . . . . . . . . . . 35
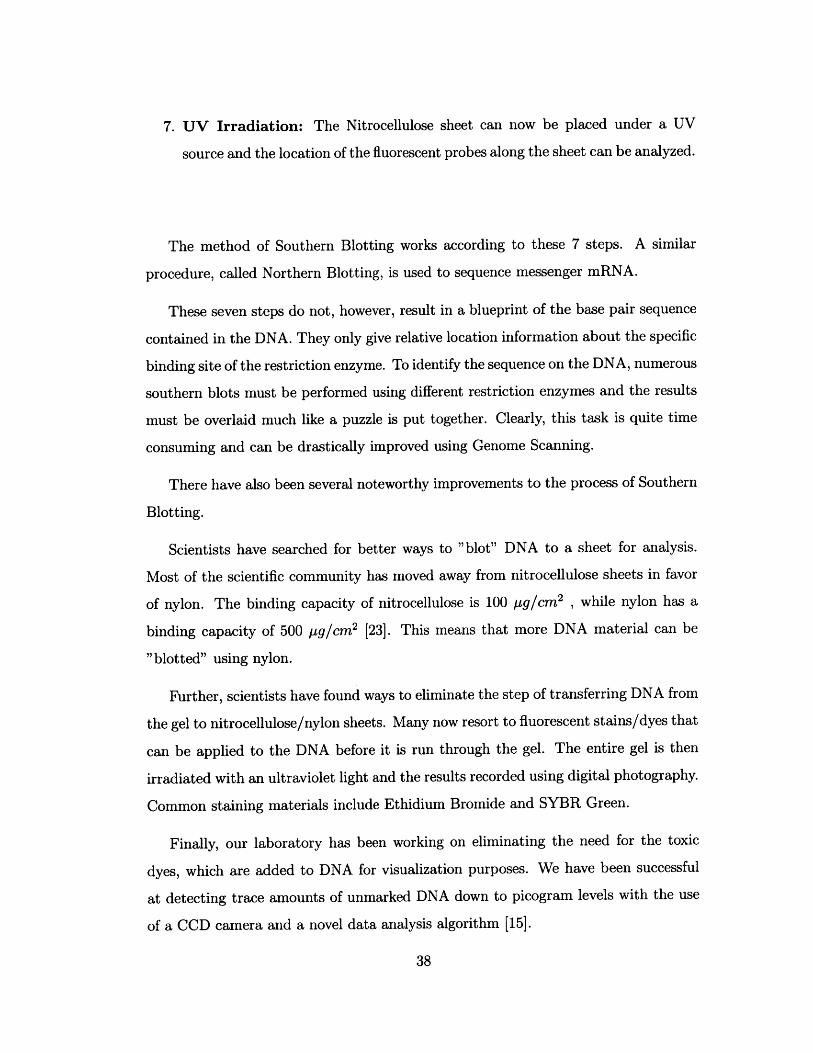
2-4 Southern blotting can be extremely tedious and time consuming. South-
ern blotting starts with gel electrophoresis. The sorted fragments
are then blotted onto a sheet and fluorescent probes are added to
the fragments. Information on the base length of the DNA frag-
ments can then be extracted from the sheet (modified from http://
www.accessexcellence.org/ AB/ GG/ southBlotg.html). . . . . . . . . 39
11

2-5 ddNTPs are added to dNTPs so newly-formed DNA chains will termi-
nate at a known base. In the figure, ddATPs are added to the DNA
strands. The first strand terminates in a ddATP and is 8 bases long.
The second strand hybridizes with dATP at the 8th base position,
then hybridizes with a ddATP at the 11th base position, resulting in
an overall length of 11 bases. Other iterations are also shown. (http://
www.blc.arizona.edu/ INTERACTIVE/ recombinant3.dna/ Sequenc-
ing.htm l) . . . . . . . . . . . . . . . . . . . . . . . . . . . .. . . . . 41
2-6 DNA sequence can be read directly from a gel after running the Sanger
method. The sequence corresponding to the bands shown is spelled out
to the right of the gel. This sequence is the complement of the DNA
strand sequence (shown above the gel). (http:// www.blc.arizona.edu/
INTERACTIVE/ recombinant3.dna/ Sequencing.html) . . . . . . . . 42
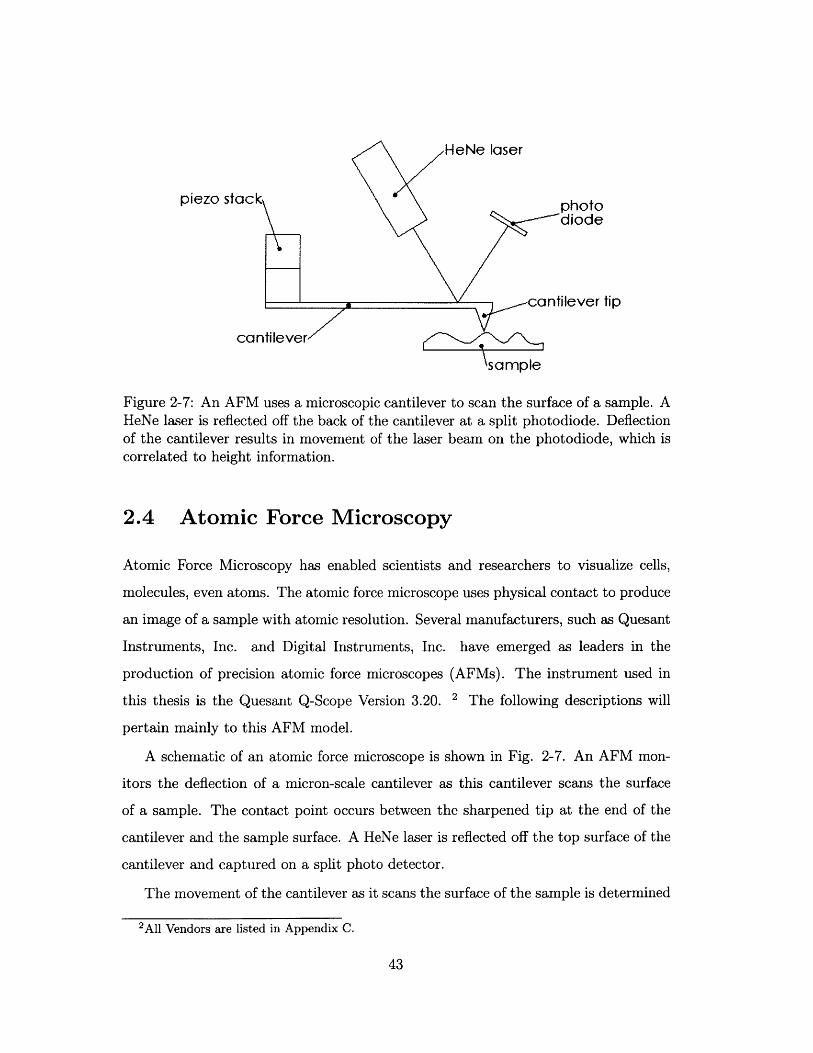
2-7 An AFM uses a microscopic cantilever to scan the surface of a sample.
A HeNe laser is reflected off the back of the cantilever at a split pho-
todiode. Deflection of the cantilever results in movement of the laser
beam on the photodiode, which is correlated to height information. . 43
2-8 Rectangular cantilevers (left) are mostly used for IC scanning, while
triangular cantilevers (right) have more stiffness for contact mode scan-
ning. (Courtesy Digital Instruments. http:// www.di.com) . . . . . . 45
2-9 The position of the laser on the photo diode can be monitored and
optimized through this user interface. . . . . . . . . . . . . . . . . . . 47
2-10 In intermittent contact mode, the cantilever is excited at frequencies
ranging from 32 dHz to 41 dHz. At 37 kHz the cantilever is seen
to resonate. This frequency will be used to oscillate the cantilever in
resonance as it scans the sample surface. . . . . . . . . . . . . . . . . 48
2-11 Contact mode imaging of a periodic rectangular grating. The AFM
produces accurate height information of the relatively large features of
the grating. . . . . . . . . . . . . . . . . . . . . . . . . . . . . . . . 49
12

2-12 IC height mode image of a pyramidal grating. More detail of the
grating surface is apparent in IC mode imaging than in contact mode
im aging. . . . . . . . . . . . . . . . . . . . . . . . . . . . . . . . . . . 51
2-13 IC phase mode imaging of a standard grating. Phase shifts occur
when the topography of the sample changes rapidly. IC phase mode
imaging is good at identifying abrupt changes in the surface, but does
not produce reliable information on flat, constant surfaces, such as the
valleys of the grating. . . . . . . . . . . . . . . . . . . . . . . . . . . . 53
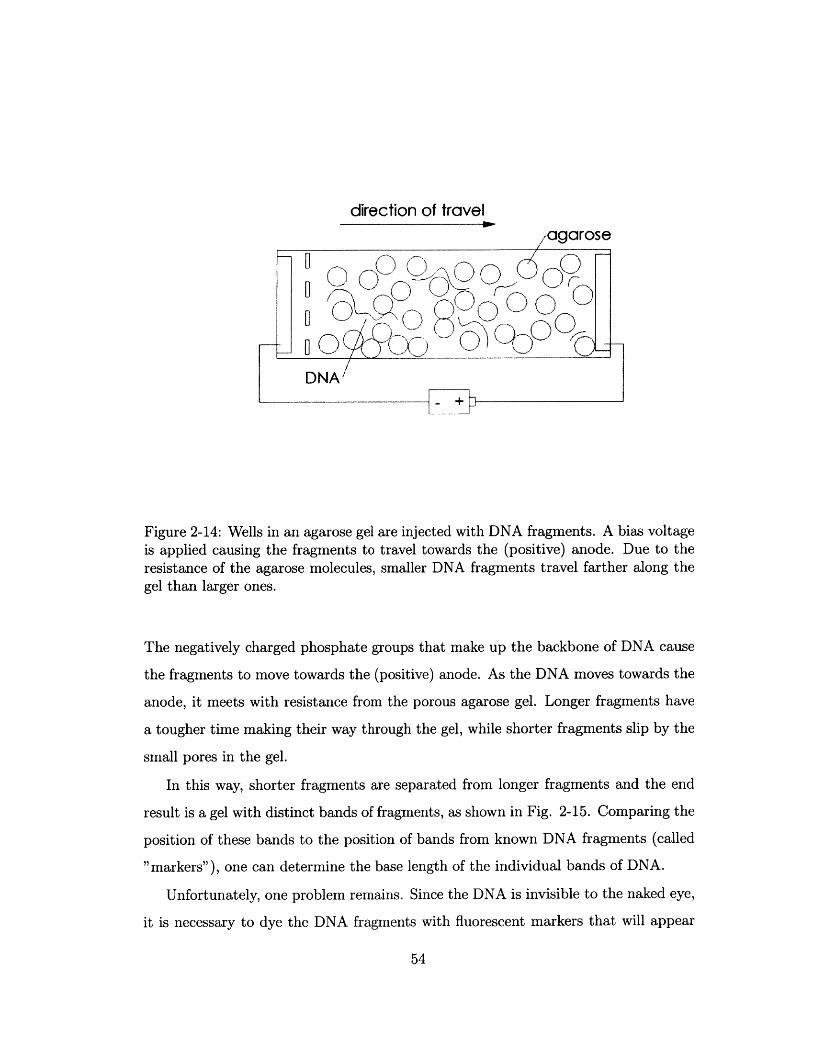
2-14 Wells in an agarose gel are injected with DNA fragments. A bias
voltage is applied causing the fragments to travel towards the (positive)
anode. Due to the resistance of the agarose molecules, smaller DNA
fragments travel farther along the gel than larger ones. . . . . . . . . 54
2-15 Bright bands in the gel (as a results of gel electrophoresis) mark the
location of DNA fragments. The direction of electrophoresis in the ver-
tical direction from the top to the bottom, resulting in 9 separate lanes
of DNA fragments. The right most lane, lane 9, shows the location of
markers with known base lengths, which are written next to the lane.
(http:// www.cdc.gov/ ncidod/ eid/ vol8no5/ 01-0373-G.htm) . . . . 55
2-16 In capillary electrophoresis, an electric field is created causing highly
negative ions to travel faster along the capillary than other particles.
The passage of ions over time is recorded using a laser and an opposing
photoreceptor. . . . . . . . . . . . . . . . . . . . . . . . . . . . . . . . 57
2-17 Membrane filters are used to separate particles greater than a threshold
value from particles smaller than that value. Two screen filters are
shown, and particles are shown trapped on the filter surface on the
left. (http:// www.millipore.com/) . . . . . . . . . . . . . . . . . . . 58
2-18 Cross-section of a depth filter with varying pore size. Pores increase in
diameter as one looks further from the center of rotation. (Courtesy
Millipore, Inc. www.millipore.com.) . . . . . . . . . . . . . . . . . . . 59
13
2-19 The source of a mass spectrometer converts a sample into a state of
gaseous ions. The analyzer sorts these ions by mass to charge ratio
and the detector determines the quantity present of each ion. . . . . . 61
2-20 Mass Spectrometry results in the identification of the desired molecule
and fragments thereof. The mass spectrum shown is of carbon dioxide.
Since the CO 2 particles are fragmented, one can see a spike at 0+ (16
Da), C+ (12 Da), and CO+ (28 Da) weights. [4] . . . . . . . . . . . . 62
3-1 Resources at WICGR are plentiful. This photograph shows the custom
built sequencing machines used by WICGR to sequence human DNA
for the Human Genome Project(http:// www.wi.mit.edu/ Genome/
gcphotos.htm l). . . . . . . . . . . . . . . . . . . . . . . . . . . . . . . 66
3-2 Sanger method as employed by the Whitehead Institute/MIT Cen-
ter for Genome Research. The Sanger method uses chemically tagged
bases to sequence DNA. After electrophoresis, one can read the DNA
sequence directly from the gel. (Courtesy WICGR http:// www-genome.
w i. m it. edu/) . . . . . . . . . . . . . . . . . . . . . . . . . . . . . . . 67
3-3 Schematic representation of custom-build sequencers employed by WICGR.
This glass plate contains 384 wells that are used in parallel to perform
gel electrophoresis in micro-machined capillaries. . . . . . . . . . . . . 68
3-4 Structure of funnel posts employed by US Genomics to untangle strands
of DNA. As DNA traverses the funnel, the physical contact with posts
forces it to untangle and unwind. At the end of the funnel, DNA is in a
straight linear form. Digital Image (top) [25] and US Patent 6,263,286
(bottom ) [13]. . . . . . . . . . . . . . . . . . . . . . . . . . . . . . . . 70
3-5 A set of lasers and detectors reads the fluorescent bases as DNA passes
by. The first laser reads positional information from the backbone of
the DNA molecule, while the second laser reads the sequence from the
strand of DNA [25]. . . . . . . . . . . . . . . . . . . . . . . . . . . . . 71
14

4-1 This schematic of Genome Scanning shows how the AFM tip is modi-
fied and how the ssDNA is immobilized to mica. The gold (AU) coating
is 100 Athick and the linker used in the experiments are either APES
or M g2 + . . . . . . . . . . . . . . . . . . . . . . . . . . . . . . . . . . . 75
4-2 Water molecules use hydrogen bonds to hold their structure.A hydro-
gen atom from one molecule is covalently bonded to an oxygen atom
giving the hydrogen a slightly positive charge, while the oxygen from
another atom is covalently bonded to a hydrogen giving the oxygen
a slightly positive charge. These two molecules will form a hydrogen
bond as shown in the figure. . . . . . . . . . . . . . . . . . . . . . . . 78
4-3 Two hydrogen bonds form between adenine and thymine while three
hydrogen bonds form between cytosine and guanine. This configura-
tion of hydrogen bonds makes it nearly impossible for bases to bond
to anything but their complementary base. (modified from http://
winel.sb.fsu.edu/ bch5425/ lect02/ IMG00008.GIF) . . . . . . . . . . 79
4-4 Linkers use ionic bonding to anchor DNA to the mica sheet. The linker
is composed of two positive terminals and bonds to the negatively
charged mica on one side and to the negatively charged phosphate
group of DNA on the other side. . . . . . . . . . . . . . . . . . . . . . 81
4-5 Base adsorption to a thick gold layer . . . . . . . . . . . . . . . . . . 83
4-6 Calculating the expected DNA width depends on the thickness of the
DNA strand (modelled as a cylinder) and the radius of curvature of
the cantilever tip (modelled as a hemisphere). . . . . . . . . . . . . . 86
4-7 The top figure shows a scan of dsDNA using a fresh 10 nm radius of
curvature cantilever tip. The bottom figure shows the measured height
profile over a section of DNA. The measured width of DNA is 12.72
nm, indicating a close correlation to the theoretical model (12.65 nm).
Height measurements were taken relative to the global height, shown
in the bottom figure as a horizontal white line. . . . . . . . . . . . . . 88
4-8 The profile of DNA scanned can also be estimated using this diagram. 89
15

4-9 Simulated profile of ssDNA as scanned by a bare tip, a lightly coated
tip, and a heavily coated tip, with radii of curvature of 10 nm, 24 nm,
and 30 nm accordingly. . . . . . . . . . . . . . . . . . . . . . . . . . . 90
5-1 The layer-like structure of muscovite mica allows it to be cleaved into
flat sheets. (Courtesy D M Sherman, University of Bristol http://
mineral.gly.bris.ac.uk/ Mineralogy/ micas.pdf) . . . . . . . . . . . . . 95
5-2 Sheering mica along its sheer plane results in atomically flat surfaces. 96
5-3 AFM image of glass surface pictured (top) shows large variations in the
height of this background substrate. By comparison, muscovite mica
only varies by 1/100 the height over the same area (bottom). . . . . . 97
5-4 APES contains 4 functionalized ends: 3 C2H5 ends and 1 NH 2 end. . 98
5-5 Divalent cations, such as Magnesium ions, are composed of two positive
terminals. Magnesium ions can be obtained by dissolving Magnesium
Chloride in solution. . . . . . . . . . . . . . . . . . . . . . . . . . . . 99
5-6 DNA overlaps as it forms a loop along the strand as pointed out by
the white arrow (left). Looping makes bases on the bottom strand
inaccessible to the cantilever tip because of the overlapping top strand.
A schematic of the DNA overlap is shown for clarity (right). . . . . . 101
5-7 Adding a probing strand to the cantilever tip would enable Genome
Scanning. Here a probing DNA strand with an A-A final base pair is
attached to an AFM cantilever tip and used to scan immobilized DNA
strands. . . . . . . . . . . . . . . . . . . . . .. . . . . ... . . . . 103
5-8 Bases adsorbed directly to the cantilever tip would also serve the pur-
pose of Genome Scanning. Here adenine bases are adsorbed to the
cantilever tip and used to scan the immobilized DNA below. . . . . . 104
5-9 Sequence detail of synthesized DNA. The top sequence contains 40
thymine bases and is called 40x T. The bottom sequence contains 40
adenine bases and is called 40x A. . . . . . . . . . . . . . . . . . . . . 108
16
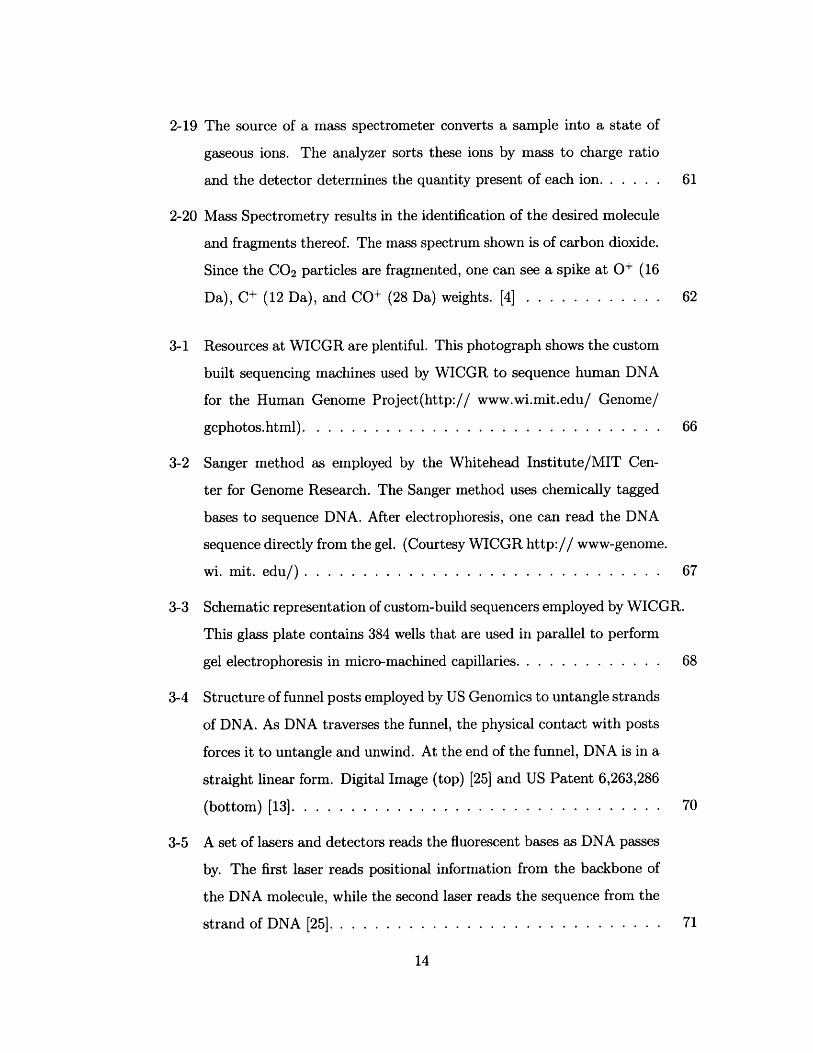
5-10 Using a piece of commercially available scotch tape, one can cleave a
small layer of mica. The cleaved mica is shown on the left and the
piece of scotch tape used to cleave is shown on the right. . . . . . . . 110
5-11 1 pg/mL DNA immobilized with 2% APES results in a rough surface
with indistinguishable features and some clustering (top). 20 pg/mL
DNA immobilized with 2 % APES resulted in major clustering of the
DNA as well (bottom left). 0.01 % APES immobilizing 1 pg/mL gave
very distinguishable DNA images, especially in phase mode (bottom
right). . . . . . . . . . . . . . . . . . . . . . . . . . . . . . . . . . . . 112
5-12 Olympus Cantilever AC240TS SEM image of cantilever (top left), SEM
images of cantilever tip (top right), and additional dimensional infor-
mation (bottom). All units are in pm. (http:// www.asylumresearch.com/
olympus/ Olympusmain.asp) . . . . . . . . . . . . . . . . . . . . . . . 114
5-13 Gold is evaporated from the high-current cradle below to cover the
AFM tips overhead. Photo courtesy SurfaceLogix, Inc. . . . . . . . . 116
5-14 Adenine readily adsorbs onto the cantilever as it is soaked in an adenine
solution. The AFM cantilever is placed on a magnetic strip as adenine
adsorbs from solution onto the cantilever tip. . . . . . . . . . . . . . . 118
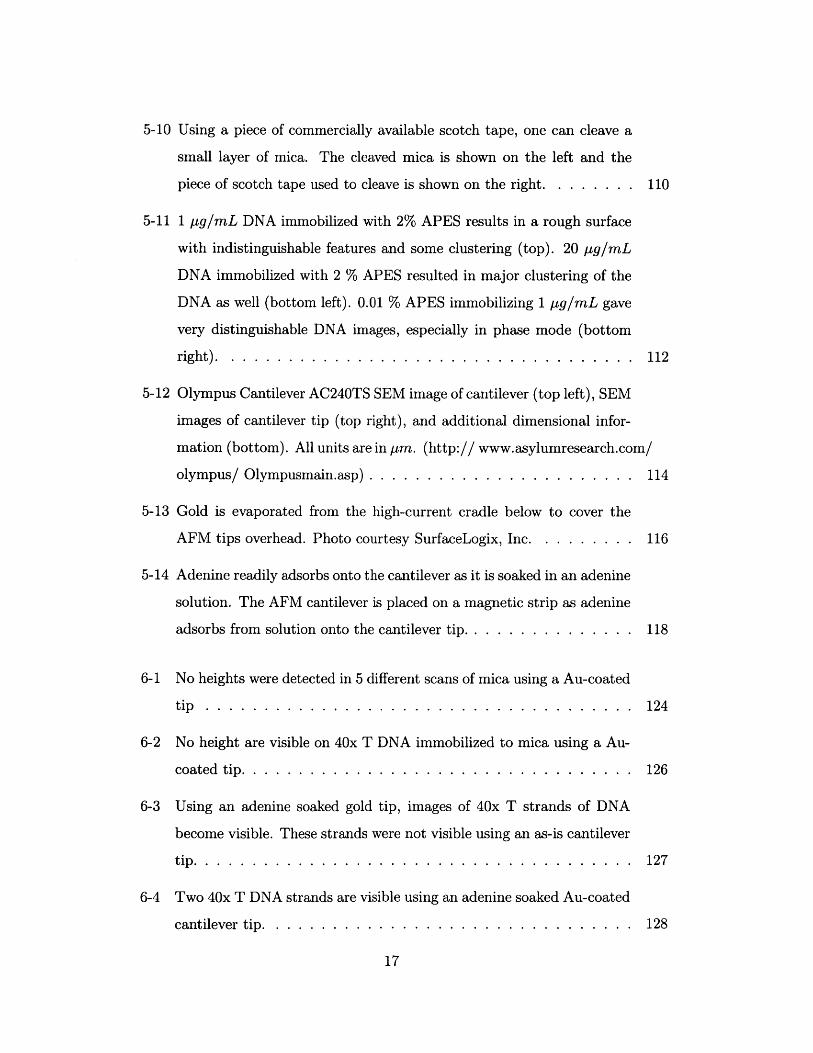
6-1 No heights were detected in 5 different scans of mica using a Au-coated
tip . . . . . . . . . . . . . . . . . . . . . . . . . . . . . . . . . . . . . 124
6-2 No height are visible on 40x T DNA immobilized to mica using a Au-
coated tip. . . . . . . . . . . . . . . . . . . . . . . . . . . . . . . . . . 126
6-3 Using an adenine soaked gold tip, images of 40x T strands of DNA
become visible. These strands were not visible using an as-is cantilever
tip.. . . . ... . ..... .. ... . . .. .. . . . . . . .. . . . . . . . 127
6-4 Two 40x T DNA strands are visible using an adenine soaked Au-coated
cantilever tip. . . . . . . . . . . . . . . . . . . . . . . . . . . . . . . . 128
17

6-5 Single stranded DNA scanned using an as-is AC240TS cantilever. Sin-
gle stranded DNA heights were recorded at the locations indicated with
white numbers. Coiled DNA height information was recorded at the
locations indicated with black numbers. . . . . . . . . . . . . . . . . . 131
6-6 Lambda DNA scanned using an annealed adenine coated cantilever tip
gave large spikes of height. . . . . . . . . . . . . . . . . . . . . . . . . 135
6-7 DNA heights appear much greater when using an adenine tip than
when using an as-is tip . . . . . . . . . . . . . . . . . . . . . . . . . . 137
18
List of Tables
4.1 Different bond strengths in kilo-Joules per mole. It is important to note
that given similar charge, covalent bonds are the strongest followed by
ionic, metallic, hydrogen, and finally Van der Waals bonds. . . . . . . 81
4.2 Model predictions for single stranded and double stranded DNA using
tips with various radii of curvature. All units are in nm. . . . . . . . 89
6.1 Model width prediction for single stranded and double stranded DNA
using as-is cantilevers and adenine-coated cantilever tips. All units are
in n m . . . . . . . . . . . . . . . . . . . . . . . . . . . . . . . . . . . . 122
6.2 Three strands of 40x T imaged using Adenine soaked tips from Fig.
6-3 and Fig. 6-4. All units are in nm. . . . . . . . . . . . . . . . . . . 126
6.3 Top:Experimental single stranded DNA heights as scanned by an as-is
cantilever tip. Bottom: Experimental coiled DNA heights as scanned
by an as-is cantilever tip. Measurements in these tables conform to the
model predictions of height given width with some degree of certainty.
All units are in nm . . . . . . . . . . . . . . . . . . . . . . . . . . . . . 132
6.4 Experimental single stranded DNA heights as scanned by an adenine
coated AC240TS cantilever tip. The top 10 points represent locations
where the tip hybridized with the DNA. The bottom 10 points rep-
resent points where no hybridization occurred. It is clear from these
tables that hybridization events produce unusually large deflections of
the cantilever when compared with non-hybridization events. All units
are in nm . . . . . . . . . . . . . . . . . . . . . . . . . . . . . . . . . . 136
19

20

Chapter 1
Introduction
1.1 Problem Statement:Sequencing
In recent years there has been much interest in genomics and the sciences surrounding
DNA sequencing. Sequencing is the process of determining the exact order of the
chemical building blocks (called bases and abbreviated A, T, C, and G), which make
up DNA. Scientists and researchers have spent much effort characterizing the nature of
DNA, its structure, and its interaction with the outside environment [17]. They have
also found ways to view these nanoscopic molecules using atomic force microscopy and
scanning tunnelling microscopy [24]. And they have found ways of detecting known
strands of DNA molecules using immobilized probes and fluorescence microscopy [28].
They have even begun to test DNA molecules for electrical conductivity in an attempt
to use them as nanowires [11].
1.2 Importance of Personal Genome Scanning
The information contained on these strands of DNA is the key to understanding life,
its limits, and its possibilities. DNA was identified as the template for life in 1953 by
Watson and Crick, and since there have been multiple attempts to develop an efficient
and effective means of sequencing the information contained in the strands of DNA.
Most of these methods are either extremely slow or unrealistic for implementation
21

in the near future. The goal of this thesis is to explore the possibility of sequencing
DNA using an atomic force microscopy based technique coined Genome Scanning.
To date, there have been several smaller genomes have been completed. For
instance, the genomes of bakers' yeast (Saccharomyces cerevisiae), the roundworm
(Caenorhabditis elegans), and the fruit fly (Drosophila melanogaster) have been en-
tirely sequenced. However these genomes are orders of magnitude smaller than the
human genome and require a minute amount of time to sequence in comparison. To
get an idea of how long current sequencing methods take, let us examine the major
attempt thus far to sequence an entire human genome.
The Human Genome Project (HGP), a project funded by the Department of
Energy and the National Institute of Health, is the main attempt to sequence the 3
billion bases that make up human DNA [3]. HGP started officially in 1990 and has
produced a draft of the human genome in 2001. This draft cannot be considered a
finished sequence because of the many inaccuracies inherent in current sequencing
techniques. While the current draft has been scanned 4 to 5 times, HGP standards
require 8 to 9 scans for a finished sequence (also known as "depth of coverage").
Currently, HGP is estimated to conclude in 2003-translating to a project length of 13
years!
A reference sequence, such as the one generated by the HGP, is useful to the gen-
eral public since all humans share the same basic set of genes and genomic regulatory
regions that control the development and maintenance of their biological structures
and processes. However, it is believed that the small variations in the genomes of
every individual underlie the person's susceptibility to disease and his/her drug re-
sponsiveness. If there was a way to sequence the genome of each individual, disease
susceptibilities could be identified early and perhaps treated. Medication could be
tailored to the drug responsiveness of the individual, and health care could become
much more effective as a result.
This vision has received much attention and there are many working on finding a
workable solution. It is clear that the current methods and techniques are unfit for
personal genome sequencing. They simply lack the speed necessary to transform the
22
vision into a reality. For this reason, we present the concept of Genome Scanning.
The main advantage of Genome Scanning is its ability to sequence DNA at a
very rapid pace. While there have been several attempts at sequencing DNA in a
timely fashion, none of them compete with the speed of Genome Scanning. This
speed problem stands in the way of personalized genome sequencing for the masses
and presents a real hurdle to the progress of biotechnology.
Therefore, we have decided to focus this thesis on the feasibility of our novel
method of sequencing DNA: Genome Scanning. The thesis can be considered a proof
of concept with recommendations of further work and research.
1.3 Prior Sequencing Work
There have been many attempts to improve sequencing, either by improving current
methods or by inventing new models of sequencing. To improve current methods, lab
facilities have devised ways to run multiple sequencers in parallel and have devised
optimized running conditions for their equipment. The Whitehead Institute/MIT
Center for Genomics is a great example of this and will be discussed in more detail
in Chapter 3.
Others have also automated the process to eliminate human error and inefficiencies
caused by manual operation. The Stanford Genome Technology Center is expending
much effort devising a scheme for a "1 Mbase a Day" system that will scan 1,000,000
bases every day at a cost of 1 cent per base [1]. Three of the five main instruments
involved in this system have been developed and are supposedly in use.
Yet others have invented new ways of reading the sequence of DNA. One notable
attempt is nanopore sequencing. Nanopore sequencing employs a small electric po-
tential to draw single strands of DNA through a pore of diameter 1.5nm in a lipid
bilayer membrane. Passage of each molecule of DNA is detected by a decrease in ionic
strength whose time duration is proportional to the length of the molecule (the pore
is only wide enough to fit a single strand of DNA)[16]. This technique shows much
promise for DNA sequencing; however, it remains unrealistic for the near future.
23

A second novel approach was tried by scientists at the University of Washington,
Seattle and the Massachusetts Institute of Technology [9]. These scientists used
atomic force microscopy (AFM) to measure the interaction force of complementary
bases of DNA. By coating an AFM tip with one base and allowing it to hybridize with
complementary bases immobilized to a slide they were able to determine the bond
strength between bases. Such a concept has vast potential and can be expanded to
the realm of DNA sequencing.
The reader should now have a general impression of the work being conducted
to improve the process of DNA sequencing. The specific methodologies employed in
DNA sequencing will be discussed in more detail in Chapters 2 and 3.
1.4 Remaining Technical Challenges
Research thus far has focused on optimizing current techniques and on inventing new
ways of sequencing DNA. A method of sequencing using atomic force microscopy
(AFM) has been hinted at, however, no real data on the feasibility of such a method
has been presented. To turn such an AFM-based techniques into a working product,
several technical challenges must be addressed. These challenges are:
" Accuracy and repeatability: Gel and capillary electrophoresis are still the
main methods of sequencing (see Chapter 2 for more information). Both these
methods suffer from low accuracies due to inconsistencies in gel composition and
other factors. Further, we discussed that the HGP requires a depth of coverage
of 9 scans to compensate for the inaccuracies in the sequencing method. Clearly,
accuracy and repeatability need to be addressed.
" Speed: As we have pointed out, current speeds are not conducive to personal
genome sequencing. An improvement of a factor of 2 or 3 is needed to enable
individual genome sequencing. Much has been done to bring current technolo-
gies up to speed, however it is our belief that the current methodologies are
inherently slow and need to be reconsidered.
24
* Cost: The cost of scanning all 3 billion bases which constitute a human genome
can become overwhelming. Even methods such as the "1 Mbase a Day"-with a
cost of 1 cent per base-would amount to millions of dollars per genome. Such
costs are a major hurdle for personalized DNA sequencing to overcome.
This thesis will focus on the challenge of improving sequencing speed. Suggestions
and recommendations will be made at the end of the thesis on how to tackle the other
remaining technical challenges. This new sequencing method will be called "Genome
Scanning" throughout the thesis.
1.5 Genome Scanning
The concerns raised in the previous section point to the need for a speedier method of
DNA sequencing. Genome Scanning is an exemplary means of achieving such speed
in a specialized, nano-scale fashion. This chapter will give the reader a brief glimpse
into the main components of Genome Scanning.
Genome Scanning employs an atomic force microscope to scan the base sequence
contained on a strand of DNA as shown in Fig 1-1. Briefly, an atomic force microscope
(AFM) scans the surface using a cantilever mounted to a piezo stack in the z-axis. As
the cantilever scans the sample surface, it bends and follows the surface topography.
A laser light is reflected off the cantilever and monitored on a split photodiode to
monitor movements of the cantilever. In such a fashion the AFM acts as a nanoscopic
"microscope" and will be used to literally scan over immobilized single-stranded DNA
to reveal the location of each type of base.
Genome Scanning consists of three main components: Immobilized single stranded
DNA, modified sensor tips, and data analysis.
1.5.1 Immobilized ssDNA
The AFM requires a stationary sample that can be probed over and over using a
small contact force. To utilize the AFM for Genome Scanning, single stranded DNA
25

functionalizedcantilever
photo diode
HeNe detectorI aser
immobilizedDNA
Figure 1-1: Genome Scanning uses an atomic force microscope (AFM) to scan immo-bilized DNA. The cantilever deflects in response to base matching events. A photo-diode monitors the movements of the laser beam reflected off the cantilever.
26

(ssDNA) was immobilized on an atomically flat mica surface using APES or divalent
cations as binding agents. In this configuration the single stranded DNA was immo-
bilized with the phosphate backbone on the mica surface and the bases exposed to
the AFM cantilever tip.
1.5.2 Modified Sensor Tip:
To detect a specific base, the cantilever tip was coated with its complimentary base,
which is naturally occurring in DNA. To coat the tips properly, several properties of
the cantilever had to be considered. First, a cantilever with enough sensitivity and
with a small enough radius of curvature of the tip had to be chosen. Secondly, the
tip was coated with a thin layer of titanium and gold, and finally, the cantilever was
coated with the desired base.
1.5.3 Data Analysis:
With a modified sensor tip and properly immobilized ssDNA, Genome Scanning
should be as easy as point and click. Current atomic force microscopes already take
care of much of the data analysis necessary to convert piezo stack displacement and
laser position changes on the photo diode to corresponding topography of the sample.
Further filtering and data analysis will be necessary to make binding events evident
to the user.
At this point, it may be useful to mention how Genome Scanning will take place.
The AFM with modified sensor tip is used to scan the ssDNA immobilized on
the mica surface. The AFM is operated in intermittent contact mode and the bases
on the tip of the cantilever are allowed to come in contact with the ssDNA in brief
spurts. If the bases come in contact with a non-complementary base on the ssDNA,
the resonance amplitude remains undisturbed. However, if the base comes in contact
with a complementary base on the ssDNA, then the two hybridize and a large force is
required to separate them. This creates a large drop in the amplitude of the resonance
and is detectable in the output image.
27

Once the output image is obtained, the magnitude of the damping can be examined
and correlated to the force required to denature the tip bases from the bases on the
ssDNA sample.
1.6 Thesis Outline
As we move forward with this thesis, we'd like to inform the reader of the sequence
of chapters to come.
Thus far we have identified the problem being solved and it's importance. We
then proceeded to introduce the fundamental concept of Genome Scanning. Now,
we will look at some background material on the basics of the DNA molecule, the
fundamentals of sequencing, and the specifics of atomic force microscopy. We will then
briefly examine current sequencing techniques and their implications, including gel
electrophoresis, capillary electrophoresis, membrane filtration, centrifugal filtration,
and mass spectrometry.
In the coming chapters we will analyze two examples from the current state of
the art. We will look at the techniques utilized by the Whitehead Institute-a major
contributor to the Human Genome Project-as well as the techniques being developed
by U.S. Genomics, Inc.-a company attempting to create personalized DNA sequencers.
We will follow this with an in-depth explanation of the fundamentals of Genome
Scanning. Specifically, we will explain its AFM basis, the DNA interaction forces that
make Genome Scanning possible, the physics and mechanics behind Genome Scan-
ning, the main advantages of this method, and the predicted results of the Genome
Scanning proof of concept experiments.
With this understanding of Genome Scanning we will then discuss the experi-
mental setup of the thesis. We will examine the goals of the experiment, the way of
examining those goals, as well as some justification for the experimental procedures.
These will include:
* How atomically flat surfaces for imaging were obtained.
28

" How ssDNA is immobilized with the bases exposed to the cantilever tip.
" How the cantilver tip was modified with the relevant bases.
* Setup of the proof of concept experiment.
The next section will present results of the outlined experiments. This section will
examine the images obtained using regular cantilever tips and base-modified cantilever
tips. We will also analyze the results the results in terms of speed and accuracy.
The final section of this thesis will bring forward conclusions and recommendations
of future work to be conducted on this topic. A short Appendix and Bibliography
will follow.
29

30
Chapter 2
Background
2.1 Introduction
In this section, we will present the reader with the background information necessary
to understand and appreciate Genome Scanning. We will begin with an in depth look
at DNA, its structure, composition, and function. We will then proceed to examine
the two fundamental methods of sequencing DNA: Southern blotting and the Sanger
method. We will also look at the basics of atomic force microscopy and how it applies
to Genome Scanning, and finally we will enumerate the current state of the art in
terms of DNA sequencing.
2.2 DNA
In 1953, J. D. Watson and F. H. C. Crick introduced the world to the replication
mechanism of nature [31]. They proposed a structural model for deoxyribose nucleic
acid (DNA), the template from which all life is perpetuated. This discovery marked
the beginning of human understanding of replication and opened the doors to improv-
ing life as we know it. Today, scientists and researchers are working hard to unlock
the secrets of DNA and to make these available to the public as a means of improving
the quality of life. Hence, it is important to present a brief introduction of the basics
of this molecule as it relates to Genome Scanning.
31

2.2.1 DNA Structure
DNA in nature is composed of a right-handed double helix with anti-parallel chains
as shown in Fig.2-1. This means that one chain runs from the 5'-end to the 3'-end
while the other chain runs from the 3'-end to the 5'-end. 1 DNA can be thought of as
a polymer with monomer units known as nucleotides. Each nucleotide consists of a
5-carbon sugar (deoxyribose), a base attached to the sugar, and a phosphate group.
In its natural form, the phosphate backbone is on the outside of the helix and the
base sequence on the inside.
2.2.2 Bases
Strands of DNA pair up according to complementary bases. There are four different
types of nucleotides found in DNA: Adenine (A), tyrosine (T), guanine (G), and
cytosine (C). Adenine and guanine are purine bases, while thymine and cytosine are
pyrimidine bases. A forms 2 hydrogen bonds with T on the opposite stand and G
forms 3 hydrogen bonds with C on the opposite strand. In such a manner, each helix
of DNA contains two complementary copies of the genetic sequence. Each copy can
be used independently to replicate the other half of the helix.
2.2.3 Helix dimensions
Double stranded DNA helices come in three dominant flavors: alpha, beta, and
gamma helices. Alpha and gamma helices are not typically formed by DNA under
normal pressure and temperature conditions and will not be discussed here. Instead
we will focus on the beta helix of DNA, as it is most likely to form in the experiments
of this thesis.
The beta helix formed by DNA has a characteristic diameter of 2 nm around the
helical axis. Its bases are spaced 0.34 nm apart along the height of the helical axis
as can be seen in Fig.2-3. Typically, the helix undergoes a complete rotation (360
'The notation of 5' and 3' refers to the binding location (also shown in Fig. 2-1) on the sugar
molecule that binds to the next nucleotide.
32

< m
4.1,~
3'- ''
base
phosphate
sugar
Figure 2-1: DNA is made of two anti-parallel chains. The chains contain comple-
mentary sequences. Nucleotides, the repeat unit of DNA, are composed of a phos-
phate group, a deoxyribose sugar, and a base. (http:// medlib.med.utah.edu/ block2/
biochem/ Formosa/ Figures/ Lecturel/ dsDNA.JPG)
33
C
S
-s 5
Ad
N
N
S C C
N c
Adenan
C
CC
0 S
Thww,
L nr-4W1f
Figure 2-2: Hydrogen bonds hold complementary bases together. A forms 2 hydrogen
bonds with T, while C forms 3 hydrogen bonds with G. (http:// www.labbies.com/
DNA.htm)
34
16yW**.
Nc C
cC CN
C C
c0
+..
360deg = one helicalturn
10.5 bp per turn
34.4 deg twist angle(rotation per residue)
/ Groove
Bl
lix Pitch Minor35.7A Groove
- 3.4
HEIIK Dianeter20a
Figure 2-3: DNA naturally forms beta helices when paired into double strands. The
helix undergoes a complete rotation every 10.1 - 10.6 bases. (http:// www.cbs.dtu.dk/
staff/ dave/ Researchi.html)
degrees) every 10.1 - 10.6 base pairs.
2.2.4 Denaturization
By breaking the hydrogen bonds between complementary bases, one can obtain single-
stranded DNA (ssDNA) from double-stranded DNA (dsDNA). Those in the field call
this process denaturization. Most commonly, denaturization is achieved by heating
DNA past its melting temperature for a duration of approximately 10 minutes.
The melting temperature of DNA depends upon the base composition of the
strands. Since G-C bonds have one more hydrogen bond than A-T bonds, strands
with high G-C/A-T ratios require a higher melting temperature to denature. E. Coli,
35
ase Pair tl1 - 6 deg
A Axial Rise
H e

which is about 50 % G-C and 50 % A-T, melts at 72*C. On the other hand, Pseu-
domonas Aeruginosa (another bacteria), which is about 66 % G-C, melts at 79 0C
[19]. Most recommend a dissociation temperature of 85 to 95*C to accommodate a
reasonable safety margin. Once heat is removed from the sample, the DNA strands
will try to rejoin, also known as rehybridization. To avoid rehybridization, the strands
of DNA should be cooled rapidly after the heat source is removed.
2.2.5 Function of DNA
The sequence of these bases determines which amino acid is transcribed and hence
which protein is produced. In this fashion DNA determines the makeup of the body
and its development. Because of its vital function, it is of utmost importance to be
able to "read" the sequence of bases of DNA. This will allow physicians to provide
personalized health care to patients based on their genetic predispositions. Genome
Scanning has immense potential to provide this service to individuals in a timely and
sequence information in a timely and reliable fashion.
2.3 Fundamentals of Sequencing
Sequencing is not a novel process, but rather an improving development over the past
50 years. The two main methods used today can be summarized as Southern Blotting
and the Sanger Method.
2.3.1 Southern Blotting
Southern Blotting is one of the most basic techniques in DNA sequencing. The
protocol for DNA blotting progresses according to the following 7 steps which are
also shown in Fig. 2-4:
1. Extraction: DNA is extracted from parts of the nucleus in a cell. Extraction is
performed either chemically, by using a detergent to "wash" the excess material
36

from the desired DNA, or mechanically, by applying large pressures to the cell
in order to "squeeze out" the desired DNA.
2. Restriction: The DNA strand is cleaved at specific sites using restriction
enzymes. Restriction enzymes cleave by mating with the DNA at a known
sites (for example GCCCT) and cleave the strand directly after that site. This
results in fragments of DNA with differing base lengths, each fragment ending
in the known site (GCCCT for example).
3. Gel Electrophoresis: The fragments are placed in a gel and gel electrophoresis
is performed on the fragments. For short fragments of DNA, scientists use
polyacrimide gels and for longer fragments of DNA agarose gels are typically
employed [22]. As we will describe in section 2.5.1, electrophoresis is the process
by which DNA fragments are sorted according to their base pair length. This
step is used to separate DNA according to length along the direction of applied
voltage. Gel electrophoresis usually runs for a duration of 45 minutes to 1 hour.
4. Denaturization: DNA is denatured (dsDNA converted to ssDNA) while it is
still in the agarose gel by adding 0.5M NaOH or similar solutions.
5. Transfer: ssDNA must now be transferred to solid surface without losing po-
sitional information. This is done by placing a nitrocellulose sheet (or any
positively charged surface) on top of the gel. The negatively charged backbones
of the DNA fragments are attracted to this surface and transfer out of the gel
and onto the nitrocellulose sheet. This step is called "blotting" the DNA. Blot-
ting works by capillary action, which is somewhat of a detriment as it requires
several hours to complete.
6. Hybridization: Up to this point, the DNA is still invisible to the naked eye.
In order to visualize the bands, a fluorescent marker must be added to each
strand. These markers hybridize to the DNA and allow the scientists to locate
the bands using ultraviolet light.
37
7. UV Irradiation: The Nitrocellulose sheet can now be placed under a UV
source and the location of the fluorescent probes along the sheet can be analyzed.
The method of Southern Blotting works according to these 7 steps. A similar
procedure, called Northern Blotting, is used to sequence messenger mRNA.
These seven steps do not, however, result in a blueprint of the base pair sequence
contained in the DNA. They only give relative location information about the specific
binding site of the restriction enzyme. To identify the sequence on the DNA, numerous
southern blots must be performed using different restriction enzymes and the results
must be overlaid much like a puzzle is put together. Clearly, this task is quite time
consuming and can be drastically improved using Genome Scanning.
There have also been several noteworthy improvements to the process of Southern
Blotting.
Scientists have searched for better ways to "blot" DNA to a sheet for analysis.
Most of the scientific community has moved away from nitrocellulose sheets in favor
of nylon. The binding capacity of nitrocellulose is 100 pg/cm2 , while nylon has a
binding capacity of 500 pg/cm2 [23]. This means that more DNA material can be
"blotted" using nylon.
Further, scientists have found ways to eliminate the step of transferring DNA from
the gel to nitrocellulose/nylon sheets. Many now resort to fluorescent stains/dyes that
can be applied to the DNA before it is run through the gel. The entire gel is then
irradiated with an ultraviolet light and the results recorded using digital photography.
Common staining materials include Ethidium Bromide and SYBR Green.
Finally, our laboratory has been working on eliminating the need for the toxic
dyes, which are added to DNA for visualization purposes. We have been successful
at detecting trace amounts of unmarked DNA down to picogram levels with the use
of a CCD camera and a novel data analysis algorithm [15].
38

009
ag
h~9 a
a t
6'
ii, iiiii
II liii III
"iiW)0 0
Figure 2-4: Southern blotting can be extremely tedious and time consuming. South-ern blotting starts with gel electrophoresis. The sorted fragments are then blottedonto a sheet and fluorescent probes are added to the fragments. Information on thebase length of the DNA fragments can then be extracted from the sheet (modifiedfrom http:// www.accessexcellence.org/ AB/ GG/ southBlotg.html).
39
0
iiII
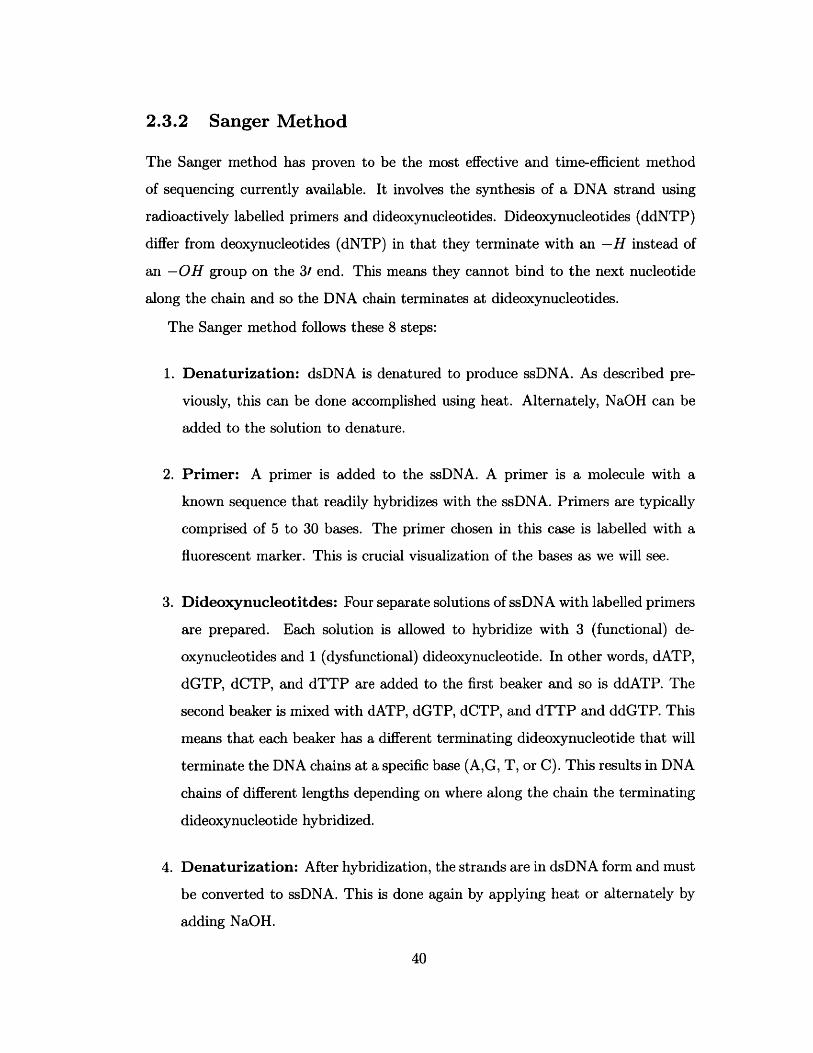
2.3.2 Sanger Method
The Sanger method has proven to be the most effective and time-efficient method
of sequencing currently available. It involves the synthesis of a DNA strand using
radioactively labelled primers and dideoxynucleotides. Dideoxynucleotides (ddNTP)
differ from deoxynucleotides (dNTP) in that they terminate with an -H instead of
an -OH group on the 3/ end. This means they cannot bind to the next nucleotide
along the chain and so the DNA chain terminates at dideoxynucleotides.
The Sanger method follows these 8 steps:
1. Denaturization: dsDNA is denatured to produce ssDNA. As described pre-
viously, this can be done accomplished using heat. Alternately, NaOH can be
added to the solution to denature.
2. Primer: A primer is added to the ssDNA. A primer is a molecule with a
known sequence that readily hybridizes with the ssDNA. Primers are typically
comprised of 5 to 30 bases. The primer chosen in this case is labelled with a
fluorescent marker. This is crucial visualization of the bases as we will see.
3. Dideoxynucleotitdes: Four separate solutions of ssDNA with labelled primers
are prepared. Each solution is allowed to hybridize with 3 (functional) de-
oxynucleotides and 1 (dysfunctional) dideoxynucleotide. In other words, dATP,
dGTP, dCTP, and dTTP are added to the first beaker and so is ddATP. The
second beaker is mixed with dATP, dGTP, dCTP, and dTTP and ddGTP. This
means that each beaker has a different terminating dideoxynucleotide that will
terminate the DNA chains at a specific base (A,G, T, or C). This results in DNA
chains of different lengths depending on where along the chain the terminating
dideoxynucleotide hybridized.
4. Denaturization: After hybridization, the strands are in dsDNA form and must
be converted to ssDNA. This is done again by applying heat or alternately by
adding NaOH.
40

= -- -BASE
HIH
dideoxg nucleotide
DNA
I I I I I I I I I I I I I I I I I IAATCTGGGCTACTCGGGCGT
DNA POLYMERASE+ 4dNTP+ ddATP
I II
C A
II60AGCC GCGT
8
11ATGAGCC
I I I I I I IGCGT
I I I I
ACCCGATGAGCC16 1 1 1 1 1 1 1 1 1 1 1
AGACCCGATGAGCC18 1 1 1 1 1 1 1 1 1 1 1 1 1 1
GCGT
GCGTI I I I -
Figure 2-5: ddNTPs are added to dNTPs so newly-formed DNA chains will ter-minate at a known base. In the figure, ddATPs are added to the DNA strands.The first strand terminates in a ddATP and is 8 bases long. The second strandhybridizes with dATP at the 8th base position, then hybridizes with a ddATP atthe 11th base position, resulting in an overall length of 11 bases. Other iterationsare also shown. (http:// www.blc.arizona.edu/ INTERACTIVE/ recombinant3.dna/Sequencing.html)
41
5. 3.
LABELEDPRIMER
W

DNA
AATCTGGGCTACTCGGGCGTCGCA
DNA POLYMERASE I+ 4dNTP
ddATP ddTTP ddCTP ddGTP
TTA
--- GACCC
--- GATGAGCCC
A
Figure 2-6: DNA sequence can be read directly from a gel after running the Sanger
method. The sequence corresponding to the bands shown is spelled out to the right
of the gel. This sequence is the complement of the DNA strand sequence (shown
above the gel). (http:// www.blc.arizona.edu/ INTERACTIVE/ recombinant3.dna/
Sequencing.html)
5. Gel Electrophoresis: The ssDNA strands are subjected to gel electrophoresis
similar to the case of southern blotting. In the Sangar method however, 4 lanes
are created, one per beaker, with each beaker containing one kind of ddNTP.
As will be explained later, gel electrophoresis is the process by which DNA
fragments are sorted according to length. This process can take up to 2 hours.
6. Irradiation: After the gel has run for some time, it is subjected to ultraviolet
radiation, which illuminates the location of the bands of DNA along the length
of the gel as shown in Fig.2-6. By simply following the location of the bands,
one can literally "read" the sequence of DNA as spelled out on the gel.
42
HeNe laser
piezo stack photodiode
cantilever tip
cantilever
sample
Figure 2-7: An AFM uses a microscopic cantilever to scan the surface of a sample. AHeNe laser is reflected off the back of the cantilever at a split photodiode. Deflectionof the cantilever results in movement of the laser beam on the photodiode, which iscorrelated to height information.
2.4 Atomic Force Microscopy
Atomic Force Microscopy has enabled scientists and researchers to visualize cells,
molecules, even atoms. The atomic force microscope uses physical contact to produce
an image of a sample with atomic resolution. Several manufacturers, such as Quesant
Instruments, Inc. and Digital Instruments, Inc. have emerged as leaders in the
production of precision atomic force microscopes (AFMs). The instrument used in
this thesis is the Quesant Q-Scope Version 3.20. 2 The following descriptions will
pertain mainly to this AFM model.
A schematic of an atomic force microscope is shown in Fig. 2-7. An AFM mon-
itors the deflection of a micron-scale cantilever as this cantilever scans the surface
of a sample. The contact point occurs between the sharpened tip at the end of the
cantilever and the sample surface. A HeNe laser is reflected off the top surface of the
cantilever and captured on a split photo detector.
The movement of the cantilever as it scans the surface of the sample is determined
43
2All Vendors are listed in Appendix C.

by recording the intensity and the location of the reflected laser beam on the photo
detector. In such a manner the photo diode acts as a sensor of the cantilever's vertical
deflection.
The fixed end of the cantilever is anchored to a piezo stack, which adjusts the
height of the cantilever according to feedback obtained from the control system. The
piezo's function is to compensate for any deflection of the cantilever due to height
features on the sample. The piezo attempts to maintain the cantilever at a constant
deflection, which, in this case, equates to a constant force on the sample.
It is important to note that the cantilever is stationary in the horizontal plane
as the sample, which is placed on a mobile carriage, is translated in both horizontal
directions.
In this fashion, one can obtain an image of the sample surface with an accuracy
of less than 1A in the vertical direction.
2.4.1 Cantilever and Tip
Depending on the application, cantilevers and tips come in many varieties. The
cantilever extends about 150pm and determines to a large extent the sensitivity of
the probe. The longer the cantilever, the less stiff it is and the more sensitive to
fluctuations of the sample surface. The stiffness (k) depends on the length of the
cantilever (1), elasticity of the material (E), and the rectangular moment of inertia
(I) [8]. The stiffness relates deflection of the cantilever (d) to the load exerted on the
cantilever (w) according to the relation
w = kd (2.1)
where
k = . (2.2)3EI
Commercially available tips have k constants between 0.06N/m and 50N/m. Con-
tact mode imaging requires more sensitive tips than those typically used for intermit-
tent contact mode. Modes of scanning will be discussed in more detail shortly. Also,
44
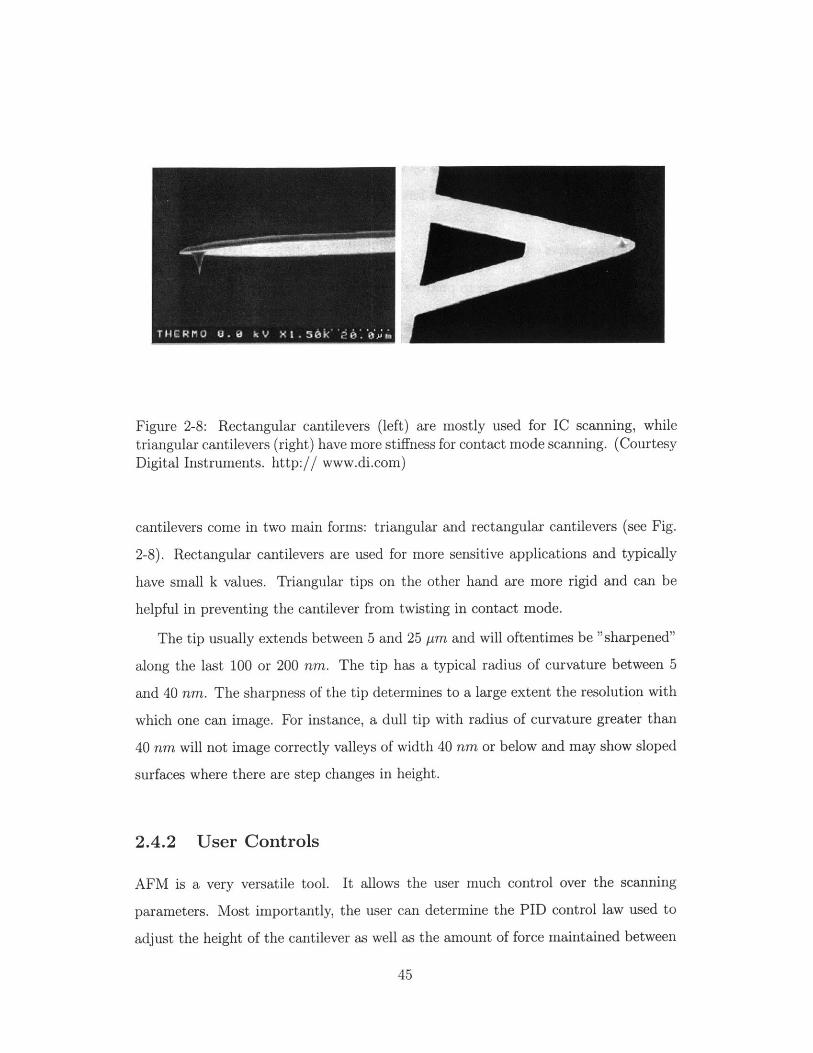
Figure 2-8: Rectangular cantilevers (left) are mostly used for IC scanning, while
triangular cantilevers (right) have more stiffness for contact mode scanning. (Courtesy
Digital Instruments. http:// www.di.com)
cantilevers come in two main forms: triangular and rectangular cantilevers (see Fig.
2-8). Rectangular cantilevers are used for more sensitive applications and typically
have small k values. Triangular tips on the other hand are more rigid and can be
helpful in preventing the cantilever from twisting in contact mode.
The tip usually extends between 5 and 25 pm and will oftentimes be "sharpened"
along the last 100 or 200 nm. The tip has a typical radius of curvature between 5
and 40 nm. The sharpness of the tip determines to a large extent the resolution with
which one can image. For instance, a dull tip with radius of curvature greater than
40 nm will not image correctly valleys of width 40 nm or below and may show sloped
surfaces where there are step changes in height.
2.4.2 User Controls
AFM is a very versatile tool. It allows the user much control over the scanning
parameters. Most importantly, the user can determine the PID control law used to
adjust the height of the cantilever as well as the amount of force maintained between
45

the cantilever tip and the sample. The PID control law determines how the piezo stack
reacts to height information gathered by the split photodiode. At the same time, the
setpoint offset determines how much force is maintained between the cantilever tip
and the sample.
The parameters one can alter are
" Scan Size: size of image to produce (up to 43pm)
* Scan rate: speed of scan in lines/second.
" Setpoint offset: contact force between the cantilever and the sample being im-
aged
* Scan direction: scan angle in the horizontal plane
* PID gains: gains used to control piezo position in response to photo diode
output.
" Scan resolution: samples per line to be recorded.
" Image mode: contact, non-contact and other modes (to be discussed shortly)
* Z Range: sensitivity of the piezo stack in the horizontal direction
The user is also able to monitor the location of maximum laser intensity on the
photo diode. This is important in calibrating the AFM and can be optimally posi-
tioned using the interface shown in Fig. 2-9.
In intermittent contact mode, the user can also control the cantilever's oscillation
frequency (Fig. 2-10) and the damping percentage of that oscillation by adjusting
the setpoint offset.
2.4.3 Contact Mode
Height Imaging
In contact mode, A piezo stack maintains a constant deflection on the cantilever as the
AFM head scans the sample surface. Constant deflection of the cantilever correlates
46

Sum Signal 7672 intennity
100
10 V 100X POWER
Figure 2-9: The position of the laser on the photo diode can be monitored andoptimized through this user interface.
47

WaveMode SignalAmp. Peyovel *wod peok: 6 kz
Peak found at: 37.06 kHzSelected: 32.94 kHz
Sweeping how:32 kHz to 41 kHz
Peak Selection --
0~ Solect
Oii
1.06V 32 33 34 35 36 37 38 39 40 41
Scale in kHz
Figure 2-10: In intermittent contact mode, the cantilever is excited at frequencies
ranging from 32 dHz to 41 dHz. At 37 kHz the cantilever is seen to resonate. This
frequency will be used to oscillate the cantilever in resonance as it scans the sample
surface.
here to a constant-force scan. Typically, as the cantilever deflects due to a height
change along the surface, the piezo stack contracts to compensate for the change in
deflection of the cantilever. The piezo stack continues to contract until the cantilever
deflection is restored to its original value. This contraction occurs according to a PID
control law defined by the user. Height information is extracted by monitoring the
voltage delivered to the piezo stack. A contact mode image of a calibration grating
is shown below. The sample was a step grating (TGZO1) with period 3 pm and peak
height 26 nm.
Lateral Force Mode
The AFM can also be operated in lateral force mode while in contact. Lateral force
mode records the twist of the cantilever torsionally as it scans the sample. Lateral
force information can be very useful in identifying contaminants and sharp features
in the sample. The basic operation of the AFM is the same as in contact mode, but
48

Figure 2-11: Contact mode imaging of a periodic rectangular grating. The AFM
produces accurate height information of the relatively large features of the grating.
49

the information recorded is the side-to-side movement of the laser beam on the photo
detector [20].
2.4.4 Intermittent Contact Mode
Contact mode is a valuable tool for detecting surface topography of solid samples,
but it can be harmful to soft biological samples, which may rupture or deform under
load. To reduce wear and tear on biological samples, most researchers use the AFM
in intermittent-contact mode (IC).
IC Height Mode
We have seen that in contact mode, the cantilever maintains a constant deflection
against the sample surface. IC mode is somewhat different as the cantilever is vi-
brated near its resonant frequency. This resonant frequency ranges from 10-400 kHz.
As the vibrating cantilever nears the sample surface, weak Van der Waals forces and
other surface forces dampen the amplitude of the cantilever's resonance. The res-
onance amplitude can be monitored using the photo detector and the piezo stack
again compensates for the change in damping. In such a fashion, an image of the
surface -based on resonant amplitude damping - is generated and displayed. As in
contact mode, the dynamics of the piezo stack compensation are regulated through
a user-defined PID controller. Fig. 2-12 shows one example of an pyramidal grating
imaged using IC height mode.
IC height imaging only imposes gentle contact on the surface sample and does not
expose the sample to large lateral forces due to "dragging" of the tip over the surface.
This makes IC height mode a strong candidate for the imaging of soft biological
samples.
It is also claimed in the literature that IC mode produces better imaging results
with fewer distortions.
50

Figure 2-12: IC height mode image of a pyramidal grating. More detail of the grating
surface is apparent in IC mode imaging than in contact mode imaging.
51

IC Phase Imaging
An alternate to IC height imaging is IC phase imaging. This mode of imaging also uses
a vibrating cantilever, but monitors phase shifts of the resonant peak as opposed to
amplitude damping. As the phase of the cantilever changes, the piezo stack adjusts
to compensate for the shift in phase. Phase shift has been particularly useful in
identifying contaminants along the surface. Fig. 2-13 shows a standard grating
imaged using IC phase mode.
As mentioned IC phase imaging is excellent for detecting contaminants on a surface
and so one sees major changes in the gaps between the grating heights. The scale
generated by the AFM is in "AU" or artificial units which have no physical backing.
Phase information depends highly on the type of tip and the type of material being
scanned. For this reason, height scaling is unreliable in phase mode.
2.5 Current State of the Art
Current techniques of DNA sequencing include gel electrophoresis, capillary elec-
trophoresis, membrane filtration, centrifugal filtration, and mass spectrometry. Of
these techniques, the most widely used is simple gel electrophoresis. Newer tech-
niques, such as capillary electrophoresis, are slowly finding their way into common
practice but gel electrophoresis remains at the forefront.
2.5.1 Gel Electrophoresis
Gel Electrophoresis is a technique used to separate fragments of DNA by physical size.
Several methodologies exist, but all involve the fragmentation of DNA along known
sequences. In one protocol, restriction enzymes are injected into a solution of DNA
and are allowed to cleave the strand of DNA at specific sites with known sequences.
In another, terminating bases are used to restrict the length of DNA fragments. The
fragments from either technique are placed in a gel, typically embodied in a slab of
agarose, and a biasing voltage is applied along the length of the gel (as in Fig. 2-14.
52
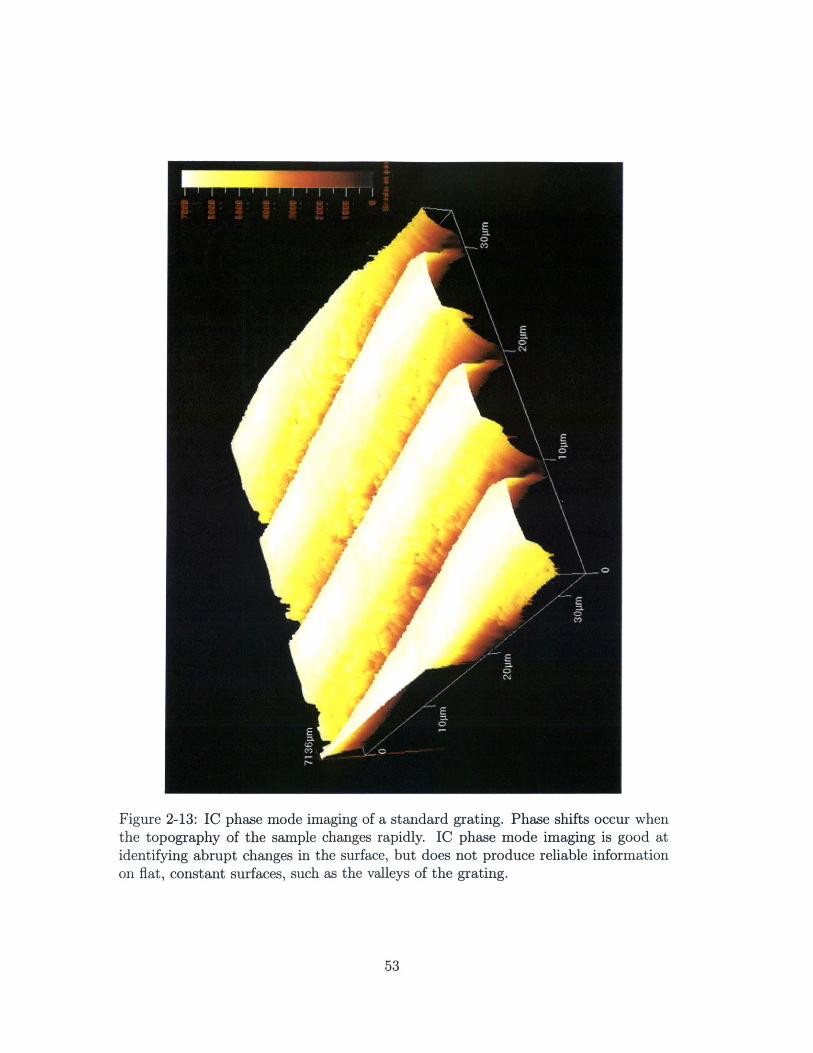
Figure 2-13: IC phase mode imaging of a standard grating. Phase shifts occur whenthe topography of the sample changes rapidly. IC phase mode imaging is good atidentifying abrupt changes in the surface, but does not produce reliable informationon flat, constant surfaces, such as the valleys of the grating.
53
direction of travelagarose
U 000~)- 0
0 0 UJnCbtDNA,
Figure 2-14: Wells in an agarose gel are injected with DNA fragments. A bias voltageis applied causing the fragments to travel towards the (positive) anode. Due to theresistance of the agarose molecules, smaller DNA fragments travel farther along thegel than larger ones.
The negatively charged phosphate groups that make up the backbone of DNA cause
the fragments to move towards the (positive) anode. As the DNA moves towards the
anode, it meets with resistance from the porous agarose gel. Longer fragments have
a tougher time making their way through the gel, while shorter fragments slip by the
small pores in the gel.
In this way, shorter fragments are separated from longer fragments and the end
result is a gel with distinct bands of fragments, as shown in Fig. 2-15. Comparing the
position of these bands to the position of bands from known DNA fragments (called
"markers"), one can determine the base length of the individual bands of DNA.
Unfortunately, one problem remains. Since the DNA is invisible to the naked eye,
it is necessary to dye the DNA fragments with fluorescent markers that will appear
54

Figure 2-15: Bright bands in the gel (as a results of gel electrophoresis) mark thelocation of DNA fragments. The direction of electrophoresis in the vertical directionfrom the top to the bottom, resulting in 9 separate lanes of DNA fragments. Theright most lane, lane 9, shows the location of markers with known base lengths,which are written next to the lane. (http:// www.cdc.gov/ ncidod/ eid/ vol8no5/01-0373-G.htm)
55

when exposed to ultraviolet light. This adds another time-consuming step to the
sequencing process and puts the scientist at a disadvantage, as these markers are
often toxic.
2.5.2 Capillary Electrophoresis
Capillary electrophoresis is a common method for separating particles based on charge
or polarity. A solution with particles of different charge and/or polarity is placed in
a thin, long capillary. As shown in Fig. 2-16, two buffers are used at either end of
the capillary to produce an electric field on the particles in the solution. As a result,
particles with a higher negative charge move faster towards the positive anode than
particles with low negative charges or particles with positive charges. A light source
and an opposing photoreceptor are placed along the capillary to record the amount
of material that passes by the photoreceptor over time. Since the travel time along
the capillary is directly related to the charge of the particle, one can estimate the
quantity of particles with any given charge.
This technique is quite impressive as it gives quality as well as quantity informa-
tion. However, capillary electrophoresis is not entirely accurate and, being a non-
autonomous system, can result at times in misleading information.
2.5.3 Membrane Filtration
This method, shown in Fig. 2-17, uses a physical membrane with pores of known
diameter (in terms of mean and standard deviation) to separate particles of different
sizes. As solution flows through the filter, particles smaller than the pore size make
it past the filter, while larger particles are trapped behind the membrane. Membrane
filters fall into two categories: screen filters and depth filters. A screen filter retains
particles on its surface while depth filters retain particles throughout the depth of the
filter. Screen filters are composed either of porous materials with controlled pore sizes
or of a composite of fibers that intersect in a pattern with a controlled interstitial
gap size. The former are called closed cellular filters, while the latter are called open
56

direction of travel
capilla
D
photodetectorry
Figure 2-16: In capillary electrophoresis, an electric field is created causing highlynegative ions to travel faster along the capillary than other particles. The passage of
ions over time is recorded using a laser and an opposing photoreceptor.
57
Ulaser

li-
Figure 2-17: Membrane filters are used to separate particles greater than a thresholdvalue from particles smaller than that value. Two screen filters are shown, and parti-cles are shown trapped on the filter surface on the left. (http:// www.millipore.com/)
cellular filters [2].
This process is further improved by providing a biasing pressure across the mem-
brane. Typical pressures are on the order of 10 psi and dramatically increase the flow
rate of particles through the filter.
This is a simple and effective concept in particle separation. Its main advantage
lies in the fact that large flow rates of approximately 150 mL/miri are achievable
with such filters. Actual filtration can reach maximums of nearly 0.15 ml flow/mmn
for every cm 3 of filter material [2].
The reason membrane filters are not used to separate fragments of DNA lies in
the fact that pore cannot be manufactured reliable with radii less than 25 to 50 rnm.
Clearly, such pore sizes would not allow for direct filtration of DNA fragments smaller
than 125 bp and so fragments smaller than 125 bases could not be identified. Another
disadvantage to this method as applied to the separation of DNA fragments is the
fact that each membrane can only distinguish between two particles sizes; one larger
than the pore size and one smaller. This does not lend itself well to the differentiation
between fragments of all sizes. Instead, one would be required to place many filters
58
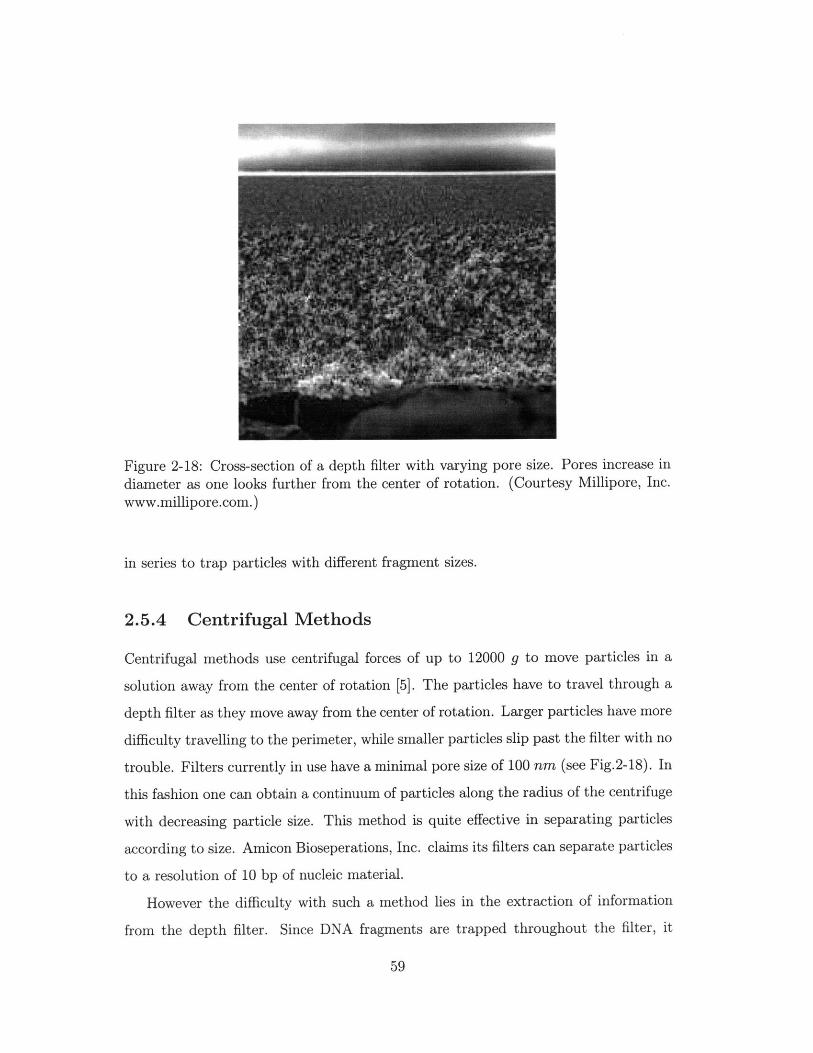
Figure 2-18: Cross-section of a depth filter with varying pore size. Pores increase in
diameter as one looks further from the center of rotation. (Courtesy Millipore, Inc.
www.millipore.com.)
in series to trap particles with different fragment sizes.
2.5.4 Centrifugal Methods
Centrifugal methods use centrifugal forces of up to 12000 g to move particles in a
solution away from the center of rotation [5]. The particles have to travel through a
depth filter as they move away from the center of rotation. Larger particles have more
difficulty travelling to the perimeter, while smaller particles slip past the filter with no
trouble. Filters currently in use have a minimal pore size of 100 nm (see Fig.2-18). In
this fashion one can obtain a continuum of particles along the radius of the centrifuge
with decreasing particle size. This method is quite effective in separating particles
according to size. Amicon Bioseperations, Inc. claims its filters can separate particles
to a resolution of 10 bp of nucleic material.
However the difficulty with such a method lies in the extraction of information
from the depth filter. Since DNA fragments are trapped throughout the filter, it
59
becomes very difficult to locate the DNA fragments and even more difficult to quantify
the amount retained.
2.5.5 Mass Spectrometry
Mass Spectrometry is a process used to measure the mass of particles that have been
converted into ions (ie have been electrically charged). A mass spectrometer does
not measure the mass of the particles directly, rather it measures the mass to charge
ratio of the ions. As the particles being examined are of micrometer size, the mass
spectrometer analyzes them in units of Daltons per fundamental units of charge [4].
Daltons (Da) are defined as 1/12 th the weight of a Carbon-12 atom and fundamental
units of charge are defined as the charge of an electron. The components of a mass
spectrometer are outlined in Fig. 2-19.
The sample is introduced at the inlet in the form of a solution embedded in a
solid, in its liquid form, or in a gaseous form. The source charges the sample and
transforms it into an ionized gas. This ionized gas enters the analyzer, where it is
sorted according to charge and charge to mass ratio. The sorted ions are then detected
in the ion detector and the data is analyzed using a complex data system.
There are many techniques used at the "source" to generate gaseous ions. These
include fast-ion-bombardment, second-ion MS, plasma desorption, laser desorption/ionization,
field desorption, and electrospray ionization [4].
The exact methodology of mass analysis is beyond the scope of this thesis. It
suffices for the reader to understand that such devices exist and can be used for the
sorting of nucleotides.
The data output of a mass spectrometer comes in the form of relative intensity
(in percentages) versus mass to charge ratio. Frequently, the charge of the particles
is held at unity, and so the mass to charge ratio can be thought of as the mass in
Da. The ions that form in mass spectrometry consist of either the entire molecule
or fragments thereof. Hence, one expects to see a large intensity of particles with
the total mass of the molecule and smaller spikes of intensity at fragments of the
molecule. For instance, Fig.2-20 shows the mass spectrograph of carbon dioxide CO 2
60

ISource'
sampie
> Analyzer
9 aeous om
01,
>/ Ion Detector
77
Figure 2-19: The source of a mass spectrometer converts a sample into a state of
gaseous ions. The analyzer sorts these ions by mass to charge ratio and the detector
determines the quantity present of each ion.
61
massdataoutput

CO 2 * 1M*144
too
0
z 70w
- 01- 40Z
C+ 00 co+12 2
0 1 - "Ionly 5 10 Is 2 5 30 35 40 45 so
Figure 2-20: Mass Spectrometry results in the identification of the desired molecule
and fragments thereof. The mass spectrum shown is of carbon dioxide. Since the
CO 2 particles are fragmented, one can see a spike at 0+ (16 Da), C+ (12 Da), and
CO+ (28 Da) weights. [4]
as given in the literature. One can easily reconstruct the composition of this molecule
from the graph knowing that carbon has a mass of 12 Da and that oxygen has a mass
of 16 Da.
Mass spectrometry is wonderful for analyzing solutions at the molecular level.
However, this technique encounters certain difficulty when used to analyze DNA
fragments. As has been mentioned, mass spectrometry requires a sample in gas form.
To obtain this gaseous state, particles are burst apart until they achieve the required
size. In the process, DNA fragments would be unintentionally fragmented into smaller
and smaller molecules. As a result, it would prove difficult, if not impossible, to
distinguish between fragment sizes (masses) due to intended restriction of DNA and
fragment sizes due to unintentional evaporation fragmentation. Genome Scanning
does not encounter such difficulty.
62

2.6 Summary
We have presented the reader with much of the background information needed to
understand the process of Genome Scanning. We have looked closely at the struc-
ture, composition, and function of DNA and we have examined the two fundamental
methods of DNA sequencing: Southern blotting and the Sanger method. We have
also looked at the basics of atomic force microscopy and how it applies to Genome
Scanning. And lastly we have examined the many techniques currently used for
DNA sequencing, including gel and capillary electrophoresis, membrane and centrifu-
gal filtration, and mass spectrometry. In the coming section we will examine two
institutions which make use of these and other techniques.
63

64
Chapter 3
Competing Concepts
3.1 Introduction
Before we examine Genome Scanning in detail, it would be helpful to gain an under-
standing of the current models being pursued by industry. We will examine here 2
models, which seem to hold a position at the forefront of the field. The first model is
the Whitehead Institute/MIT Center for Genome Research, which has been instru-
mental in moving the HGP towards completion. We will also look at U.S.Genomics,
which has been designing and developing personal genome sequencers and hopes to
be the first to produce such a product. The processes employed by these two facilities
are worth understanding to gain a better idea of the potential of Genome Scanning.
3.2 Whitehead Institute/ MIT Center for Genome
Research
The Whitehead's Institute Center for Genome Research (WICGR) is the world's
largest public sequencing facility and has contributed over 1/3 the content of the hu-
man genome. WICGR uses a simple algorithm for sequencing of the human genome.
The first step of sequencing is a time-intensive process of purifying human DNA
from E.Coli cells used to make multiple copies of the nucleic material. After purifi-
65

Figure 3-1: Resources at WICGR are plentiful. This photograph shows the custombuilt sequencing machines used by WICGR to sequence human DNA for the HumanGenome Project(http:// www.wi.mit.edu/ Genome/ gcphotos.html).
cation, DNA undergoes the Sanger method described in Section 2.3.2 above.
The Sanger method, which uses a fluorescently labelled primer to replicate strands
of DNA, is outline in Fig. 3-2. During replication, some of the bases are altered so
they become terminator bases. This produces fragments of DNA that terminate
in a known base (A, C, T, or G). The fragments are injected into an agarose gel
and exposed to a bias voltage where they sort according to fragment length. The
DNA sequence is then read directly from the agarose gel by exciting the fluorescently
labelled primers.
The interesting part of the WICGR's process is the sequencers they have designed
in house. These sequencers consist of a large glass plate with micro-machined channels
for gel electrophoresis (see Fig.3-3).
Each glass plate is roughly 3' x 6' large with a thickness of 1". Each glass
sheet houses 384 wells that are used for electrophoresis. Each well is nearly 4' long,
optimized to accommodate sequencing of the maximum number of bases without
losing accuracy. The wells are loaded with agarose gel material, then DNA is injected
at one end into the gel and allowed to migrate towards the other end. Each well is
66

Strand to be sequenced
Prime( twrepticallon
Prepare tour reactlon mixtures.include in each a different
Pdrmed DNA replIcabo-topping nucleogde
TA
C
PrimerfAplicanonproducts ofC" reaction
Read sequence ascomplement of bands
contaling labeled strands
AC
T A
A
Figure 3-2: Sanger method as employed by the Whitehead Institute/MIT Center forGenome Research. The Sanger method uses chemically tagged bases to sequenceDNA. After electrophoresis, one can read the DNA sequence directly from the gel.(Courtesy WICGR http:// www-genome. wi. mit. edu/)
67
Separateproducts bygel electropboresis

injection points
scanninflourescdetectc
gencer
±9
Figure 3-3: Schematic representation of custom-build sequencers employed by
WICGR. This glass plate contains 384 wells that are used in parallel to perform
gel electrophoresis in micro-machined capillaries.
roughly 150 pm wide and is machined in the form of a hemisphere with its flat edge
facing downwards.
The gels are run for approximately 40 to 60 minutes at a voltage differential of
7.5 kV. After the DNA fragments separate according to size along the length of the
wells. After each run, a fluorescence detector scans the glass surface and outputs a
graph of the sequence of bases.
Each well results in the identification of approximately 800 bases per run. The
entire process has a margin of error of roughly 2 %. This translates to a maximum
speed of 16 bases/minute for each lane. The fact that 384 wells are running at
the same time does not influence our comparisons since other devices can be run in
parallel as well. Genome Scanning has the potential to far outperform this device.
68
4' well
--- I 384 wells/glass plate
7,500 V differential
ADN

3.3 U.S. Genomics
U.S. Genomics, Inc. was founded by Eugene Chen with the long-term goal of se-
quencing an entire human genome in 45 minutes for less than $1000 [25]. The current
project, called Gene Engine, is supposedly 4 to 5 years away from nearing reality and
has drawn much attention from the experts. The sequencing technique used by U.S.
Genomics is very similar to capillary electrophoresis and can be explained as follows:
1. Isolation: DNA is isolated from a blood sample. This is perhaps the longest
step taking 1-2 days to complete.
2. Labelling: Using common fluorescent dyes, each base is labelled with a certain
color tag to distinguish them in the final analysis. It takes 5-30 minutes to add
the labelled nucleotides, allow them to incubate, then rinse off excess unbound
nucleotides.
3. Processing: The sample undergoes several other processing stages which can
take from 1 to 5 hours
4. Deposition: The drop of the sample is deposited onto a silicon chip with micro
fabricated wells. The strands of DNA wick into the wells by mere capillary
action.
5. Uncoiling: The first stage along each well is shaped like a funnel with posts
throughout. The posts, each 100 nm in diameter, act as a grid which DNA
must untangle to traverse (see Fig.3-4). The strand of DNA leaves the funnel
in the form of a linear chain.
6. Imaging: The second stage of the 600 nm wide wells is where the information
is extracted. Two laser beams shine on the well, and directly below a detector
reads the fluorescence emitted by the tagged DNA. A set of mirrors focuses the
beams onto the wells.
7. DNA translation: Once the lasers are locked on the wells, fluid pressure pushes
the DNA through the chip. The first laser is used to read a special set of tags on
69

* REGION OF CONSTANT X-DIRECTION SHEAR TO MAINTAINTHE POLYMER IN EXTENDED CONFORMATION AFTER RElEASEFROM THE POSTS- DISTANCE FROM END OF POST FIELD TO REGION OFEXCITATION 1-3mm
I50 MICRONS 0000080808
- POSTS 1.5 MICRONS PITCH. 0.5 MICRONS GAPBETWEEN POSTS- STAGGERED POST ARRANGEMENT- 12-15 ROWS OF POSTS
REGION OF EXCITATION
US 6,263,286 Bi
Figure 3-4: Structure of funnel posts employed by US Genomics to untangle strands
of DNA. As DNA traverses the funnel, the physical contact with posts forces it to
untangle and unwind. At the end of the funnel, DNA is in a straight linear form.
Digital Image (top) [25] and US Patent 6,263,286 (bottom) [13].
70

Figure 3-5: A set of lasers and detectors reads the fluorescent bases as DNA passes by.The first laser reads positional information from the backbone of the DNA molecule,while the second laser reads the sequence from the strand of DNA [25].
71

the backbone of the DNA. This gives the GeneEngine information on the length
of fragment being sequenced. The second laser reads the individual probe tags
and gives information on the specific sequence.
U.S. Genomics claims that each DNA molecule moves past the two laser beams
in a couple of milliseconds. That translates to 10 million bases of DNA length per
second. However, U.S. Genomics is unable to read the sequence at this speed. As
previously mentioned, the company is working towards sequencing an entire genome
in 45 minutes or less, but has not produced evidence of any such accomplishments to
date.
Several problems exist with this method of DNA sequencing. First, there is much
post-processing necessary to decipher the information gathered by the device. This
requires intense computational power and could easily become the limiting factor in
the success of the GeneEngine. Secondly, the process requires fluorescent tags. As
we have mentioned, the addition of these tags and the removal of excess tags increase
the sequencing time dramatically. Most fluorescent tags are also hazardous to the
operator.
3.4 Summary
In this chapter we have examined the sequencing methods employed by the Whitehead
Institute for Genome Research and by U.S. Genomics Inc. We have explained the
drawbacks, especially in speed, of the Sanger method as used by WIGR and the
drawbacks, especially in postprocessing and tagging, of fluorescence imaging as used
by U.S. Genomics Inc. We believe that Genome Scanning, in its final form, has the
potential to outperform both of these models.
72
Chapter 4
Genome Scanning
4.1 Introduction
Genome Scanning is a powerful technique that will help bring personal genome se-
quencing to life. This section will focus on the advantages of Genome Scanning and
the conditions necessary for the implementation of Genome Scanning. We will then
formulate predictions concerning the AFM images produced when scanning immobi-
lized DNA.
4.2 Advantages of Genome Scanning
Genome Scanning presents four main advantages over other methods. These advan-
tages can be summarized as follows:
* Preparation time decreased: As previously mentioned in Section 2.5.1, cur-
rent methods require DNA extraction from the cell, DNA purification, intro-
duction of DNase restriction enzymes, incubation, removal of said enzymes, and
preparation of the sample. Some techniques even require the addition of fluo-
rescent tags, incubation of the tags with DNA, and the removal of excess tags.
Genome Scanning only requires the extraction of DNA form the cells and its
purification, thereby reducing the process time significantly.
73

* Base recognition time dramatically decreased: The proposed method
can ideally analyze an area of 375 nm x 375 nm populated with a density of 1
pg/ml of DNA in 2 minutes (equivalent to a scan rate of 5 Hz at 600 samples
per line). At this rate, Genome Scanning can sequence 180,000 bases per scan,
or 90,000 bases per minute. Current methods require approximately 45 min/gel
where one gel will yield at most 800 meaningful points of information, each
point representing a particular base of DNA.
* Accuracy improved: Genome Scanning uses complementary base hybridiza-
tion to detect for bases along a strand of DNA. Since A will only hybridize with
T, and C only with G, base hybridization is an inherently specific process and
leads to extremely accurate results. Because of this, Genome Scanning has the
potential to provide flawless data on DNA sequences.
* Fluorescence tagging eliminated: Genome Scanning eliminates the costly,
cumbersome process of adding and removing fluorescent tags to DNA strands
before and after scanning. This is also an advantage since most fluorescent tags
are toxic and hazardous to the operator.
In this thesis we will focus mainly on the speed and feasibility of Genome Scanning.
The results will demonstrate to the reader the power of Genome Scanning and its
clear-cut advantage over the current state-of-the-art.
4.3 Genome Scanning Requirements
Let us now examine the mechanical components of a Genome Scanner. As shown
in Fig. 4-1, Genome Scanning requires the use of an atomic force microscope with a
functionalized tip. The AFM scans DNA deposited and immobilized on an atomically
flat sheet of cleaved mica. Simply put, an atomic force microscope is used to detect
for base interactions between the bases adsorbed to the cantilever tip and the bases
present on the strand of DNA. The first section of this chapter will examine the forces
exerted on the cantilever tip due to this interaction.
74

AFM cantilever
V~ /adsorbed base
Au coating( -..DNA bases
nrssDNA
mica
Figure 4-1: This schematic of Genome Scanning shows how the AFM tip is modifiedand how the ssDNA is immobilized to mica. The gold (AU) coating is 100 Athickand the linker used in the experiments are either APES or Mg2 +.
75
Also, it is important to know apriori that the system is robust enough to overcome
base hybridization forces. We can determine this by looking at the interfaces present
in the system tool path and the system workpiece path. These paths can be thought
of as:
" Tool Path: Base - AFM- Cantilever - Adsorbed Base
" Workpiece Path: Base - Mica - Linked DNA
" Tool - Workpiece Interface: Adsorbed Base - Linked DNA
The interfaces between system path elements are strong except for two question-
able interfaces: the Mica-Linked DNA interface and the Cantilever-Adsorbed Base
interface. In order for this methodology to function, we must examine these two inter-
faces and show that they will not interfere with the operations of Genome Scanning.
In summary, the three conditions that must be met for Genome Scanning to
operate correctly are:
" Base interaction force must be detectable
* DNA must be firmly anchored to mica
" Adsorbed bases must be firmly anchored to AFM tip
Let us now examine these three conditions in detail.
4.3.1 Base Interaction Forces
DNA bases hybridize naturally and hold their structures well in nature. There have
been many attempts at quantifying this interaction and its degree of specificity. As
previously stated, hydrogen bonding is at the basis of DNA hybridization. Hence we
will begin our analysis with a presentation of hydrogen bonding.
Hydrogen bonding is one of many forms of atomic interaction. Because of the
unique composition of the hydrogen atom it is able to form strong bonds with certain
76
atoms. A hydrogen atom consists of a single proton and an orbiting electron. Hydro-
gen atoms do not have electron levels or layers, instead the lone electron orbits the
proton much like the moon orbits the earth. By contrast, all other elements in the
periodic table have layers of electrons, which cushion the nucleus from the surround-
ing environment. The proton in a hydrogen atom does not have such a cushion and
as a result it can come in very close proximity to negatively charged particles.
To understand when hydrogen bonding will occur, we need to understand the
concept of electronegativity.
Electronegativity refers to how strongly an atom will pull shared electrons towards
it. A strongly electronegative atom will dominate shared electrons and will develop an
incrementally negative charge. The most electronegative atoms are nitrogen, oxygen,
fluorine, and chlorine with electronegativities of 3.04, 3.44, 3.98, and 3.16 accordingly
[10]. Of these, nitrogen, oxygen, and fluorine have a small enough atomic radius to
interact with hydrogen.
Because of its strong electronegativity, an oxygen atom will draw hydrogen's lone
electron close to it (see Fig.4-2), giving the oxygen atom a slight positive charge and
leaving the hydrogen atom with a slight negative charge. A hydrogen bond would
form between two such molecules.
Hydrogen bonding will occur between a hydrogen atom, which is covalently bonded
to oxygen, nitrogen, or fluorine, and a nitrogen, hydrogen, or fluorine atom, which
in turn is covalently bonded to hydrogen. Water molecules (H 2 0), for instance, form
hydrogen bonds in the liquid state.
As shown in Fig. 4-3, 3 such bonds form between cytosine and guanine, while
only 2 such bonds form between adenine and thymine. These bonds make it highly
unlikely that a base will bond to anything other than its complement. It is nature's
way of ensuring the accuracy of the genetic code. Fig. 4-3 shows the orientation of
hydrogen bonds between A and T, and C and G and the respective bond spacing.
According to sources in the literature [12] the A-T bond has an energy of 6
kJ/mole and the C-G bond has an energy of 12 kJ/mole. One paper [9] suggests a
bonding force between one A-T base pair of 54 pN based upon the interaction of a
77

8HHS++
Figure 4-2: Water molecules use hydrogen bonds to hold their structure.A hydrogenatom from one molecule is covalently bonded to an oxygen atom giving the hydrogena slightly positive charge, while the oxygen from another atom is covalently bondedto a hydrogen giving the oxygen a slightly positive charge. These two molecules willform a hydrogen bond as shown in the figure.
T-coated surface with an A-coated cantilever tip. Another paper suggests a bonding
force of 71.5 pN based on the rupture force of strands of 20, 16, and 12 bases [18].
For the purposes of our calculation, we will use the average rupture force of 62.75
pN for a single A-T base pair.
Even though we are ultimately interested in a single base pair bond, the technique
of Genome Scanning can use software averaging methods to pinpoint the location of
bases if multiple bases bond. In other words, we can tolerate more than one base
pair hybridizing at each location. Taking into account that the cantilever tip has a
diameter of 20 nm and that DNA bases are 0.5 nm apart, we can assume a total of
3-40 bases will hybridize. Let us assume for this analysis that realistically 10 bases
will hybridize.
We need to ensure that the force generated by the interaction of these 10 bases
with the cantilever tip will be detectable using the AFM. Knowing that the cantilever
deflection is linear with a known spring constant (kcantilever), we can calculate the
deflection of the cantilever due to this force (FA-ToWd). The equivalent deflection
(Xdisplacement) can be calculated using the equation
78

A0 .-...--....
0.28 nm
0.30 nm
0
Thymine (T) Adenine (A)
0kI0.29 nm
0.30 nm
0.29 nm I
Cytosine (C) Guanine (G)
Figure 4-3: Two hydrogen bonds form between adenine and thymine while threehydrogen bonds form between cytosine and guanine. This configuration of hy-drogen bonds makes it nearly impossible for bases to bond to anything but theircomplementary base. (modified from http:// winel.sb.fsu.edu/ bch5425/ lect02/IMG00008.GIF)
79

FA-Ttond = kcantilever - Xdisplacement - (4.1)
Substituting the force generated by 10 A-T bonds and the spring constant of the
cantilever used in the experiments, we obtain
10 - 0.06275nN = 2.00Nm-1 Xdisplacement. (4.2)
Rearranging the equations, we find that
Xdisplacement = 0.3138nm. (4.3)
The AFM is capable of sub-Angstrom precision in the z-direction and so a deflec-
tion of 0.3138 nm is certainly detectable.
4.3.2 DNA Linkage to Mica
In order for this method to function properly, it is important that the ssDNA remain
firmly grounded to the mica sheet. This depends strongly on the type of linker-mica
bond and the type of linker-DNA bond. Using APES or divalent cations (as we will
see in a later section) results in the formation of ionic linker-mica bonds as well as
ionic linker-DNA bonds. To review, an ionic bond implies that the molecules remain
separate yet attracted by their large opposing charges. Fig. 4-4 shows how an ionic
bond is formed between negatively charged mica and positively charged linkers. The
same is true for the negatively charged phosphate group of DNA and the positively
charged linker.
Such ionic bonds will be robust enough for Genome Scanning if they require more
energy to break than the hydrogen bonds of the bases. So the question remains: are
ionic bonds stronger than hydrogen bonds?
To answer to this, we take a look at the literature and find bond energies of these
interactions. One reliable source gives the following energies for different bond types
[12].
80

ionicbond
A
DNA bases
linker, ssDNA
j mica
Figure 4-4: Linkers use ionic bonding to anchor DNA to the mica sheet. The linkeris composed of two positive terminals and bonds to the negatively charged mica onone side and to the negatively charged phosphate group of DNA on the other side.
Bonding Bond Strength
Adenine - Thymine 6 kJ/molCytosine - Guanine 12 kJ/molIonic Bond 200-1000 kJ/molCovalent Bond 300-800 kJ/molVan der Waals 0.05-40 kJ/mol
Table 4.1: Different bond strengths in kilo-Joules per mole. It is important to notethat given similar charge, covalent bonds are the strongest followed by ionic, metallic,hydrogen, and finally Van der Waals bonds.
81

While there are are such large ranges of specific energies for ionic, covalent, and
Van der Waals bonds, one thing is certain in the literature. For similar charge, the
bond strengths are, in order of decreasing strength: covalent > ionic > metallic >
hydrogen > Van der Waals [21].
As one can see, the linker-DNA and linker-mica ionic bonds are strong enough
that they will not dissociate as the bases are being dehybridized. Hence, it is safe to
assume the linkers will adequately anchor DNA to the mica surface.
4.3.3 Tip Adsorption
The last piece of the puzzle is to guarantee that the bases used to scan the surface will
not detach from the cantilever tip. For the sake of obtaining preliminary experimental
results, the experiments in this thesis will employ standard AFM probes coated with a
layer of gold. Bases will then be adsorbed onto the gold surface in a simple procedure
described in Chapter 5.
There are many assumptions being made about the strength of various components
of the AFM. For instance, we know that the adhesive used to fix the cantilever chip to
the steel cross is orders of magnitude stronger than the interactions we are measuring.
The same can be said of the magnetic connection between steel cross and AFM
magnetic holder. Also, as shown in Fig.4-5, the gold evaporated onto the cantilever
tip is much more rigidly fixed than the base chemical bonds. In other words, the only
interface we need to check for robustness is the interface between evaporated gold
and the adsorbed bases.
This question reaches far beyond the scope of mechanical engineering and will not
be answered here analytically. However, we can make use of the observations and
explanations of those versed in the field.
Tao, DeRose, and Lindsay [27] have demonstrated that adenine, guanine, thymine,
and cytosine all readily adsorb onto gold surfaces. Adenine, guanine, and cytosine
adsorb spontaneously onto gold coated members while thymine adsorbs only after a
bias voltage of +0.04 Volts is applied to the gold member. By simply exposing the
bases to a gold surface, they almost immediately adsorb and form a surface layer. Tao
82

/AFM cantilever
Ti layer
Au layer base
adsorptionlocation
Figure 4-5: Base adsorption to a thick gold layer
83

observed that the bases tend to adsorb along the direction of the crystalline structure
of the gold atoms. In other words, the bases form "worms" that extended along the
crystalline structure of the gold.
The experiments conducted by Tao et al yielded "worms" of Adenine that were
packed tightly together in a periodic structure with period 3.4 A± 0.2 A. The spacing
between consecutive "worms" was 7 ± 0.5 Aand the height of the "worms" was 2 Aas
compared to the height of the unmodified gold, which was 0.1 A.
In the case of Guanine, the "worms" appeared with less contrast, but were re-
peatable when observed. The periodicity and spacing were similar to that of adenine.
Cytosine, however, did not produce "worms" along the crystalline structure when
adsorbed to gold. Instead, cytosine formed large areas of a highly ordered oblique
lattice.
As mentioned previously, thymine does not spontaneously adsorb to gold. When
a biasing voltage greater than +0.04 Volts in applied thymine forms semi-observable
lattices on the gold surface. It is, however, not entirely certain that this process is as
successful as with guanine, adenine, and cytosine.
Base adsorption to gold is extremely useful for Genome Scanning because it pro-
vides us with a means of linking the bases directly to the tip in a inelastic manner.
This translates to a more accurate scan with bases strongly fixed to the cantilever
tip. After a layer of gold is deposited on the AFM cantilever, one can readily adsorb
a particular base to it and scan the mica surface using this functionalized tip. The
simplicity of this process also makes it appealing for large-scale implementation of
Genome Scanning.
The process of adsorption is inherently robust and, as explained above, can be
trusted to overcome the decoupling force of A-T bonds and of C-G bonds.
Hence all three conditions necessary for Genome Scanning have all been satisfied.
To remind the reader, these three conditions are:
" Base interaction force must be detectable
" DNA must be firmly anchored to mica
84

9 Adsorbed bases must be firmly anchored to AFM tip
4.4 Predicted Results of Genome Sequencing
It is important to know what one is searching for before looking for the answer in
the experimental results. In particular, it is important to understand what images
to expect from the AFM. These images depend greatly on the radius of curvature of
the tip, the size of fragment being scanned and the sampling rate of the AFM. This
section will give our expectations in terms of DNA width and DNA profile relative to
the variables expressed above.
4.4.1 DNA Width
Estimating the size of DNA fragments as scanned by the AFM depends on the radius
of curvature of the cantilever tip and on the type of DNA being scanned (ss or ds).
Since the AFM vibrates the cantilever at a rate of 30-400 kHz in intermittent contact
mode while scanning at a rate of 3 kHz, it is safe to assume that features will not
be overlooked during the scan. Throughout the experiments, a sampling rate of 600
points per scan line will be employed.
Let us now take an look at the geometry of the cantilever tip and the DNA (Fig.
4-6). The tip can be estimated as a hemisphere with radius of curvature as rated by
the manufacturer with additional radial thickness due to the coatings of Ti and Au.
The strands of DNA can be modelled as a cylinder with known radius immobilized
to the surface.
Fig.4-6 shows the instant when the cantilever tip begins to deflect upwards as it
registers the presence of DNA. The horizontal distance between the centers can be
understood as half the width of the DNA molecule as it will appear in the AFM image
(w/2). The distance depends on the radius of DNA (r) and the cantilever radius of
curvature (R). Equation (4.4) gives a simple way to calculate the expected width of
DNA.
85

cantlevetip-P
DNA
mica substrate w/2
Figure 4-6: Calculating the expected DNA width depends on the thickness of the
DNA strand (modelled as a cylinder) and the radius of curvature of the cantilever tip
(modelled as a hemisphere).
(0.5w) 2 + (R - r) 2 = (R + r)2
(0.5w) 2 = (R 2 + 2Rr +r 2 ) - (R2 - 2Rr +r 2 )
(4.4)
(4.5)
Rearranging terms, we obtain
w = 41P/ Rr. (4.6)
This result is echoed in the literature by several scientists. One paper gives the
same result and shows its applicability [6]. Furthermore, we have taken experimental
measurements to verify the validity of this theoretical result. An AFM image of
dsDNA was scanned using a fresh tip with 10 nm radius of curvature. Using the
predictions we obtain
w = 410nm 1nm
w = 12.65nm.
86
(4-7)
(4.8)
cantilever tip

The data collected is shown in Fig.4-7 It is clear that the calculations match our
expectations with a fair degree of certainty. The DNA width measured was 12.72 nm
and average width over 5 samples was 13.20 nm. Compared with the theoretical value
of 12.65 nm, we arrive at a 4.3 % error in the model predictions, which is reasonable.
4.4.2 DNA Profile
We can take this analysis one step further and actually predict the profile of DNA
we expect to see in our scans. The geometry needed for this prediction is shown in
Fig.4-8.
A profile of DNA height versus distance can be easily plotted. Distance (x) is the
distance between the centers of the cantilever tip (modelled as a hemisphere or radius
R) and the DNA (modelled as a cylinder of radius r). The imaged height (h) of the
DNA strand can be calculated as follows:
h = d1 + d2 - R (4.9)
di +x 2 = R (4.10)
h = (R +r) 2 - X2 + r - R (4.11)
Simulated in Matlab for dsDNA and a cantilever probe with radius of curvature
of lOnm, the profile in Fig. 4-9 was returned. The profile can be compared with the
actual profile of dsDNA measured experimentally and shown in Fig.4-7 above. It is
worth noting here that Eq. (4.9) does not account for instances when the cantilever
is in contact with the substrate. The code, however, has been formatted to account
for such instances. Appendix B shows the details of this profile estimation code.
Again, the expected width is 12.65 nm and as is clear, the theoretical profile
matches that observed in the experiment fairly closely. Furthermore, simulation
widths for commonly used tips and DNA types are compiled in Table 4.4.2 for refer-
ence.
87
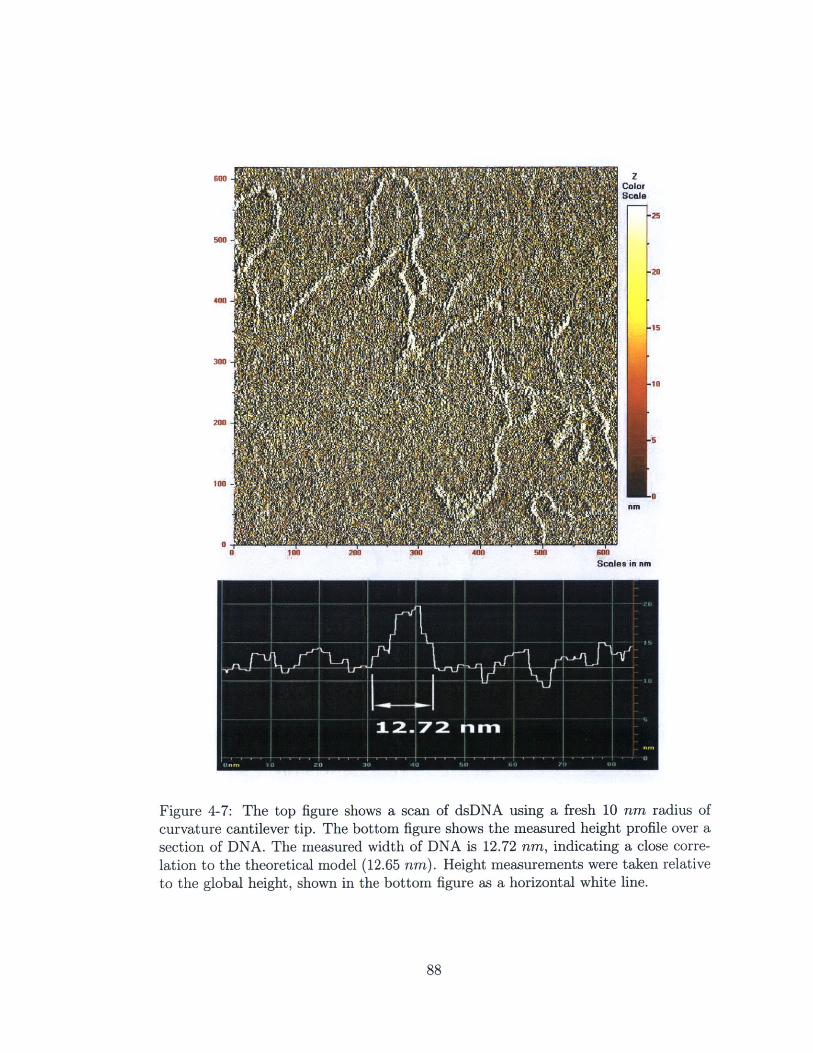
section~~~I fk DNA The mesue wdt -IN is,, '2.7 nm idcain a, 1ls Coe
o25
41I5
Figure 4-7ba Thegtp w h bto figureshw ascno dsN s a fresnt hit0 lnme.duso
curvature~~~~~~~~~~~~~~1 catlee tip Thkotmfgrhw h eaue egtpoieoesection~~~~~~~~~~X ofDANh4esre it fDAi 1.2midctigacoecre
lation ~Q toI? th thoeia moe 1.5n) egtmaueet eetknrltvto ~ ~ ~ ~ f th-lblhigt.hw-nthotmfgrea W oiota ht ie
88
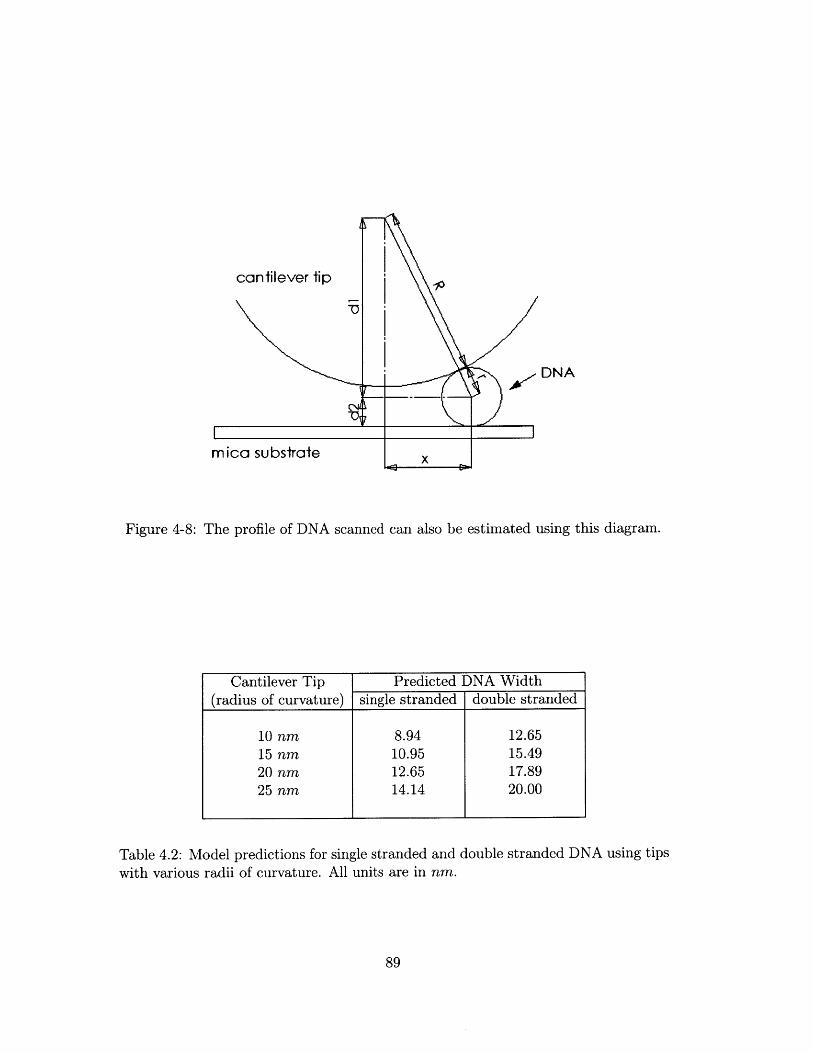
cantilever tip
~0
mica substrate
DNA
-Q x E
Figure 4-8: The profile of DNA scanned can also be estimated using this diagram.
Table 4.2: Model predictions for single stranded and double stranded DNA using tipswith various radii of curvature. All units are in nm.
89
7
Cantilever Tip Predicted DNA Width(radius of curvature) single stranded double stranded
10 nm 8.94 12.6515 nm 10.95 15.4920 nm 12.65 17.8925 nm 14.14 20.00

1.8
1.6
1.4
1.2|-
0.8-
0.6-
0.4
0.2
0'--20 -15 -10 -5 0
nm
Figure 4-9: Simulated profile of ssDNAtip, and a heavily coated tip, with radiiaccordingly.
5 10 15 20
as scanned by a bare tip, a lightly coatedof curvature of 10 nm, 24 nm, and 30 nm
90
- as-is t-lightly
.-' v- -..-. heavil c
.V1
ipcoated tipycoated tip

4.5 Summary
In this chapter we have defined the advantages and restrictions of Genome Scanning.
We have seen that Genome Scanning reduces preparation and sequencing time, while
increasing accuracy and eliminating the need for fluorescent dies. We have also ex-
amined the three conditions necessary to implement Genome Sequencing: detectable
hybridization forces, firm immobilization of DNA to mica, and firm adsorption of
bases to the cantilever tip. Finally, we have presented a model predicting DNA width
and profile as scanned by the AFM. With this knowledge in hand, we can now examine
the experiments conducted.
91

92

Chapter 5
Experimental Setup
5.1 Introduction
This chapter will focus on the materials needed to conduct Genome Scanning. We will
discuss appropriate background surfaces, DNA linkers, and methods of functionalizing
the cantilever tip. We will also discuss the setup of the experiments conducted in
terms of background surface preparation, DNA immobilization, and base adsorption
to the cantilever tip. The results of these experiments will then be given in Chapter
6.
5.2 Purpose
The purpose of these experiments is to demonstrate in very basic terms the worka-
bility of Genome Scanning and the speed associated with this process. This thesis
can be considered a proof of concept. Further development will take place in future
publications. For instance, detailed accuracy and repeatability measurements will
be disclosed elsewhere. The experiments conducted for this thesis focus on the in-
teraction of the probe and sample as it relates to genome sequencing. We'd like to
show:
9 Comparison of DNA imaging using as-is cantilever and functionalized can-
tilevers.
93

* Demonstration of the specificity of the base interaction of Genome Scanning.
5.3 Setup
5.3.1 Atomically Flat Background
Scientists have successfully imaged DNA using atomic force microscopy as early as
1991. Mostly, scientists have been imaging double-stranded DNA, and enzymes/proteins
as they interact with ds- or ss-DNA [26].
The diameter of a beta-helix of DNA is nearly 20 A, and as such we can expect
the diameter of ss-DNA to be around 10 A(1 nm). To image ssDNA with such a
small height difference, one must make use of a background material that is nearly
atomically flat. If the background surface is rougher than 10 A, the scanned DNA
will fade into the background noise and may be missed altogether.
The materials commonly used to image with the AFM are glass and mica. Glass
is known to be much rougher than mica. As we will see in the following pages, this
is primarily due to the crystalline structure of mica.
Mica
Mica is the name given to a mineral group with the structure KAl2 (AlSi3 )0 1 o(OH) 2.
The mica used in labs across the world for nano-imaging is the muscovite form of
mica. Other mica types are Biotite, Fuchsite, Lepidolite, and Zinnwaldite. Muscovite
mica is a semi translucent mineral with a gray-brownish tint.
Crystalline Structure
The reason mica has become so popular as a background substrate in atomic force
microscopy is due to its ability to form atomically flat surfaces. The crystal structure
of Mica is arranged such that it forms perfect sheets in one direction of sheer. This
can be understood better by looking at the crystalline structure of mica.
Figure 5-1 shows how mica is composed of two basic layers. The first layer is
a tetrahedral layer composed of(Si 6 Al 20 20) 10-. The second layer is a dioctahedral
94

muscovite mica(side view)
dioctahedral layer(top view)
tetrahedral layer(top view) muscovite mica
(top view)
Figure 5-1: The layer-like structure of muscovite mica allows it to be cleaved into flatsheets. (Courtesy D M Sherman, University of Bristol http:// mineral.gly.bris.ac.uk/Mineralogy/ micas.pdf)
layer that is composed primarily of the Al'+ structure. Each dioctahedral layer is
sandwiched in the middle of 2 tetrahedral layers. These 3 layer sandwiches are bonded
to one another by potassium (K) atoms as shown in the figure.
The alignment of mica crystals means that any pressure applied to the sheet
will cleave the mica along that direction and leave two atomically flat surfaces of
mica. Being an atomic layer, these surfaces have little to no roughness and make
good background surfaces for atomic force microscopy. Fig.5-2 shows how mica forms
atomically flat sheet when sheered.
Negative Charge
As mentioned previously, the structure of mica is KA12 (AlSi3 )010(OH) 2 . This
95
Potassium

Figure 5-2: Sheering mica along its sheer plane results in atomically flat surfaces.
means that the oxygen atoms are always exposed when the crystal structure is cleaved.
The oxygen atoms however, are lacking a covalent bond and so the charge on each
oxygen atom is -1. This gives muscovite mica a distinctive negative charge in its
cleaved form.
Glass
Because of the process used to make glass slides, they tend to have warped surfaces.
Glass is formed by the heating of a mixture of sand, sodium carbonate, and calcium
carbonate at high temperature followed by cooling. The glass is poured into a mold or
blown, spun, or otherwise formed to obtain a desired shape. Such a process inherently
yields rougher surfaces than the atomic cleaving of mica.
Fig. 5-3 shows two 1 Mm x 1 1um images taken using the Quesant AFM. The
images were taken in intermittent contact mode at a scan rate of 5 Hz with Olympus
AC240TS cantilevers (2 N/m). The two figures clearly demonstrate the superiority
of mica as a background surface for nano-imaging. The image of mica produced by
the AFM has a variable height ranging 6 nm, while the height of the AFM image of
the glass surface ranges up to 600 nm. For this simple reason, muscovite mica will
be used as a background surface throughout the experiments.
96

UW*W
r4
r3
I VI t6
Figure 5-3: AFM image of glass surface pictured (top) shows large variations in theheight of this background substrate. By comparison, muscovite mica only varies by1/100 the height over the same area (bottom).
97
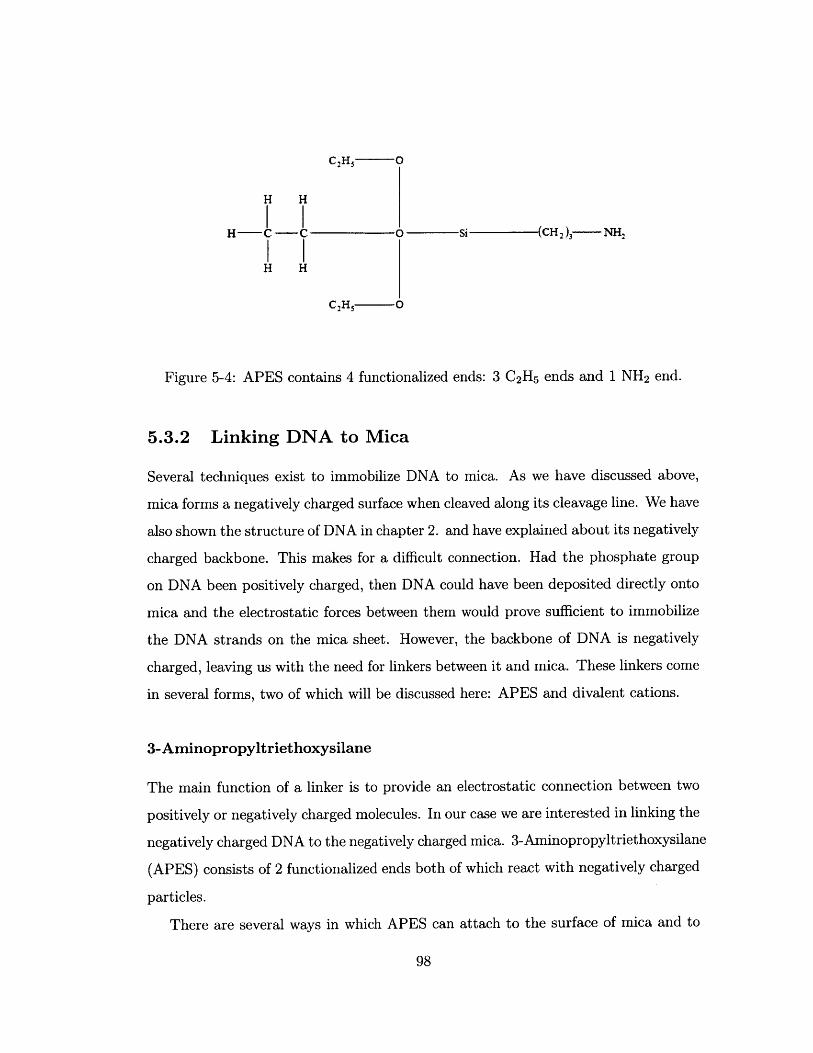
C2H5 O
H H
H - C-C 0 Si(CH 23 N2
H H
C2H5 0
Figure 5-4: APES contains 4 functionalized ends: 3 C2H5 ends and 1 NH 2 end.
5.3.2 Linking DNA to Mica
Several techniques exist to immobilize DNA to mica. As we have discussed above,
mica forms a negatively charged surface when cleaved along its cleavage line. We have
also shown the structure of DNA in chapter 2. and have explained about its negatively
charged backbone. This makes for a difficult connection. Had the phosphate group
on DNA been positively charged, then DNA could have been deposited directly onto
mica and the electrostatic forces between them would prove sufficient to immobilize
the DNA strands on the mica sheet. However, the backbone of DNA is negatively
charged, leaving us with the need for linkers between it and mica. These linkers come
in several forms, two of which will be discussed here: APES and divalent cations.
3-Aminopropyltriethoxysilane
The main function of a linker is to provide an electrostatic connection between two
positively or negatively charged molecules. In our case we are interested in linking the
negatively charged DNA to the negatively charged mica. 3-Aminopropyltriethoxysilane
(APES) consists of 2 functionalized ends both of which react with negatively charged
particles.
There are several ways in which APES can attach to the surface of mica and to
98
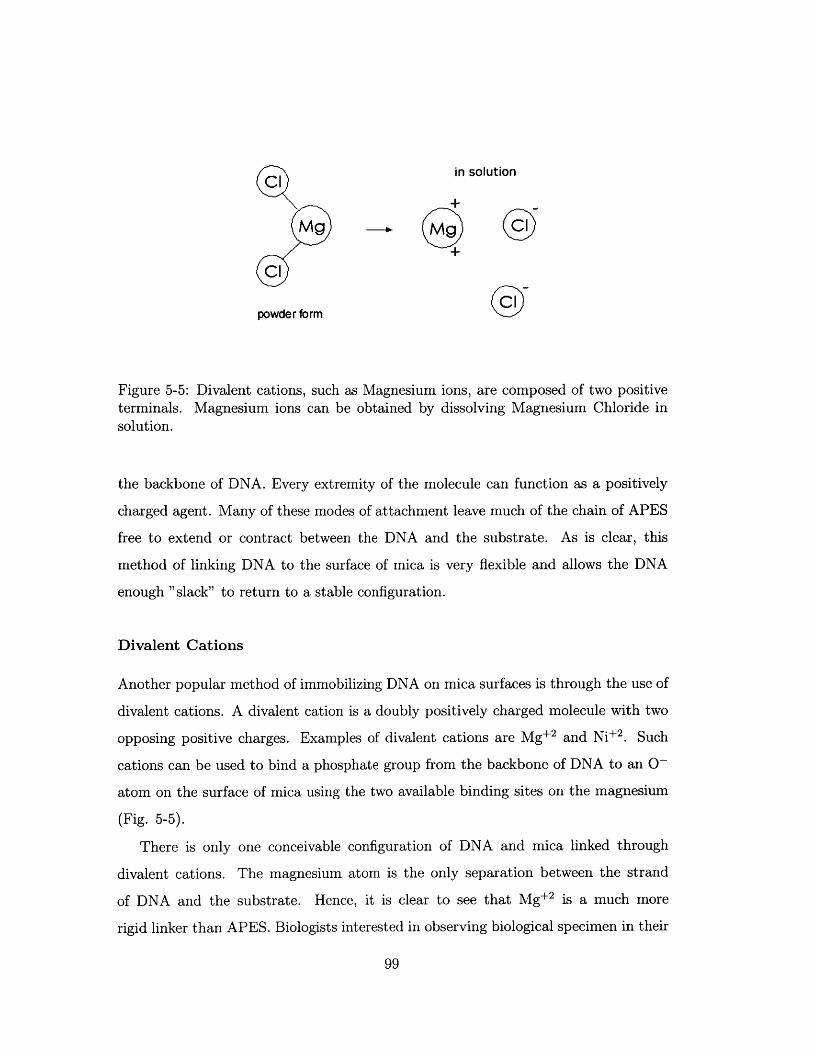
CI in solution
+
Mg Mg
CI
CIpowder form
Figure 5-5: Divalent cations, such as Magnesium ions, are composed of two positiveterminals. Magnesium ions can be obtained by dissolving Magnesium Chloride in
solution.
the backbone of DNA. Every extremity of the molecule can function as a positively
charged agent. Many of these modes of attachment leave much of the chain of APES
free to extend or contract between the DNA and the substrate. As is clear, this
method of linking DNA to the surface of mica is very flexible and allows the DNA
enough "slack" to return to a stable configuration.
Divalent Cations
Another popular method of immobilizing DNA on mica surfaces is through the use of
divalent cations. A divalent cation is a doubly positively charged molecule with two
opposing positive charges. Examples of divalent cations are Mg+ 2 and Ni+2 . Such
cations can be used to bind a phosphate group from the backbone of DNA to an 0~
atom on the surface of mica using the two available binding sites on the magnesium
(Fig. 5-5).
There is only one conceivable configuration of DNA and mica linked through
divalent cations. The magnesium atom is the only separation between the strand
of DNA and the substrate. Hence, it is clear to see that Mg+ 2 is a much more
rigid linker than APES. Biologists interested in observing biological specimen in their
99

natural states prefer APES since it allows the specimen more freedom to return to
its natural conformation. Divalent cations do not allow this flexibility and are used
when the sample must be rigidly bound the surface. Having DNA rigidly bound to
the surface can be useful when exerting a force on the DNA molecule as is the case
in atomic force microscopy.
5.3.3 DNA Alignment
The purpose of this thesis is to allow for the direct bonding of bases on the AFM
cantilever to the bases along immobilized strands of DNA. For this to occur, DNA
strands must be immobilized with all bases accessible to the probing cantilever. An-
other important issue to consider is the straightness of the DNA molecule along the
direction of travel of the AFM. Let us now examine both of these issues.
Base Accessibility
Using either APES or divalent cations as linkers ensures that the single stranded
DNA fragments will be immobilized with the phosphate backbone facing downwards
towards the mica sheet and the bases facing the overhead cantilever. However, there
still exists the possibility of the DNA forming loops overlapping bases and thus making
certain lengths of DNA inaccessible to the cantilever tip. An example of this is shown
in the AFM image (Fig. 5-6) taken in intermittent contact mode.
Another possible problem is the coiling of DNA. Fortunately, DNA does not form
coils unless it is in a double-stranded state. Since we will first denature the strands
of DNA to obtain ssDNA, this does not present a problem in the way of Genome
Scanning.
In the case that linearly stretched DNA is still necessary, several methods have
been successful at obtaining "straight" DNA. For further information on this process,
please refer to the bibliography.
100

Figure 5-6: DNA overlaps as it forms a loop along the strand as pointed out by thewhite arrow (left). Looping makes bases on the bottom strand inaccessible to thecantilever tip because of the overlapping top strand. A schematic of the DNA overlapis shown for clarity (right).
Scanning Direction
One major question is whether or not the scan direction must be aligned with the
DNA. The simple answer is that this is not an important consideration. As the
AFM scans its regular path it will encounter the strands of DNA and compensate
accordingly. There is no reason to expect the scanning direction to be along the
strand of DNA as this will not interfere with the intended function in any sense.
5.3.4 Cantilever Tip Functionalization
The cantilever tip needs to be functionalized with an appropriate base for Genome
Scanning. In order to scan for adenine the tip needs to be functionalized with thymine,
to scan for cytosine the tip needs to be functionalized with guanine, to scan for
thymine the tip needs to be functionalized with adenine, and to scan for guanine
the tip needs to be functionalized with cytosine. There are two methods of func-
tionalizing cantilever tips that can be employed: Base functionalization and Strand
functionalization.
101

Strand Functionalization
One method of functionalization is to mate a molecule of double-stranded DNA to
the cantilever tip. The desired end result is to link a base to the end of the cantilever
tip. This can be accomplished by linking a strand of DNA to the cantilever tip and
using the final exposed base as a sensor. It is important for this process that only the
final base interact with the ssDNA immobilized on mica. One way of accomplishing
this is by designing the sequence along this strand so that it mates exactly except in
the final base pair. In this way the interior bases will be prevented from interacting
with the ssDNA immobilized on mica and the final base pair will be the only point of
contact. This final base pair must be designed as a pair of the same bases. In other
words, the final base pair should be an A-A, T-T, C-C, or G-G pair to ensure that
they will not hybridize and will sense only one type of base, namely it's compliment.
Fig. 5-7 shows a schematic representation of how a probing DNA strand attached to
the AFM cantilever tip can be used to approach and scan immobilized DNA for a
particular base type.
The cantilever can also be negatively charged to avoid any coiling of the probing
strand around the cantilever tip. In such a fashion a dsDNA probe can be created to
scan the sequence of immobilized DNA. One must account for the added elasticity of
the probing strand when calculating force deflection curves of the cantilever tip.
Base Functionalization
Another method of adding sensing bases to the cantilever tip is by directly adsorbing
the bases onto the cantilever. In this way, bases are aligned directly along the surface
of the cantilever tip and are accessible to the DNA bases on the mica surface.
As we have described in Chapter 4, bases readily adsorb to gold surfaces except
for thymine, which requires a small bias voltage to catalyze the reaction. In this sense
it is the clear winner as far as tip functionalization is concerned. Fig. 5-8 shows a
base-functionalized tip coming in contact with a strand of DNA.
Base functionalization does have drawbacks however.
102

cantilever
V
probingDNA strand
A A
A TimmobilizedDNA strand
sugar sugar sugar
P04 P04 P04 P04
Figure 5-7: Adding a probing strand to the cantilever tip would enable Genome
Scanning. Here a probing DNA strand with an A-A final base pair is attached to an
AFM cantilever tip and used to scan immobilized DNA strands.
103

conilever lipA A
A A
AA A A
A TGbiDzedtrand
sugar svgor sugar
P04 P04
Figure 5-8: Bases adsorbed directly to the cantilever tip would also serve the purposeof Genome Scanning. Here adenine bases are adsorbed to the cantilever tip and usedto scan the immobilized DNA below.
104
immoDNA s

The most striking drawback becomes apparent when trying to pinpoint the loca-
tion of a particular base. Because of the large radius of curvature of the cantilever tip,
it is likely that more than one of the adsorbed bases could hybridize with the DNA
in succession. As the AFM moves laterally across the immobilized DNA strands,
several of the adsorbed bases would hybridize one after the other resulting in a seem-
ingly larger strand DNA. This would also make it difficult to pinpoint the location of
specific bases along the immobilized DNA.
Several solutions to this problem can be explored. First, one can use computa-
tional techniques to locate the base in the 'haze' of activity. This approach has been
implemented by members of this laboratory and is known as stereo profilometry.
Briefly, this process takes the shape of the cantilever tip into consideration when out-
putting the AFM image. This method may increase scan times slightly, but provides
much more accurate results. For more information, please refer to the PhD thesis by
Bernardo Dantes Aumond [7].
Another solution is to scan using a carbon nanotube cantilever tip. Carbon nan-
otube can be made in diameters of down to 1 nm and have very large aspect ratios.
Carbon nanotubes have been used to obtain high-resolution AFM images of previ-
ously undetectable landscapes [30]. The main advantage of carbon nanotubes from
the standpoint of Genome Scanning is it's nanoscopic diameter, which can be used to
scan immobilized DNA instead of the cantilever tip. This is useful because a carbon
nanotube would come in contact with only one or two bases of the immobilized DNA
strand while current cantilever tips come in contact with about 20 or so bases. This
would result in much more precise information on the location of DNA bases.
Also, the process of rigidly bonding adenine to the end of carbon nanotube tips is
well-understood and easy to perform, making carbon nanotubes an attractive option
for Genome Scanning.
105
5.4 Experimental Procedures
The purpose of the experiments is to determine if Genome Scanning can be used to
sequence ssDNA. Ideally, one could examine every method described thus far, but for
the sake of concept verification, we will only examine a specific case. Later experi-
mentation will optimize the process and quantify many of the unknown parameters.
The experimental procedure consists of seven aspects:
" DNA preparation
" Cleaving of mica
" Linker application to mica
" DNA immobilization on mica
" Cantilever tip functionalization
" AFM imaging of sample
* Data interpretation
5.4.1 DNA Preparation
The DNA used in the experiment was both natural and synthetic. All DNA was
purchased in its purified, extracted form and diluted to 1 pg/mL as explained shortly.
This dilution is necessary to obtain a recognizable image of individual strands of DNA.
At higher concentrations the strands of DNA tend to aggregate and form large clusters
that are not distinguishable under atomic force microscopy. At lower concentrations
it becomes difficult to "find" the DNA in a scanned image. The DNA is so scattered
that one needs to take several images before finally "spotting" a strand of DNA.
Natural DNA
Lambda DNA in solution was ordered through Life Technologies, Inc. Lambda DNA
is isolated from an E. Coli lysogen (dam+ dcm+ E. coli LE597 lysogen). The exact
106

genotype is cIind1ts857Sam7. For our purposes what really matters is the length in
base pairs. The lambda DNA described above has a molecular weight of 32 x 10 6
Daltons, which equates to roughly 48,500 base pairs.
The DNA is stored in a storage buffer consisting of 10 mM Tris-HCl (pH 7.4), 5
mM NaCl, and 0.1 mM EDTA. This storage buffer ensures that the lambda DNA
will not deteriorate quickly and maintains it in its natural state. The concentration of
DNA as purchased was 0.25-0.6 pg/pL. Most of the DNA used was at a concentration
of 0.55 pg/ pL.
Before purchase, the lambda DNA was screened using agarose gel analysis to
ensure purity, DNA structure, and the presence of selected restriction endonuclease
fragmentation patterns. In other words, gel electrophoresis was conducted on the
DNA obtained from E. Coli and DNA contained in a certain band range was harvested
for this experiment.
Lambda DNA purchased from Life Technologies, Inc. was diluted to a concentra-
tion of 1 pg/mL in water. As stated above, this concentration is necessary for accurate
AFM imaging. Higher concentrations result in aggregation of the DNA strands while
lower concentrations make it difficult to locate the immobilized strands.
The protocol used to dilute the solution of Lambda DNA down to 1 pg/mL is
given in Appendix A.1.
DNA in its natural state forms double stranded helices, which after annealing form
coils and coils of coils and coils of coils of coils. An image of coiled DNA will not be
recognizable as DNA and is not conducive to Genome Scanning. Hence, one must first
uncoil and denature the strands (form single strands of DNA from double-stranded
DNA.) This can be achieved in several ways, the simplest of which is heating.
According to the manufacturer, heating of the lambda DNA to 65'C for short
period of time will uncoil and the strands. To denature them, the sample must be
heated further to a temperature of 85 'C. Quickly cooling the solution afterwards will
"freeze" the molecules in their denatured state, thereby ensuring that they do not
anneal once again.
To denature Lambda DNA, the protocol listed in Appendix A.2 was followed.
107
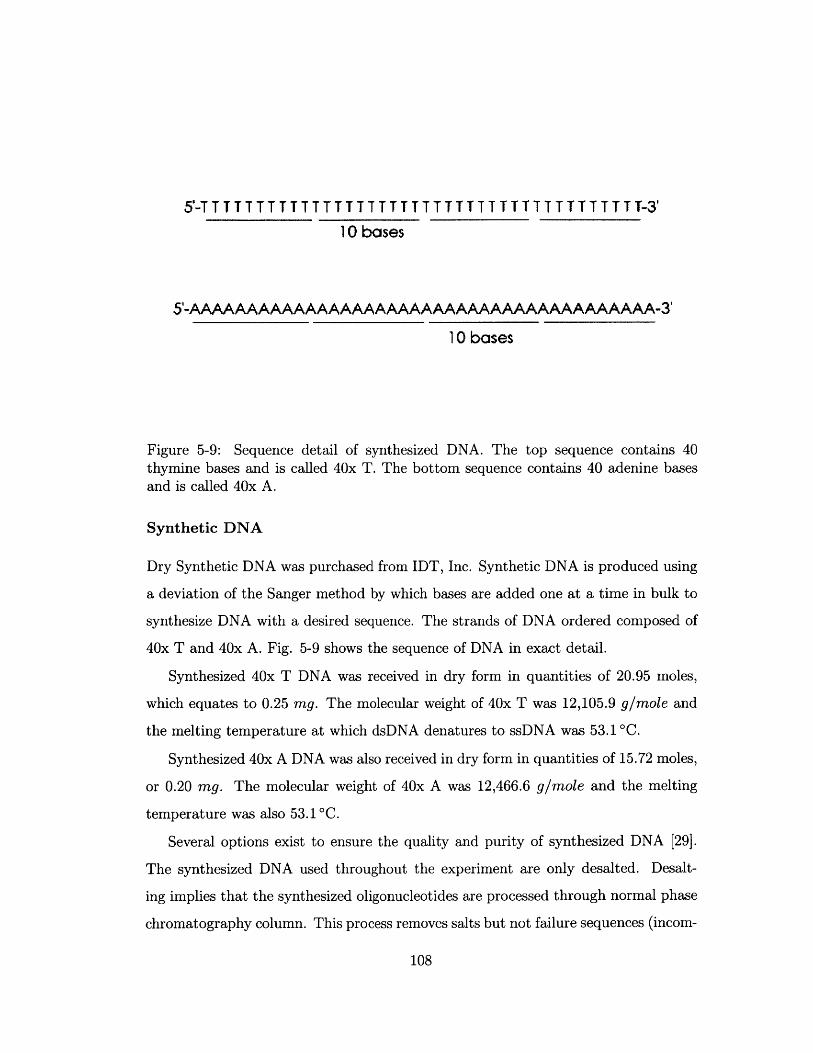
5'-T T T I T T T T T T T T T T T T T T T T T T T T T T T T T T T T T T T-3'
10 bases
5'-AAAAAAAAAAAAAAAAAAAAAAAAAAAAAAAAAAAAAAAA-3'
10 bases
Figure 5-9: Sequence detail of synthesized DNA. The top sequence contains 40
thymine bases and is called 40x T. The bottom sequence contains 40 adenine bases
and is called 40x A.
Synthetic DNA
Dry Synthetic DNA was purchased from IDT, Inc. Synthetic DNA is produced using
a deviation of the Sanger method by which bases are added one at a time in bulk to
synthesize DNA with a desired sequence. The strands of DNA ordered composed of
40x T and 40x A. Fig. 5-9 shows the sequence of DNA in exact detail.
Synthesized 40x T DNA was received in dry form in quantities of 20.95 moles,
which equates to 0.25 mg. The molecular weight of 40x T was 12,105.9 g/mole and
the melting temperature at which dsDNA denatures to ssDNA was 53.1 C.
Synthesized 40x A DNA was also received in dry form in quantities of 15.72 moles,
or 0.20 mg. The molecular weight of 40x A was 12,466.6 g/mole and the melting
temperature was also 53.1 C.
Several options exist to ensure the quality and purity of synthesized DNA [29].
The synthesized DNA used throughout the experiment are only desalted. Desalt-
ing implies that the synthesized oligonucleotides are processed through normal phase
chromatography column. This process removes salts but not failure sequences (incom-
108

plete sequences). Other processes such as cartridge purification, High Performance
Liquid Chromatography (HPLC), and PAGE sequencing are often used to purify
successful sequences from failure sequences and salts.
As stated, a solution of concentration 1 pg/mL is needed for proper AFM imaging.
To obtain such a concentration, synthesized DNA was diluted in DNase/RNase free
water as described in Appendix A.3 for 40x T and in Appendix A.4 for 40x A.
Because the 40x T and 40x A solutions contain non-complementary bases, it is
not necessary to denature the solution. The bases do not match up and so the ssDNA
does not anneal and cannot coil. Hence there is no protocol necessary for denaturing
synthetic DNA.
5.4.2 Cleaving Mica
As we have seen, muscovite mica forms atomically flat surfaces as it is sheered along
its lattice sheer line. Mica for this experiment was purchased from SPI Supplies,
Inc. Muscovite mica was purchased in its V-1 grade. This is SPI's top grade and
guarantees 0.0 % air content in the mica. Mica was obtained in sheets of 25mm x
25mm x 0.15mm.
To obtain atomically flat surfaces, the mica was cleaved using commercially avail-
able Scotch tape. SPI Supplies, Inc. recommends using specialty razor blades to split
the mica along its thickness, however we have had little success with this method. In-
stead, most laboratories on campus and off campus use a small piece of commercially
available Scotch tape to cleave the top layer from the mica sheet (See Fig. 5-10).
The bottom of a sheet of mica was fixed to a lab bench using double-sided Scotch
sticky tape. A piece of Scotch adhesive tape was placed on the top surface and
pressed firmly against the mica. With a quick tug, the top piece of Scotch adhesive
tape was removed from the top surface of the mica. A thin layer of mica could be seen
attached to the piece of Scotch adhesive tape. The mica was then carefully removed
from the lab bench and placed in a closed container. This is what professional journals
commonly refer to as freshly cleaved mica.
The mica was then divided into 3 sections using a lab marker. One section was
109
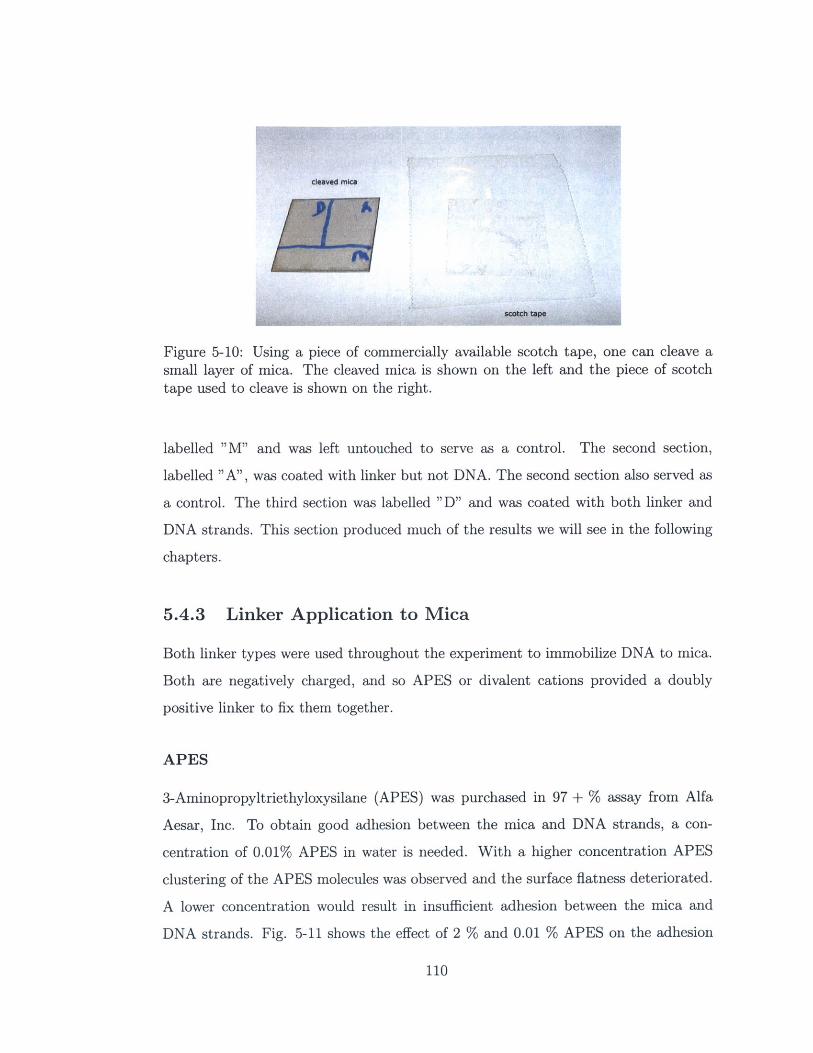
cleaved mica
scotch tape
Figure 5-10: Using a piece of commercially available scotch tape, one can cleave a
small layer of mica. The cleaved mica is shown on the left and the piece of scotch
tape used to cleave is shown on the right.
labelled "M" and was left untouched to serve as a control. The second section,
labelled "A", was coated with linker but not DNA. The second section also served as
a control. The third section was labelled "D" and was coated with both linker and
DNA strands. This section produced much of the results we will see in the following
chapters.
5.4.3 Linker Application to Mica
Both linker types were used throughout the experiment to immobilize DNA to mica.
Both are negatively charged, and so APES or divalent cations provided a doubly
positive linker to fix them together.
APES
3-Aminopropyltriethyloxysilane (APES) was purchased in 97 + % assay from Alfa
Aesar, Inc. To obtain good adhesion between the mica and DNA strands, a con-
centration of 0.01% APES in water is needed. With a higher concentration APES
clustering of the APES molecules was observed and the surface flatness deteriorated.
A lower concentration would result in insufficient adhesion between the mica and
DNA strands. Fig. 5-11 shows the effect of 2 % and 0.01 % APES on the adhesion
110
of DNA to mica. Both images are taken using AFM intermittent tapping mode at 5
Hz.
A solution of 0.01 % APES in water was prepared in two stages. The first stage
prepared 0.05 % APES solution in water. The second used the 0.05 % solution
to prepare 0.01 % solution in water. This was done since the smallest measurable
quantity the automatic pipetter could handle was 2 piL. This multistage protocol
also conserves the amount of DNase/RNase free water needed. The protocol is given
in Appendix A.5.
This dilution of APES was then applied to the linker section, "A", and the
DNA/linker section, "D", of the freshly cleaved mica using a 100 pL automatic pipet-
ter. Droplets of small radius were carefully placed on the mica and the mica was stored
in a closed, sterilized container for 40-50 minutes. Afterwards, the sections of mica
labelled "A" and "D" were rinsed with 2 mL DNase/RNase free water to remove
any contaminants or unbound molecules of APES. This process is summarized in the
protocol of Appendix A.6.
The slides of mica with APES are now ready for the application of DNA.
Magnesium Chloride
Magnesium Chloride was used as a linker from the class of divalent cations. Magne-
sium Chloride was purchased in solution from Sigma Aldrich, Inc. The solution was
divided into 1 mL quantities of 1.00 M MgCl 2 in water. The water in solution was
0.2 micron filtered and tested negative for DNase, RNase, and protease. In solution,
the magnesium ions and the chloride ions dissociate and float as free radicals (for a
wide range of pH).
Linking with magnesium chloride was less time intensive than APES. DNA can
be directly added to a solution of MgC12 in water and the combined solution can be
deposited onto a freshly cleaved mica surface.
Several papers published in the literature suggest that a reasonable concentration
of Mg+ 2 linker is roughly 1.00 mM Mg+ 2 in water [14]. At a higher concentration,
the surface may become too rough for nano imaging, while at lower concentrations
111

Figure 5-11: 1 pg/mL DNA immobilized with 2% APES results in a rough surfacewith indistinguishable features and some clustering (top). 20 pg/mL DNA immo-bilized with 2 % APES resulted in major clustering of the DNA as well (bottom
left). 0.01 % APES immobilizing 1 pag/mL gave very distinguishable DNA images,especially in phase mode (bottom right).
112
there is insufficient binding of the DNA strands to the surface.
Diluting the MgCl2 to an appropriate concentration was carried out as explained
in Appendix A.7
The 1 mM solution was then enriched with the desired DNA and deposited in the
appropriate sections of the mica surface. This step is outlined in the coming section.
It is also worthwhile to note that DNA linked to mica using MgCl2 produced im-
ages with DNA heights closer to the background surface than APES. This is consistent
with the notion that Mg+ 2 is a shorter, stricter linker than APES.
5.4.4 DNA Immobilization on Mica Surface
With mica freshly cleaved, and linker applied to it (or added to the solution of DNA),
all that remains is to deposit the desired DNA in the desired sections. In the case
of Mg+ 2 linkers, the linkers are placed in the solution of DNA, while in the case of
APES linkers, the linkers are deposited onto the freshly cleaved mica before DNA ap-
plication. Both protocols for depositing DNA onto the mica surfaces are summarized
in Appendix A.8 and A.9.
5.4.5 Cantilever Tip Functionalization
This step is concerned with the adsorption of bases to the cantilever tip. The process
of functionalization can be split into 2 parts: gold coating of cantilever and Base
Adsorption.
AC240TS Cantilever
Cantilevers were purchased from Asylum Research, Inc./Olympus Research, Inc., one
of the leader manufacturers of AFM equipment and supplies. The cantilevers used in
this experiment were intermittent contact mode rectangular cantilevers with a spring
constant of 2 N/m, a resonant frequency near 70 kHz, and a cantilever length of 240
pm. The cantilever is made of Si and the tip is Al. The dimensions of the tip are
shown in Fig. 5-12.
113

2402207
Figure 5-12: Olympus Cantilever AC240TS SEM image of cantilever (top left), SEMimages of cantilever tip (top right), and additional dimensional information (bottom).
All units are in yam. (http:// www.asylumresearch.com/ olympus/ Olympusmain.asp)
114

The tip has a length of 14 Mm and a radius of curvature less than 10 nm. This is
especially useful for imaging of nanoscopic features such as single stranded DNA.
The cantilevers protrude from a 3.3 mm x 1.6 mm x 0.3 mm chip and are adhered
to a steel cross using commercially available nail polish as adhesive. The steel cross
is finally mounted to the atomic force microscope by means of magnetic forces.
Gold Coating of Cantilever
Coating the cantilever tip with Gold (Au) is necessary to adsorb the desired bases to
the tip as described in Chapter 4. This step of the process was carried out with the
generous support of SurfaceLogix, Inc (Brighton, MA).
Before Gold was evaporated onto the cantilever tips, a layer of Ti was evaporated
to provide good adhesion for the gold. Ti was evaporated onto the cantilevers using
a BOC-Edwards Auto 306 vacuum coating system. Before evaporation, the system is
pumped down to a very low pressures. By passing a current through a coil containing
gold, small particles of gold are evaporated and rise to the tips placed overhead.
For deposition of Ti, a pump-down pressure of 7.0 x 10⁻⁶ Torr, and a current of
3.2 Amp was used to deposit Ti at a rate of 1 A/sec. For deposition of Au, the same
pump-down pressure was used, and a current of 2.5 Amp was used to deposit Au at
a rate of 5-10 A/sec. Fig. 5-13 shows the setup of the vacuum coating system.
A witness crystal is used to measure the thickness of deposited metal while the
system is in operation. The witness crystal is exposed to the chamber and is coated
at the same time as the samples overhead. During operation, the resonant frequency
of the witness crystal is monitored to determine the amount of metal deposited onto
the samples.
The tips used in this experiment were coated with a 40 Alayer of Ti for adhesion
followed by a 100 Alayer of Au.
It is important to think about the implications of this coating process on the
accuracy of the AFM tip. By adding extra layers of material, one is effectively
increasing the radius of curvature of the tip. For this reason, we only added a small
layer of Ti and Au, even though a thicker layer would guarantee a flatter surface.
115

Figure 5-13: Gold is evaporated from the high-current cradle below to cover the AFMtips overhead. Photo courtesy SurfaceLogix, Inc.
116

For the final product, it is important to reduce the radius of curvature to the limit in
order to ensure single base hybridization.
The cantilevers were annealed after the process of evaporation to allow large gold
crystals to form on the surface. This is important because it creates regular gold
structures that adenine can readily adsorb to.
Annealing was carried out using an industrial hotplate. The cantilevers were
placed on the hotplate once it reached a temperature of 300 'C. After annealing for 7
minutes, the cantilevers were removed from the hotplate and placed on an aluminum
slab (room temperature) to cool.
5.4.6 Base Adsorption
Adsorbing the desired base to the gold coated tip was not a difficult task. As we have
explained, bases in ethanol solution adsorb readily to gold coated surfaces. This pro-
cess has two steps: Creating an ethanol solution of bases and creating an environment
for base adsorption.
Obtaining 1 mM Ethanol Solution of Bases
To conserve the amount of ethanol used, this step was divided into two. First, a
0.222 M solution of bases in ethanol was created, then a sampling of the solution was
diluted to the final concentration of 1 mM. The protocol for this process is given in
Appendix A.10.
Base Adsorption Procedure
Before bases could be adsorbed to the tip, a small box had to be created for the
interaction. This small plastic box was lined with a magnetic strip with double
sided tape. The gold coated cantilevers were glued onto steel crosses as mentioned
above and the steel crosses were placed on the magnetic strip. In such a fashion, the
cantilevers were fixed in place inside the plastic container.
The container was then filled halfway with a solution of 1 mM adenine in ethanol.
117

Figure 5-14: Adenine readily adsorbs onto the cantilever as it is soaked in an adeninesolution. The AFM cantilever is placed on a magnetic strip as adenine adsorbs fromsolution onto the cantilever tip.
The lid was shut and the bases were given 5 minutes to adsorb to the gold surface.
The box with cantilever and adenine solution is shown in Fig. 5-14.
We also attempted to bring the cantilever down onto a drop of solution using the
AFM. However, this method produced irregular and undesirable results. Immediately,
and mostly because of strong surface tensions, the cantilever was deformed to its
extreme. It is feared that such deformation may have damaged the cantilever. Also,
the reflectance of the cantilever was significantly diminished. The laser beam reading
from the photo diode was reduced to half its pre-soak value. It took nearly 20 minutes
for the cantilever to return to a normal state. It is our belief that such behavior is
due to the wetness of the cantilever. In the wet state, the reflectance of the cantilever
118

suffers and the resonance properties change also. For this reason, all cantilevers used
in the experiments were soaked in solution using the small plastic box.
5.5 Summary
In this chapter, we have discussed appropriate background surfaces and have justified
our use of mica. We have also examined APES and divalent cations as possible linkers
between DNA and mica. Further we have explored base functionalization and strand
functionalization as ways of functionalizing the cantilever tip and have decided to
use base functionalization in the experiments. We have then examined in detail the
procedures followed to ready the AFM and the strands of DNA for Genome Scanning.
Now, the setup is complete and we can look at the experimental results.
119

120

Chapter 6
Experimental Results and Analysis
6.1 Introduction
In this chapter we will discuss the experimental results and further analyze our find-
ings. We will begin with the results of the synthesized DNA experiments and then
we will explore the results of the lambda DNA experiments. In particular we will
be looking at DNA scans using as-is cantilever tips as compared to DNA scans using
adenine-coated cantilever tips. We will then analyze the results in terms of accuracy
and speed.
6.2 DNA Profile Data
In Chapter 4 we presented a model predicting the width and profile of DNA expected
in the experiments. The model width of DNA given in Eq. (6.1) was
w = 4vq~ (6.1)
while the model height of DNA was given in Eq. (4.9) as
h= F(R+r)2 -x 2 +r - R. (6.2)
These predictions give us a way to determine whether the DNA being scanned is
121

Cantilever Tip Predicted DNA Widthsingle stranded double stranded
As-is cantilever (10 nm) 8.94 12.65Adenine tip cantilever (24 nm) 13.86 19.60
Table 6.1: Model width prediction for single stranded and double stranded DNAusing as-is cantilevers and adenine-coated cantilever tips. All units are in nm.
single stranded or double stranded. Typically this would be ascertained by looking
at the heights of the strands (ssDNA has a theoretical height of 1 nm while dsDNA
has a theoretical height of 2 nm). However, since the heights of the DNA strands are
distorted due to the hybridization of adenine and thymine, we need to resort to our
DNA width model to determine the number of strands in an image.
Using this model, we can find an expected width of DNA single- and double-
strands using AC240TS cantilever tips. Table 6.2 summarizes the expected DNA
widths of the strands of DNA.
The radius of curvature for adenine-coated cantilevers is estimated to be 24 nm,
which breaks down into a 10 nm as-is radius of curvature, a 4 nm titanium layer for
adhesion, and a 10 nm layer of Au.
6.3 Synthesized DNA results
With this information in hand, we can analyze the resulting scans of synthesized
DNA. A 40x T synthesized strand of DNA was scanned using an as-is AC240TS
intermittent contact cantilever with a tip radius of 10 nm. The cantilever was then
immersed in an adenine solution in ethanol as described in Section 5.4.6. The sample
was scanned using the adenine coated tip and the results compared. Scans of freshly
cleaved mica using both tip types were used as control.
Because of the extremely small base length of the synthesized DNA, it is extremely
difficult to image it using as-is cantilevers. As the base length increases, it becomes
easy to recognize a pattern of DNA along the scanned mica surface. The DNA we
122

are using however is only 40 bases long. These strands of DNA, when immobilized
to the surface, can either be coiled or stretched. In its coiled form, we can expect a
base pair separation along the helical axis of 3.4 A, as described in Chapter 2. In its
linear state, we can easily calculate a base pair separation of 6.28 A(given that the
helix radius is 1 nm and that there are 10 bases per revolution).
In other words, a 40 bp strand of DNA will be between 13.6 nm and 25.12 nm
long. This is extremely difficult to see in an AFM image using an as-is cantilever and
oftentimes blends into the background noise. However, as we will see, the DNA is
easily identified using an adenine-coated tip.
The experiment was designed to demonstrate the specificity of Genome Scanning.
We are trying to show that an a-tip will pick up information regarding thymine but
not regarding other bases. To demonstrate this, 3 different types of scans were taken:
" Au-coated tip on freshly cleaved mica.
" Au-coated tip on 40x T substrate.
* Adenine Au-coated tip on 40x T.
Fig. 6-1 through 6-4 show the three types of images. All images have been
flattened to adjust for tilted and warped surfaces. All images were taken in height
intermittent contact mode at a scan rate of 5 Hz with a PID control gain of 10, 20,
and 0 respectively. These gains were chosen to produce an image with crisp features
without sending the cantilever tip into an instability. The setpoint offset, which
determines the force with which the cantilever pushes against the surface, was set to
65%.
The Au-coated tip did not detect any heights on freshly cleaved mica. This is to
be expected as there were no DNA strands present on the substrate. Freshly cleaved
mica 1 pm x 1 Mm was scanned 4 more times using the Au-coated tip and no heights
were detected (See Fig. 6-1).
Next, a freshly cleaved mica substrate with 40x T strands immobilized on the
surface was imaged using the Au-coated cantilever tip. The imaging parameters were
kept constant and equal to their values from the previous experiment.
123

1000z
ColorScale
900
600
18
5w0
400 4
3.0
2
100 nm
* 00 20 300 40 so -600 700 M so0 10Mscales in nm
Figure 6-1: No heights were detected in 5 different scans of mica using a Au-coatedtip
124

This image is shown in Fig. 6-2 and shows no sign of identifiable strands of DNA.
To further examine the situation, 5 more scans of a 4 pm x 4 pm area were taken
with no identifiable strands of DNA. It is understandable that the strands of DNA
would not be visible since they have so few bases and in theory are only 1 nm high.
It is worth noting that marking an exact location on the mica surface was not
feasible at this time. Instead, a 1 cm square was drawn on the back of the mica
sheet and all scans were taken within the square. It is assumed throughout these
experiments that the mica surfaces are uniformly coated with DNA and as such all
scans in that area should display the same information. However, to prove our results
conclusively, we need to place nanoscale markers on the mica surface and image the
same area with and without an adenine coated tip. This problem is being explored
beyond the current writing and will be reported elsewhere.
Finally, the Au-coated tip was soaked in a container of 1 mM adenine in ethanol.
Adenine molecules had a chance to adsorb onto the gold surface for 5 minutes, before
the cantilever was removed from the container and allowed to air dry inside a second
container.
The adenine soaked cantilever tip did a wonderful job of imaging the 40x T DNA.
What was invisible using a Au-coated tip was now observable. Fig. 6-3 shows a
strand of 40x T DNA as imaged using adenine soaked tips.
Fig. 6-4 shows two more sites with identifiable 40xT DNA strands. The images
show how distinct the interaction of the thymine bases on the immobilized single
stranded DNA with the adenine adsorbed to the cantilever tip is.
To examine in more detail the appearance of 40x T DNA as imaged by an adenine
soaked AFM tip, we need to look at the heights of strands as well as the width of the
DNA imaged. This information is compiled in Table 6.3, where local height refers to
the height relative to the local baseline and global height refers to the height relative
to the global baseline.
The average local height of the DNA strands is 4.92 nm and the average global
height is 6.39 nm. These values are far greater than the physical ssDNA height of 1
nm. If one factors in the added height due to hybridization of an estimated 10 thymine
125

zColorScale
25
20
1400
1200-
low .
am00
400-
200-
nm
0 -r3
Figure 6-2: Nocoated tip.
Scales in nm
height are visible on 40x T DNA immobilized to mica using a Au-
40x T DNA imaged using Adenine coated tipSite width (min) width (max) local height global height
1 12.48 14.62 6.02 6.822 16.05 20.83 5.73 6.533 12.27 15.47 3.01 5.82
Table 6.2: Three strands of 40x T imagedand Fig. 6-4. All units are in nm.
using Adenine soaked tips from Fig. 6-3
126

Scal
100 a
2S
pa
3t:0
i rw
42
MS;le in" nm
Figur 6 U a ke gold tip ira t v% < l &
'ao p j N
4 44
PN 4' .. 4..-2 % w"
I "!
%ete in
FiMr 6-3 Usin ..I adr; okdgodtp mgs f4xTsrnd fDAbcm
uiibe Ths :tad eeno iil sn9nasi atlvrtp
127

zColorScale
1200
1000
80
80
200
0 200 400 600
Figure 6-4: Two 40x T DNA strands arecantilever tip.
-10
-g
-I
.7
.6
nm
Scales in nm
visible using an adenine soaked Au-coated
128
bases with 10 adenine bases, one arrives at an expected image height of 1.3138 nm
(see Eq. 4.3). Even if one assumes that all 40 thymine bases on the strand of DNA
are hybridizing with the adenine coated tip, we calculate an additional deflection of
40 -62.75pN = 2.00Nm 1 * Xdefection, (6.3)
which yields
Xdeflection = 1.255nm. (6.4)
Adding this deflection to the physical height of the ssDNA, we expect 2.255 nm
heights. Instead, we see in the experimental images heights that are twice this size.
This addition in height is not fully understood at the moment, but is most welcome
as a way of identifying thymine bases using adenine coated tips.
6.4 Lambda DNA Results
6.4.1 As-is Cantilever
The purpose of the Lambda DNA experiment is to detect a difference in the way as-is
cantilevers and adenine coated cantilevers respond to thymine bases on the strand
of DNA. Such a difference would demonstrate conclusively the power of Genome
Scanning and its applicability.
To this end, 48 kbase strands of Lambda DNA were denatured and immobilized
on a mica substrate using Mg 2 + divalent cations. The specifics of these procedures
are discussed in Chapter 5. These strands of DNA were scanned using both an as-is
cantilever tip and an annealed adenine coated cantilever tip.
The scan was taken in height intermittent contact mode at a scan rate of 5 Hz,
PID gains of 10, 20, and 0 respectively, and a resolution of 600 samples per line. As
previously explained, the PID gains were chosen to yield crisp images without sending
the cantilever into instability. The scan area was set to 600 nm x 600 nm and the
setpoint offset, which determines how hard the cantilever presses against the surface,
129

was fixed at 65 %.
Fig. 6-5 shows the image of Lambda DNA scanned with an as-is cantilever tip.
As one can see, the AFM was able to successfully image strands of DNA. However,
not all the strands were in the denatured single-stranded form. Some of the strands
existed in dsDNA form and some were coiled and super coiled. Single stranded DNA
and coiled DNA could be distinguished by examining the width of the strands scanned
by the AFM and comparing them to the model values in Table 6.2. For the purposes
of forming an all-encompassing comparison, we have examined the heights of single
stranded segments as well as wider coiled segments.
10 single stranded segments and 10 coiled segments were examined.
Single Stranded Lambda DNA
Single stranded data is given in the top half of Table 6.4.1. The width of DNA strand
(both minimal and maximal) are given for each of the points examined. Further, 3
different kinds of heights were looked at. First, the estimated height from when the
AFM starts to sense an upwards force until when the scan changes slope from positive
to negative is recorded. This is labelled simply as the "Height". Next, the maximum
change in height from the top of DNA peak to the depths of the surrounding pits
is measured. This is called "Peak-Valley" in the analysis. Finally, the highest point
along the imaged DNA is compared to the long-range average height. This value is
the "Global Height".
The values of DNA width in Table 6.4.1 indicate that the strands are indeed single
stranded at the measured locations. Since the tips had modest use at the time of the
experiment, one expects to see ssDNA width of 9 nm as opposed to dsDNA width
of 13 nm.
Further, one can tell that the average global height is 2.90 nm. This is higher than
than the expected height of ssDNA ( 1.0 nm), but is on the right order of magnitude.
With atomic force microscopy, height information can oftentimes be misleading. For
this reason scientists and researchers tend to look for relative height data. We will use
this height data in comparison to scans which employ an adenine coated cantilever
130

600
ColorScale
220
400
300
140
nM
a too 29 300 4W 6W080ScsMes in run
Figure 6-5: Single stranded DNA scanned using an as-is AC240TS cantilever. Singlestranded DNA heights were recorded at the locations indicated with white numbers.Coiled DNA height information was recorded at the locations indicated with black
numbers.
131

As-is Tip on single stranded Lambda DNA
Site Width (min) Width (max) Height Peak-Valley Global Height
1 8.71 11.55 2.67 3.83 3.02 9.93 11.87 2.83 3.83 3.533 7.56 10.21 2.41 3.47 4.084 8.26 9.01 2.53 4.28 1.225 9.04 9.27 2.55 6.98 2.366 8.56 10.42 3.7 5.19 2.757 8.2 9.43 2.01 4.08 2.918 9.19 11.54 3.85 6.57 2.149 7.56 10.85 3.41 5.07 2.6210 8.01 9.43 4.18 5.64 4.43
As-is Tip on Coiled Lambda DNA
Site Width (min) Width (max) Height Peak-Valley Global Height
1 20.99 27.37 10.93 15.05 11.222 26.7 28.19 10.21 13.61 9.713 22.99 26.33 8.19 14.95 11.334 17.44 25.05 8.57 10.66 8.535 20.71 27.22 3.89 7.21 6.46 19.52 26.97 6.93 10.4 7.637 18.41 26.72 7.14 9.35 8.058 17.76 21.86 4.35 6.89 4.619 21.56 27.52 8.41 10.98 9.1710 17.47 19.99 6.46 10.8 8.63
Table 6.3: Top:Experimental single stranded DNA heights as scanned by an as-iscantilever tip. Bottom: Experimental coiled DNA heights as scanned by an as-iscantilever tip. Measurements in these tables conform to the model predictions ofheight given width with some degree of certainty. All units are in nm.
132
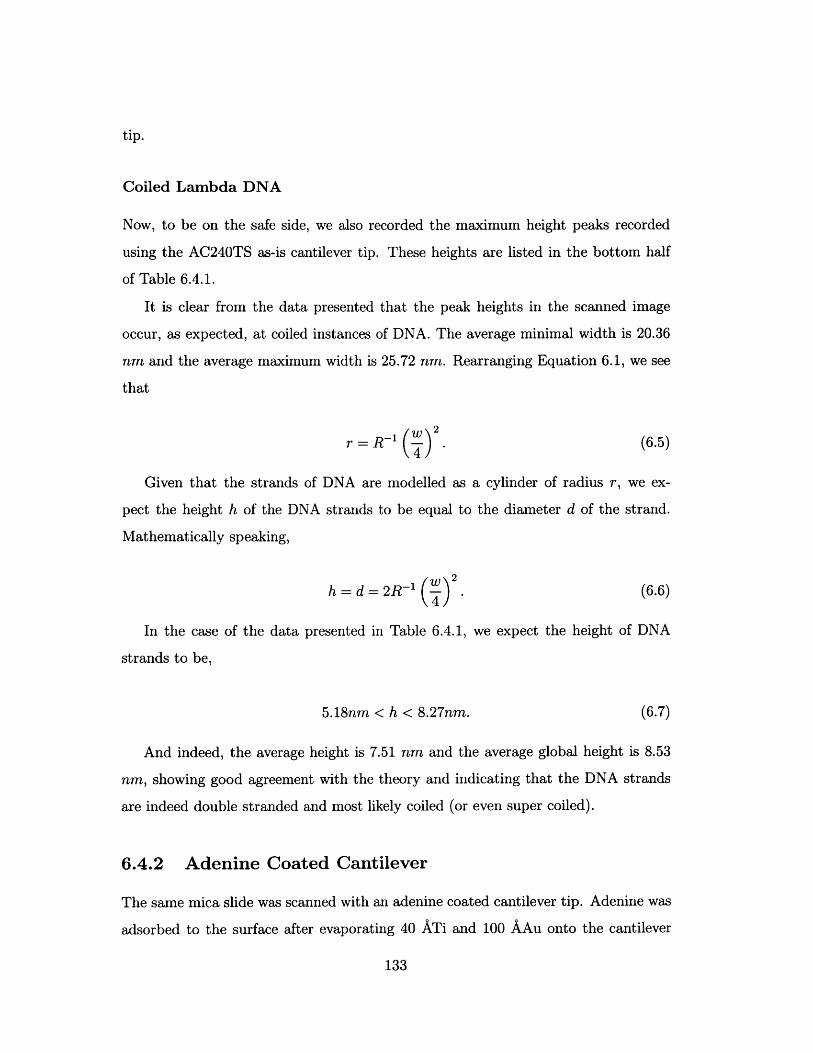
tip.
Coiled Lambda DNA
Now, to be on the safe side, we also recorded the maximum height peaks recorded
using the AC240TS as-is cantilever tip. These heights are listed in the bottom half
of Table 6.4.1.
It is clear from the data presented that the peak heights in the scanned image
occur, as expected, at coiled instances of DNA. The average minimal width is 20.36
nm and the average maximum width is 25.72 nm. Rearranging Equation 6.1, we see
that
r = R- . (6.5)
Given that the strands of DNA are modelled as a cylinder of radius r, we ex-
pect the height h of the DNA strands to be equal to the diameter d of the strand.
Mathematically speaking,
h=d=2R-1 (). (6.6)
In the case of the data presented in Table 6.4.1, we expect the height of DNA
strands to be,
5.18nm < h < 8.27nm. (6.7)
And indeed, the average height is 7.51 nm and the average global height is 8.53
nm, showing good agreement with the theory and indicating that the DNA strands
are indeed double stranded and most likely coiled (or even super coiled).
6.4.2 Adenine Coated Cantilever
The same mica slide was scanned with an adenine coated cantilever tip. Adenine was
adsorbed to the surface after evaporating 40 ATi and 100 AAu onto the cantilever
133

tip followed by an annealing process at a temperature of 300 *C. The exact process
used is explained in Chapter 5.
The same scan conditions were used with adenine coated cantilever tips as with
as-is cantilevers. The resulting image is shown in Fig. 6-6 with measured sites labelled
in black numbers. These numbers represent the sites of maximum imaged heights.
Analyzing these heights one sees that they represent areas of single stranded DNA.
Using Eq. (6.1) and a cantilever radius of curvature of 24 nm, we expect single
stranded DNA widths of 13.86 nm. In comparison, double stranded DNA widths
using the same cantilever would be 19.60 nm. Table 6.4.2 shows the experimentally
measured widths of DNA strands and their corresponding heights. It also affirms that
the sites measured are indeed single stranded.
As stated at the beginning of this chapter, the adenine coated tips have a 24 nm
radius of curvature. Inserting this value into Eq. (6.6), we see that
h = d = 2 -24-1 (W) 2 (6.8)
As we can see in Table 6.4.2, the average width is between 12.49 nm and 14.60
nm. Plugging these numbers into Eq. (6.8), we predict a DNA strand height of
0.813nm < h < 1.11nm. (6.9)
However, the experimentally gathered data has an average height of 16.88 nm and
an average global height of 17.49 nm! These figures are far greater than the expected
heights given the recorded widths and thus indicate a special kind of interaction-one
that is easily distinguishable.
This coupled with the fact that not the entire strand of DNA elicits such a reaction
indicates that the adenine coated cantilever is greatly attracted to a certain type of
base on the strand of DNA. Chemically speaking, this base can only be thymine, the
complement of adenine. It makes sense that the adenine coated tip is deflecting the
most when it scans an area of large thymine concentration. The adenine bases are
hybridizing with thymine and causing the cantilever to deflect even more.
134

zA Scele
2-02
160
Br
Scls nn
Fgr6-6:Lmd N cne usn aanelddniecatdcniertpgavelarg spkes f heght
135

Adenine Coated Tip on single stranded Lambda DNA (hybridization sites)
Site Width (min) Width (max) Height Peak-Valley Global Height
1 13.09 14.01 15.74 17.66 15.762 10.09 15.06 20.83 21.17 16.833 14.07 15.37 16.61 23.42 18.764 14.62 16.29 15.67 22.01 18.85 10.17 12.61 17.02 20.0 18.326 13.63 14.55 14.79 18.76 16.827 10.38 13.12 16.77 21.77 18.388 13.93 15.42 16.58 18.54 18.119 13.5 15.19 17.19 20.4 15.5410 11.38 14.4 17.63 19.99 17.58
Adenine Coated Tip on single stranded Lambda DNA (non-hybridization sites)
Site Width (min) Width (max) Height Peak-Valley Global Height1 10.58 14.73 2.15 3.39 2.362 11.65 14.38 2.57 3.71 3.253 11.02 13.78 2.78 4.46 2.824 12.65 14.11 1.97 4.13 2.165 13.03 14.44 2.48 3.23 2.496 12.70 14.55 2.63 3.40 2.927 13.26 14.23 1.49 2.88 2.138 13.67 16.36 1.69 4.06 3.349 14.35 15.24 1.76 1.91 2.9210 13.63 16.48 2.83 3.82 1.82
Table 6.4: Experimental single stranded DNA heights as scanned by an adeninecoated AC240TS cantilever tip. The top 10 points represent locations where thetip hybridized with the DNA. The bottom 10 points represent points where no hy-bridization occurred. It is clear from these tables that hybridization events produceunusually large deflections of the cantilever when compared with non-hybridizationevents. All units are in nm.
136

0 2 4 6 8 10 12 14 16 18 20 22Height (nm)
Figure 6-7: DNA heights appear much greater when using an adenine tip than whenusing an as-is tip.
A comparison of DNA heights recorded using an as-is tip and an adenine coated
tip would be very useful here. Fig. 6-7 shows this comparison. It is clear from the
figure that the single-stranded DNA heights using an as-is tip are clustered around
a mean height of 3.01 nm with a standard deviation of 0.72 nm. Similarly, the non-
hybridized single-stranded DNA scanned with an adenine coated tip centered around
a mean height of 2.16 nm with a standard deviation of 0.44 nrm. However, when the
adenine coated tip hybridized with the bases of ssDNA, the observed heights had a
mean of 16.88 nrm with a standard deviation of 1.62 nm.
These results are truly astounding in confirming Genome Scanning as a viable
process for DNA sequencing.
6.5 Accuracy Analysis
The experiments conducted were meant as a proof of concept and an indication of
the great potential of Genome Scanning. They were not intended to yield pinpoint
accuracy. What we have seen thus far is the ability of Genome Scanning to sequence
137
no hybridization hybridization
Adenine p, ssDNAx As-is ip, ssDNA

areas with large concentrations of a particular base, but we have not demonstrated
that Genome Scanning can distinguish a molecule of thymine in a sea of adenine (in
other words positional accuracy). That remains to be shown. So while we cannot say
that we are able to image single bases at this time, we can say that Genome Scanning
has enabled us to image small clusters of bases. The large heights shown in Fig. 6-6
correspond in length to clusters ranging from 3.5 nm to 13.1 nm. In other words, we
were able to sequence down to an accuracy of 6 to 26 bases. Further work is necessary
to improve the accuracy of Genome Scanning and we will make recommendations to
that effect in the following chapter.
6.6 Speed Analysis
One of the most important factors of a useful DNA sequencing technique is its speed
capabilities. As we have seen, current methods require years to sequence a single
human genome. The proposed method needs to sequence a genome in less than a
week. Ideally, a patient would walk into their doctor's office, give a drop of blood,
then return shortly thereafter to discuss the implications of their sequenced DNA.
The experiments conducted show the power of Genome Scanning. Using this
data, we can identify a theoretical speed limitation using current technology. This
limitation is caused by the scan speed and the sample rate.
In the experiments conducted, we have used a a scan speed of 5 Hz (lines per
second). This resulted in reasonably crisp images. At higher speeds the image became
somewhat blurry and it became difficult to distinguish features of the sample. At lower
speeds, the image remained intact. Hence, we continued imaging at a scan rate of 5
Hz. However, the absolute limit on scan rates possible imposed by the Quesant AFM
is 20 Hz, and this is the theoretical limit achievable with an improved technique.
The sample rate is also crucial in determining a theoretical speed limitation. The
limitation here is our ability to distinguish which bases belong to which strand. If
the entire surface were coated with DNA strands, then one would not be able to
sequence bases along one strand. At best, one can imagine creating parallel "lanes"
138

of DNA on the mica surface. Every other lane would be loaded with DNA while the
interstitial lanes would be left empty, allowing the researcher to assign bases to a
particular strand. This implies that one could only coat half the surface with mica.
In other words, we can at best expect one point of information per every 2 samples.
In summary, we can expect:
* 20 lines per second
* 600 samples per line
* 1 base sequenced per 2 samples
Taking these parameters into consideration, we can estimate the theoretical speed
of Genome Scanning to be
20 -600 samples -0.5 bases = 6000 bases. (6.10)sec line sample sec
A sequencing rate of 6000 bases per second translates to 5.78 days to sequence
the entire human genome (3 billion bases). Compared to current technologies, this is
absolutely astounding.
6.7 Summary
In this section we have looked at the experimental results from both synthesized
DNA and lambda DNA. We have seen that Genome Scanning enhances the detection
of complementary bases on synthesized DNA and we have seen that it also greatly
magnifies the cantilever deflection due to complementary bases of lambda DNA. While
the results do not demonstrate single base accuracy, they do hold to an accuracy of
3 to 26 bases. On the other hand, the speed analysis is phenomenal. Using Genome
Scanning, we can expect a sequencing time of 5.78 days per human genome (3 billion
bases).
139

140
Chapter 7
Conclusions and Recommendations
7.1 Conclusions
Genome Scanning, the process of sequencing DNA immobilized to mica using an
atomic force microscope, has proven its vast potential in the experiments of this
thesis. Genome Scanning reduces the amount of pre-sequencing preparation time
needed and eliminates the need for fluorescent dies entirely. Genome Scanning also
enables sequencing at a maximum rate of 360,000 bases per minute. In other words,
the 3 billion bases that comprise a human genome can be sequenced in less than 6
days using this technique. With such incredible speeds, personal genome sequencing,
with all the medical benefits it brings, can become a reality.
7.2 Recommendations
There are, however, several issues that need to be addressed to optimize Genome
Scanning. We are recommending further work in the following areas:
" Genome Scanning Accuracy
" Genome Scanning Speed
" Multiple Base Scanning
141

7.2.1 Genome Scanning Accuracy
We have shown in the experiments, Genome Scanning can clearly detect a specific
base type on natural lambda DNA. However, we have not worked on fine tuning the
accuracy of this method. In order for Genome Scanning to be successful, one needs
to take one of two approaches.
First, one could allow the tip to sequence several bases concurrently (as is currently
the case) and focus efforts on developing software to pinpoint the location of the base
type. This can be accomplished by using averaging and overlay techniques that would
point the user to the "center" of activity (ie the base being imaged).
Alternatively, one could focus on making the tip smaller and more accurate, so that
only one base is in contact with the tip at any given point in time. To accomplish
this, we strongly recommend the use of carbon nanotube equipped cantilever tips.
Carbon nanotubes have a small enough radius that one can achieve single base contact
between cantilever tip and immobilized DNA. They are also made of organic material
that lends itself well to bonding with the desired bases.
7.2.2 Genome Scanning Speed
Current achievable speeds are quite impressive. However, these speeds depend on our
ability to utilize the high sampling rate of the AFM. To accomplish this, one needs
to take one of two approaches: Either one must cover the mica surface effectively
with DNA strands or one must program the AFM to only scans areas which contain
immobilized DNA.
The first approach entails a high density of DNA per surface area and it entails
that we eliminate looping of the DNA (as shown in Fig. 5-6). These issues have not
been dealt with in this thesis and require further research. Two promising remedies to
these problems are DNA combing and meniscus straightening. DNA combing uses a
physical "comb" to align DNA strands in a linear orientation. Meniscus straightening
uses a receding water line to force DNA into a linear orientation as well. Both methods
could lead to improved speeds and faster sequencing.
142

The second approach requires an algorithm that will "lock on" to DNA strands
and, using trajectory control, will instruct the AFM to only scan areas which contain
immobilized DNA. Such an algorithm is within the grasps of current technologies and
would aid in Genome Scanning greatly.
7.2.3 Multiple Base Scanning
Currently, we are using one AFM head with one cantilever tip to scan for one base
type. If Genome Scanning is to become practical, one will require four cantilever tips,
each coated with a specific base (A, C, T, or G) to scan for each of the four base
types. (In theory, one only needs scan for three of the bases and assume that unexcited
regions are composed of the fourth base type.) This requires the construction of a new
AFM with multiple cantilever tips monitored by multiple laser beams or monitored
using a single actuated laser beam shared between the cantilevers.
143

144

Appendix A
Protocols
A.1 Lambda DNA Dilution Protocol
1. A 2 mL test tube was filled with 1.647 mL DNase/RNase free water.
2. Using a 20 pL automatic pipetter, 3 pL of 0.55 pg/pL Lambda DNA werepipetted into the test tube.
3. The 1 pg/mL Lambda DNA solution was shaken gently for 30 seconds.
A.2 Lambda DNA Denaturation Protocol
1. A hotplate/stirrer was used to uniformly heat a 200 mL beaker of deionizedwater to 90'C.
2. The stirrer was used to circulate the contents of the beaker and ensure uniformheating.
3. A mercury thermometer was used to monitor the temperature of the deionizedwater bath.
4. A test tube containing 1 pg/mL solution of lambda DNA in water was sus-pended in the 90 C water bath for 15 minutes.
5. The test tube was then removed from the water bath and washed in a streamof cold water for 2 minutes.
145

A.3 40x T Synthesized DNA Dilution Protocol
1. A 15 mL test tube was filled with 12.5 mL DNase/RNase free water.
2. The contents of the synthesized DNA vial were emptied into the 15 mL testtube.
3. The current concentration is 20 pg/mL.
4. A second 15 mL test tube was filled with 4.75 mL DNase/RNase free water.
5. 250 ptL were pipetted from the 20 pg/mL solution to the second 15 mL testtube.
6. The current concentration in the second test tube is 1 pg/mL.
7. The 1 pg/mL 40x T synthesized DNA solution was shaken gently for 30 seconds.
A.4 40x A Synthesized DNA Dilution Protocol
1. A 15 mL test tube was filled with 10.0 mL DNase/RNase free water.
2. The contents of the synthesized DNA vial were emptied into the 15 mL testtube.
3. The current concentration is 20 pg/mL.
4. A second 15 mL test tube was filled with 4.75 mL DNase/RNase free water.
5. 250 ptL were pipetted from the 20 pg/mL solution to the second 15 mL test
tube.
6. The current concentration in the second test tube is 1 pg/mL.
7. The 1 pg/mL 40x A synthesized DNA solution was shaken gently for 30 seconds.
146
A.5 APES Dilution Protocol
Stage I:
1. 10 mL DNase/RNase free water were placed in a 15 mL test tube.
2. 5 pL APES were pipetted using a 20 pL automatic pipetter into the test tube.
3. The solution is now 0.05% APES in water.
Stage II:
1. 12 mL DNase/RNase free water were placed in a second 15 mL test tube.
2. 3 mL of 0.05% APES in water were pipetted into the second test tube.
3. The solution is now 0.01% APES in water.
A.6 APES Application Protocol
1. 0.01% APES in water was applied to freshly cleaved mica.
2. Mica with APES was stored in a closed, sterilized container for 40-50 minutes.
3. Mica with APES was rinsed with 2 mL DNase/RNase free water.
4. One side of the mica was blocked off on sterile laboratory wipes.
5. Mica with APES was blow-dried using a gentle gust of compressed air.
A.7 MgCl 2 Dilution Protocol
1. A 15 mL test tube was filled with 5 mL DNase/RNase free water.
2. Using a 20 pL automatic pipetter, 5 pL of 1 M MgCl 2 were pipetted into the
test tube.
3. The solution is now 1 mM MgCl2 .
4. The solution was shaken gently for 30 seconds
147

A.8 DNA Immobilization on Mica Protocol (Mg2+Linker)
1. A sheet of freshly cleaved mica was placed in a small Petri dish.
2. Using a 100 pL automatic pipetter, 50 mL of 1 pg/mL Lambda DNA dissolvedin 1 mM Mg2+ was deposited onto the mica surface.
3. The Petri dish was covered and the solution was allowed to incubate for 15minutes
4. The mica surface was rinsed gently with 2 mL DNase/RNase free water.
5. One side of the mica sheet was blocked off onto a laboratory wipe.
6. The mica was placed in the Petri dish and covered to dry for 10 minutes.
A.9 DNA Immobilization on Mica Protocol (APESLinker)
1. A sheet of freshly cleaved mica with APES linkers on the surface was placed ina small Petri dish.
2. Using a 100 pL automatic pipetter, 50 mL of 1 pg/mL Lambda DNA in waterwas deposited onto the mica surface.
3. The Petri dish was covered and the solution was allowed to incubate for 15-30minutes.
4. The mica surface was rinsed gently with 2 mL DNase/RNase free water.
5. One side of the mica sheet was blocked off onto a laboratory wipe.
6. The mica was placed in the Petri dish and covered to dry for 10 minutes.
148

A.10 1.0mM Base Solution in Ethanol Protocol
Stage I:
1. 10 mL of ethanol were poured into a 15 mL test tube
2. Using an electronic scale, 0.3 g of Adenine were weighed on a piece of weighing
paper
3. The Adenine was slowly placed in the ethanol test tube
4. The solution is now 0.222 M.
5. The solution was shaken vigorously as Adenine is not very soluble
Stage II:
1. 2.22 mL of ethanol was poured into a second 15 mL test tube
2. The solution of 0.222 M adenine in ethanol was shaken vigorously
3. 10 pL were pipetted from the 0.222 M adenine in ethanol solution and placed
in the second test tube
4. The second test tube contains 1.0 mM adenine in ethanol
149

150

Appendix B
DNA theoretical Models
B.1 DNA Profile Predictions:Matlab Code
XExpected width of DNA using a tip with radius of curvature
%Ahmed Elmouelhi, MIT, Mechatronics Research Laboratory
%1/10/2003
%units in nm
clear all x=(-20:.01:20);
R=10r=0 .5
R2=24r2=0 .5
R3=30r3=0.5
%radius of curvature of tip %bare tip
%radius of DNA cylinder (0.5 for ss, 1.0 for ds)
Xradius of curvature of tip X10tip+10au+4ti Coating type 1
%radius of curvature of tip 10tip+15au+5ti Coating type 2
%for R, rfor i=1:length(x),
if x(1,i)>(R+r)h(1,i)=0;
elseif x(1,i)==(R+r)
h(1,i)=0;
else
%condition when there is a gap between DNA and tip
h(1, i)=sqrt((R+r)^2-x(1,i)^2)+r-R; %tip in contact with DNA
end
151

if h(1,i)<O %condition when tip makes contact with substrate
h(e,i)=n;end
end
%for R2, r2
for i=1:length(x),
if x(1,i)>(R2+r2) %condition when there is a gap between DNA and tip
h2(1,i)=0;
elseif x(1,i)==(R2+r2)
h2(1,i)=0;
else
h2(1, i)=sqrt((R2+r2)^2-x(1,i)^2)+r2-R2; %tip in contact with DNA
end
if h2(1,i)<0 %condition when tip makes contact with substrate
h2(1,i)=0;
end
end
%for R3, r3
for i=1:length(x),
if x(1,i)>(R3+r3) %condition when there is a gap between DNA and tip
h3(1,i)=0;
elseif x(1,i)==(R3+r3)
h3(1,i)=0;
else
h3(1, i)=sqrt((R3+r3)^2-x(1,i)^2)+r3-R3; %tip in contact with DNA
end
if h3(1,i)<0 Xcondition when tip makes contact with substrate
h3(1,i)=0;
end
end
plot(x, h, 'b-', x, h2, 'r--', x, h3, 'g:') legend('as-is tip',
'lightly coated tip', 'heavily coated tip') xlabel('nm')
ylabel('nm')
152

Appendix C
List of Vendors
C.1 Chemical Supplies
VWR International, Inc.975 Overland Ct.SanDimas, CA 91773phone:877-VWR-PSCSfax:888-890-9124web: http:// www.vwr.com
Laboratory equipment, pipetters
Sigma-Aldrich CorporationBox 14508St. Louis, Missouri 63178phone: 800-325-3010fax: 800-325-5052web: http:// sigma-aldrich.com
Bases in powder form, MgCl2 in solution, APES, filtered water
153
C.2 Biological Supplies
Invitrogen Corporation (Life Technologies)
1600 Faraday Avenue PO Box 6482Carlsbad, California 92008phone: 760-603-7200fax: 760-602-6500web: http:// www.invitrogen.com
Lambda DNA, Cat. No. 25250-028
Harvard Medical School Biopolymers Facility
Warren Alpert Building
200 Longwood Avenue
Boston, MA 02115phone: 617-432-7481web: http:// genome.med.harvard.edu/
Synthesized DNA, 40x A, 40x T
C.3 Atomic Force Microscope and Supplies
Asylum Research, Inc.
341 Bollay Dr.Santa Barbara, CA 93117-5550phone: 805-685-7077fax: 805-685-5007web: http:// www.asylumresearch.com/
AC240TS non-contact cantilevers
154

Molecular Imaging, Inc.9830A S. 51st Street, Suite A124Phoenix, AZ 85044phone: 480-753-4311fax: 480-753-4312web: http:// www.molec.com/
CONT contact cantilevers, NCH non-contact cantilevers
Quesant Instrument Corporation17 Bridge StreetGreat Barrington, MA 01230phone: 413-528-8030fax: 413-528-8069web: http:// www.quesant.com/
Quesant QScope atomic force microscope
Structure Probe, Inc.P.O. Box 656West Chester, PA 19381-0656phone: 610-436-5400fax: 610-436-5755web: http:// www.2spi.com/
Muscovite mica background substrate
C.4 Thin Film Coating
Surfacelogix, Inc.50 Soldiers Field PlaceBrighton MA 02135
155

phone: 617-783-8866fax: 617-783-8877web: http:// www.surfacelogix.com
Au evaporation, Ti evaporation
156
Bibliography
[1] Stanford genome technology center - technology development group. http://
sequence-www.stanford.edu/ group/ techdev/ auto.html, November 2000.
[2] Millipore laboratory catalog. 80 Ashby Road, Bedford, MA, 2001-2002.
[3] Human genome project progress. http:// www.ornl.gov/ hgmis/ project/
progress.html, October 2002.
[4] American society for mass spectrometry. http:// www.asms.org/ whatisms/
p4.html, January 2003.
[5] Amicon bioseparations. http:// www.millipore.com/ lifescience/ products.nsf/
docs/ amiconul?open&path= lifescience - drugdiscovery.nsf, January 2003.
[6] D. P. Allison, P. S. Kerper, M. J. Doktycz, J. A. Spain, P. Modrich, F. W.
Larimer, T. Thundat, and R. J. Warmack. Direcet atomic force microscope
imaging of ecori endonuclease site specifically bound to plasmid dna molecules.
Proceedings of the National Academy of Science - Applied Biological Sciences,
93:8826-8829, August 1996.
[7] Bernardo Dantes Aumond. High precision stereo profilometry. PhD thesis, Mas-
sachussets Institute of Technology, 77 Massachussetts Ave., Cambridge, MA, 2
2001.
[8] Eugene A. Avallone and Theodore Baumeister III. Marks' Standard Handbook
for Mechanical Engineers. McGraw-Hill, 10 edition, 1996.
157

[9] T. Boland and B. D. Ratner. Direct measurement of hydrogen bonding in dna nu-
cleotide bases by atomic force microscopy. Proceedings of the National Academy
of Science, USA - Biophysics, 92:5297-5301, June 1995.
[10] Craig Counterman. Periodic table of the elements: Electronegativity. http://
web.mit.edu/ 3.091/ www/ pt/ pert8.html, January 2003.
[11] Cees Dekker and Mark Ratner. Electronic properties of dna. Physics World,
August 2001.
[12] Bruce Alberts et al. Essential Cell Biology: An Introduction to the molecular
biology of the cell. Garland Publishing, New York, 1998.
[13] Rudolph Gilmanshin and Eric Chen. Us patent 6,263,286: Method of analyzing
polymers using a spatial network of fluorophores and fluorescence resonance en-
ergy transfer. http:// www.usgenomics.com/ technology/ US06263286.pdf, July
2001.
[14] Wanhai Han, S. M. Lindsay, Mensur Dlakic, and Rodney E. Harrington. Kinked
dna. Nature, 386(6625):563, April 1997.
[15] Belal Helal. Uv imaging of electrophoresis gels: a non-invasive, nanogram level
quantification of dna. Master's thesis, Massachusetts Institute of Technology, 77
Massachusetts Ave., Cambridge, MA, 2 2002.
[16] John J. Kasianowics, Eric Brandin, Daniel Branton, and David W. Deamer.
Characterization of individual polynucleotide molecules using a membrane chan-
nel. Proceedings of the National Academy of Science USA-Biophysics, 93:13770-
13773, November 1996.
[17] David A. LaVan, David M. Lynn, and Robert Langer. Moving smaller in drug
discovery. Nature Reviews, 1:77-84, January 2002.
[18] Gil U Lee, Linda A. Chrisey, and Richard J. Colton. Direct measurement of
the forces between complementary strands of dna. Science, 266(5186):771-773,
November 1994.
158
[19] S. Meredith. The structure of dna and its role in heredity. BMB 301, November
2001.
[20] Gerhard Meyer and Nabil M. Amer. Simultaneous measurement of lateral and
normal forces with an optical-beam-deflection atomic force microscope. Applied
Physics Letters, 57(20):2089-2091, November 1990.
[21] EASA Mineralogy. Pauling's rules continued. http:// www.eas.slu.edu/ People/
JPEncarnacion/ mineralogy/ week4.htm, January 2003.
[22] David L. Nelson and Micheal M. Cox. Lehninger Principles of Biochemistry.
Worth Publishers, New York, NY, 3 edition, 2000.
[23] Arizona State University Dept of Life Sciences. Mama ji's molecular kitchen-
southern blotting. http:// Isvl.la.asu.edu/ resources/ mamajis/ southern/ south-
ern.html, January 2003.
[24] Luda S. Shlyakhtenko, Lexander A. Gall, Jeffrey J. Weimer, David D. Hawn,
and Yuri L. Lyubchenko. Atomic force microscopy imaging of dna covalently
immobilized on a functionalized mica substrate. Biophysical Journal, 77:568-
576, July 1999.
[25] John Soares. The personal genome sequencer. Technology Review, 105(9):76-79,
November 2002.
[26] Hiroyuki Tanaka, Chiho Hamai, Takashi Kanno, and Tomoji Kawai. High-
resolution scanning tunneling microscopy imaging of dna molecules on cu(111)
surfaces. Surface Sciences, 432:L611-L616, April 1999.
[27] N. J. Tao, J. A. DeRose, and S. M. Lindsay. Self-assembly of molecular su-
perstructures by in situ scanning tunneling microscopy: Dna bases on au(111).
Journal of Physical Chemistry, 97:910-919, October 1993.
[28] T. Andrew Taton, Chad A. Mirkin, and Robert L. Letsinger. Scanometric dna
array detection with nanoparticle probes. Science, 289:1757-1760, September
2000.
159
[29] Invitrogen Life Technologies. Custom primers - technical information. http://
www.invitrogen.com/ content.cfm?pageid=85, 1 2003.
[30] Takayuki Uchihashi, Nami Choi, and Masato Tanigawa et al. Carbon-nanotube
tip for higly-reproducible imaging of deoxyribonucleic acid helical turns by
noncontact atomic force microscopy. Japanese Journal of Applied Physics,
39(8B):L887-L889, August 2000.
[31] J. D. Watson and F. H. C. Crick. A structure for deoxyribose nucleic acid.
Nature, 171:737, April 1953.
160