population genetics and molecular - EPrints USM - Universiti ...
Upload
khangminh22Category
view
0download
0
EROSION AND SEDIMENT YIELD
EVALUATION IN REGARDS OF EROSION SEDIMENT CONTROL PRACTICES
(ESCP)
SITI ISMA HANI BINTI ISMAIL
UNIVERSITI SAINS MALAYSIA
2010

ii
ACKNOWLEDGEMENT
“IN THE NAME OF GOD, THE MOST GRACIOUS, THE MOST
COMPASSIONATE”
Alhamdulillah, I thought the time to write this section would never arrive, and often I even
wondered why I’d ever decided to start on my Masters. Now I’ve reached the end and it is
time to express my gratitude to all the people who have encouraged me to finish this work.
For sure, the fulfillment of this research is due to the cooperation of many people. Therefore
I can only hope that I mention you all and those who I forget at this moment please forgive
me and think that despite this lapse I really do appreciate you all
I would like to begin by saying how greatly indebted I am to The Almighty Allah S.W.T for
giving me the strength, patience and never ending courage in completing my research.
I would like to take this golden opportunity to dedicate this report with grateful thanks to my
dearest parents and parents in law, En. Ismail Bin Haji Omar, Puan Siti Eshah Binti Haji
Hasan, En. Asbullah Bin Latif and Puan Sabrinawati Binti Abdullah for their continuous
supports during this thesis preparation. My sincere gratitude and love goes to my beloved
husband, En. Anuar Shamsuri Bin Haji Asbullah who made it possible for me to embark on
my research.
I would like to express my sincere and million thanks to my supervisor, En Zorkeflee Bin
Abu Hasan for his priceless guidance, suggestions, supportive advice, constructive criticism
and encouragement all the way through this study project. Without him I would not be able
to complete this research. On the other hand, I am also grateful to my second supervisor Dr.
H. Md. Azamathulla for his idea and assistance.

iii
I would like to offer my special thanks and appreciate to my boss, Mr. Lim Man Kwang, my
consultants Ir Tang Heap Seng and Ir Yeap Geok Ngoh, Professor Dr. Nor Azazi Zakaria,
Dr. Lai Sai Hin, Profesor Dr. Roslan Zainal Abidin, Puan Nurul Azfa Binti Azizan, Cik Noor
Hasliza Binti Wan Chik, Cik Nuramidah Binti Hamidon, En Zubir Bin Mohammed, En.
Nassir, Puan Norsalina Binti Johari, Noor Arbaayah bin Mohd. Hashim and Puan Noor
Zamrina Binti Zakaria for their guidance and supports throughout my research.
I would like to thank those researchers in the field of erosion modeling and processes from
different countries around the world that unselfishly provided their findings, software and
publications, thus greatly contributing to my research.
Last but not least to all my friends for their endless support and encouragement throughout
the years of my studies. Finally to all the individuals who were involves in the mission to
complete this thesis, thank you again from the bottom of my heart.
May all the good deeds that were done will be blessed by ALLAH S.W.T.

iv
TABLE OF CONTENTS
CHAPTER CONTENT PAGE
ACKNOWLEDGEMENT ii
TABLE OF CONTENTS iv
LIST OF TABLES viii LIST OF FIGURES xii LIST OF PLATES xvi LIST OF ABBREVIATIONS xvii LIST OF SYMBOLS xix ABSTRAK xx ABSTRACT xxi
CHAPTER 1 – INTRODUCTION
1.0 General 1
1.1 Background 3
1.2 Study area 11
1.2.1 Rational for Selection of Study Area 12
1.3 Problem statement 13
1.4 Objectives 17
1.5 Research Significance 18
1.6 Research Report Outline 18
CHAPTER 2 - LITERATURE REVIEW
2.0 Introduction 20
2.1 Definition of Soil Erosion 21
2.1.1 Why does erosion occur? 24
2.1.2 How does erosion occurs 24
2.1.3 Type of Erosion 27
2.1.4 Erosion and Sediment Hazards Associated with
Development 33
2.1.5 Factors that Influence Erosion 37
2.1.6 Best Management Practices 39

v
2.1.7 Erosion and Sediment Control Practices (ESCP) 41
2.1.8 Sediment Delivery Ratio (SDR) 41
2.2 Existing Model Review/Model types 42
2.2.1 Universal Soil Loss Equation (USLE) and Modifications 45
2.2.2 Revised Universal Soil Loss Equation (RUSLE) 45
2.2.3 Agricultural Non-Point Source (AGNPS) 46
2.2.4 Areal Nonpoint Source Watershed Environment Response
Simulation (ANSWERS) 46
2.2.5 The Chemical Runoff and Erosion from Agricultural
Management Systems (CREAMS) 46
2.3 Weirs 47
2.4 Discussion and Conclusion 48
CHAPTER 3 - STUDY AREA AND METHODOLOGY
3.0 Introduction 49
3.1 Study Area 49
3.1.1 Landuse / Development 50
3.1.2 Topography 51
3.1.3 Soil Types 52
3.1.4 Drainage and Hydrology 53
3.1.5 Flooding Conditions 54
3.1.6 Climate and Meteorology 55
3.2 Methodology 56
3.2.1 Desk Study 57
3.2.2 Research Preparation 66
3.2.3 Field work / Data collection 67
3.3 Data analysis and overall brief discussion 96
CHAPTER 4 - DATA COLLECTION AND ANALYSIS
4.0 Introduction 100
4.1 Data Analysis 100
4.1.1 To measure water level of dry sedimentation ponds during
Storm events 100
4.1.2 To measure Inflow and Outflow of dry sedimentation
Pond B by using the Rectangular Sharp Crested Weir 109
4.1.3 To check the Total Suspended Solid (TSS) of Inflow and
Outflow of dry sedimentation Pond B 115

vi
4.1.4 To estimate soil erosion rates for study area 119
4.2 Summary 151
CHAPTER 5 – RESULTS AND DISCUSSION
5.0 Introduction 152
5.1 Dry Sediment Pond designs on the study area 152
5.2 Measured water levels of dry sedimentation ponds during the
storm events 156
5.3 The measured Inflow and Outflow of Dry Sedimentation Pond B
By using Rectangular Sharp Crested Weir 163
5.3.1 Measured Water Level versus Time 163
5.3.2 Weirs’ discharge rate versus Time 164
5.3.3 Required Storage Volume for Pond B during storm events 167
5.3.4 Runoff volume (m3) and peak runoff rate per event (m3/s) 168
5.4 Total Suspended Solid (TSS) at Inflow and Outflow of dry
sediment Pond B 169
5.4.1 Summary of the efficiency of the ESCP 174
5.5 Evaluation of the soil erosion rates at study area 175
5.5.1 Assessment of soil erosion rates by using Modified Soil
Loss Equation (MSLE) and Revised Universal Soil Loss
Equation (RUSLE) 176
5.5.2 Assessment of soil erosion rates at Pond B by using
Modified Soil Loss Equation (MUSLE) Equations versus
measured Erosion rates (TSS) 179
5.5.3 Assessment of soil erosion rates at Pond B by using
MUSLE by William and Berndt (1977) compared to RUSLE
and MSLE Equations 186
5.5.4 Assessment of soil loss rates at Pond B by using MUSLE
Equation and measured erosion with Sediment Delivery
Ratio (SDR) 188
5.6 Conclusion 189
CHAPTER 6 - CONCLUSIONS AND RECOMMENDATIONS
6.0 Introduction 191
6.1 Conclusion 191
6.1.1 Estimation and evaluation of the soil loss on the study area 192

vii
6.1.2 Comparison of various equations used by researchers for
soil loss evaluation 193
6.1.3 Efficiencies of the ESCP used on the study area 194
6.2 Recommendation 195
6.3 Summary and Concluding 196
REFERENCES 198
APPENDICES
APPENDIX A Dry Sedimentation Pond Designs
APPENDIX B Measured Water Levels for Pond A, B, C, D and
E during the storm events for the year of 2008
APPENDIX B (i) Value for V (m3) for Pond A
APPENDIX B (ii) Value for V (m3) for Pond B
APPENDIX B (iii) Value for V (m3) for Pond C
APPENDIX B (iv) Value for V (m3) for Pond D
APPENDIX B (v) Value for V (m3) for Pond E
APPENDIX C Measured water levels at the Rectangular Sharp Crested
Weir (Inflow and Outflow) and the hydrograph for weir
discharge
APPENDIX D Total Suspended Solid (TSS) calculation
APPENDIX E Erosion calculation by using MSLE, RUSLE and MUSLE
Equations
APPENDIX F Soil Investigation - Boreholes results

viii
LIST OF TABLES
TABLE TITLE
PAGE
1.1 Population Distribution and Yearly Average Growth Rate Percentages for Penang According to District from 1980 to 2000
6
1.2 Migration distribution according to State, 1995 to 2000 (Interim Reports on Penang State Structure Plan (2005-2020))
7
1.3 Housing Development in Penang, 1991 to 2000 (Interim Reports on Penang State Structure Plan (2005 to 2020))
9
1.4 Estimated Demand for Residential Land 2000 - 2020.
9
1.5 Projection of the Development Land needed for Residential by Sector for every 5 Year, Penang (Hectare)
10
1.6 Major impact of soil erosion failures for on-site and off-site scenarios (Goh and Tew, 2006)
10
1.7 Landuse Suitability at the study area (Geotechnical Report, 2006)
13
2.1 Erosion/Sediment transport models (Merritt et al. 2003)
43
3.1 Rainfall Data for Year 2008 (MMD, 2008)
56
3.2 Terrain classification (Geotechnical Report, 2006)
63
3.3 Percentage of OM content for 26 Malaysian Soil Series
81
3.4 Soil Structure (S) Class and Code for 26 Malaysian Soil Series
82
3.5 Soil Permeability (P) Class and Code for 26 Malaysian Soil Series
83
3.6 Exponent m based on slope percent (FRIM, 1999)
86
3.7 C Factor and P Factor values for construction site rainfall BMPS
89
4.1
MSMA - Sediment Basin Types and Design Consideration (DID, 2000a)
101
4.2 MSMA - Dry sediment basin sizing Guideline (DID, 2000a)
101

ix
TABLE TITLE
PAGE
4.4 Sediment basin size required based on MSMA guideline
(DID, 2000a)
103
4.5 Summary of the Dry Sediment Pond designs on study site
105
4.6 Example of volume calculated for Pond A and Pond B on the study area
107
4.7 Example of daily water level measured at Pond A, B, C, D and E
109
4.8 Examples of water level measurement at Inflow and Outflow of weirs for discharge (Q) value (dated 10th May 2008)
113
4.9 Typical water sampling laboratory results for TSS (June 2008)
116
4.10 Water sampling laboratory results for TSS value for the month of October 2008
117
4.11 Extract of the Meteorological Data for 4th October 2008
118
4.12 Summary of the TSS results at Pond B
119
4.13 K factor at Boreholes 1 to 22 on the study area
125
4.14 LS Factor at the study area for Boreholes 1 to 22
126
4.15 Soil Loss estimation by using MSLE equation for Boreholes 1 to 22 on the study area
128
4.16 Soil loss rates by using RUSLE equation for Boreholes 1 to 22 at the study area
130
4.17 Percentage (%) different in Soil Loss estimation by using MSLE and RUSLE at the Boreholes 1 to 22
131
4.18 Extract of the Meteorological Data based on water sampling dates
133
4.19 EI30 value for Onstad and Foster (1975)
134
4.20 Summary of total runoff rate per event and peak runoff rate per event for Pond B
136
4.21 K and LS Factor for MUSLE equations for Pond B
137

x
TABLE TITLE
PAGE
4.22 Soil loss rate by using MUSLE equation by Onstad and Foster (1975) at Pond B
138
4.23 Soil loss rate by using MUSLE equation by William and Berndt (1977) at Pond B
141
4.24 Soil loss rate by using MUSLE equation by Fifield (2004) at Pond B
142
4.25 EI30 value and soil loss rate by using MUSLE equation by Tew and Goh (2006) at Pond B
143
4.26 Summary of erosion rates at Pond B by using the MUSLE equations versus TSS
145
4.27 Soil loss rates for Pond B by using RUSLE and MSLE equations
147
4.28 Soil loss rates comparison between MUSLE with RUSLE and MSLE
148
4.29 SDR for erosion estimation by using the MUSLE equations
150
5.1 Dry sedimentation pond sizing and designs
153
5.2 The maximum height and pond’s capacity designed
158
5.3 Measured water levels on 8th Mac 2008 and 22nd April 2008 which exceeded the maximum allowable height of the sedimentation ponds
158
5.4 Extract of Rainfall data from the Meteorological Data on 8th of Mac 2008 and 22nd of April 2008
162
5.5 Extract of Rainfall data from the Meteorological Data on 6th of September 2008
167
5.6 The summary of the required storage volume for Pond B
168
5.7 TSS results for the water samples at Inflow and Outflow of Pond B
169
5.8 The variable K Factor and LS Factor for soil erosion evaluation using the MSLE and RUSLE
177
5.9 Summary of erosion rates comparison using the MSLE and RUSLE equation
178
5.10 Classification of the Soil Erosion Rate (Department of Agriculture, 2008)
179

xi
TABLE TITLE
PAGE
5.11 Classification of the Soil Erosion Rate (Hardy, 2004)
179
5.12 The erosion rates comparison obtained from various MUSLE equations with measured erosion for Catchment B
181
5.13 The percentage of soil loss volume for MUSLE equations and TSS
185
5.14 Soil loss estimation using the MUSLE, RUSLE and MSLE equations for Pond B
187
5.15 Sediment Delivery Ratio (SDR) for each of the MUSLE equations
189

xii
LIST OF FIGURES
FIGURE TITLE
PAGE
1.1 Physical Topographical of Penang (Penang Structure Plan 2005 – 2020)
4
1.2 Landuse in Penang Year 2004 (Penang Structure Plan 2005 – 2020)
5
1.3 Population distribution for Penang according to district, 1980 to 2000 (Interim Reports on Penang State Structure Plan (2005-2020)
7
1.4 Location map of the study area
12
1.5 Artist illustrations on land development impact on Soil Erosion(Connecticut Guidelines for Soil Erosion and Sediment Control, 2002)
15
1.6 The research work flow
19
2.1 The GLASOD estimate of global land degradation
23
2.2 A simple model of hillside erosion (Merritt et al., 2009)
25
2.3 Types of erosion ((A) Encyclopedia Britannica, 2006) and (B) Lal, 1990)
27
2.4 The five types of Soil Erosion on an exposed slope Source: North Carolina DEHNR, 1993
29
2.5 The direct impact of falling drops of rain on soil particles
30
2.6 Changes in the runoff due to urbanization
34
2.7 Typical pre-development and post-development discharge rates
35
2.8 Changes in stream hydrology as a result of urbanization (Schueler, 1992)
36
2.9 Factors influencing erosion potential
39
2.10 Sharp Crested Weirs
48
3.1 Location of the study area
50
3.2 Survey plan of the research area (Geotechnical Report, 2007)
51

xiii
FIGURE TITLE
PAGE
3.3 Cross Section Profile for the site plan (Geotechnical Report, 2007)
52
3.4 Soil Map of the Project Area (EIA, 2007)
53
3.5 Flow chart showing the four phases in conducting the research
57
3.6 Topography Plan for the study area
59
3.7 Example of particles size distribution from the SI Report
61
3.8 Boreholes Location of the study area (SI Report, 2006)
62
3.9 Terrain Map of the study area (Geotechnical Report, 2006)
63
3.10 Building consideration by following land profile (Geotechnical Report, 2006)
64
3.11 Work flow for the data collection segment
66
3.12 Typical Dry Detention Basin Components (DID, 2000)
68
3.13 Site plan showing all the pond location and the receiving catchment area
68
3.14 Form used for the data collection of the water level reading at Pond A to Pond E
70
3.15 Type of weirs
71
3.16 The location of the ‘ruler’ at the weirs
73
3.17 Form used for data collection at the weirs
73
3.18 Annual Rainfall Erosivity (R) map for the Penang State of Malaysia (Shamshad et al. 2007)
80
3.19 Nomograph for Soil Erodibility (K) factor
84
3.20 Soil texture triangle for determining soil texture
85
3.21 RUSLE equation and its factors influencing Soil Erosion and Sedimentation
88
3.22 Rainfall Erosivity analysis flow chart
91
3.23 Example of runoff hydrograph
93

xiv
FIGURE TITLE
PAGE
3.24 Water level measurement at the dry sedimentation ponds
97
3.25 Nixon-Steramflo and the Current Meter
98
4.1 Dry sedimentation pond sizing and detail design
104
4.2 Graph showing the volume versus water level measured on the study area
108
4.3 Example of volume estimation for the water level measurement
110
4.4 A typical Rectangular Sharp Crested Weir (Bentley Systems, 2007)
110
4.5 Rectangular Sharp Crested Weir with end contractions and its section (DID, 2000b)
111
4.6 Graph showing the measured water level versus time for Pond B
114
4.7 Typical example of graph for flow discharge versus time for Pond B
115
4.8 Annual Rainfall Erosivity (R) map for the Penang State of Malaysia (Shamshad et al. 2007)
121
4.9 SI analysis report for Boreholes 11
122
4.10 Soil Erodibility Nomograph (Foster et al., 1981)
123
4.11 Diagram used to calculate the LS value
124
4.12 Catchment area B divided into two zones based on the boreholes location
132
4.13 The total runoff rate calculation
135
5.1 Sediment pond and cross section
154
5.2 Water flows from higher level to lower level
155
5.3 Illustration of check dam located inside the earth drain
156
5.4 Typical graph for volume versus measured water level for Pond A
157
5.5 Typical effect on the impervious area for land development
161

xv
FIGURE TITLE
PAGE
5.6 Rainwater effects on surface runoff
162
5.7 Rectangular Sharp Crested Weir
163
5.8 Typical graphs for measured water level versus time at the weirs from May 2008 to December 2008
164
5.9 Typical hydrograph of Q versus time at Inflow and Outflow of Weirs from May 2008 to December 2008
165
5.10 The Inflow hydrograph is smaller compared to the Outflow hydrograph on 6th September 2008
166
5.11 Peak discharge rate and the total runoff volume for the hydrograph
168
5.12 Suspended solid (TSS) trend at Pond B
170
5.13 National Water Quality Standard for Malaysia (DOE, 2006)
171
5.14 DOE Water Quality Index Classification and Uses (DOE, 2006)
171
5.15 Maintenance access for typical Sedimentation Basin Layout
172
5.16 Cross section showing the storage capacity is reduced due to sediment accumulation
173
5.17 Potential significant environmental impact on surface water during construction
174
5.18 Localized Deposition of particles before entering Pond B
183
5.19 Emergency spillway at Pond B
184
5.20 Use of Sediment Basin on construction sites
190

xvi
PLATE TITLE
PAGE
1.1 Typical example of Soil Erosion features on construction site
16
2.1 Soil Erosion Phenomena on bare slope
20
3.1 Historical flood surrounding the study area due to surface runoff
55
3.2 Pictures showing the site plan before the land development
60
3.3 Dry Sedimentation Ponds on study area
69
3.4 Pictures showing the water level measurement at the sedimentation ponds
70
3.5 The construction of weirs at the study area
72
3.6 Weirs and ‘ruler’ located at the Inlet and Outlet of Pond B
73
3.7 Water level measurement and water sampling at Pond B
74
3.8 Water samples
76
3.9 Laboratory Works for TSS
77
4.1 Pond B
105
4.2 Pond A
105
5.1 A ‘ruler’ was placed inside the sediment pond for measuring purposes
156
5.2 Poor maintenance work for the sediment ponds
159
5.3 Receiving drain after heavy rain
159
5.4 Maintenance works is carry out at the receiving drain after heavy rain
159
5.5 Uncontrolled site clearing activities
160
5.6 Failed side slope at Pond B
173

xvii
LIST OF ABBREVIATIONS
AGNPS Agricultural Non-Point Source Pollution Model
ANSWERS Areal Nonpoint Source Watershed Environment Response
Simulation
ARI Average Recurrence Intervals
ASML Above Sea Mean Level
BLIA Bayan Lepas International Airport
BMP Best Management Practices
CREAMS The Chemical Runoff and Erosion from Agricultural
Management Systems model
DID Department of Irrigation and Drainage
DOA Department of Agricultural Malaysia
DOE Department of Environmental
ECP Erosion Control Plan
EIA Environmental Impact Assessment
EMP Environmental Management Plan (EMP)
EPA Environmental Protection Agency
ESCP Erosion Sediments Control Practices
EWRC Environment Waikato Regional Council
F.R. Forest Reserves
FAO Food and Agriculture Organization of the United Nation
FRIM Forest Research Institute Malaysia
GIS Geographic Information Systems
GLEAMS Groundwater Loading Effects of Agricultural Management
Systems
LESTARI The Institute for Environment and Development
MDRN Missouri Department of Natural Resources
xviii
MMS Malaysia Meteorological Services Department
MPPP Majlis Perbandaran Pulau Pinang
MSC Multimedia Super Corridor
MSLE Modified Soil Loss Equation
MSMA Manual Saliran Mesra Alam
MUSLE Modified Universal Soil Loss Equation
NC DEHNR North Carolina Department of Environment, Health and Natural
Resource
NSW New South Wales
NWQSM National Water Quality Standard of Malaysia
PERFECT The Productivity, Erosion and Runoff, Functions to Evaluate
Conservation Techniques
RMSE Root Mean Square Error
RUSLE Revised Universal Soil Loss Equation
SIR Storie Index Rating
SWAT Soil and Water Assessment Tools
TIA Traffic Impact Assessment
TSS Total Suspended Solids
UNEP/GPA United Nations Environment Programme/Global Programme of
Action
USDA United States Department of Agriculture
USEPA United State Environment Protection Agency
USLE Universal Soil Loss Equation
WEPP Water Erosion Prediction Project
WQI Water Quality Index

xix
LIST OF SYMBOLS
SYMBOLS DESCRIPTIONS
xΗ Measured height
A Erosion rate for RUSLE
B Weir base width
CSCW Constant for Rectangular Sharp Crested Weir
E Rate of erosion for MUSLE
EI Rainfall Erosivity index
H Head above weir crest excluding velocity head
Hc Height of the weir until the bottom of the opening
I30 Rainfall intensity for 30 minutes
IA Fraction of impervious area
K Soil Erodibility Factor
LS Slope Length Factor
m Exponent
n Number of end contractions for weir
OM Organic Matter
P Annual rainfall
Q Weir discharge
qc Erosion Rate for MSLE
QP Peak runoff rate per event
qP Peak flow rate
R Rainfall Erosivity
RO Total runoff rate per event for MUSLE
S Soil structure code
T Sediment yield per storm event
TSS Total Suspended Solid
V Volume of runoff
VM Vegetation management factor
� Constant for MUSLE
� 2 Constant for MUSLE
xx
PENILAIAN HAKISAN DAN HASILAN ENDAPAN BERKAITAN DENGAN
AMALAN KAWALAN HAKISAN ENDAPAN
ABSTRAK
Tapak projek pembinaan adalah terdedah kepada risiko hakisan air disebabkan oleh aktiviti
kerja tanah yang giat dijalankan. Bagi tapak pembinaan ini, didapati cerun bukit terdedah
begitu sahaja tanpa sebarang tanaman dan sistem pemparitan yang sedia ada pula dipenuhi
dengan hasilan endapan. Hasilan endapan ini akan menyebabkan peningkatan ketara bagi
beban endapan ke kawasan tadahan sungai manakala teknik pembinaan yang digunakan turut
menyumbang kepada pencemaran di kawasan sekeliling tapak pembagunan ini. Hakisan
yang berlaku di tapak kajian adalah disebabkan oleh aktiviti penebangan pokok, keamatan
lebat hujan yang tinggi dan juga kegagalan kolam endapan untuk berfungsi dengan
berkesan.Kajian ini dijalankan untuk menilai hakisan dan hasilan endapan yang disebabkan
oleh hujan lebat dan air larian di tapak kajian yang terletak di Sungai Ara, Pulau Pinang,
Malaysia. Jumlah kehilangan tanah ditentukan dengan menggunakan kaedah permodelan
empiric bagi hakisan iaitu Revised Universal Soil Loss Equation (RUSLE), Modified Soil
Loss Equation (MSLE) dan Modified Universal Soil Loss Equation (MUSLE) dan juga
berdasarkan kepada sampel yang telah diambil di kawasan kajian. Keputusan kajian
menunjukkan kadar hakisan dan enapan adalah tinggi bagi kawasan kajian ini. Kadar hakisan
tahunan tertinggi adalah direkodkan di Lubang Jara 19 melalui persamaan RUSLE iaitu
sebanyak 7,772 ton/hektar/setahun. Dengan menganalisa sampel yang diambil di Kolam
Endapan B, keputusan beban enapan terampai (TSS) yang diperolehi melalui aliran masuk
ke kolam enapan adalah diantara 352 mg/l sehingga 5031 mg/l manakala di aliran keluar
pula mencatatkan nilai diantara 309 mg/l ke 5375 di mana kesemua nilai ini diklasifikasikan
sebagai Kelas V bagi Jabatan Alam Sekitar Malaysia. Walaubagaimanapun, berdasarkan
sampel yang telah diambil, didapati kadar kehilangan tanah adalah jauh berkurangan jika
dibandingkan dengan kaedah pengiraan kehilangan tanah.
xxi
EROSION AND SEDIMENT YIELD EVALUATION IN REGARDS OF
EROSION SEDIMENT CONTROL PRACTICES (ESCP)
ABSTRACT
During construction, large areas of soil are exposed to the risk of water erosion due to
earthworks activities. Bare slopes and drains choked with sediment can often be observed on
construction sites. This erosion may result in a significant increase in sediment loads to
receiving waters and the construction techniques used on site can cause offsite
contamination. Erosion from the study area occurred due to the removal of the vegetation
cover, high rainfall intensity and the failure of the sediment basins to function effectively.
The present study aims to evaluate the erosion and sediment yield due to storm rainfall and
runoff on a construction site located at Sungai Ara, Penang state of Malaysia. The soil loss
was evaluated by using empirical erosion modelling namely the Revised Universal Soil Loss
Equation (RUSLE), Modified Soil Loss Equation (MSLE) and Modified Universal Soil Loss
Equation (MUSLE) and from the water samples taken at the study area. Results showed that
large amount of sediment has being eroded from the study area. The highest annual erosion
rates estimated is by using the RUSLE equation is recorded at Borehole 19 with soil loss of
7,772 tons/ha/y. By analyzing the samples collected at the Pond B, the TSS value is noted
from 352 mg/l to 5031 mg/l at Inflow and 309 mg/l to 5375 mg/l at Outflow which fall under
the Class V according to the classification by Department Of Environment in Malaysia.
However, the results shows that the measured soil loss was very much smaller compared to
the calculated soil loss.

1
CHAPTER 1
INTRODUCTION
1.0 General
In Malaysia, township and urban areas were rapidly developed. By the 1970s, urbanization
and industrialization touched most of the country. As a result, land became an increasingly
scarce resource in many of the developed areas such as Kuala Lumpur, Petaling Jaya,
Penang and Johor Bahru. In the last ten years, intensification of industrialization, housing
and construction, the development of tourism and agriculture, and greater urbanization have
led to greater pressure on land. Even land reclamation (in some coastal areas) has not eased
the pressures as demand for land remains high. As such, developers have turned to
developing hill land (Ibrahim et al., 2002).
Hill land, which is located on the upstream of drainage basins, is extremely sensitive to
human induced environmental changes (Ibrahim et al., 2002). Even small changes caused by
forest clearance could lead to severe damage on natural systems such as flora, fauna, climate,
hydrology and soils (Ibrahim et al., 2002). Rapid development of the foothills, slopes and
hill tops since the 1970s, have resulted in depletion of forest, destruction and deterioration of
water catchments, changes in micro climatic elements, endangering of wild life, high rates of
soil erosion, increased incidence of landslide and rock-falls, high rates of sedimentation
leading to rapid siltation and reduce capacities of rivers leading to an increased frequencies
and magnitudes of downstream flooding (Chan, 1998), besides the pollution of the river
water (Ibrahim et.al. 2002).

2
In line with vision 2020, Malaysia has undergone tremendous land development, especially
in the development of infrastructures. Although these activities form an integral part of the
socio economic advancement in this country, their success is indeed limited, if insufficient
attention is paid to the adverse effects of land development particularly on soil erosion issues
(Faisal and Tew, 2006).
As all of us are aware, degradation of the non-renewable soil resource by accelerated (human
sinduced) erosion is a serious environmental problem (Sutherland, 1989). Accelerated
erosion results from agriculture, mining and any activities related to urbanization, such as
building construction, utility development and road building (Wolman and Schick, 1967;
Anderson and McCall, 1968; Guy and Jones, 1972; Reed, 1980). Goldman et al. (1986)
stated that when land is disturbed for construction, road building, mining, logging,
landscaping or other activities, the soil erosion rate increases from two to forty thousand
times. Construction areas are of particular concern because they are considered to be one of
the most severe modifications of the human landscape (Meyer, et al., 1971). It was reported
by Fifield (2008) and North Carolina Department of Environment, Health, and Natural
Resources (NC DEHNR) (1993) that erosion rates at construction sites may be ten to twenty
times greater than for undisturbed lands. Over a short period of time, construction sites can
contribute more sediment to receiving streams than was previously deposited over several
decades (NC DEHNR, 1993).
On the other hand, studies in the Auckland region shows that construction sites yield ten to
hundred times more sediment than untouched land (Associated Rockery Contractors (ARC)
1992; The Auckland Regional Authority (ARA) and Auckland Regional Water Board
(ARWB), 1983; Swales 1989).

3
In engineering perspective, soil erosion is defined as a general destruction of soil structure by
the action of water and wind (Beasley, 1972). It is essentially the smoothing process with
soil particles being carried away, rolled and washed down by the force of gravity (Morgan,
1993). Rainfall is the prime agent of soil erosion, whereby the rain’s runoff will scour away,
loosen and break soil particles and then carry them away, thus leaving behind an altered bare
earth surface (Wischmeier et al., 1978). In the case of a slope, an altered bare surface of the
slope with the formation of sheet, rill and gully erosion features will cause instability of the
slope. This situation will gradually cause slope failure or landslide as commonly known. The
soil erosion phenomenon is basically the function of the erosivity of the rainfall and the
erodibility of the soil (Roslan, 1992). In other words, when the rainfall acts upon the earth
surface, the amount of the soil erosion loss will basically depend upon the combination of
the strength and the magnitude of the rainfall to cause the erosion process and the ability of
the soil to withstand the rain itself (Hudson, 1979).
1.1 Background
The Penang state of Malaysia has made remarkable progress in its economic development
over the past few decades. The diversification of the economy from agricultural sector into
manufacturing sector has meant rapid urbanization and industrialization. Bayan Baru and
Bayan Lepas Industrial Estates were established since 1969 (Penang Development News,
2003) to boost the economic growth in the island. George Town has been extended and
became a regional hub for Northern Region of Malaysia. Following the impetus for
economic expansion, comes the related demand for manpower especially in the fields of
manufacturing and commercial businesses. Since then, the influx of population from other
states to Penang has contributed to the greater growth of its population.
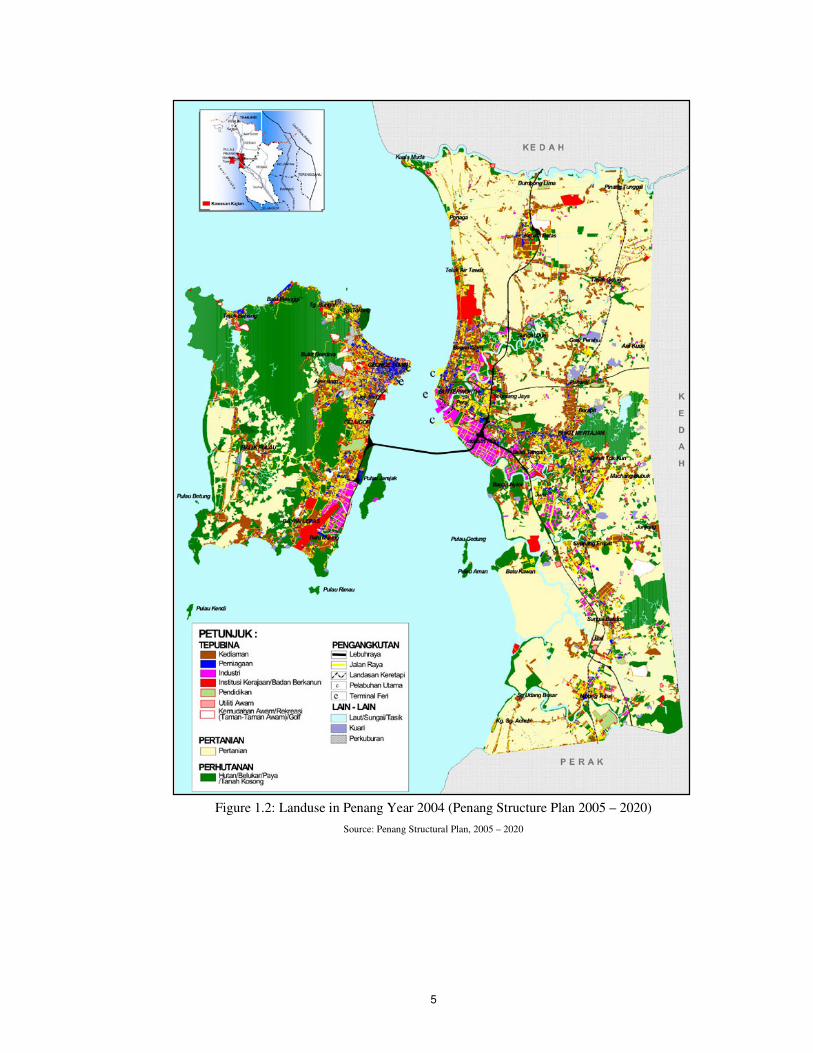
Increasingly, land is a scarce resource which is much sought after in Penang Island,
Malaysia. This is because Penang is largely made up of steep topography and much of the
lowland areas are already been developed as shown in Figure 1.1 and Figure 1.2.

4
Figure 1.1: Physical Topographical of Penang (Penang Structure Plan 2005 – 2020) Source: Penang Structural Plan, 2005 – 2020
5
Figure 1.2: Landuse in Penang Year 2004 (Penang Structure Plan 2005 – 2020) Source: Penang Structural Plan, 2005 – 2020

6
Penang is one of the many rapidly industrializing states in Malaysia with a largely urban
populace. In recent decades, efforts at industrialization and the development of other
economic sectors have been intensified, leading to greater urbanization and greater pressures
on land (Chan, 1998). The rapid urbanization and industrialization has also accelerated its
impact on the hydrology and geomorphology of the island. The tremendous increase in the
population of the island due to internal migration and influx of people from other countries
such as Indonesian and Bangladeshi, seeking jobs in the island’s industries, have caused and
increased demand for more land for development of housing estates as shown in Table 1.1,
Figure 1.3 & Table 1.2. The intention of the State Government to make Penang the leading
industrial state in Malaysia has also caused more flatlands to be developed for industrial use
(Ismail, 1997).
Table 1.1: Population Distribution and Yearly Average Growth Rate Percentages for Penang According to District from 1980 to 2000
(Interim Reports on Penang State Structure Plan (2005-2020))
1980 1991 2000 Yearly Average Growth Rate (%)
District
Population % Population % Population % 1980 - 1991
1991 - 2000
1980 - 2000
North East 391,400 43.5 395,714 37.2 444,923 33.9 0.1 1.31 0.6 South West 76,390 8.5 122,764 11.5 169,442 12.9 4.4 3.7 4.1
Northern Main Land
199,449 22.1 224,647 21.1 259,823 19.8 1.1 1.6 1.3
Central Main Land
161,975 18.0 236,270 22.2 313,607 23.9 3.5 3.2 3.4
Southern Main Land
71,558 7.9 84,771 8.0 125,654 9.6 1.6 4.5 4.5
Penang 900,772 100 1,064,166 100 1,313,449 100 1.5 2.4 1.9 Source: Department of Statistic Malaysia, 2002

7
Population Distribution
0
100,000
200,000
300,000
400,000
500,000
1980 1991 2000
Year
Population
North East South West Northern Seberang Perai Central Seberang Perai Southern Seberang Perai
Figure 1.3: Population distribution for Penang according to district, 1980 to 2000 (Interim Reports on Penang State Structure Plan (2005-2020)
Source: Department of Statistic Malaysia, 2002
Table 1.2: Migration distribution according to States, 1995 to 2000 (Interim Reports on Penang State Structure Plan (2005-2020))
State 1995 2000
Migrate In Migrate out Net Migration Migrate In Migrate out Net
Migration
Selangor 78,005 40,370 37,635 60,941 36,637 24,304
Penang 24,436 11,925 12,511 29,735 15,077 14,658
Johor 22,387 24,471 (2,084) 31,522 18,146 13,376
Terengganu 11,689 15,913 (4,224) 19,953 11,519 8,434 Melaka 13,224 10,961 2,263 9,688 9,507 181 Kedah 18,798 17,943 855 22,530 23,143 (613) Negeri
Sembilan 23,535 15,438 8,097 16,293 17,100 (807)
Perlis 2,897 2,484 413 1,832 3,567 (1,735)
Pahang 17,218 25,488 (8,270) 17,908 19,720 (1,812)
Sarawak 8,133 9,709 (1,576) 9,284 12,066 (2,782)
Perak 15,975 36,346 (20,371) 20,711 27,656 (6,945)
Sabah 12,685 11,615 1,070 13,147 21,079 (7,932)
Kelantan 22,406 17,679 4,727 12,846 21,422 (8,576) Kuala
Lumpur 14,137 45,183 (31,046) 4,459 34,200 (29,741)
Source: Migration Investigation Report, 1995 – 2000, Department of Statistic Note: ( ) Means a negative value
Although land reclamation has eased the pressures somewhat, it is not enough to satisfy the
high demand for land on the island. Due to its small size of 285 km2 in area and lack of flat
land, developers have turned to the remaining hill land on the island. Many hills and their

8
environs are already being developed and many hill projects are in the pipe line (Ismail,
1997), which is very common in Penang Island nowadays. As all of us are aware,
construction industries are the backbone of any land development and it growths rapidly as
well. The immediate response that will come across our mind of any construction
development is the negative impacts to the adjacent areas or downstream such as
deforestation, decimation of water catchments, destruction of endangered fauna and flora,
soil erosion, landslides, water pollution, sedimentation and downstream flooding. Some of
these problems have been exacerbated and turned into disasters due to the extremely fragile
and sensitive nature of hill ecosystems. Despite such problems, the State Government has
decided to lift the freeze on development of hill land since January 1998 and this has
effectively opened up all hill land for development on the island (Chan, 1998).
As a result of growing population comes a corresponding need for adequate housing. It is
projected that between the year 1996 to 2010, an average of 3,800 housing units are required
annually in the island (Majlis Perbandaran Pulau Pinang (MPPP), 2007). Table 1.3 and Table
1.4 shows the Housing Development and Land demand in Penang. However, the figure is
expected to increase by taking into account those immigrants from other States. As to hasten
development and accelerate the pace towards Vision 2020, the housing woes must first be
solved. To deal with the issue, there must be concerted efforts by the private and public
sector to reduce the present housing shortage and to satisfy future housing needs. The
objective of housing development as outlined in the Penang Island Structure Plan (1989) is
to ensure an adequate housing provision at an appropriate location accompany with range of
utilities, social amenities and recreational facilities as tabulated in Table 1.5.

9
Table 1.3: Housing Development in Penang, 1991 to 2000 (Interim Reports on Penang State Structure Plan (2005 to 2020))
Residential Unit Unit Increments Percentage of increments (%)
District 1991 1995 2000 1991 -
1995 1995 - 2000
1991 - 1995
1995 - 2000
Northeast 79,631 99,530 130,612 19,899 31,082 25.0 31.2
Southwest 26,562 32,927 44,847 6,365 11,920 24.0 36.2 Island
Total 106,193 132,457 175,459 26,264 43,002 24.7 32.5
Northern 48,112 52,300 58,779 4,188 6,479 8.7 12.4
Central 55,618 66,565 83,940 10,947 17,375 19.7 26.1
Southern 19,550 23,307 34,648 3,757 11,341 19.2 49.7
Main Land
Total 123,280 142,172 177,367 18,892 35,195 15.3 24.8
Total for Penang 229,473 274,629 352,826 45,156 78,197 19.7 28.5 Source: Department of Statistic Malaysia Special Request, 2000 & Penang Structural Plan, 2005 - 2020
Table 1.4: Estimated Demand for Residential Land 2000 - 2020.
2000 – 2005 2006 - 2010 2011 - 2015 2016 - 2020 Total
District % Amount
Land Area (Ha)
Amount Land Area (Ha)
Amount Land Area (Ha)
Amount Land Area (Ha)
Amount Land Area (Ha)
10
40
50
Northeast
Total
10 78 5.2 234 15.6 286 19.1 598 39.9
40 312 4.2 935 12.6 1,145 15.5 2,392 32.3
50 391 2.6 1,168 7.8 1,432 9.5 2,991 19.9
Island
Southwest
Total 781 12.0 2,337 36.0 2,863 44.1 5,981 92.1
10 26 1.7 146 9.7 178 11.9 350 23.3
40 104 5.0 584 27.8 711 33.9 1,399 66.7
50 130 1.1 731 5.8 888 7.1 1,749 14.0 Northern
Total 260 7.8 1,461 43.3 1,777 52.9 3,498 104.0
10 120 8.0 336 22.4 456 30.4
40 480 22.9 1,346 64.1 1,826 87.0
50 601 4.9 1,682 13.5 2,283 18.4 Central
Total 1,201 35.8 3,364 100.0 4,565 135.8
10 29 1.9 236 15.7 265 17.6
40 114 5.4 946 45.0 1,060 50.4
50 142 1.1 1,183 9.5 1,325 10.6
Main Land
Southern
Total 285 8.4 2,365 70.2 2,650 78.6
Total 1,041 19.8 5,284 123.5 10,369 267.2 16,694 410.5
Source: Penang Structural Plan, 2005 - 2020
10
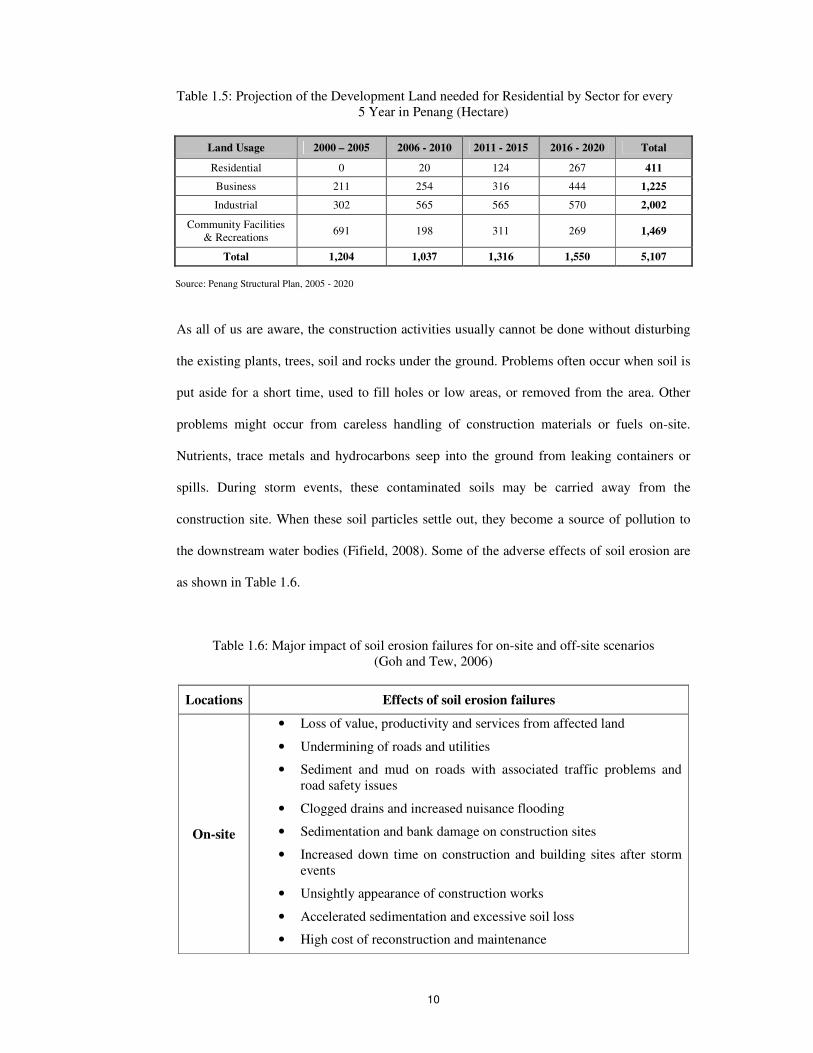
Table 1.5: Projection of the Development Land needed for Residential by Sector for every 5 Year in Penang (Hectare)
Land Usage 2000 – 2005 2006 - 2010 2011 - 2015 2016 - 2020 Total
Residential 0 20 124 267 411
Business 211 254 316 444 1,225
Industrial 302 565 565 570 2,002
Community Facilities & Recreations 691 198 311 269 1,469
Total 1,204 1,037 1,316 1,550 5,107
Source: Penang Structural Plan, 2005 - 2020
As all of us are aware, the construction activities usually cannot be done without disturbing
the existing plants, trees, soil and rocks under the ground. Problems often occur when soil is
put aside for a short time, used to fill holes or low areas, or removed from the area. Other
problems might occur from careless handling of construction materials or fuels on-site.
Nutrients, trace metals and hydrocarbons seep into the ground from leaking containers or
spills. During storm events, these contaminated soils may be carried away from the
construction site. When these soil particles settle out, they become a source of pollution to
the downstream water bodies (Fifield, 2008). Some of the adverse effects of soil erosion are
as shown in Table 1.6.
Table 1.6: Major impact of soil erosion failures for on-site and off-site scenarios (Goh and Tew, 2006)
Locations Effects of soil erosion failures
On-site
• Loss of value, productivity and services from affected land
• Undermining of roads and utilities
• Sediment and mud on roads with associated traffic problems and road safety issues
• Clogged drains and increased nuisance flooding
• Sedimentation and bank damage on construction sites
• Increased down time on construction and building sites after storm events
• Unsightly appearance of construction works
• Accelerated sedimentation and excessive soil loss
• High cost of reconstruction and maintenance

11
Off-site
• Sedimentation in nearby reservoirs and other storage structure, with resulting loss of water storage capacity
• Instability of stream channels nearby caused by increased runoff and sediment loads
• Reduction in channel capacity leading to greater frequency of floods caused by siltation and sedimentation of rivers
• Proliferation of exotic weeds within watercourse due to high nutrients content of silt and sediment
• Smothering of aquatic and marine flora and fauna: high turbidity in rivers excluding light penetration affects fish life.
• Land degradation caused by gully erosion/sediment deposition
• Increased pollution of river and streams
• Loss of navigable reaches of a river or watercourse
• Adverse ecology effects on high sediment loads, deposition and dredging and de-silting of waterways
• Decline or total loss of fishing industry, particularly as a results of increased turbidity due to sediment load
The total amount of sediment in the water is called total suspended solids (TSS). When TSS
in water occurs in large quantities, degraded water quality can be harmful to animals and
plants (Fifield, 2008).
1.2 Study area
This study site comprises of 3 lots (Lot 11897, 11898 and 12025, Mk.12. DBD) of land at
Sungai Ara in Penang state, Malaysia, with a total area of 103.572 acres. The project site is
located in the southern end of South-West District on Penang Island and is situated adjacent
to Bayan Lepas Town as shown in Figure 1.4. The site is about 2 km away from Bayan
Lepas Town, 3.5 km from Sungai Ara and approximately 5 km from Bayan Baru’s town
hub. As the project site was previously a golf course, large portions of the site is covered
with secondary vegetation such as trees, shrubs and golf’s course grasses. Rocks and
boulders could be found in few locations in the project area. Areas toward the north and west
of the site consist of several hills namely Bukit Gambir and Bukit Papan which form the
main catchments for Sungai Air Terjun and Sungai Bayan Lepas.

12
In view of the pressing need on housing, this project proponent has taken some necessary
steps to alleviate the problem by developing a large scale housing scheme in Sungai Ara
which is close to Bayan Lepas Industrial Estate and Bayan Baru Town.
Figure 1.4: Location map of the study area
1.2.1 Rational for Selection of Study Area
This study area is located at hilly land categorized as hill land development in Penang. As
reported in the Geotechnical Report (2006), the suitability of the Land with respect to the

13
proposed development area taking into account the site geology, terrain condition and the
terrain component was assessed as shown in the table 1.7.
Table 1.7: Landuse Suitability at the study area (Geotechnical Report, 2006)
Land use Suitability Area (m2) Percent (%)
Class I (0 – 15°) 301,703.5 74.56 Class II (16° - 25°) 54,932.9 13.57 Class III (26° - 35°) 31,584.9 7.81 Class IV (> 36 °) 16,448.7 4.06
As this is a big scale of hillslope development, (i.e. sensitive area to erosion and
sedimentation) which is under rapid construction activities, this area was selected for this
researched. During heavy rainfall, high velocity of surface runoff will caused more erosion
activities especially on the slope surface. Running water removes soil and organic matter
from gentle sloping land and steeper sites by a variety of processes which often starts off as
splash erosion, leading to sheet erosion and as the conditions change this will lead to rill
erosion and subsequently develop gullies. The eroded particles will be transported and
settled at downstream which will lead to siltation and sedimentation. Thus, the depth of the
river and drainage system will be shallower which subsequently reduces the capacity of the
system and caused flooding. Besides, the eroded particle will also pollute the water quality
of the river. On the other hand, the uncontrolled removal of vegetations at the study area has
lead to reduction of the infiltration capacity since the surface runoff is force to flow
downstream due to the bare surface.
1.3 Problem statement
Sungai Ara has been selected as the research area for its rapid development for the past 10
years. As a result of massive urbanization, erosion problems can be accelerated by a variety
of human activities, including unrestricted development, removal of surface cover and
increased imperviousness that increases runoff. Every phase of a construction project has the
potential of contributing significant quantities of sediment runoff.

14
With its rapid urbanization, the incremental of public awareness for land development in
Penang is undeniable. People have deep feelings about a place or strongly connect with a
community when they are in contact with the environment and with other people. In parallel
with the developments related to the quality concept in all sectors, various approaches on
various scales can be seen for a solution to quality problems in the urban environment. The
public are well educate and demanding on the quality of the environment for better living
and lifestyle. They are more concern on the safety measures implemented in all the land
development in order to avoid any hazardous event. Besides, the State Government has fear
on the safety of this development by trying to enforce more guidelines and implementing
additional engineering studies especially for hill slope projects such as Geotechnical Report
for Hill Land Committee approval, Environmental Impact Assessment (EIA) Report,
Environmental Management Plan (EMP), Erosion Sediments Control Practices (ESCP)
report, Traffic Impact Assessment (TIA) report, and others.
For this study area, land development which involves massive construction activities and
shaping of this land will definitely alter the land cover and the soil in many ways. These
alterations often detrimentally affect on site stormwater patterns and eventually off-site
stream and streamflow characteristics. Protective vegetation is reduced and removed during
the earthworks activities, excavations are made, topography is altered, the removed soil
material is stockpiled and often without protective cover and the physical properties of the
soil itself are changed. While rainfall patterns may or may not have been affected by human
activities, it is clear that runoff has changed significantly with human development shown in
Figure 1.5.

15
Figure 1.5: Artist illustrations on land development impact on soil erosion Source: Connecticut Guidelines for Soil Erosion and Sediment Control, 2002
While all lands erode, not all land can be the source of sediments pollution. There has always
been naturally occurring erosion. However, major problems can occur when large amounts
of sediment enter our wetlands, watercourses and drain systems. On developing land, erosion
frequently is in the form of gully erosion on land disturbed for a year or less. Both conditions
result in lower quality of soil and water resources. However, gully erosion which is the result
of concentrated flows of surface runoff generates high sediment volumes requiring costly
clean-up and continual need for site stabilization during development. A construction is
typically erodes at a rate of 50 tons/acre/year. This erosion rate is five times greater than
cropland erosion and 250 times greater than woodland erosion (Connecticut Guidelines for
Soil Erosion and Sediment Control, 2002).

16
Plate 1.1: Typical example of Soil Erosion features on construction site
Uncontrolled erosion and sediment from urban development often cause considerable
economic damage to individuals and to surrounding society in general. Improperly planned
and maintained land management of the construction site causes continual erosion and
sedimentation problem, both during and after construction. The excess runoff from this
construction site can cause erosion to the adjacent areas.
On the other hand, the main on-site impact is the reduction in soil quality which results from
the loss of the nutrient rich upper layers of the soil and the reduced water holding capacity of
many eroded soils. In addition to its on site effects, the soil that is detached by accelerated
water erosion may be transported at a considerable distances. Hence, increased downstream
flooding and local damage to property may also occur due to the reduced capacity of eroded
soil to absorb water.

17
While we strive to improve the quality of our lives, the fact that much of human activities
results in damage to the environment comes as no surprise to many of us living in or near to
the City. We take on the responsibility of attempting to control and reduce the amount of
damage as a society inflict on our water, air, and land. The activity at hand is construction
and the damage to focus on in our discussion is the pollution construction contributes to
stormwater.
The knowledge of the potential erosion problems on a construction site will enable the site
planner to better manage site development and erosion controls in order to minimize soil loss
off the property. Prevention is much more effective than trying to improve water quality of
the runoff. Therefore, this research is a necessity in order to carry out a study on the
efficiencies of the site temporary works and Best Management Practices (BMPs) that has
been implemented in order to control the negative impact cause from the study area.
1.4 Objectives
The primary objectives of the study are as follow:
1. To evaluate the soil erosion occurring at the study area during the pre-construction
activities by using the empirical modeling.
2. To compare various equations used by researchers for estimating soil erosion (e.g.
Modified Soil Loss Equation (MSLE), Revised Universal Soil Loss Equation
(RUSLE) and Modified Universal Soil Loss Equations (MUSLE)).
3. To determine the efficiencies of the silt/sedimentation pond as the Erosion and
Sediment Control Practices (ESCP) implemented for this Project.

18
1.5 Research Significance
This work will help in the analysis and assessment of the environmental quality of natural
resources and can assist as a future guideline for land use planning in the study area. The
result of spatial change detection results and other related findings in this work will helped to
identify the main soil erosion process that takes place in the study area.
The various hypothesis considered are as follows;
i. The degree of deterioration of the environment quality is not uniform throughout
the study area.
ii. The natural influences are determining factors for the soil erosion process in the
study area.
iii. Revised Universal Soil Loss Equation (RUSLE), MUSLE and MSLE equations
may be helpful in evaluating the soil loss.
iv. The Soil investigation reports may be helpful in the estimating the K factor (soil
erodibility factor).
v. The Geotechnical and Environmental Impact Assessment (EIA) reports may be
useful for the determination of slope length and gradient and also the land cover
factor.
1.6 Research Report Outline
This research report is organized in six (6) chapters followed by sections and subsection as
follows:
i. Chapter One briefly introduces the research, a short description of the study area
with respect to its location including objectives and scope of works of the study.
ii. Chapter Two contains literature review of relevant studies regarding to data
collection, soil erosion, modeling and etc.
iii. In Chapter Three, Materials, Research Methods and Techniques are discussed
together with site description including its location, climate, hydrology and geology.

19
No
Yes
iv. Chapter Four contains the overall result for data analysis and its discussion includes
the general description of soil erosion models using MSLE, RUSLE and MUSLE
equations.
v. Chapter Five is the further discussion on the results obtained from data analysis; and
vi. Chapter Six is the conclusion and recommendations for this research.
The summary showing the research work flow is illustrated in Figure 1.6.
Figure 1.6: The research work flow

20
CHAPTER 2
LITERATURE REVIEW 2.0 Introduction
Erosion can be a major environmental problem worldwide as shown in Plate 2.1. It can affect
the land and its inhabitants either in direct or indirect ways. Soil erosion is an issue where the
adage “think globally, act locally,” is clearly apropos. Think globally as soil erosion is a
common problem that will always continue to impact the global community. Act locally
since effective erosion control requires action at the hill slope, field, stream channel and
upland watershed scales (Toy et. al., 2001).
Plate 2.1: Soil erosion phenomena on bare slope

21
2.1 Definition of Soil Erosion
The word "erosion" is derived from the Latin "erosio", meaning "to gnaw away". In general
terms soil erosion implies the physical removal of topsoil by various agents, including rain,
water flowing over and through the soil profile, wind, ice or gravitational pull (University of
Hong Kong, 2000).
Erosion is the process of carrying away or displacement of sediment by the action of wind,
water, gravity, or ice (Smith and Smith, 1998). The process of deposition of sediment from a
state of suspension or solution in a fluid is called sedimentation. Natural sources of
sediments transported to the sea include erosion of bedrock, soil and decomposition of plants
and animals (United Nation Environment Programme and Gems Water Programme
[UNEP/GPA], 2006). However, anthropogenic activities or those which are carried out by
man often change the processes of erosion and sedimentation as well as modifying the flow
of rivers and the amount of sediments it can carry. Most land based activities that occur in
sectors such as agriculture, forestry, urbanization and mining contribute to these changes.
Another significant cause of changes in sedimentation and erosion patterns is through
hydrological modifications that may occur from construction of reservoirs, dams and
causeways, dredging of water bodies and development of large scale irrigation schemes
(UNEP/GPA, 2006a).
Al-Kaisi (2002) stressed that soil erosion is a gradual process that occurs when the impact of
water or wind detaches and removes soil particles causing the soil to deteriorate. According
to Al-Kaisi, soil deterioration and low water quality due to erosion and surface runoff have
become severe problems worldwide.
Soil erosion events are quick processes (Blaikie and Brookfield, 1987; Lal, 1990; and Eaton
1996) and can be defined as a physical process. It refers to the wearing away of land surface

22
by water or wind as well as to the reduction in soil productivity due to physical loss of
topsoil, reduction in rooting depth, removal of plant nutrients and loss of water.
It is particularly problematic in tropical countries because of high rainfall intensities and
generally less fertile soil. It is also a threat to those developing countries when agriculture
production is crucial to development and the majority of the rural population base livelihood
strategies on the primary sector. Unfortunately, many of such rural residents have been
pushed to the margins of agricultural production, i.e. shallower and poorer soils, and the
sloping land and forest frontiers of the uplands. In this situation, agriculture can be the main
cause of soil erosion and watershed deterioration, though the impacts of other activities such
as road construction or logging operation should not be downplayed. Cultivating upland soils
often lead to a reduction in natural soil fertility and crop productivity thus undermining
future income generation (Alfsen et al., 1996) and economic growth (Alfsen et al., 1997).
Soil erosion and the depletion of soil resources have an important economic implications for
countries whose economic depend heavily on the agricultural sector (Barbier and Bishope,
1995).
Adapted from Maine Department of Transportation (MaineDOT) BMPs for Erosion
Sediment Control (ESCP) Manual (2008), erosion is the detachment and movement of soil
particles by the action of water, ice, gravity, or wind. Natural erosion always occurs but the
rate is slow enough that the environment can adjust. When humans began to manipulate the
landscape, it will accelerate the process by exposing soil to the forces of water and wind. On
the other hand, sedimentation is the deposition of soil particles that were detached and
transported by the erosion process. Sedimentation occurs when the velocity of the wind or
water becomes insufficient to keep the soil particles in suspension. Particles can be
transported at great distances and deposited in environmentally sensitive areas such as rivers,
lakes and wetlands. It is sedimentation that can severely alter water quality, damage an
aquatic ecosystem and destroy a wetland.

23
According to Mortlock (2007) soil is naturally removed by the action of water or wind. Soil
erosion has been occurring for some 450 million years ago since the first land plants formed
the first soil. In general, erosion removes soil at roughly the same rate as soil is formed. But
'accelerated' soil erosion (loss of soil at a much faster rate than it is formed), is a far more
recent problem. It is always a result of mankind's unwise actions that leave the land
unprotected and vulnerable during times of erosive rainfall or windstorms where soils may
be detached, transported, and deposited.
The Global Assessment of Human Induced Soil Degradation (GLASOD) (1987-1990) study
as shown in Figure 2.1 estimated that around 15% of the Earth's ice free land surface is
afflicted by all forms of land degradation. From this, accelerated soil erosion by water is
responsible for about 56% and wind erosion for about 28%. This means that the area affected
by water erosion is roughly around 11 million square km and the area affected by wind
erosion is about 5.5 million square km (Mortlock, 2007).
Figure 2.1: ������������ ���������������������������� ���������������� �� ����������������������� ���������� ����������������� ����
��������UNEP (World Atlas of Desertification) GRID�� ������!��"##$��
The consequences of soil erosion can be seen both on site and off site. On site effects are the
loss of soil, the breakdown of the soil structure and a decline in organic matter. Erosion also
reduces available soil moisture, resulting in more draught-prone conditions. Off site

24
problems result from sedimentation downstream or downwind which reduces the capacity of
rivers and drainage ditches, increases the risk of flooding, blocks irrigation canals and
shortens the design life of reservoirs. Eroded sediment is also a pollutant which the
chemicals absorbed by it can increase the levels of nitrogen and phosphorus in water bodies
and result in eutrophication (University of Hong Kong, 2000).
2.1.1 Why does erosion occur?
Erosion is very much depends on the power balance between the rainfall and the soil. Rain
and its runoff provide the force to drive water erosion. If the force applied to the soil is
greater than the resistance of the soil, then particles will detach and move away in either
splash or in surface flows. As the force increases so does the rate of detachment. This gives
the first clue to keeping erosion down to acceptable limits. We can do very little about
reducing the force applied by the rain but we can work at dissipating its energy before it
reaches the soil surface (Cummings, 1998).
2.1.2 How does erosion occurs
Detachment, transport and deposition are basic processes that occur on upland areas (Foster,
1982). Detachment occurs when the erosive forces of rainfall drop impact or when flowing
water exceeds the soil's resistance to erosion. Detached particles are transported by the
splash and flow of raindrop. Deposition occurs when the sediment load of eroded particles
exceeds its corresponding transport capacity and generally will be transported down slope
flowing into rills and gullies as shown in Figure 2.2. Understanding the soil erosion
mechanism is very important to design the soil erosion measurement system and develop the
soil erosion control techniques (Choi et al., 2005).
Copyright © 2022 FDOKUMEN