population genetics and molecular - EPrints USM - Universiti ...
44
POPULATION GENETICS AND MOLECULAR TAXONOMY OF TWO IMPORTANT CULTURED OYSTER SPECIES IN MALAYSIA, Crassostrea iredalei (Faustino, 1932) AND C. belcheri (Sowerby, 1871) SUZANA BINTI MUSTAFFA UNIVERSITI SAINS MALAYSIA 2011
-
Upload
khangminh22 -
Category
Documents
-
view
1 -
download
0
Transcript of population genetics and molecular - EPrints USM - Universiti ...
POPULATION GENETICS AND MOLECULAR
TAXONOMY OF TWO IMPORTANT CULTURED
OYSTER SPECIES IN MALAYSIA,
Crassostrea iredalei (Faustino, 1932) AND
C. belcheri (Sowerby, 1871)
SUZANA BINTI MUSTAFFA
UNIVERSITI SAINS MALAYSIA
2011

POPULATION GENETICS AND MOLECULAR TAXONOMY OF TWO
IMPORTANT CULTURED OYSTER SPECIES IN MALAYSIA,
Crassostrea iredalei (Faustino, 1932) AND C. belcheri (Sowerby, 1871)
by
SUZANA BINTI MUSTAFFA
Thesis submitted in fulfillment of the requirements
for the degree of
Master of Science
School of Biological Sciences
Universiti Sains Malaysia
Pulau Pinang, Malaysia
August 2011
ii
ACKNOWLEDGEMENTS
Alhamdulillah. Allah S. W. T. have given me deepest strength to finish my M
Sc. project and surrounded me with His consent.
I gratefully acknowledge my supervisor, Professor Siti Azizah Mohd Nor for
many years of support, patient, and steadfast efforts on this project. Your insightful
comments, suggestions, and contributions have progressively enhanced this project
and its supplements. Thank you for hundreds of hours of proofreading and assistance
during the writing of the thesis.
Special thanks to Miss Devakie M. Nair and officers from Fisheries Research
Institute (FRI); Assoc. Professor Khoo Khay Huat; Professor Peter Mather from
Queensland University of Technology, Brisbane, Australia; Dr. Thuy Nguyen from
Deakin University, Australia; and Dr. Geoffrey K Chambers from Victoria
University of Wellington, Wellington, New Zealand for their guidance and
contributions to this project. This project was funded by the Ministry of Agriculture
and Agro-Based Industry, Universiti Sains Malaysia through Research University
Grant; the Department of Fisheries, Malaysia and the National Science Fellowship
(NSF), Ministry of Science, Technology and Innovation (MOSTI), Malaysia.
My heartfelt gratitude to members of Lab 308, Kak Naz, Kak Adel, Lutfi,
Adi, Su Yin, Mira, Lim, Papau, Zaza, Dilla, Balkis, Om/Dr Icin, Abdullah, Semah,
Elham, Mashair, Salman, Danial, and Faisal. My dear housemates, Katie, Ana, Lin
and Zai, thanks for being supportive and helpful.
Thank you to Dr Rajinder Singh from Malaysian Palm Oil Board (MPOB) for
my new job, all officers and staff for the cooperation.
This project could not have been completed without continued support and
forbearance of my parents, Mustaffa bin Din and Hasnah Mat Dahan, sisters, Kak Ina
and Adeq, my younger brother, Nan and brothers in law, Abg Yakub and Abg
Khairi. Thank you my family.

iii
TABLE AND CONTENTS
Acknowledgement.......................................................................................................... ii
Table of Contents...........................................................................................................iii
List of Tables............................................................................................................... viii
List of Figures................................................................................................................. x
List of Plates..................................................................................................................xii
List of Symbol and Abbreviations................................................................................xiii
Abstrak......................................................................................................................... xvi
Abstract......................................................................................................................xviii
CHAPTER I – INTRODUCTION
1.1 General Introduction................................................................................................. 1
1.2 Objectives................................................................................................................. 5
CHAPTER 2 – LITERATURE REVIEW
2.1 Oysters of the Malaysian Waters.............................................................................. 6
2.1.1 Malaysian oyster culture, Crassostrea iredalei and C. belcheri................6
2.1.2 Taxonomic description of C. iredalei and C. belcheri...............................7
2.1.3 Distribution.............................................................................................. 12
2.1.4 Biology and life history............................................................................12
2.1.5 Status of C. iredalei and C. belcheri culture in Malaysia........................15
2.4 Mitochondrial DNA................................................................................................ 16
2.4.1 Structure and characteristics of mtDNA.................................................. 16
2.4.2 Molecular taxonomy.................................................................................19
2.4.3 Population genetics.................................................................................. 20
2.4.4 Molecular taxonomy using the barcoding approach................................ 21
iv
2.5 Microsatellite Marker..............................................................................................22
2.5.1 Microsatellite characteristics................................................................... 22
2.5.2 Development of microsatellites............................................................... 25
2.6 Applications of Molecular Marker in Molluscs Research...................................... 28
CHAPTER 3 – MATERIALS AND METHODS
3.1 Sample Collection and Preservation........................................................................31
3.2 DNA Extraction for Mitochondrial and Microsatellite DNA Analyses................. 34
3.3Agarose Gel Preparation.......................................................................................... 34
3.4 Electrophoresis Procedure...................................................................................... 35
3.5 Mitochondrial DNA Analysis................................................................................. 36
3.5.1 Primers..................................................................................................... 36
3.5.2 PCR amplification................................................................................... 36
3.5.3 PCR product purification......................................................................... 37
3.5.4 Automated DNA sequencing of purified products................................. 39
3.5.5 Data analysis........................................................................................... 39
3.5.5.1 Population genetic analysis..................................................... 42
3.5.5.2 Barcoding analysis................................................................... 44
3.6 Microsatellite Analysis........................................................................................... 45
3.6.1 Development of microsatellite markers of Crassostrea.......................... 45
iredalei
3.6.1.1 Construction of enrichment library.......................................... 45
3.6.1.2 Screening for positive microsatellite clones............................. 46
3.6.1.3 DNA sequencing....................................................................... 46
3.6.1.4 Design of oligonucleotide primers............................................ 48
3.6.2 Evaluation of microsatellite marker........................................................ 48

v
3.6.3 Data analysis........................................................................................... 51
CHAPTER 4 – RESULTS
4.1. DNA Extraction..................................................................................................... 52
4.2 Mitochondrial DNA Analysis................................................................................. 52
4.2.1 PCR amplification of COI and 16S mtDNA gene................................... 52
4.2.2 Sequencing results................................................................................... 52
4.3 Population Genetics................................................................................................ 55
4.3.1 Sequence variation................................................................................... 55
4.3.2 Distribution of haplotypes........................................................................55
4.3.3 Genetic diversity...................................................................................... 56
4.3.4. Population genetic structure....................................................................60
4.3.4.1 Population differentiation and gene flow (Nm)......................... 60
4.3.4.2 Analysis of Molecular Variance (AMOVA) ............................ 63
4.3.4.3 Mantel Test................................................................................ 66
4.3.5 Phylogenetic analysis of C. iredalei and C. belcheri...............................68
4.3.6 Minimum Spanning Network...................................................................71
4.4 Barcoding Analysis................................................................................................. 75
4.4.1 Neighbour-joining tree of COI................................................................... 75
4.4.2 Resolution of taxonomic ambiguities based on 16S rRNA gene............... 79
4.4.3 Evolutionary divergence among species based on COI gene..................... 82
4.4.4 Saturation tests for COI gene..................................................................... 82
4.5 Development of Microsatellites.............................................................................. 85
4.5.1 DNA extraction........................................................................................ 85
4.5.2 Enrichment of microsatellites product..................................................... 85
4.5.3 Screening for microsatellite positive clones............................................ 85

vi
4.5.4 Automated fluorescent sequencing.......................................................... 85
4.5.5 Primer design........................................................................................... 88
4.5.6 Microsatellite banding profiles................................................................ 88
4.5.7 Microsatellite evaluation......................................................................... 91
CHAPTER 5 – DISCUSSION
5.1 Population Genetics of C. iredalei and C. belcheri................................................ 93
5.1.1 Genetic variability of COI gene within C. iredalei and........................... 93
C. belcheri populations
5.1.2 Population structure of C. iredalei........................................................... 94
5.1.3 Population structure of C. belcheri.......................................................... 98
5.1.4 Phylogenetic relationships among C. iredalei and C. belcheri..............100
haplotypes
5.2 DNA Barcoding.................................................................................................... 102
5.2.1 Presence of C. madrasensis in Peninsular Malaysia?............................ 103
5.2.2 Identity of the Sebatu pecimens............................................................. 105
5.2.3 Identity of the Muar specimens..............................................................106
5.2.4 Identity of Sungai Menghulu and Semporna specimens........................106
5.2.5 Application of molecular genetics in species identification.................. 107
5.3 Microsatellites....................................................................................................... 108
5.3.1 Development of microsatellite markers................................................. 108
5.4 Implications of Molecular Data to Oyster Management in Malaysia...................111
CHAPTER 6 – CONCLUSION............................................................................... 114
REFERENCES..........................................................................................................116

vii
APPENDICES
LIST OF PUBLICATIONS

viii
LIST OF TABLES
Table 3.1 Putative species, collection site, origin, sample size and collection 32
date of C.iredalei and C. belcheri
Table 3.2 PCR mixture for mtDNA COI and 16S rRNA gene amplification 38
Table 3.3 PCR reaction protocol for mtDNA COI and 16S rRNA 38
gene amplification
Table 3.4 Number of samples extracted and sequenced, number of samples 41
used for population genetics and DNA barcoding analyses
Table 3.5 PCR mixtures for amplification of enriched DNA library 47
Table 3.6 PCR reaction protocol for amplification of enriched DNA library 47
Table 4.1 Distribution of 29 observed mtDNA COI haplotypes, sample 58
size (n), nucleotide diversity, number of haplotypes,
number of polymorphic sites, and Tajima’s D tests among
populations of C. iredalei
Table 4.2 Distribution of 26 observed mtDNA COI haplotypes, sample 59
size (n), nucleotide diversity, number of haplotypes,
number of polymorphic sites, and Tajima’s D tests among
populations of C. belcheri
Table 4.3 Population divergence between samples (FST) based on mtDNA 62
COI sequence data (below diagonal) and gene flow (Nm)
(above diagonal) for (a) C. iredalei, and (b) C. belcheri
Table 4.4 Hierarchical AMOVA within and among eight populations of 65
C. iredalei and C. belcheri.
Table 4.5 Distance in km (below diagonal) and FST values (above 67
diagonal) between populations of (a) C. iredalei and (b) C. belcheri
Table 4.6 Presumed species identification, collection site, sample size, and 78
clade affiliation in COI phylogenetic analysis

ix
Table 4.7 Field identification, ambiguous sequences based on COI gene, 81
number of samples, and BLAST Search results of COI and
16S rRNA gene in GenBank Database
Table 4.8 Kimura 2-parameter estimates of evolutionary divergences 83
over sequence pairs within and between Crassostrea, Saccostrea,
and Ostrea species for the COI gene
Table 4.9 Category of repeats of each sequenced clones 87
Table 4.10 Primer sequences, repeats types, fluorescent dyes, and product 89
size for 11 unsuccessful amplification microsatellite loci
Table 4.11 Characterization of nine novel polymorphic microsatellites for 92
the C. iredalei

x
LIST OF FIGURES
Figure 2.1 Animal mitochondrial genome organization 17
Figure 2.2 Microsatellite fragments of 15 dinucleotides repeats of CT 23
Figure 2.3 Stylized examples of microsatellite data 23
Figure 2.4 Detection of microsatellites from genomic DNA 27
Figure 3.1 Map of Malaysia indicating sample collection sites for putative 33
Malaysian C. iredalei and C. belcheri
Figure 3.2 Schematic representation of microsatellite development using 49
enriched library construction
Figure 4.1 Scatterplots of geographical distances vs pairwise FST values of 67
(a) C. iredalei and (b) C. belcheri from Mantel tests
Figure 4.2 Neighbour-joining phylogram showing the relationships between 69
COI haplotypes in C. iredalei
Figure 4.3 Neighbour-joining phylogram showing the relationships between 70
COI haplotypes in C. belcheri
Figure 4.4a Minimum spanning network showing relationships among 73
29 haplotypes of mtDNA COI gene of C. iredalei, classified
according to populations
Figure 4.4b Minimum spanning network showing relationships among 73
26 haplotypes of mtDNA COI gene of C. belcheri, classified
according to populations
Figure 4.5a Minimum spanning network showing relationships among 74
29 haplotypes of mtDNA COI gene of C. iredalei, classified
according to defined regions
Figure 4.5b Minimum spanning network showing relationships among 74
26 haplotypes of mtDNA COI gene of C. belcheri, classified
according to defined regions
Figure 4.6 Neighbour-joining tree of COI gene sequences of Crassostrea 77
species

xi
Figure 4.7 Kimura 2-parameter distance neighbour-joining tree of 81
16S rRNA gene sequences of Crassostrea and Saccostrea species
Figure 4.8 Relationship between pairwise K2P evolutionary distances and 84
the number of transitions (Ti) and transversions (Tv)
Figure 5.1 Surface currents of the South China Sea 97

xii
LIST OF PLATES
Plate 2.1 Major morphological features for the identification of oyster 9
species
Plate 2.2 Black adductor muscle scar observed in (a) C. iredalei and 11
white scar in (b) C. belcheri
Plate 2.3 Oyster life cycle 14
Plate 4.1 DNA extraction of C. belcheri 53
Plate 4.2 PCR products of C. belcheri partial COI gene 53
Plate 4.3 Purified amplified product of C. belcheri partial COI gene 54
Plate 4.4 DNA extraction of C. iredalei (CI) of S01 from Setiu samples 86
Plate 4.5 Amplification of enriched DNA of C. iredalei 86
Plate 4.6 Workable tests of primer CI.A08 in C. iredalei 90
Plate 4.7 Workable tests of primer CI.G11 in C. iredalei 90

xiii
LIST OF SYMBOLS AND ABBREVIATIONS
β beta
λ lambda
Φ phi
< less than
> more than
π nucleotide diversity
h haplotype diversity
Ho observed heterozygosity
He expected heterozygosity
M molar
μL microliter
µM micromolar
mM milimolar
ng nanogram
mt metric tonne
w/v weight per volume
kW m-1
kilowatts per meter
bp base pair
V volt
UV ultraviolet
U unit
Tv transversion
Ti transition
TBE Tris/Borate/EDTA
Ta annealing temperature
DNA deoxyribonucleic acid
T thymine
C cytosine
A adenine
G guanine
SSR simple sequence repeats

xiv
SSCP single stranded conformational polymorphism
RsaI Rhodopseudomonas sphaeroides I restriction enzyme
rpm rotation per minute
RNA ribonucleic acid
RFLP restriction fragment length polymorphisms
rDNA ribosomal DNA
RAPD random amplified polymorphic DNA
r correlation coefficient
ppt part per thousand
P probability
oC degree Celcius
Nm gene flow
MP maximum parsimony
NJ neighbour-joining
Na number of alleles per locus
mtDNA mitochondrial DNA
MSN minimum spanning network
MluI Micrococcus luteus I adaptor
MLST multilocus sequence typing
min minute
LD linkage disequilibrium
LB lysogeny broth
km kilometer
kb kilobase
K2P Kimura-2-Parameter
IPTG isopropyl-β-D-thiogalactoside
HWE Hardy-Weinberg equilibrium
g gram
FST F statistic
EtBr ethidium bromide
EST expressed sequence tag
EDTA ethylenediaminetetraacetic acid
X-gal 5-bromo-4-chloro-3-indolyl-beta-D-galacto-pyranoside
E. coli Escheria coli

xv
dNTP dideoxynucleotide triphosphate
ddH2O distilled water
COI cytochrome oxidase 1 gene
16S rRNA 16 small ribosomal RNA unit
BLAST Basic Local Alignment Search Tool
AMOVA analysis of molecular variance
AFLP amplified fragment length polymorphisms

xvi
GENETIK POPULASI DAN TAKSONOMI MOLEKUL DUA SPESIES
TIRAM KULTUR YANG PENTING DI MALAYSIA,
Crassostrea iredalei (Faustino, 1932) DAN C. belcheri (Sowerby, 1871)
ABSTRAK
Sebanyak 140 sampel Crassostrea iredalei (Faustino 1932) dan 83 C.
belcheri (Sowerby 1871) dianalisis daripada 16 lokasi sepanjang perairan di
Malaysia. Kepelbagaian genetik dinilai menggunakan fragmen sepanjang 581
nukleotida bagi gen mtDNA sitokrom oksidase 1 (COI). Secara amnya, analisis FST
dan AMOVA menstrukturkan sampel C. iredalei kepada dua kumpulan utama,
konsisten dengan kedudukan geografinya di Semenanjung Malaysia dan Malaysia
Borneo (Sabah). Dalam C. belcheri, analisis FST menunjukkan bahawa populasi
Tawau adalah berbeza daripada populasi lain termasuk populasi yang juga terletak di
Sabah iaitu Sandakan. Hubungan filogenetik berdasarkan algoritma ‘neighbour-
joining’ (NJ) dan ‘maximum parsimony’ (MP) tidak berjaya mengesan sebarang
perbezaan genetik di antara dua kumpulan kawasan tersebut. Kaedah DNA barkod
bagi gen COI dan 16S rRNA menggunakan algoritma NJ pula menunjukkan banyak
individu telah tersalah pengecaman dan tidak terkelompok dalam jangkaan spesies
berdasarkan morfologinya. Keputusan BLAST menunjukkan kewujudan spesies C.
madrasensis yang tidak pernah dilaporkan di perairan Semenanjung Malaysia
sebelum ini (98% persamaan). Spesies Sebatu yang tidak dapat dikenalpasti
dipercayai sebagai Saccostrea cucullata (99% persamaan). Walau bagaimanapun,
pengecaman sebenar sampel Muar (Crassostrea sp.), Sungai Menghulu (Ostrea sp.)
dan Semporna (Saccostrea sp.) tidak dapat ditentukan melalui BLAST (<88%
persamaan). Sembilan penanda mikrosatelit yang polimorfik dipencilkan daripada C.

xvii
iredalei berdasarkan pembinaan perpustakaan diperkaya- mikrosatelit dan dinilai
pada 43 sampel liar dari Kuala Penyu, Sabah. Purata frekuensi alel adalah 21 bagi
setiap lokus dengan nilai 0.395 hingga 1.000 dan 0.780 hingga 0.970, masing-masing
bagi heterozigositi dicerap dan dijangka. Ketidakseimbangan beruntaian berpasangan
(P<0.05) yang signifikan didapati di antara tiga pasangan lokus. Empat lokus tersisih
daripada keseimbangan Hardy-Weinberg selepas pembetulan Bonferroni.
Pemencilan lokus mikrosatelit yang pertama dilakukan ini akan berguna untuk kajian
genetik populasi dan pengurusan stok. Keputusan daripada kajian ini mempunyai
kesan penting dalam akuakultur, pengurusan, dan pemantauan populasi kulur dan
juga pemuliharaan spesies tiram liar di Malaysia.
xviii
POPULATION GENETICS AND MOLECULAR TAXONOMY OF TWO
IMPORTANT CULTURED OYSTER SPECIES IN MALAYSIA,
Crassostrea iredalei (Faustino, 1932) AND C. belcheri (Sowerby, 1871)
ABSTRACT
A total of 140 Crassostrea iredalei (Faustino 1932) and 83 C. belcheri
(Sowerby 1871) samples were analysed from 16 locations along the coast of
Malaysia. Genetic diversities were assessed using a 581-nucleotide fragment of the
mtDNA cytochrome oxidase subunit 1 (COI) gene. FST and AMOVA analyses
generally structured C. iredalei samples into two major groups, consistent with their
geographic origins in mainland Peninsular Malaysia and Malaysian Borneo (Sabah).
In C. belcheri, FST analysis showed that the Tawau population was differentiated
from the rest including the other Sabah population of Sandakan. Phylogenetic
relationship inferred by neighbour-joining (NJ) and maximum parsimony (MP)
algorithm generally failed to detect any differentiation between these two regions.
Barcoding approach of COI and 16S rRNA based on neighbour-joining (NJ)
algorithm revealed that many individuals had been misidentified and did not cluster
with their morphologically presumed species. BLAST results showed the presence of
a previously unreported C. madrasensis species in the Peninsular Malaysian waters
(98% identity). The ambiguous Sebatu species was believed to be Saccostrea
cucullata (99% identity). However, the true identities of the Muar (Crassostrea sp.),
Sungai Menghulu (Ostrea sp.) and Semporna (Saccostrea sp.) samples were
unresolved by BLAST search (<88% identity). Nine polymorphic microsatellite
markers were isolated from C. iredalei based on the microsatellite-enriched library

xix
construction and evaluated in 43 wild samples from Kuala Penyu, Sabah. The
average allele number was 21 per locus with 0.395 to 1.000 and 0.780 to 0.970
observed and expected heterozygosities respectively. Significant pairwise linkage
disequilibrium (P<0.05) was found between three pairs of loci. Four loci
significantly deviated from HWE after Bonferroni corrections. These first C. iredalei
microsatellite loci isolated would be useful for subsequent studies of population
genetics and stock management. The findings from this study have important
implications for aquaculture, management and monitoring of cultured populations as
well as for the conservation of wild oyster species in Malaysia.

1
CHAPTER 1
INTRODUCTION
1.1 General Introduction
Molluscs are highly diverse with the number of described extant species
estimated to be in the range of 85,000 (Chapman, 2009). They make up a group of
commercially important food resource (Mannino and Thomas, 2002); mussels,
clams, cockles, scallops, and abalones. In terms of aquaculture, the Malaysian
mollusc industry is a promising and important sector as food, source of higher
income to the small-scale fisherman as well as profitable trade from export activities
(Wan Norhana, 2011). France leads the mollusc industry in Europe, while in Asia,
China accounted for 80% of the global mollusc catch, netting almost
11,000,000 tonnes in 2005 (http://www.fao.org). In Malaysia, molluscs are one of the
major fisheries sub-sector products which remain as the main contributor to the
export of processed food along with other sub-sectors such as canned fish and
crustaceans (http://www.mida.gov.my). In 2004, the total mollusc harvest was 8.17
million metric tonnes which contributed approximately 40% of the harvest from the
Malaysian aquaculture sector (Mohd Fariduddin, 2008).
Among the molluscs, oysters are among the most familiar filter-feeding
bivalve and best studied of all the marine invertebrate taxa (Jozefowicz and Ó
Foighil, 1998). They inhabit the coastal waters, shallow-water bays and estuaries and
are globally distributed from latitude 64°N to 44°S (Hedgecock, 1995). They are an
ecologically crucial component of marine ecosystems due to their abundance and
various interactions in benthic communities (Berthou et al., 2001). They also play an
important role in the national economies of many countries (Vakily, 1992). Oysters

2
may travel long distances during their long passive planktonic larval stages (1 to 4
weeks) (Avise, 1994) resulting in widespread distribution and dispersion.
The edible species in the world oyster market are highly diverse; mainly
belonging to the genera Ostrea, Crassostrea, Ostreola, and Saccostrea. In Malaysia,
cultured oysters are related to three genera; Ostrea (flat oysters), Saccostrea, and
Crassostrea (cupped oysters). Lam and Morton (2003) reported that oysters of the
genus Crassostrea (Sacco, 1897) are commercially important worldwide but tend to
be low in diversity in Malaysia (Lam and Morton, 2009). The development of the
oyster industry in Malaysia is now targeted at the genus Crassostrea, the dominant
species being C. iredalei and C. belcheri. Both species have shown potential in
aquaculture and are in high demand in Malaysia compared to other marine oysters
such as S. cucullata, and O. folium (Ng et al., 1982, Zulfigar and Aileen, 2000).
Traditionally, Crassostrea can be distinguished from other genera by the form
and structure of the larval shell (Lam and Morton, 2003) and the absence of chromata
(Klinbunga et al., 2003). Chromata are the marginal crenulations in several oyster
taxa, occurring all around the inner side of the valves or only near the hinge which is
composed of small tubercles on the right valve and a corresponding pit on the left
valve. In general, the earlier classification of oysters had been solely based on
morphological characteristics which can be unreliable for precise taxonomic
identification (Ignacio et al., 2000). Several studies have revealed that these earlier
traditional morphological identifications were sometimes inconsistent with those
determined by molecular data (Huvet et al., 2000, Wand et al., 2004). Lam and
Morton (2003) reported that the taxonomy of Crassostrea in the East and South
China Seas has been problematical because of phenotypic shell plasticity. Thus,

3
genetic description should be a very important component of taxonomic
identification.
Since the early studies using allozymes were first initiated in the 1970s, rapid
development in DNA marker technology has now led to the increasing utility of
genomics in aquaculture and taxonomy. Mitochondrial DNA and microsatellites are
now among the most popular markers utilised in taxonomic and aquaculture studies,
in addition to RFLPs, RAPDs, AFLPs SNPs and ESTs (Liu and Cordes, 2004).
Mitochondrion is an organelle found in most eukaryotic cell (Henze and Martin,
2003) which is composed of several compartments performing exclusive functions.
Due to its uniparental inheritance (generally from the female line) (Hoekstra, 2000),
mitochondrial DNA sequence represents a single haplotype and relationships among
each haplotype of different individuals can be used to infer gene tree
(http://en.wikipedia.org/wiki/Mitochondrion). Consequently, gene tree patterns can
be used to infer the evolutionary history of populations. Thus, it has become a
marker of choice in the studies of population genetics, phylogeography, phylogenetic
reconstruction, genetic diversity and evolutionary biology (Avise, 1994, Castro et al.,
1998). Its fast evolutionary rate also makes it suitable for investigation on currently
diverged taxa (Lemos et al., 1999). The genetic differentiation of mtDNA among
populations and the evolutionary rate is thought to be approximately 5-10 times
higher than individual nuclear genes (Birky et al., 1983). Another recent application
is the utilization of the mitochondrial cytochrome oxidase subunit I (COI) gene as the
barcoding gene for the taxonomic identification of most organisms (Hebert, 2003a), a
characteristic of its conservative evolution within, as compared to between species.

4
Microsatellites or simple sequence repeats (SSR) consists of repetitive 1-6 base
pairs of DNA. They were first recognised in the early 1980s (Hamada et al., 1982;
Turnpenny and Ellard, 2005). A microsatellite locus often contains many alleles
which follow a co-dominant inheritance mode; an ideal marker in population genetic
studies, genetic recombinant, and paternity determination (Queller et al., 1993). The
variable number of repeat units (alleles) at a given locus accounts for its
polymorphism (Karsi et al., 2002). High mutation rates have been reported in
microsatellites of up to 10-2
per generation (Weber and Wong, 1993, Crawford and
Cuthbertson, 1996). Even though the development of microsatellite markers can be
costly (Wuthisuthimethavee et al., 2003) but once developed it has proven useful for
resolving many biological questions in various organisms (Gupta et al., 1996, Moore
et al., 1999).
The applications of various genetic markers in population biology have seen
rapid increases since their development in the 1980s and 1990s (Wang and Szmidt,
2001). Through the studies of population genetic structure and diversity, historical
events (de Meeuˆs et al., 2007) and evidence for recent adaptive evolution
(Brookfield, 2001) can be elucidated. The utilization of molecular markers has also
provided important insights into the nature of population divergence in marine
species (Hilbish, 1996). Such data are important in defining stocks and therefore
management units in conservation and selection of broodstocks in aquaculture.
Realising the importance of genetic data for oyster management, the Fisheries
Department of Malaysia and USM embarked on this project to investigate the
population structures of two commercially important oyster species with the ultimate
objective of recommending their management strategies.

5
1.2 Objectives
Specifically the objectives were:
1. To investigate the population structure of two important oyster species,
Crassostrea iredalei and C. belcheri found along the coast of Malaysia.
2. To investigate natural dispersal and translocations among populations of these
species based on mitochondrial markers.
3. To develop microsatellite markers for future studies in aquaculture and population
studies.
However, due to taxonomic ambiguities observed during the course of the population
study, a fourth objective was introduced:
4. The barcoding of the Malaysian oysters.

6
CHAPTER 2
LITERATURE REVIEW
2.1 Oysters of the Malaysian Waters
The global edible species are highly diverse; mainly belonging to the genera
Ostrea, Crassostrea, Ostreola, and Saccostrea. In Malaysia, four main genera (with
their respective species) have been identified by Ng (1979); Crassostrea
(Crassostrea iredalei and Crassostrea belcheri), Saccostrea (Saccostrea echinata
and Saccostrea sp.), Ostrea (Ostrea folium), and Hyotissa (Hyotissa hyotis). Of
these, oyster culture is focused on three genera; Ostrea (flat oysters), Saccostrea, and
Crassostrea (cupped oysters). The total oyster production in Malaysia increased from
373.72 metric tonne (mt) in 2005 to 869.72 mt in 2007 with increased profit of
74.02% (RM 3.40 billion) (DOF, 2005, 2008). Unfortunately, this number decreased
to 275.47 mt in 2008 with a total value of only RM 1.25 billion (DOF, 2008).
Presumably, similar to other regions, heavy losses of reefs world-wide due to
destructive and overfishing, sedimentation, unstable freshwater inflow, disease,
intrusion of new species and unbalanced nutrients and pollutants may have accounted
for this serious decline (Beck et al., 2009).
2.1.1 Malaysian oyster culture, Crassostrea iredalei and C. belcheri
Crassostrea iredalei and C. belcheri are members of the family Ostreidae,
which consists of the most important edible oysters worldwide. However, the
importance of C. iredalei is not restricted to consumption as a healthy food source; a
project to utilize C. iredalei shells as substitutes for silicon dioxide (silica sand) in
ceramic tile manufacturing has been commercialized (Agbayani and Espinosa, 2006).
7
In Peninsular Malaysia, the culture programme of slipper cupped oyster or C.
iredalei (Faustino, 1932) has been very successful on the west coast through spat
transplantation programme from its native habitat in the east coast (Devakie and Ali,
2000). Even though the transplanted spats grow relatively slower than the local C.
belcheri, this species has successfully adapted to the west coast environment with
low mortality rate (Devakie et al., 1993). However, due to the monsoon seasons
occurring yearly from November to January, oyster spats are regularly imported from
Thailand to overcome the spat supply disruption.
Crassostrea belcheri (Sowerby, 1871) or ‘tiram kapak’ was the first species
cultured in Malaysia in the early 1960’s (Okada, 1963). According to Charoensit
(1995) it is the most commercially important oyster species in Thailand. It can be
grown from natural seeds and is tolerant to a wide range of salinities (Angell, 1986)
making it a perfect choice for the mollusc aquaculture industry (Tanyaros et al.,
2008). In addition, recent studies have shown that the hemolymph and purified
proteins of C. belcheri exhibit significant antibacterial activity against Vibrio spp.
(Nuchchanart et al., 2007).
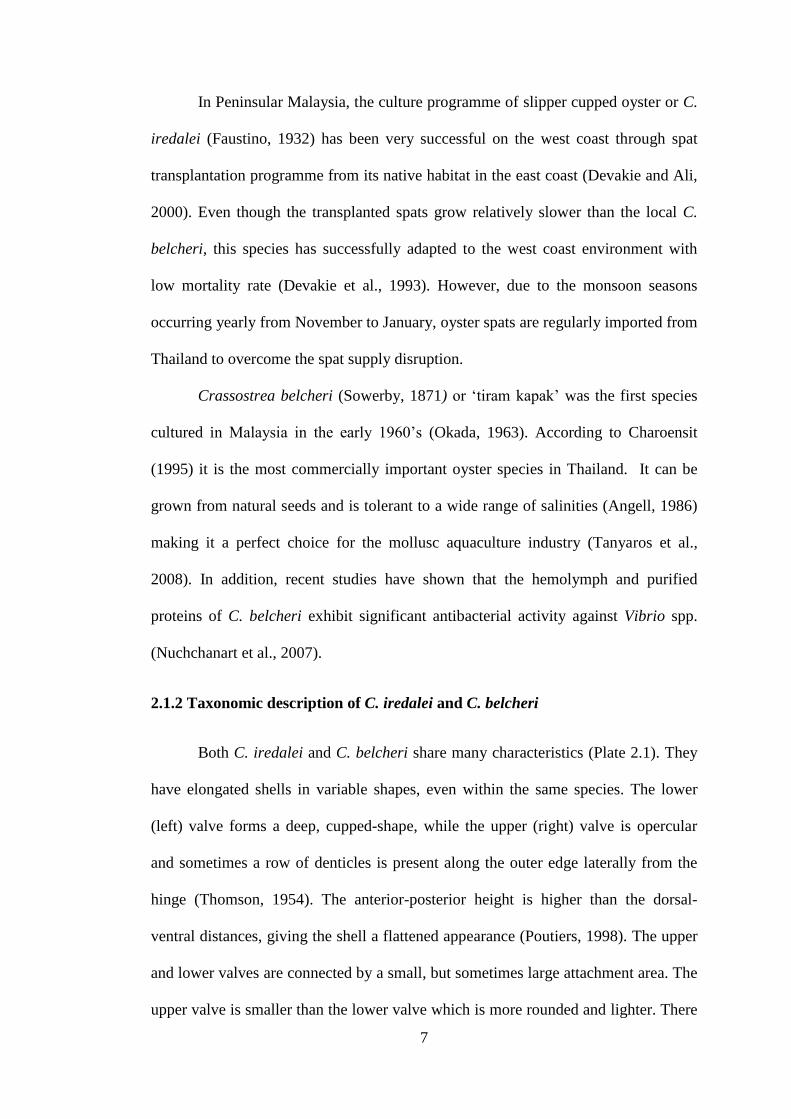
2.1.2 Taxonomic description of C. iredalei and C. belcheri
Both C. iredalei and C. belcheri share many characteristics (Plate 2.1). They
have elongated shells in variable shapes, even within the same species. The lower
(left) valve forms a deep, cupped-shape, while the upper (right) valve is opercular
and sometimes a row of denticles is present along the outer edge laterally from the
hinge (Thomson, 1954). The anterior-posterior height is higher than the dorsal-
ventral distances, giving the shell a flattened appearance (Poutiers, 1998). The upper
and lower valves are connected by a small, but sometimes large attachment area. The
upper valve is smaller than the lower valve which is more rounded and lighter. There

8
is a clear adductor muscle scar which is the attachment area for the flesh in the
internal part of the shells (Hickman, 1993). A promyal chamber is present on the
right side. Crassostrea iredalei usually has an asymmetrical, medium sized shell of
approximately 8 cm, but this could reach 15 cm high (FAO, 2010). The shell shape is
roughly rounded, slanted triangular or elongated ovate in outline. The adductor
muscle scar is black, roundish or bean-shaped and located dorsally, nearer to the
ventral margin than to the hinge.

9
Plate 2.1 Major morphological features for the identification of oyster species
(Redrawn from Siddiqui and Ahmed, 2002).
10
Crassostrea belcheri has a larger shell compared to C. iredalei, which is
rounded, dome, or oval in shape. The hinge is broad with the posterior side wider
than the anterior end but the ventral margin is a little extended (Siddiqui and Ahmed,
2002). Internally, the muscle scar is white and located slightly to the dorsal end. The
colour of the adductor muscle scar is the primary characteristic used to differentiate
between C. belcheri and C. iredalei, which is observed to be black in C. iredalei and
white in C. belcheri (Visootiviseth et al., 1998). The difference between these scars
can be clearly seen in Plate 2.2. The inner mantle is slightly brownish and the mantle
fold is black.
The taxonomy of C. iredalei and C. belcheri is shown below:
Superkingdom : Eukaryota
Kingdom : Animalia (Linnaeus, 1758)
Subkingdom : Bilateria (Hatschek, 1888; Cavalier-Smith, 1983)
Branch : Protostomia (Grobben, 1908)
Infrakingdom : Lophotrochozoa
Superphylum : Eutrochozoa
Phylum : Mollusca (Linnaeus, 1758; Cuvier, 1795) - molluscs
Class : Bivalvia (Linnaeus, 1758)
Subclass : Pteriomorpha
Order : Ostreoida
Superfamily : Ostreoidea
Family : Ostreidae
Genus : Crassostrea
Species : C. iredalei and C. belcheri

11
Plate 2.2 Black adductor muscle scar observed in (a) C. iredalei and white scar in (b)
C. belcheri.
Black
adductor
muscle
White
adductor
muscle
(a) (b)

12
2.1.3 Distribution
Crassostrea iredalei and C. belcheri are mainly found in the South China
Sea, Andaman Sea and Gulf of Thailand (Yoosukh and Duangdee, 1999). However,
Berthou et al., (2001) reported that the main areas of C. iredalei production are
restricted to Malaysia and the Philippines. Crassostrea. belcheri culture is rapidly
growing throughout the South China Sea region including the Philippines, Vietnam,
Malaysia, the Indonesian islands of Java and Sumatra (Ranson, 1967) and Thailand
(Klinbunga, 2000). Earlier studies by Awati and Rai (1931), Kazmi (1953) and
Hasan (1960) had documented this species at the littoral zones of Karachi, Pakistan.
In Malaysia, C. iredalei can be naturally found along the east coast of
Peninsular Malaysia especially in Kelantan and Terengganu, along the coast of
Sabah and a few locations in Sarawak (Zulfigar and Aileen, 2000). On the other
hand, C. belcheri is naturally abundant in the mangrove systems on the west coast of
Peninsular (Kedah and Perak), in the south (Johor), and along the coast of Sabah. In
the 1970’s, culture trials of this species was conducted in Sabah (Chin and Lirn
1975) and has since shown promising commercial development until now. From
2005-2007, Sabah was the top producing state contributing up to 221.05 mt per year
valued at RM1.25 billion (DOF, 2008).
2.1.4 Biology and life history
Crassostrea iredalei is found in enclosed brackish water lagoons (Devakie,
1993), estuaries, intertidal zone, shallow subtidal water (FAO, 2010) and even rocky
shores which have lower salinity than the open sea (Young and Serna, 1982). In
Malaysia, spats and adults can be found in brackish water (5 ppt) to full strength sea
water (33 ppt). Devakie and Ali (2000) however reported a narrower range of 15 to

13
25 ppt for its culture. On the other hand, C. belcheri can be found in the intertidal
zone, attached to the aerial roots of mangroves in the west coast of Peninsular
Malaysia and Sabah (Chin and Lim, 1975). Being able to tolerate a wide range of
environmental variables including salinity, temperature (Tan and Wong, 1996),
concentrations of suspended sediments and dissolved oxygen, oysters are categorised
as tolerant organisms. (http://score.dnr.sc.gov/deep.php?subject=2andtopic=15).
The life history of oysters (McNevin, 2007) begins with the release and
fertilization of the eggs and sperms in the water. The eggs then develop into a
planktonic trocophore larva (Plate 2.3). The trocophore metamorphose into a thin-
shelled veliger larva after 24 hours. Oysters may travel long distances during this
long planktonic veliger larval stage (1 to 4 weeks) (Avise, 1994) resulting in
widespread distribution and dispersion. A foot structure will be developed at the end
of this stage, facilitating settlement on hard substrates such as molluscan shells for
attachment. These veliger larvae then metamorphose into spats which are the
miniature adult form. High mortality occurs during this stage- only 8 to 12 per cent
of the spats will survive to adults on the substrate surfaces.

14
Plate 2.3 Oyster life cycle (illustration modified from South Carolina Department of
Natural Resources – McNevin, 2007)

15
2.1.5 Status of C. iredalei and C. belcheri culture in Malaysia
Crassostrea iredalei and C. belcheri have high potential in the aquaculture
industry due to their high demand in the Malaysian aquaculture sector compared to
other oyster species such as S. cucullata and O. folium (Ng et al., 1982, Zulfigar and
Aileen, 2000). Although C. belcheri culture was introduced in the early 1960’s
(Okada, 1963), its development in Malaysia had not shown significant increase even
into the 1990’s. Thus, taking into account the importance and success of the oyster
industry in the neighbouring countries, Thailand and Philippines the Malaysian
government embarked on a more active programme for its development in the late
1980’s (Devakie et al., 1993). In particular, the Fisheries Research Institute (FRI),
Malaysia benefited technically and financially from the Bay of Bengal Programme,
funded by the Danish International Development Assistant (DANIDA) and the
Swedish International Development Authority (SIDA). This programme was
conducted from 1988 to 1989, focusing on C. iredalei and C. belcheri along with two
other common species, Saccostrea sp., and Ostrea folium but with greater emphasis
on the first two species. However, 20 years on, the Malaysian industry still lacks far
behind the other producing countries (Devakie, Fisheries Research Institute, personal
communication).
Three traditional culture methods are practiced in Malaysia, namely 1. the raft
or floating method which is employed for oysters grown in riverine conditions with
heavy siltation and considerable tidal range 2. the pole and rack method which is an
intertidal fixed-culture method used for both spat collection and grow-out 3. the
bottom culture method where clutches are scattered at the same site for collecting the
spats and grow-out (http://www.fao.org).

16
However, in recent years, recognising the prospects of oyster culture, various
research institutions and private sector establishments involved in bivalve culture are
focusing their interest on the oyster industry. In 2002 to 2004, there were 260 to 300
operators involved in oyster culture production (Mohd Fariduddin, 2008). Several
studies on improved culture methods and new technology have been conducted to
develop this bivalve production. These included a study on the comparative growth
and survival of hatchery-produced oyster seeds in Semporna. Among others, the
study reported that physical parameters should be of high consideration when
choosing a culture site (Zulfigar, 2002). Izwandy (2006) also conducted a study on
the influence of environmental factors on the growth and mortality of C. iredalei in
Kg. Telaga Nenas, Perak. His study revealed that the oysters could not tolerate
habitats with a dominance of phytoplankton. Other studies have focused on heavy
metal contamination in cultured oysters (Lim et al., 1995, Najiah et al., 2008).
However, despite all these efforts, there is still limited progress in the development
and utilisation of innovative techniques in oyster culture. More studies should be
encouraged to overcome the constraints and threats associated with this culture.
2.4 Mitochondrial DNA
2.4.1 Structure and characteristics of mtDNA
The mitochondrion is a large energy producing cell organelle which has its own
small, circular DNA molecule (15-22kb). This genetic material is believed to have
evolved independently from nuclear DNA. Historically, mtDNA is thought to arise
from the circular genomes of bacteria that were consumed by the early predecessor
of eukaryotic cells. Two to ten copies of mtDNA are found in each mitochondrion
(Wiesner et al., 1992). The heavy (H) and light (L) strand transcription is regulated
by the control region, functioning as the primary non-coding region (Fig 2.1).

17
Figure 2.1 Animal mitochondrial genome organization. Abbreviations: DL, D-loop
region; 12S, small 12S rRNA (ribosomal ribonucleic acid), 16S, large 16S rRNA;
ND1-6, NADH dehydrogenase subunits 1-6; ND4L, NADH dehydrogenase subunit
4L; COI-III, cytochrome oxidase subunits I-III; ATP8, ATPase subunit 8; ATP6,
ATPase subunit 6; Cyt b, cytochrome b, OH, origin of heavy strand; OL, origin of
light strand (Wilhelm et al., 2003)

18
As a molecular marker, mitochondrial DNA has many advantages, such as high
mutation rate (Brown et al,. 1979), high copy number, lack of recombination (Elson
et al., 2001) and haploid in nature (Hurwood et al., 2003). Brown (1983) reported
that the evolutionary rate, thought to be approximately 5-10 times higher than
nuclear DNA makes it more sensitive towards genetic changes than nuclear DNA
(Clayton, 1984). It is suitable for studying evolution, migration patterns, diseases,
species identification, forensics and maternal lineage correlation. Phylogenetic
relationships among closely related taxa can also be resolved by the utilisation of
mtDNA (Moritz et al., 1987).

19
2.4.2 Molecular taxonomy
Mitochondrial DNA sequencing analysis is a molecular method to compare
DNA sequence of targeted genes located in the cell mitochondria. DNA sequences
are the order of the four nucleotide bases which build the DNA strands; adenine (A),
guanine (G), cytosine (C), and thymine (T). Basically, the procedure involves
multiplying the targeted DNA fragments using Polymerase Chain Reaction (PCR)
followed by sequencing.
In the early days, DNA sequencing was performed by primed synthesis with
DNA polymerase under controlled conditions, known as ‘plus and minus method’
(Sanger and Coulson, 1975). This initial method has consequently been improved
leading to the introduction of chain-termination methods (Sanger et al., 1977). Both
approaches are basically the same, but the latter exploit dideoxynucleotide
triphosphates (ddNTPs) as specific DNA polymerase chain terminators. Due to its
high efficiency, minimal involvement of toxic chemicals and radioactivity, this
improved method is more favoured than the alternative method of Maxam-Gilbert.
The Maxam-Gilbert method was developed by Allan Maxam and Walter Gilbert and
utilizes labelled DNA which is chemically cleaved in a sequence-dependent manner
(Maxam and Gilbert, 1977). It is hazardous due to the utilisation of toxic chemicals,
is laborious, and difficult to apply on a large scale. With technological advances,
many big institutions are now going for the more costly third generation sequencing
method which allows for easier, faster and flexible sequence reactions of the genome
(Glaser, 2010).

20
2.4.3 Population genetics
Identifying and monitoring populations are very important for a systematic
aquaculture management programme. Early conventional approaches have depended
on population life history characteristics such as reproductive condition (Newell et
al., 1982), breeding (Mendoza 1989) and movement patterns (Hemker et al., 1984) to
understand processes and patterns of variations in populations. With the advent of
molecular tools such questions are more accurately addressed and understood and the
area of population genetics has increasingly become the method of choice replacing
the traditional approaches.
Population genetics help us to gain insights into the process of evolution
based on the population genetic composition and changes through time. These
changes are ruled by the co-actions of natural selection, genetic drift, and gene flow
(Eckert et al., 2008) which can lead to variation between populations. Several
molecular markers extensively used to study population variation and have proven
advantageous include PCR-RFLP (Okimoto et al., 2006), mtDNA sequencing
(Mathews and Anker, 2009, Norfatimah et al., 2009, Jamsari et al., 2010, Nazia et
al., 2010), randomly amplified polymorphic DNA (RAPD) (Garg et al., 2009,
Motlagh and Anvari, 2010), microsatellites (Bhassu and Abd Rashid, 2009, Amro et
al., 2009), isoenzymes/allozymes (Filipová et al., 2009) and amplified fragment
length polymorphisms (AFLP) (Nisar et al., 2010). Other available markers are
minisatellites, multilocus sequence typing (MLST), and single stranded
conformational polymorphism (SSCP) (de Meeuˆs et al., 2007).
Data on population genetic diversity can be utilised in the genetic
improvement of important cultured species, through selection of genetically rich

21
broodstock, selective breeding of optimal strains and management (Hurwood et al.,
2005). In addition taxonomic uncertainties could be resolved (van Dyke, 2008), and
patterns of natural genetic variation could be recorded for a sustainable aquaculture
programme (Nguyen et al., 2006).
2.4.4 Molecular taxonomy using the barcoding approach
The taxonomic identification of species utilising an approximately 640bp of
the cytochrome oxidase subunit 1 (COI) gene or also popularly known as the DNA
barcode has gained wide popularity since its introduction in 2003 (Hebert et al.,
2003b). The COI gene ability to successfully discriminate among species across the
animal (Hebert et al., 2003a), plant (Chase et al., 2005), and fungi (Seena et al.,
2010), stem from its much higher variation among congeneric species than
conspecific individuals. This approach has enabled precise identification of fishes
(Ward et al., 2008, Hubert et al., 2008, Steinke et al., 2009), birds (Kerr et al., 2009,
Johnsen et al., 2010), insects (Hebert et al., 2004, Virgilio et al., 2010), terrestrial
mammals, such as opossums, rodents and bats (Borisenko et al., 2008) etc. In marine
biodiversity (apart from fishes), its efficacy has been revealed in molluscs
(Mikkelsen et al., 2007), echinodermata (Uthicke et al., 2010) and cnidaria (Moura et
al., 2007).
Oyster classification has conventionally been based on morphological
characteristics that are often highly problematical, therefore frequently leading to
ambiguous taxonomic diagnoses (Lam and Morton, 2003, Wang and Guo, 2008).
Occurrence of morphological misidentifications is not uncommon because the use of
traditional keys often requires well trained personnel. This is further confounded by
the morphological plasticity of this group (Lam and Morton, 2006, Sekino, 2009). In

22
many cases, DNA barcoding helps resolve these problems by permitting even non-
experts to accurately identify specimens in whatever life stages or gender. Although
it cannot replace morphological taxonomy, it is a complementary tool for taxonomist
to quickly identify and confirm existing species as well as to discover new species.
The Barcode of Life Data Systems (BOLD) serves as the biovidersity catalogue that
manages data collection of global barcodes, provides an identification engine, and
monitor sequence record around the globe (Ratnasingham and Hebert, 2007). It is an
important platform to the barcoding community and society.
2.5 Microsatellite Marker
2.5.1 Microsatellite characteristics
The simple sequence repeats of microsatellite markers (SSRs) are made up of
fragments of repeated di-, tri-, and tetranucleotides (two, three, or four nucleotides
respectively) (Figure 2.2). These fragments can be repeated from 10 up to 100 times,
the variable repeats forming the various alleles. The size of PCR products and
number of repeats for each allele can be determined either by gel electrophoresis or
capillary electrophoresis (Figure 2.3).
The microsatellite marker has become increasingly popular and advantageous
in addressing many genetic issues, compared to other markers even though its
isolation is more tedious and complicated. Among its characteristics is its abundance
across the genome, high polymorphism, informative (Guo et al., 2009), co-dominant
inheritance (Smith et al., 1997), effectively simple and ability to be cross-amplified
(King et al., 2008). Thus, genetic differences could be elucidated at high sensitivity
using this marker (Koffi et al., 2007).

23
Figure 2.2 Microsatellite fragments of 15 dinucleotides repeats of CT.
Figure 2.3 Stylized examples of microsatellite data. (a) Four data sets produced by
gel electrophoresis. Black bands indicate allele and grey bands indicate stutter*. (b)
Data sets produced by analysis on an automated capillary electrophoresis-based
DNA sequencer. The height of each peak indicates the amount of PCR product. True
alleles produce higher peak than the stutter peaks (http://www.bio.davidson.edu).

24
Many genomic studies have incorporated this hypervariable microsatellite
marker as a key focus in their studies. In Malaysia, seven tetranucleotide
polymorphic loci have been isolated and characterized in the mungbean Vigna
radiata based on the 5′-anchored PCR technique (Kumar et al., 2002). Ghiasi (2009)
tested cross amplification of 16 microsatellite markers developed for the common
carp Cyprinus carpio L. and Tor tambroides in two hatchery populations of ikan
temoleh, Probarbus jullieni in Peninsular Malaysia with the addition of six newly
developed markers spesifically for P. jullieni also based on 5′-anchored PCR
technique. Recently, the isolation of eight single locus DNA microsatellite markers
using 5'-anchored ISSR-PCR enrichment procedure was conducted and tested on 127
samples to determine the population structure of the mangrove horseshoe crab
Carcinoscorpius rotundicauda from Peninsular Malaysia (Adibah et al., 2011).
Other than local studies described above, Mukesh et al. (2009) used 25
bovine specific microsatellite markers for individual assignment assay in six native
cattle breeds from the Gujarat state of India and observed discrete genetic sturucture
in four out of six cattle breeds. A slight genetic variation between wild and cultured
population of mud carp (Cirrhina molitorella) was detected using 12 polymorphic
microsatellite loci (Yang et al., 2008). Paternity testing system of 330 Chinese
Holstein genotype was established using 30 microsatellite markers and nine were
proven useful and selected (Tian et al., 2008). High level of gene flow inferred by
nine microsatellite loci indicated the probability of widespread drug resistance and
virulence allele distribution among Schistosoma mansoni within human
infrapopulation in Mwea, central Kenya (Agola et al., 2009). As described,
microsatellite markers have high merit compared to other genetic markers in
detection of targeted traits in large breeding programmes (Brown et al., 1996),