Untitled - Eprints@CMFRI
165
-
Upload
khangminh22 -
Category
Documents
-
view
0 -
download
0
Transcript of Untitled - Eprints@CMFRI


The Centre of Advanced Studies in Mariculture commenced in 1979 at the Central Marine Fisheries Research Institute, Cochin under one of the Sub-projects of the ICAR/UNDP project on 'Postgraduate Agricultural Education and Research, is now continued as a regular Postgraduate Programme in Mariculture. The main objective of the PGP in Mariculture is to catalyse research and education in mariculture which forms a definite means and prospective sector to augment fish production of the country. The main functions of the Programme are to :
— provide adequate facilities to carry out research of excellence in mariculture/coastal aquaculture;
— improve the quality of postgraduate education in mariculture;
— make available the modern facilities, equipments and the literature;
— enhance the competence of professional staff;
— develop linkages between the Centre and other institutions in the country and overseas;
— undertake collaboration programmes; and
— organise seminars and workshops.
Under the programmes of the PGPM at CMFRI, postgraduate courses leading to M. Sc. (Mariculture) and Ph. D. are offered in collaboration with Cochin University of Science and Technology since 1980.
Cover Photos by Shri K. N. Rajan and Shri P. Raghavan

MARICULTURE RESEARCH UNDER THE POSTGRADUATE PROGRAMME
IN MARICULTURE
PART 3
Editorial Committee
Dr. K. Rengaxajan — Convenor Dr. A. Noble Mrs. Prathibha Mrs. V. Kripa Dr. N, Sridhar Dr. Mohan Zakhriah
CMFRI SPECIAL PUBLICATION Number 54
CENTRAL MARINE FISHERIES RESEARCH INSTITUTE INDIAN COUNCIL OF AGRICULTURAL RESEARCH
DR. SAUM ALI ROAD, POST BOX NO. 1603, TATAPURAM - P. O., ERNAKULAM, COCHIN • 682 014

RESTRICTED DISTRIBUTION
Published by : Dr. P. S. B. R. James Director, Central Marine Fisheries Research Institute, Cochin - 682 014.
Citation : SHYLAIA, K . AND K. RENOARAJAN 1993. Tolerance limits of salinity, temperature, oxygen and pH by the juveniles of prawn Penaeus indicus H. Milne Edwards. CMFRI Spl. PubL, 54 : 64-69.
PRINTED IN INDIA AT MODERN GRAPHICS, KALOOR, ERNAKULAM, COCHIN 682 017

CONTENTS
PREFACE . . . . . . . . . . . . in
CONTENTS . . . . . . . . . . . . v
EFFECT OF PHYSICAL STRESS ON THE PRAWN
PENAEUS INDICUS. ... . . . . . . 1
SOME BIOCHEMICAL AND HISTOLOGICAL CHANGES
IN RELATION TO TOXICITY OF DDT IN
PENAEUS INDICUS H . M I L N E EDWARDS. . . . 9
ECOLOGICAL STUDIES ON COCONUT HUSK RETTING
AREA IN THE COCHIN BACKWATER AND ITS
RELATION TO FISH SEED AVAILABILITY. . . . 14
EFFECT OF 2, 4-D AND GIBBERELLIC ACID ON
SELECTED SEAWEEDS. . . . . . . . . . 21
HISTOPATHOLOGICAL STUDIES ON ZINC TOXICITY IN
MiLKFisH CHANOS CHANOS FORSSKAL. ... 25
STUDIES ON THE QUALITY OF BRACKISHWATER
CULTURED AND WILD MARINE PRAWN
PENAEUS INDICUS. ... ... ... 28
HISTOPATHOLOGICAL STUDIES ON SOFT PRAWNS. . . . 33
DISTRIBUTION OF PENAEID SEED ACCORDING TO
VARIATIONS IN WATER DEPTH IN SHALLOW
AREAS OF COCHIN BACKWATER. . . . 36
MOBILISATION OF TOTAL CAROTENOIDS IN RELATION
TO O V A R I A N M A T U R A T I O N IN THE P R A W N
METAPENAEUS DOBSONI (MIERS). . . . 43
HiSTOMORPHOLOGICAL CHANGES IN PENAEUS INDICUS
D U E TO THE EFFECT OF L O W SALINITY A N D
Low OXYGEN IN WATER. * . . . 49

EFFECT OF "NUVAN" ON SOME BIOCHEMICAL AND
PHYSIOLOGICAL PARAMETERS OF LIZA PARSIA
(HAMILTON AND BUCHANAN). . . . 53
KARYOMORPHOLOGY OF LATES CALCARIFER. ... 58
STUDIES ON THE BIOTOXICITY OF THE MANGROVE
VEGETATION ON THE FINGERLINGS OF LIZA
MACROLEPIS, TiLAPIA MOSSAMBICA AND CHANOS
CHANOS. ... ... ... ... 61
TOLERANCE LIMITS OF SALINITY, TEMPERATURE,
OXYGEN AND P H BY THE JUVENILES OF PRAWN
PENAEUS INDICUS H . MILNE EDWARDS. . . . 64
O N THE DISTRIBUTION AND ABUNDANCE OF FRY AND
JUVENILES OF A FEW CULTIVABLE FISHES IN
RELATION TO CERTAIN ENVIRONMENTAL
PARAMETERS AT COCHIN. . . . . . . 70
STUDIES ON SALINITY INDUCED STRESS ON
NEUROSECRETORY CELLS, PROTEIN, FREE
AMINO ACID CONTENT AND AMMONIA
EXCRETION RATE OF PENAEID PRAWN
METAPENAEUS MONOCEROS (FABRICIUS). . . . 74
STUDIES ON A MANGROVE HABITAT DOMINATED BY
BRUGUIERA SPP. . . . . . . . . . 78
A N ANALYSIS OF FACTOR - PRODUCT RELATIONSHIP
IN PRAWN FARMING : A PRODUCTION
FUNCTION APPROACH. . . . . . . . . . 85
A SAMPLING MODEL FOR THE ESTIMATION OF
JUVENILE SHRIMP FISHERY OF VEMBANAD
LAKE. . . . . . . . . . . . . 94
SOIL CHARAqTERisTics IN THE CULTURE P O N D S OF
CHERAI IN VYPEEN ISLAND. . . . . . . 99

A STUDY OF THE EFFECTS OF EYESTALK ABLATION ON
THE ELECTROPHORETIC PATTERNS OF GENERAL
PROTEIN IN PENAEUS INDICUS H . MILNE
EDWARDS. . . . . . . . . . . . . 105
STUDIES ON THE EFFECT OF M S - 2 2 2 ON BASAL
METABOLISM IN SEEDS OF PENAEUS INDICUS
H. MILNE EDWARDS. . . . . . . . . . 114
STUDIES ON THE HYDROLOGY AND THE ABUNDANCE
OF PHYTOPLANKTON OF FISH CULTURE PONDS. . . . 119
STUDIES ON OSMOTIC ADAPTATIONS WITH RESPECT
TO HAEMOLYMPH OSMOLALITY AND CHANGES
IN GILL STRUCTURE IN METAPENAEUS DOBSONI
(MiERs). ... ... ... ... 127
STUDIES ON THE EFFECT OF TEMPERATURE AND
SALINITY ON GROWTH AND FEEDING RATE OF
THE BLACK CLAM VILLORITA CYPRINOWES
(GRAY). . . . . . . . . . . . . 132
A STUDY ON PHYTOPLANKTON PIGMENTS AND
PRIMARY PRODUCTIVITY IN THE COCHIN
BACKWATER DURING SOUTHWEST MONSOON
SEASON. . . . . . . . . . . . . 140
EVALUATION OF IMMUNE RESPONSE IN FINFISH. . . . 151

CMFRI Spl. Publ, 1993; 54 : 1 - 8
EFFECT OF PHYSICAL STRESS ON THE PRAWN PENAEUS INDICUS
BiNDu R. PiLLAi P. S. B. R. JAMES Research Scholar Supervising Teacher
Introduction
Owing to natural and manmade manipulations, aquacul-ture system is often exposed to variations in the biotic and abiotic factors which results in various degrees of trauma in cultured animals. In addition to these, many of the procedures adopted in aquaculture practices, such as handling of animals, confinement, transport, disease treatment, etc. also cause severe physical stress in them. Many of these stressors have been found to be associated with reduced growth, increased susceptibility to pathogens, and these can adversely affect the overall production of animals in the culture system. Therefore an understanding of the responses of cultivable animals to actue physical stress is of paramount importance to farmers and field biologists. With this in view, the present investigation was carried out to examine the effect of physical stress on the various biochemical constituents such as glucose, lactic acid, protein and lipid, in haemolymph and muscle of the Indian white prawn Penaeus indicus. Studies were also made on histological changes occurring in hepatopancreas and muscle during stressed conditions.
Material and methods
The prawn P. indicus 100-120 mm in size, collected from Matsyafed farm at Narakkal were used for the experimental purpose. Prawns were transported to the laboratory in polythene bags, and acclimatized to laboratory conditions in large fibre-glass tanks of 2 tonnes capacity containing filtered and well aerated seawater of \5%o salinity for 48 hrs. Only intermoult individuals were segregated for the experimental purpose. In the first experiment strenuous exercise was
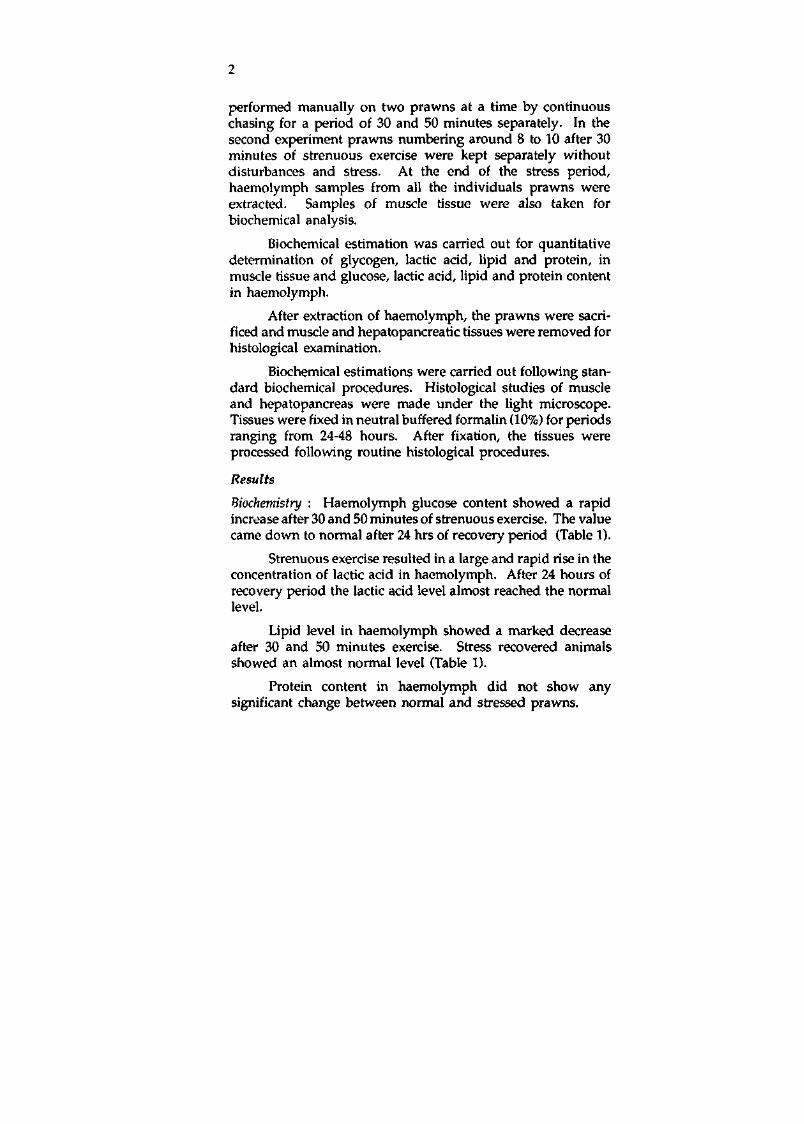
performed manually on two prawns at a time by continuous chasing for a period of 30 and 50 minutes separately. In the second experiment prawns numbering around 8 to 10 after 30 minutes of strenuous exercise were kept separately without disturbances and stress. At the end of the stress period, haemolymph samples from all the individuals prawns were extracted. Samples of muscle tissue were also taken for biochemical analysis.
Biochemical estimation was carried out for quantitative determination of glycogen, lactic acid, lipid and protein, in muscle tissue and glucose, lactic acid, lipid and protein content in haemolymph.
After extraction of haemolymph, the prawns were sacrificed and muscle and hepatopancreatic tissues were removed for histological examination.
Biochemical estimations were carried out following standard biochemical procedures. Histological studies of muscle and hepatopancreas were made under the light microscope. Tissues were fixed in neutral buffered formalin (10%) for periods ranging from 24-48 hours. After fixation, the tissues were processed following routine histological procedures.
Results
Biochemistry : Haemolymph glucose content showed a rapid increase after 30 and 50 minutes of strenuous exercise. The value came down to normal after 24 hrs of recovery period (Table 1).
Strenuous exercise resulted in a large and rapid rise in the concentration of lactic acid in haemolymph. After 24 hours of recovery period the lactic acid level almost reached the normal level.
Lipid level in haemolymph showed a marked decrease after 30 and 50 minutes exercise. Stress recovered animals showed an almost normal level (Table 1).
Protein content in haemolymph did not show any significant change between normal and stressed prawns.

Glycogen content in the muscle tissue showed a significant reduction after the application of strenuous exercise (Table 2). In the recovery phase the glycogen content was not found to be restored.
TABLE 1. Variations in biochemical constituents in haemolymph of P. indicus, after 30 and 50 minutes of strenuous excercise and for the recovery period of 24 hours
Haemolyi (mg/lOO
Glucose
nh ml)
Mean
SD
Range
Lactic acid Mean
Lipid
Protein
SD
Range
Mean
SD
Range
Mean
SD
Range
Normal
13.75'
±2.12
11 - 18
30.89^
±9.26
15-40
253.72-
±30.97
213 - 280
5.6"
±0.93
4.6 - 70
Strenuous stress 30 minutes
46.64"
±7.23
37-59
56/04"
±9.415
59-80
161.88"
±21.06
133 - 193
4.94"
±0.686
4 - 6
50 minutes
48.2"
±4.50
44-56
77.316'
±13.2
55-88
138.66=
±16.99
120 - 160
4.76"
±0.606
4-5.6
24 hrs. recovery
18.201-
±4.67
13-26
47648'
±9.722
33-55
219.8-
±26.76
200-266
4.83"
±0.521
4-5.6
All values are mean of 8 determinations X ± SD. "Mean values with the same superscription do not differ significantly".
Muscle lactate content showed a similar rapid increase during strenuous exercise. During the recovery phase, the muscle lactate level came down to near normal valves.
Muscle lipid showed a decreasing trend during the stress period. Stress recovered prawns showed near normal values.
Protein content in the muscle exhibits no significant variation between normal and strenuously exercised prawns.
Histology: Histological studies were made on muscle and hepa-topancreas of both normal and stressed prawns. In the present study, prawns were found to develop opaque white patches in

the abdominal segments after 30 and 50 minutes of strenuous exercise. Histological observation of the opaque muscle areas revealed that these areas were necrotic. Areas of necrosis were usually surrounded by normal muscle tissue. Opaque muscle fibres displayed a variety of morphological changes characteristic of progressive segmental myofibre degeneration. The most characteristic change observed in the muscle fibre after 30 minutes of strenuous exercise was a swelling of muscle cell followed by a loss of usual cross striations. Some of the muscle cells showed presence of pyknotic nuclei. 50 minutes stressed prawns showed a more wide distribution of opaque white patches in the abdominal segment. Fusion and cross splitting of myofibrils were also observed. Haemocytic infiltration was observed around the necrotic foci. A prominent shrinkage of myofibres were also observed at the necrotic foci caused by progressive loss of myofibre parenchyma. The area of necrosis were distributed randomly throughout the striated musculature of the body.
No significant histological changes could be observed in the hepatopancreas of prawns subjected to strenuous physical exercise except an extensive vacuolation in the epithelial cells of the tubules.
Discussion
Carbohydrates present in the blood and muscle serve as the immediate source of energy for muscular work. Mayerholf and Lohmann (1928, Biochem. Z., 196 : 23-48) demonstrated an overall conversion of glycogen to lactic acid in the crustacean muscle. According to Love (1980, The chemical biology of fishes. Academic Press, London, N. Y. 2; p. 943), the most characteristic general response to stress from whatever source is a pronounce rise in blood sugar level. A rise in haemolymph glucose observed in the present study in P. indicus immediately after strenuous physical exercise and decline to normal values after 24 hours of recovery corroborates well with the findings of earlier workers in both fishes and crustaceans. The elevated levels of blood glucose may be due to increased basal metabolic
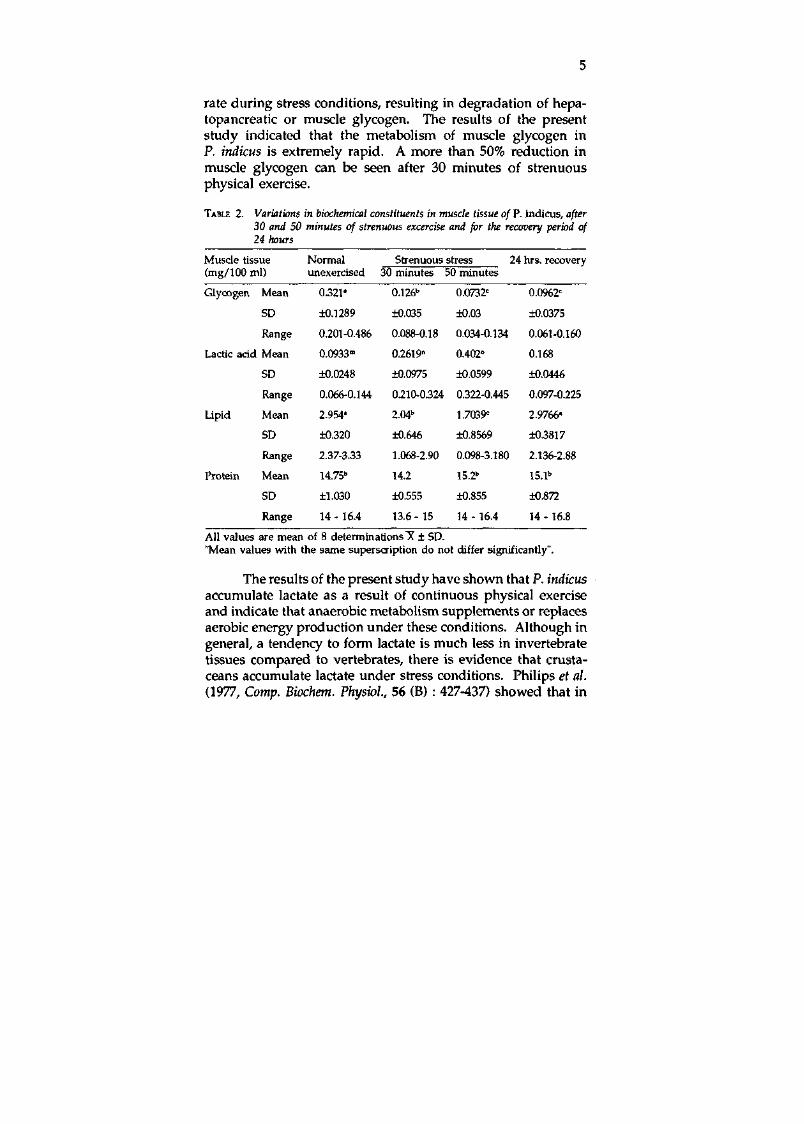
rate during stress conditions, resulting in degradation of hepa-topancreatic or muscle glycogen. The results of the present study indicated that the metabolism of muscle glycogen in P. indicus is extremely rapid. A more than 50% reduction in muscle glycogen can be seen after 30 minutes of strenuous physical exercise.
TABLE 2. Variations in biochemical constituents in muscle tissue of P. indicus, after 30 and 50 minutes of strenuous excercise and for the recovery period of 24 hours
Muscle tis (mg/100 r
Glycogen
sue nl)
Mean
SD
Range
Lactic acid Mean
Lipid
Protein
SD
Range
Mean
SD
Range
Mean
SD
Range
Normal vinexercised
0.321'
±0.1289
0.201-0.486
0.0933"
±0.0248
0.066-0.144
2.954*
±0.320
2.37-3.33
14.75"
±1.030
14 - 16.4
Strenuous stress 24 hrs. recovery 30 minutes
0.126"
±fl.035
0.088-0.18
0.2619"
±0.0975
0.210-0.324
2.04"
±0.646
1.068-2.90
14.2
±0.555
13.6- 15
50 minutes
0.0732'=
±0.03
0.034-0.134
0.402°
±0.0599
0.322-0.445
1.7039'=
±0.8569
0.098-3.180
15.2"
±0.855
14 - 16.4
0.0962=
±0.0375
0.061-0.160
0.168
±0.0446
0.097-0.225
2.9766*
±0.3817
2.136-2.88
15.1"
±0.872
14 - 16.8
All values are mean of 8 determinations X ± SD. "Mean values with the same supersaiption do not differ significantly".
The results of the present study have shown that P. indicus accumulate lactate as a result of continuous physical exercise and indicate that anaerobic metabolism supplements or replaces aerobic energy production under these conditions. Although in general, a tendency to form lactate is much less in invertebrate tissues compared to vertebrates, there is evidence that crustaceans accumulate lactate under stress conditions. Philips et al. (1977, Comp. Biochem. Physiol, 56 (B) : 427-437) showed that in

crustaceans lactate is produced during exercise. Spotts and Lutz (1981, /. World Maricul. Soc, 12 (2): 244-249) showed a large and rapid accumulation of lactic acid during activity stress in two commercially important shrimps P. duorarum and M. rosenbergii. The present study also showed the same trend, a rise in lactate content in haemolymph and muscle immediately following severe muscular activity.
During intense muscular activity the metabolic rate also increases and may exceed the animals ability to consume oxygen. At such times the muscle tissue resort to anaerobic production of energy, accumulating metabolic end products which are often highly acidic. Although many end products of anaerobic metabolism are possible, lactic acid is the most important end product in crustaceans, as in fishes and mammals.
The effect of physical stress on lipid metabolism of crustaceans is far from clear. The present investigation showed a decrease in total lipid level in both muscle and hepatopancreas immediately after 30 and 50 minutes of exercise. It may be that prawns utilize lipids for the energy production when their carbohydrate resources are used up. There are no other studies relating stress and lipid level to compare the present observation.
Proteins are relatively abundant constituents of crustaceans. The catabolism of proteins and amino acids can serve as a significant source of metabolic energy since they are the major constituents of crustacean tissue. Since the metabolism of proteins is relatively slow, it usually do not serve as the immediate source of energy for muscular activity. The results of the present study did not show any significant change in the total protein content of haemolymph and muscle. Statistical analysis also proved that there is no significant difference between normal, stressed and stress recovered prawns.
In the present study muscle opacity was observed in the abdominal segments of strenuously exercised prawns. Among penaeid prawns this muscle opacity is variously known as sf)ontaneous muscle necrosis, ideopathic muscle necrosis, etc.

Earlier studies showed that muscle necrosis is related to environmental stressors including extremes and sudden fluctuations in salinity, temperature, dissolved oxygen, overcrowding, hyperactivity, physical handling, etc. such a stress related muscle necrosis has been reported earlier in penaeids and in Macrobrachium rosenbergii. Hyperactivity during intense exercise may be the major cause of opaque white discolouration of the abdominal muscle found in P. indicus.
The morphological and histological changes in muscle observed in the present study after strenuous physical exercise were similar to those previously described in penaeid and non-penaeid prawns. Histological observation of the necrotic foci revealed extensive myofibre degeneration typical of necrotic tissue. Muscle cells in the necrotic foci exhibited varying degrees of structural degradation manifested as disorganised myofibrils and loss of recognisable sarcomeres.
Biochemical studies carried out in the present study showed a large and rapid accumulation of lactic acid in the muscles of strenuously exercised prawns. Muscle also showed a rapid decrease in glycogen content. Intense muscular activity during strenuous physical exercise is usually followed by a period of reduced activity leading to complete exhaustion and immobility. This state has been correlated with lactic acid accumulation and with the occurrence of muscle necrosis in prawns. It is shown that stress induced hyperactivity always leads to muscle hypoxia; this and the accumulation of lactic acid during anaerobic glycolysis were the most important steps in manifestation of muscle necrosis.
Information is generally meagre regarding histological changes observed in the hepatopancreas of strenuously exercised prawns. Nash et al. (1986, /. Fish. Dis., 106 : 109-119) observed prawns with muscle necrosis additionally displayed a paucity of normal cytoplasmic fat/glycogen vacuolation of the hepatopancreatic epithelial cells. Observation of the frozen sections of hepatopancreas of normal and stressed prawn stained with oil red showed that the distribution of lipid droplets

8
are almost similar in both cases. Excessive vacuolation observed in haematoxylin and eosin stained sections of hepatopancreas might be the result of excessive accumulation of water due to increased osmotic disturbances during stressed condition.

CMFRI Spl Publ, 1993; 54 : 9 - 13
SOME BIOCHEMICAL AND HISTOLOGICAL CHANGES IN RELATION TO TOXICITY OF DDT IN PENAEUS INDICUS H. MILNE EDWARDS
SYNTHIA THOMAS A. NOBLE Research Scholar Supervising Teacher
Introduction
Water bodies lying adjacent to agricultural fields are prone to pollution by pesticides. Since it has been realized that pesticides are extremely toxic to several aquatic organisms, a great deal of attention has been paid to evaluate their hazardous effects on the proximate composition of many non-target organisms. Most of this work have been on fishes. In crustaceans subacute physiological stress induced by phosphomidon on carbohydrate in muscle of Penaeus indicus was investigated by Reddy and Rao (1986, Proc. Indian Acad. Sci. {Anim. Sci.), 95 (5): 525-532). DDT has been found to affect the protein content of hepatopancreas in the freshwater prawn Macrobrachiutn kistensis by Fawade et al. (1983, /. Environ. Biol, 4 (2) : 81-90).
Histopathological changes in antennal gland, midgut and hepatopancreas of grass shrimp exposed to hexavalent chromium was reported by Doughtie and Rao (1984, /. Invert. Pathol, 43 (1): 89-108). Histological changes in gills and hepatopancreas of Scylla serrate induced by dimecron was reported by Nagabushanam et al (1987, /. Adv. Zool, 8 (1) : 46-51). The commercially important Indian white prawn Penaeus indicus H. Milne Edwards spends its early stages in brackishwater areas. During this phase they are subjected to the toxicity of several pollutants causing their mortality or affecting their growth. As there are not much works on the effects of toxic substances on this prawn particularly on their early stages in the estuarine phase of their Life history. This work has been taken up for detailed studies.

10
Material and methods
Live Penaeus indicus of sizes 55-65 mm were acclimatised to laboratory conditions for 10 days by maintaining them in 15%o salinity and temperature 28°C. The waste food and faecal matter were regularly siphoned off.
A stock solution of 1 ppm DDT was prepared (200 mg/ 200 ml). By diluting this in filtered seawater of 15%o salinity, the desired concentrations were obtained.
Bioassay procedure : Static bioassay method (FAO 1987, Manual of methods in aquatic environment research, 10:5-33) was used with renewal of test medium every 24 hours. DDT solutions of concentrations varying from 0.5 ppm to 0.01 ppm were used for the initial tests after aerating for 24 hours to remove even traces of acetone. In each container containing 30 1 of test solution 8 experimental animals were introduced.
A number of pilot tests were conducted to fix the range of toxicant to be used in the bioassay for a period of 24 to 96 hours. Simultaneously controls without DDT were also maintained. Concentrations of DDT ranging from 0.025 ppm to 0.07 ppm, as found suitable in pilot tests were used for the determination of LCjg. The percentage of surviving and dead prawns were accounted for, at the end of every 24, 48, 72 and 96 hours.
The data was subjected to probit analysis for the determination of LCjQ. The 95% confidence limit of LCj values and slope function were calculated according to the nomographic method given by Litchfield and Wilcoxon (1949, /. Pharmacol. Experi. Ther., 96 : 99-113).
Acute and chronic exposure studies: Prawns were exposed to lethal concentrations of 0.03, 0.05 and 0.06 ppm for 96, 72 and 24 hrs respectively. Simultaneously controls were maintained. At the end of exposure period the test animals were sacrificed for biochemical and histological studies.
For chronic exposure studies two sublethal concentrations of 0.001 ppm and 0.002 ppm were selected. 3 sets of each

11
concentration and control were maintained. The prawns were fed daily. Water was changed after every 48 hours. After 10 days of exposure prawns from one control tub and one tub of each concentration were sacrificed for biochemical estimation. Hepatopancreas of prawns subjected to 30 days of chronic exposure were fixed for histological studies.
Results and discussion
Acute toxicity studies: The slope and the 95% confidence interval were found to vary in all the 4 exposure periods of 24, 48, 72 and 96 hours. The variations in percentage mortality and LCjg values at different exposure periods indicate differential toxicity of DDT in Penaeus indicus. Ramesh Babu et al. (1987, Mahasagar, 20 (4): 249-253) reported acute toxicity of DDT to P. indicus. The LCgQ value for 48 hours in their study was as high as 0.063 ppm. In the present investigation the value was lower at 0.053 ppm. This difference may be due to the test animals collected from different localities.
There have been reports of acute toxicity of DDT to other crustaceans also. Lower LCgo values of 0.003 ppm and 0.012 ppm were reported in grass shrimp Palaemontes vulgaris and sand shrimp Cranogon septemspinosa by Eisler (1969, Crustaceana, 16 : 302-310). However, he conducted the experiments in a test medium with 24%o salinity as against 15%o used in the present study. His experiments are not comparable with the present investigation as toxicity of this pesticide is found to increase with increase in salinity (Fonselius 1972, Marine pollution and sea-life. Fishing News Ltd. England, pp. 23-27).
Biochemistry : The data presented in the present investigation revealed marked fluctuations in the organic constituents of muscle, hepatopancreas and haemolymph on actue and chronic exposure to DDT.
Elevation in muscle glycogen on actue exposure was observed in the present study. The participation of free fatty acids in tissue oxidations might be responsible for suppressed glycolysis leading to elevation in glycogen content (Bhagya-lakshmi 1981, Ph.D. Thesis, S. V. Univ., Tirupati). The muscle

12
forms a reserve site and its increased glycogen content may also be due to its storage for general muscular activity (Reddy and Rao 1986, loc. cit.).
Muscle metabolism seems to be different in acutely and chronically exposed prawns, since with chronic exposure to DDT there was a decrease in muscle glycogen. Similar observation was also made by Reddy and Rao (1986, loc. cit.) in P. indicus during phosphomidon exposure. This may be due to pesticide induced muscular stress as reported in Chanm punctatus chronically exposed to endosulphan by Sastry and Siddique (1982, Water, Air and Soil Pollution, 19 : 133-141).
The decline in muscle protein in P. indicus following actue exposure to DDT in the present study may be due to the utilization of muscle protein under stressed condition to meet the increased metabolic demands of the animal as reported by Dimichele and Taylor (1978, /. Fish. Res. Bd. Canada, 32:533- 539) in their work on effect of napthalene on fish. Contrarily in the chronically exposed prawns there was a slight elevation in muscle protein. This may be the result of a resistant reaction by formation of antibodies that protect the animals against toxicants. This view is supported by YaganoBano et al. (1981, Proc. Indian Acad. Sci. (Anim. Sci.), 90 : 33-37) who worked on the effect of sublethal concentration of DDT on muscle proteins of Clarias batrachus.
The prawn in the present study appeared less active during acute exposure and this inactivity may have caused increased lipid deposition in them. The increase in lipid reserve of muscle in P. indicus on acute and chronic exposure to DDT may confer tolerance to its accumulation.
Depletion of glycogen in the hepatopancreas on acute and chronic exposure to DDT accompanied by decrease in the glucose level of haemolymph glucose into the muscle. This may be a sensitive sign of hepatic lesion partly due to the disturbed metabolism and energy imbalance of liver cells (Sharma and Maya 1987, Him. ]. Env. ZooL, 1 : 114-117). Decrease in hepatopancreatic protein of prawns subjected to actue toxicity

13
of DDT was also reported in Clarias batrachus exposed to DDT (YaganoBano et al. 1981, loc. cit.). Her findings are based on the view that reduction in proteins may be due to their breakdown into aminoacids first and then into nitrogen and other elementary molecules. Proteolysis may be the cause of decrease of hepatopancreatic protein reported in the present study also.
Miller and Kinter (1977, Physiological responses of marine biota to pollutants. Academic Press, N. Y., pp. 16-30) have reported that amino acid uptake was inhibited in fish exposed to DDT. This may be a factor causing low level of protein in haemolymph following chronic exposure to DDT in P. indicus. However there was slight increase in haemolymph protein of prawns following acute exposure to DDT. This may be due to proteolysis in the hepatopancreas.
Haemolymph glucose decreased in Macrobrachium kisten-sis exposed to DDT (Fawade et al 1983, /. Environ. Biol, 4 (2) : 81-90) and it was reported to be due to release of h5^glycemic hormone triggered by the toxicant.
Histology
The disturbance in the orientation of hepatopancreatic tubules and their loose arrangement observed in the present study was also noted in the sole Parophrys vetulus exposed to lethal concentration of carbon tetrachloride (Casillas et al. 1983, Aquat. toxicol, 3 : 61-78). They opined that this was probably due to destruction of connective tissue. Changes in the architecture of tubule was reported in Scylla serrata exposed to dimecron (Nagabushanam et al. 1987, /. Adv. Zool, 8 (1): 46- 51). Similar observation made in the present study may be a result of pathological changes which leads to impairment of cellular function. Vacuolation in pancreatic cells in animals exposed to dithiocarbamate has been reported. Such pathological changes in vital organs like hepatopancreas caused by DDT may lead to disruption of its normal physiological function.

CMFRI Spl. Publ, 1993; 54 : 14 - 20
ECOLOGICAL STUDIES ON COCONUT HUSK RETTING AREA IN THE COCHIN BACKWATER AND ITS
RELATION TO FISH SEED AVAILABILITY
M. AMBIKA DEVI N . GOPALAKRISHNA PILLAI
Research Scholar Supervising Teacher
Introduction
Cochin Backwater, the largest brackishwater system in Kerala accommodates many coconut husk retting grounds. Coconut husk retting is considered as one of the important sources of pollution in the Cochin Backwater. Retting, brought about by the pectinolytic activity of bacteria and fungi, liberates large quantities of organic substances including pectin, pectosan, fat, tannin and also toxic polyphenols into the ambient water. Investigations on pollution in the Cochin Backwater has gained importance recently due to the environmental deterioration taking place in this ecosystem. The present investigation was carried out to elucidate the ecology of one of the typical retting grounds of Cochin Backwater and its relation to fish seed availability.
Study area
A typical retting ground at Chittoor, 6 km north of the barmouth, about 20 old was selected for the present study. The study was carried out in four selected stations. Station I was an intensively polluted area from where the retting husks were being removed. Station II was one of the retting wells from where the retted husks had already been removed. Station III with a depth of 1 m, located near Vaduthala Jetty, 1 km south of the retting zone was considered as the marginal zone. The IVth station, 5 km south of Chittoor in an unpolluted area, located opposite to CMFRI Head quarters was taken as the reference zone.

15
Material and methods
Fortnightly observations from April to September 1988 were made on the salient physico-chemical parameters of water such as temperature, salinity, dissolved oxygen, pH, total sulphide, BOD5, phosphate, nitrite, nitrate and ammonia. The texture of sediments including organic carbon and organic nitrogen were also studied along with bottom fauna, zooplank-ton biomass and fish seed availability.
Rainfall data for Cochin was collected from the daily weather report of Bharat Mausam Vigyan Vibhag. Surface water samples by a plastic bucket and the bottom water by a bottom water sampler were collected. Water temperature was measured using an ordinary thermometer and pH with the help of a digital pH meter. Dissolved oxygen, salinity, biochemical oxygen demand, total sulphide, phosphate, nitrite - nitrogen, nitrate -nitrogen and ammonia - nitrogen were determined/estimated by Winkler method, Mohr Knudsen titration method, unseeded dilution method, iodometric method. Murphy and Riley method, Bendschneider and Robison method, Morris and Riley method and phenol hypochlorite method respectively.
Sediment samples were collected using a Van Veen grab. Grain size analysis was done according to the combined sieving and pipette method of Krumbein and Pettijohn. Organic carbon was estimated by Walkley and Black's method and nitrogen by Kjeldhal method.
The bottom fauna were screened through 0.5 mm mesh sieve. The residue was preserved in 15% neutral formatlin for further study. Zooplankton was collected using a half metre zooplankton net, having a mesh size of 0.3 mm. The fish and prawn seeds from plankton were completely sorted out analysed separately to study the availability of fish seeds.
Analysis of variance test was conducted to compare the variation of all the parameters between stations. The Shannon's diversity index had been applied to determine the species diversity of benthic fauna.

16
Results and discussion
During 1988, Cochin and its environs received heavy monsoon (2366 mm), when compared to 1987 (1600 mm). The rainfall and river discharges had been found to change the ecological conditions of the retting and non-retting areas during the period of observation. A progressive decrease in temperature and salinity was observed with the onset of monsoon. The temperature ranged between 26.4°C and SB.CC. Salinity at retting ground varied from 0.18%o (August) to 6.01 %o (May) and 1.47%o (August) to 13.83%o (May) at clean zone. Salinity showed a downward trend with increasing distance from the barmouth towards upstream.
Seasonal and stationwise variations were observed in the values of dissolved oxygen, BODj, total sulphide, pH and nutrients. Prolonged period of anoxic condition associated vWth high concentration of hydrogen sulphide, high BODj and low pH were the most characteristic feature of the retting zone. The dissolved oxygen remained at zero in most of the months in Station I. The values ranged between 1.29 and 4.66 ml/1, 3.17 and 5.29 ml/1, and 3.85 and 5.46 ml/1 at staions II, III and IV respectively. The stagnant condition and the utilization of oxygen for the retting of coconut husk had contributed to the low values of dissolved oxygen in the retting zone. The maximum BODj observed at the retting ground reflects, the high load of organic matter and bacterial population consuming the available oxygen. The total sulphide at retting zone varied from 0.31 to 8.82 mg/1, while no measurable amount of total sulphide were observed from the reference station. The pH was very low in the retting zone when compared to clean station. The highest value of BODj and total sulphide were observed during premonsoon and a drop in the values were noticed with the commencement of monsoon at the retting zone. An increase in pH was observed with the onset of monsoon. The differences in dissolved oxygen, BOD5, total sulphide and pH between stations were significant at 1% level.
The concentration of phosphate was significantly higher at the retting zone during the premonsoon and monsoon

17
periods. The phosphate concentration varied from 0.25 to 15.4 |j,g at/1 in the retting zone and 0.5 to 6.25 (ig at/1 in the clean zone. The pollution does not seem to have any significant effect on nitrite and nitrate concentration. The nitrite ranged between 0.13 and 4.75 \ig at/1 and nitrate between 1.09 and 39.21 ng at/1 in the retting ground, while the values varied from 0.25 to 5.55 |ig at/1 and 8.72 to 43.93 (ig at/1 for nitrate and nitrate respectively at clean zone. When compared with nitrate the concentration of nitrite was very low. An increase in nutrient concentration observed during the monsoon amply testify the noticeable impact of rainfall and river discharge over its variations. Seasonal as well as stationwise variation was not observed in the concentration of ammonia.
Sediment of the retting ground was black in colour with the smell of hydrogen sulphide and large deposits of pith and fibre. Based on the investigation the region under study, can be differentiated into two major sedimentological divisions: (1) area with dominance of sand fraction - Station I, II and III and (2) area with dominance of fine sand with clay (clayey sand) -Station IV. Organic carbon and organic matter showed enrichment in the retting ground sediments (3.42% to 7.51%) compared to the reference station (3.19% to 5.09%). But the nitrogen content at reference zone (0.34% - 0.47%) was marginally higher than at retting ground (0.18% - 0.38%). Thus in the polluted station with high carbon content, the percentage of organic nitrogen was not found proportionate to organic carbon resulting in an unbalanced food supply for the organisms. The C/N ratios were consistently higher in the retting ground 13.53 to 28.76 compared to the reference station (9.39 to 12.47). High C/N ratio of sediment is an indication of low food value and this can be one of the reasons for the low abundance of organisms in the retting zone compared to the clean zone.
Among the macrobenthos, polychaetes, crustaceans and molluscs formed the dominant groups of animals in both the retting and non-retting zones. The maximum percentage of animals were recorded from station IV (63.23%) followed by Station III (29.2%), station II (6.96%) and station I (0.63%).

18
According to the frequency of occurrence of the bottom fauna in the retting, marginal and clean zones, the animals were grouped into three major categories. 1. Species which can tolerate the polluted conditions, with their maximum occurrence in the retting zone. 2. Species which are indifferent, showed no special affinity to polluted habitat, though they are not totally absent in the polluted zone. 3. Species which avoid polluted zone and are almost absent there.
Under category 1, polychaetes were found to be the most tolerant and dominant group among the benthic fauna collected. The most prevalent species found in the polluted zone were Dendronereis aestuarina, Paraheteromastus tenuis, Scyphoproctus djiboutiensis, Prionospio polybranchiata, Branchiocapitella sp. and Lumbriconereis simplex. Polychaetes such as Ancistrosyllis con-stricta and Prionospio cirrifera, crustaceans like caprellids and Melita zeylanica and insect larvae dominated in the category 2. Polychaete species like 'Nerds chilkensis, Perinereis cavifrons, Nephthys oligobranchia, Lumbriconereis sp. and Lycastis indica were confined to the marginal and clean zones. Similarly crustaceans such as Apseudes gymnophobia, Corophium triaenonyx, Quadriviso bengalensis, Anthuridae Cirolana fluviatilis and Iphinoe sp. were represented only in station III and IV.
Of all the animals collected from each station, the highest percentage of polychaetes were observed from station I (100%) followed by Station II (52.7%), station III (16.8%) and station IV (9.5%).
The polychaete species such as Dendronereis aestuarina, Branchiocapitella sp. and Schyphoproctus djiboutiensis with high population density and frequency of occurrence at station I and II in the retting zone were proposed as indicator species in the present study. These species occurred almost throughout the observation period in the retting ground and can tolerate anoxic conditions and high sulphide content of the environment.
Crustaceans and molluscs were totally absent at station I. Maximum number of crustaceans, mostly amphipods (5333/ 0.1 m^), were recorded from station IV (90.1%) followed by

19
station III (80.7%) and Station II (31.5%). Molluscan fauna of the area under study was limited and only four species of bivalves were observed. Among molluscs, Nuculana mauritiana was recorded in good numbers from Station II.
The diversity index (H) for both the polychaetes and crustaceans were very low in the retting zone when compared to clean and marginal zones. The diversity values remained as zero, throughout the study, in station I. The values ranged from 0 to 1.271 in station II, 0 to 1.735 in station III and 0.636 to 2.00 in station IV for polychaetes and 0 to 0.898 in station II, 0 to 1.830 in station III and 0 to 1.600 in station IV for crustaceans.
An examination of the general composition of the zooplankton communities revealed that the zooplankton at the retting zone was quantitatively and qualitatively poorer in comparison with non-retting zone. The plankton at the retting zone mainly consisted of mosquito larvae, chironomus larvae, tanytarspus and one species of calanoid copepod, while hydromedusae, copepods, amphipods, ostracods, mysids, decapods and fish eggs and larve formed the plankton of the marginal and clean zones.
A significant variation was noticed in the availability of prawn and fish seeds between retting and non-retting areas. The caridean prawns and gobids constituted the dominant groups at the retting zone. But Metapenaeus dobsoni, M. monoceros, Cardim sp., Ambassis sp. and Haplochilus sp. were found abundant at the non-retting zone.
Conclusion
The environmental degradation has taken place in the backwaters due to retting activity. The depletion of fauna in the retting ground and nearby areas is the adverse effects of decades of retting activity and the consequent pollution of the region. From the present investigation it may be concluded that the retting of coconut husk results in the formation of an anaerobic sulphide biome, which besides adversely affecting the production of plankton and benthos also spoils the nursery grounds of

20
some of the commercially important prawn and fishes such as mullets, pearlspot and milkfish inhabiting the area.
The results of the present study, which mainly covered monsoon period, gives only a partial picture. Year round studies on biotic and abiotic parameters of the retting and non-retting grounds of the Cochin Backwater may throw more light on this subject.

CMFRI Spl. Publ, 1993; 54 : 21 - 24
EFFECT OF 2, 4-D AND GIBBERELLIC ACID ON SELECTED SEAWEEDS
IMELDA JOSEPH C. V. K. CHENNUBHOTLA Research Scholar Supervising Teacher
Introduction
In view of the great demand for seaweeds, it has become imperative to cultivate seaweeds, as more and more natural stocks are heavily exploited throughout the world and demand for algal products exceed supply. Besides increasing the total supply, algal culture is also attractive in that it has the capacity of providing high quality raw material with specifically selected characteristics of desired species. Use of growth promoting substances or hormones to improve the biomass production is one among the modem techniques. Many plant physiologists have tried the effect of different growth promoting substances like natural auxins, gibberellins, kinetins and other synthetic phyto hormones like 2, 4-D (2, 4-dichlorophenoxy acetic acid) and NAA (Naphthalene acetic acid) on several species of seaweeds.
Objectives
The present study was undertaken to elucidate the effects of growth regulators, 2, 4-D and gibberellic acid on the growth of the thallus of four selected species of seaweeds of economic value growing luxuriantly along the Kerala Coast, by laboratory culture experiments.
Material and methods
Hypnea valentiae (Turn) Mont (Rhodophyceae), Gracilaria corticata J. Ag. (Rhodophyceae), Enteromorpha compressa (Linn.) Grey (Chlorophyceae) and Ulva fasciata Delile (Chlorophyceae) were taken for the study. The substances tested for their growth regulating property on the above species were 2, 4-D and gibberellic acid.

22
The seaweeds were collected from Tirumullavarom (Quilon), Varkala, Mulloor (Trivandrum), Elathur, Thikkotti (Calicut) and Saudi (Cochin) during low tides in the early months of southwest monsoon. The collected specimens were thoroughly washed and put in polythene bags and transported in a rectangular ice box to the laboratory at Cochin. It is again washed in the laboratory and aerated in plastic troughs and maintained as stock culture throughout the tenure of work.
The culture studies were carried out according to the 'cut-piece' method for Gracilaria corticata and Hypnea valentiae. Here, apical segments 20-30 mm long were cut from the vegetative thalli of the algae using a sharp blade. For Ulva fasciata, pieces of thallus 10x10 mm size were cut from the middle region of uniform sized thallus. In the case of Enteromorpha compressa, plants of almost the same size (30-40 mm) were selected for culture.
Preparation and treatment with growth substances
The growth substance solutions were prepared by dissolving 6, 8, 10, 12, 16 and 20 mg of 2, 4-D and gibberellic acid in a few drops of 80% ethyl alcohol. It was then diluted to one litre each, in filtered sterilized sea water.
Treatment was done in these solutions of different concentrations for 24 hours for each species and controls were also maintained without pretreatment. The 'cut pieces' were then transferred to sterile petridishes of 9 cm diameter containing 50 ml of basal culture medium, which was 'Erdshreiber' and modified 'Erdshreiber'. The salinity and pH of the medium were maintained at 30 ppt and 7.5 respectively.
Culture conditwns
The cultures were kept on wooden racks in the laboratory at room temperature ranging from 26-32''C. It was illuminated from top by tube lights of intensity varying from 500-1000 lux. The culture medium was renewed on alternate days and the experiment run for 30 days for each species. The experiments were repeated for more accuracy.

23
Growth measurements
The linear growth measurements of cut pieces of G. corticata as well as H. valentiae from treatments as well as controls were taken to the nearest millimeter every five days. As the thallus of U. fasciata is uniformly two layered and thin, it is possible to record area measurements as an index of growth. The area measurements were taken five day intervals. For E. compressa, initial and final lengths were measured.
The fresh weight measurements for all the four species were taken initially and finally. In all experiments there is a possibility of variance and error. Hisnce, standard deviation for the mean of increase in length, area and fresh weight measurements were calculated. A two way classification of Analysis of variance was also done to compare the significance in growth between treatment and replications at five day intervals.
Results and discussion
The results concerning the effect of the tested substances i. e. 2, 4-D and gibberellic acid on the growth of algae showed that both the hormones increased biomass considerably for all the four species studied, at various concentrations. In contrast to the effect of Gibberellic acid which showed maximum increase in length, areas and fresh weight at 16-20 mg 1 ^ 2,4-D produced significant growth only at lower concentrations i. e. 10-12 mg 1^ With higher concentrations of 2, 4-D, a proportionally retarding effect on the growth of algae was noticed. Gibberellic acid showed no growth inhibition at any of the selected concentrations and was growth promoting at higher concentrations. At lower concentrations it was less effective and was almost similar to the control.
The presents results with 2,4-D for all the four species are in confirmity with the results obtained by Buggeln (1976, /. Phycol, 12 : 355-358) with the Kelp Alaria esculenta i. e. inhibition of elongation at high concentrations and not significant effect at very low concentrations, Gorham (1979, Bot. Mar., 22 (5) : 273-281) on Sargassum muticum, Chauhan and Joshy

24
(1985, Seaweed Res. UHl, 7 (2): 105-108) on Sargassom swarizu and Kothy and Krishnamurthy (1977 , Seaweed Res. UHl, 2 (2) : 55-61) on Ulva rigida.
For the present study, the pretreatment with gibberellic acid had given results which are in confirmity with those obtained by Subbaraju et al. (1981, Aquat. Bot., 10 : 78-80) on Gradlaria corticata, Kothy and Krishnamurthy (1977, loc. cit.) on Ulva rigida, Provasoli (1958, Biol. Bull., 114 : 357-383) on Ulva lactuca and Kinoshita and Teramoto (1958, Bull. jap. Soc. Phycol, 6 : 85-88) on Porphyra.
Conclusion
The results of the present investigations show that phytohormones have profound infulence on the growth and development of the four selected species of seaweeds. But from this evidence we cannot be certain that algae normally employ such compounds to regulate their processes. Skoog and Miller (1957, Symp. Soc. Exp. Biol., 7il: 118-131), in a review, concluded that regulation of growth may depend more upon the quantitative interactions, than upon the qualitative action of the single plant hormone. The present study also indicated that 2,4-D and Gibberellic acid in certain concemtrations stimulated that increase in length, surface area and fresh weight of the thallus of four selected species o(: seaweeds.

CMFRI Spl PubU 1993; 54 : 25 - 27
HISTOPATHOLOGICAL STUDIES ON ZINC TOXICITY IN MILKFISH CHANOS CHANOS FORSSKAL*
DiNESAN, K. C. K. C. GEORGE
Research Scholar Supervising Teacher
Introduction
Industrial pollution is the problem very often faced by aquatic systems. Among the industrial pollutants, heavy metals are of a major problem. Zinc is a major effluent from the industries such as soft drink flavouring, fur dressing and dyeing, fish processing, laundry, etc. Many studies conducted involving heavy metal pollution were limited to the estimation of pollutants in water, its accumulation in aquatic organisms and its lethal effects. Literature is limited regarding the effects of pollutants on various vital systems of cultivable organisms at cellular level. Therefore this study was taken up with a view to investigate the damages caused by Zinc at cellular level on various organs of milkfish.
Material and methods
Milkfish Chanos chanos of two size groups /. e. fry (3.0 to 3.5 cm length; 0.3 to 0.45 gm weight) and subadults (13.0 to 15.0 cm length; 16.0 to 20.0 gm weight) were selected for the experiments and were acclimitised for two weeks. They were fed ad libitum with artificially prepared wet feed.
Exposure to zinc : Zinc was added in the form of ZnS0^.7H20 throughout the experiment. The LCgg values of Zinc for fry was approximately calculated by the method of Finney (1952, Statistical methods in biological assay. Charles Griffin & Co.) for exposing the experimental animals to sublethal and lethal concentration.
* Prepared by the Editorial Committee.

26
To study the histopathological changes due to the sublethal and lethal concentrations of Zinc, experiments were conducted on fry (sublethal and lethal) and subadults (sublethal only). The fishes were grouped into 5 categories. The first group served as the control while the second, third and fourth were subjected to 2.5 ppm, 5.0 ppm and 7.5 ppm of Zinc respectively. The fifth group consisted of fry was subjected to a Zinc concentration of 30.0 ppm. All the experiments were done in duplicates taking 10 animals in each group.
The experimental fishes were sacrificed on 10th, 20th and 30th day post-exposure. Vital organs such as liver, kidney, brain heart, gills, muscle and spleen were dissectedout from subadult fishes and fixed in 10% neutral buffered formalin. In the case of fry incisions were made in the cranium and muscle, abdomen was opened by a longitudinal mid-ventral incision for proper fixation and was fixed in neutral buffered formalin. Fishes from the fifth group were fixed immediately after death. After proper fixation, tissues were processed by routine histological techniques.
Results and discussion
Chanos chanos were used for determining approximate LCjo value and histopathological studies for both lethal and sublethal concentration of Zinc. Median lethal concentration determined approximately was found to be 15 ppm Zinc for 72 hours.
The liver in all treatment groups revealed extensive vacuolation necrosis, mononuclear cell accumulation, intravascular coagulation and perivascular fibrinous exudation. The tubular lumen contained proteinaceous cast. The brain in acute toxic condition revealed congestion of blood vessels, vacuolation of neurons and necrosis of neuron. In sublethal levels the changes were very significant.
Cardiac muscles showed changes such as loss of stria-tions, granularity of cytoplasm and foci of necrosis. These changes were seen in the initial stages of experiment. But as the

27
duration increased, the foci of necrosis were numerous and were infiltrated with mononuclear cells. The gills in group which was treated with lethal amount of Zinc revealed extensive oedema of the lamellae, necrosis and disquamation of epithelial layers of secondary lamellae, but sublethal amount of Zinc did not reveal much significant alteration compared to the control.
The skeletal muscle of the body wall in group treated with lethal and sublethal amount of Zinc showed foci of hyalinised muscle fibres indicating Zenker's type of necrosis. Spleen from the treated groups did not reveal any significant changes.

CMFRl Spl. Publ, 1993; 54 : 28 - 32
STUDIES ON THE QUALITY OF BRACKISHWATER CULTURED AND WILD MARINE PRAWN
PENAEUS INDICUS
D. RAMARAJ N . KALAIMANI Research Scholar Supervising Teacher
Introduction
The brackishwater and marine environments are diverse with respect to the environmental factors. Salinity, food availability, pollutant load and microbial population are the outstanding of many such parameters. These probably have a significant influence on the physiology, reproduction, growth and health of an animal. Besides these, the foresaid factors can have significant effects on the shelf-life or keeping quality of fish. Several species of prawns are known to grow equally well in both the environments, of which Penaeus indicus is the most important species in India considering its culture potential.
Salinity difference in these two environments is bound to bring in a considerable difference in the osmotic concentration in the cells of the species of animal that grows well in both the environments. Organic substances such as amino acids phosphates and other amino compounds are the major contributors to the osmotic concentration. Amino acids are known to form the bulk of these organic constituents. Apart from its function in osmoregulation, free amino acids are known to impart flavour to the flesh. The brackishwater environment is known to contain a greater bacterial load than the marine environment. As the bacterial spoilage is one of the prime reasons for the spoilage of ice stored prawn, the bacterial population of the environment from where the prawns are caught could have an effect on the shelf-life. With these views in the background, the present study was taken up to thrdw some light on the biochemical composition and shelf-life of the Indian white prawn Penaeus indicus from brackishwater and marine environments. An
29
attempt has also been made to correlate the environmental parameters with the composition and keeping quality.
Methodology
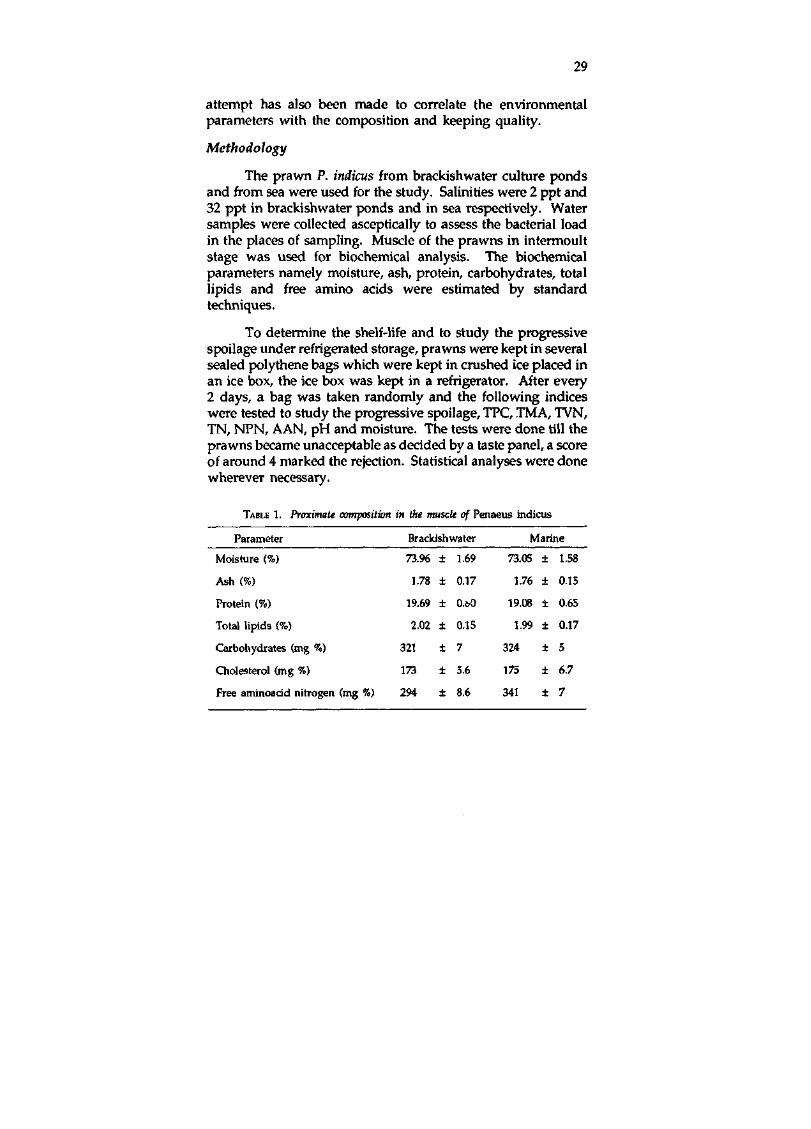
The prawn P. indicus from brackishwater culture ponds and from sea were used for the study. Salinities were 2 ppt and 32 ppt in brackishwater ponds and in sea respectively. Water samples were collected asceptically to assess the bacterial load in the places of sampling. Muscle of the prawns in intermoult stage was used for biochemical analysis. The biochemical parameters namely moisture, ash, protein, carbohydrates, total lipids and free amino acids were estimated by standard techniques.
To determine the shelf-life and to study the progressive spoilage under refrigerated storage, pravms were kept in several sealed polythene bags which were kept in crushed ice placed in an ice box, the ice box was kept in a refrigerator. After every 2 days, a bag was taken randomly and the following indices were tested to study the progressive spoilage, TPC, TMA, TVN, TN, NPN, AAN, pH and moisture. The tests were done till the prawns became unacceptable as decided by a taste panel, a score of around 4 marked the rejection. Statistical analyses were done wherever necessary.
TABLE 1. Proximate composition in the muscle of Penaeus indicus
Parameter Brackishwater Marine
Moisture (%) 73.96 ± 1,69 73.05 ± 1.58
Ash (%) 1.78 ± 0.17 1.76 ± 0.15
Protein (%) 19.69 ± O.faO 19.08 ± 0.65
Total lipids (%) 2.02 ± 0.15 1.99 ± 0.17
Carbohydrates (mg %) 321 ± 7 324 ± 5
Cholesterol (mg %) 173 ± 5.6 175 ± 6.7
Free aminoadd nitrogen (mg %) 294 ± 8.6 341 ± 7

30
Results and discussion Moisture, ash, protein, carbohydrates, total lipids and
cholesterol showed no difference in relation to the environment (Table 1). The percentage composition of these parameters is similar to those reported by earlier works in several prawns and shrimps.
A significant difference (at 1% level) was observed in the free amino acids. The marine prawns had 341 mg% of amino acid nitrogen while the brackishwater prawns had 294 mg% of amino acid nitrogen. The observed difference in the free amino add levels is due to the difference in the environmental salinities. This is evidenced from the prior works involving acclimatisation of several prawns and shrimps to different environmental salinities.
TABLE 2. The changes in xmrious spoilage indices during refrigerated storage of the brackishwater prawn P. indicus
Indices
Score of raw prawn*
Moisture
pH
Total plate count (TPC)"
Total nitrogen %
Nonprotein nitrogen (NPN) mg % Alpha anuno nitrogen (AAN) mg %
Total volatile nitrogen (TVN) mg %
Trimethylamine (TMA) mg %
0
10
75.16
7.01
3.46
3.23
756
330
12.2
0.52
Number of i
3
9.25
78.28
6.73
3.68
2.98
639
210
23.81
0.5
5
8.6
79.68
7.13
3.51
2.69
588
320
26.5
1.3
days of
7
7.6
79.26
7.32
3.61
2.69
572
312
32.7
2.01
storage
9 11
6.7 4.2
79.8 77.95
7.43 7.23
2.9 4.91
2.62 2.42
528 591
287 247
41.4 48.2
1.18 1.38
The scores are the average value of 7 panelists, a score of around 4 was taken as the criterion for rejection, expressed as log^^n.

31
As some of the free amino acids are known to give a sweet flavour to flesh, the difference in the free amino acid level between the prawns from the two environments is of considerable importance. The sweet flavour imparting amino acids namely Gly, L-Ala and L-Glu are known to increase multifold when the prawns are subjected to h5^rosmotic shock. Perhaps, the same set of amino acids show a great variation between the prawns from these two environments. Some amino adds, L-Try, L-Tyr, L-Phe and L-Leu impart bitter taste, since these amino acids also vary marginally in response to osmotic shock, it is the combined effect of these two sets of free amino acids that decide the taste of the flesh. Since the difference in the sweet flavour amino acids is comparatively higher than the bitter amino acids, it is probable that the marine prawns can have a better tasts than their brackishwater counterparts. But, this needs detail study through amino acid analysis and confirmation by expert taste panelists.
TABLE 3. Changes in various sfmilage indices during refrigerated storage of marine prawn P. indicus*
Indices
Score of raw prawn
Moisture
PH TPC
0 3
10 9.5
76.4 76.9 6.99 6.85
2.51 2.2
5
9
77.85 6.63
3.2
Number of days
7
8.75
77.40 7.25
3.6
9
8
78.15 7.20
3.4
of storage
11
7.1
78.00 7.30 4.6
13
5.8
78.25 7.34 4.87
15
4.3
77.80 7.39
5.2 TN (%) 3.18 2.88 2.78 2.65 2.59 2.55 2.56 2.40 NPN (mg %) 772 708 652 636 594 611 585 572 AAN (mg %) 360 290 310 292 276 184 178 269 TVN (mg %) 11.7 21.55 26.08 29.31 34.77 35.15 32.62 40.92 TMA (mg %) 0.67 0.91 1.7 1.37 2.55 2.25 1.08 1.41
* Follow the foot notes of Table 2.
Refrigerated storage studies
In refrigerated storage, P. indicus from brackishwater had a shelf-life of 11 days. The changes in organoleptic scores.

32
physical and chemical indices and bacterial population are shown in Tables 2 and 3.
The difference in the shelf-life of the prawns from the two environments is attributed to the difference in the bacterial load of the environment. The bacterial populations were 9 X 10 cfu/ml and 65 x 1(F cfu/ml in brackishwater and marine environments respectively. Batcerial count, TVN, pH and moisture had a strong negative correlation with the raw acceptability scores, while TN and a-amino nitrogen had a strong positive correlation with raw scores. TMA did not have significant correlation with the scores. These correlations were identical for both marine and brackishwater prawns.

CMFRI Spl Publ, 1993; 54 : 33 - 35
HISTOPATHOLOGICAL STUDIES OF SOFT PRAWNS'
RAMESH, P. R. S. C. MUKHERJEE Research Scholar Supermsing Teacher
Introduction
To make aquaculture commercially successful, the criteria that maximum number of the individual utilize minimum quantity of space and water becomes the economic requirement. In realising that a variety of debilitating and serious problems appear. One such problem is the 'Soft-shell syndrome'. Although the improvements in general husbandry of penaeids have certainly contributed to lower incidence of shrimp disease, presently the principal means of control is early recognition and subsequent elimination of treatment of infected groups of animals. But in this particular case, no controlling measures have been put forward due to meagre understanding of the etiology and pathogenesis. Hence this study was undertaken as an essential step to revealing many kinds of informations to know the impact of the disease on the normal histological architecture of the animal including the pathogenesis.
Material and methods
The present study was conducted from May to August 1988. It included the collection of penaeid prawns Penaeus indicus and Penaeus monodon having softness of the exoskeleton and muscles, from the culture ponds for carrying out clinicopatho-logical, gross and histopahtological examinations.
The analysis of hydrological parameters such as water temperature, pH, salinity and dissolved oxygen were carried out from time to time. The pathological investigations included the observations and recording of clinical signs, behavioural changes and gross lesions in spontaneous cases of affected animals.
• Prepared by the Editorial Committee.

34
Haematological studies included total hemocytic count (THC) and haemolymph glucose determination. Histopathological investigations were carried out in hepatopancreas, gut, gill, body muscle and exoskeleton of the diseased as well as the normal animals.
Results and discussion
The haematological examination of soft prawns revealed an increase in the number of circulating haemocytes (Hemocy-tosis) and a decrease in the maemolymph glucose content (Hypoglycemia) in the soft prawns.
Haemocyte counts Haemolymph glucose content
Normal prawns 4250 - 16950 22 - 41 mg/100 ml
Extremely soft 8050 - 24750 8-17
Moderately soft 7500 - 17750 14 - 27
Histopathological changes in the exoskeletion exhibited marked thinning or decalcified nature mainly in the calcified layer of endocuticle. Focal detachment of fonofibrils from the uncalcified layer was also a regular finding. Degeneration of the epidermal layer and the vacuolation of the subepidermal connective tissue layer was also noticed in soft prawns.
Remarkable changes were noticed in the muscle tissue. Progressive degenerative changes were evident in the striated musculature. Focal to multifocal necrotic areas with occasional haemocytic infiltration without presence of any bacterial or protozoan agent were invariably present throughout the musculature in extremely soft animals. The necrotic changes were characterised by early degenerative change, loss of striations, fragmentations of myofibres, severe sarcomere atrophy with pyknotic and karyorrhetic nuclei, disintegration, hyalinization and mineralization in the necrotic foci. Focal areas of Zenker's type of necrosis were also evident.
Gill alterations were characterised by flattening of branchial epithelial cells and distension of outer lamellar sinuses and

35
thickening of branchial septum with focal aggregation of haemocytes. Histopathologically the hepatopancreas showed degenerated tubular epithelial cells which showed hyperchro-matization with basophilic cytoplasmic inclusions in some cells and extensive vacuolation. The heart exhibited myocardial degeneration with pyknotic and karyorrhetic nuclei.
Necrosis of the cuticular linning with sloughing in some places, haemocytic infiltration in the submucosal layer and invagination of the serosal layer where pathomorphological alterations observed in the gut. Marked damage in the chitinous plates was noticed in the filtering organ.

CMFRI Spl. Publ, 1993; 54 : 36 - 42 8
DISTRIBUTION OF PENAEID SEED ACCORDING TO VARIATIONS IN WATER DEPTH IN SHALLOW
AREAS OF COCHIN BACKWATER
SOSAMMA E A S O K . J. M A T H E W
Research Scholar Supervising Teacher
Introduction
One of the important factors that determine the success of scientific farming is the availability of required quantity of seed of desired species at proper time. Penaeid prawns spend their early life stages in estuaries and backwaters. Such early juveniles form the seed of the wild and used in extensive and semi-intensive culture systems.
Objective
The present study is to find out the magnitude of variations of penaeid prawn seed in their natural habitat on a depthwise, sizewise and seasonwise basis and also in relation to the physical, chemical and biological parameters of the environment.
Material and methods
Two sampling stations, one at Kannamaly, south of the barmouth and the other at Manjanakad in the north were almost equidistant from the Cochin Barmouth. From each station fortnightly sampling for seed, water and sediment in 10, 30, 60 and 90 cm depth zones was carried out using a quantitative seed sampler for seven months from April to October, comprising three distinct seasons such as premonsoon, southwest monsoon and postmonsoon. For ensuring reasonable distance between sampling depths the stations were fixed in such part of the estuary where the water depth increased gradually from the water edge towards the estuary giving atleast 10 m distance between the first and last sampling depth zone. Prawn fry ranging 10-50 mm were considered as seed in the present study.

37
Chemical analyses of water and sediment were carried out by following standard methods.
Results and discussion
The prawn seed encountered during the study period were those of Permeus indicus, Metapenaeus dobsoni and M. monoceros. The average density of seed obtained at both the stations during the entire period of investigation was 14/m^ for P. indicus 16/TV? for M. dobsoni and 6/m^ for M. monoceros.
TABLE 1. Depthwise monthly variations (in percentage) in the occurrence of seed of P. indicus
Kannamaly
April
May
June
July
August
September
October
Manjanakad
April
May
June
July
August
September
October
10 cm
49.29
78.43
72.72
83.33
52.39
70.28
69.23
55.26
78.00
33.34
64.70
100.00
63.64
68.19
Depth
30 cm
50.70
21.56
27.27
16.67
47.61
29.72
30.76
38.15
22.00
25.00
35.30
—
36.36
31.81
Zones
60 cm
—
—
—
—
—
—
—
5.26
—
41.66
—
—
—
—
90 cm
—
—
—
—
—
—
—
1.31
—
—
—
—
—
—

38
Seed of P. indicus were found to be more concentrated from the water edge upto 30 cm depth zone irrespective of seasonal changes in the environment at both the stations (Table 1). Soil at these depth had a sandy texture. Substratum studies showed that the seed of P. indicus were more aggregated on the soil of sandy texture than clayey nature.
In the case of M. dobsoni the seed were more abundant between 30 and 90 cm depth zones during premonsoon season at both stations (Table 2). During this time the percentage of clay/silt content was more at the above depth zones than 10 cm dpeth. But during monsoon the seed migrated even upto 10 cm depth zone in higher percentage than other deeper depth zones. The percentage of silt/clay in the soil was found to be comparatively high at 10 cm depth during this season when compared to premonsoon. This increase in the clay content may be due to heavy freshwater runoff. Again during postmonsoon the seed of M. dobsoni gradually occupied the deeper zones. These results show that the seed of M. dobsoni has an affinity towards clayey soil than sandy soil.
On the whole the 30 to 60 cm depth zone was preferred by the seed of M. monoceros in most of the months at both the stations irrespective of seasonal variations (Table 3). The depth zones had a silty texture at both stations. This result showed that seed of M. monoceros had an affinity to soil of silty texture.
This study further revealed that smaller ones were more abundant at shallower depths. P. indicus of size range 21-40 mm were more abundant at 10 to 30 cm depth zone at both stations. Larger ones were absent even at 60 and 90 cm depth zones.
In the case of seed of M. dobsoni at both stations 10 - 20 and 21 - 30 mm size groups were more at 10 cm depth zone and 31 - 40 mm at 60 cm depth zone. The seed of 41 - 50 mm group was more at 60 and 90 cm depth zones than shallower depths. This clearly show that smaller size of M. dobsoni preferred shallow depth zone and as they grow larger they migrate to deeper areas. Less predation and high productivity of the

39
shallow water area may be the reason for this pattern of distribution in the estuarine system.
TABLE 2. Depthwise monthly variations (in percentage) in the occurrence of seed of M. dobsoni
Kannamaly
April
May
June
July
August
September
October
Manjanakad
April
May
June
July
August
September
October
10 cm
—
— 8.20
46.91
56.28
32.67
9.73
—
2.43
3.94
40.93
40.96
26.34
12.65
Depth
30 cm
25.00
14.81
21.31
29.03
22.95
30.15
43.68
3.44
26.83
18.42
24.57
26.02
26.34
27.84
Zones
60 cm
75.00
51.86
40.99
16.04
12.55
26.63
31.55
89.65
62.20
59.22
24.56
33.02
39.03
36.73
90 cm
—
31.03
29.50
8.02
8.22
10.55
15.04
6.90
8.54
18.42
9.94
—
8.29
22.78
Seed of M, tnonoceros also showed definite pattern in its depth preference in accordance with the body size. At both stations, seed of 10 - 20 mm were more at 10 and 30 cm depth zones. At the same time 21 - 30 mm size was more at 30 and 60 cm depth zones. 31 - 40 mm was more at 60 cm depth zones and that of 41 - 50 mm also preferred 60 cm depth zone. But 51-60 cm size group was concentrated at 60 and 90 cm depth zones only. Here also smaller size groups preferred deeper zones.
40
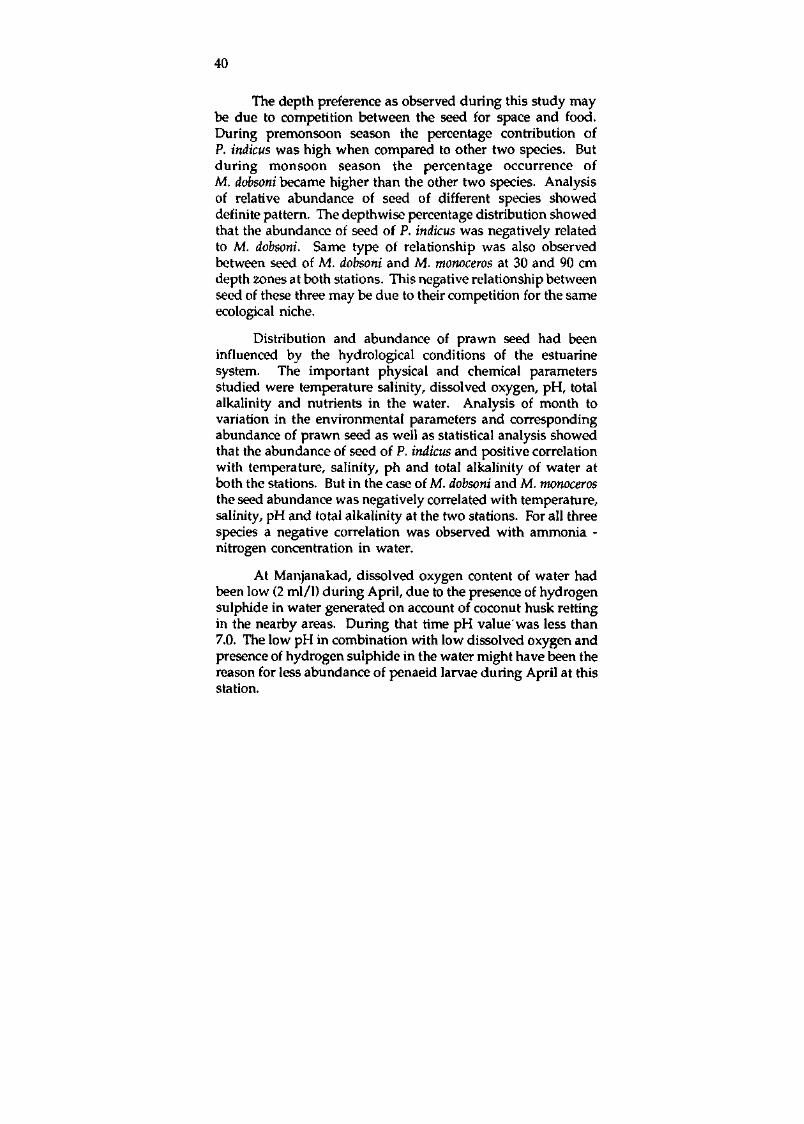
The depth preference as observed during this study may be due to competition between the seed for space and food. During premonsoon season the percentage contribution of P. indicus was high when compared to other two species. But during monsoon season the percentage occurrence of M. dobsoni became higher than the other two species. Analysis of relative abundance of seed of different species showed definite pattern. The depthwise percentage distribution showed that the abundance of seed of P. indicus was negatively related to M. dobsoni. Same type of relationship was also observed between seed of M. dobsoni and M, monoceros at 30 and 90 cm depth zones at both stations. This negative relationship between seed of these three may be due to their competition for the same ecological niche.
Distribution and abundance of prawn seed had been influenced by the hydrological conditions of the estuarine system. The important physical and chemical parameters studied were temperature salinity, dissolved oxygen, pH, total alkalinity and nutrients in the water. Analysis of month to variation in the environmental parameters and corresponding abundance of prawn seed as well as statistical analysis showed that the abundance of seed of P. indicus and positive correlation with temperature, salinity, ph and total alkalinity of water at both the stations. But in the case of M. dobsoni and M. monoceros the seed abundance was negatively correlated with temperature, salinity, pH and total alkalinity at the two stations. For all three species a negative correlation was observed with ammonia -nitrogen concentration in water.
At Manjanakad, dissolved oxygen content of water had been low (2 ml/1) during April, due to the presence of hydrogen sulphide in water generated on account of coconut husk retting in the nearby areas. During that time pH value was less than 7.0. The low pH in combination with low dissolved oxygen and presence of hydrogen sulphide in the water might have been the reason for less abundance of penaeid larvae during April at this station.

41
The organic matter in the estuarine sediment are very important from the point of view of the distribution of benthic organisms. In the present study an attempt was made to estimate the organic matter in the soil at the respective depth zones. The percentage of organic matter was found to increase as depth increased. It varied from 0.97 to 6.68% at the above
TABLE 3. Depthwise monthly vamtions (in percentage) in the occurrence of seed ofM. monoceros
Kannamaly
April
May
June
July
August
September
October
Manjanakad
April
May
June
July
August
September
October
10 cm
—
16.67
6.25
3.84
26.16
11.53
20.00
—
10.25
—
—
—
—
—
Depth
30 cm
33.33
33.33
40.63
46.15
40.10
19.25
20.00
33.33
23.08
16.23
25.71
61.11
—
18.18
Zones
60 cm
66.67
50.00
46.87
34.63
21.09
46.15
40.00
44.44
35.90
56.75
45.71
38.89
75.00
63.63
90 cm
— •
—
6.25
15.38
12.65
23.07
20.00
22.23
30.77
27.02
28.58
—
25.00
18.19
two stations. Low percentage of organic matter was observed during premonsoon. This reached a maximum level during monsoon period. The high values observed during monsoon season might be due to heavy sand runoff at the two stations. Analysis of the prawn seed distribution showed that they were

42
more aggregated along the shallow water edge than deeper zones. A comparison between prawn seed abundance and organic matter showed a negative relationship. This result showed that the low organic matter at 10 cm was adequate for the prawn seed. This also proved that it is the substratum which is more important for the prawn seed than nutrients.
Larvae and juvenilies of nonpenaeids and juveniles of fish were the two main groups of associated organisms collected along vdth seed of penaeids. Analysis of relative abundance of these showed that abundance of seed of penaeids was negatively related to that of fish juveniles. This negative relation by penaeids may either be due to competition for food or to avoid the predatory fish juveniles like gobids.

CMFRI Spl. Publ, 1993; 54 : 43 - 48
MOBILISATION OF TOTAL CAROTENOIDS IN RELATION TO OVARIAN MATURATION IN
THE PRAWN METAPENAEUS DOBSONI (MIERS)
LETHAKUTTY P . S. B . R. JAMES Research Scholar Supervising Teacher
Introduction
The striking yellow, red, orange and purple colours found in aquatic animals and especially in crustaceans are often attributed to a group of lipid soluble pigments called carotenoids. Metapenaeus dobsoni being one of the commercially important prawns found along the southwest coast of India, has been subjected to an extensive study on reproductive biology. It has been noticed that while the ovary is under progressive stages of maturation, it takes on different colours and these colour changes could be used to classify the different stages of ovarian maturation.
The above observations combined with the fragmentary knowledge of the function of carotenoids in the reproductive process and the paucity of this information among commercially important Indian decapod crustaceans has prompted this study.
In the present work, the variation of total carotenoid concentration of tissues like hepatopancreas, exoskeletion, ovaries and whole animals has been studied and the results are compared with those of ablated prawns. A relationship between total carotenoid content of the ovary with the gonadosomatic index has been established in M. do^oni during its ovarian maturation.
Material and methods
Live females of M. dobsoni measuring 68 to 115 mm TL with different ovarian maturation have been collected from the inshore waters of Cochin during June to September 1989 and

44
were brought to the laboratory. Under oxygenated conditions, the specimens were classified into five maturity stages, evaluated on the basis of ovary colour and size (Brown and Patlan 1974, Mar. Fish. Rev., 36 (7) : 23-26) morphological and microscopic examination of the ovary (Rao 1968, FAO Fish. Rep., 57 : 285-302) and histological study of the ovary during its maturation. The gonadosomatic index (GSI) was determined for each maturity stage to ascertain the condition of the ovary according to the method of Farmanfarmaian et al. (1958, /. Exp. Zool, 138 : 355-367).
For the estimation of total caretenoids, prawns of different maturity stages were dissected fresh and tissues like hepatopan-creas, exoskeleton and ovaries were removed. Tissues were cleaned to remove debris, weighed to the nearest mg and stored in screw capped glass vials, lined with aluminium foil at a temperature of -10°C until analysis. The haemolymph sampes collected were frozen.
Estimation of total caretenoids : Total carotenoids from various tissues and the whole animals were estimated using Olsons method (1979, Nutrition Rep. International, pp. 807-813) where chloroform stabilised with 0.75% absolute ethanol was used to extract the carotenoids. The tissue samples (1 gm) were ground with anhydrous sodium sulphate, prior to addition of chloroform. The whole animals were cut into small pieces and soaked in cold chloroform (5 ml) were kept for 24 hours at -10°C and during this period the chloroform will have formed a clear layer of 1.2 cm above the residue. An aliquot of 0.3 ml chloroform was taken from this layer and made upto 3 ml with absolute ethanol. Optical density is read at 480 nm. The total carotenoid concentration has been expressed as Hg carotenoid/g tissue.
Total carotenoid content =
Optical density of sample dilution factor X
extension coefficient sample unit (gm)
In this method, dilution factor = 50, extension = 0.25.

45
Induced maturation by eye stalk ablation and estimation ofcarotenoid content : In order to evaluate whether there is any significant difference in the total carotenoid concentration of eye stalk ablated prawn during different stages of maturity with that of the wild prawns, induced maturation was resorted to.
Adult females 66 mm (TL) about twenty in number were maintained in 100 litre fibre glass tanks and acclimatised for 5 days in sea water of 31±1 ppt salinity and pH 8.0 and water temperature at 27- 29°C. Fresh clam meat was given as feed and water quality was monitored regularly.
After acclimation the animals were isolated into five groups, each group containing 4 animals and maintained in 30 litre capacity fibre glass tanks with same salinity, pH and temperature. Unilateral eye stalk ablation was done for all animals.
The animals were sampled from the first tank on the second day after ablation when the ovary was still immature, from the second tank on the 8th day after ablation, from the third tank on the 11th day, from the fourth tank on the 14th day when the ovary was in progressive stages of maturation and finally from the fifth tank on the 20th day after the prawn have spawned.
The estimation of total carotenoids from the tissues and whole animals was done as before.
Statistical Analysis : Data were subjected to Analysis of Variance (ANOVA). In order to establish a relationship between GSI and ovarian total carotenoids, a polynomial regression line was drawn and an equation obtained. A one way ANOVA was done to determine whether there was any significant difference in total carotenoids of different tissues and whole animals of ablated and wild prawns.
Results
Estimation of total carotenoids : The variation in total carotenoid concentration ((Ag/g wet wt) in the hepatopancreas of M. dobsoni during ovarian maturation showed a decrease from the immature

46
stage (75.27 ± 7.15) to the mature stages (20.38 ± 2.90) with a recovery in the spent stage (58.29 ± 8.50).
The variation in total carotenoids concentration (|ag/g wet wt) in the haemolymph showed an increase from the immature stage (5.43 ± 0.84) to the mature stage (11.58 ± 1.46) as maturity advanced and after spawning it fell to 6.78 ± 1.58.
The variation in total carotenoids content (|xg/g wet wt) in the exoskeleton showed that from an initial of 22.57 ± 3.28 in the immature stage it reached a peak (70.58 ± 7.14) in the mature stage, but later declined (39 ± 3.99) in the spent stage.
The variation in total carotenoid concentration (|J.g/g wet wt) in the ovary during its ovarian maturation demonstrated a maximum trend (100.73 ± 13.47) in the mature stage, with a fall in the spent stage (56.50 ± 16.01).
The variation in GSI and total carotenoid concentration during ovarian maturation showed a positive relationship. The minimum GSI value (0.189) recorded a total carotenoid concentration (|J.g/g wet wt) of 28.4 while the maximum value (7.26) recorded a concentration of 101.5. The results of polynomial regression has showed a positive correlation between GSI and the total carotenoid concentration. The polynomial regression line obtained for the relation between GSI (X) and total carotenoids of the ovary (Y) has been determined as Y = 35.9367 + 11.0133 X (r = 0.7688 and S R = 2.0131).
The total carotenoid concentration (|J.g/g wet wt) from whole animlas of M. dobsoni from different stages of maturity showed a general increase from the immature stage (149.4 ± 4.88) to the mature stage (223.4 ± 27.51) whereas in the spent stage it is reduced to 210.8 ± 9.01.
Comparison between prawns matured through eye stalk ablation and wild prawns : The comparison in total carotenoid concentration between eye stalk ablated and wild M. dobsoni in different tissues at different stages of maturity showed a general decrease in all tissue as well as in whole animals of the ablated prawns when compared to the wild ones. However the same trend of increase

47
and decrease in carotenoid levels has been maintained in both cases, in all the tissues as well as in whole animals.
Discussion
Ovarian maturation refers to a cyclic morphological change during which a female undergoes sexual maturity. This attainment always mark a change in the growth pattern resulting from a "reproductive drain" due to diversion of biochemical reserves meant for somatic growth to the ovaries.
The present study is in agreement with earlier observations in most of the aspects. As the gonadosomatic index increased, there is a corresponding increase in the total carote-noids levels, showing that carotenoids are also one among the biochemical reserves that accumulate in the course of ovarian maturation. The prawn M. dobsoni has been also found to mobilise carotenoids from the hepatopancreas to the ovary.
It was observed that the total carotenoids of the hepatopancreas is found to decrease as maturity advances and eventually only a very low level of the pigment has remained as maturation peak is reached.
The present study showed that the total carotenoids levels in the haemolymph have increased as maturation progresses and have decreased after spawning. This may be attributed to the fact that haemolymph maintains a constant reserve of carotenoids during the breeding season, so that the ovary can utilise it during maturation. But during spawning the haemolymph carotenoids are transferred to the mature eggs for their consequent development, thereby, causing a decrease in its level.
The exoskeleton also gets a fair amount of carotenoids during reproduction cycle. This has also been observed in M. dobsoni during the present study. This increased level of carotenoids in the exoskeleton accompanying the advancement of maturation may be in some way related to temperature and light. Besides as this prawn attains peak maturity during the intense summer months, the excess carotenoids in the exoskele-

48
ton may provide some protection against increase in temperature and light.
Crustacean ovaries in general show a maximum accumulation of carotenoids during egg production. The change in the colours of crustacean ovaries are attributed to the deposition of carotenoids in varying intensities (Castillo et ah 1982, In : Carotenoid chemistry and biochemistry. Pergamom Press, Oxford, pp. 221-224). The various colourations given by these carotenoids results from their different particular composition, depending on the species and probably also on the stages of development of the eggs (Zagalsky et al. 1967, Comp. Biochem. Physiol, 22 : 851-871). In the present study, the changes in the colour of the ovary in M. dobsoni has been so distinct, that by observing the colour, the particular stage of maturation could be determined.
In the present study, a decrease in the total carotenoid content in all tissues of the ablated prawns may be due to the lack of pigment in the diet. The wild prawns in comparison might have acquired the carotenoids from the wide variety of food they feed on in nature.
Thus, the pattern of mobilisation of organic reserves like the carotenoids from the digestive gland may reflect the nutritional hibitat or the reproductive biology of the animal concerned.
According to Castillo and Lawrence (1989, /. Crust. Biol, 9 (2) : 202-211), the mobilisation of stored organic reserves is usually found in species that reproduce seasonally and the influence of seasonal factors on reproduction is usually more pronounced in species that reproduce in shallow waters rather than those in deep waters. In short, both seasonal reproduction and mobilisation of stored nutrients are frequently found in species that reproduce at shallow depths. However in the present study eventhough M. dobsoni shows a potracted breeding season extending throughout the year and breeds in relatively deeper waters of the inshore grounds (Rao 1968, loc. cit.), it could mobilise stored carotenoids dissolved in lipids from the hepatopancreas to the ovaries.

CMFRI Spl. Pubi, 1993; 54 : 49 - 52 10 HISTOMORPHOLOGICAL CHANGES IN
PENAEUS INDICUS DUE TO THE EFFECT OF LOW SALINITY AND LOW OXYGEN IN WATER
SHARMILA AZIZ S. C. MUKHERJEE Research Scholar Supervising Teacher
Introduction
The aquatic environment is under constant changes. Sometimes, the changes are so great and sudden that the animals inhabiting it are unable to cope up with the changes. These changes in the environment brings about a lot of stress in the animals. These signs of stress become evident in the behaviour and histological levels. Conditions like low dissolved oxygen and low salinity are two important parameters that affect the normal physiological and metabolic activities in aquatic animals. It has been observed that a lot of histomorphological changes is brought about by the effect of these stresses. The present study was aimed to study the changes that occur at the tissue level due to the effect of enviromental stressors like low dissolved oxygen and low salinity.
Material and methods
Brownish areas of necrosis ranging between 8 mm to 10 mm in diameter were seen in the posterior abdominal region of Permeus indicus. They appeared as small pinkish brown areas, which became opaque later. The animals were lethargic and moved very slowly.
The dissolved oxygen (DO) content was maintained at 2-3 ml/litre by providing mild aeration. The salinities to which the animals were subjected were 1 ppt, 2 ppt, 3 ppt and 4 ppt.
The tissues selected for the study were hepatopancreas, heart, gills, muscle and gut. The fixatives used were Neutral buffered forrrualin, Bouin's fluid and 10% formalin. The

50
processing was done using routine histological techniques and the sections cut in a manual rotary microtome at 5-10 \i. Staining was done using haematoxylin and Eosin. Stained sections were examined under a binocular research microscope. Haemotologi-cal studies were conducted to find out the total haemocyte count (THC) and the haemohymph glucose content.
Results
The myofibrils exhibited marked muscular necrosis. In advanced cases, the degenerating myofibrils had a pale vacuolated "moth-eaten" appearance due to marked destruction of parenchyma.
Areas of mineralization resembling calcification were frequently observed. Severe necrotic foci with mild to moderate infiltration of haemocytes were also obf»erved.
Heart exhibited myocardial degeneration with karyor-rhectic nuclei in the muscle bands. Pericardial sac showed oedomatous change with thickening and sicattered haemocytes. Hyalinization and vacuolation associated with moderate haemocytic infiltration was evident in majority of cases. Pericardium showed marked thickening due to hyperplastic changes and haemocytic infiltration.
Thinning of epiculticle was a regular finding. The subepicuticular layer showed thinning and exhibited uneven thickness at some places. Tonofibrils traversing the epidermal layer showed focal detachment from the uncalcified layer of the endocuticle. There was separation of the exoskeleton from the underlying muscle. Mild to moderate infiltration of haemocytes was observed in the widened space.
The hepatopancreas exhibited marked tubular degeneration with complete loss of architecture in few cases where acinar structure was absent. In other cases empty hepatopancreatic acini were observed with complete denudation of the epithelial cells of the tubules. The thickened basal lamina was left alone in extreme cases.

51
Branchial cell hyperplasia occurred in the low salinity and low oxygen condition. Marked to moderate haemocytic infiltration was observed in the gill lamellae and branchial septum.
Increased number of granular eosinophilic cells were observed in the sub-serosal layer where marked oedema and extensive vacuolation was noticeable.
Total haemocyte count (THC) : Mild to moderate haemocytosis was observed in the haemolymph. The mean THC was 9,125 cells/rrun^ with a range of 6,450 - 18,150 cells/mm^.
Haemolymph glucose content: Hypoglycemia was observed in the haemolymph with a mean value of 9.375 mg/dl and with a range of 9-10 mg/dl.
Discussion
The histomorphological changes in various tissues observed in the present study under stress condition was similar to that obtained by earlier workers.
The extensive structural degradation of the muscle cells in the transitional and necrotic zones of Penaeus aztecus subjected to salinity and temperature change indicated that initial damage was of a physiological nature, induced by abrupt salinity and temperature changes (Lakshmi et al. 1978, Aquaculture, 13 : 35^3.
The absence of any microorganisms in association with the premortem pathological myofibre alterations in Macrobra-chium rosenbergii under intensive conditions in the hatcheries, might be as a result of idiopathic nature of the lesions (Nash et al. 1987, /. Fish. Dis., 1 (2) : 113-123). In the present study too, the absence of any miaoorganisms suggests that the histological changes are brought about by the environmental stress and that they are not of an infectious type.
Water quality management is an integral part of mari-culture. Nearly every problem that arises in an aquaculture system is the result of, or leads to degradation of water quality.

52
which in turn may lead to oxygen depletion. This often triggers the sudden outbreaks of diseases. Hence, dissolved oxygen is a vertical hydrological characteristic which should be carefully monitored in the culture system.
Salinity of the culture medium is as important as the DO factor for successful culture activities. The influx of fresh water, especially during the monsoon in the brackishwater system, where most of the culture activities are carried out at present, brings the salinity level to such low extents that it brings about a lot of undesirable changes in the culture animals leading to varying degrees of morbidity and mortality.
Though innumerable diseases of economically important crustaceans have been described, most of them are of undetermined etiology. This reveals the fact that besides the instinct pathogenecity of certain disease causing agents, the effect of environmental stressors like DO, salinity and temperature fluctuations also play vital roles.
Histopathological changes in the five organs examined in the stressed animals indicated that they may serve as early warning indicators of stress. The muscle appears to be one of the most important organs for this purpose, as frank lesions were abundant in the muscle tissue of the exposed animals. Tissue responses in the hepatopancreas, heart and gill also prove as useful indicators of stress.
The degenerative changes in the gills and exoskeleton are helpful for early detection of stress.

CMFRI Spl. Publ, 1993; 54 : 53 - 57 11
EFFECT OF "NUVAN" ON SOME BIOCHEMICAL AND PHYSIOLOGICAL PARAMETERS OF
LIZA PARSIA (HAMILTON AND BUCHANAN)
B. C. MoHAPATRA A. NOBLE
Research Scholar Supervising Teacher
Introduction
The pesticides which get into water bodies through rain run off, discharge of industrial effluents and dust storms over cultivated land and industrial areas cause degradation and disaster to the aquatic ecosystem. Considering the usefulness of the pesticides and since no other chemicals are found suitable to replace them, we cannot presently suggest a ban on the use of pesticides.
As organochlorine piersists in the environment and accumulates in different tissues, its use in agriculture has given rise to criticism in recent years prompting to prefer organo-phosphates by most of the agriculturists. The water soluble organophosphate insecticide "Nuvan" is widely used in KoUeru region of Andhra Pradesh for control of ectoparasites such as Lernea and Argulus. But the long range effects of this practice are not known. The "Nuvan Fish 500 EC" has been granted a U. K. Government product licence for use as medicine in salmon farming against the sea lice. But this appears to have deleterious effects on marine invertebrates and epidemic eye disease in salmon of the wild is linked to the use of "Nuvan 500 EC" in farms.
The target in this work is to (i) evaluate the acute toxicity range of "Nuvan", (ii) find out alterations if any in the biochemical composition in blood and muscle and (iii) study physiological disorders including histological disorders in kidney and liver tissue of Liza parsia.
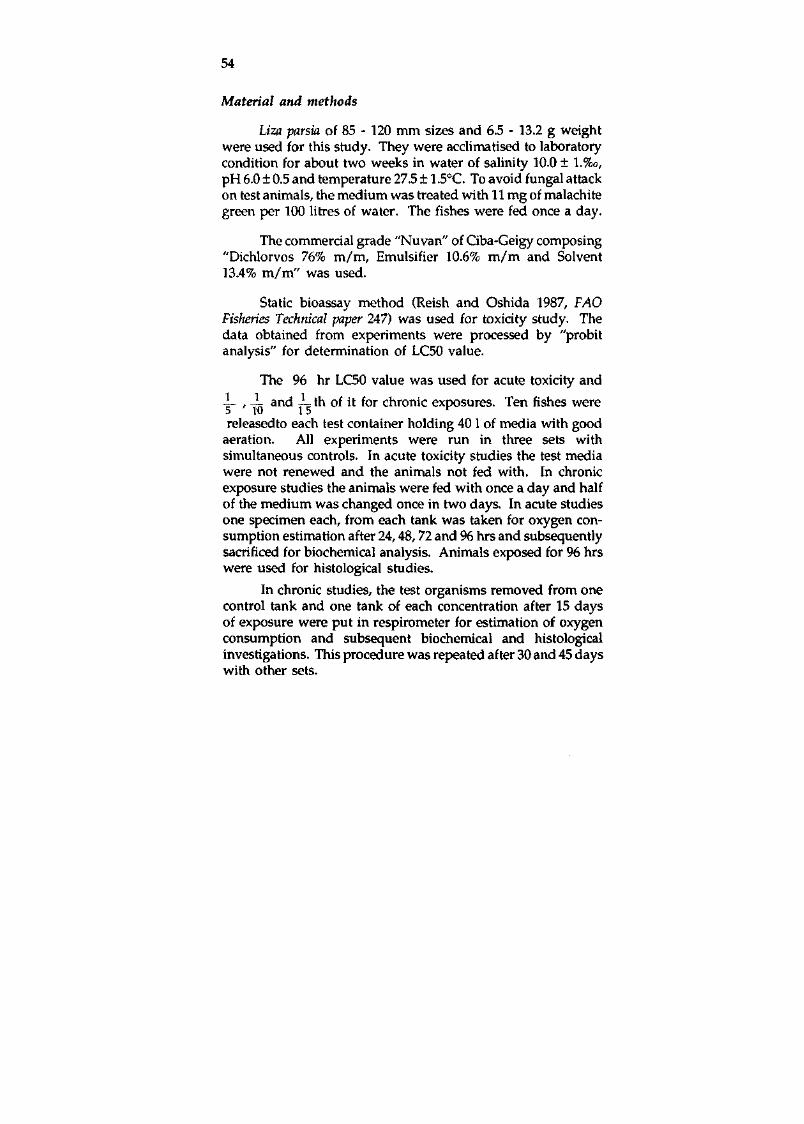
54
Material and methods
Liza parsia of 85 - 120 mm sizes and 6.5 - 13.2 g weight were used for this study. They were acchmatised to laboratory condition for about two weeks in water of salinity 10.0 ± l.%o, pH 6.0 ± 0.5 and temperature 27.5 ± 1.5°C. To avoid fungal attack on test animals, the medium was treated with 11 mg of malachite green per 100 litres of water. The fishes were fed once a day.
The commercial grade "Nuvan" of Ciba-Geigy composing "Dichlorvos 76% m/m, Emulsifier 10.6% m/m and Solvent 13.4% m/m" was used.
Static bioassay method (Reish and Oshida 1987, FAO Fisheries Technical paper 247) was used for toxicity study. The data obtained from experiments were processed by "probit analysis" for determination of LC50 value.
The 96 hr LC50 value was used for acute toxicity and
-L , J* and -L th of it for chronic exposures. Ten fishes were
releasedto each test container holding 40 1 of media with good aeration. All experiments were run in three sets with simultaneous controls. In acute toxicity studies the test media were not renewed and the animals not fed with. In chronic exposure studies the animals were fed with once a day and half of the medium was changed once in two days. In acute studies one specimen each, from each tank was taken for oxygen consumption estimation after 24,48,72 and 96 hrs and subsequently sacrificed for biochemical analysis. Animals exposed for 96 hrs were used for histological studies.
In chronic studies, the test organisms removed from one control tank and one tank of each concentration after 15 days of exposure were put in respirometer for estimation of oxygen consumption and subsequent biochemical and histological investigations. This procedure was repeated after 30 and 45 days with other sets.

55
Oxygen content was estimated by Winklers method. The consumption of O^ by fishes was calculated based on the formula :
Water vol. in ml 1000 g 60 minutes (Initial Oj - Final Op x x x
1000 ml Weight in g of fish time in minutes
The values were expressed in "mg/kg body wt/hour".
Muscle and serum protein were estimated by Biuret method (Gornall et al. 1949, /, Biol. Chem., 177). Total free amino acids were estimated with Ninhydrin method (Yemm and Cocking 1955, Analyst, 80) using Gl3/cine and Glutamic acid as standards. The alkaline and acid phosphatases activity were determined following the procedure of (Barret 1972, Lysosomes : A laboratory handbook. North Holand Publishing Co., Amsterdam).
Results
The LC50 values were found to be 1.015, 0.750,0.554 and 0.482 ppm for 24, 48, 72 and 96 hrs respectively.
TABLE 1. Percentage variation of biochemical parameters on acute exposure
Exposure period (Hrs)
0
24
48
72
96
Muscle tissue
Protein AAs
0
-7.72
-13.61
-22.14
-37.46
0
14.14
18.50
17.29
2.50
Protein
0
10.57
34.46
14.82
-44.55
St2rum
AAs
0
7.22
16.41
57.0.1
-36.63
ACP
0
4.59
10.0
26.55
56.41
ALP
0
-12.28
-11.68
-21.46
-31.35
Gradual depletion in protein content with elevation of total free amino acids in the muscle tissue were observed in acute exposure study (Table 1). The possible causative factor for such a decrease may be due to the extensive proteolysis which ultimately leads to the increase of amino acids. Similar results

56
were obtained in chronic exposures (Table 2). In chronic exposures the depletion of total free amino acids (AAs) was observed initially followed by gradual elevation (Table 2). As the animals were fed daily, the decrease of AAs may be related to the oxidative deamination of it. Later increase, may be due to proteolysis of proteins and peptides.
TABLE 2. Percentage variation of bbchemical parameters on acute exposure
Biochemical parameters
Protein
AAs
ACP
ALP
Exposure period (Days)
15
30
45
15
30
45
15
30
45
15
30
45
Muscle: tissue
A B
-14.39
-21.82
-30.61
-24.36
-1.78
11.00
-.'20.5
•35.27
-34.69
-30.07
6.52
45.97
C
-24.10
-33.46
-38.77
-35.68
20.34
52.40
A
22.63
12.60
-2.92
-5.17
-9.04
17.27
8.26
15.65
18.18
-24.11
-27.17
-20.80
Serum
B
21.17
7.09
-10.72
-7.78
1.21
35.97
12.84
4.35
28.10
-30.14
-33.20
-38.32
C
15.33
-7.09
-20.53
-18.13
15.96
48.22
25.69
27.83
42.98
-37.23
-37.96
-46.35
In serum, initial increase of protein both in acute and chronic experiments (Table 1 and 2) was observed followed by the decrease on longer exposure periods. Comparing the result with other investigations, it is felt that the increase may be due to increased content of globulin in the plasma, but the decrease may be related to low assimilation of food at pesticidal stress or decreased level of albumin and globulin content. Similar results were also seen for total free amino acids in acute study. But in chronic study it reversed to an initial decrease followed by increase. The decrease of AAs may be due to the withdrawal of it from blood stream to the surrounding active tissues for

57
energy production or for protein synthesis needed in production of detoxifying enzymes at pesticidal stress and the increase of it at longer duration may be related to the cause explained earlier in the second paragraph.
Gradual elevations in acid phosphatase (ACP) and depletion in alkaline phosphatase (ALP) of serum were observed both in acute (Table 1) and chronic (Table 2) exposures. The cause is not known. However it may be related to the pH of blood.
The present study showed the initial increase of oxygen consumption, over control at LC50 concentration, followed by sudden decrease (Table 3). The possible reason also is not known. But increased oxygen uptake was observed in fishes exposed to sublethal concentrations of "Nuvan" and the increase was more in lower concentrations. According to Davis (1973, /. Fish. Res. Bd. Canada, 30:369 - 377) "the arterial oxygen tension declines rapidly in pesticidal stress i. e. sublethal concentration and decreased arterial oxygen tension increases the oxygen uptake through the gills to maintain equilibrium". This may be the cause for such increase of oxygen uptake in the present study.
Acute and chronic exposures resulted in histological disorders such as vacuolation, karyolysis, karyorrhexis and pyknosis of hepatocytes, and enlargement of renal tubules and vacuolation in epithelial cells of kidney.
TABLE 3. Percentage variation in oxygen consumption after acute and chronic exposures
Exposure period (Hrs)
0
24
48
72
96
Acute
Variation (%)
0
12.30
3.06
-11.91
-18.24
Exposure period (Days)
15
30
45
A
7.41
17.85
21.74
Chronic
B
9.13
5.90
12.73
C
6.34
8.74
7.47
Note : A = 1/15 th 96 hr LC50, B=l/10th 96 hr LC50, C = l/5th 96 hr LC50

CMFRI Spl. Publ, 1993; 54 : 58 - 60 12
KARYOMORPHOLOGY OF LATES CALCARIFER
SuDHEESH, P. S. GEORGE JOHN
Research Scholar Supervising Teacher
Introduction
Fish genetics is an emerging field in fish breeding promising the production of cheap high quality fish protein. Karyotypic differences among species or taxa may be used to determine phenetic similarities and phylogenetic relationships. In addition to understanding the systematic position of species, detecting gross genetic variation, cytogenetic studies would be an aid in experimental hybridization. Seabass Lates calcarifer culture has been gaining immense popularity in the Indo-Pacific region. In the present study a methodology for the chromosome preparations of L. calcarifer was standardised. Chromosome preparations were made from two representative populations collected from Cochin and Tuticorin. The two populations were compared cytogenetically on the basis of chromosome morphology, their total length, relative length and arm ratios.
Material and methods
Live L. calcarifer sjsecimens of the size 80-120 mm were collected from the backwaters of Puduvaippu (Cochin) in Kerala and Tuticorin in Tamil Nadu. The animals were transported to the laboratory in oxygenated polythene bags and maintained in fibreglass tanks containing water of salinity 5-10 ppt. Live prawns were given as feed. The fishes were acclimatised for about one week before the experiments were conducted.
Out of the many methods, the method of Kligerman and Bloom (1977, /. Fish. Res. Bd. Canada, 34 : 266-269) was found to be most suitable for the chromosome preparations of L. calcarifer.
Results and discussion
Though a number of methods have been evolved for the

59
chromosome preparation of fishes, each species requires specific standardisations for obtaining well spread chromosomes with clear morphology. For the present study seven different methods were tried to achieve a suitable methodology for the particular species. The in vitro studies are best suited for chromosome studies, but is usually impossible as it requires a lot of sophisticated laboratory facilities.
Method 3 and 5 were generally found unsuitable. Method of McPhail and Jones (1966, /. Fish. Res. Bd. Canada, 23 : 767-768) gave no metaphase spreads due to the damage of chromosomes during manual squashing. The sodium citrate hypotonic treatment of Le Grande and Fitzimons (1976, Copeia, 2 : 388-391) was helpful for inducing cell swelling. Method 2 and 4 yielded only incomplete metaphase spreads at a very low frequency and hence found unsuitable for screening. The incomplete metaphase spreads were possibly due to the loss of chromosomes during centrifuging. The method of Kilgerman and Bloom (1977, loc. cit.) gave excellent results with well spread chromosomes. The treatment with low concentration of 0.001% colchicine was helpful in getting well-spared chromosomes which were not contracted.
In fishes, both haploid and diploid sets contain chromosome numbers characteristic for the species. The diploid number of L. calcarifer was determined to be 48. This finding is in conformity with the report of Khuda Bukhah (1979, Caryologia, 32 :161-169). There are so many reports on the intra-individual, intra-population and inter-population chromosomal variations in fishes. But, in the present study, the two populations of L. calcarifer from Cochin and Tuticorin did not show any difference in chromosome numbers. The model diploid number of 48 was observed in the maximum number of 133 metaphases counted from all of the 14 animals collected from Cochin. The same modal number of 48 was observed in 128 metaphases counted from all the 10 animals from Tuticorin. No other modes were observed. Counts above 48 were observed in the specimens from Tuticorin. The high and low diploid numbers other than 48 are ascribed to the mixing or loss of chromosomes during

60
slide preparation. For the frequency of diploid numbers and animal wise distribution of diploid numbers of specimens from Cochin and Tuticorin, the original Dissertation may be consulted.
Detailed observations have shown that the karyotype of L. calcarifer consists of 48 chromosomes which can be aligned into 24 homomorphic pairs comprising 1 pair of metacentrics, 4 pairs of submetacentrics and 19 pairs of acrocentrics. The haploid karyotype of 24 acrocentric chromosomes is found throughout several diverse orders of the subclass Teleostei (Class : Osteichthyes) and appears to be the predominant karyotype in the recently evolved Perciformes. Deviation from the pattern of 48 acrocentric chromosomes is observed in L. calcarifer by the presence of metacentric and submetacentric chromosomes. Karyotype containing biarmed elements (metacentrics and submetacentrics) are generally regarded to represent as dervied or non-primitive condition within Teleosts.
Generally fish chromosomes are smaller in size than chromosomes in most vertebrates. Chromosomal lengths of L. calcarifer collected from Cochin ranged between 1.7875 |im and 3.7504 \im. In the specimens from Tuticorin the total length of chromosomes ranged between 1.9471 |xm and 3.7319 \im. Based on the overall studies on fish chromosomes it can be suggested that L. calcarifer chromosome lengths fall into the general pattern observed. The total chromosome length, relative length and arm ratios of L. calcarifer collected from Cochin and Tuticorin are also given in the original Dissertation. The NF value (fundamental number of arms) was found to be 55 in both the populations. Sex chromosomes were morphologically unidentified.
In this context it may be concluded that the chromosome constitution of L. calcarifer is similar to the general pattern found in the order Perciformes. The Geographic separation does not seem to have created any variations in the two populations of L. calcarifer. Detailed investigations using advanced chormo-somal banding techniques have to be carried out regarding the population cytology of L. calcarifer for identifying, conserving and maintaining its relatively limited stocks.

CMFRl Spl. Puhl, 1993; 54 : 61 - 63 13
STUDIES ON THE BIOTOXICITY OF THE MANGROVE VEGETATION ON THE FINGERLINGS OF
LIZA MACROLEPIS, TILAPIA MOSSAMBICA AND CHANOS CHANOS
K. MADHU D . SADANANDA RAO
Research Scholar Supervising Teacher
Introduction
The mangrove ecosystem with its complex canals, plants, pneumatophores and aerial roots provide food and shelter to a number of juvenile fishes. But, so far no scientific work has been carried out on the toxicity of mangrove vegetation on the aquatic organisms which inhabit these regions. The present work has been taken up to study the biotoxicity of mangrove plants on the fish fingerlings of Liza macrolepis, Tilapia mossatnbica and Chanos chanos.
Material and methods
Ethanol and water extracts of the seeds, flowers, stem, leaves and root bark of seven species of mangrove plants were used for the biotoxicity studies. The plant species studied were Acanthus ilicifolius, Aerostichum aureum, Avicennia officinalis, Brugiera cylindrica, Clerodendrum inermi, Excoccaria agallocha and Rhizophora mucronata.
Ethanolic extracts were carried out with hot ethanol using all glass soxhlet apparatus. The ethanolic solution thus obtained was distilled and the residue dried in a dessicator over fused calcium chloride for 48-72 hours. The water extracts were obtained by heating 2 g of the powdered material of the plant part with 10 ml of distilled water in a water bath for 30 minutes. For toxicity studies with ethanolic extracts, an aliquot of cooled ethanolic solution equivalent to 2 g of dried plant material dissolved in 100 ml of ethanol was taken and to this 10 ml of

62
Phosphate-Bufffer-saline (PBS) was added after evaporating the ethanolic solution. 10 ml of PBS solution was added to the water extracts also.
Fingerlings of Liza macrolepis (45 mm mean length and 0.75 g), Tilapia mossambica (60 mm and 0.98 g) and Chanos chanos (50 mm and 0.68 g) were acclimatised and used for the toxicity experiments. One test fingerling each was placed in finger bowls with 250 ml of acclimatised water. To this the ethanolic or aqueous extract containing 10 ml of PBS solution was added and thoroughly mixed. The experiments were carried out at laboratory temperature (26.5°-32.0°C) and repeated thrice along with control. The experiments were terminated either when the fish died or continued to show normal behaviour.
The muscle tissue of the dead fingerlings and those of the control experiments were subjected to biochemical analysis for total free sugar, total protein and cholestrol. Standard procedures were used for all estimations. In each case, the estimation was repeated six times and the mean values were taken.
The ethanolic extracts of each part of mangrove species were chromatographed by descending method (Zweig and Whitaker 1971, Academic Press Inc., London, BA Vol. 1) on Whatman filter paper (No. 1) using Shandon apparatus. Five different solvent systems namely n-Butanol: Acetic acid : Water (14 : 4 : 50 V/V); n-Batanol : Acetic acid : Water ( 4 : 1 : 1 V/V); n-Butanol : Acetic acid : Water ( 4 : 1 : 5 V/V), n-Butanol : water : Ethanol ( 5 : 4 : 1 V/V) and Benzene : Methanol : water ( 4 : 4 : 1 V/V) were used. Various spots developed in the chro-matograms were detected by illumination with ultra-violet light and their Rf values calculated. Later the chromatograms were exposed to ammonia vapours for 6 hours and the Rf of the observed coloured areas were calculted.
Results
The toxic effect of the ethanolic and aqueous extracts of different parts of seven mangrove plant species on L. macrolepis,

63
T. tnossambica and C. chanos fingerlings were studied. The ethanol and water extracts did not show any difference in their toxic reactions. Extracts of all parts of A. officinalis were found to be non-lethal to the three fish sjjecies. On the other hand, extract of the leaves and stem bark of £. agallocha and seeds, leaves, stem and root bark of R. mucronata were lethal to all the species. The leaf extract of R. mucronata however did not have a lethal effect on C. chanos. The seed and stem bark extracts of A. ilicifolius were lethal only to C. chanos and leaf extract of A. aureum lethal only to T. mossambica. Only the stem bark extract of B. cylindrica had a lethal effect on both L. macrolepis and T. mossambica. On the other hand, the extracts of stem bark, leaves and seeds had a lethal effect on C. chanos and L. macrolepis. C. chanos was affected only by the flower extract of C. inermi, but L. macrolepis was affected by both the flower and leaf extract of C. inermi.
Biochemical studies on the muscle tissue of fingerlings showed that in all cases of lethality the total free sugar and total protein content reduced considerably. The cholesterol content also showed a slight reduction.
Chromatographic results of the ethanolic extracts showed that they contained 4 to 7 different chemical components.

CMFRI Spl. Publ, 1993; 54 : 64 - 69 14
TOLERANCE LIMITS OF SALINITY, TEMPERATURE, OXYGEN AND pH BY THE JUVENILES OF
PRAWN PENAEUS INDICUS H. MILNE EDWARDS
SHYLAJA, K. K. RENGARAJAN Research Scholar Supervising Teacher
Introduction
In nature all aquatic organisms very particularly invertebrates, are subjected to a variety of environmental changes. The biology of any aquatic animal is profoundly influenced by several abiotic factors prevailing in its surroundings. As a general rule the distributional limit of the animal concerned to any particular ecosystem is determined by the degree of influence exerted by each of these factors either independently or in combination with others. It is therefore vital to study the organisms in relation to environmental condition in any investigation.
Penaeus indicus like most of the penaeid prawns, has been found to pass through two distinct phases of life cycle - a marine and an estuarine phase.
In the natural ecosystem, mortality due to extreme temperature, salinity and pH are very high. Thermal discharge and acidic effluents from the ever increasing industries are found to pollute the coastal aquatic environment to affect the survival, growth, reproduction, etc. of the organisms.
Considerable works have been done on the effect of salinity on the growth of P. indicus postlarvae and juveniles in the laboratory by various authors. But not much work has been carried out collectively for all the parameters such as salinity, temperature, dissolved oxygen and pH to know their influence on and tolerance limit of the juveniles of P. indicus and each author has studied the effect of a particular parameter only on

65
a particular species. In view of the above lacunae, an attempt has been made with limited time available for dissertation to understand the effects of all the above mentioned parameters on the juveniles of Indian white prawn Penaeus indicus which is considered to be one of the best suitable species for aquaculture. This study has given interesting results to understand the tolerance limits of the the juveniles of P. indicus.
Material and methods
For the present work, juvenile prawns of Penaeus indicus were collected from Puthuvyppu, a coastal village near Cochin. On reaching the laboratory the animals were carefully transferred to 40 litre fibre-glass tanks containing well aerated sea water of 20 ppt salinity. The water in the acclimation tank was renewed partially every day. The juveniles used for the present study were 40-70 mm in size and fed with fresh clam meat.
Experiments on salinity tolerance : The experimental containers consist of three aquarium tanks with a water holding capacity of 35 litres. During the present study salinity concentrations upto 50-60 ppt were obtained by freezing out. Desired salinity from a known higher salinity solution was prepared by using the following simple formula.
Desired salinity x 1000
Known higher salinity of sea water
This gives the volume of sea water of known salinity that should be taken and diluted with distilled water to make up one litre solution of desired salinity. The solution thus made were checked up by titration.
Each experimental container was provided vdth constant aeration throughout the acclimation and experimental periods. One third of the water in all experimental containers were changed once in two days with freshly prepared sea water of respective salinities, maintaining the volume of media constant. All the salinity tolerance experiments were conducted in

66
triplicate at a stocking rate of 20 animals in 20 litre of water taken in each container. Each set of experiments lasted for 10 days. For every set of experiment a control series was also run at 20 ppt salinity. At the end of every 24 hours the mortality was recorded.
Experiments on pH tolerance : The sea water collected and stored in large bins for 2 weeks to settle down and stabilise the pH. The test solutions were prepared separately in large closed bins for more than 2 weeks and every day the varying pH adjusted till it got stabilised.
The low pH ranges were prepared with one normal hydrochloric acid (IN HCl) and the higher range with one normal sodium hydroxide (IN NaOH) solution. pH was measured using a "Elico" digital pH meter. For each concentration triplicate sets were maintained. Two litre capacity glass beakers filled with 1500 ml of sea water with salinity 25±3 ppt were used. 10 animals of 40-70 mm size were subjected to each concentration and the whole system was aerated with aeration tubes.
Experiments on temperature tolerance : For higher temperature tolerance limit, experimental set up was same as in the case of pH. But the whole system was introduced in separate sets of temperature control unit. To find out the lower temperature tolerance an aquarium tank with water holding capacity of 40 litres was used. 10 animals of 40-70 mm size were introduced into the tank and the temperature was made to decrease gradually by adding the ice blocks (in polythene bags). The temperature of the medium was checked with ordinary standard mercury thermometer.
Experiments on oxygen tolerance : Three seed transportation bags of 15 litres water holding capacity were used for this experiment. Each bag was filled with 5,10 and 15 litre sea water respectively. Ten animals of 40-70 mm size were introduced into each bag and filled with oxygen from oxygen cylinder purchased from the market. Dissolved oxygen was measured by using "Winkler method".

67
An aquarium tank with water holding capacity of 35 litres was used for lower oxygen tolerance experiment. Ten animals of 40-70 mm size were introduced into the tank and the surface was covered with liquid paraffin in order to cut-off the atmospheric interaction. When the prawn start dying water samples were collected and analysed for dissolved oxygen content.
Statistical analysis
The data obtained from each experiments were processed at the Computer Centre of the National Marine Living Resources Data Centre (NMLRDC) of CMFR Institute by using regression analysis (y = a + bx) to find out intercept (a) and slope (b). Where X and y are taken as concentrations of parameters and response (survival) respectively. Taking y as 0, 50 and 100, respective survival concentrations were calculated. 0, 50 and 100, respective survival concentration were calculated. 0, 50 and 100% survival concentration for different exposure periods was plotted graphicaly to obtain respective survival curves.
Results and discussion
Salinity : The results of salinity tolerance in the present study clearly indicated that the juvenile P. indicus of 40-70 mm size can tolerate a wide range of salinity varying from 3.9-40.7 ppt under environmental conditions. Kuttyamma (1980, Mar. Biol., 11 (1) : 1-35) noticed the extreme euryhaline nature of juvenile P, indicus and reported 5-35 ppt as the best survival limit. 50% survival obtained at 43 ppt within 10 days. In the present study 40.7 ppt was found out as 50% survival limit at 10th day. The variation between these two reports may be due to the difference in size of test animals used and differential experimental conditions. The present study has revealed that P. indicus juveniles survive well in salinities between 3.9 and 40.7 ppt. Lakshmikanthan (1982, M.Sc. Disst., Cochin Univ. Sci. & Tech.) observed 5-40 ppt salinity as the survival range for postlarvae of P. indicus. From the present study it may be said the juveniles of same species are more resistant than postlarvae.

68
pH : In the present study pH 8 was found out as the 100% survival limit for juvenile P. indicus in experimental condition. After 2 days the pH tolerance limit was 5.2-8.3. Results obtained by Sarada (1984, M.Sc. Disst., Cochin Univ. Sci. & Tech.) indicated the pH range 6-9 is not directly affect the postlarvae. But the lower pH range observed in the present study for juveniles may be related to the differential laboratory conditions.
From the present study, extreme alkaline pH was also observed as lethal to the juvenile P. indicus. Survival rate of juvenile P. indicus decreases with increase in pH from 8. As the reports pertaining to this work are scanty, the present observation cannot be compared directly.
Temperature : Zein - Eldin and Aldrich (1965, Biol. Bull. mar. bid. Lab., Woods Hok, 129 (1) : 199-219) observed that the growth of Penaeus aztecus was not affected by salinity except at extreme temperature. Kuttyamma (1980, loc. cit.) observed that the three species of juvenile penaeid prawn viz. P. indicus, Metapenaeus dobsoni and M. monoceros were having different lethal limits in different salinities. The ranges of temperature tolerated by each species vary depending on the size of the individuals and the salinity in the medium. From the present study 50% survival was observed at 35.1°C for juveniles at 20 ppt. But Kuttyamma (1980, loc. cit.) observed 50% survival at 34.5°C in 20 ppt sea water. The difference between these two reports for P. indicus at salinity 20 ppt may be due to the differential acclimation temperature, size of animals used and other experimental conditions.
Oxygen : The work of Subramanyan (1963, Curr. Sci., 32 (4): 165-166) established a relationship between body weight, oxygen consumption and lethal dissolved oxygen level of the prawn P. indicus. Oxygen consumption and lethal dissolved oxygen levels of the prawn P. indicus varied directly with body weight. Kramer (1975, Proc. Sixth Annual Meeting World Mar. Soc, pp. 157) found out the lethal dissolved oxygen concentration for juvenile P. aztecus. According to him the lethal dissolved oxygen concentration for juveniles appear to be affected by sudden

69
salinity changes. Kutty (1971, Mar. Biol, 11 (2) : 125-131) observed the routine oxygen consumption of very young juveniles of P. indicus was significantly influenced by ambient temperature and weight of the animal, but not by ambient salinity. In the present study the observations were made keeping the size of species, salinity and temperature of the test medium constant. The medium tolerance limit was found to be 0.45 ml/1 at salinity 20 ppt and temperature 28°C. 100% mortality observed in 0.36 ml/1.

CMFRI Spl. Publ, 1993; 54 : 70 - 73 15
ON THE DISTRIBUTION AND ABUNDANCE OF FRY AND JUVENILES OF A FEW CULTIVABLE FISHES IN RELATION TO CERTAIN ENVIRONMENTAL
PARAMETERS AT COCHIN
JOYKRISHNA J E N N A S . S I V A K A M I
Research Scholar Supervising Teacher
Introduction
Availability of adequate quantity of fish seed of the desired species at the appropriate time is one of the prime factors that determine the success of their culture operations. Majority of seeds used for brackishwater fish farming is still collected from natural sources. So the present investigation on the availability of fry and juveniles of cultivable finfishes and their quantitative abundance in time and space, therefore would enable us to have better understanding of seed resources and their timely exploitation in desired quantities.
Objective
The main objective of this study is to obtain the accurate information on the distribution and abundance of fry and juveniles of cultivable fishes in relation to environmental parameters in Cochin Backwater and the intertidal water of the sea in the vicinity of Cochin.
Material and methods
The investigations were made at four selected stations : Station I at Karuthedam representing backwater system; Station II at South Puduvyepu; Station III at North Puduvyepu both representing estuarine system and Station IV near Vypeen light house representing intertidal area of the sea. The materials for study were collected from February to September 1989 at fortnightly intervals, on every full and new moon days. At Station III, collections were made only from May onwards.

71
A hapa net (1.8 x 1 m mouth & 1 m length) was used for collection of fry. A surf net was also used as a secondary gear. The gear was operated for 30 minutes at each station and it was considered as one unit effort. Juveniles were collected by operating a cast net of diameter 5 m with a mesh size of 8-10 mm. The collected samples were preserved in 5% neutral formalin for further analysis.
Water samples were collected using a plastic bucket. Hydrographical parameters (temperature, salinity, dissolved oxygen, pH) and inorganic nutrients (nitrite, nitrate, phosphate, silicate) were monitored. The rainfall data of Cochin was collected from the daily weather report of Bharat Mausam Vibhag, Indian Meteorological Department.
Phytoplankton samples were collected by filtering 100 litres of water through bolting silk net (mesh size 0.069 mm). The samples were preserved in 5% formalin and later analysed with the help of the Sedgwick rafter cell. Zooplankton samples were collected by towing a 30 cm diameter plankton net (mesh size 0.3 mm) for a distance of 25 m. The different zooplankton groups were sorted and counted with the help of zooplankton counting tray.
Diurnal studies were carried out at Station II and III. Sampling was done on the last calendar day of July at every three hours interval, starting from 0900 hrs in Station II, 1000 hrs in Station III and contined till the same time the next day. Tidal amplitude was also recorded.
Results and discussion
The rainfall data collected indicated that Cochin and its adjacent areas received a total rainfall of 2270 mm during the study period. Maximum rainfall (472 mm) was observed during the first fortnight of June followed by the second fortnight of July (375 mm). The hydrographic parameters and the inorganic nutrients were directly affected by the rainfall. While the temperature and salinity values decreased, the concentration of nutrients increased sharply with the onset of monsoon. The

72
dissolved oxygen concentrations ranged from 1.93 ml/I to 5.88 ml/1 pH was on the alkaline side throughout the period of study. Concentration of phytoplankton and zooplankton reduced during the monsoon period.
Of the cultivable finfishes, the fry of Liza parsia, Mugil cephalus, Chanos chanos and Megalops cyprinoides were observed at the stations. Fry abundance was more at stations II and III. This may be due to the proximity of these stations to the barmouth. L. parsia was the most dominant species followed by L. tnacrolepis and they were observed throughout the study period. Fry of M. cephalus was observed at all the stations except station I during June-August. At stations II and IV the fry of C. chanos and M. cyprinoides were observed during March-April and February-June respectively. M. cyprinoides was totally absent from Station I. Nine species of juveniles were recorded and they were more abundant during the premonsoon season. L. parsia and- L. tnacrolepis were the dominant species and together they formed 90% of the juveniles.
A correlation of the distribution of fry in time and space with hydrobiological parameters indicated that salinity had a great influence on their distribution directly and indirectly. The fry of L. parsia and L. macrolepis were abundant during the premonsoon when high salinity condition favoured rkh plankton production. The fry of M. cephalus was recorded during June - August when the temperature and salinity values were comparatively low. Fry of C. chanos were observed at Stations II and IV when salinity and temperature values were high. Thus the presence of all the species along with larvae of M, cyprinoides during the premonsoon season appears to be directly influenced by salinity, temperature and distribution of phytoplankton and zooplankton.
The distribution of juveniles also varied considerably with time and space. Juveniles of L. parsia and L. macrolepis occurred throughout the year with maximum abundance during premonsoon. Juveniles of V. cunnesius, M. cyprinoides, M. cephalus and C. chanos were observed only after the onset of monsoon

73
indicating a possible migration of these species to this ground during monsoon. Salinity and occurrence of phyto and zooplankton favoured the distribution of juveniles. Station I had poor distribution of juveniles when compared to Stations II and III. This may be due to the low saline and low concentration of phyto and zooplankton. On the other hand, the highly turbulent water during the monsoon and the highly dynamic nature of the intertidal zone due to wave action, creating an unstable habitat may be the cause for the minimal distribution of juveniles at Station IV.
The tides had a profound influence on the different hydro-graphical parameters, nutrients, concentration and abundance of phytoplankton, zooplankton, fish fry and juvenile populations. While salinity and pH showed a direct relationship with tide, the nutrient concentration showed an inverse relationship. Dissolved oxygen content was not influenced by the tidal amplitude. The phytoplankton concentration had a direct relationship with more numbers during high time. Qualitatively, marine forms dominated during high tide and freshwater algae during ebb tide. Maximum number of zooplankton occurred during the incoming and receding tide and minimum during highest high tide and lowest low tide. The fry showed a similar relationship with tide, but the distribution of juveniles was inversely proportional to the tide. The juveniles were abundant during lowest low tide. This may be due to the shrinkage of water body and presence of higher concentration of juveniles per unit area than during high tide. Maximum numbers were caught during early morning hours. Abundance was found to be independant of other parameters. To sum it up, it was found that the tide was the key factor controlling the distribution of juveniles.

CMFRI Spl. Publ, 1993; 54 : 74 - 77 16
STUDIES ON SALINITY INDUCED STRESS ON NEUROSECRETORY CELLS, PROTEIN, FREE AMINO ACID CONTENT AND
AMMONIA EXCRETION RATE OF PENAEID PRAWN METAPENAEUS MONOCEROS (FABRICIUS)
R. KAMALA A. D . DIWAN Research Scholar Supervising Teacher
Introduction
Estuarine crustaceans living in an environment of varying salinities, face great osmoregulatory problems. Presumably, such animals could either possess well developed osmoregulatory powers or lacking these they move on to favourable environment. Those organisms surviving in such demanding conditions have evolved adaptations to meet the variability. Such organisms maintain stable osmotic pressure of blood and cells with changing external salinities either by extracellular anisosmoHc or intracellular isosmotic regulation.
The present study was initiated to understand the physiological mechanisms involving the amino acid and protein regulation, that might account for the success of the species acclimatisation to changing salinities. Therefore in the present investigation, an attempt was made to study the sudden effect of osmotic stress on neurosecretory cells of different neuroendocrine masses, protein and free amino acid content of haemolymph, muscle and hepatopancreas and the ammonia excretion rate of the prawn Metapenaeus monoceros.
Material and methods
Two sets of experiments were conducted in the present study. In the first set, low saline acclimatised prawns, were transferred to high saline medium and in the second set, high saline acclimatised prawns were transferred to low saline water. The effect of sudden salinity variation was then studied by

75
determining the organic constituents namely, protein and TFAA in the haemolymph, muscle and hepatopancreas and also the ammonia excretion rate of the prawn. Similar experiments were also conducted on isolated muscle tissue. The changes occurring in neuro-secretory cells in response to different osmotic environment were also studied. The results obtained in the present investigation are summarised below.
Results and discussion
Ammonia : In prawns transferred from low to high saline water (35%o) the ammonia excretion rate showed a decreasing trend and the excretion rate was reversed, when prawns acclimatized to high saline water (35%o) were transferred to low saline water (5%c).
In isolated muscle tissue, ammonia excretion rate showed significant decrease and remained low till the end of 12th hr in high saline water (35%o). On the other hand when transferred from high to low saline water (5%o), ammonia excretion rate showed an increasing trend and remained high throughout the experimental period.
Total free amino acid (TFAA): TFAA in the haemolymph of whole prawn increased significantly when transferred to high saline water (35%o). Whereas, on transferring prawns from high to low saline water (5%) the TFAA content decreased significantly. TFAA content in the muscle of prawns exposed to high saline water (35%o) showed a significant increase throughout the experimental period. Whereas, in prawns exposed to low saline water (5%o) significant decrease was observed only during 12 and 24 hrs of experimental duration. TFAA content in the hepatopancreas of prawns exposed to high saline water (35%o) increased significantly. Whereas, in prawns exposed to low saline water (5%o) significant decrease was more pronounced after 12th hr.
In isolated muscle tissue, TFAA content showed significant increase when exposed to high saline water (35%o). On the other hand, it decreased significantly when transferred from high to low saline water (5%o).

76
Protein : In the prawns transferred to high saline water (35%o), the protein content of haemolymph showed a decreasing trend and remained low during the experimental period. On the other hand, in prawns transferred from high to low saline (5%o) water haemolymph protein showed an increasing trend throughout the time of experiment. The protein content of muscle in prawns transferred to high saline water (35%o) showed significant increase only during 24 and 48 hours. But, in prawns transferred to low saline water (5%o) the protein content showed a decrease which was more prominent during 24 and 48 hrs. The protein content of hepatopancreas showed an increasing trend in prawns transferred to high saline water (35%o). Whereas, in prawns transferred to low saline water (5%o) protein content decreased significantly after 12 hrs and the decrease continued till 48th hr.
The protein content of isolate muscle tissue transferred to low saline water (5%o), however, showed a transitory increase upto 8th hr. When transferred to high saline water (35%o) it showed a decreasing trend throughout the period of experiment.
Neurosecretory cells : Prawns transferred from low to high saline water showed decreased activity in their neurosecretory cells when compared to prawns transferred from high to low saline water. Only giant cells and type A cells of different neuroendocrine masses exhibited response. In other cells response was not that pronounced.
Prawns transferred from high to low saline water showed increased activity in their neurosecretory cells. Here also only the giant cells and type A cells exhibited response and response by other cell types were not that pronounced.
The results obtained in the present investigation illustrate a significant role played by TFAA, protein and ammonia excretion to fulfill the osmoregulatory needs of the animal. The variations showed increased mobilisation of protein in the form of FAA from the tissues to haemolymph thereby, resulting in a decrease in the TFAA content of tissues and an increase in haemolymph protein and also accelerated catabolic activity of

Tl
the amino compounds under hyposmotic condition. The possibility of reverse process during hyperosmotic stress is also predicted i. e. mobilisation of protein from haemolymph to tissues resulting in a rise in the level of TFAA and protein in the tissues and a fall in the protein level in the haemolymph, concomitant with decreased catabolic activity of the amino compounds. The isolated muscle tissue also achieved cell volume regulation in a similar way by modifying the amination and deamination activity of amino compounds. Moreover, the observations made on the changes occurring in different neurosecretory cells implicate that neuroendocrine factors may have some role in the control of osmoregulation.

CMFRI Spl. Publ, 1993; 54 : 78 - 84 17
STUDIES ON A MANGROVE HABITAT DOMINATED BY BRUGUIERA SPP.
JosiLEEN JOSE M . S. RAJAGOPALAN Research Scholar Supervising Teacher
Introduction
Mangrove areas serve as an ideal nursery ground for a number of species of finfishes and shellfishes and often protect the coastal area from sea and soil erosion. The occurrence of the mangrove Bruguiera in the Cochin estuarine system was noticed only recently. The present investigations on morphological characters, distribution pattern, tree density, phenology, germination and growth of seedlings and other ecological parameters such as physico-chemical properties of the soil and tidal water in the area were undertaken with the objective of understanding various ecological aspects of the habitats dominated by the above species. The rate of accumulation of mangrove litter and its decomposition, occurrence of juveniles of many species of prawns and fishes were also taken into account.
In the Cochin estuarine system the habitats dominated by B. cylindrica belonging to Rhizophoraceae were identified. Bruguiera zone is generally seen progressing landward. Trees of the genus Bruguiera develop on more heavy sediment (Silty clays) at the level of high water of spring tides.
Material and methods
A preliminary survey was undertaken and stations were fixed at Murukkumpadam (Station 1 & 2), Puthuvypeen (3) Narakkal (4) and Panambukadu (5). Regular sampling was conducted from April to September 1989 and materials and data were collected from sites between 0800 to 1200 hrs on every fullmoon and newmoon day. Stations (1) and (2) were selected for diurnal variation studies.
79
Hydrography : The rainfall data were collected from the daily weather report of Bharat Mausam Vigyan Vibhag, Indian Meteorological Department. Surface temperature of water was measured on the spot using a mercury thermometer of 0-50°C range. Salinity of the water sample was estimated by Mohr-Knudsen method as described by Strickland and Parsons (1968, Bull. Fish. Res. Bd. Canada, 167 : 311 pp). The dissolved oxygen content of the water sample was estimated by the modified Winkler technique (Strickland and Parsons 1968, loc. cit.). pH of water sample was measured using a digital pH meter.
The inorganic nutrient content of the water sample such as nitrite, nitrate, ammonia, phosphate, silicate and chlorophyll a, b and c were estimated as described by Parsons et al. (1984, A manual of chemical and biological methods for seawater analysis. Pergamon press, Oxford. 283 pp).
Soil : pH and Eh of soil were estimated using century digital pH meter with respective electrodes in the wet condition itself. Cation exchange capacity of soil was estimated by Versene method as described by Jackson (1973, Soil Chemical analysis. Prentice Hall of India, New Delhi. 498 pp). Available phosphorus in the soil was calculated by modified Olsen's method, following Khanna (1979, Practical manual for introductory courses in soils. HAU Press, Hissar). Nitrate was estimated spectrophotometrically following usual procedure. Wet oxidation method of Walkley and Black (1934, Soil Sri., 37:29-38) was used to estimate organic carbon in the Soil. Grain size analysis of soil was carried out by hydrometric method.
Phenology : Parameters relevant to phenological studies were estimated by observing the percentage of shoots, bearing different stages like buds, full flower, fruit and mature seedling during different months.
Estimation of tree density : Tree density in the site was estimated by enumerating the number of trees and their diameter at breast height of small trees and through trignometrical ratios in the case of tall trees.

80
Litter : Mangrove litter was collected fortnightly from fixed quadrants of size 1 m^ and the com|x>nents were seperated manually and percentage in the total dry weight was calculated.
Biological parameters : Qualitative observations of phytoplankton and zooplankton were made by analysing the collected samples using velon screen with a mesh size of 0.069 mm and 0.3 mm respectively. A castnet was operated for the study of juveniles of fishes and prawns.
Decomposition experiment : After drying the mature leaves constantly in the oven at 70°C, 10 gm of dry material was placed in litter-bags of size 10 x 15 cm made of nylon mosquito net. Bags were kept immersed in brackishwater collected from the sites and the rate of decomposition was estimated every week by weighing the material removed from these bags.
Germination experiment : The mature propagules were planted in troughs, using the soil collected from respective sites. The troughs containing the seedlings were placed close to a glass window receiving diffuse sunlight for most part of the day. Watering was done with brackishwater collected from mangrove creeks. During night no artificial light was used. The progress in the growth was observed weekly. Simultaneously with this experiments propagules were planted in the sites and the percentage of survival and growth were observed.
Results and discussion
A detialed study of the ecological conditions in the habitats dominated by the mangrove Bruguiera was the main objective of this work. As regards the structure and zonation of the species, variation were noticed in different stations. Since the tidal amplitude is weak in Cochin estuarine system, zonation of this species was not distinct. In Station I, the Bruguiera cylindrica stands are not very old and they range in height from 2 - 8 metres. This region is connected in the tidal water system of Cochin Backwater, the tidal flow in the creeks is weak and the amplitude is low. Station II is also in the same area, but closer to the main feeder canal in the western side. In station

81
III, the drainage in the tidal canal is good. In Station IV, the location of Bruguiera in small stands were chosen for comparative studies and the tidal flow is more effective than above three stations. In station V (in Vallarpadam) the Bruguiera stands are older and occur closer to the adjacent backwater.
Structure and zonation of Bruguiera stands : The Bruguiera trees in station I and station II were measured for their actual height and tree diameter. The trees with heights of 6 m had the maximum frequency and young plants of 1 m height had the lowest frequency. The mean diameter for different classes of tree height showed direct co-relation. The older trees of height greater than 7 m have the mean diameter of 7.47 cm and the younger plants of 1 m average height had a mean diameter of 1.10 cm. The Bruguiera stands occur in slightly elevated well drained soils. The frequency of diurrial tides reaching these stations, are less than 8 days in a month (Spring tides).
Climatic condition : During premonsoon (1989), the total rainfall was 114 mm and during monsoon months 1792 mm. The second fortnight of June received 497 mm rainfall and this value tapered off during August. Intermittent rains continued during September and October also.
Hydrography : In all stations, temperature, salinity, dissolved oxygen, pH values were more during premonsoon months. With the onest of monsoon, these values showed a decreasing pattern. In station I, water temperature varied between 27.5°C and 31.0°C, in Station II between 27.5°C and 31.5°C, in Station III, 28.5''C and 32.5'='C and in station IV and at Panambukadu between 28.0°C and 30.0°C. The highest temperature was recorded in May in all the stations. The water pH ranged from 7.03 to 8.60 in the five stations during the study period. Salinity values showed a maximum during pre-monsoon months in all the stations. The values varied between 31.5%o and 0.8%o.
The nitrite values were not high and it was more during July - August and no correlation was found between nitrite and nitrate in their occurrence. The nitrate values were higher during monsoon period, as it reveals the noticeable impact of

82
rainfall and discharge over its variation. Ammonia reading were more during May-June at Murukkumpadam, where the dominant vegetation was Bruguiera. Phosphate values were high during June to August first week. Silicate readings showed a uniform dominance in all the stations, during July to August middle, due to more land drainage over that period.
Diurnal studies did not show significant variation in parameters except in the case of temperature and dissolved oxygen.
Chlorophyll : In the present observation, the most dominant pigment was chlorophyll a, followed by chlorophyll c and Chlorophyll b. Since chlorophyll a is one of the major indices of the standing crop of phytoplankton, the estimation of this pigment will give a general idea of the variation in the magnitude of production. Distribution of total chlorophyll (a+b+c) was similar to chlorophyll a being maximum in June and minimum in April, at first three stations.
At Murukkumpadam and Puthuvypeen the chlorophyll a values were recorded maximum during May-July and during last fortnight of September. Chlorophyll a readings varied between 6.634 mg/m^ and 199.166 mg/m^ Chlorophyll b readings have shown a lower range between 3.85 mg/m^ and 45.74 mg/m^ Chlorophyll c reading were shown a higher range than chlorophyll b and values were fluctuating between 84.114 mg/m^ and 7.617 mg/ml
Soil : Soil pH varied between 6.75 and 8.15 in all the stations. The Eh readings have shown drastic change over the period and it was high during most part of the study period. This may be due to more aeration of the soil. Available phosphorus readings showed a similar pattern in first two stations i. e. highest value recorded during first fortnight of June and lowest reading during August first fortnight. The available nitrate content varied between 2.5175-5.6425 jig at/g. Organic carbon content of the soil varied between 1.452% and 2.599% and highest reading was recorded in May first fortnight.

83
Floral phenology : Horal phenology have shown similarity to work done by Wium-Anderson and Christensen (1978, Aqua. Bot., 5 : 383 - 390). The maximum number of flowers observed during August - September and the propagules started its appearance during January-February. In the present study the propagules took 7-8 months to reach a mean length of 14.5 cm before they dropped to the ground. In their studies the propagules reached a length of 15.7 cm and the total development time was 7-8 months.
Litter and decomposition : Leaves constituted the largest component, occurring for 48.78% of the total weight followed by fruits (35.15%) and twigs (16.07%). Maximum litterfall was observed during the premonsoon period. The total litter production during the study period was 3835 gm in dry wt/m^.
The litterfall will inevitably influence the supply of detritus available to consumers in the mangrove and shallow water coastal ecosystem. In this present observation, in Bruguiera station, the total flushing is very less, so that only a little part of litter has washed away. However the accumulated litter was flushed out by monsoon rainfall.
The decomposition of litter is an important stage in its utilisation in the estuarine system. In the experiments conducted in the laboratory the rate of decomposition of Bruguiera leaves were rapid during first two weeks. More than 50% of the total weight was reduced during the first month. Thereafter the rate of degradation was very less (20-25% of the original weight).
Phytoplankton and zooplankton : Different species of phytoplank-ton observed in the mangrove creeks during the present investigation include Coscinodiscus, Nitzschia, Navicula, Pleuro-sigma, Gyrosigma, Thalassiosira, Nostoc, Anabaena and Oscillatoria. During premonsoon Coscinodiscus was the dominant one followed by Nitzschia, Navicula and Peridinium. During monsoon, Oscillatoria and Nostoc were also found in good numbers along with those species.

84
Among zooplankton copepods and decapod larvae (Crab zoea, postlarvae of both penaeids and non-penaeids) formed the major groups during premonsoon period. During monsoon season cladocerans and after August amphipods were also seen in zooplankton.
Larvae and juveniles : Seasonal fluctuation was observed in the abundance of juvenile fishes and prawns. The maximum number was recorded during the premonsoon season. Their abundance declined during the monsoon season and continued through the early postmonsoon. Prawns were the major component of the juvenile catch and the important species were Penaeus indicus, P. monodon, Metapenaeus dobsoni, M. monoceros and Macrobrachium idella. Among the finfishes juveniles of Liza parsia, L. tnacrolepis, Etroplus maculatus and Ambassis gymnocepha-lus were noticed in good numbers. Among crabs, Sq/lla serrata was collected throughout the study period in few numbers besides the mangrove fiddler carb iUca spp.) which occurred in large numbers.
Mangrove ecosystem is not subjected to much disturbances as in the estuaries. The substratum is fine silty mud and the salinity is relatively less than the estuaries. The abundance of mangrove foliage and relatively small number of predators and other harmful organism provide necessary protection and all other factors being more or less similar to those of estuaries and hence this ecological niche forms ideal nursery ground for the juveniles.
Germination experiment: Growth of Bruguiera cylindrica seedlings under laboratory conditions showed that 70% of the seedlings were in primordial stage by the end of first week, after the commencement of the experiment. By the 4th week maximum seedlings had grown upto three leaf stage, by the end of 8th week dominated percentage was in four leaf stage, by 12th week in six leaf stage and by 16th week eight leaf stage and by the completion of 20th week maximum percentage were found to be in ten leaf stage. The success of laboratory experiment shows that we can adopt nursery rearing of Bruguiera plants without much difficulty.

CMFRI Spl. Pubi, 1993; 54 : 85 - 93 18
AN ANALYSIS OF FACTOR - PRODUCT REALATIONSmP IN PRAWN FARMING : A PRODUCTION FUNCTION APPROACH
AjiTH KUMAR, V. K. K. P. PANIKKAR
Research Scholar Supervising Teacher
Introduction
The stagnation of the yield of penaeid shrimps from the sea inspite of the increasing demand and efforts of capture has made it imperative to seek alternative methods of prawn production like culturing them along the coastal area.
In Ernakulam District where there is a greater concentration of prawn farms, much efforts have been made by Central and State Government agencies to encourage the adoption of scientific prawn farming to improve production. In spite of all these efforts, the extent of adoption of semi-intensive prawn farming practice is not upto the satisfactory level. In this context, it is essential to analyse the relative advantages of introducing improved practices in terms of economic feasibility in field situations. The present study which aims at analysing the economics of semi-intensive prawn farming being practiced in Kerala, could provide a feed back information on the profitability of the culture practice in field situations and also on the allocation efficiency of the inputs used in prawn farming. This will help to provide basic informations on the economic feasibility of the existing technology and to correct the imbalances in resources utilisation.
Material and methods
The explanation of output variation through a production function requires data collected from a sufficiently large number of farms to allow the reliable estimation of parameters. A sample size of 30 was established in this study and the farms were

86
selected on a random basis from villages in Ernakulam District such as Tripunithura, Maradu, Edavanakkad and Panangad.
The data on inputs, output, prices and costs and also socio-economic condition of the farmers were collected from the farmers by personal interview.
The model used for production function analysis is a general form of Cobb-Douglas production function which is given as : Y = a x^" x ^ X2'' x^^^ x^" Xg* . Where Y is the dependent variable (product) m Xj through x are the explanatory variables (factors), 'a' is a constant and 'b' values are the regression coefficients for respective factors Xj to Xj. The explanatory variables used in the function are land area (Xj), seed (x^), feed (Xj), fertilizer (x ) and Labour (x ).
The physical relationship between the inputs and output is established through the estimated Cobb-Douglas production function. Then the marginal analysis is employed to evaluate the producer behaviour.
Results and discussion
Socio-economic analysis : Before selecting the families to bring under the study of input-output relationship in prawn farming, a comprehensive socio-economic survey was conducted covering the sample families.
The average size of the family of all the farmers was worked out at 6.5. Adult males formed the largest percentage of the population, 39%. Adult females formed 25%. The percentage of literacy was 100% in the sample families. Among children in the age group of 5 - 18 years, 98% were School/ College going. In this area, prawn farming is the main occupation for most of the families involved in it. Most of them have been traditionally indulged in paddy-cum-prawn culture. The average annual family income from sources other than prawn farming was worked out at Rs. 6,240/-. About 60% of the dwelling houses were concrete or tile roofed. 50% of the farmers were having more than 10 years experience and about 37% less than 5 years.

87
Economics of prawn farming
The level of production from a pond depends on the efficiency of various inputs used in the pond such as seed, feed, fertilizer, labour, etc. To study the input-output relationship, the costs of these inputs were worked out.
Production : The average number of seeds stocked in the farms was 20413/ha. The unit price of the seed was calculated at Rs. 32.02/1000. Thus the amount spent on seed on an average in all the 30 farms was Rs. 654/ha.
The average quantity of feed used was 467 kg/ha. The average cost of the feed was Rs. 4.63/kg. Thus the amount incurred on feed on an average was Rs. 2,162/ha.
For the last crop, the average quantity of fertilizer used was 234 kg/ha, with an average unit price of Rs. 105/kg. Hence the average amount incurred on fertilizer on all the farms was Rs. 246/ha.
The average quantity of toxicants used in the farms was 156 kg/ha, with an average unit cost of Rs. 1.41/kg and the average amount incurred on toxicants was Rs. 220/ha.
In larger farms, the farm activities were usually carried out by hired labour and the cost incurred on labour was high. While in smaller farms, much of the work was done by family labour. Since all the adult males in the working force are engaged in farming activities throughout the duration of the crop, family labour was also calculated as 150 mandays for every adult male in the family. The labour was calculated in terms of mandays of 8 hours. The average labour used per crop in the farms was 169 mandays/ha. The wage rate per manday was fixed at Rs. 40/- and the cost incurred on labour on an average was Rs. 6,760/ha.
The lease value of the land holding and the capital on the amount spent on the preparation of the pond construction of sluice gate, purchase value of nets and other inventory of assets
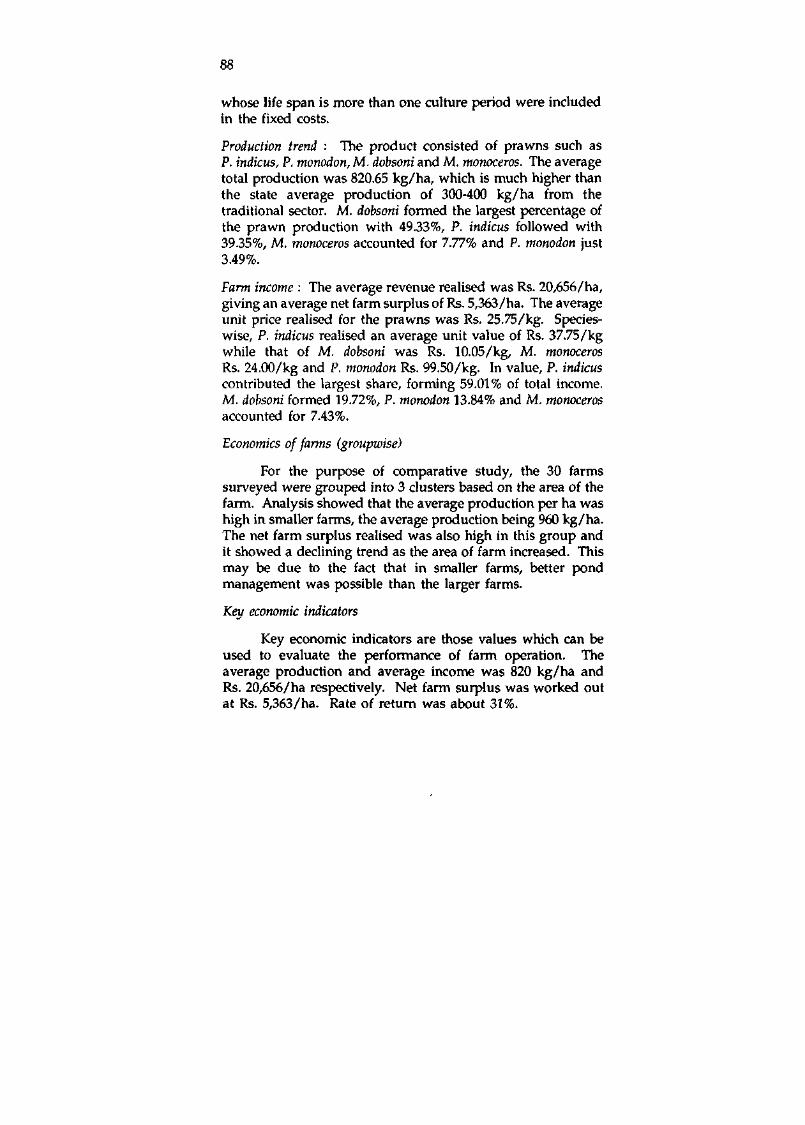
88
whose life span is more than one culture period were included in the fixed costs.
Production trend : The product consisted of prawns such as P. indicus, P. monodon, M. dobsoni and M. monoceros. The average total production was 820.65 kg/ha, which is much higher than the state average production of 300-400 kg/ha from the traditional sector. M. dobsoni formed the largest percentage of the prawn production with 49.33%, P. indicus followed with 39.35%, M. monoceros accounted for 7.77% and P. monodon just 3.49%.
Farm income : The average revenue realised was Rs. 20,656/ha, giving an average net farm surplus of Rs. 5,363/ha. The average unit price realised for the prawns was Rs. 25.75/kg. Species-wise, P. indicus realised an average unit value of Rs. 37.75/kg while that of M, dobsoni was Rs. 10.05/kg, M. monoceros Rs. 24.00/kg and P. monodon Rs. 99.50/kg. In value, P. indicus contributed the largest share, forming 59.01% of total income. M. dobsoni formed 19.72%, P. monodon 13.84% and M. monoceros accounted for 7.43%.
Economics of farms (groupwise)
For the purpose of comparative study, the 30 farms surveyed were grouped into 3 clusters based on the area of the farm. Analysis showed that the average production per ha was high in smaller farms, the average production being 960 kg/ha. The net farm surplus realised was also high in this group and it showed a declining trend as the area of farm increased. This may be due to the fact that in smaller farms, better pond management was possible than the larger farms.
Key economic indicators
Key economic indicators are those values which can be used to evaluate the performance of farm operation. The average production and average income was 820 kg/ha and Rs. 20,656/ha respectively. Net farm surplus was worked out at Rs. 5,363/ha. Rate of return was about 31%.

89
Key economic indicators
Average Production/ha
Average Income/ha
Profit/ha
Rate of return on investment
Rate of return on operating cost
Production / manday
Labour required/kg of Production
Production/kg of feed
Amount of Feed/kg of production
Number of seeds/kg of production
Cost of production per kg of Prawn
Value realised per kg of Prawn
820.65 kg/ha
Rs. 2a656/ha
Rs. 5^63/ha
31%
53%
4.85 kg
0.21 mandays
1.8 kg
0.57 kg
25
Rs. 12.23
Rs. 25.17
Production function
The estimated equation obtained by Cobb-Douglas production function is :
Y = 11.3158 4).0289 V 0.1266
R2 = 94%
0.3108 0.0126 0.2124
In this equation, the input seed has a statistically significant coefficient of 0.1266 which indicates that a 1% increase in seed used from the mean level would bring forth an addition of 0.127% to the total output. Similarly in case of feed, a 1% increase in quantity of feed used would add to the total output by 0.31%, 1% increase in mandays used would bring forth an addition of 0.212% to the output and in case of fertilizer the production elasticity was insignificant at 5% level. The coefficient of farm area is negative, indicating that an increase in farm area would reduce the total output per hectare. The coefficient of determination (R ) is 94% which indicates that 94% of the variation in the total output is explained by variables included in the equation.

90
Marginal value productivity (MVP)
The marginal value product of a particular input represents the expected addition to the gross returns by an addition of one unit of that resources while all other inputs are held constant. The marginal value product was computed by multiplying marginal physical product (MPP) with product price.
Economic efficiency of resource utilisation
In order to evaluate the economic efficiency of farmers as users of inputs, the MVPs of input factors were compared with their respective acquisition costs. Profit is maximum when the value of marginal product of certain input (MVPx) is equal to its price (Px)
i. e. when MVP^ = Px (1)
But, MVP, = MPP, X Py (2)
MVP, and MPP, are the marginal value product and marginal physical products of input x, P, the price of input and P price of the output Y.
P. i. e. MPP, = (3)
That is, profit is maximum when MPP, is equal to price ratio of input and output.
Y But, MPP, = b. — (4)
X
Where V is regresion coefficent and "x, y are the mean values of input and output.
b.Y P, Hence = —^r (5)
X P.

91
The optimum level of input use for maximising profit is calculated by substituting the values of b, y, P and P in equation (5) and solving for X. The ratios of MVPs of different inputs with their respective acquisition costs were calculated. A ratio more than unity indicates that the returns could be increased by using more of that resource and less than unity indicates the unprofitable level of resource which should be decreased to minimise the loses.
Among those inputs for which production elasticities were significant; for seed and feed, the MVPs were much higher than their respective acquisition costs indicating that the use of the inputs can be increased to increase the net returns. However, the MVP of labour was only 26.54 as compared to its acquisition cost of 40, which means that utilisation of one more manday of labour for mean level would also add to the total revenue only Rs. 26.54 whereas total cost would be increased by Rs. 40/-. This indicates that labour used per hectare has to be reduced to increase the profit from the farm. The excess utilisation of labour days in the farms is mainly due to the engagement of family labour for which the opportunity cost in this region is comparatively nil.
The present study revealed that the inputs such as seed, feed and labour were not used to the maximum profitable level. The average number of seed stocked/ha was calculated at 20413 while a stocking density of 83500/ha can be had under present conditions to increase returns. The average quantity of feed used was 467 kg/ha, while a quantity of 1417 kg/ha was found to give maximum profit. The optimum level of labour required for one crop was worked out at 112 days/ha as against 169 mandays already engaged for one crop indicating a major problem of disguised unemployment among the farmers. By substituting the above optimum values of inputs in production function equation, the optimum level of production is estimated at 1268 kg/ha.
The level of production is optimum or in other words, is most profitable level only with given technology, given level of

92
input and output price and also given level of natural productivity. However, it can be increased by using more efficient feed and better pond management.
The under-utilisation of feed and seed is mainly because of its nonavailability. Hence for overall development of prawn farming sector, it is essential to provide farmer with adequate quantity of suitable seeds and effective feed through public agencies at reasonable prices.
Input requirements
At present in Kerala, about 8000 ha is under culture and by 1991 another 1500 ha is proposed to be developed. Assuming that the above 9500 ha is to be developed under semi-intensive farming, with the prices of both inputs and output remaining the same, the requirements of major inputs such as seed and feed used to the maximum profitable level; are given below :
Seed : As indicated in the study, the optimum level of seed to be used to maximise returns is 83500/ha per crop. Assuming that only one crop is raised per year, in 1991, the requirement of prawn seed in Kerala will be 793.25 million.
Feed : With the efficacy of available feed being used at present, the optimum level of feed to be used is 1417 kg/ha. So the total requirement of feed for 9500/ha will be 13.46 million kg. This indicates the bright prospects of aquaculture feed formulation factories in the State, which are at present practically nil.
Employment generated : The maximum profitable level of labour is 112 mandays/ha. So if 9500 ha is to be developed under the same system, 1.06 million mandays will be generated per each crop.
The traditional prawn culture of Kerala is being slowly replaced by semi-intensive method of prawn cultivation. This can be accelerated by creating proper motivation among the farmers through well organised extension services and removing financial constraints by establishing links with rural funding agencies. It is all the more essential to provide the major inputs

93
such as good quality seeds and efficient feed to farmers in sufficient quantity at the right time so as to enable them to utilise these factors of production to the optimum levels. In this respect, along with research on biological constraints to production, economic studies also should be given deserved preference in areas of production and distribution and also optimum level of inputs to be used to maximise the profits.

CMFRI Spl. Publ, 1993; 54 : 94 - 98 19
A SAMPLING MODEL FOR THE ESTIMATION OF JUVENILE SHRIMP FISHERY OF VEMBANAD LAKE
M. K. ANIL K. NARAYANA KURUP Research Scholar Superuising Teacher
Introduction
Realising the importance of fishery resources in meeting the food requirements of the country, in recent times, developmental agencies have been paying serious attention for exploiting fish resources for the benefit of the population. Besides meeting the internal requirements, export of marine fish earns, to the nation, foreign exchange of about Rs. 630 crores currently. Export of marine products from the nation has been mainly concentrated on prawns and its products. However, in recent times it is reported that in spite of increased inputs in fishing, the production of prawns is not showing commensurate increase. Hence industry and developmental agencies are seized of the problem of increasing production and ways and means of conserving the resources is being discussed in various forums.
Vembanad Lake having an area of 256 sq. km, extends from Kodungallore in the north to Alappuzha in the south and is well known to be important nursery ground for many species of marine prawn. These species of prawns spend their juvenile stages in backwaters and on reaching pre-adult stage gradually move to oceanic regions. Traditionally these juvenile resources have been exploited inflicting juvenile mortality on these resources which otherwise would have supported a prominent marine prawn fishery of the country. Planning and conservation stratagies in respect of these species would needless to say, require quantified information on this aspect. At present there is no authentic information on the annual quantum of catches of these juveniles from these area. Hence a study was undertaken to evolve a scientific method of collection of data on the catches of juvenile prawns from Vembanad Lake area.

95
Material and methods
Vembanad Lake is connected to sea mainly at two places. Cochin and Azhikode. Although more than a dozen species of prawns are known to occur in the lake, species of major commercial importance contributing to rich fishing are Metapenaeus dobsoni, M. monoceros, Penaeus indicus and P. monodon. In general, the occurrence of prawns is fairly good in salt water side of the lake upto the barrage, but beyond this area they show sudden decline. Among those four species of prawns Metepenaeus dobsoni is the most dominant one occurring in the lake.
Various types of nets are made use of in the capture of prawns, but the stake net and dipnet catches are comparatively more abundant and account for a substantial part of the total.
Chinese dip net is a fixed balanced liner dipnet, located simply or in groups both along the shores and nearshore in shallow waters.
Free nets such as cast net, drag nets (Koruvala, Vadivala) Seine net (Pattikanni vala, Peruvala), drift net (Chemmeen vala), etc. are used. In addition, other methods such as canoe-trap fishing, scoop netting and hand picking, etc. are also used in capturing prawns.
Survey for enumerating fixed nets
For planning a pilot sampling design in the beginning of the investigation, a guide survey was carried out to enumerate the stake nets and dip nets operated in the area. A dingy made of fibre-glass fitted with 15 HP. Number and position of each type of net was noted down in the map available on hand. Survey was planned and conducted for 3 day, covering the area between Kodungallore and Thaneermukkam. The number so enumerated formed the basis of further investigation.
Data collection : On the basis of the number of nets operated and topography, the fishing area has been stratified into 7 strata (Zones). Since heavy concentration of nets is observed in zone

96
2 and zone 3, these two strata were selected for detailed investigations. From two strata 5 centres were selected proportionate to the number of operating units. Thus, one centre was selected at random from zone 2 and 4 centres from zone 3. From these selected centres, a few nets were randomly selected everyday for detailed investigations. The number so selected varied from centre to centre, but was kept constant in a given centre. The preliminary data were collected for a period of three months on a proforma.
The data were subjected to detailed statistical analysis as follows. To facilitate comparison between stations and between months, the catch per unit in respect of different species of prawns and fish was obtained by dividing the total catch by number of units operated.
Variances of different stations and months were estimated and its homogeneity is tested with Bartlett's Chi-Square. The catch per unit operation were statistically analysed to ascertain whether any linear trend existed in the population as we move from barmouth to interior areas. The existence of linear trend was ascertained by linear regression analysis by the method of least squares. Significance of trend was tested by 't'-test.
On the basis of the results obtained and some practical considerations, a pilot survey was planned and executed. Zone number 3 which has the maximum number of stake net was selected for detailed investigation.
A two stage sampling scheme was adopted with row of nets as Primary Stage Unit (PSU) and a net as Secondary Stage Unit (SSU),10% of PSU and within selected PSU, 20% of the SSU were selected for detailed investigation. The data collected in pilot survey were also analysed to evolve a suitable sampling design.
Dip net fishery : The dipnet fishery was not active during the period of study. However, the fishery resumed in September and data were collected on this fishery in September using a two stage sampling design. The entire region was divided into

97
clusters of nets on the basis of topography and also on the distribution of dipnet as arrived at by the initial survey. In the present study only dipnet available in zone 3 were considered. However extension to the entire lake area is straight forward.
In the zone concerned, however, the entire clusters were included in the sample. Within cluster nets were selected with a sampling proportion of 10%.
Results and discussion
Based on the survey the whole lake was divided into 7 zones and nets present in each zone is given in Table 1.
TABLE 1. Different zones, number of nets and their percentages in each zone
Zone
1
2
3
4
5
6
7
Total
Description
Kodungalloor to Mulavukadu
Mulavukadu to Venduruthy Bridge
Venduruthy to Perumbalam
Edacochin to Kumbalsingi
Arookutty to Vayalar east
Perumbalam to Vaikom
Vaikom to Thanneermukkam
Stake net Total No.
353
1184
4021
198
531
1576
240
8103
% 4.4
14.6
49.6
2.4
6.5
19.5
3.0
100
No. of rows
33
44
76
9
24
42
5
233
Dipnet Total No.
534
154
283
176
63
167
18
1395
% 38.3
11.0
20.3
12.6
4.5
12.0
1.3
100
Comparison of catch at different stations
The statistical analysis of the data by the analysis of variance showed that in general there was no difference between the cacth levels at different stations observed.

98
Homogeneity of variance
Homogeneity test, using Bartlett' s Chi-Square performed on the variance estimate showed significant difference over stations and month. In order to ascertain whether any linear trend existed in the levels of abundance of various species as we move from barmouth to south, regression analysis was performed on catch per net.
It could be seen that M. dobsoni in September exhibited a linear trend. However it might be mentioned that previous months were lean period for stake net fishery and therefore it is logical to assume the presence of this trend when the fishery is active. Also it might be mentioned that M. dobsoni determined the trend of total catch as this formed a major component. Hence a series of statistical analyses were attempted and this linear trend was assumed.
In the present study, stratification has been resorted according to the topography of the area and intensity of fishing activities. On the basis of the preliminary investigation, it has been found a stratified two stage design-geographical zone as stratum over space and month stratum over time. A zone-month therefore forms a basic stratum for sampling purpose. A row of nets is taken as the primary stage unit and within the selected unit a specifed percentage of the nets are selected as second stage units. In both stages the sampling is by simple random sampling without replacement. From the selected second stage units data have to be collected using a proforma. The scheme of sampling and method of calculation which will lead to reliable estimates of the characterisitic are elaborately analysed and discussed in the original Dissertation.
In the present investigation free nets were not covered due to paucity of time and resources. However it is suggested that the multistage random sampling design followed by CMFRI for estimating the marine fish landings can be fruitfully employed for estimating the catches by these nets.

CMFRI Spl. Publ, 1993; 54 : 99-104 20
SOIL CHARACTERISTICS IN THE CULTURE PONDS OF CHERAI IN VYPEEN ISLAND
M. P. REMESAN R. N . MISRA Research Scholar Supervising Teacher
Introduction
Since the yield of living resources from any water body is closely related to the primary productivity of the water, maintenance of a healthy aquatic environment thereby production of sufficient fish food organisms in ponds, are very important for successful culture operations.
The productivity of any water body is a function of the nutrient supply which is largely the result of sediment composition as well as variations in the surrounding land use and resultant run off. Soils have several roles with production of fish from ponds. It supplies nutrients to the overlying water, helps in the mineralisation of organic bottom deposits and it acts as a store house of nutrients. They also provide food and shelter for bottom dwellers.
The object of the present study is therefore, to have a basic knowledge of the soil characteristics of the culture ponds of Cherai, which is one of the most productive zones of Vypeen Island.
Material and methods
Nine prawn culture ponds were selected for the present study, representing Cherai village completely. Based on the duration of culture practices carried out, eight of them are seasonal and the other one is perennial. The seasonal fields are utilized for paddy cultivation during May-October and for prawn culture during November to April. Although the culture practices carried out in these fields are similar, seasonal fields were found to be more productive (George 1974, Indian J. Fbh., 21 (1) : 1-19).

100
During pre-monsoon and monsoon season soil samples were collected from the ponds in duplicate, determination of pH and Eh were made in wet condition using an Elico pH meter. Subsequently samples were air dried and ground in a mortar with a pestle so as to pass through 1 mm sieve.
The pH and Eh of dried samples were also estimated. Redoxpotential (Eh) was estimated using the same pH meter, but with a plantinum electrode. Texture of the soil was determined by 'Hydrometer method'.
Cation exchange capacity was determined by "Modified Perkins method" (Firman (Ed.) 1964, Chemistry of the soil. Oxford and IBH Publishing Co., pp. 497-498). Total exchangeable metallic cation were determined by standard method suggested by Firman (1964, loc. cit.).
Organic carbon content by 'Wet oxidation method' (Walkley and Black 1934, Soil. Sci., 37 (1) : 29-38), available phosphorus by Sodium bicarbonate - soluble phosphorus method (Kanna and Yadav 1979, Practical Manual for Introductory courses in soils. Agril. Univ., Hissar, pp. 117-120) and available suphur by the method given by Jackson (1973, Soil Chemical Analysis. Prentice Hall, pp. 498) were determined.
Results and discussion
Grain size analysis revealed that the soils belong largely to clayey silt followed by silty-clay and sandy loam. As pointed out by Nees (1946, Trans. Fish. Soc., 76 : 335-358), an ideal pond soil should not be too sandy to allow too much leaching of the nutrients, nor should be too clayey to keep all the nutrients adsorbed in it. The clay mineral is the governing factor of exchangeable cations. Chattopadhyay and Mandal (1986, Proc. Symp. Coastal Aquaculture, 4 : 1053-1058) suggested that silty-clay-loam group may increase the susceptibility of the soils to more saline condition.
The soils of sand and loamy sand texture do not grow good quantities of pasture algae, because of light texture and

101
poor nutrient status. Since the soil is not too sandy, these soils have fairly good productivity with respect to aquaculture.
Most of the pond showed slightly acidic reaction may be due to the short supply of oxygen to the soil-water interface as a result of which reducing condition might have occurred as shown by the negative redox-potential. During monsoon season most of the stations showed a slight decline in pH might be due to heavier rainfall and dilution of water. Bacterial fermentation and sulphur oxidation may be the other factors responsible for the acidic pH.
The term redox-potential is an expression of oxidising or reducing power of a solution. All samples recorded negative redox-potential during both periods which indicates the reducing condition of the soil. Reducing condition arise when in consumption rate of oxygen due to oxidation of organic matter exceeds that of supply.
Sulphate reduction by bacteria takes place only in environments with negative redox-potential. Since the redox-potential is a measure of decomposition of organic matter, it is important in the release of nutrients from the mud to water (Wrobel 1967, FAO Fish. Rep., 44 (4) : 153-163).
The capacity of a soil to adsorb and exchange cations can be measured and expressed in chemical equivalents is called the cation exchange capacity. The ion-exchange property is partly pH dependent. Further it is low under acid condition and high under alkaline condition, but the present analysis did not show a corresponding increase or decrease with hydrogen-ion concentration.
The cation exchange capacity of these pond soils ranged from 11 to 23 meq/100 gm of soil. Many workers reported almost the same range from brackishwater soils. Analysis reveals that the ion-exchange property of a soil is almost entirely due to the clay and silt fractions and the organic matter.
The exchangeable metallic cations and in exchange capacity considerably increased during monsoon season, than

102
TABLE 1. Seasonal variations in pH, Eh, cation exchange capacity (mecjll 00 gm), total exchangeable metallic cations (meqllOO gm), organic carbon (%) and available phosphorus (kg/h) and sulphur (ppm) in 9 ponds during premon-soon and monsoon seasons
Pre-monsoon
Wet pH
Dry
Wet Eh
Dry
CEC
TEMC
Organic carbon
Available Phosphorus
Available sulphur
Monsoon
Wet pH
Dry
Wet Eh
Dry
CEC
TEMC
1
6.9
7.0
-274
-274
14.5
18.7
2.21
127.7
1200
6.9
6.1
-376
-191
18.5
34.1
Orgaiuc carbon 0.27
2
6.5
6.4
-365
-365
15.5
16.5
2.77
103.0
1487
6.6
6.5
-166
-268
17.0
38.5
1.16
3
6.7
5.6
-381
-381
14.5
13.75
2.21
156.0
1325
7.0
7.8
-382
-177
15.5
36.3
1.03
Pond No. 4
6.8
6.5
-431
-431
13.5
12.65
2.54
87.4
1400
6.9
7.7
-295
-193
15.5
30.8
1.03
5
6.7
6.6
-370
-369
12.5
19.95
2.49
672
1337
6.6
5.5
-358
-219
13.0
33.0
0.16
6
6.8
7.2
-389
-386
13.0
14.3
2.46
78.4
1562
6.7
5.3
-302
-262
16.5
39.6
0.78
7
7.0
7.5
-353
-353
175
14.3
1.61
51.5
937
6.6
5.3
-366
-252
18.0
39.6
1.74
8
6.9
6.7
-383
-383
19.5
12.1
2.47
51.5
900
6.8
6.1
-330
-230
20.8
35.2
1.14
9
6.9
6.1
-392
-373
14.5
14.5
0.67
14.0
1537
6.8
6.4
-232
18.5
30.8
0.35
Available Phosphorus 107.5 103.0 127.7 129.9 170.2 100.8 141.1 153.2 136.6
Available Sulphur 1050 1675 1110 1537 1000 1487 1300 1350 1375
CEC = Cation exchange capacity, TEMC = Total exchangeable metallic cations.

103
that of premonsoon. Paddy plants utilizes most of the nutrients during premonsoon and the subsequent increase during monsoon may be due to the run off and that released due to the decomposition of organic matter. There was a corresponding increase of metallic cations along with the exchange capacity during monsoon.
Comparatively higher values of organic carbon was obtained during premonsoon (0.39-2.92%) than that of monsoon season (0.13-1.25%). The high values during premonsoon might be correlated with the stagnant nature of water organic deposition after the decomposition of paddy stumps and minimum decomposition because of nonavailability of oxygen as already shown by the negative redox-potential. Comparatively low concentration obtained during monsoon season can be attributed to the precipitation and resultant run off on one hand and relatively higher decomposition of organic matter, due to the addition of new water on the other hand (Mollah et al. 1976, India J. Mar. ScL, 1 (1) : 106-115).
Unlike organic carbon, the quantity of available phosphorus was low in the premonsoon collection, might be due to the displacement by the paddy plants. The higher values obtained during monsoon was due to comparatively lower fixation of phosphorus, due to low ca** activity.
The phosphorus content ranged between 12.54 kg/ha to 170 kg/ha. Sreenivasan (1967, FAO Fish. Rep., 44 (3) : 179-197) found that those ponds having 500 kg/ha are less productive and those having 1000 kg/ha are highly productive. Available phosphorus showed correlations with redox-potential and metallic cations.
Available sulphur content ranged inbetween 175 ppm to 1875 ppm.
Conclusion
Grain size analysis reveals five types of soils namely silty clay, clayey silt, sandy loam, silty loam and clayey sand. The soil pH did not show much seasonal variations and the values

104
remain near neutral except little acidic trend in some stations (5.6-7.0) might be due to the short supply of oxygen as shown by the negative redox-potential. Redox-potential recorded a seasonal variation and the range was little more wider during monsoon (Premonsoon -274 to -431, Monsoon -166 to -382) which shows the reducing condition. Cation exchange capacity of the samples was more or less same during both period of study. Organic carbon content was comparatively high during premonsoon (0.39-2.92%) than monsoon season (0.13-1.23%). The available phosphorus ranged from 12.54 kg/ha to 170.24 kg/ha and showed a correlation with exchangeable ions and redox-potential. During both seasons the available sulphur concentration was almost same and it was in the productive range.
In general, the extent of physico-chemical properties and the amount of available nutrients increased with decreasing grain size and as per the soil characteristics all ponds are suitable for the culture of finfish and shellfish.

CMFRI Spl. Publ, 1993; 54 : 105 - 113 21
A STUDY OF THE EFFECTS OF EYESTALK ABLATION ON THE ELECTROFHORETIC PATTERNS OF GENERAL PROTEIN IN PENAEUS INDICUS H. MILNE EDWARDS
GHADEI, S. K. M . K. GEORGE Research Scholar Supervising Teacher
Introduction
The most successful technology of induced maturation of prawn in captivity is "eyestalk ablation" involving removal of the eyestalk which holds the location of ovary inhibiting hormone (OIH).
The eyestalk apart from the OIH also carries a number of neurosecretory hormones that regulate lipid metabolism and protein synthesis in the hepatopancreas, calcium metabolism during cuticle formation and induce hyperglycaemia in the hemolymph to combat stress.
Little information is available on the relationship between the eyestalk and the qualitative nature of protein storage in different organs/tissues, its mobilisation to ovary in the Indian penaeid prawn Penaeus indicus. Hence the objective of the present short term investigation was to study the effects of eyestalk ablation on the electrophoretic patterns of general protein in selected tissues of Permeus indicus.
Material and methods
Specimens of P. indicus 130 ± 10 mm in total length and 20 ± 2 gm in body weight were collected from the "Thop-pilikettu" prawn filtration pond at Edavanakad near Narakkal. One brood female prawn was collected from open sea at a depth of 30 m by trawl net.
The animals collected from culture pond and brought to the laboratory in plastic buckets were gradually acclimatised to higher salinity (33.7%o) in holding tanks.

106
The fennales were subjected to eyestalk ablation using an electrocautery apparatus, heated with 6 volts current. The males were not eye ablated. For unilateral eyestalk ablation experiment, only one eye of each female prawn was removed, whereas for bilateral eyestalk ablation experiment, both eyes were removed. The ablated eyes were separately taken for electro-phoretic studies. In another tank 3 females and 2 males were kept as control (without eyestalk ablation) providing same environmental condition as that of experiment. The prawns meant for control were sacrified periodically to see the protein patterns in selected tissues before eyestalk ablation. The eyestalk ablated (both unilateral and bilateral) prawns were scarified after 7 days, 15 days and 30 days to see the protein patterns after eyestalk ablation in selected tissues.
The electrophoresis method followed here was that of Subashini and Rabindranath (1981, CMFRI Spl. Publ, 7 : 1-172) and Bye and Ponniah (1983, CMFRI Spl. Publ, 13 : 1-90). For the standardisation of methodology several electrophoresis runs were carried out by taking different gel concentrations 10% (A) + 2% (B), 9% (A) + 2% (B), 7% (A) + 2% (B), 5% (A) + 2% (B), different weights of tissue for homogenisation (50 mg/1 ml DDW, 100 mg/1 ml DDW, 200 mg/lml DDW), different sample quantities (40 |i.l, 50 \i\, 75 (il, 100 nl), supply of different amount of power (30 MA, 40 MA, 50 MA) and different time periods of staining with AB and CBB stains.
For general protein study Tris-Glycine was used as tank buffer and Tris-HCl as gel buffer. Tank buffer (Tris- Glycine, pH 8.3) was composed of 6 gm of 0.05 M Tris-buffer and 28.8 gm of 0.38 M Glycine.
All reagents were dissolved in DDW (W/v), volume made upto 1 litre and stored at 4°C. Before use 60 ml of this stock solution was diluted to 600 ml by adding DDW (V/V). 1 part of 0.1% BPB mixed with same part of 40% sucrose solution was used as marker dye. The HM was directly drawn from the heart by keeping the animal in a bending position. The HM was poured into the preweighted sample vials and kept inside the

107
freezer. Then the other tissues like Eye (E), Hepatopancreas (HP), Gonad (G), Nerve (N), Antenna base (A) Body muscle (M) were removed, weighed and homogenised with the DDW @ 100 mg/1 ml by hand homogeniser. The whole nervous system was taken for prepartion of nerve tissue extract. The homogenised tissues were centrifuged for 20 minutes in 1000 rpm at below 10°C.
For applications of samples the clear supernatant portion of the centrifuged fluid was taken. Samples of required quantity (50 |xl, 100/1) were applied by means of digital micropipette over the gel. Then 20 |il of marker dye was applied over the sample and properly mixed. The remaining part of the gel tube was filled with tank buffer. The power pack was switched on and initially adjusted to supply 12 Milli Ampere (MA) for 10 minutes and then 36 MA for another 2 hours 20 minutes. The current was regulated for uniform flow of 3 MA/gel tube. After electrophoresis the gel and the inner wall of the gel tubes using a syringe without demaging the gels. The general protein studies here were stained with 0.1% Amido Black (AB) or 0.2% Coomassie Brilliant Blue (CBB). Before staining the gels were fixed with 10% TCA for 10 minutes. The staining period was only 10 minutes. The destaining procedures were carried out with 7% Acetic acid for 2-3 days.
Results and discussion
Among different percentage of gel composition tried, 10% (A) + 2% (A) polyacrylamide gel was found to produce a satisfactory separation and resolution of general protein in all the tissues of P. indicus tested in the present study. 100 mg/1 ml DDW was found to be a standard volume for sample preparation and 100 |al for sample application in all experiment. On the basis of clarity and staining intensity of different major and minor bands in different tissues tested, AB was found to be a better stain for general protein of P. indicus. A standard staining time of 10 minutes produced all the major and minor protein bands in different tissues. For the purpose of destaining 7% Acetic acid was found to produce easy destaining with 2-3 days.

108
To get an insight into the effects of eyestalk ablation on the electrophoretic patterns of general protein in P. indicus the patterns obtained before eyestalk ablation were compared with that of the pattern after a certain period of unilateral eyestalk ablation and patterns after a certain period of bilateral eyestalk ablation. The actual effects of eyestalk ablation on the general protein patterns in different target tissues were demonstrated here mainly by two methods, considering : 1. The total number of protein bands and 2. Details of distance migrated by individual protein bands (electrophoretic mobility) with reference to the mobility of BPB marker dye and measurable colour intensity of each band.
The basic patterns of general protein in the 7 target tissues including the Eye (E) before eyestalk ablation indicated that all tissues possessed a tissue specific protein patterns either in terms of differences in the total number of bands (4 to 16) or the colour intensity of each specific band or electrophoretic mobility of a particular band.
A comparison of general protein patterns obtained in different tissues after 7 days of unilateral eyestalk ablation with that of unablated revealed a significant variation. It is also known that there is a host of biochemical processes or physiological mechanism that follow the eyestalk ablation leading to the actual incidence of gonadal maturation or moulting.
The results of present study on the effects of unilateral eyestalk ablation conducted in P. indicus corroborate the positive effect of similar studies conducted in other crustaceans. Thus the total number of protein bands counted as electrophoretic bands in the ovary before eyestalk ablation in P. indicus was only 7 which was found increased to 17 bands giving 143% increase after 7 days of eyestalk ablation. Such significant increase in the ovary protein was also reflected in the increased size of the ovary on 7th day. The increase in the protein bands in the case of N tissue was from 4 to 7 at the end of the 7th day of unilateral eyestalk ablation giving 75% increase over the zero day. The

109
total number of HP protein bands was only 16 before ablation whereas it was found increased to 25 on 7th day of unilateral eyestalk ablation, giving 56% increase. These three above results indicated a significant effect of unilateral eyestalk ablation on the general protein patterns in P. indicus. Though other tissues like HM, E showed relatively less increase in total number of general protein bands, the positive effect of unilateral eyestalk ablation in all these tissues also evidently demonstrated. This dramatic positive responses of G, N and HP of P. indicus to the unilateral eyestalk ablation is a clear demonstration of the inhibiting role naturally played by the eyestalk in gonadal maturation during unfavourable natural brackishwater conditions. Whether these protein bands electrophoretically detected and demonstrated in the G, N and HP of P. indicus studied here, are precursors of egg yolk proteins or lipid carrier proteins are not verified as in the case of other penaeid prawn like P. vannamei.
Thus the most significant effect of the present unilateral eyestalk ablation in P. indicus was the 143% increase in the number of protein bands of ovary (G). Such highly significant sudden response of ovary (G) can be expected on sudden removal of the eyestalk which had been inhibiting such positive response until the very moment of ablation. Such varying response in terms of total concentrations of protein, free sugar and lipid in different tissues under natural and induced maturation conditions was also reported in P. indicus by earlier studies.
However, the highly positive response of ovary in P. indicus to the eyestalk ablation observed here may be considered as another example of ovary as the major site of egg yolk protein synthesis, assuming that the protein bands detected in the present study are egg yolk protein or its precusors.
The nervous system tissue (N) and HP were the other tissues of P. indicus that showed significant effects of eyestalk ablation registering 75% and 56% increase in the number of protein bands respectively. The increase of 75% in the number of N tissue protein bands as an effect of eyestalk ablation is very

110
interesting. It shows that eyestalk endocrine factors of P. indicus have a wide range of target tissues under its direct or indirect inhibitory influence. Though susceptibility of crustacean central nervous system (CNS) to hormonal priming action is suspected. This is probably the first report of active response by the CNS to eyestalk ablation in terms of number of electrophoretic protein bands in crustaceans particularly in P. indicus.
The production of extra protein bands in N tissue after eyestalk ablation in P. indicus is again more interesting in view of the experimental report of induction of acceleration of ovarian growth by N tissue extract (brain and thoracic ganglia) into an eyestalk ablated as well as normal P. hardwickii (Nagabhush-anam and Kulkarni, 1982). The third tissue of P. indicus that showed a significant positive response to eyestalk ablation was HP. On the 7th day of unilateral eyestalk ablation the number of general protein bands were found increased by 56%. It is an important storage organ of organic/inorganic resources like proteins, lipids and free sugar, etc. required for many physiological functions including moulting and reproduction.
The present observation of 56% increase in HP protein bands in the destalked P. indicus on the 7th day of ablation can be reasonably be correlated to the direct positive effects of eyestalk ablation.
The HM of P. indicus tested in the present study also showed 40% increase in the number of electrophoretic protein bands as a result of the effects of eyestalk ablation.
The pattern of the results of the present study on the effects of unilateral eyestalk ablation in P. indicus discussed above was found again considerably varying on 15th and 30th days of ablation. Such variations were also reflected particularly with reference to the previous pattern existed viz., on zero day and 7th day respectively.
However, it is interesting to note that the 17 number of bands in ovary present on 7th day found unchanged on 15th day under unilateral eyestalk ablation, whereas it got reduced to 12

I l l
on 30th day, which still considerably higher than 7 bands existed on zero day. Similar tendency of reduction in the total number of protein bands on 15th and 30th day was noticed in other tissues like HM, HP, E and N particularly compared to the pattern obtained on 7th day in all tissues, but only in certain cases compared to the patterns on 15th day. The occurrence of only 5 number protein bands in HM on 30th day under unilateral eyestalk ablation suggests the complete disappearance of the effects of unilateral eyestalk ablation, because that was the normal pattern existed on zero day. It also suggests that after particular period of unilateral eyestalk ablation the tendency of the tissue protein pattern is to return towards the original pattern even in the absence of one eyestalk. This can be due to a normal built in homeostatic mechanism that becomes active and dominate during normal cyclic process of moulting and reproduction.
Another basic reason may be that the tissue Sf)ecificity of general protein patterns inherited and controlled through species specific gene mechanism remains undisturbed in spite of a general changes brought about by the eyestalk ablation in the number of bands or variation in the staining intensity. A comparison of general protein pattern in different tissues before eyestalk ablation with that of bilateral eyestalk ablation on 7th, 15th and 30th days again showed an entirely different pattern compared to that of unilateral eyestalk ablation, particularly in the case of G and HP.
The total number of protein bands on 7th day of bilateral ablation in the tissues like HP and ovary reflex a significantly negative response compared to significantly positive response by these same tissues to the unilateral eyestalk ablation during the same period. The observation of 6 number of G bands on 7th day increasing to 13 on 15th day and 4 bands on zero day to 7 on 15th day suggests a positive effect of bilateral eyestalk ablation after a longer jseriod than that of unilateral eyestalk ablation. It may also suggest that the factors influenced the G tissue and N tissue are the same, because.the positive effect was taken place only on 15th day in these two particular tissues.

112
The only comparable effects observed under both unilateral and bilateral eyestalk ablation experiment was the positive response of HM tissue by increasing from 5 numbers to 7 on 7th day under unilateral eyestalk ablation and 8 on 7th day under bilateral eyestalk ablation and showing slight negative response by reducing the number of 4 on 15th day under unilateral eyestalk ablation and again the same 4 bands on 15th day under bilateral eyestalk ablation. There are no reports on effects of bilateral eyestalk ablation on electrophoretically detected general protein in other crustaceans for comparison.
A close analysis of the present results of the effects of unilateral and bilateral eyestalk ablation reveals that the effects of either type of eyestalk ablation is not permanent in nature, that a physiological/biochemical change induced by eyestalk ablation leads to secondary changes as a results of the primary effect of eyestalk ablation. These results also suggest the complex role of antagonistic, synergestic and homoeostatic mechanism involved in producing the observed protein patterns in P. indicus. As the final effect of eyestalk ablation is expected to lead to building up of extra protein resources in ovary probably by mobilising from other sources, the steady state of the number of bands in G even on the 15th day and meanwhile unsteady conditions of the number of protein bands in other tissues is natural. The above pattern of reduction of protein bands of HP, HM, etc. agrees with such reductions in total concentration of proteins and other organic substances reported in P. indicus from earlier reports.
The present report of unchanged G protein patterns in P. indicus even on 15th day of unilateral eyestalk ablation is comparable positively with comparable unchanged pattern observed on the 14th day of ablation of eyestalk in P. vennamei with special reference to immunoprecipitated total protein. However, it is interesting to note that the total protein in P. vannamei on 14th day remained stable until 30th day. The total number of protein bands in all the tissues tested in P. indicus on the 30th day of unilateral eyestalk ablation further got reduced considerably compared to 7th and 15th day. The total

113
number of ovary protein bands which remained unchanged on 15th day of ablation also showed a reduction of about 30% of its bands.
However the highest reduction of 72% was recorded by the HP tissue, followed by N (50%) G (30%). Inspite of considerable reductions in the number of protein bands on 30th day, ovary still showed more bands compared to that of 7th day. This is again expected, because ovary is the final target tissue to reflect the total effects of eyestalk ablation, especially where gonadal cells progress towards required size for vitellogeneis.
It is concluded that the effect of unilateral eyestalk ablation on the general protein in tissues like G, N, HP and HM of Penaeus indicus was highly positive, particularly on 7th day of ablation, whereas the effect was of lesser order on 15th and 30th days of ablation. On the other hand the effect of bilateral eyestalk ablation on the above same parameters was highly negative, particularly on 7th day of ablation, but became reasonably positive on 15th day of ablation, particularly with reference to proteins of ovary and nerve tissues. The protein patterns of all the above tissues except nervous tissue (N) of a unilaterally ablated and spawned P. indicus were of different nature and order compared to the above experimental result.

CMFPJ Spl. Publ, 1993; 54 : 114 - 118 22
STUDIES ON THE EFFECT OF MS-222 ON BASAL METABOLISM IN SEEDS OF
PENAEUS INDICUS H. MILNE EDWARDS
CHITRA DAS A. NOBLE Research Scholar Supermsing Teacher
Introduction
Several chemicals such as Ether, Chlorobutanol, Tertiary Amyl-Alcohol, Chloralhydrate, MS-222, etc. have been tested on fishes to over come stress and mortality and produced desired results. As works and literature on anaesthetics on Crustacea are very scarce in comparison to fish and no work was carried out on MS-222 on prawn, the present study was done on the effect of MS-222 on seeds of Petfoeus indicus.
Odjectives
The objectives of the study has been to find out (i) the tolerable range of MS-222. (ii) the changes in metabolism - in terms of rate of oxygen consumption, rate of ammonia excretion, ammonia quotient, changes in pH and the time for 50% and 100% mortality in different concentrations within the range; and (iii) the changes in protein, lipid and carbohydrate contents on exposure to different concentrations.
Material and methods
Seeds of Penaeus indicus (15-40 mm) obtained from the canals and perennial ponds of Edavanakkad and Puduvypu, and the prawn Hatchery of Central Institute of Brackishwater Aquaculture, Narakkal were the test animals and were transported to the laboratory by jerry cans. In the laboratory, the seeds were acclimated for 4 days during which they were fed with formulated feed until 24 hours prior to the experiment. The acclimation medium was replenished every alternate day and the leftover feed and faecal matter removed everyday.

115
Sea water (33-35 ppt) collected off Cochin, filtered and diluted to 15 ppt with freshwater, formed the medium for acclimation and tests.
MS-222 was dissolved in the 15 ppt medium to the desired concentrations of 1 ppm to 5000 ppm. Sodium hydroxide of 1 N was used to rectifty the reduction in pH caused by MS-222.
Throughout the experiment the temperature ranged from 22°C to 26°C, initial dissolved oxygen content around 4.33 ml/L, initial ammonia 0.15 ppm and initial pH between 7.8 and 8.1.
Six circular pools (40 litres capacity) each filled with 35 litres of acclimation medium with continuous aeration and stocked with 250 seeds in each formed the acclimation set up.
Initial tests were conducted to find out the tolerable range of MS-222. Fifteen conical flasks of 1 litre capacity, were filled each with 1, 5, 10, 15, 20, 25, 50, 100, 150, 200, 250, 500, 1000, 2500 and 5000 ppm of MS-222 media and another conical flask filled with 1 litre of 15 ppt water without MS-222 (as control). The range of concentrations in which the time of 100% mortality observed was higher than that of the time of 100% mortality control. The range was found to be 50 to 250 ppm.
Five conical flasks filled with 50, 100, 150, 200 and 250 ppm MS-222 media and one without MS-222 as control, simultaneously kept, formed one set of experiment. The initital oxygen, ammonia and pH levels were recorded. Fifty seeds were then transferred into each flask and sealed by liquid paraffin to avoid diffusion of oxygen. The time of setting, 50% and 100% mortality were noted down. After the test period at 100% mortality, the seeds were analysed for biochemical changes. Three such sets were conducted.
The dissolved oxygen was measured by Winkler's method, ammonia by Solarzano's method and pH by a Toshniwal pH meter.
Quantitative analysis of protein (Lowr/s method), lipid (Sulphovanillin method) and carbohydrate (Phenol-sulphuric

116
acid method) were done. For all the spectrophotometric analyses a GS 886D ECIL Senior Spectrometer was used.
ANOVA, linear regression and correlation co-efficient of data were analysed by a computer with suitable programmes.
Results and discussion
Below 50 ppm there was no significant difference of time from that of control at 50% and 100% mortality while between 50 and 250 ppm there was an increase and above 250 ppm it was harmful. The time of 100% mortality was lowest at 5000 ppm (1 minute) and the highest was seen at 150 ppm (1035 minutes). The range of 50 to 250 ppm was thus found suitable.
The rate of oxygen consumption ranged between 0.000385 ml/mg/hr (150 ppm) and 0.008590 ml/mg/hr (conti-ol). The percentage variation of oxygen consumption from control was least at 150 ppm (-55.18%). The linear regression expression for the rate of oxygen consumption was with a slope value of - 0.000132 and an intercept of - 0.00774. The correlation coefficient, r was -0.6346. The F-value of ANOVA was found to be 19.62 which is highly significant at 1%.
The highest rate of excretion observed was 0.000170 ppm/ mg/hr (control) and the lowest value 0.00002 ppm/mg/hr (150 ppm). The percentage variation from control ranged between -20% (250 ppm) and 87.059 (150 ppm).
The regression relation was with a slope of -0.000(X)305 and an intercept 0.000132. The correlation coefficient, r was - 0.4834. F-value of ANOVA was 25.95 which is highly significant at 1%.
Ammonia quotinet was found to decrease with increase in concentration. The highest quotient was 0.01979 (control) and the lowest 0.0107 (250 ppm). The percentage variation of from each quotient control ranged between -71.147 (150 ppm) and - 14.098 that of (250 ppm). The correlation coefficient r was - 0.6346.

117
The linear regression observed was with a slope of 0.(X)01 and an intercept of 0.(X)91. The correlation co-efficient r was -0.4934. F-value of ANOVA was 6.34 which is significant at 1%.
The decrease in pH ranged from 7.46% (50 ppm) to 12.24% (control). The decrease in pH was noted highest in control /. e. 7.8 to 6.9, followed by 150 ppm, 8.1 to 7.1, while the least change was observed at 50 ppm, 8.0 to 7.5.
The regression relation was with slope -0.005 and an intercept 10.787. The correlation coefficient r was 0.3785.
The highest time for 50 and 100% mortalites was observed at 150 ppm with 823 and 1035 minutes respectively, and the least time was recorded for control with 293 and 420 minutes respectively. The percentage variation of time of 50% mortality from control ranged from 21.84% (50 ppm) to 180.89% (150 ppm) and that of 100% of mortality ranged between 19.76% (250 ppm) and 146.43% (150 ppm). The linear regression was with a slope of 0.867 and an intercept of 406.570 at 50% mortality. And of 100% mortality was with a slope of 1.18 and intercept 558. The correlation co-efficient r, was 0.4121 for 50% mortality and 0.4839 for 100%.
The protein content ranged from 17.209% (control to 19.28% (150 ppm) of body wet weight. It is observed that the protein content was more than that of control at all concentrations. With the highest level being at 150 ppm (12.049% more) and the least at 250 ppm (0.3196% more) F-value of ANOVA was 51.49 being highly significant at 1%.
A range between 4.079% (control) and 3.904% (150 ppm) of body wet weight lipid level was observed. A depletion was observed due to lipolysis ranging between -4.29% (150 ppm) and -1.882% (50 ppm). The F-value of ANOVA was 1.25 which is found to be insignificant.
A depletion of carbohydrate content was observed due to glycolysis. The maximum level of carbohydrate observed was 0.821% (control) and the minimum level of 784% (150 ppm) of body wet weight. The minimum percentage to vary from control

118
was -1.3389 (250 ppm) and the maximum variation -4.576 (150 ppm). F-value of ANOVA was 0.38 which is insignificant.
Since the time to 50% mortality is related to the available oxygen, the differences in the time to it could be accounted for the differences in the metabolic rates in the various concentrations. It is found that the anaesthetised groups of seeds lived longer than control. The increase in the time to 50% and 100% mortality of the anaesthetised prawn seeds are due to the result of decreased metabolism resulting from the loss of activity. The maximum time for 50% and 100% mortality has been observed at 150 ppm.
In the present study the level of protein content remained more than control suggesting a decrease in protein metabolism. Whereas, the depletion in lipid content can be attributed to lipolysis. A similar depletion was also indicated for carbohydrate content glycolysis. Earlier workers reported that a decrease in lipid content of liver along with decreased carbohydrate content is indicative of induced glyconeogenesis, which supports the findings in the present study.
Conclusion
An evaluation of the results of the foregoing results and highlights shows that anaesthetised prawn seeds in the tolerable range of MS-222 tended to live longer than in control. It is found that MS-222 of 150 ppm concentration can be used for handling and transport of Penaeus indicus seeds (50/litre) for 17 hours without aeration at 4.33 ml/L oxygen level, 0.15 ppm ammonia level and 8.1 pH.

CMFRI Spl. Publ, 1993; 54 : 119 - 126 23
STUDIES ON THE HYDROLOGY AND THE ABUNDANCE OF PHYTOPLANKTON
OF FISH CULTURE PONDS
S. GOMATHY S. MUTHUSAMY
Research Scholar Superxnsing Teacher
Introduction
The traditional fish/prawn culture practices were in operation in a large number of perennial fish culture ponds around the Cochin Backwater region for a very long time. The difference in the water level between the successive tides is taken advantage of to regulate the tidal flow in and out of these ponds through a sluice gate. The amount of particulate organic and detrital matter entering the ponds during high tide though considerable, is limited and far less than the demand by a growing stock of different sizes and varieties of fish, etc. This limitation is overcome by phytoplankton production which forms the backbone of production in these ponds.
The present study envisages to evaluate the changes in the hydrology and the fertility of a few perennial fish culture ponds between Cochin and Azhikode mouth, caused by the enormous input of river water on one hand and the cold high saline upwelled seawater on the other and assess their impact on the production of phytoplankton during the southwest monsoon and early postmonsoon seasons when the conditions in these ponds undergo drastic changes.
Material and methods
Three perennial fish culture ponds located across the estuary between Cochin and Azhikode one each at Vaduthala, Vallarpadam and Valappu were chosen for this study. Water level in these ponds ranged froih 0.5 m to just over 1 m.
Weekly water samples were collected from surface for the estimation of salinity, dissolved oxygen, pH and the micro-

120
nutrients : inorganic phosphate, nitrate, silicate and nitrite and for determining the phytoplankton cell count. Standard methods were adapted to estimate the above parameters. The temperature was measured immediately on sampling using a mercury thermometer. A few drops of chloroform not exceeding 0.5 cc was added to the nutrient samples to prevent any biological activity that would alter the concentration of nutrients. 1 to 2 ml of 5% formalin was added to 100 ml of the water sample in order to preserve the phytoplankton elements. One ml each of winkler A and winkler B were added to the water samples in BOD bottles for determining the dissolved oxygen content.
The data were subjected to multiple regression analysis in order to examine the influence of various hydrological parameters on the production of phytoplankton.
Results and discussion
Pond at Vaduthala
The salinity was extremely low mostly below 1 ppt, while the temperature fluctuated between a narrow range of 2°C the exceptions being the beginning of June and that of the pH remained either slightly lower or higher than that of the neutral pH except towards the end of September. However all these three parameters have shown a marked increase towards the end of September. Unlike the other parameters, the variations in the dissolved oxygen content does not conform to any pattern, except at the end of September when it recorded a sharp increase. The variations in nitrate were similar to those of silicate. While the changes observed during August were highly drastic, those recorded during the rest of the period were subdued. On the other hand the variations in the phosphate and nitrite contents were similar except during August, when the concentration of the former attained maximum that of the latter declined to minimum. It is interesting to note that, inspite of the enrichment of the pond water with nutrients almost throughout the period of this study the phytoplankton content

121
never exceeded 50,000 cells/litre. Besides the total cell count recorded from June till the middle of July and once in September were around 40,000 cells/litre. While it remained between 10,000 to 20,000 cells during the rest of the period.
The correlation matrix showed that the temperature had a negative correlation with phytoplankton (-0.4900). The dissolved oxygen had a positive correlation with temperature (0.4918) and pH (0.7128), but a negative correlation with phosphate (-0.4355). Salinity showed a negative correlation with nitrate (-0.6433) and a positive correlation with nitrite (0.4482). The nitrate and silicate have negative correlation with nitrite (-0.5752 and -0.5878) respectively. Regression coefficients due to temperature, nitrate and nitrite (at p <0.01) were found to be significant. The variables according to the order of significance are nitrite, nitrate and temperature. While nitrite and nitrate show a positive relationship the temperature showed an inverse relationship. About 46% of the variations in phytoplankton cell count could be explained by these variables. The F test showed that the regression analysis is significant at 1% level.
Pond of Vallarpadam
The water temperature showed an increase during June and August, but was on a declining trend during the rest of the period. Except for the decline that brought down the value to the minimum in July the salinity was on an increasing trend during the rest of the period so as to record the highest value towards the end of September. The pH remained around 8 and above. The dissolved oxygen content fluctuated between 1.43 ml/1 and 3.67 ml/1 both these values occurring during second half of September and during the rest of the period it remained between 2.0 and 3.5 ml/1. Nitrate and silicate follow a similar trend during June-July attained a peak during August. While the former recorded a declining trend during September the latter increased to record a maximum and then come down drastically during the same month. A minor peak in the phytoplankton content observed in June preceeded that of the nitrite and phosphate. Where as the abundance observed

122
towards the end of July coincided with the ascending trend in both these nutrients. A decline in phytoplankton together with that of nitrite is a conspicuous feature observed in August, while phosphate concentration continued to increase and remained high. A spurt in the activity of phytoplankton observed throughout September coincided with a steady decline of concentration of both phosphate and nitrite during this month. The phytoplankton cell counts were mostly a lakh and above exceeding 5 lakhs at the end of September.
The correlation matrix showed that the temperature had a negative correlation with nitrate (-0.5917) and nitrite (-0.4395). The pH showed a negative correlation with salinity (-0.4174) and silicate (-0.4430). Salinity showed positive correlation with the phytoplankton (0.7206) and silicate (0.5226). Phosphate showed positive correlation with silicate (0.4708). Nitrate showed positive correlation with nitrite (0.6799). Regression coefficients due to salinity, phosphate (at p <0.01) and dissolved oxygen (at p <0.05) were found to be significant. The variables according to the order of significance were salinity, phosphate and dissolved oxygen. The salinity and dissolved oxygen showed a positive relationship whereas phosphate showed an inverse relationship. About 69.8% of the variation in the phytoplankton cell count could be explained by these variables. The F test showed a very high significance for the regression analysis at 1% level.
Pond at Valappu
The temperature recorded two peaks one in June and the other in August, but recorded a minimum in the beginning of the latter month. The salinity got eroded as the monsoon season advanced to register minimum in August, but increased to values comparable to those recorded in the begining of June towards the end of September. While the fluctuations in dissolved oxygen content were highly erratic the pH varied within a narrow range of values and remained above eight. The fluctuations in nitrate and silicate contents were strickingly different from those of the pond water at Vallarpadam. A
123
moderate increase observed during June was restricted to that month as values recorded during July and a greater part of August were comparatively low. The concentration of nitrate recorded towards the end of August was the highest. An increasing trend of silicate content continued throughout September to record the maximum towards the end of the month. Except for the minor differences the variations in phosphate and phyto-plankton content recorded an ascending trend from June to register maximum in the begining of August (phosphate is 39.94 (ig at/1 and phytoplankton 20 lakh cells) it was followed by more or less a steady decline during the rest of the period. The changes in the nitrite content were though subdued during the first three months of this investigation were marked by sudden changes during successive weeks in September.
The correlation matrix showed that the temperature had a positive correlation with pH (0.4515) and dissolved oxygen. (0.4243). Phosphate showed positive correlation with phytoplankton (0.7369). The silicate had a positive correlation with salinity (0.6713) and nitrite (0.3959). Regression coefficients due to phosphate and silicate (at p <0.01) were found to be significant and the order of significance being the phosphate first and silicate next. Phosphate showed a positive relationship whereas silicate showed an inverse relation. About 62% of the variations in the phytoplankton cell count could be explained by these variables. The F test showed a high significance for the regression analysis at 1% level.
The phytoplankton spedes encoiintered during June-September 1990 from all the 3 ponds studied are given below.
Amphora sp. Amphiprora alata Anabaena sp. Biddulphia sp. Cymhella sp. Coscinodiscus sp. Diploneis smithii D. dydima Fragilaria oceanica Cuinardia flaccida Gyrosigma sp.
Licmophora jeurgensii Mastagloia dolosa M. cochinsis Navicula monilifera Nitzschia palea N. longissima N. closterium N. panduriformis N. clavata N. navicularis Pleurosigma elongatum
P. aesturii Surirella sp. Skeletonema costatunt Scenedesmus cjuadricaula S. accuminatus Stephanopixis palmariana Triceratium favus Thalassiosira subtilis Thalassiothrix frauenfeldii Tropidoneis elegans

124
From the above observations it is evident that the accessibihty of seawater to these ponds vary depending upon their location around the estuary. Therefore the hydrological changes and the abundance of phytoplankton observed in the pond at Vaduthala differed from those of the ponds at Vallarpadam and Valappu. The hydrological conditions of the pond at Vaduthala were close to that of freshwater and the phytoplankton content was a mere 10-20% of the abundance observed in the ponds at Vallarpadam or Valappu. On the otherhand the impact of the tidal incursion of seawater could be discerned distinctly from the variations in salinity in the ponds at Vallarpadam and Valappu where the phytoplankton content was consistently eight to ten times greater than that of the pond at Vaduthala. Gopalakrishnan et ah (1988, Mahasagar, 21 : 85-94) reported the occurrence of phytoplankton maximum in the seasonal and perennial ponds around Cochin during the monsoon season, but this maximum varied in intensity depending on the location of the pond. Nair et al. (1988, Indian J. Mar. Sci., 17 : 24-30) also observed very high concentration of phytoplankton during the monsoon season in culture ponds of this region.
The nutrient enrichment observed in these ponds cannot be entirely attributed to any discharge from a fertilizer plant as reported by Gopalakrishnan et al. (1988, he. cit.) and Nair et al. (1988, loc. cit.) as these ponds are located far away from any such source. The continued high concentration of phytoplankton in the ponds at Vallarpadam and Valappu when the low saline conditions prevailed, shows that the impact of the latter on the proliferation of the former is the least throughout the period of this study.
A comparison of the hydrophysical conditions, the nutrient content and the phytoplankton abundance observed during June - September 1990 shows that each pond differs from the other depending upon its location around the estuary as the changes associated with the tides and the monsoon manifest themselves as localised effects influenced by the islands and shoals and the length of the canals feeding the pond. The

125
hydrophysical conditions and the corresponding abundance of phytoplankton observed in the pond at Vaduthala seem to indicate that when the former becomes as close to those of the freshwater inhibits the production of the latter. However the numerical superiority of the phytoplankton observed in the ponds at Vallarpadam and Valappu shows that slightly brackishwater conditions stimulate and intensify the multiplication of the floral elements. Ramachandran Nair et al. (1975, Bull. Dept. Mar. Sci, Univ. Cochin, 7 (1) : 161-171) have noticed an increasing trend in primary production with increasing salinity and have attributed the low production rate in northern parts of Vembanad Lake to reduction in salinity and nutrient concentration.
A noticeable difference between the time distribution of the temperature of the pond at Vaduthala and those at Vallarpadam and Valappu is the higher values observed in the latter ponds. The temperature values viz. 34.8°C in June, 34°C and SS' C during August, 30.2°C and 31.7'='C during September in the pond at Valappu seems to indicate that the shallow nature of the pond and the network of canals that feed it, favours the increase in temperature to record such high values during the summer monsoon months. Probably a little elevated temperature during the summer monsoon months together with brackishwater conditions hastens the proliferation of the diatoms. Though a slight increase in the phytoplankton content that coincided with the upward swing in temperature in the pond at Valappu by more than 6°C at the end of June, seems insignificant the temperature when continued to be high together with enhanced level of nutrients appears to keep the production of phytoplankton high as observed during August - September. However, according to Gopinathan (1972, /. mar. biol. Ass. India, 14 (2) : 568-577) the lowering of temperature and salinity, and increased content of nutrients increases the cell counts during the monsoon months.
The occurrence of high concentration of nitrate and dissolved oxygen content simultaneously is a conspicous feature observed during the first fortnight of August in the ponds at

126
Vaduthala and Vallarpadam. Ramamirtham and Annie Mathew (1987, Indian J. Fish., 34 (2): 192-197) also recorded high values for these two parameters in ponds at Narakkal during June -September 1984.
Nearly freshwater conditions and pH below that of the neutral pH observed in the pond at Vaduthala during a greater part of this study indicate that not only the buffer capacity of the pond water was extremely low, but also the mixing of either the domestic sewage with the pond water or the organic exudates from the coconut husk retting ojjerations. The values below neutral pH 7 taken together with very low salinity conditions observed here probably indicate the impact of the upwelled seawater rep)orted to be entering into the estuary by Ramamirtham and Jayaraman (1963, /. mar. biol. Ass. India, 5 : 170-177) on this pond is non-existent.
The variations in the dissolved oxygen content were more or less erratic in all these three ponds monitored. As these ponds are shallow and are being subjected to regular mixing the very low values recorded occasionally seem to indicate the high biological oxygen demand (BOD) by the pond water contaminated by the domestic sewage and the organic matter from the coconut husk retting operations (Lakshmanan et al. 1987, Indian J. Mar. Sci., 16 : 99-102) in the pond at Vaduthala. Whereas by the fluid mud that is formed by the flocculation of colloids as the freshwater meets the brackishwater in the estuary and which enters into the ponds at Vallarpadam and Valappu. But Haridas et al. (1973, Indian J. Mar. Sci., 2:94-102) have recorded very high values for oxygen during southwest monsoon season and they attributed this to the primary production in the surface during this season.

CMFRI Spl. Publ, 1993; 54 : 127 - 131 24
STUDIES ON OSMOTIC ADAPTATIONS WITH RESPECT TO HAEMOLYMPH OSMOLALITY AND
CHANGES IN GILL STRUCTURE IN METAPENAEUS DOBSONI (MIERS)
P. MINI P. S. B. R. JAMES
Research Scholar Supervising Teacher
Introduction
The penaeid prawn Metapermeus dobsoni is one of the common species of the Cochin Backwater and highly eury-haline in nature. The present study was conducted to throw light on the osmoregulatory capacity and ionic regulation (Na*, K* and CI) in the prawn, when exposed to abrupt changes in salinity. The associated structural changes at cellular level in the gills of the prawn with respect to the salinity changes have also been examined.
Material and methods
Adult M. dobsoni (size range 70-90 mm TL) required for the study were collected from the perennial fields in and around Cochin. In the laboratory, the prawns were maintained at the same salinity as that of the collection site for a period of 24 hours.
Two separate experiments were conducted, the first for the osmoionic studies and the second for histological studies. About two hundred prawns maintained in the laboratory were divided into two groups A and B of one hundred prawns each. Group A prawns were acclimated at a low salinity of 5%o and Group B prawns were acclimated at a high salinity of 35%o.
Both the group A and B prawns were maintained in two separate pools of one tonne capacity for a period of seven days at 5%o and 35%o respectively. During the acclimation period, the prawns were fed ad libitum with fresh clam meat once a day. The water temperature during the course of acclimation was 28 ± 1°C. At the end of acclimation period, the intermoult

128
prawns were selected for experimental study without regard to sex.
Prawns for group A numbering about seventy were selected and were further subdivided into seven sets of ten prawns each. One of the seven sets was maintained in the salinity of 5%o to serve as the control for the experiment. The remaining six sets were exposed to the respective ascending salinities of 10%o 15%o, 20%o, 25%o, 30%o and 35%o in six tubs for a period of 84 hours each. No feeding was carried out during the exposure period. A similar set up was done for the group B prawns as well and they were exposed to the respective descending saHnities of 30%o, 25%o, 20%o, 15%o, 10%o and 5%o, with 35%o serving as the control in this case.
After the start of the experiment, one prawn from each of the seven tubs of both groups A and B were taken and the haemolymph collected at 0 hours and thereafter at 12,24,36,48, 60, 72 and 84 hours. The haemolymph was collected through the pericardial cavity with the help of a 1 ml hypodermic syringe previously rinsed with an anticoagulant (5% sodium citrate). Simultaneously the water samples from the seven tubs of both groups A and B were also collected at the respective time intervals and stored in the osmomat cuvettes and maintained in frozen condition until use. The experiment was replicated three times.
Haemolymph and medium osmolality was determined using 030 Osmomat. Sodium and Potassium ions in the haemolymph and medium was determined in all experimental and control prawns using Systronics digital flame photometer. Chloride ion concentration in the haemolymph and medium was determined colorimetrically. A two way classification of ANOVA was adopted to study the variance due to salinity changes and also due to the time intervals of exposure, in case of each of the parameters studied.
The second experiment was designed to study the histological changes in the gill structure in relation to osmotic stress. Twenty laboratory maintained prav»ms were divided into
129
two groups of ten prawns each, namely Group A and B. In group A, prawns were maintained at a low salinity of 5%o for a week and in group B, the prawns were maintained at a high salinity of 35%o for a week. Five of the prawns from Group A were exposed to 35%o salinity for a period of five days while the remaining five were maintained at 5%o salinity to serve as the control. Similarly in the group B prawns, five were maintained at 35%o salinity serving as the control while five were exposed to 5%o salinity. At the end of five days in each case, the gills were collected and fixed in Bouin's fixative for 48 hours. The fixed tissue was washed, dehydrated and cleared in xylene. After clearing and hot impregnation in molten wax, the tissue was embedded in Paraffin wax (Merck 58-60''C) and serial sections of 5-7 [i were cut using a manual rotary microtome. Staining was done after deparaffinising with xylene using Haematoxylin and Eosin and sections were mounted in DPX. Photomicrographs of the histological preparation were taken using Olympus research microscope.
Results and discussion
Osmo-ionic studies
In the group A prawns, the haemolymph osmolality showed hyperosmotic condition to the medium on exposure to the salinities of 5%o and 10%o. Hypoosmotic behaviour of the exposed prawns were found to become more and more pronounced with the increase in the salinity in the range of 25 - 35%o. Isosmatic condition in the haemolymph and medium osmolalities were evident on exposure to the salinities of 15%o and 20%o. In the group B prawns, which were acclimated to a higher salinity of 35%o seawater and then exposed to the descending grades of salinity, a similar trend was noticed. The exposed prawns behaved as a hyperosmoregulator at lower salinities (15%o) and hypoosmoregulator at higher salinities (25%o - 35%o) and isoosmoregulator at the intermediate salinities (15%o - 25%o).
The findings of hyperosmotic regulation of this species at low salinities and h3^osmotic regulation at high salinities are

130
in agreement with the earlier reports on other crustaceans. The isosmotic condition in the salinity range of l5%o - 25%o will be ideal or favourable salinity range for optimal growth of the species, as in this range, the prawn is under minimal stress*
The prawn M. dobsoni required at least 48 hours for stabilising osmolal concentrations of the haemolymph, when they were acutely transferred to different salinities as was reported from the earlier stuides on P. monodon.
In both the group A and B prawns, sodium ion concentration in the haemolymph behaved hypoionically to the medium at higher salinities of 25%o - 35%o and hj^erionically at lower salinities of 5%o - 20%o. In the case of chloride ion concentration also, both the group A and B prawns behaved hyperionically at the salinities of 5%o and 10%o and hypoionically in the salinity range of 15%o - 35%o.
In group A prawns, the blood K* concentration remained hyperionic to the medium potassium ion concentration at all salinities from 5%o - 35%o. In the group B prawns, the blood K* concentration was hypoionic to the medium in the salinities of 35%o and 30%o. In all the other salinities from 25%o - 5%o, the prawns have their blood K* concentration hyperionic to the medium K* concentration. The K* concentration was found to be increasing in the medium with salinities from 5 - 35%o.
Similar results as in the present study were obtained elsewhere by different workers for Na* regulation in M. bennettae, CV regulation in Palaemonetes varians and for K* regulation in M. rosenbergii. At higher salinities the blood K* concentration increased, apparently the result of a decrease in the regulatory ability and at lower salinities the high blood K* concentration was the result of osmoregulatory mechanisms which work to conserve or minimize K* loss through diffusion or excretion.
Histological studies
The group A prawns acclimated at 5%o for 10 days served as the control and showed normal structure of the gill lamellae.

131
The gill lamellae appeared as thin filaments with single lining of epithelial cells and lamellar blood sinuses were narrow in appearance. Mild accumulation of haemocytes were seen within the blood sinuses. The group A prawns exposed to 35%o for 5 days showed shortened gill lamellae due to the swollen nature of lamellar sinus when compared to that of the control. The outer lamellar sinus was enlarged. Other lamellar blood sinuses appeared distended due to the accumulation of albuminous fluid. The cells lining the lamellar sinuses appeared hypertrophic and contained large number of haemocytes when compared to that in the control.
The group B prawns acclimated out 35%o salinity for a period of about 10 days showed enlarged gill lamellae with slight to moderate congestion due to accumulation of haemocytes in the lamellar blood sinuses. In the 5%o exposed prawn gills of group B, the lamellae showed slightly shrunken condition and the lamellar blood sinuses were filled with large number of haemocytes indicating congestion.
The swelling of the gill lamellae in the present study may be due to stress or hyperactivity of the prawn when exposed to the extreme salinities abruptly. When the stress is more, oxygen requirement is increased and to facilitate this, the gills might expand. The high metabolic activity may be another reason of swelling which results in the enlargement of the different cell organelles like mitochondria. The changes in the gill lamellae observed in the present investigation could be associated with no particular cause. Hence further studies are required in this connection to give a conclusive evidence.

CMFRI Spl. Publ, 1993; 54 : 132 - 139 25
STUDIES ON THE EFFECT OF TEMPERATURE AND SALINITY ON GROWTH AND FEEDING RATE OF
THE BLACK CLAM VJLLORITA CYPRINOIDES (GRAY)
PREETHA PANIKKAR K. PRABHAKARAN NAIR Research Scholar Supervising Teacher
Introduction
The Black clam Villorita q/prinoides (Gray) selected for the present study, supports a regular fishery in many estuaries of Kerala. Noteworthy references are those by Nair (1975, Bull. Dept. Mar. Set, Univ. Cochin, 7 (4) : 919-929) on growth and by Nair and Shynamma (1975, Bull. Dept. Mar. ScL, Univ. Cochin, 7 (3): 537-542) on salinity tolerance, besides some works on the biological aspects, fishery and resource characteristics.
Since bivalves feed by filtration, an estimate of the filtration rate or clearance rate determines how much food is consumed by them. In this study the clearance rate was estimated by measuring the decrease in the algal cell concentration over time and this was taken as the feeding rate.
Objectives
This study is an attempt to investigate by laboratory experiments whether temperature and salinity have any effect on the growth and feeding rate of the black clams of small and large sizes, to compare the growth in the laboratory with that obtained from field observations and to compare the rates of feeding when fed with two types of algal feed in the laboratory.
Material and methods
The clam was collected from Nettur, 13 km southeast of Cochin Harbour. Clams of 10-15 mm and 25-30 mm were selected for the experiment. They were acclimated in laboratory and transferred gradually to the test-salinity levels of 5%o and 15%o.

133
The experiment set up in the laboratory for maintaining small and large clams in different combinations of temperature and salinity under constant aeration was replicated three times. For the experiments in room temperature, seven basin each were filled with 2 litres of water having salinity of 5%o and the other seven with 15%o salinity water. Ten small clams (10-15 mm) each were put in three containers and ten large clams (25-30 mm) in the other three containers of the first set; one container was kept without clams as control of algal feed. Similar arrangement was made for the second set with 15%o. The temperature of the water medium was 28 ± 1°C.
For the experiments in 33°C, fourteen 2-litre glass beakers were used; one set of seven beakers containing 5%o salinity water was kept in an aquarium tank three-fourth filled with water and another set of seven beakers with 15%o salinity water in a second aquarium tank. A jumo thermometer with heatng coil and relay system was used in each tank for maintaining the water temperature constant at 33°C. To avoid over crowding of clams, only five clams were kept in each of the 14 beakers, leaving one beaker in each set as control for algal feed.
The materials used for feeding the clams were the unicellular flagellate Tetraselmis sp. and mixed phytoplankton. They were grown in low saline water (10-15%o) collected from Cochin Backwater.
Culture of Tetraselmis sp. was done in 500 ml Miquel's medium (A and B) in 2 litre flasks plugged with sterilized cotton and was maintained in logarithmic phase. The water of 10-15%o salinity used for culture of mixed phytoplankton in 200 1 capacity tanks was fertilized with chemicals in required proportion. The algal components of the mixed culture were mainly species of Scenedesmus, Coscinodiscus and Skeletonema; other algae observed were species of Navicula, Pleurosigma, Nitzschia, Pyrocystis and Thalassionema.
At the start of the experiments small and large clams of known length, width and thickness and weight were introduced in the culture containers. Linear measurements of all the clams

134
in all the containers were taken every month without causing disturbance to the animals and the average values for clams in each container was calculated. All the linear measurements were taken to the nearest 0.1mm with vernier calipers and the weight to the nearest milligram on an electronic balance.
For taking initial meat weight, clams identical in length and weight to those introduced for experiment were used. For final meat weight values, the test clams themselves were utilised at the close of the experiment.
At the start of every experiment, 250 ml of the algal culture was introduced in all the plastic basins (room temperature; 5%o and 15%o) and 50 ml in the glass beakers (33°C; 5%o and 15%o). Algal consumption was monitored at regular intervals after the introduction of feed. Samples of 3 ml water was removed from the rearing containers, fixed in formalin and the cell counts taken microscopically using a plankton counting chamber. From the initial and final concentration, the feeding rate was estimated using Quayle's equation.
M r cone cone' "I m = — doge ) - <l0ge > I
nt L conCj conCj' ^ where 'm' is the feeding rate/clearance rate; 'M' the volume of the suspension; 'n' the number of animals per container; 'conc^' the initial concentration; 'conCj' the final concentration after time 't'; 'conCj,' and 'conCj' the initial and final concentration in the control suspension. The scope of feeding rate investigated here is limited to the gross clearance rate. Dissolved oxygen, pH, nitrite, nitrate and phosphate of the experimental medium were estimated by standard methods.
The field experiment was done in a small pen of 1 sq. m area set up at Nettur. The pen was made of chicken wire mesh and was divided into two equal compartments. In one half 1000 small clams of 12-16 mm were stocked and in the other 300 large clams of 27-32 mm. The water level at this area was 0.5-1 m. The experiment lasted for three months.

135
Fortnightly sampling was done for studying the growth of clams. Water temperature was noted in the field using an ordinary thermometer and the pH was measured with a digital pH meter. Salinity, dissolved oxygen, nitrite, nitrate and phosphate were estimated using standard methods.
The initial length, width, thickness, total weight and meat weight of clams were measured from random samples. Measurements were made every fortnight on 25 small and 10 large clams.
Statistical analysis
Correlation coefficients were calculated to test the mutual relationship of various parameters observed at pen site. ANOVA test was carried out in order to test the significance of length, width, thickness, meat weight and total weight of small and large clams in the two temperature and two salinity combination. Analysis of variance on feeding rates of two feeds z. e. mixed phytoplankton and Tetraselmis sp., was separately carried by following the method for factorial experiment on three factors, each at two levels, the factors being temperature, salinity and size of the animal. Mean feeding rate under different combinations were computed and significance of difference between pairs of means was tested by computing standard error of difference as
2 EMS SE (di) =
n r /
where EMS is the Error Mean Square; 'n' the number of combinations; and 'r' the number of observations; computing the least significant difference,
LSD = '(0.01) X SE„y
Results
Growth : Observations on the growth of clams in linear dimensions (length, width and thickness) and weight show that in small and large clams the growth was more in higher salinity

136
(15%o) under both room temperature and 33°C. However, growth in width in small clams was more in low salinity under both the temperatures. In the case of thickness, it was more in low temperature - high salinity combination for both the size groups of clams. As regards growth in weight, maximum values for small and large clams were in higher temperature-higher salinity combination. The meat weight increase in large clams was more in both the salinities under higher temperature, whereas it was more or less constant in small clams in all combinations.
TABLE 1.
Pen
Comparison of growth in and laboratory
Initial length
SmaU 15.7 Large 30.8
length (mm) of Villorita cyprinoides in the pen
I month
4.5 2.4
Increment 11 month III month IV month
1.8 — — 3.2 3.3 —
Laboratory
28+l°C &5%o
28±1°C &15%o
33°C &5%o
33°C &15%o
SmaU Large
Small Large
Small Large
Small Large
14.7 27.1
13.1 26.6
12.8 22.5
11.9 20.7
2.9 1.8
5.5 1.9
3.2 3.7
6.5 6.9
2.1 0.7
2.1 1.7
1.2 0.9
1.0 2.1
0.5 0.2
0.7 0.3
0.6 0.6
0.8 0.3
0.7 0.1
0.8 0.5
1.1 0.7
0.9 0.2
In the field the small clams grew 6.3 mm in two months, after which all of them died, probably due to predation by crabs. During this period the average monthly increment in thickness was 1.8 mm. The large clams had an iilcrement of 8.9 mm in length in three months, 11.2 mm in width and 8.7 mm in thickness. There was an addition of 8.3 g in total weight and 0.9 g in meat weight. A comparison of growth (in length) of the clam in the field (pen) and laboratory is given in Table 1.

137
Feeding rate: The feeding rate was higher in small and large clam when fed with Tetraselmis sp. (Feed 2) than with mixed phytoplankton (Feed 1). In all cases the feeding rate increased with increasing temperature and salinity and the maximum rate was recorded in 33°C - 15%o combination, whether it was phytoplankton or Tetraselmis sp.
Hydrographic parameters : The values of dissolved oxygen and pH of the culture media in all combinations of temperature and salinity were in the normal range, varying from 3.84 ml/1 to 6.54 ml/1 and from 6.9 to 7.5 ml/1 respectively. The range of nitrite values was 0.0 to 3.15 |j.g at/1, nitrate 0.2 to 18.5 ^g at/1 and phosphate 0.0 to 16.8 jig at/1.
In the field the salinity was very low initially and till end of August coinciding with the southwest monsoon and then increased to 9.7%o by October. Dissolved oxygen ranged from 4.0 ml/1 to 5.2 ml/1, pH 6.5 to 8.2; nitrite 0.0 to 1.33 jUg at/1, nitrate 7.0 to 10.8 ^g at/1 and phosphate 2.2 to 13.6 |xg at/1.
Analysis of variance on growth in terms of length, width and thickness revealed that the interaction between temperature and salinity is significant. Similar analysis carried out on total weight and meat weight revealed that neither salinity, nor temperature has differential influence.
Analysis of variance on feeding rates obtained when the clams were fed under two levels of three factors viz. temperature, salinity and size, reveals that the feeding rates were different under different levels of all the three factors. It is also observed that the interaction between temperature and size of the clam is highly significant.
Salinity showed a positive correlation with length, width, thickness, total weight and meat weight, but temperature showed positive correlation only with length.
Discussion
Water temperature and salinity in the field were found to be influenced by the monsoon rains. The oxygen values were

138
always high probably due to the shallowness of the area where the concentration is expected to be comparatively higher, especially due to the influence of the monsoon rains. Variation in pH was not very wide. Nutrients were high during the monsoon months of July and August.
The study of growth rates in laboratory experiments reveal that growth was more in higher temperature and higher salinity. The mean growth rates in length of two size groups were pooled and classified as follows :
TiSi T,S, T,S, T,S,
4.5 mm 6.5 mm 6 mm 9 mm
This clearly shows that the growth increment is higher at higher level of temperature and salinity.
It was observed that growth of clams in the field was also influenced by increase in temperature and salinity. Statistical analysis indicates that salinity and temperature has a positive correlation with growth.
On comparison of growth rate of clams in the laboratory with that observed in the field, it is found that in both cases growth was faster in higher temperature and higher salinity. Growth was found to be more rapid in the field than in the laboratory.
The mean rates of feeding on mixed phytoplankton (x 1(F cells/ml/hr/clam) are classified according to two levels of temperature and size of the clams. The mean rates (rounded off to integers) obtained were as given below :
Salinity 1 (5%o)
Salinity 2 (15%o)
T,Z,
42
46
T,Z,
35
38
T^Z,
79
84
T ^ ,
60
64
The difference can evidently be attributed to difference in the temperature.

139
Similar was the case with Tetraselmis sp. The mean rates (rounded off to integers) are given below :
TjZ, T,Z, V , T ^ ,
Salinity 1 (5%o) 127 105 148 122
Salinity 2 (15%o) 135 110 155 127
This shows the effect of temperature in increasing the feeding rates.
Studies also indicate that the feeding rate was high in higher salinity and that the rate of feeding on Tetraselmis sp. (12 ^m) was higher than on mixed phytoplankton (30-70 n,m). Feeding rate of 2 size groups of clams (10-50 mm and 25-30 mm) indicates that the rate of feeding is directly related to the size of the clam; the larger the clam the more is the feeding rate per hour.
The effects of temperature and salinity on bivalve development have a more direct application to the ecology of the animal in their natural environment' than the effects of feeding selected species of algae as food. The feeding experiments are important for laboratory work and for possible eventual hatchery operations.
Comparisons between laboratory and field studies are complementary and provide a means of iterating towards improved knowledge. The present study thus may be considered a step towards the direction.
Conclusion
Clams in the higher temperature and higher salinity combination (33°C and 15%o) showed significantly higher growth rate. Feeding rate was found to be significantly higher in higher tempjerature (33°C), higher salinity (15%o) and in larger clams. Feeding rate was higher with Tetraselmis sp. than with mixed phytoplankton. Statistical analysis of the field experiments also shows that growth was more rapid in high temperature and high salinity conditions. Comparison of growth rate in the field and laboratory revealed that growth was faster in the field.

CMFRI Spl. Publ, 1993; 54 : 140 - 150. 26
A STUDY ON PHYTOPLANKTON PIGMENTS AND PRIMARY PRODUCTIVITY IN
THE COCHIN BACKWATER DURING SOUTHWEST MONSOON SEASON
PREETHA PAUL G. S. DANIEL SELVARAJ
Research Scholar Supervising Teacher
Introduction
The fishery resources of any aquatic ecosystem mainly depend on the magnitude of primary and secondary production which are influenced by various physical, chemical and biological factors. The phytoplankton production and distribution vary considerably in the estuarine ecosystem. The Cochin Backwater is a unique estuarine ecosystem in the west coast of India influenced by southwest monsoon during June-September. The Emakulam Channel in the Cochin Backwater system forms the main source of fertile estuarine waters to feed several hectares of potential aquaculture sites during high tide and to enrich the neighbouring marine environment during low tide. The present investigation deals with the distribution and abundance of phytoplankton pigments (chlorophyll 'a', V, 'c', carotenoids and phaeo-pigments) and primary productivity in the Emakulam Channel in relation to the environmental parameters during the southwest monsoon season commencing from June to September 1990.
Material and methods
The area of investigation covered three zones viz. (1) South zone (opp. to Shipyard), (2) middle zone (opp. to Malabar Hotel) and (3) barmouth zone (opp. to Aspinwall) in the Emakulam channel of Cochin Backwater extending between the barmouth and the railway-cum-road bridge having the overall depth range of 5-10 m and a depth (euphotic) of 1.25-1.75 during monsoon season. Weekly sampling was made regularly from the three fixed stations on the same day from surface, mid-depth and

141
near-bottom, between 0830 and 0930 hrs. Apart from the regular collection, diurnal data were collected on hydrography and phytoplankton production during July from surface and bottom at bihourly interval between 0630 and 1830 hours. Hydro-graphic parameters were estimated adopting the standard methods. Phytoplankton pigments and primary productivity by light and dark bottle technique were estimated by standard methods. In addition, major phytoplankton groups were identified to study their relative abundance during this season.
Since the measurements were subjected to diurnal, micro-distributional and experimental sources of variability, care was taken in the processing of data; and as far as possible individual values were not considered for results and discussion. From the weekly data collected, fortnightly, monthly and season's average were estimated. Depending on the intensity of monsoon rainfall, the period of study was divided into two halves, viz. June-July (with heavy rainfall) and August-September (with low rainfall) to treat the data on environment and phytoplankton production. The euphotic waters and the water column below the euphotic depth were treated separately to study the depthwise distribution and abundance of nutrients and phytoplankton pigments. The values obtained for the three stations were pooled together to get, the average picture of surface waters and the column waters in the Emakulam Channel for the different parameters; and multiple regression analysis was done to examine the influence of hydrographic parameters on phytoplankton production in the surface and water column.
Observations
Rainfall: The Emakulam Channel had the rainfall of 1900 mm during May-September 1990. The monthly rainfall recorded from May to September were 560, 398, 681,186 and 75 mm for the respective months with the peak in July.
Temperature, salinity and dissolved oxygen : Water temperature at surface and bottom ranged from 27.6 to 28.9 and 24.3 to 28.1°C with mean values of 28.05 and 26.5°C respectively. In general, high values were recorded in the south zone (Station-1). Very

142
low values were observed at the bottom (mean 25.3°C) during August-September. The overall average of surface and bottom in the study area was 27.25''C.
Salinity at surface and bottom ranged from 0.54 to 15.44 and 0.91 to 29.82%o with the mean of 4.79%o and 15.38%o respectively; and higher values were recorded at surface aind bottom during August-September. The overall average for the water column was lO.C
Dissolved oxygen at surface and bottom ranged from 3,26 to 4.06 and 2.2 to 3.94 ml/1 with the mean of 3.77 and 3.02 ml/1 respectively. Low values were recorded at the bottom during August-September (mean 2.54 ml/1) while surface water did not show any remarkable variation between the first and second half of the season. The overall average of surface and bottom in the study area was 3.4 ml/1 during this season.
Nutrients : The concentration of reactive phosphate-P at surface and bottom waters ranged from 2.45 to 12.35 and 0.96 to 5.15 |j,g at/1 respectively. In the euphotic column and the water column below the euphotic depth, mean values in the study ai"ea were 6.29 and 4.02 |ig at/I (mg at/m^) respectively. In surface and column waters, high values were recorded during June-July. The values were always higher at surface layers especially in the south zone (Station -1). The overall average for the season v\? as 4.45 |xg at/1.
The concentration of nitrate-N at the surface and bottom ranged from 1.63 to 17.7 and 0.63 to 6.65 \ig at/I repsectively. In the euphotic waters and the column below the euphotic depth mean values were 9.48 and 5.44 |j,g at/I respectively. High values were always recorded at surface during June-July with the highest at station-1. The overall average for the season vms 6.41 iig at/1.
The concentration of nitrite-N at the surface and bottom ranged from 0.58 to 3.45 and 0.3 to 1.49 |J,g at/I resjsectively. In the euphotic waters and the column below euphotic depth, mean values were 1.33 and 0.82 fig at/1 respectively. High values were

143
recorded at surface during June-July in general and the highest at Station-1. The overall average in the study area for the season was estimated as 0.94 p,g at/1.
Phytoplankton pigments : In surface waters, concentration of chlorophyll 'a' ranged from 5.19 to 26.63 mg/w? with progressive increase from June to September showing highest values in September at Stations 2 and 3. In the euphotic column, the mean concentrations were 6.75 and 17.51 mg/m^ during June-July and August-September, while in the water column below the euphotic depth the values were 2.01 and 5.54 mg/m^ respectively.
The concentration of chlorophyll V ranged from 1.56 to 8.12 mg/m^ in surface waters with high values recorded at south zone during June and August. In the euphotic column, the mean concentrations for June-July and August-September were 3.49 and 3.21 mg/m^ while in the water column below the euphotic depth the values were 0.3 and 1.33 mg/m^ respectively.
Chlorophyll 'c' values ranged from 1.39 to 6.49 mg/m^ in the surface with high values recorded during August-September especially at Stations 2 and 3. In the euphotic column of the study area, the mean concentrations for June-July and August-September were 4.05 and 4.9 mg/m^ while in the water column below the euphotic depth the values were 0.81 and 1.05 mg/m^ respectively.
In surface waters, the concentration of total chlorophylls (a+b+c) ranged from 12.79 to 35.13 mg/m^ with progressive increase from June to September, with the maximum recorded at stations 2 and 3 in September. Their mean concentrations in the euphotic and waters below euphotic depth for the season were 19.96 and 5.52 mg/m' respectively with high values recorded during August-September in both cases.
The concentration of carotenoids ranged from 0.2 to 8.78 mg/m^ in the surface water with progressive increase from June to September and highest value recorded in September. In the euphotic layer and the water column below the euphotic zone.

144
the mean values were 3.5 and 1.3 mg/xv? respectively during this season.
The concentration of phaeo-pigments in the surface water ranged from 3.27 to 12.27 mg/m^ showing an increasing trend in general from June to September with some fluctuations among the stations. In the euphotic column of the study area, the average concentrations for June-July and August-September were 4.73 and 7.39 mg/m^ whereas in the column below the euphotic depth, the values were 2.06 and 4.25 mg/m^ respectively.
Primary productivity : In the surface waters, gross production varied from 0.241 to 2.55 g C/m^/day with progressive increase from June to September. Among the stations, high values were recorded at Station 2 (middle zone). The overall average for the season was 0.960 g C/m^/day in the surface while the column production was 1.349 g C/m^/day in the study area. Net production also showed an increasing trend from June to September with the overall average of 0.668 g C/m^/day in the surface and 0.815 g C/m^/day in the euphotic column having the mean euphotic depth of 1.5 m in the study area during the southwest monsoon season.
To confirm the productive potential of bottom waters, productivity experiments were conducted in July during diurnal observation by incubating the bottom water samples in the normal sunlight available at surface. The gross values showed that the bottom waters were relatively more productive than the surface waters during high tide while the net production was found to be relatively less in the bottom water.
Statistical analysis : Multiple regression analysis revealed that 83% of the variations in production in the surface waters and 86% of the variations in the euphotic column could be explained by the independent variables. In the surface waters the total chlorophylls gave high positive correlation with gross production (r = 0.81) followed by carotenoids (r = 0.67) while in the euphotic column salinity gave high positive correlation (r = 0.79) followed by total chlorophylls (r = 0.76).

145
Results and discussion
In 1990, the Cochin region had the local rainfall of 1900 mm during southwest monsoon season which amounted to 80% of the average monsoon rainfall of this region and the data indicated the onset of southwest monsoon in May during this year. The rainfall indicated that the intensity of rainfall was very less during the second half of the normal monsoon season (August-September).
The water temperature, dissolved oxygen and salinity showed vertical gradients in the Emakulam Channel with higher values of temperature and dissolved oxygen and low values of salinity at surface and the reverse at bottom respectively during this season. The occurrence of very high saline water with relatively very low temperature and dissolved oxygen values at the bottom during August-September indicated the incursion of upwelled sea water into this estuary during monsoon season as reported by Ramamirtham and Jayaraman (1963, /. mar. biol. Ass. India, 5 (2) : 170-177). The undersaturated oxygen values observed in the surface layers during monsoon season might be attributed to the utilisation of dissolved oxygen for the decomposition of dead planktonic organisms resulted by the sudden change in environment by the rainfall and partly due to the high concentration of nitrates in the first half (June-July) and mixing of upwelled sea water with the surface layers during the second half of the season (August-September).
The distribution of phosphate, nitrate and nitrite also exhibited vertical stratification with very high values at the surface and euphotic column and showed a decreasing trend in their concentration from June to September in relation to the decrease in rainfall with the low values recorded in September. Their abundance in surface layers with higher concentrations at the south zone (Station-1) and the decreasing trend in values from June to September corresponding to the reduction in the rainfall indicated that the main source of these nutrients was through the fresh water discharge than from the sea of in situ recycling process. The very high values of nutrients observed

146
during the first half of the monsoon might indicate the influence of excess fertilizers from agriculture and industrial wastes derived from land drainage. The mean N/P ratio of 1.65 obtained for the season (in the presence of high values of N and P) revealed that this low ratio was due to the occurrence of unusually higher concentration of reactive phosphates. The observations also revealed that the nitrogen values were mainly derived from the nitrates in the backwater.
Phytoplarikton composition showed two modes during this season. The initial mode observed during the peak monsoon (June-July) was of lesser concentration dominated by freshwater forms like Oscillatoria, Oedogonia, Spirogyraj Scenedesmus and Volvox and brackishwater species of Coscinodiscus, Ceratium, Rhizosolenia, Navicula and Biddulphia when the salinity was less than 4%o. The next mode of high magnitude was dominated by higher salinity tolerant species of Coscinodiscus, Rhizosolenia, Chaeloceros, Fragilaria, Nitzschia and Pleurosigma during August-September when the salinity of water was 5-20%o. Qasim et al. (1972, Mar. Biol, 12 : 200-206) have reported that species of Coscinodiscus can bloom in salinity range of 0-25%o.
Among the pigments, chlorophyll 'a' was dominant, followed by 'c'. Chlorophyll V was relatively more in the south zone in surface waters during June and August after the peak rainfall in May and July respectively, when the salinity of water was very less. The relatively higher concentration of chlorophyll 'b' observed in the bottom waters during August-September might be due to some species brought from the marine environment during high tide (when the salinity was consider-ally higher by the incursion of upwelled sea water). The richness of chlorophyll 'a' indicated high productivity in the estuary. Generally carotenoids showed an increase corresponding to the magnitude of chlorophyll 'a' in the estuarine environment.
The distribution of total chlorophylls (a+b+c) in general followed the same trend as that of chlorophyll 'a' showing a small peak in June-July and the primary peak during August-September. The decline in the first peak of total chlorophylls

147
during July-August (when the salinity was very less) followed by the formation of a secondary peak of high magnitude during August-September (when the salinity was relatively high) indicated succession of phytoplankton species of high salinity tolerance during the second half of the season. In general, when a sudden reduction of increase in the intensity of rainfall was noticed in a fortnight, its influence was greatly reflected in the backwater especially on salinity and phytoplankton pigment concentration in the next fortnight.
In the case of phaeo-pigments also, generally a progressively increasing trend was observed from June to September in par with the production trend of chlorophyll pigments with a small peak in the first half and the primary peak in the second half of the monsoon season. When high concentration of phaeo-pigments was observed in a fortnight, a reduction in the live pigment concentration could be noticed in the following fortnight; and similarly when the phaeo-pigment concentration was lesser in magnitude, an increase in the live chlorophyll concentration was also noticed in the following fortnight especially during August-September. The decrease in concentration of live chlorophylls and the relative increase in the percentage of phaeo-pigments in the backwater indicated the mortality of phytoplankton cells in the estuary. By the onset of monsoon, the marine species present in the backwater (during summer months) become inactive, die and added to detritus and are gradually replaced by the multiplication of brackishwater and freshwater species. These forms appear in considerable number during the peak monsoon months and disappeared by death and decay when fresh water discharge is reduced as a result of decline in the intensity of rainfall and salinity of backwater increased towards the close of monsoon season; and are replaced by succession of higher salinity tolerant species from the coastal marine environment by tidal influence.
The estimate of chlorophyll pigments available in the water column below the euphotic depth was considerably high especially during the second half of the season and they tend to die due to lack of light for photosynthesis and other

148
unfavourable conditions and as a result, increase the phaeo-pigment concentration. Since the sudden variations in the environmental parameters such as salinity, temperature and dissolved oxygen at surface waters were not remarkable when compared to the column waters below the euphotic depth, the percentage of phaeo-pigments in relation to total chlorophylls was relatively less in the surface waters (22-25%) and more in the water colunnn especially below the euphotic depth (35-42%), indicating that the death rate was higher in the water column below the euphotic depth during this season.
As in the case of phytoplankton pigments, the rate of primary production showed an increasing trend from June to September in general at all the three stations with high rate obtained during the second half of the season and the surface waters proved highly productive. The estimated gross and net production in the Emakulam Channel for the season (4 months) were 164.58 and 99.43 tonnes of carbon/km^ respectively. From the result, it is understood that approximately 40% of column production is utilised at the primary level itself.
The relatively higher values recorded in the bottom water samples during high tide (when exposed to normal sunlight at surface) indicated that bottom waters were potentially productive and the low net production observed in the bottom waters might be attributed to high metabolic loss as a result of sudden change in the environment such as from the sea to estuary by tide and from bottom to surface.
Primary productivity in relation to tides gave better results than with time of the day in the diurnal experiments. The record of high production at high tide and low at low tide indicated that the main source of phytoplankton production was from the sea through the tidal influence than from the upstreams. The observations also revealed that although vertical stratification of water was prominent in the estuary during this season, considerable mixing of bottom water with surface layer was felt in this djmamic environment as evidenced from the increase in salinity values, abundance of chlorophyll
149
pigments and increase in the rate of primary production in the surface waters during high tide.
Since the temperature and dissolved oxygen content in the surface waters did not show any remarkable variation in par with the wider fluctuations in phytoplankton production, their relationship on phytoplankton productivity was not significant in the estuary during this season. Although, salinity was found to influence phytoplankton production in the euphotic column as per statistical analysis, its influence on primary production was found to be relatively less in surface waters where the highest production was obtained. The very high concentration of nutrients with low phytoplankton production observed during the first half of the season (June-July) revealed that the nutrient was not the limiting factor to govern phytoplankton production in estuary during the season.
Conclusion
From the above results, the present study reveals that the rainfall beyond an optimum level is not favourable for phytoplankton production in the estuary since heavy rainfall has greater impact on other environmental factors such as the intensity of flood flow, tidal influence, turbidity, light penetration and salinity of water, eventhough enormous quantity to nutrients are brought into the estuary by the fresh water discharge from land drainage. The high values of phytoplankton production obtained in the present investigation are more related to the low intensity and intermittent reduction in the rainfall and their influence on the hydrographic factors in the estuarine ecosystem.
A close consideration of the foregoing facts indicates that it might be the combination of various parameters that is necessary to create an optimum condition to favour phytoplankton production. The environmental condition prevailed in the second half of the monsoon season and particularly in the last fortnight (second half of September) of this season provides an optimum condition in the study area for high primary production during the southwest monsoon season. Among the three

150
zones studied, south zone is considered as the relatively less productive region, characterised by elevated bottom topography with heavy flood flow, relatively higher water temperature, oxygen and nutrient concentrations and with relatively low tidal influence, salinity, phytoplankton pigment concentration and primary productivity; and barmouth zone is influenced greatly by tidal influence during high tide and flood flow during low tide due to the narrowness of barmouth; while the middle zone is considered as the typical and ideal region for phytoplankton production with moderate flood flow and tidal flow and relatively lesser ecological disturbances owing to its wider topographic nature.

CMFRI Spl. Publ, 1993; 54 : 151 - 155 27
EVALUATION OF IMMUNE RESPONSE IN FINFISH
SuDHA, P. V. K. C. GEORGE Research Scholar Supennsing Teacher
Introduction
The main obstacle in maximising production in aquacul-ture is that of losses due to diseases. So it is essential to develop methods for control and prevention of diseases. Modem methods of intensive aquaculture techniques impose considerable stress on animals which make the host susceptible for infections which in normal condition may not be able to over come the host defence mechanism. Hence in aquaculture we face two types of diseases i. e. one, already existing diseases and the other is the emerging diseases. We have two major methods of control at our disposal, one is the therapautic method using antibacterial, antiviral and antiparasitic drugs. The other is enhancing the resistance of the host against the pathogen. Of these the first one is highly expensive, labour intensive and has other side effects. The technique of improving the resistance of the host involves the selection of resistant strains of fish and immunising them against known pathogens existing in the environment. Newer techniques of immunising fish offer a better and attractive method.
Considerable effort is being applied to understand the basic mechanisms of fish immune system. However, the information available is meager. We know that fish posses several parameters of adaptive immune response. But we have not reached a stage of manipulating this for mounting protective reactions against common infections and diseases. Hence this work was taken up with a view to standardise the immunological techniques and to initiate further work in this field.

152
Material and methods
Tilapia sp. {Oreochromis mossambicus Peters, 1852) were obtained from CIBA and Edavanakkadu Private Farms. The fishes were acclimatised in well aerated tanks and kept at a water temperature of 28 ± 2°C. They were fed on pelleted feed. Vibrio alginolyticus H ^ 30 and Aeromorms sp. Gy 28 were used for preparing bacterial antigen. The formalin killed and carbol-saline bacterial antigens were prepared as per the methods of Johnson and Flyn (1982, /. Fish. Dis., 5 :197-205). Soluble protein antigens were also prepared using Ovalbumin and Bovine Serum Albumin (BSA) respectively. Each group was triplicated taking 6 animals in each group. Other environmental parameters of the experiment were kept constant through out the experiment. The fishes were administered with an antigen dose of 1x10* cells/gram body weight in the case of bacterial antigen and soluble protein antigen at the rate of 25 jig/body weight. The antigens were administered intra-peritoneally and intra muscu-larly. Serum was collected after 10 days of primary injection and 5 days of secondary injection. The serum collected from each group were used for slide agglutination test and various precipitation tests as per the methods described by Cruickshank, 1975.
Results and discussion
Various immunological tests were carried out in fish sera. The fishes were divided into 5 groups. The Group 1 animals served as control throughout the experiment.
Group 1 : Agglutination tests to find out Vibrio antibody did not produce any alterations when the sera of this group was incubated with the antigen. However, the sera produced clumping of Aeromonas cell suspension when it was incubated with the cell suspension. However no clumping was obtained when serum was diluted upto 1:10. The various precipitation tests were also carried out using the sera against Vibrio, Aeromonas, Ovalbumin and BSA. All these tests did not show any precipitation.

153
The 1st group sera revealed no antibodies against Vibrio, BSA and Ovalbumin. The reaction of Aeromonas antigen at low titre gave suspicion of an early exposure. These animals were collected from field farms where frequently Aeromonas hydrophila was isolated.
Group 2 : Group 2 animals revealed production of antibodies against Vibrio antigen. After 10 days of the 1st injection the agglutination carried out showed dumping of cells upto 1:20 dilution of the serum. After 15 days these clumping titre reached 80. On the 10th day of 1st injection the precipitation test proved negative. However, after 15 days precipitation bands appeared in test tubes and agarose gel tubes. The titre reached 20.
In this group agglutinating antibody appeared much earlier compared to the precipitating antibodies. There were reports in fishes agglutinating antibodies appeared earlier. (Hodgins et al. 1967, /. Immunol, 99 : 534-544). The precipitating antibody response in our study was mild. Agglutinating antibody response against Vibrio antigen was good in our studies. The observation agreed with earlier findings (Tatner and Home 1983. Dev. Compar. Immunol, 7 : 465-472).
Group 3 : This group was treated with Aeromonas antigen. The sera collected on 10th day of 1 st injection produced agglutination with Aeromonas bacterial cell suspension upto a titre of 40. The same sera produced precipitation upto a titre of 80. The fishes did not withstand for a second injection of the antigen. Repetition of the experiment produced the same result. The postmortum findings of the fishes died showed accumulation of clear fluid in the peritoneal cavity and pericardial cavity. The gills were pale. The peripheral blood vessels were congested. The heart was congested and the chambers were empty of blood.
This group of animals showed a very good antibody response in the 1st injection itself. Agglutinins and precipitations reached a titre above 40. Fish generally responded very well to Aeromonas antigen (Anderson and Klontz 1970, /. Fish. Res. Bd. Canada, 27:1389-1393; Evenberg et al 1988. /. Fish. Dis.,

154
11 (4) : 337-350). The fishes when tested initially before the experiment also revealed the presence of agglutinating antibodies. Later they gave good antibody response. Subsequent injection killed all animals indicating probability of circulatory failure or shock. Though extensive work on anaphylaxis in fish had not been undertaken, evidences existed in fish about the presence of anaphylaxis (Dreyer and King 1948, /. Immunol, 60 : 277-282; Ellis 1981, Dev. Compar. Immunol, 6 : Suppl 1). Our observation also did not rule out the possibility.
Croup 4 : These animals were tested for production of antibodies against Ovalbumin. The sera revealed precipitating antibodies after 10 days of primary injection and the titre reached upto 40. After 2nd injection the precipitation titre reached 1:160. Six fishes from this group were used to produce amnestic response. After 50 days of the last injection of antigen they were reinoculated with the antigen. The serum revealed precipitating antibody on the 3rd day of injection and the titre reached beyond 640.
This group of animals gave very good precipitation reaction when compared to other groups. The secondary response also was enhanced. In mammals ovalbumin produced very good response. In the case of fishes no detailed study had been undertaken with respect to ovalbumin.
The much enhanced and quick antibody response obtained in our study when ovalbumin treated animals were reinoculated with the antigen after 50 days supported the existence of amnestic response in fishes.
Group 5 : The antigen tested in this group was BSA. In this group BSA produced precipitating antibody only when it was given with adjuvant. Pure BSA did not produce any precipitation. The sera from the animals which were given BSA with adjuvant produced precipitation lines upto a low titre of 5 which were not consistent. The sera collected after 5 days of second injection gave a precipitation reaction upto a titre of 20. BSA in pure form was reported to be poorly antigenic in fishes like Carp (Avtalion et al 1980. Phyl Immunol Memory, pp. 113-121).

155
The same authors were of the view that BSA given to Tilapia produced antibody response. But we did not get an immune response with pure form of BSA.
Though many immune tests were available to evaluate the immune responsiveness of fish, we were confined to a few simple tests. Among these tests it was found that agglutination tests were useful in detecting response against bacterial antigens. Precipitations were demonstrated in our experiments against various antigens, but the precipitation tests were found to be difficult to conduct.

MANUALS OF RESEARCH METHODS AND SPECIAL PUBLICATIONS ISSUED UNDER THE POSTGRADUATE PROGRAMME IN MARICULTURE,
CENTRAL MARINE RSHERIES RESEARCH INSTITUTE, COCHIN.
*1. Manual of research methods for crustacean biochemistry and physiology. CMFRl Spl. Publ., 7, 1981, 172 pp.
*2. Manual of research methods for fish and shellfish nutrition. CMFRI Spl. Publ., 8, 1981, 125 pp.
3. Manual of research methods for marine invertebrate reproduction. CMFRI Spl. Publ, 9, 1982, 214 pp.
*4. Approaches to finfish and shellfish pathology investigations. CMFRI Spl. Publ., 11, 1983, 43 pp.
*5. Application of genetics in aquaculture, CMFRI Spl. Publ, 13, 1983, 90 pp.
*6. Manual of research methods for invertebrate endocrinology. CMFRI Spl. Publ., 14, 1983, 114 pp.
*7. Production and use of Artemiam aquaculture. CMFRI Spl. Publ, 15,1984,74 pp.
*8. Manual on marine toxins in bivalve moUuscs and general consideration of shellfish sanitation. CMFRI Spl. Publ, 16, 1984, 100 pp.
*9. Handbook on diagnosis and control of bacterial diseases in finfish and shellfish culture. CMFRI Spl Publ, 17, 1984, 50 pp.
*10. Mariculture research under the Centre of Advanced Studies in Mariculture. CMFRI Spl. Publ, 19, 1984, 109 pp.
*11. Water quality management in aquaculture. CMFRI Spl. Publ, 22,1985,96 pp.
'12. A practical manual for studies of environmental physiology and biochemistry of culturable marine organisms. CMFRI Spl. Publ, 25,1986,45 pp.
13. Theorems of environmental adaptation. CMFRI Spl. Publ, 26, 1986, 50 pp.
14. A manual for hormone isolation and assay. CMFRI Spl. Publ, 41,1986,46 pp.
15. Manual of techniques for estimating bacterial growth rates, productivity and numbers in aquaculture ponds. CMFRI Spl. Publ, 42, 1986, 27 pp.
16. Nutritional quality of life food organisms and their enrichment. CMFRI Spl Publ, 43, 1987, 28 pp.
17. Mariculture research under the Postgraduate Programme in Mariculture, Part 2. CMFRI Spl Publ, 53, 1993, 176 pp.
18. Mariculture research under the-Postgraduate Programme in Mariculture, Part 3. CMFRI Spl Publ, 54, 1993, 155 pp.
19. Mariculture research under the Postgraduate Programme in Mariculture, Part 4. CMFRI Spl Publ, 55, 1993 (in press).
20. Meiriculture research under the Postgraduate Programme in Mariculture, Part 5. CMFRI Spl Publ, 56, 1993 (in press).
* Out of print.