Download (6MB) - Eprints@CMFRI - Central Marine Fisheries ...
Upload
khangminh22Category
view
3download
0
OBSERVATIONS ON THE ECOljOGY AND FCCD HABITS OF THE *PEARLSPOT’
EIROPLUS SURATENSIS (BUXH)
DISSERTATION SUBMITIED BY
RENI. K.
IN PARTIAL FULFILMENT OF THE DEGREE OF
MASTER OF SCIENCE (MARiajLTTJRE)
OF THE
COCHIN UNXVERSm OF SCmiCE AND TECHNOLOGY
IBwtrf cf fti Cftntr*! .-*'5Cociiffi
Qitt reC7>>vi-t...... .....................................-TV
t..... ... , 'C"R
POST-GRADUATE reO(3!AM« IN MARiaJLTORE
GEKIKAL MARINE FISHERIES RESEARCH D B m U IE
(Indian Council of Agricultural Research)
COCHIN - 682 031-
JANUARY 1994

C E R T I F I C A T E
This is to certify that this Dissertation is a bonafide record
of work carried out by Kum. Reni K. under my supervision and that no
part there of has been presented before for any other degree.
Dr -i .BENSAMPrincipal Scientist and Head, Demersal Fisheries Division, Central Marine Fisheries Research Institute,Cochin - 682 031.
Countersigned by:
Director,Central Marine Fisheries Research Institute, Cochin - 682 031.
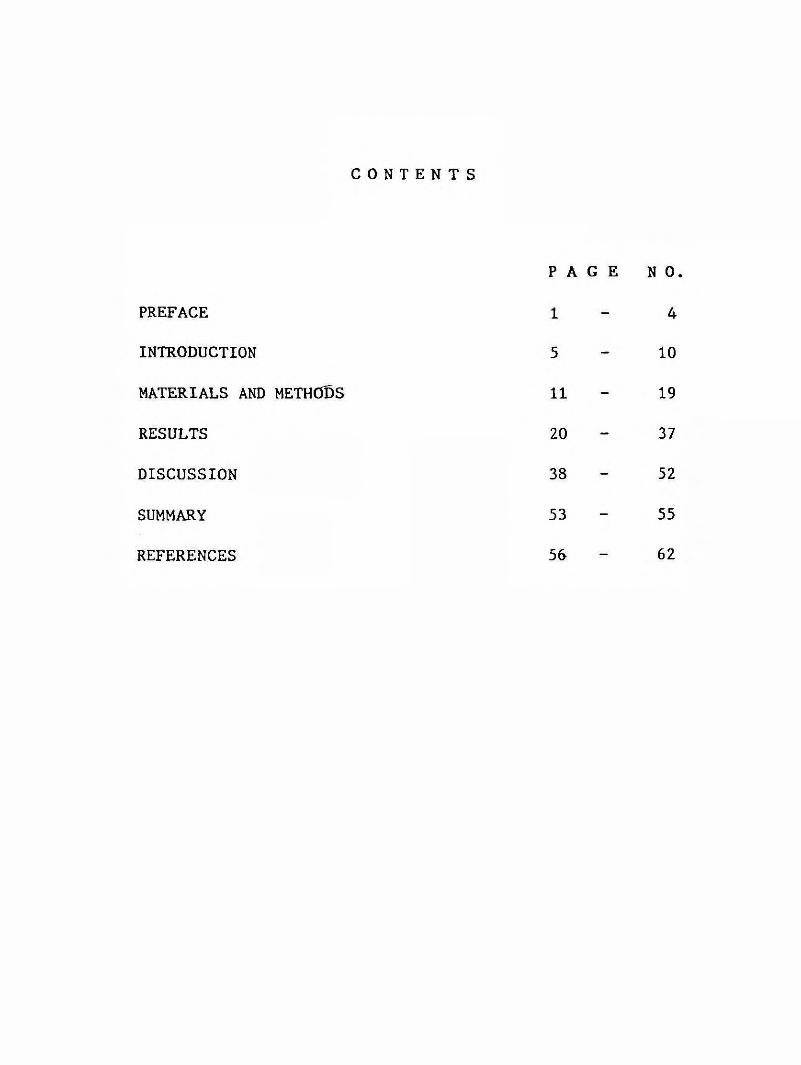
C O N T E N T S
P A G E NO.
PREFACE 1 - 4
INTRODUCTION 5 - 1 0
MATERIALS AND METHODS 11 - 19
RESULTS 20 - 37
DISCUSSION 38 - 52
SUMMARY 53 - 55
REFERENCES 56 - 62

Explosion of human population and the decreasing
food supply from terrestrial sources have diverted man's
attention towards the aquatic environment for
supplementing his food requirements. Thus, aquaculture
has been gaining importance for achieving additional
production of proteinaceous food. The continually
expanding demand for protein-rich fishery products, the
stagnating capture fish production, the risk prone,
capital-intensive and technology-oriented deep sea
exploitation, the ever-increasing fuel costs, coupled
with the need to generate more employment opportunities
for the rural traditional fishermen have all created an
awareness among scientists, policy makers, fishfarmers
and enterpreneurs to evolve new strategies for converting
the vast derelict swamps and low lying water bodies
adjacent to backwaters and coastal zones into productive
fish farms at a comparatively low cost and with the
locally available technologies. In view of these
factors, it is generally felt that the traditional
extensive fish culture practices with minimum inputs is a
more attractive, feasible and economically viable

solution to increase fish production, rather than to
concentrate on an already stagnating coastal capture
fisheries or to venture into the uncertain deep sea for
exploitation.
The selection of productive strains of fish,
crustaceans and molluscs for successful culture in
different environmental conditions becomes a continuing
process. The endemic Indian Cichilds represented by two
species Etroplus Suratensis (Bloch) and Etroplus maculatus
(Bloch) are traditionally considered to be suitable species
for culture practices. They occur along the coastal tracts
of penisular India and in the land-locked hrakishwater and
freshwater lakes of the country. E. Suratensis, Che larger
of the two is a delicious table fish considered as
important for culture in brackish and freshwater (Bensam,
1993); and considerable attention has been given in recent
years through research and development programmes relating
to the culture of this fish.
Several workers have dealt with the food, feeding,
reproductive behaviour, biology, ecology and culture
aspects of this fish. The present study deals with the
variations in the feeding habits of four size groups in 3
different natural brackish water systems; as well as the
food preference of different size groups in laboratory

conditions. This dissertation comprises of the following
chapters: -"INTRODUCTION", "MATERIAL AND METHODS" ,
"RESULTS", "DISCUSSION", "CONCLUSIONS" and "REFERENCES".
"INTRODUCTION" includes the importance of the study, a
resume of relevant literature and scope of the study. A
description of the study area, station positions and
treatment of data are included in "MATERIAL AND METHODS".
"RESULTS AND DISCCUSSION" relates to the environment,
hydrological parameters, different items in the stomach
contents, food preference etc. "RESULTS AND DISCUSSION"
presents the salient features from the analyses of the data
and discussion in relation to earlier findings. Various
aspects of the findings of the present investigations are
given in the chapter " SUMMARY " followed by
"REFERENCES" containing the relevant literature cited in
the dissertation,
I place on record my deep sense of gratitude to my
supervising Guide Dr.P.Bensam, Principal Scientist, and
Head Demersal Fisheries Division, Central Marine Fisheries
Research Institute, for valuable guidance, constant
encouragement and whole hearted support throughout the
period of study and in the preparation of the dissertation.
My thanks are also due to Dr. P.S.B.R. James, the Director,
CMFRI, for the excellent facilities provided to carry out
this work. I am much obliged to Dr.C.Suseelan, Senior
Scientist for valuable suggestions and encouragement. My
thanks are also due to Dr .N .G .Menon, Senior Scientist for
help.
I express my gratitude to Mr. T. V . Sathyanandhan,
Scientist for the help rendered in the statistical analysis
of the data. I also thank Dr .V .Kun jukrishna Pillai, Senior
Scientist for the facilities provided to me. I am much
obliged to Dr.C.P. Gopinathan for affording help and for
valuable suggestions.
I further record my gratitude to M/s. P . M . Aboobeckar,
M.J. John, A.Nandakumar , C.N. Chandr asekharan . C.G.Thomas,
V . A.Kuttappan and M.K. Anil Kumar for their timely help in
the course of this study.
I am very much thankful to all Senior Research
Fellows at this Institute, especially to Mr. Rameshan and
Mrs. Shirly Thomas who have rendered valuable co-operation
and help throughout this study. I further thank all my
class mates, M/s Akshaya Panigrahi, Joe K. Kizhakudan, M.
Muruganandham, Rammohan.M .K, Santhosh N.K, Johny P.K,
Elsamma Ithack, Shoba Viswanadhan and Rekha J. Nair for
the whole hearted support and help in the course of this
study.
I am grateful to the Indian council of Agricultural
Research for providing me with a Fellowship during the
present study.

I N T R O D U C T I O N
Aquaculture is the farming of commercially important
aquatic animals and plants In fresh, brackish and marine
water masses under conditions of husbandary, management,
nutrition and breeding. In the world as at present, the
day by day increase in human population has drawn more
attention to the finite nature of aquatic resources as a
source of protein. The trend of production from it,
including the sea has reached a stage of stagnation. Thus,
it is inevitable to go in for generation of additional
resources through culture along with capture, in order to
boost protein supply for the ever-increasing human
population.
The family Cichilidae is composed of over 100 species
of fishes found in fresh as well as brackishwater habitats
in Africa, South America, North America and parts of Asia.
The larger African lakes of Malawi, Victoria and Tanganyika
contain about 500 endemic species of Cichlids (Fryer and
lies, 1972). Their presence in the southern Continents and
Islands such as Madagascar and Sri Lanka suggests that
although they might have originated in freshwater, their
ancestors were able to withstand brackish and marine waters.
Etroplus is the only endemic Indian cichlid genus.
Day (1889) has reported three species of Etroplus frora
Indian waters. They are E,canarensis (Bloch), E, maculatus
(Bloch) and E. suratensls (Bloch). Of these E. canarensis
is confined to north Karnataka region. E. maculatus and E.
suratensis are the two widely accepted species and are
reported by many workers from Indian and Sri Lankan waters
(Jerdon, 1848,; Bleeker, 1863; Gunther, 1892; Day, 1865.
1878, 1889; Munro, 1953; Gunther, 1962).
E. suratensls is distributed widely in brackish and.
freshwater environments from Goa in the west coast to
Chilka lake area in the east coast. It is popularly called
the "Pearl Spot", on account of possessing spot along the
lateral line and has been introduced in interior water
sheds like dams and natural freshwater lakes from early
times. The erstwhile Fisheries Department of the
Government of Madras has transplanted this species into the
interior districts of Bellary and Anantpur and in the farms
at Sunkesula and Ippur (Nellore) , where it has established
itself. (Jones and Sarojini, 1952).
Fingerlings of this fish have been transplanted
successfully from north Karnataka to Mahin creak in Bombay
(Kulkarni, 1947) in 1941 and in subsequent years fron
Sunkesula to certain irrigation tanks of Baroda (Mosses,
1942, 1944).

Fry of E. suratensis from the erstwhile Madras
Presidency have been introduced to Bidyadhari area in
Bengal (Jaganatham, 1946) and these have attained maturity
and spawned successfully there (Job and Chacko, 1947). The
fish was introduced then to the Hyderbad State in 1942 from
Madras and it has established there also (Rahinullah,
1946). Since this fish has recently assumed considerable
importance for coastal aquaculture, it is considered
desirable to investigate its food and feeding habits, food
preference etc; and hence the present work was undertaken
to study these aspects.
The earliest studies on Etroplus in India was on
their systematics and distribution. Important among these
are that of Day (1888). Several authors who have studied
the biology of one or the other species have dealt with the
food and feeding habits briefly. Alikunhi (1957) has
described the food of E. suratensis and reported that from
19 mm length onwards they feed mainly on zooplankton; but
as growth progresses, they feed upon filamentous algae such
as Spiro^yra and vegetable matter. Bhaskaran (1946) has
observed the food habits of E. suratensis youngones from
freshwater habitat and reported that they feed mainly on
filamentous algae, marginal plants and detritus. Bhaskara
(1946), Raj (1916), Sebastian (1942) and Job ( 1947) have
discussed briefly the biology of E. suratensis. Chacko
(1949) has dealt with the food and feeding of the fry and

fingerlings and concluded that they feed rarely on higher
marginal plants, insect larve and filamentous algae. Costa
(1983) has made biological studies of the Pearlspot from
three different habitats in Sri Lanka. A comparative study
of the food of E. suratensis juveniles collected from
estuarlne and freshwater habitats at Mangalore was made by
Devaraj e^ £l (1975). They found that filamentous algae
and detritus formed the dominant food item in the stomachs
of fishes collected from estuarine waters; but in the
fishes collected from freshwater, insect larvae and
detritus were found to dominate. The digestibility of
aquatic macrophytes by E. suratensis and the relative
merits of three indegenous components as markers with daily
changes in protein digestibility were studied by De Silva
and Perera (1983). De Silva £t al (1984) have studied some
aspects of the biology of this species and its food and
feeding habits from brackish water and freshwater reservoir
in Sri Lanka, Gopalakrishnan (1973) while describing the
taxonomy and biology of the species, has dealt with the food
and feeding habits too. The weed-destroying habit of this
species is reported by Gopinath (1948), Job (1947)
have studied it's biology from freshwater tanks, including
food and feeding habits. Jayaprakash (1980) in his work on
the biology of E. suratensis has studied the food and
feeding habits of different size groups of the species,
collected from Veli lake in Trivandrum. He found that

there is a gradual change in food preference as growth
progresses from diatoms and zooplankton to filamentous
algae and then to higher aquatic plants. Jayasinghe et al.
(1985) have conducted feeding experiments on fingerlings of
some cultivable fishes using two formulated feeds. Kezhava
et al (1987) studied the feeding habits of E. suratensis in
the Netravati-Gurpur Estuary. Mohobia (1987) in his
studies on Indian Cichlids has evaluated the biochemical
composition of E. suratensis and Ej_ maculatus. Pillay &
Hora (1962) have observed that adults of E. suratensis are
herbivorous, feeding on Chlorophyceae, Cyanophyceae and
decaying organic matter. Prasadam (1971) in his studies on
the bilogy of E. suratensis in Pulicat Lake has reported
that the fish is mainly a vegetable feeder with seasonal
variations in feeding activity. According to him, smaller
size groups predominantly feed on microvegetation and
larger size groups utilise mainly macrophytes.
Premjith e^ ^ ( 1987) have made a comparative study
of the biochemical composition of the stomach contents of
E. suratensis and Tilapla mossamblca. Padmanabhan (1980)
observed the food and feeding habits of E. suratensis. Raj
and Surriara (1916) in their studies on freshwater fishes of
Madras Presidency have briefly dealt with the food and
feeding habits of E. suratensis. Sebastian (1942) has
studied the role of E. suratensis and E. Maculatus in the

control of mosquitoes. Thampy et (1987) studied the
growth, survival and production of E. suratensis from
brackishwater ponds. Varghese (1975) has briefly dealt
with the food and feeding habits of E. suratensis in his
studies on the biology, morphology and development of
Cichlids in India. He has reported that this species is
omnivorous, showing a certain degree of specificity with
regard to the food Items it consumes and that it displays
definite variations in the diet in some months. He has
also reported that there is no change in the quality of
food between males and females and between ’zero’ year
groups and adults.

MATERIAL AND METHODS
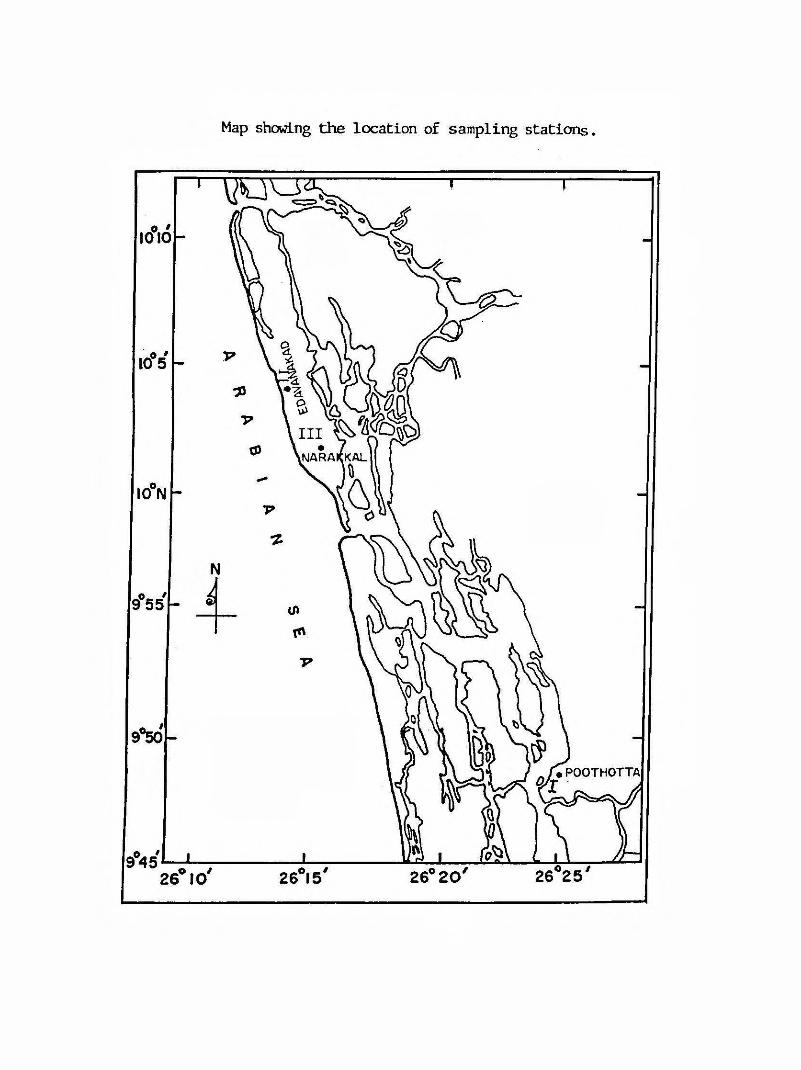
Three representative natural systems were identified
for the present study, viz. (i) a brackish water system
near the Matsyafed fishfarm at Poothottaj about 72 km
south east of Cochin (ii) a brackishwater system near
Kannuvilakettu at Edavanakadu about 30 km north of Cochin
and (iii) the feeder Canal of Matsyafed fishfarm at
Narakkal about 20 km north of Cochin. The fish samples,
ambient water and sediment were collected from each station
fortnightly. The water and sediment temperatures were
recorded at the station itself, using a standard
thermometer .
Data on the following parameters were collected from
all the three stations.
Ambient water
Temperature
Dissolved oxygen
Salinity
pH
Nitrate
Nitrite
Phosphate
Silicate

STATKM I POCyiHOTTA
STATICW I I . EDAVANAKADU

STATION III. (NARAKKAL)

S o i l
The upper layer of soil weighing 250 g was collected
for a study of the benthos and identification of the algal
complex. Algal complexes includes, Blue green algae
Oscillatorla
Nostoc
Diatoms
Pleurosifima
Navicula
Nitzschia
Amphora
Amphipora
Cosclnodiscus
Combylodiscus
Microcystis
Merismopedium
Miscellaneous items
Roots of higher plants
Decayed plants and animal matter
Fish egg and fish scales
Microfauna
Copepods
Amphipods
Gastropods
Polychaetes

Collection Methods
Etroplus suratensls of different size groups were
collected from each station by using a castnet at
fortnightly intervals. For estimation of salinity, ,
nitrate, nitrite, phosphate and silicate surface vater
samples were collected in narrow-mouthed, screw-capped and
airlight polyethylene bottles of 250 ml capacity; and
brought to the laboratory after preserving them in an ice
box. One litre water was collected from the site in a
polyethylene bag and 10 ml of 10% formalin was added to it
and kept for settlement. After one week, the uppeY water
was drained off and a known volume of the remaining vater
with the already settled microcflora and microfauna was
analysed under a microscope.
For estimation of dissolved oxygen, the surface and
bottom water samples were collected in 125 ml glass
stoppered bottles, without entangling any air bubble
within; and the samples were fixed with 1 ml each of
Winkler A and B solutions respectively at the collection
site itself. The bottles were shaken gently till a
precipitate has formed and brought to the laboratory for
analyses.
Temperature
Temperature values of the surface and bottom water
were recorded at the collection site itself by a mercury
thermometer ranging in values between 0 - 50®C.
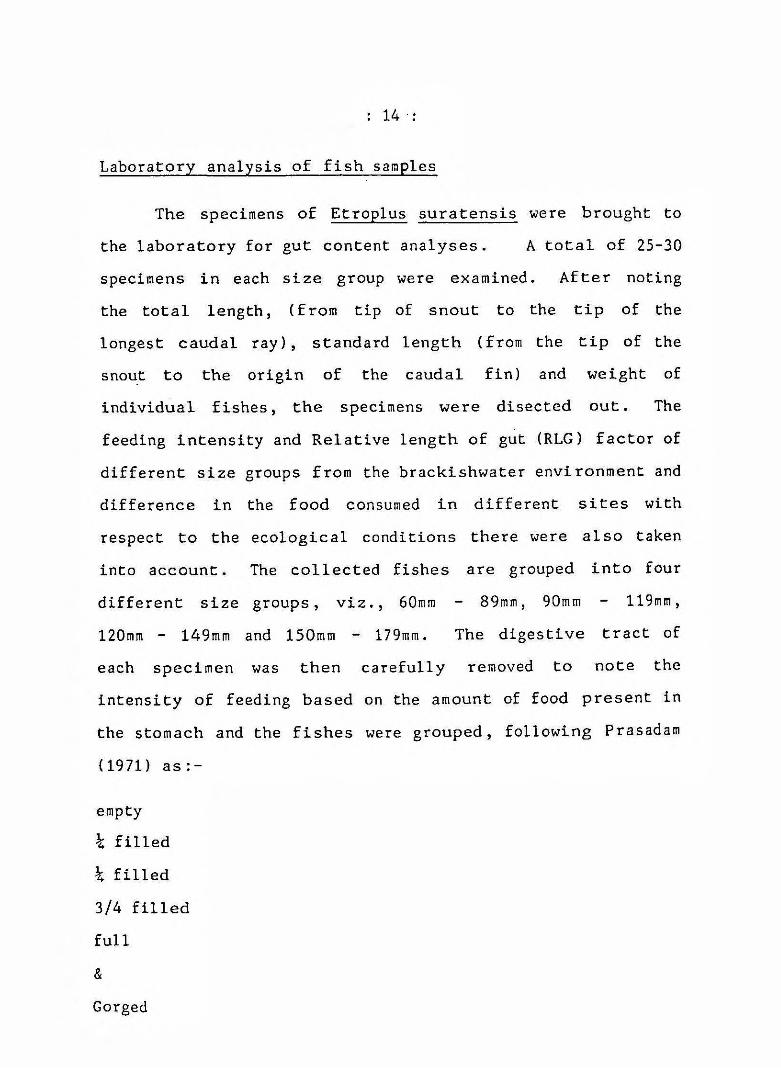
Laboratory analysis of fish samples
The specimens of Etroplus suratensis were brought to
the laboratory for gut content analyses. A total of 25-30
specimens in each size group were examined. After noting
the total length, (from tip of snout to the tip of the
longest caudal ray), standard length (from the tip of the
snout to the origin of the caudal fin) and weight of
individual fishes, the specimens were disected out. The
feeding intensity and Relative length of gut (RLG) factor of
different size groups from the brackishwater environment and
difference in the food consumed in different sites with
respect to the ecological conditions there were also taken
into account. The collected fishes are grouped into four
different size groups, viz., 60mm - 89mm, 90mm - 119mm,
120mm - 149mm and 150mm - 179mm. The digestive tract of
each specimen was then carefully removed to note the
intensity of feeding based on the amount of food present in
the stomach and the fishes were grouped, following Prasadam
(1971) as:-
empty
k filled
k filled
3/4 filled
full
&
Gorged

The feeding index was calculated using the formula,
No. of fishes with filled stomachFeeding Index = ^ 100
No. of fishes examined
Gut contents analysis
The methods of assessment of food of both marine and
freshwater fishes have been evaluated critically by
different authors (Hynes 1950, Pillay 1952). The latter has
summarised the various methods described by Hynes (1950)
into three main categories (i) Numerical (ii) Volumetric
(iii) Gravimetric. Numerical method includes (a) Occurence
(b) Dominance (c) Number and (d) Point methods.
Due to the presence of diatoms, micro and macro
materials and detritus in the gut contents of E . suratensis,
volumetric or gravimetric estimations could not be
satisfactorily adopted for the present study. Therefore the
Number method was found to be suitable and convenient over
the other methods.
The stomach contents were carefully removed and
examined immediately in the fresh condition as far as
possible. Otherwise, they were preserved in 57o formalin
(Ushakumari and Aravindan, 1992) for subsequent examination.
Larger elements were Isolated and Identified with the help
of a hand lens, while smaller organisms were identified
using a microscope upto their generic level as far as
possible. Gut contents were made up to a known volurr.e and

1 ml of it was taken and analysed; and the number of
diatoms, filamentous algae, detritus, digestive organic
matter and fragments of higher plants was recorded.
Laboratory analysis of water samples
Dissolved oxygen
Dissolved oxygen content of water samples was
estimated by the "Modified Winkler Method" as given by
Strickland and Parsons (1968). The already preserved oxygen
bottles were added with 2 ml of concentrated Hydrochloric
acid and were shaken till the precipitate is completely
dissolved. 10 ml of the preserved samples was pipetted out
and titrated against Sodium Thiosulphate solution till the
blue colour disappears.
Salinity
Salinity of the water samples was estimated by "Mohr -
Kundson method" as given by Strickland and Parsons (1968).
lOcc of the seawater sample was pipetted out into a 250 cc
conical flask. Four drops of potassium chromate solution
were added and using a mechanical stirrer, the sample was
titrated against Silver nitrate solution.
pH
The pH of water samples was measured in the
laboratory, using a digital pH meter. The pH meter was
standardised by using buffer solutions of acidic and
alkaline solutions. The buffer solution of pH 9.2 was
Prepared by dissolving a tablet having 9.2 in 100 ml
distilled water and the acidic buffer solution was
prepared by dissolving a 4.2 pH tablet in 100 ml distilled
water.
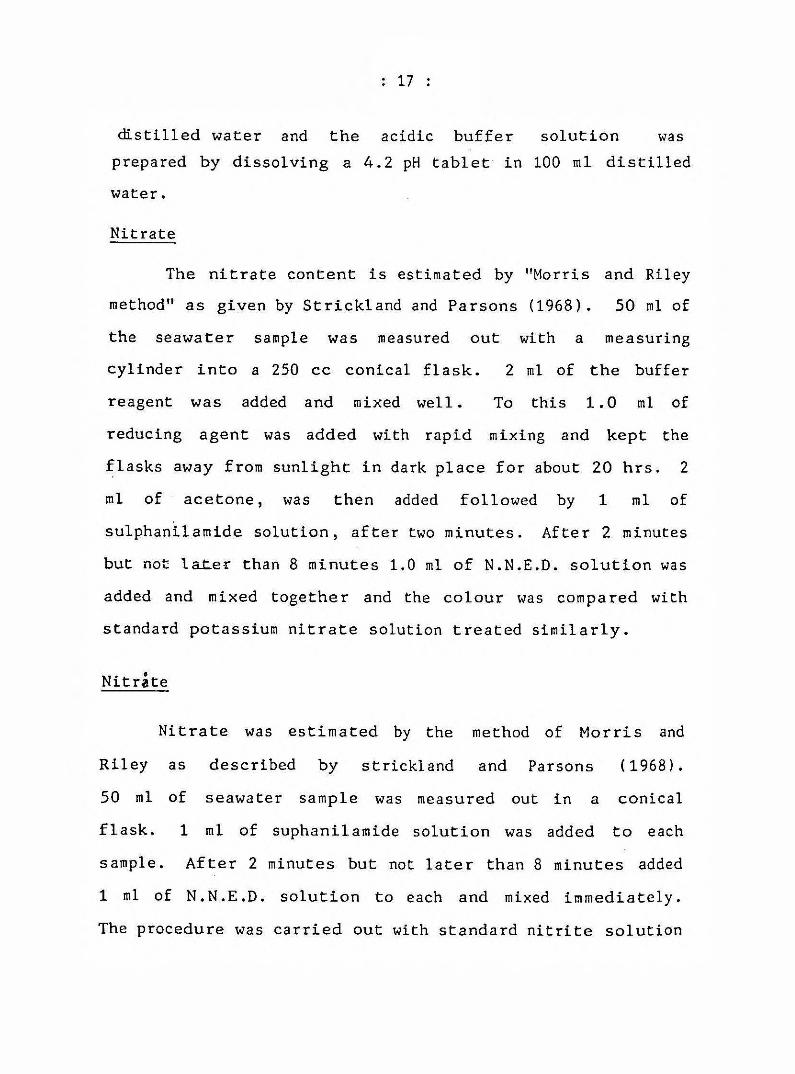
Nitrate
The nitrate content is estimated by "Morris and Riley
method" as given by Strickland and Parsons (1968), 50 ml of
the seawater sample was measured out with a measuring
cylinder into a 250 cc conical flask. 2 ml of the buffer
reagent was added and mixed well. To this 1.0 ml of
reducing agent was added with rapid mixing and kept the
flasks away from sunlight in dark place for about 20 hrs. 2
ml of acetone, was then added followed by 1 ml of
sulphanilamide solution, after two minutes. After 2 minutes
but not lat.er than 8 minutes 1.0 ml of N.N.E.D. solution was
added and mixed together and the colour was compared with
standard potassium nitrate solution treated similarly.
Nitrite
Nitrate was estimated by the method of Morris and
Riley as described by Strickland and Parsons (1968).
50 ml of seawater sample was measured out in a conical
flask. 1 ml of suphanilamide solution was added to each
sample. After 2 minutes but not later than 8 minutes added
1 ml of N.N.E.D. solution to each and mixed immediately.
The procedure was carried out with standard nitrite solution

also and the colours were compared using spectrophotometer
at 543 n m .
Phosphate
The method given by Murphy and Riley, as described by
Strikland and Parsons (1968) was used for the determination
of reactive phosphorus. To a 100 ml sample 10 + 0.5 ml of
mixed reagent (Molybdic acid, ascorbic acid and trivalent
antimony) was added and mixed. After 5 minutes, preferably
within 2-3 hours the extinction of the solution was measured
at 885 nm. For standard phosphorus, different
concentrations of potassium dihydrogen phosphate was made
and the graph was plotted. Phosphate is expressed in
/ug at/1.
Silicate
Dissolved silicon of the sample was estimated by using
the method of Mullin and Riley (1955). To a sample of
25 ml, 10 ml of molybdate solution (prepared by dissolving
4g. of ammonium molybdate in 300 ml of distilled water and
12 ml of concentrated hydrochloric acid (12N) was added.
After 10 minutes, 15 ml of reducing agent (consisted of
metol + oxalicacid + sulphuric acid) was added to the
sample. The solution was allowed to stand for 2 hours to
complete the reduction. The absorbance was measured against
the blank at 810 nm. Standard graph was prepared by using

VARIOUS SIZE GROUPS OF FISHES USED KiR GUT OOKTENT ANALYSIS
EXPERIMENTAL SET UP FCR POOD PREFERENCE EXPERIMENT

FEED I Splrogyra
FEED II. Salvinia

the standard silicate solution and silicate is expressed in
yugat/1.
Feeding Experiments
To find out the food preference of E«suratensis, a
feeding experiment was conducted in the laboratory using two
weight groups of the fish (4 gra and 20 gm body weight) for a
period of 5 days. The fishes were kept in plastic troughs
containing 57o« salinity brackishwater through out the
experiment and food materials like Spirogyra, Salvinia clam
meat and. pelleted feed, prepared from 25% Spirogyra, 257o
ground nuC oil cake, 20% rice brass, IT'L tapioca powder, 2%
cod liver oil, 2.87o vitamin mix and 3.2% mineral mix
were given to them. The fishes were fed daily in the
morning and evening hours at a rate of 10% of the body
weight. The unconsumed food and faecal matter were removed
from the troughs.

RESULTS AND DISCUSSION
RESULTS
The results of various environmental parameters
studied and gut contents analyses made during the period
June 1993 to October 1993 are given below.
Temperature
The readings made from the samples of ten
observations during June - October showed that the
variations were more or less similar in all the three
stations. In station I (Poothotta brackish water system),
the values of water temperature have ranged between a
minimum of l l^ Z in June and a maximum of 30,5°C in
September. In this station, air temperature has ranged
between a minimum of 28°C in June and a maximum of 32.5°C
in September. In station II (Edavanakadu brackish water
system), the values of water temperature have ranged
between a minimum of 27.5°C in July and a maximum of 31.5°C
in September; and the values of air temperature ranged
between a minimum of 28°C in July and a maximum of 32.5°C
in September. In station III (Narakkal feeder canal near
CIBA), the values of water temperature ranged between a
minimum of 27.5°C in June and a maximum of 31°C in
September; and air temperature ranged between 28°C in June
to 32°C in October. (Table-3).

OL
ilO
35
3 0
25
20
'«/» <!/» «/,■ 5?if ^ 2/99*0
iO-
£t>ftVANAKADU CS/c,l,V3jj) X---— X WATEa.TTSMP|£a^T-y,^j[i
•——• /'/R TCiM Pis R H TO/I.E
3 5
O C 3 0 -
2 5 -
?0-
X-
O C
y
4 0 -
3 5 .
30-
25
20-1
Ai/AWCC Li fS//foo (j_( >WATCRTeyiP pATUfie
■ ---'’/iTeMP(i/i»-ru/2G
•y/» /6/i 9 ^ /y /-3 ^ /a r^ ’5 s / f
Cal/a.e.Ucr>

$y.
n
-M 'I
poothotaOtat.c- r) pH
\
r/t *17 i7:r t i t I’l t *neATC» e r COI.I.CC T lox
tf
t
75pH 7
EDA\f fMK/DU (station n) pH .— .
'6 /6 9 /7 n /T 5 /6 n / a 6 /9 2 t!9 7 /« i Z \Jn

vr-
> 3 -
2-
1 -
Q 4-
3 -
1 ■
o-r
C 4-:;>N.
o 3 - •o
2-
POOTHOTTA ( S l ^ i r o o l )
----- -D o
8/6 ,il:f 2 1 23/& //|9 23/9 ?/'o
PuXsiro Co Ici-hoo
>>■ 10
MARACKAL (Sl iroo Ml) 0 0 .
ISJ6 ajfiX
2«/<j 7ji0 zijio
EDAV^AJAKADU CSialT nH)£50i --- -
l6 !6}s ejjj /?/? 5/5rD c t l d i 0 ^ C o ife c - ix O r )
20 7U(i— > X
Ijio

BO)->
U-i
T J0)
T3)-iOO(Uu
cni JcG)1-1UU3C
OBOw
U-l0
•CO
QJ i->3 A-i
T-^ oCO X> 4-)
O’0 Oc 0ro
l-HVh(U c4J ocu 1-1B 4->TO CO!-•CO COCL
(0o
•1-(0 0o
0
“O>»
J 2
c :♦wCO4 J
0)CJ
r-4<D
f—4 rOfO
H
o o CM CO orH m m CO CM CM r>. vD
<r • • • • > • •CM r«* 0 0 Ch CO o 1 o m
CM CvJ
Ow
ON
u
ilB0)ua0)
w
OJcna
5
VO
00
COo
CTnCNJ
ON OUO
CO • #CM v£> o
ON C3N
♦ OCO
CO mo
CO • 0CM ON
CM
Ov£> m
00CM
tnOnCM
CMcn
CMcn
Ocn
5fO
CNi
o
ON< !■
CO
o
00 T—Ho
oON
CO
CMO
\£>
OvD
\D
CO
m oCNI
ONCM
ONm
CO
oCM
OCM
CO
U<U
4 Jcd
• Oo
U
s
B
C
CM
s
B-2C
c
COw
CO
oCM
O«sf
'Clin
S 5VDCM
OON
vOON
OvD
CO o cr> o CMm
o or>* CO• r>.O T-( r> .
m
OO o vD o oCO O r>* CM < r vO CO
• ON • • • • • •0 0 r>. CM ON CO o CO o CM o
CM t T“(
- O CO o vDr>«. CM iTl CO O vD vO CO
• CO • • • • • « v£>r ' . CM CO o 0 0 C?N m
CM CM T—1
VOh>. ON CO VO o o ON
o m r>«. O vO •sf <rH • C7\ • • rH COr-( r>* 00 CM o vO rH t n
CM
\DCO CM op vD m o
CM O CM CO o OOCM • 00 • • • • vD •
CO CM CM CO o t-H vO
Oy£)
OCM
J-)CO i J0 0 4J 4 J CO
CO CO 0 00 0 0 0 3 _
c1-C a. cc c •rH
0> •HAJ53 Q) 0)
CD
4 J 4 J COO h •H CO OVi U J-o 4J 4J r —iX •H *r-(Cu 2 z C/3

EO»-«U-l
* s
'Hoo0)
(SiXJc(U•r4u4J
<UEO(A
CO(UD
>
CO
(A>->cuu(UEfO03a
fd
COuCO
z
g•r^uCO
J Jw
J Jw
a5
o OCO CsJ O v£) CMtH tH CO Csl
o cr- O o • • mCM CM CO CO • v£? o vX> r H
T —(
m v£> 00 o 00 COvO m CM <1- O r>» CT OO
• • • • « • •r>«. CJN CM CO r>. O m m
CO
r>.
O '
CM ro
0 ^ ^—1 O o ^ 0 0 kDCM m O CTn o ^ CM
O ■ • • • tH0> CM r> . o rH CO o o c ^ •
CO CO y£>E CM(1) L 1Q m o o o VO CM v£> CO(U CM m O ' CO C7^ CO r>. o >W • • • • • • • •
CO hN. CO CM CTv o r>* mCO CM
00 \D O CM CMm r>. CM CM Csl o
f>x CTV • • v£) O •<rtH CM O ' CO « • • •
OCM
5
CM
Oin00CM
r>. m Om m
r>. • •r> . 0 0
CM
<T^CM
<T'CM
CT>CM
Om
CM
COvj-c n
CO
•sf
vD
y£>
00
vOv£>
m
om
COr» .
CO
CMO
v£5
o00
vO
CvJvD
•vtCM
o ^
vOc n
5•
om
Cs|CM
om
vX5
O•r^
0 )-•
1
CO4 J
Q>O
(1)
VD O■s f
om CMCO
m0 0
o0 0
vD • 0 0 • COtH CO r>.
CMCM CO ■s t r«. CJN CO
vDm
o o Om m m
# • •00 00 O'
CM CM
v£>tHCO
ov£>
\ 0
O o Or». m \D0 • •
r>. mCO
CM
Q)
.D
e2
£
:S
cx£
a)XJto
- J
4 -) J JCO 4 J J J CO
OO CO CO 00hJ 00 CO 2 - .
a .c c= c
E •H c1-1
c•H
1-1
c_J<DXJ <3)•H 4 J CO (D 0) J J
J J J J COc Q - 1-1 CO O
CM cn U U 1-Jq o J J J J w
CO •W i- (d w D -. Z z C/D

EO
•S■Soo(1)>->
V)XJc<D
•r^V-ij
u
oX Juo
B(U
X Jcu0 )CO
cvj
otHh*.
CO
vD
Om
o ^CN
cn
v f o o CM CMCO tM Csl vD CM O
• • • %oCO
CO rH O 00
oCO O LTl o vO1 CM tH \D m
tH # « « • *CO CO tH vO o o ^
T-H
cyv y-A tH o CM csl CM—^ CT' r o 0 0 o vDo CM • • •CM v£> r o r o CO CT' CO r>.
CM
W o O CM VO 0 0 CM CMO ' o m m O o ^ VO CO o• • • • • • #0 0 r« . T-i
COCMCO
CM c ^ rH r>. vOCM
CflCDP
T—ICO>
ICO
w>-•<uXJa ;sCOuCOa
aT3
IS§
3
Co
•HX JCO
X JC/D
X Jto
3^5
0 0 \D O CO < ra
VD vO CMCO
COuO v£ CO o CM# • > * t
T—1 CM COCM
r o tH 0 0 r-H IT) mCsl
CO
m
r« .
r> .
r>*
ON
mCM
c n
r> .
COCM
00CM
O m
• CO r>. CM CM
oi n CO vO CM
C'JO CO
• r x CMCO • < • vD o>csi CO v d tH 1-H
O r>.r oCM
OuO
o
lA m vD vD # • •« * « • r>.
0 0CM
O i n CM
vDCO
COCO
d
CVJo <x>
CMCMm
COo•rA00o
1-^0 i-t
1
COuuQ>
a
<D
vO o o vD CM o oo tn O' r v 0 0 CM r>.vD • • CJs • • • •tH CO CO
CMCM ro CM CO
o o m CM o ovD ■sj- om t—j r>. CO CO• • • w
m 0 0 CO oCO
CO t-H
< rCO
CO
r o
Q)
X )CO
H
Xa .
l-r0 )XJCO
3
£XB
XJCO00 XJ
COo 0 0
C•H
c cE •t4
Q)•rH
c XJ•rH XJ CO 0)
x : XJC e x -r-4
CM •r^ cn }->q O X J
CO j : : •r*4d C/3 Cl ,
XJCO002 -
C•H
oXJCOu
XJ-rA
XJCOoO
c•r4(1)XJCOo•rH•r4

p H
P values recorded maximum concentration during the
month June in station I and minimum during September, from
8.03 to 6.40. The values in station II were slightly
higher almost all the days of observations, with a maximum
of 8.4 in June and a minimum of 6.93 in October. Inu
station III, the P concentration ranged between 8.5 in
June and 7.13 in October. (Table-3).
Salinity
Comparatively very low values were recorded in
station I, where a minimum of 0.068%* was obtained in the
first week of July and a maximum of 0.498%« in the last
week of September. In station II, salinity has ranged
between a maximum of 4.757o« in June and a minimum of O.6177o®
in July. In the station III, the values ranged between
4.857o*in June and 0.5647co in July. (Table-3).
Dissolved Oxygen
At all the three stations, it showed an almost the
same trend. In station I, dissolved oxygen value ranged
between 4.835 ml/L in July and 3.085 ml/L in September. In
station II the range was 4.578 ral/L in July and 3.012 ml/L
in September; and in station III, a higher value of 4.813
ml/L in July and a lower value of 2.905 ml/L in September

CvUtoi'on
■ MUcJioo

3'I
5O
Col}e.(JXoo
S'/a 1(6 f/;» sfi !7f v/f 2cf9 ?/-« OCoUtcUao
S/s H/t y> Ijfi ;y,j,OsiZi qJCeUa.Ubr>
CoVotJ.eff
*1
z
/ s /6 7 /1 s / i /? /•& iSj>) Z o ji^ ? / » ZO JIO
z

were recorded. In all the three stations during monsoon
months the values were high, ranging from 4,578 ml/L to
4.835 ml/L. (Table-3).
Phosphates
Phosphate readings were fluctuating between a maximum
of 14.2 yugat/L in August and a minimum of 6.6 /ugat/L in
July in station I. Phosphate values ranged between a
maxinjum of 18.04 ^gat/L in August and a minimum of 4.02
/jgat/L in July in station II and the values were between
15.62/agat/L in August and 3.78/ugat/L in July in station
III. (Table--3).
Nitrites
During the study period the values of nitrite was
maximum in July in all the three stations. Nitrite values
ranged between a maximum of 1.64yugat/L in July and minimum
of 0.46 yUgat/L in August in station I, In station II the
values ranged between a maximum of 2.2 in June and a
minimum of 0.15 yugat/L in October (Table--3).
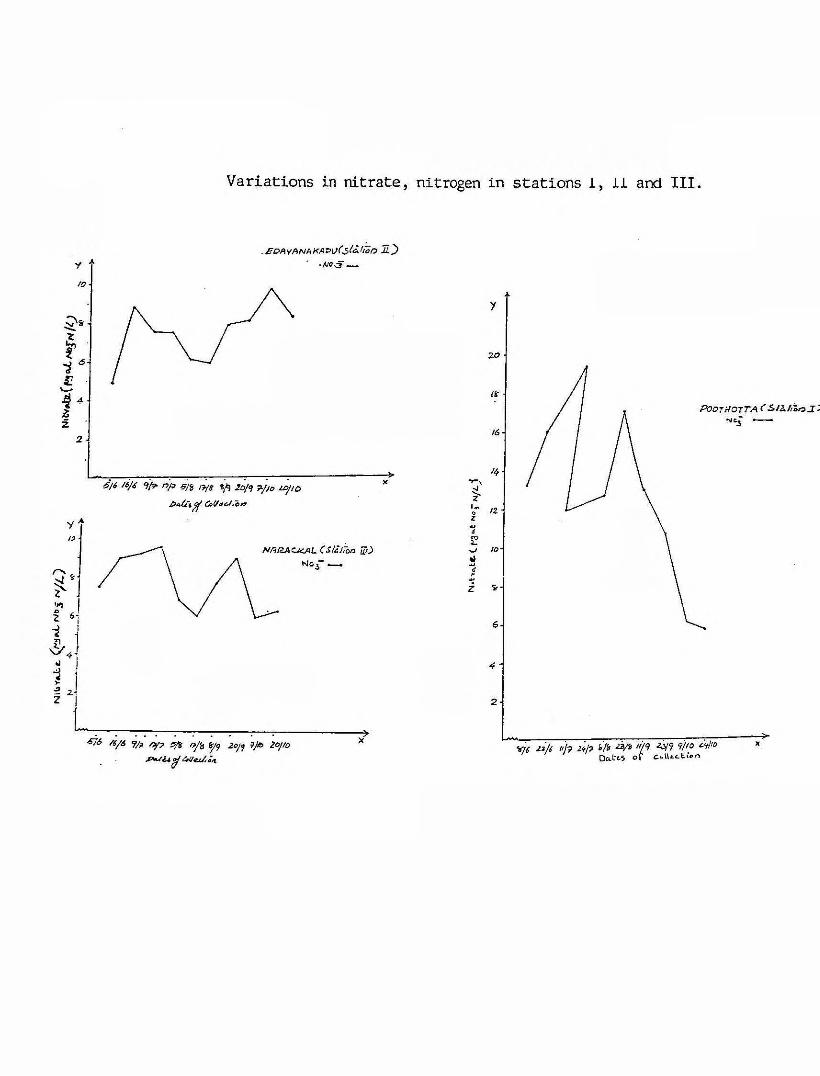
Nitrates
Nitrate values ranged between a maximum of 19.36
/ugat/L in July and a minimum of 5.6 yOjgat/L in October in
station I. In station XI, the values ranged between a


fj)0)
aBCO(n
DOomCM
0)u4 J
^ to ^ ijS r
3^<y
■85CO (0 W V-
oo
1m
0) c/3 (0O Dto O
T-l 0)S C * H
(U
c/i »-• jj C)C X tf)OJ OO-U E C OCX «0 CT3 ^ v>i uh
C l, O
c/) c/3 *0
-S'S aQ a o0.*H u
O E CO O < O
<f)EOiJCO
00c o . »«-l «1-) p> > C G) (0 CO JJ O OOiJ Q> J - CO
Q O E
COO
O o5 $ o or - - csl m
r>.\£> CO c ntH CM
d)
§
4JC/)
I
CM
vO
u
I(1)CX0>
CO
O o o oO o o oCTx tH CO 10 0 t—1 CT' <csj CO m <
O o o oO o 25 o o*<f CM CO CO vDvO vD o CT' COtH CM o^
O O o o2 5 o o o o
o o oo> < r CO CO
<3> r>. o < t CO\D CO v£) tH
rH CO tH
o o O Oo o o o\D CM CTNi n u o CO
CM CO m
oo00\£>n
I4JOo
maximum of 9.6 jUgat/L in October and a minimum of 4.8
jugat/L in June; and in station III these have ranged
between 9.62 yugat/L in July and 5.98 yugat/L in October. (Table-3)
Silicates
In station I the values of silicates have ranged
between a maximum of 58 yugat/L in July and a minimum of
20.6 yUgat/L in June, In station II these were between 36
jugat/L in June and 14 yugat/L in July; and in station III,
between 36.4 yugat/L in August and 15 yugat/L in O c t o b e r . (Table-3)
Algal composition in the environment
In each month, an analyses of_ ona litre of water and
250 g of upper layer of soil samples in the three stations,
have shown the following constituents.
Station I (Poothotta)
The available phyloplankton genera is given in the
Table 4. Bascillariophyceae (Diatoms), Myxophyceae (Blue
green algae) and chlorophyceae were the major constituents.
Diatoms were dominant through out the study period except
during June and July, when filamentous algae like
Oscillatoria and Spirogyra were dominant in the upper
layers of soil and water samples. The diatoms present
were: Pleurosigma, Gyrosigma , Navicula, Nltzschia, Amphora,
Amphipora, Coscinodiscus, Diploneis, and Rhizosolenia.
Blue-green algae have included Oscillatoria and Nostoc.

</)0 )
^-4a .BC3CO
ODOmCM
o(A
CO
G)
u
I
^.5Vi «0w bs 00
Q) cn 05U 3 605 O CD^ 0> 4J2 C *H
WEO
uca
•HQ
&0 . c o >-■>> C JJ cd CO u U 00 CO
o ^acn
ijcQ)e Q>CJ CO
r-( 00•t4tt, <0
o O o Oo O o or>. CNI oON o vO r«.CN r~l CM
O o o O oO o o O otH m r>* <t CMr>. vO ON CO
w csl CM ONcn
CDC
4 JCO
I
OoCOoT—<
a o o oo o o oON OS o c nvr> vO VO T—1vD VD csl olA < r \D c n CTNtH T—1 CO
o O o Oo o o oO' cn r s . cnCM CM nOv£> CO—1 CM
J -
Ia ;AJCl-(U
0 3
o o o oo o oo CO c n CO CMCM v£> o C'J mCO vO
m m
0
1 00

1
<D
IlO
s:cn
-DCO V-
CO 00
CO1-^r-^<u w0 cny\ 5 e•r-l 0) Q)s C
•H
(0 OJ oc x:0) 0£t COe u
£CO CO .-(
It. o a.
iffss03•WQ
Of)c o•H ‘H> , C G> to CD 4 J
m i-i cOa o s
05gUc0)c3 ca i~t 00 •T-} rHu , to
C7'CD
I
o O o Oo o o otn tA ON
o COvX> St cO tH
o o O O Oo O o oCO CO r».
cr> r*N m ■t-H cr*o i lyy <>A
o o O o oo o O o
COr>«* OQ r-» o VOtH cn <r cr> T - (
o O O oo o o o o<3s ■r'* <Jr roKD cO CNJ CO •vfVDt orH
r~*- CO CO CM
crv Ocr* oCNJ 04r- o o00 r>..
IT)-iT,r*'.
>r>3'-3
o\Dro
XJw
f
M
IQ>
i JCuQ>
CO
inO
ooCM
V-
IiJ{JO

Detritus, digested matter and fragments of higher plants
also were noticed in the water and soil samples. (Table-4),
Station II (Edavanakadu)
Diatoms were the most dominant item almost through
out the study period. Among the diatoms, Pleurosigma,
Navicula, Nitzschia and Gyrosigma have occured in abundance
through out. (Table 5 )
Station III (Narakkal)
In this station also diatoms were the most dominant
item in all the months of the study period. Pleurosigma,
Gyrosi^ma Navicula, Nitzschia were abundant. The other
diatoms appearing in smaller numbers included Amphora,
Cosclnodlscus, Amphipora, Diploneis and Merismopedium.
Oscillatoria was found abundantly in October. In July and
August filamentous algae were not recorded. Digested
matter, detritus and sand grains have occurred in good
proportions in the water samples and soil samples.
Miscellaneous items such as roots of higher plants, fish
eggs, fish scales and fragments of higher plants were found
In good proportions. (Table 6 )

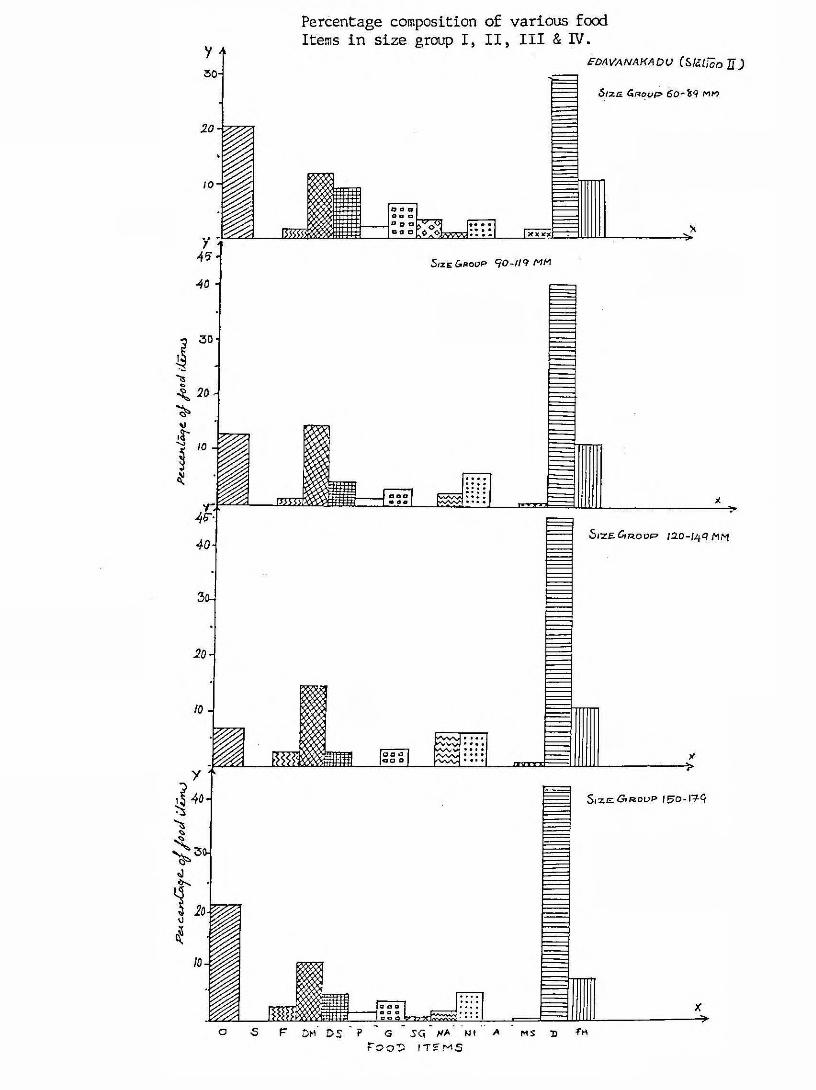
Percentage composition of various food
Items in size groups I , I I , I I I & IV.
Percentage composition of various food
rOOZi IT?MS

Various composition of various food items in size group I,II,III & IV.
AJAIZf\CKAL (iialiooHi;
SneGi^Oop 00‘i9 m m
X
Si-z.e GiK.oop mm
KXXX X K » * X

en
to§r>i
t/ic
■ a - i s03 >-CO 00
n?
r~4(D tflU sin Q <y
■v«< o 4Js: c •H
uG)JZOO»T«<-C u00 c«5 ttsV-»—i
a
^ L
.- u .*w ui ^ x: «t> w
f t - im
Bto
4-iV*Xi
0>M-C iJ00-u ♦H nj
S
<ucc CO r- ClO^ r-Afo n?
rv .
r**
£7»
SOo%
«
r-<tHr-<
00cn•
o •»—#
vO
CO
CM
\DrW
c nm
§ ■V-
O
■S
5
S 's
<T'CO
IO\D
r vr - i
SOf o
o
o
C Oo >
#s j -
t o
4»s f
o
r>4
SOCO
•V OK t
e£
!OOX.
(NO '
CO
c v
(M
mT-<
fsJ
in8o
o
O '05
c ^o
tAo>
tH
cr
eBar\
-HJ
s
fN.o
»m
a>
5o
< t00
t »
O
»ACT
CNf~4
00
CO\0
cn
<J-vD
£
tHI
Ou*ir~i
CM CO

I
c/>Cu
V-4OO
S)
cn•1-I/)Co>CO)-•n(/!)WI
CA4-Jco>
X Jcoo
COEo
X Jt o
O)5
u->
0CDCTO w
1- £<y
(Uo •r^w
•Hs
■s|njC/5 00
»-• O) Q) -U
oox cca OO CO »w
IlH ^ O .
i/> I
w 'O O *g o >- 0 ai-»D.-H t/)
(O COa. cucj) -g o e o o < oa Q.
!-•u
5g3
CTS t-Hr > t H
• • • •O O o o
ON r>.\ 0
« • •cn O o
CO <)■ i n CTnc n r o
• • # «o o r-sT-< —1
IPl \D CNJo O OQ O oo O o
• • oo o o
U-SO ' CO ON CNI
00 v£3 lO• • #
t—1 CNJ mm vD i n
<N •<{■ t-H CT'\£3 in m• « •
O ' < ■ ( N < r
0 0v t r-l o> CO
m• o
T-^w T—I tH
C^Jo> o T-Wv£> vO CO
• • • •
-sJ- O N COC^J T—1 CNj
E e
ese
£ON s
s 0\ r->O ' r-<CO 1 1J 1 o o
o o CVJ i nv O o ^ 1 i-H
* #
w CM C O < t

c•f-l
i-too<uCs3‘iHcn
CMro
O ' O '(N
O
V-I
gONCO
fO
r>.CM
C'J
r>>tH
CM
CT'LOCM
LO
I
05t-4
C/3c(1)
COVi=3CA
W |
c nCO
(A
cd>
4 - )cou
* 6CO£o
4 ^cn
<0
- gCOV-
M
XJed
C/3
o 3
O 'CO
ONCO
< rrH
CO
moCMCM
mooo
CO
0 ^CO
CM
CMo ^
m
mooo
m
tH
r>«.CM
\ o
c n
t n
00
u uy) (U(DCO-U •H to Q E
COm
CMCO
CMr>*CM
mo\ o
c/iO
8<Do Oca
oV-<u
Ic
S CO r- l b o•r^Pm CO
uO
CMON
CM
BB
ON00
Ioy£)
O 'COm
EB
O '
IoO '
00
B B
ON •< t T—I
IoCM
mlOCO
B
•JtH
Iom
CM CO

GUT CONTENTS ANALYSES
A-Size group I (60-89mm)
The major food items in the stomach contents of E .
suratensis from Poothotta brackish water system (station I)
were filamentous algae, fragments of higher plants,
detritus, digested matter, diatoms, copepods, gastropods
and amphipods. Filamentous algae have formed 537o of the
stomach contents in the samples analysed from station I,
Of this, 447o has belonged to blue-green algae and
spirogyra, Chara and Bulbochaete have constituted to 97o.
Diatoms have formed 10%; detritus, 9X; digested matter, 8X;
fragments of higher plants, 117o; miscellaneous items
including roots of higher plants, fish eggs and fish
scales, 1%; sandgrains, 1 \ \ and copepods, amphipods and
gastropods were negligible (Table 13).
In station II (Edavanakadu brackish water system),
filamentous algae have formed 237o of the stomach contents
in the samples analysed. Of this, 21% has belonged to
blue-green algae (Oscillatoria and Nostoc). Diatoms present
have included Pleurosi^ma Gyrosigma, Navicala, Nltzschia
Amphora Amphipora, Dlploneis, Coscinodiscus. The
percentage composition was: diatoms, 317. digested matter,
127,; detritus, 97.; fragments of higher plants, 117o; sand
grains, 47,; miscellaneous items composed of roots of higher
plants, fish eggs, fish scales, copepods, gartropods and
amphipods were negligible (Table 14 )

In station III (Narakkal feeder canal), filamentous
algae have formed 26Z of the stomach contents in the
samples analysed. The percentage composition was: diatoms,
40%; fragments of higher plants, 11%; digested matter, 11%;
detritus 87o; and sand grains, 4%. Diatoms included:
Pleurosigma, Gyrosigma, Navicula, Nitzschia, Amphora,
Amphipora, Diploneis and Coscinodiscus« Miscellaneous
items including roots of higher plants, fish eggs, fish
scales, copepods, amphipods and gastropods were negligible
(Table 15).
Preferred food items of Size group I
Based on the above analysis, filamentous algae have
formed the major food item in station I and diatoms in
station II and III.
B-Size group II (90-119 mm)
Out of the specimens collected from Poothotta
brackish water system (station I), the gut contents were
mostly composed of Oscillatoria, Spirogyra, Pleurosigma,
Gyrosi^ma, Navicula Nitzschia, Amphora, Amphipora,
Diploneis , Rhizosolenia , Coscinodiscus , detritus , digested
matter, fragments of higher plants, copepods, amphipods and
gastropods.
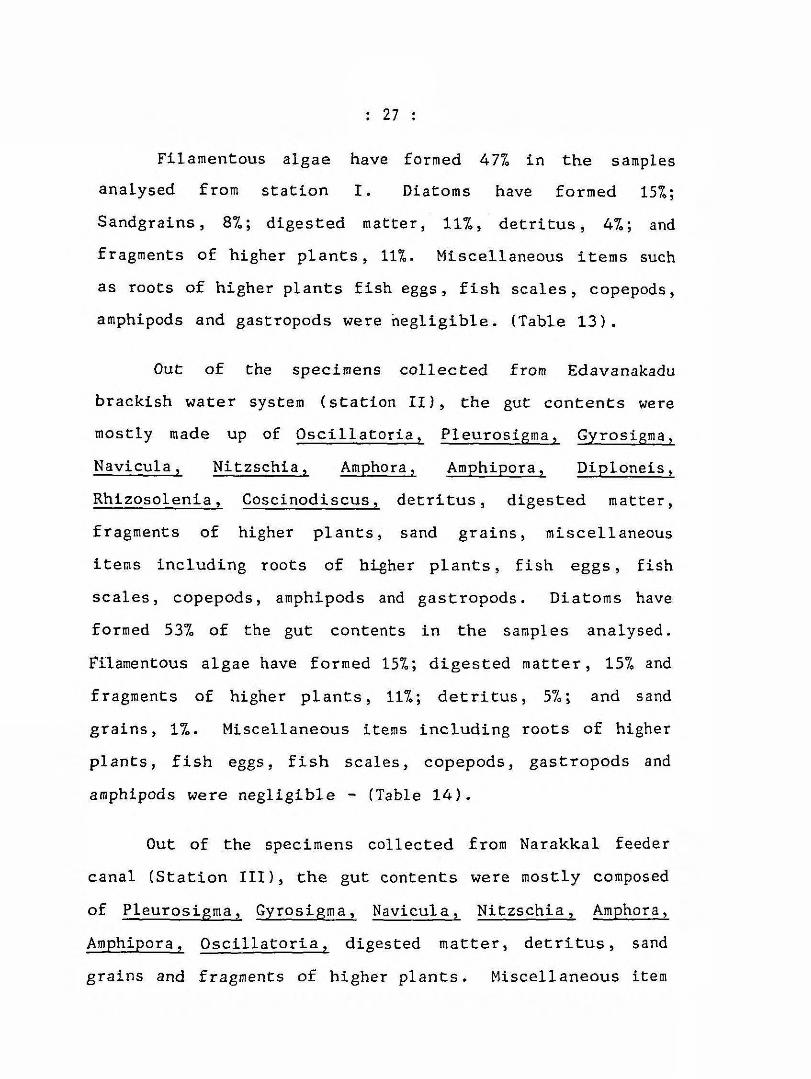
Filamentous algae have formed 47% in the samples
analysed from station I. Diatoms have formed 15Z;
Sandgrains, 87 ; digested matter, IIX, detritus, 4%; and
fragments of higher plants, 117o. Miscellaneous items such
as roots of higher plants fish eggs, fish scales, copepods,
amphipods and gastropods were negligible. (Table 13).
Out of the specimens collected from Edavanakadu
brackish water system (station II), the gut contents were
mostly made up of Oscillatoria, Pleurosi^ma, Gyrosigma,
Navicula, Nitzschia , Amphora, Amphipora, Diploneis ,
Rhizosolenia, Coscinodiscus, detritus, digested matter,
fragments of higher plants, sand grains, miscellaneous
items including roots of higher plants, fish eggs, fish
scales, copepods, amphipods and gastropods. Diatoms have
formed 537o of the gut contents in the samples analysed.
Filamentous algae have formed 157o; digested matter, 157o and
fragments of higher plants, 117o*, detritus, 57o*, and sand
grains, 17o. Miscellaneous items including roots of higher
plants, fish eggs, fish scales, copepods, gastropods and
amphipods were negligible - (Table 14).
Out of the specimens collected from Narakkal feeder
canal (Station III), the gut contents were mostly composed
of Pleurosigma, Gyroslgma , Navicula, Nitzschia, Amphora,
Amphipora, Oscillatoria, digested matter, detritus, sand
grains and fragments of higher plants. Miscellaneous item
have included the roots of higher plants, fish eggs, fish
scales, copepods, amphipods and gastropods. Diatoms have
formed 397®; filamentous algae, 57<,; digested matter, 247»;
detritus, 7.X\ sand grains, 27,; fragments of higher plants,
207oj roots of higher plants, fish egg & fish scales, 57,;
copepods, amphipods & gastropods were negligible in the gut
contents (Table 15 )
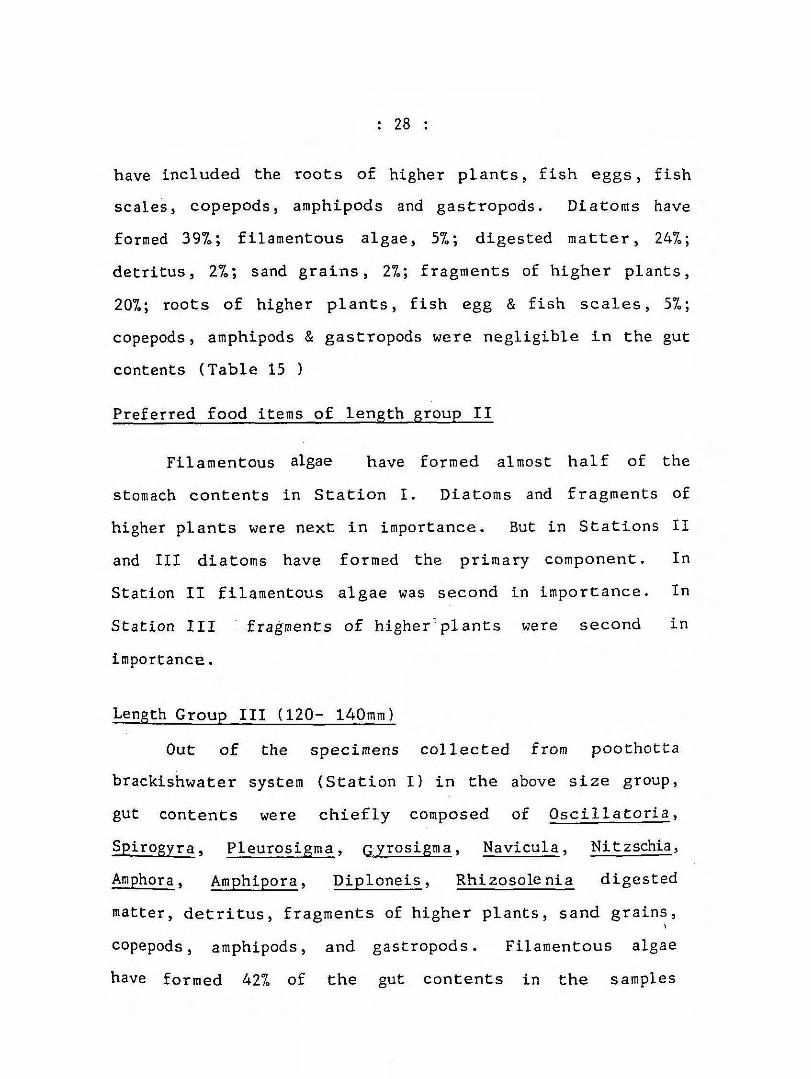
Preferred food items of length group II
Filamentous algae have formed almost half of the
stomach contents in Station I. Diatoms and fragments of
higher plants were next in importance. But in Stations II
and III diatoms have formed the primary component. In
Station II filamentous algae was second in importance. In
Station III fragments of higher'pi ants were second in
importance.
Length Group III (120- 140mm)
Out of the specimens collected from poothotta
brackishwater system (Station I) in the above size group,
gut contents were chiefly composed of Oscillatoria,
Splrogyra, Pleurosigma, g yrosigma, Navlcula, Nltzschia,
Amphora Amphipora, Diploneis , Rhizosole nia digested
matter, detritus, fragments of higher plants, sand grains,
copepods, amphipods, and gastropods. Filamentous algae
have formed A27» of the gut contents in the samples
analysed from Station I. Diatoms have formed 8%; digested
matter, 147o; detritus, 13%; sandgrains, 97<,; and fragments
of higher plants, 12%. Miscellaneous items including
roots of higher plants, fish eggs and fish scales amounted
to 27o; and copepods, amphipods and gastropods were
negligible in the gut contents (Table 13).
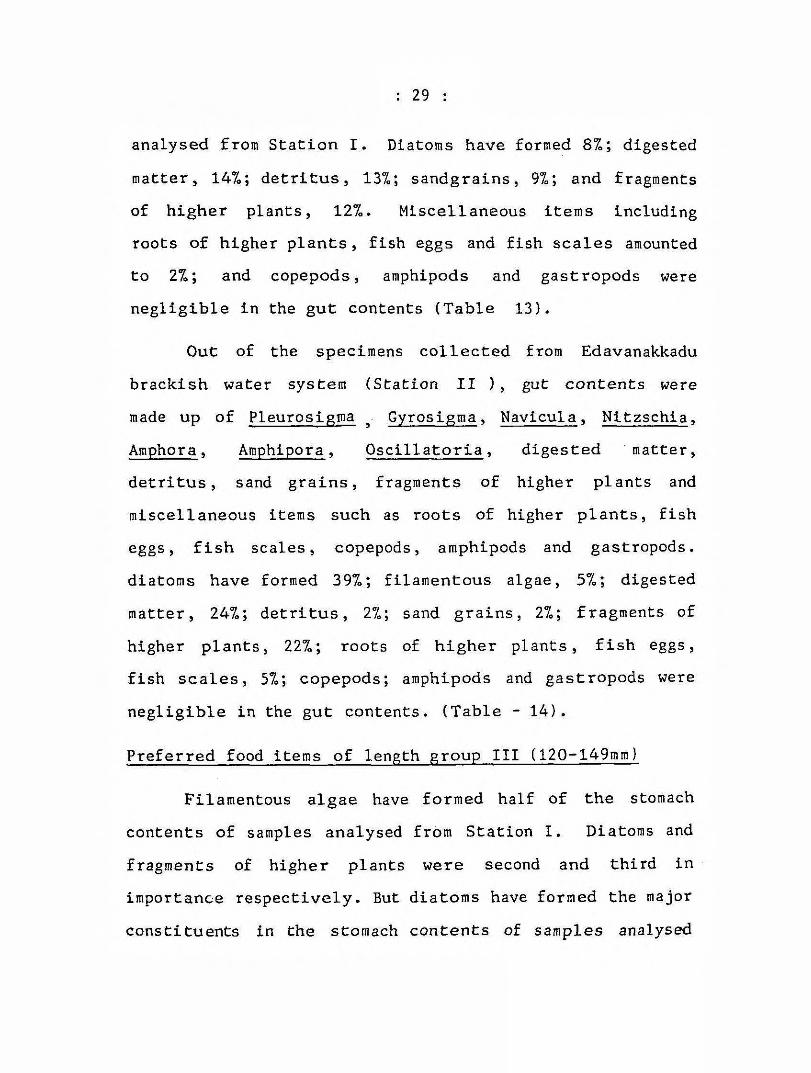
Out of the specimens collected from Edavanakkadu
brackish water system (Station II ) , gut contents were
made up of Pleurosigma Gyrosigma, Navicula, Nttzschia,
Amphora, Amphipora, Oscillatoria, digested matter,
detritus, sand grains, fragments of higher plants and
miscellaneous items such as roots of higher plants, fish
eggs, fish scales, copepods, amphipods and gastropods,
diatoms have formed 397®; filamentous algae, 57o; digested
matter, 247,; detritus, 1%\ sand grains, 27o; fragments of
higher plants, 227.; roots of higher plants, fish eggs,
fish scales, 57«; copepods; amphipods and gastropods were
negligible in the gut contents. (Table - 1 4 ) .
Preferred food items of length sroup III (120-149mm)
Filamentous algae have formed half of the stomach
contents of samples analysed from Station I. Diatoms and
fragments of higher plants were second and third in
importance respectively. But diatoms have formed the major
constituents in the stomach contents of samples analysed
from Stations II and III. In Station 11, digested matter and
filamentous algae were second and third in importance
respectively. In Station III digested matter and fragments of
higher plants were second and third in importance
respectively.
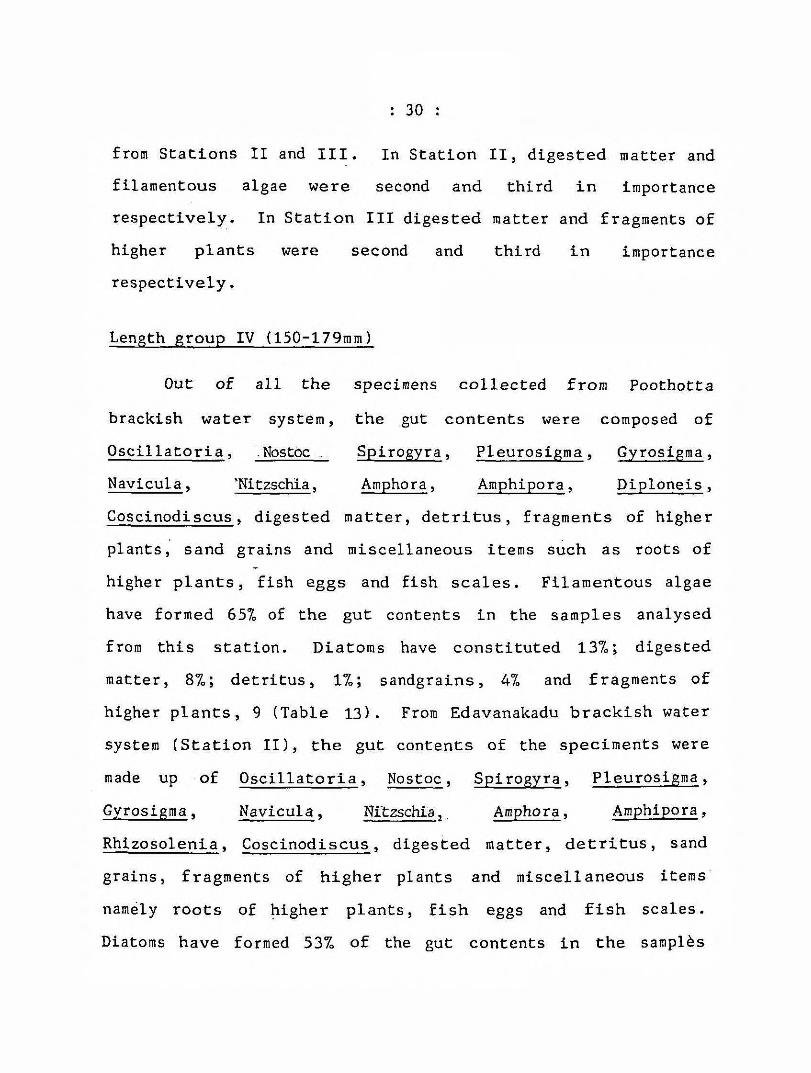
Length group IV (150-179mm)
Out of all the specimens collected from Poothotta
brackish water system, the gut contents were composed of
Oscillatoria, -Nostbc Spirogyra, Pleurosigma , Gyrosigma,
Navicula , ^Nitzschia, Amphora, Amphipora» Diploneis ,
Coscinodiscus» digested matter, detritus, fragments of higher
plants, sand grains and miscellaneous items such as roots of
higher plants, fish eggs and fish scales. Filamentous algae
have formed 657o of the gut contents in the samples analysed
from this station. Diatoms have constituted 137o; digested
matter, 87o; detritus, 1%; sandgrains, 47=, and fragments of
higher plants, 9 (Table 13). From Edavanakadu brackish water
system (Station II), the gut contents of the speciments were
made up of Oscillatoria, Nostoc, Spirogyra, Pleurosigma,
Gyrosigma Navicula, Nitzschia, Amphora, Amphipora,
Rhizosolenia, Coscinodiscus, digested matter, detritus, sand
grains, fragments of higher plants and miscellaneous items
namely roots of higher plants, fish eggs and fish scales.
Diatoms have formed 537o of the gut contents in the samples

Lengthgroup
No. of fishes examined
No, offisheswithemptystomach
No, of fish with stomach
filled to about 507o
No. of Feeding fish intensity with stomach
filled to about ?5-1007o
1. 60-89mm 29 0 12 17 58.62
II. 90-119mm 29 7 8 13 48.27
III. 120-149mm 30 6 10 13 46,67
IV. 150-179mm 30 9 8 13 43.33
TABLES
LengthGroup
No. of fishes examined
No. offisheswithemptystomach
No, of fishes with stomach filled to about 5Q7o
No. of Feeding fishes Intensity with stomach filled to about 75-1007o
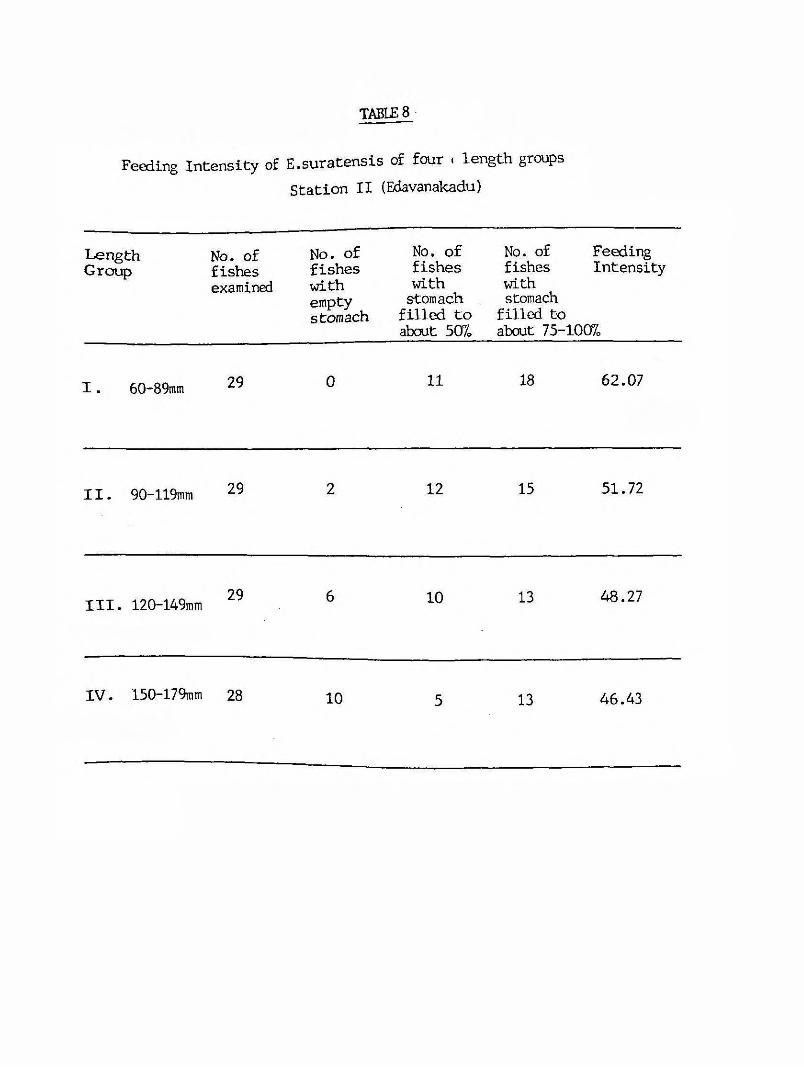
1 . 60*89mm 29 0 11 IS 62.07
II. 90-119mm 29 2 12 15 51.72
III. 120-149mm29 6 10 13 48.27
IV. 150-179mm 28 10 5 13 46.43

Lengthgroup
No. of fishes examined
No. offisheswithemptystomach
No, of with stomachs filled to about 507o
No. of fish with stomach filled to about 75-
FeedingIntensity
1007o
1 . 60-89niin 30 2 10 18 60
II. 90-119mm 28 5 7 16 57.14
II. 120-149mm 30 8 6 16 53.33
IV. 150-179mm 30 6 9 15 50
analysed from this station. Filamentous algae have
constituted 237o; digested matter, 107t,; detritus 57o;
sandgrains, 17* and fragments of higher plants (Table .14 ).
In the samples analysed from Narackal feeder canal
(Station III), the gut contents were made up of Oscillatoria,
Spirogyra, digested matter, detritus, Pleurosigma, Gyrosigma,
Navicula, Nitzschia, Amphora, Amphipora, Diploneis ,
Coscinodisucs, sand grains, fragments of higher plants and
miscellaneous items such as roots of higher plants, fish eggs,
fish scales. Diatoms have formed 457o; filamentous algae, 147o;
digested matter, 167o; detritus, 97»; sand grains, 37o and
fragments of higher plants, 147o. ( Table 15 )
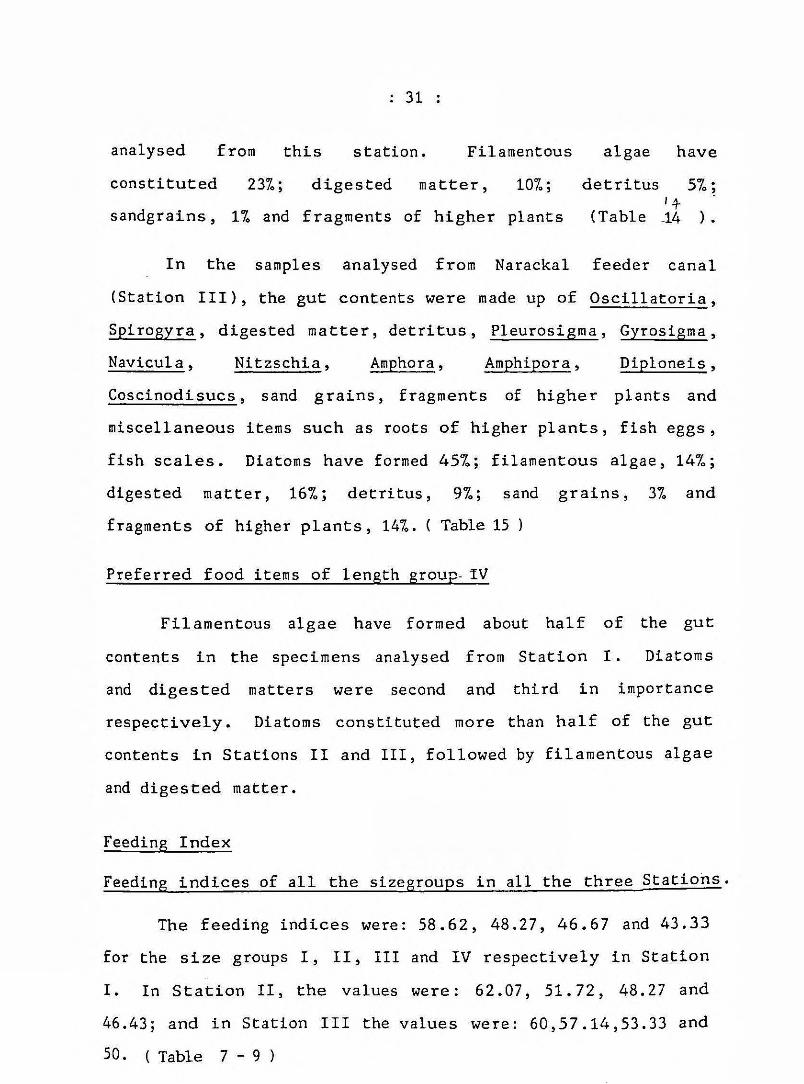
Preferred food items of length group- IV
Filamentous algae have formed about half of the gut
contents in the specimens analysed from Station I. Diatoms
and digested matters were second and third in importance
respectively. Diatoms constituted more than half of the gut
contents in Stations II and III, followed by filamentous algae
and digested matter.
Feeding Index
Feeding indices of all the sizegroups in all the three Stations
The feeding indices were: 58,62, 48.27, 46.67 and 43.33
for the size groups I, XI, III and IV respectively in Station
I. In Station II, the values were: 62.07, 51.72, 48.27 and
46.43; and in Station III the values were: 60,57.14,53.33 and
50. ( Table 7 - 9 )

Length Group Average total Length of
the fish (mm)
Average gut Length of the fish (mm)
R.L.G.factor
1.
60-89mm 72.413 349.34 481.65
2.
90-119mm 103.97 451.72 435.37
3.
120-149nini 136.83 658.43 482.53
4.
150-179mm 167.17 559.63 336.21
Length Group. Average total Length of the fish (mm)
Average gut Length of the (fish mm)
R.L.G.factor
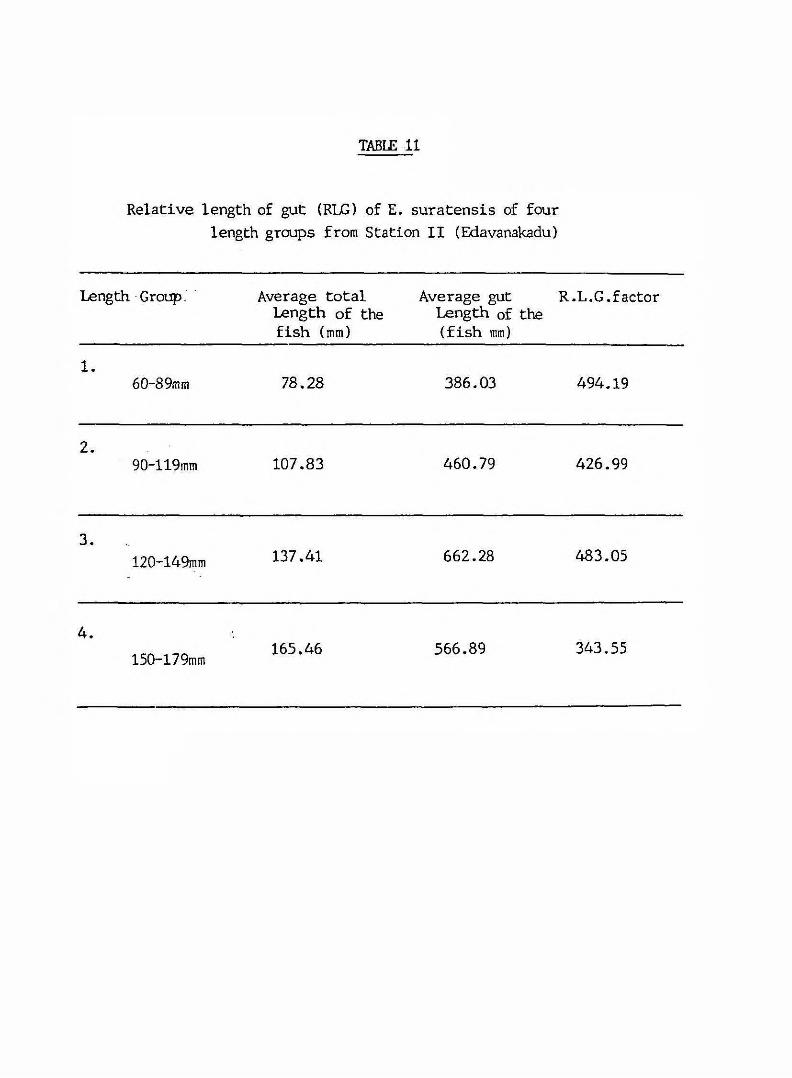
1,60-89mm 78.28 386.03 494.19
2.90-119inm 107,83 460.79 426.99
3.
120-149mni 137,41 662.28 483.05
4.165.46 566,89 343.55
150-179mm

Length Grojp Average total length of the fi^ (mm)
Average length of the flsri (mm)
R.L.G. factor
1.
60-89mm78 384.73 494.29
2.
90-119mm 110.29 473.46 429.33
3.
120-149mni 137.77 668.77 487.072
A.
150-I79mm 166.17 566.43 341.53
Relative length of gut factor (RLG factor)
1 0
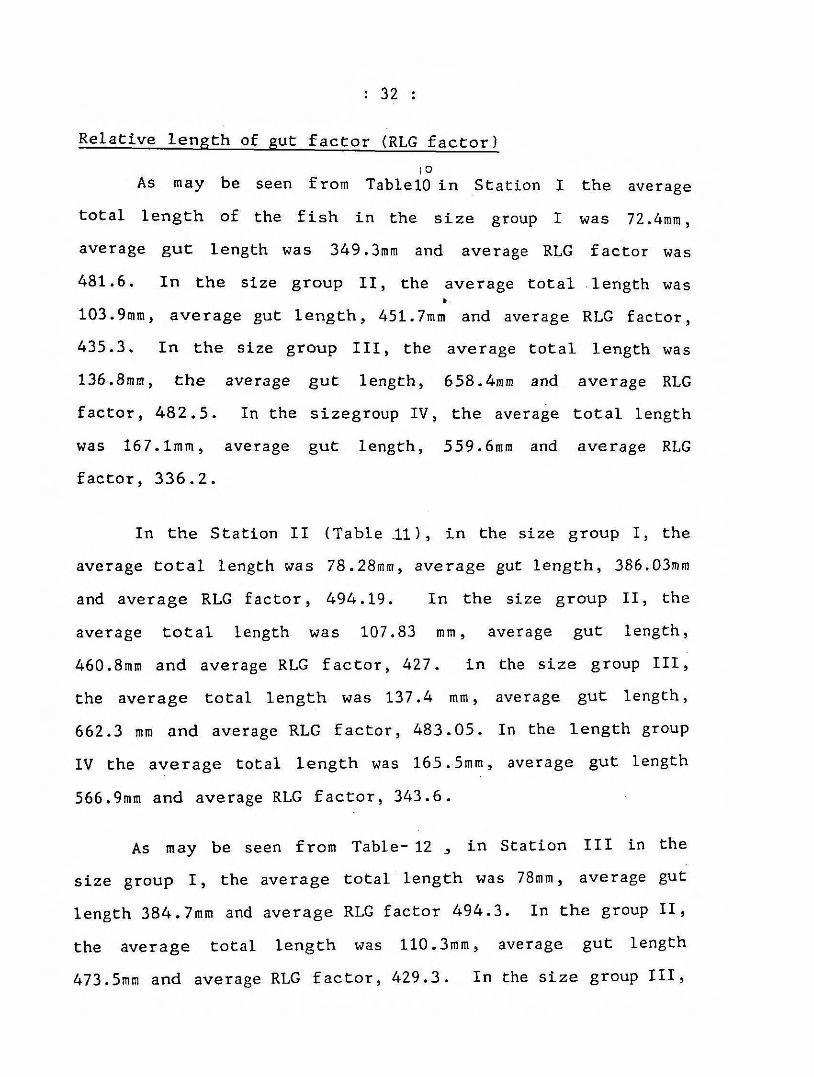
As may be seen from TablelO in Station I the average
total length of the fish in the size group I was 72.4mm,
average gut length was 349.3mm and average RLG factor was
481.6, In the size group II, the average total length was>
103.9tnm, average gut length, 451.7mm and average RLG factor,
435.3. In the size group III, the average total length was
136.8mm, the average gut length, 658.4mm and average RLG
factor, 482.5. In the sizegroup IV, the average total length
was 167.1mm, average gut length, 559.6mm and average RLG
factor, 336.2.
In the Station II (Table 11), in the size group I, the
average total length was 78.28ram, average gut length, 386.03mm
and average RLG factor, 494.19. In the size group II, the
average total length was 107.83 mm, average gut length,
460.8mm and average RLG factor, 427. in the size group III,
the average total length was 137.4 mm, average gut length,
662.3 mm and average RLG factor, 483.05. In the length group
IV the average total length was 165.5mm, average gut length
566.9mm and average RLG factor, 343.6.
As may be seen from Table- 12 j in Station III in the
size group I, the average total length was 78mm, average gut
length 384.7mm and average RLG factor 494.3. In the group II,
the average total length was 110.3mm, average gut length
473.5mm and average RLG factor, 429.3. In the size group III,

the average total length was 137.Smm, average gut length
668.8mm and average RLG factor, 487.1. In the size group IV,
the average total length was 156,2mm, average gut length,
566.Amm and average RLG factor 341.5.
STATISTICAL ANALYSIS
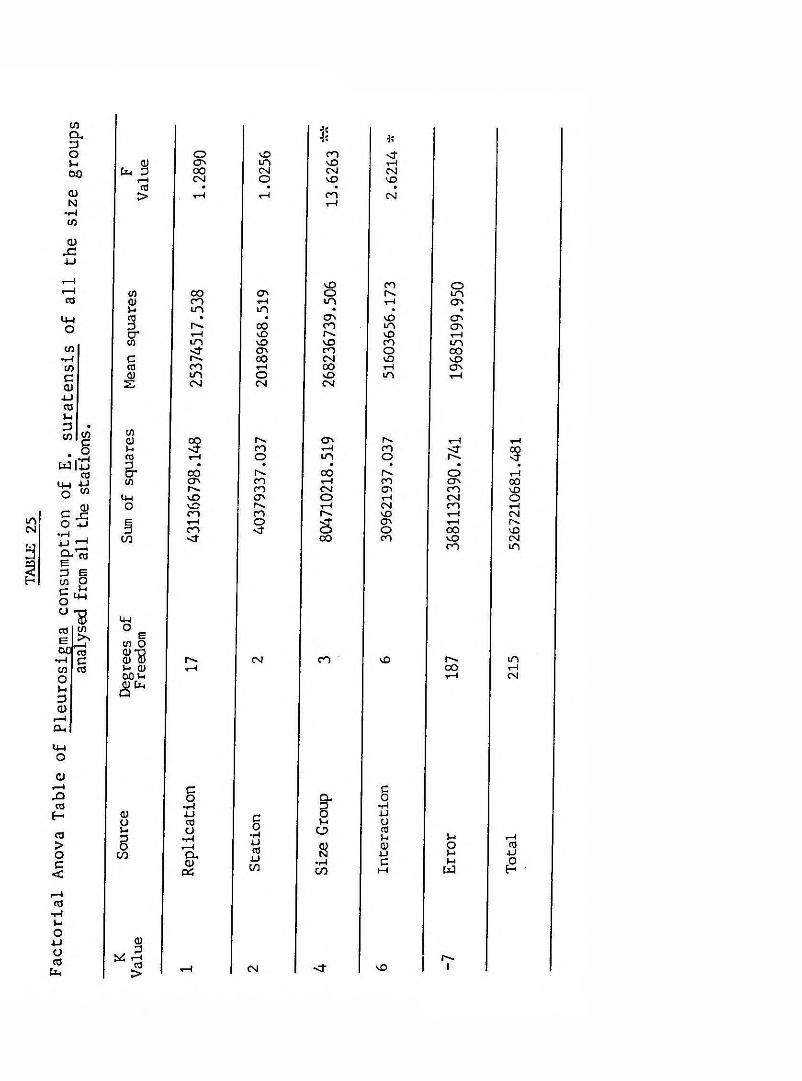
From the Factorial Anova table presented in Table-20 ,
it may be seen that there is a significant difference in the
consumption of Oscill atoria by the Pearlspot at different
stations at 1% Level . Oscillatoria consumption between
Station I (Poothotta) and Station III(Narakkal) has differed
significantly; but between Stations I and II and II and III,
it is not significant. Between the size groups, Oscillatoria
consumption varied significantly between sizegroups I and IV,
II and IV and III and XV.
The consumption of Splrosyra by the fish at different
stations has varied significantly at 1% level. (Table 21 ).
The consumption of the flamentous algae at different stations
has varied significantly at 1% level. Between Stations I and
II and I and III, the quality and quantity of consumption had
significant differences. Between sizegroups, the consumption
between groups I and III, I and IV, II and IV and III and IV
had significant differences among themselves.
Consumption of detritus in different stations has
significantly varied at 57» level. Consumption cf detritus by

ocs
a2
BO>-i
' 8(A
gcna
u00
<DN
•H
to
05 §
♦H
Wl«I/i(U
S 5•H4J r-la . - ^
(/5
BG
o(A
O
Xi03
H
I
«0•rH)-louoCOCt.
Q)
r —
5
03Q)>>4
STcCO
cn(UVhCO:3a*toU-loEP
CO
COcuQ)>-. _ 00 Q) d> >-i Q tt.
O
■S
0 )o
3
<DD
f-^CO
>
( J '
o
O '
00<T>(NvOCMW\ 0CO
CO
<NJ
r>»•sf
r o
sc n
s•HUCOO
a .0)
0:2
mmr««.
CNJm00
om\ oe x 'COO 'mvD< rCT'
f O
sr O<y^
o >
mCT'oo
CNl
g•r44 -)CO
4->W
00O '00
CNJ
vDo >CM
oo>< rmoCOv£)mrOCOO '
COCO
COCO< r\D
O '00\DOo00CM
CO
uo
0)N
•l-iw
3c n
oCOvD
«ONr>«.OL O
ooCSlv£>
ooCM
00r> .
»r>>
C7>oo
r> .CO
v O
Co•r^uocOu(U
uc
00o >
0 0CSlCM00
Ir>*oex 'CJ'
r> .O 'CM
\DCTNov£)COOCO<J-\oCMCM
CO
p>.CO
v D
}-<
su
w
r> .I
53p>^COCOooCMCNlr » .
p> .
mt
CM
COO J
e2
><aJ
t n
-L j
03 fo
-L-> _uc pfro (TJo oMu.»-■ 1-qt>o •OkOUi
cn

ouU-l
■ 8(/)
CO§(0p -
u00
0)N
I
tM<L)
5ca>
V)stow
cCO
OfOCO
d
vDvOfOoCs|COOmo
00 N.D T—Ioo ^
mCOvD
•olOimmr>«.
SvO
CM
m
fOolAroT—<
00
CT'•s f
o - jo ^
COoLOr orH
\ oCOCO
CMr> .
3v£>mmCMO 'CM
CO
c rW5
U -lo
i nrHCO
CM
CMt no ^CO£>
00h v
oCO
oT—(m< T 'oCOCOCM
COONoi n
5tHvDmr> .
i n00
00\Do ^
or««.
CMmCO
\DCM\DO00or> .
CM
mT—ICO
•r>sr>sr>KoT—(c nmomONCM
W B<u oS'SCio Q>
^ uO <4-1
h*. CM CO \ o rv .CO
m
CM
Uo4 JOCO
Q)
CO
co•rHutoo
•H
aQ)ai
co
*1^XJCO
4->CO
)-•o
♦l-lc/5
g•tH
oCO
Q)4Jc
oUu
w
fO■U
&
CM

§
05O -
000 )N
t/5
ICO
U-iO
CO*r4cnc(U
J -)03v»305
Ul O )
g• H
s CO XJ
z> ^ i-s
so CO0 )COCO g
*ro ^
g '8
■ u ^ c0 )
CO
)->
Io
Q). o
CO
§
CO
>->O
4->OCOtz-i
COCCO
d) fa p
ca
>
CAQ>Ur}3cr(/)
ctoQ>
Z
w0 )»-•fOg-cn
IM0
CO
u -t0(0 B Q) O <u * 6 u S CO (D (1) M
Q fa
w
oU O< t00
\ 0CNJ
C OCMr>«.'X >mv£>00
r oO NCsJ< rvi5
r> *< r
co• H4->COU
Q .(U
P i
CM00ofO
CMIT)00
r—I
so ^oCOrovO
COo0000vOr> .C'JcsJ
Cs]
g•HJJCO
4JC/D
r>«.v£>\£>CO
•
ON
mr> ^C T'
m
r » -< fC3>CO
v£>CMO '
mCMv DC OCM< f00C O
CO
O
§J•I—IC O
CvJ
CJN
u nr> .c ^
a>COr> .COCMoCOCsJ
CMmCO
LOCO
CM
COCO
cO
♦1*44 JOCOu(1)
4 Jc
omCO
O Nv Dv DCO
O Nv£>
O N
L O
GO
O Nr > .COr > .r > *00
00
2U
COCOCOOCsJCOr> *
mf
CM
COu

■S
§cn
I00(UN
cn
SU
a
>1-1toc(1)4 Jcduz )Vi
c s
K
r *
cn
S
i y
■UC L .
W
to CO
H s
82<i>uu
B
■ 84 J(/](U00
OJ
I nCtJ
H
CO
§
CO•i^MO4-)OCO
[z^
Ci4BI—I Cd
>
V)<uuCO
(A
Cto
CO(U1-HCO
g -(/i
U-io
c/3
tMocn =Q) g
(1) sQ r2
<DO> -
CO
Bf-H
CO
>
v£5cr>Ovr>*
COo00\DwmCv)mmi n
vO
i nCOr>*CMO 'CO< rvD<T>CO
co•r^J JCOo
a<D
pe:;
•}{j{
mCSlCJN•
CO
CO
•
oo3CvJ
cnm
cs>
v£)CSlo >
vOc r .
scr«< rCvJ
CVJ
co•r^4 JCO
C/3
CvJomfs<
<D
CNCSJp*%
#cr*mr>«.t-H00CN}OCsJCO
r vy£>
o ^r>*CMm
COo\DT—i\ 0CSl
CO
a
uo
0 )N
C/3
r>*00
o
mCOm
C7N
3m
CTxCOCO
CO
mO '
cr>CT'csjoO '
VX>
coXJoCO
0)uc
:S
csjc nr> .CSlCT\
mC7NCO
ON
o
Ic OtHCslmo"t HoCTxocsj
C50
Uo}-•U
5vD
COc n
5CslvT>o ^O 'COCO
mwcsj
CO4 J
e2
csj vO

t;
COeo
■8ifi
ca§(fia.
uCO
0)Ncn
SXJ
<d
05tAtoC<u4J03U3
03 C o
•r^uCO
•[JlW
•r^uCu
cnC8c/3
3
- S
0
CO
1CO1-1uouoCO
■i!•J: ■ii
<u (N CO CsJ3 CTN CM
CjH i-H m CO r>* r> .CO t—1 CO t—1 o
> * «d r o vX>
COiH r> . r> - c s l CO
OJ r>* \£> mOi vO <}• # Ou • • • o #
v£> vD CO CMr> . tH CM o
a * \D O m < ; O0 ) 1—( • s t m
0 0 < r CTN iT l (JNc CO vO o CO COCO i n r> . tH CO
j y 0 0 fO CM o vD2 T—• tH m T—(
CTN COV3 o o w CO CO0 ) o fO r s . CO CO
o ro CO • •CO • fO • 0 0 COn o • O O CO COcr o <r m CTv05 m cn m CM ooo fO <r r>.tu m CvJ 0 0 CO CvJo CM 0 0 CM CM CO CO
o C«J CO om \£> \ 0 Cs|
3 1 P". m m o Csjto CO CM t-H \£> CO •sj-
BO
0 )uU-tU-lo
P'S. CM CO \o r>s t n05 CO T—I0 ) CMQ>
0 0Q>
Q
c co Oh o•r^ •r^J J Q AJCO C u a
(U o o O COO •rH •rH u u 1—t>-• 1- <y o o CO3 a CO N 4 J u 4-»O (U 4 J •1^ c > - OLT3 cc: C/2 in M H
<D;3,-tCO r>.> CM vO 1
cx3Ou00
<DN
cn
Q)
cd
Ow f-»
03
C 0)
4 -)CO ViO 03 J2
«,lCO
c MO 4j
Q-'CO
^ i to P r- *-•
Cd
00 ♦H03O }-•3 0)
a .
U-io oJ3 CO
H
CO > o c <
n31-tV-<O4JOCO
U4
<o \D fO
a) o> m vD wtL, 3 00 rg CM C'Jt—( CsJ o £) vOfO • •> rH w CO CM
\D CO OU) oo O' O r>. md> CO uO o>u m m * • •• • ON vO CJ'r«-. 00 CO lOa* vD O T—Iw tn \£> vO ro un
<r cr> CO O ooc r>» 00 CM vn vOCO CO tH 00 T—t o>(U m o vO m T—t2 CsJ Csl CM
U3G) op o rs. fH>-• CO !-*< fO OQ<0 O m O r>.8- CO
#r. CO r>.
•o 1—1
to ON fO rH CO CJN COr>«. fO CM CTN CO \DU-l vO ON ( iH CM Oo o rH CM CO 1—tcn ro ''H vO CMc i-H O it o rs.3 CO •si- I3 O OO vDw CO CO v£5 CM
CO m
o Ey) Ocy <1) o r«. CM CO y£> r». lO)-• a> oo 1—100 V- rH CM
C co I 0•H
o u ID uo CO V-I o}-• o o CJ3 CC3 •l-l •r }-< V-> t—A5 f i XJ C\) Q) p COCO CL fO 3 JJ V- 4J
CD •I—I c )-■ Pec; c/3 C/3 M U H •
(U, D
1 r>«.CO> 1—c CM <r ^ 1 1
kO
■ s
> %
CO
§
cncx
CxO
CUN
toQ )
03
cn«f-lc/5CO )
4 -»03J-ig
05s1-4
X J03
t ttn
Cu
c/5C
03
cno>-•
o
LMoa )
CO
§
c d• r ^
v->
s
fa
y j<l>i-i
1CfO<u
2
(4-1o
w
o
(U o <y * 0Vm 000 Q)
S Mb n
W
Cslr > .
Csi
r > .00\ 0mm
00c » j
OmC T'< oCNI
r o
5
g•r^4 JCOV
Cu0 )
P i
CO>
o ^Cvjv£)CO
i n
ooo
•omCO\D
v£>O
CM
CM
Co•W4 Jc3UCO
cslt o
O
O
o
sc n
r>«.mf Or > .v O
Ot ooCvJCOr>«.Ocslocsl
CO
a .
o
Q)N
•P^CO
IT ,o
d
ooo
dmmCMot-HCM•<rCM
oo
vX>CMi n< r
§AJUCOv-<(1)
4 Jc
CM
CO
^—1CMOOO
CMONCO
OOO •om
\£>CO< r<X)CO
;3i
r> .00
}-•
g}-•
OmCMCMooc ^mo ^m00
m
CM
<0JJ

N
CD
OV<>M-i
•s>
§C/5CX
oo0 )N
•r-»t o
<D
t— I1— tCO
U -t0
CO
COc(U •
COCO c
0D *r^CO 4-»
03• U
u ! CO
CD
4 J
0•rXJCL
1
i0 3
3*5!fOZ
o0)
I« 3
g
CO•ruooCO
•34 cH-l i->
a > 0 CvJ 0003 f>v. fO OJ 0
> CO 0 r> . sc t00 rv . o ^
♦ • • •0 CO CO
v£> 0 lA in 00(/) 0 CO 00 CO 000) 00 \D t M VD)H • • • «eg 0 o> m in VO0 CM r>. CO CO CMc r LO \D CTn 0 0W) VD v£> CO tH
0 m Cyv O ' CT'c tH h>. r%. m CMCO CT* CM 0 vD CM
O ' CO 0 COs cn 00 CO CM
r—) 0(0 CJv VO tH < r0> 0 in m rH CO
CvJ in T—1 •
S • • • « 0 CDP CO O ' m tH O ' Cs]U " m in 0 <JN CMcn 0 0 CO 0 0 cvj t-H CM
h>^ CO 0 00 CM w<4-1 C'J rH 0 m < t r>*0 cO 10 CO in 00 0
'*T in csj G -'g 00 v£> 0 vO C'J5 CO r o 0 <3^ t—<w CO CM m CO m
iw0
C/ EQ> 0{U -n r>«. Csl CO VD r> . inV- © tH CO tH0 0 (U T-W CMQ> J-4
Q C i.
CQ & 0
<u ♦r^ 3 •r4a XJ Q AJ}-• CO C U 0
0 0 0 COQ »(-J •r^ * V-*
w U Q> Q) 0 COa - CO N i . 1 u 4J0 4J •r^ c i-> 0
O i C/ c n ^- i w H
Q), 3
CO> T—i C'J >st vD »

■g
a
tAsCTt
O '
< T -cn
«
\i>
XJO
♦wsocn
OON
r-v-r-i-:r?>-to07
mcn CNt»1* 00«
tH IMo ocr rs/
OMvJD s£>
»wC'lfO
-<?■
C/I
fO< r \
l>s.o
arx%
SfT-»m
I
T*si5r ^
Cn3
C?'00ac?
sr o{ ^r ^iNs\£ 3
onr>’cO
«r o
c ^"j?
CifvOc©O '
r4CO
in•r4cs
§CC
co
u >uerfuCt> I ra
eo
■SCO
f— I cc g
<0>
vO
CM
Oi00COo
«m
CM
<T)
to00ON
c/3P -
V-IooQ)N•r4CO
4J
CO
•i—I05cQ)
o >r* 4
I
uai
C/3
!iS
w
I
srcCO0 )
2
W5<UVi
D *toLMO
COcs»O
CO
Sr>»
vOCM< rtH
COvT*
fOCM
SsCM
CM
CMm00
COr« .CM\D\ 0\D
mocr<v£>
5*;CMCOCOCO
COvDCT'
CMT—ICO\DCOCOO
o >0000
00*CO(T n
goCM
COOCJ^
«CM
CJ>OmooCOo
00r«*
•r«-.r> .
i noCOi nvO
mCO
COCO00i nCO
o
vD
CM
\D<T
mtHmv£>oC'J
COCT>c r .ONooCOooT—I p » . CM
c x
COc
8COc03uoo
CO
CO s CD O
S'S 00 0) o >-<Q [SH
CM CO r > .CO
t o
CM
cdCO
a >
CO
<T3
§
0 )O>-r
cn
gCOo
ChCDoi
co•r-(4 JCOuCO
uo
s•I—IC/D
g•r^AJoCO}-«o
uov><>-•
COJ J
C3•1 ^uo
4 - )oCO
tx-lOJD
: > CM \ D I

COBO
U-l
■Syj
r—ICOgViOh
)-•00
a
w
4J
cd
o
COCO
•r^4JfO4JW
wl^
§4JQ-
cnC
8cneo
ua
•r^Q
U-(oQ)
«0H
cd§
CO•HUO
4-)OCOlu
+ J
tL|CD:3
1—Cd
>
wQ)U(0P
S 'cCO
(/)
c uO
C/3
U -lO
CO e Q> O (U " P>-• o00 <D 0 ) >-• Q u,
CO
m
C50
o
o >ov D•
r>*.r>*.mCNJvD< r
COr>*cr*
or -CO
oCNjo oCOv D
00CMOO
Co
•r^XJCOu
Q .0 )
0 2
soCM
CM
. g•r^UCO
XJCO
m
so
CM
OCO
CM
Or>«.00CJ>ONvO
CM
5tH
3CM
lOooo >CMCTVr«HCMCM
m
COO 'COCM
c n
ooc n< r
r>*
CJN00CMuTiO00CO
OCO
v£)v£)00COr««.T—I fO 00 CM CM
vO
g•r4i JOCOuouc
moCO
0000O 'COCOv£>00om
CMv£>
CMT—iCOocr.mCOCOCOvDt-HCM
r>«.00
or> .CO
otr »
COCO
CMT—I< rCOCO
CM
CO4->
r>*I

CL)N
•r^
4J
>
fvj
CSlm< r
CsJ
m
cvjLO
cnvDCNJvDCO
cn(D><•CO
g -CO
cCO
r> *
O '
-3 -
:?\ 0
»00
v £ )
mCMVD
CO
o
( /)
u -«o
o >m
•fO00
r>^00CN
ouDr>H
•p>.00
mCO
< rmr > .
ONmCsJ
f>s.
CNi
Vi eCD o<D - r tu o300 <D<D U
P>
CNi c n \Dr> *.00
m
CM
Q)U
D -OOii
co♦ r ^XJCO
X JC O
O
<l)N
•r^CO
co• l-fuc»CO}-•Q>AJc
v->o
}-<w
COAJ
e2
ca
V -o
■uoCO
Exh
<0>

■ 8cn
gcn&
V-OQ(UN
V)
I
U)T-lcn§
J-<3cfl
C14r j
>
toQ>UfO
S'cfO<u
o ^o
CJv
00
CM«rHrom»—IvDCO
0 0cr»CnJ
csim
o ^LOr » .
mOio
■{c
v£>CM
o>
in
mtHCM
d5C » < ■
fOoCM
u n< ! ■
CMCM
mr> .r —I ON CM CO v D
o§
(JsCMCT>o
CO
CMfO
CJI
g•l-lua
w
§cnEQ>
•H
eft
§C
QJOW•i-l
>-•04 JOfO
Cjh
•H4 JCO
■U(A
EO
<4-1
CO
u->oU5<U
e _ o <u * 0 u o3 00 Q)<u V- Q Cau
0 )o>->
CO
rt
soCOCMCOCM< f
P>.m
co•r^OJ<do
•H
aG)pS
CO
g<T»
COmm
lrOCM
CM
PO
•r^4 J<0
XJCO
vO
d
i n<J-COovD
CO
Iu
o
Q>N
•HCO
CO
v Oromou nr>*CT
CT'
v D
s•r^X Ju03v-«0 )
A JC
CMONr> .
:??Rm
< j-\£>
r> .00
0 0u oo >
0 0
CO
CMt-HO0 00 0
mT~WCM
CO4-1
e2
r -t

CO
a
OV-iU-1
"S> > .
r I0 3CcaCDa-
Vo00G>
••-<05o;
pa
t/5t-lcnCQ>4-»CO) - ■
3 CO
g "Cu
c n
got/5
<D a -
^ V-
cO *H
•pi §
S IO fO « 3 * - ■
ti-i
i ip •3«
t*-lCO r> . O w CO
> tH »i—( m OfO vO c ri \D
VD < r o ^i # • •
tH vD CO o
•sj- CO CO O0) CvJ VD CO CO vO<U CO V£> (T) CO T—1
• • • •n j 00 VO CO CO o
o VO CO CO v£>& ■< CM vO r*s05 VO ■< CO O
in f m vDC v£> r~ h«. < t OCO •< f i n OO CsJ vDfl) VD o CO CO
in r o r~ i CO COc s i T—(
w CO O O CO(U C5 CO o 2 5 o CO
o CO o o o CO• • » • •
3 o CO o o o COm CO o o in CO
W5 tH CTv 0 0Cvj OO CsJ m
U-4 lO Csj r> . vO 'X> COo CM Csl C3> CO C7N
C7N O vO <J- CO COE CT> vD a > I CO3 m vD m <JN r> .
03 CO tHvD 0 0
u-^o
CO EQ) O
r>s CM CO vO r> . m0 0 cu tH 00^ V- T—1 CMQ M-t
C co Q - o0) •r( J •Wp 4J 0 4Jtd c u OS O u COo •i-l >-« u r”CO XJ <u Q> 0 CO
a CO N 4-» (-< u0) 4-1 •r^ c u cw CO 1—t w e -
0)3
> vH CM vO 1

the size groups II and IV and III and IV have varied
significantly among themselves. In the case of Pleuroslgnia,
the consumption has varied significantly between size groups
II and IV s III and IV and I and IV. The consumption of
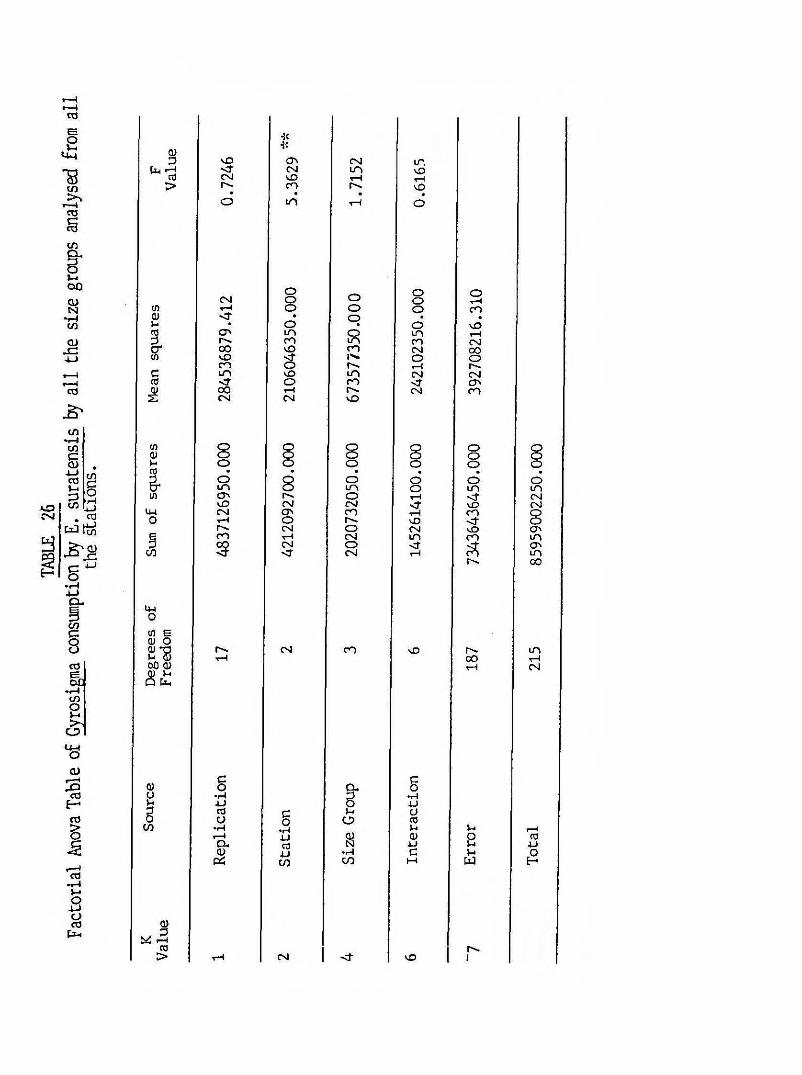
Gyroslgma has varied significantly at 1% level between
Stations I and II and I and III. The amount of sand grains
in the gut contents has varied significantly at 17o level,
between Stations I and II and I and III. The consumption of
Navicula has varied significantly at 5% level, between
sizegroups I and III only. (Table 27)
The consumption of Nitzschia has varied significantly at
17o level between Stations I and IX and I and III. Among the
some groups, the variation was significant between groups I
and II and I and IV. The consumption of copepods, amphipods
and gastropods has varied significantly at 1% level between
groups I and II, I and III, I and IV and II and IV.
Consumption of miscellaneous items including roots of higher
plants, fish eggs, fish scales, has varied significantly at 17o
level between size groups I and II, II and III and II and IV.
(Table 28)
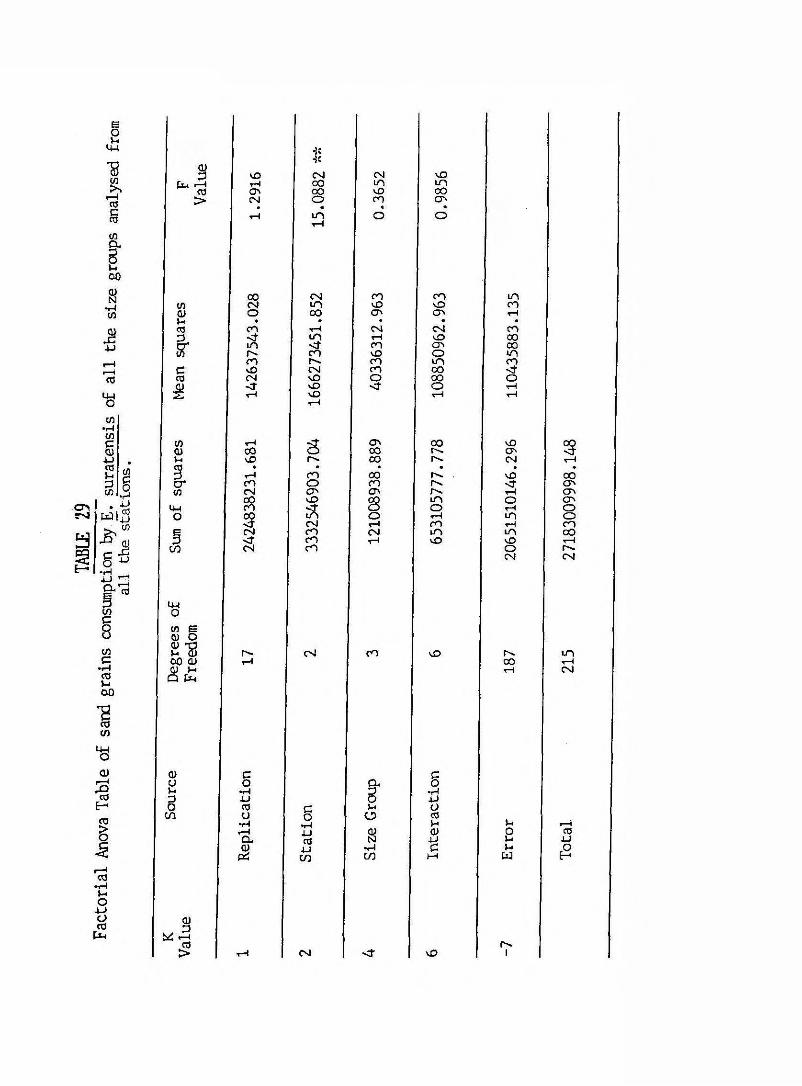
Consumption of the minor diatoms (Amphora, Amphipora etc )
at different stations has varied significantly at 1% level,
between Station I and II and II and III. Between the
sizegroups, the consumption has varied significantly at 17o
level among I and III, II and III and I and IV. Consumption
of fragments of higher plants between stations and between

size groups were varying significantly at 1% and 5% levels
respectively, between Stations I and II and I and III. Among
the size groups, the above consumption has varied
significantly between groups I and IV and III and IV in all3 3
the stations. ( Table 33 )
LENGTH-WEIGHT RELATIONSHIP
The length-weight relationship of fishes is usually
represented by W = aL^, where W = weight of the fish,
L = Length of the fish, a & b are constant. This expression
can be transformed as log W = loga + b (logL) . The results
obtained from the present study were compared by Analysis of
Variance; and the length-weight relationship of E. suratensis
at, Poothotta (Station I) has been arrived at as: log
W = “8.96427 + 2.69917 log L with correlation coefficient
0.984360.
At Edavanakadu (Station II), the length-weight
relationship is: log W = -8.41133 + 2.59632 log L with
correlation coefficient 0.987759; while at Narakkal feeder
canal (Station III) the values are:
log W = -8.63639 + 2.63401 log L with correlation coefficient
0.989601.

FOOD PREFERENCE EXPERIMENT
In the first weight group (20g)j the average food
consumption from the evening feeding schedule which
consists of Spirofiyra, Salvinia, pelleted feed and clam
meat were:
Spirogyra 1.18g (14.75% of the feed given) Salvinia
0.0013g (.0167o) pelleted feed l,34g (16.75%), and clam
meat 1.178g. (14.727o). In the same weight group, the
average food consumption from the morning feeding
schedule was: Spirogyra 1.144g (14.3Z), Salvinia
0.0006g (0.00757o) pelleted feed 1.258g (15. 7337J and
clam meat 1.132g (14.157o). (Table 16 - 17 )
In the second weight group ( 4 g), the average
food consumption from the evening schedule which
consists of Spirogyra Salvinia, pelleted feed and clam
meat were: Spirogyra 0.316g (15.8Z) Salvinia 0.0009g
(0.0457o), pelleted feed 0.403g (20.157o) and clam meat
0.247g (12.357o). In the same weight group, the average
food consumption from morning feeding schedule was;
Spirogyra, 0.371g (18.557o) , Salvinia, 0.0009g
(0.045%), pelleted feed 0.378g (18.97.) and clam meat
0.215g (10.75%) .(Table 18 - 19 )

Iin
coucau0in
tiJlu-io
• s
COocsl
c•HU-IO '•X
U ‘H•r-l U-IJJc 03 COD 3crxia) >00t42-H(U •!-< •> Ifi< c E00
U-io
&•r^uc
o00fOV-Q)
U-k
■S
CO
■r^OJC M-l
■8cro 500 wro0)
(ftor
(/5E0)
U-I 4-1 O H-t
i'SC3 O
r > .00
O '< 1-p>*.
mCNJC O
COuI
• r^CL
C O
m
m
mo >
cd♦r ^c
•r^>
T—lCO
W
r o
n
r o«
m
COCOv D
•
CsJ
■8<D
M-J
•sti
0)CU
mCOr*»
vf
VDCOCs|cn
jjfOa;BBCO
o

Food preference of four types of food in, weight group- I (20g) of E. suratensis, ^^en fed in the morning.
Name of Food Items
Average qvxantity of unconsumpii food,in gms.
Average quantity of consumed food, in gms.
Average quantity of food consumed by individual fish, in gms.
Spirogyra 3.425 4.575 1.144
Salvina 7.997 0.0027 0.0006
Pellettedfeed 2.966 5.034 1.258
Clam meat 3.474 4.526 1.132

Food preference of four types of food in weight group II (4gm) of.E. suratensis, vihen fed in the evening
Name of the Food Items
Average quantity Average quantity of of unconsumed consumed
food , in gms. food , in gms.
Average quantity food consumed by individual fish in gms.
Spirogyra 0.736 1.263 0.316
Salvinia 1.996 0.0036 0.0009
Pellttedfeed 0.389 1.6112 0.4028
Clammeat 1.012 0.988 0.2471
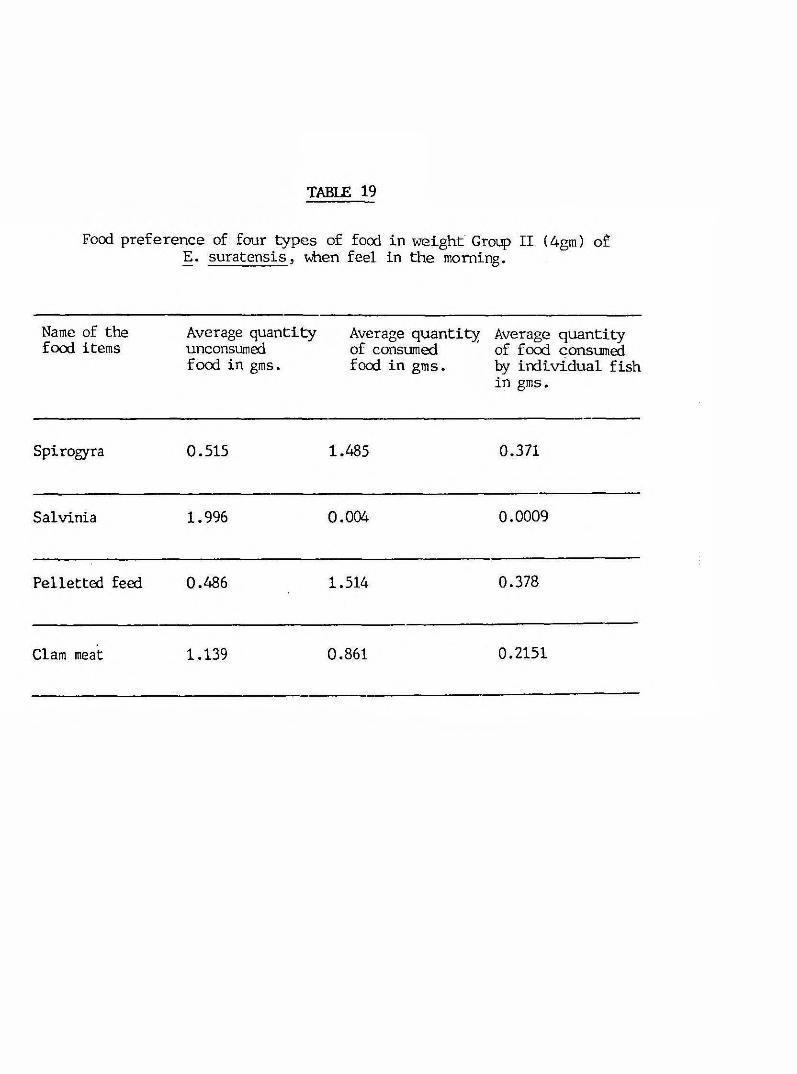
Food preference of four types of food in weight Group II {4gm) o£ E. suratensis, when feel in the morning.
Name of the food items
Average quantity unconsum^ food in gms.
Average quantity of consumed food in gms.
Average quantity of food consumed by individual fish in gms.
Spirogyra 0.515 1.485 0.371
Salvinia 1.996 0.004 0.0009
Pelletted feed 0.486 1.514 0.378
Clam meat 1.139 0.861 0.2151

Q)
CO
<DOcCO
•r^uCO>
C/D• I—(
CO
>4CO
■3S■3c 1= ■i«
BU-i *—t
CO >
0 0a >r> .0 0
tH
tHo ^CO
otH
0 00 0r> .r> .
«
OCO
mo
CO
0)u03
g -
cCOQ)
Z
COa•o
1<T'CO
CM
CT»
S•
r> .
CNio ^r>.
O
COCsJO
•o
CO0)u*90o*(A
UM0
or o
♦O
cnr vtH
r>*
o \s•
r>*
mr>.CO
Cs|
CMCMt-H
OCSJO
CO
W
IW0
CO E(U o 0> T5 J - © 0 0 (U 0 ^
Q Cl.
r>«. CO tH CO o >< t
COvD
0)o
w
g•WAJCOO
•r^1—4CL0)
§•Hi JCO
4JC/3
>-■Od)N
•r^CO
s•r^4 JOCOu(Uuc
wouutJ
1-^CO4J
stH CvJ < r v£>
r> .1

Statistical analysis by Factorial Anova showed
that preference of the four items of feed has varied
significantly at 17® level in both the weight groups.
The critical difference values showed that generally
there was significant difference in the preference of
the four feeds, ie between Splrogyra and Salvinia and
pelleted feed, Salvinia and clam meat. But, there was
no significant difference in the preference of feeds in
the morning feeding schedule and evening feeding
schedule. In both the size groups, the average food
consumed by each fish was more in the caseof pelleted
feed than the other items. Spiro^yra, clam meat and
Salvinia have followed the above in the order of
preference. { Table 34 )

D I S C U S S I O N
The Cochin backwater system is profoundly influenced by
the south-west monsoon, which brings out changes from a marine
and bracklshwater condition to a freshwater condition during
the monsoon rains. The physico-chemical conditions in the
backwaters and connected canals are controlled by tides to a
great extent. As is well known, the fishery resources of any
area is mainly dependent on the magnitude of primary and
secondary production which In turn are influenced by physical,
chemical and biological factors. In the present study, the
atmospheric temperatures have shown little variations.
Temperatures were lesser during the monsoon months than during
the other months in all the three stations.
Water temperature influences the biochemical reaction
and the microbial release of nutrients in the water and the
soil. In the present study water temperature was less during
the monsoon months than during the other periods. Monthly
variations in temperatures observed may be due to the time lag
between sampling and the incursion of cold and highly saline
water through the barmouth. (Sankaranarayanan and Qasim,
1969). Vijayalakshmi and Venugopalan (1973) while studying
the physico-chemical properties of Vellar Estuary have stated
that diurnal variations in the surface temperature have
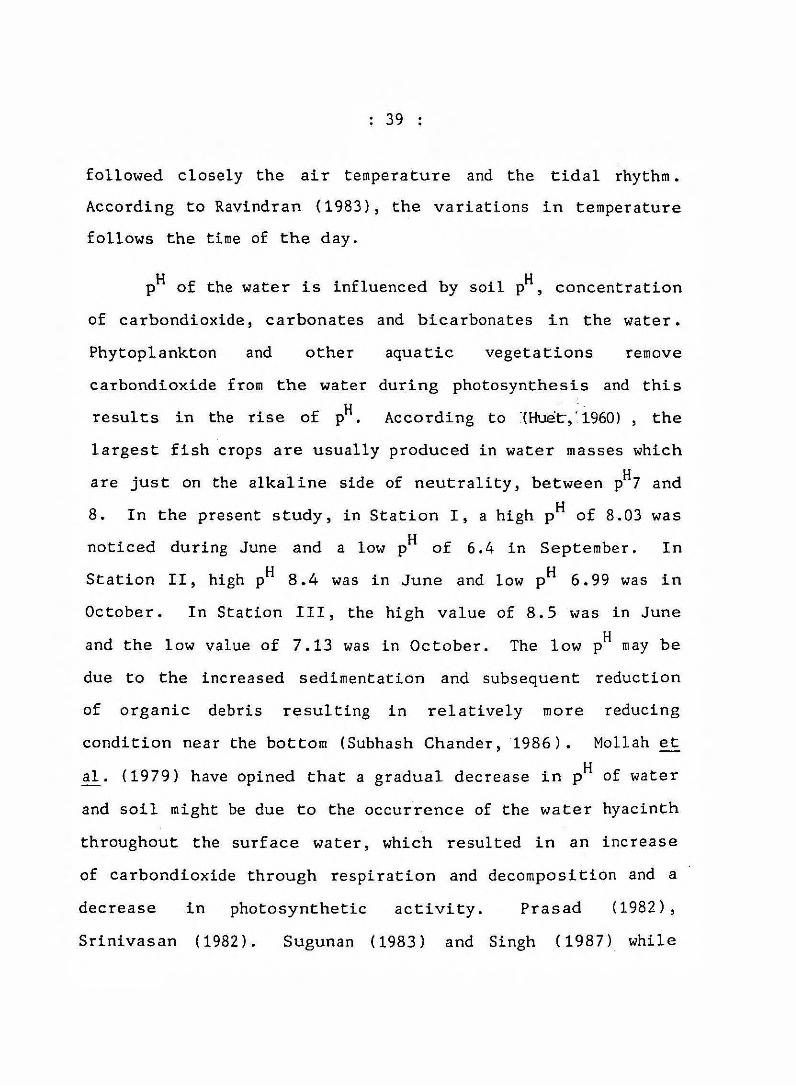
followed closely the air temperature and the tidal rhythm.
According to Ravindran (1983), the variations in temperature
follows the time of the day.
H Hp of the water is influenced by soil p , concentration
of carbondioxide, carbonates and bicarbonates in the water.
Phytoplankton and other aquatic vegetations remove
carbondioxide from the water during photosynthesis and thisu
results in the rise of p . According to (Huet*/1960) , the
largest fish crops are usually produced in water masses whichu
are just on the alkaline side of neutrality, between p 7 andij
8. In the present study, in Station I, a high p of 8.03 was
noticed during June and a low p of 6.4 in September. In
H HStation II, high p 8.4 was in June and low p 6.99 was in
October. In Station III, the high value of 8.5 was in Juneu
and the low value of 7.13 was in October. The low p may be
due to the increased sedimentation and subsequent reduction
of organic debris resulting in relatively more reducing
condition near the bottom (Subhash Chander, 1986). Mollah etIJ
al. (1979) have opined that a gradual decrease in p of water
and soil might be due to the occurrence of the water hyacinth
throughout the surface water, which resulted in an increase
of carbondioxide through respiration and decomposition and a
decrease in photosynthetic activity. Prasad (1982),
Srinivasan (1982). Sugunan (1983) and Singh (1987) while

; AO :
investigating the ecology of certain brackishwateru
culturesystems near Cochin, have reported high p values for
water and sediments during the monsoon and postmonsoon.u
Ravindran (1983) has reported that p did not show any
seasonal and tidal variations. In the present study, high p^
was noticed during monsoon months in all the 3 stations.
oLow salinity values were noticed during monsson months
in all the three stations. The precipitation and freshwater
discharge into the ecosystem during the monsoon have reduced
the salinity, as drawn attention to by Subhash Chander
(1986), Prasad (1982), Gopalan ^ £l (1982) Gopinathan et al
(1982) and Sankaranarayanan e^ al , (1982) from certain
brackishwater systems around Cochin.
Among the chemical constituents of natural waters,
oxygen is of primary importance both as a regulator of
metabolic process of plant and animal community and as an
indicator of water conditions. Based on a study conducted by
Ellis (1937), it is found that dissolved oxygen concentration
below 3ppm can lead to asphyxia and that in order to maintain
a favourable condition for a varied fish fauna, 5 ppm of
dissolved oxygen is required. In the present study in
Station I the oxygen values ranged between a high value of
4.835ml/L in July and a minimum of 3.08ml/L in September. In
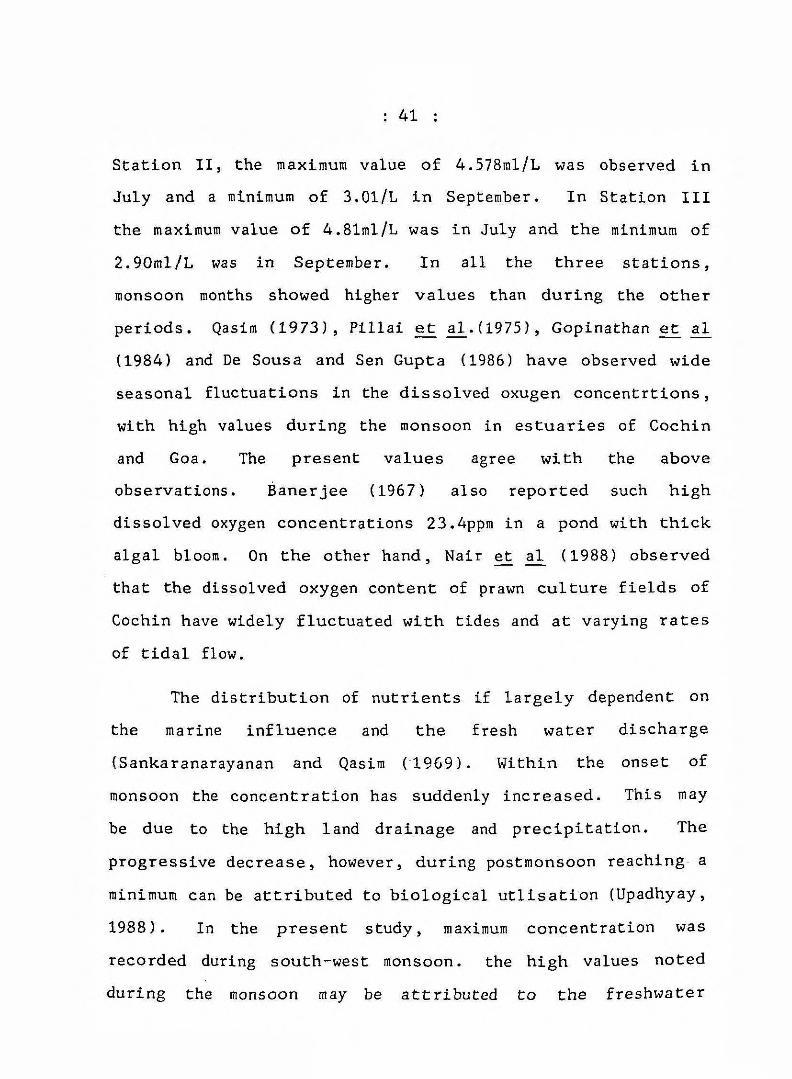
Station II, the maximum value of 4.578ml/L was observed in
July and a minimum of 3.01/L in September. In Station III
the maximum value of 4.81ml/L was in July and the minimum of
2.90ml/L was in September. In all the three stations,
monsoon months showed higher values than during the other
periods. Qasim (1973), Pillai ^ a^.(1975), Gopinathan e£ a]
(1984) and De Sousa and Sen Gupta (1986) have observed wide
seasonal fluctuations in the dissolved oxugen concentrtions,
with high values during the monsoon in estuaries of Cochin
and Goa. The present values agree with the above
observations. Banerjee (1967) also reported such high
dissolved oxygen concentrations 23.4ppm in a pond with thick
algal bloom. On the other hand, Nair et £l (1988) observed
that the dissolved oxygen content of prawn culture fields of
Cochin have widely fluctuated with tides and at varying rates
of tidal flow.
The distribution of nutrients if largely dependent on
the marine influence and the fresh water discharge
(Sankaranarayanan and Qasim ( 1969). Within the onset of
monsoon the concentration has suddenly increased. This may
be due to the high land drainage and precipitation. The
progressive decrease, however, during postmonsoon reaching a
minimum can be attributed to biological utlisation (Upadhyay,
1988). In the present study, maximum concentration was
recorded during south-west monsoon. the high values noted
during the monsoon may be attributed to the freshwater

discharge (Sankaranarayanan and Qasim, 1969). Verlencar
(1987) is of opinion that seasonal changes in-
Nitrate-Nitrogen concentTation was due to its quick
utilization.
Nitrite-Nitrogen may be formed as a result of the
decomposition of organic nitrogen and it is a transitory
stage in the nitrogen cycle. The findings of Sankaranarayanan
and Qasim(1969), Manikoth and Salih (1973), Saraladevi et ^
(1993) and Nair et ^ (1988) showed higher values of Nitrite-
Nitrogen during the postmonsoon and lesser values during the
monsoon.
The interchange of phosphates between sediments and
water is known to be one of the major factors governing the
phosphate concentration of the overlying water(Subhash
Chander 1986). Sediments of estuaries are several times
richer in phosphates compared to the overlying water (Moore,
1930) and are reported to entrap phosphates in times of
exce ssive run off ( Sinha, 1981^). Regenerative property of the
sediment is also known to play a vital role in governing the
nutrient concentrations. Inorganic phosphate concentration in
the present study was high during premonsoon, as also
reported by Gopinathan et al . (1984), Subhash Chander (1986)
and Devapiriyan (1990). Upadhyay (1988) has explained the
low concentration of this nutrient during monsoon to a massive

land drainage. Saraladevi et (1983) while studying the
nutrients in the estuaries of Kerala have reported that
phosphates did not show any well defined seasonal pattern.
The present observations also did not show any well defined
seasonal pattern.
Sankaranarayanan and Qasim (1969), Gopinathan et al ■
(1974, 1984), Datta et al, (1983) and Joshi (1990) have
observed high silicate values during the monsoon season. The
present observations agree with the above studies. The high
value recorded during the monsoon may be due to the fact that
the chief source of silicate is from the soil which in turn
is brought down by land runoff during the monsoon. De Sousa
(1983) has reported low silicates during the monsoon season
and has suggested biological utilization and abiological
removal' by adsorption into the suspended sediments as the
probable mechanisms of removal, Upadhyay (1988) suggested
that dilution effect due to large river run off may have
considerable influence on the lowering of silicates during
the monsoon.
Diatoms constitute the major part of phytoplankton and
serve as the food directly or indirectly to almost all
animals in Che habitat. Throughout the study period, diatoms
was the dominant component in Stations II & III. But in
Station I blue-green algae and green algae were the dominant
groups. George (1958), Joseph and Pillai (1975), Gopinathan
et £l. (1984) and Preetha (1990) have reported the abundance
of diatoms from Cochin backwaters and Gopalakrishnan £t al.
(1988) from prawn culture fields at Cochin.

FEEDING INTENSITY.
In the present study of four size groups, viz,,
60-89mm, 90-119mm, 120-149mm and 150-179mni5 the first one
(60-89mm) showed the maximum feeding intensity in all the
three stations. Devaraj et al. (1975) in their studies on
the food and feeding habits of E.suratensis from fresh water
tanks and estuaries in Mangalore have reported that the
intensity of feeding was higher in juveniles of E.suratensis
in estuarine environments than in freshwater tanks. They
have also reported that in the estuarine environment feeding
intensity was higher in juveniles, whereas the intensity
appeared to be somehwat similar in all the length groups of
fishes collected from freshwater tanks. The present study
also showed higher feeding intensity in smaller size groups
from all the Stations.
According to Sathiavathy (1989), the maximum feeding
intensity was observed in the 90-120mm group both in culture
ponds and backwaters. Jayaprakash (1981), while studying the
feeding habits of E .suratensis of certain size groups from
Veli lake, Thiruvananthapuram, has reported that the maximum
feeding intensity was shown by specimens in the length group
of 105-140min. Prasadam (1971) also has suggested that adults
of E . suratensis were more actively feeding than the
juveniles.

: 45 ;Variation in the ^it len ,th o£ the len .th r,70ups.
In the present study, the length groups I & III showed
higher R.L.G. factor in all the three stations. Relative
lengths of gut for different fishes with diverse feeding
habits have been estimated by Das and Srivasthava (1979).
They have reported that there is an increase in RLG factor
for herbivorous fishes from early larval stages to adults.
Thus, they have observed an increase in RLG factor of
Cirrihinus reba from 306 to 894 as it grows from the
fingerling stage to the adult condition. Similarly, in
Cirrihinus mrigala, RLG has increased from 6.05 to 11.6, from
fingerling to juvenile stages.
Quantitative data for Tilapia rendelli, Sarotherodon
melanothera and Sarotherodon mossambicus in a West African
Lagoon show that the ratio of intestinal length to fish
standard length is between 7:1 and 10:1 (Caulton, 1976 ;
Pauly, 1976). According to Sathiavathy (1989), the RLG
factor of E.suratensis has increased from younger stages to
adult. This Indicates that the species gradually turns to a
vegetative feeding habit from an omnivorous habit in the
younger stages.
De Silva and Perera (1983) have reported that the mean
relative intenstional length (m.r.i.l.) of E .suratensis is
less than that of a typical herbivorous fish and varies from
1.6:3 to 7:1. De Silva et al . (198A) reported that, the
m.r.i.l. of E.suratensis is higher in freshwater reservoirs,
where it is primarily adapted to feed on macrophytes than
that in euryhaline lagoons where its food is mainly moLluscs .

Jayaprakash et al . ( 1979) have reported that the general
layout of the alimentary canal as evidenced by RLG for
E.maculatus is 2.2 which confirms to that of omnivorous
fishes. According to Al Hussaini (1948), the intenstinal
length of omnivorous fishes varies from 0.7 to 4 times the
length of the animal. From the present study, it may be seen
that E .suratensis has an omnivorous feeding habit during the
early stages, involving the length groups I and II. But, the
length groups III and IV showed more a herbivorous habit than
an omnivorous one.
Food variations in different size groups:
The food and feeding habits of E . suratensis have
studied by several previous workers (Rajj 1983;
Bhaskaran,1946; Job et _al. , 1947; Alikunhi, 1957; Hora and
Pillay, 1962; Jhingran and Natarajan, 1969; Prasadam, 1971;
Devaraj et , 1975; Varghese, 1975; Jayaprakash, 1980;
Costa, 1983; De Silva et a] . , 1984). The feeding habits of
the species during different stages of its life history have
also been discussed by some workers (Alikunhi, 1957; Hora and
Filial, 1962; Prasadam, 1971; Jayprakash, 1980) . The results
of the present study indicate that there are variations in
the feeding habits during different stages of the life
history of the species and the observations agree in certain
respects with those of the previous workers.
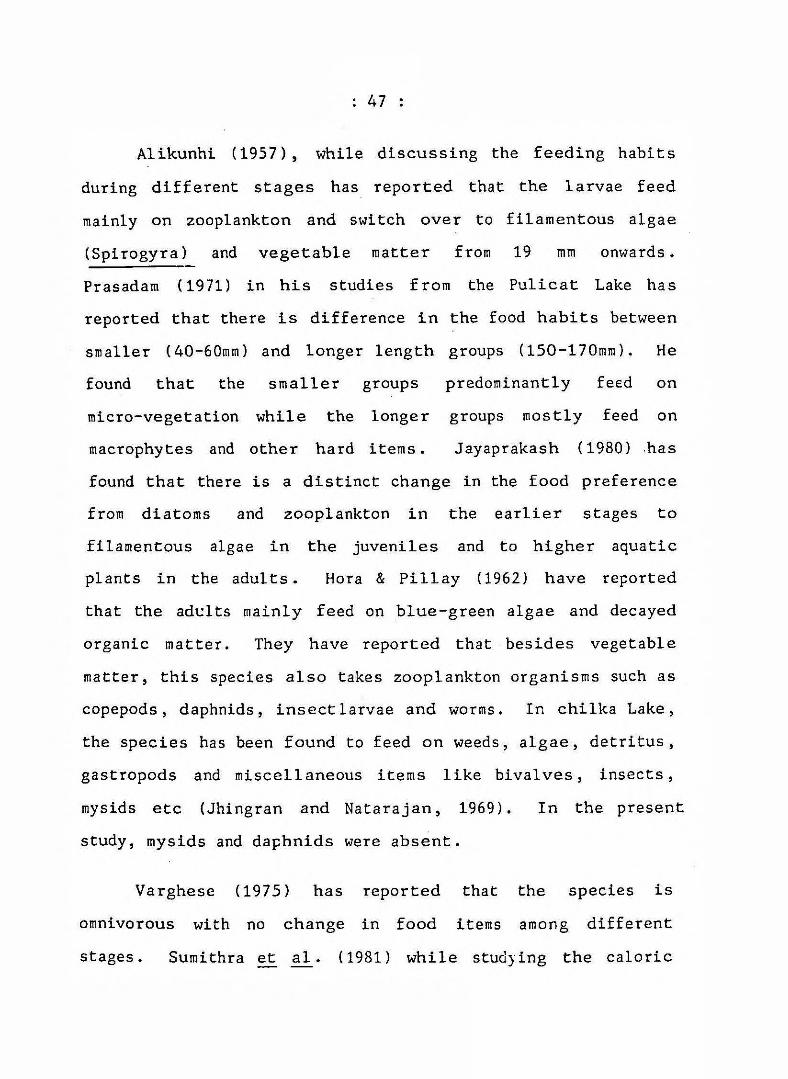
Alikunhi (1957), while discussing the feeding habits
during different stages has reported that the larvae feed
mainly on zooplankton and switch over to filamentous algae
(Spirogyra) and vegetable matter from 19 mm onwards.
Prasadam (1971) in his studies from the Pulicat Lake has
reported that there is difference in the food habits between
smaller (40-60mm) and longer length groups (150-170mm). He
found that the smaller groups predominantly feed on
micro-vegetation while the longer groups mostly feed on
macrophytes and other hard items. Jayaprakash (1980) -has
found that there is a distinct change in the food preference
from diatoms and zooplankton in the earlier stages to
filamentous algae in the juveniles and to higher aquatic
plants in the adults. Hora & Pillay (1962) have reported
that the adults mainly feed on blue-green algae and decayed
organic matter. They have reported that besides vegetable
matter, this species also takes zooplankton organisms such as
copepods, daphnids, insect larvae and worms. In chilka Lake,
the species has been found to feed on weeds, algae, detritus,
gastropods and miscellaneous items like bivalves, insects,
mysids etc (Jhingran and Natarajan, 1969). In the present
study, mysids and daphnids were absent.
Varghese (1975) has reported that the species is
omnivorous with no change in food items among different
stages. Sumithra et a l . (1981) while studying the caloric

value of ingested food of E . suratensis grown in culture
ponds, have observed no change in the feeding habits of the
species during different stages and reported that the species
is principally a phytcplankton-detritus feeder. The
observations made by Varghese (1975) and Sumithra £t al.
(1981) indicating an omnivorous feeding habit for the species
with no change in food selection during the different stages ,
may be due to the fact that they may have made observations
in enclosed environments, where there is no scope for a wide
food selection.
According to Bowen (1981), detritus formed an important
food of pond-reared E . suratensis and it has been reported to
play a significant role in the diet of certain freshwater
Cichlids. Devaraj e^ ^ (1975) in a comparative study of the
food of juveniles of E .suratensis collected from estuarine
and freshwater of Mangalore, have observed that detritus
formed a significant portion of the stomach contents of
fishes collected from both the estuarine and freshwater
environments. It has been pointed out by Halver ( 1972) that
when plant material and other food items become scarce,
tilapia will eat bottom detritus mud and decaying vegetation.
According to Sathiavathi (1989) E.suratensis has been
reported to be predominantly a macrophytic feeder in adult
stages. Macrophytes like Hydrilla, Elodea, Chara etc were
reported to be present in the stomach contents of
E. suratensis from Veli lake (Jayaprakash, 1981). Hora and

Plllai (1962) have reported the presence of Blyxa and
Utrlcularla in the gut contents of fishes from Chilka lake.
De Silva (1984) have reported that the dentition
and the position of mouth of E.suratensis shows mixed
characteristics. The frontal incisiform sharp teeth are
similar to those found in the Cichlid fishes such as Tilapia
rendelli, T . zllll and Haplochromls Simllis which feed on
higher aquatic plants (Fryer and lies, 1972).
Feeding habits in different Stations:
Comparative studies of the food habits of E.suratensis
made in different ecosystems are only a few (Devaraj ^ al . ,
1975; Costa, 1983; De Silva et al., 1984). Devaraj e£ al.
(1975) in a comparative study of the juveniles from an
estuary and freshwater tanks at Mangalore, have reported that
filamentous algae and detritus formed the dominant food item
in the stomach contents of fishes from estuarine waters,
while insect larvae and detritus were found as dominant items
in the stomach contents of fishes from freshwater tanks. De
Silva et al . (1984) who have studied the food and feeding
habits from an euryhaline Kaggala lagoon and a fresh water
reservoir in Sri Lanka have found that in fresh water
reservoirs macrophytes formed the major food items in the
gut.
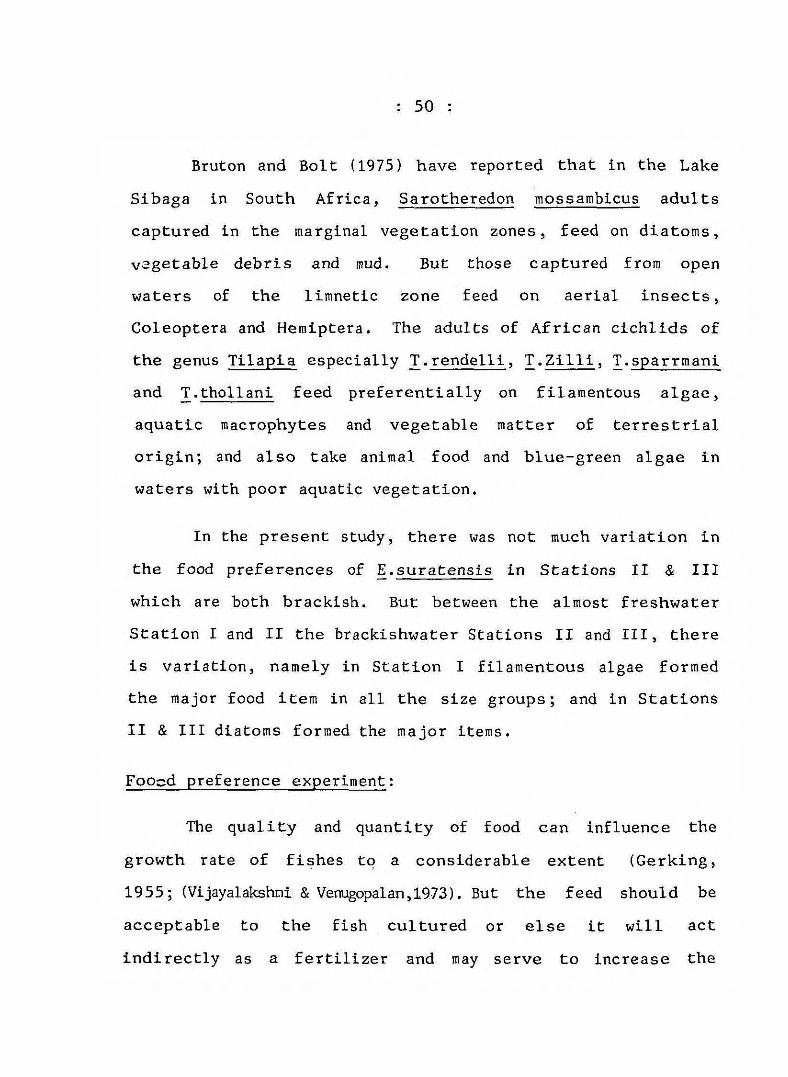
Bruton and Bolt (1975) have reported that in the Lake
Sibaga in South Africa, Sarotheredon mossambicus adults
captured in the marginal vegetation zones, feed on diatoms,
v3getable debris and mud. But those captured from open
waters of the limnetic zone feed on aerial insects,
Coleoptera and Hemiptera. The adults of African cichlids of
the genus Tilapia especially T .rendelli, T .Zilli , T.sparrmani
and T.thollani feed preferentially on filamentous algae,
aquatic macrophytes and vegetable matter of terrestrial
origin; and also take animal food and blue-green algae in
waters with poor aquatic vegetation.
In the present study, there was not much variation in
the food preferences of E .suratensis in Stations II & III
which are both brackish. But between the almost freshwater
Station I and II the brackishwater Stations II and III, there
is variation, namely in Station I filamentous algae formed
the major food item in all the size groups; and in Stations
II & III diatoms formed the major items.
Foosd preference experiment:
The quality and quantity of food can influence the
growth rate of fishes to a considerable extent (Gerking,
1955; (Vijayalakshni & Venugopalan,1973). But the feed should be
acceptable to the fish cultured or else it will act
indirectly as a fertilizer and may serve to increase the

natural productivity of the pond, which in turn may be
utilised by the fish (Halver, 1972). The importance of
incorporating natural food items in artificial feeds has been
well illustrated by Yashouv and Ben Schachar (1967) in the
experiments conducted on Mugil capito in Israel. In these
experiments percentage increases of body weight of 115.50 mg.
was observed with plankton food alone; 127.0 mg. with pellets
alone composed of wheat, fishmeal, soya flour containing 227o
protein; and 183 mg. with pellets and plankton food together.
In the present study, a natural food item Spirogyra (257®)
was incorporated in the pelleted food. The inclusion of
aquatic plants in the diet of fishes which are herbivorous in
the adult condition have been suggested by Huet (1960),
Halver ( 1972), Ga.lgher (198A) and Edwards (1985).
Huet (1960) has pointed out that chopped grasses, water
plants, algae, banana leaves, mill scrappings, bran, broken
rice grain and oil cakes can be used for feeding tilapia.
The feeds usually given to cultured stocks of fishes in
India include various cereal bran like rice bran and wheat
bran and oil cakes of ground nut, mustard, coconut etc
(Alikunhi, 1957: Sinha, 1981). The published literature on
the use of supplementary food for E.suratensis in the
laboratory and field conditions are those of Jayaprakash
(1980), Sumithra et al. (1978), Krishnakumari et al. (1979),

AnonymoiS (1981) and De Silva and Perera (1983). Sumltra et
(1982) have reported a high specific growth rate for the
species when £ed on food containing 53.62% protein.
In the present observations on the food preference with
four kinds of food (Spirogyra, Salvinia, pelleted feed and
clam meat), the preference for pelleted feed over Spirosyra
clam meat and Salvinia, indicates that the mixture containing
ground nut oil cake, tapioca powder, Cod liver oil, Vitamins
and mineral mix may be more acceptable for the fish than the
others. Much more experiments are needed to confirm the
present one.
S U M M A R Y
The present observations on the ecology and feeding
habits of E.suratensis in three stations at Cochin were
carried out for a period of five months from June to
November, 1993. Of- these, one station was almost freshwater
one; and the others were brackish.
Atmospheric temperatures ranged between 27*0 and 32.5®C
in these stations. Water temperatures have closely followed
the air temperatures and the range was from 27*0 to SQ.S^C in
Poothotta brackishwater system (Station I), 27.5“C to 31.5°C
in Edavanakadu brackishwater system (Station II) and 27.5®C
to 31°C in the Narackal feeder canal (Station III), All the
systems showed low temperature values during monsoon season,
fjThe p values have fluctuated from 6.40 to 8.03 in
Station I, 6.93 to 8.4 in Station II and 7.13 to 8.5 in
Station III.
Low salinity values were recorded during the monsoon
season in all the three stations. These have ranged between
0.0687o* to 0.4987o. in Station I, O.6177o. to 4.757o* in Station
II, and 0.667o. to 4.857o. in Station III.
In all the three stations high dissolved oxygen values
were recorded during the monsoon months between 2.73ml/L and

4.835ml/L in Station I; 2.361ml/L and 4.578inl/L. in Station
II; and 2.659ml/L and 4.8126ml/L in Station III.
High nitrite-nitrogen concentration was noticed during
the monsoon season in all the three stations. Values ranged
between 0.46 jugat/L and 1.64^gat/L in Station I; 0.15^gat/L
and 2.2 yugat/L in Station II; and 0.70 yugat/L and 1.80 gat/L
in Station III.
In the case of nitrate-nitrogen concentration, high
values were noticed during monsoon season in Stations I and
III, but no such trend was noticed in Station II.
Silicate-Silicon concentration has fluctuated from 20.6
jUgat/L to 58 pgat/L in Station I; 14 ^ugat/L to 36 jUgat/L in
Station II and 15 gat/L to 36,4 gat/L in Station III. the
fluctuation was inconsistant in all the three stations.
From the water sample and soil analysis, it has been
observed that diatoms were dominant during the study period,
except during June and July, when filamentous algae like
Oscillatorla and Spirogyra have dominated in Station I. In
Stations II and III, datoms were dominant throughout the
study period.
Based on the gut content analysis, filamentous algae
were observed to form the major food item in Station I in all
the size groups; and diatoms in Station II and III. In all
the three stations gut contents were mostly made up of

Osclllatorla, Pleurosigma , Gyrosigma , Navicula , Nltzschia
Amphora , Amphipora, Dlplonels , Rhizo solenla, Coscinodiscus,
detritus, fragments of higher plants, sand grains,
miscellaneous items including roots of higher plants, fish
eggs, fish scales, copepods , amphipods and gastropods . In all
the three stations, smaller size groups (60-89mm and
90~119mm) were found to be omnivorous in habit whil . the
larger size groups (120-149mm and 150-179min) were found to be
more, of a herbivorous in habit.
The observations have shown a decrease in feeding in
indices with increase in size in all the three stations.
The food preference experiments on two weight groups
(20g & 4g) have indicated that among the four types of feeds
supplied, Spirogyra, Salvinia, pellected feed and clam meat,
the preference was for pelletted feed. Also between the two
weight groups, the preference varied significantly.

R E F E R E N C E S
AL HUSSAINIj A.H. 1947. Feeding habits and the morphology of alimentary tract of some teleosts, living in the neighbourhood of the Marine Biological Station, Ghardequa, Red sea. Fond I. Univ. Publications of the Marine Biological Station. Ghardaqua 5 : 4-61..
ALIKUNHI, K.H. 1957. Fish culture in India. 'Em. Bull,Indian Coun. Agri. Res. 20: 144 pp.
ANONYMOUS 1981 Proc. Fourth Workshop of All India Co-ordinated Research Project Brackish water Prawn and Fish Farming. Centr. Inland Fish. Res. Insh,I.C.A.R. Kakinada 1981: 25 pp.
ARAVINDAN, C.M, and USHAKUMARI, 1980, Food selection and feeding habits of Tllapia mossambica in different ecological habitats. Proc. Indian Natn. Sci. Acad, B 46 (1) :54-57.
BANERJEA, S.M, 1967- Water quality and soil condition of fish ponds in some states of India in relation to fish production. Indian. J. Fish., 14: 115-144.
BHASKARAN, V.K. 1946. Bionomics and life history of Etroplus suratensis (Bloch) with special reference to stocking tanks CAbstract) Proc. 33rd. Indian Sci Congr,, Part III. Abstracts: 128.
BRUTON, M.N. and BOLT, R.E. 1975. Aspects of biology of Tilapia mossambica Peters (pisces: Cichlidae) in a natural £resh water lake (Lake Sibaya South Africa) .J.Fish. Biol. 7: 423-446. ------ ------
CAULTON, M.S. 1978- Tissue depletion and energy utilisation during routine metabolism by sub-adult Tilapia rendelli Boulenger. J_. Fish Biol. 13: 1-6.
CHACKO, P.I. 1949. Fish and Fisheries of the Muthupet saline swampj Tanjore district. Proc. 36th Indian Sci. Congr. (Allahabad), Pt. 3, Abstracts 1^3-164,
COSTA, H.H, 1983.- Biological studies of the Pearlspot Etroplus suratensis (pisces : Cichlidea) from three ditterent habitats in Sri Lanka, Int. Rev. Gesamt. Hydrobiol. 68 (4) : 565-580.

DAS, S-M- and SRIVASTHAVA A.K. 1979. On relative length of gut (RLG) in some food fishes of Uthar Pradesh with changes from fingerlings to adult stage. J.Inland Fish. Soc. India. 2 (1 ): 6-1 1 .
DAY, F. 1878-88. The fishes of India: a natural history of the fishes of India, Burma and Ceylon, text including supplement, London. 1 1-20. PP.
DAY. F. 1889, The fauna of British India, including Ceylon and Burma Fishes - London,l,pp:
DATTA, N.C., S.CHAUDHURI, M.DAS and B-GHOSH. 1983. Ecological characteristics of brackish water bheri of the Sunderbans, West Bengal. Env. Ecol. ,1(4:235-239 .
DE SOUSA, S.N., R-SEN GUPTA 1986. Variations of dissolved oxygen in Mandori and Zuari estuaris. Indian J.Mar. Sci,, - 15(2) : 67-71.
DE SILVA, S. SENA, M.RUCHIRA and T. CUMARANATUNGE 1984. Aspects of the biology of euryhaline Asian cichlid, Etroplus suratensis. Env. Biol.Fish. ^(1-2) : 77-87.
DE SILVA, S. SENA and PERERA, N.K. 1983. Digestibility of an aquatic macrophyte by cichlid Etroplus suratensis with observations on the relative merits oT three indegenous compounds as markers and daily changes in protein digestibility. J.Fish. Biol. 23: 675-684.
DEVAPIRIYAN. R.1990. Studies on the ecology and production of algae in prawn culture systems. Ph.D. Thesis, Cochin. Univ. Sci & Tech. 81p.
DEVARAJ, K.V. SANTHARAM,B. and SHETTY, H-P.C. 1975. A comparative study of the food of juveniles of the pearl spot Etroplus suratensis (bloch) collected from Estuarine and Fresh waters. Mysore J . Agric. Sci.9 :131-135 .
ELLIS ,M.M. 1939. Detection and measurement of stream pollution. Ball. U.S. Bur. fish 58 :365-437 .
FRYER,G. and ILES, T.D. (1972) The Cichlid fishes of ^reat lakes of Africa, their biology and evolution. PuBl^ By Oliver and Boyd. Edinburgh: 641 pp.

GALGHER, I.G. PORATH ,D. and GRANOTH, G,(1984) Evaluation of duck weed (Lemna sibba) as feed for tilapla (Qreochromis niloticus, O.aureusl Tn a recirculating unit. Aquaculture. 5 T r 235-2'44;
GERKING, S.D. (1955) Influence of rate of feeding and body composition on protein metabolism of blue gill sun fish. Physiol. Zool. 28: 267-282.
GEORGE. K.V. 1958. Observations on the plankton of Cochin backwater. Indian. J .Fish. _5* 375-401.
GOPALAKRISHM T.C., C.B. LALITHAMBIKA DEVI, P.N. ARAVINDAKSHAN, K.K.C. NAIR, T.BALASUBRAMANIAN and M .KRISHNANKUTTY, 1988. Phytoplankton and Zooplankton of some paddy-cum prawn culture fields in and around Cochin Mahasagar., ^(2); pp 85-94.
GOPALAN, U.K., K . S . PURUSHAN, V. SANTHAKUMARI and P.P. MEENAKSHI KUNJAMMA, 1982. Experimental studies on high density, short term farming of -shrlmp, P.indices in a Pokkali field in Vypeen Island, Kerala. Proc. Symp. Coastal Aquaculture. 1: 151-159.
GOPINATHAN, C.P. , P.V.R.NAIR, V. KUNJIKRISHNA PILLAI, P.PARAMESWARAN PILAI, M. VIJAYAKUMARAN and V.K. BALACHNDRAN 1982. Environmental characteristics of the seasonal and perennial prawn culture fields in the estuarine system of Cochin. Proc.Symp .Coastal Aquacult., 1; 369-382.
GOPINATH, K. 1948. Weed destroying habits of Etroplus suratensis (Bloch), Department of Research Report for the septennium 1939-1946. University of Travancore. Division, Marine Biology and Fisheries, 1948; 268 pp.
GIDNTHER, G., 1962, 1892. Temperature In: Hedgpeth, J.W, (ed). Treabise on marine ecology, Vol. I: 159-184.
HALVER, J.E. 1972. Fish Nutrition. Ed.J.E. Halver, Academic Press Newyork 1972.
HUETj MARCEL. 1960. Textbook of fish culture - breeding and cultivation of fish. Fishing News (Books) Ltd. England.
HORA, S.L. and PILLAY, T.V.R. 1962. Handbook on the fish culture in the Indo pacific region F.A.O. Fish. Biol. Tech. Pap. 14: 124 pp.
HYNES, H.B.N. 1950- The food of fresh water sticklebacks (Gasterosteus acculeatus and Pygosteus pingilim with a review o^ inethods used in studies or the food fishes. J. A n i m . Ecol. 19(1} : 36-38.

JOSHI, K.K. 1990. Nature and ecological significance of nutrient regneration in different prawn culture fields. Ph.D. Thesis , Cochin Univ. Scl & Tech. 192 p.
JOSEPH K,J. and V.KUNJUKRISHNA PILLAI. 1975. Seasonal and spatial distribution of phytoplankters in Cochin backwaters. Bull. Dept. Mar. Sci. Univ. Cochin, 7(i): pp 171-180.
JAYAPRKASHV.and G. PADMANABHAN 1985. Food and feeding habits of the pearlspot Etroplus suratensis (Bloch) Proc. Symp. Coastal Aquaculture 3; pp 955-9^3^
JAYAPRAKASH-V. 1980* Culture possibilities of pearl spot, Etroplus suratensis (Bloch) in Kerala. Sea Food Export. J. 12(11): 51-52.
JAYAPRAKASH V. 1980. The biology of Etroplus suratensis. Ph.D thesis University of Kerala, 435 pp.
JAYAPRAKASH, V- and NAIR, N.B. 1981. Food preference and effect of supplementary feeding on the growth of Etroplus suratensis (bloch) Memoir of the Salem Institute oT Experimental Biology, No.I; 177-185.
JHINGRAN, V.G. and NATARAJAN, A.V, 1969. A study of the fisheries and fish population of Chilka lake during the period 1957 - 1965. J. Inland Fish.S o d . India 1_: 49-126.
JOB, T.J., ALIKUNHI, K.H. and CHORDAMANI 1947. On thebiology of the pearlspot Etroplus suratensis. (bloch) Proc. 34th Indian Sci . Con^r . (Delhi ) Pt . 3 Abstract: 183.
KRISHNAKUMARI, L., SUMITHRA VIJAYARAGHAVAN, ROYAN, J.P. and WAFAR, M.V.M, 1979. Laboratory studies on the food conversion in Etroplus suratensis Mahasa^ar. 12(1) : 41-44.
MAHOBIA, GOPAL PRASAD 1987. Studies on Indian Cichlids. Ph.D. thesis Centre of Advanced studies in mariculture. Central Marine Tish^ries Research Institute, Cochin: 213 pp.
MOLLAH, M.F.A. A.K.M. AMINUL HAQUE, M. IDRIS and M.Y. CHAUDHURY, 1979. Interaction between pond bottom soil and water qualities. Indian J. Fish., 26 (1&2): 101-114.

MANIKOTH, SREEDHARAN and K.Y.M. SALIH 1974. Distribution characteristics of nutrients in the estuarine complex of Cochin, Indian J« Mar. Sol. ,3: 125-130.
MOORE, H-B. 1930. The muds of the Clyde Sea area I. Phosphate and nitrogen content. J. Mar. Biol.Ass. 16: pp 595-607 . ~ --- ~
NAIR, K . K X - , V.N. SANKARANARAYANAN, T.C. GOPALAKRISHNAN, T, BALASUBRAMANIAN, C.B. LALITHAMBIKA DEVI, P-N.ARAVINDAKSHAN and M.KRISHNANKUTTY 1988. Environmental conditions of some paddy cum prawn culture fields of Cochin backwater. Southwest Coast of India. Indian.J.Mar .Sci. ^(1): pp 24-30.
PAULY, D 1976. The biology, fishery and potential for aquaculture of Tilapia melanotheron in a small west African lagoon. Aquacul^re. 7_ (1) : pp 3J-49 .
PILLAY, V-K- JOSEPH. K.J. and NAIR, A.K. 1973. The plankton production in the Vembanad lake and adjacent waters in relation to the environmental parameters. Bull. Mar. Sci. Univ. Cochin. 8; 137-150.
PRASADAM, R.D. 1971. Observations on the biology of pearl spot Etroplus suratensis (Bloch) from the Pulicat lake, Madras, J. Inland Fish.Soc. India. 72-78.
PRASAD, P.E. 1982- Studies on the soils of some brackish water prawn culture fields around Cochin. MSc. Dissertation Cochi . Uni. Sci & Tech. , Cochin 80 p .
PREETHA PAUL, 1990. A study on the phytoplankton pigments and primary productivity in the Cochin backwaters during South West monsoon. M .Sc . Dissertation, Cochin. Univ.Sci . & Tech. 83p.
QUASIM, S.Z. 1973, Experimental ecology of tropical marine phytoplankton. Mar .Biol. Asscn. India Spl .Publ. 80-86.
RAVINDRAN N. 1983. Studies on the diurnal variation of certain environmental parameters in culture pond. M.Sc. Dissertation Cochin Uni. sci. & Tech. , 84p.
RAJ, B.S. 1983. Etroplus suratensis. Service Bulletin, Madras Fisheries Department, Madras, 86pp.
RAJ. B. and SUNDARA 1916. Notes on the freshwater fishes of Madras. Rec. Indian Mus. 12(6): 249-294.

SATHIAVATHY C.R. 1989. Food selectivity of pond reared and wild
Etroplus suratensis and effect of supplementary feeding on its growth.
M.sc. Dissertation, Kerala. Agri. Uni. 20 83.
SANKARANARAYANAN, V.N., S-Z- QQASIM 1969. Nutrients of the Cochin backwaters in relation to environmental characteristics. Mar. Biol. 2(2); pp 236-247. ---
SARALADEVI, K., P. VENUGOPALAN, K.N, RQ4ANI, DOMINIC ZACHARIAS arxi R.V. UNNITHAN 1983. Nutrients in some estuaries in Kerala. Mahasagar, Bull. Natn. Inst. Oceanogr., 16;161-173,
SEBASnANj V.O. 1942. On the role of Etrolplus maculatus (bloch) ard Etroplus suratensis (Bloch) in the control^^ mosquitoes. 3"! Bombay Nat. Hist. Soc. V r \ l ) : 271-273.
SNEDEOC^, G-W. and COCHRAN, W.G. 1968. Statistical methods. Oxford and IBH.publ. Co. Calcutta: 593 pp.
STRICKLAND, J.D.H. and PARSONS, T.R. 1972. A practical handbook of sea water analysis Bull. Fish. Res. Bd. Canada. 167 2nd Edition: 311 pp.
SRINIVASAN, R 1982- Studies on the distribution of benthos and hydrological parameters in prawn culture systems. M.Sc. Dissertation, C^hin Univ. Sci & Tech-.-, 96p.
SINGH, 1987. Comparative studies on the ecology of bottom macrofauna in seasonal and perennial fish ponds and in the adjacent backwaters. M.Sc. Dissertation, cochin. Univ. Sci & Tech. 108 p.
SINHA, V.R. P, and RAMACHANCRAN, V. 1981. Fresh water fish culture. Publications and information division, IndiarT Council of Agricultural Research New Delhi 80 pp.
SUBHASH, 1986. Studies on ecophysiology of Penaeus indicus H.Milne Edwards in the growout system. Ph.D. Thesis, Cochin Univ. Sci. & Tech. 325 P. --- ------------------ ---- ---
SUGUNAN, V. 1983. Ecology of meiobenthos in selected culture fields around Cochin. M.Sc. Dissertation, Cochin Univ. Sci. & Tech. 88p.
SUMITHRA, KRISHNAKUMARI-L, DHAWAN, R.M. and ROYAN, J.P. 1981. Caloric values of ingested food of E. suratensis in culture pond. Indian J.Mar.Sci. 10; 205-107.

THAMFY, D.M., JOSE, SUSHEEIA, RAJENCRAN, C.G. MRITHUNJAYANjP.S. arxi JOSE, M.M. 1987. 'Ihe growth, survival and production of pearl spot Etrcplus suratensis (Bloch) in brackish water culture ponds. Natn. Seminar on Estuarine Management. Science and Technology. Abst. EB 12.
UPADHAYAY.S 1988. Physico-chemical characteristics of the Mahanadi estuarine ecosvsterm, East Coast of India. Indian J. Mar. Sci., 17(1): 19-23.
VARGHESE, P.P. 1975. Studies on the biology, morphology and development of Cichlidae (Pisces) of Kerala, India, PhD. Thesis Cochin University. 215 pp.
VEJ®CATARAMAN, G. 1960- Studies on the food and feeding relationship of the inshore fishes of Calicut on the Malabar Ck)ast. Indian J. Fish. 7: 275-306.
VIJAYALAKSHHI, G ■ S . and V -K. VENUGOPALAN 1973 - Diurnal variation in the physico-chemical and biological properties in Vellar estuary. Indian J. Mar. Sci., ^:19-22.
Copyright © 2022 FDOKUMEN