Renuka B - ePrints@CFTRI
275
Biotechnological Approaches for the Preparation of FOS based Prebiotic and Probiotic Foods A thesis submitted to the UNIVERSITY OF MYSORE In fulfilment of the requirements for the award of DOCTOR OF PHILOSOPHY in BIOTECHNOLOGY by Renuka B Under the supervision of Dr. (Mrs.) S. G. Prapulla Senior Principal Scientist Department of Fermentation Technology and Bioengineering Central Food Technological Research Institute Council of Scientific and Industrial Research Mysore- 570 020, India September 2011
-
Upload
khangminh22 -
Category
Documents
-
view
0 -
download
0
Transcript of Renuka B - ePrints@CFTRI

Biotechnological Approaches for the
Preparation of FOS based
Prebiotic and Probiotic Foods
A thesis submitted to theUNIVERSITY OF MYSORE
In fulfilment of the requirements for the award ofDOCTOR OF PHILOSOPHY in BIOTECHNOLOGY
by
Renuka B
Under the supervision of
Dr. (Mrs.) S. G. PrapullaSenior Principal Scientist
Department of Fermentation Technology and Bioengineering
Central Food Technological Research InstituteCouncil of Scientific and Industrial Research
Mysore- 570 020, India
September 2011

Acknowledgements
I consign my respectful thanks to my supervisor Dr. (Mrs.). S. G. Prapulla, who
welcomed my candidature whole heartedly with great zeal and provided a platform to
perform under, a just then introduced fellowship programme from DST, Govt. of india.
She helped me to attain the hidden stakes of knowledge to pursue my research work
successfully. I express my deep sense of gratitude for all the academic nourishment right
from the beginning to this stage with incessant co-operation in all aspects of research
activities. Her valuable guidance and encouragement gave me an opportunity to take up
new challenges and enabled me to successfully complete this doctoral research. I will
always cherish the academic freedom and friendly atmosphere that I enjoyed in her
laboratory. I owe all my achievements to her. I would also like to express my sincere,
heartfelt gratitude to Late. Dr. M. N. Ramesh for his encouragement during the initial
stages of my research.
I am thankful to Dr. V. Prakash, former Director, and Dr. Venkateshwara Rao, acting
Director, CFTRI who have given me the opportunity to work in CFTRI. I am thankful to
Dr. N. G. Karanth, Dr, M. C. Misra, former Heads, FTBE and Dr. S. Divakar, Head,
Fermentation Technology and Bioengineering Department, CFTRI, for permitting me to
use the facilities of the Department.
I thank Dr. M. C. Varadaraj, Head, HRD, for bridging gap with university of Mysore for
all formalities towards this doctoral degree. I am also grateful to University of Mysore
for the same.
I gratefully acknowledge the Department of Science and Technology (DST), New Delhi,
Govt. of India for providing the financial assistance in the form of DST Scientist Fellow.
My special thanks to Dr. (Mrs). Surekha Puyed and Dr. (Mrs). Roopa Gowda who have
been instrumental in taking up the DST Women Scientist Fellowship.
I am extremely thankful to all the staff of FTBE Department for the support offered. My
sincere thanks to Dr. M. S. Thakur, Dr. H. K. Manonmani, Dr. A. P. Sattur, Dr. K. Yogish
and Dr. D. Somashekar for their support throughout my stay in the Department.
I am in dearth of words to express my deep sense of hearty gratitude to all the staffs of
Food Packaging Department, especially Dr. Ranga Rao, Head, Mrs. Indiramma, and
Mrs. Vijayalakmi for allowing me to use the lab facility throughout my research tenure.
Their kind cooperation, help and the favourable atmosphere during my work is
unforgettable. Without their timely help and support, it would not have been possible to
complete my research.

I am grateful to Mr. Anup Krishna, former scientist, Food Engineering Department,
CFTRI, and Mr. Sathyendra Rao, Senior Principal Scientist, Grain Science and
Technology, CFTRI for their valuable help in carrying out optimization studies. I have
been greatly benefited from their experience and skills. I thank Dr. Prakash Halami,
Scientist, Food Microbiology Department for the support in executing molecular biology
experiments and Dr. (Mrs) Maya Prakash, Head, Sensory Science Dept., for sensory
studies.
The nice companies of my friends are the memories which I carry the most. Many thanks
to all my dear friends for all their support extended.
I owe my very special thanks to Dr. Ayyappan Appukuttan, a wonderful friend, senior for
all the invaluable help, particularly at the stage of compiling the data and final
preparation of the thesis, without which, this effort of mine would have not paid off. The
thesis would not have been completed in the present form without his help, support and
reassuring advice. No words suffice my thankfulness to him.
I would like to acknowledge my beloved chechy, Dr. Dina for all moral support and
intellectual discussions. Dr. Praveen Reddy deserve special mention for boosting my
confidence and up-grudging support.
I deem it a great opportunity to express my heartfelt thanks to my friend Mrs. Theresa,
for her extended utmost co-operation, help and support during the initial stages of my
research. I have been blessed with a friend and a brother: Mr. Vijay, no words are
enough to express my immense gratitude to him, who was with me in all ups and downs in
all these years.
It is a privilege to extend my sincere obligation to Mrs. Poornima devi and Dr.
Mahadeswaraswamy for spending much of their valuable time and also for their timely
unfailing help received at various stages of research tenure. I express my heartfelt
gratitude to my friend Banu, Meera, Hema, Mani, Sowmya, and Vanitha for boosting my
morale and for extending enormous support at times of emotional upheavals.
I profoundly acknowledge here, the affectionate encouragement of my friend Mabel for
her support throughout my research work. I deeply cherish all the cooperation of my lab
mates Mr. Awasthi, Mr. David, Mr. Girish, Mr. Gobinath, Mr. Madhu, Mr. Prashanth,
Ms. Amrutha and Mrs. Jolly for whom words would never suffice to say just thanks. I am
obliged to all friends at FTBE Department, Mr. Murthy, Mr. Abhijith, Mr. Selva, Mr.
Chidanand, Mrs. Lisa, Mr. Raghu Raj, Mrs. Sowmya, Ms. Selvi, Mr. Vinayak and the
dissertation students for their nice association. Besides, I would like to thank Mr.
Somanna, Mrs. Mamatha and Mrs. Meenakshi for their support.

I am also very much indebted to Dr. (Mrs) Habibunnisa, former Scientist, Mrs. Revathy
Baskaran, Scientist, and other staff of Fruit and Vegetable Technology Department.
Very special thanks to all my dear friends and colleagues from other Departments of
CFTRI: Mr. Binod, and Mrs. Nithya for teaching me the molecular techniques, Mrs.
Neelamma, Mr. Prashanth, Dr. Jagadish, Ms. Ashwini, Mrs. Shilpa Naveen, Ms.
Vishalakshi, Ms. Naveena, Mrs. Uma, Mr. Gajendra, Ms. Anila, Ms. Hema, Ms. Kavitha,
Mr. Surya, and Mr. Raju for their great help and support throughout my research tenure.
My sincere thanks to the scientific staff of Central Instrumentation Facility, CFTRI,
especially, Mr. K. Anbalagan, Mr. Vatchravelu, Ms. Asha and Mr. Vishnukumar,
Information and Publicity for Photography, Mr. Jayaprakash, Food Engineering pilot
plant for spray drying and concentrating FOS syrup, Mr. Prasanna, Computer Section,
and FOSTIS-library for their help and support received throughout my stay in the
Institute. I am thankful to each and every person with whom I came into contact during
sojourn at CFTRI, who not only thought me science but also the sense of living.
I recall my association at M/S. N. Ranga Rao and Sons who fostered my research
interest. I owe my thanks to Mrs. Chandu Honnappa, Bangalore, for providing the star
fruits of special need for experimental purposes.
It gives me an immense pleasure to thank my special friends, Sowbhagya akka, Yashoda
akka, Teju, Suma, Rashmi and Nitin for their valuable support throughout my research
tenure. Memorable thanks to my college mates: Dr. Chethan, Dr. Hitesh, Mr. Arun, Mr.
Lokesh, Mr. Mahesh, Mr. Kamath, Mr. Karna, Dr. Kumar, Mrs. Poornima, Mr.
Prasanna, Mr. Siddegowda, Mr. Jaikumar and Mr. Krishnamurthy.
I deeply treasure the moral support and constant encouragement given by my mama, atte,
brother Mr. Mahadevaswamy, cousin Mr. Bhaskar and all my close family members who
stood with me throughout my career.
Finally, a penultimate thanks goes to my wonderful parents, for all they deserve far more
credit than I can never give them. I owe this thesis to my father, mother, sisters: Ms.
Dakshayini, Ms. Nandini, and Ms. Prabha and my brother Mr. Manjunath, who were the
driving force in my doctoral research. I am privileged to have them for being the light of
my life and for their love, care, wisdom, encouragement, support and for sharing my joy
and sorrows during my life. This work would not have seen the light of the day without
the constant support, encouragement and love of my parents, sisters and brother.
Above all, I believe that nothing is possible without God’s grace.Renuka B
Renuka. B
DST Scientist Fellow
Department of Fermentation Technology & Bioengineering
CFTRI, Mysore-570 020, India
DECLARATION
I, Ms. Renuka B, certify that this thesis is the result of research work done by me under
the supervision of Dr. (Mrs) S. G. Prapulla, at the Department of Fermentation
Technology and Bioengineering, Central Food Technological Research Institute, Mysore.
I am submitting this thesis for possible award of the degree of Doctor of Philosophy
(Ph.D.) in Biotechnology from the University of Mysore, Mysore.
I further certify that this thesis or any part of it has not been submitted for award of any
other degree/diploma of this or any other University.
Signature of Doctoral candidate
Date:
Signature of Guide
(S.G.Prapulla)
Date:
Counter signed by
Signature of Chairperson/Head of Department/
Institution with name and official seal

Dr. (Mrs.) S. G. Prapulla Fermentation Technology & Bioengineering
Senior Principal Scientist September, 2011
CERTIFICATE
This is to certify that the thesis entitled “Biotechnological approaches for the
preparation of FOS based prebiotic and probiotic foods” submitted by Ms. Renuka B
for the award of the degree of Doctor of Philosophy (Ph.D.) in Biotechnology to the
University of Mysore is the result of research work carried out by her under my
guidance in the Department of Fermentation Technology & Bioengineering, Central Food
Technological Research Institute, Mysore- 570 020, India during the period 2005-2011.
S. G. Prapulla
(Guide)

Dr. (Mrs.) S. G. Prapulla Fermentation Technology & Bioengineering
Senior Principal Scientist September, 2011
Attendance Certificate
This is to certify that the thesis entitled “Biotechnological approaches for the
preparation of FOS based prebiotic and probiotic foods” submitted by Ms. Renuka.
B, for the award of the degree of Doctor of Philosophy (Ph.D.) in Biotechnology to the
University of Mysore is the result of research work carried out by her under my
guidance in the Department of Fermentation Technology & Bioengineering, Central Food
Technological Research Institute, Mysore- 570 020, India. She has attended her duties
during the tenure from May 2005 till date.
S. G. Prapulla

INDEX

INDEX
Chapters Contents PageNos.
Acronyms and abbreviations i-ivList of tables and figures v-xiSynopsis xii-xxi
Chapter 1 Introduction 1-40
Chapter 2 Fructooligosaccharides: A novel osmotic agent forimpregnation of fruits and vegetables
41-61
Introduction 42-43Materials and Methods 44-50Results and Discussion 50-61
Chapter 3 Vacuum osmotic dehydration of Banana usingFructooligosaccharides: Optimization of process parametersusing statistically designed experiments
62-83
Introduction 63-65Materials and Methods 65-70Results and Discussion 70-83
Chapter 4.1 Fructooligosaccharide fortified fruit juice beverages 84-101
Introduction 85-86Materials and Methods 87-91Results and Discussion 91-101
Chapter 4.2 Preparation of FOS based traditional Indian acid coagulatedmilk based sweet, Gulab jamun
102-119
Introduction 103-105Materials and Methods 105-109Results and Discussion 110-119

Chapter 5 Isolation and characterization of potent probiotics fromfruits and vegetables
120-160
Introduction 121-123Materials and Methods 124-135Results and Discussion 135-160
Chapter 6.1 Synbiotic functional fruits with fructooligosaccharidesand selected probiotics
161-175
Introduction 162-163Materials and Methods 164-165Results and Discussion 165-175
Chapter 6.2 Shrikhand: A fermented milk based dessert enriched withfructooligosaccharides and probiotic Enterococcus faeciumCFR 3002
176-193
Introduction 177-179Materials and Methods 179-182Results and Discussion 183-193
Chapter 7 Summary and conclusion 194-199Future perspectives 199-200
Bibliography 201-240
Publications 241-261Papers published/communicated/presented in symposia 262-263

Acronyms and abbreviations i
ACRONYMS AND ABBREVIATIONS

Acronyms and abbreviations i
Acronyms and abbreviations
% percentage~ approximately< less than< less than or equal> greater than> greater than or equal°C degree CelsiusµL microlitreµM micromolarµm micrometerµmol micromolesµs microsecondsA° Armstrong
ANOVA Analysis of VarianceAOAC The Association of Official Analytical ChemistsAPEDA Agricultural and Processed Food Products Export Development AuthorityATCC American Type Culture Collectionaw water activitybar unit of pressureBATH bacterial adhesion to hydrocarbonsBki linear regression coefficientBkii quadratic regression coefficientBkij cross-product regression coefficientbp base pairCaCl2 calcium chlorideCAGR compound annual growth rateCCRD central composite rotatable designcDNA complementary DNACF culture filtrateCFTRI Central Food Technological Research Institutecfu or CFU colony forming unitscm centimeterCo. companydATP deoxyadenosine triphosphateDBT Department of BiotechnologyDFSDSS
dynamic frequency sweepdynamic strain sweep
DH5α commonly used E.coli strain in transformation experimentsDNA deoxyribo nucleic aciddNTP deoxyribonucleotide triphosphateDVS Direct Vat Sete.g. exempli gratia: Latin expression meaning “for the sake of example”EC Enzyme CommissionEco RI an endonuclease enzyme commonly used for restriction digestionEDTA ethylene diamine tetra acetic acid
et al. Latin expression for “and others”EU European Union

Acronyms and abbreviations ii
FAO Food and Agricultural OrganizationFDA Food and Drug AdministrationFDI Foreign Direct InvestmentFOS fructooligosaccharidesFOSHU Foods for Specific Health UsesFTase Fructosyl transferaseg gramG* complex modulusg/L gram/litreG’ storage modulusG” loss modulusGDP Gross Domestic ProductGI gastro-intestinalGOS galactooligosaccharidesGRAS Generally Regarded As Safeh hourH % per cent cell surface hydrophobicityH2O2 hydrogen peroxideH2SO4 sulfuric acidHACCP hazard analysis and critical control pointHCl hydrochloric acidHDM hydrodynamic mechanismHELP high electric field pulseHFCS high fructose corn syrupHP high pressureHPLC high performance liquid chromatographyHunter L, a, b Hunter values representing brightness, redness and yellowness respectivelyHz HertzICPSIMARC
International Committee on Systematics of ProkaryotesInternational Market Analysis Research and Consulting
IMFs intermediate moisture foodsIMO isomaltooligosaccharidesIMTECH Institute of Microbial Technologyin vitro Latin for “within the glass”in vivo Latin for "within the living"IPTG isopropyl-beta-thio galactopyranosidekb kilo base pairskcal kilo calorie
KCl potassium chloridekDa kilo Daltonkg kilogramKH2PO4 potassium dihydrogen phosphateL litreLAB lactic acid bacteriaLB Luria-Bertani Mediumlog logorithmLtd limitedM MolarmA milli Ampere

Acronyms and abbreviations iii
Mb mega base pairsMCA McConkey agarmg milli grammin minutesmL milli litremm milli metermM milli molarmm Hg unit of pressure
MRS de Man, Rogos and SharpeMTCC Microbial Type Culture Collection and Gene BankN normality or NewtonNA nutrient agarNa2HPO4 sodium biphosphate
NaCl sodium chlorideNaNO3 sodium nitrateNaOH sodium hydroxideNCBI National Center for Biotechnology InformationND Not detectedOD optical densityOD osmotic dehydrationONPG ortho- nitro phenol β-galactopyranosideOQ overall qualityOS osmotic solutionP probability value in statisticsPa PascalPCA plate count agarPCR polymerase chain reactionPDA potato dextrose agarPFGE pulsed field gel electrophoresispGEM-T a ready-to-use cloning vector
ppm parts per millionPRESS prediction error sum of squaresPst I a restriction endonuclease used for restriction digestionPVOD pulsed vacuum osmotic dehydrationQDA quantitative descriptive analysisRCT randomized, controlled human trialRID refractive index detectorrpm rotation per minutesrRNA ribosomal-ribo nucleic acid
RSM response surface methodologyRT retention times secondsSCFA short chain fatty acidsSD standard deviationSEM scanning electron microscopySG solute gainSGJ synthetic gastric juicespp. speciesTA titratable acidity

Acronyms and abbreviations iv
TAE buffer tris-acetate-EDTA bufferTaq polymerase a thermostable DNA polymerase from Thermus aquaticusTE buffer tris-EDTA buffertonne 1000 kgTPA texture profile analysisTSS total soluble solidsU enzyme unitsUSDA United States Department of Agriculture
UTM universal testing machineUV ultra violetv/v volume/volumeVI vacuum impregnationVOD vacuum osmotic dehydrationVOS vacuum osmotic solutionw/v weight/volumew/w weight/weightWHO World Health Organizationwk weekWL water lossWR weight reductionX-Gal 5-bromo-4-chloro-3-indolyl-b-D-galactopyranosideXOS xylooligosaccharides

v
LIST OF FIGURES AND TABLES

vi
LIST OF FIGURES
No Description Pagenumber
1.1 Schematic representation of VOD process 7
1.2 FAO guidelines for the evaluation and substantiation ofprebiotics
23
2.1
2.2
Process flow chart for the preparation of fruits and vegetablesenriched with FOS
FOS enriched fruits and vegetables
46
47
2.3 Moisture content of fresh and FOS enriched fruits andvegetables
51
2.4 Colour values [(a) L* value; (b) a* value and (c) b* value] offresh and FOS enriched fruits and vegetables
53
2.5 Texture of fresh and FOS enriched fruits and vegetables 55
2.6 β-Carotene content of fresh and FOS enriched fruits andvegetables
56
2.7 Scanning electron micrographs of fresh banana (a), jackfruit(b) and carrot (c) and FOS enriched banana (d), jackfruit (e)and carrot (f).
59
3.1 Response surface plots for FOS uptake in banana slices as afunction of temperature and vacuum pressure
73
3.2 Response surface plots for FOS uptake in banana slices as afunction of vacuum treatment time and vacuum pressure
73
3.3 Response surface plots for FOS uptake in banana slices as afunction of atmospheric restoration time and vacuum pressure
74
3.4 Response surface plots for FOS uptake in banana slices as afunction of vacuum treatment time and temperature
74
3.5 Response surface plots for FOS uptake in banana slices as afunction of atmospheric restoration time and temperature
75

vii
3.6 Response surface plots for FOS uptake in banana slices as afunction of atmospheric restoration time and vacuum treatmenttime
75
3.7 Response surface plots for shear strength of banana slices as afunction of temperature and vacuum pressure
77
3.8 Response surface plots for shear strength of banana slices as afunction of vacuum treatment time and vacuum pressure
77
3.9 Response surface plots for shear strength of banana slices as afunction of vacuum treatment time and temperature
78
3.10 Response surface plots for shear strength of banana slices as afunction of atmospheric restoration time and vacuum pressure
78
3.11 Response surface plots for shear strength of banana slices as afunction of atmospheric restoration time and vacuum treatmenttime
79
3.12 Response surface plots for shear strength of banana slices as afunction of atmospheric restoration time and temperature
79
4.1.1 Flow chart for the preparation of fruit juice beverages 88
4.1.2 Colour (L*a*b*) values of pineapple juice beverage stored atambient temperature (25±2 °C)
92
4.1.3 Colour (L*a*b*) values of mango juice beverage stored atambient temperature (25±2 °C)
93
4.1.4 Colour (L*a*b*) values of orange juice beverage stored atambient temperature (25±2 °C).
93
4.1.5 Comparison of colour (L*a*b*) values of fruit juice beveragesstored at ambient (25±2 °C) and refrigerated (4±2 °C)temperature.
94
4.1.6 Changes in the pH of fruit juice beverages during storage 96
4.1.7 Changes in the total soluble solids (TSS) of fruit juicebeverages during storage
97
4.1.8 Changes in the titratable acidity (TA) of fruit juice beveragesduring storage
98

viii
4.1.9 Changes in the FOS content (g/100g) of fruit juice beveragesas function of storage
99
4.2.1 Gulab jamun sweetened with (a) FOS, (b) blend of FOS andsucrose, and (c) sugar syrup
106
4.2.2 Colour (L*a*b* values) of freshly prepared gulab jamunsweetened with FOS, blend of FOS-sucrose and sucrose
111
4.2.3 Colour (L*a*b* values) of gulab jamun sweetened with FOS,blend of FOS-sucrose and sucrose, at the end of 2nd day ofstorage at ambient temperature (25±2 °C)
111
4.2.4 Colour (L*a*b* values) of gulab jamun sweetened with FOS,blend of FOS-sucrose and sucrose, at the end of 4th day ofstorage at ambient temperature (25±2 °C)
112
4.2.5 Scanning electron micrographs of gulab jamun sweetened withFOS, a blend (FOS+Sucrose) and sucrose
116
4.2.6 FOS content of gulab jamun sweetened with FOS and blend 117
4.2.7 Profilogram of gulab jamun sweetened with FOS, blend andsucrose
118
5.1 Survivability of the LAB isolates to pH 2.0 and 2.5 for 4 hincubation at 37 oC
138
5.2 Survivability of the LAB isolates to bile salt (0.3, 0.6 and1.0%) for 4 h incubation at 37 oC
141
5.3 Survivability of the LAB isolates to synthetic gastric juice 142
5.5 (a) Carbohydrate fermentation test of the probiotic LAB isolateCu8 (wells numbered from 1-35 correspond to carbohydratesmentioned in Table 5.5 in the same order and well number 36represents control)
148
5.5 (b) Carbohydrate fermentation test of the probiotic LAB isolateR32 (wells numbered from 1-35 correspond to carbohydratesmentioned in Table 5.5 in the same order and well number 36represents control)
149
5.6 Agarose gel (0.8%) showing the chromosomal DNA of theisolates, Cu8 and R32 shows distinct bands of thechromosomal DNA
151

ix
5.7 Agarose gel (1.5%) showing PCR amplification of 1.4 kb 16SrDNA gene fragment
152
5.8 Analysis of Plasmid DNA isolated from recombinant and nonrecombinant E. coli DH5 cells
153
5.9 16s rRNA sequence of the probiotic LAB isolates (Cu8 andR32) after DNA sequence analyzer
155
5.10 Multiple sequence alignment of rRNA gene of Cu8 with otherEnterococcus sps.
158
5.11 Multiple sequence alignment of rRNA gene of R32 with otherEnterococcus sps.
159
6.1.1 Moisture content of prebiotic and synbiotic star fruits 166
6.1.2 Colour values of fresh, prebiotic and synbiotic enriched starfruits
168
6.1.3 Texture of prebiotic and probiotic impregnated star fruits 169
6.1.4
6.1.5
Retention of FOS content in prebiotic (FOS) and synbioticfruits
SEM photographs of fresh (a) and synbiotic [FOS+L.salivarius CFR 2158 (b) and FOS+E. hirae CFR 3001 (c)] starfruits
170
171
6.2.1 Shrikhand with (a) FOS, (b) blend of FOS and sucrose, and (c)sucrose
180
6.2.2 Colour of shrikhand enriched with prebiotic FOS, blend andsucrose and probiotic E. faecium CFR 3002
184
6.2.3 Rheology [(a) storage and (b) loss modulus] of shrikhandenriched with prebiotic FOS, blend and sucrose along withprobiotic E. faecium CFR 3002
186
6.2.4 FOS content of shrikhand enriched with FOS and blend ofFOS and sucrose
187
6.2.5 Scanning electron micrograph (SEM) of shrikhand enrichedwith (a) FOS, (b) a blend of FOS-sucrose, and (c) Sucrose
189

x
LIST OF TABLES
No Description Pagenumber
1.1 Summary of candidate prebiotics still under investigation 18
1.2
1.3
Information on suppliers of probiotics and prebiotics
Examples of probiotic strains in products
26, 27
30
2.1 The fruits and vegetables used in the VOD process 45
2.2 Water activity, FOS content and microbial load of VOD fruitsand vegetables
57
2.3 Sensory attributes of fresh and FOS enriched fruits andvegetables
61
3.1 Different process variables in coded and un-coded terms chosenfor the Central Composite Rotatable Design (CCRD)
67
3.2 Central composite rotatable design (CCRD) with experimentalvalues of response variables
68
3.3 ANOVA indicating the variables as linear, quadratic andinteraction terms and coefficients for the prediction models
71
3.4 Experimental conditions and observed response values ofvalidation trials
82
4.1.1 Sensory attributes of fruit juice beverages with varying ratio ofFOS and sucrose
89
4.1.2 Composition of fruit juice beverages fortified with FOS in theratio of 75: 25
90
4.1.3 Viscosity of fruit juice beverages stored at ambient (25±2 °C) andrefrigerated (4±2 °C) temperature
95
4.1.4 Sensory scores of FOS fortified fruit juice beverages (FOS:Sucrose::75: 25) during storage at ambient (25±2 °C) andrefrigerated (4±2 °C) temperature for 6 months
101
4.2.1 Texture profile analysis of gulab jamun sweetened with FOS,blend ((FOS and sucrose) and sucrose
114

xi
5.1 Examples of probiotic microorganisms 122
5.2 Prevalence of lactic acid bacteria in fruits and vegetables 136
5.3 Antibacterial effect of the LAB isolates against food bornepathogens
145
5.4 Antibiotic susceptibility for LAB isolates 147
5.5 Carbohydrate fermentation and organic substrates utilizationprofile
150
5.6 PCR reaction parameters 152
5.7 Sequences producing significant alignments with that of Cu8isolate
156
5.8 Sequences producing significant alignments with that of R32isolate
157
6.1.1 Sensory attributes of prebiotic and synbiotic fruits 175
6.2.1 Total probiotics* of shrikhand enriched with prebiotic FOS,blend of FOS and sucrose and sucrose along with probiotic E.faecium CFR 3002 stored at refrigerated temperature (4±2 oC)
191
6.2.2 Sensory attributes of shrikhand enriched with prebiotic FOS,blend of FOS and sucrose and sucrose along with probiotic E.faecium CFR 3002 stored at refrigerated temperature (4±2 oC)
192
Abstract
The global food landscape is rapidly evolving, as consumer needs, shift with
changing lifestyles. With these changes, the market for processed or ready to eat products
has grown. Enhancement of these products with functional food ingredients such as
prebiotics and probiotics could meet the consumers’ demand for foods with benefits
beyond basic nutrition. In line with this trend, the focus of the research has been on the
use of beverages, traditional sweets and most ideally the fruits and vegetables as a source
for delivery of prebiotics and probiotics.
Fruits and vegetables were enriched with fructooligosaccharides (FOS), a low
calorie prebiotic using vacuum osmotic dehydration (VOD) process. The final product
contained 8.02-17.21 g/100 g FOS without affecting the sensory attributes. Processing
conditions were optimized using statically designed experiments and under the optimized
conditions, the uptake of FOS in banana was found to be 9.64 g/100g of fruit pieces. Fruit
juice could be considered as a novel, appropriate medium for fortification with
prebiotics/probiotics. Fruit juice beverages (pineapple, mango, and orange) were fortified
with FOS and the physicochemical characteristics of the fortified juices during storage
have been carried out. The FOS content of pineapple, mango and orange juices was 3.79,
3.45, and 3.62 g/100ml respectively.
Catering to the needs of the present day consumers’ desire to have low calorific
products, gulab jamun, a traditional Indian sweet with FOS was prepared. In addition
synbiotic shrikhand, milk based sweet with FOS and probiotic Enterococcus faecium
CFR 3002 was also prepared. Studies also lead to the successful enrichment of star fruits
with FOS and Enterococcus hirae CFR3001 and with a reference culture Lactobaccilus
salivarius CFR 2158, to have synbiotic functional star fruits. The synbiotic star fruits
contained 17.80-20.24 g/100g FOS and 138-178x106cfu/g probiotics. The probiotics (E.
hirae CFR3001 and E. faecium CFR 3002) used in the study were isolated from fruits and
vegetables and were identified at species level based on the phenotypic characteristics
and 16S rRNA gene sequences.
Sensorially acceptable, physicochemically characterized fruit juice beverages,
gulab jamun, shrikhand and fruits and vegetables enriched with FOS and/or probiotics
have been the outcome of the study paving way for commercialization.

Synopsisxii
SYNOPSIS

Synopsisxiii
Ph.D. Synopsis
Title: Biotechnological approaches for the preparation of FOS based prebiotic and
probiotic foods
Summary and highlights of the investigation:
The development of prebiotics and probiotics during the past decade has indicated
a significant shift in the food industry towards the development of ‘functional foods’ that
promote health beyond providing basic nutrition. Prebiotics are defined as non-digestible
food ingredients that beneficially affect the host by selectively stimulating the growth
and/or activity of one or a limited number of bacteria in the colon that can improve the
host health. The term ‘prebiotic’ is used to describe a variety of oligosaccharides and
other food ingredients that promote the growth of beneficial gut microbes. A number of
carbohydrates such as fructooligosaccharides (FOS), galactooligosaccharides (GOS) and
xylooligosaccharides (XOS) have emerged as new functional food ingredients. Among
which, FOS have attracted special attention as prebiotic, because of their beneficial health
effects in regulating mineral absorption, lipid metabolism and serum cholesterol. These
oligosaccharides improve proliferation of beneficial microorganisms in human gut by
preventing colonization of pathogenic microorganisms. They have great potential for
improving the physicochemical properties of foods and also functions as dietary fiber.
FOS are produced by transfructosylation of sucrose using Fructosyl Transferase (FTase -
EC 2.4.1.9). The FOS syrup obtained is generally a mixture of glucose (14%), sucrose
(30%), 1-kestose (35%), 1-Nystose (18%) and 1-Fructofuranosyl Nystose (3%).
The use of microorganisms for the preparation of fermented milk, cereal and
legume based foods has been a traditional practice since prehistoric times. Majority of the
traditional Indian fermented foods are due to the involvement of mixed cultures of yeast
and lactic acid producing bacteria. A number of Lactobacillus spp. and Bifidobacterium
spp. have been in use as desirable probiotic cultures, so as to act as beneficial food
supplements and contribute to a balanced intestinal microflora for human wellness.
Probiotics are live microorganisms which when administered in adequate amounts confer
a health benefit on the host. Probiotic bacteria generally belong to the genera

Synopsisxiv
Lactobacillus and Bifidobacterium. Some of the species belonging to the genera
Lactococcus, Enterococcus, Saccharomyces and Propionibacterium are also considered
as probiotics. Food products containing both prebiotics and probiotics are generally
termed synbiotics, are used in non dairy products such as cereal bars, fruit and berry
juices and confectionary.
The consumption of fruits and vegetables has been known to be an integral part of
the human diet. The important nutrition and economic values of both fresh fruits and
vegetables are well recognized. They are the ideal carriers of vitamins, essential minerals,
dietary fiber, and other bioactive substances. In addition to these components, they also
provide fair amounts of carbohydrates, proteins, and calories. Fruits and vegetables are
thus important for our daily nutrition. India ranks second in the world in production of
fruits and vegetables, accounting roughly 12% and 13%, respectively, of total global
production in which, a mere 2.2% of fruits and vegetables are processed. Currently, up to
23% of the most perishable fruits and vegetables are lost during their transport through
agri-food chain due to spoilage, physiological decay, water loss, mechanical damage
during harvesting, packaging and transporting. India has a strong and dynamic food
processing sector. Food processing adds value and enhances shelf life of perishable agro-
food products. There has been a positive growth in ready to serve beverages, fruit juices
and pulps, processed fruit/vegetable products (dried/preserved) and dehydrated fruits and
vegetables. The food processing sector is likely to be the driving force for Indian
economy. Thus, there exists a great need for processing of fresh fruits and vegetables into
suitable products with higher nutritional benefits, combined with improved storage
characteristics.
Commercialization has been limited by traditional processing technologies such
as canning, candying and other methods. Although the use of probiotics in food is largely
restricted to refrigerated dairy products, technology is developing and there are now
several ways in which probiotics can be added to a number of products. Scope exists for
the development of newer technologies for expanding the use of both probiotics and
prebiotics into new ranges of foods and beverages and this, in turn, could provide the
industry, an opportunity for growth and adding value for the manufacturer and retailer
and also better health for the consumer.

Synopsisxv
Among the processing technologies, vacuum osmotic dehydration (VOD) is used
in food processing sector, for enhancing the functionality through the addition of
prebiotics and probiotics to fresh/cut fruits and vegetables. VOD process not only enables
the storage of fruits and vegetables for a longer period, but also preserves flavour,
nutritional characteristics and prevents microbial spoilage.
The work presented in the thesis describes the enrichment of fruits and vegetables
with prebiotic FOS using VOD, optimization of VOD process parameters in banana,
fortification of fruit juice beverages and preparation of traditional gulab jamun with FOS,
isolation and characterization of probiotics from fruits and vegetables, incorporation of
these probiotics into star fruit and shrikhand, a milk based dessert, along with FOS. The
physicochemical and sensory attributes of prebiotic/probiotic products are also discussed.
Objectives:
I. Isolation and selection of potent probiotic cultures from fruits and vegetables
II. Characterization of selected cultures for probiotic properties
III. Incorporation of FOS and selected probiotics to fruits, vegetables and traditional
sweets
IV. Standardization of the vacuum osmotic treatment parameters
V. Product characterization and storage studies

Synopsisxvi
The contents of the thesis have been organized and presented in 7 chapters.
Chapter: 1
Introduction
Importance of prebiotics and probiotics, biotechnological approaches, food
processing, fruits and vegetables processing industry in India, post harvest losses and
preservation of fruits and vegetables, vacuum osmotic dehydration, fruits and vegetables
as matrices for the incorporation of prebiotics and probiotics are presented in this chapter.
Scope of the investigation is presented at the end of the chapter.
Chapter: 2
Fructooligosaccharides (FOS): A novel osmotic agent for impregnation of fruits and
vegetables
A detailed study on the vacuum osmotic dehydration (VOD) of fruits and
vegetables enriched with FOS is presented in this chapter. Fruits and vegetables (apple-
Malus domestica, banana- Musa acuminata, jack fruit- Artocarpus heterophyllus, papaya-
Carica papaya, sapota- Diospyros digyna, star fruit-Averrhoa carambola, ash gourd-
Benincasa hispida, pumpkin- Cucurbita pepo, and carrot- Daucus carota) pieces of
known dimensions were impregnated with 70 °Brix FOS syrup in the ratio of 1:5 (w/v)
for 60 min at room temperature (25±2 °C) under vacuum (650 mm Hg) followed by 30
min of restoration at atmospheric pressure. The impregnated samples were further dried
at 40 °C for 24 h to get 10-30% moisture content with increased shelf stability. The FOS
content was found to be 8.02-17.21 g/100g product. The moisture content of FOS
enriched fruits and vegetables pieces was in the range of 10-28%, and -carotene content
was 2116-3428 µg/100g. Scanning electron micrographs of impregnated fruits and
vegetables indicated uptake of FOS in the intercellular spaces. The study clearly
indicated that colour, texture and sensory attributes of the final products were not affected
by the incorporation of FOS and thus, prebiotic FOS can be used as a healthier alternative
for the sugar solution normally used for the preparation of osmotically dehydrated fruits
and vegetables.

Synopsisxvii
Chapter: 3
Vacuum osmotic dehydration of banana using FOS: Optimization of process
parameters using statistically designed experiments
An experiment to determine the optimum processing conditions that would result
in maximum uptake of FOS in banana during VOD was designed using statistical
software (Design Expert, version 8.0.3.1). The independent process variables for the
VOD were vacuum pressure (250-650 mm Hg), temperature (30-50 oC), vacuum
treatment time (15-55 min), and atmospheric restoration period (10-30 min). A Central
Composite Rotatable Design (CCRD) with these four factors each at five different levels,
including central and axial points was employed. Experiments were carried out using 70
oBrix FOS syrup and the fruit to syrup ratio of 1:5 (w/v) in a vacuum oven. With respect
to the responses viz., uptake of FOS and the texture (shear strength) of the product,
second order polynomial models were developed using multiple linear regression
analysis. Analysis of variance (ANOVA) was performed to check the adequacy and
accuracy of the fitted models. The response surfaces and contour plots showing the
interaction of process variables were constructed and optimized for the desirability
function for maximum FOS and minimum shear strength. A vacuum pressure of 550 mm
Hg, temperature of 45 oC, vacuum treatment time of 45 min and atmospheric restoration
period of 16.44 min were found to be the optimum operating conditions. With these
optimized condition, the uptake of FOS was found to be 9.64 g/100g with a shear
strength value of 13.42 N.
Chapter: 4; Section: 4.1
Fructooligosaccharides fortified fruit juice beverages
An attempt has been made to fortify selected fruit juice beverages (pineapple,
mango and orange juice) with FOS. It was found that sucrose which is usually used as a
sweetener in fruit juice beverages can be partially substituted with FOS without affecting
the quality. The fruit juice beverages were evaluated for changes in physicochemical and
sensory attributes during 6 months storage period at ambient (25±2 °C) and refrigeration
temperature (4±2 °C). The results indicated that pH, total soluble solids, titratable acidity,
colour and viscosity did not change significantly (P>0.05) during storage. The initial

Synopsisxviii
FOS contents of pineapple, mango and orange juices were 3.79, 3.45, and 3.62 g/100 ml
respectively. With respect to FOS content, the fruit juice beverages stored at refrigeration
temperature showed 2.00-2.39 g/100 ml FOS after six months of storage, while the FOS
content being 2.69-3.32, 1.65-2.08 and 0.38-0.58 g/100 ml at the end of second, fourth
and sixth month of storage at ambient temperature respectively. The sensory analysis
showed that the beverages were acceptable up to 4 and 6 months storage at ambient and
refrigeration temperature respectively. The present study has opened up a new avenue for
value addition to highly popular beverage segment.
Chapter: 4; Section 4.2
Fructooligosaccharides based traditional Indian acid coagulated milk based sweet:
gulab jamun
Gulab jamun, a popular milk based traditional Indian sweet, is prepared by deep-
frying of balls of dough in oil, followed by dipping in sugar syrup. Suitability of FOS and
FOS-sucrose blend over sucrose and its effects on colour, texture, sensory and
microbiological attributes of gulab jamun were investigated. FOS and FOS-sucrose blend
did not show any adverse effect on colour values and sensory scores of gulab jamun.
However, the increase in hardness, adhesiveness and gumminess observed were
correlated to an increase in compactness of microstructure of gulab jamun prepared with
FOS or FOS-sucrose blend as indicated by scanning electron microscopy. FOS contents
of gulab jamun sweetened with FOS and FOS-sucrose blend were 17.58 g/100g and 9.18
g/100g respectively. The amount of FOS slightly decreased during storage for 4 days at
ambient temperature (25±2 °C). The study indicated that FOS syrup could be an effective
healthier alternative to sucrose (either fully or partially) in the preparation of most
popular Indian sweetmeat without many changes in the physicochemical characteristics
and sensory attributes of the same. Panelists have rated the product as highly acceptable,
indicating the suitability and also the acceptance of FOS for the preparation of gulab
jamun. In addition, FOS sweetened gulab jamun will have an added advantage over that
of sucrose based gulab jamun from the point of low calorie and other well known health
benefits such as improved mineral absorption, non cariogenicity etc.

Synopsisxix
Chapter: 5
Isolation and characterization of potent probiotics from fruits and vegetables
Lactic acid bacteria (LAB) are industrially important organisms because of their
fermentative ability as well as health and nutritional benefits. Moreover, they are
generally regarded as safe (GRAS) for incorporation into food products. Searching for
desirable LAB isolates for the food industry, isolation of microorganisms from traditional
fermented products (cereals, vegetables, milk and meat) and characterization of
physiological properties are a constant effort of scientific communities around the world.
In view of this, the study was carried out to isolate, characterize, and identify LAB
isolates from fruits and vegetables. Selection criteria employed included the ability of
isolates to withstand environmental conditions such as low pH, high bile salt
concentration, and cell surface hydrophobicity, which are the fundamental characteristics
of LAB isolates used as probiotics. The selected LAB isolates were able to survive
(>80% and 70%) and at low pH (2.5) and relatively high bile (1.0%) concentration. These
isolates showed significant antimicrobial activity against food borne pathogens and
antibiogram towards a range of antibiotics. Out of 17 LAB isolates, 2 isolates (Cu8 and
R32) were found to be potent probiotics based on the certain probiotic properties and
were assigned to the genera Enterococcus on the basis of morphological, biochemical,
physiological characteristics and 16S rRNA gene sequence analysis. Identification of the
selected isolates was performed by partial sequencing of approximately 700 bp of 16S
rDNA gene and gene fragment obtained from representative of each groups were aligned
with all sequences present in the GenBank database. The two isolates were identified as
Enterococcus hirae and Enterococcus faecium and the strain numbers have been assigned
as CFR 3001 and CFR 3002 respectively by culture collection centre of CFTRI, Mysore,
Karnataka, India.
Chapter: 6; Section: 6.1
Synbiotic functional star fruits with fructooligosaccharides and selected probiotics
An attempt was made to prepare star fruit enriched with prebiotics and probiotics
to have a synbiotic product. Star fruits slices were impregnated with 70 °Brix FOS (1:5
w/v) and 1% probiotic cells (v/v) viz., Lactobacillus salivarius CFR 2158, a reference

Synopsisxx
culture and Enterococcus hirae CFR 3001, an isolate from cucumber. The moisture
content, water activity, colour, texture, FOS content, viability of probiotic cells over a
period of 6 months of storage at ambient temperature (25±2 °C) were carried out and
scanning electron microscopic observations before and after VOD were also conducted
on the initial day. Prebiotic (FOS) and synbiotic (L. salivarius CFR 2158, E. hirae CFR
3001) enriched star fruit slices showed 19.26, 20.24, and 17.80 g of FOS/100g product
(initial day) respectively. The FOS content was decreased to 16.66, 18.62 and 16.09
g/100g at the end of the storage period (6 months). The viable cell count of L. salivarius
CFR 2158 and E. hirae CFR 3001 was found to be 178x106 cfu/g and 138x106 cfu/g
respectively in synbiotic star fruits up to 4 months of storage at ambient temperature
(25±2 oC). There was slight decrease in the survivability (34x106 cfu/g and 26x106 cfu/g)
of probiotics (L. salivarius CFR 2158 and E. hirae CFR 3001 respectively) at the end of
the storage period (6 months). The final product exhibited good synbiotic properties
along with desirable textural and sensory attributes. The level of probiotic
microorganisms found in prepared products falls well within the recommended range of
106 cfu/g probiotics in food at the time of consumption. The results indicated that the E.
hirae CFR 3001, when compared with L. salivarius CFR 2158 did not show any
significant difference in the overall quality of the product and it can be successfully
incorporated into any fruits/vegetables without affecting quality attributes of the same.
The FOS along with desired levels of probiotics in the final product did not impart any
off flavour/taste and retained fresh appearance, soft texture as well as low water activity
with a resultant long shelf life. These synbiotic products are expected to have higher
market potential and with increasing mass market coupled with the health benefits will
ultimately drive their markets.
Chapter: 6.2
Shrikhand: A fermented milk based dessert enriched with fructooligosaccharides
and probiotic Enterococcus faecium CFR 3002
The manufacture of indigenous dairy products with low calorie prebiotic and
potent probiotic will provide a successful outlet for traditional milk products, and this
will provide an alternate variety to the health conscious consumers. An attempt has been

Synopsisxxi
made to explore the effect of replacement of sucrose with FOS at 100% and 50% levels
(50% FOS and 50% sucrose) on the physicochemical, microbiological and sensory
characteristics of shrikhand enriched with probiotic E. faecium CFR 3002. The shrikhand
enriched with FOS and blend of FOS and sucrose showed initial FOS content of 10.32
g/100g and 5.55 g/100g respectively; however it decreased to 6.16 g/100g and 1.76
g/100g during storage period of 60 days at 4±2oC. The shrikhand showed similar values
for moisture content and aw and indicated similar trends with slight decrease in viable
probiotic count. The results also indicated that the probiotics cultures remained viable
(>140x106 cfu/100g) during 60 days of storage which is satisfactory for the shrikhand to
be claimed as a probiotic product.
The results indicated that the FOS can be an effective and healthier replacement
to sucrose, either fully or partially for the preparation of many food items without any
changes in the physicochemical characteristics and sensory attributes of the same. These
prebiotic oligosaccharides have been attracting global interest due to its prebiotic
properties and exhibit its properties in the final product.
Chapter: 7
Summary and conclusion
Summary, conclusion and future perspectives are given in this chapter. The thesis
ends with a list of references arranged in alphabetical order.
Overall, the investigation focused on the evaluation of FOS as a novel osmotic
agent for impregnation of fruits and vegetables using VOD process, followed by the
optimization of process parameters using statistically designed experiments for banana.
Studies are also made on the preparation and characterization of FOS based fruit juice
beverages and gulab jamun, isolation and characterization of potent probiotic cultures
from fruits and vegetables and their use in the preparation of synbiotic star fruits and
shrikhand.

Chapter: 1
1Introduction
CHAPTER: 1
INTRODUCTION

Chapter: 1
2Introduction
1.1. Introduction
The primary role of a diet is not only to provide enough nutrients to fulfill
metabolic requirements of the body but also to modulate its various functions. In recent
years, a considerable growing consumer’s inclination towards healthful foods has been
noticed throughout the world including India. In this context, several studies to obtain
foods or beverages from fruits and vegetables have been carried out. Biotechnology is
driving much change, in areas as diverse as agrichemicals, plant breeding and food
processing. Recent years have witnessed dramatical changes and improvements in the
processing operations. Novel processing techniques are being developed. The
biotechnological production of food products has been used by human beings since pre-
history for the preparation of fermented beverages, breads etc. However, it was only in
the last decades of 20th century that the use of this technique was extended to the
manufacturing of ingredients, e.g. flavors and oligosaccharides. An increase in the
production of processed fruit and vegetable products (dried pulps, jam, and beverages),
potential perspectives of control and/or treatment and extraction processes of its
compounds, concomitant with the development of the processing industries, have been
noticed (Giovani et al., 2009). In view of this, the application of biotechnology in food
processing industries can make a significant difference. The ‘biotechnology’ concept
promotes the exploitation of valuable traits for the design of more technologically robust
and effective microbes with a special emphasis on probiotic lactic cultures with
potentially improved biotechnological applications, paving way for the development of
novel prebiotic, probiotic and synbiotic enriched fruits and vegetables and other products.
1.2. Status of food processing industry in India
The world population is estimated to reach nine billion by 2050. The Food and
Agriculture Organization (FAO) estimates that, global food production needs to be
increased by 70% by 2050 compared to an average 2005-07 levels to feed the rising
global population. Clearly, a large part of the consumption will happen in India and
China, which would require an additional 1.6 billion hectares of land to be brought into
cultivation compared to the current 1.4 billion hectares being cultivated presently. This

Chapter: 1
3Introduction
increase in cultivable land looks improbable (Hindu Business Line, 3 April 2011) and
thus, the demand for food would be increasing dramatically.
Currently, India is the second largest producer of food in the world and the food
processing industry is one of the largest industries in India. In terms of production,
consumption, export and expected growth, India is ranked fifth in the world. India’s food
industry is valued at US$ 180 billion of which, the food processing industry is estimated
at US$ 67 billion, according to Klynveld Peat Marwick Goerdeler (KPMG) report on
‘Food Processing and Agri Business’ (KPMG, 2007). The highest share of processed
food is in the dairy sector, where 37% of the total produce is processed, of this only 15%
is processed by the organized sector. Value addition of food products is expected to
increase from the current 8% to 35% by the end of 2025. Fruit and vegetable processing,
which is currently around 2% of total production in India, is very low as compared to the
western countries. Taking market forces such as rising income level and changing
consumer behavior due to rapid economic growth into consideration, the Agricultural and
Processed Food Products Export Development Authority (APEDA) under the Ministry of
commerce and industry, Government of India envisages a growth rate of 10% by 2015
and to 25% by 2025.
Food processing includes different methods used to transform raw ingredients into
food for human consumption. The food processing industry in the country is set to ensure
profitability in the coming decades. The sector is expected to attract phenomenal
investments of about Rs 1,400 billion in the next decade. A Foreign Direct Investment
(FDI) inflow to food processing industries has set a target of US$ 25.07 billion to be
achieved by 2015. The food processing sector attracted US$ 130 million of FDI in the
first eight months of the fiscal year as compared to total FDI of US$ 1.2 billion. A
dominant segment of the food industry, food processing is estimated to be worth US$ 70
billion with a 32% share. It comprises agriculture, horticulture, animal husbandry, and
plantation. Experts estimate the industry Grass Domestic Product (GDP) at 6-8% with
value addition of food products to increase from 8% to 35% by the end of 2025. To
realize India's potential in this industry, the Government has set an investment target of
US$ 25.07 billion by 2015 to double India's share in global food trade from 1.6% to 3%,

Chapter: 1
4Introduction
increase processing of perishable food from 6% to 20% and value addition from 20% to
35%.
1.3. Status of fruits and vegetable processing industry in India
India ranks second in the global production of fruits and vegetables, next to
China, and has the potential of being the biggest with the food and agricultural sector.
China, India, and Brazil account for almost 30% of the world’s fruit supply and most of
this production is destined for domestic consumption. Fruits and vegetables are important
to our health for many reasons; they are a source of fibre and are rich in vitamins,
minerals, an array of phytonutrients, all of which work together either to improve our
health or even prevent disease. Healthy diets, rich in fruits and vegetables may reduce the
risk of many chronic diseases (Paolo Boffetta, et al., 2010). Most fruits and vegetables
are naturally low in fat and calories and are filling.
Disaggregated data on exports of fruits and vegetables for the period 2009-2010
was Rs.5963.10 crore as against Rs.5110.61 crore for the period 2008-2009, showed
16.68% increase in export of fruits and vegetables (India 2011- A reference Manual,
2011). Over the last few years, there has been a positive growth in ready-to-serve
beverages, fruit juices, pulps, dehydrated and frozen fruits and vegetable products,
tomato products, pickles, convenience vegspice pastes, processed mushrooms and curried
vegetables etc. The domestic consumption of value added fruits and vegetable products is
low compared to the primary processed food in general and fresh fruits and vegetables in
particular, which is attributed to higher evidence of tax and duties including that on
packaging material, lower capacity utilization, non-adoption of cost effective technology,
high cost of finance, infrastructural constraints, inadequate farmers-processors linkage
leading to dependence upon intermediaries. The smallness of units and their inability for
market promotion are also reasons for inadequate expansion of the domestic market. In
order to give fresh impetus to processing of fruits and vegetables, the Government of
India in 2004-2005 had allowed 100% deduction of profit for first five years for new
upcoming fruits and vegetable processing units. During 2008-2009, the Ministry of Food
Processing Industries had released financial assistance of Rs. 15.84 crores to 93 fruits and

Chapter: 1
5Introduction
vegetables processing units in the form of 1/2 installments (India 2011- A reference
Manual, 2011).
1.4. Post-harvest losses and preservation of fruits and vegetables
At present, the country produces 12% and 13% of world production of fruits and
vegetables, respectively, whereas it shares only 1.38% in the global market, which is
much less compared to the present day demand. Several efforts are being made
worldwide to improve the yield/production, however post harvest loss can be a serious
threat. The major losses are attributed to physiological, mechanical damage and microbial
spoilage (Flores, 2000). The main reason for loss of fruits and vegetable is the improper
storage after plucking. Most post-harvest losses in developing countries occur during
transport, handling, storage, and processing. It is well established that processing
treatments for fruits and vegetables that are designed to preserve them in various forms
(fresh, frozen, pasteurized or dried), have an effect on organoleptic qualities such as
texture, colour or flavour. Many fruits and vegetables can be processed into canned
products that cater to local taste. The processed fruits and vegetables can be stored for a
long time and are easy to carry and convenient to serve and they are the most seasonal
crops with higher demand at present. Now, seasonality of fruits and vegetables are
becoming less obvious, which is closely related with the general application of
preservative technology. One of the technologies contributing to the preservation of the
original properties of fruit or vegetables is ‘vacuum technology’, which is also called
‘vacuum infusion’ or ‘vacuum impregnation or ‘vacuum osmotic dehydration’.
1.5. Vacuum osmotic dehydration (VOD)
Increased interest in osmotic treatment stems primarily from the need to make
improvements in the quality of food products. Osmotic dehydration (OD) is a widely
used water removal process, wherein, fruits or vegetables are added to a hypertonic
solution. Three kinds of osmotic treatments have been defined, depending on the pressure
applied on the system: osmotic dehydration at atmospheric pressure (OD), osmotic
dehydration at vacuum pressure or vacuum osmotic dehydration (VOD), and pulsed
vacuum osmotic dehydration (PVOD) (Fito et al., 1994). The combination of osmotic

Chapter: 1
6Introduction
dehydration by vacuum impregnation (VI) could be a good choice in the development of
new food products in a minimally processed way.
VOD promotes water release from a cellular material immersed in a concentrated
solution, while a simultaneous external solute uptake takes place. Mass transfer occurs
during this operation through different mechanisms to a different extent depending on
process variables (Andres et al., 2001). The action of the different mechanisms, balanced
by controlling those variables, makes it possible to achieve a specific dewatering solute
uptake ratio, in the final product. Mechanisms involved in mass transfer during osmotic
dehydration of cellular tissues depend on the structure of the tissue (Chiralt and Fito,
2003). The external broken cells can be easily impregnated by the external solution, and
in the intercellular spaces, bulk flow of solution, water and solute diffusion occurs. The
bulk flow is promoted due to capillary pressure in processes carried out at atmospheric
pressure. Nevertheless, when vacuum is applied to the system, capillary impregnation is
promoted and when the atmospheric pressure is restored, pores are extensively flooded
with the external solution and depending on the applied compression ratio. Mass
transport in the intercellular spaces is mainly responsible for solute gain (SG). At cellular
level, cell wall and membranes act as non-selective and selective barriers respectively to
mass transport and the transmembrane flux is responsible for most of the cell-to-cell
water transport during osmotic dehydration of tissues.
1.5.1. Mechanism of VOD
VOD leads to some advantages as compared with atmospheric dehydration. The
schematic representation of VOD is depicted in Fig 1.1. The influence of vacuum
treatment is very important on the kinetics of the mass transfer phenomena, especially
concerning water loss (WL) and weight reduction (WR) of food during osmotic
treatment. This effect of vacuum application cannot be explained only on the basis of
diffusional and osmotic transport mechanisms. Therefore, a hydrodynamic mechanism
(HDM) has been proposed and experimentally analyzed. Taking this new mechanism into
account, a more accurate approach for the modeling of the VOD operation may be done.
VOD of a porous product consists of exchanging the internal gas or liquid occluded in

Chapter: 1
7Introduction
open pores for an external liquid phase by the action of HDM promoted by pressure
changes (Fito, 1994; Fito and Pastor, 1994).
Vacuum Chamber
Fig 1.1 Schematic representation of VOD process
VOD is carried out in two steps after fruit/vegetable pieces immersed in a tank
containing the liquid phase. In the first step, vacuum pressure is imposed on the system
for a time sufficient for it to be de-aired, thus promoting the expansion and outflow of
internal gas in the fruit/vegetable. Gas release takes the product pore native liquid with it.
In the second step, atmospheric pressure is restored, while the product remains immersed
for some time, and thus the subsequent influx of external liquid into the porous structure
(Fito et al., 2001a).
Many applications of VOD have been reported (Fito et al., 2001b; Torreggiani
and Bertolo, 2001; Rastogi and Raghavarao, 1996; Shi et al., 1996; Torreggiani, 1995;
Fito et al., 1994; Shi and Fito, 1993). According to Fito (1994), the main advantage of
VOD over OD at atmospheric pressure lies in the increased mass transfer due to the
HDM and to the corresponding increment produced in the solid-liquid interfacial surface,
leading to a significant reduction in processing time. The most important HDM effect is
very rapid and occurs just when atmospheric pressure is restored.
Impregnation solution
Solute in
Liquid/gas out
Fruit/vegetable piece
Solute in
Liquid/gas out

Chapter: 1
8Introduction
VOD can be useful in introducing dissolved or dispersed substances directly into
the porous structure of the food matrix. The incorporation of functional ingredients using
vacuum during osmotic process is possible to enrich the fruits and vegetables. This
process is being investigated to incorporate physiological active compounds (minerals,
probiotics, vitamins and firming agents such as hydrocolloids) into the structure of fruits
and vegetables (Fito et al., 2001; Fito and Chiralt, 2000). Impregnated products can be
commercialized as minimally processed fresh functional foods or can be dried
osmotically or by air in order to obtain more stability (Fito et al., 2001).
1.5.2. VOD of fruits and vegetables
The VOD has long been used to prolong the post harvest conservation of many
products: lemons (Valero et al., 1998a; Valero et al., 1998b), Avocados (Wills and
Sirivatanapa, 1988), tomatoes (Wills and Tirmazi, 1979), strawberries (Ponnappa et al.,
1993). The compounds used in the impregnation solution to impregnate above fruits are
usually calcium salts (mostly calcium chloride) and many plant hormones (polyamines).
Mujica-Paz et al., (2003b) studied the impregnation properties of mango, apple, papaya,
and peach at vacuum pressure. It was observed that the vacuum pressure and its
application time had an important effect on the impregnation of isotonic solution in the
studied fruits.
The effect of vacuum on the OD was studied by few researchers (Giraldo et al.,
2006; Barat et al., 2001; Fito et al., 2001). Fito et al., (2001) studied the VI and OD in
matrix engineering for the enrichment of fruits and vegetables (egg plant fruit and
oranges) with minerals, vitamins or other physiologically active components to develop
functional foods. The application of vacuum has shown beneficial effects on the
structural changes of product and mass transfer kinetics leading to shorter processing
times. Giraldo et al., (2006) studied the osmotic dehydration process of mango fruit. The
process was carried out under vacuum and also at atmospheric pressure. The greatest SG
with the more heavily diluted solution was observed under vacuum. Mujica-Paz et al.,
(2003a) reported the effect of vacuum and syrup concentration on osmotic dehydration of
apple, mango and melon.

Chapter: 1
9Introduction
1.5.3. Osmotic solutions for fruits and vegetable processing
One of the key factors in any type of osmotic treatment is the selection of osmotic
solution (OS). Three types of solutions are usually used in osmotic operations: (1)
isotonic, a solution containing the same solute concentration both outside and inside the
cell membrane, (2) hypotonic, a solution containing less solute molecules outside of the
cell membrane than inside of it, and (3) hypertonic, a solution containing more solute
molecules outside of the cell membrane than inside.
The selection of vacuum osmotic solution (VOS) should also take into
consideration of the following factors: non-toxicity, good sensory characteristics, high
solubility, and low cost. In general, any soluble solute or solvent that is miscible can be
used as a VOS. These include starch syrup, glycerol, ethanol, polyols, lactose
maltodextrin, trehalose, L-lysine, casein, monosodium glutamate, and combination of
these solutes, such as glucose with sucrose, glycerol with sucrose, and sucrose with salt
etc (Ferrando and Spiess, 2001; Barbosa-Canovas and Vega-Mereado, 1996; Argaiz et
al., 1994; Biswal and Maguer, 1989; Garrote and Bertone, 1989; Giangiacomo et al.,
1987; Lerici et al., 1985; Hawkes and Flink, 1978; Hoover and Miller, 1975).
Osmotic process is also affected by the physicochemical properties of the solutes
employed, because differences in efficiency of dehydration arise mainly from differences
in molecular weight, ionic state, and solubility of solute in water. For instance, using
higher molecular weight sugars (i.e. lower dextrose equivalent corn syrup solids), it was
possible to zero net SG (Lazarides and Mavroudis, 1995) and allows only migration of
moisture. Other studies have confirmed that glucose resulted in higher amounts of WL
and SG than sucrose (Panagiotou et al., 2007; Garrote and Bertone, 1989; Lerici et al.,
1985; Bolin et al., 1983). Lenart and Flink, (1984) found that mixed sucrose/salt
solutions gave a greater decrease in product water activity than pure sucrose solutions,
although water transport rates were similar.
In most cases, low molecular weight carbohydrates are used for VOD process of
fruits and vegetables because low molecular weight solutes quickly penetrate the
samples: the smaller the molecular weight, the faster the diffusion (Stockes-Einstein
Law). A mixture of dextrose and sucrose was found to provide the highest diffusivity of
water as the dextrose concentration increased in the mixed solution. Thus, low molecular
Chapter: 1
10Introduction
weight solutes favour the impregnation process, whereas high molecular weight solute is
helpful for the dewatering effect (Kaymak-Ertekin and Sultanoglu, 2000). The diffusivity
of sucrose is smaller than that of glucose because the molecular weight of glucose is
about one-half of the molecular weight of sucrose (USDA, 2003; Garrote and Bertone,
1989). High fructose corn syrup (HFCS) solution had a diffusion coefficient 32% higher
than that of a sucrose solution due to the smaller molecular dimension of the
monosaccharide. Thus, fruits impregnation by HFCS had lower water activity than those
treated, at the same operation conditions, with a sucrose solution because of the faster
penetration rate of HFCS (Bolin et al., 1983). VOD in HFCS also resulted in a lower WL
and a higher SG than those in the maltodextrin syrup (Mastrocola et al., 1987).
Some of the OS may impart flavour of impregnated products. Corn syrups impart
their characteristic flavour to delicately flavored products. Sensory study indicated that
HFCS dehydrated fruit is sweeter than that treated with sucrose solution. While dextrose
is a more effective osmotic agent than sucrose because of its high dehydration rate
(Kaymak-Ertekin and Sultanoglu, 2000), sucrose solution was found to be slightly better
than a glucose solution with respect to discoloration and sugar gain in a strawberry
product (Yang and Maguer, 1992). Sucrose, corn syrup, and concentrated fruit juices
have been most commonly used in fruit VI (Fito et al., 2000).
Many studies have used blends of sucrose and salt in fruit and vegetable
processing to obtain a maximum WL with low SG (Sereno et al., 2001; Qi et al., 1999;
Biswal and Bozorgmehr, 1992; Giangiacomo et al., 1987; Lenart and Flink, 1984; Islam
and Flink, 1982). It was found that adding a small quantity of sodium chloride to sucrose
solution tremendously increased the dewatering rate in fruits (Sereno et al., 2001; Biswal
and Bozorgmehr, 1992). The interaction between sucrose and salt was also found to limit
the salt residue in the fruit samples. Because of its lower molecular weight, a small
incremental increase in the sodium chloride concentration leads to significant change in
osmotic pressure, whereas the same incremental increase in the sucrose concentration
(higher molecular weight) does not. This means that diffusion coefficients are more
sensitive to changes in sodium chloride concentration than in sucrose concentration (Ade-
Omowaye et al., 2002). A high level of sugar can reduce the taste threshold for salt.
Conversely, salt can enhance the sweetness of sucrose (Sacchetti et al., 2001). In general,

Chapter: 1
11Introduction
low salt concentrations should be used in fruit processing to avoid a significant decrease
in organoleptic quality.
The usage of vacuum to develop nutritionally enriched products is relatively new
in comparison with its other applications. Fito et al. (2001a) first evaluated the feasibility
of using VI for mineral fortification of fruits and vegetables from an engineering point of
view. Mathematical models were developed to determine the concentration of different
minerals in VOS required to achieve a 20-25% dietary reference intake fortification in
200g of samples. Following the modeling prediction, experimental validation confirmed
that VI could be an effective method for the enrichment of fruits and vegetables with
minerals, vitamins or other physiologically active components. Betoret et al., (2003)
studied probiotic-enriched dried fruits, either with commercial apple juice containing
Saccharomyces cerevisiae, or with whole milk or apple juice containing 107 or 108 cfu/ml
of Lactobacillus casei (spp. rhamnosus) using VI technique. It was reported that dried
apple samples could contain about 106 cfu/g Lactobacillus casei (spp. rhamnosus), a
similar level to that in commercial dairy products.
Betalleluz-Pallardel et al., (2010) reported that apple fruit can be fortified with
FOS BeneoTM P95-ORAFTI (oligofructose > 93.2% with some traces of glucose,
fructose and sucrose < 6.8%) by incorporating into the cellular structure of the apple fruit
by means of VI. Aniko-Matusek et al., (2008) studied the comparison of diffusion of
FOS during vacuum impregnation and osmotic dehydration of apple cubes. The results
indicated that the advantage of the VI rests in a higher SG of the raw material if the
structure is porous, but does not speed up the diffusion, and the effective diffusion
coefficient does not increase after vacuum treatment. There were no significant
differences among the FOS components during OD and VI operation.
1.5.4. Factors affecting VOD
The chemical potential of the hypertonic solution is the driving force of the
diffusion. The rate of the mass transport depends on many factors such as type of pre-
treatments (i.e. conventional blanching, microwave, vacuum, high electric field pulse
(HELP) and high pressure (HP) treatment), the conditions of the osmotic treatment (time,
temperature, use of agitation, vacuum, ultrasound), the concentration and the quality of

Chapter: 1
12Introduction
the osmotic agent, use of combined solutions with salt (Sereno et al., 2001), the solution-
to-food ratio and the tissue structure of the food (Fito et al., 2001; Rastogi et al., 2000;
Rastogi and Raghavarao, 1994; Torreggiani, 1993).
Three important phenomena are coupled in VOD process. They are gas out flow,
deformation-relaxation of the solid matrix and liquid influx. The VOD process and the
quality of finished products are determined by processing condition, including
pretreatment of the samples, temperature, pressure and immersion time under vacuum,
time to restore atmospheric pressure, composition and concentration of the osmotic
solution, geometry of the food pieces, agitation, and solution to sample ratio. Their
effects on mass transfer rate and composition of final product have been studied in
several fruits, including apple (Sereno et al., 2001; Kaymak-Ertekin and Sultanoglu,
2000; Barat et al., 1998), mango, kiwi (Leunda et al., 2000), and banana (Sousa et al.,
1998). Lenart and Lewicki (1990) and Rastogi and Raghavarao (1996) found that the rate
of mass transfer increased to a certain extent with an increase in concentration and
temperature of the osmotic solution, above which undesirable changes in flavor, texture
and color occurred.
Yang and Maguer (1992) reported that the stabilization or decrease in mass
transfer occurred when the solution concentration reached 50-60%. Barat et al., (2001)
observed different results in apple slices subjected to VI treatment with 25-65% sucrose
at 30, 40 or 50 oC, where concentration of osmotic solution did not show a significant
effect on the effective diffusivity. It was explained that diffusion appeared to be hindered
by unspecified active transport. Moreira and Sereno (2003), further investigated the
effects of temperature, concentration, and flow rate of solution on osmotic
dehydration/impregnation rate during immersion of apple cylinders in sugar solutions at <
25 oC, and suggested that the sample SG is controlled by diffusion inside the material
while WL is governed by mixed internal external flow. The influence of vacuum time
and solution concentration on mass transfer and mechanical properties of
osmodehydrated melon cubes has been studied (Cristhiane et al., 2011). Pulsed vacuum
osmotic dehydration (PVOD) was carried out at 30 °C for 4 h, using sucrose solutions
(40, 50 or 60 °Brix) and applying a vacuum pulse (100 mbar for 5, 10 or 15 min).

Chapter: 1
13Introduction
Samples subjected to PVOD using 60 °Brix sucrose solution presented greater water loss,
lower sugar uptake and better maintenance of fresh fruit texture throughout the process.
The effects of temperature on mass transfer kinetics can be well predicted by the
Arrhenius equation. High temperature also speeds up the osmotic process, but may cause
negative effects on color, texture, and flavor of samples. Optimal temperature depends on
the type of the raw materials used, the type of finished product, and the speed of
processing. The ratio of OS to product is an important parameter. The optimum value is
usually determined by two factors: stability of the solution during processing, and the
economics of transport and recycling of the solution. The high ratio increases cost and
necessitates solution recycling. The effect of agitating the solution on VI processing has
been investigated (Mavroudis et al., 1998; Garrote et al., 1992; Bongirwar and
Sreenivasan, 1977). It is clear that agitation affects WL and SG in impregnation
processing (Peanagiotou et al., 1998). In some cases, the advantages of agitation do not
justify the cost.
Mujica-Paz et al., (2002) evaluated the effect of vacuum pressure (135-674 mbar)
and its application time (3-45 min) on the volume of isotonic solution impregnated in
slices of mango, apple, papaya, banana, peach, and melon, and reported that vacuum
pressure and time had a significant effect on the volume in all fruit slices. Mujica-Paz et
al., (2003) further investigated the combined effects of vacuum level (135-674 mbar) and
concentration of osmotic solution (41-60 oBrix) on dehydration parameters of apple,
mango, and melon. They found that the lowest final water activity level was achieved
with a vacuum pressure of 674 mbar and 50 oBrix syrup in apple and 593 mbar and 57
oBrix in melon. Mujica-Paz et al., (2002) upon evaluating the effect of vacuum time (3-
45 min) on the volume of isotonic solution impregnated into slices of mango, apple,
papaya, banana, peach, and melon. It was showed that impregnation depends
significantly on the vacuum treatment time.
1.5.5. Limitations of VOD and osmotic solution
The major constraint for the industrial adoption of osmotic dehydration is the cost
of osmotic solution that necessitates a proper means of its recycling. During osmotic
dehydration, some of the characteristics of the solutions gets changed at the end of

Chapter: 1
14Introduction
process due to simultaneous leaching of color, acids, flavour and fragments from the
product and the solutes in the solutions penetrating into the product, the extent of which
depends upon the type of the food. To make the process feasible, the solutions are usually
reconcentrated before reuse by heating or filtrating (Valdez-Fragoso and Mujica-Paz,
2002). However, the reconstruction process may change the properties of the solutions.
For example, heating may darken the color of the solutions, as well as generating off
flavor volatiles. Care should be taken to minimize these, so that product quality is not
affected by recycling the osmotic solution (Aachary and Prapulla, 2009; Peiro-Mena et
al., 2007).
The OS has to be concentrated in order to be recycled and this can be achieved by
evaporation and/or by the addition of solute. To study the relation between water
transport and membrane type, membranes of various densities, thickness and
configurations were used (Warczok et al., 2007). It appears that due to high solute
concentration, microbial problems could be less severe in osmotic dehydration. Special
attention is required for equipment design especially to handle fragile food material while
having provision for automated operation control and online measurement facilities.
VOD process has been considered to improve product quality, modify product
formulation, and save energy in some of the fruit and vegetable processing. By selecting
appropriate process conditions, the specific application of VOD can be controlled and
optimized. However, extensive studies are still required in order to fully taking advantage
of its unique features and applying in large-scale industrial operations. One major issue in
the large-scale industrial application of VI and any other osmotic processing is the
management of the used osmotic solution at the end of the process. Potential applications
of concentrated solutions include reusing as table syrups, fruit fillings, beverage bases, or
syrups in canning process. From the engineering standpoint, it is possible to reuse the
solution at least 20 cycles of the same recycled solutions (Valdez-Fragoso et al., 2002;
Rosa and Giroux, 2001). Valdez-Fragoso et al., (2002) found that WL, SG, and color of
dehydrated apple cubes obtained in osmotic dehydration process with reused osmotic
solution were similar to those obtained with fresh osmotic solution.
Lack of knowledge relevant to the microbial safety of VI solutions and processed
product is another critical aspect need to be investigated and also hinders the application

Chapter: 1
15Introduction
of VI technique. If raw materials are contaminated, it may contaminate VI solutions
during VI processing. Further contamination would occur if contaminated solutions are to
be reused.
1.6. Functional foods: Prebiotics and Probiotics
Increased consumer’s interest in the health benefits of foods have led to the
significant development of functional foods and nutraceuticals. Distinct changes in the
understanding the role of foods in human health promotion have assumed greater
importance within the last decade. The first frontier of scientific investigations has moved
from the primary role of food as the source of energy and body-forming substances to the
more subtle action of biologically active food components on human health. In the
industrialized world, there has been an explosion of consumer interest in the active role
of foods in the well-being and life prolongation as well as in the prevention of initiation,
promotion and development of cancer, cardiovascular diseases and osteoporosis. As a
result, the market for functional foods, or foods that promote health beyond providing
basic nutrition, is flourishing (Pisulewski and Kostogrys, 2003; Diplock et al., 1999;
Berner and O’Donnell, 1998; Dimer and Gibson, 1998; Sanders, 1998).
In Japan, regarded as the birthplace of functional food, these foods are known as
“Foods for Specified Health Use” (FOSHU) and the market for these foods is significant.
In total, more than 1700 functional food products have been launched in Japan between
1988 and 1998 with an estimated turnover of around 14 billion US$ in 1999 (Menrad,
2003). The market was estimated to be 5 billion US$ in 2003 (Side, 2006) and 5.73
billion US$ in 2006, while more than 500 products were labelled as FOSHU in 2005
(Fern, 2007).
The rise of functional foods has occurred at the convergence of several critical
factors, such as: awareness of personal health deterioration, led by busy lifestyles with
poor choices of convenience foods and insufficient exercise; increased incidence of self-
medication; increased level of information from health authorities and media on nutrition
and the link between diet and health; scientific developments in nutrition research; and a
crowded and competitive food market, characterized by pressurized margins (Siro et al.,
2008). These factors have created a dynamic functional food and beverage market,

Chapter: 1
16Introduction
offering good prospects for growth for well-positioned food and drink manufacturers. In
the year 2000, the world-wide market of functional foods generated US$ 33 billion, in
2005 this total was US$ 73.5 billion (Justfood, 2006), and the market is estimated to
reach US$ 167 billion after 2010, with a yearly growth potential of 10% (Research and
Markets, 2008). The functional foods comprise: (i) conventional foods containing
naturally occurring bioactive substances (e.g. dietary fiber), (ii) foods enriched with
bioactive substances (e.g. probiotics, antioxidants), and (iii) synthesized food ingredients
introduced to traditional foods (e.g. prebiotics).
Among the functional food components, prebiotics and probiotics constitute a
focus of contemporary science of human nutrition. Epidemiological studies and
randomized clinical trials carried out in different countries have demonstrated or at least
suggested numerous health effects related to prebiotics and probiotics consumption, such
as reduction of cancer risk, improvement of heart health, stimulation of immune system,
decrease of menopause symptoms, improvement of gastrointestinal health, maintenance
of urinary tract health, anti-inflammatory effects, reduction of blood pressure,
maintenance of vision, antibacterial and antiviral activities, reduction of osteoporosis and
antiobese effects (Grajek, 2005). Thus, production and marketing of prebiotics and
probiotics is assuming greater challenges. In this context, biotechnology plays a key role
in the functional food industry.
1.6.1. Prebiotics
A prebiotic was originally defined in 1995 as a “non-digestible food ingredient
that beneficially affects the host by selectively stimulating the growth and/or activity of
one or a limited number of bacteria in the colon, and thus improves host health” (Gibson
and Roberfroid, 1995). A more recent definition states that “A prebiotic is a selectively
fermented ingredient that allows specific changes; both in the composition and/or activity
in the gastrointestinal microbiota that confers benefits upon host wellbeing and health”
(Gibson et al., 2004). In other words, prebiotics are defined as non-digestible or low-
digestible food ingredients that benefit the host organism by selectively stimulating the
growth or activity of one or a limited number of probiotic bacteria in the colon (Manning
and Gibson, 2004; Dimer and Gibson, 1998; Crittenden and Playne, 1996). These non-

Chapter: 1
17Introduction
digestible carbohydrates occur naturally in foods such as wheat, oats, bananas, asparagus,
leeks, onion, garlic, chicory, and artichokes (Van Loo et al., 1995). However, they are
only present in small amounts. The most common prebiotic in the diet is the fibre found
in fruits and vegetables. Although it is preferable to obtain prebiotics from natural
sources, this may not always be practical.
Prebiotics can be incorporated into the diet through foods such as cereals and
dairy products, which are supplemented with them. Some of the widely used prebiotics in
use include inulin, fructooligosaccharides (FOS), galactooligosaccharides (GOS),
xylooligosaccharides (XOS), isomaltooligosaccharides (IMO) and lactulose. These
substrates are fermented by particular members of the gut microbiota (Lim, 2005).
Prebiotics provide food for the growth of lactobacillus and bifidobacteria. The majority
of studies have so far focused on inulin, FOS and GOS (Macfarlane et al., 2008). These
saccharides have now a long history of safe use. The prebiotic potential of several other
candidates has been investigated, although their classification as prebiotics is premature
since the evidence at this stage is too limited. A list of these compounds is given in Table
1.1. Researchers distinguish between long chain, short chain, and full spectrum
prebiotics. Inulin is a long chain prebiotic fiber. The long chain prebiotics contain 9-64
links per saccharide molecule and are digested more slowly, providing food for bacteria
in the colon. Oligofructose is a short chain prebiotic, containing 2-8 links per saccharide
molecule and are fermented considerably faster. A full spectrum prebiotic supplement
would be something like oligofructose enriched inulin, which contains all possible
saccharide links.

Chapter: 1
18Introduction
Table 1.1 Summary of candidate prebiotics still under investigation
Carbohydrate References
Germinated barley Kanauchi et al., 1998a, 1998b, 2003
Oligodextrans Olano-Martin et al., 2000
Gluconic acid Tsukahara et al., 2002
Gentio-oligosaccharides Rycroft et al., 2001
Pectic oligosaccharides Olano-Martin et al., 2002
Mannan oligosaccharides White et al., 2002
Lactose Szilagyi, 2002
Glutamine and hemicellulose-rich substrates Bamba et al., 2002
Resistant starch and its derivatives Lehmann et al., 2002; Silvi et al., 1999;
Wang et al., 2002
Oligosaccharides from melibiose Van Laere et al., 1999
N-Acetylchito-oligosaccharides Chen et al., 2002
Sugar alcohols Piva et al., 1996
Source: Food Science and Technology Bulletin: Functional Foods, 2005
Recently, the World Health Organization issued a report, which advises a
reduction in the overall consumption of sugars and other rapidly absorbable
carbohydrates, along with an increase of daily physical activity. This recommendation
was made with the expectation that this may help reduce the dramatic increase in the
incidence of obesity, type 2 diabetes and related health care costs. Recently, there has
been a lot of attention paid to oligosaccharides and in particular FOS present in diet. FOS
has emerged as one of the important prebiotic in the functional food market. Lot of
research work has been carried out on production of FOS using microbial Fructosyl
Transferase (FTase) (Sangeetha et al., 2003). Due to its innumerable beneficial properties
to human health, FOS will continue to lead the functional food market. Since FOS is not
hydrolyzed by the human digestive enzymes, it undergoes fermentation in the colon and
encourages the growth of beneficial bacteria in the colon. This in turn discourages the

Chapter: 1
19Introduction
growth of potentially putrefactive microorganisms in the colon resulting in a healthy gut
environment. FOS has been demonstrated as an effective prebiotic through both in vivo
and in vitro assessments. Durieux et al., (2001) have investigated the prebiotic effect of
FOS by studying the metabolism of two types of chicory FOS (Fibruline Instant and
Fibrulose F 97) by Bifidobacterium longum, B. infantis and B. angulatum.
Although FOS is present in trace amounts in natural foods, its use in different
fruit and vegetable based products is an efficient way to enrich human diet. Proper choice
of food vehicle and processing methods ensures its stability and bioactivity. In view of
the great demand for FOS as food ingredients, scope exists for the incorporation into
fruits, vegetables, beverages, confectioneries, and dairy products and this will be a
continuous programme for identifying newer and novel sources. Examples of the use of
FOS in food products include the following:
1. Light jam products: FOS can be used as the sole sweetening agent and gives 34%
calorie reduction compared with sucrose standard. Organoleptic characteristics of
the products are claimed to be very similar with the test sample, having a lower
sweetness and a softer texture.
2. Ice cream: FOS can be used with inulin to replace all the sugar and reduce the fat
content and give excellent mouth feel characteristics.
3. Confectionery: Hard candies, gums, and marshmallows can be made while
achieving significantly reduced energy values (Murphy, 2001).
4. Fruit juice beverages: FOS can be used to fortify selected fruit juice beverages to
replace sucrose either fully or partially without affecting the sensory and other
properties (Renuka et al., 2009)
5. Gulab jamun: An Indian traditional sweetmeat ‘gulab jamun’ can be enriched
with prebiotic FOS (Renuka et al., 2010).
1.6.1.1. Criteria for classification of a food ingredient as a prebiotic
It is necessary to establish clear criteria for classifying a food ingredient as a
prebiotic. Indeed such classification requires a scientific demonstration that the ingredient
(1) resists gastric acidity, (2) is not hydrolyzed by mammalian enzymes, (3) is not
absorbed in the upper gastro-intestinal (GI) tract, (4) is fermented by intestinal

Chapter: 1
20Introduction
microflora, and (5) selective stimulation of growth and/or activity of intestinal bacteria
potentially associated with health and well-being. These requirements have been
classified as the three prebiotic criteria (Gibson and Roberfroid, 1995).
1. Resistance to digestive processes in the upper part of the GI tract.
2. Fermentation by intestinal microbiota.
3. Selective stimulation of growth and/or activity of a limited number of the health-
promoting bacteria in that microbiota.
1.6.1.2. Ease of use of prebiotics
Unlike probiotics, prebiotics are non-viable and reach the colon intact and these
properties make prebiotics more attractive. Their food manufacturing applications in the
form of thickening agents or sweeteners make them more amenable to industrial
processes. Prebiotics have a longer shelf-life and can be incorporated into a large variety
of food, such as infant formulae, weaning food, cereals, confectionery, beverages, dairy
products, dietary supplements etc.
1.6.1.3. Limitations of prebiotics
Possible side effects may be encountered when using prebiotics in excess and it
results in an increased volume of fermentation end products. An increase in stool
frequency and stool weight is often reported in human feeding trials (Chen et al., 2001).
Consumption of a large dose (>20 g/day) of prebiotics such as inulin or lactulose may
lead to a laxative effect (Bouhnik et al., 1999). It is critical that newly developed products
are selective towards non-gas producer bacteria, as gas distension may discourage the
intake of prebiotics.
1.6.1.4. Dose effects of prebiotics
Optimum doses of prebiotics have been determined for common prebiotics such
as fructooligosaccharides and transgalactooligosaccharides in various populations. Doses
of fructooligosaccharides administered in feeding and clinical trials range from 3-20
g/day in adults and 0.4-3.0g/day in infants (Moore et al., 2003, Moro et al., 2002,
Bouhnik et al., 1999). These doses were fixed based on the amount of oligosaccharides

Chapter: 1
21Introduction
present in diet rich in vegetables (van Loo et al., 1995). A minimal intake of 4-10 g/day
for induction of a bifidogenic effect is often suggested for prebiotics, but there is no
recommended intake available.
1.6.1.5. Purity and safety of prebiotics
Due to limitations in the manufacturing process, current prebiotic preparations are
generally mixtures of oligosaccharides of various chain lengths. The presence of mono-
and disaccharides may hinder the specificity of the prebiotic. Chemical extraction of
oligosaccharides from food may also result in undesirable color or flavor. To overcome
these drawbacks, new enzymatic processes providing higher oligosaccharide selectivity
and more palatable properties are developed (Rastall and Gibson, 2002). The risk of
bacteremia associated with prebiotics is almost negligible.
1.6.1.6. GRAS status and persistent effect of prebiotics
The recognition of GRAS status of existing prebiotics and/or their history of safe
use is sufficient to guarantee their safety for public authorities, the users and the
consumers (Pascal, 2008). The persistence of prebiotic effects when their intake is
stopped has not been well established. In many feeding studies, colonic microbial
changes are observed after treatment with prebiotics, but the effect generally ceased with
the interruption of treatment (Tuohy et al., 2002, Gionchetti et al., 2000). Long-term daily
intake of prebiotics seems to be necessary to achieve optimum efficiency.
1.6.1.7. Potential food applications of prebiotics
Due to the difficulties of characterizing the colonic microflora at the species level,
virtually all of the data on prebiotic properties of oligosaccharides are on microflora
changes at the genus level. It may, however, be desirable to develop prebiotics which are
targeted at particular species of Bifidobacterium and Lactobacillus. As prebiotics exploit
the use as non-viable dietary components to improve gut health, the range of foods into
which they can be added is much wider than that for probiotics, where culture viability
needs to be maintained. Potential applications for prebiotics as food ingredients to
improve the gastrointestinal health of the consumer are beverages and fermented milks,

Chapter: 1
22Introduction
health drinks, bakery products, table spreads, sauces, infant formulae and weaning foods,
cereals, biscuits, confectionery, cakes, desserts, snack bars, soups, salad dressings and
dairy products.
It has long been thought that the gut flora of the breast-fed infant is dominated by
bifidobacteria and that this is not the case for formula-fed infants (Benno et al., 1984).
This is seen to be one reason for the improved resistance of the breast-fed infants to
infections. If prebiotics could be developed with particular selectivity towards those
bifidobacteria that are present in the guts of breast-fed infants, a new range of synbiotic
formula foods could be envisaged. Above the age of about 55-60 years, faecal
bifidobacterial counts have been shown to markedly decrease compared to those of
younger people (Kleessen et al., 1997; Mitsuoka, 1990). This decrease in bifidobacteria is
a cause for concern as the natural elderly gut flora may have become compromised
through reduced bifidobacterial numbers, resulting in a diminished ability to resist
colonization with invading pathogens. Prebiotics may be potentially utilized as a dietary
intervention in the attempt to restore the microflora balance of the gut in the elderly
population concurrently with indirectly providing antipathogenic protection.

Chapter: 1
23Introduction
1.6.1.8. Guidelines for the evaluation and substantiation of prebiotics
The following guidelines (Fig 1.2) have been given by FAO for the evaluation
and substantiation of prebiotics (FAO, 2007).
Fig 1.2 FAO guidelines for the evaluation and substantiation of prebiotics
Source: Modified based on FAO, 2007
A prebiotic is a non-viable food component that confers a health benefit
on the host associated with the modulation of microbiota
Component characterization: Source, origin, purity, chemical composition
and structure
Functional characterization: In vitro/animal testing
Product formulation: Vehicle, concentration andamount
Safety assessment: In vitro and/or animal and/or Phase 1 human study if not
GRAS or equivalent
Double blind, randomized,
controlled human study (RCT)
Preferably second independent RCT
study to confirm results
PREBIOTIC

Chapter: 1
24Introduction
1.6.1.9. Future prebiotic research areas
It is recognized that there are numerous potential new applications being
considered for prebiotic use e.g. prevention and/or management of type 2 diabetes
mellitus; drug bioavailability; effects on autoimmune diseases and allergy; modulation of
pathogenic biofilms. There is a need for more randomized, placebo controlled clinical
trials with adequate statistical power. It is recognized that prebiotics may be used in
conjunction with probiotics; this is considered a synbiotic. Depending on the nature of the
two components, the net effect may not be synergistic.
Research is being carried out to establish how effective prebiotic ingredients
substances are in different food applications. There has been a rapid increase in the
number of companies marketing such ingredients on the basis that a good balance of gut
flora protects the digestive system and bowel against various cancers and other illnesses.
As prebiotics are closely associated with products containing some form of fibre, product
usage tends to be wide bread and baked products, breakfast cereals (such as Kelloggs
Rice Krispies Multi-Grain), baby foods, dairy products and even soft drinks and pet food.
However, these products are less well established than probiotics and tend to be confined
to niche sectors of more established markets.
1.6.1.10. Prebiotic market
As with probiotics, the global market for prebiotics is showing a healthy growth
in demand and there appears to be good scientific evidence to underpin health claims,
which should further sustain growth in the future. RTS Resource Ltd calculates that the
strict market for added prebiotic ingredients in functional foods, as defined, in the EU,
USA and Asia, totals some 25,000 tonnes, which is forecast to rise in volume by more
than 6% per year (RTS Resource Ltd., 2008). Growth could occur at an even higher rate
than our predictions if the industry develops more new products and markets them
successfully, given legislative restrictions.
The market for prebiotics is growing rapidly from a small base. Prebiotics are
mainly associated with breakfast cereals, baked goods, cereal bars and baby foods, as
well as some dairy products. The probiotics market has become better established, based
primarily on the launch of special yogurt and fermented milk drinks. Synbiotics are a

Chapter: 1
25Introduction
mixture of prebiotics and probiotics. The theory being that synbiotics load the colon with
good bacteria whilst ensuring there is a plentiful supply of the right food on which to
thrive. This also seems to be a rapidly growing market (Table 1.2).
Both prebiotics and probiotics represent different but potentially exciting parts of
the market for healthy food and drink. All the signs are that consumers will continue to
favour products with specific health benefits and this factor should ensure that these
sectors continue to enjoy above average growth. However, as can be seen in the history
of the development of probiotic dairy drinks, the consumer must feel both comfortable
and somewhat knowledgeable about the products and their benefits before markets can
develop. Perhaps the most significant barrier to future growth, therefore, is legislation.
New EU legislation is likely to curb the use of specific health claims that lack the
scientific evidence to back them up.

Chapter: 1
26Introduction
Table 1.2 Information on suppliers of probiotics and prebiotics
Company Description URL
BioGaia L. reuteri culture comes in three different, producer-friendly forms: freeze-
dried powder, freeze- dried DVS (Direct Vat Set) granules, and frozen pellets
www.biogaia.com
Bio K + Producer and seller of probiotic mix including L. acidophilus and L. casei www.biokplus.com
Chr. Hansen The “nu-trish” brand probiotic culture range consists of Probio-Tec, Yo-Fast,
and other nu-trish culture blends with a well-defined viscosity profile that
ferment quickly
www.chr-hansen.com
Cerbios-Pharma Producer of Enterococcus LAB SF 68 www.cerbios.ch
Danisco The company supplies probiotic cultures for foods and supplements, as well
as natural food protectants
www.danisco.com
Danone Producer of several brands of fermented dairy products containing probiotics www.danone.com
DSM The Lafti line of probiotics is formulated for stability, survivability, and
concentration, and includes L. acidophilus (Lafti L10), L. casei (Lafti L26),
and Bifidobacterium (Lafti B94)
www.dsm.com
GTC Nutrition NutraFlora short-chain fructo-oligosaccharides (scFOS) are a cane sugar or
beet sugar–derived natural prebiotic fiber
www.gtcnutrition.com
Lallemand The company delivers probiotics and bio-supplements to the nutraceuticals,
functional-foods, and pharmaceuticals industries
www.lallemand.com

Chapter: 1
27Introduction
Continuation of Table 1.2 Information on suppliers of probiotics and prebiotics
Company Description URL
National Starch The Hi-Maize brand corn-based resistant starch has multiple benefits,
including acting as a prebiotic for digestive health
www.hi-maize.com
Orafti BeneoSynergy1 is the unique, patented oligofructose-enriched inulin
prebiotic used in the landmark SynCan project on synbiotics and colon cancer
www.orafti.com
Proctor & Gamble “Align” is a probiotic supplement contain B. infantis 35624 www.aligngi.com
Sanofi-Aventis Producer of Bacillus clausii strains O/C, NR, SIN, and T, marketed in
Europe, Asia, and South America as Enterogermina
www.sanofi-
aventis.com
Sensus Frutafit inulin and Frutalose fructooligosaccharides are soluble dietary fibers
with bifidogenic/prebiotic properties, suitable for a variety of food systems to
enrich fiber, reduce calories, and replace sugars and fats
www.sensus.us
Solvay Producer of lactulose (Duphalac) for treatment of constipation and hepatic
encephalopathy
www.solvay.com
Valio The Lactobacillus rhamnosus GG probiotic is the most researched in the
world and was recently licensed to Dannon for the U.S. yogurt market. The
Gefilus family containing LGG is marketed worldwide
www.valio.fi
VSL
Pharmaceuticals
VSL#3 is a mixture of eight strains with 450 billion live bacteria per packet w ww.vsl3.com
Winclove The company sells mixtures of probiotic strains for different indications www.winclove.com

Chapter:1
28Introduction
1.6.2. Probiotics
The definition of the term probiotic has evolved through the years. Probiotics are
live microorganisms administered in amounts that positively affect the health of the host
(Sanders, 2003; FAO/WHO, 2002). The first recorded probiotic was fermented milk for
human consumption. After that, probiotics became popular with animal nutrition. The
role of fermented milk in human diet was known even in vedic times. The natural
microbiota of human intestine consists of more than 400 different strains of bacteria,
numbering about 100 billion. Majority (>95%) of this microbial population inhabits the
healthy colon.
Probiotic microorganisms majorly belong to the genera, Lactococcus,
Lactobacillus, Bifidobacterium, Saccharomyces, Bacillus, Enterococcus, Pediococcus,
Leuconostoc (Prado et al., 2008; Shah, 2007; Isolauri et al., 2004). Probiotics of the
Lactobacillus genus accounted for the largest share, representing 61.9% of total sales in
2007. Lactic acid bacteria (LAB) constitute a diverse group of organisms providing
considerable benefits to humankind. LAB occur either as natural inhabitants of the
intestinal tract or as fermentative LAB used in food industry, imparting flavor, texture
and possessing preservative properties. Beyond these, some species are administered to
humans as live microbial supplements, which positively influence our health mainly by
improving the composition of intestinal microbiota. Lactobacillus acidophilus, L. casei,
L. lactis, L. helviticus, L. salivarius, L. plantarum, L. bulgaricus, L. rhamnosus, L.
johnsonii, L. reuteri, L. fermentum, L. delbrueckii, Streptococcus thermophilus,
Enterococcus faecium, E. faecalis, Bifidobacterium bifidum, B. breve, B. longum and
Saccharomyces boulardii are the commonly used probiotics (Gibson et al., 1999).
Microorganisms must fulfill a number of criteria related to safety, functional
effects and technological properties to achieve a probiotic status (FAO/WHO, 2001).
From the safety point of view, the probiotic microorganisms should not be pathogenic,
have no connection with diarrhoeagenic bacteria and no ability to transfer antibiotic
resistance genes, as well as be able to maintain genetic stability. To be recognized as
functional food components, they should demonstrate the following properties: acid and
bile stability, resistance to digestive enzymes, adhesion to intestinal surface, antagonistic
activity against human pathogens, anti-carcinogenic and anti-mutagenic activity,

Chapter:1
29Introduction
cholesterol-lowering effects, stimulation of the immune system without inflammatory
effects, enhancement of bowel motility, maintenance of mucosal integrity, improvement
of bioavailability of food compounds and production of vitamins and enzymes
(Ouwehand et al., 1999). Probiotics must have good technological properties so that it
can be manufactured and incorporated into food products without loosing viability and
functionality or creating unpleasant flavors or textures.
1.6.2.1. Probiotic products
The global market for probiotic ingredients, supplements, and foods was worth
$14.9 billion in 2007 and reached US$16 billion in 2008. Estimates target a total of
US$19.6 billion on sales in 2013 at a compound annual growth rate (CAGR) of 4.3%.
Probiotics are available in a variety of food products and supplements. A probiotic may
be made out of a single bacterial strain (Gilliland and Speck, 1977) or it may be a
consortium as well. Probiotics can be in powder form, liquid form, gel, paste, granules or
available in the form of capsules, sachets, etc. Food products containing probiotics are in
general, almost exclusively dairy products; milk and yogurt - due to the historical
association of LAB with fermented milk. A total of 78% of current probiotic sales in the
world today are delivered through yogurt. A spectrum of probiotics is reported in
probiotic products available in market (Table 1.3).

Chapter:1
30Introduction
Table 1.3 Examples of probiotic strains in products
Strain (alternative designations) Product Name Manufacturer
Bifidobacterium animalis DN 173 010 Activia Danone/Dannon
Bifidobacterium breve Yakult Bifiene Yakult
Bifidobacterium infantis 35624 Align Procter & Gamble
Bifidobacterium lactis HN019 (DR10) Howaru Bifido Danisco
Enterococcus LAB SF 68 Bioflorin Cerbios-Pharma
Escherichia coli Nissle 1917 Mutaflor Ardeypharm
Lactobacillus casei DN-114 001 Actimel, DanActive Danone/Dannon
Lactobacillus casei F19 Cultura Arla Foods
Lactobacillus casei Shirota Yakult Yakult
Lactobacillus johnsonii La1 (Lj1) LC1 Nestlé
Lactobacillus plantarum 299V GoodBelly, ProViva NextFoods Probi
Lactobacillus reuteri ATTC 55730 Reuteri BioGaia Biologics
Lactobacillus rhamnosus ATCC 53013 (LGG) Vifit and others Valio
Lactobacillus rhamnosus LB21 Verum Norrmejerier
Lactobacillus acidophilus CL1285 & Lactobacillus casei Lbc80r Bio K+ Bio K+ International
Tested as mixture: Lactobacillus rhamnosus GR-1 & Lactobacillus reuteri RC-14 FemDophilus Chr. Hansen

Chapter:1
31Introduction
Fruit juices, desserts, and cereal-based products may be other suitable media for
delivering probiotics (Cargill, 2009). Indeed, technological advances have made possible
to alter some structural characteristics of fruit and vegetables matrices by modifying food
components in a controlled way such as pH modification, fortification of culture media,
among others (Betoret et al., 2003). This could make them ideal substrates for probiotics,
since they already contain beneficial nutrients, such as minerals, vitamins, dietary fibres,
and antioxidants, while lacking the dairy allergens that might prevent consumption by
certain segments of the population (Sheehan et al., 2007).
1.6.2.2. Status of probiotics in India
In India, probiotics are often used as animal feed supplements for cattle, poultry
and piggery. This requirement is also met by importing probiotics from other countries. It
is rarely used for human beings - Sporolac, Saccharomyces boulardii and yogurt (L.
bulgaricus + L. thermophilus) are the most common ones. Sporolac is manufactured
using Sporolactobacilli. Lactobacilli solution is an example of a probiotic, usually given
to pediatric patients in India. The latest and recent addition to the list of probiotics in
India is ViBact (which is made up of genetically modified Bacillus mesentricus), which
acts as an alternate to B-complex capsules. In India, only sporulating lactobacilli are
produced and they are promoted with some of the antibiotic preparations. Probiotics
should not be considered a panacea for health, but can be incorporated into a balanced
and varied diet to maximize good health. In general, the country is bound to become a
fertile seedbed for all types of probiotic products in the foreseeable future.
1.6.2.3. Indian Council of Medical Research (ICMR) guidelines for probiotics
International guidelines (Reid, 2001; Sanders and Huisint Veld, 1999) on
probiotics in food broadly specify the kind of tests that may be required to determine the
safety and to assess the health claim of a probiotic product in food. The regulatory
mechanism for probiotics differs from country to country and also even within a country
(Patel et al., 2008). Therefore, a holistic approach is needed for formulating guidelines
and regulations for evaluating the safety and efficacy of probiotics in India which should
be in consonance with current international standards. Indian Council of Medical
Chapter:1
32Introduction
Research (ICMR) along with the Department of Biotechnology (DBT) has formulated
guidelines for evaluation of probiotics in food in India.
Keeping in view the above, a task force was constituted by ICMR, comprising of
experts from varied fields to develop guidelines for evaluation of probiotics in food in
India. The task force took into consideration the guidelines available in different parts of
the world (EFFCA, 2008; Food and Drug Administration, 2006; FAO/WHO, 2002) and
deliberated on the various aspects to be covered (FAO/WHO, 2001). The guidelines will
help the regulatory authority for evaluating probiotic products in India. The parameters
include identification of stain, in vitro screening for probiotic characteristics, animal
studies to establish safety and in vivo animal and human studies to establish efficacy. It
also includes requirements for labeling of the probiotic products. The following
guidelines set forth by ICMR are meant to be followed for a strain or food to be termed as
‘probiotic’ for marketing in India.
1.6.2.3.1. Genus, species and strain identification
Effects of probiotics are strain specific. Strain identity is important to link a strain
to a specific health effect as well as to enable accurate surveillance and epidemiological
studies. Both phenotypic and genotypic tests should be done using validated standard
methodology. Nomenclature of the bacteria must conform to the current, scientifically
recognized names as per the International Committee on Systematics of Prokaryotes
(ICPS). The current molecular techniques used for identification include PCR based
techniques; 16S rRNA sequencing and DNA finger printing techniques like ribotyping
and Pulsed Field Gel Electrophoresis (PFGE). It is recommended that probiotic strains in
use in India should be deposited in internationally recognized culture
collection/repositories.
1.6.2.3.2. In vitro tests to screen potential probiotic strains
The following in vitro tests with standard methodology are recommended for
screening putative probiotic strains: Resistance to gastric acidity, bile acid resistance,
antimicrobial activity against potentially pathogenic bacteria, ability to reduce pathogen
adhesion to surfaces and bile salt hydrolase activity. These tests are based on the hostile

Chapter:1
33Introduction
gut environment which they mimic under in vitro conditions. The cultures evaluated as
probiotics based on these tests should be subjected to preclinical validation in appropriate
animal models before clinical trials are conducted in human subjects.
1.6.2.3.3. In vivo safety and efficacy studies in animal models
Assessment of the acute, subacute and chronic toxicity of ingestion of extremely
large amounts of probiotics should be carried out for all potential strains. Such
assessment may not be necessary for strains with established documented use. To
substantiate in vitro effects, appropriate, validated animal models must be used first, prior
to human trials.
1.6.2.3.4. Evaluation of safety and efficacy of probiotics for human use
In recognition of the importance of assuring safety, even among group of bacteria
that are Generally Recognized as Safe (GRAS), probiotics strains needs to be
characterized at a minimum with the following tests: (1) Determination of antibiotic
resistance patterns, (2) assessment of undesirable side-effects, (3) if the strain under
evaluation belongs to a species that is a known mammalian toxin producer or of
hemolytic potential, it must be tested for toxin production and hemolytic activity
respectively, and (4) assessment of lack of infectivity by a probiotics strain in immune
compromised individuals would be an added measure.
The principal outcome of efficacy studies on probiotics should be proven with
similar benefits in human trials, such as statistically and clinically significant
improvement in condition, symptoms, signs, well-being or quality of life, reduced risk of
disease or longer time to next occurrence or faster recovery from illness. Each of the
parameter should have proven correlation with the probiotics tested. Probiotics delivered
in food may not be tested in Phase 3 studies (effectiveness), unless the product makes a
specific health claim wherein it becomes imperative to generate the required evidence
necessitating carrying out Phase 3 studies. If a probiotic food has a record of documented
long and safe use outside the country, the data regarding this could be reviewed and
deemed as sufficient to allow its marketing within the country.

Chapter:1
34Introduction
1.6.2.3.5. Effective dosage of probiotic strains, labeling requirements and
manufacturing and handling procedures
The minimal effective dose or the level of viable cells of the probiotic strain in
terms of cfu/ml/day in the carrier food that demonstrates general health promoting
functions or well being or specific health claims in target population should be clearly
indicated. In addition to the general labeling requirements under the food laws, the
following information should also be mentioned on the label (Saldanha, 2008): (1)
Genus, species and strain designation following the standard international nomenclature,
(2) the minimum viable numbers of each probiotic strain should be specified at the level
at which efficacy is claimed and at the end of shelf-life, (3) evidence-based health
claim(s) should be clearly stated, (4) the suggested serving size to deliver the minimum
effective quantity of the probiotic related to the health claim, and (5) proper storage
conditions to be mentioned. Adequate quality assurance programmes should be in place.
Good manufacturing practices should be followed in the manufacture of probiotic foods.
The codex general principles of food hygiene and guidelines for application of Hazard
Analysis and Critical Control Point (HACCP) should be followed.
A very promising area in the development of enhanced functional food
ingredients is the development of synbiotics. These are defined as a combination of a
probiotic and a prebiotic (Gibson and Roberfroid, 1995) and there has been a lot of recent
interest in the concept. There seems little doubt that synbiotics will result in elevated
levels of bifidobacteria due to the prebiotic component. A comparative in vitro study
(Bielecka et al., 2002) of several strains of Bifidobacterium and FOS and inulin
concluded that strains of B. longum, B. catenulatum and B. animalis grew best on FOS
with much lower growth rates seen on inulin. The selected synbiotics were then fed to
rats and faces analyzed for bifidobacteria, coliforms and total cell counts. Rats that were
fed FOS and the synbiotics displayed higher levels of bifidobacteria and lower coliform
levels. The synbiotic preparation was, however, no more effective than the prebiotic. The
ability of FOS to promote survival of the particular species of Bifidobacterium was not
evaluated; however, FOS has been reported to increase bile resistance in bifidobacteria
(Perrin et al., 2000). L. reuteri has been investigated as a component in a synbiotic with
soygerm powder (de Boever et al., 2001). Soygerm powder contains a few prebiotic

Chapter:1
35Introduction
oligosaccharides studied by others (Rycroft et al., 2001), but it is also a source of
isoflavones, which are believed to be protective against some forms of estrogen-related
cancer, osteoporosis and cardiovascular conditions. Soygerm powder (4 g/l) increased
resistance of L. reuteri to bile salts. In addition, the lactobacilli cleaved the isoflavone
glycosides to liberate the aglycone isoflavone, increasing its bioavailability (Izumi et al.,
2000).
One of the principal benefits of synbiotics is believed to be increased persistence
of the probiotics in the GI tract. A synbiotic preparation of L. acidophilus and FOS has
been studied in an in vitro model of the human gut (Gmeiner et al., 2000). The model
used was the simulated human intestinal microbial ecosystem popularly known as
SHIME reactor and the synbiotics resulted in higher levels of lactobacilli (an increase of
0.89 log) in the vessel corresponding to the ascending colon. An increase in
bifidobacteria was seen in the vessels corresponding to the ascending (1.27 log),
transverse (0.9 log) and descending (0.47 log) colon, presumably due to the prebiotic
component of the synbiotics. Increases were also seen in levels of propionate and
butyrate and in β-galactosidase. Persistence of a particular ingested strain of probiotic, B.
lactis Bb-12, as a synbiotic preparation with GOS has been investigated using randomly
amplified polymorphic DNA genotyping (Alander et al., 2001). A total of 30 healthy
volunteers consumed prebiotics, probiotics or synbiotics in a yoghurt medium for two
weeks. Volunteers consuming each supplement showed increase in LAB and all of the
volunteers taking the probiotic (or synbiotic) had showed the presence of B. lactis in the
faecal flora. No increase in survival of the B. lactis due to GOS was seen; however, as
pointed out by Alander et al., B. lactis had very good survival properties to begin with.
The development of synbiotics might be more important for strains of probiotic with
poorer survival properties. The technological properties of bacteria play a very significant
role in the production of probiotics (Saarela et al., 2000).
The ability of a synbiotic preparation with Bifidobacterium with GOS to protect
against Salmonella infection in mice has been investigated (Asahara et al., 2001). Mice
were treated with streptomycin to compromise the gut flora by selective removal to
undetectable levels of bifidobacteria, lactobacilli and enterobacteria. Feeding with B.
breve at 108 cfu/mouse/day or the synbiotic preparation, which additionally contained

Chapter:1
36Introduction
galactooligosaccharides at a concentration of 2-50 mg/mouse/day, resulted in re-
colonisation of the gastrointestinal tract with B. breve. Mice fed the probiotic and
synbiotic displayed reduced faecal excretion of Salmonella enterica serovar
Typhimurium after pathogen challenge. In addition the synbiotic blocked extra-intestinal
translocation of the pathogen, whereas galactooligosaccharides alone did not.
Research on probiotics, prebiotics and synbiotics is promising. However, further
research is needed to substantiate preventive and therapeutic health benefits, mechanism
of action, optimal intake, duration of treatment, selection of specific probiotic strains for
a targeted outcome and mode of delivery. In the meantime, health professionals can tailor
nutrition guidance by matching products with a specific strain for a client specific
condition or by offering guidance about these products as components for healthy diets in
general.
The consumption of foods containing prebiotics and probiotics shows a
progressive increase in the last decade due to changes in habits and trends of consumers
attracted by the benefits from the consumption of this new functional food. Nowadays the
development of fruits and vegetables with prebiotics and probiotics is a topic of high
interest for the health conscious consumers. However, the available information is very
limited.
1.6.3. Fruits and vegetables as matrices for prebiotic and probiotic fortification
Plant tissues are multiphase systems with an intricate internal microstructure
formed by cells, intercellular spaces, capillaries and pores. Edible portions of most fruit
and vegetables are composed of fleshy parenchyma cells, which form the bulk of the
softer parts of plants. Nutrients of importance to man are frequently stored in these thin-
walled living cells. Despite the differences in composition and structure of the cell walls
of various plant tissues, the limiting pore diameters appear to be similar (Carpita et al.,
1979). Also, an intact plant cell wall constitute an extremely effective physical barrier
against attack by microorganisms since its pores are far too small to permit bacteria (size
range ~0.1 to 5 μm), yeasts (size range ~5 to 30 μm), mould spores (size range ~3 to 9
μm) and even viruses (size range ~0.02 to 0.3 μm) to penetrate through the protoplast
(Alzamora et al., 2000). Penetration of microorganisms through the cell walls, therefore,

Chapter:1
37Introduction
would require physicochemical or enzymatic degradation and/or alteration of wall
structures. In porous fruits and vegetables not the wall pores but the intercellular spaces
may play a major role regarding the penetration of microorganisms. These intercellular
spaces are commonly referred to as ‘pores’. Intercellular air spaces are common in
parenchymatous tissue and have been estimated to be 20-25% of the total volume in
apple, 15% in peach, 37-45% in mushroom, and 1% in potato. For instance, mature cells
of apple parenchyma tissues may be 50-500 μm in diameter with interconnecting air
spaces ranging from 210-350 μm across (Lapsley, 1992).
Rodriguez (1998) conducted basic impregnation studies with different
microorganisms (Saccharomyces cerevisiae, L. acidophilus and Phoma glomerata) to
evaluate their penetration by VI into a porous fruit tissue (Granny Smith apple). When
compared microbial counts of fresh apple and apple treated under atmospheric
conditions, it could be observed that the simple soaking renders a significant increase in
microbial counts. This highlights the fact that capillary force and superficial adherence
are very important factors that cannot be neglected in any modeling approach of
immersion and impregnation operations. The model proposed by Roa et al., (2001) was
used for predicting microorganism incorporation into vegetable tissues. These authors
simplified the model previously developed by Fito (1994) by accomplishing direct
experimental determination of the volumetric fraction of sample occupied by the
impregnating solution as a result of HDM.
The fortification of apple cylinders with Bifidobacterium spp. ‘‘Bb12’’ (Christian
Hansen Corp.) by applying VI was investigated by Maguina et al., (2002). Viability
evaluation of Bifidobacterium spp. in apple pieces stored in anaerobiosis at 4°C for 12
days revealed that viable populations decreased only by a log cycle after the sixth day,
and remained in that level until the end of storage. Probiotic-enriched dried apple by VI
was developed by Betoret et al., (2003). Apple cylinders were impregnated either with
commercial apple juice containing S. cerevisiae or with whole milk or apple juice
containing 107-108 cfu/ml of L. casei (spp. rhamnosus). At the end of the storage, L. casei
concentration in dried product was greater than 106 cfu/g, being very similar to the levels
usually found in commercial probiotic dairy products.

Chapter:1
38Introduction
Incorporation of carbohydrates into fruits and vegetables are rather simpler and
has been widely employed in the production of dehydrated fruits and vegetables by VI or
OD techniques. The use of prebiotic oligosaccharides as an osmotic solution for the
dehydration process is scarce. Froseth and Creedon (2003) patented a process for
preparing dried infused food pieces comprising: a food body including, at least in part a
fruit component; fruit infused inulin content ranging from about 1% to about 35%
wherein the inulin has a DP ranging from about 2-9; a moisture content ranging from
about 5% to about 25%; and, aw ranging from about 0.25 to 0.75. The infusing step
includes the sub-step of holding the mixture of inulin containing syrup and food pieces
for sufficient time to allow osmotic equilibrium to form the inulin infused food product
and a spent inulin syrup.
Ramesh et al., (2004) prepared prebiotic enriched fruits and vegetables by OD
using FOS syrup produced by the action of FTase enzyme on table sugar solution. The
novelty of the process is that it uses FOS syrup for the enrichment of fruit and vegetables.
The final product contains about 12-14 g of FOS/100 g product. The authors claimed that
FOS enriched fruits and vegetables can be used as topping for ice-cream, biscuits,
chocolates, breads, sweetened puffs and buns. It can also be used in Indian traditional
sweets dishes such as payasam in addition to raisins and nuts. The final product exhibits
functional properties like non-cariogenicity, low calorific value and other prebiotic
properties. The product might improves mineral absorption, reduces the total cholesterol
and triglyceride levels in the body. Another novelty of the process is the value addition to
fruits and vegetables. Also, use of FOS syrup improves the texture, colour, taste and shelf
life of the product. Presence of FOS also reduces the chance of microbial contamination
to the product to a considerable level. The FOS syrup used for OD also gets enriched by
the leached out nutrients (Ramesh et al., 2004). Recently, Anikó-Matusek et al., (2008)
studied how the different oligosaccharide components of FOS diffuse during VI and
osmotic dehydration of apple cubes. The study demonstrated that there is great potential
for developing high quality, FOS fortified fresh-cut apples using VI technology, thus
further enhancing the health benefit of the apples.
In the similar direction, the present investigation is paying awareness to the health
conscious consumers, a new approach of prebiotic and probiotic enriched foods.

Chapter:1
39Introduction
1.7. Scope of the work
The research program on ‘Biotechnological approaches for the preparation of FOS
based prebiotic and probiotic foods’ is based on the following facts.
1. Fructooligosaccharides (FOS), produced from transfructosylation of sucrose using
FTase, have a great potential as an osmotic agent to incorporate into fruits and
vegetables. However, the replacement of sucrose syrup, a commonly used
osmotic solution with FOS needs to be studied (Chapter 2).
2. Detailed studies on the vacuum osmotic dehydration (VOD) parameters for the
production of FOS enriched fruits/vegetables are needed. Optimum experimental
conditions have to be established to ascertain the maximum FOS intake in the
product (Chapter 3).
3. With the changing pace of human activity and changing life styles, the demand
for the readymade fruit juice is increasing. Fruit juice beverages fortified with
minerals and vitamins are abundantly available. FOS fortified fruit juice
beverages is a new approach and a detailed study to establish their functional
properties is required (Chapter 4: Section 4.1). The consumption of sweets is an
integral part of the Indian dietary system. The enrichment of ‘gulab jamun’ with
FOS, a low calorie prebiotic as an effective replacement of sucrose either fully or
partially is to be investigated (Chapter 4: Section 4.2).
4. Though, there are number of sources available for the isolation of probiotics,
fruits and vegetable are also a rich source for probiotic strains, which are most
suitable for food industry. The potency of the probiotic organisms isolated from
fruits and vegetables needs to be evaluated for further use (Chapter 5).
5. There is a great potential for synbiotic products and traditional Indian dairy
products for innovation and value addition. Synbiotic (FOS along with probiotics)
fruits (Chapter 6: Section 6.1) and synbiotic shrikhand would provide health
benefits to the consumers (Chapter 6: Section 6.2), and improve the scale of
economy in the food and/or dairy industry.

Chapter:1
40Introduction
The specific aspects of the thesis are presented under the following headings
Chapter 1: Introduction
Chapter 2: Fructooligosaccharides: A novel osmotic agent for impregnation of fruits and
vegetables
Chapter 3: Vacuum osmotic dehydration of banana using fructooligosaccharides:
Optimization of process parameters using statistically designed experiments
Chapter 4:
Section 4.1: Fructooligosaccharides fortified fruit juice beverages
Section 4.2: Fructooligosaccharides based traditional Indian acid coagulated
milk sweet; gulab jamun
Chapter 5: Isolation and characterization of potent probiotics from fruits and vegetables
Chapter 6:
Section 6.1 Synbiotic functional star fruits with fructooligosaccharides and
selected probiotics
Section 6.2 Shrikhand: A fermented milk based dessert enriched with
fructooligosaccharides and probiotic Enterococcus faecium CFR 3002
Chapter 7: Summary and conclusion
Bibliography

Chapter: 2
FOS as an osmotic agent in VOD of fruits & vegetables 41
CHAPTER: 2
FRUCTOOLIGOSACCHARIDES:A novel osmotic agent for impregnation of fruits and vegetables

Chapter: 2
FOS as an osmotic agent in VOD of fruits & vegetables 42
2.1. Introduction
Changing concepts in nutrition and diet over the years have led to the
development of “functional foods” that promote health beyond providing basic nutrition
(Klaenhammer and Kullen, 1999) and/or reduce the risk of diseases. Functional foods are
better understood as a concept rather than a well-defined group of food products
(Alzamora et al., 2005). These foods are enriched with physiologically active components
such as prebiotics, probiotics, vitamins, and minerals. A number of carbohydrates such as
fructooligosaccharides (FOS), galactooligosaccharides (GOS) and xylooligosaccharides
(XOS) have emerged as new functional food ingredients. Among which, FOS have
attracted special attention as prebiotic, because of their well studied health effects in
regulating mineral absorption, lipid metabolism and serum cholesterol (Sangeetha et al.,
2005b; Katapodis et al., 2004; Cuervo et al., 2004; Moore et al., 2003). FOS improve
proliferation of beneficial microorganisms in human gut by preventing colonization of
pathogenic microorganisms. They have great potential for improving the
physicochemical properties of foods and functions as dietary fiber (Gibson and
Roberfroid, 1995).
The consumer demand for functional foods is on par with the demand for higher
quality fruits and vegetables. Fruit and vegetable consumption has been shown to be an
important part of any diet leading towards good health. Consumption is generally based
on locally and seasonally available foods, since expensive imports cannot be afforded or
for the lack of the necessary storage facilities for perishable products. Fruits and
vegetables in general contain more than 75% water and are prone to fast spoilage, if not
stored properly. Even proper storage fails to preserve the fruits for a long period unless
they are treated with hypertonic/hypotonic solutions to get dehydrated or intermediate
moisture foods (IMFs). It is at this juncture that, vacuum osmotic dehydration (VOD), a
well known method of osmotic treatment of foods can be used as an effective tool for
enhancing the functionality and storage parameters of fruits and vegetables (Fito and
Chiralt, 2000; Martinez-Monzo et al., 1998).
VOD leads to some advantages as compared with atmospheric osmotic
dehydration, since a faster dehydration as well as controlled impregnation of active
compounds in to the food matrix can be achieved with this treatment (Chiralt et al.,
Chapter: 2
FOS as an osmotic agent in VOD of fruits & vegetables 43
2001; Fito et al., 2001a; Fito et al., 2001b). The influence of vacuum on the kinetics of
the mass transfer phenomena, especially concerning weight loss and solid gain is very
important during osmotic treatment. The effect of vacuum application can be explained
on the basis of hydrodynamic mechanism (HDM).
The use of vacuum in osmotic dehydration allows an increase in the rate of water,
weight loss and solid gain (Sereno et al., 2001; Rastogi and Raghavarao, 1996) and
introduces controlled quantities of a solution in to the porous matrix of fruits and
vegetables (Fito et al., 2001). VOD not only enables the storage of fruits and vegetables
for a longer period, but also preserves flavour, nutritional characteristics and lessens the
extent of microbial spoilage by promoting fast compositional changes (Zhao and Xie,
2004).
The VOD process results in dehydrated or IMFs products. IMFs are those with a
water activity (aw) of 0.65 to 0.90 and moisture content ranging from 10% to 40%. The
osmotic solutions such as sugars and salts solutions used during VOD increases the
stability of these foods. IMFs offer advantages both to consumers and processors as this
process requires less energy when compared with other methods such as canning, drying,
freezing or refrigeration (Raoult-Wack, 1994). These foods can be consumed without
further processing as they bear soft texture with considerable shelf stability because, the
water is not available to support microbial growth as it is bound physically and
chemically with the osmotic solute.
Sucrose is the most widely used osmotic solution in a majority of the studies on
impregnation and osmotic dehydration. Fruit/vegetable products with sucrose, glucose,
fructose, corn syrup, minerals, nutraceuticals, sorbitol, glycerol etc as added food
ingredients are well known (Chafer et al., 2001), but there are hardly any report on the
use of FOS as an osmotic agent. Hence, there exists scope for the impregnation of fruits
and vegetables with FOS to give value addition to the product. Generally FOS is a
mixture of short chain fructans having a low calorific value (1.5 kcal/100 g) and is about
one-third as sweet as sucrose (Yun, 1996).
The present chapter details the effective use of FOS as a healthier and low calorie
replacement to sucrose for the development of shelf stable prebiotic enriched fruits and
vegetables.

Chapter: 2
FOS as an osmotic agent in VOD of fruits & vegetables 44
2.2. Materials and methods
2.2.1. Preparation of fructooligosaccharide (FOS) syrup
The production of FOS was carried out in two stage continuous process. In the
first stage, Fructosyl Transferase (FTase - EC 2.4.1.9) was produced by submerged
fermentation (Sangeetha et al., 2003) using Aspergillus oryzae MTCC 5154, a soil isolate
from our laboratory. The culture was maintained on potato dextrose agar (Himedia
Laboratories Ltd, India) slants at 4 °C. The inoculum for the production of FTase was
developed by transferring a loop of mycelium from a five day old slant of A. oryzae
MTCC 5154 into inoculum medium (1% sucrose, 0.2% yeast extract, 100 ml medium per
500 ml flask, pH 5.50). The flasks were incubated at 30±1 °C on a rotary shaker
(Emenvee Rotary Shaker 48N3, Pune, India) at 250 rpm for 24 h. The culture fluid was
separated from mycelia by filtration and was used as the source of FTase, without further
purification (Sangeetha et al., 2005a).
In the second stage, FOS syrup (30 L) was produced by transfructosylation of
sucrose (60 °Brix) using FTase at enzyme to substrate ratio of 1:9 (v/v) in an
indigenously designed and fabricated bioreactor at 55 °C for 18 h (Sangeetha et al.,
2005b). The resultant FOS syrup of 58°Brix (Refractometer; Range: 58-92 °Brix, No:
94478, Erma, Japan) was a mixture of glucose (14%), sucrose (30%), 1-kestose (35%), 1-
nystose (18%) and 1-fructofuranosyl nystose (3%). The syrup was concentrated to 70
°Brix (10 L water evaporation per hour using 0.5 kg/cm2 steam pressure at 55 °C) using
agitated thin film evaporator (M/S. Chemetron corporation, model: 04-012, USA) and
stored at 4 °C until use.
2.2.2. Vacuum osmotic dehydration (VOD) of selected fruits and vegetables with
FOS
The fruits and vegetables were purchased from the local super market (Table 2.1),
Mysore, India. Care was taken to use fairly uniform sized fruits and vegetables. The
VOD experiments were carried out in a 1 L glass bowl. The selected fruits and vegetables
were washed, peeled, cut either into 1 cm cubes (apple, papaya, sapota, ash gourd,
pumpkin) or 0.6 cm thick slices (banana, star fruit, carrot), and were water blanched at

Chapter: 2
FOS as an osmotic agent in VOD of fruits & vegetables 45
80-90 °C for 2-3 min. The process flow chart for the preparation of FOS enriched
fruits/vegetables is depicted in Fig 2.1.
Table 2.1: The fruits and vegetables used in the VOD process
The fruits and vegetable pieces with an initial moisture content of 67 to 92% were
immersed in FOS syrup (70 °Brix), at a fruit/vegetable to FOS ratio of 1:5 (w/v) (to make
sure that the fruits/vegetables were immersed completely in the FOS syrup) and subjected
to vacuum at 650 mm Hg pressure (85.5% vacuum drawing out 650 mm Hg from the
standard atmospheric pressure of 760 mm Hg) (Vacuum oven with glass window PEW,
Model No. 132 VG, M/S. Industrial and Lab Tools Corporation, Chennai, India) for 60
min at ambient temperature (25±2 °C). The atmospheric pressure was restored for 30 min
and at the end of treatment time, the fruits and vegetable pieces were separated from FOS
syrup by straining. The FOS adhered to the surface of the fruit/vegetable pieces was
removed using adsorbent paper followed by drying in a hot air oven (The Andra
Scientific Company Ltd., Andra Pradesh, India) at 40 °C for 24 h to obtain a product with
10-30% moisture. Fig 2.2 shows the photograph of the FOS enriched fruits and vegetable
pieces.
Sl. No. Fruits / Vegetables
Common Name Scientific Name
1 Apple Malus domestica
2 Banana Musa acuminate Colla
3 Jack fruit Artocarpus heterophyllus
4 Papaya Carica papaya
5 Sapota Manilkara zapota
6 Star fruit Averrhoa carambola
7 Ash gourd Benincasa hispida
8 Pumpkin Cucurbita pepo
9 Carrot Daucus carota

Chapter: 2
FOS as an osmotic agent in VOD of fruits & vegetables 46
Fig 2.1 Process flow chart for the preparation of fruits and vegetables enriched with FOS
Fruit/vegetable pieces and FOS syrup (70 oBrix) at a ratio of 1:5 (w/v)
Fruit/vegetable pieces separated from FOS by straining
Drying of fruits/vegetable pieces at 40 oC for 24 h
FOS enriched intermediate moisture fruits/vegetables
Product characterization
Restoration of atmospheric pressure for 30 min
VOD at 650 mm Hg for 60 min at ambient temperature

Chapter: 2
FOS as an osmotic agent in VOD of fruits & vegetables 47
Fig 2.2 FOS enriched fruits and vegetables
2.2.3. Characterization of FOS enriched fruits and vegetable pieces
2.2.3.1. Estimation of moisture content and water activity (aw)
Moisture content was determined by drying the samples at 90 oC in an oven until
constant weight was reached (AOAC, 1980). Moisture determinations were made in
triplicates and average values are presented. Water activity values of FOS enriched
fruits/vegetable pieces were estimated using Novasina Thermoconstanter (Type-
TH/RTD, No-750, Switzerland).
2.2.3.2. Colour measurement of fresh and FOS enriched fruits and vegetable pieces
The colour values of fresh and FOS enriched fruits and vegetable pieces were
measured using a Hunter Lab colour measuring system (Lab scan XE, Hunter Ass. Lab,
Virginia, USA), using the L* a* b* colour scheme. Wavelengths of the visible light range

Chapter: 2
FOS as an osmotic agent in VOD of fruits & vegetables 48
between 400-700 nm, view angle of 2° and the most commonly used illuminant ‘C’ were
used to analyze the L*, a* and b* values. The L*, a* and b* values represent
brightness/darkness, green/red and yellow/blue respectively (Krishnamurthy and Kantha,
2005). Colour values presented are an average of three readings.
2.2.3.3. Texture analysis of fresh and FOS enriched fruits and vegetable pieces
A universal testing machine (UTM; LLOYD, LR 5K) at 50 mm/min cross head
speed with a load cell of 50 kg weight was used to measure the shear strength of fresh
and FOS enriched fruits and vegetable pieces. The test cell consists of thin stainless steel
blade with an equilateral triangular hole (mounted to the cross head) and is led through a
narrow slit between two shear bars (Krishnamurthy and Kantha 2003).
2.2.3.4. β-carotene
The amount of β-carotene in fresh and FOS enriched fruits and vegetables pieces
was estimated using acetone extraction followed by separation in an adsorption column
and subsequent measuring of the colour intensity at 450 nm using a UV/Visible
spectrophotometer (Shimadzu, UV-1601) and compared with that of a β-carotene
reference standard. The amount of β-carotene was expressed as μg/100ml of sample
(Ranganna, 2003).
2.2.3.5. Estimation of FOS content
The FOS enriched fruits and vegetables pieces (5 g) were taken randomly and
macerated with 5-10 ml of triple distilled water using mortar and pestle. The extract was
centrifuged at 8000 rpm for 20 min and filtered through 0.45 micron membrane filters.
The filtrate was appropriately diluted with triple distilled water and analyzed for FOS
content by HPLC (SCL-6B, Shimadzu, Japan) equipped with a refractive index detector
RID 6B (Shimadzu, Japan) using an Aminopropyl column 250×4.6 mm SS Excil amino 5
μm (SGE, Australia). Appropriately diluted reaction mixture was injected using HPLC
injector syringe (Hamilton, Nevada, USA). The analysis was carried out at room
temperature (25±2 °C) using acetonitrile: water (70:30 v/v) as the mobile phase at a flow
rate of 1.0 ml/min (Sangeetha et al., 2002).

Chapter: 2
FOS as an osmotic agent in VOD of fruits & vegetables 49
The FOS obtained was compared with FOS standards: 1-kestose, 1-nystose and 1-
fructofuranosyl nystose from Wako Pure Chemical Industries, Ltd. (Gift from Dr. Sosaku
Ichikawa, Osaka, Japan) and analytical grade glucose and sucrose were also used as
reference standards. Data acquisition was done by AIMIL chromatography data station
(AIMIL, New Delhi, India) and processed on computer using WINACDS software
(AIMIL, New Delhi, India). The final FOS content was expressed as the percentage
conversion based on initial sucrose concentration. The final FOS content of VOD fruits
and vegetables was expressed as g/100g product.
2.2.3.6. Scanning electron microscope (SEM) analysis of fresh and FOS enriched
fruits and vegetables pieces
Structural analysis of the fresh and FOS enriched fruits and vegetable pieces were
carried out using SEM (Leo 435 VP, Leo Electron Microscopy Ltd. (Zeiss), Cambridge,
U.K) to confirm the uptake of FOS. The sample fixation was carried out by immersing
fruit and vegetable sections in glutaraldehyde (2%) for 24 h in 0.1 M phosphate buffer
(pH 7.2 to 7.4) at 4 °C. Samples were dehydrated by sequential immersion in ethanol
solutions [(30%, 50%, 70%, 80% (v/v)] for 15 min each followed by immersion in 95%
ethanol for 20 min and were dried in a desiccator. Polaron E5100 SEM coating system
was used for gold coating. The samples were coated with 3 A° thickness gold for 2 min at
20 mA current. Gold-coated samples were examined at 150x and 300x magnifications.
2.2.3.7. Microbiological analysis of FOS enriched fruits and vegetable pieces
Microbial load of FOS enriched fruits and vegetable pieces was determined by
plating a known volume of serially diluted samples on plate count agar (PCA), potato
dextrose agar (PDA) and McConkey agar (MCA). The PDA plates were incubated at
25±2 °C for 48 h. The PCA and MCA plates were incubated at 37 °C for 24 h. The
colonies were counted and expressed as cfu/g of samples. The experiments were
performed in triplicate and the average results are reported.

Chapter: 2
FOS as an osmotic agent in VOD of fruits & vegetables 50
2.2.3.8. Sensory analysis of fresh and FOS enriched fruits and vegetable pieces
Sensory analysis was carried out using hedonic scale consisting of 10 points (1-
10), where 9-10 = excellent, 7-8 = very good, 5-6 = good, 3-4 = fair, 1-2 = poor (Sidel
and Stone, 1993). An internal panel of nine expert members evaluated the products for
colour, aroma, flavour, texture and overall acceptability.
2.2.3.9. Statistical analysis
Statistical analysis was carried out using a one-way analysis of variance
(ANOVA), Origin 6.1 Software. Means were separated using the least significant
difference test. Significance was defined at P<0.05.
2.3. Results and Discussion
2.3.1. Effect of FOS enrichment on moisture content and water activity (aw) of fruits
and vegetables
Moisture content is an important parameter, which plays a major role in
maintaining the freshness of fresh fruits and vegetables. However, the high moisture
content and high aw make them more susceptible to spoilage. In order to circumvent this,
drying is widely used for getting shelf stable products. Moisture content of fresh and FOS
enriched fruit and vegetable is shown in Fig 2.3. Moisture content of FOS enriched apple,
sapota and pumpkin was found to be in the range of 20-30%, where as in banana, jack
fruit and papaya, it was 14%. The star fruit, ash gourd and carrot contained 11.14, 17.46
and 18.94% moisture respectively. The replacement of native liquid or air in the pores of
the fruits and vegetable is achieved by an external solution i.e. FOS syrup (70 °Brix)
during VOD and thus, moisture content and water activity of fruits and vegetable pieces
changed markedly after applying vacuum during the process. The FOS syrup used is
hypertonic and thus, the native liquid would have been expelled, partially during process.
FOS enriched fruits and vegetable pieces were dried at 40 °C in order to retain some of
the desirable attributes of fruits and vegetables. The final moisture content of FOS
enriched fruits and vegetables at the end of 24 h drying was found to be less than 30%,
which is a characteristic of IMF.

Chapter: 2
FOS as an osmotic agent in VOD of fruits & vegetables 51
It is generally known that water removal by osmotic dehydration is a relatively
slow process. Hence the vacuum was used during the osmotic dehydration process to
enhance the rate of removal of water content from fruits and vegetables. Fito (1994)
reported that vacuum operation significantly increased the water loss rate compared to
that obtained at atmospheric pressure.
-10
10
30
50
70
90
110
%M
ois
ture
(w/w
)
Fresh VOD
Fruits and vegetables
Fig 2.3 Moisture content of fresh and FOS enriched fruits and vegetables
It has been reported that the reduction of moisture content (% dry basis) was
much higher when the concentration of the syrup used was higher. It is also said that the
increase in osmotic syrup concentration increases diffusional changes and the osmotic
pressure exerted on the fruit cell structure, consequently results in greater moisture
reduction (SAS, 1993). A combination of hypertonic FOS syrup (70 oBrix) and the
application of vacuum (650 mm Hg), promotes hydrodynamic gain of FOS syrup into
tissue pores of fruits and vegetables.
Chapter: 2
FOS as an osmotic agent in VOD of fruits & vegetables 52
The water holding capacity of FOS is similar to that of sucrose (Sabater-Molina
et al., 2009) and hence, the resultant aw of FOS enriched fruits and vegetables was in the
range of 0.67-0.86, which is a characteristic of IMF (Table 2.2) The application of
vacuum during osmotic process decreases aw in the minimal process of fruits (Alzamora
and Gerschenson, 1997). With the decrease in moisture content, the aw of the final
product also decreased, resulting in shelf stable FOS enriched fruits and vegetables.
2.3.2. Effect of FOS enrichment on colour of fruits and vegetables pieces
Appearance and colour are the most important quality characteristics of foods,
which play an important role in consumer acceptability. The colour of foods is due to the
presence of naturally occurring or added pigments, or even developed as a result of
complex chemical and biochemical (enzyme or non-enzymatic browning) changes
occurring during processing. The FOS enriched fruits and vegetable pieces showed a
slight decrease in L* values after VOD (Fig 2.4a). The FOS enriched sapota and ash
gourd did not show much difference in L* value when compared with fresh sapota and
ash gourd, indicated fresh appearance. The decrease in L* value (<50%) of fruits and
vegetables observed may be due to the transparency gained because of air loss and total
or partial substitution of air spaces present in the pores, by FOS.
The a* values of jackfruit and papaya after VOD with FOS indicates that, the
colour did not change significantly (P>0.05) and had retained fresh appearance which
could probably enhance the consumer acceptability. Apple and ash gourd showed
negative a* value, indicated slight brownish tinge. Where as, the jack fruit and papaya
showed similar trend in a* value. The slight decrease (sapota, carrot and pumpkin) and
increase (banana and star fruit) in a* value was also observed (Fig 2.4b). The FOS
enriched fruits and vegetables had yellowish tinge as indicated by the positive b* value
(Fig 2.4c).

Chapter: 2
FOS as an osmotic agent in VOD of fruits & vegetables 53
0
10
20
30
40
50
60
70
L*
val
ue
Fresh VOD
-5
0
5
10
15
20
25
30
a*
va
lues
Fresh VOD
0
5
10
15
20
25
30
35
b*v
alu
es
Fresh VOD
Fig 2.4 Colour values [(a) L* value; (b) a* value and (c) b* value] of fresh and FOS
enriched fruits and vegetables
b
a
c

Chapter: 2
FOS as an osmotic agent in VOD of fruits & vegetables 54
The results indicated that there were no observable changes in the colour of the
finished product after enrichment with FOS, though a slight increase or decrease in
L*a*b* values was observed in comparison with that of fresh fruits and vegetables. It is
reported that, for light colored fruits sensitive to enzymatic browning, air leaves the pores
of the fruits during vacuum treatment, reducing the oxygen concentration in the sample
tissue. This results in slowed down oxidative reaction rates, which in turn would lead to
the final product with a good natural colour (Alzamora et al., 2000). In addition, it was
found that the colour of the osmotic solution has an impact on the colour of final products
due to the filling of the pores with the solution, especially in case of light colored
products (Xie and Zhao, 2003a).
2.3.3. Effect of FOS enrichment on texture (shear strength) of fruits and vegetable
pieces
Fruits and vegetables are important components of a healthy diet, and their
textural characteristics are important quality attributes in determining consumer choice.
Tissue structure and how the tissue reacts to applied force during shear or cutting test
determines the textural characteristics of fruits and vegetables. The texture quality of
FOS enriched fruits and vegetables can be significantly influenced by the type and
concentration of osmotic solution used. Shear test determines the resistance offered by a
food sample against cutting or shearing and is widely used on account of its good
reproducibility of the results (Szczesniak, 1990).
The shear values of FOS enriched fruits and vegetable were significantly different
(P<0.05) in comparison with that of fresh fruits and vegetable pieces as shown in Fig 2.5.
The shear strength of FOS enriched fruits and vegetable pieces were similar to that of
reported values for the well studied IMF (Engelen et al., 2003). In the present study, the
FOS enriched banana, jackfruit, papaya, sapota, star fruit and carrot showed an increase
in shear strength (6.74 N, 38.5 N, 15.55 N, 7.28 N, 17.6 N and 33.05 N respectively),
when compared to that of fresh fruits and vegetables.. The observed increase in shear
strength could be due to the air-liquid exchange during the vacuum operation (Alzamora
et al., 2000; Alzamora et al., 1997). In contrast to general increasing trend, the shear
values of ash gourd, apple and pumpkin were decreased (30.6 N, 2.9 N and 20.75 N

Chapter: 2
FOS as an osmotic agent in VOD of fruits & vegetables 55
respectively) after VOD. It is well established that the texture properties, in general are
dependent on the behavior of cellular matrix and soluble solid phase inside the tissue
(Contreras et al., 2005; Gabas et al., 2002). Vision, audition, touch and kinesthesis
sensations are involved in texture perception during food selection and later during
consumption. In line with the above argument, the final products were found to be highly
acceptable by the sensory panelists.
0
5
10
15
20
25
30
35
40
45
50
Sh
ear
va
lues
(N)
Fresh VOD
Fruits and vegetables
Fig 2.5 Texture of fresh and FOS enriched fruits and vegetables
2.3.4. β-carotene content
Carrot, pumpkin, jackfruit, and papaya are rich source of carotenoids, especially
β-carotene and other carotenoids that are well known precursors of vitamin A. The
retention of β-carotene is of utmost importance not only from the point of preserving the
appearance of the finished product, but also from the point of nutritional and dietary
value of the product (Ong and Chytil, 1983).
β-carotene content of fresh and FOS enriched fruits and vegetable pieces are
shown in the Fig 2.6. There was 60-70% retention of β-carotene in FOS enriched fruits
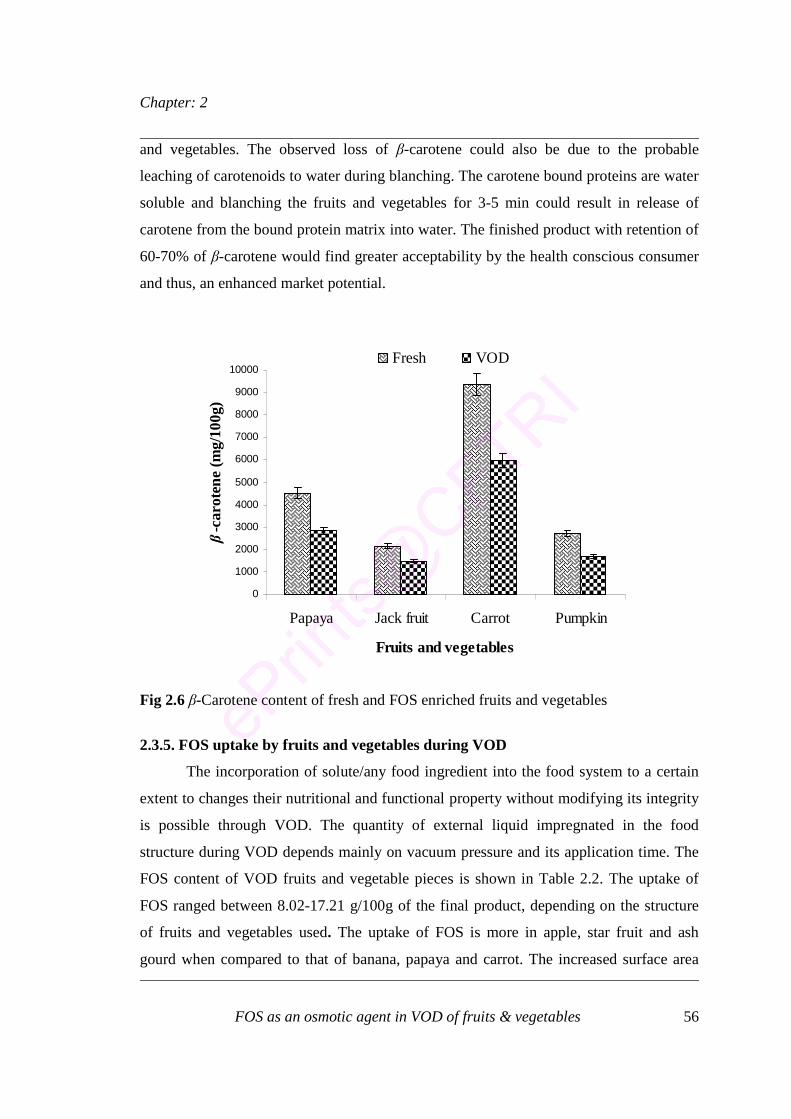
Chapter: 2
FOS as an osmotic agent in VOD of fruits & vegetables 56
and vegetables. The observed loss of β-carotene could also be due to the probable
leaching of carotenoids to water during blanching. The carotene bound proteins are water
soluble and blanching the fruits and vegetables for 3-5 min could result in release of
carotene from the bound protein matrix into water. The finished product with retention of
60-70% of β-carotene would find greater acceptability by the health conscious consumer
and thus, an enhanced market potential.
0
1000
2000
3000
4000
5000
6000
7000
8000
9000
10000
Papaya Jack fruit Carrot Pumpkin
β-c
arot
ene
(mg/
100
g)
Fresh VOD
Fruits and vegetables
Fig 2.6 β-Carotene content of fresh and FOS enriched fruits and vegetables
2.3.5. FOS uptake by fruits and vegetables during VOD
The incorporation of solute/any food ingredient into the food system to a certain
extent to changes their nutritional and functional property without modifying its integrity
is possible through VOD. The quantity of external liquid impregnated in the food
structure during VOD depends mainly on vacuum pressure and its application time. The
FOS content of VOD fruits and vegetable pieces is shown in Table 2.2. The uptake of
FOS ranged between 8.02-17.21 g/100g of the final product, depending on the structure
of fruits and vegetables used. The uptake of FOS is more in apple, star fruit and ash
gourd when compared to that of banana, papaya and carrot. The increased surface area

Chapter: 2
FOS as an osmotic agent in VOD of fruits & vegetables 57
and the biological microstructural characteristics of fruit and vegetable tissue (Shi and
Fito 1993) are some of the factors, which facilitates better uptake of FOS (Gras et al.,
2003) during VOD. The FOS uptake could also accelerated by the coupling of HDM with
the diffusional phenomena promoted by concentration gradients, due to capillary effect
(Fito, 1994; Fito and Pastor, 1994; Fito et al., 1994). Application of vacuum pressure
facilitates the outflow of internal gas or liquid and their efficient substitution by the
external liquid, thus improving the gain of external solute, FOS in the present study.
Based on the results, it can be inferred that there were no observable or significant
changes in the various quality parameters such as colour, texture and sensory attributes of
the final product due to FOS enrichment. The enriched fruits and vegetable pieces were
shelf stable, with prebiotic properties and could be consumed without further preparation.
Table 2.2 Water activity, FOS content and microbial load of VOD fruits and vegetables
Values are an average of three readings
Fruits/vegetables Water activity (aw) FOS (g/100g) Microbial load (cfu/g)
Apple 0.86±0.01 16.55±3.00 2x10³
Banana 0.66±0.02 08.49±2.00 Nil
Jackfruit 0.69±0.03 09.47±2.00 Nil
Papaya 0.71±0.01 8.02±1.00 1x10³
Sapota 0.75±0.01 10.32±3.00 2x10³
Star fruit 0.67±0.01 17.21±2.00 Nil
Ash gourd 0.78±0.02 11.78±3.00 Nil
Carrot 0.74±0.01 08.43±2.00 3x10³
Pumpkin 0.81±0.03 09.14±2.00 8x10³

Chapter: 2
FOS as an osmotic agent in VOD of fruits & vegetables 58
2.3.6. Scanning electron microscopic (SEM) observation of fruits and vegetable
pieces
SEM studies were carried out to understand the effect of FOS impregnation on
fruits and vegetables structure. The variations in microstructure of fresh and FOS
enriched fruits and vegetable pieces are shown in Fig 2.7. Intercellular spaces of fresh
fruits and vegetable are clearly seen [Fig 2.7 (a), (b) and (c)] and these spaces were filled
with FOS [Fig 2.7 (d), (e) and (f)] in case of impregnated fruits and vegetables pieces,
indicated that the external liquid infused the cellular cavity through the permeable cell
wall by replacing intracellular water, thus avoiding the cell wall deformation (Albors et
al., 1996).
Accumulation of FOS in the narrowest zone of the intercellular spaces is probably
due to the pressure gradients created during the vacuum application during the process
(Betoret et al., 2003). The reduction in the cell shape and size could probably the
resultant of loss of native liquid during VOD. A thick middle lamella between cells was
observed. This could be the reason for the observed differences in shear values (Fig.2.5).
This thick material could be due to the concentrated sugars or polymeric compound,
which may be formed by interactions of middle lamella pectin with solute present in the
impregnation solution. Moreno et al., (2000) reported similar phenomenon in
strawberries.
The type of osmotic solution used in VOD process affects the microstructure of
fruits and vegetables (Martinez-Monzo et al., 1998). Cell shrinkage is reported to increase
when sucrose is used; however, the cells have been found to retain its original form with
the use of glucose (Muntada et al., 1998; Monsalve Gonzalez et al., 1993). The FOS
syrup used for impregnation of fruits and vegetables is a mixture of glucose (14%),
sucrose (30%) and oligosaccharides (56%). The glucose and sucrose components could
have been favorable in retaining the microstructure of the end product in spite of the use
of considerable vacuum (650 mm Hg).

Chapter: 2
FOS as an osmotic agent in VOD of fruits & vegetables 59
Fig 2.7 Scanning electron micrographs of fresh banana (a), jackfruit (b) and carrot (c) and
FOS enriched banana (d), jackfruit (e) and carrot (f).
b e
da
c f

Chapter: 2
FOS as an osmotic agent in VOD of fruits & vegetables 60
2.3.7. Microbiological analysis of FOS enriched fruits and vegetable pieces
The presence of microorganisms like yeast and moulds beyond a certain number
in food is harmful. The microbial loads of FOS enriched fruits and vegetable pieces are
given in Table 2.2. Vacuum application results in expelling the internal gas or liquid,
which are replaced by the osmotic solution (FOS syrup) on vacuum release (Andres et al.,
2001). This results in lower moisture content, concomitant with lower aw, which in turn
reduces the chances of microbial spoilage.
No colonies were detected in case of banana, jackfruit, star fruit and ash gourd.
However, a few colonies were observed on PCA plates in case of apple, papaya, sapota,
carrot and pumpkin. No coliforms were observed in any of these FOS enriched fruits and
vegetable pieces. Incorporation of anti-browning agent, pH reducers, firming agents and
antimicrobials to the fruits and vegetables for extending shelf life and enhancing
microbial safety have been reported (Betoret et al., 2003; Gras et al., 2003; Xie and
Zhao, 2003a; Fito et al., 2001a). The present study has successfully shown the use of
FOS for developing nutritionally enriched, shelf stable fruits and vegetable pieces with
considerable shelf stability.
2.3.8. Effect of FOS enrichment on sensory attributes of fruits and vegetable pieces
FOS enriched fruits and vegetable pieces showed good sensory acceptance for all
the sensory attributes evaluated. Slightly lower scores were observed in banana and
carrot, but with average scores, above the limit of acceptability. However, all the FOS
enriched fruits and vegetables pieces were found to be acceptable based on the overall
quality (Table 2.3).

Chapter: 2
FOS as an osmotic agent in VOD of fruits & vegetables 61
Table 2.3 Sensory attributes of fresh and FOS enriched fruits and vegetables
Fruits/vegetables
Colour Flavour Texture OverallAcceptability*
C* T** C* T** C* T**
Apple 9.00±0.25 7.50±0.16 7.00±0.22 7.00±0.16 9.00±0.25 8.00±0.16 8.00±0.22
Banana 9.00±0.16 7.00±0.22 7.00±0.26 7.00±0.16 9.00±0.22 5.50±0.26 7.50±0.26
Jackfruit 9.00±0.22 9.00±0.25 9.00±0.25 9.00±0.22 8.00±0.16 5.00±0.25 8.00±0.16
Papaya 9.00±0.25 9.00±0.26 8.00±0.16 8.50±0.16 8.00±0.22 7.50±0.16 8.00±0.25
Sapota 8.50±0.25 8.00±0.25 8.00±0.16 8.00±0.25 9.00±0.26 8.50±0.22 8.50±0.25
Star fruit 8.50±0.16 8.00±0.16 7.50±0.25 7.50±0.16 8.00±0.25 7.50±0.25 8.50±0.22
Ash gourd 9.00±0.16 7.50±0.16 9.00±0.25 8.00±0.16 9.00±0.16 8.50±0.22 8.50±0.16
Carrot 9.00±0.22 8.50±0.22 8.00±0.16 7.00±0.25 8.00±0.25 6.00±0.16 7.50±0.22
Pumpkin 9.00±0.22 9.00±0.26 9.00±0.25 7.50±0.25 8.00±0.25 8.00±0.25 8.50±0.16
C* Fresh fruits and vegetables: T** FOS enriched fruits and vegetables
*Minimum acceptable score is 7.00

Chapter: 3
Optimization of VOD process for FOS impregnation in banana 62
CHAPTER: 3
VACUUM OSMOTIC DEHYDRATION OF BANANA USINGFRUCTOOLIGOSACCHARIDES:
Optimization of process parameters using statistically designedexperiments

Chapter: 3
Optimization of VOD process for FOS impregnation in banana 63
3.1. Introduction
India, with a production of 44.04 million tonnes of fruits from an area of 3.72
million hectares is the second largest producer of fruits after China. Banana (Musa
acuminate Colla) is one of the world’s most important food crops in the tropical and sub
tropical regions where it constitutes a major staple food crop for millions of people. It is
grown in Maharashtra, Tamil Nadu, Gujarat, Karnataka, Andhra Pradesh, Kerala, Assam,
and Bihar in an area of 565 thousand hectare with production of 19.19 million tonnes
(Singh, 2007). Banana is one of the important fruits grown in Karnataka, cultivated in
52,613 hectares, with a production of 1.3 million tonnes and a productivity of 24.6 tonnes
per hectares, which is below the national average of 30.6 tonnes per hectares.
Banana has high nutritional value, being rich in starch, sugars, besides vitamin A,
C and minerals such as potassium, phosphorus, calcium, sodium, and magnesium
(Borges, 1997). Banana is one among the most widely consumed fruits in the world in its
fresh form and is also consumed in various other forms like dried banana, also called
banana "chips". Banana is used in the preparation of banana puree as the basis for baby
food, desserts, sweets, and for dairy products (Deka and Choudhury, 2006). Banana has a
commercial value for its highly appreciated sensorial characteristics, and hence occupies
an important place for its multifaceted application, but is constrained by a short post-
harvesting life at room temperature. The short life span, apart from resulting in increased
fruit losses, also imposes restrictions on commercialization and transportation. There
exists a scope for the development of various processing operations for making different
products with an extended shelf life. Therefore, a need was felt to evaluate a simple and
an industrially feasible vacuum osmotic dehydration (VOD) for the development of shelf
stable nutritionally enriched banana slices. Osmotic dehydration (OD) is relatively a slow
process and hence, in order to accelerate the mass transfer, the vacuum pressure (Rastogi
et al., 1997; Fito, 1994) and ultrahigh hydrostatic pressure (Rastogi and Niranjan, 1998)
have been used.
The application of vacuum with the osmotic solution as a preliminary step allows
obtaining a faster processing with minimal heating and increased solute impregnation in
osmotic treatments (Chiralt et al., 1999; Fito and Chiralt, 1997). This is especially
desirable for improving sensory properties of the finished product. Viscosity and

Chapter: 3
Optimization of VOD process for FOS impregnation in banana 64
concentration of the osmotic solution greatly affect the product response to solute
impregnation and osmo-dehydration kinetics (Giraldo et al., 2003; Barat et al., 2001;
Chafer et al., 2001), as well as the final ratio of water loss and solute gain in the product,
which in turn has a great influence on product characteristics.
The effect of several factors including the type and concentration of osmotic
agents (El-Aouar et al., 2006; Collignan and Raoult-Wack, 1994; Lerici et al., 1985),
processing temperature and time (Biswal and Bozorgmehr, 1992; Lenart and Flink,
1984), agitation (Mavroudis et al., 1998), food matrix to solution ratio (Vijayanand et al.,
1995) and raw material characteristics (Mavroudis et al.,1998) on OD of fruits,
vegetables, meat and fish have been investigated. Investigations on factors affecting OD
of a specific food product provides valuable information on the most important
processing variables and their levels prior to optimization studies (Ozen et al., 2002).
Statistical designs are powerful tools that can be used to account for the main as
well as the interactive influences of different process parameters on the OD process. The
OD requires that, it should be optimized with the purpose of diminishing costs and
undesired effects in the resulting product. There are many optimization methods such as
conventional graph method (Wanasundara et al., 2002; Mettler and Seibel, 1993;
Gurmail et al., 1990; Ylimaki et al., 1988), the improved graph method (Garrote et al.,
1993; Fichtati et al., 1990; Floros and Chinnan, 1988), the desired function method and
the procedure of extended surface (Guillou and Floros, 1993) are successfully applied in
optimization process.
Response surface methodology (RSM) is a useful statistical tool for industrial
applications to optimize reaction conditions, an effective statistical tool and widely used
in process optimization, which includes experimental design, model fitting, validation
and condition optimization (Cornell, 2002). A modeling approach based on an empirical
model obtained by RSM and investigation on influence of the ingredients concentrations
on a wide range of mathematical parameters has been reported (Ferreira et al., 2007;
Haminiuk et al., 2007; Biazus et al., 2005; Higuti et al., 2004). RSM presupposes the use
of an experimental design to investigate the functional form of the process or system
which involves one or more response variables that are influenced by various factors, or
independent variables. The main advantage of RSM is the reduced number of

Chapter: 3
Optimization of VOD process for FOS impregnation in banana 65
experimental runs that provide sufficient information for statistically valid results. RSM
is faster and more informative than the classical one-variable-at-a-time approach or the
use of full factorial designs. RSM guides, in process optimization by providing the
maximum or the minimum of the responses, if they exist, or determining a region in the
total space of the factors wherein, certain desirable operating conditions are satisfied
(Myers, 1971).
The effect of sugar concentration, temperature and time on the OD of apples using
RSM was studied by Quintero-Ramos et al., (1993). Vijayanand et al., (1995) followed
the same statistical approach to optimize the processing conditions of OD of cauliflower.
Corzo and Gomez (2004) optimized the OD of cantaloupe using the desired function
methodology of response surface optimization. The present chapter details the effect of
operating conditions like vacuum pressure, temperature, vacuum treatment time and
atmospheric restoration time on the uptake of fructooligosaccharides (FOS) and the
texture (shear strength) of banana slices during VOD.
3.2. Materials and methods
3.2.1. Preparation of FOS syrup
The detailed protocol for the preparation of FOS syrup is given in the section
2.2.1.
3.2.2. VOD of banana slices with FOS
Bananas (Musa acuminate Colla) were purchased from a local super market
(Mysore, Karnataka, India). Fruits of uniform maturity from the same bunch were peeled
and cut into slices of 6 mm thickness. The selection of banana in the present study is
based on the previous observation (Chapter 2) on FOS uptake. The study mainly focused
on the maximum uptake of FOS in banana. The average moisture content of the banana
was found to be 65 to 67±2% (wet basis). A known quantity (100 g) of banana slices,
immersed in FOS syrup (70 oBrix; 500 ml) in a glass bowl was placed in the vacuum
oven (Vacuum oven, Model No. 132 VG, M/S. Industrial and Lab Tools Corporation,
Chennai, India) as per the experiment design. Detailed sample preparation is given in

Chapter: 3
Optimization of VOD process for FOS impregnation in banana 66
section 2.2.2. Experiments were randomized in order to maximize the effects of
unexplained variability in the observed responses due to extraneous factors.
3.2.3. Texture (shear strength) and FOS content of banana slices
The measurement of shear strength and estimation of FOS content of the banana
slices are given in section 2.2.3.3 and 2.2.3.5 respectively.
3.2.4. Experimental design and statistical analysis
The RSM was used to estimate the main effects of process variables on uptake of
FOS (g/100g) and shear strength (N) of the banana slices during VOD. Vacuum pressure
(x1), temperature (x2), vacuum treatment time (x3) and atmospheric restoration time (x4)
were selected as independent variables based on the preliminary trials to fix the
experimental domain.
A Central Composite Rotatable Design (CCRD) was used to examine the
response pattern and to determine the optimum synergy of the variables (Cochron and
Cox, 1957). The design included 31 experiments and was adopted by adding 7 (no)
central points and 8 (=2) axial points to 24 full factorial design. The centre runs provided
a means for estimating the experimental error and a measure of lack of fit. The axial
points were added to the factorial design to provide for estimation of curvature of the
mode. The four process variables such as vacuum pressure (250-650 mm Hg),
temperature (30-50 oC), vacuum treatment time (5-55 min) and atmospheric restoration
time (5-30 min), at five levels with 7 replicates at the center for the VOD of banana slices
are given in Table 3.1. Treatment schedule for the chosen CCRD is shown in Table 3.2.
Experiments were randomized to maximize the effects of unexplained variability in the
responses because of extraneous factors and influences.

Chapter: 3
Optimization of VOD process for FOS impregnation in banana 67
Table 3.1 Different process variables in coded and un-coded terms chosen for the Central
Composite Rotatable Design (CCRD)
Independent variable Range and levels Mean Standarddeviation
-2 -1 0 +1 +2
Vacuum pressure (mm Hg) 250 350 450 550 650 450 87.99
Temperature (oC) 30 35 40 45 50 40 4.40
Vacuum treatment time (min) 15 25 35 45 55 35 8.80
Restoration time (min) 10 15 20 25 30 20 7.91
A second-order polynomial equation was adapted to fit the experimental data
given in Table 3.2. Two models of the following form were developed to relate to the two
responses (Y) such as FOS uptake and shear strength of product to the four process
variables (x):
Where Yk= response variable (Y1= uptake of FOS; Y2= shear strength) and xi
represent the coded independent variables (x1= vacuum pressure, x2= temperature, x3=
vacuum treatment time and x4 = restoration time) and Bko is the value of the fitted
response at the center point of the design i.e., at point (0,0,0), Bki, Bkii and Bkij are the
linear, quadratic and cross-product regression coefficients respectively.

Chapter: 3
Optimization of VOD process for FOS impregnation in banana 68
Table 3.2 Central composite rotatable design (CCRD) with experimental values of
response variables
Runorder
x1:Vacuumpressure(mm Hg)
x2:Temperature(oC)
x3:Vacuumtime(min)
x4:Restorationtime(min)
Y1:FOSuptake(g/100g)
Y2:Shearstrength(N)
1 350 (-1) 35 (-1) 25 (-1) 15 (-1) 7.50 22.702 550 (+1) 45 (+1) 45 (+1) 25 (+1) 10.03 17.703 450 (0) 40 (0) 35 (0) 30 (+2) 6.91 20.314 350 (-1) 35 (-1) 45 (+1) 25 (+1) 7.56 12.505 450 (0) 30 (-2) 35 (0) 20 (0) 5.71 22.456 350 (-1) 45 (+1) 25 (-1) 15 (-1) 5.76 18.707 450 (0) 40 (0) 35 (0) 20 (0) 6.42 14.708 550 (+1) 45 (+1) 45 (+1) 15 (-1) 9.61 12.809 550 (+1) 35 (-1) 25 (-1) 25 (+1) 7.08 20.65
10 450 (0) 40 (0) 55 (+2) 20 (0) 10.00 11.2011 450 (0) 40 (0) 35 (0) 20 (0) 6.23 16.9012 450 (0) 40 (0) 35 (0) 20 (0) 6.15 17.0013 450 (0) 50 (+2) 35 (0) 20 (0) 7.27 22.8914 350 (-1) 45 (+1) 45 (+1) 25 (+1) 8.54 17.8515 450 (0) 40 (0) 35 (0) 10 (-2) 6.50 20.9816 550 (+1) 45 (+1) 25 (-1) 15 (-1) 6.91 16.1517 550 (+1) 45 (+1) 25 (-1) 25 (+1) 7.37 23.5018 450 (0) 40 (0) 35 (0) 20 (0) 6.03 16.3019 350 (-1) 35 (-1) 25 (-1) 25 (+1) 7.24 17.9020 550 (+1) 35 (-1) 45 (+1) 25 (+1) 6.86 16.0021 650 (+2) 40 (0) 35 (0) 20 (0) 7.49 23.4022 450 (0) 40 (0) 35 (0) 20 (0) 6.46 15.0023 350 (-1) 45 (+1) 25 (-1) 25 (+1) 5.93 29.7624 550 (+1) 35 (-1) 45 (+1) 15 (-1) 6.66 22.5525 250 (-2) 40 (0) 35 (0) 20 (0) 7.04 22.5026 350 (-1) 45 (+1) 45 (+1) 15 (-1) 8.57 14.1527 550 (+1) 35 (-1) 25 (-1) 15 (-1) 6.76 20.3528 450 (0) 40 (0) 35 (0) 20 (0) 6.41 10.8029 450 (0) 40 (0) 35 (0) 20 (0) 6.56 10.8030 350 (-1) 35 (-1) 45 (+1) 15 (-1) 7.76 20.0031 450 (0) 40 (0) 15 (-2) 20 (0) 7.91 17.90

Chapter: 3
Optimization of VOD process for FOS impregnation in banana 69
Mathematical models were evaluated for each response by means of multiple
regression analysis. Modeling was started with a quadratic model including linear,
squared and interaction terms. The significant terms in the model were found by analysis
of variance (ANOVA) for each response. Significance was judged by determining the
probability level that the F-static (F-value) calculated from the data for which the index
was less than 5%. Model adequacies were checked by R2, adjusted-R2, predicted-R2 and
prediction error sum of squares (PRESS) (Myers and Montgomery, 1995). The model
with comparable adjusted R2 and predicted R2, a low PRESS and high adequate precision
values was selected. Residual analysis was conducted to validate the assumptions used in
the ANOVA. This included calculating case statistics to identify outliers and examining
diagnostic plots such as normal probability plots and residual plots.
To deduce optimum process conditions, response surface and contour plots were
generated for different interaction of any two independent variables, while holding the
value of the third variable as constant (at the central value). Optimization of the process
was aimed at finding the levels of independent variables, viz., vacuum pressure,
temperature, vacuum treatment time and restoration time which would give maximum
possible FOS uptake and minimum shear strength of the product. RSM was applied to the
experimental data using commercial statistical package, Design-Expert Version 8.0.3.1
(Trial Version, Stat-Ease Inc., Minneapolis, MN). The same software was used for the
generation of response surface plots, superimposition of contour plots and optimization of
process variables. Maximization and minimization of the polynomials thus fitted was
performed by desirability function method.
3.2.5. Optimization
During optimization of the VOD process, response variables describing the
measures of the systems and the quality characteristics are to be optimized in
conjunction. One of the responses (FOS uptake) is to be maximized while the other
(shear strength) is to be minimized. This could complicate the process of optimization of
the several possible approaches like constrained optimization, superimposition of contour
diagrams of response variables etc. A desirability function that combines all the

Chapter: 3
Optimization of VOD process for FOS impregnation in banana 70
responses into one measurement was developed for the criteria of maximizing FOS
uptake and minimizing shear strength of the banana slices.
3.2.6. Statistical analysis
Statistical analysis was carried out using a one-way analysis of variance
(ANOVA).
3.3. Results and discussion
3.3.1. Fitting Models
Experimental data (Table 3.2) were used to assess the effect of process variables
on the two responses by fitting suitable models. ANOVA was conducted to determine the
adequacy of the model and significance of process variables on each response. The model
for FOS uptake was found to have a large R2 value of 0.985 and adjusted and predicted
R2 value of 0.972 and 0.938 respectively. The model for texture (shear strength) was
found to have a large R2 value of 0.891 and a reasonably good adjusted and predicted R2
value of 0.795 and 0.671 respectively. Adequate precision value is a measure of signal to
noise ratio. A ratio greater than 4 is desirable. The precision value for FOS and texture
was found to be 34.221 and 13.476 respectively, which indicated adequate signal. The
models were highly significant (P<0.0001) and the lack of fit was insignificant (0.514
and 0.926 for FOS uptake and texture respectively) which implied that the models
adequately represented the relationship between responses and factors.
Multiple linear regression analysis of the experimental data yielded second order
polynomial models for predicting FOS uptake and texture values as assumed at the
beginning of the study. Statistical significance of all the main effects, linear, quadratic
and interaction effects for each response are shown in Table 3.3.

Chapter: 3
Optimization of VOD process for FOS impregnation in banana 71
Table 3.3 ANOVA indicating the variables as linear, quadratic and interaction terms and
coefficients for the prediction models
SourceFOS Texture/Shear strength
Df Co-efficient
Sum ofSquares
P-valueProb > F
Co-efficient
Sum ofSquares
P-valueProb > F
Model 14 6.322 38.709 < 0.0001 14.414 525.541 < 0.0001x1:Vacuumpressure
1 0.138 0.459 0.0027 -0.086 0.177 0.8367
x2:Temperature 1 0.351 2.954 < 0.0001 -0.048 0.056 0.9076x3:Vacuumtreatment time
1 0.634 9.652 < 0.0001 -2.065 102.341 <0.0001
x4:Atmosphericrestorationtime
1 0.079 0.150 0.0593 0.297 2.112 0.4795
x1x2 1 0.489 3.822 < 0.0001 -1.048 17.556 0.0532x1x3 1 -0.060 0.058 0.2271 0.810 10.498 0.1261x1x4 1 0.107 0.185 0.0388 0.221 0.783 0.6652x2x3 1 0.658 6.917 < 0.0001 -0.941 14.175 0.0791x2x4 1 0.060 0.058 0.2271 2.848 129.732 < 0.0001x3x4 1 -0.019 0.006 0.6998 -1.210 23.426 0.0283x1^
2 1 0.261 1.953 < 0.0001 1.926 106.031 < 0.0001x2^
2 1 0.068 0.131 0.0766 1.856 98.461 < 0.0001x3^
2 1 0.683 13.37 < 0.0001 -0.174 0.870 0.6485x4^
2 1 0.121 0.421 0.0037 1.349 52.065 0.0024Residual 16 0.584 64.475Lack of Fit 10 0.367 0.5143 24.127 0.9266Pure Error 6 0.216 40.349Cor Total 30 39.294 590.016R2 0.985 0.891Adj R2 0.972 0.795Predi R2 0.938 0.671PRESS 2.412 193.888CV% 2.653 10.999

Chapter: 3
Optimization of VOD process for FOS impregnation in banana 72
Values of “Prob > F” less than 0.05 indicate model terms that are significant. In
this case x1, x2, x3, x4, x1x2, x1x4, x2x3, x12, x3
2, x42 and x3, x1x2, x2x4, x3x4, x1
2, x22, x4
2 were
found to be the significant model terms for FOS uptake and shear strength respectively.
The insignificant effects were also carried forward for modeling, as it was found that
some of the insignificant terms for one response were significant for the other. ANOVA
showed that the lack of fit was not significant for the response surface models at 95%
confidence level. The experimental results were analyzed through RSM to obtain an
empirical model for the best response. The mathematical expression of relationship to the
response with variables (coded factors) is shown below:
Y1 = 6.323 + 0.138 * x1 + 0.351 * x2 + 0.634 * x3 + 0.079 * x4 + 0.489 * x1 * x2 - 0.06 *
x1 * x3 + 0.108 * x1 * x4 + 0.658 * x2 * x3+ 0.06 * x2 * x4 - 0.019 * x3 * x4 + 0.261 *
x12 + 0.0676 * x2
2 + 0.684 * x32 + 0.121 * x4
2
Y2 = 14.414 - 0.086 * x1 - 0.048 * x2 - 2.065 * x3 + 0.297 * x4 - 1.048 * x1 * x2 + 0.81 *
x1 * x3 + 0.221 * x1 * x4 - 0.941 * x2 * x3 + 2.848 * x2 * x4 - 1.21 * x3* x4 + 1.926 *
x12 + 1.856 * x2
2 - 0.174 * x32 + 1.349 * x4
2
Where Y1 and Y2 represent FOS uptake (g/100g) and texture (shear strength, N)
respectively, and x1, x2, x3, and x4 are the coded values of the test variables, vacuum
pressure (mm Hg), temperature (oC), vacuum treatment time (min), and atmospheric
restoration time (min) respectively.
3.3.2. Response surface and contour plots
The FOS uptake of the banana slices varied from 5.71 to 10.03 g/100g and the
shear strength, an indicator of the texture of the banana slices varied from 10.80 to 29.76
N in the experimental domain depending upon the process conditions. To visualize the
combined effects of the two factors on the response, response surface and contour plots
were generated for each of the fitted models as a function of two variables, keeping the
other two variables (central values) constant. The response surface curves were plotted to
determine the optimum level of each variable for maximum response. The response
surface curves for FOS uptake are shown in Fig 3.1, 3.2, 3.3, 3.4, 3.5 and 3.6. The
response surface curves for shear strength are shown in Fig 3.7, 3.8, 3.9, 3.10, 3.11 and
3.12.

Chapter: 3
Optimization of VOD process for FOS impregnation in banana 73
Fig 3.1 Response surface plots for FOS uptake in banana slices as a function of
temperature and vacuum pressure
Fig 3.2 Response surface plots for FOS uptake in banana slices as a function of vacuum
treatment time and vacuum pressure

Chapter: 3
Optimization of VOD process for FOS impregnation in banana 74
Fig 3.3 Response surface plots for FOS uptake in banana slices as a function of
atmospheric restoration time and vacuum pressure
Fig 3.4 Response surface plots for FOS uptake in banana slices as a function of vacuum
treatment time and temperature

Chapter: 3
Optimization of VOD process for FOS impregnation in banana 75
Fig 3.5 Response surface plots for FOS uptake in banana slices as a function of
atmospheric restoration time and temperature
Fig 3.6 Response surface plots for FOS uptake in banana slices as a function of
atmospheric restoration time and vacuum treatment time

Chapter: 3
Optimization of VOD process for FOS impregnation in banana 76
The response surface curves, Fig 3.1 to Fig 3.6 indicate the interaction between
the variables and FOS uptake. Fig 3.1 indicates that at lower temperature, vacuum
pressure has a negative effect on uptake of FOS, where as the trend reverses at higher
temperature. Also, at lower pressures increase in temperature is less significant where as
at higher pressure FOS uptake increases with temperature. Fig 3.2 indicates that high
pressure and longer vacuum treatment time result in better FOS uptake. However, the
uptake beyond 35 min of treatment time is responsible for higher uptake as indicated by a
steeper gradient. Fig 3.3 shows a similar effect of high temperature and higher vacuum
treatment time resulting in better uptake of FOS. The effect of atmospheric restoration
time with respect to vacuum pressure, vacuum treatment time and temperature are
brought about in Fig 3.4, 3.5 and 3.6. For any restoration period, application of higher
vacuum pressure aids in better FOS uptake even though at any given pressure, the
atmospheric restoration time did not appreciably increase the uptake. Vacuum treatment
time beyond 35 min result in higher uptake. Higher temperature results in better uptake
for any given duration of the restoration period and for any given temperature,
atmospheric restoration time did not significantly increase the uptake.
The response surface curves, Fig 3.7 to Fig 3.12 indicate the interaction between
the variables and shear strength. Fig 3.7 shows that lower shear strength of the banana
slice favors medium temperature and vacuum pressure. An increase or decrease in the
values of temperature and pressure adversely affect the texture of the banana slices by
increasing its shear strength. Fig 3.8 shows that in the longer vacuum treatment time and
medium pressure range of 450 to 500 mm of Hg is preferable to get a product of lower
shear strength. Fig 3.9 indicates that, vacuum treatment time has a significant effect on
the shear strength of the banana slices. Longer vacuum treatment time has resulted in
banana slice of lower shear strength across the temperature domain. The effect of
atmospheric restoration time with respect to vacuum pressure, vacuum treatment time and
temperature are brought about in Fig 3.10, 3.11 and 3.12. Vacuum pressure in the range
of 450 to 500 mm Hg results in banana slices of lower shear strength compared to higher
or lower pressures. Longer vacuum treatment time results in a banana slice of better
texture (low shear strength) for any given period of atmospheric restoration time. High

Chapter: 3
Optimization of VOD process for FOS impregnation in banana 77
temperature and longer atmospheric restoration time is not preferred as it results in a
banana slice of very high shear strength.
Fig 3.7 Response surface plots for shear strength of banana slices as a function of
temperature and vacuum pressure
Fig 3.8 Response surface plots for shear strength of banana slices as a function of
vacuum treatment time and vacuum pressure

Chapter: 3
Optimization of VOD process for FOS impregnation in banana 78
Fig 3.9 Response surface plots for shear strength of banana slices as a function of
vacuum treatment time and temperature
Fig 3.10 Response surface plots for shear strength of banana slices as a function of
atmospheric restoration time and vacuum pressure

Chapter: 3
Optimization of VOD process for FOS impregnation in banana 79
Fig 3.11 Response surface plots for shear strength of banana slices as a function of
atmospheric restoration time and vacuum treatment time
Fig 3.12 Response surface plots for shear strength of banana slices as a function of
atmospheric restoration time and temperature

Chapter: 3
Optimization of VOD process for FOS impregnation in banana 80
In view of these conflicting and competing kind of influences of process variables
on the responses, optimization was based on a desirability function. The desirability was
to maximize the FOS content in the final product while minimizing the shear strength,
from the point of sensorial acceptability.
3.3.3. Optimization
Optimum condition for VOD of banana slices was determined to obtain maximum
FOS uptake and minimum shear strength. Second order polynomial models obtained in
this study were used for each response in order to determine the specified optimum
conditions. In this study, vacuum pressure, temperature, vacuum treatment time and
atmospheric restoration time were selected in the range of 250-650 mm Hg, 30-50 oC, 15-
55 min and 10-30 min respectively.
Table 3.4 shows results from validation experiments to be in good agreement with
predicted values. By applying desirability function method, three solutions were obtained
for the optimum covering the criteria. The first one is 550 mm Hg for vacuum pressure,
45 oC for temperature, 45 min for vacuum treatment time and 16.44 min for atmospheric
restoration time. The second is 542.07 mm Hg for vacuum pressure, 45 oC for
temperature, 45 min for vacuum treatment time and 20.56 min for atmospheric
restoration time. The third one is 500 mm Hg for vacuum pressure, 45 oC for temperature,
44.99 min for vacuum treatment time and 15 min for atmospheric restoration time. The
results indicated that the desirability value for the first solution was greater than the
second and third solution. So the factor level obtained at the first solution was selected as
the optimum.
The suitability of the model equations for predicting optimum responses at the
optimum conditions of 550 mm Hg for vacuum pressure, 45 oC for temperature, 45 min
for vacuum treatment time and 16.44 min for atmospheric restoration time of processing
time would result in FOS uptake of 9.64 g/100g and shear strength of 13.42 N. These
results were compared to the calculated FOS uptake (9.44 g/100g) and shear strength
(13.79 N). Experimentally determined values for FOS uptake and shear strength of the
banana slices under the optimum conditions were very close to the predicted values
(Table 3.4). Calculated values were within the experimental limits; therefore, the fitted

Chapter: 3
Optimization of VOD process for FOS impregnation in banana 81
models allow the prediction of the FOS uptake and decreased shear strength in banana
slices by VOD within the studied experimental conditions. It should be considered that
the final decision of the optimal conditions depends on the cost, the product quality and
the consumer expectations.

Chapter: 3
Optimization of VOD process for FOS impregnation in banana 82
Table 3.4 Experimental conditions and observed response values of validation trials
ExperimentNo.
Vacuumpressure(mm Hg)
Temperature(oC)
Vacuumtime(min)
Restorationtime(min)
Predicted Experimental
FOS(g/100g)
Shearstrength
(N)
FOS(g/100g)
Shearstrength
(N)
1 550.00 45.00 45.00 16.44 9.44 13.79 9.64 13.42
2 542.00 45.00 45.00 20.56 9.48 14.63 9.45 14.40
3 500.00 45.00 44.99 15.00 9.01 12.66 9.16 14.25

Chapter: 3
Optimization of VOD process for FOS impregnation in banana 83
RSM and graphical optimization methods were effective in locating optimum
processing conditions for VOD of banana slices. RSM has been successfully applied to
optimize food processing operations. It can be used in solving problems that concern
ingredients and/or processing conditions as variables. The main advantage of RSM is the
reduced number of experimental trials needed to evaluate multiple factors and their
interactions. Also, the study of the individual and interactive effects of these factors will
be helpful in effort to find the target value. Therefore, RSM provides an effective tool for
investigating the aspects affecting the desired response if there are many factors and
interactions in the experiment. To optimize the process, RSM can be employed to
determine a suitable polynomial equation for describing the response surface (Yin et al.,
2009; Deshpande et al., 2008). RSM used in the present study determining the optimum
operating conditions that yield maximum FOS uptake (9.64 g/100g) and minimum shear
strength (13.79 N) in VOD of banana slices. The optimum conditions obtained are only
for banana fruit and the conditions obtained may or may not be suitable for other fruits.
The FOS content of other fruits studied is well within the expected result. Therefore, the
optimization of the process parameters for the maximum uptake of FOS was carried only
for banana. Analysis of variances showed that the effects of all the process variables were
statistically significant for FOS uptake. Second order polynomial models were obtained
for predicting FOS uptake and shear strength of banana slices. This methodology could
therefore be successfully employed to study the importance of individual, cumulative and
interactive effects of the test variables in vacuum osmotic processes.

Chapter: 4, Section: 4.1
FOS fortified fruit juice beverages 84
CHAPTER: 4; SECTION: 4.1
FRUCTOOLIGOSACCHARIDES FORTIFIED FRUIT JUICE BEVERAGES

Chapter: 4, Section: 4.1
FOS fortified fruit juice beverages 85
4.1.1. Introduction
Fruits are one of the five major food groups in food pyramid. India is one of the
largest and most varied fruit producing nations in the world, accounting for about 10.4%
of all fruits and nearly 40% of tropical fruits produced globally (FAO). The major fruit
growing states include, Uttar Pradesh, Karnataka, Tamil Nadu, Maharashtra, and Gujarat.
The major tropical fruits grown in India include banana, mango, guava, pineapple,
papaya, lychee, with lesser product of sapota, jackfruit, phalsa, annona and ber. The 3
major tropical fruits (mango, pineapple, and guava) accounted for 33% of total fruit
production in 2004.
Indian consumers are becoming increasingly aware of the positive health aspects
of fruit consumption. A diversified diet and interest in healthier eating has led to
increased consumption of fruits. The consumption of fruits in India is anticipated to
increase by 4% per year according to projected growth rates for income, population, and
trends in food preferences. This would result in demand for fruits reaching 66 million
tonnes by 2015, with the bulk of this demand growth for tropical fruit. India can meet this
increased demand by identifying and adopting measures to reduce wastage and improve
domestic productivity of fruit. Consumption of processed fruits, juices, is expected to
increase rapidly, particularly due to projected income growth. Of the total processed fruit
production in the country about 45% is contributed by mango-based products and 15% by
pineapple-based products.
Fruit juices are an important source of energy in the form of sugars; glucose,
fructose and sucrose being the most abundant in fruit and fruit products. The world trade
in fruit juices is said to be highly competitive. The observed growth in the fruit juice
market is expected to prevail in the coming years. The statistics has shown that a
beverage fruit blend, among others is a growing section of the beverage market. This has
attracted the attention of fruit growers, fruit juice distributors and processors to meet the
demand and is making a profit over the pulpy juices and fruit juice blends. Fruit juice
beverages with neutraceuticals have carved niche place in the fruit juice market (Stack,
1995).
Consumer trends with respect to food choice are changing due to the increasing
awareness of the link between diet and health (Mark-Herbert, 2004). The consumption of

Chapter: 4, Section: 4.1
FOS fortified fruit juice beverages 86
foods and beverages containing functional prebiotics and probiotics is a growing global
consumer trend (Verbeke, 2005). Consequently, the global functional food market is
thriving with recent estimates indicating up to a $50 billion annual share (Stanton et al.,
2005).
Fruit based beverages are becoming popular in comparison to synthetic or aerated
drinks due to their pleasing flavour and nutritional characteristics. Therefore, there is
great scope for preparation of fruit juice and other fruit based beverages as they quench
thirst and also help as a source of energy. Ready to serve beverages from tropical fruits
such as orange, mango and pineapple are very popular due to their unique color, flavor
and consumer preference. The juices, either made from juice concentrates and the
corresponding recovery aromas, or made as single strength juices, are annually produced
in high amounts. They are sweetened with the natural sweetener sucrose unless specified
as a ‘lite’ beverage in which case they may contain a permitted synthetic sweetener. The
nutritional quality of these beverages is improved by supplementing with neutraceutical
components.
Fruit juices are generally viewed as an appropriate medium for fortification,
because they have an established market sector as functional drinks through sales of
calcium and vitamin fortified juices and are consumed regularly. Traditional nutritional
ingredients (e.g. vitamins, minerals) used to fortify functional foods are widely
recognized and accepted by consumers as being healthy (Breithaupt, 2001). Fortification
with novel functional ingredients such as probiotics (Luckow et al., 2006), prebiotics like
fructooligosaccharides (FOS) is a recent development in this direction. The present
chapter details the value addition of selected conventional tropical fruit juices by
fortification with FOS followed by analysis of the physicochemical and sensory attributes
of these beverages, over a storage period of 6 months.
Preparation of FOS based beverage concentrate (Ramesh et al., 2004), spread
(Prapulla et al., 2002) and honey-like product (Sangeetha et al., 2003) has been
successful and the processes have been patented. On similar lines a study has been taken
to fortify selected fruit juice beverages.

Chapter: 4, Section: 4.1
FOS fortified fruit juice beverages 87
4.1.2. Materials and Methods
4.1.2.1. Preparation of FOS syrup
The detailed protocol for the preparation of FOS syrup is given in the section 2.2.1.
4.1.2.2. Preparation of fruit juices
Ripe fruits of pineapple (Ananas comosus L. Merr), mango (Mangifera indica)
and orange (Citrus sinensis L.) were procured from the local fruit market (Mysore,
Karnataka, India). The fruits were washed, peeled, crushed and passed through a pulper
to obtain pulp. In the case of oranges, the fruits were peeled and passed through a screw
type juice extractor to obtain orange juice.
4.1.2.3. Preparation of fruit juice beverages with varying ratio of FOS and sucrose
The flow chart for the preparation of FOS fortified fruit juices is given in Fig
4.1.1. An initial experiment to study the effect of fortification of fruit juice beverages
with varying ratios of FOS and sucrose (w/w) (0:100, 25:75, 50:50, 75:25 and 100:0) on
the sensory qualities was carried out. Sensory attributes like colour, taste and flavour
were evaluated by expert panelists (Table 4.1.1).
It was observed that fruit juice beverages fortified with FOS in the ratio of 75:25
was found to be acceptable and hence was chosen for further studies. The composition of
the selected fruit juice beverages fortified with FOS in the ratio of 75:25 is given in table
4.1.2. The fruit juice beverages were formulated to a total soluble solid content of 15
°Brix with a titratable acidity of 0.28-0.30 g/100 ml (citric acid). Fruit juice beverages
with only sucrose, with no added FOS was used as control.
Chapter: 4, Section: 4.1
FOS fortified fruit juice beverages 88
Fig 4.1.1 Flow chart for the preparation of fruit juice beverages
Fruits (Pineapple, Mango
and Orange)
Preparation of sugar syrup
Sugar + Water+ Citric acid
Extraction of the juice/pulp
Boiling and filtering
Blending
Sugar syrup
Addition of FOS (56 °Brix)
Fruit juice beverage with FOS
Heating to 90 °C and hot filling into presterilized bottles
Crown corkingAllowed to cool to ambient temperature
Characterization and storage studies

Chapter: 4, Section: 4.1
FOS fortified fruit juice beverages 89
Table 4.1.1 Sensory attributes of fruit juice beverages with varying ratio of FOS and sucrose
FOS: Sucrose
(w/w)
Sensory parameters
Colour Taste/Flavor Overall acceptability*
Pineapple Mango Orange Pineapple Mango Orange Pineapple Mango Orange
0:100 9.0±0.10 9.0±0.08 9.0±0.09 9.0±0.09 9.0±0.09 9.0±0.10 9.00±0.10 9.00±0.09 9.00±0.10
25:75 8.6±0.11 8.8±0.10 8.5±0.10 8.8±0.13 8.7±0.12 8.6±0.12 8.70±0.12 8.75±0.11 8.75±0.11
50:50 8.0±0.16 8.2±0.11 8.0±0.13 8.5±0.14 8.5±0.15 8.5±0.15 8.25±0.13 8.35±0.13 8.25±0.14
75:25 7.5±0.14 7.8±0.09 7.5±0.11 7.0±0.13 7.2±0.10 7.5±0.10 7.25±0.12 7.50±0.10 7.50±0.10
100:0 5.5±0.10 5.7±0.15 5.5±0.12 5.0±0.15 5.0±0.09 5.5±0.13 5.25±0.11 5.35±0.12 5.50±0.11
* Minimum acceptable score is 7.0

Chapter: 4, Section: 4.1
FOS fortified fruit juice beverages 90
Table 4.1.2 Composition of fruit juice beverages fortified with FOS in the ratio of 75: 25
Components Pineapple Mango Orange
Fruit pulp / Juice (g) 200.00 200.00 200.00
Sucrose (g)* 13.50 3.50 19.50
FOS syrup (g) 200.00 200.00 200.00
Citric acid (g) 1.80 1.80 1.80
Water (g) 584.70 594.70 578.50
Total quantity of fruit juice (g) 1,000.00 1,000.00 1,000.00
* FOS to sucrose ratio is 75:25 (w/w). Addition of sucrose to the fruit juice beverage was
based on TSS of fruit juice.
4.1.2.4. Characterization and storage studies of fruit juice beverages
Pasteurized fruit juices were stored at ambient (25±2 °C) and refrigeration (4±2
°C) temperature for 6 months and were analyzed for colour, viscosity, total soluble solids
(TSS), titratable acidity (TA), pH changes in the FOS content and sensory attributes at
regular intervals of 2 months.
4.1.2.4.1. Colour
The colour of fortified fruit juices was measured in a Hunter Lab colour
measuring system (Lab scan XE, Hunter Ass. Lab., Virginia, USA) as described in
section 2.2.3.2. Colour values represented are an average of three readings.
4.1.2.4.2. Viscosity
Viscosity was measured using Rheology viscometer at 75 rpm with spindle No.3
(Rheology International Shannon Ltd, Viscometer RI: 3: M, Shannon Ireland).

Chapter: 4, Section: 4.1
FOS fortified fruit juice beverages 91
4.1.2.4.3. TSS and titratable acidity
TSS of the fruit juices fortified with FOS was measured using hand Refractometer
(Erma, Japan). The titratable acidity was estimated by AOAC (2006) method and
expressed as “g citric acid/100 ml juice”.
4.1.2.4.4. pH
The pH of the fruit juices was determined using a control dynamics digital pH
meter (Model: APX 175 E/C) at room temperature (25±2 °C).
4.1.2.4.5. FOS Content
FOS was estimated by HPLC method (Sangeetha et al., 2002). A known volume
of fruit juice fortified with FOS was centrifuged at 8000 rpm for 20 min. The supernatant
was filtered through 0.45 µ membrane filter (Millipore India Pvt. Ltd.) and appropriately
diluted with triple distilled water and analyzed by HPLC (SCL-6B, Shimadzu, Japan) as
described in section 2.2.3.5.
4.1.2.4.6. Sensory evaluation
Sensory evaluation was carried out as described in the section 2.2.3.8. An internal
panel of seven expert members evaluated the products for colour, appearance,
taste/flavour, mouth feel and overall acceptability.
4.1.2.4.7. Statistical analysis
Statistical analysis was carried out using a one-way analysis of variance
(ANOVA), Origin 6.1 Software. Means were separated using the least significant
difference test. Significance was defined at P<0.05.

Chapter: 4, Section: 4.1
FOS fortified fruit juice beverages 92
4.1.3. Results and discussion
4.1.3.1. Colour
The L*a*b* values are shown in Fig 4.1.2, Fig 4.1.3, Fig 4.1.4 and Fig 4.1.5. After 6
months of storage, FOS fortified fruit juice beverages stored at refrigeration temperature,
exhibited higher L* values compared to values of freshly prepared beverages (initial).
During storage at ambient temperature, a constant decline of L* values was observed.
As can be seen from the results, there was no significant difference (P>0.05) in
the colour of the fruit juices fortified with FOS in comparison with that of control. This
has an important bearing on the consumer acceptance of the fortified juices, as colour is
one of the primary quality characteristics, which appeals to the consumer. Results also
indicate that there was no noticeable change (P>0.05) in the colour during storage.
-20
-10
0
10
20
30
40
50
60
70
0 2 4 6 0 2 4 6 0 2 4 6
L* a* b*
L*
a*b
*v
alu
es
Storage time (months)
Control FOS fortified
Fig. 4.1.2 Colour (L*a*b*) values of pineapple juice beverage stored at ambient
temperature (25±2 °C)

Chapter: 4, Section: 4.1
FOS fortified fruit juice beverages 93
-10
0
10
20
30
40
50
0 2 4 6 0 2 4 6 0 2 4 6
L* a* b*
L*
a*b
*va
lues
Storage time (months)
Control FOS fortified
Fig. 4.1.3 Colour (L*a*b*) values of mango juice beverage stored at ambient temperature
(25±2 °C)
05
101520253035404550
0 2 4 6 0 2 4 6 0 2 4 6
L* a* b*
L*
a*b
*v
alu
es
Storage time (months)
Control FOS fortified
Fig. 4.1.4 Colour (L*a*b*) values of orange juice beverage stored at ambient temperature
(25±2 °C).
Chapter: 4, Section: 4.1
FOS fortified fruit juice beverages 94
-10
0
10
20
30
40
50
I RT LT I RT LT I RT LT
L* a* b*
L*a
*b*
val
ues
Storage condition
Pineapple Mango Orange
Fig. 4.1.5 Comparison of colour (L*a*b*) values of fruit juice beverages stored at
ambient (25±2 °C) and refrigerated (4±2 °C) temperature.
I: Initial, LT: Low/refrigeration temperature (4±2 °C), RT: Room/ambient temperature
(25±2 °C).
4.1.3.2. Viscosity
The viscosity values are presented in Table 4.1.3. The viscosity of pineapple and mango
fruit juice beverages fortified with FOS is found to be 25.00 mPas and 23.30 mPas
respectively after 6 months of storage at refrigeration temperature. The viscosity of FOS
fortified pineapple juice could not be measured after 6 months of storage at ambient
temperature. The viscosity of fresh and the stored (4±2 °C and 25±2 °C) orange juice
beverages was not in the detectable range.
The viscosity of the juices is an important physical characteristic. It has a bearing
on the consumers’ appeal and acceptance. A fruit juice beverage generally contains
sugars, acids, soluble pectins, proteins, and salts and these form a dispersing phase which
determines the viscosity (Race, 1991). The viscosity of pineapple fruit juice beverage,
after 6 months of storage at ambient temperature could not be measured, but could be
D

Chapter: 4, Section: 4.1
FOS fortified fruit juice beverages 95
detected in the pineapple and mango fruit juice beverages stored at refrigerated
temperature and there was no significant difference.
Table: 4.1.3 Viscosity of fruit juice beverages stored at ambient (25±2 °C) and
refrigerated (4±2 °C) temperature.
PF: FOS fortified Pineapple juice, MF: FOS fortified Mango juice, OF: FOS fortified
Orange juice, PC: Pineapple juice with sucrose, MC: Mango juice with sucrose, OC:
Orange juice with sucrose (Control)
*ND: Not detectable.
4.1.3.3. Changes in physicochemical characteristics of fruit juice beverages during
storage
The changes in physicochemical characteristics of the fruit juice beverages are shown in
Fig 4.1.6, Fig 4.1.7 and Fig 4.1.8. As can be seen by ANOVA, the difference in pH (Fig.
4.1.6), TSS (°Brix) (Fig. 4.1.7), and TA (Fig. 4.1.8) were not statistically significant at
5% level between time zero (initial) and 180 days (6 months) of storage at ambient and
refrigeration temperature. The pH of all the fruit juice beverages tested ranged between
3.23 and 3.82. TSS of fruit juice beverages varied from 15.00 to 16.20 °Brix. Titratable
acidity of fruit juice beverages varied from 0.23 to 0.32 g citric acid/100 ml juice.
Fruits juice beverages
Viscosity (m Pas)
Initial Low/refrigeration
temperature (4±2 °C)
Room/ambient
temperature (25±2 °C)
PF 25.50 25.00 ND*
MF 24.00 23.30 21.50
OF ND* ND* ND*
PC 25.50 ND* ND*
MC 25.50 21.80 22.50
OC ND* ND* ND*

Chapter: 4, Section: 4.1
FOS fortified fruit juice beverages 96
0
0.5
1
1.5
2
2.5
3
3.5
4
PF MF OF PC MC OC
pH
Fruit juices
Initial (25±2°C) 2 months (25±2°C) 4 months (25±2°C)6 months (25±2°C) 6 months (4±2°C)
Fig 4.1.6 Changes in the pH of fruit juice beverages during storage
PF: FOS fortified Pineapple juice, MF: FOS fortified Mango juice, OF: FOS fortified
Orange juice, PC: Pineapple juice with sucrose, MC: Mango juice with sucrose, OC:
Orange juice with sucrose (Control)
The pH of the fruit juice beverages fortified with FOS was in the range of 3.23-
3.57 as in the case of sucrose fortified beverages (3.30-3.82). Result shows that during 6
months of storage at ambient and refrigeration temperature, the pH values did not show
any significant difference. Similar observations with respect to the changes in pH as a
function of storage time and temperature have been made by Kaanane et al., (1988),
Martin et al., (1995) and Souci et al., (1987).
TSS (°Brix) of the fruit juice beverage was stable throughout the storage period
(4±2 °C and 25±2 °C). The stability of the TSS could be due to the heat treatment
(pasteurization) prior to storage. Pasteurization inhibits the growth of microbes especially
yeasts which are known to ferment sugar and sugar products such as fruit juice beverages
and thus results in sugar reduction and concomitant changes in the TSS (Fig 4.1.7).

Chapter: 4, Section: 4.1
FOS fortified fruit juice beverages 97
0
2
4
6
8
10
12
14
16
18
PF MF OF PC MC OC
TS
S(°
Bri
x)
Fruit juices
Initial (25±2°C) 2 months (25±2°C) 4 months (25±2°C)
6 months (25±2°C) 6 months (4±2°C)
Fig 4.1.7 Changes in the total soluble solids (TSS) of fruit juice beverages during storage
PF: FOS fortified Pineapple juice, MF: FOS fortified Mango juice, OF: FOS fortified
Orange juice, PC: Pineapple juice with sucrose, MC: Mango juice with sucrose, OC:
Orange juice with sucrose (Control)
Organic acids contribute to the particular flavour and palatability of fruit juices.
To a large extent, acidity protects against the development of pathogens. Increase in the
acidity over storage could be due to the formation of organic acids by the fermentation of
sugar by undesired organisms. However, in the present study no significant change in
acidity was noticed and the acidity was fairly constant throughout the storage (Fig 4.1.8).
This indicates the stability of the fruit juice beverages fortified with FOS over storage.
Also, the beverages retained all the desirable sensorial properties, as is the case of fruit
juice beverages with sucrose.

Chapter: 4, Section: 4.1
FOS fortified fruit juice beverages 98
0
0.05
0.1
0.15
0.2
0.25
0.3
0.35
0.4
PF MF OF PC MC OC
TA
(g/1
00
ml)
Fruit juices
Initial (25±2°C) 2 months (25±2°C) 4 months (25±2°C)
6 months (25±2°C) 6 months (4±2°C)
Fig 4.1.8 Changes in the titratable acidity (TA) of fruit juice beverages during storage
PF: FOS fortified Pineapple juice, MF: FOS fortified Mango juice, OF: FOS fortified
Orange juice, PC: Pineapple juice with sucrose, MC: Mango juice with sucrose, OC:
Orange juice with sucrose (Control)
4.1.3.4. Retention of FOS in the fortified fruit juice beverages
Fig 4.1.9 represents the retention of FOS in the fortified fruit juice beverages as a
function of storage time. At the end of the storage (6 months) period, fruit juice
beverages stored at refrigeration temperature had retained a good amount of FOS
whereas, loss was pronounced in beverages stored at ambient temperature. The fruit juice
beverages stored at refrigeration temperature had retained 2.00-2.39 g/100 ml FOS after 6
months of storage whereas retention was found to be only 0.41-0.58 g/100 ml at ambient
temperature with 2.69-3.23 g/100 ml and 1.65-2.08 g/100 ml retention recorded during
the second and fourth month of storage respectively. Deterioration in the acceptable
quality characteristics was noticed only after 4 months storage. Fruit juice beverages in
general are fast moving commodity and it generally does not remain unsold for more than
2-4 months. There was a noticeable change in the acceptable quality characteristics only

Chapter: 4, Section: 4.1
FOS fortified fruit juice beverages 99
after 4 months storage at ambient temperature. Thus, the present study clearly indicates
that fruit juice beverages can successfully be fortified with FOS with shelf life of 4
months at ambient temperature.
0
0.5
1
1.5
2
2.5
3
3.5
4
4.5
Initial(25±2°C)
2 months(25±2°C)
4 months(25±2°C)
6 months(25±2°C)
6 months(4±2°C)
FO
S(g
/100
g)
Storage period (months)
Pineapple Mango Orange
Fig 4.1.9 Changes in the FOS content (g/100g) of fruit juice beverages as function of
storage
4.1.3.5. Sensory evaluation
No significant changes were detected in the overall quality of the fruit juice
beverages fortified with FOS in comparison with that of sucrose by the panelists after 4
months of storage at ambient temperature. The shelf life of fruit juice beverages was
limited to 4-5 months, after which sensory changes attained undesirable levels
(deterioration of the typical fruit flavour and taste) (Table 4.1.4).
Sensory qualities of the fruit juice beverages stored at ambient and refrigerated
temperature was studied on the basis of the consideration that a minimally acceptable
product should be equivalent to rating 5 (colour, consistency, taste, flavour and overall
quality) of its sensory quality. Fruit juice beverages, fortified with FOS, were found to be
acceptable upto 4 and 6 months based on the evaluation of overall quality.

Chapter: 4, Section: 4.1
FOS fortified fruit juice beverages 100
The changes in the present day consumer’s life style have led to a vital change in
the marketing trends of food sector. Today’s consumer being more health conscious is
seeking products with greater health benefits and there is a great demand for ‘health
foods’. The present study clearly indicates that fruit juice beverages can successfully be
fortified with FOS with shelf life of 4 months and 6 months at ambient and refrigeration
temperature respectively. There were no undesirable changes in the physicochemical
characteristics of the fruit juice beverages fortified with FOS. Overall quality of the fruit
juice beverages fortified with FOS and sucrose for 4 months of storage at ambient
temperature was acceptable as indicated by sensory analysis. Constant pH, TSS, TA and
viscosity of fruit juice beverages clearly indicates that there is no spoilage either due to
microbial or enzymatic reaction. The present study has opened up a new avenue for the
preparation of a commonly available, hugely popular healthy beverage.

Chapter: 4, Section: 4.1
FOS fortified fruit juice beverages 101
Table 4.1.4 Sensory scores of FOS fortified fruit juice beverages (FOS: Sucrose::75: 25) during storage at ambient (25±2 °C) and
refrigerated (4±2 °C) temperature for 6 months
*Minimum acceptable score is 7.0
Fruit
juice
beverages
Colour Taste/flavor Overall quality*
Storage time (months)
Initial 2 4 6 Initial 2 4 6 Initial 2 4 6
Pineapple 9.0±0.05 8.6±0.11 7.5±0.15 6.4±0.11 8.9±0.11 8.0±0.20 7.4±0.2.0 6.3±0.20 9.0±0.05 8.5±0.06 7.6±0.25 6.4±0.11
Mango 9.1±0.05 8.4±0.15 7.4±0.11 6.3±0.20 8.8±0.21 8.1±0.06 7.6±0.25 6.2±0.25 8.7±0.25 8.0±0.20 7.6±0.25 6.3±0.20
Orange 8.8±0.28 8.0±0.20 7.3±0.28 6.4±0.11 8.6±0.11 7.9±0.15 7.5±0.60 6.1±0.25 8.8±0.21 8.1±0.06 7.5±0.15 6.1±0.25

Chapter: 4, Section: 4.2
FOS based Gulab jamun 102
CHAPTER: 4; SECTION: 4.2
FRUCTOOLIGOSACCHARIDES BASED TRADITIONAL INDIAN ACIDCOAGULATED MILK SWEET: GULAB JAMUN

Chapter: 4, Section: 4.2
FOS based Gulab jamun 103
4.2.1. Introduction
India is home for many of the milk based delicacies. Milk processing started with
the objective of better utilization of perishable milk, by preparing a number of shelf
stable dairy products like butter, cheese, ghee etc. Thus, the products could be easily
transported to a market centre, and also fetch a better price or return. Processed milk
products are broadly categorized as fermented milk products, concentrated milk products,
acid coagulated milk products, evaporated milk, fat-based milk products and dried milk
products.
Gulab jamun occupies a prominent place as a popular delicacy among the acid
coagulated milk based sweets throughout Indian subcontinent. Khoa (a heat-desiccated
intermediary milk product) is a base for preparation of many Indian indigenous sweets. It
refers to partially dehydrated whole milk product prepared by the continuous heating of
milk in a frying pan, with constant stirring till it reaches a semi-solid consistency. The
semi-solid mass is transformed to solid consistency known as khoa, with a fat, moisture,
and total solid content of 20-23%, 37-44%, and 56-63% respectively. Traditionally, gulab
jamun is prepared from a mixture of khoa, refined wheat flour (maida) and baking
powder. The name gulab jamun of this sweet preparation is attributed to its resemblance
to the popular monsoon fruit, Jamun (Syzygium cumini L) and to its mild flavour of rose
water.
Sugars used in Indian sweetmeats have many functions as preservative, bulking
agent, texturizer, humectant, dispersing agent, stabilizer, flavour carrier, browning agent,
and decorative agent (Pai, 2006). Gulab jamun is one of the popular indigenous dairy
products, where sugar is the main ingredient and plays an important role in maintaining
the texture and microstructure. Textural quality is primarily a sensory attribute, but
usually, instrumental methods are used for quantifying it in foods. Texture profile
analysis (TPA) involves compressing a bite-sized piece of food two or more times in a
reciprocating motion that simulates the action of the jaw. The resulting force time curve
generated is then used to quantify a number of textural parameters that correlate well with
results from sensory evaluation (Bourne and Szczesniak, 2003). Understanding the
relationship between food texture perception and food structure is of great importance for
enterprising manufacturers intending to produce texturally attractive food products

Chapter: 4, Section: 4.2
FOS based Gulab jamun 104
(Wilkinson et al., 2000). The microstructural studies of any food material help us
understanding the physical properties of foods such as texture/firmness and sensory
attributes. Limited studies have been carried out through scanning electron microscopy
(SEM) to understand some of the very important physical properties such as
texture/firmness and sensory attributes of foods, in particular of Indian indigenous
traditional sweet preparations.
The consumer preference for low calorie sugars is on raise, as they are believed to
be effective in reducing weight, management of diabetes, prevention of dental caries and
reduction in the risks associated with obesity. Hence consumer’s demand for healthy food
products has lead to the development and marketing of a large number of functional
foods based on sugar substitution in various forms. The discovery of a large number of
new sweeteners over the past few decades has led to the development of various sugar
free products for people prone to obesity and also for diabetics (Ozdemir and Sadikoglu,
1986). In recent years the acceptance of low calorie food is getting momentum due to
increased awareness of their nutritional and health benefits. The sugar has been
successfully replaced with non-calorific artificial sweeteners like saccharine, acesulfame-
K, cyclamate, sucralose and aspartame. Further to this, use of food ingredients like
fructooligosaccharides (FOS) in desserts, ice cream, dry ice cream mix, yoghurt and
cheese etc (Maia et al., 2003) has been viewed as a healthier alternative.
FOS are naturally occurring sugars that have beneficial effects as food
ingredients. They consists of sucrose molecule to which 1, 2 or 3 additional fructose units
are added by a β-(2-1)-glycosidic linkage to the fructose units of sucrose (Clevenger et
al., 1988). The health benefits of these compounds have increased popularity as food
ingredients. These oligosaccharides act as prebiotics, since they are not hydrolyzed by the
human digestive system, undergo fermentation in the colon and influence the growth of
beneficial bacteria in the colon resulting in a healthy gut environment (Sangeetha et al.,
2005).
There have been few attempts to prepare some of the commonly available and
cherished Indian sweetmeats with alternate sweeteners for e.g., Burfi with saccharin,
aspartame, acesulfame-K, sucralose gulab jamun with sorbitol, aspartame, shrikhand
with raftilose (Arora et al., 2008; Arora et al., 2007; Raghvendra and Jha, 2005;

Chapter: 4, Section: 4.2
FOS based Gulab jamun 105
Chetana et al., 2004). However, there has been no report on the use of FOS for the
preparation of gulab jamun. The present chapter details mainly on texture,
microstructure, and sensory attributes of gulab jamun prepared with FOS syrup, sugar
syrup and a blend of FOS and sucrose.
4.2.2. Materials and methods
4.2.2.1. Preparation of Syrups
Gulab jamun were sweetened with three different syrups: sugar syrup, FOS syrup
and a blend of FOS and sugar syrup. Sugar syrup of 50 °Brix was prepared by dissolving
100 g cane sugar in 100 ml water and boiling for 4-5 min. The TSS of the syrup was
recorded using refractometer (Erma, Japan). The detailed protocol for the preparation of
FOS syrup is given in the section 2.2.1. The syrup obtained (58 °Brix) was diluted to 50
°Brix using distilled water and further used for the preparation of gulab jamun. A blend
of FOS and sugar syrup was prepared by mixing FOS syrup (50 °Brix) and sugar syrup
(50 °Brix) at a ratio of 1:1 (v/v).
4.2.2.2. Preparation of gulab Jamun
Instant jamun mix (100 g: refined wheat flour, skimmed milk powder, vegetable
fat, sodium bicarbonate, malic acid, gluten and milk powder) was purchased from the
local super market (Mysore, Karnataka, India) and the contents were transferred into a
container, to which 35 ml of water was gradually added and the dough was prepared by
gentle mixing. It was allowed to stand for about 5 min, rolled into smooth balls of 7 g,
deep fat fried at 165±2 °C until the outer crust became brown in color and then
transferred to the respective syrups. Fig 4.2.1 shows the photograph of the prepared gulab
jamun sweetened with (a) FOS, (b) blend and (c) sugar syrup.

Chapter: 4, Section: 4.2
FOS based Gulab jamun 106
Fig 4.2.1 Gulab jamun sweetened with (a) FOS, (b) blend of FOS and sucrose, and (c)
sugar syrup
a
ba
Wholegulab jamun
Cutlongitudinally
ca

Chapter: 4, Section: 4.2
FOS based Gulab jamun 107
The moisture content, water activity, colour, texture, sensory, FOS content and
microbiological attributes of the gulab jamun were estimated immediately after the
preparation and also at the end of 2nd and 4th day of storage at ambient temperature (25±2
°C). The structural analysis was carried out only on the initial day.
4.2.2.3. Moisture content and water activity (aw)
The moisture content and aw were determined as detailed in section 2.2.3.1.
4.2.2.4. Colour
The colour was measured as per the protocol described in section 2.2.3.2.
4.2.2.5. Texture Profile Analysis (TPA)
The texture of gulab jamun was characterized in terms of hardness, adhesiveness,
springiness, cohesiveness, gumminess and chewiness. TPA tests were performed using
LLOYDS universal testing machine (UTM), model 4103 using 80 mm probe
(Krishnamurthy and Kantha, 2003). The force distance curve was obtained for a dual bite
compression cycle employing a crosshead speed of 50 mm/min. The values presented are
an average of three readings. The TPA data were subjected to statistical analysis. Mean
and standard deviation were individually calculated for scores obtained for all quality
attributes of the product.
4.2.2.6. Analysis of FOS and blend of FOS and sugar syrup
The detailed protocol for the quantification of FOS in the syrup is given in section
2.2.3.5.
4.2.2.7. FOS content of the gulab Jamun
Gulab jamuns sweetened with FOS syrup and a blend of FOS and sugar syrup
were taken (10 g) and macerated with triple distilled water (10-20 ml) in a mortar and
pestle. The extract was centrifuged at 8000 rpm for 20 min and the supernatant was
filtered through 0.22 µ membrane filter (Millipore Pvt. Ltd., India). The appropriately

Chapter: 4, Section: 4.2
FOS based Gulab jamun 108
diluted samples were analyzed using HPLC (SCL-6B, Shimadzu, Japan) (section 2.2.3.5)
(Sangeetha et al., 2002).
4.2.2.8. Sensory Analysis
4.2.2.8.1. Physical set up
The laboratory consisted of individual booths equipped with fluorescent lights to
provide daylight illumination without shadows on the table of each booth, temperature
was maintained at 22±2 °C, and free from noise and odor.
4.2.2.8.2. The panel
The panel consisted of 15 members of both sexes aged 25 to 55, were selected on
the basis of their sensitivity to the basic color, taste, odor and texture as well as their
experience as panelists for the sensory analysis of various products.
4.2.2.8.3. Scaling method
Quantitative descriptive analysis (QDA) of intensity scaling was followed (Stone
and Sidel, 1998). The score card consisted of 15 cm QDA scale wherein 1.25 cm was
anchored as low and 13.75 cm as high. A panel of 15 people was asked to mark the
perceived intensity of the attribute by drawing a vertical line on the scale and writing the
code numbers. Gulab jamuns were served in porcelain bowls with 3 digit codes in a
randomized order, one at a time. The selected members were familiarized with texture
terminology and texture profiling through model systems in 6 sessions. Panelists were
asked to describe terms, as they found applicable and an open discussion was held to
finalize the descriptor as per the well known guidelines given by Dravnieks (1985) and
Jowitt (1974). The common descriptors selected by at least one third of the panel were
utilized for the development of score card. They were further trained with the actual
product to be evaluated by including some extreme variations of the product in the
sessions. Thus, the scale variations were looked into to understand each one of the
attributes by the panel-in-training. One of the products in every group was always
duplicated for the purposes of using it as a built in control. The difference between the

Chapter: 4, Section: 4.2
FOS based Gulab jamun 109
coded controls was used for monitoring the panel performance. The data were analyzed
and used to generate sensory profile by plotting sample mean scores over attributes (Ravi
et al., 2002).
4.2.2.9. Ultrastructure by Scanning Electron Microscope (SEM)
Structural analyses of gulab jamun sweetened with FOS, sucrose and a blend of
FOS and sugar syrup were carried out using SEM (Leo 435 VP, Leo Electron
Microscopy Ltd. (Zeiss), Cambridge, U.K). The detailed protocol for the preparation of
samples is given in section 2.2.3.6. Gold-coated samples were examined at 100x and
500x magnifications.
4.2.2.10. Storage studies
Gulab jamuns sweetened with FOS, sucrose and a blend of FOS and sugar syrup
were stored at ambient temperature (25±2 °C) in glass bowls covered with glass lid. The
shelf stability in terms of microbial load was determined initially, on 2nd and 4th day of
storage by standard plate count method (APHA, 1967). A known volume of serially
diluted samples were plated on plate count agar (PCA), potato dextrose agar (PDA) and
McConkey agar (MCA). The PDA plates were incubated at 25 °C for 48 h. The PCA and
MCA plates were incubated at 37 °C for 24 h. The colonies were counted and expressed
as cfu/g of samples.
4.2.2.11. Statistical analysis
Means were established using one-way analysis of variance (ANOVA). Statistical
software (Origin 6.1) was used to test the least significant differences (P<0.05) at 5%.
Correlation between sensory and instrumental texture parameters were established using
Pearson’s product moment correlation ‘r’ values (P<0.05)

Chapter: 4, Section: 4.2
FOS based Gulab jamun 110
4.2.3. Results and discussion
4.2.3.1. Moisture content and water activity (aw) of gulab jamun
Moisture content and aw are important quality parameters of food which has a
bearing on food safety, stability, quality and physical properties (Lewicki, 2004). Both aw
and moisture content have a significant bearing on the texture of finished products and its
properties (Cornillon and Salim, 2002). The moisture content of all the gulab jamuns was
found to be 34.38% - 36.89% initially, and was 31.76% - 33.39% at the end of storage
period. The loss of moisture content of gulab jamun sweetened with FOS, a blend and
sugar syrup over a period of 4 days of storage was found to be 2.03%, 2.62% and 3.13%
respectively. The aw of gulab jamuns sweetened with FOS, a blend and sugar syrup was
0.90, 0.91 and 0.92 respectively on 4th day of storage. It was observed that the moisture
loss in FOS sweetened gulab jamun was low when compared with that of blend and
sucrose sweetened gulab jamun. Thus the aw was found to be maintained throughout the
storage in FOS sweetened gulab jamun.
4.2.3.2. Colour
Fig 4.2.2, Fig 4.2.3 and Fig 4.2.4 show the L*a*b* values of gulab jamun
sweetened with FOS, blend and sucrose respectively. L* value represents the changes in
lightness of gulab jamun. All the samples exhibited decreased L* values, may be due to
the temperature (165±2 °C) of the frying medium, which is also related to Maillard
reaction and caramelization (Carabasa and Ibarz, 2000). Lightness value of gulab jamun
depends also on many factors such as composition of products, the extent of non-
enzymatic browning, nature of sugar syrups used etc. On the other hand the observed
minor difference in lightness values is probably due to the colour of sugar syrups used.
The colour of milk and milk products undergoing Maillard browning is characterized by
two primary hues viz., red and yellow. The brownness of gulab jamun under present
study is due to the combination of redness (positive value of a*) and yellowness (positive
b*). There were no observable changes in the a* and b* values of all the samples
throughout the storage.

Chapter: 4, Section: 4.2
FOS based Gulab jamun 111
0
5
10
15
20
25
L a b
L*a
*b*
va
lues
FOS Blend Sucrose
Fig 4.2.2 Colour (L*a*b* values) of freshly prepared gulab jamun sweetened with FOS,
blend of FOS-sucrose and sucrose
0
5
10
15
20
25
L a b
L*
a*
b*
valu
es
FOS Blend Sucrose
Fig 4.2.3 Colour (L*a*b* values) of gulab jamun sweetened with FOS, blend of FOS-
sucrose and sucrose, at the end of 2nd day of storage at ambient temperature (25±2 °C)

Chapter: 4, Section: 4.2
FOS based Gulab jamun 112
Fig 4.2.4 Colour (L*a*b* values) of gulab jamun sweetened with FOS, blend of FOS-
sucrose and sucrose, at the end of 4th day of storage at ambient temperature (25±2 °C)
4.2.3.3. Texture Profile Analysis (TPA)
The most recurrent parameters among food texture attributes are hardness,
adhesiveness, springiness, cohesiveness gumminess and chewiness. Texture is widely
recognized as an important quality attribute for product acceptability affecting consumer
perception. TPA is a “two-bite” test, which includes the first and second compression
cycles. The first and second compression cycles indicate the force versus time data during
the first and second compression of the product by the instrument probe. Representative
values for most important texture attributes of gulab jamun sweetened with FOS, blend
and sucrose are given in Table 4.2.1.
Hardness is defined as the peak force of the first compression of the product and
is determined as the force required to compress a substance between molar teeth or
between tongue and palate. The hardness values were slightly higher (P<0.05) in case of
FOS and a blend of FOS and sucrose sweetened gulab jamuns than that of jamun
sweetened with sucrose throughout the storage period (Table 4.2.1) as indicated by
0
2
4
6
8
10
12
14
16
18
20
L a b
L*
a*b
*v
alu
es
FOS Blend Sucrose

Chapter: 4, Section: 4.2
FOS based Gulab jamun 113
ANOVA. This could be due to the presence of higher oligosaccharides in FOS sweetened
gulab jamun.
Adhesiveness is also referred as stickiness. It is defined as the negative force area
for the end of the first bite, representing the work necessary to pull the plunger away
from the food sample. Adhesiveness of FOS sweetened gulab jamun was higher as
compared to that of gulab jamun sweetened with a blend and sucrose throughout the
storage. The increase in adhesion in gulab jamun may be due to the maintenance of free
moisture by oligosaccharide components during storage. FOS is highly hygroscopic in
nature and as the degree of polymerization increases, the water holding capacity also
increases (Prapulla et al., 2000).
The distance that the food recovered in its height during the time that elapsed
between the end of the first bite and the start of the second bite is defined as springiness
(Bourne, 1978). A slight decrease in springiness values of all the samples was observed
on 2nd and 4th day of storage period. Cohesiveness is determined as the degree to which a
substance is compressed between the teeth before it breaks. There were no significant
difference (P>0.05) in the cohesiveness values of the conventionally prepared (sucrose)
gulab jamun and those with FOS and a blend.
Gumminess is the energy required to disintegrate a food to a state ready for
swallowing. FOS sweetened gulab jamun had slightly higher values for gumminess as
compared to jamun sweetened with a blend and sucrose during storage. Chewiness is the
length of time required to masticate the sample at constant rate of force application to
reduce it to a consistency suitable for swallowing. No significant difference (P>0.05) was
observed in the chewiness values of FOS, a blend and sucrose sweetened gulab jamun.
The texture of the gulab jamun depends on the consistency of dough, frying temperature
etc. (Madhura et al., 2009). The type and concentration of syrup used also greatly affects
the texture of the final product.

Chapter: 4, Section: 4.2
FOS based Gulab jamun 114
Table 4.2.1 Texture profile analysis of gulab jamun sweetened with FOS, blend ((FOS
and sucrose) and sucrose
Quality
Parameters
Storage days FOS Blend Sucrose
Hardness
(N)
0 8.97±0.63 6.35±0.83 6.00±1.51
2 9.10±0.15 6.10±0.42 5.97±0.48
4 10.90±0.43 8.90±0.29 6.41±0.26
Adhesiveness
(N)
0 -0.50±0.59 -0.24±0.06 -0.27±0.60
2 0.69±0.01 0.39±0.01 0.50±0.03
4 0.73±0.02 0.50±0.01 0.48±0.01
Springiness
(mm)
0 3.14±0.60 3.35±0.17 3.12±0.09
2 2.19±0.17 2.70±0.01 2.49±0.19
4 2.32±0.12 2.66±0.15 2.67±0.05
Cohesiveness
(ratio)
0 0.16±0.01 0.19±0.01 0.20±0.01
2 0.18±0.01 0.20±0.01 0.17±0.01
4 0.18±0.01 0.18±0.01 0.18±0.01
Gumminess
(N)
0 1.49±0.17 1.23±0.19 1.18±0.01
2 1.92±0.05 1.12±0.10 1.03±0.02
4 1.80±0.10 2.32±0.09 1.18±0.02
Chewiness
(N mm)
0 4.68±0.49 4.17±0.49 3.69±0.10
2 4.20±0.12 4.20±0.12 3.78±0.18
4 4.81±0.06 4.84±0.24 3.79±0.05
Means ± Standard error mean (n=3)

Chapter: 4, Section: 4.2
FOS based Gulab jamun 115
4.2.3.4. Ultrastructure by Scanning Electron Microscope (SEM)
The microstructural studies have been used by food scientists for studying the
internal structure of a wide variety of food products since 1950. In recent years, scanning
electron microscopy (SEM) has gained considerable importance in the study of surface
topology and to develop correlations between the structure and the physical appearance
of various food materials. According to Bourne (2002), texture of foods is derived from
their microstructure.
The microstructure of the gulab jamun sweetened with FOS, a blend and sucrose
is shown in the Fig 4.2.5. A well-defined compact network was found in gulab jamun
sweetened with FOS (Fig 4.2.5a and Fig 4.2.5b) and a blend of FOS and sucrose (Fig
4.2.5c and Fig 4.2.5d). Whereas loosely arranged structures with air pockets were
observed in case of sucrose sweetened gulab jamun (Fig 4.2.5e and Fig 4.2.5f). This
indicates slight hardness of gulab jamun sweetened with FOS and a blend when
compared with sucrose sweetened gulab jamun. Lack of a well defined 3-D
microstructure in burfi and kalakand prepared using low calorie sweeteners as against
that of sucrose has been reported (Arora et al., 2008; Arora et al., 2007) which is related
to decreased hardness in the texture. In the present study, it was observed that the texture
and the microstructure of gulab jamuns sweetened with FOS and blend of FOS and
sucrose was similar to that of burfi and kalakand prepared with sucrose. This indicates
FOS maintains the structure of gulab jamun because of its water binding ability as in case
of sucrose and it provides enhanced stability. Based on the SEM study along with results
obtained from texture analysis, it can be inferred that sucrose can be replaced partially or
fully with FOS to prepare gulab jamun and has the potential to be highly acceptable by
the consumer.

Chapter: 4, Section: 4.2
FOS based Gulab jamun 116
Fig 4.2.5(a); Gulab jamun with FOS (100x) Fig 4.2.5(b); Gulab jamun with FOS(500x)
Fig 4.2.5(c); Gulab jamun with F+S (100x) Fig 4.2.5(d); Gulab jamun with F+S (500x)
Fig 4.2.5(e); Gulab jamun with sucrose(100x)
Fig 4.2.5(f); Gulab jamun with sucrose(500x)
Fig 4.2.5 Scanning electron micrographs of gulab jamun sweetened with FOS, a blend
(F+S) and sucrose

Chapter: 4, Section: 4.2
FOS based Gulab jamun 117
4.2.3.5. FOS content
The FOS content of the gulab jamun sweetened with FOS and a blend of FOS and
sucrose is shown in the Fig 4.2.6. The freshly prepared FOS sweetened gulab jamun
showed 6.03 g of glucose, 8.70 g of sucrose and 17.60 g of FOS in 100 g of jamun. On
storage at room temperature (4th day), the FOS content slightly decreased. Freshly
prepared gulab jamun sweetened with a blend of FOS and sucrose showed 2.40 g of
glucose, 15.60 g of sucrose and 9.20 g of FOS in 100 g of jamun. The FOS content was
found to be 8.30 g and 7.80 g/100g of jamun on 2nd and 4th day of storage at ambient
temperature (25±2 °C) respectively. Sucrose content of freshly prepared gulab jamun
sweetened with only sucrose was found to be 30.50 g, followed by a slight decrease on
storage.
0
2
4
6
8
10
12
14
16
18
20
Initial 2nd day 4th day Initial 2nd day 4th day
FOS Blend
Glu
cose
,Su
cro
se&
FO
S(g
/10
0g)
Glucose Sucrose FOS
Fig 4.2.6 FOS content of gulab jamun sweetened with FOS and blend
The results indicate that, the sucrose can be replaced with FOS, a healthier food
ingredient in the preparation of traditional Indian sweets. Studies have indicated that FOS
can also be used in the preparation of fruit juice beverages (Renuka et al., 2009) and it
can be an alternative non-nutritive sweetener without any adverse effect on various
diabetic related metabolic parameters (Mabel et al., 2008).

Chapter: 4, Section: 4.2
FOS based Gulab jamun 118
4.2.3.6. Sensory quality
The sensory attributes of gulab jamun prepared using three different syrups were
evaluated. There was no significant differences (P>0.05) in brownness, softness,
chewiness, mealiness, milkyness and juiciness of the gulab jamun sweetened either with
FOS or blend, when compared with that of sucrose sweetened gulab jamun (Fig 4.2.7).
0
2
4
6
8
10
12
14
Brown
Softness
Chewiness
Mealiness
Juiciness
Milky
Fermented
Jamun sweetness
Juice sweetness
Overall quality
Gulab jamun sweetened with sucrose
Gulab jamun sweetened with FOS
Gulab jamun sweetened with blend of sucrose + FOS
Fig 4.2.7 Profilogram of gulab jamun sweetened with FOS, blend and sucrose
In terms of sweetness perception, the panelist rated FOS sweetened gulab jamun
towards slightly lower sweetness in comparison with those of blend and sucrose
sweetened gulab jamun. However, all the jamuns sweetened with FOS, blend and sugar
syrup showed score of more than 10 (on a score range of 0-15), which is generally
regarded as highly acceptable, indicating the suitability and also the acceptance of FOS
for the preparation of gulab jamun. In addition, FOS sweetened gulab jamun will have an

Chapter: 4, Section: 4.2
FOS based Gulab jamun 119
added advantage over that of sucrose sweetened gulab jamun from the point of low
calorie, non digestibility and other well known health benefits.
4.2.3.7. Correlation between sensory and instrumental texture parameters
Relationship between sensory and instrumental textural parameters was
established using “r” values. Results have indicated sensory brown is highly correlated
negatively with overall quality (OQ) (-0.83) and sensory softness with instrumental
springiness (-0.90). Juiciness was correlated negatively with cohesiveness (-0.96). On the
other hand, OQ was mostly influenced by instrumental hardness values (-0.88).
Instrumental gumminess, cohesiveness and chewiness were correlated with OQ with
0.94, -0.90, and -1.0 respectively.
4.2.3.8. Shelf life of gulab jamun
Gulab jamun sweetened with FOS, blend and sucrose was found to be stable at
ambient temperature (25±2 °C) for 4 days. There were no coliforms and fungal colonies
observed on MCA and PDA plates respectively. This is indicative of the microbiological
quality of the prepared gulab jamuns. The number of total viable count on plate count
agar (PCA) plates per gram of gulab jamun sweetened with FOS, blend and sucrose were
19 x 104, 22 x 104 and 23 x 104 respectively.
From this study, it can be concluded that FOS syrup can be an effective
replacement either fully or partially for the preparation of gulab jamun without much
changes in the physicochemical characteristics and sensory attributes of the same. The
present investigations have given all the positive indications for the use of FOS in the
preparation of gulab jamun. The change in life style has been the causative agent for the
increase in the number of diabetics all over the world. With this present scenario it would
be most welcoming to have healthier alternatives to sucrose.

Chapter: 5
Isolation and characterization of probiotic LAB 120
CHAPTER: 5
ISOLATION AND CHARACTERIZATION OF POTENT PROBIOTICSFROM FRUITS AND VEGETABLES

Chapter: 5
Isolation and characterization of probiotic LAB 121
5.1. Introduction
The isolation and screening of microorganisms from natural sources have always
been the most powerful means for obtaining useful and genetically stable strains for
industrially important products. Lactic acid bacteria (LAB) are the first and largest group
of microorganisms to be regarded as probiotics (Mombelli and Gismondo, 2000) and are
important in the food and dairy industries because the lactic acid and other organic acids
produced by these bacteria act as natural preservatives as well as flavour enhancers. Their
probiotic effect is accredited to their production of metabolic byproducts such as acid,
hydrogen peroxide, and bacteriocins (e.g. lactocidin and acidophilin) that manifest
antibiotic properties and inhibit the growth of a wide spectrum of pathogens such as
Escherichia coli, Klebsiella, Enterobacter, Pseudomonas, Salmonella, Serratia and
Becteroides (Krasaekoopt et al., 2003; Chen and Yao, 2002). LAB finds increasing
acceptance as probiotics which aid in stimulation of immune responses, reduction of
serum cholesterol, and alleviation of lactose intolerance, enhancement of resistance
against pathogens and prevention of traveler’s diarrhea (Reid, 2006).
A particular microorganism has to fulfill a number of specific properties for it to
be regarded as a probiotic strain. These properties are dependent on its specific purpose
and on the location on which the specific property has to be expressed. Considerable
beneficial properties/functions offered by the probiotics have resulted in a boom in the
market volume of probiotics (Brashears et al., 2003; Hamilton-Miller, 2003).
Taxonomy of LAB genera has also undergone considerable changes since the
time of Orla-Jensen (1919), resulting in the genera listed in Table 5.1. Such taxonomic
knowledge of a strain may, therefore, give an indication of the strain’s origin, habitat, and
physiology, and have important consequences for the selection of novel strains for
application in food fermentation or for use as a probiotic. The first step in an organism or
product being referred to as a probiotic is to identify and characterize the organism to
genus and species level. For identification of LAB, phenotypic methods have been most
commonly used (Corsetti et al., 2001). More recently, genetic techniques, such as 16S
rDNA sequencing have been developed which allows a more consistent and accurate
identification of individual strains (Buddhiman et al., 2008). New tools for classification
and identification of LAB are underway (Sascha and Magdalena, 2010).

Chapter: 5
Isolation and characterization of probiotic LAB 122
Traditional phenotypic characterization of probiotic bacteria is rather tedious and
not always reliable since certain species cannot be distinguished by these methods.
Molecular techniques have emerged as a replacement or complement to traditional
phenotypic tests for comparing strains or species of probiotic bacteria. Amongst these
methodologies, sequence analysis of the 16S rRNA gene (Kullen et al., 2000; Ward et
al., 1990) and 16-23S internally transcribed spacer regions (Tannock et al., 1999) have
proven to be useful tools for identification. DNA pulsed-field gel electrophoresis (PFGE)
is also an efficient means for differentiating strains (O’Riordan and Fitzgerald 1997).
LAB is of essential importance as starter cultures in fermented food industries (Robert,
2008; Guasch-Jane et al., 2005). Various metabolic and enzymatic activities of LAB lead
to production of volatile substances, which contribute to flavor, aroma and texture
developments (Soukoulis et al., 2007; Kleerebezemab et al., 2000). The ability of LAB to
produce prebiotics and stimulation of the immune system (Kalliomäki et al., 2001) render
this group of microorganisms most essential in dairy industry.
Table 5.1 Examples of probiotic microorganisms
Lactobacillus species
L. acidophilus, L. amylovorus, L. casei, L. crispatus, L. delbrueckii sub sp. bulgaricus, L.
gallinarum, L. gasseri, L. johnsonii, L. paracasei, L. plantarum, L. reuteri, L. rhamnosus
Bifidobacterium species
B. adolescentis, B. animalis, B. bifidum, B. breve, B. infantis, B. lactis, B. longum
Other lactic acid bacteria
Enterococcus faecalis, Enterococcus faecium, Lactococcus lactis, Leuconstoc mesenteroides,
Pediococcus acidilactici, Sporolactobacillus inulinus, Streptococcus thermophilus
Non-lactic acid bacteria
Bacillus cereus var. Toyoi, Escherichia coli strain nissle, Propionibacterium freudenreichii,
Saccharomyces cerevisiae, Saccharomyces boulardii
*Source: Holzapfel et al., 1998
.

Chapter: 5
Isolation and characterization of probiotic LAB 123
LAB possessing the generally regarded as safe (GRAS) status find application in
the production of food and feed. Food fermentation has been shown to have not only
preservative effects and ability to modify the physico-chemical properties of various
foods, but also the capability to provide significant impact on the nutritional quality and
functional performance of the raw material (Knorr, 1998). This offers a possibility to
explore the use of probiotics as functional starters for the manufacture of fermented
foods. Functional starters are defined as cultures that possess at least one inherent,
functional property, aimed at improving the quality of the end product (De Vuyst, 2000).
Certain LAB strains are characterized by their ability to transform lactose and improve
the digestibility of fermented dairy products (Weinberg et al., 2007) as well as their
preservation (Abdelbasset and Djamila, 2008).
The increasing application of probiotics in food products underscores the need to
properly identify and distinguish these beneficial bacteria among the originally presented
microbial population. Moreover, certain probiotic activities are strain-specific and thus,
identification of probiotics to the strain level is most essential. Therefore, isolation,
characterization and identification of the microorganisms with a prospective selection of
probiotic LAB are important to support the technical process and to obtain a food product
with a desired quality.
Probiotics are a feasible solution against gastrointestinal infections. An important
number of bacterial strains are used for this purpose (Gibson et al., 2000). The genus
Enterococcus could be an alternative in the search for probiotics. In some studies E.
faecium showed antagonistic effect against some bacteria, and it is of great relevance to
look for other species, from the same genus, with probiotic characteristics (Audisio et al.,
2000; Audisio et al., 1999; Laukova et al., 1998). The main aim of this chapter was to
characterize the diverse phenotypes of Enterococcus sps isolated from fruits and
vegetables.

Chapter: 5
Isolation and characterization of probiotic LAB 124
5.2. Materials and Methods
5.2.1. Isolation of probiotic LAB from fruits and vegetables
LAB were isolated from fresh fruits and vegetables (banana, sapota, star fruit,
beans, brinjal, carrot, cucumber, drum stick, radish, tomato) procured from local market
(Mysore, Karnataka). Fruits and vegetables were cut into small pieces and suspended (10
g) in 90 ml sterile saline (0.85% NaCl) and incubated at 37 oC under static micro aerobic
conditions for 3-4 days. Fermented samples were drawn aseptically each day and were
serially diluted. The appropriate dilutions were plated on de Man Rogosa Sharpe (MRS)
agar, incubated for 24-48 h at 37 oC. The plates were examined for well isolated colonies.
Based on the difference in morphological characteristics of the colony on MRS
agar, individual colonies were randomly picked and inoculated in to MRS broth. Purity of
the isolates was established by taking a loopful of the culture from the broth and
streaking on MRS agar plates and also by microscopic observation. The pure colonies
were used for further studies.
5.2.2. Identification of the selected isolates
5.2.2.1. Morphology by Gram staining
Gram staining is an empirical method of differentiating bacterial species into two
large groups (Gram-positive and Gram-negative) based on the chemical and physical
properties of their cell walls (BSOPTP 39 - Staining Procedures). The bacterium isolated
from fruits and vegetables were Gram stained and observed under the microscope. Those
bacteria that hold on to primary dye iodine complex and remain violet are Gram positive
and those which get decolorized and subsequently take up counter stain (pink/red) are
Gram negative.
5.2.2.2. Catalase test
The test was carried out by placing a drop of 3% (v/v) hydrogen peroxide (H2O2)
(NICE chemicals, Mumbai) on a clean microscopic slide containing a smear of 24 h old
culture and it was allowed to react for 30 sec (Cappuccino and Sherman, 2004). The

Chapter: 5
Isolation and characterization of probiotic LAB 125
bubbles or froth formed from the organism was recorded as catalase-positive and catalase
negative for the absence of bubbles.
Out of 40 isolates screened, 17 were found to be gram positive and catalase
negative, which are the characteristic feature of LAB. Probiotic properties of these 17
LAB were evaluated by in vitro methods.
5.2.3. In vitro evaluation of probiotic properties of selected LAB
5.2.3.1. Acid tolerance
Tolerance to low pH was tested for 17 isolates as described by Yeong et al.,
(2002). The isolates were activated thrice in MRS broth at 37 oC for 12-15 h each time
and the active culture with an optical density of 0.280 at 600 nm was inoculated (10%
v/v) to MRS broth modified with 0.1N HCl to pH values of 2.0, 2.5 and 3.0 and
incubated at 37 °C for 4 h. The viable cells count from 0 h to 4 h were determined by
plating serial decimal dilutions (10-2 to 10-6) of samples in saline (0.85% NaCl) on MRS
agar, incubated at 37 °C for 24-48 h. The survival rate was calculated using the formula
as, the percentage of colonies grown on MRS agar compared to the initial bacterial
concentration (Fuller, 1989).
% Survival = log number of viable cells survived (cfu/ml) x100------------------------ (1)
log number of initial viable cells inoculated (cfu/ml)
5.2.3.2. Bile tolerance
For the bile tolerance test, 17 LAB isolates were cultured and treated similarly to
the MRS broth as described in the section 5.2.3.1, except that the acid was replaced by
0.3%, 0.6%, and 1.0% (w/v) bile salt respectively. Samples were incubated under the
same conditions and viable cell counts from 0-4 h were determined as described above
(section 5.2.3.1) (Yeong et al., 2002).

Chapter: 5
Isolation and characterization of probiotic LAB 126
5.2.3.3. Viability of selected LAB isolates in synthetic gastric juice (SGJ)
The transit tolerance through simulated gastric juice was determined according to
the method of Cotter et al., (2001). The LAB isolates showed >75% survivability at pH
2.0 and 1.0% bile salt were further tested for survivability in SGJ (8.3 g of protease
peptone, 3.5 g of glucose, 2.05 g of NaCl, 0.6 g of KH2PO4, 0.11 g of CaCl2, 0.37 g of
KCl, 0.05 g of bile, 0.1 g of lysozyme and 13.3 mg of pepsin; composition is per litre).
The pH of the prepared medium was adjusted to pH 2.5 with 1N HCl. The media was
filter sterilized (Pedersen et al., 2004) using 0.22 µm membrane filter (Millipore, India).
The isolates were activated thrice in MRS broth at 37 oC for 12-15 h each time and the
active culture (1 ml) with an optical density of 0.280 at 600 nm was inoculated (10% v/v)
to SSJ (9 ml). The 0-4 h sample of each isolates was drawn (1 ml), serially diluted with
sterile saline (10-2 to 10-6) and plated on MRS agar plates, incubated at 37 oC for 24 h.
The viable cell counts were determined as detailed in the section 5.2.3.1.
5.2.3.4. Cell surface hydrophobicity
The bacterial adhesion to hydrocarbons (BATH) test was performed to assess the
adherent ability of the 6 LAB isolates for their cell surface hydrophobicity, using a
hydrocarbon- xylene as described by Canzi et al., (2005) with some modifications. 10 ml
of 12 h grown LAB cells were harvested by centrifugation at 6500 rpm for 5 min at 4 °C,
washed twice with phosphate buffer saline (PBS: 140 mM NaCl, 3 mM KCl, 8 mM
Na2HPO4, 2 mM KH2PO4, pH 7.2) and re-suspended in the same buffer. The cell
suspension was adjusted approximately to the value of 1.0 at absorbance of 600 nm.
Briefly 0.6 ml of hydrocarbon was added to 3 ml of bacterial suspension and mixed
thoroughly using vortex for 2-3 min and the two phases were allowed to stand for 1 h at
37 °C for phase separation. The bottom aqueous phase was removed carefully and its
absorbance at 600 nm was measured. The decrease in optical density (OD) correlates
with the hydrophobicity of the strain. The decrease in absorbance of the aqueous phase
correlates with the measure of the cell surface hydrophobicity (H %), calculated using the
formula,
Cell surface hydrophobicity H% = [(Ao-A)/Ao] X100 ----------------------------------- (2)
Where, Ao and A are the absorbance before and after extraction with xylene respectively.

Chapter: 5
Isolation and characterization of probiotic LAB 127
5.2.3.5. Antibacterial test
The antagonistic activity of the LAB isolates (Cu8 and R32) resistant to SGJ and
showed good adherent ability to mucosal surface was determined against well known
food borne pathogens (Micrcoccus, Staphylococcus aureus FR1722, Escherichia coli
MTCC118, Listeria murrayi FB 69, Aeromonas hydrophila B445, Salmonella paratyphi
FB254, Salmonella typhii FB231, Yersinia enterocolotica MTCC859, Listeria innocua
FB 21, Listeria monocytogenus Scott A, and Bacillus cereus F4433) by agar well
diffusion method as described by Jacobsen et al., (1999). The isolates grown in MRS
broth, with an optical density of 0.280 was centrifuged at 8000 rpm at 4 oC for 15 min.
The culture filtrate (CF) was neutralized with 0.1 N NaOH, and 50 μl of neutralized CF
poured to MRS agar wells for checking its antagonistic activity against these food borne
pathogens. One ml of the indicator pathogens in nutrient broth was mixed with 7 ml of
soft agar (0.7%) and overlayed immediately over the MRS agar on which the CF were
inoculated. The plates were incubated aerobically at 37 oC for 24 h and the diameter of
zone of inhibition was measured in millimeter (mm). The zone of inhibition around the
wells indicates positive (+) for antibacterial activity while the absence of zone indicates a
negative (-) result.
5.2.3.6. Antibiotics susceptibility test
Antibiotic resistance of selected LAB isolates (Cu8 and R32) was assessed by
paper disc method using antibiotic discs (HiMedia Pvt. Ltd., Mumbai, India) (Reddy et
al., 2007). The antibiotic discs were placed on MRS agar plates previously seeded with
active culture. The plates were incubated at 37 °C for 24-48 h, after which zones of
inhibition were examined. The diameter of the zone of inhibition was measured and
expressed in mm. The susceptibility of the strains was expressed as described by
Charteris et al., (1998b).
5.2.3.7. Carbohydrate utilization test
The selected LAB isolates (Cu8 and R32) were characterized according to their
ability to ferment a range of different carbohydrates using KB009 HiCarbohydrateTM kit
(HiMedia, Mumbai, India). The different carbohydrates tested include Lactose, Xylose,

Chapter: 5
Isolation and characterization of probiotic LAB 128
Maltose, Fructose, Dextrose, Galactose, Raffinose, Trehalose, Mellibiose, Sucrose, L-
Arabinose, Mannose, Inulin, Sodium gluconate, Glycerol, Salicin, Glucosamine, Dulcitol,
Inositol, Sorbitol, Mannitol, Adonitol, α-methyl D-glucoside, Ribose, Rhamnose,
Cellobiose, Melezitose, α methyl D- mannoside, Xylitol, ONPG (ortho- nitro phenol β-
galactopyranoside), Esculin, D-Arabinose, Citrate, Malonate, and Sorbose. The active
culture was centrifuged at 8000 rpm at 4 oC for 10-15 min. Supernatant was discarded
and the cell pellet was added with sterile saline and again centrifuged. The sterile saline
was added to the cell pellets obtained after centrifugation, mixed well (vertexed) to get
uniform suspension and used for inoculating the kit. The kit was opened aseptically in
laminar air flow chamber. Inoculum (50 µl) was transferred to each well of KB kit by
surface inoculation method. Lid was replaced carefully and the kit was incubated at 37 oC
for 24-48 h. Interpretation of the result was based on the KB009 HiCarbohydrateTM kit
interpretation chart.
5.2.3.8. Thermotolerance, growth at high salt concentration and sodium azide test
The LAB isolates (Cu8 and R32) were aseptically inoculated to sterile MRS broth
tubes and subjected to heat treatment at temperatures 60 oC and 70 oC for 30 min. Heat
treated Cu8 and R32 tubes were incubated at 37 oC for 24 h and growth was observed
visually (turbidity).
Requisite quantity of MRS broth tubes with the addition of sodium chloride
(NaCl; 10%) and sodium azide [0.04% (w/v)] was prepared. The active cultures of each
isolates (Cu8 and R32) were aseptically inoculated to the sterile MRS broth with added
salts. The tubes containing 10% NaCl and 0.04% sodium azide were subjected to 50 oC
and 37 oC for 24 h respectively. The change in colour of the broth, incubated at 37 oC for
24 h indicates positive for sodium azide test and the turbidity on the 10% NaCl tubes
incubated at 50 oC indicates positive for the test.

Chapter: 5
Isolation and characterization of probiotic LAB 129
5.2.4. Genotypic identification
5.2.4.1. Isolation of chromosomal DNA
The total genomic DNA of the LAB isolates was extracted from active cultures
grown in MRS broth as described by Mora et al., (2000) with slight modification. The
cells were harvested by centrifuging at 8000 rpm for 10 min (4 °C), followed by washing
the cell pellet thrice with 0.4 ml TE buffer [Tris 10mM (pH 8.0), EDTA 1mM (pH 8.0)]
containing 15 l of lysozyme (0.45 mg lysozyme/ml ) and incubated at 37 °C for 1 h. The
20% SDS solution (15 µl) and proteinase K (15 µl) were added to the digested cells and
incubated at 55 oC for 15 min. The mixture was extracted with Tris saturated phenol (250
µl) followed by phase separation by centrifugation at 8000 rpm for 15 min (4 °C). The
aqueous phase was removed, extracted with chloroform and precipitated with 15 l
sodium acetate (3 M, pH 4.8) and 400 l ethanol (95%) by incubating at -20 °C for 30-60
min. The precipitate was harvested by centrifugation at 10,000 rpm for 20 min. The pellet
was washed with 70% ethanol and centrifuged at 10000 rpm for 15 min (4 °C), air dried
and resuspended in 50 l TE buffer. The quality of isolated DNA was checked by
electrophoresis using 0.8% agarose gel in 1X TAE buffer.
5.2.4.2. Analysis of chromosomal DNA by agarose gel electrophoresis
Agarose gel electrophoresis is a method used to separate DNA or RNA molecules
by their size and charge. The standard DNA marker (3 µl) (MBI Fermentas, Lithuania)
and the DNA samples of isolates (5 µl) were mixed with loading dye and loaded in
subsequent wells in an agarose gel (0.8% agarose, dissolved in 1X TE buffer) placed in
the electrophoresis tank filled with 1X TAE buffer. Electrophoresis was carried out at 90
volts for about 45 minutes or until the DNA samples containing the dye travel 1/2 to 3/4
of the way down the gel. The gel was removed from the tank and stained by placing in a
solution of 0.5 g/ml ethidium bromide for 10-15 min. The gel was de-stained in distilled
water for 10 min, examined on a UV transilluminator (Photodyne, USA) and
photographed using gel documentation system (Gel Doc EQ, Biorad, USA).
Chapter: 5
Isolation and characterization of probiotic LAB 130
5.2.4.3. Polymerase Chain Reaction (PCR)
PCR was carried out to amplify the targeted 1.4 kb 16S rRNA gene. The PCR
reaction mixture has the following composition.
Components used in PCR reaction mixture:
Nuclease free water : 14.0 µl
10x reaction buffer (100 mM Tris, pH 9.0,
500 mM KCl, 15 mM MgCl2 and 0.1% gelatin) : 2.5 µl
dNTP mixture (10 mM) : 5.0 µl
Taq DNA polymerase : 0.5 µl
Primer : 1.0 µl
Template DNA/Genomic DNA : 2.0 µl
Total volume : 25.0 µl
Primer sequence: (Bangalore genie)
Forward sequence- 51GAG TTT GAT CCT GGC TCA GG 31
Reverse Sequence- 31TCA TCT GTC CCA CCT TCG GC51
The master mixture was prepared by mixing all the components except template
DNA and sterile water. This master mixture was taken in PCR tubes containing template
DNA and sterile water. The contents of the tubes were mixed by brief spin in a
microcentrifuge. The tubes were then placed in thermocycler GeneAmp PCR System
9700 (Perkin-Elmer, USA) and the reaction parameters were as follows.
Initial denaturation: 94 °C for 4 min
Denaturation: 94 °C for 1 min
Annealing: 50 °C for 1 min 34 cycles
Extension: 72 °C for 1 min
Final extension: 72 °C for 10 min

Chapter: 5
Isolation and characterization of probiotic LAB 131
5.2.4.4. Analysis of PCR products by agarose gel electrophoresis
The PCR products were analyzed by using 1.5% agarose gel electrophoresis. The
amplified PCR product (10 µl) was mixed with 2 µl of loading dye and loaded in
subsequent wells in an agarose gel (1.5% agarose, dissolved in 1X TE buffer containing
ethidium bromide solution 10 µg/ml) placed in the electrophoresis tank filled with 1X
TAE buffer.
Electrophoresis was carried out at 70 volts for 60 min or until the samples
containing the dye travels to 3/4 of the way down the gel. The gel was visualized under
UV light and photographed using gel documentation system (Gel Doc EQ, Biorad). The
size was confirmed by comparing with 3 Kb ladders which was used as a molecular size
standard.
5.2.4.5. Purification of PCR product
The PCR product to be ligated in vector of selected isolates was gel-purified by
using Sigma GenElute PCR clean up kit. The amplicon from the gel was excised with a
sterile sharp scalpel and taken in a sterile pre-weighed eppendorfs tube. To one volume of
gel fragment, three volume of solubilization buffer was added (100 mg/300 µl). The
mixture was incubated at 50 oC for 10 min until the gel gets completely dissolved. The
contents in the tube were mixed often for every 2-3 min. Once the gel is completely
dissolved the color of the mixture turns yellow.
The contents of the tubes were mixed, spinned and the solubilization fluid was
then transferred into the Qiangen’s elution column. The column was centrifuged at
10,000 rpm for 2 min. The flow through was discarded and 750 µl of PE wash buffer was
added to the column which retains the DNA fragment and it was incubated at room
temperature for 10 min. The column was again centrifuged at 10,000 rpm for 2 min and
the flow through was discarded. The PCR product was eluted by adding 20 µl of
deionized sterile water and stored at -20 oC.
5.2.4.6. Confirmation of purified PCR product
The PCR product (3 µl) was run on 0.8% agarose gel electrophoresis to confirm
its concentration and purity.

Chapter: 5
Isolation and characterization of probiotic LAB 132
5.2.4.7. 16S rDNA cloning and transformation
5.2.4.7.1. Cloning 16S rDNA into vector
After purification, 16S rDNA products were cloned into the pGEM-T easy vector
according to the manufacturer's recommendations (Promega Corporation). Ligation
mixture consisted of pGEM-T Easy Vectors (1μl), 2x rapid ligation buffer (5 μl), PCR
product (3 μl), DNA ligase (1μl) (3 Weiss units/μl) and deionized water to a final volume
of 10 μl. The resulting ligation mixture was incubated at 4°C, overnight and after
incubation was transformed in E. coli DH5 cells.
5.2.4.7.2. Preparation of competent cells using CaCl2
Competent cell preparation was carried out as described by Sambrook and Russell
(2001). A single colony of E. coli DH5 cells from a plate, freshly grown for 16-20 h at 37
°C was picked and inoculated into 2 ml of LB broth in test tube, incubated at 37 °C with
shaking. The 250 ml conical flask containing 50 ml of LB broth was seeded with 0.2 ml
of overnight grown culture and was incubated at 37 oC at 225 rpm. The culture was
allowed to grow till the OD600 reached 0.40-0.50. The cells were transferred aseptically to
sterile polypropylene tube and the culture was cooled in ice for 10-15 min. The cells were
harvested by centrifugation at 6000 rpm for 10 min at 4 °C. The media was decanted from
the cell pellet. The cell pellet was re-suspended in 10 ml of ice-cold 0.1 M CaCl2 and stored
in ice for at least half an hour. The cells were harvested by centrifugation at 6000 rpm for
10 min at 4 °C. The supernatant from the cell pellet was decanted and the tubes were kept
in an inverted position for 1 minute to drain the last traces of fluid. The cell pellet was re-
suspended in 2.0 ml of ice-cold 0.1 M CaCl2 and the competent cells were stored at 4 °C
overnight.
5.2.4.7.3. Transformation of competent cells
Transformation of E. coli was carried out by CaCl2 method (Sambrook and
Russell, 2001). The competent cells (200 l) were taken in sterile micro-centrifuge tubes,
10 l of ligation mixture was added to each tube and the contents of the tubes were mixed
by swirling gently followed by keeping the tubes in ice for 30 min. The competent cells
Chapter: 5
Isolation and characterization of probiotic LAB 133
that received standard super coiled plasmid DNA and the competent cells that received no
plasmid DNA were included as control samples. The cells were given a heat shock
treatment by placing the tubes in water bath (45 oC) for 90 sec. The tubes were
immediately transferred to ice and the cells were allowed to cool for 1-2 min. LB broth of
800 μl was added to each tube and the culture was incubated at 37 oC for 12 h at 180 rpm.
The tubes were centrifuged at 6000 rpm for 5 min to concentrate the cells. The
concentrated cells were plated in appropriate selection media.
5.2.4.7.4. Selection of transformants/recombinants
The transformants were selected on LB agar plates. The transformation mixture
(200 μl) was spread on LB agar plates containing 100 g/ml ampicillin, 0.5 mM IPTG and
80 g/ml X-Gal. The control mixture, E. coli competent cells transformed with pGEM-T
easy vector were spread on to LB plates containing ampicillin, X-Gal and IPTG. The plates
were incubated overnight at 37 °C. After incubation the clones that contain PCR products
produce white colonies were selected.
5.2.4.8. Analysis of transformants/recombinants
The transformants were checked for the presence of plasmid by isolating plasmid
DNA and performing 0.8% agarose gel electrophoresis. Restriction digestion experiments
were set up to check for insert release from recombinants.
5.2.4.8.1. Isolation of plasmid DNA from the transformed colonies
The plasmids were isolated from the transformed E. coli cells by alkali lysis
method (Birnboim and Doly, 1979). Single colonies of appropriate strain were inoculated
in 2 ml of LB broth containing required antibiotic and grown overnight in a shaker
incubator at 37 °C and 180 rpm. The overnight culture (1.5 ml) was transferred to a 1.5
ml micro centrifuge tube and the cells were harvested by centrifugation at 10000 rpm for
2 min. After discarding the supernatant, 100 l of solution I (50 mM glucose, 25mM Tris
HCl, pH 8.0; 10 mM EDTA, pH 8.0) was added and mixed thoroughly until no visible
clumps of cells were observed. The samples were kept on ice for 5 min. About 200 l of
freshly prepared solution II (1% SDS, 0.2N NaOH) was added to the tube and mixed

Chapter: 5
Isolation and characterization of probiotic LAB 134
gently by inverting the tubes several times until the lysed cell suspension became clear.
The samples were kept on ice for 5 min, 150 l of ice-cold solution III (5 M potassium
acetate, glacial acetic acid) was added, and tubes were inverted gently. The tubes were
centrifuged at 10000 rpm for 10 min.
The supernatant was transferred to a fresh tube and equal volume of phenol-
chloroform was added and mixed thoroughly. Centrifugation at 10000 rpm for 10 min
separated the two phases. The upper aqueous phase was transferred to a fresh tube and
equal volume of chloroform was added. The tubes were centrifuged at 10000 rpm for 10
min. The upper aqueous phase was transferred to a fresh tube and 2 volumes of absolute
ethanol were added. The tubes were kept at -20°C for 1 h to overnight for precipitation.
The tubes were centrifuged at 10000 rpm for 10 min and the supernatant was discarded.
The pellet was washed with 300 l of 70% ethanol and the air-dried pellet was dissolved
in 20 l of TE buffer. Samples were tested by carrying out agarose gel (0.8%)
electrophoresis along with control plasmid. The isolated plasmid was used for the further
PCR and restriction analysis to confirm the presence of the insert.
5.2.4.8.2. Double restriction digestion of recombinant plasmids for insert release
Restriction enzymes such as Eco RI and Pst I (MBI Fermentas, Lithuania) were
used for double digestion experiment. The following constituents were added to a micro
centrifuge tube in the order stated:
Constituents Volume (l)
Nuclease-free water 13.0
Restriction enzyme 10 x buffer 2.0
Plasmid DNA 3.0
Restriction enzyme 1 (Eco RI) 1.0
Restriction enzyme 2 (Pst I) 1.0
Final volume 20.0

Chapter: 5
Isolation and characterization of probiotic LAB 135
The contents of the tube were mixed gently and the tube was centrifuged briefly at
10000 rpm to collect the contents at the bottom of the tube. The reactions were incubated
at 37 °C for 4-8 h. The samples were analyzed by agarose gel (1.5%) electrophoresis.
5.2.4.9. Sequence analysis
DNA sequencing was carried out using M13F and M13R primers by dideoxy
chain termination method (Sanger et al., 1977). The reaction was carried out in an
automatic DNA sequencer (ABI prism, Applied Biosystems, USA) with fluorescent
dideoxy chain terminators at Bangalore Genie, Bangalore, India. A database search was
performed in GenBank database release 155 using BLAST programme (National Centre
for Biotechnology Information, Maryland, and USA).
5.3. Results and discussion
LAB comprise the natural microflora of the animal and human intestine. When
present in sufficient numbers, these bacteria are able to create a healthy equilibrium
between beneficial and potentially harmful microflora in the gut, preventing intestinal
infection. Therefore, these bacteria have been widely used as a probiotic or as standard
bacterium to screen novel probiotics for humans and animals.
5.3.1. Prevalence of LAB
Out of 40 isolates from fruits and vegetables, 17 isolates were positive for LAB as
confirmed by Gram staining and catalase test (Table 5.2).

Chapter: 5
Isolation and characterization of probiotic LAB 136
Table 5.2 Prevalence of lactic acid bacteria in fruits and vegetables
Fruits/
vegetables
Total
number of
isolates
Total number
of isolates
positive for
gram staining
Total number
of isolates
negative for
catalase test
Total number
and (%) of LAB
isolates
Banana 4 2 2 2 (50.00)
Brinjal 5 2 1 1 (20.00)
Carrot 6 3 5 3 (50.00)
Cucumber 4 4 4 4 (100.00)
Drumstick 3 1 1 1 (33.33)
Pear 5 0 1 0
Radish 4 4 4 4 (100.00)
Star fruit 5 2 2 1 (25.00)
Tomato 4 2 2 1 (20.00)
Total 40 20 22 17 (42.50)
Radish and cucumber showed the highest prevalence of LAB (100%), but no
LAB were isolated from pears. Banana, brinjal, carrot, cucumber, drumstick, star fruit
and tomato showed 20-50% prevalence of LAB. Moreover, the measured prevalence of
LAB differed significantly among sources and fermentation time. The 17 isolates were
coded as B2, S3, Br4, C5, R7, Cu8, B11, R15, D16, Cu17, T18, R24, Cu26, R32, C33,
Cu34, and C37.
5.3.2. Acid and bile salt tolerance
To determine the selection criteria for probiotic properties of the isolated LAB,
their stability on acid and bile, should first be assessed (Klein et al., 1998; Salminen et
al., 1998). One of the most important properties for a probiotic to provide health benefits
is that it must be able to overcome physical and chemical barriers such as acid and bile in
the gastrointestinal tract (Gibson et al., 2000). Therefore, the 17 LAB isolates (B2, S3,
Br4, C5, R7, Cu8, B11, R15, D16, Cu17, T18, R24, Cu26, R32, C33, Cu34, and C37)

Chapter: 5
Isolation and characterization of probiotic LAB 137
were subjected to the effective properties, as prerequisites for probiotics, i.e., tolerance to
low pH (2, 2.5 and 3) and high bile salt concentration (0.3%, 0.6%, and 1.0%), so that the
LAB isolated from different sources would be more likely to colonize in the human
intestine. For a strain to be considered as probiotic, its resistance to acid pH and tolerance
to bile salt are most important (García-Galaz et al., 2004; Prasad et al., 1998). Fig 5.1
and Fig 5.2 shows the percentage resistance of the LAB isolates to low pH and high bile
salt concentration respectively.
All strains showed tolerance to pH 2.0 and 2.5 for 2 h despite variations in the
degree of viability. Cu8, R15, Cu17, Cu26, R32, and Cu34 were the most acid-tolerant
strains, with more than 90% survivability after incubation for 2 h at pH 2.0, while B2, S3,
Br4, C5, R7, B11, D16, T18, R24, C33, and C37 were the most acid-sensitive strains,
with only 80% survivability after the 2 h incubation. In general, there was a greater
reduction in total colony forming units for the strains of B2, S3, br4, D16 compared with
those of Cu8, R15, Cu17, Cu26, R32, and Cu34 for the first hour of incubation. However,
the isolate of Cu8, R15, Cu17, Cu26, R32, and Cu34 showed greater acid tolerance over
the entire incubation period (Fig 5.1), and their counts decreased by >90% to >80% at pH
2.0. These results were compared with L. salivarius CFR 2158, a reference culture from
Central Food Technological Research Institute (CFTRI) culture collection center, which
showed >70% survivability at pH 2.0 and 90% at pH 2.5 for 4 h of incubation (Reddy and
Prapulla, 2007).
As seen from result, out of 17 LAB isolates, 6 were found to be resistant at pH 2.0
and 2.5. In general, most of the strains tested in this study showed a good resistance to
low pH. Therefore, it has been assumed that isolated strains may survive passage through
the digestive system that has specific condition such as the low pH of the stomach. This
phenomenon has previously been observed in a number of probiotic bacteria where a
substantial decrease in the viability of strains was often observed at pH 2.0 or below
(Hood and Zottola, 1988). However, as reported by Prasad et al., (1998), the probiotic
strains are likely to be buffered by food or other carrier matrix molecules following
consumption and are thus not likely to be exposed to the extremes of pH in the stomach.

Chapter: 5
Isolation and characterization of probiotic LAB 138
0
10
20
30
40
50
60
70
80
90
100
%S
urv
iva
bili
ty
LAB isolates
pH 2 pH 2.5
Fig 5.1 Survivability of the LAB isolates to pH 2.0 and 2.5 for 4 h incubation at 37 oC
Chapter: 5
Isolation and characterization of probiotic LAB 139
Bile tolerance is one of the properties required for lactobacilli to survive in the
small intestine, enabling them to play a role in the physiological function of this organ
(Kaur et al., 2002; Reid and Friendship, 2002; Saarela et al., 2000). Selection of bile
tolerant strains at bile concentrations between 0.3 and 1.0% w/v in growth media is
typical. Fig 5.2 shows the survival rates (%) of the tested LAB isolates simulating bile
tolerance of bacteria in the human proximal intestinal conditions. Similar to the results of
acid tolerance study, the Cu8, R15, Cu17, and R32 exhibited higher viability (>70%) than
B2, S3, Br4, C5, R7, B11, D16, T18, R24, Cu26, C33, Cu34 and C37 (55-65%) under the
same treatment conditions (P>0.05). Cu8 and R32 had the highest survival rates (76%
and 71% respectively) of all the tested LAB strains for the same bile concentrations and
treatment periods. The extended treatment time (4 h) resulted in significant lowering of
survival rates (P<0.05) for each LAB at the same bile salt concentrations. Although it is
found that the growth rates of all 17 LAB isolates were slightly suppressed by bile, all
showed growth, even in 1% bile salt (Fig 5.2). A bile concentration of 1% is considered
greater than that normally observed in animal intestines. According to Gilliland et al.,
(1984) 0.3% bile is considered to be a crucial concentration to evaluate a bile tolerant
probiotic LAB. Among 6 acid tolerant strains (Cu8, R15, Cu17, Cu26, R32, and Cu34), 4
strains (Cu8, R15, Cu17 and R32) were found to survive at the tested bile salt
concentrations (0.3, 0.6 and 1%) for 12 h, whereas the survival of the isolate Cu26 and
Cu34 were found to decrease with an increase in bile salt concentration.
The gastric acid and bile salts are two critical factors affecting the survival of
LAB which are ingested and transit through the gastrointestinal tract (GIT). In the in vitro
studies, hydrogen chloride (HCl) and bile salts are usually used to imitate the unfavorable
conditions that exist in the GIT. To be useful probiotic candidates, LAB must possess the
properties of acid and bile tolerance to help them survive and grow in the conditions
found in the gut. In the present study, Cu8, and R32 displayed higher tolerance towards
acid and bile salts than other isolates (Fig 5.1 and Fig 5.2). However, the reference strain,
L. salivarius CFR 2158, is reported to be the highest survivability in all acid and bile
conditions tested (Reddy and Prapulla, 2007). In general, each tested strain showed a
significant decrease in survival rate, with increased bile concentrations and decreased pH
values.

Chapter: 5
Isolation and characterization of probiotic LAB 140
Gilliland et al., (1984) reported that bile tolerant lactobacilli occur in high
numbers in the upper section of the intestine. Although the bile concentrations in the
gastro-intestinal tract vary, the mean intestinal bile concentration is believed to be 0.3%
w/v (Gilliland et al., 1984). This phenomenon was also observed by Begley et al., (2005)
and they reported that hydrolysis of bile salts by bile tolerant bacteria results in increased
usage of cholesterol to synthesize new bile salts and this resulted in lowering of serum
cholesterol levels. However, it is worth mentioning that too high bile salt hydrolase
activity in the intestinal lumen can result in low availability of conjugated bile salts
needed for lipid digestion (Kim and Lee, 2005). Klaenhammer (1982) reported that
probiotic bacteria vary considerably in their level of bile tolerance. Also, they explained
the mechanism of tolerance is not understood and the minimum acceptable level of bile
tolerance for a candidate probiotic remains unknown. Until now, the lethality of bile on
microorganisms in the human small bowel was thought to be low, even negligible,
because of in vitro data that showed conjugated bile salts, which constitute the majority
of bile salts present in the small bowel, were less bactericidal than deconjugated bile
salts.
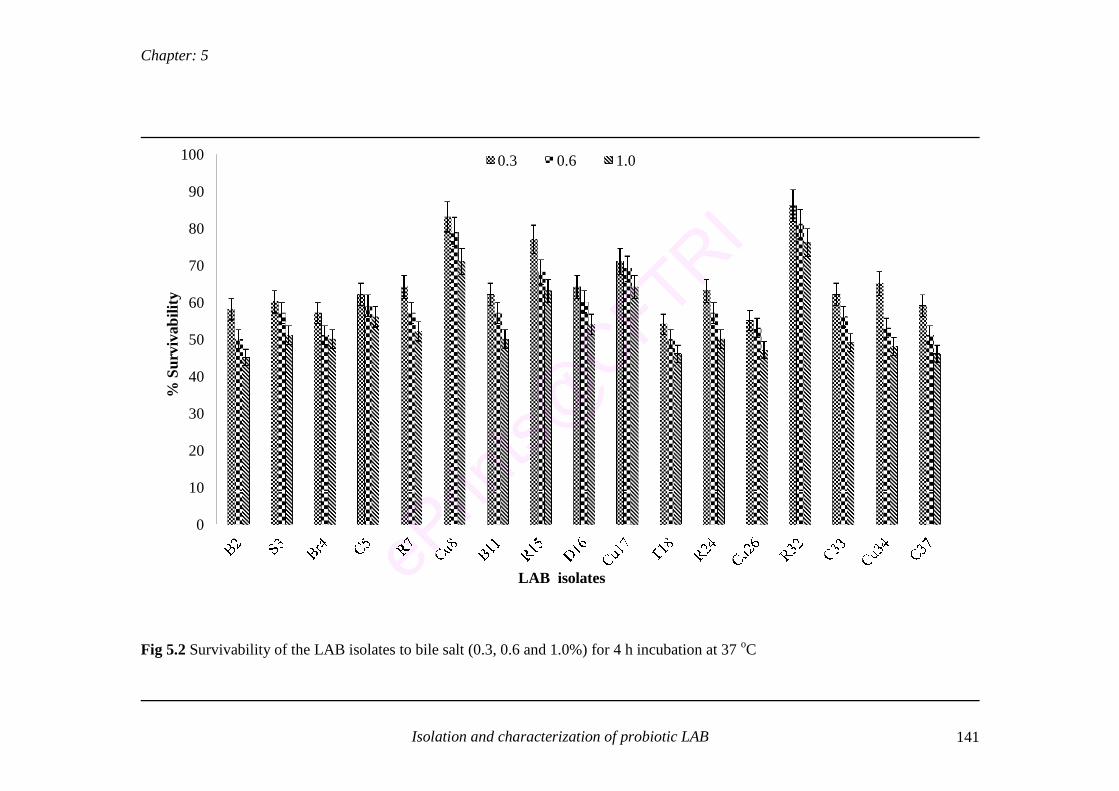
Chapter: 5
Isolation and characterization of probiotic LAB 141
0
10
20
30
40
50
60
70
80
90
100%
Su
rviv
abil
ity
LAB isolates
0.3 0.6 1.0
Fig 5.2 Survivability of the LAB isolates to bile salt (0.3, 0.6 and 1.0%) for 4 h incubation at 37 oC

Chapter: 5
Isolation and characterization of probiotic LAB 142
5.3.3. Viability of selected LAB isolates in synthetic gastric juice (SGJ)
In order to analyze the effects of various components of simulated gastric juice on
viability of lactobacilli, 6 LAB isolates, which showed more than 80% survivability at
low pH and more than 70% survivability at high bile salt concentration was selected. The
effects of SGJ on viability of LAB isolates are presented in Fig 5.3.
0
10
20
30
40
50
60
70
80
90
100
Cu8 R15 Cu17 Cu26 R32 Cu34
%S
urv
iva
bil
ity
LAB isolates
2h 4h
Fig 5.3 Survivability of the LAB isolates to synthetic gastric juice
When the synthetic gastric juice of pH 2.5 was used, the Cu8 and R32 showed the
highest survival rate (86% and 73%) over 4 h of exposure to synthetic gastric juice.
While, the poorest survivor was R15, the concentration of Cu17, Cu26 and Cu34 were
also declined to 65% after 4 h of exposure (Fig 5.3). Therefore, even under starving
condition, it is considered that pH of stomach is around 2.0 and the required time to
release is about 1.5 h. The isolates Cu8 and R32 could pass through gastrointestinal tract
after ingestion with food products.
5.3.4. Cell surface hydrophobicity
One of the important criteria for the LAB isolate to consider it as probiotic is its
ability to adhere to mucosal surface of the human gastro intestinal tract. The beneficial
Chapter: 5
Isolation and characterization of probiotic LAB 143
effect of LAB isolates has been attributed to their ability to colonize human and animal
gastrointestinal tracts (Dharmawan et al., 2006). Several factors are involved in the
adhesion of probiotic LAB, one is the hydrophobicity of the bacterial cell surface. BATH
is a method for determining the hydrophobic surface characteristics of bacterial cells. The
strains affinity for water is evaluated by thoroughly mixing a culture and hydrocarbon
suspension and then evaluating the decrease in optical density (OD) of the culture phase.
The decrease in OD correlates with the hydrophobicity of the LAB isolates. Reddy and
Prapulla (2007) reported that the L. salivarius CFR 2158 was strongly adhesive to HT-29
intestinal epithelial cell line. Taking this as a reference point, LAB isolates (Cu8 and
R32) were compared with L. salivarius CFR 2158. The most hydrophobic LAB isolates
were found to be Cu8 (69.27%); R32 (65.09%) and Cu8 (91.40%); R32 (61.62%) when
xylene and hexane were used as the hydrocarbon. The least hydrophobic (<30%) LAB
isolates were found to be R15, Cu17, Cu26 and Cu34. Therefore, the isolate Cu8 and R32
were selected to study other probiotic properties.
It has been reported by Wadstrom et al., (1987) that, compared to hydrophilic
strains, hydrophobic lactobacilli adhered better to intestinal epithelial cells. As bacterial
cells alter their membrane fluidity under various environmental conditions, growth
conditions may have a profound effect on the fatty acid composition of their lipids and
subsequently on the hydrophobicity and adhesion ability of bacterial strains.
Lactobacillus can adhere to the epithelium in the intestinal tract and may thus prevent the
adherence of pathogenic microorganisms. Adherence indicates the capacity of the strain
to colonize the mucosa. Moreover, the attachment to mucosa prolongs the time for
probiotics to influence the gastrointestinal immune system and microbiota of the host.
Thus the ability to adhere to intestinal surfaces is considered to be an indicator of the
efficacy of the probiotic strain.
5.3.5. Antibacterial test
One of the major criteria for probiotic LAB is its inhibitory effect on the growth
of pathogenic bacteria (Lin et al., 2007). Bacterial antagonism provides information about
inhibitory properties against some pathogens. Probiotic bacteria produce inhibitory
substances as organic acids, peroxide and bacteriocins. Table 5.3 indicates the wide

Chapter: 5
Isolation and characterization of probiotic LAB 144
spectrum inhibitory effects of the isolates Cu8 and R32 against well known food borne
pathogenic organisms (Micrococcus, S. typhi FB231, Y. enterocolitica MTCC 859, E.
coli MTCC118, L. murreyi FB 69, L. innocua FB 21, L. monocytogenus Scott A, S.
aureus FR1722, B.cereus F4433, S. paratyphi FB254, A. hydrophila B445). The
inhibition zone was found to be in the range of 6-10 mm (+) and 10 mm and above (++).
The inhibitory effect of LAB might be due to the production of H2O2, organic
acids, bacteriocins, reuterins, etc. (Jacobsen et al., 1999). An in vitro study proposed that
lactic acid production by L. acidophilus is responsible for the inhibition of
gastrointestinal pathogens (Lin et al., 2007). An agar well diffusion assay was performed
to find out the nature of the antibacterial compound for the culture filtrate of the Cu8 and
R32. On studying the antibacterial activity, both the isolates showed a strong antibacterial
effect (++) on Micrococcus, S. typhii FB231, E. coli MTCC118, L. monocytogenus Scott
A, S. aureus FR1722 and A. hydrophila B445, and these native isolates were unable to
inhibit the growth of B.cereus F4433 and S. paratyphi FB254. The LAB isolate R32
showed strong inhibition on L. murreyi FB 69, where Cu8 showed moderate effect. The
Cu8 showed strong antibacterial effect on L. monocytogenus Scott A, while R32 showed
no effect (Table 5.3).

Chapter: 5
Isolation and characterization of probiotic LAB 145
Table 5.3 Antibacterial effect of the LAB isolates against food borne pathogens
++ Above 10mm zone of inhibition, + 6-10 mm, - No zone of inhibition
5.3.6. Antibiotics susceptibility test
The use of antibiotics is very common in order to treat any diseases or infections.
One of the problems with this treatment procedure is the development of bacterial
resistance. For example, in 1979 less of 1% of Salmonella strains isolated from pigs were
resistant to penicillin. In 1996, Salmonella strains resistant to penicillin increased to 34%
(CSPI News, 1999). Development of resistance to drugs induced by inadequate use
implies a constant search of new antibiotics and this search increases costs of production
(Trieu-Cuot and Poyart, 1999; Mc Kellar, 1998). It is very important to search for an
alternative to the use of antibiotics. A kind of functional food is one which is
supplemented with probiotics.
The selected acid and bile tolerant isolates (Cu8 and R32) were tested for
antibiotic susceptibility (Charteris et al., 1998b). The isolate Cu8 was moderately
susceptible to Erythromycin and Co-trimoxazole whereas, R32 showed resistant to these
Food borne pathogens LAB isolates
Cu8 R32
Micrococcus ++ ++
S. typhii FB231 ++ ++
Y. enterocolitica MTCC 859 + +
E. coli MTCC118 ++ ++
L. murreyi FB 69 + ++
L. innocua FB 21 + +
L. monocytogenus Scott A ++ -
S. aureus FR1722 ++ ++
B.cereus F4433 - -
S. paratyphi FB254 - -
A. hydrophila B445 ++ ++

Chapter: 5
Isolation and characterization of probiotic LAB 146
antibiotics and a moderate susceptibility to Tetracycline. Both the LAB isolates were
resistant to most of the antibiotics (Penicillin-G, Kanamycin, Metronidazole,
Vancomycine, Streptomycin, Rifampicin and Polymyxin-B) and a moderate
susceptibility to Ampicillin and Chloramphenicol (Table 5.4). The results implicated that
LAB isolates which have shown resistance to specific antibiotics can be consumed by the
patient at the time of antibiotic treatment. In the treatment of urogenital infections and
traveler’s diarrhea, better results can be obtained when concurrent therapy is made with
probiotic LAB during antibiotic treatment but safety of the applied strain should be
considered.
Antibiotics cause diarrhea due to an imbalance of intestinal bacterial flora in 20%
of patients treated. In double-blind placebo-controlled randomized studies, probiotics
such as Saccharomyces boulardii (McFarland et al., 1995; Surawicz et al., 1989),
Lactobacillus rhamnosus GG strain (Pant et al., 1996), Bifidobacterium longum
(Colombel, 1987), and Enterococcus faecium SF 68 strain (Buydens and
Debeucklaere, 1996) significantly decreased the incidence of diarrhea in healthy subjects
and patients treated with antibiotics. Meta-analysis of the effects of probiotics on
antibiotic induced diarrhea in nine double-blind placebo-controlled studies has been
performed, and the results clarified the significance of the actions of probiotics such as S.
boulardii and Lactobacillus (D’Souza et al., 2002).

Chapter: 5
Isolation and characterization of probiotic LAB 147
Table 5.4 Antibiotic susceptibility for LAB isolates
Antibiotics Interpretative zone diameter (mm)
TypeDisc Conc.
(µg)Cu8 R32
Penicillin-G 10 10 (R) 14 (R)
Kanamycin 30 00 (R) 00 (R)
Metronidazole 5 00 (R) 00 (R)
Vancomycine 30 00 (R) 00 (R)
Ampicillin 10 14 (MS) 15 (MS)
Chloramphenicol 30 15 (MS) 15 (MS)
Streptomycin 10 00 (R) 00 (R)
Co-trimoxazole 25 11 (MS) 00 (R)
Tetracycline 30 14 (R) 15 (MS)
Erythromycin 15 14 (MS) 00 (R)
Rifampicin 5 15 (R) 12 (R)
Polymyxin-B 300 00 (R) 00 (R)
(R)-Resistance; (MS)-Moderate susceptible; (S)-Susceptible, in accordance to
performance of standards for antimicrobial disk susceptibility test.
5.3.7. Carbohydrate utilization test
Carbohydrate utilization by LAB isolates (Cu8 and R32) was carried. Change in
the color of wells from red to yellow indicates positive results for carbohydrate utilization
and no change in color indicates negative result (Fig 5.5a and Fig 5.5b).

Chapter: 5
Isolation and characterization of probiotic LAB 148
Fig 5.5 (a) Carbohydrate fermentation test of the probiotic LAB isolate Cu8 (wells
numbered from 1-35 correspond to carbohydrates mentioned in Table 5.5 in the same
order and well number 36 represents control)
1 2 3 4 5 6 7 8 9 10 11 12
13 14 15 16 17 18 19 20 21 22 23 24
25 26 27 28 29 30 31 32 33 34 35 36

Chapter: 5
Isolation and characterization of probiotic LAB 149
Fig 5.5 (b) Carbohydrate fermentation test of the probiotic LAB isolate R32 (wells
numbered from 1-35 correspond to carbohydrates mentioned in Table 5.5 in the same
order and well number 36 represents control)
In ONPG test, media color change from colorless to yellow indicates positive
results and absence of color change indicates negative results. A color change from cream
to black indicate Esculin hydrolysis (positive result) and if remains cream, indicates
negative results. Change in medium color from yellowish green to blue shows positive
results for citrate utilization. In malonate utilization test, color of the medium changes
from light green to blue indicates positive results. Both the isolates Cu8 and R32
produced acid from maltose, fructose, dextrose, trehalose, sucrose, mannose, inulin,
cellobiose, and hydrolyzed the esculin. Isolate Cu8 was able to ferment galactose, salicin,
1 2 3 4 5 6 7 8 9 10 11 12
13 14 15 16 17 18 19 20 21 22 23 24
25 26 27 28 29 30 31 32 33 34 35 36

Chapter: 5
Isolation and characterization of probiotic LAB 150
mannitol, α-Methyl-D-glucoside, melezitose and D-arabinose. In contrast, isolate R32
was able to ferment lactose (Table 5.5).
Table 5.5 Carbohydrate fermentation and organic substrates utilization profile
(+): substrate fermented; (-): substrate not fermented.
Sl.
No.
Substrate Cu8 R32 Sl.
No.
Substrate Cu8 R32
1 Lactose - + 19 Sorbitol - -
2 Xylose - - 20 Mannitol + -
3 Maltose + + 21 Adonitol - -
4 Fructose + + 22 Arabitol - -
5 Dextrose + + 23 Erythritol - -
6 Galactose + - 24 α-Methyl-D-glucoside + -
7 Raffinose - - 25 Rhamnose - -
8 Trehalose + + 26 Cellobiose + +
9 Melibiose - - 27 Melezitose + -
10 Sucrose + + 28 α-Methyl-D-mannoside - -
11 L-arabinose - - 29 Xylitol - -
12 Mannose + + 30 ONPG - -
13 Inulin + + 31 Esculin hydrolysis + +
14 Sodium gluconate - - 32 D-Arabinose + -
15 Glycerol - - 33 Citrate utilization - -
16 Salicin + - 34 Malonate utilization - -
17 Dulcitol - - 35 Sorbose - -
18 Inositol - - 36 Control
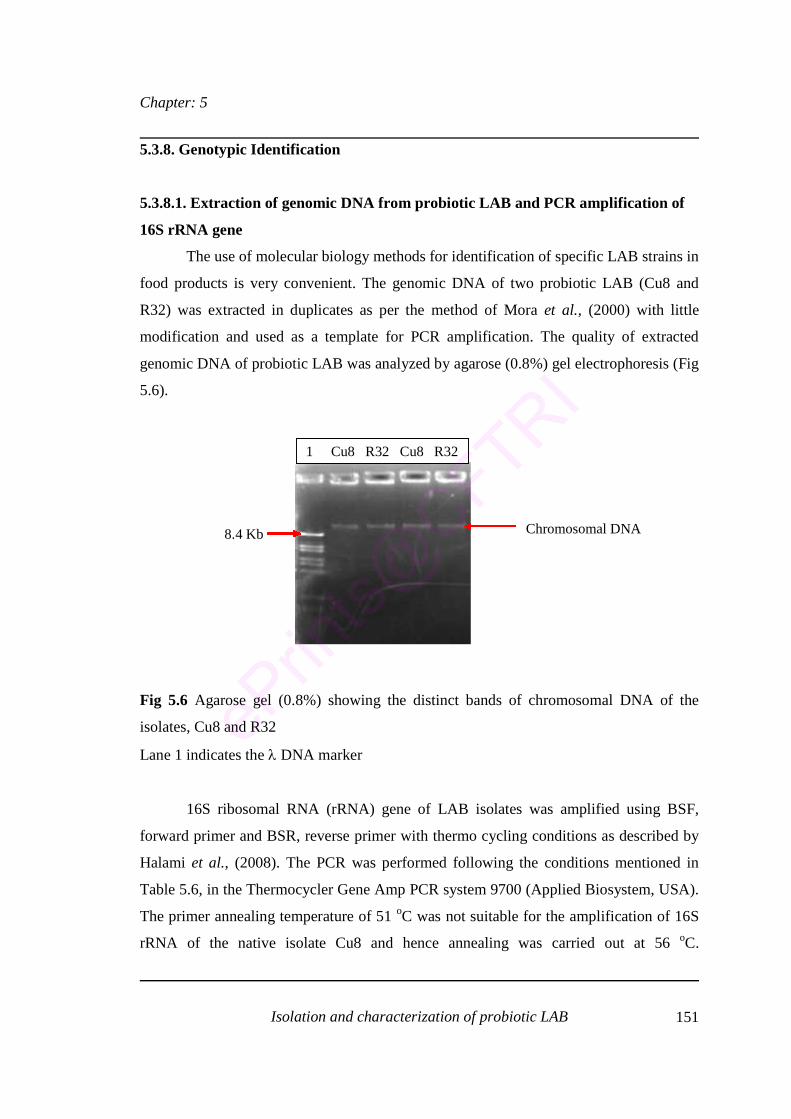
Chapter: 5
Isolation and characterization of probiotic LAB 151
5.3.8. Genotypic Identification
5.3.8.1. Extraction of genomic DNA from probiotic LAB and PCR amplification of
16S rRNA gene
The use of molecular biology methods for identification of specific LAB strains in
food products is very convenient. The genomic DNA of two probiotic LAB (Cu8 and
R32) was extracted in duplicates as per the method of Mora et al., (2000) with little
modification and used as a template for PCR amplification. The quality of extracted
genomic DNA of probiotic LAB was analyzed by agarose (0.8%) gel electrophoresis (Fig
5.6).
Fig 5.6 Agarose gel (0.8%) showing the distinct bands of chromosomal DNA of the
isolates, Cu8 and R32
Lane 1 indicates the DNA marker
16S ribosomal RNA (rRNA) gene of LAB isolates was amplified using BSF,
forward primer and BSR, reverse primer with thermo cycling conditions as described by
Halami et al., (2008). The PCR was performed following the conditions mentioned in
Table 5.6, in the Thermocycler Gene Amp PCR system 9700 (Applied Biosystem, USA).
The primer annealing temperature of 51 oC was not suitable for the amplification of 16S
rRNA of the native isolate Cu8 and hence annealing was carried out at 56 oC.
1 Cu8 R32 Cu8 R32
Chromosomal DNA8.4 Kb

Chapter: 5
Isolation and characterization of probiotic LAB 152
Approximate size of the amplicon was obtained from agarose gel electrophoresis wherein
the size of the amplicon was checked against a DNA marker.
Fig 5.7 Agarose gel (1.5%) showing PCR amplification of 1.4 kb 16S rDNA gene
fragment
Lane Cu8 and R32 shows the band that indicates the 16S rRNA gene amplified at 1.4kb
region. Lane 1 indicates the 10 kb DNA marker
From the above photograph (Fig 5.7), it was confirmed that the target gene was
amplified and the specificity of the primer along with the absence of non specific
amplification. The PCR amplified products, ≈ 1.4 kb to be ligated with T- tail vector was
gel-purified purified by using Sigma QIAQuick gel extraction kit.
Table 5.6 PCR reaction parameters
PCR reaction parameter Cu8 R32
Initial denaturation 95 oC/ 3 min 95 oC/ 3 min
Denaturation . 94 oC/ 40 sec 94 oC/ 40 sec
Annealing 56 oC/ 60 sec 51 oC/ 60 sec
Extension 72 oC/ 20 sec 72 oC/ 20 sec
Final extension 72 oC/ 15 min 72 oC/ 15 min1 2 M LF 5 6 7
10Kb
Kb3Kb
Kb
500Kb
Kb
1.2Kb
Kb
1.4Kb
Kb
100Kb
Kb
Cu8 R32

Chapter: 5
Isolation and characterization of probiotic LAB 153
5.3.8.2. Cloning of 16S rRNA gene and sequence analysis of the selected LAB
After purification, the purified PCR products were cloned into the pGEM-T easy
vector according to the manufacturer's recommendations (Promega Corporation). The
cloned vector was transformed in E. coli DH5 cells. The recombinants were selected
based on blue/white colonies and confirmed for the presence of 16S rDNA products in
the recombinant E. coli DH5 cells by isolation of plasmid DNA and analysis on gel
(Fig 5.8) and also with Restriction analysis.
Fig 5.8 Analysis of plasmid DNA isolated from recombinant and non recombinant E. coli
DH5 cells
Lane 1 shows marker. Lane 2, 3, 4 and 5 are the vector. Lane 6 shows confirmation of
recombinants.
A double digestion using EcoRI/ NotI shows an insert release of a 1.4 Kb
fragment. The recombinant plasmids was subjected for sequencing using M13 forward and
reverse primers at the sequencing facility of Genie, Bangalore, India. The nucleotide
sequence was analyzed in GenBank database release 155 using Basic Local Alignment
Search Tool (BLAST) on the National Center for Biotechnology Information (NCBI,
USA) database, for homogenous gene search.
The genotypic identification of the selected probiotic LAB from fruits and
vegetables was studied using a total DNA extraction, PCR amplification of 16S rDNA,
cloning the 16S rDNA into pGEM-T easy vector and sequence analysis. Identification of
Confirmation of the recombinants
8.4Kb
4.4Kb
2 3 4 5 6
Chapter: 5
Isolation and characterization of probiotic LAB 154
the selected isolates was performed by partial sequencing of approximately 700 bp of 16S
rDNA gene. The gene sequences of amplified 16S rRNA gene fragment obtained from
representative of each groups were aligned with all sequences present in the GenBank
database and resulted in the final identification of the selected LAB isolates. Sequence
analysis of PCR products revealed that, for both the isolates there was 1% or no
differences with the most closely matched sequence in the databank. According to the
reports on the correlation between the DNA-DNA homology and 16S rDNA sequence
homology (Guha and Jaffe, 1996; Kobayashi and Ritmann, 1982), strains reveal DNA-
DNA homology higher than 70% and show sequence homology higher than 99.5% when
strains were identified. Consequently, the two isolates were assigned to the genera
Enterococcus on the basis of morphological, cultural, biochemical, and physiological
characteristics and 16S rRNA gene sequences. They were identified and tentatively
named as Enterococcus hyrae (Cu8) and Enterococcus faecium (R32). These isolates
were grouped at species level on the basis of key phenotypic characteristics and 16S
rRNA gene sequences.
5.3.8.3. Sequence
The sequence of 589 and 460 bp of rRNA gene obtained for the LAB isolates Cu8
(Enterococcus hyrae) and R32 (Enterococcus faecium) after sequencing using M13F and
M13R primers is shown in the Fig 5.9. The sequence of rRNA gene from Cu8 and R32
were homologous to an extent of 99% with that of other Enterococcus hirae and
Enterococcus faecium strains respectively (Table 5.7 and Table 5.8). Multiple sequence
alignment of Cu8 and R32 was carried out using ‘Multalin’ software. The method used is
as described by Corpet (1988). The multiple sequence alignment is shown in the Fig 5.10
and Fig 5.11 respectively. Strain numbers have been assigned for the LAB isolates
Enterococcus hirae and Enterococcus faecium as CFR 3001 and CFR 3002 respectively
by culture collection centre of CFTRI, Mysore, Karnataka, India.

Chapter: 5
Isolation and characterization of probiotic LAB 155
LAB isolate Cu8 (Enterococcus hyrae)
GAGTTTGATCCTGGCTCAGGACGAACGCTGGCGGCGTGCCTAATACATGCAA
GTCGAACGCTTCTTTTTCCACCGGAGCTTGCTCCACCGGAAAAAGAGGAGTG
GCGAACGGGTGAGTAACACGTGGGTAACCTGCCCATCAGAAGGGGATAACA
CTTGGAAACAGGTGCTAATACCGTATAACAATCGAAACCGCATGGTTTTGAT
TTGAAAGGCGCTTTCGGGTGTCGCTGATGGATGGACCCGCGGTGCATTAGCT
AGTTGGTGAGGTAACGGCTCACCAAGGCGACGATGCATAGCCGACCTGAGAG
GGTGATCGGCCACATTGGGACTGAGACACGGCCCAAACTCCTACGGGAGGCA
GCAGTAGGGAATCTTCGGCAATGGACGAAAGTCTGACCGAGCAACGCCGCGT
GAGTGAAGAAGGTTTTCGGATCGTAAAACTCTGTTGTTAGAGAAGAACAAGG
ATGAGAGTAACTGTTCATCCCTTGACGGTATCTAACCAGAAAGCCACGGCTA
ACTACGTGCCAGCAGCCGCGGTAATACGTAGGTGGCAAGCGTTGTCCGGATT
TATTGGGCGTAAAGCGAG
LAB isolate R32 (Enterococcus faecium)
CATGCAAGTCGTACGCTTCTTTTTCCACCGGAGCTTGCTCCACCGGAAAAAGA
AGAGTGGCGAACGGGTGAGTAACACGTGGGTAACCTGCCCATCAGAAGGGG
ATAACACTTGGAAACAGGTGCTAATACCGTATAACAATCGAAACCGCATGGT
TTTGATTTGAAAGGCGCTTTCGGGTGTCGCTGATGGATGGACCCGCGGTGCAT
TAGCTAGTTGGTGAGGTAACGGCTCACCAAGGCCACGATGCATAGCCGACCT
GAGAGGGTGATCGGCCACATTGGGACTGAGACACGGCCCAAACTCCTACGG
GAGGCAGCAGTAGGGAATCTTCGGCAATGGACGAAAGTCTGACCGAGCAAC
GCCGCGTGAGTGAAGAAGGTTTTCGGATCGTAAAACTCCTGTTGTTAGAGAA
GAACAAGGATGAGAGTAACTGTTCATCCCTTGACGGTATCTAACC
Fig 5.9 16s rRNA sequence of the probiotic LAB isolates (Cu8 and R32) after DNA
sequence analyzer

Chapter: 5
Isolation and characterization of probiotic LAB 156
Table 5.7 Sequences producing significant alignments with that of Cu8 isolate
Accession
No.Description
Max
score
Total
score
Query
coverageE value
Max
Identity
GU727814.1 Enterococcus hirae
strain T3 16S
ribosomal RNA gene,
partial sequence
Enterococcus hirae
gene for 16S rRNA,
partial sequence,
strain: NRIC 0109
Enterococcus hirae
gene for 16S rRNA,
partial sequence,
strain: NRIC 0108
Enterococcus hirae
gene for 16S rRNA,
partial sequence,
strain: NRIC 0107
Enterococcus hirae
gene for 16S rRNA,
partial sequence,
strain: NRIC 0104
Enterococcus hirae
gene for 16S rRNA,
partial sequence,
strain: NRIC 0102
1088 1088 100% 0.0 100%
AB362598.1 1083 1083 100% 0.0 99%
AB362597.1 1083 1083 100% 0.0 99%
AB362596.1 1083 1083 100% 0.0 99%
AB362593.1 1083 1083 100% 0.0 99%
AB362591.1 1083 1083 100% 0.0 99%

Chapter: 5
Isolation and characterization of probiotic LAB 157
Table 5.8 Sequences producing significant alignments with that of R32 isolate
Accession
No.Description
Max
score
Total
score
Query
coverageE value
Max
identity
HM638426.1 Enterococcus faecium
strain Vm3 16S
ribosomal RNA gene,
partial sequence
1090 1090 87% 0.0 99%
HM218167.1 Enterococcus faecium
strain NM31-5 16S
ribosomal RNA gene,
partial sequence
1090 1090 87% 0.0 99%
HM218160.1 Enterococcus faecium
strain NM30-4 16S
ribosomal RNA gene,
partial sequence
1090 1090 87% 0.0 99%
HM218152.1 Enterococcus faecium
strain NM29-3 16S
ribosomal RNA gene,
partial sequence
1090 1090 87% 0.0 99%
FJ378892.1 Enterococcus faecium
strain B-30 16S
ribosomal RNA gene,
partial sequence
1090 1090 87% 0.0 99%

Chapter: 5
Isolation and characterization of probiotic LAB 158
Fig 5.10 Multiple sequence alignment of rRNA gene of Cu8 with other Enterococcus sp.
Accession Numbers: GU727814.1 (Enterococcus hirae strain T3 16S ribosomal RNA
gene) and AB362598.1 (Enterococcus hirae gene for 16S rRNA, partial sequence, strain:
NRIC 0109)

Chapter: 5
Isolation and characterization of probiotic LAB 159
Fig 5.11 Multiple sequence alignment of rRNA gene of R32 with other Enterococcus sp.
Accession Numbers: HM218167.1 (Enterococcus faecium strain NM31-5 16S ribosomal
RNA gene) and HM638426.1 (Enterococcus faecium strain Vm3 16S ribosomal RNA
gene)

Chapter: 5
Isolation and characterization of probiotic LAB 160
5.3.8.4. Thermotolerance, high salt (NaCl) concentration and sodium azide test for
Enterococcus
The preliminary, confirmatory tests for the identified Enterococcus hirae and
Enterococcus faecium was carried based on the genotypic characterization. Both
Enterococcus hirae and Enterococcus faecium were tolerant to high temperatures (60 oC
and 70 oC) and high NaCl (10%) concentration and they showed excellent growth
(turbidity), which clearly indicated that, both the isolates belong to the genera
Enterococcus.
The selective media, sodium azide in MRS broth, usually form the basis for the
estimation of Enterococcus growth was carried. Both E. hirae and E. faecium showed
positive for the tests, indicated the ability of the isolates to ferment 0.04% sodium azide
and turns media into red colour. Enterococci are characterized by growth at high
temperature, high NaCl and in the presence of sodium azide. The results of
carbohydrates, especially maltose and lactose fermentation, thermotolerance, high NaCl
concentration and growth at sodium azide test obtained for both the strains clearly
confirmed that they belong to Enterococcus group and were identified as E. hirae and E.
faecium (section 5.3.8.3).

Chapter: 6, Section: 6.1
Synbiotic functional star fruits 161
CHAPTER: 6; SECTION: 6.1
SYNBIOTIC FUNCTIONAL STAR FRUIT WITHFRUCTOOLIGOSACCHARIDES AND SELECTED PROBIOTICS

Chapter: 6, Section: 6.1
Synbiotic functional star fruits 162
6.1.1. Introduction
In the recent years, much emphasis is on the ‘optimized’ nutrition that offers
maximum life expectancy and quality living. Changing trends in population demography,
consumer affluence, increased education, and improved healthcare have been the driving
force behind the rapidly emerging health conscious consumers and thus, the ‘functional
food’ is recognized as the number one global food biotechnology industry (Dillard and
German, 2000; Belem, 1999; Childs, 1999). The term functional food was first
introduced in Japan in the mid 1980s and is defined as ‘any food or food ingredient that
provides a health benefit beyond the traditional nutrients it contains’ (Mazza, 1998). A
food can be said to be functional if it contains a component (which may or may not be a
nutrient) that affects one or a limited number of functions in the body in a targeted way
so as to have positive effects on health (Bellisle et al., 1998) or if it has a physiological or
psychological effect beyond the traditional nutritional effect (Clydesdale, 1997). As the
market for functional foods continues to expand, research in the development of food
products containing prebiotic and probiotic bacteria will also continue to grow (Christian
et al., 2010; Boylston et al., 2004). Foods enriched with physiologically active
compounds such as probiotics, prebiotics, vitamins, minerals and dietary fibers are
considered as functional foods. These foods exhibit beneficial effects in the maintenance
of host health and prevention of diseases.
It is well known that probiotic bacteria have beneficial effects on human health
and well being. Some of these effects include improvement in gut health, lowering of
blood cholesterol and enhancement of body’s natural defense mechanisms. Additional
health benefits include stimulation of the immune system, vitamin synthesis, anti
carcinogenesis and antibacterial activities. The consumer acceptance and survival of
added probiotics are the two important criteria to determine efficacy and success of
products enriched with probiotics (Heenan et al., 2004). The use of probiotics in food and
pharmaceutical industries is mainly driven by the increasing consumer health awareness.
Incorporation of probiotics in pharmaceutical products and aquaculture feeds has been of
considerable industry interest (Calo-Mata et al., 2008). Scientific evidences suggest that
the consumption of probiotic bacteria at high levels (109-1011 cfu/day) can decrease the

Chapter: 6, Section: 6.1
Synbiotic functional star fruits 163
incidence, duration and severity of some intestinal illness (Boylston et al., 2004; Sanders,
1999).
The prebiotic approach advocates the administration of non-viable entities.
Dietary carbohydrates such as non-digestible oligosaccharides are the most promising
prebiotics, because of their selective metabolism. Current trend in marketing the
functional foods is to combine probiotic with prebiotics. Products containing these two
components are generally termed ‘synbiotics’ (Holzapfel and Schillinger, 2002).
Synbiotics are used in dairy (Alegro et al., 2007) and non dairy products such as cereal
bars (Ouwehand et al., 2004), fruit and berry juices (Tharmaraj et al., 2004) and
confectionary (Mattila-Sandholm et al., 2002). A few probiotic preparations are
exclusively consumed as powders, tablets, ice creams, kefir, and fermented dairy
products such as yogurt, cheddar cheese, freeze-dried or spray dried preparations (Golker,
1993; Champagne et al., 1991), but are not generally a part of fruit and/or vegetable
preparations. Synbiotic products have not been extensively studied to date (Bielecka et
al., 2002). Roberfroid (2002) suggested that synbiotic products can improve the survival
of probiotics when they pass through the upper part of the gastrointestinal tract and
produce greater effects in the large bowel.
The star fruit (Averrhoa carambola) is a member of the oxalis family. The fruit
acquired its name from the five pointed star shape when cut across the middle of the fruit.
The fruit is native to Sri Lanka and popular throughout Southeast Asia, India, southern
China, New Zealand, and Australia. Preservation of highly seasonal crops can prevent the
huge wastage and make them available in the off season at remunerative prices. A study
has been carried out with an objective of value addition to star fruit, an underutilized fruit
which is a native to tropical lowlands of India.
The present chapter details the incorporation of fructooligosaccharides (FOS) and
probiotics (Lactobacillus salivarius CFR 2158 and Enterococcus hirae CFR 3001) to star
fruits using vacuum osmotic dehydration (VOD) aiming to produce both prebiotic and
synbiotic enriched star fruits.

Chapter: 6, Section: 6.1
Synbiotic functional star fruits 164
6.1.2. Materials and methods
6.1.2.1. Preparation of FOS syrup
The detailed protocol for the preparation of FOS syrup is given in the section
2.2.1.
6.1.2.2. Production of probiotics (Lactobacillus salivarius CFR 2158 and
Enterococcus hirae CFR 3001)
E. hirae CFR 3001 was isolated from cucumber and a reference culture of L.
salivarius CFR 2158 was obtained from Central Food Technological Research Institute
culture collection center (CFR). Both the isolates were grown in de Man, Rogosa and
Sharpe (MRS) broth for 24-48 h at 37 °C. The cells were harvested by centrifuging at
6000 rpm for 15 min at 4 °C (Remi cooling centrifuge, C-30, Mumbai, India)
(Homayouni et al., 2008). The cells were stored at 4 °C and were used for further studies.
6.1.2.3. Sample preparation
Star fruits (Bangalore, India) were cleaned and cut into slices. They were water
blanched and immediately immersed either in 70 °Brix FOS or in 70 °Brix FOS syrup
containing 1% probiotic cell biomass (>300x1016 cfu/ml) (w/v). The fruit to FOS ratio
was maintained at 1:5 (w/v). Experiments were carried out under vacuum as described in
section 2.2.2.
6.1.2.4. Physicochemical characterization of prebiotic and synbiotic star fruits
Moisture content and aw, colour, texture, FOS content and sensory attributes of
prebiotic and synbiotic star fruits over a period of 6 months storage were carried out as
detailed in section 2.2.3.1, 2.2.3.2, 2.2.3.3, 2.2.3.5 and 2.2.3.8 respectively.
6.1.2.5. Scanning electron microscopy (SEM) of synbiotic star fruits
A comparative study on the structural changes before and after VOD of star fruits
has been carried out using SEM (Leo 435 VP, Leo Electron Microscopy Ltd. (Zeiss),
Cambridge, U.K). The sample fixation was carried out as described in section 2.2.3.6.

Chapter: 6, Section: 6.1
Synbiotic functional star fruits 165
The specimens were mounted on aluminium studs with double sticky tape and were gold
coated (3 A° thickness) for 2 min at 20 mA current using Polaron E5100 SEM coating
system. Gold-coated samples were examined at different magnifications (500x, 10,000x
and 20,000x).
6.1.2.6. Viability of probiotics
Survivability of probiotics (initially, 3rd month and 6th month) in synbiotic star
fruits was determined by viable cell count method. A 5 g of sample was macerated with
0.9% saline (20 ml) and a known volume of serially diluted sample was plated on MRS
agar. The plates were incubated at 37 °C for 24-48 h, and the colonies were counted and
expressed as cfu/g of samples. The experiment was performed in triplicate and the
averages of results are reported.
6.1.2.7. Microbiological analysis
Microbial load of prebiotic (FOS) and synbiotic (L. salivarius CFR 2158 and E.
hirae CFR 3001) enriched star fruits was determined initially and at 2 months intervals
up to 6 months of storage as described in section 2.2.3.7.
6.1.2.8. Statistical analysis
Statistical analysis was carried out using a one-way analysis of variance
(ANOVA), Origin 6.1 Software. Means were separated using the least significant
difference test. Significance was defined at P<0.05.
6.1.3. Results and discussion
6.1.3.1. Moisture content and water activity
Fig 6.1.1 shows the moisture content of prebiotic and synbiotic star fruits during 6
months of storage at ambient temperature (25±2 oC). No significant changes (P>0.5) in
the moisture content were observed for prebiotic and synbiotic star fruits during storage,
indicated that the addition of probiotics (1%) did not have any adverse effect on the
moisture content of the final product. The moisture content of the prebiotic and synbiotic

Chapter: 6, Section: 6.1
Synbiotic functional star fruits 166
star fruit was around 12% as against that 89% of fresh star fruit. The loss in water content
might be due to the increase in osmotic pressure gradient (Azoubel and Murr, 2004)
during vacuum treatment. The replacement of native liquid or air in the pores of the star
fruits is achieved by an external hypertonic solution (FOS) during VOD. Impregnated
star fruits were dried at 40 °C for 24 h in order to retain the desirable attributes of fruits,
higher survivability of probiotics and stability of the product. Drying at 40 °C helps in
water holding sites of the fruit tissues to come close to one another to form a metastable
state and thus, helps in reducing the extent of shrinkage. Consequently, the water binding
capacity remains unchanged (Klewick et al., 2009). However, drying at higher
temperature could result in greater shrinkage of fruits. There was only 1% decrease in the
moisture content of prebiotic and synbiotic star fruit during the storage period of six
months, which is insignificant. The water activity of prebiotic and synbiotic star fruits
was found to be 0.65 and 0.64 respectively. With the decrease in moisture content, the
water activity of the final product was also decreased, resulting in stable prebiotic and
synbiotic enriched star fruit.
4
6
8
10
12
14
%M
oist
ure
(w/w
)
Star fruit (FOS) Star fruit (FOS+L. salivarius)
Star fruit (FOS+E. hirae)
Fig 6.1.1 Moisture content of prebiotic and synbiotic star fruits

Chapter: 6, Section: 6.1
Synbiotic functional star fruits 167
6.1.3.2. Effect of impregnation of FOS and probiotics on colour and texture of star
fruit
Lightness (L*) and chroma (a* and b*) values are the measure of retension of
colour in any processed product. Fig 6.1.2 shows the variation in L*, a*, and b*
parameters of star fruits observed after the VOD and compared with the values of fresh
star fruits. Higher luminosity values (L*=51.55) were observed in fresh star fruits, while
prebiotic star fruits showed a decrease in L* parameter (35.82). Similarly synbiotic star
fruits (L. salivarius CFR 2158 and E. hirae CFR 3001) also showed decreased L* values
(34.35 and 35.21 respectively). This indicated that the synbiotic star fruits did not show
any significant difference (P>0.05) when compared with that of prebiotic enriched star
fruit.
The L*a*b* values of synbiotic star fruits did not show any significant difference
(P>0.05) up to 4 months of storage at ambient temperature (25±2 oC), however a very
slight decrease was observed at the end of storage period (6 months). This is evident from
the observation, that the original L* a* and b* co-ordinates of prebiotic and synbiotic star
fruits were maintained as indicated by absence of browning up to 4 months of storage
(Fig 6.1.2) at ambient temperature (25±2 oC). These results are in accordance with the
observations of Krokida et al., (2000) on apple and banana, and of Tan et al., (2001) on
pineapple. The positive b* value indicated the retention of yellow tinge in prebiotic and
synbiotic star fruits. The impregnation of FOS in fruits would have caused a relative
stability of color parameters (L*a*b*) during storage (6 months). Moreover, the
impregnation of star fruit with E. hirae CFR 3001 did not result in any significant colour
change as in the case of impregnation with a reference culture L. salivarius CFR 2158.

Chapter: 6, Section: 6.1
Synbiotic functional star fruits 168
0
10
20
30
40
50
60
L* a* b* L* a* b* L* a* b* L* a* b*
Initial 2nd month 4th month 6th month
Fresh star fruit Star fruit (FOS)
Star fruit (FOS+L. salivarius) Star fruit (FOS+E. hirae)
L*
a*b
*v
alu
es
Storage period
Fig 6.1.2 Colour values of fresh, prebiotic and synbiotic enriched star fruits
Texture makes a significant contribution to the overall food quality, contributing
more or less equally with both flavor and appearance (Bourne, 2002). Textural behavior
is also related to the structure of foods (Ramana and Taylor, 1994). A marginal increase
in shear values of prebiotic and synbiotic star fruits, in comparison with that of fresh fruit
was noticed during storage at ambient temperature (Fig 6.1.3). These results were
consistent with the work of Tregunno and Goff, (1996), who reported that the presence of
sugars increased firmness of thawed apple samples. Monsalve-Gonzalez et al., (1993)
reported that firmness correlated significantly with sugar uptake. Torreggiani and Bertolo
(2001) observed that cells protected by sugars exhibited less damage to the middle
lamella and less severe shrinking of the cell content.
The results showed that the VOD star fruits were more resistant to deformation
than the fresh star fruit, indicating that the VOD process increased the elasticity of the
star fruit, though it was sensorially perceptible (Pereira et al., 2003). Results also
indicated the clear influence of both probiotics (E. hirae CFR 3001 and L. salivarius CFR
2158) and prebiotic (FOS) ingredient on firmness and juiciness of the synbiotic star
fruits. Therefore, during storage period, the texture of star fruit remained constant

Chapter: 6, Section: 6.1
Synbiotic functional star fruits 169
(P>0.05) for all the treatments (prebiotic and synbiotic) used. It can be concluded that
VOD will result in dehydrated products with firm texture that can withstand further
handling and processing. Together with texture improvement, the penetration of solutes
combined with dehydration effect could modify the fruit composition and improve
pigment, colour, vitamin and aroma retention during storage.
0
2
4
6
8
10
12
14
16
18
20
Initial 2nd month 4th month 6th month
Sh
ear
stre
ng
th(N
)
Storage period
Star fruit (FOS) Star fruit (FOS+L. salivarius)
Star fruit (FOS+E. hirae)
Fig 6.1.3 Texture of prebiotic and probiotic impregnated star fruits
6.1.3.3. FOS content
The FOS content of prebiotic and synbiotic star fruit is shown in Fig 6.1.4. There
was no significant changes (P>0.05) in the FOS content of the fruits and was maintained
throughout the storage period (6 months). The penetration of FOS syrup into the tissue of
star fruit is resulted from the HDM during VOD. The thinner the fruit slices, greater the
water losses, which is replaced by the external solution. It was observed that the uptake
of FOS by star fruit was significantly higher. This may be due to the greater surface area
of slices resulting in increased exposure to the impregnation solution.
Christian et al., (2010) reported that about 100 g of synbiotic fresh-cut apple
slices can supply 2-3 g of prebiotics. In the present study, the FOS content was in the
range of 17.80-20.24 g/100g of star fruit (initial day). The star fruits stored at ambient

Chapter: 6, Section: 6.1
Synbiotic functional star fruits 170
temperature (25±2 oC) had retained 16.09-18.62 g/100g FOS after 6 months of storage
(Fig 6.1.4), which is high enough to claim the product as ‘prebiotic star fruit’.
Interestingly, the FOS content did not show any significant change (P>0.05) over a
period of 6 months of storage at ambient temperature (25±2 oC). The storage study was,
however, limited to 6 months considering the viability of probiotics in the star fruits,
since the main focus of the present study was on synbiotic star fruit. The FOS syrup used
along with probiotics (L. salivarius CFR 2158 and E. hirae CFR 3001) probably resulted
in certain compositional changes leading to improved quality of the final product.
0
5
10
15
20
25
Initial 2nd month 4th month 6th month
FO
Sco
nte
nt
(g/1
00g
)
Storage period
Star fruit (FOS)Star fruit (FOS+L. salivarius)Star fruit (FOS+E. hirae)
Fig 6.1.4 Retention of FOS content in prebiotic (FOS) and synbiotic fruits
6.1.3.4. Scanning electron microscopy (SEM) of fresh and synbiotic star fruit
Fruits and vegetables offer enough opportunities for the development of new
functional products without disrupting their desired cellular structure. Fresh star fruit
tissue has a well-organized structure consisting of cell and intercellular spaces (Fig
6.1.5a). VOD resulted in successful uptake of FOS, the base material used as the carrier
of probiotics. Thus, the intercellular spaces were filled with L. salivarius CFR 2158 (Fig
6.1.5b) and E. hirae CFR 3001 (Fig 6.1.5c). The size of the intercellular spaces (210-310
µm) (Lapsley et al., 1992) facilitates lodging of probiotics. It was observed that the cell
concentration per gram of product varied with the type of organism used. The probiotics

Chapter: 6, Section: 6.1
Synbiotic functional star fruits 171
found in the intercellular spaces is probably due to the flow of FOS syrup, originated by
pressure gradients created during the VOD.
Fig 6.1.5 SEM photographs of fresh (a) and synbiotic [FOS+L. salivarius CFR 2158 (b)
and FOS+E. hirae CFR 3001 (c)] star fruits
L. salivarius CFR 2158
E. hirae CFR 3001
a
b
c

Chapter: 6, Section: 6.1
Synbiotic functional star fruits 172
6.1.3.5. Viability of probiotics
The viability and stability of probiotics have been both a marketing and
technological challenge for industrial producers. It is important to have a significant
number of viable probiotics present in the probiotic/synbiotic products for maximum
health benefits (Shah, 2001). The viable cell count of L. salivarius CFR 2158 and E.
hirae CFR 3001 was found to be 178x106 cfu/g and 138x106 cfu/g respectively in
synbiotic star fruits up to 4 months of storage at ambient temperature (25±2 oC). There
was slight decrease in the survivability (34x106 cfu/g and 26x106 cfu/g) of probiotics (L.
salivarius CFR 2158 and E. hirae CFR 3001 respectively) at the end of the storage period
(6 months) and this could be significant enough to consider the proposed process as
adequate to develop synbiotic functional foods. Vinderola et al., (2002) have indicated
the suitability of Argentinean fresco cheese as a food carrier for probiotic cultures and
cheese may be used as a vehicle for probiotic bacteria. On a similar line, the fruit used in
the present study acts as a vehicle for probiotic bacteria. According to Boylston et al.,
(2004) the recommended levels of probiotic microorganism in food at the time of
consumption in order to have a beneficial effect on consumer health is 106 cfu/g. This
criterion is fulfilled in the synbiotic star fruits prepared in the present study.
Previously, Rybka and Kailaspathy (1995) reported that the consumption of
probiotic yogurt should be more than 100 g/day containing 106 cfu/ml. The final product
exhibiting high viability can offer beneficial synbiotic properties to the consumer. The
product is likely to be affected by harsh conditions of gastric acid and bile salts before it
reaches the gastro intestinal tract, which is the site of action. Reddy et al., (2009)
observed a higher percentage survivability of L. salivarius CFR 2158 at pH 2.5 and 0.3%
bile salt concentration. Similarly, E. hirae CFR 3001 also showed greater percentage
survivability at pH 2.5 and 0.3% bile salt (section 5.3.2). High survivability observed has
a bearing from the point of commercialization and marketing of such symbiotic foods
with nutraceutical value. Products containing probiotics and prebiotics could improve the
survival of the bacteria, crossing the upper part of the gastrointestinal tract, thus
enhancing their effects in the large bowel (Roberfroid, 2002). Moreover, probiotic and
prebiotic effects might be additive or even synergistic. These synbiotic foods represent an
exciting market opportunity for the food and dairy industries.
Chapter: 6, Section: 6.1
Synbiotic functional star fruits 173
Star fruits enriched with FOS along with E. hirae CFR 3001 and L. salivarius
CFR 2158 have shown good synbiotic properties and the survivability of probiotics in the
impregnated fruits was found to be highly significant. This is sufficient for a probiotic
effect, and is comparable to counts of probiotic bacteria in commercially available
products.
6.1.3.6. Microbiological analysis
Star fruits enriched with prebiotic FOS along with probiotics L. salivarius CFR
2158 and E. hirae CFR 3001 were found to be stable at ambient temperature (25±2 oC)
throughout the storage period (6 months). There were no bacterial counts, yeast/molds
and coliform detected in prebiotic and synbiotic star fruits up to 4 months of storage.
However, few colonies of coliform (17 to 24x102 cfu/100g) were observed at the end of
storage period (6 months). The storage study was limited to 6 months considering the
growth of coliforms. Observed numbers of yeasts and moulds were lower than bacteria.
Tournas (2005) obtained similar results with samples of fresh and minimally-processed
vegetables.
6.1.3.7. Sensory evaluation
Sensory attributes are the key factor in determining the shelf life of many food
products. The sensory scores for various attributes of prebiotic and synbiotic star fruits
are given in Table 6.1.1. As can be seen from the results the overall acceptability of
prebiotic and synbiotic star fruits did not show any significant difference (P>0.05) and
were found to be highly acceptable by the panelist. In synbiotic fruits, it is important that
the prebiotic component should impart good sensory properties by improving mouth feel
and texture of the product. Product quality and sensory properties of the final product
were highly acceptable indicating that the FOS with 1% probiotic cells resulted in a star
fruits with desirable sensory attributes.
The synbiotic star fruits exhibited all desirable sensory properties as in the case of
prebiotic star fruit. In general, substitution with prebiotic ingredients has a greater
influence on texture and aroma, whereas substitution with probiotics has a greater effect
on flavor and aroma. A number of authors reported that probiotic microorganisms

Chapter: 6, Section: 6.1
Synbiotic functional star fruits 174
affected the flavour of food product to which they were added. Bernardi et al., (2004)
observed that an acerola flavoured ice cream with fermented milk containing B. longum
and B. lactis had a moderate acceptance, whereas ice-cream not supplemented with these
microorganisms was well accepted by consumers.
In the present study, star fruit is shown to be an excellent vehicle for the
incorporation of probiotics like E. hirae CFR 3001 and L. salivarius CFR 2158 and the
prebiotic, FOS. The prebiotic ingredient is incorporated into the product matrix,
conferring and enforcing already existent bonding between different components of the
food, resulting in a palatable texture. Metabolism of the probiotic culture can result in the
production of components that may contribute negatively to the aroma and taste of the
product. In addition to this, it is also reported that Bifidobacterium spp. produce acetic
acid as a product of their metabolism, which resulted in a vinegary flavor in the product,
prejudicing the performance in sensory assessments (Tamime et al., 1995). In the present
study, however, the addition of 1% probiotics (E. hirae CFR 3001 and L. salivarius CFR
2158) did not adversely affect the sensory attributes of the final product.

Chapter: 6, Section: 6.1
Synbiotic functional star fruits 175
Table 6.1.1 Sensory attributes of prebiotic and synbiotic fruits
*Minimum acceptable score is 7.00
From the results obtained it was concluded that the probiotic E. hirae CFR 3001
was highly comparable with the reference culture, L. salivarius CFR 2158 for all the
properties studied. The star fruits enriched with prebiotic FOS along with probiotic E.
hirae CFR 3001 and L. salivarius CFR 2158 was in turn comparable with prebiotic
enriched star fruits without affecting the sensory and other properties. It is suggested that
novel synbiotic fruits can be prepared using prebiotics in combination with probiotics.
Star fruits
Sensory parameters
Colour Aroma/
Flavour
Firmness Juiciness Overall
acceptability
Prebiotic star fruit
(FOS)
8.00±0.25 8.00±0.16 7.00±0.22 7.00±0.25 8.00±0.25
Synbiotic star fruit
(FOS+ L. salivarius
CFR 2158)
8.00±0.25 8.00±0.25 8.00±0.16 7.00±0.25 8.00±0.25
Synbiotic star fruit
(FOS+ E. hirae
CFR 3001)
8.00±0.22 8.00±0.26 8.00±0.16 7.00±0.25 8.00±0.22

Chapter: 6, Section: 6.2
Probiotic and prebiotic enriched Shrikhand 176
CHAPTER: 6; SECTION: 6.2
SHRIKHAND: A FERMENTED MILK BASED DESSERT ENRICHEDWITH FRUCTOOLIGOSACCHARIDES AND PROBIOTIC
Enterococcus faecium CFR 3002
Chapter: 6, Section: 6.2
Probiotic and prebiotic enriched Shrikhand 177
6.2.1. Introduction
In the last couple of decades, the growing concern about health and life quality
has encouraged people to exercise regularly, eat healthy food and decrease the
consumption of food rich in sugar and salt. In addition, there has been an increase in the
demand by consumers for food with functional properties. With increased consumer
interest in reducing sugar intake, food products made with sweeteners other than sugar
have become more popular. The discovery of a great number of sweeteners has triggered
the development of new sugar free products, particularly for diabetics, people on special
diets and/or for the obese (Ozdemir and Sadikoglu, 1998). Artificial sweeteners are
alternative substances to table sugars, which give food a sweet taste (Ministério da
Saude, 1997), and are used to replace sucrose partially or totally. During the past few
decades, low-calorie artificial sweeteners, such as aspartame, saccharin, acesulfame and
sucralose, have become sugar alternatives to replace sucrose, and have been widely used
in dairy products (Calorie Control Council, 2002).
India has emerged as the largest milk producing country in the world (Lee, 2010).
A considerable portion of milk in India is utilized for the manufacture of indigenous
milk products viz. clarified butter (ghee), heat desiccated milk (khoa), acid coagulated
milk (chhana), Indian cheese (paneer) and varieties of sweets. Heat and acid coagulation,
heat desiccation, separation, fermentation etc are the different processing steps involved
in the preparation of above products (Patil, 2005). Indian fermented milk products utilize
only 7% of total milk produced (Aneja et al., 2002) and mainly includes three products
dahi (curd), shrikhand (sweetened concentrated curd) and lassi (stirred curd), which may
be considered as equivalent to western yoghurt, quarg and stirred yogurt, respectively.
Among various fermented milk products, the market for 'yogurt' has increased
considerably (Saavedra et al., 2004), owing to yogurt’s nutritional and therapeutic
benefits (Sarkar and Misra, 2002a). Today, organized dairies make only 1 to 2% of the
yoghurt consumed in India, but demand for industrially produced yoghurt is currently
growing at a pace of 20% per year. International Market Analysis Research and
Consulting (IMARC) Group, one of the world‘s leading research and advisory firms,
finds in its new report “Indian Dairy Market Report and Forecast 2011-2016” that the
growth of the organized dairy sector is expected to increase rapidly in the next five years

Chapter: 6, Section: 6.2
Probiotic and prebiotic enriched Shrikhand 178
reaching values worth US$ 29 Billion by 2016. The reports expect that by 2016, around
26% of the dairy market will be organized compared to 19% in 2010. This report
provides an analytical and statistical insight into the Indian dairy market.
Recently, attempts have been made to incorporate certain probiotic lactic acid
bacteria (LAB) with the objective of enhancing the dietetic properties of yoghurt. LABs
are of essential importance for their role in most industries of fermented foods as starter
cultures. Use of LAB in dairy industry has resulted in different cultured milk products
with improved preservation accompanied with characteristic flavor, aroma and texture,
non-identical from the original food (Kleerebezemab et al., 2000; Saloff-Coste, 1994).
There have been few reports on the use of certain probiotic LAB along with the starter
cultures in the preparation of traditional milk products. These include L. delbrueckii
subsp. bulgaricus, S. thermophilus, B. bifidum (Geetha et al., 2003) and L. delbrueckii
subsp. bulgaricus, S. thermophilus, L. dextranicum (Patil et al., 2006, Suryawanshi et al.,
2006) and L. casei, L. lactis subsp. diacetylactis (Sinha et al., 2005).
Enterococci are ubiquitous LAB that occurs frequently in large numbers in dairy
products and other fermented foods and are part of the normal intestinal microbiota. E.
faecalis, E. faecium and E. durans are the most frequently found species in dairy products
(Foulquie-Moreno et al., 2006). They play an important role in cheese making and
contribute to the development of the sensory characteristics of many varieties of cheese
(Manolopoulou et al., 2003).
All fermented milk products contain live LAB, unless they are pasteurized after
fermentation. The addition of probiotics to these products is a natural way of enhancing
the functionality of such products. The most common functional dairy products are with
probiotic bacteria, quite frequently enriched with prebiotics (Saxelin et al., 2003). Given
the commercial success and growth of yoghurt as a healthy choice among consumer, it is
considered a good vehicle for probiotics (Bran-non, 2006). Yoghurt, the oldest Indian
fermented milk product may be either sour or sweet, consumed directly as a part of diet.
It is also used as a base material for the preparation of certain fermented Indian dairy
products such as shrikhand, a popular Indian dessert belonging to the group of fermented
and coagulated milk products.
Chapter: 6, Section: 6.2
Probiotic and prebiotic enriched Shrikhand 179
The current chapter details the studies on preparation, physicochemical,
microbiological and sensory attributes of synbiotic shrikhand with fructooligosaccharides
(FOS) and probiotic Enterococcus faecium CFR 3002.
6.2.2. Materials and methods
6.2.2.1. Preparation of FOS powder
The FOS syrup of 58 °Brix was diluted to 30 °Brix using distilled water.
Maltodextrin [10% w/v)] and tri-calcium phosphate [0.5% (w/v)] were added to the
diluted FOS syrup and it was spray dried (BE 1216; Bowen engineering, Inc., Somerville,
New Jersey, USA) at an inlet temperature of 130-140 oC. An outlet air temperature of 90-
95 oC was maintained at a liquid flow rate of 60-70 ml/min, to obtain fine FOS powder
(57%).
6.2.2.2. Propagation of yoghurt starter cultures (Lactobacillus bulgaricus CFR 2028
and Streptococcus thermophilus ATCC 19258) and probiotic Enterococcus faecium
CFR 3002
L. bulgaricus and S. thermophilus were acquired from Central Food
Technological Research Institute culture collection center (CFR) and American Type
Culture Collection (ATCC) respectively and E. faecium CFR 3002 was isolated from
radish. These strains were activated by transferring it [10% (v/v)] to MRS broth, followed
by incubation at 37 °C for 24 h. Thereafter, the cultures were transferred [10% (v/v)] to
sterile reconstituted skim milk medium (3 ml of peptone broth and 6 ml of skim milk),
incubated at 37 °C for 15-18 h and used for further studies.
6.2.2.3. Preparation of shrikhand
Cow milk (1L, 3% fat Nandini milk; Packed and marketed by Mysore-
Chamarajanagar Dist., Co-operative milk producers societies union Ltd., Mysore,
Karnataka, India) was heated to 85 °C for 30 min, and then cooled to 40±2 °C. S.
thermophilus (1% v/v) and L. bulgaricus (1% v/v) in combination with probiotic E.
faecium CFR 3002 (2.0 % v/v) were inoculated to the milk and incubated for 10-12 h at

Chapter: 6, Section: 6.2
Probiotic and prebiotic enriched Shrikhand 180
40±2 °C using incubator (Alpha Scientific Co. Ranla Plaza, Bangalore, India). The pH of
the set curd at the end of 12 h was 4.6 to 4.8 with a corresponding acidity of 0.46 to
0.52% lactic acid. Lactic fermented curd was suspended in muslin cloth for 6 to 8 h to
separate out whey and the resultant solid mass known as ‘chakka’ was subsequently used
for the preparation of shrikhand with FOS and/or sucrose. The chakka was divided into
three equal portions. Each portion was thoroughly mixed with FOS (40%, w/w), sucrose
(cane sugar) (40%, w/w) (Patel and Chakraborty, 1982), and a blend of FOS (20%, w/w)
and sucrose (20%, w/w) till attains a semi-soft consistency and sweetish sour taste,
typical of shrikhand. No coloring and flavoring ingredients were added to the prepared
product. Fig 6.2.1 shows the photograph of prepared shrikhand with FOS (a), blend (b)
and sucrose (c).
Fig 6.2.1 Shrikhand with (a) FOS, (b) blend of FOS and sucrose, and (c) sucrose
a b
c

Chapter: 6, Section: 6.2
Probiotic and prebiotic enriched Shrikhand 181
The moisture content, water activity, colour, rheology, and FOS content of
shrikhand were determined. The viability of probiotics and other relevant microbiological
and sensory attributes were evaluated during two months of storage at refrigerated
temperature (4±2 °C). The structural analysis was also carried out.
6.2.2.4. Moisture content and water activity (aw)
The moisture content and aw were determined as detailed in section 2.2.3.1.
6.2.2.5. Colour
The colour was measured as per the protocol described in section 2.2.3.2.
6.2.2.6. Rheology
Strain controlled Rheometer (SR5, Rheometric Scientific) was used to measure
rheology of shrikhand. The tests were carried out on 25 mm Teflon plates with a gap of
1.0 mm between the plates. A thin coat of low viscosity silicon oil was applied to the free
surface of the sample to prevent moisture evaporation (Kulkarni et al., 2006). Gap setting
between the samples was performed slowly so as to avoid high shear rates during sample
loading and the same protocol was followed every time. Dynamic strain sweep and
frequency sweep experiments were performed at a temperature of 25 oC. Temperature
was controlled using a forced convection oven. The rheological data were analyzed with
the supporting software 1SR3:RS1 Orchestrator. The samples were first subjected to a
frequency sweep test using a frequency ramp from 0.1 to 10 Hz at a constant strain of
0.5% (determined from an amplitude sweep at 1 Hz) to ascertain the viscoelastic
properties. The storage and loss module and phase shift were recorded for all the samples.
6.2.2.7. FOS content of shrikhand
Shrikhand prepared with FOS, blend of FOS and sucrose, and sucrose along with
probiotic E. faecium CFR 3002 were taken (5 g), mixed with triple distilled water (5-10
ml) with rigorous stirring, and centrifuged at 8000 rpm for 20 min. The aqueous phase
was filtered using 0.22 µ filter membranes (Millipore Pvt. Ltd, India). Appropriately

Chapter: 6, Section: 6.2
Probiotic and prebiotic enriched Shrikhand 182
diluted samples were analyzed by HPLC (SCL-6B, Shimadzu, Japan) as explained in
section 2.2.3.5 (Sangeetha et al., 2002).
6.2.2.8. Ultrastructure by Scanning Electron Microscope (SEM)
Structural analysis of shrikhand enriched with FOS, blend, and sucrose along with
E. faecium CFR 3002 were carried out using SEM [Leo 435 VP, Leo Electron
Microscopy Ltd. (Zeiss), Cambridge, U.K]. The shrikhand smear was prepared on a
cover slip and was fixed using glutaraldehyde (2% in 0.1 M phosphate buffer; pH 7.2 to
7.4) at 4 °C, for 24 h. The samples were dehydrated as explained under the section
2.2.3.6. Gold-coated samples were examined at 20000x magnification.
6.2.2.9. Viability of probiotics
The survivability of total probiotics in shrikhand [freshly prepared (0 day) and
stored at 4±2 oC] was carried out at 20 day intervals following viable cell count method
as described in section 6.1.2.6.
6.2.2.10. Storage studies
Shrikhand samples sweetened with FOS, blend, and sucrose along with E.
faecium CFR 3002 were placed in glass bowls covered with glass lid and were stored at
4±2 °C. The shelf stability was determined initially and at 20 days intervals up to 60 days
of storage by standard plate count method as described in section 2.2.3.7.
6.2.2.11. Sensory Analysis
Sensory attribute of shrikhand sweetened with FOS, blend, and sucrose along
with E. faecium CFR 3002 was carried out using the protocol explained in section
2.2.3.8.
6.2.2.12. Statistical analysis
Statistical analysis was carried out using a one-way analysis of variance (ANOVA),
Origin 6.1 Software. Means were separated using the least significant difference test. Significance
was defined at P<0.05.

Chapter: 6, Section: 6.2
Probiotic and prebiotic enriched Shrikhand 183
6.2.3. Results and discussion
6.2.3.1. Moisture content and water activity (aw)
Moisture content of shrikhand enriched with FOS, blend and sucrose along with
probiotic E. faecium CFR 3002 was 45.05%, 45.13%, and 44.88% respectively and the
corresponding aw was 0.88, 0.89, and 0.89. The FOS sweetened shrikhand did not show
any significant difference in moisture content, when compared with sucrose sweetened
shrikhand. There were no significant differences (P>0.05) in the moisture content and aw
of all the samples over a period of 60 days storage. Thus, the result indicated that the
addition of FOS and probiotic E. faecium CFR 3002 had not resulted in any undesirable
changes in the physicochemical characteristics of the shrikhand.
6.2.3.2. Colour
The L* a* b* values (Fig 6.2.2) of shrikhand enriched with prebiotic FOS, blend
and sucrose along with probiotic E. faecium CFR 3002 were measured immediately after
its preparation (0 day), and after storage for 20, 40 and 60 days at refrigerated
temperature (4±2 °C). As can be seen from the Fig., the L*and b* values of shrikhand
sweetened with FOS and blend of FOS and sucrose decreased gradually as the storage
increased to 60 days. Where as a* value of shrikhand did not show any significant
difference (P>0.05) during this period. Similar trend was observed in the case of sucrose
sweetened shrikhand, during the same storage period. The change in L* value of FOS,
blend and sucrose sweetened shrikhand ranged from 71.10 to 65.79, 71.55 to 67.15 and
73.10 to 66.44 respectively and the change in b* value ranged from 10.92 to 7.37, 11.50
to 7.88 and 11.37 to 7.82 respectively over 60 days storage. L* value is an estimation of
whiteness (Owens et al., 2001). Consumers have the highest appeal for products with
appealing visual properties and the perception of products whiteness has been reported to
have the most positive influence on increasing consumer appeal (Hutchings et al., 1994).
The decrease in L* value is most likely attributable to the decreased size of casein
micelles.
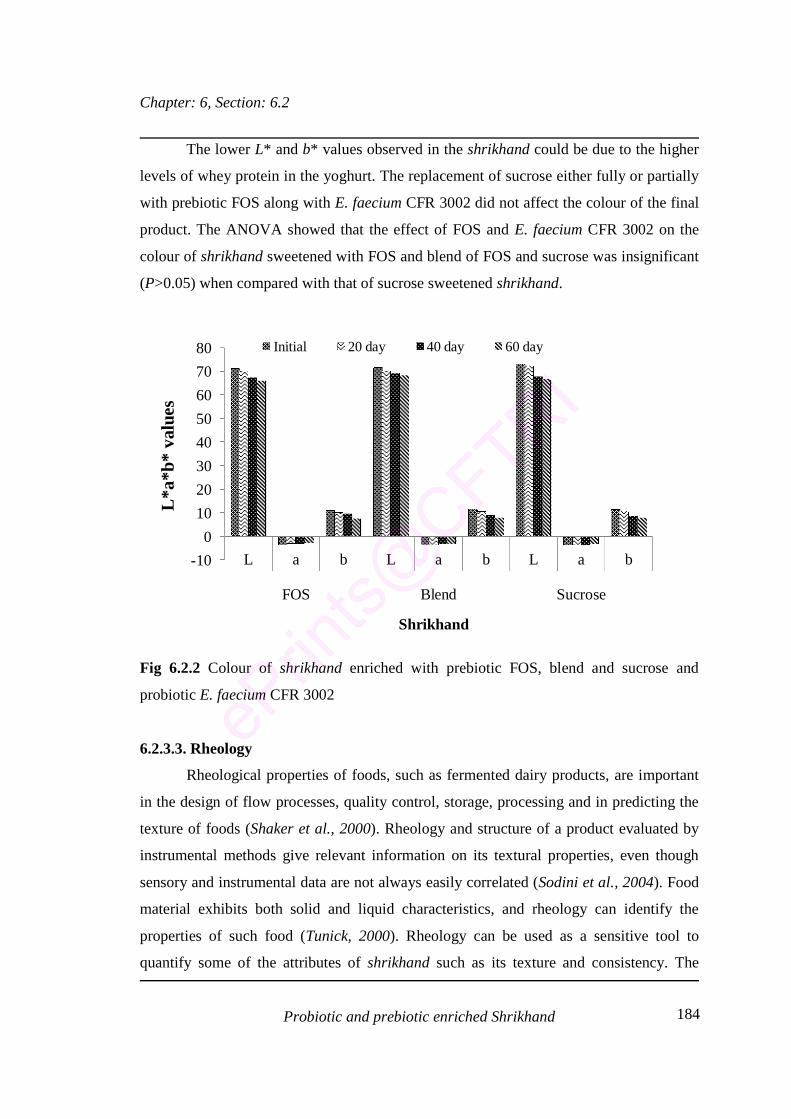
Chapter: 6, Section: 6.2
Probiotic and prebiotic enriched Shrikhand 184
The lower L* and b* values observed in the shrikhand could be due to the higher
levels of whey protein in the yoghurt. The replacement of sucrose either fully or partially
with prebiotic FOS along with E. faecium CFR 3002 did not affect the colour of the final
product. The ANOVA showed that the effect of FOS and E. faecium CFR 3002 on the
colour of shrikhand sweetened with FOS and blend of FOS and sucrose was insignificant
(P>0.05) when compared with that of sucrose sweetened shrikhand.
-10
0
10
20
30
40
50
60
70
80
L a b L a b L a b
FOS Blend Sucrose
L*a
*b*
val
ues
Shrikhand
Initial 20 day 40 day 60 day
Fig 6.2.2 Colour of shrikhand enriched with prebiotic FOS, blend and sucrose and
probiotic E. faecium CFR 3002
6.2.3.3. Rheology
Rheological properties of foods, such as fermented dairy products, are important
in the design of flow processes, quality control, storage, processing and in predicting the
texture of foods (Shaker et al., 2000). Rheology and structure of a product evaluated by
instrumental methods give relevant information on its textural properties, even though
sensory and instrumental data are not always easily correlated (Sodini et al., 2004). Food
material exhibits both solid and liquid characteristics, and rheology can identify the
properties of such food (Tunick, 2000). Rheology can be used as a sensitive tool to
quantify some of the attributes of shrikhand such as its texture and consistency. The

Chapter: 6, Section: 6.2
Probiotic and prebiotic enriched Shrikhand 185
literature on the rheology of shrikhand is relatively scarce and more work with different
sweetener/prebiotics is required to understand the effect of rheology on the texture and
consistancy of shrikhand. The flow behaviour of its precursor yogurt has been widely
studied and reviewed (O’Donnell and Butler, 2002a; O’Donnell and Butler 2002b; van
Marle et al., 1999). Rheometers working in dynamic mode are used to calculate storage
and loss modulus that describe the elastic and viscous properties of the gelling system,
respectively (Sodini et al., 2004).
Elasticity, viscosity and stress are some of the rheological properties, which are
generally studied. These properties are studied in terms of different modulous like storage
(G´), loss (G´´), complex (G*) modulii and phase angle; tan delta (δ). To study the
viscoelastic behaviour of shrikhand prepared with FOS, blend and sucrose, the sweep of
G´ and G´´ modulii with respect to dynamic frequency sweep (DFS) was carried out.
The DFS shows that the value of storage modulus (G´) is greater than loss
modulus (G´´) over a measurable frequency range in all the shrikhand samples. In case of
FOS enriched shrikhand the value of storage and loss moduli is slightly on higher side
when compared to shrikhand sweetened with that of blend and sucrose. However, not
much difference was found in magnitude of elastic and viscous modulii during frequency
sweep experiments. Shrikhand prepared with FOS, blend and sucrose along with E.
faecium CFR 3002 seem to be consistent along with the frequency (Fig 6.2.3). It has been
reported that the shrikhand exhibits a combination of several rheological properties such
as weak gel-like visco-elasticity, an apparent yield stress and long structural recovery
time scales (Kulkarni et al., 2005). From the result obtained, it can be concluded that the
FOS enriched shrikhand exhibited better gel like consistency, as in case of blend and
sucrose without affecting other properties like color, microstructure etc.

Chapter: 6, Section: 6.2
Probiotic and prebiotic enriched Shrikhand 186
0
500
1000
1500
2000
2500
3000
3500
4000
4500
5000
0 2 4 6 8 10
Sucrose Blend FOS
Frequency
0
500
1000
1500
2000
2500
3000
0 2 4 6 8
Sucrose Blend FOS
Frequency (Hz)
b
Fig 6.2.3 Rheology [(a) storage and (b) loss modulus] of shrikhand enriched with
prebiotic FOS, blend and sucrose along with probiotic E. faecium CFR 3002

Chapter: 6, Section: 6.2
Probiotic and prebiotic enriched Shrikhand 187
6.2.3.4. FOS content
Fig 6.2.4 shows the FOS content of shrikhand enriched with FOS and blend of
FOS and sucrose along with probiotic E. faecium CFR 3002. The initial (0 day) FOS
content of shrikhand enriched with FOS and blend of FOS and sucrose was found to be
10.32 g/100g and 5.55 g/100g respectively. It was found to be decreased to 6.16 g/100g
and 1.76 g/100g at the end of the storage period (60 days) at 4±2 oC. The popularity of
dairy products prepared with prebiotics and probiotics continues to increase, as
consumers desire appetizing foods that will fulfill their health needs. The incorporation of
prebiotics can increase the mouth feel attributes of the product while providing an
adequate sweetness level (Guggisberg et al., 2009). Shrikhand enriched with prebiotic
FOS can therefore drive preference and present additional health benefits, beyond
traditional ingredients. The result shows that, the FOS could be a good replacer to sucrose
in the preparation of any milk based products. It is used in a wide range of foods (Renuka
et al., 2010) and beverages (Renuka et al., 2009), as it doesn't interact with any
commonly used food ingredients.
0
2
4
6
8
10
12
Initial 20 day 40 day 60 day
FO
Sco
nte
nt
(g/1
00g
)
Storage period
FOS Blend
Fig 6.2.4 FOS content of shrikhand enriched with FOS and blend of FOS and sucrose

Chapter: 6, Section: 6.2
Probiotic and prebiotic enriched Shrikhand 188
6.2.3.5. Ultrastructure by Scanning Electron Microscope (SEM)
The composition of shrikhand and the processing conditions determine its
microstructure, which in turn decides the texture and consistency of the product.
Microstructure of shrikhand enriched with FOS, a blend of FOS and sucrose, and sucrose
along with probiotic E. faecium CFR 3002 are presented in Fig 6.2.5 (a), (b) and (c)
respectively. It is well recognized that the structure of foods greatly affects their various
properties including texture, functionality and appearance. Microstructure has a major
impact on the texture and other physical properties of acid milk gels. Various factors such
as heating of milk, total solids content, pH, lactic acid bacteria and thickening agents
have been reported to affect the microstructure of milk based products (Kalab et al.,
1983).
The formation of the microstructure and its firmness as affected by the type of
culture, extent of syneresis, and thermal treatment has been studied by many researchers
(Haque et al., 2001; Lucey, 2001; Lucey et al., 1999). It would be interesting to see the
effect of a prebiotic FOS, compared to sucrose, on shrikhand gel network formation.
SEM observation revealed that in the presence of either FOS or a blend of FOS and
sucrose, the shrikhand matrix was predominantly casein micelles arranged in double
longitudinal polymers [Fig 6.2.5 (a) and (b)] along with clusters in some spots. Where as
in case of shrikhand sweetened with sucrose, casein micelles associated in the form of
clusters [Fig 6.2.5 (c)], causing the matrix to form small void spaces.
The present study showed that there was slight difference in the microstructure of
shrikhand enriched with FOS, when compared with that of sucrose sweetened shrikhand.
Even though, there observed a slight difference by SEM analysis, the texture of
shrikhand was palatable and acceptable by the panelist.

Chapter: 6, Section: 6.2
Probiotic and prebiotic enriched Shrikhand 189
Fig 6.2.5 Scanning electron micrograph (SEM) of shrikhand enriched with (a) FOS, (b) a
blend of FOS-sucrose, and (c) Sucrose
a
b
c

Chapter: 6, Section: 6.2
Probiotic and prebiotic enriched Shrikhand 190
6.2.3.6. Viability of total probiotics
Milk based products generally have a shelf life of <40 days and viability of
probiotic bacteria in products over long shelf life at refrigerated temperature is reported
to be poor (Dave and Shah, 1997). Several researchers have reported poor survival of
probiotics in milk based product during refrigerated storage (Gilliland and Speck, 1997).
The survival of total probiotics in shrikhand enriched with FOS, blend of FOS and
sucrose and sucrose, along with probiotic E. faecium CFR 3002 are given in Table 6.2.1.
No change (P>0.05) in the colony counts of total probiotics was observed for 20 days of
storage at 4±2 oC. There was slight decrease in the viable count of probiotics from 40
days and at the end of storage period (60 days) and the population of all the probiotics
was ≥140 x 106 cfu/g. This is well above the levels suggested as providing therapeutic
benefits (Boylston et al., 2004). All the three types of shrikhand showed similar trends
with slight decrease in viable probiotics which confirms that the probiotic cultures
remained viable in the product until the end of storage (60 days) which is satisfactory for
the shrikhand to be claimed as probiotic shrikhand. Desai et al., (2004) and Ozer et al.,
(2005) have reported improvement in the survival of probiotics in yoghurt in the presence
of inulin. Similarly, the presence of FOS could also have contributed to the survival of the
probiotics during storage.

Chapter: 6, Section: 6.2
Probiotic and prebiotic enriched Shrikhand 191
Table 6.2.1 Total probiotics* of shrikhand enriched with prebiotic FOS, blend of FOS
and sucrose and sucrose along with probiotic E. faecium CFR 3002 stored at refrigerated
temperature (4±2 oC)
6.2.3.7. Sensory analysis
The results of sensory attributes of shrikhand are presented in Table 6.2.2.
Analysis of variance explicit that shrikhand enriched with prebiotic FOS and probiotic E.
faecium did not show any significant changes (P>0.05) with respect to sensory attributes
like color, taste, texture, flavor, mouth-feel and overall acceptability. No significant
differences (P>0.05) were observed between the overall quality scores of shrikhand
enriched with FOS, blend and sucrose, though the scores of sucrose sweetened shrikhand
was slightly on higher side. The result indicated that the shrikhand containing FOS in
replacement of sucrose is sensorially acceptable and microbiologically safe with tendency
to have extended shelf-life. Shrikhand enriched with FOS and blend have obtained fairly
good score when compared with sucrose sweetened shrikhand. Sensory scores showed
that blend was preferred by the panelists because it gave the desired taste to the
shrikhand, yet FOS enriched shrikhand was also acceptable by them. The results
Storage period
(days)
Total probiotics (cfu/100g)
FOS Blend Sucrose
0 >300x106 >300x106 >300x106
20 >300x106 >300x106 >300x106
40 281x106 274x106 256x106
60 172x106 148x106 141x106

Chapter: 6, Section: 6.2
Probiotic and prebiotic enriched Shrikhand 192
concerning with the score for colour, texture and mouth feel of shrikhand disclosed a
very similar scores between the samples. Overall acceptability was determined on the
basis of quality scores obtained from the evaluation of color, taste, flavor, texture and
mouth feel of the shrikhand. This makes FOS not only promising sugar substitute but
alternative sweetener with real practical applicability in this type of products. The
products with prebiotics and probiotics can therefore drive preference and present
additional health benefits, beyond what traditional ingredients such as sweeteners.
Table 6.2.2 Sensory attributes of shrikhand enriched with prebiotic FOS, blend of FOS
and sucrose and sucrose along with probiotic E. faecium CFR 3002 stored at refrigerated
temperature (4±2 oC)
Shrikhand
Sensory parameters
Colour Texture Mouth feel Flavour TasteOverallquality
FOS 9±0.05 9±0.15 8±0.10 9±0.05 7.5±0.15 8±0.10
Blend 9±0.10 9±0.10 8±0.20 9±0.15 8±0.20 8±0.15
Sucrose 9±0.10 9±0.12 9±0.16 9±0.10 9±0.05 9±0.05
* Minimum acceptable score is 7.0
6.2.3.8. Storage studies
Shrikhand has a long shelf-life compared with other cultured milk products and
has been reported to be stable for >30 days (Sarkar et al., 1996b). The higher shelf-life of
shrikhand than other milk based products may be due to higher acidity, reduced water
content and the addition of sugar (Sharma and Zariwala, 1980). The analysis of freshly
prepared shrikhand showed no growth (plate count, yeast/molds and coliform) at zero
day. However, the number of colony forming unit (CFU) increased (20 to 25x102
cfu/100g) at the end of storage period (60 days). The presence of low number of CFU in

Chapter: 6, Section: 6.2
Probiotic and prebiotic enriched Shrikhand 193
the shrikhand prepared with replacement of FOS is associated with rather rare ability of
microorganisms to metabolize FOS compared with the microbial utilization of sucrose
(Winkelhausen and Kuzmanova, 1998). In view of these observations, the synbiotic
shrikhand enriched with FOS along with probiotic are not only microbiologically safe but
their shelf-life could be much longer too.

Chapter: 7
Summary, Conclusion and Future perspectives 194
CHAPTER: 7
SUMMARY AND CONCLUSION

Chapter: 7
Summary, Conclusion and Future perspectives 195
7.1. Summary and Conclusion
The incidence of acute and chronic gut disorders continues to rise, with many
diseases being untreatable. The functional food industry’s perception of the importance of
gut microbiology in human health and nutrition has led to a major increase in the
development of probiotic and prebiotic based products. In this context, the thesis titled
‘Biotechnological approaches for the preparation of fructooligosaccharides (FOS)
based prebiotic and probiotic foods’ presents the details of the study carried to enrich
fruits and vegetables and a few selected Indian traditional foods with FOS and probiotic
lactic acid bacteria (LAB). The important observations made in this study are
summarized as follows.
A few fruits and vegetables (apple, banana, jack fruit, papaya, sapota, star
fruit, ashgourd, pumpkin and carrot) were enriched with FOS, a low calorie
prebiotic, using vacuum osmotic dehydration (VOD) process. The study
clearly indicated that FOS could be a healthier alternative to the sugar solution
normally used for the preparation of osmotically dehydrated fruits and
vegetables.
The FOS content in the final product (FOS enriched fruits and vegetables) was
found to be 8.02-17.21 g/100g product. The results also implied that the effect
of process parameters such as temperature, pressure, vacuum treatment time
and atmospheric restoration period could be varied in order to get a desired
FOS content.
The following conditions- vacuum pressure of 550 mm Hg, temperature of 45
oC, vacuum treatment time of 45 min and atmospheric restoration period of
16.44 min- were found to be optimum to maximize uptake of FOS in banana
using VOD. These optimized conditions resulted in an FOS uptake of 9.64
g/100g banana and the products exhibited a shear strength value of 13.42 N.

Chapter: 7
Summary, Conclusion and Future perspectives 196
Response surface methodology (RSM) and graphical optimization methods
were effective in ascertaining the optimum processing conditions for VOD of
banana slices. Analysis of variances showed that the effects of all the process
variables were statistically significant for FOS uptake. Second order
polynomial models were obtained for predicting FOS uptake and shear
strength of banana slices. This methodology could, therefore, be successfully
employed to study the importance of individual, cumulative and interactive
effects of the test variables in vacuum osmotic processes.
The pH, total soluble solids, titratable acidity, colour and viscosity of selected
fruit juice beverages (pineapple, mango and orange juice) fortified with FOS
did not change significantly (P>0.05) during 6 months storage at ambient
(25±2 °C) and refrigeration temperature (4 °C). The initial FOS contents of
pineapple, mango and orange juices were 3.79, 3.45, and 3.62 g/100ml
respectively. The fruit juice beverages stored at refrigeration temperature
showed 2.00-2.39 g/100ml FOS after six months of storage. However, fruit
juice beverages stored at ambient temperature (25±2 °C) showed a gradual
reduction in FOS content after the second, fourth and sixth months (2.69-3.32,
1.65-2.08 and 0.38-0.58 g/100ml) respectively.
There were no undesirable changes in the physicochemical characteristics of
the fruit juice beverages fortified with FOS. The sensory analysis showed that
the fruit juice beverages fortified with FOS were acceptable up to 4 and 6
months storage at ambient and refrigeration temperature respectively.
Gulab jamun, a traditional Indian sweet, was prepared by replacing sucrose
with FOS and FOS-sucrose blend. The FOS content was found to be 17.58
and 9.18 g/100g respectively. The effect of FOS enrichment on colour,
texture, sensory and microbiological attributes was evaluated. FOS and FOS-
sucrose blend did not affect colour values and sensory scores of gulab jamun,

Chapter: 7
Summary, Conclusion and Future perspectives 197
adversely which slightly decreased during storage for 4 days at ambient
temperature (25±2 °C).
The results also indicated the possibility of using FOS as an effective
alternative either fully or partially for the preparation of gulab jamun. In
addition, FOS sweetened gulab jamun would have an added advantage over
that of sucrose based jamun from the point of low calorie, non digestibility
and other well known health benefits of FOS.
LAB isolates (17) from fruits and vegetables were tested for their probiotic
features such as their ability to withstand low pH, high bile salt concentration,
and cell surface hydrophobicity. The selected LAB isolates were able to
survive (>80% and 70%) at low pH (2.5) and relatively high bile (1.0%)
concentration.
Out of 17 LAB isolates, 2 isolates (Cu8 and R32) were categorized as potent
probiotics based on the studied probiotic properties and were assigned to the
genera Enterococcus on the basis of morphological, biochemical,
physiological characteristics and 16S rRNA gene sequencing. The 2 isolates,
Cu8 and R32, were identified and designated as Enterococcus hirae CFR
3001 and Enterococcus faecium CFR 3002.
A synbiotic star fruit enriched with prebiotics (FOS) and probiotics (L.
salivarius CFR 2158 and E. hirae CFR 3001) was prepared. The FOS content
of the prepared synbiotic star fruits was 17.80-20.24 g/100g (initial day). The
star fruits stored at ambient temperature (25±2 oC) had retained 16.09-18.62
g/100g FOS after 6 months of storage. Impregnation of FOS syrup along with
L. salivarius CFR 2158 and E. hirae CFR 3001 into structural matrix of fresh
star fruit tissue resulted in synbiotic star fruits with probiotics ranging 138-
178x106 cfu/g up to 4 months of storage at ambient temperature (25±2 oC).

Chapter: 7
Summary, Conclusion and Future perspectives 198
The survivability (34x106 cfu/g and 26x106 cfu/g) of probiotics (L. salivarius
CFR 2158 and E. hirae CFR 3001 respectively) at the end of the storage
period (6 months) in synbiotic star fruit is well within the
recommended/desired concentration (106 cfu/g probiotics) in food at the time
of consumption, sufficient enough to exert the beneficial probiotic effect on
the host. The final product exhibited desirable textural and sensory attributes.
These synbiotic functional star fruits can be successfully marketed for the
improvement of health through the promotion of a proper balance of gut
microflora.
The study also intended to evaluate the effects of FOS on the
physicochemical, microbiological and sensory characteristics of shrikhand
enriched with probiotic E. faecium CFR 3002. The result indicated that the
shrikhand containing FOS in replacement of sucrose is sensorially acceptable
and microbiologically safe. The initial FOS content of shrikhand enriched
with FOS and blend of FOS and sucrose was found to be 10.32 g/100g and
5.55 g/100g respectively. It was found to be decreased to 6.16 g/100g and
1.76 g/100g during storage period of 60 days at 4±2 oC.
The survival of total probiotics in shrikhand enriched with FOS, blend of FOS
and sucrose and sucrose did not change significantly (P>0.05) up to 20 days
of storage at 4±2 oC. The population of all the probiotics was ≥140 x 106 cfu/g
from 40 days and at the end of storage period (60 days) which is satisfactory
for the shrikhand to be claimed as probiotic shrikhand. The result suggested
that the FOS could be a healthier alternative to sucrose in the preparation of
certain milk based products.
The research work carried out encompasses the evaluation of FOS as a novel
osmotic agent for impregnation of fruits and vegetables using VOD process, followed by
the optimization of process parameters using banana as a case study. Preparation and
characterization of FOS based fruit juice beverages and gulab jamun, isolation and
Chapter: 7
Summary, Conclusion and Future perspectives 199
characterization of potent probiotic cultures from fruits and vegetables and their use in
the production of synbiotic start fruits and synbiotic shrikhand are the other studies
presented in the thesis.
7.2. Future perspectives
The beneficial properties of prebiotics and probiotics offer a new dimension for
the development of functional fruits and vegetable foods. Opportunities exist in exploring
the improved knowledge of the synbiotic relationships between colonic microbiota,
prebiotics and whole body physiopathology. Fruits and vegetable juices are logical
matrices for the addition of prebiotic and probiotic compounds, not only because
beverage market is ever growing but also it is rich source of desirable healthier ingredient
of our diet. A likely expansion of the fruits and vegetable juice market which contain
either one (pre/probiotic) or both (synbiotics) of these bioactive ingredients is envisaged.
However, adding prebiotics and probiotics to fruits and vegetable foods offers many
technological challenges and there is much place for future research.
Improved or new methods to enhance the stability during storage are certainly
desirable. Furthermore, little is known of the functionality of these products. In particular,
can health claims obtained with probiotics and prebiotics be transferred to fruits and
vegetables which carry the same bioactive principles? Consumers increasingly wish to
ingest bioactive ingredients through foods rather than any other route. Therefore, the
health community would surely benefit from using fruits and vegetable products as
matrix bases to carry their active components to patients. Another alternative matrix for
the incorporation of prebiotics and probiotics is the traditional Indian foods, especially
fermented diary products. The results from the present study using gulab jamun and
shrikhand, the two most popular traditional Indian delicacies, expand the scope of similar
traditional foods as better carriers of functional food ingredients.
The emergence of prebiotics and probiotics as important elements of a healthy
diet has been accompanied by sophisticated technological developments in the food
industry. Predictions are that the demand for nutraceuticals and functional food additives
will continue to grow, stimulated by new products and an increasing number of health
conscious consumers. Functional foods are definitely here to stay. However, to what

Chapter: 7
Summary, Conclusion and Future perspectives 200
extent products enriched with prebiotics and probiotics will contribute to sustained
growth in this sector, depends on the results of research in validating the perceptions of
the health benefits of these bioactive ingredients and the efforts of the food industry in
formulating and promoting products which carry these benefits to the consumer.

201
Bibliography
BIBLIOGRAPHY

202
Bibliography
Aachary AA & Prapulla SG. Value addition to spent osmotic sugar solution
(SOS) by enzymatic conversion to fructooligosaccharides (FOS), a low calorie
prebiotic. Innovative Food Science and Emerging Technologies. 2009, 10 (2):
284-288.
Abdelbasset M & Djamila K. Antimicrobial activity of autochthonous lactic acid
bacteria isolated from Algerian traditional fermented milk “Raïb”. African
Journal of Biotechnology, 2008, 7: 2908-2914.
Ade-Omowaye BIO, Rastogi NK, Angersbach A, & Knorr D. Osmotic
dehydration behavior of red paprika (Capsicum annuum L.). Journal of Food
Science, 2002, 67: 1790-1796.
Alander M, Matto J, Kneifel W, Johansson ML, Kogler B, Crittenden R, Mattila-
Sandholm T & Saarela M. Effect of galacto-oligosaccharide supplementation on
human faecal microflora and on survival and persistence of Bifidobacterium lactis
Bb-12 in the gastrointestinal tract. International Dairy Journal, 2001, 11: 817-
825.
Albors A, Salvatori D, Andres A, Chiralt A & Fito P. Structure changes profiles
in apple tissue during mass transfer phenomena. In Proceedings of the Meeting on
Minimally Processing of Foods and Process Optimization, 1996. Copernicus
Program Warsaw.
Alegro LCA, Alegro JHA, Cardarelli HR, Chiu MC & Saad SMI. Potentially
probiotic and synbiotic chocolate mousse. LWT-Food Science and Technology,
2007, 40: 669-675
Alzamora SM, Salvatori D, Tapia MS, Lopez-Malo A, Welti-Chanes J & Fito P.
Novel functional foods from vegetable matrices impregnated with biologically
active compounds. Journal of Food Engineering, 2005, 67: 205-214.
Alzamora SM, Gerschenson LN, Vidales S & Nieto A. Structural changes in the
minimal processing of fruits: Some effects of blanching and sugar impregnation.
1997. In Fito P, Ortega-Rodriguez E & Barbosa-Canovas GV (Ed.). Food
Engineering, 2000, 117-140. New York: Chapman & Hall.
203
Bibliography
Alzamora SM, Tapia MS, Leunda A, Guerrero SN, Rojas AM, Gerschenson LN
& Parada-Arias E. Minimal preservation of fruits: A cited project. In Lozano JE,
Anon C, Parada-Arias E & Barbosa-Canovas GV (Ed.). Trends in food
engineering, 2000, 205-225. Pennsylvania: Technomic Publishing Company.
Chapter 16.
Alzamora SM & Gerschenson LN. Effect of water activity depression on textural
characteristics of minimally processed fruits. In Barbosa-Canovas GV, Lombardo
S, Narsimhan G & Okos MR. New frontiers in food engineering. Proceedings of
the Fifth Conference of Food Engineering, 1997, 72-75. New York: AICHE.
Andres I, Salvatori D, Chiralt A & Fito P. Vacuum impregnation viability of some
fruits and vegetables. 2001. In Fito P, Chiralt A, Barat JM, Spiess WEL,
Behsnilian D, Barat JM, Spiess WEL & Behsnilian D (Ed.). Osmotic dehydration
and vacuum impregnation. Behsnilian.
Aneja RP, Mathur BN, Chandan RC & Benerjee AK. Technology of Indian milk
products; Dairy India Publication, New Delhi, 2002.
Anikó-Matusek, Bálint Czukor, Péter Merész & Ferenc Örsi. Comparison of
diffusion of fructo-oligosaccharide components during vacuum impregnation and
osmotic dehydration. European Food Research and Technology, 2008, 227 (2):
417-423.
AOAC. Official methods of analysis. International volume I and II, 18th Edition,
Revision 1. 2006.
AOAC, Association of Official Analytical Chemists. Official methods of analysis.
1980, 14th Ed. Washington, DC.
APHA (American Public Health Association). Standard methods for the
examination of dairy products, 1967, D.C. 79, 12th Ed. Washington.
Argaiz A, Lopez-Malo A, Palou E & Welti J. Osmotic dehydration of papaya with
corn syrup solids. Drying Technology, 1994, 12: 1709-1725.
Arora S, Gawande H, Narendra K, Yarrakula S, Singh VP, Sharma V, Wadhwa
BK, Tomer SK & Sharma GS. Textural and structural properties of kalakand

204
Bibliography
made with artificial sweeteners-saccharin, acesulfame-k, sucralose and aspartame.
Journal of Food Science and Technology, 2008, 45 (3): 263-266.
Arora S, Singh VP, Yarrakula S, Gawande H, Narendra K, Sharma V, Wadhwa
BK, Tomer SK & Sharma GS. Textural and microstructural properties of burfi
made with various sweeteners. Journal of Texture Studies, 2007, 38: 684-697.
Asahara T, Nomoto K, Shimizu K, Watanuki M & Tanaka R. Increased resistance
of mice to Salmonella enterica serovar Typhimurium infection by synbiotic
administration of bifidobacteria and transgalactosylated oligosaccharides. Journal
of Applied Microbiology, 2001, 91: 985-996.
Audisio MC, Oliver G & Apella MC. Protective effect of Enterococcus faecium
J96, a potential probiotic strain, on chicks infected with Salmonella Pullorum.
Journal of Food Protection, 2000, 63 (10): 1333-1337.
Audisio MC, Oliver G & Apella MC. Antagonistic effect of Enterococcus
faecium J96 against human and poultry pathogenic Salmonella spp. Journal of
Food Protection, 1999, 62 (7): 751-755.
Azoubel PM & Murr FEX. Mass transfer kinetics of osmotic dehydration of
cherry tomato. Journal of Food Engineering, 2004, 61: 291-295.
Bamba T, Kanauchi O, Andoh A & Fujiyama Y. A new prebiotic from
germinated barley for nutraceutical treatment of ulcerative colitis. Journal of
Gastroenterology and Hepatology, 2002, 17: 818-824.
Barat JM, Talens P, Barrera C, Chiralt A & Fito P. Pineapple candying at mild
temperature by applying vacuum impregnation. Journal of Food Science, 2002,
67 (8): 3046-3052.
Barat JM, Chiralt A & Fito P. Effect of osmotic solution concentration,
temperature and vacuum impregnation pretreatment on osmotic dehydration
kinetics of apple slices. Food Science and Technology International, 2001, 7:
451-456.
Barat JM, Chiralt A & Fito P. Equilibrium in cellular food osmotic solution
systems as related to structure. Journal of Food Science, 1998, 63: 836-840.

205
Bibliography
Barbosa-Canovas GV & Vega-Mercado H. Osmotic dehydration. Dehydration of
foods. Florence: International Thomson Publishing, 1996, 265-288.
Begley MC, Gahan GM & Hill C. The interaction between bacteria and bile.
FEMS Microbiology Reviews, 2005, 29: 625-651.
Belem MAF. Application of biotechnology in the product development of
nutraceuticals in canada. Trends in Food Science Technology, 1999, 10: 101-106.
Bellisle F, Diplock AT & Hornstra G. Functional food science in Europe. British
Journal of Nutrition, 1998, 80: 3-4.
Benno Y, Sawada K & Mitsuoka T. The intestinal microflora of infants:
composition of fecal flora in breastfed and bottle-fed infants. Microbiology and
Immunology, 1984, 28: 975-986.
Bernardi S, Bodini RB & Favaro-Trindade CS. Avaliac-a osensorial de sorvete
de acerola com propriedades probioticas. In Proceedings of the 19th Congresso
brasileiro de ciencia e tecnologia de alimentos. Campinas: Sociedade Brasileira
de Cie ncia e Tecnologia de Alimentos, 2004, 138.
Berner LA & O’Donnell JA. Functional foods and health claims legislation:
applications to dairy foods. International Dairy Journal, 1998, 8: 355-362.
Betalleluz-Pallardel N, Betoret D Campos & Fito P. Prebiotic fortification of
apple by vacuum impregnation. International Conferences on Food Innovation,
2010, 25-29 October.
Betoret N, Puente L, Diaz MJ, Pagan MJ, Garcia MJ, Gras ML, Martinez-Monzo
J & Fito P. Development of probiotic enriched dried fruits by vacuum
impregnation. Journal of Food Engineering, 2003, 56 (2-3): 273-277.
Biazus JPM, Souza AG, Santana JCC, Souza RR & Tambourgi EB. Optimization
of drying process of Zea mays malt to use as alternative source of amylolytics
enzymes. Brazilian Archive of Biology and Technology, 2005, 48 (6): 185-190.
Bielecka M, Biedrzycka E & Majkowska A. Selection of probiotics and prebiotics
for synbiotics and confirmation of their in vivo effectiveness. Food Research
International, 2002, 35: 125-131.

206
Bibliography
Birnboim HC & Doly J. A rapid alkaline extraction procedure for screening
recombinant plasmid DNA. Nucleic Acids Research, 1979, 7 (6): 1513-1523.
Biswal RN & Bozorgmehr K. Mass transfer in mixed solute osmotic dehydration
of apple rings. ASAE Transactions, 1992, 35: 257-262.
Biswal RN & Maguer LM. Mass transfer in plant materials in aqueous solutions
of ethanol and sodium chloride: Equilibrium data. Journal of Food Process
Engineering, 1989, 1: 149-153.
Bolin HR, Huxsoll CC, Jackson R & Ng KC. Effect of osmotic agents and
concentration on fruit quality. Journal of Food Science, 1983, 48: 202-205.
Bongirwar DR & Sreenivasan A. Studies on osmotic dehydration of banana.
Journal of Food Science and Technology, 1977, 14: 104-112.
Borges AL. et al. O Cultivo da Banana. Cruz das Almas. EMBRAPA-CNPMF.
Circular Técnica. EMBRAPA-CNPMF, 1997, 27: 109.
Bouhnik Y, Vahedi K, Achour L, Attar A, Salfati J, Pochart P, Marteau P, Flourie
B, Bornet F & Rambaud JC. Short-chain fructooligosaccharide administration
dose-dependently increases fecal bifidobacteria in healthy humans. Journal of
Nutrition, 1999, 129: 113-116.
Bourne MC & Szczesniak AS. Sensory evaluation-texture. In Encyclopedia of
Food Sciences and Nutrition, 2003, 5167-5174. (Caballero B, Trugo L & Finglas
P. (Ed.). Academic Press, Amsterdam, `Natherlands.
Bourne MC. In Food Texture and Viscosity: Concept and Measurement Taylor
SL. (Ed.). Academic Press, San Diego CA, 2002, 1-32.
Bourne MC. Texture profile analysis. Food Technology, 1978, 32 (7): 62-72.
Boylston TD, Vinderola CG, Ghoddusi HB & Reinheimer JA. Incorporation of
bifidobacteria into cheeses: Challenges and rewards. International Dairy Journal,
2004, 14: 375-387.
Bran-non CA. Prebiotics as “good carbs’. Today’s Dietitian, 2006, 8 (8): 12-21.
Brashears MM, Jaroni D & Trimble D. Isolation, selection, and characterization
of lactic acid bacteria for a competitive exclusion product to reduce shedding of

207
Bibliography
Escherichia coli O157:H7 in cattle. Journal of Food Protection, 2003, 66: 355-
363.
Breithaupt DE. Determination of folic acid by ion-pair RP-HPLC in vitamin-
fortified fruit juices after solid-phase extraction. Food Chemistry, 2001, 74: 521-
525.
BSOPTP 39 - Staining Procedures. Issued by Standards Unit, Evaluations and
Standards Laboratory Centre for Infections.
Buddhiman T, Jyoti PT, Ulrich S, Charles MAPF, Michael G & Wilhelm HH.
Phenotypic and genotypic identification of lactic acid bacteria isolated from
ethnic fermented bamboo tender shoots of North East India. International Journal
of Food Microbiology, 2008. 121 (1): 35-40.
Buydens P & Debeucklaere S. Efficacy of SF 68 in the treatment of acute
diarrhea: a placebo controlled trial. Scandinavian Journal of Gastroenterology,
1996, 31: 887-891.
Calo-Mata P, Arlindo S, Boehme K, de Miguel T, Pascoal A & Barros-Velazquez
J. Current applications and future trends of lactic acid bacteria and their
bacteriocins for the biopreservation of aquatic food products. Food and
Bioprocess Technology, 2008, 1: 43-63.
Calorie Control Council, Low-calorie sweeteners.
http://www.caloriecontrol.org/lowcalqa.html, Accessed on 25th February, 2002.
Canzi EI, Gugliemetti S, Mora D, Tamagnani I & Parini C. Conditions affecting
cell surface properties of human intestinal bifidobactoria. Antonie van Leeuwen,
2005, 88: 207-219.
Cappuccino JG & Sherman N. Microbiology: A Laboratory manual. 6th Ed.
Pearson Education Publication, 2004, 528.
Carabasa GM & Ibarz RA. Kinetics of colour development in aqueous glucose
system at high temperatures. Journal of Food Engineering, 2000, 44: 181-189.
Cargill. Cargill beverage concepts will address consumer demands for health,
taste and texture at IFT 2008. http://www.cargill.com/news-center/news-
releases/2008/NA3007612.jsp. 2009, accessed July 20, 2009.

208
Bibliography
Cháfer M, González-martínez C, Ortolá MD, Chiralt A & Fito P. Kinetics of
osmotic dehydration in orange and mandarin peels. Journal of Food Process
Engineering, 2001, 24 (4): 273-289.
Chafer M, Ortola MD, Chiralt A & Fito P. Orange peel products obtained by
osmotic dehydration. In: Fito P, Chiralt PA, Barat JM, Spiess WEL, Beshnilian D
(Ed.). Osmotic dehydration and Vacuum Impregnation. Applications in Food
Industries. Lancaster: Technomic Publishing Company, 2001, 93-106.
Carpita NC, Sabularse D, Montezinos D & Delmer DP. Determination of pore
size of cell walls of living plant cells. Science, 1979, 205: 1144-1147.
Champagne CP, Gardner N, Brochu E & Beaulieu Y. The freeze-drying of lactic
acid bacteria: A review. Canadian Institute, Food Science Technology Journal,
1991, 24: 118–128.
Charteris WP, Kelly PM, Morelli L & Collins JK. Antibiotic susceptibility of
potentially probiotic lactobacillus species. Journal of Food Protection, 1998b, 61:
1636-1643.
Chen BH & Yao YQ. Beneficial microbe composition, new protective material
for the microbes, method to prepare the same and uses thereof. US Patent
6368591, 2002.
Chen HC, Chang CC, Mau WJ & Yen LS. Evaluation of N-
acetylchitooligosaccharides as the main carbon sources for the growth of
intestinal bacteria. FEMS Microbiology Letters, 2002, 209: 53-56.
Chen HL, Lu YH, Lin JJ & Ko LY. Effects of isomalto-oligosaccharides on
bowel functions and indicators of nutritional status in constipated elderly men.
Journal of American College of Nutrition, 2001, 20: 44-49.
Chethana R, Manohar B & Yella Reddy SR. Process optimization of gulab jamun,
an Indian traditional sweet, using sugar substitutes. European Food Research
Technology, 2004, 219: 386-392.
Childs NM. Nutraceutical industry trends. Journal of Nutraceuticals, Functional
and Medical Foods, 1999, 2: 73-85.

209
Bibliography
Chiralt A & Fito P. Transport mechanisms in osmotic dehydration: The role of the
structure. Food Science and Technology International, 2003, 9 (3): 179-186
Chiralt A, Fito P, Andres A, Barat JM, Martinez-Monzo J & Martinez-Navarrete
N. Vacuum impregnation: A tool in minimally processing of foods. In Oliveira
FAR & Oliveira JC (Ed.). Processing of foods: Quality optimization and process
assessment. Boca Raton, FL: CRC Press LLC, 1999, 341-356.
Chiralt A, Fito P, Barat JM, Andres A, Gonzalez-Martinez C, Escriche I &
Camacho MM. Use of vacuum impregnation in food salting process. Journal of
Food Engineering, 2001, 49 (2-3): 141-151.
Christian Rößle, Nigel Brunton, Ronan T. Gormley, Paul R. Ross & Francis
Butler. Development of potentially synbiotic fresh-cut apple slices. Journal of
Functional Foods, 2010, 2 (4): 245-254.
Clevenger MA, Turnbull D, Inone H, Enomoto M, Allen JA, Henderson L &
Jones E. Toxicological evaluation of neosugar: genotoxicity, cariogenicity and
chronic toxicity. Journal of American College of Toxicology, 1988, 7: 643-667.
Clydesdale F. A proposal for the establishment of scientific criteria for health
claims for functional foods. Nutrition Review, 1997, 55: 413-422.
Cochran WG & Cox GM. Some methods for the study of response surfaces. In
Experimental Designs. 2nd Ed. New York: John Wiley and Sons, Inc. 1957, 127-
131.
Collignan A & Raoult-Wack AL. Dewatering and salting of cod by immersion in
concentrated sugar/salt solutions. Lebensmittel-Wissenschaft und-Technologie,
1994, 27: 259-264.
Colombel JF, Cortot A, Newt C & Romond C. Yoghurt with Bifidobacterium
longum reduces erythromycin induced gastrointestinal effects. The Lancet, 1987,
2 (8549): 43.
Contreras C, Martin ME, Martinez-Navarrete N & Chiralt A. Effect of vacuum
impregnation and microwave application on structural changes which occurred
during air-drying of apple. Lebensmittel Wissenschaft und Technologie, 2005, 38:
471-477.

210
Bibliography
Cornell JA. Experiments with mixtures: designs, models and the analysis of
mixture data. 3rd Ed. New York. 2002, 21-99.
Cornillon P & Salim LC. Characterization of water mobility and distribution in
low and intermediate moisture food systems. Magnetic Resonance Imaging, 2002,
18: 335-341.
Corpet F. Multiple sequence alignment with hierarchical clustering. Nucleic Acids
Research, 1988, 16: 10881-10890.
Corsetti A, Lavermicocca P, Morea M, Baruzzi F, Tosti N & Gobbetti M.
Phenotypic and molecular identification and clustering of lactic acid bacteria and
yeasts from wheat (species Triticum durum and Triticum aestivum) sourdoughs of
Southern Italy. International Journal of Food Microbiology, 2001, 64 (1-2): 95-
104.
Corzo O & Gomez ER. Optimization of osmotic dehydration of cantaloupe using
desired function methodology. Journal of Food Engineering, 2004, 64: 213-219.
Cotter PD, Gahan CG & Hill C. A glutamate decarboxylase system protects
Listeria monocytogenes in gastric fluid. Molecular Microbiology, 2001, 40: 465-
475.
Cristhiane C. Ferrari, Javier R. Arballo, Rodolfo H. Mascheroni, Miriam D.
Hubinger. Modelling of mass transfer and texture evaluation during osmotic
dehydration of melon under vacuum. International Journal of Food Science and
Technology, 2011, 46 (2): 436-443.
Crittenden RG & Playne MJ. Production, properties and applications of food-
grade oligosaccharides. Trends Food Science and Technology, 1996, 7: 353-360.
CSPI News. FDA should ban the use of certain antibiotics to fatten farm animals.
http://www.cspinet.org/new/antibiotics.htm, 1999.
Cuervo RB, Guilarte A, Juarez & Martınez J. Production of
fructooligosaccharides by β-fructofuranosidase from Aspergillus sp. 27H. Journal
of Chemical Technology and Biotechnology., 2004, 79: 268-272.

211
Bibliography
D’Souza AL, Rajkumar C, Cooke J & Bulpitt CJ. Probiotics in prevention of
antibiotic-associated diarrhoea: meta-analysis. British Medical Journal, 2002,
324: 1361-1367.
Dave RI & Shah NP. Viability of yogurt and probiotic bacteria in yogurts made
from commercial starter cultures. International Dairy Journal, 1997, 7: 31-41.
De Boever P, Wouters R & Verstraete W. Combined use of Lactobacillus reuteri
and soygerm powder as food supplement. Letters in Applied Microbiology, 2001,
33: 420-424.
De Vuyst L. Technology aspects related to the application of functional starter
cultures. Food Technology and Biotechnology, 2000, 38: 105-112.
Deka BC & Choudhury S. Post-harvest treatments for shelf life extension of
banana under different storages. Acta Horticulturae, 2006, 723: 948-950.
Desai AR, Powell IB & Shah NP. Survival and activity of probiotic lactobacilli in
skim milk containing prebiotics. Journal of Food Science, 2004, 69 (3): 57-60.
Deshpande RP, Chinnan MS & McWatters KH. Optimization of a chocolate-
flavored, peanut-soy beverage using response surface methodology (RSM) as
applied to consumer acceptability data. LWT- Food Science and Technology,
2008, 41: 1485-1492.
Dharmawan J, Surono IS & Kun LY. Adhesion properties of indigenous Dadih
lactic acid bacteria on human intestinal mucosal surface. Asian-Australian
Journal of Animal Science, 2006, 19: 751-755.
Dillard CJ & German JB. Phytochemicals: Nutraceuticals and human health.
Journal of Science of Food and Agriculture, 2000, 80: 1744-1756.
Dimer C & Gibson GR. An overview of probiotics, prebiotics and synbiotics in
the functional food concept: perspectives and future strategies. International
Dairy Journal, 1998, 8: 473-479.
Diplock AT, Aggett PJ, Ashwell M, Bornet F, Fern EB & Roberfroid MB.
Scientific concepts of functional foods in Europe: consensus document. British
Journal of Nutrition, 1999, 81: 11-27.

212
Bibliography
Dravnieks A. Atlas of odour character profiles compiled by ASTM data series.
1985, D.S 61, Philadelphia, USA.
Durieux A, Fougnies C, Jacobs H & Simon JP. Metabolism of chicory
fructooligosaccharides by bifidobacteria. Biotechnology Letters, 2001, 23: 1523-
1527.
EFFCA Guidelines for Probiotics in Food and Dietary Supplements. European
Food and Feed Culture Association.
http://bbs.bio668.com/simple/index.php?t35919.html. 2008, accessed on January
15, 2009.
El-Aouar AA, Azoubel PM, Barbosa Jr JL & Murr FE. Influence of the osmotic
agent on the osmotic dehydration of papaya (Carica papaya L.). Journal of Food
Engineering, 2006, 75: 267-274.
Engelen L, de Wijk RA, Prinz JF, Janssen AM., van der Bilt A, Weenen H, et al.
A comparison of the effects of added saliva, α-amylase and water on texture
perception in semi solids. Physiology and Behaviour, 2003, 78: 805-811.
FAO. FAO Technical meetings on prebiotics: Food Quality and Standards Service
(AGNS). Rome: Food and Agricultural Organization,
www.fao.org/ag/agn/agns/index_en.stm, 2007, 1-11,
FAO/WHO. Guidelines for evaluation of probiotics in food. Report of a Joint
FAO/WHO Working Group on Drafting Guidelines for the Evaluation of
Probiotics in Food. April 30 and May 1, 2002, London, Ontario, Canada.
FAO/WHO. Evaluation of health and nutritional properties of powder milk with
live lactic acid bacteria. Report from FAO/WHO Expert Consultation. 1-4
October, 2001, Cordoba, Argentina.
FAO: FAO Corporate Document Repository, Market for tropical fruits in India.
CCP: BA/TF 01/11.
Fern E. Marketing of functional foods: a point of view of the industry.
International developments in science & health claims. ILSI International
symposium on functional foods in Europe, 2007.

213
Bibliography
Ferrando M & Spiess WEL. Cellular response of plant tissue during the osmotic
treatment with sucrose, maltose and trehalose solutions. Journal of Food
Engineering, 2001, 49: 115-127.
Ferreira GB, Evangelista AF, Severo Junior JB, Souza RR, Santana JC,
Tambourgi EB & Jordão E. Partitioning optimization of proteins from Zea mays
malt in ATPS PEG 6000/CaCl2. Brazilian Archives of Biology and Technology,
2007, 50 (3): 557-564.
Fichtati J, Van De Voort FR & Khury AI. Multiresponse optimization of acid
casein production. Journal of Food Process Engineering, 1990, 12 (4): 247-258.
Fito P, Chiralt A, Barat JM & Martinez-Monzo J. Mass transfer and deformation-
relaxation phenomena in plant tissues. In Welti-Chanes J, Barbosa GV &
Aguilera JM (Ed.). Engineering and food for the 21st century Boca Raton, FL:
CRC Press, 2002, 235-252.
Fito P, Chiralt A, Barat JM, Andres A, Martinez-Monzo J & Martinez-Navarrete
N. Vacuum impregnation for development of new dehydrated products. Journal
of Food Engineering, 2001, 49: 297-302.
Fito P, Chiralt A, Betoret N, Gras M, Chafer M, Martinez-Monzo J, Andres A &
Vidal D. Vacuum impregnation and osmotic dehydration in matrix engineering
application in functional fresh food development. Journal of Food Engineering,
2001a, 49 (2-3): 175-183.
Fito P, Chiralt A, Barat JM, Andres A, Martinez-Monzo J & Martinez-Navarrete
N. Vacuum impregnation for development of new dehydrated products. Journal
of Food Engineering, 2001b, 49: 297-302.
Fito P, Chiralt A, Barat JM & Martinez-Monzo J. Vacuum impregnation in fruit
processing. In Lozano JE, Anon C, Parada-Arias E & Barbosa-Canovas GV (Ed.).
Trends in food engineering. Pennsylvania: Technomic Publishing Company,
2000, 149-164.
Fito P & Chiralt A. Vacuum impregnation of plant tissues. In Alzamora SM,
Tapia MS & Lopez-Malo A (Ed.). Minimally processed fruits and vegetables:

214
Bibliography
Fundamental aspects and applications Gaithersburg: Aspen Publication, 2000,
189-204.
Fito P & Chiralt A. An approach to the modeling of solid food-liquid operations:
Application to osmotic dehydration. 1997. In Fito P, Ortega E & Barvosa G (Ed.).
Food Engineering, 2000, 231-252. New York: Chapman & Hall.
Fito P, Andres A, Pastor R & Chiralt A. Modelling of vacuum osmotic
dehydration of foods. In Singh P & Oliveira F (Ed.). Process optimization and
minimal processing of foods. Boca Raton: CRC Press, 1994, 107-121.
Fito P & Pastor R. Non-diffusional mechanisms occurring during vacuum osmotic
dehydration. Journal of Food Engineering, 1994, 21 (4): 513-519.
Fito P. Modeling of vacuum osmotic dehydration of food. Journal of Food
Engineering, 1994, 22: 313-328.
Floch MH, Binder HJ, Filburn B & Gershengoren W. The effect of bile acids on
intestinal microflora. American Journal of Clinical Nutrition, 1972, 25: 1418-
1492
Flores Gutierrez., A.A. Manejo Postcosecha de Frutas y Hortalizas en Venezuela.
Experiencias y Recomendaciones. 2nd Ed. UNELLEZ, San Carlos, Cojedes,
Venezuela, 2000, 86-102.
Floros J & Chinnan M. Seven factor response surface optimization of a double-
stage lye (NaOH) peeling process of pimiento peppers. Journal of Food Science,
1988, 53: 631-638.
Food and Drug Administration. Guidance for industry on complementary and
alternative medicine products and their regulation by the Food and Drug
Administration. Draft Guidance. U.S. Department of Health and Human Services.
December 2006.
Foulquie Moreno MR, Sarantinopoulos P, Tsakalidou E & De Vuyst L. The role
and application of Enterococci in food and health. International Journal of Food
Microbiology, 2006, 106: 1-24.
Froseth BR & Creedon SW. Inulin infused fruit and method of preparation.
United States Patent Publication. US 2005, 0064082 A1.

215
Bibliography
Fuller R. Probiotics in man and animals. Journal of Applied Bacteriology, 1989,
66: 365-378.
Gabas AL, Menegalli FC, Ferrari F & Talis-Romero J. Influence of drying
conditions on the rheological properties of prunes. Drying Technology, 2002. 20:
1485-1502.
García-Galaz A, Perez-Morales R, Diaz-Cinco M & Acedo-Felix E. Resistance of
Enterococcus strains isolated from pigs to gastrointestinal tract and antagonistic
effect against Escherichia coli K88. Revista Latinamericana de Microbiologia,
2004, 46 (1-2): 5-11.
Garrote R, Coutaz V, Luna J, Silva E & Bertone R. Optimizing processing
conditions of chemical peeling of potatoes using response surface methodology.
Journal of Food Science, 1993, 58: 821-826.
Garrote RL, Silva ER & Bertone RA. Osmotic concentration at 5 oC and 25 oC of
pear and apple cubes and strawberry halves. Lebensmittel-Wissenschaft und
Technologie, 1992, 25: 133-138.
Garrote RL & Bertone RA. Osmotic concentration at low temperature of frozen
strawberry halves. Effect of glycerol, glucose and sucrose solutions on exudates
loss and thawing. Lebensmittel-Wissenschaft und Technologie, 1989, 22: 264-267.
Geetha VV, Sarma KS, Reddy VP, Reddy YK, Moorthy PRS & Kumar S.
Physico-chemical properties and sensory attributes of probiotic shrikhand. Indian
Journal of Dairy and Biosciences, 2003, 14: 58–60.
Giangiacomo R, Torreggiani D & Abbo E. Osmotic dehydration of fruit: Sugar
exchange between fruit and extracting syrup. Journal of Food Processing and
Preservation, 1987, 2: 265-284.
Gibson GR. From probiotics to prebiotics and a healthy digestive system. Journal
of Food Science, 2004, 69: 141-143.
Gibson G, Heber D, Meydani S, Postaire E & Sanders ME. Functional Dairy
Products. John Libbey Eurotext, France. 2000.
216
Bibliography
Gibson GR, Rastall RA & Roberfroid MB. Prebiotics. In Colonic Microbiota,
Nutrition and Health (Ed.). Gibson GR & Roberfroid MB. Doordrecht: Kluwer
Academic Press. 1999, 101-124.
Gibson GR & Roberfroid MB. Dietary modulation of the human colonic
microbiota: Introducing the concept of prebiotics. Journal of Nutrition, 1995, 125:
1401-1412.
Gilliland SE, Staley TE & Bush LJ. Importance of bile tolerance of Lactobacillus
acidophilus used as a dietary adjunct. Journal of Dairy Science, 1984, 67: 3045-
3051.
Gilliland SE & Speck ML. Instability of Lactobacillus acidophilus in yogurt.
Journal of Dairy Science, 1977, 60: 1394-1398.
Gionchetti P, Rizzello F, Venturi A & Campieri M. Probiotics in infective
diarrhoea and inflammatory bowel diseases. Journal of Gastroenterology and
Hepatology, 2000, 15: 489-493.
Giovani BM Carvalho, Daniel P Silva, Júlio C Santos, Hélcio J Izário Filho,
António A Vicente, José A Teixeira, Maria das Graças A Felipe & João B
Almeida e Silva. Total Soluble Solids from Banana: Evaluation and Optimization
of Extraction Parameters. Applied Biochemistry and Biotechnology, 2009, 153,
34-43.
Giraldo G, Vázquez R, Martín-Esparza ME & Chiralt A. Rehydration kinetics and
soluble solids lixiviation of candied mango fruit as affected by sucrose
concentration. Journal of Food Engineering, 2006, 77 (4): 825-834.
Giraldo G, Talens P, Fito P & Chiralt A. Influence of sucrose solution
concentration on kinetics and yield during osmotic dehydration of mango. Journal
of Food Engineering, 2003, 58: 33-43.
Gmeiner M, Kneifel W, Kulbe KD, Wouters R, De Boever P, Nollet L &
Verstraete W. Influence of a synbiotic mixture consisting of Lactobacillus
acidophilus 74-2 and a fructooligosaccharide preparation on the microbial
ecology sustained in a simulation of the human intestinal microbial ecosystem
(SHIME reactor). Applied Microbiology and Biotechnology, 2000, 53: 219-223.

217
Bibliography
Golker C. Final recovery steps: Lyophilisation, spray-drying. In Rehm HJ, Reed
G, Stephanopou G. los (Ed.). Biotechnology, 1993, 3 (2): 695-714. Weinheim:
VCH.
Grajek W, Olejnik A & Sip A. Probiotics, prebiotics and antioxidants as
functional foods. Acta Biochimica polonica, 2005, 52 (3): 665-671
Gras ML, Vidal D, Betoret N, Chiralt A & Fito P. Calcium fortification of
vegetables by vacuum impregnation Interactions with cellular matrix. Journal of
Food Engineering, 2003, 56: 279-284.
Guasch-Jane M, Andres-Lacueva C, Jauregui O & Lamuela- Raventos R. First
evidence of white wine in ancient Egypt from Tutankhamun’s tomb. Journal of
Archaeology Science, 2005, 33: 1075-1080.
Guggisberg D, Cuthbert-Steven J, Piccinali P, Bütikofer U & Eberhard P.
Rheological, microstructural and sensory characterization of low-fat and whole
milk set yoghurt as influenced by inulin addition. International Dairy Journal,
2009, 19: 107-115.
Guha S & Jaffe PR. Biodegradation kinetics of phenanthrene partitioned into the
micellar phase of nonionic surfactants. Environmental Science and Technology,
1996, 30: 605-611.
Guillou AA & Floros J Multi-response optimization minimizes salt in natural
cucumber fermentation and storage. Journal of Food Science, 1993, 56: 1381-
1389.
Gurmail S Mudahar R, Toledo T & Joseph J. A response surface methodology
approach to optimize potato dehydration process. Journal of Food Processing and
Preservation, 1990, 14: 93-106.
Halami PM. Production of polyhydroxyalkanoate from starch by the native isolate
Bacillus cereus CFR06. World Journal of Microbiology and Biotechnology, 2008,
24: 805-812.
Hamilton-Miller JM. The role of probiotics in the treatment of and prevention of
Helicobacter pylori infection. International Journal of Antimicrobial Agents,
2003, 22: 360-366.

218
Bibliography
Haminiuk CWI, Sierakowski MR, Branco IG, Maciel GM & Masson ML.
Rheological study of ternary mixtures and pectic gels of red fruit pulps. Journal of
Food Science and Technology, 2007, 42: 629-639.
Haque A, Richardson RK & Morris ER. Effect of fermentation temperature on the
rheology of set and stirred yogurt. Food Hydrocolloids, 2001, 15: 593-602.
Hawkes J & Flink JM. Osmotic dehydration of fruit slices prior to freeze-
dehydration. Journal of Food Processing and Preservation, 1978, 2: 265-284.
Heenan CM, Adams MC, Hosken RW & Fleet GH. Survival and sensory
acceptability of probiotic microorganisms in a non fermented frozen vegetarian
dessert. LW T- Food Science and Technology, 2004, 37: 461-466.
Higuti IH, Silva PA, Papp J, Okiyama VMO, Andrade EA, Marcondes AA &
Nascimento AJ. Colorimetric determination of α and β-cyclodextrins and studies
on optimization of CGTase production from B. firmus using factorial designs.
Brazilian Archives of Biology and Technology, 2004, 47 (6): 837-841.
Hindu Business Line. Online edition of India's National Newspaper.
Sunday, April 03, 2011.
Holzapfel WH & Schillinger U. Introduction to pre and probiotics. Food
Research International, 2002, 35: 109-116.
Holzapfel WH, Haberer P, Snel J, Schillinger U & Huis in’t Veld JHJ. Over view
of gut flora and probiotics. International Journal of Food Microbiology, 1998, 41:
85-101.
Homayouni A, Azizi A, Ehsani MR, Yarmand MS & Razavi SH. Effect of
microencapsulation and resistant starch on the probiotic survival and sensory
properties of synbiotic ice cream. Food Chemistry, 2008, 111: 50-55.
Hood SK & Zottola EA. Effect of low pH on the ability of Lactobacillus
acidophilus to survive and adhere human intestine cells. Journal of Food Science,
1988, 53: 1514-1516.
Hoover MW & Miller NC. Factors influencing impregnation of apple slices and
development on a continuous process. Journal of Food Science, 1975, 40: 698-
700.

219
Bibliography
Hutchings JB. Food colour and appearance. Blackie Academic, 1994.
India 2011- A Reference Manual, compiled by Research, Reference and Training
Division, Publication Division, Ministry of Information and Broadcasting,
Government of India, 55th Ed. 2011.
Islam MN & Flink JM. Dehydration of potato: II. Osmotic concentration and its
effect on air drying behavior. Journal of Food Technology, 1982, 17: 387-403.
Isolauri E, Salminen S & Ouwehand AC. Probiotics. Best Practice and Research
in Clinical Gastroenterology, 2004, 18: 299-313.
Izumi T, Piskula MK & Osawa S. Soy isoflavone aglycones are absorbed faster
and in higher amounts than their glucosides in humans. Journal of Nutrition,
2000, 130: 1695-1699.
Jacobsen C, Rosenfeldt V, Hayford E, Moller L, Michaelsen F, Paerregaard A,
Sandstrom B, Tvede M & Jakobsen M. Screening of probiotic activities of forty-
seven strains of Lactobacillus spp. by in vitro techniques and evaluation of the
colonization ability of five selected strains in humans. Applied Environmental
Microbiology, 1999, 65: 4949-4956.
Jowitt R. The terminology of food texture. Journal of Texture Studies, 1974, 5:
351-358.
Justfood. Global market review of functional foods-forecasts to 2012.
http://www.alacrastore.com/acm/2023 sample.pdf. 2006, 84, Accessed Oct 12,
2009.
Kaanane A, Kane D & Labuza TP. Time and temperature effect on stability of
Moroccan processed orange juice during storage. Journal of Food Science, 1988,
53: 1470-1473 & 1489.
Kalab M, Allan-Wojtas P & Phipps-Todd BE. Development of microstructure in
set-style nonfat yoghurt – A review. Food Microstructure, 1983, 2 (1): 51-66.
Kalliomäki M, Salminen S, ArvilommiH, Kero P, Koskinen P & Isolauri E
Probiotics in primary prevention of atopic disease: a randomised placebo-
controlled trial. The Lancet, 2001, 357: 1076-1079.

220
Bibliography
Kanauchi O, Mitsuyama K, Araki Y & Andoh A. Modification of intestinal flora
in the treatment of inflammatory bowel disease. Current Pharmaceutical Design,
2003, 9: 333-346.
Kanauchi O, Hitomi Y, Agata K, Nakamura T & Fushiki T. Germinated barley
foodstuff improves constipation induced by loperamide in rats. Bioscience,
Biotechnology and Biochemistry, 1998a, 62: 1788-1790.
Kanauchi O, Nakamura T, Agata K, Mitsuyama K & Iwanaga T. Effects of
germinated barley foodstuff on dextran sulfate sodium-induced colitis in rats.
Journal of Gastroenterology, 1998b, 33: 179-188.
Katapodis P, Kalogeris E, Kekos D, Macris BJ & Christakopoulos P. Biosynthesis
of fructo-oligosaccharides by Sporotrichum thermophile during submerged batch
cultivation in high sucrose media. Applied Microbiology and Biotechnology,
2004, 63: 378-382.
Kaur IP, Chopra K & Saini A. Probiotics: potential pharmaceutical applications.
European Journal of Pharmaceutical Sciences, 2002, 15: 1-9.
Kaymak-Ertekin F & Sultanoglu M. Modeling of mass transfer during osmotic
dehydration of apples. Journal of Food Engineering, 2000, 46: 243-250.
Kim GB & Lee BH. Biochemical and molecular insights into bile salt hydrolase
in the gastrointestinal microflora: a review. Asian-Australian Journal of Animal
Science, 2005, 18: 1505-1512.
Klaenhammer TR & Kullen MJ. Selection and design of probiotics. International
Journal of Food Microbiology, 1999, 50: 45-57.
Klaenhammer TR. Microbiological considerations in selection and preparation of
Lactobacillus strains for use as dietary adjuncts. Journal of Dairy Science, 1982,
65: 1339-1345.
Kleerebezemab M, Hols P & Hugenholtz J. Lactic acid bacteria as a cell factory:
rerouting of carbon metabolism in Lactococcus lactis by metabolic engineering.
Enzyme and Microbial Technology, 2000, 26: 840-848.

221
Bibliography
Kleessen B, Sykura B, Zunft HJ & Blaut M. Effects of inulin and lactose on fecal
microflora, microbial activity and bowel habit in elderly constipated persons.
American Journal of Clinical Nutrition, 1997, 65: 1397-1402.
Klein GA, Pack & Reuter G. Antibiotic resistance patterns of enterococci and
occurrence of vancomycin-resistant entero-cocci in raw minced beef and pork in
Germany. Applied Environmental Microbiology, 1998, 64: 1825-1830.
Klewicki R, Konopacka D, Uczciwek M, Irzyniec Z, Piasecka E & Bonazzi C.
Sorption isotherms for osmo-convectively-dried and osmo-freezedried apple, sour
cherry, and blackcurrant. Journal of Horticultural Science & Biotechnology,
2009, ISAFRUIT Special Issue, 75-79.
Knorr D. Technology aspects related to microorganisms in functional foods.
Trends in Food Science and Technology, 1998, 9: 295-306.
Kobayashi H & Ritmann BE. Microbial removal of hazardous organic
compounds. Environmental Science and Technology, 1982, 16: 170-183.
KPMG. Processed Food and Agribusiness. 2007, 1-55.
Krasaekoopt W, Bhandari B & Deeth H. Evaluation of encapsulation techniques
of probiotics for yoghurt. International Dairy Journal, 2003, 13: 3-13.
Krishnamurthy S, Kantha HJ. Food colour measurement: Instrumentation and
Techniques. Journal of Instrument Society of India, 2005, 35 (2): 227-238.
Krishnamurthy S & Kantha HJ. Applications of universal testing machine (UTM)
for food texture analysis. Journal of Instrument Society of India, 2003, 33 (1): 60-
73.
Krokida MK, Karathanos VT & Maroulis ZB. Effect of osmotic dehydration on
viscoelastic properties of apple and banana. Drying Technology, 2000, 18: 951-
966.
Kulkarni C, Belsare N & Lele A. Studies on Shrikhand Rheology. Journal of
Food Engineering, 2006,74 (2): 169-177.
Kullen MJ, Sanozky-Dawes RB, Crowell DC & Klaenhammer TR. Use of the
DNA sequence of variable regions of the 16S rRNA gene for rapid and accurate
222
Bibliography
identification of bacteria in the Lactobacillus acidophilus complex. Journal of
Applied Microbiology, 2000, 89: 511-516.
Lapsley KG, Escher FE & Hoehn E. The cellular structure of selected apple
varieties. Food Structure, 1992, 11: 339-349.
Laukova A, Czikkova S, Vaslikova Z, Juris P & Marekova M. Ocurrence of
bacteriocin production among environmental enterococci. Letters in Applied
Microbiology, 1998, 27: 178-182.
Lazarides HN & Mavroudis NE. Freeze/thaw effects on mass transfer rates during
osmotic dehydration. Journal of Food Science, 1995, 60: 826-828, 857.
Lee K. Industry News: Progressive Dairymen. 2010.
Lehmann U, Jacobasch G & Schmiedl D. Characterization of resistant starch type
III from banana (Musa acuminata). Journal of Agricultural and Food Chemistry,
2002, 50: 5236-5240.
Lenart A & Lewicki PP. Osmotic dehydration of carrots at high temperature. In
Spiess WEL & Schubert H. Engineering and food preservation processes and
related techniques London: Elsevier, 1990, 2: 731-740.
Lenart A & Flink JM. Osmotic concentration of potato: I. Criteria for the end-
point of osmosis process. Journal of Food Technology, 1984, 19: 45-63.
Lerici CL, Pinnavaia G, Dalla Rosa M & Bartolucci L. Osmotic dehydration of
fruit: Influence of osmotic agents on drying behavior and product quality. Journal
of Food Science, 1985, 50: 1217-1219.
Leunda MA, Guerrero SN & Alzamora SM. Color and chlorophyll content
changes of minimally processed kiwifruit. Journal of Food Processing and
Preservation, 2000, 24: 17-38.
Lewicki P. Water as the determinant of food engineering properties. A review.
Journal of Food Engineering, 2004, 61: 483-495.
Lim CC, Ferguson LR & Tannock GW. Dietary fibres as ''prebiotics'':
implications for colorectal cancer. Molecular Nutrition and Food Research, 2005,
49: 609-619.
223
Bibliography
Lin W, Yu B, Jang S & Tsen H. Different probiotic properties for Lactobacillus
fermentum strains isolated from swine and poultry. Anaerobe, 2007, 13: 107-113.
Lucey JA. The relationship between rheological parameters and whey separation
in milk gels. Food Hydrocolloids, 2001, 15: 603-608.
Lucey JA, Munro PA & Singh H. Effect of heat treatment and whey protein
addition on the rheological properties and structure of acid skim milk gels.
International Dairy Journal, 1999, 9: 275-279.
Luckow T, Sheehan V, Fitzgerald G & Delahunty C. Exposure, health
information and flavour-masking strategies for improving the sensory quality of
probiotic juice. Appetite, 2006, 47: 315-323.
Mabel MJ, Sangeetha PT, Kalpana Platel, Srinivasan K & Prapulla SG.
Physiological characterization of fructooligosaccharides and evaluation of their
suitability as a potential sweetener for diabetics. Carbohydrate Research, 2008,
343: 56-66.
Macfarlane GT, Steed H & Macfarlane S. 2008. Bacterial metabolism and health-
related effects of galacto-oligosaccharides and other prebiotics. Journal of
Applied Microbiology, 2008, 104: 305-344.
Madhura U, Joshi, Anirban Sarkar, Rekha S, Singhal & Aniruddha B. Pandit.
Optimizing the formulation and processing conditions of gulab jamun: a statistical
design. International Journal of Food Properties, 2009, 12: 162-175.
Maguina G, Tapia MS, Briceno AG, Rodriguez C, Sanchez D, Rao V & Lopez-
Malo A. Incorporation of Bifidobacterium spp. En una matriz porosa de fruta por
el mecanismo hidrodinamica (PF-08). In Actas del 2o Congreso Espanol de
Ingenieria de Alimentos. Lleida, Espana: Universitat de Lleida. 2002, 1-4.
Maia GA, Ritter UG, Figueiredo RWD, Oliveira GSFD, Gaspar JC, Monterio
JCS, De Digueiredo RW & De Oliveira GSF. Preparation and evaluation of low
caloric drink based on acerola. Revista Ciencia Agronomica, 2003, 34: 233-240.
Manning TS & Gibson GR. Prebiotics. Best Practice and Research in Clinical
Gastroenterology, 2004, 18: 287-298.

224
Bibliography
Manolopoulou E, Sarantinopoulos P, Zoidou E, Aktypis A, Moschopoulou E,
Kandarakis, IG & Anifantakis EM Evolution of microbial populations during
traditional Feta cheese manufacture and ripening. International Journal of Food
Microbiology, 2003, 82: 153-161.
Mark-Herbert C. Innovation of a new product category - Functional foods.
Technovation, 2004, 24: 713-719.
Martin JJ, Solanes E, Bota E & Sancho J. Chemical and organoleptic changes in
pasteurized orange juice. Alimentaria, 1995, 261: 59-63.
Martinez-Monzo J, Martinez-Navarrete N, Chiralt A & Fito P. Machanical and
structural change in apple (var. Granny Smith) due to vacuum impregnation with
cryoprotectants. Journal of Food Science, 1998, 63: 499-503.
Mastrocola D, Serverini C, Lerici CR & Sensidoni A. Disidratazione per via
osmotica della carota. Industrie Alimentari, 1987, 26: 133-138.
Mattila-Sandholm T, Myllarinen P, Crittenden R, Mogensen G, Fonden R &
Saarela M. Technological challenges for future probiotic foods. International
Dairy Journal, 2002, 12: 173-182.
Mavroudis NE, Gekas V & Sjoholm I. Osmotic dehydration of apples-effects of
agitation and raw material characteristics. Journal of Food Engineering, 1998, 35:
191-209.
Mazza G. Functional foods: Biochemical and processing aspects. Lancaster PA:
Technolomic Publishing Company, 1998, 437.
McFarland LV, Surawicz CM, Greenberg RN, Elmer GW, Moyer KA, Melcher
SA, Bowen KE & Cox JL. Prevention of beta-lactam- associated diarrhea by
Saccharomyces boulardii compared with placebo. American Journal of
Gastroenterology, 1995, 90: 439-448.
McKellar QA. Antimicrobial resistance: a veterinary perspective. British Medical
Journal, 1998, 317: 610-611.
Menrad K. Market and marketing of functional food in Europe. Journal of Food
Engineering, 2003, 56: 181-188.

225
Bibliography
Mettler E & Seibel W. Effects of emulsifiers and hydrocolloids on whole wheat
bread quality: A response surface methodology study. Cereal Chemistry, 1993, 70
(4): 373-377.
Ministério da Saúde. (1997) Regulamento Técnico: Aditivos Alimentares–
Definições, Classificação e Emprego. Ministério da Saúde, Secretaria da
Vigilância Sanitária, Portaria no. 540 de 27 de Outubro de 1997, Brazil.
Mitsuoka T. Bifidobacteria and their role in human health. Journal of Industrial
Microbiology, 1990, 6: 263-268.
Mombelli B & Gismondo MR. The use of probiotics in medical practice.
International Journal of Antimicrobial Agents, 2000, 16: 531-536.
Monsalve Gonzalez A, Barbosa-Canovas GV & Cavalieri RP. Mass transfer and
textural changes during processing of apples by combined methods. Journal of
Food Science, 1993, 58: 1118-1124.
Moore N, Chao C, Yang LP, Storm H, Oliva-Hemker M & Saavedra JM. Effects
of fructooligosaccharides-supplemented infant cereal: double-blind, randomized
trial. British Journal of Nutrition, 2003, 90: 581-587.
Mora D, Fortina MG, Parini C, Daffonchio D & Manachini PL. Genomic sub-
populations within the species Pediococcus acidilactici detected multilocus typing
analysis: relationships between pediocin AcH/PA-1 producing and non-producing
strains. Microbiology, 2000, 146: 2027-2038.
Moreira R & Sereno AM. Evaluation of mass transfer coefficients and volumetric
shrinkage during osmotic dehydration of apple using sucrose solutions in static
and non-static conditions. Journal of Food Engineering, 2003, 57: 25-31.
Moreno J, Chiralt A, Escriche I & Serra JA. Effect of blanching/osmotic
combined methods on quality and stability of minimally processed strawberries.
Food Research International, 2000, 33, 609-616.
Moro G, Minoli I, Mosca M, Fanaro S, Jelinek J, Stahl B & Boehm G. Dosage-
related bifidogenic effects of galacto- and fructooligosaccharides in formula-fed
term infants. Journal of Pediatric Gastroenterology and Nutrition, 2002, 34: 291-
295.

226
Bibliography
Mujica-Paz H, Valdez-Fragoso A, Lopez-Malo A, Paloub E & Welti-Chanes J.
Impregnation and osmotic dehydration of some fruits: Effect of the vacuum
pressure and syrup concentration. Journal of Food Engineering, 2003, 57: 305-
314.
Mujica-Paz H, Valdez-Fragoso A, Lopez-Malo A, Palou E & Welti-Chanes J.
Impregnation properties of some fruits at vacuum pressure. Journal of Food
Engineering, 2002, 56: 307-314.
Muntada V, Gerschenson LN, Alzamora SM & Castro MA. Solute infusion
effects on texture of minimally processed kiwifruit. Journal of Food Science,
1998, 63: 616-620.
Murphy O. Non polyol low digestible carbohydrates: food applications and
functional benefits. British Journal of Nutrition, 2001, 85: 47-53.
Myers RH & Montgomery DC. Response surface methodology, process and
product optimization using designed experiments, 2nd Ed. New York: John Wiley
and Sons, 1995.
Myers RH. Response surface methodology. DOE Book by Boston: Allyn and
Bacon. 1971.
O’Donnell HJ & Butler F. Time-dependent viscosity of stirred yogurt. Part-I:
Couette flow. Journal of Food Engineering, 2002a, 51: 249-254.
O’Donnell HJ & Butler F. Time-dependent viscosity of stirred yogurt. Part-II:
tube flow. Journal of Food Engineering, 2002b, 51: 255-261.
Olano-Martin E, Gibson GR & Rastall RA. Comparison of the in vitro bifidogenic
properties of pectins and pectic-oligosaccharides. Journal of Applied
Microbiology, 2002, 93: 505-511.
Olano-Martin E, Mountzouris KC, Gibson GR & Rastall RA. In vitro
fermentability of dextran, oligodextran and maltodextrin by human gut bacteria.
British Journal of Nutrition, 2000, 83: 247-255.
Ong DE & Chytil F. In: Aurbach, GD., (Ed.). Vitamins and hormones. Academic
press, New York. 1983, 105-112.

227
Bibliography
O'Riordan K & Fitzgerald GF. Determination of genetic diversity within the
genus Bifidobacterium and estimation of chromosomal size. FEMS Microbiology
Letters, 1997, 156: 259-264.
Orla-Jensen S. The lactic acid bacteria. Copenhagen: Anhr Fred Host and Son,
1919.
Ouwehand AC, Kurvinen T, & Rissanen. Use of probiotic Bifidobacterium in a
dry food matrix, an in vivo study. International Journal of Food Microbiology,
2004, 95: 103-106.
Ouwehand AC, Kirjavainen PV, Shortt C, Salminen S. Probiotics: mechanisms
and established effects. International Dairy Journal, 1999, 9: 43-52.
Owens SL, Brewer JL & Rankin SA. Influence of bacterial cell population and
pH on the color of nonfat milk. Lebensmittel-Wissenschaft Technology, 2001, 34:
329-333.
Ozdemir M & Sadikoglu H. Characterization of rheological properties of
systems containing sugar substitutes and carrageenan. International Journal of
Food Science and Technology, 1998, 33 (5): 439-444.
Ozen BF, Dock LL, Ozdemir M & Floros JD. Processing factors affecting the
osmotic dehydration of diced green peppers. International Journal of Food
Science and Technology, 2002, 37: 497-502.
Ozer D, Akin S & Ozer B. Effect of inulin and lactulose on survival of
Lactobacillus acidophilus LA-5 and Bifidobacterium bifidum BB-02 in
acidophilus-bifidus yogurt. Food Science and Technology International, 2005, 11:
19-24.
Pai JS. Traditional Indian foods: Physico-chemical aspects. In PFNDAI Bulletin,
December 2006. Badami MC, Holla KS, Padgaonkar SV, Sakhavalkar JA &
Singh SD. (Ed.). http://www.pfndai.com/Dec06.pdf, 2006, 3-6.
Panagiotou NM, Karathanos VT & Maroulis ZB. Effect of osmotic agent on
osmotic dehydration of fruits. Drying Technology, 2007, 25: 175-189.

228
Bibliography
Pant AR, Graham SM, Allen SJ, Harikul S, Sabchareon A, Cuevas L & Hart CA.
Lactobacillus GG and acute diarrhoea in young children in the tropics. Journal of
Tropical Pediatrics, 1996, 42: 162-165.
Paolo Boffetta, Elisabeth Couto, Janine Wichmann, et al. Fruit and vegetable
intake and overall cancer risk in the European prospective investigation into
cancer and nutrition (EPIC). Published by Oxford University Press, 2010, 102 (8):
529-537
Pascal G. Prebiotics and food safety. In: Handbook of Prebiotics. Gibson GR &
Roberfroid MB. (Ed.). CRC Press, Taylor & Francis Group, Boca Raton, USA,
2008, 449-470.
Patel D, Dufour Y & Domigan N. Functional food and nutraceutical registration
process in Japan and China. Similarities and differences. Journal of Pharmacy
and Pharmaceutical Science, 2008, 11 (4): 1-11.
Patel RS & Chakraborty BK. Process alterations in Shrikhand Technology. Ph.D.
Thesis, submitted to Kurukshetra University. 1982.
Patil AM, Khedkar CD & Kalyankar SD. Studies on antimicrobial properties of
probiotic dahi. XXXV Dairy Industry Confererence, November 23-25, Kolkata,
India, DPP No. 46, 2006.
Patil AM, Desosarkar SS, Kalyankar SD & Khedkar CD. Is a probiotic dahi safe
for human consumption? XXXIV Dairy Industry Confererence, November 23-25,
Bangalore, India, DP No. 2005, 49.
Peanagiotou NM, Karathanos VT & Maroulis ZB. Mass transfer modeling of the
osmotic dehydration of some fruits. International Journal of Food Science and
Technology, 1998, 33: 267-284.
Pedersen C, Jonsson H, Lindberg JE & Roos S. Microbiological characterization
of wet wheat distillers' grain, with focus on isolation of lactobacilli with potential
as probiotics. Applied Environmental Microbiology, 2004, 70: 1522-1527.
Peiro-Mena R, Camacho MM & Martinez-navarrete N. Compositional and
physicochemical changes associated to successive osmodehydration cycles of

229
Bibliography
pineapple (Ananas comosus). Journal of Food Engineering, 2007, 79 (3): 842-
849.
Pereira RB, Singh H, Munro PA & Luckman KS. Sensory and instrumental
characteristics of acid milk gels. International Dairy Journal, 2003, 13: 655-667.
Perrin S, Grill JP & Schneider F. Effects of fructooligosaccharides and their
monomeric components on bile salt resistance in three species of bifidobacteria.
Journal of Applied Microbiology, 2000, 88: 968-974.
Pisulewski P & Kostogrys RB. Functional properties of foods of animal origin
and the methods of their assessment. Polish Journal of Food and Nutrition
Sciences, 2003, 12/53 (1): 65-73.
Piva A, Panciroli A, Meola E & Formigoni A. Lactitol enhances short-chain fatty
acid and gas production by swine cecal microflora to a greater extent when
fermenting low rather than high fiber diets. Journal of Nutrition, 1996, 126: 280-
289.
Ponappa T, Scheerens JC & Miller AR. Vacuum infiltration of polyamines
increases firmness of strawberry slices under various storage conditions. Journal
of Food Science, 1993, 58: 361-364.
Prado FC, Parada JL, Pandey A & Soccol CR.Trends in non-dairy probiotic
beverages. Food Research International, 2008, 41: 111-123.
Prapulla SG, Sangeetha PT & Ramesh MN. A process for the preparation of
prebiotic bread spread, 2002, 344/DEL.
Prapulla SG, Subhaprada V & Karanth NG. Microbial production of
oligosaccharides. Advanced in Applied Microbiology, 2000, 47: 299-343.
Prasad J, Gill H, Smart J & Gopal PK. Selection and characterization of
Lactobacillus and Bifidobacterium strains for use as probiotics. International
Dairy Journal, 1998, 8: 993-1002.
Qi H, Sharma SK & Lemaguer M. Modelling multicomponent mass transfer plant
material in contact with aqueous solution of sucrose and sodium chloride during
osmotic dehydration. International Journal of Food Properties, 1999, 2: 39-54.

230
Bibliography
Quintero-Ramos A, De La Vega C, Hernandez E & Anzaldua-Morales A. Effect
of the conditions on osmotic treatment on the quality of dried apple dices. In
Barbosa-Canovas GV, & Okos MR. (Ed.). New York: AIChE. Food Dehydration,
1993, 108-113.
Race SW. Improved product quality through viscosity measurement. Food
Technology, 1991, 45: 86-88.
Raghavendra Singh & Jha YK. Effect of sugar replacers on sensory attributes,
biochemical changes and shelf-life of shrikhand. Journal of Food Science and
Technology, 2005, 42 (2): 199-202.
Ramana SV & Taylor AJ. Effect of various agents on rheological properties of
carrot cells and protoplasts, Journal of Science of Food Agriculture, 1994, 64:
519-525.
Ramesh MN, Ramalakshmi K, Sangeetha PT & Prapulla SG. Beverage
concentrate based on fructooligosaccharides. Indian Patent Office, Gov. of India,
2004, 457/ DEL.
Ranganna S. Plant pigments. In: Analysis and quality control for fruit and
vegetable products. 2003, 84-86.
Rao V, Tapia MS & Millan F. Mass balance in porous foods impregnation.
Journal of Food Science, 2001, 66: 1332-1336.
Raoult-Wack AL. Recent advances in the osmotic dehydration of foods. Trends in
Food Science and Technology, 1994, 5: 46-51.
Rastall RA and Gibson GR. Prebiotic oligosaccharides: evaluation of biological
activities and potential future developments. In: Tannock W (editor), Probiotics
and prebiotics: where are we going? England: Caister Academic Press, 2002,
107-148.
Rastogi NK, Angersbach A & Knorr D. Evaluation of mass transfer mechanisms
during osmotic treatment of plant materials. Journal of Food Science, 2000, 65:
838-841.
Rastogi NK & Niranjan K. Enhanced mass transfer during osmotic dehydration of
high pressure treated pineapple. Journal of Food Science, 1998, 63: 508-511.
231
Bibliography
Rastogi NK, Raghavarao KS & Niranjan K. Mass transfer during osmotic
dehydration of banana: Fickian diffusion in cylindrical configuration. Journal of
Food Engineering, 1997, 31: 423-432.
Rastogi NK & Raghavarao KSMS. Kinetics of osmotic dehydration under
vacuum. Lebensmittel Wissenschaft und Technologie, 1996, 29: 669-672.
Rastogi NK & Raghavarao KSMS. Effect of osmotic dehydration under vacuum.
Lebensmittel Wissenschaft und Technologie, 1994, 27: 564-567.
Ravi R, Maya Prakash & Rajalakshi D. Relationship between sensory and texture
measurement of jamun and positioning of jamun samples. Journal of Sensory
Studies, 2002, 17: 29-41.
Reddy KBPK, Madhu AN & Prapulla SG. Comparative survival and evaluation
of functional probiotic properties of spray-dried lactic acid bacteria. International
Journal of Dairy Technology, 2009, 62 (2): 240-248.
Reddy KBPK & Prapulla SG. In vitro evaluation of lactic acid bacteria as potent
probiotics for nutraceuticals applications. International Journal of Probiotics and
Prebiotics, 2007, 2 (2-3): 75-84.
Reddy KBPK, Raghavendra P, Girishkumar B, Misra MC & Prapulla SG.
Screening of probiotic properties of lactic acid bacteria isolated from Kanjika, an
ayurvedic fermented product: An in vitro evaluation. Journal of General and
Applied Microbiology, 2007, 53: 207-213.
Reid G. The extra intestinal effects of probiotics. In: Gibson GR, (Ed.).
Interventions for Improving Human Health. London: Wiley and Sons Ltd., 2006,
201-211.
Reid G & Friendship R. Alternatives to antibiotic use: probiotics for the gut.
Animal Biotechnology, 2002, 13: 97-112.
Reid G. Regulatory and clinical aspects of dairy probiotics. Background paper for
FAO/WHO Expert Consultation on Evaluation of Health and Nutritional
Properties of Probiotics in Food including Powder Milk and Live Lactic Acid
Bacteria. Cordoba, Argentina. October 1-4, 2001.

232
Bibliography
Renuka B, Prakash M & Prapulla SG. Fructooligosaccharides based low calorie
gulab jamun: Studies on the texture, microstructure and sensory attributes.
Journal of Texture Studies, 2010, 41 (4): 594-610.
Renuka B, Kulkarni SG, Vijayanand P & Prapulla SG. Fructooligosaccharide
fortification of selected fruit juice beverages: Effect on the quality characteristics.
LWT - Food Science and Technology, 2009, 42 (5): 1031-1033.
Research and Markets. Functional foods market assessment 2007, 2008. Available
from: http://www.researchandmarkets.com/reports/. Accessed Jun 27, 2008.
Roberfroid MB. Functional foods: Concepts and application to inulin and
oligofructose. Journal of Nutrition, 2002, 84: 139-143.
Robert S. Ecology of fermented foods. Human Ecology Review, 2008, 15: 25-31.
Rodriguez MI. Estudio de la penetracion de microorganismos en frutas mediante
el modelo Hidrodinamico (HDM). Thesis. Instituto de Ciencia y Tecnologia de
Alimentos, Universidad Central de Venezuela. 1998.
Rosa MD & Giroux F. Osmotic treatments (OT) and problems related to the
solution mangement. Journal of Food Engineering, 2001, 49: 223-236.
RTS Resource Ltd. Food and ingredients market research and analysis. England:
RTS Resource Ltd., 2008, www.rts.resource.com/
Rybka S, Kailaspathy K, The survival of culture bacteria in fresh and freeze dried
AB yogurts. Australian Journal of Dairy Technology, 1995, 50 (2): 51-57.
Rycroft CE, Jones MR, Gibson GR & Rastall RA. A comparative in vitro
evaluation of the fermentation properties of prebiotic oligosaccharides, Journal of
Applied Microbiology, 2001, 91: 878-887.
Rycroft CE, Jones MR, Gibson GR & Rastall RA. Fermentation properties of
gentio-oligosaccharides. Letters in Applied Microbiology, 2001, 32: 156-161.
Saarela M, Mogensen G, Fonden R, Matto J & Mattila-Sandholm T. Probiotic
bacteria: safety, functional and technological properties. Journal of
Biotechnology, 2000, 84: 197-215.

233
Bibliography
Saavedra JM, Abi-Hanna A, Moore N & Yolken R.H. Long-term consumption of
infant formulas containing live probiotic bacteria: tolerance and safety. American
Journal of Clinical Nutrition, 2004, 79: 261-67.
Sabater-Molina M, Larque E, Torrella F & Zamora S. Dietary
fructooligosaccharides and potential benefits on health. Journal of Physiology and
Biochemistry, 2009, 65 (3): 315-328.
Sacchetti G, Gianotti A & Dalla Rosa M. Sucrose-salt combined effect on mass
transfer kinetics and product acceptability. Study on apple osmotic treatment.
Journal of Food Engineering, 2001, 47: 163-173.
Saldanha LG. US Food and Drug Administration regulations governing label
claims for food products, including probiotics. Clinical Infectious Disease, 2008,
46 (2): 119-121.
Salminen S, Wright A, Morelli L, Marteau L, Brassart P & de Vos DWM.
Demonstration of safety of probiotics a review. International Journal of Food
Microbiology. 1998, 44: 93-106.
Saloff-Coste CJ. Lactic acid bacteria. Danone World Newsletter, 1994, 5: 2.
Sambrook J & Russell D. Molecular cloning. A laboratory manual. Cold Spring
Harbor Laboratory,Cold Spring Harbor, New York. United States of America 3rd
Ed. 2001.
Sanders ME. Probiotics: considerations for human health. Nutrition Review, 2003,
61: 91-99.
Sanders ME & Huis in’t Veld J. Bringing a probiotic-containing functional food
to the market: microbiological, product, regulatory and labeling issues. Antonie
van Leeuwenhoek, 1999, 76: 293-315.
Sanders ME. Prebiotics. Food Technology, 1999, 53 (11): 67-77.
Sanders ME. Overview of functional foods: emphasis on probiotic bacteria.
International Dairy Journal, 1998, 8: 341-347.
Sangeetha PT, Ramesh MN & Prapulla SG. A process for the preparation of
honey like product, 2003, 92/DEL.

234
Bibliography
Sangeetha PT, Ramesh MN & Prapulla SG. Recent trends in the microbial
production, analysis and application of Fructooligosaccharides. Trends Food
Science and Technology, 2005, 16 (10): 442-457.
Sangeetha PT, Ramesh MN & Prapulla SG. Fructooligosaccharide production
using fructosyl transferase obtained from recycling culture of Aspergillus oryzae
CFR202. Process Biochemistry, 2005a, 40 (3-4): 1085-1088.
Sangeetha PT, Ramesh MN & Prapulla SG. Recent trends in microbial
production, analysis and application of Fructooligosaccharides. Food Science and
Technology, 2005b, 16 (10): 442-457.
Sangeetha PT, Ramesh MN & Prapulla SG. Microbial production of
Fructooligosaccharides. Asian Journal of Microbiology Biotechnology and
Environmental Science, 2003, 5 (3): 313-318.
Sangeetha PT, Ramesh MN & Prapulla SG. Influence of media components and
reaction parameters on the production of Fructosyl transferase and
fructooligosaccharides. Sciences des aliments. 2002, 22: 277-287.
Sanger F, Nicklen S & Chase AR. DNA Sequencing with Chain Terminating
Inhibitors. Proceedings in National Academy of Science, USA. 1977, 74 (12):
5463-5468.
Sarkar S & Misra AK. Yogurt: Nutritional and therapeutic significance. Indian
Journal of Microbiology, 2002a, 42: 275-287.
Sarkar S, Kuila RK & Misra AK. Effect of incorporation of Gelodan™ SB 253
(Stabilizer cum preservative) and nisin on the microbiological quality of
shrikhand. Indian Journal of Dairy Science, 1996b, 49: 176-184.
SAS. SAS user's guide: Statistics. 1993, SAS Institute, Cary, USA.
Sascha S & Magdalena K. Mass spectrometry tools for the classification and
identification of bacteria. Nature Reviews Microbiology, 2010, 8: 74-82.
Saxelin M, Korpela R & Mayra-Makinen A. Introduction: classifying functional
dairy products. In Mattila-Sandholm T, & Saarela M. (Ed.). Functional Dairy
Products, Cambridge, England: Woodhead Publishing Limited. 2003, 1-16.
235
Bibliography
Sereno AM, Moreira R & Martinez E. Mass transfer coefficients during osmotic
dehydration of apple in single and combined aqueous solutions of sugar and salt.
Journal of Food Engineering, 2001, 47: 43-49.
Shah NP. Functional cultures and health benefits. International Dairy Journal,
2007, 17: 1262-1277.
Shah NP. Functional foods from probiotics and prebiotics. Food Technology,
2001, 55 (11): 46-53.
Shaker RR, Jumah RY & Abu-Jdayil B. Rheological properties of plain yogurt
during coagulation: impact of fat content and preheat treatment of milk. Journal
of Food Engineering, 2000, 44: 175-180.
Sharma VP & Zariwala IT. Deterioration of shrikhand during storage. Indian
Journal of Dairy Science, 1980, 33: 223-231.
Sheehan VM, Sleator RD, Hill C & Fitzgerald GF. Improving gastric transit,
gastrointestinal persistence and therapeutic efficacy of the probiotic strain
Bifidobacterium breve UCC2003. Microbiology, 2007, 153: 3563-3571.
Shi XQ & Fito P. Vacuum osmotic dehydration of fruits. Drying Technology,
1993, 11: 1429-1442.
Shi XQ, Chiralt A, Fito P, Serra J, Escoin C & Gasque L. Application of osmotic
dehydration technology on jam processing. Drying Technology, 1996, 14: 841-
847.
Side C. Overview on marketing functional foods in Europe. Functional Food
Network General Meeting, 2006.
Sidel JL & Stone H. The role of sensory evaluation in the food industry. Food
Quality and Preference, 1993, 4: 65-73.
Silvi S, Rumney CJ, Cresci A & Rowland IR. Resistant starch modifies gut
microflora and microbial metabolism in human flora-associated rats inoculated
with feces from Italian and UK donors. Journal of Applied Microbiology, 1999,
86: 521-530.
Singh HP. Research and development in banana and plantain in India-a pathway
for enhancing yield potential. Indian Horticulture, 2007, 52: 3-8.
236
Bibliography
Sinha PR, Yadav H & Jain S. Preparation of low calorie probiotic lassi. XXXIV
Dairy Industry Conference, November 23-25, Bangalore, India, DP No. 06, 2005.
Siro I, Kapolna E, Kapolna B & Lugasi A. functional food, Product development,
marketing and consumer acceptance- A review. Appetite, 2008, 51: 456-467.
Sodini I, Remeuf F, Haddad S & Corrieu G. The relative effect of milk base,
starter, and process on yogurt texture: A review. Critical Reviews of Food Science
and Nutrition, 2004, 44: 113-137.
Souci SW, Fachmann W & Kraut H. Food composition and nutrition tables
1986/1987. Wissenschaftliche verlagsgesellschaft GmbH, Stuttgart, Germany.
1986.
Soukoulis C, Panagiotidis P, Koureli R & Tzia C. Industrial yogurt manufacture:
monitoring of fermentation process and improvement of final product quality.
Journal of Dairy Science, 2007, 90: 2641-2654.
Sousa R, Salvatori D, Andres A & Fito P. Analysis of vacuum impregnation of
banana (Musa acuminata cv. Giant Cavendish). Food Science and Technology
International, 1998, 4: 127-131.
Stack A. Quality juice processing. Fruit Processing, 1995, 6-10.
Stanton C, Ross RP, Fitzgerald GF & Van Sinderen D. Fermented functional
foods based on probiotics and their biogenic metabolites. Current Options in
Biotechnology, 2005, 16: 198-203.
Surawicz CM, Elmer GW, Speelman P, McFarland LV, Chinn J & van Belle G.
Prevention of antibiotic associated diarrhea by Saccharomyces boulardii. A
prospective study. Gastroenterology, 1989, 96: 981-988.
Suryawanshi SU, Khedkar CD & Kalyankar SD. Studies on effect of storage
temperature on viable counts of probiotic organisms in shrikhand. XXXV Dairy
Industry Conference, November 23-25, Collate, India, DPP No. 43, 2006.
Szczesniak AS. Texture: is it still an overlooked food attribute?, Food
Technology, 1990, 44 (9): 86-95.
Szilagyi A. Review article: lactose - a potential prebiotic. Alimentary
Pharmacology and Therapeutics, 2002, 16: 1591-1602.

237
Bibliography
Tamime AY, Marshall VM & Robinson RK. Microbiological and technological
aspect of milks fermented by bifibacteria. Journal of Dairy Science, 1995, 62:
151-187.
Tan M, Chua KJ, Mujumdar AS & Chou SK. Effect of osmotic pre-treatment and
infrared radiation on drying rate and color changes during drying of potato and
pineapple. Drying Technology, 2001, 19 (9): 2193-2207.
Tannock GW, Tilsala-Timisjarvi A, Rodtong S, Ng J, Munro K & Alatossava T.
Identification of Lactobacillus isolates from the gastrointestinal tract, silage, and
yoghurt by 16S-23S rRNA gene intergenic spacer region sequence comparisons.
Applied Environmental Microbiology, 1999, 65: 4264-4267.
Tharmaraj N, Shah NP. Survival of Lactobacillus acidophilus, Lactobacillus
paracasei subsp. Paracasei, Lactobacillus rhamnosus, Bifidobacterium animalis
and Propionibacterium in cheese based dips and the suitability of dips as effective
carriers of probiotic bacteria. International Dairy Journal, 2004, 14: 1055-1066.
Torreggiani D & Bertolo G. Osmotic pre-treatments in fruit processing: chemical,
physical and structural effects. Journal of Food Engineering, 2001, 49: 247-253.
Torreggiani D. Osmotic dehydration in fruit and vegetable processing. Food
Research International, 1993, 26: 59-68.
Torreggiani D. Technological aspects of osmotic dehydration in foods. In
Barbosa-Canovas GV & Welti-Chanes J (Ed.). Food preservation by moisture
control. Fundamentals and applications. Lancaster: Technomic Publisher
Company, 1995, 281-304.
Tournas VH. Moulds and yeasts in fresh and minimally processed vegetables, and
sprouts. International Journal of Food Microbiology, 2005, 99: 71-77.
Tregunno NB & Goff HD. Osmodehydrofreezing of apples: Structural and
textural effects. Food Research International, 1996, 29: 471- 479.
Trieu-Cuot P & Poyart C. Visita con guía al centro del arsenal bacteriano. Mundo
Científico. 1999, 197: 46-50.

238
Bibliography
Tsukahara T, Koyama H, Okada M & Ushida K. Stimulation of butyrate
production by gluconic acid in batch culture of pig cecal digesta and identification
of butyrateproducing bacteria. Journal of Nutrition, 2002, 132: 2229-2234.
Tunick MH. Rheology of dairy foods that gel, stretch and fracture. Journal of
Dairy Science, 2000, 83: 1892-1898.
Tuohy KM, Ziemer CJ, Klinder A, Knobel Y, Pool-Zobel BL & Gibson GR. A
human volunteer study to determine the prebiotic effects of lactulose powder on
human colonic microbiota. Microbial Ecology in Health and Disease, 2002, 14:
165-173.
USDA National Nutrient Database for Standard Reference. 2003.
Valdez-Fragoso A, Mujica-Paz H, Giroux F & Welti-Chanes J. Reuse of sucrose
syrup in pilot-scale osmotic dehydration of apple cubes. Journal of Food Process
Engineering, 2002, 25: 125-140.
Valero D, Martinez-Romero D, Serrano M & Riquelme F. Influence of
postharvest treatment with putrescine and calcium on endogenous polyamines,
firmness, and abscissic acid in lemon (Citrus lemon L. Burm Cv. Verna). Journal
of Agriculture Food Chemistry, 1998a, 46: 2102-2109.
Valero D, Martinez-Romero D, Serrano M & Riquelme F. Postharvest
gibberellins and heat treatment effects on polyamines, abscisic acid and firmness
in lemons. Journal of Food Science, 1998b, 63 (4): 611-615.
Van Laere KM, Hartemink R, Beldman G, Pitson S, Dijkema C, Schols HA &
Voragen AG. Transglycosidase activity of Bifidobacterium adolescentis DSM
20083 alpha-galactosidase. Applied Microbiology and Biotechnology, 1999, 52:
681-688.
van Loo J. Prebiotics: a nutritional concept gaining momentum in modern
nutrition. Food Science and Technology Bulletin: Functional Foods, 2005, 2 (8):
83-100.
van Loo J, Coussement P, De Leenheer L, Hoebregs H & Smits G. On the
presence of inulin and oligofructose as natural ingredients in the Western diet.
Critical Reviews in Food Science and Nutrition, 1995, 35: 525-552.

239
Bibliography
van Marle ME, van den Ende D, de Kruif CG and Mellema J. Steady-shear
viscosity of stirred yogurts with varying ropiness. Journal of Rheology, 1999, 43:
1643-1662.
Verbeke W. Consumer acceptance of functional foods: Sociodemographic
cognitive and attitudinal determinants. Food Quality and Preference, 2005, 16
(1): 45-57.
Vijayanand P, Chand N & Eipeson WE. Optimization of osmotic dehydration of
cauliflower. Journal of Food Processing and Preservation, 1995, 19: 229-242.
Vinderola CG, Costa GA, Regenhardt S & Reinheimer JA. Influence of
compounds associated with fermented dairy products on the growth of lactic acid
starter and probiotic bacteria. International Dairy Journal, 2002, 12: 579-589.
Wadstrom T, Anderson K, Sydow M, Axelsson L, Lindgren S & Gullmar B.
Surface properties of lactobacilli isolated from the small intestine of pigs. Journal
of Applied Bacteriology, 1987, 62: 513-520.
Wanasundara PK, Amarowicz RA, Pegg RB & Shand PJ. Preparation and
characterization of hydrolyzed proteins from defibrinated bovine plasma. Journal
of Food Science, 2002, 67: 623-630.
Wang X, Brown IL, Khaled D, Mahoney MC, Evans AJ & Conway PL.
Manipulation of colonic bacteria and volatile fatty acid production by dietary high
amylose maize (amylomaize) starch granules. Journal of Applied Microbiology,
2002, 93: 390-397.
Warczok J, Ferrando M, Lopez F, Pihlajamaoki A & Guoell C. Reconcentration
of spent solutions from osmotic dehydration using direct osmosis in two
configurations. Journal of Food Engineering, 2007, 80 (1): 317-326
Ward DM, Weller R & Bateson MM. 16S rRNA sequences reveal numerous
uncultured microorganisms in a natural community. Nature, 1990, 345: 63-65.
Weinberg Z, Shatz O, Chen Y, Yosef E, Nikbahat M, Ben-Ghedalia D & Miron J.
Effect of lactic acid bacteria inoculants on in vitro digestibility of wheat and corn
silages. Journal of Dairy Science, 2007, 90: 4754-4762.

240
Bibliography
White LA, Newman MC, Cromwell GL & Lindemann MD. Brewers dried yeast
as a source of mannan oligosaccharides for weanling pigs. Journal of Animal
Science, 2002, 80: 2619-2628.
Wills RBH & Sirivatanapa S. Evaluation of postharvest infiltration of calcium to
delay the ripening of avocados. Australian Journal of Experimental Agriculture,
1988, 28: 801-804.
Wills RBH & Tirmazi SIH. Effect of calcium and other minerals on ripening of
tomatoes. Australian Journal of Plant Physiology, 1979, 6: 221-227.
Winkelhausen E & Kuzmanova S. Microbial conversion of D-xylose to xylitol.
Journal of Fermentation and Bioengineering, 1998, 86: 1-14.
Xie J & Zhao Y. Nutritional enrichment of fresh apple (Royal Gala) by vacuum
impregnation. International Journal of Food Science and Nutrition, 2003a, 54:
387-398.
Yang DC & Maguer ML. Osmotic dehydration of strawberries in a batch
recirculation system. Journal of Food Quality, 1992, 15: 387-397.
Yeong S, Ji-Young Lee P, Young-Suk K & Dong-Hwa S. Isolation and
characterization of lactic acid bacteria from feces of newborn baby and from
dongchimi. Journal of Agricultural Food Chemistry, 2002, 50: 2531-2536.
Yin H, Chen Z, Gu Z & Han Y. Optimization of natural fermentative medium for
selenium-enriched yeast by D-optimal mixture design. LWT - Food Science and
Technology, 2009, 42: 327-331.
Ylimaki G, Hawrysh RT & Thomson ABR. Application of response surface
methodology to the development of rice flour yeast breads: Objective
measurements. Journal of Food Science, 1988, 53: 1800-1805.
Yun JW. Fructooligosaccharides occurrence, preparation and application.
Enzyyme Microbial Technology, 1996, 19: 107-117.
Zhao Y & Xie J. Practical applications of vacuum impregnation in fruit and
vegetable processing. Trends in Food Science and Technology, 2004, 15: 434-
451.

262
PAPERS:
Published
1. Fructooligosaccharide fortification of selected fruit juice beverages: Effect on the
quality characteristics. Renuka B, Kulkarni SG, Vijayanand P and Prapulla SG.
LWT - Food Science and Technology, 2009, 42 (5):1031-1033. (Impact Factor:
2.29).
2. Fructooligosaccharides based low calorie gulab jamun: Studies on the texture,
microstructure and sensory attributes. Renuka B, Prakash M and Prapulla SG.
Journal of Texture Studies, 2010, 41(4): 594-610. (Impact Factor: 0.59).
Communicated
1. Fructooligosaccharides: A novel osmotic agent for impregnation of fruits and
vegetables. Renuka B and Prapulla SG
2. Novel synbiotic functional foods: Fruits and vegetables impregnated with
fructooligosaccharides and Lactobacillus salivarius, Pediococcus acidilactici and
Enterococcus hirae. Renuka B and Prapulla SG
Under preparation
1. Reutilization of spent fructooligosaccharides syrup for successive vacuum
osmotic dehydration cycles of star fruit
2. An integrated process for the production of fructooligosaccharides and osmotic
dehydration of fruits and vegetables
3. Vacuum osmotic dehydration of banana using fructooligosaccharides:
Optimization of process parameters using a statistical experimental design
4. Isolation and characterization of potent probiotics from fruits and vegetables
5. Fermented milk based dessert, Shrikhand enriched with selected probiotic
Enterococcus faecium and prebiotic fructooligosaccharides
6. Fructooligosaccharides based edible film.

263
PAPERS PRESENTED IN SYMPOSIUM:
1. Renuka B and Prapulla SG. Novel functional foods from fruits and vegetables
impregnated with probiotics and prebiotics, 19th Indian Convention of Food
Scientists and Technologists (ICFOST) on Health Foods, Indian Institute of
Technology (IIT), Kharagpur, Kolkata, India, 31st December 2007 to 2nd January
2008.
2. Renuka B and Prapulla SG. Development of prebiotic enriched fruits and
vegetables, 18th Indian Convention of Food Scientists and Technologists
(ICFOST), ANGRAU, Rajendra Nagar, Hyderabad, India, 16th & 17th November
2006.
3. Renuka B, Aachary AA and Prapulla SG. An integrated process for the
production of Fructooligosaccharides and development of prebiotic enriched fruits
and vegetables, National Symposium on New Horizons in Fermentation and Food
Biotechnology- Organized by Department of Biotechnology, Punjabi University,
Patiala (Punjab), India, 21st to 22nd March 2006.