
Final_Thesis_Oluseun.pdf - KFUPM ePrints
136
-
Upload
khangminh22 -
Category
Documents
-
view
0 -
download
0
Transcript of Final_Thesis_Oluseun.pdf - KFUPM ePrints


c©Sanuade, Oluseun Adetola2015
i

Dedication
To my lovely parents for their prayers and support.
ii

ACKNOWLEDGMENTS
I want to express my heartfelt gratitude to all the people who directly or indirectly
contributed to this work. Since the list of names is inexhaustible, I hereby apologize in
advance, in case I miss someone in particular.
I like to express my indebtedness of gratitude to:
• Dr. SanLinn I. Kaka for his thorough supervision of this thesis. Without his
immense support, this work would not have been possible. I thank him for his
idea, constructive criticism and continuing discussions throughout the course of
my thesis.
• Dr. Mustafa Hariri for his contribution, encouragement and useful suggestions.
• Dr. Osman Abdullatif for contributing to the success of this thesis.
• Shell Petroleum Nigeria and Department of Petroleum Resources Nigeria for
kindly providing relevant data sets.
• Nigerian Community and friends for their leadership, support, care, advice and
companionship
• Dr. Abdulaziz Shaibani for his leadership, immense support and contribution
towards the success of my program.
iii

• Saudi Arabian Government through the Ministry of Higher Education for pro-
viding scholarship to complete my masters program.
Last but not the least I want to thank my parents, siblings and friends for their immense
support, care and prayers. I appreciate you for being there for me at all times.
iv

TABLE OF CONTENTS
Page
ACKNOWLEDGEMENTS iii
LIST OF TABLES viii
LIST OF FIGURES ix
ABSTRACT (ENGLISH) xv
ABSTRACT (ARABIC) xviii
CHAPTER 1 INTRODUCTION 1
1.1 Introduction . . . . . . . . . . . . . . . . . . . . . . . . . . . . . . . . 1
1.2 Motivation . . . . . . . . . . . . . . . . . . . . . . . . . . . . . . . . . 3
1.3 Objectives of the Study . . . . . . . . . . . . . . . . . . . . . . . . . . 3
1.4 Location and Database . . . . . . . . . . . . . . . . . . . . . . . . . . 5
1.4.1 Location . . . . . . . . . . . . . . . . . . . . . . . . . . . . . 5
1.4.2 Database . . . . . . . . . . . . . . . . . . . . . . . . . . . . . 7
1.5 Methodology . . . . . . . . . . . . . . . . . . . . . . . . . . . . . . . 11
1.5.1 Lithostratigraphy Identification . . . . . . . . . . . . . . . . . 11
1.5.2 Identification of Facies and Depositional Environments . . . . . 11
1.5.3 Stacking Patterns and Parasequences . . . . . . . . . . . . . . . 12
1.5.4 Stratigraphic surfaces, systems tracts and depositional sequences 12
1.5.5 Chronostratigraphic correlation of wells . . . . . . . . . . . . . 13
v
1.5.6 Structural Interpretation . . . . . . . . . . . . . . . . . . . . . 13
1.5.7 Seismic Stratigraphy . . . . . . . . . . . . . . . . . . . . . . . 13
1.5.8 Synthetic Seismograms . . . . . . . . . . . . . . . . . . . . . . 14
1.5.9 Seismic Geomorphology . . . . . . . . . . . . . . . . . . . . . 14
1.5.10 Porosity Evaluation . . . . . . . . . . . . . . . . . . . . . . . . 14
1.5.11 Reservoir Quality . . . . . . . . . . . . . . . . . . . . . . . . . 15
1.6 Previous Work . . . . . . . . . . . . . . . . . . . . . . . . . . . . . . . 15
CHAPTER 2 THE NIGER DELTA 20
2.1 Introduction . . . . . . . . . . . . . . . . . . . . . . . . . . . . . . . . 20
2.2 Geologic Setting . . . . . . . . . . . . . . . . . . . . . . . . . . . . . 20
2.3 Stratigraphic Setting . . . . . . . . . . . . . . . . . . . . . . . . . . . 22
2.4 Regional Stratigraphy . . . . . . . . . . . . . . . . . . . . . . . . . . . 26
2.5 Structural Setting . . . . . . . . . . . . . . . . . . . . . . . . . . . . . 32
2.5.1 Regional Structure . . . . . . . . . . . . . . . . . . . . . . . . 32
2.6 Petroleum Geology of the Niger Delta . . . . . . . . . . . . . . . . . . 35
2.6.1 Petroleum System . . . . . . . . . . . . . . . . . . . . . . . . 35
2.6.2 Source Rock . . . . . . . . . . . . . . . . . . . . . . . . . . . 37
2.6.3 Petroleum Maturation and Migration . . . . . . . . . . . . . . . 37
2.6.4 Reservoir and Seal . . . . . . . . . . . . . . . . . . . . . . . . 40
CHAPTER 3 DATA ANALYSIS AND INTERPRETATION 44
3.1 Introduction . . . . . . . . . . . . . . . . . . . . . . . . . . . . . . . . 44
3.2 Well Log Data . . . . . . . . . . . . . . . . . . . . . . . . . . . . . . . 44
3.2.1 Lithostratigraphic Analysis of the Wells . . . . . . . . . . . . . 44
3.2.2 Lithofacies . . . . . . . . . . . . . . . . . . . . . . . . . . . . 47
3.2.3 Chronostratigraphic Correlation of Wells . . . . . . . . . . . . 51
3.3 Interpretation of Stratigraphy of Otu Field . . . . . . . . . . . . . . . . 60
3.3.1 Interpretation of Sequences within Otu Field . . . . . . . . . . 61
3.4 Seismic to well tie: Otu 46 Synthetic Seismograms . . . . . . . . . . . 62
3.5 3D Seismic Volume . . . . . . . . . . . . . . . . . . . . . . . . . . . . 64
vi

3.5.1 Structural Elements and Framework . . . . . . . . . . . . . . . 64
3.6 Seismic Stratigraphy Analysis . . . . . . . . . . . . . . . . . . . . . . 70
3.6.1 Sequence Boundary One (SB−1) . . . . . . . . . . . . . . . . 73
3.6.2 Sequence Boundary Two (SB−2) . . . . . . . . . . . . . . . . 73
3.6.3 Sequence Boundary Three (SB−3) . . . . . . . . . . . . . . . 73
3.6.4 Maximum Flooding Surface Three (MFS−3) . . . . . . . . . . 77
3.6.5 Sequence Boundary Four (SB−4) . . . . . . . . . . . . . . . . 77
3.7 Seismic Geomorphology . . . . . . . . . . . . . . . . . . . . . . . . . 82
3.7.1 Sequence Boundary Four (SB−4) . . . . . . . . . . . . . . . . 83
3.7.2 Maximum Flooding Surface Three (MFS−3) . . . . . . . . . . 85
3.7.3 Sequence Boundary Three (SB−3) . . . . . . . . . . . . . . . 85
3.7.4 Sequence Boundary Two (SB−2) . . . . . . . . . . . . . . . . 85
3.7.5 Sequence Boundary One (SB−1) . . . . . . . . . . . . . . . . 85
3.8 Discussion . . . . . . . . . . . . . . . . . . . . . . . . . . . . . . . . . 90
3.9 Depositional Sequences and Model . . . . . . . . . . . . . . . . . . . . 94
3.9.1 Depositional Sequence Architecture . . . . . . . . . . . . . . . 99
3.10 Reservoir Potential of Otu Field . . . . . . . . . . . . . . . . . . . . . 99
3.10.1 Porosity Evaluation . . . . . . . . . . . . . . . . . . . . . . . . 99
3.10.2 Reservoir Continuity . . . . . . . . . . . . . . . . . . . . . . . 100
3.10.3 Reservoir Geometry . . . . . . . . . . . . . . . . . . . . . . . 101
3.10.4 Source Rock Potential . . . . . . . . . . . . . . . . . . . . . . 101
3.10.5 Trapping Mechanisms . . . . . . . . . . . . . . . . . . . . . . 101
CHAPTER 4 CONCLUSION AND RECOMMENDATION 103
4.1 Conclusion . . . . . . . . . . . . . . . . . . . . . . . . . . . . . . . . 103
4.2 Recommendation . . . . . . . . . . . . . . . . . . . . . . . . . . . . . 105
REFERENCES 106
VITAE 113
vii

LIST OF TABLES
1.1 Well log data available for this study . . . . . . . . . . . . . . . . . . . 9
3.1 The relationship between systems tracts, reservoirs and their respective
predicted depositional environments . . . . . . . . . . . . . . . . . . . 81
3.2 Relationship between the type of channel, channel orientation relative
to fault, sequence stratigraphic surface and the depositional environments 91
3.3 Average Effective Porosity for the Reservoirs . . . . . . . . . . . . . . 100
3.4 Porosity values for Reservoirs Qualitative Description (Adapted from
Rider (1986)) . . . . . . . . . . . . . . . . . . . . . . . . . . . . . . . 100
viii

LIST OF FIGURES
1.1 Stratigraphic column of the Niger Delta showing Akata, Agbada and
Benin formations (Doust and Omatsola, 1990). . . . . . . . . . . . . . 4
1.2 Location map of study area (A) Position of Nigeria in Africa and Niger
Delta Basin. (B) Otu field location map (Doust and Omatsola, 1990) . . 6
1.3 Survey line showing inline and crossline in the study area. The inline
range from 11228 - 12110 and crossline range has range between 2673
- 3434. The 3D seismic has TWTT between 0 to 3000 ms . . . . . . . . 8
1.4 Distribution of wells in the study area. The wells in red are deviated
wells while those in black are vertical wells . . . . . . . . . . . . . . . 10
2.1 Paleogeography revealing the opening of the South Atlantic, and devel-
opment of the region around the Niger Delta (a) Cretaceous paleogeog-
raphy (b) Cenozoic paleogeography (Tuttle et al., 1999). . . . . . . . . 21
2.2 Schematic of a seismic section from the Niger Delta continental
slope/rise depicting the result of internal gravity tectonics on sediments
at the distal portion of the depobelts (Doust and Omatsola, 1990). . . . 23
2.3 The bounding geologic features of the Niger delta depicting the north-
ern sources of fluvial supply (Whiteman, 1982). . . . . . . . . . . . . . 25
2.4 Stratigraphic column depicting the three formations in the Niger Delta
(Doust and Omatsola, 1990). . . . . . . . . . . . . . . . . . . . . . . . 28
2.5 Stratigraphic column of Anambra basin from the Late Cretaceous
through the Eocene as well as time equivalent formations in the Niger
Delta (Reijers et al., 1997). . . . . . . . . . . . . . . . . . . . . . . . . 29
ix

2.6 (a) Isopach of total sedimentary thickness (in km) in the Niger Delta
(b) Cross section (East - West) A-A through the Niger Delta region
and Cross section (Southwest-Northeast) (c) B-B depicting the three
formations of the Niger delta (Whiteman, 1982). . . . . . . . . . . . . . 30
2.7 (a) Top structure map of Akata formation (b) Isopach map of Agbada
formation (Avbovbo, 1978). . . . . . . . . . . . . . . . . . . . . . . . 31
2.8 Structural styles of the deepwater Niger Delta. The three provinces in
the Niger Delta are the toe thrust, diaper and extensional province. Otu
field falls within the extensional province (Corredor et al., 2005). . . . . 34
2.9 Event chart of the Niger Delta showing Akata/Agbada petroleum sys-
tem (Tuttle et al., 1999). . . . . . . . . . . . . . . . . . . . . . . . . . 36
2.10 (a) Burial history chart of the northern portion of the Niger delta
petroleum system, derived from data collected in Oben-1, northwest
Niger delta (b) Top Niger delta oil kitchen, contour interval is 1,000 ft
(312 m) (Ekweozor and Daukoru, 1994). . . . . . . . . . . . . . . . . . 39
2.11 Examples of Niger Delta oil field structures and associated trap types
(Stacher, 1995). . . . . . . . . . . . . . . . . . . . . . . . . . . . . . . 42
2.12 Sequence stratigraphic model of the Niger Delta showing the relation-
ships between the source rock, migration paths, and traps (Stacher, 1995). 43
3.1 Lithostratigraphic analysis of the wells showing fourteen reservoir
sands in Otu field. Sand A is the shallowest while Sand N is the deepest
which was not penetrated by all wells within the field. . . . . . . . . . . 46
3.2 Shaly sandstone facies represented by coarsening upward unit GR log
pattern. SB means sequence boundary. . . . . . . . . . . . . . . . . . . 49
3.3 Sandstone facies represented by blocky-shaped gamma ray log pattern.
SB means sequence boundary and RSME is regressive surface of ma-
rine erosion . . . . . . . . . . . . . . . . . . . . . . . . . . . . . . . . 49
3.4 Mudrock facies represented by serrated GR log pattern. MFS and TS
are maximum flooding surface and transgressive surface respectively. . 50
x

3.5 Heterolith facies represented by bell-shaped GR log pattern . . . . . . . 50
3.6 Sequences, systems tracts, and stratigraphic surfaces defined in relation
to the base-level and the transgressive —regressive curves (Catuneanu,
2002) . . . . . . . . . . . . . . . . . . . . . . . . . . . . . . . . . . . 52
3.7 Chronostratigraphic correlation log panels for wells 11, 4 and 29 in-
dicating a coarsening upward sequence. Serrated log character are in-
terpreted to be tidal flat, blocky patterns are interpreted to be fluvial
channel deposits. MFS3 is the base of the Benin formation. . . . . . . . 54
3.8 Chronostratigraphic correlation log panels for wells 19, 8, 21, 5, 36, 32
and 56 indicating a coarsening upward sequence. Serrated log character
are interpreted to be tidal flat while blocky patterns are interpreted to be
fluvial channel deposits. HSTs are inferred to be prograding clinoforms. 55
3.9 Chronostratigraphic correlation log panels for wells 38 and 6 indicating
a coarsening upward sequence. SB-1 was not penetrated by Otu 38.
Serrated log character are inferred to be tidal flat deposits and HST are
prograding clinoforms. Sequences and tracts are thicker in the southern
part of the field . . . . . . . . . . . . . . . . . . . . . . . . . . . . . . 56
3.10 Chronostratigraphic correlation log panels for wells 38, 8 and 11 in-
dicating a coarsening upward sequence. Serrated log character are in-
terpreted to be tidal flat deposits and blocky patterns are inferred to
be fluvial channel deposits. Small scale coarsening upward units are
interpreted to be point bar deposits. . . . . . . . . . . . . . . . . . . . . 57
3.11 Chronostratigraphic correlation log panels for wells 46, 6, 21 and 4 in-
dicating a coarsening upward sequence. Small scale coarsening upward
units are interpreted to be point bar deposits. . . . . . . . . . . . . . . . 58
3.12 Chronostratigraphic correlation log panels for well 5 and 29 indicating
a coarsening upward sequence. Serrated log character are interpreted to
be tidal flat while blocky patterns are interpreted to be fluvial channel
deposits. HSTs are inferred to be prograding clinoforms. Sequence two
is thicker at the eastern part of the field. . . . . . . . . . . . . . . . . . 59
xi

3.13 Types of well log patterns in Otu field. (a) Blocky log pattern. (b)
Upward-coarsening, progradation log pattern. (c) Serrated, aggrada-
tional log pattern. (d) Bell shaped, upward-fining, retrogradational log
pattern . . . . . . . . . . . . . . . . . . . . . . . . . . . . . . . . . . . 60
3.14 Synthetic seismogram (a) Sample 1 (b) Sample 2 (c) Sample 3 (d) Sam-
ple 4 showing the integration of density (Blue) and sonic logs (Red) into
impedance (Red) and reflectivity (Blue) and was depth time converted
(including an upscaling) and convolved with the wavelet. The red color
means peak (+) while the black color means trough cores (-) . . . . . . 63
3.15 Structural interpretation of Otu field showing inlines 11686 and 11666.
The figures reveal three major listric faults in the field (F3, F6 and F7)
and a synthetic fault (F15) . . . . . . . . . . . . . . . . . . . . . . . . 66
3.16 Structural interpretation of Otu field showing Inline 11466 and Inline
11586. It reveals antithetic faults (F4 and F8), counter regional faults
(F10 and F14), major listric faults as well synthetic faults within the
Otu field. . . . . . . . . . . . . . . . . . . . . . . . . . . . . . . . . . 67
3.17 Time slice at 1500 ms showing NW-SE trending faults . . . . . . . . . 68
3.18 3D Fault model. The Otu wells targeted the hanging wall closure and
encountered about fourteen hydrocarbon bearing sands . . . . . . . . . 69
3.19 Types of stratal terminations (Catuneanu, 2002) . . . . . . . . . . . . . 70
3.20 Sequence stratigraphy architecture with the horst and grabenal struc-
ture within Otu field showing sequence boundaries and stratigraphic
surfaces mapped. . . . . . . . . . . . . . . . . . . . . . . . . . . . . . 72
3.21 Sequence Boundary one (SB−1) (a) Trace 2920 uninterpreted section
(b) Trace 2920 interpreted section revealing interfluve sequence bound-
ary one (SB1) . . . . . . . . . . . . . . . . . . . . . . . . . . . . . . . 74
3.22 Sequence Boundary two (SB − 2) (a) Trace 2968 uninterpreted sec-
tion (b) Trace 2968 interpreted section showing prograding clinoforms
within HST-1 . . . . . . . . . . . . . . . . . . . . . . . . . . . . . . . 75
xii

3.23 Sequence Boundary three (SB−3) (a) Trace 2980 uninterpreted section
(b) Trace 2980 interpreted section. LST-3 has a complex geometry and
its deposits should be widespread and not localized because TS-3 does
not merge with SB-3 . . . . . . . . . . . . . . . . . . . . . . . . . . . 76
3.24 Maximum Flooding Surface three (MFS-3) (a) Trace 3213 uninter-
preted section (b) Trace 3213 interpreted section. SB-3 is an interfluve
sequence boundary. . . . . . . . . . . . . . . . . . . . . . . . . . . . . 78
3.25 Sequence Boundary four (SB−4) (a) Trace 2885 uninterpreted section
(b) Trace 2885 interpreted section. SB-4 separates the underlying se-
quence three from the overlying sequences . . . . . . . . . . . . . . . . 79
3.26 Section (a) Uninterpreted section (b) Interpreted section. A point bar
was observed here and the channel disappears on interception with nor-
mal faults. Scale bar is amplitude values. . . . . . . . . . . . . . . . . . 84
3.27 Spectral decomposition at (10Hz and 40Hz) on MFS− 3 stratal slice
showing the channel NE SW direction (+30ms and -30ms). A rel-
atively pronounced sinuous channel was observed in the northeastern
part of the field. Scale bar is amplitude values . . . . . . . . . . . . . . 86
3.28 Spectral decomposition at (10Hz and 20Hz) on SB − 3 stratal slice
showing the channel NE-SW direction (+30ms and -30ms). The indi-
vidual channel observed on SB-3 is subtle and directed along the hang-
ing wall of the fault. Scale bar is amplitude values . . . . . . . . . . . . 87
3.29 Similarity (Coherency) on SB−2 stratal slice (+30ms and -30ms). The
individual channel observed on SB-2 is subtle and directed along the
hanging wall of the fault, running parallel along the fault trace . . . . . 88
3.30 Spectral decomposition at (10Hz and 40Hz) on SB − 1 stratal slice
showing a meandering channel belt with its characteristics point bar
flowing at an obtuse angle in the NE-SW direction (+30ms and -30ms) . 89
3.31 Sequence boundary development on down faulted blocks. Sequence
boundary erosion shows increased slopes over the collapsing wedge
rather than fluvial lowstand incision . . . . . . . . . . . . . . . . . . . 92
xiii

3.32 (a) Depositional sequence one in Otu field. It shows key stratigraphic
surfaces and various systems tracts. (b) Variation with sea level. The
model is based on the integration of seismic and well logs and was not
drawn to scale . . . . . . . . . . . . . . . . . . . . . . . . . . . . . . . 95
3.33 (a) Depositional sequence two in Otu field showing key stratigraphic
surfaces and various systems tracts (b) Variation with sea level. Note
that the model is based on the integration of seismic and well logs and
was not drawn to scale . . . . . . . . . . . . . . . . . . . . . . . . . . 96
3.34 (a) Depositional sequence three in Otu field showing key stratigraphic
surfaces and various systems tracts (b) Variation with sea level. The
model is based on the integration of seismic and well logs and was not
drawn to scale . . . . . . . . . . . . . . . . . . . . . . . . . . . . . . . 97
3.35 Geomorphology, cyclic sedimentation and an active fault in the Tertiary
Niger Delta coastal zone (modified after Reijers (2011) . . . . . . . . . 98
xiv

THESIS ABSTRACT
NAME: Sanuade, Oluseun Adetola
TITLE OF STUDY: SEQUENCE STRATIGRAPHIC ANALYSIS AND POROS-
ITY EVALUATION OF A FIELD USING 3D SEISMIC
AND WELL LOGS: AN EXAMPLE FROM THE NIGER
DELTA, NIGERIA
MAJOR FIELD: Geology
DATE OF DEGREE: September, 2015
3D seismic data and wireline logs from thirteen (13) wells were used in this study
to understand the sequence stratigraphic evolution and build a sequence stratigraphic
model for Otu field in the onshore area of the Niger Delta. The subsurface facies reveals
three sequences that are bound by four sequence boundaries (SB1 to SB4) which are
interpreted as erosional unconformities with three maximum flooding surfaces (MFS1,
MFS2 and MFS3). Sequence boundaries evolved as the structural collapse of the clas-
tic wedge of the Niger Delta caused steepening of mass flow erosion slopes. The se-
quences that are delineated were composed of lowstand systems tracts (LST), falling
stage systems tracts (FSST), transgressive systems tracts (TST) and highstand systems
xv

tracts (HST), revealing depositional systems deposited during different phases of base
level changes. Sediments identified within the LSTs in Otu field are fluvial channel
sands formed at low sea level and when the rate of sediment supply is higher than
accommodation space. Sediments within the FSST are offlapping slope deltaic wedge
which are formed when the shoreline was forced to regress irrespective of the influx
rate of sediment. The TSTs in Otu field capped the low systems tracts facies and consist
mainly of marine shales. TSTs are formed during relatively high sea levels and when
sediment supply is lower than the accommodation space. HSTs are made up of coars-
ening and shallowing upward intervals, having deltaic fluvial sands near the top of the
units. The sequences that were delineated were deposited in transitional to shallow
marine environments. Seismic geomorphological study carried out on all the sequence
boundaries and MFS3 shows a relationship between depositional environments, type
of channel and direction of paleo-flow in relation to faults. Channel belts are associ-
ated with continental to transitional depositional environment deposits while individual
(relatively thin and less sinuous) channels are associated with shallow marine deposits.
Channel belts are oriented perpendicular to the fault while individual channels (incised
valley) are parallel and rarely affected by the faults. Chronostratigraphic correlation
of wells in Otu field revealed that the surfaces that were delineated are not continuous
laterally and this could be as a result of syndepositional faults within Otu field. These
faults are believed to serve as major traps for the accumulation of hydrocarbon in the
field. However, the reservoir rocks of the LST and HST and seals from marine shale of
the TST could probably combine together to form stratigraphic traps for hydrocarbon
xvi

accumulation in Otu field.
xvii

مستخلص األطروحة
سانا ,اديوليسون اديتول ألسم:ا
سجيالت اآلبار: مثال من تتحليل التتابع الطبقي و تقيم المسامية لحقل باستخدام بيانات السيزمية ثالثية األبعاد و عنوان الدراسة:
دلتا النيجر, نيجيريا
لتخصص: الجيولوجيا مجال ا
2015سبتمبر, تاريخ المنح:
بئر لفهم تطور 13 في هذه الدراسة تم استخدام كل من بيانات السيزمية ثالثية االبعاد والمجسات التحليل البئري المستخرجة من
التتابع وبناء قالبه الطبقي لمنطقة حقل اوتو الواقعة على دلتا النيجر القارية.
دم توافق أربعة حدود طباقية والتي فسرت كأسطح عالسحنات الصخرية التحت سطحية اظهرت ثالثة تتابعاات طباقية محاطة ب
لنيجر المتسبب في نتيجة للتعرية مصاحبة بثالث اسطح تدفق عليا. الحدود الطباقية تطورت نتيجة للتهدم البنائي لمنخفض دلتا ا
, المتقدم حسر,المن , رسوبيات سطح البحر المنخفض. التتابعات الطبقية تتكون من زيادة إنحدار ميل االنسياب الكتلي الصخري
ي مستو الرسوبيات المتعرف عليها ضمن متغيرة من مستوي سطح البحر.انظمة ترسيبية في مراحل تمثل مظهرة و المرتفع
الحوض عبارة عن رسوبيات قنوات رملية ترسبت عندما كان إمداد الرسوبيات يفوق سعةسطح البحر المنخفض في حقل أوتو
جبر الخط الساحليأتكونت عندما الرسوبيات التي تكونت في فترة انحسار سطح البحر تمثل رسوبيات دلتابينما نجد ان الترسيبي.
بحر المنخفض, . رسوبيات البحر المتقدم تعلو السحنات الترسيبية لمستوي سطح الدون اعتبار لالمداد الرسوبي على التراجع,
يا" واإلمداد لترسبات تكونت عندما كان مستوي سطح البحر يرتفع نسب.هذه ا في غالبيتها من رسوبيات الطفل البحريةوتتألف
زداد العلى رسوبيات سطح البحر المرتفع مكونة من تتابعات طبقية ذات حجم حبيبات ي لرسوبي أقل من سعة الحوض الرسوبي.ا
بيئات رسوبية عليها ترسبت في وهذه التتابعات المتعرف , ورسوبيات دلتا نهرية تعلو كل وحدة طبقية.في بيئة ترسييبة ضحلة
انتقالية وبحرية.
قة وطيدة بين عالايضا في هذه الدراسة تم استخدام الطبوغرافية السيزمية في فواصل التتابعات الطبقية والتي بدورها اظهرت
منطقة الدراسة حزام ة فيالبيئات الرسوبية ونوع و اتجاه القنوات القديمة وعالقتها مع الصدوع التركيبةي. تمثل القنوات الموجود
) البيئات الرسوبية مصاحب للبيئات الرسوبية القارية واالنتقالية, بينما تصاحب القنوات المنفردة ( زات مجري رفيع واقل تعرجا
لقللفواتتجه متوازية , بينما القنوات المنفردة ()التركيبية لقتتجه عموديا على الفواالبحرية. وكذلك مجموعة القنوات المشتركة
و غالاب ال تتأثر بها. تركيبيةال
الق المتكونة أثناء الترسيب لك نتيجة للفوذمضاهاة الطبقية الزمنية لآلبار في حقل اوتو اظهرت أن االسطح الطبقية غير مستمرة و
ح البحر المنخفض وكذلك تمثل رسوبيات سط وهذه الفوالق تمثل مصائد ريئسية لتجميع الهايدروكربون في الحقل. في حقل اوتو.
والمرتفع و صخور الغطاء المكونة من الطفل البحري المترسب في مستوى سطح البحر التقدمي, تكون مصائد استراتيجرافية
لتراكم الهايدروكربونات في حقل اوتو.

CHAPTER 1
INTRODUCTION
1.1 Introduction
Sequence stratigraphy provides the basis for the chronostratigraphic correlation of sed-
iments and a valuable exploration and reservoir development tool for the petroleum
industry. An approach of sequence stratigraphy in association with knowledge of de-
positional environments as well as importance of accommodation space and sediment
supply can aid in the reconstruction of paleogeography and prediction of temporal and
spatial relationship between source, reservoir and seal facies (Catuneanu et al., 2011).
Sequence stratigraphy is used to locate stratigraphic prospects and predict reservoir and
seal quality on structural prospects. This approach was applied on Otu field in the Niger
Delta.
The Niger Delta is a clastic wedge which is 12 km in thickness with an area of 75, 000
km2 between southern Nigeria and the Gulf of Guinea. It is known as one of the largest
oil provinces in the world having reserves of over 34 billion barrels of oil and 93 trillion
1

cubic feet of gas (Tuttle et al., 1999). The deposits in the Niger Delta are known to be
subdivided into three lithostratigraphic units which are the Akata formation, Agbada
formation, and Benin formation (Evamy et al., 1978; Whiteman, 1982) (Figure 1.1).
Formations become progressively younger basinward showing long-term progra-
dation of the depositional environments of the Niger Delta into the passive margin of
the Atlantic Ocean. The stratigraphy of the Niger Delta is complex as a result of the
syndepositional slump of the clastic wedge due to movement of shale of the Akata for-
mation by the influence of the load of the Agbada and Benin formation deposits which
are prograding deltaic and fluvial respectively. A network of large-scale, listric normal
faults dipping towards the basin formed as a result of diapered upward mobility of the
underlying shales. Blocks down dropped across these faults loaded with growth strata,
changed the local slopes of deposition, resulting in complex path ways of sediment
transport into the basin (Evamy et al., 1978). This has made field evaluation in the
basin tedious due to problems associated with imaging of the subsurface in the Niger
Delta.
For the purpose of field evaluation or re-evaluation, it is very important to understand
detailed relationships between the faulting system in the area as well as the stratigraphic
component of the basin. It has been proven that when 3D seismic data is integrated with
well log data, it provides a powerful tool to determine the seismic stratigraphic and
structural framework of a basin (Nton and Adesina, 2009; Futalan et al., 2012; Amigun
et al., 2014). Hence, this study was carried out to understand the tectono-stratigraphic
evolution, structural styles, identifying different facies and their depositional environ-
2

ments and establishing a sequence stratigraphic model that will enhance prediction of
reservoir quality within Otu field as well as porosity distribution within the field.
1.2 Motivation
The availability of a 3D seismic data and wireline log data encourage detail study for
the Niger Delta in field scale. Moreover the wells in Otu oil field were discovered and
drilled based on structural traps, hence there is a need to understand the stratigraphic
evolution of the field and the relationship between structures and stratigraphic compo-
nents in the area. This is in addition to the fact that no previous data and/or relationship
between stratigraphy and structures were defined.
1.3 Objectives of the Study
The objectives of this thesis are to:
• Identify different facies and their depositional environments
• Establish the tectono-stratigraphic evolution and structural styles of Otu field
• Establish sequence stratigraphic model within the study area
• Evaluate the porosity and predict reservoir quality in field scale
3

Figure 1.1: Stratigraphic column of the Niger Delta showing Akata, Agbada and Beninformations (Doust and Omatsola, 1990).
4

1.4 Location and Database
1.4.1 Location
The study area is situated within the Gulf of Guinea off the west coast of the Niger
Delta (Figure 1.2) and covers an area of approximately one hundred thousand square
miles. The onshore portion covers approximately 30,000 square miles (Chukwu, 1991;
Magbagbeola and Willis, 2007). Sediments deposited within the study area consist of
marine and fluvial sediments that range in age from Cretaceous to Holocene (Kostenko
et al., 2008). Otu field is located onshore in the western part of the Niger Delta.
5

Figure 1.2: Location map of study area (A) Position of Nigeria in Africa and NigerDelta Basin. (B) Otu field location map (Doust and Omatsola, 1990)
6

1.4.2 Database
The data used for this study include a 3D seismic, thirteen (13) wireline logs, checkshot
and deviation survey data. The 3D seismic amplitude data covers an area of about 421
sq. km in the onshore area of the Niger Delta. The bin spacing of the data is 25 by
25 m. The data are available in milliseconds two-way travel time (ms TWTT) with a
maximum value of 3000 ms. It has Inline range of 11228−12110 and Crossline range
of 2673−3434 (Figure 1.3). The characteristics of the seismic records were observed
to change with depth. The seismic volume generally have series of parallel reflections
offsets that have been deformed by major listric normal faults.
7

Figure 1.3: Survey line showing inline and crossline in the study area. The inlinerange from 11228 - 12110 and crossline range has range between 2673 - 3434. The 3Dseismic has TWTT between 0 to 3000 ms
8

Table 1.1: Well log data available for this study
Well CNLLC ACAL RHOCN GR LLD SP LLS DTOtu 4 X X X X X XOtu 5 X X X X X XOtu 6 X X X X X XOtu 8 X X X X X X X
Otu 11 X X X X X X XOtu 19 X X X X X X XOtu 21 X X X X X X XOtu 29 X X X X X X XOtu 32 X X X X X X XOtu 36 X X X X X X XOtu 38 X X X X X X XOtu 46 X X X X X X XOtu 56 X X X X
Note: ACAL: caliper, LLD: laterolog deep resistivity, LLS: laterolog shallowresistivity, CNLLC: neutron porosity, RHOCN: bulk density, DT: sonic, GR: gamma
ray, (X): available type log
The well data include time depth curves and digital well curves. Well log types
available are shown in Table 1.1. These wells were drilled spatially in the study area.
The basemap in Figure 1.4 shows the distributions of the wells in the study area.
9

⊕otu46
⊕otu38
⊕otu6
⊕otu19
⊕otu8
⊕otu21
⊕otu11
⊕otu4
⊕otu5
⊕otu29
⊕otu36 ⊕
otu32⊕
otu56
298400 300000 301600 303200 304800
1800
0018
2000
1840
0018
6000
Scale 1:50000
0.0 0.6 1.2 1.8 2.4 3.0kmFigure 1.4: Distribution of wells in the study area. The wells in red are deviated wellswhile those in black are vertical wells
10
1.5 Methodology
Wireline logs (gamma ray, resistivity, density and neutron) and a 3D seismic data were
studied, analyzed and interpreted to identify facies and their depositional environments,
establish the tectono-stratigraphic evolution and structural styles of Otu field, establish
sequence stratigraphic model, evaluate the porosity and to predict reservoir quality in
field scale.
1.5.1 Lithostratigraphy Identification
Gamma ray (GR) logs from all the thirteen wells were employed to delineate the lithol-
ogy in Agbada formation of Otu field. The sand bodies were identified by the de-
flection of the GR log to the left while shale was identified by the deflection to the
right. Gamma ray log cut-off of 35 API was used for the lithostratigraphic analysis (i.e.
shale: > 80API, shaly sand: 35− 80 and sand: < 35API). The hydrocarbon bearing
sands were identified using GR and resistivity logs. The results of lithostratigraphy was
compared with that of chronostratigraphy in order to establish the relationship between
the two.
1.5.2 Identification of Facies and Depositional Environments
Gamma ray (GR) log patterns were used for the identification of facies and their de-
positional environments (Beka and Oti, 1995). ’Blocky’ log pattern was interpreted
to depicts uniform deposition that is peculiar to channelized region and typical of flu-
vial channel deposits. Pattern showing coarsening upward units (progradational pat-
11

tern) was interpreted to be a feature of deltaic fluvial environment (Channel point bar).
’Serrated’ (aggradational log pattern) with uniform bandwith shows limited coastline
variability and was interpreted to be typical of tidal flat environment. ’Bell-shaped’
GR log pattern (upward fining, retrogradational log pattern) was interpreted to be tidal
channels or sands.
1.5.3 Stacking Patterns and Parasequences
The stacking patterns and parasequences of the facies were also established. The stack-
ing of parasequences (vertical occurrence of repeated cycles of sequences that are fining
upward or coarsening upward) produced progradational, retrogradational and aggrada-
tional sets of parasequences.
1.5.4 Stratigraphic surfaces, systems tracts and depositional se-
quences
The delineation of maximum flooding surface (MFS) was done on the wireline logs.
MFS was identified as the boundary between progradational and retrogradational
parasequence sets as well as the units that have shale peaks and were well developed
on GR, resistivity and neutron logs. The criteria for the recognition of sequence bound-
aries (SBs) included low GR and high resistivity responses that occurred within the
shallow section. SBs were described at the base of the thickest and coarsest sand units
between two adjacent MFSs (Williams, 1997) and base of a progradational stacking
pattern. The depositional (IV) model of Hunt and Tucker (1992, 1995) and Helland-
12

Hansen and Gjelberg (1994) was used for the identification of the systems tracts and
depositional sequences within the Otu field.
1.5.5 Chronostratigraphic correlation of wells
Wells were correlated along strike and dip line for the development of a chronostrati-
graphic framework. The correlation was carried out to build a holistic sequence strati-
graphic framework in Otu field. This was done to establish the lateral continuity or
discontinuity of facies and depositional sequences in order to aid reservoir studies in
the field.
1.5.6 Structural Interpretation
Major and minor faults were identified and mapped appropriately on the 3D seismic to
establish the structural styles and framework within Otu field and to clarify the main
structural elements that affect the hydrocarbon-bearing reservoir.
1.5.7 Seismic Stratigraphy
Stratal terminations such as truncation, toplap, onlap, downlap, and offlap (Catuneanu,
2002) were incorporated into sequence stratigraphy to describe the stacking patterns
of stratal units and to provide diagnostic features for the recognition of the various
surfaces and systems tracts (Posamentier and Vail, 1988; Van Wagoner et al., 1990;
Christie-Blick, 1991).
13
1.5.8 Synthetic Seismograms
Seismic to well tie was carried out using checkshot data and sonic log of well number
46 to link the well data to the seismic for more reliability.
1.5.9 Seismic Geomorphology
Seismic geomorphology may be defined as the application of analytical techniques per-
taining to the study of landforms and to the analysis of ancient, buried geomorpho-
logical surfaces as imaged by 3D seismic data. Seismic geomorphology, when used in
conjunction with seismic stratigraphy, represents the state of the art approach to extract-
ing stratigraphic insights from 3D seismic data (Posamentier et al., 2007). The seismic
geomorphology was applied to the subsurface facies of the Agbada formation. The
patterns observed from the 3D seismic images were described to be diagnostic of depo-
sitional environment(s). Sequence boundaries were mapped as horizons and attributes
such as spectral decomposition and similarity (coherency) were draped on the surfaces
to enhance the identification and interpretation of the structural and stratigraphic fea-
tures.
1.5.10 Porosity Evaluation
Porosity was evaluated in Otu field by cross-plotting both density and neutron logs
using techlog software developed by Schlumberger. The two logs were guided by both
gamma ray and resistivity logs to know the lithology and fluid contents. The quality of
each reservoir rock was established using the results of the porosity that was evaluated
14

from both density and neutron logs.
1.5.11 Reservoir Quality
Reservoir potential in Otu field was analyzed based on the results of sequence strati-
graphic analysis and the evaluation of some petrophysical parameters in Otu field.
1.6 Previous Work
Although the title of this study is describing the Niger Delta, this thesis focuses on
Otu field as it is a representative in the Niger Delta region. The outcome of this study
can be applied in other areas in the Niger Delta. The Tertiary Niger Delta is known to
have reservoirs that are stacked together in an oil rich shale and the best approach to
understanding these fields is to study them on a field scale. The present study addresses
the sequence stratigraphic analysis of Otu field and develops a sequence stratigraphic
model using 3D seismic data and well logs as this information is absent in the field.
However, it is important to discuss what previous authors have studied in some other
fields located in the Niger Delta.
Hooper et al. (2002) explained the influence of deformation in the control of the
patterns of deposition in the south-central part of Niger Delta. Their work was however
focused mainly on the compressional toe of the delta, and they concluded that the ele-
ments of structures in the area are the main control of accommodation changes on the
slope and toe of the delta.
Morgan (2004) examined the relationships between mobile shale structure and channel
15

formation above the compressional toe of Niger Delta and highlighted the importance
of transfer zones within the toe thrust belt as a control on the underlying structural
framework.
Corredor et al. (2005) related styles of structures in the deep-water fold and thrust belts
of the Niger Delta and concluded that there are two complex, imbricate fold and thrust
belt systems (the inner and outer fold and thrust belts) that are produced by contraction
which are formed as a result of extension driven by gravity on the shelf.
Nton and Adesina (2009) worked on structural interpretation and environment of depo-
sition of sand bodies within tomboy field, offshore western Niger Delta. They showed
that the field is made up of sand bodies deposited in different environment across nor-
mal, growth faults and associated rollover anticlinal structures.
Rotimi (2010) worked on application of 3D seismic interpretation of structures and
seismic attribute analysis to hydrocarbon prospect in a field called ”‘X”’ in the Niger
Delta. Closures found in the field were fault assisted closures which corresponds to the
crest of rollover structures and the amplitude map revealed high amplitude zones. He
identified some prospects which are hydrocarbon bearing.
Opara (2010) worked on 3D seismic interpretation and structural analysis of Ossu oil
field, northern depobelt, situated in the onshore area of the Niger Delta. He revealed
a complex subsurface structures, predominant with simple rollover structures that are
widely spread bounded by growth faults. He also examined for hydrocarbon prospects
16

and found that the field is hydrocarbon bearing.
Daramola et al. (2011) made use of integration of 3D seismic and data from well logs
to evaluate subsurface geology as well as the potentiality of hydrocarbon of an oil field
in the onshore Niger Delta by identifying and mapping faults and horizons. They pro-
duced time and depth structural maps of the top of the reservoir that they analyzed. The
maps showed that the structure that bears hydrocarbon is dependent on networks of
fault in the area. They also generated amplitude map of the top of the reservoir which
is consistent with structural maps.
Amigun et al. (2014) used well logs and seismic data to determine the lithology, lithofa-
cies, sequence stratigraphy, seismic facies and depositional environment of Holu field,
in the Niger delta. They analyzed wireline logs and identified five depositional se-
quences having six sequence boundaries that are in association. They also identified
sand and shale to be the dominant lithologies. By analyzing the seismic facies of the
area using seismic amplitude extraction, continuity of reflections, frequency and reflec-
tion configuration, the environment of deposition of the field was suggested to belong
to fluvial systems to marine environments.
Futalan et al. (2012) mapped the seismic facies in the Sandakan Sub-basin, in the Philip-
pines and the results of their analysis showed that there is a relationship between litho-
facies and depositional environment of the sub-basin. They identified the depositional
environment to be fluvio-deltaic system. They also performed the structural analysis
of the sub-basin and provides information about the timing of deformation in the sub-
17

basin as well as the present of some related structural maps.
Tamannai et al (2013) carried out a detailed 3-D interpretation of seismic in Pict Field,
in the Central North Sea, United Kingdom. The interpretation was carried out with the
aim of identifying different seismic facies types in the field and also to determine hy-
drocarbon potential in the Tay Sandstone. They recognized three seismic facies types
using maximum seismic amplitude maps. They then confirmed the results from the
seismic interpretation with the available information from the well log.
Oyedele et al. (2013) in their work entitled ”‘Sequence stratigraphic approach to hy-
drocarbon exploration in Bobsaa field, onshore Niger Delta”’ used data from seismic,
well logs, paleobathymetric and biostratigraphic to evaluate the field with a view to
determine the lithology, reservoir sands and the depositional environment of the study
area. Their results showed that the lithology is mainly alternation of sand and shale
with sand having the highest ratio. The environment of deposition was recognized us-
ing integration of available data to be fluvial to shallow marine mainly shallow inner
neritic, inner neritic and middle neritic.
Obaje (2013) mapped the structures of Tomboy field using seismic interpretation
method. He recognized some strata terminations including onlaps, toplaps and trun-
cations. He concluded that the styles of structures style in the area is characterized by
two systems of antithetic and growth faults and that the overall reflectors geometry is
parallel or sub-parallel.
John et al. (2014) integrated well logs and 3D seismic data to perform facies analysis
and to determine the environment of deposition of RAY field in Onshore, Niger Delta,
18

with the aim to know the hydrocarbon potential of the field. They however identified
four lithofacies shale, heterolithic, shaly-sand and sandstone facies. The facies were
subjected to electrosequence analysis which showed five depositional systems. The
sandstone facies of the distributary channels revealed good potential for hydrocarbon
reservoir having thickness of 40 m and 60 m.
Adewoye et al. (2013) used information from well logs, check-shot and 3D seismic data
in the delineation of sand reservoirs that are oil bearing, determination of petrophysical
parameters and also analysis of geologic structures in Maiti field, Niger Delta. They
used three wells for the evaluation and delineated three hydrocarbon reservoirs within
the study area (R1, R2 and R3).
Alao et al. (2013) also made use of the combination of 3D seismic volume and well log
data to characterize reservoirs of ALA field in the Niger Delta. They evaluated petro-
physical parameters of the reservoirs and obtained time-depth structural maps. The
authors also used seismic attributes in the characterization of those reservoirs. In their
study, they delineated seven hydrocarbon-bearing reservoirs having thicknesses that
vary from 9.9 to 71.6 m. They also generated structural maps of horizons in six wells
having hydrocarbon-bearing zones with tops and bottoms at range of 2,453 to 3,950 m.
They concluded the trapping mechanism in the study to be mainly fault-assisted anti-
clinal closures. The identified prospective zones have good porosity, permeability, and
hydrocarbon saturation. The depositional environment was determined from shapes of
available logs which indicate a transitional-to-deltaic depositional environment.
19

CHAPTER 2
THE NIGER DELTA
2.1 Introduction
This chapter describes the geologic setting of the Tertiary Niger Delta, its structural and
stratigraphic settings as well as the petroleum systems within the Niger Delta.
2.2 Geologic Setting
The Niger Delta is situated in the Gulf of Guinea, in West Africa. It represents the
southern margin of a triple junction rift system that triggered the separation of the
African continent from the South American continent during the Jurassic through the
Early Cretaceous. Rifting started around Late Jurassic and continued to the Middle
Cretaceous (Lehner and De Ruiter, 1977). During the Late Cretaceous, rifting reduced.
Figure 2.1 depicts the gross paleogeography of the Niger Delta and the relative posi-
tions of the African and South American plates from the period of rifting.
At the end of rifting, gravity tectonism occurred as the main process of deformation.
20

(a)
(b)
Figure 2.1: Paleogeography revealing the opening of the South Atlantic, and develop-ment of the region around the Niger Delta (a) Cretaceous paleogeography (b) Cenozoicpaleogeography (Tuttle et al., 1999).
21

Internal deformation was induced by the mobility of shale. This occurred as a result of
the response to two major processes as explained by Kulke (1994). The first process
is the formation of shale diapirs from the loading of Akata formation which is poorly
compacted, over-pressured, pro-delta and delta-slope clays, by the more densely delta
front sands which is the Agbada formation. The second process involved the instability
of slope which occurred as a result of lack of lateral, basinward, and support for the
Akata formation (Figure 2.2).
There was completion of gravity tectonics for any depobelts in the Niger Delta
before Benin formation was deposited. These are shown in complex structures such
as roll-over anticlines, shale diapirs, collapsed growth faults, back-to-back features and
steeply dipping closely spaced flank faults (Evamy et al., 1978).
2.3 Stratigraphic Setting
The River Niger, which drains much of West Africa south of the Sahara, is the main
supplier of sediments to the Niger delta (Allen, 1965). River Benue, which is the sec-
ond prominent fairway of sediment supply to the Niger delta, merges with River Niger
in the confluence town of Lokoja, Nigeria. River Niger subsequently branches into a
network of tributaries that deposit their fluvial loads into the Niger delta. Sediment sup-
ply to the Niger Delta is sourced from the Northern Nigerian massif, the West African
massif, Adamawa Massif, Oban massif, Benue trough, Bida basin, Anambra basin, and
Abakaliki trough (Figure 2.3). The Niger delta lithology is predominantly siliciclastic,
and the direction of current at discharge to the Niger Delta is approximately north-south
22

Figure 2.2: Schematic of a seismic section from the Niger Delta continental slope/risedepicting the result of internal gravity tectonics on sediments at the distal portion of thedepobelts (Doust and Omatsola, 1990).
23

(N-S). The Niger Delta is believed to have been prograding into the Atlantic Ocean for
the last 35 Ma. Each formation records a different part of a linked non-marine to delta
to offshore depositional system.
24

Figure 2.3: The bounding geologic features of the Niger delta depicting the northernsources of fluvial supply (Whiteman, 1982).
25

2.4 Regional Stratigraphy
Short and Stauble (1967) subdivided the Niger delta into three lithostratigraphic units,
ranging in age from Paleocene to Recent. They include the Akata, Agbada and Benin
formations (Figure 2.4). These formations are coeval. The Akata formation is marine
in origin and is made up of thick shale sequences. The Akata formation is situated at
the base of the Niger Delta and consists of prodelta, hemipelagic, and pelagic shales
that were deposited in marine environments (Figures 2.4, 2.5, 2.6). The formation is
late Paleocene to early Pliocene in age. The Akata formation is characterized by high
plasticity and overpressure, especially at depth. All major faults and counter-regional
faults merge into a plane (or detachment surface) in the lower part of the Akata forma-
tion. Though little of the Akata formation has been drilled with the availability of only
top structure map of the formation, estimations show that the formation is about 23,000
ft. (7,000 m) in thickness (Doust and Omatsola, 1990; Tuttle et al., 1999) (Figure 2.7).
The Agbada formation consists of a paralic sequence of interbedded sands and shales.
The sandstones were deposited in prograding transitional or coastal environments com-
prised the fluvio-deltaic and barrier islands of the delta front, lagoon, brackish-water
bays, beaches, and the shoreface. Shales are prodeltaic to hemipelagic in origin. The
Agbada formation is Eocene to Pleistocene in age and about 3,700 m thick (Figure 2.7).
The Benin formation consists of continental sandstones that were deposited in a delta
plain as point bars by meandering streams or as channel fills with natural levees (Doust
and Omatsola, 1990). The massive fresh-water bearing Benin formation occurs widely
across the Niger Delta, with thicknesses ranging between 300 and 3,000 m. The Benin
26

formation does not play any important role in the evolution of the Niger delta petroleum
system, except serving as overburden.
27

Figure 2.4: Stratigraphic column depicting the three formations in the Niger Delta(Doust and Omatsola, 1990).
28

Figure 2.5: Stratigraphic column of Anambra basin from the Late Cretaceous throughthe Eocene as well as time equivalent formations in the Niger Delta (Reijers et al.,1997).
29

(a)
(b)
(c)
Figure 2.6: (a) Isopach of total sedimentary thickness (in km) in the Niger Delta (b)Cross section (East - West) A-A through the Niger Delta region and Cross section(Southwest-Northeast) (c) B-B depicting the three formations of the Niger delta (White-man, 1982).
30

(a)
(b)
Figure 2.7: (a) Top structure map of Akata formation (b) Isopach map of Agbada for-mation (Avbovbo, 1978).
31

2.5 Structural Setting
Otu field is located in the south-west Niger delta, within the extensional fault province
that is associated with growth faults and rollover anticlines.
2.5.1 Regional Structure
The Niger Delta system, the Anambra basin, the Benue trough, and the Chad basin,
are believed to have been triggered by the triple-junction rifting that is responsible for
the splitting of Africa from South America during the Jurassic through the Cretaceous;
with a relict in the present-day West African Gulf of Guinea. The system extends from
the north in the present onshore, prograding southwestward into the present offshore
deep waters. Paleo-depositional environment is believed to range from the onshore
deltaic fluvial systems to the offshore marine systems. The separation of the African
plate from the South American plate gave rise to the opening of the South Atlantic and
the Early Cretaceous incursion of marine sediments in the basin (Doust and Omatsola,
1990).
Corredor et al. (2005) subdivided the delta into five structural zones (Figure 2.8), based
on seismic interpretation which include: (a) extensional province defined by listric
basin-dipping faults, as well as counter-regional normal growth faults and associated
rollovers, (b) a zone of mud diapirs made up of passive, active, and reactive mud di-
apirs (c) the inner fold and thrust belt, made up of basinward-verging thrust faults and
associated folds, (d) a transitional detachment fold zone beneath the lower continen-
tal slope, and (e) the outer folds and thrust belts characterized by both basinward and
32

hinterland-verging thrust faults and associated folds. The extensional province com-
mences from the onshore Niger delta, including the field to be studied. Otu field is
situated within the extensional province defined by basin-dipping listric faults.
33

Figure 2.8: Structural styles of the deepwater Niger Delta. The three provinces in theNiger Delta are the toe thrust, diaper and extensional province. Otu field falls withinthe extensional province (Corredor et al., 2005).
34
2.6 Petroleum Geology of the Niger Delta
There are three critical factors that are important in the Niger Delta regarding the
petroleum system in the basin. These include the source, reservoir, and seal. These
critical factors are believed to have occurred during the Middle Eocene (Figure 2.9)
2.6.1 Petroleum System
. The main source rock of the Niger Delta petroleum system is the Akata formation
(Evamy et al., 1978; Ejedawe, 1986; Nwachukwu and Chukwura, 1986; Bustin, 1988).
The organic contents and kerogen type of the shale in the younger Agbada formation
was evaluated and believed to have contributed towards the generation of hydrocarbon
in the basin (Evamy et al., 1978). Oil-bearing type III kerogen is the predominant
kerogen in the petroleum system of the Niger Delta .
The Niger Delta has low total organic carbon (TOC), having a range of 1.4 percent and
1.6 percent according to Bustin (1988). As a result of the synchronous occurrence of
the reservoir rocks, traps, and seals, the Niger Delta is thus believed to provide a prolific
oil province, irrespective of the relatively low TOC
35

Figure 2.9: Event chart of the Niger Delta showing Akata/Agbada petroleum system(Tuttle et al., 1999).
36

2.6.2 Source Rock
Akata formation, which is the oldest formation in the basin is the established forma-
tion that served as source rock of the petroleum system of the Niger Delta. The Akata
formation is comprised mainly of mobile shale on which growth faults detach and prop-
agate basinward, thereby creating more accommodation space in the Niger Delta basin
(Evamy et al., 1978; Doust and Omatsola, 1990; Tuttle et al., 1999). The deposition of
this formation started during the Paleocene.
2.6.3 Petroleum Maturation and Migration
During the Middle Eocene to the Present, there is deposition of overburden rock in
the Niger delta. The generation of petroleum in the delta started in the Eocene and
continues up till present (Tuttle et al., 1999). Petroleum generation started from the
north to south as progressively younger depobelts entered the oil window (Tuttle
et al., 1999). The top of the Niger delta oil window is presently at the 240◦F (115◦C)
isotherm (Evamy et al., 1978). The oil window in the northwestern portion of Niger
Delta (where Otu field is located) is in the upper Akata formation and the lower
Agbada formation (Figure 2.10). The top of the oil window is stratigraphically lower
in the southeastern portion of the Niger delta: about 4,000 ft (1,247 m) below the
upper Akata/lower Agbada sequence (Evamy et al., 1978). The distribution of the top
of the oil window depends on the thickness and sand/shale ratios of the overburden
rocks of Agbada and Benin formations (Nwachukwu and Chukwura, 1986; Doust and
Omatsola, 1990; Stacher, 1995). The sandy continental Benin formation has the lowest
37

thermal gradient of 1.3 to 0.125◦C/321 ft (100 m); the paralic Agbada formation has an
intermediate gradient of 2.7◦C/321 ft (100 m); and the marine, over-pressured Akata
formation has the highest thermal gradient of 5.5◦C/321 ft (100 m) (Ejedawe, 1986).
38

(a)
(b)
Figure 2.10: (a) Burial history chart of the northern portion of the Niger delta petroleumsystem, derived from data collected in Oben-1, northwest Niger delta (b) Top Nigerdelta oil kitchen, contour interval is 1,000 ft (312 m) (Ekweozor and Daukoru, 1994).
39

The boundary of the Akata and Agbada formations in the vicinity of Oben-1 entered
the oil window during the Late Eocene at approximately 0.6 Ro (Stacher, 1995), (Figure
2.10). The current depth of the Akata/Agbada boundary in the northwestern Niger Delta
is about 4,300m, with the upper Akata formation in the wet gas/condensate generating
zone of vitrinite reflectance value greater than 1.2 (Tissot and Welte, 1984; Tuttle et al.,
1999). The lowermost part of the Agbada formation in the northwestern Niger Delta
entered the oil window during the Late Oligocene.
Stacher (1995) assumed that migration overlapped in time with the burial and structural
development of the overlying reservoir and that hydrocarbon migration occurred mainly
through the fault gaps. Migration distances were believed to be short, as evident in
the wax content, API gravity, and the chemistry of the Niger Delta oils (Short and
Stauble, 1967; Reed, 1969). Migration from matured, over-pressured shale in the more
distal portion of the Niger Delta may be similar to that described from over-pressured
shale in the Gulf of Mexico (Tuttle et al., 1999). Beka and Oti (1995) predicted a bias
towards lighter hydrocarbons (gas and condensate) from the over-pressured shale as a
result of down-slope dilution of organic matter as well as differentiation associated with
expulsion from over-pressured sources.
2.6.4 Reservoir and Seal
Both structural and stratigraphic traps are present in the Niger Delta, although struc-
tural traps are more pronounced in the basin. Examples of such oil fields are given in
Figure 2.11. The Agbada formation in the Niger Delta serves as the hydrocarbon reser-
40

voir. It is described as an intercalation of sand and shale (Doust and Omatsola, 1990).
Growth faults that detach on the Akata formation provide the pathways through which
the porous and permeable sandstones of the Agbada formation are interconnected. The
shales of the Agbada formation serve as the local seal, in combination with the appro-
priate fault framework as seen in Figure 2.12.
Benin formation (continental sands) is believed not to play an important role in the gen-
eration and the preservation of hydrocarbon in the Niger Delta. The Benin formation
is, however, thick enough (300 m - 3,000 m) to serve as a significant overburden rock.
About 65 percent of the crude oil produced from the Niger Delta fall within the category
of the sweet (low-Sulfur-content), 30 degrees to 40 degrees API gravity range.
41

Figure 2.11: Examples of Niger Delta oil field structures and associated trap types(Stacher, 1995).
42

Figure 2.12: Sequence stratigraphic model of the Niger Delta showing the relationshipsbetween the source rock, migration paths, and traps (Stacher, 1995).
43

CHAPTER 3
DATA ANALYSIS AND
INTERPRETATION
3.1 Introduction
This chapter describes the analysis and interpretation of data in Otu field. The analysis
involves the results of well logs and seismic data. The chapter also describes reservoir
potential and porosity evaluation within Otu field.
3.2 Well Log Data
3.2.1 Lithostratigraphic Analysis of the Wells
Gamma ray (GR) logs from all the thirteen wells were used to delineate the lithology
in Otu field. The sand bodies were identified by the deflection of the GR log to the
left while shale was identified by the deflection to the right. Gamma ray log cut-off of
44

35 API was used for the lithostratigraphic analysis (i.e. shale: > 80API, shaly sand:
35−80 and sand: < 35API). Sand reservoirs were identified in the field.
The result of the lithostratigraphic analysis for the subsurface facies of the Agbada
formation penetrated by the wells in the Niger Delta is given in Figure 3.1. Fourteen
sand reservoirs were identified in Otu field. Sand N is the deepest sand whose top was
encountered at different depths in almost all the wells except in wells Otu 19, Otu 21,
and Otu 46 whose total depths were shallower. Sand A is the shallowest sand reservoir
that was penetrated by all the wells at different depths. Some sand units occurred at
greater depth than their adjacent units and this could be the result of faulting.
45

Figure 3.1: Lithostratigraphic analysis of the wells showing fourteen reservoir sandsin Otu field. Sand A is the shallowest while Sand N is the deepest which was notpenetrated by all wells within the field.
46
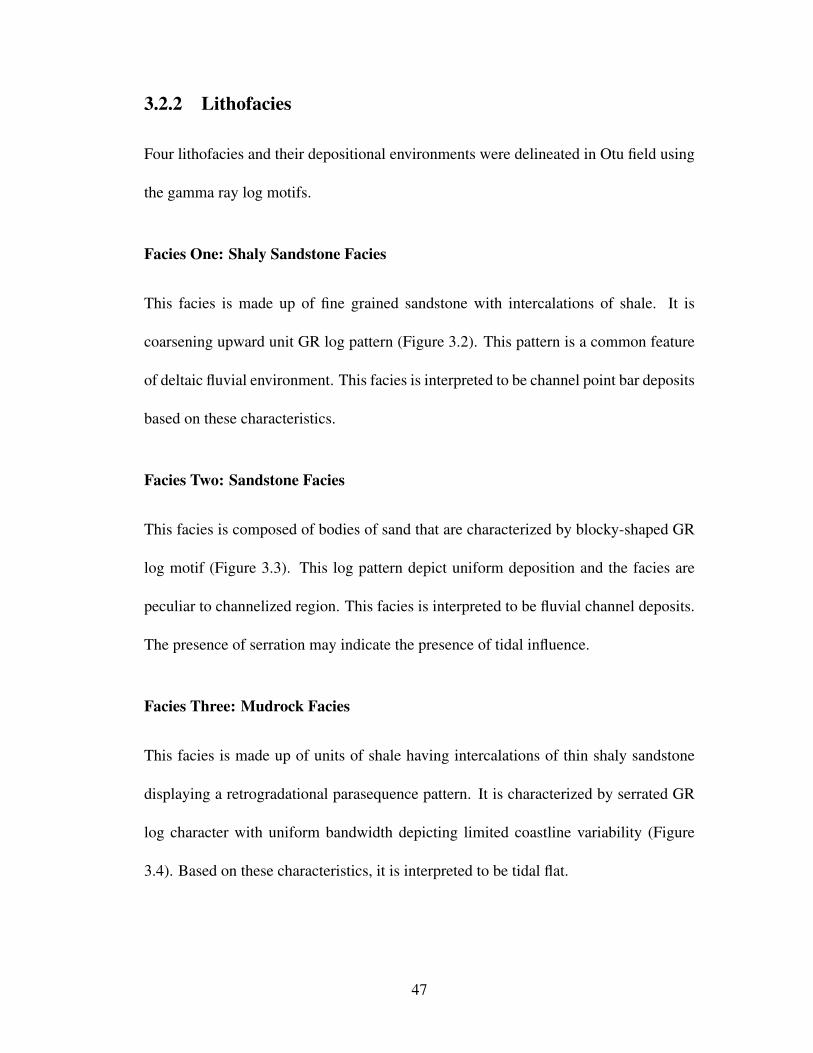
3.2.2 Lithofacies
Four lithofacies and their depositional environments were delineated in Otu field using
the gamma ray log motifs.
Facies One: Shaly Sandstone Facies
This facies is made up of fine grained sandstone with intercalations of shale. It is
coarsening upward unit GR log pattern (Figure 3.2). This pattern is a common feature
of deltaic fluvial environment. This facies is interpreted to be channel point bar deposits
based on these characteristics.
Facies Two: Sandstone Facies
This facies is composed of bodies of sand that are characterized by blocky-shaped GR
log motif (Figure 3.3). This log pattern depict uniform deposition and the facies are
peculiar to channelized region. This facies is interpreted to be fluvial channel deposits.
The presence of serration may indicate the presence of tidal influence.
Facies Three: Mudrock Facies
This facies is made up of units of shale having intercalations of thin shaly sandstone
displaying a retrogradational parasequence pattern. It is characterized by serrated GR
log character with uniform bandwidth depicting limited coastline variability (Figure
3.4). Based on these characteristics, it is interpreted to be tidal flat.
47

Facies Four: Heterolith Facies
This facies consist of sandstone and shale heteroliths and characterized by bell-shaped
GR log character (Figure 3.5) depicting a fining upward sequence. The serrated edges
may signifies tidal influence. It is interpreted to be tidal channel or sands based on the
GR log pattern.
48

Figure 3.2: Shaly sandstone facies represented by coarsening upward unit GR log pat-tern. SB means sequence boundary.
Figure 3.3: Sandstone facies represented by blocky-shaped gamma ray log pattern. SBmeans sequence boundary and RSME is regressive surface of marine erosion
49

Figure 3.4: Mudrock facies represented by serrated GR log pattern. MFS and TS aremaximum flooding surface and transgressive surface respectively.
Figure 3.5: Heterolith facies represented by bell-shaped GR log pattern
50

3.2.3 Chronostratigraphic Correlation of Wells
Chronostratigraphic correlation of time significant surfaces was performed using avail-
able well logs and carried out the well log sequence stratigraphic interpretation of indi-
vidual wells using the stacking patterns such as progradation, retrogradation and aggra-
dation which aided the delineation of the lateral continuity of facies within the systems
tract. The depositional (IV) model of Hunt and Tucker (1992, 1995) and Helland-
Hansen and Gjelberg (1994) was employed for the subsurface facies within the Agbada
formation. The chart in Figure 3.6 was used for the well log sequence stratigraphy and
the prediction of the depositional environment.
51

Figure 3.6: Sequences, systems tracts, and stratigraphic surfaces defined in relation tothe base-level and the transgressive —regressive curves (Catuneanu, 2002)
52
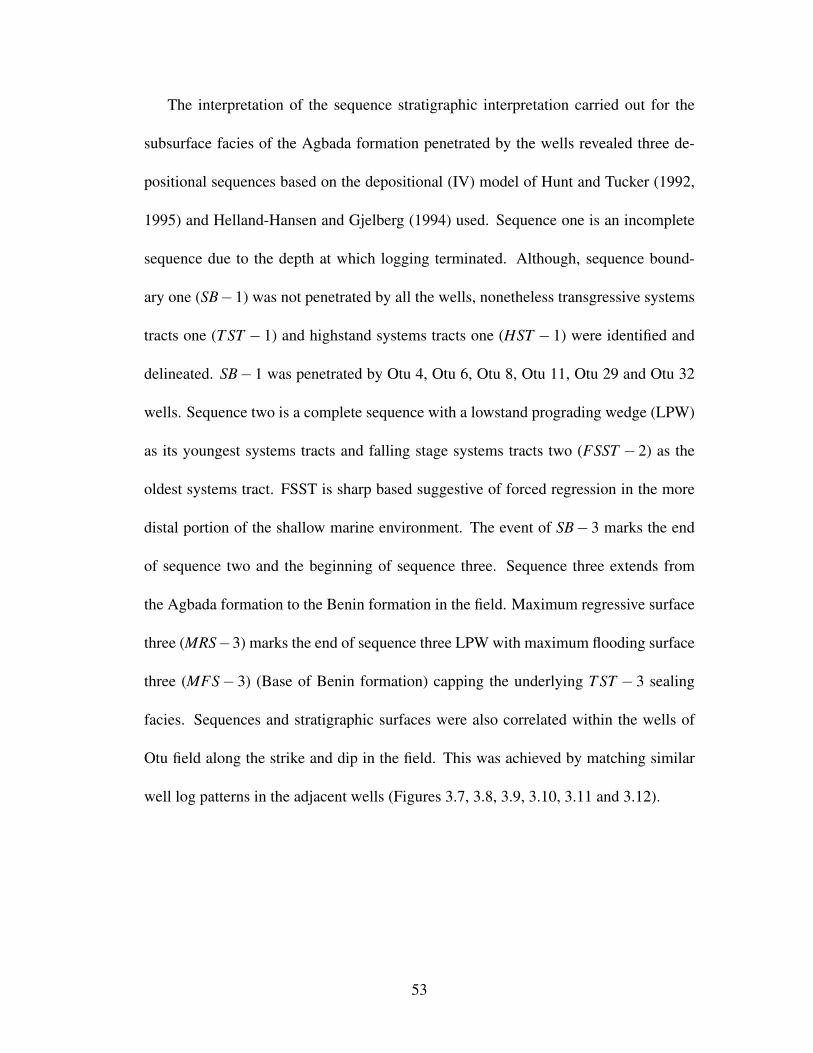
The interpretation of the sequence stratigraphic interpretation carried out for the
subsurface facies of the Agbada formation penetrated by the wells revealed three de-
positional sequences based on the depositional (IV) model of Hunt and Tucker (1992,
1995) and Helland-Hansen and Gjelberg (1994) used. Sequence one is an incomplete
sequence due to the depth at which logging terminated. Although, sequence bound-
ary one (SB−1) was not penetrated by all the wells, nonetheless transgressive systems
tracts one (T ST − 1) and highstand systems tracts one (HST − 1) were identified and
delineated. SB−1 was penetrated by Otu 4, Otu 6, Otu 8, Otu 11, Otu 29 and Otu 32
wells. Sequence two is a complete sequence with a lowstand prograding wedge (LPW)
as its youngest systems tracts and falling stage systems tracts two (FSST − 2) as the
oldest systems tract. FSST is sharp based suggestive of forced regression in the more
distal portion of the shallow marine environment. The event of SB− 3 marks the end
of sequence two and the beginning of sequence three. Sequence three extends from
the Agbada formation to the Benin formation in the field. Maximum regressive surface
three (MRS−3) marks the end of sequence three LPW with maximum flooding surface
three (MFS− 3) (Base of Benin formation) capping the underlying T ST − 3 sealing
facies. Sequences and stratigraphic surfaces were also correlated within the wells of
Otu field along the strike and dip in the field. This was achieved by matching similar
well log patterns in the adjacent wells (Figures 3.7, 3.8, 3.9, 3.10, 3.11 and 3.12).
53

Figure 3.7: Chronostratigraphic correlation log panels for wells 11, 4 and 29 indicatinga coarsening upward sequence. Serrated log character are interpreted to be tidal flat,blocky patterns are interpreted to be fluvial channel deposits. MFS3 is the base of theBenin formation.
54

Figure 3.8: Chronostratigraphic correlation log panels for wells 19, 8, 21, 5, 36, 32 and 56 indicating a coarsening upward sequence.Serrated log character are interpreted to be tidal flat while blocky patterns are interpreted to be fluvial channel deposits. HSTs areinferred to be prograding clinoforms.
55

Figure 3.9: Chronostratigraphic correlation log panels for wells 38 and 6 indicating acoarsening upward sequence. SB-1 was not penetrated by Otu 38. Serrated log charac-ter are inferred to be tidal flat deposits and HST are prograding clinoforms. Sequencesand tracts are thicker in the southern part of the field
56

Figure 3.10: Chronostratigraphic correlation log panels for wells 38, 8 and 11 indicat-ing a coarsening upward sequence. Serrated log character are interpreted to be tidalflat deposits and blocky patterns are inferred to be fluvial channel deposits. Small scalecoarsening upward units are interpreted to be point bar deposits.
57

Figure 3.11: Chronostratigraphic correlation log panels for wells 46, 6, 21 and 4 indi-cating a coarsening upward sequence. Small scale coarsening upward units are inter-preted to be point bar deposits.
58

Figure 3.12: Chronostratigraphic correlation log panels for well 5 and 29 indicating acoarsening upward sequence. Serrated log character are interpreted to be tidal flat whileblocky patterns are interpreted to be fluvial channel deposits. HSTs are inferred to beprograding clinoforms. Sequence two is thicker at the eastern part of the field.
59

Figure 3.13: Types of well log patterns in Otu field. (a) Blocky log pattern. (b) Upward-coarsening, progradation log pattern. (c) Serrated, aggradational log pattern. (d) Bellshaped, upward-fining, retrogradational log pattern.
3.3 Interpretation of Stratigraphy of Otu Field
The variations of stratigraphy in the Agbada formation of Otu field reflect the regression
of depositional environments within the Niger Delta basin by changing broadly from
fine-grained deposits in deeper wells directly above underlying the shales of Akata
formation (high GR log values) to progressively coarser-grained deposits in shallower
wells below the overlying Benin formation (lower GR log values). With the use of
standard interpretations of the Agbada formation, successions of logs that gradually
decrease in GR value and then rapidly increase are interpreted to be prograding delta
deposits. On the other hand, log successions that abruptly decrease in GR value and
have ”‘blocky”’ or gradually increasing trends are interpreted to be channel deposits
(Figure 3.13).
”‘Serrated”’ high GR value intervals are known to be dominated by shale with dif-
60

ferent amounts of thin beds of sandstones. It should be noted, however, that varying
trends of log related to prograding shorelines are not always different from those of
prograding deeper water mass flow fans, and that no core samples from Otu field are
available. Faulting, formations of growth strata over down thrown blocks, and structural
deformations that are related with upward movement of underlying Akata formation al-
ways makes the stratigraphy of the Agbada formation to be more complex.
3.3.1 Interpretation of Sequences within Otu Field
Although wells of Otu field penetrate only part of the area documented by the seis-
mic record, they provide critical information for interpreting lithic variations associated
with changes in seismic reflector character, sequence boundary incision depth, and de-
positional patterns across major faults. The four sequence boundaries and stratigraphic
surfaces were correlated between well logs by viewing adjacent log parallel to their
deviated paths. Correlations of these surfaces between gamma ray well logs and resis-
tivity logs are shown in Figures 3.7, 3.8, 3.9, 3.10, 3.11 and 3.12.
Vertical well log patterns between sequences are complex and laterally variable.
These patterns suggest that vertical grain size changes observed in individual well logs
cannot be related directly to regional patterns of regression and transgression. Vertical
trends rather record more complicated changes in accommodation and sediment supply
related to the rapid aggradation of sediments above down-dropped blocks and shifts
in the position of coarser-grained sediment transport pathways along topographically
complex and structurally-faulted sea beds. Lithic patterns observed in well logs (Fig-
61

ures 3.7, 3.8, 3.9, 3.10, 3.11 and 3.12) thus can only be understood within the context
of patterns of structural deformation and sediment thickness changes mapped in the
three dimensional seismic volume (Figures 3.15 and 3.16). The depositional environ-
ment of the subsurface facies penetrated by the wells was therefore suggestive of the
shallow marine environment (inner neritic —outer neritic) for sequence two and three
while sequence one was predicted to consist predominantly deposits of the transitional
environment.
3.4 Seismic to well tie: Otu 46 Synthetic Seismograms
Seismic-to-well tie was carried out for only Otu 46 due to the availability of sonic
logs. Density (Blue) and sonic logs (Red) were integrated into impedance (Red) and
reflectivity (Blue), depth time converted (includes an upscaling) and convolved with
the wavelet. This resulted in synthetic seismic traces for the well (samples 1-4) (Figure
3.14). This trace was compared with composite seismic trace that was extracted in the
volume along the (deviated) well path, on the nearest trace. The synthetic and compos-
ite seismic traces were then cross correlated, and the output value shows the alignment
and matching quality. The alignment was carried out by shifting the synthetic trace up
or down and also by selecting several locations in both seismic traces, specifying and
applying a shift function which varies with the travel time. The applied changes were
then validated before being converted into a new time-depth function that replaces the
previous one. This was used to link the well data to the seismic data with higher degree
of accuracy.
62

(a)
(b)
(c)
(d)
Figure 3.14: Synthetic seismogram (a) Sample 1 (b) Sample 2 (c) Sample 3 (d) Sample4 showing the integration of density (Blue) and sonic logs (Red) into impedance (Red)and reflectivity (Blue) and was depth time converted (including an upscaling) and con-volved with the wavelet. The red color means peak (+) while the black color meanstrough cores (-)
63

3.5 3D Seismic Volume
3.5.1 Structural Elements and Framework
Major and minor faults observed from the 3D seismic were mapped appropriately to
identify the structural styles within the field and to clarify the main structural elements
that affect the hydrocarbon-bearing reservoir. The structure in Otu field is dominated by
three major listric normal faults, trending northwest-southeast (NW-SE) and dip toward
the south which corresponds to gravity tectonics that occurred as a response to variable
rates of subsidence and sediment supply. The faults are labeled F3, F6, and F7 as seen
on seismic cross sections in Figures 3.15 and 3.16.
Synthetic, antithetic and counterregional faults of small scale radiate from anticline
crests, which makes those observed structures to be more complicated. The antithetic
faults include F4 and F8 while synthetic faults include F1, F2, F5 and F15 (Figure 3.15b
and Figure 3.16). The counterregional faults identified within Otu field include F10
and F14 (Figure 3.16b). Although several smaller faults were also delineated within
the seismic volume, only those faults with the highest offsets are shown in the seismic
cross sections in Figures 3.15 and 3.16. The presence of these complex structures such
as collapsed growth faults, back-to-back features in Otu field suggested that there was
completion of gravity tectonics before Benin formation was deposited (Evamy et al.,
1978).
Structural analysis framework of the study area also reveals NW-SE trending of the
faults (Figure 3.17). These major faults are believed to act as conduits for the migration
of hydrocarbon from the Akata formation to the overlying Agbada formation. The
64

accumulation in the field is defined by a hanging wall structural closure associated with
F6 (Figure 3.18), which appears to demarcate the field into NE and SW block. The Otu
wells targeted this closure and encountered about fourteen hydrocarbon bearing sands
proving that F6 is sealing.
65

(a) Seismic cross sections on Inline 11686.
(b) Seismic cross sections on Inline 11666.
Figure 3.15: Structural interpretation of Otu field showing inlines 11686 and 11666.The figures reveal three major listric faults in the field (F3, F6 and F7) and a syntheticfault (F15)
66

(a) Seismic cross sections on Inline 11466
(b) Seismic cross sections on Inline 11586.
Figure 3.16: Structural interpretation of Otu field showing Inline 11466 and Inline11586. It reveals antithetic faults (F4 and F8), counter regional faults (F10 and F14),major listric faults as well synthetic faults within the Otu field.
67

Figure 3.17: Time slice at 1500 ms showing NW-SE trending faults
68

Figure 3.18: 3D Fault model. The Otu wells targeted the hanging wall closure andencountered about fourteen hydrocarbon bearing sands
69

Figure 3.19: Types of stratal terminations (Catuneanu, 2002)
3.6 Seismic Stratigraphy Analysis
The identification of stratal terminations aided the identification of time significant sur-
faces. Stratal terminations are defined by the geometric relationship between strata and
the stratigraphic surfaces against which they terminate. The main types of stratal ter-
minations are described by truncation, toplap, onlap, downlap, and offlap (Catuneanu,
2002). These terms have subsequently been incorporated into sequence stratigraphy in
order to describe the stacking patterns of stratal units and to provide diagnostic features
for the recognition of the various surfaces and systems tracts (Posamentier and Vail,
1988; Van Wagoner et al., 1990; Christie-Blick, 1991) (Figure 3.19).
The result of seismic stratigraphy analysis carried on the available 3D seismic
data is shown in Figure 3.20. The stratal terminations were used to infer the vari-
ous shoreline shifts such as transgression and regression (normal regression and forced
regression) and their respective diagnostic depositional trends such as progradation,
retrogradation and aggradation. Having successfully integrated the well data to the
70

seismic, consistency was established between the stratigraphic surfaces independently
interpreted from both data sets as recommended by Vail et al. (1977).
The prevalence of incised valleys accompanied by seismic reflections truncating
at the base of the channels serves as evidence for sequence boundaries in most cases.
Fluvial down-cutting and the formation of incised valleys are typically formed during
a major fall in sea level at the shoreline.
71

Figure 3.20: Sequence stratigraphy architecture with the horst and grabenal structure within Otu field showing sequence boundaries andstratigraphic surfaces mapped.
72

3.6.1 Sequence Boundary One (SB−1)
Sequence boundary one is the deepest sequence identified and it has an interfluve se-
quence boundary (SB − 1) which shows a merging of SB − 1 and T S − 1 allowing
LST − 1 to be localized within the channel. No well was observed to penetrate the
channel although Otu 6 was observed to penetrate the margin of channel margin (Fig-
ure 3.21).
3.6.2 Sequence Boundary Two (SB−2)
Sequence boundary two (SB−2) separates the underlying sequence one from the over-
lying sequence two. The underlying HST −1 is characterized by inclined beds which
are prograding clinoforms terminating at the base of SB−2 (Figure 3.22).
3.6.3 Sequence Boundary Three (SB−3)
The shallowest sequence boundary three extends from the Agbada formation into the
Benin formation. SB− 3 separates the underlying sequence two from the overlying
sequence three. SB− 3 bounds the base LST − 3. The overlying channel fill within
LST −3 has a complex geometry which characterizes the channel fill. In this case, the
T S−3 does not merge with the SB−3, therefore the lowstand deposit within LST −3
should be widespread and not localized (Figure 3.23).
73

(a)
(b)
Figure 3.21: Sequence Boundary one (SB−1) (a) Trace 2920 uninterpreted section (b)Trace 2920 interpreted section revealing interfluve sequence boundary one (SB1)
74

(a)
(b)
Figure 3.22: Sequence Boundary two (SB−2) (a) Trace 2968 uninterpreted section (b)Trace 2968 interpreted section showing prograding clinoforms within HST-1.
75

(a)
(b)
Figure 3.23: Sequence Boundary three (SB− 3) (a) Trace 2980 uninterpreted section(b) Trace 2980 interpreted section. LST-3 has a complex geometry and its depositsshould be widespread and not localized because TS-3 does not merge with SB-3
76

3.6.4 Maximum Flooding Surface Three (MFS−3)
Several channelized systems exist between the Benin formation and the Agbada for-
mation such as the Soku clay, Buguma clay, Agbada clay and Opuama channel com-
plex (Figure 2.4). Such channels are well pronounced within Otu field as it extends all
through the 3D seismic sections. Figure 3.24 reveals more perspectives of SB−3 which
separates the underlying sequence two from the overlying sequence three. The figure
shows that the channel is bounded at its base by SB− 3 which merges with T S− 3,
MFS− 3 and SB− 3; hence, revealing the interfluve nature of SB− 3. Furthermore,
in some other areas this channel is bounded at its base by MFS− 3. These variations
show that the intensity of the erosional event led to the down-cutting of the underlying
T ST −3 and MFS−3 is not the same all through. This therefore led to the presence of
these systems tracts in some areas and their absence in some others.
3.6.5 Sequence Boundary Four (SB−4)
The truncation of reflections below the channel is also found to be consistent with the
SB−4 independently identified from well logs. The channel associated with this event
is within the continental Benin sands. SB− 4 separates the underlying sequence three
from the overlying sequences (Figure 3.25).
77

(a)
(b)
Figure 3.24: Maximum Flooding Surface three (MFS-3) (a) Trace 3213 uninterpretedsection (b) Trace 3213 interpreted section. SB-3 is an interfluve sequence boundary.
78

(a)
(b)
Figure 3.25: Sequence Boundary four (SB−4) (a) Trace 2885 uninterpreted section (b)Trace 2885 interpreted section. SB-4 separates the underlying sequence three from theoverlying sequences
79

The relationship between systems tracts, reservoirs and their respective depositional
environments (Table 3.1) shows that sequence one which extends from the Agbada
formation to Benin formation belongs to transitional to continental and shallow marine
environment. Sequence two in the Agbada formation is shallow marine based on the
associated system tracts while sequence three belongs to a transitional environment.
80
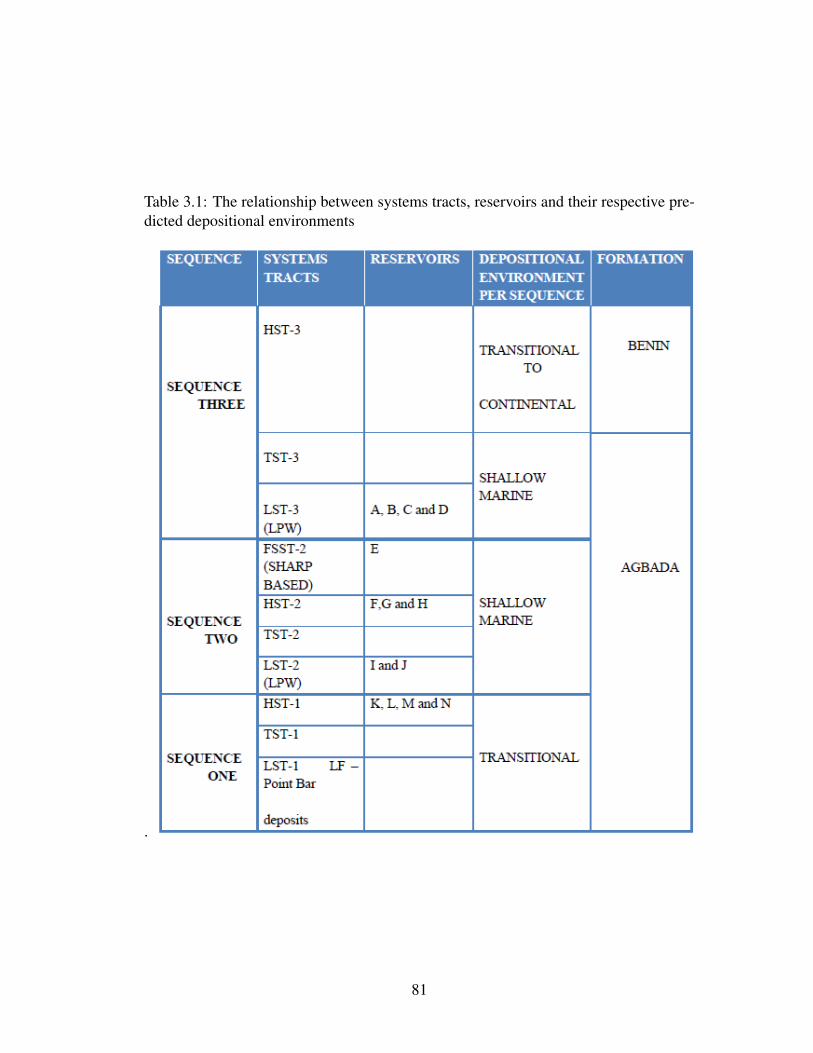
Table 3.1: The relationship between systems tracts, reservoirs and their respective pre-dicted depositional environments
.
81

3.7 Seismic Geomorphology
A seismic geomorphological approach was applied to the subsurface facies of the Ag-
bada formation. The patterns observed from the 3D seismic images are diagnostic of
depositional environment. The study provides an indication of the reservoirs internal
and external architecture which furthers our understanding of depositional processes
that ”‘gave birth”’ to the various stratigraphic features. The structural analysis revealed
a complex faulting system which plays a major role in the trapping of hydrocarbons.
The wells in the study area are concentrated within a prominent hanging wall closure
at the central portion of the field. The outputs of the seismic geomorphology stud-
ies reveal the structural framework for some of the sequence stratigraphic significant
surfaces of interest. Seismic geomorphological interpretation on stratal slices along
sequence stratigraphic significant surfaces provides an understanding of the geological
events that occur as a result of interplay of sea level changes and the rate of sedimen-
tation. Seismic geomorphology provides a clear cut relationship between stratigraphic
elements such as channels and structural elements such as faults. The sequence strati-
graphic surface of interest includes SB−1, SB−2, SB−3, MFS−3 and SB−4 in order
of decreasing depth. The stratigraphically mapped horizon were auto-tracked and sev-
eral attributes such as spectral decomposition and similarity (coherency) were draped
on the auto-tracked surfaces in order to enhance the identification and interpretation of
the structural and stratigraphic features. Spectral decomposition outputs the amplitude
at discrete frequencies. It unravels the seismic signal into its constituent frequencies,
which allows the interpreter to see phase and amplitude tuned to specific wavelengths.
82

The amplitude component excels at quantifying thickness variability and detecting lat-
eral discontinuities while the phase component detects lateral discontinuities. For this
study, it provides a useful tool for ”below resolution” seismic interpretation, sand thick-
ness estimation, and enhancing channel structures. Coherency/similarity together with
color blended spectral images help better illustrate geological information.
3.7.1 Sequence Boundary Four (SB−4)
Sequence boundary four (SB−4) is the shallowest stratigraphic surface mapped within
the Benin formation with an overlying lowstand deposit LST − 4. The direction of
paleoflow of the S-shaped meandering channel is northeast-southwest (NE-SW) (Figure
3.26). The channel is visible at the footwall of the east-west (E-W) trending normal
fault but was not observed at the hanging wall area. However, sediment waves were
observed at the hanging wall area. There is an evidence of a possible point bar in this
sequence boundary. It was observed that the channel disappears on interception with
normal faults (Figure 3.26).
83

(a)
(b)
Figure 3.26: Section (a) Uninterpreted section (b) Interpreted section. A point bar wasobserved here and the channel disappears on interception with normal faults. Scale baris amplitude values.
84

3.7.2 Maximum Flooding Surface Three (MFS−3)
A relatively pronounced sinuous channel was observed in the northeastern part of the
field. The direction of paleoflow is NE-SW and perpendicular to the fault trace (Figure
3.27). The strength of incision is perturbed by the faulting event causing the channel to
be pronounced at the footwall of the normal fault.
3.7.3 Sequence Boundary Three (SB−3)
The individual channel observed on SB− 3 is subtle and directed along the hanging
wall of the fault, running parallel along the fault trace (Figure 3.28).
3.7.4 Sequence Boundary Two (SB−2)
The individual channel observed on SB− 2 is subtle and directed along the hanging
wall of the fault, running parallel along the fault trace (Figure 3.29).
3.7.5 Sequence Boundary One (SB−1)
The meandering channel belt in this sequence boundary shows characteristics point bar
which flow at an obtuse angle in the direction of NE-SW (Figure 3.30)
85

Figure 3.27: Spectral decomposition at (10Hz and 40Hz) on MFS−3 stratal slice show-ing the channel NE SW direction (+30ms and -30ms). A relatively pronounced sinuouschannel was observed in the northeastern part of the field. Scale bar is amplitude values
86

Figure 3.28: Spectral decomposition at (10Hz and 20Hz) on SB−3 stratal slice showingthe channel NE-SW direction (+30ms and -30ms). The individual channel observed onSB-3 is subtle and directed along the hanging wall of the fault. Scale bar is amplitudevalues
87

Figure 3.29: Similarity (Coherency) on SB− 2 stratal slice (+30ms and -30ms). Theindividual channel observed on SB-2 is subtle and directed along the hanging wall ofthe fault, running parallel along the fault trace
88
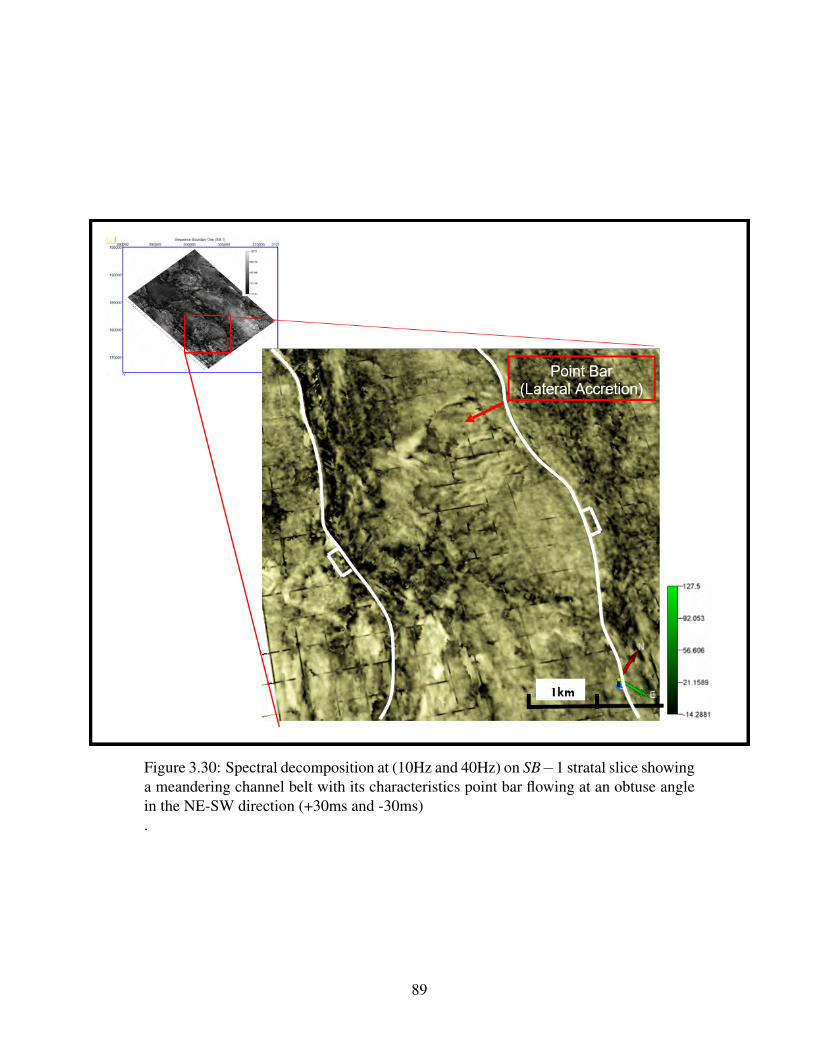
Figure 3.30: Spectral decomposition at (10Hz and 40Hz) on SB−1 stratal slice showinga meandering channel belt with its characteristics point bar flowing at an obtuse anglein the NE-SW direction (+30ms and -30ms).
89

Table 3.2 shows the relationship between the type of channel observed in the se-
quences, channel orientation relative to fault, sequence stratigraphic surface, and the
depositional environments.
3.8 Discussion
Our interpretations suggest that most sequence boundaries are eroded by fluvial mass
flows forward of the delta front. Patterns of sequence erosion, deeper in footwalls
of faults and along edges of rollover anticlines, and the thickening of deposits across
down-dropped blocks, suggest that multiple faults moved during Agbada formation de-
position. This reflects the larger-scale collapse of the Niger Delta clastic wedge as
sediments loaded the underlying Akata formation shales. Sequence boundary erosion
thus probably reflects increased slopes over this collapsing wedge (Figure 3.31), rather
than fluvial lowstand incision. The depositional environments of sediments filling se-
quence surface topography are more difficult to constrain without core sample. Well
logs through some sequences clearly show an up-section progression from upward-
coarsening successions (prograding lobes) to blocky and upward fining successions
(channel deposits). It may be that this reflects a progression from pro-delta and deltaic
shorelines to fluvial depositional settings. Alternatively, however, these trends may re-
flect progression from lobe to channel deposits within a prograding submarine system.
90

Table 3.2: Relationship between the type of channel, channel orientation relative tofault, sequence stratigraphic surface and the depositional environments
.
91

Figure 3.31: Sequence boundary development on down faulted blocks. Sequenceboundary erosion shows increased slopes over the collapsing wedge rather than fluviallowstand incision.
92

Although syndepositional deformation significantly complicated local basin slopes,
locations of sequence boundary incision, sediment transport patterns, and local sedi-
ment accumulation rates and the general association between eustatic sea level fall and
the age of sequence boundaries suggests a causal relationship. It may be that falls in
sea level forced deltas to prograde more rapidly, increasing loading on Akata formation
shales, and accelerating rates of clastic wedge collapse into the basin. Falling sea level
may have also been associated with less storage of muds in the fluvial system, and an
increase in hyperpycnal flow from the Niger River system onto the shelf.
In this scenario, sequence boundary erosion would reflect increased basin gradi-
ents across the faulted shelf-slope edge. Gradients and associated erosion would have
increased during rapid delta progradation due to associated structural collapse of the
shelf, rather than times of lowstand shelf exposure when incised fluvial valleys car-
ried sediments directly to the slope edge. Deepening of facies directly above sequence
boundaries reflect the down dropped faulted blocks as shorelines continued to regress.
Progressive decrease in the thickness of successive sequences, and increase in local
incision at the base of successive sequences, reflects the filling of accommodation in
the area of Otu field, greater rates of sediment bypass, and thus decreased local rates
of sediment loading. As accommodation filled, the locus of sediment deposition, and
location a fastest sediment loading would also have shifted seaward.
The evolution of channel meanders appear to be similar to fluvial meandering chan-
nels in terms of direction and geometry of channel migration but channel fills are fine-
grained. Changes in gravity flows have been associated with the formation of sinuous
93

crosscutting channel preserved on the floor of a larger canyon at Benin-major in the
Niger Delta (Deptuck et al., 2003).
3.9 Depositional Sequences and Model
The depositional sequences within the Otu field are shown in Figures 3.32, 3.33 and
3.34 . The Figures illustrate the three sequences mapped in Otu Field with their systems
tracts as a result of an interplay of variation in sea level and accommodation rates.
However, the depositional models for all the three sequences were constructed as shown
in Figure 3.35.
94

(a)
(b)
Figure 3.32: (a) Depositional sequence one in Otu field. It shows key stratigraphicsurfaces and various systems tracts. (b) Variation with sea level. The model is based onthe integration of seismic and well logs and was not drawn to scale
95

(a)
(b)
Figure 3.33: (a) Depositional sequence two in Otu field showing key stratigraphic sur-faces and various systems tracts (b) Variation with sea level. Note that the model isbased on the integration of seismic and well logs and was not drawn to scale
96

(a)
(b)
Figure 3.34: (a) Depositional sequence three in Otu field showing key stratigraphicsurfaces and various systems tracts (b) Variation with sea level. The model is based onthe integration of seismic and well logs and was not drawn to scale
97

Figure 3.35: Geomorphology, cyclic sedimentation and an active fault in the TertiaryNiger Delta coastal zone (modified after Reijers (2011)
98

3.9.1 Depositional Sequence Architecture
The depositional systems in Otu field are made up of lowstand systems tracts (LST),
transgressive systems tracts (TST), falling stage systems tracts (FSST) and highstand
systems tracts (HST). Sediments identified within the LST are the fluvial channel sands.
These sands are related to the incision of fluvial valley into the shelf. There is presence
of prograding forced regressive deposits (FSST). These fluvial channel sands have ex-
cellent qualities as reservoir. The TSTs in the field capped the LST facies and consist
of mainly marine shales. HSTs are made up of coarsening and shallowing upwards in-
tervals, having fluvial and deltaic sands near the top of the unit. HSTs are very thick in
most of the wells studied in Otu field. This may be as a result of high subsidence rates,
high input of sediments and instability caused by underlying shale which is similar to
the pattern of sediments observed in the Gulf Coast (Winker, 1982).
3.10 Reservoir Potential of Otu Field
Five (5) potential reservoirs (A, B, I, J and K) were delineated in the field. These
reservoirs are mainly channel sands of LST and HST.
3.10.1 Porosity Evaluation
Porosity was evaluated from seven (7) wells. The evaluation of porosity was not possi-
ble for five (5) wells (Otu 6, Otu 8, Otu 19, Otu 46 and Otu 56) because there were no
neutron, density or resistivity logs in those wells. The results of porosity evaluation is
given in Table 3.3.
99

Table 3.3: Average Effective Porosity for the Reservoirs
Reservoirs Average Effective PorosityMinimum Mean Maximum
A 0.243 0.299 0.342B 0.220 0.278 0.315I 0.298 0.313 0.329J 0.232 0.272 0.288K 0.233 0.276 0.305
Table 3.4: Porosity values for Reservoirs Qualitative Description (Adapted from Rider(1986))
Percentage Porosity Qualitative Description0 - 5 Negligible5 - 10 Poor
15 - 20 Good20 - 30 Very Good>30 Excellent
Table 3.3 shows a good reservoir quality and probably reflects well sorted coarse
grained sandstone reservoirs with little cementation. According to Rider (1986), the
porosity in all the reservoirs fall within very good porosity except reservoir I which
have an excellent porosity. The results are consistent with recent studies in nearby
fields (Ajisafe and Ako (2013); Richardson (2013); Adeoti et al. (2014)).
3.10.2 Reservoir Continuity
Reservoirs A and B were identified within the LST of sequence three. Reservoir A are
traceable within seven wells and absent in Otu 4, Otu 6 and Otu 38. Reservoir B on the
other hand are traceable within five wells (Otu 29, Otu 11, Otu 21, Otu 8 and Otu 4).
Reservoirs I and J are found within the LST of sequence two. Reservoir I has lateral
continuity from wells Otu 4, Otu 8, Otu 21, Otu 29 and Otu 32. Reservoir J however
100

has lateral continuity from wells Otu 4, Otu 5, Otu 6 Otu 8, Otu 11, Otu 19, Otu 21, Otu
29, Otu 36 and Otu 38. However, reservoir K represents the thick facies of the HST in
sequence one and are traceable within wells Otu 4, Otu 8, Otu 11, Otu 21 and Otu 29.
3.10.3 Reservoir Geometry
The Niger Delta is known to have stacked reservoirs that have thickness in the range of
less than 15 m to greater than 45 m (Evamy et al., 1978). However, thicker reservoirs
are likely to be composite bodies of stacked channels (Doust and Omatsola, 1990).
Therefore, the reservoirs in the field are stacked channel sands and have thickness as
in the range of 11 m to about 62 m. On the basis of reservoir quality and geometry in
Otu field, point bars of fluvial channels that are cut by sand-filled channels are the most
important. Also based on their porosity evaluation, the reservoir shows a good reservoir
quality.
3.10.4 Source Rock Potential
The marine shale units of the transgressive systems tracts (TST) that were identified in
the field would probably serve as the potential source rocks for the hydrocarbon found
in the reservoirs of the field.
3.10.5 Trapping Mechanisms
The results of lithostratigraphic analysis show some sand units occurring at greater
depth than their adjacent units. These were interpreted to be a result of syndepositional
101

faulting in Otu field. These faults probably constitute the major traps for the accumu-
lation of hydrocarbons. However, the shale units of the TST and those in HST could
provide both top and bottom seals for hydrocarbon in the reservoir sands within Otu
field. Therefore, the reservoir rocks of the LST and HST and seals from marine shale
of the TST can together to form stratigraphic traps for hydrocarbon accumulation.
102
CHAPTER 4
CONCLUSION AND
RECOMMENDATION
4.1 Conclusion
The Agbada formation of the Niger Delta is characterized by both structural and strati-
graphic features which controls the trapping of hydrocarbon within its deposits. This
study seeks to understand the relationship between these two features within the Otu
field.
The structural analysis of the study area reveals a complex faulting system. The
structural styles observed include horst and graben structures, structures with collapsed
crest, structures with rollover anticlines. These faults play a major role in the hydrocar-
bon trapping in the study area. A prominent hanging wall closure in the central part of
the field is the primary target of all the wells that penetrated the field. Lithostratigraphic
analysis assisted in identifying and delineating fourteen reservoir sands in the field.
103

The subsurface facies of Otu field is subdivided into three sequences from the se-
quence stratigraphic interpretation carried out using well logs and 3-D seismic data. Se-
quence one is the deepest sequence subdivided into LST −1, T ST −2 and HST −3 and
interpreted to consist predominantly deposits of the transitional environment. Overly-
ing sequence one is sequence two which consists of LST −2 (LPW), T ST −2, HST −2
and FSST −2 and its depositional environment is interpreted to be predominantly shal-
low marine. Sequence three is the shallowest sequence stretching from the Agbada
formation into the Benin formation, and consists of LST −3 (LPW), T ST −3, HST −3
and were interpreted to be deposits representing transitional to shallow marine environ-
ments.
The seismic geomorphological study carried out on all the sequence boundaries
(SB1 to SB4 and MFS−3) reveals a link between the depositional environment, type of
channel and direction of paleo-flow relative to the faults. Channel belts are associated
with continental to transitional depositional environment deposits while individual (rel-
atively thin and less sinuous) channels were associated with shallow marine deposits.
Channel belts are oriented perpendicular to the fault while individual channels (incised
valley) were parallel and rarely affected by the faults.
This integrated study therefore reveals insights into the effects of tectonic events
as it significantly affect the relationship between structural features such as faults and
stratigraphic features such as channels within the field: therefore, providing a profitable
means to guide hydrocarbon exploration and production strategies.
On the basis of reservoir quality in Otu field, point bars of fluvial channels that are
104

cut by sand-filled channels are the most important reservoir rocks of the LST and HST
and seals from marine shale of the TST could also combine to form stratigraphic traps
for hydrocarbon accumulation in Otu field. Five hydrocarbon bearing sands were also
identified and the evaluation of their porosities shows very good to excellent porosities.
4.2 Recommendation
Additional biostratigraphic, core and permeability data needed to integrate the results
in order to establish more reliable interpretation in the field.
105

REFERENCES
Adeoti, L., N. Onyekachi, O. Olatinsu, J. Fatoba, and M. Bello, 2014, Static reservoir
modeling using well log and 3-d seismic data in a kn field, offshore niger delta,
nigeria: International Journal of Geosciences, 5, 93.
Adewoye, O., J. Amigun, E. Okwoli, and A. Cyril, 2013, Petrophysical and structural
analysis of maiti field, niger delta, using well logs and 3-d seismic data: Petroleum
& Coal, 55, 302–310.
Ajisafe, Y., and B. Ako, 2013, 3-d seismic attributes for reservoir characterization of y
field niger delta, nigeria: IOSR Jour. of Appl. Geo. and Geoph, 1, 23–31.
Alao, P., S. Olabode, and S. Opeloye, 2013, Integration of seismic and petrophysics
to characterize reservoirs in ala oil field, niger delta: The Scientific World Journal,
2013.
Allen, J. R. L., 1965, Late quaternary niger delta, and adjacent areas: sedimentary
environments and lithofacies: AAPG Bulletin, 49, 547–600.
Amigun, J. O., O. Adewoye, T. Olowolafe, and E. Okwoli, 2014, Well logs–3 d seis-
mic sequence stratigraphy evaluation of holu field, niger delta, nigeria: International
Journal of Science and Technology, 4, 26–36.
106
Avbovbo, A. A., 1978, Tertiary lithostratigraphy of niger delta: Geologic notes: AAPG
Bulletin, 62, 295–300.
Beka, F., and M. Oti, 1995, The distal offshore niger delta: frontier prospects of a
mature petroleum province: Geology of deltas: Rotterdam, AA Balkema, 237–241.
Bustin, R., 1988, Sedimentology and characteristics of dispersed organic matter in ter-
tiary niger delta: origin of source rocks in a deltaic environment: AAPG Bulletin,
72, 277–298.
Catuneanu, O., 2002, Sequence stratigraphy of clastic systems: concepts, merits, and
pitfalls: Journal of African Earth Sciences, 35, 1–43.
Catuneanu, O., W. E. Galloway, C. G. S. C. Kendall, A. D. Miall, H. W. Posamen-
tier, A. Strasser, and M. E. Tucker, 2011, Sequence stratigraphy: methodology and
nomenclature: Newsletters on Stratigraphy, 44, 173–245.
Christie-Blick, N., 1991, Onlap, offlap, and the origin of unconformity-bounded depo-
sitional sequences: Marine Geology, 97, 35–56.
Chukwu, G., 1991, The niger delta complex basin: Stratigraphy, structure and hydro-
carbon potential: Journal of Petroleum Geology, 14, 211–220.
Corredor, F., J. H. Shaw, and F. Bilotti, 2005, Structural styles in the deep-water fold
and thrust belts of the niger delta: AAPG Bulletin, 89, 753–780.
Daramola, A., M. Ayuk, et al., 2011, 3d structural interpretation and volumetric analysis
over dara field onshore niger delta.: Presented at the 2011 SEG Annual Meeting,
Society of Exploration Geophysicists.
Deptuck, M. E., G. S. Steffens, M. Barton, and C. Pirmez, 2003, Architecture and
107

evolution of upper fan channel-belts on the niger delta slope and in the arabian sea:
Marine and Petroleum Geology, 20, 649–676.
Doust, H., and M. Omatsola, 1990, Petroleum geology of the niger delta: Geological
Society, London, Special Publications, 50, 365–365.
Ejedawe, J., 1986, The expulsion criterion in the evaluation of the petroleum source
beds of the tertiary niger delta: Journal of Petroleum Geology, 9, 439–450.
Ekweozor, C., and E. Daukoru, 1994, Northern delta depobelt portion of the akata-
agbada (!) petroleum system, niger delta, nigeria: Chapter 36: Part vi. case studies–
eastern hemisphere.
Evamy, B., J. Haremboure, P. Kamerling, W. Knaap, F. Molloy, and P. Rowlands, 1978,
Hydrocarbon habitat of tertiary niger delta: AAPG bulletin, 62, 1–39.
Futalan, K., A. Mitchell, K. Amos, and G. Backe, 2012, Seismic facies analysis and
structural interpretation of the sandakan sub-basin, sulu sea, philippines: Presented
at the AAPG International Conference and Exhibition (2012: Singapore).
Helland-Hansen, W., and J. G. Gjelberg, 1994, Conceptual basis and variability in se-
quence stratigraphy: a different perspective: Sedimentary Geology, 92, 31–52.
Hooper, R. J., R. J. Fitzsimmons, N. Grant, and B. C. Vendeville, 2002, The role of
deformation in controlling depositional patterns in the south-central niger delta, west
africa: Journal of Structural Geology, 24, 847–859.
Hunt, D., and M. E. Tucker, 1992, Stranded parasequences and the forced regressive
wedge systems tract: deposition during base-level’fall: Sedimentary Geology, 81,
1–9.
108

——–, 1995, Stranded parasequences and the forced regressive wedge systems tract:
deposition during base-level fallreply: Sedimentary Geology, 95, 147–160.
John, O., O. Sunday, et al., 2014, Analysis of facies and depositional systems of ray-
field, onshore niger delta basin, nigeria: Presented at the 2014 SEG Annual Meeting,
Society of Exploration Geophysicists.
Kostenko, O. V., S. J. Naruk, W. Hack, M. Poupon, H.-J. Meyer, M. Mora-Glukstad,
C. Anowai, and M. Mordi, 2008, Structural evaluation of column-height controls at
a toe-thrust discovery, deep-water niger delta: AAPG Bulletin, 92, 1615–1638.
Kulke, H., 1994, Regional petroleum geology of the world: Europe and asia: G. Born-
traeger.
Lehner, P., and P. De Ruiter, 1977, Structural history of atlantic margin of africa: AAPG
Bulletin, 61, 961–981.
Magbagbeola, O. A., and B. J. Willis, 2007, Sequence stratigraphy and syndepositional
deformation of the agbada formation, robertkiri field, niger delta, nigeria: AAPG
bulletin, 91, 945–958.
Morgan, R., 2004, Structural controls on the positioning of submarine channels on the
lower slopes of the niger delta: Geological Society, London, Memoirs, 29, 45–52.
Nton, M., and A. Adesina, 2009, Aspects of structures and depositional environment
of sand bodies within tomboy field, offshore western niger delta, nigeria: RMZ–
Materials and Geoenvironment, 56, 284–303.
Nwachukwu, J. I., and P. I. Chukwura, 1986, Organic matter of agbada formation, niger
delta, nigeria: AAPG Bulletin, 70, 48–55.
109

Obaje, S., 2013, Seismic interpretation of tomboy field, offshore western niger delta,
nigeria: Intl. J. Sci. & Tech, 2, 648–660.
Opara, A., 2010, Prospectivity evaluation of usso field, onshore niger delta basin, using
3-d seismic and well log data: Petroleum & Coal, 52, 307–315.
Oyedele, K., D. Ogagarue, and D. Mohammed, 2013, Integration of 3d seismic and
well log data in the optimal reservoir characterisation of emi field, offshore niger
delta oil province, nigeria: American Journal of Scientific and Industrial Research,
4, 11–21.
Posamentier, H., R. Davies, J. Cartwright, L. S. g. a. t. h. e. Wood, and production,
2007, Seismic geomorphology-an overview: Geological Society of London, Special
Publications, 277, 1–14.
Posamentier, H., and P. Vail, 1988, Sequence stratigraphy: sequences and systems tract
development: CSPG Special Publications, 15, 571–572.
Reed, K. J., 1969, Environment of deposition of source beds of high-wax oil: Geologi-
cal notes: AAPG Bulletin, 53, 1502–1506.
Reijers, T., 2011, Stratigraphy and sedimentology of the niger delta: Geologos, 17,
133–162.
Reijers, T., S. Petters, and C. Nwajide, 1997, The niger delta basin: Sedimentary Basins
of the World, 3, 151–172.
Richardson, A.-A. M., 2013, Well correlation and petrophysical analysis, a case study
of rickie field onshore niger delta: The Inter. Jour. of Engi. and Scie, 2, 4–99.
Rider, M. H., 1986, The geological interpretation of well logs.
110

Rotimi, O. J., 2010, Sequence stratigraphy study within a chronostratigraphic frame-
work of ningning field, niger delta: RMZ–Materials and Geoenvironment, 57, 475–
500.
Short, K., and A. Stauble, 1967, Outline of geology of niger delta: AAPG bulletin, 51,
761–779.
Stacher, P., 1995, Present understanding of the niger delta hydrocarbon habitat: Geol-
ogy of Deltas. AA Balkema, Rotterdam, 257–267.
Tissot, B. P., and D. H. Welte, 1984, Identification of source rocks, in Petroleum For-
mation and Occurrence: Springer, 495–547.
Tuttle, M. L., R. R. Charpentier, and M. E. Brownfield, 1999, The niger delta petroleum
system: Niger delta province, nigeria, cameroon, and equatorial guinea, africa: US
Department of the Interior, US Geological Survey.
Vail, P. R., R. Mitchum Jr, and S. Thompson III, 1977, Seismic stratigraphy and global
changes of sea level: Part 4. global cycles of relative changes of sea level.: Section
2. application of seismic reflection configuration to stratigraphic interpretation.
Van Wagoner, J. C., R. Mitchum, K. Campion, and V. Rahmanian, 1990, Siliciclastic
sequence stratigraphy in well logs, cores, and outcrops: concepts for high-resolution
correlation of time and facies.
Whiteman, A., 1982, Nigerian petroleum geology, resources and potential vol 2.: Gra-
ham and Trotman ltd.
Williams, S., 1997, Graptolites, acritarchs and scolecodonts at green point, western
newfoundland: International cambrian-ordovician boundary working group.
111

Winker, C. D., 1982, Cenozoic shelf margins, northwestern gulf of mexico (*): Gulf
Coast Association of Geological Societies Transactions, 32, 427–448.
112

1
Sanuade, Oluseun Adetola
Address: Building 801/304, KFUPM, Dhahran 31261
Mobile: +2347038958998; +966551759149;
E-mail: [email protected]; [email protected]
Date of Birth: 17 July, 1982
EDUCATION
King Fahd University of Petroleum & Minerals, Dhahran, Saudi Arabia 2015
[M.Sc. Geology]
University of Ibadan, Ibadan Nigeria 2012
[M.Sc. Applied Geophysics]
University of Ibadan, Ibadan, Nigeria 2007
[B.Sc. Geology (First Class Honours)]
The Polytechnic Ibadan, Ibadan, Nigeria 2002
[National Diploma in Geology (Distinction)]
EMPLOYMENT HISTORY
King Fahd University of Petroleum & Minerals 2014 till date
Teaching Assistant
• Physical Geology
• Sustaining the Earth
Professional Experts and Energy Company Ltd, Lagos 2012 – 2013
Geoscientist
• Seismic Interpretation
• Petrophysical Interpretation.
University of Ibadan, Ibadan Nigeria 2010 – 2012
Research Assistant
• Acquisition, processing and interpretation of geophysical data.
• Acquisition, processing and interpretation of thermal properties of soil.
• Supervision of student projects/theses
• Geological mapping and production of geological maps
Eniade Resources Interbiz Concept Ltd 2008 –2010
Geoscientist
• Acquisition, processing and interpretation of geophysical (resistivity) data.
• Acquisition, processing and interpretation of thermal properties of soil.
• Supervision of borehole drilling/projects and management of site workers
• Geological mapping and production of geological maps

2
National Youth Service Corps, Akwa Ibom State 2007 – 2008
• Ini Secondary School, Ikpe Ikot Nkon
• Mathematics Teacher/ Game Master/Form Master
• Integrated Science Teacher
Petroc Services Ltd, Ibadan, Nigeria 2007
Trainee Geoscientist (Intern)
• Preparation of samples for Geochemical analyses
• Determination of pH, TDS, anions, cations, conductivities of water samples
• Interpretation of Geochemical Data
• Geological Mapping and Production of Geological Maps
Subsurface Geo-Imaging, Ibadan 2005- 2007
Assistant Geologist (Contract Staff)
• Acquisition, processing and interpretation of geophysical data.
• Acquisition, processing and interpretation of thermal properties of soil.
• Supervision of borehole drilling/projects and management of site workers
• Geological mapping and production of geological maps
Petroc Services Ltd, Ibadan, Nigeria 2005
Assistant Geologist
• Preparation of samples for Geochemical analyses
• Determination of pH, TDS, anions, cations, conductivities of water samples
• Interpretation of Geochemical Data
• Geological Mapping and Production of Geological Maps
•
Postgraduate School, University of Ibadan, Ibadan Nigeria 2003-2004
Clerical Officer
• Organization of Board and committees meetings
• Preparation of conversion letters
• Data Management
PUBLICATIONS, TECHNICAL REPORTS AND CONFERENCE PROCEEDINGS
• Adelu A. Oluwaseun, Sanuade O. Adetola, Oboh E. Goodluck, Offeh E. Ogheneworo, Adewale
Taiwo, Mumuni O. Stephen, Oladapo I Micheal and Omolaiye E. Gabriel, “Hydrocarbon Field
Evaluation: Case study 'Tadelu Field' shallow offshore Western Niger Delta Nigeria” Arabian Journal of Geosciences (Article in Press)
• Michael A. Oladunjoye, Ademola J. Salami, Ahzegbobor P. Aizebeokhai, Oluseun A. Sanuade
and Sanlinn I. Kaka, “Preliminary Geotechnical Characterization of a Site In Southwest Nigeria
Using Integrated Electrical and Seismic Methods, Arabian Journal of Geosciences (Article in
Press)
• Michael A. Oladunjoye, Kehinde David Oyeyemi , Ahzegbobor P. Aizebeokhai, Oluseun A.
Sanuade and Sanlinn I. Kaka, “Geophysical Surveys to Inverstigate an Archaeological Site in
Southwestern Nigeria, Arabian Journal of Science and Engineering (Article in Press)

3
• Sanuade, Oluseun A., Oladunjoye, M. A. and Olaojo, A. A., “ Hydrocarbon Reservoir
Characterization of “AY” Field, Deep-Water Niger Delta using 3D seismic and well logs”, Arabian Journal of Geosciences (Article in Press)
• Oladunjoye, Michael Adeyinka, Adefehinti, Afolabi and Sanuade, Oluseun Adetola., “In-
Situ and Laboratory Determination of Thermal Properties of Tar Sands in Eastern Dahomey
Basin Southwestern Nigeria”, IJRRAS 20 (1), July 2014.
• Sanuade Oluseun Adetola, Calcareous Nannofossil Biostratigraphic Analysis of Well ‘K-
2’, Deep Offshore Niger Delta, Nigeria, Advances in Research 2(12): 696-711, 2014, Article
no. AIR.2014.12.001
• Michael Adeyinka Oladunjoye, Oluseun Adetola Sanuade and Olaojo Abayomi A, “Variability of Soil Thermal Properties of a Seasonally Cultivated Agricultural Teaching and Research Farm,
University of Ibadan, South- Western Nigeria”, Global Journal of Science Frontier Research:
Agriculture and Veterinary Volume 13 Issue 8 Version 1.0 Year 2013.
• Oladunjoye, Michael Adeyinka, Adefehinti, Afolabi and Sanuade, Oluseun Adetola., “In-Situ
and Laboratory Determination of Thermal Properties of Tar Sands in Eastern Dahomey Basin
Southwestern Nigeria”, 13th SAGA Biennial Conference and Exhibition, 06 October, 2013.
• Omolaiye Gabriel, E. and Sanuade Oluseun, A., “Petrophysics of the B- Reservoir in Eyram
Field, Onshore Niger Delta” British Journal of Applied Science and Technology, 3(4): 1481-1504,
2013.
• Michael Adeyinka Oladunjoye and Oluseun Adetola Sanuade, “Thermal Diffusivity, Thermal Effusivity and Specific Heat of Soils in Olorunsogo Power Plant, Southwestern Nigeria,” IJRRAS
13 (2), November 2012.
• Michael Adeyinka Oladunjoye and Oluseun Adetola Sanuade, “In Situ Determination of Thermal Resistivity of Soil: Case Study of Olorunsogo Power Plant, Southwestern Nigeria,” ISRN
Civil Engineering, vol. 2012, Article ID 591450, 14 pages, 2012. doi:10.5402/2012/591450.
• Oladunjoye, M.A. and Sanuade, O.A. “In-situ Determination of Thermal Properties of Soil: Case
Study of Olorunsogo Power Plant, Southwestern Nigeria”. 48th Annual International Conference
and Exhibition of the Nigerian Mining and Geosciences Society (NMGS), 18th – 23rd March,
2012.
• Oladunjoye, M.A., Oyerinde, A. Olaojo, A. A. and Sanuade, O.A, 2010: Thermal
resistivity/conductivity measurements at Lagos Free Trade zone, Ibeju Lekki Area, Lagos, Nigeria.
Technical Report Submitted to TREVI Foundations Nig Ltd, Gbagada Industrial Estate, Lagos.
SKILLS
• Usage of Resistivity meter (Campus Ohmega, ABEM 1000 and Geopulse Tiger) for geophysical
investigations and thermal resistivity KD 2 probe
• Proficient in Resist 2D & 3D, Win Resist, Microsoft office packages, Origin 6.0 , Surfer 11, Petrel,
Kingdom Suite, Seismic Unit
• A self-motivation
• Open-minded (can take suggestions and criticism as positive)
• A functional team player
• Task oriented and can work under pressure
AWARDS AND SCHOLARSHIPS
• King Fahd Postgraduate Scholarship, Saudi Arabia, 2013
• Aret Adams Foundation Postgraduate Scholarship Award, 2013

4
• Siyan Malomo Prize in Geology, University of Ibadan, 2007
• Dean’s Roll of Honour, University of Ibadan, 2004 - 2006
• Best Graduating Geology student, The Polytechnic, Ibadan, 2002
• The Vine Group (TVG) Award, The Polytechnic , Ibadan , 2001
• SEG Challenge Bowl in the 2015 Middle East SEG Challenge Bowl, Manama Bahrain
PROFESSIONAL AFFILIATIONS
• Society of Exploration Geophysicists (SEG)
• Dhahran Geosciences Society (DGS)
• Society of Petroleum Engineers (SPE)
• American Association of Petroleum Geologists (AAPG)
• Nigerian Association of Petroleum Explorationists (NAPE)
• International Association of Hydrogeologists (IAH)
• Association of Environmental and Engineering Geologists
(AEG).
PROFESSIONAL COURSES ATTENDED
• DOWAC- Sequence Stratigraphy Applied to Exploration, 2010
• SEG – Distinguished Instructor short course: Practical Applications of
• EAGE- Education Tour Series: Seismic Fracture Characterization, 2014.
• SEG – Non Mathematical Overview of Modeling, Migration, Velocity Analysis and Full
waveform Inversion, 2014
REFEREES
• On Request