
1 1111111 11111111111 IIN 11111 111111 11 1111 - City of ...
Upload
khangminh22Category
view
0download
0
r •
@~~ l~. . . .
, IIN~~HI


•
Aquaculture "lnd the bllvironment
Edited by M. Mohan Joseph
(Proceedings of the International Symposium "Environment - Aquaculture Interaction",
27 November, 1996, Fourth Indian Fisheries Forum, 24-28 November, 1996, Kochi. Asian
Fisheries Society, Indian Branch)
1999
Printed in India
Published by
Asian Fisheries Society, Indian Branch
College of Fisheries Campus
University of Agricultural Sciences
Mangalore 575 002
India
Copyright © 1999 Asian Fisheries Society, Indian Branch
M. Mohan Joseph
Aquacuiture and the Environment
Asian Fisheries Society, Indian Branch,
Mangalore,
India.
ISBN 81·85340·17 - X

--------------------------------------------------------------Contents
2
3
4
Coastal Aquaculture and the Environment Hassanai Kongkeo
Environmental Issues in Indian Freshwater Aquaculture S. Ayyappan and 1.K. l elia
Packages of Practices for Sustainable, Ecofriendly Mariculture (Land-based Saline Aquaculture and Seafarming)
M. De va raj, V.K. Pillai. K.K. Appukuttan. C. Suseelan. V.S.R. Murthy. P. Kaladharan. G. Sudhakara Rao. N.G.K. Pillai. N. N. Pillai. K. Balan. V. ClulIldrika. K.c. George and K.S. Sobhana
Application of Genetics to Aquaculture: Challenges. Strategies and Principles
Mel)'/ 1. Williams
L
1'1

Preface
This special publication of the Asian Fisheries Society, Indian Branch (AFSIB) is a
result of an international symposium "Environment - Aquaculture Interaction" held
on 27 November, 1996 during the course of the Fourth Indian Fisheries Forum
organized by the AFSIB from 24 to 28 November, 1996 in Kochi, Kerala Statc,
India. This symposium served as a forum for updating and interacting for ali those
involved in research, monitoring, legislative development and the regulatory aspects
of aquaculturc activity and environmental quality. Five invited papers were presented,
of which four have been edited and published in this volume.
In recent years, the Asian region has been witnessing significant developments in
aquaculture which has assumed the status of an industry. Such developments have
also attracted growing concerns on the environmental, economic and social impacts
of aquaculture and these issues have generated interest among a wide section of the
society. Concerns ancl actions of both aquaculturists and environmentalists have
become debatable issues. A great deal of information and misinfol111ation are presently
available on the benefits and costs of aquaculture development vis-a-vis environmental
quality. In this scene, an unemotional analysis examining the issues from ali angles
is the need of the hour and the present volume hopefully meets this requirement.
There are four contributions presented in this volutne. Hassanai Kongkeo examines
the environmental concerns related to shrimp farming. finfish culture and mollusc
culture in his presentation "Coastal Aquaculture and the Environment". He overviews
tht:'impacts.on mangroves and suggests appropriate measures needed for safe culture
practices, improved environment quality and reduced coastal pollution. The author
clarities that 'intensive shrimp culture system may be the only solution to prevent
mangroves from being destroyed through extensive farming'. Environmental
management measures in NACA (Network of Aquaculture Centres in Asia-Pacific)
countries are also reviewed in this paper.
Environmental issues in Indian freshwater aquaculture have been examined by S.
Ayyappan and J.K. Jena. Topics ranging from bio-diversityto marketing and hygiene
are covered in this paper. Envil'onmental quality in the context of supplementary
feeding practices, integrated fish farming and water budgeting has been examined i.n
the Indian situation. Depuration of fish cultured in waste waters and the public safety
aspects have been highlighted in this paper. M. Devaraj and co-authors describe various
packages of practices for sustainable and eco-friendly land-based saline aquaculture

and seafalllling. Guidelines for safe and environmcnt fricndly farming of marine
organisms ranging from shrimp to mussels, oysters, clams, pear,b . crabs, seaweeds
and fInfish are presented along with details of farming techniques, husbandry, health
management and economics. Application of genetics to aquaculture in the light of
recent developments resulting from the pioneering work carried out at ICLARM has
been discussed by Meryl J. Williams in her presentation. Recent research results
have opened up wider possibilities in the application of' genetic engineering in
aquaculture and the author has painted a broad picture of the scenario in her
presentation. ICLARM's pioneering work on genetic application in aquaculture carried
out in various countries has been highlighted. An insight into the GIFT project and
GIFT technology has becn provided .
The four papers presented in this volume portray four distinctly different phases or
recent aquaculture developments in the Asian region. Lessons from the experiences
or active researchers will certainly provide the required insights presently needed to
understand and practise safe, sustainable, eco-friendly and responsible aquaculture.
The present efforts through this volume are a small step towar(.Is achieving this goal
in the Asian region so that aquaculture regains its respectable status it rightly deserves
in the food security of the Asian region.
M. Mohon joseph.
~. . '....-,1 ;- r:: ,,,0 Institut.
?1 J (India)

1 i
Coastal Aquaculture and the Environment
HASSANAI KONGKEO
Network of Aquaculture Cell/res ill Asia· Pacific Department of Fisheries Compound Kasetsart University Campus
Ladyao, jatujak, Bangkok 10900, Thailand
If! ' I '
B ~ It I I
~chiD. 682 014.
r l'"fT
d n;h lnatitut• .1\ j
o L~ill)
I. Introduction •... i .. ... ............... • • .. • ...... .. ........ ,,· . . ... ........... •• • •• .... • ............... . ...... .. . ..... ..... ... v ... .... : . I
2. Environmental Concerns Related to Coastal Shrimp Culture .... .. .................. ....... ....... ......... 2
3. Environmental Issues Associated with Finfish Culture .... ........ ............. ........................ .. .... .
4 . Environmental Issues Associated with Mollusc Culture .......................... ...... .. ... ....... .......... 3 5. Mangrove ....... .. ..... .. ... ....... .............. ......... ...... .... ............................ ........... ..... ....... ......... : ..... ,4
6. Shrimp Farm Effluent ... ..... ... .................... ...................... .................... ................................... 5,
7. Developed Culture Practices for Improving Environment ..... ....... .. .......... ... ;0 ...................... 6
8. Government Policies towards Reducing Pollution from Coastal Waters .................. ...... ..... 9
9. Environmental Management of Coastal Aquaculture in other NACA Countries ............... II
References
1. Introduction
Aquaculture production" has been increasing worldwide while culture practices have undergone considerable intensi fication and diversification. Although there have been substantial socio
economic benetits including increased nutrition level, income, employment and foreign exchange,
aquaculture also utilizes resources and causes
environmental changes. In fact, the majority of aquaculture practices , particularly inland
aquaculture, have had little effect on the
ecosystems. Some cases of environmental degradation in coastal areas have occurred due to, for example, intensive cage culture operations in
AQUACULTURE AND THE ENVIRONMENT
ISBN 81-85340-17-X
Europe and shrimp farming practices in southeast
Asia and Latin America . In some cases , environmental problems have resulted from conversion of wetland habitats, nutrient and organic waste discharges, introduction of exotic species,
chemical usages as well as from deterioration of water quality and decreasing availability of suitable
sites for aquaculture (Barg, 1992).
Coastal aquaculture is dominated by shrimp culturej
while smaller quantities of molluscs, fish and seaweeds are also produced through aquaculture.
In recent years, intensive shrimp culture has been beset by environment-related disease and water
quality problems, which have caused significant
Copy right © 1999 Asian Fisheries Society, Indian Branch
All rights of reproduction in any form reserved

economic losses to farmers and resulted in large
scale abandonment of ponds. The environment
related disease problems that hit the industry in
late 1990's were widely thought to be a result of
(I) a general deterioration in the quality of coastal
water used for culture shrimp due to increasing
pollutant loads from agriculture, industry and
domestic sources; (2) self pollution by shrimp
farmers through bad management practices; and
(3) shrimp t~lrms abstracting water already polluted
by other shrimp farms (This problem is caused by
high densities of farms which result in localized
deterioration in water quality and easy transfer of
pathogens). The case study of coastal aquaculture
and environment was carried out in Thailand
because aquaculture, particularly shrimp farming
has been developed in very intensive ways so that
it will very harmful to coastal environment. The
solutions for environmental problems are also
useful to the other countries in region which are
going to intensify the shrimp culture system.
Coastal aquaculture in Thailand produces shrimp
(Penaeus mOlldon, P. merg!liellsis), oyster
(Crassostrea [1I~ubris, C. be/cheri), mussel (Perna
viridis, Madia/a senhau.I'enii), cockles (Anadam
gmllosa), crabs (Scylla serrata) and finfish (Lates
calcari/er, Epiflephelus spp). In 1995, the yield of
coastal aquaculture was 352,000 tonnes worth
US$ 2,158 million to the Thai economy. Of the
total production, 79.5% (280,000 tonnes) was
from shrimp culture 19.4% (68,000 tonnes) was
from shelfish and 1. 1 % (3,700 tonnes) was from
finfish culture. The main spur for the development
of coastal aquaculture in Thailand has been the
high economic returns from the organisms
cultured, which are mainly used for export.
Development has been made possible hy
improvement in seed production techniques,
culture technologies and infrastructure and
Government incentives.
2. Environmental Concerns Related to Coastal Shrimp Culture
There are a number of environmental issues linked
to the development of intensive shrimp culture in
southeast Asia. Thepotential impactsofintensive
shrimp cultureon the environment are summarised
in (Table 2) and are mainly linked to land . water
and biological resources (FAO/NACA , 1995).
In Thailand. the most seriolls impacts are those
associated with water resources. water pollution
from pond effluent and siltation. Salinization or freshwater resources has now become less
problematic as most shrimp farmers have reduced
pond leakage by construction of separate drainage
system, erection of strong dikes and preparation
of well compacted pond bottom.
In addition. the shrimp culture indus try is
vulnerable to impacts from tlood and storm. which
cause physical damage to farms resulting in
serious economic loss. In 1995, a numheroffarms
in Thailand were seriously affected by tlooc\s.
Other physical impacts are from sedimentation.
siltation and erosion of coastal areas, which can
lead to silting of supply canals and ponds . The
Table) : Production of shrimp in Thailand in 1994 (DOF.1995)
Ccntral I!:{ t South-west South-Cllst Total
Extensive (tonnes) 2.263 421 159 1.745 4.588
Semi-intensive (tonnes) 1.379 0 0 2.194 3.5D
Intensive (tonnes) 10,793 106.D8 43,2t7 94533 255.281
Total (tonnes) 14,435 107.159 43,376 98,472 263,442
Area (ha) 24.196 20.727 5.267 22,031 72.221
Tonnes/hnlyr 0.60 5.19 8.25 4.44 ;1.h~
Value (US$ million) 103.6 769.0 31 t.2 706.6 1.1l90.4
No. of farms 4.066 5,509 2.946 9.145 21.666
2

Table 2: Environmental issues associated with intensive shrimp culturc
Resource
Land resources (construction)
Water resources
Biological r~l'Dlm: ~
Impact
Alteration of sedimentation and siltation patterns
Alternation of estuarine habitats and circulation pallerns
Conflicts with other users through removal of mangrove and loss of access
Salinisation of freshwater resources and agricultural land
Water pollution from pond eftlucnt Self pollution problems
Chemical and drug use
Removal of coastal mangrove forests for shrimp culture
Shrimp seed resourccs
deterioration of coastal water quality is another
constraint to coastal shrimp culture, which has
been adversely affected by red tides resulting
from eutrophication of coastal waters in some
arcas. Hi~h levels of organic pollution in water
supplies from industrial, agricultural and domestic
sourccs, leads to microbial contamination., thus
increasing the chances of disease outbreak. Heavy
metal and pesticide contamination of water has
also been responsible for shrimp losses in some
Asian countries.
3. Environmental Issues Associated with Finfish Culture
The most important environmental concerns
associated with intensive marine finfish culture
are related to water quality (Table 3). Intensive
cage culture can have an adverse impact on water
quality through the release of solid and soluble
wastes (mainly uneaten feed and fish excreta).
Soluble wastes are made up of matrials leached
from the sol id wastes as they fall through the water
(such as nutrients and other organic matter) and
fish metabolites (such as ammonia and urea).
Solid wastes are made up primarily of uneaten
feed and fish faeces which have relatively high
< Consequence
May lead to the blocking of canals and farm water supplies.
May lead to changes in habitats. salinity patterns and benthic populations_
IVlay result in loss of l ivelihood for coastal communities through loss of resource or access to traditional fishing or gathering grounds
Leads to social contlicts and restrictions or alternate uses of water and land resources
ContJibutes to eu.trophication of coastal waters Wherc many farms discharge into water supply canals a deterioration in water quality may OCCUl' and pathogens can transfel' hetween farms more easily
Discharge to the environment \Vith largely unknown environmental consequences
Coastal erosion. saltwater intrusion. water quality deterioration and loss of biodiversity
Decline in shrimp stocks
organic contents and rich nutrients. If there is
inadequate tlushing ordilution of the cage wastes,
these may accumulate beneath or around the cages
leading to depleted dissol ved oxygen and elevated
nutrient levels which are toxic or stressful to
aquatic life (e.g. unionized ammonia and nitrite).
In addition, intensive cage culture systems arc
very vulnerable to impacts from the environment
particularly adverse weather conditions (such as
Iloods or storms) and siltation caused by land
erosion, deforestation, domestic and industrial
waste discharges and land reclamation. Good
water quality is essscntial for successful cage
culture whi Ie fish farms are vulnerable topoor
quality water polluted with domestic or industrial
wastes and oil. Harmful algal blooms or red tide
have also caused significant economic losses to
cage farms in Asia.
4. Environmental Issues Associated with Mollusc Culture
Compared with intensive finfish culture.
environmental concerns associated with mollusc
culture are low and normally occur where culture
sites cover large area, have very high stocking

Table 3 : Potential environmental impacts or intentivc marine cage culture (FAOINACA. 1995)
Resources
Water
Biological
Impact
Obstruction of navigation and contl icts over access to fishing grounds
Discharge of uneaten feed , lish faeces and escrcta
Chemical and drug usc
Usc of wild juvenile fish
densities or arc not propcrly managed. Mollusc culturc can result in a positive aneluscful impact on the environment by assimilating particulate organic matter anel reducung coastal eutrophication. Mollusc cuilure is, however, particularly sensitive to environmental pollution, particularly siilation "mel sedimentation, coastal eutrophication (which can result in decreased spat-fall from natural populations), harmful algal blooms (which can either be directly toxic to mollusc or make them unsuitable forconsumption) and organic or industrial contamination (which can make the product unsuitable for human consumption).
5. Mangrove
Generally, the reduction in mangrove areas is mainly causcd by mining, salt ponds, aquaculture and other agriculture activities , reclamation of sites for industries, urbanization, harbours and road construction which blocks tidal feed to mangrove. There were 312,732 ha of mangrove in 1975 (ten years before intcnsiveshrimp farming tookoffas an industry in Thailand) whichclwindleel
COnSC(lUCnCC
Social contlicts
HypCI'IlUlrilic(l ti on Icading to local ised dissolved oxygcn depletion
Localised accuillulations or solid waste,
Released to the environment with unKnown consequenccs
I)cdine in wild stocks leading to reduced natural productivity and loss of biodiversity
to 168,682 ha by 1993. During this I X-ycar period, about 65,000 ha or one-fi fIh of the 1975 cover was used lor aquaculture. Less than 60% or this aquaCUlture arca in mangrove zone was establ isheci in previously cleared or ull-prociucti vc
mangrove tracts while only 27,412 ha or R. 7% or the 1975 hectaragc was cleared specifically for aquacuILUre(AquacultureAsia, 1996). In addition, most of these areas are utilizeci for extensive and semi-intensive culture which produce only 3iY" of total cultured shrimp in the eountry. Therefore intensi ve shrimp culture shoulcinot be blamed for the destruction of mangrove.
Intensive shrimp culture operations havc been utilizing land away from the unsuitable low lyi ng mangrove areas. It is better practised in the nonacid and non-peaty soi I of rice paddies. Coupled with leehnologies such as formulated feeel. waleI' quality managem en t, efficient water pumps, disease control anel hatchery protocols, shrimp culture has become more efficient, producing morc shrimp from less culture area. Though the land costs for supra-tidal areas of rice fields are higher, (he costs of construction are much lower
Table 4 : Environmental impacts of mollusc culture (FAO/NACA, 1995)
Land
Water
Biological
Impact
Large areas may interfere with direction and velocity of tidal current
May interfere with oavigation
Accumulation of solid waste hcncath cu lture sites
Uptake of prilllary and secondnry prociuction
Collec tion of wild seed
4
Conscqucnce
Changes in sedimentation patterns
Localised deterioration in environmental quality
Can have positive impact on coastal eutrophication
Impacts on wild stocks unknown

because heavy machines can be used effeciently.
These legal supra-tidal lands can be used easily as
collateral for bank loans for inititial investment
and operation. When shrimp are cultured in
mangrove areas where water and soil contain high
organic loads, disease problems always occur.
Ponds developed in supra-tidal areas can be
properly treated by completely drying out, without
interference from seepage from supply canals, or
by efficient removal of the fouled boltom layer by
heavy machi nes. In order to prevent contl icts with
rice farmers, the ponds must be designed to have
proper drainage system without interfering with
freshwater canals and the pond embankments
should be well compacted to prevent seepage of
saline water into rice paddies.
Famlers gradually have come to realize that
intensive shrimp culture systems are sustainable
whilc mangroves are not. While shrimp farming
was admittedly a factor in destroying mangroves,
the distinction must be made that this destruction
was carried out in the name of unsophisti"cated
extensive cuhure system. If extensive shrimp
culture, whidr has low efficiem.cy and is
unsustainable, has to be expanded' by milJillgi1'lg irn
more areas in vhe developing countries under
culture, then the world's mangroves are seriously
endangered. Therefore, the intensive shrimp
culture system may be the only solution to prevent
mangroves from being destroyed through extensive
farming. In Thailand's case, 85% of the shrimp
farms practise intensive culture system, utilizing
relatively little land with great efi"iciency. This
efficiency has benefited the mangrove ecosystem
of Thailand in eliminating the need for mangrove
clearing for shrimp fanning. Intensive shrimp
culture technology needs to.be promoted through
education and by discouraging newcomer shrimp
.farmers from utilizing the mangroves. Such
technology should be disseminated globally for
the purpose of conserving the remaining mangrove
ecosystems around the world (Menasveta, 1996).
6. Shrimp Farm Effluent
The principal components of effluent from 5
intensive shrimp culture include nutrients, shrimp
faeces, dead plankton}.small quantities of chemical
and therapeutants as well as sill. Pond and
effluent water quality tends to deteriorate through
the grow-out period, as feeding ratcs increase with
shrimp size and biomass. High quantities of poor
quality effluents (in terms of nutrient loadings,
total ammonia and unionised ammonia) are found
during harvesting time. when shrimp biomass is at
its maximum and pond water completely drained.
On an average, water discharged during harvest
contributes to 60% of the total volume of waler
discharged from shrimp culture and 70-80% of
the total shrimp effluent loadings. In addition, a
large quantity of accumulated sediment remains
at the pond bottom after the pond is harvested and
water drained out. Removing the sediment is
regarded as essential by most shrimp farmers
because allowing sediments to accumulate will
adversely affect the water quality, benthic fauna,
shrimp health and survival of shrimp in the next
crop. In general, there are many ways of
removing this sediment; e.g. by drying the pond
andmechani'calremoval; by sucking in to reserved
areas· and by heavy flushing.
Although the farm efiluents during culture contain
elevated levels of BOD, nutrients and suspended
solids compared with normal sea water, once
discharged to the aquatic environment where they
receive some dilution, it is unlikely that significant
environmental impacts could occur if good dilution
or flushing is available and the area is not
overcrowded with too many farms. In addition,
most shrimp farms discharge water very rarely
during the culture period. So the quantities o/"
eftluent released arc not large. Effluents released
during harvest, however, is of much poorer qual ity
and the impact of the harvest effluent will depend
on the sensitivity of the receiving environment
and the dilution which may be possible.· In
practice, farmers in each area avoid harvesting
their shrimp at the same time so that the shrimp
prices do not drop due to over- supply. Therefore
it is improbable that the waste from harvest will

Table 5 : Shrimp farm eftluent during operation compared with other types of wastewater
Parameter Shrimp farm Harvest Domestic wastewatel' Fish prnccssin~ (mg/I) effluent emuent Untreated Primary Biological plant
BOD 4.0-10.2
Total nitrogen 0.03-1.24 5.25-14.8
Total phosphorus 0.001-2.()2 0.08-0.8
Suspended solids 119-225 60-243
exceed the carrying limit of the coastal environment.
Table 5 compares effluent qual ity from operational shrimp farms with other types of wastewater (NEB, 1994), An analysis shows that in terms ofquality, shrimp farm effluent is far less polluting both during operation and during harvest, than domestic wastewater that has undergone secondary treatment. From various observations, nutrient loads and dense phytoplankton in farm effluent also enhance the growth of aquatic species such as green mussels, oysters, cockles, horse shoe mussels and seaweed around the shrimp farming area providing ample evidence that suchloadlngs do not exceed the(ca'l1ry,ing"'capacityof water sources.
There are, howcver, many shrimp farms discharging to the coastal environment and it is useful to compare the total loadings with those from other sources to put the contribution of shrimp farm wastes in proper perspective, Table 6 compares the overall loadings from shrimp
300 200 10 IO.OO()-18 .0()O
75 6() 4() 700-4.530
20 15 12 130·.:lCJ8
500 r5 1 .8~0-7 ,47 5
culture in each region of Thailand with those from the major river systems (DPC, 1996). The results of this analysis show that shrimp farms are not a major contributor to overall nutrient loads in the Upper Gull' of Thailand, both in terms of volume discharged and quantity of nutrient. Analysis for the southern coast which still use the high water exchange system, suggests that shrimp farms arc more significant contributors to overall .loads , However, farm wastes in these areas are di I,utcd quickly due to the good circulation or flushing out to the deep sea, Considering the the total loadings in the country, shrimp farm effluent is still not a major cause of pollution to coastal environment.
7. Developed Culture Practices for Improving Environment
[llil ordenosdlveenvironmental problems and to keep sht'ilT\p 'farming sustainable, Thai farmers have successfully developed theirculture practices as follows:
Table 6: Loadings from the major river systems compared with shrimp effluent loading
Major river areas Annual discharge Total Nitrogen BOI.) Total Phosphate Nitrate
(million mJ/yr) (tonlyr) (tonlyr) (ton/yr) (tonlyr)
Upper Gulf
River discharge 57550 64,736 115.704 14.777 1:l.H65 Shrimp culture 64 345 350 19 2
Eastern coast
River discharge 4.971 NA 17,829 575 1.544 Shrimp culture 742 3,137 4,155 1,(}4 196 .
Southern coast River discharge 1 :1.1~() 8,831 15.297 2 .623 15.297 Shrimp culture 1.109 10.083 8.537 57(} NA
Total
River discharge 17.7~ 1 73,567 148,830 17,975 30.706 Shrimp culture 1,91':; 13.565 13 .042 7~9 198
6

Fig. 2. Pond dykes must be strong and well packed in order to prevent leakage
Fig. 1. Circular ponds ensure proper water cJl'cul <Ilion
Fig. 3. Proper pond preparation ensures elimination of toxic gases such as ammonia, hydrogen sulphide and methane in the pond bottom

Ig,. , Bottom deposits and soil removed from the ponds could be dr.ied and treated in a trealmcllt area
Fig. 4. After every crop, the fouled layer of pond bottom should be scraped off by bulldozer
Fig. 6. Circula:rwarer movemen in ponds i ··faciLitated by heavy aeration which brings the solid waste to the centre of the pond

{i) Itlillll."iflClIlit}ll: Semi· irllcn ive technology.
which is easily adapted to local conditions, is the
most appropriate system at the initial period of
shrimp culture development. After farmers have
galnet! expel'i nee in shrimp fanning and the related industries have been developed, this culture
system should be intensified in order to increase
country production without expansion of
production areas. In some countries, semi-intensive
culture, which generates less feed waste than .
intensive systems, still causes self-pollution. This
is mainly caused by the inability of the farmers to
carry out pond treatment / preparation before
stocking, due to the lower level of the pond boltom
in a tidal arca, and the poor water circulation
without efficient aeration in large ponds It is also
impossible to remove the fouled substrate in a
large pond with heavy machine as is done in the
caseof more efficient intensive ponds. After the
ponds have been used for 6-8 years, the production
of this system invariably goes down significantly
and improvements arc difficult.
(ii) Suitable pond desiglt alld cOllstruction: In
order to facilitate the optimal water circulation in
a pond, the shape of the pond should be square or
round (Fig. I). The optimal pond size is about 0.5 ha. The pond bottom level should be high enough
to facilitate complete draining and drying between
crops. Pond dikes must be strong and well packed
in orderto prevent leakage (Fig. 2). Import of clay
or laterite from nearby area should be considered
ifthesite is sandy or has acid sulfatesoil. Generally,
water storage ponds are necessary for good water
circulation.
(iii) Proper pond preparation: Pond preparation
is the most important operation in shrimp fanning.
Proper preparation ensures elimination of toxic
gases such as ammonia, hydrogen sulfide and
methane in the pond bottom which would have
accumulated during the previous crop (Fig . 3). If possible, after every crop, the fouled layerofpond
bottom should be scraped off by bulldozer and
dried on pond dikes or removed by excavator to
dry in the reserved area near the grow-out pond 7
(Fig. 4). If the use of heavy machine is not
practical in the rainy se~$on, this fouled substratc
can be partly sucked up by specially dcsigned
machines and transferred into the treatment pond
for further drying and treatment (Fig. 5). Aftcr
drying for about one month to eliminate thc left
over toxic gases, lime should be applied before
stocking. With this type of waste removal, water
cxchangecould be reduced totheminimum thereby
reducing the organic loacl dischargecl to. the
environment.
(iv) Proper water management: In order to
maintain good water quality during low water
exchange, circular water movement in ponds is
facilitated by heavy aeration which brings the
solid waste to the centre of the pond (Fig. 6).
Shrimp tend to avoid living or feeding in areas of
the ponds where high levels of waste have
accumulated. Plankton blooms must bemonitored
and controlled carefully through regular recordi ng
of water colour, pH, alkalinity and transparency.
It is now believed that the introduction of new
water into the pond causes high mortality due [0
sudden change in water quality (physical,chemical
and biological). Low water exchange also lessens
introduction of viruses, other pathogens , disea~e carriers, ammonia and other toxic particles which
are released by nearby farms, through the incoming
water. If high water exchange system is still
maintained, organic load in brackishwater sources
will settle in the growout pond thus increasing the
level of pond bottom and rapidity of panel
deterioration. Even when the qual ity of ex isting
pond water is poor owing to low water exchange,
shrimp can gradually get adapted to this condition.
Therefore, 1110st of the intensi ve farmers in
Thailand now prefer to reduce their water intake
from external sources as much as possible, thus
reducing waste discharged to environment. In
order to keep the system closed from external
pathogens and disease carriers, incoming water to
growout pond should pass through a chlorination
process in the reservoir.

(v) Closed culture systems: If ponds are located
in unavoidable pollutcd arcas or areas of high
incidence of diseases, particularly along rivers
and canals, farmers develop a closcd culture
system which does not require water exchange
from external watcrsources for thc cntire duration
of the growing pcriod. This systcm must have
rcservoirs or watcr treatment ponds which
generally occupy 20-30% of grow-out pond size,
attached to the grow-out ponds. Clean water during
the highest tide day is introduced only once (at the
start of culture cyclc) into the grow-out ponds and
the reservoir. 10 ppm Benzalkonium chloride or
hypochlorite is applied by spreading all over water
area. Heavy aeration is also continuously applied
for a few days in order to q uickl y el imi nate chlori ne
gas and residue. Both ponds are later fertilized
because water has became c lear after ch lori nation.
In order to keep water treatment system efficient,
stocking density in this closed system should be
limited at 30/m2 or at 6 ton/ha of production level.
There is no water cxchange within thc process in
the tirst month. In the second month, all water
from the reservoir is added to fill the grow-out
ponds while waste (bottom) water from the grow
out pond is pumped back at the rate of 30% every
10 days, through water supply/drainage canal, to
this reservoir, which now scrvcs as asedimentation
or scttling pond. 30% water is exchanged on
every 7th and 4th days during the 3rd and 4th
months respectively. However the exchangc
regime also depends on the dissolved ammonia
concentration in the grow-out pond which should
not exceed D.I ppm. Organic loads and silt will
settle in this sedimentation pond within 2-4 days
before its surface watcr overflows to the second
treatment pond (20-30% of grow-out pond area)
for biological filtration. Living organisms such as
phytoplankton and zooplankton are consumed by
introduced tish and bivalves, e.g. tilapia, mullets,
milkfish, green mussels, oyster, anemia, etc., in
order to prevent overblooming of phytoplankton.
Stocking densities of these plankton feeders depend
on phytoplankton level in this pond. Green
mussels are able to reduce 67% and 77% of
8
amonia-nitrogcn and BOD levels rcspectively
within 2+ hours. The clear surface water is then
allowcd to overllow into the supply canal where
heavy aeration is applied in order to eliminatc
toxic gascs. This recycled water is then pumped
back into grow-out ponel. Up to harvesting time.
ponel salinity, which gradually increases through
evaporation, does not exceed 40 ppt hecause thc
initial salinity would be about \ 0-\5 ppl. In an
emergency, when new water is required rordilution
of pond water, if the pond salinity rises above 40
ppt, the incoming water must be chlorinated
separately in a sparc pond. In case many grow-out
ponds use the same water treatment ponds.
wastewater from an infected pond must not be
pumped to thiscom1l1on facility. All waterreleasecl
to rivers/canals must always be treated and
disinfected by 300 kg/ha chlorine. In some cases
the water may be used for two production cycles
before being replaced.
(vi) Freslnvatercltltllre systems: In these systcms.
shrimp are cultured at very low salinities (0-5 ppt)
in essentially freshwater ponds which do not
cxchange water. Most of P. l1loflodon freshwater
farms are developed from catfish and
Macrobrachiul1l ponds. Concentrated saline water
(100-150 ppt) is bought from salt farms and added
to the chlorinated freshwater ponel to achieve a
salinity of around 5 ppt with 0 .35 m dcpth at the
initial period. Within the first month after stock i ng,
pond is gradually filled up with freshwater which
makes salinity reduced over the culture period to
around 0 ppt at harvest time. In freshwater systcm,
shrimp will bc usually harvested within 3 months
at averaged 20 g si ze otherwise mortal ity Illay occur. This will significantly reduce the pond
deterioration because feed consumption is far less
from4-month culture. During harvest, pond water
which is not harmful to surrounding environmcnt.
is then released to natural water bodies. Only pond
bottom soil has become salty which will be
convenient for farmer to introduce less saline
water to the pond in order to keep salinity level at
5 ppt in the next crop. Fouled pond bottom is

mechan icall y removed to reserved arca once every
two years as the deterioration is much less than
that in brackish water culture.
8. Government Policies towards Reducing Pollution from Coastal Aquaculture
The policies ai m to efficiently util ise coastal areas
for shrimp culture taking into consideration the
local economic and social development,
conservation , impacts on the coastal environment
and conserving fresh and seawater resources.
Systematic management of effluent from culture
areas is also a priority . The government activities
carried out to improve the environmental
performance of shrimp farms are as fol.'ows:
(i) Dredging ditchs and canals to increase the supply of water : Sedimentation in water supply
canals (partly as a resu It of solid waste discharges
from shrimp farms) has led to restricted water
tlows in supply canals. A lot of budget has been
allocated to dig out shallow canals throughout the
country since 1992.
(ii) Reducing costs of production: The Department
of Fisheries carries out research on farm
management techniques to establish optimal
cultivation procedures which minimi se
environmental impacts. Research areas include
management practices, feeding , waste water
treatment, production of fertiliser ti'om bottom
sludge, environmental monitoring, training and
technology transfer.
(iii) Improved cuLture techniques : Model
demonstration farms were constructed to promote
good shrimp cu lture practices among farmers in
various regions.
(iv) Designatioll of shrimp culture ZOlles: This
measure aims at ensuring development of shrimp
culture in appropriate areas.
(v) Qualityco1ltrolofshrimp larvae: Tomaintain
the quality of shrimp larvae, the Department of
Fisheries provides certification for hatcheries
producing good quality larvae. In 1989, there was
9
a ministerial regulation which required all
hatcheries to register / and apply for permit to operate.
(vi) Registratioll of shrimp farmers: Under the
Fisheries Act, all shrimp farmers are required to
register their farms. The farmers who owned over
8 ha, have to obtain the annual operating
licenses. Farmers who are not registered have no
right to assistance from the government for
monitoring water quality, antibiotic residuc,
disease diagnostics, export certification for TED
issue and product quality certification .
Unregistered farmers also cannot claim
compensation for damage caused by floods or other natural hazards.
(vi i) Seawater irrigation: Seawater irrigation
systems were recommended as a potential answer
to self-pollution problems threatening the industry
and to provide better water circulation to the
supra-tidal areas behind the mangroves. Self
pollution occurs when farms discharge water into
canals used for water supplies by other shrimp
fanns. Seawater irrigation system aims to solve
this problem by designing farm layout so that intake and drainage canals are kept separate. These
projects therefore involve areas of land to be
designated as shrimp culture zones,' the
construction of intake and discharge canals and
the construction of intake and discharge water
treatment systems. Problems such as rcdesigning·
existing shrimp farms and removing other users
from zones make the practical implementation of
irrigation systems on private land difficult,
particularly if some farmers have to give up
productive land to create common treatment
facilities. The successful operation of seawater
irrigation systems requires co-operation of all the
fanners involved. The currently proposed
seawater irrigation projects cover the area 01'8,780
ha and some of thein have been constructed.
(viii) Control of feed quality: The Feed Quality
Control Act required all feed manufacturers to
register and set quality standards for pre-mixed
and ready mixed feeds. Thepercentageofprotein,

fat, fibre and moisture should be in accordance
with the trade name, type and size of feed or the
age of aquatic animals for which they are intended.
(ix) Control of chemicals and hazardolls substances: The control of some chemicals and
toxic substances used in aquaculture is now under
the responsiblity of the Department of Fisheries,
instead of the Food and Drug Administration,
Ministry of Public Health.
(x) Co-operating with the private sector to provide services to farmers: The DOF provides
a service to shrimp farmers on the examination of
toxic substances and antibiotic residue in shrimp.
A cabinet resolution in 1993 designated the DOF
iI competent l.1uthOl'ity lo issue ceniJicmeli 0 hygiene fo r ti.shctics exports, particularly FFOz£n shrimp products. In 1994, DOF s tarted the
Development of Raw Materials and Fishery
Products Inspection System Project under which
raw material s and fishery products for export
must be certified by the DOF to ensure that the
products meet the inspection standards offoreign
countries, particularly the European Community,
Japan find USA. The project included the establishment of Raw Material Inspection Centres
in 20 provinces and Fisheries Product Inspection
Centres in 4 provinces. Membership of the
certificaion scheme is voluntary forshrimpfarmcrs
and is independent from farm registnition
procedure. The main incentive for farmers tojoin
this is that certification from the DOF enables the
farmers obtain a higher prices for their shrimp.
When a shrimp farmer joins the certification
programme, the DOF inspect the farm and grade
it in to Grade A, B orC based on the facilities and
management practices used. The DOF can then
recommend to the processors the names of the
farms which are able to consistently produce
shrimp of required standard.
(xi) Monitoring of environmental impact: The
DOF regularly investigates water quality, soil
quality and other environmental parameters as
we)) as shrimp quality as part of its plans to
improve larval quality and standard of shrimp
farming.
(xii) Designation of effluent standards: Waste
waters from shrimp farms are regulated under a
regulation of the Fisheries Act. All shrimp
farmers need farm registration and the farmers
whose culture operations are more than 8 ha also
require licensing. Licensed shrimp fanners have
to comply with the following regulations:
Table 7 : Environmental management of coastal aquaculture in NACA countries
Registration f.1A Specific fiJ'Il u nl Monitoring
EfIlnent of farms aquaculture standards treatment
legislation reqnirement
Bangladesh No No No No No No
Cambodia No No 0 Ntl No No
China Yes Nil No 0 No No
Hong Kong Yes Yes No Yes No Yes
India (some states) Yes Yes Yes Yes No No Iran Yes No No No No No
Indonesia No Ye.~ No No
Korea Ye~ No Yes Yes Yes Yes Malaysia Yes Yes Yes No No No
Myanmar Yes No Yes No No No
Philippines YC$ Yes No Yes Yes No
Sri Lanka Ye~ Yes No Yes Ye: Yes
Thailand Yes No No Yes Yes Yes
Vietnam Nc.1 No No No No No'
III

Table 8 : Effluent standards for coastal waters in NACA countries
Paramcter Hong Kong India (somc states)
BOD (Illgll) 10-40 20-50
COD (rng/l) 50-85 75-100
IIH 6,0-10,0 6,0-8.5
Suspended solids (lIlg!l) 25-40 100
Telllperature (OC) 4( ·50 Total nitrogen (lllg!1 as N) 10-50 2.0
Total phosphorus (l11gl1 as P) .s Phosphate (mgtl) 0,2-0.4
Total anllllonida (l11gl1 as N) O_~-L()
Dissolved oxygen (Illg/l) >3
Coliforrn (MPNIIOOI11I) 1.00
• Farm effluent water must havc a BOD, Icss than 10 mg/I
• Pond sluclgcanclmud should not bc discharged to natural watcr sourccs or public arcas
• Salt watcr should not hc dischargcd into public frcshwater
• Farms with pond areas greatcr than 8 ha should have effluent treatment ponds of not less than 10% of pond area.
• New eftluent standard has been recommendcd for law enforccmcnt (DPC, 1996) as follows:
Salinity - 1.5 ppt in freshwatcr - maximum 10% change
in coastal watcr pH - 6.5-9.0 in freshwater
7.0-8.7 in coastal watcr greater than 4.0 mg/I 10mg/1
Dissolved oxygcn -BOD, Suspcnded solids Total ammonia
Nitrite
Nitratc
100 mg/I - 0.7 mg/l in freshwater - 1.5 mg/I in coastal
watcr - 0.02-0.2 mg/l as N in
freshwatcr - 0.2 mg/l as N in coastal
watcr - 20 mg/l as N in
freshwater - not neccssary in coastal
watcr
Philippines
6,5-8,6
30% increase
3° max, ri se
<70 7(
Thailand
Transparency - 60 cm
Sri Lanka
SO 2:'i()
6.0-8,S
100
35 2,0 '
l,n
Total nitrogen - not necessary In freshwatcr
- 4.0 mg/I in coastal water Total phosphorus - not necessary in
freshwater - 0.4 mg/I in coastal watcr
9. Environmental Management of Coastal Aquaculture in other NACA Countries
In order to establish how other Asian countries approach environmental management of coastal aquaculture, a questionnairc was sent out to 13 countries in thc NACA network. The results arc summarized in Tables 7 and 8.
References
Barg, V.c., 1992. Guidelincs for the promotion of environmental managcmcnt of coastal aquaculturc development. FAD Fisheries
Technical Paper, No. 328, FAO, Romc.
DOF, 1995. Statistics of shrimp culture in 1994. Department of Fisheries, Ministry of Agrieulturc and Co-opcratives, Bangkok, Thailand.
DPC, 1996. A survcy of watcr pollution sourccs from coastal aquaculturc. Final report submittcd to thc Department of Pollulion Control. by. Network of Aquaculturc Ccntres in Asia-Pacific,Bangkok, Thailand.
Novcmber, 1996.

FAO/NACA, 1995. Regional Study and Workshop
on the Environmental Assessment and
Management of AquacultureDeve!opment
(TCPIRASI2253) : NACA environment
and aquaculture development series no. I.
Network of Aquaculture Centres in Asia
Pacific, Bangkok, Thailand.
AquacultureAsia, 1996. The mangroves : finding
a way out of the thicket of complications.
From the editors desk ofAquaculturc Asia
magazine, Vol 1 ,No.2. October-December
1996.
12
Menasveta, P, 1996. Mangrove destruction a
shrimpculturesystcms. Aquatic Resourc
Re each Illsti tUl . Chula 1<)l1gko University, Bangkok, Thailand.
NEB, 1994. The environmental management \
coastal aquaCUlture. An assessmcnt (
shrimp culturc in Southern Thailand. Fin l
report submitted to the Office c
Environmcntal Policy anc! Planning. b
Network of Aquaculture Centres in Asia
Pacific. January, 1994.

2 -Environmental Issues in Indian Freshwater Aquaculture s. AYYAPPAN and J. K. JENA
Centro/Institute oj' Freshwater Aquoclliture
Kallsal\'(lgonga, Bizu/JOlleslVar - 751002, Indio
I. Introduction ., .... ,.""."."""".., ..... ....... " .................. ,. ...... .. " .... ........ , ... ............. " .............. ........ ..... 13
2.. Biodiver ily of Fish Speci.c:s ........ .... .. ........... ........ .. ......... ............ ....................................... I
3. Fish Genetics Research Implications ......... ... ...................... .............................. " ................. . 17
Lnnd-wmcr Imel",lClion, . .... ..... .. .... ....... . ... .................. " ..... ........................ _ . . _ . .. ....... ..... ... ........ . J '7
5. Environmental Pollution ............ " ... .. " ..... " .... ,; ....... " ............. " ..................... " ..... " ............. 18
6. Supplementary Feeding Issues .. .... ........ ... _ .. ....... ____ ..... ....... .... .... ...... ....... ............. , ....... .. ........ 2·1
7. Fish (um1mti llc ... ...... ........ ......... ............... , . .. ... .. ......... .. .. .. .... ... .... ............ .. .... _ ... ... ... ............. . 23
B. TntegnJted ''i.ish .·<tf111ing ... .............. " ..................... ............. " ..... ................. .. ..................... ..... 24
9. Water Budgeting ... .... ..... ... ..... .......... ................ .... ............. .......................... ................... "' ... 2 ;Ci
10. DcpIJr3Licm of Fish ulrui'-ctl i ll Wa~tc WMcrs· ....... ......... _ ................................................... 26
II. Energy Inputs ........................................ .. ..................... _ .......... _ ............ .................... ... ........... 26
12. Fi'ail l;{;trketing and' Hygiene _._ ..................... "." ................... ............. " ....... " .......... ............ 27
13. Environmental Modification and' Recovery ....... .......... ....... .... .... ..... .. ..... ..... . " ................... . 27
14. Epilogue: .. ... .... ....... . ..... " ........... ....... .... ...................... " .. " .......................................... .......... 28 References
1. Introduction
Aquaculture is assuming increasing importance in recent years on a global basis including the Indian subcontinent. With possibilities of obtaining high productivity levels among different farming system, there has been a flux between the farming practices and aquaculture is receiving greater investments both in public and private sector. The contribution of freshwater aquaculture to the total fish production has risen steadily from 17% a
AQUACULTURE AND THE ENVIRONMENT
ISBN 81.85340.17.X
13
decade back to over 30% at present. It is common knowledge that witl-i stagnating trends of marine fisheries as well as inland capture fisheries production levels, freshwater aquaculture is an attractive option for increasing fish production in the country. This substantiated by the growth rates of over 5% over the last few years. The sector, with the necessary R&D back-up for culture of different components of carps, catfishes, prawn
Copy right © 1999 Asian lIishcrics Socicty, Indian Branch
All rights of reproduction in any form l'cscrvcd

and molluscs, entrepreneurial enthusiasm and the
governmental support, is poised to realize the
potential of about 4.5 million metric tonnes in the
corning decade.
As with any developed process, freshwater
aquaculture development too has several environ
mental isslles i r not concerns to be deliberated
upon. They include biodiversity of fishes, land
water interactions, environ menIal pollulion, feed
and ICrliJizer-rciated water management, import
of ex·olic fish and shellfish species and their
quarantine, water budgeting and management,
comparative energy budgeting for different
farm i ng systems, human pathogens associated
with fish cultured in waste waters, fish marketing
and hygiene, etc. It may be mentioned that
freshwater aquaculture being compatible with
other farming systems is largely environment
friendly and in fact provides for recycling,
utilization and even treatment of organic wastes.
Pollution due to eftluents frolll the freshwater
aqualeulture systems is yet to assume any
considerable proportions. However, due attention
is being given to this aspect too in view of
intensification of aquaculture practices in recent
years. The paper discus'Scs ,these issLles in the
context of the significant :&Fowth trends of
freshwater aquaculture in the country .
2. Biodiversity of Fish Species
India has a rich and diverse fish fauna of 2200
species which is about I I % of the global fish
faunal resources (about 20,000 fish species)
occurring in cold and warm waters, both freshwater
and marine. Of the country 's fish species, 24.7% live in warm freshwaters, 3.3% in cold waters,
6 .5% in estuaries and 65 .5% in the sea. Since the
past several years, indiscriminate fishing, habitat
destruction , degradation of water quality through
pollution, construction of dams and barrages across
Ihe rivers and deforestation resulting in siltation
and rise of river beds have been threatening the
fish biodiversity. The populations of some of the
economically important fishes inhabiting the
14
natural waters like carps in the River Gange
catfishes in marshy lands, rnahseers in cold wat,
rivers, streams and reservoirs, migratory hilsa
Hooghly river arc declining over the years, ;
revealed from the production trends of these fishc
It has been reponed that out of 79 threatent
species listed so far, 63 species belong to rreshwat,
(46 from warm water and 17 from cold wale)
Among the listed threatened species (Table I
species I ike Ompokpabda. o. pDbo. Tor ml/ssu/lc,
in warm waleI' and GylJll/.ocypris hiswasi in co
water have become endangered (Mahanta er D ,
1(94).
India is known for its rich and diverse populatic
of gangetic resources of value. Even so, over 3('
exotic varieties have been introduced inlo tI
country so far (Jhingran, 1989). Whi Ie most (
them arc ornamental fishes which remain more (
less confined to the aquaria, some have bee
introduced into the aquaculture systems and ope
waters . Among the species introduced, while
few have proved to be a boon to the aquacultun
the accidental or deliberate introduction of son"
others has caused havoc to theaquatic environmel
as a whole. The tilapia, Oreochrornis mossamhicl
which was introduced into the country durin
1952 made its presence in almost all II'
watdbodies within a few years. The main attractic
Worits ;introduction was its pond breeding ail
omnivorous 'feeding 'habits. However, its earl
maturation, prolific breeding and voracious lCedir
habits not only found to adversely aflCct n· growth of carps in polyculture system, but al>
eliminated were other fishes including Ganget
carps in a number of reservoirs. The effects wei
well rellected in fisheries of many reservoirs (
Tamil Nadu viz. , Vaigai, Krishnagiri, Amaraval
Uppar and Pam bar. Similarly, introduction (
O. lJIosscflnbicLis in laisamancllake of Rajasth,:
not on ly resulted in reduction of average weight (
major carps, but also posed a threat to species li~
mahseers (Tor tor and T plIritora) which are c
the verge of extinction (Bhatnagar, 1(95). I
prolific breeding resulling in inadequate growl

Table I . List of threatened freshwater fishes of
India
Wllrmwatcr Fishes
Endnngercd I. 01lll'okl'alllia 1. (}lIIpok palm
~. Torllllfs,mllulJ
Vulnerable I. Ailia c(lila
1. Anguilla heIlKlI /eJJsi.\'
J. llllJ,:llr"u.'ibUJ,:lIr;lIs
4. £ulropiic:"'''Ys pocJut
.'i. l."beoe/yoclldlll.l ·
7. PlllilillS.\'{//"(/I/{/
R. SClIlip/OflfS .W! lI/i/J/OIIIS
9. Cirrhilllls c:irrlwsll
10. o.'I"lI"Il/Ielllll" II"hili.l·
II. l."be" e/em
12. [ .illu!O dlf.\'sltJllier;
13. OslefJ!Jrall/u he/allger;
Rare I. HOl'ag/llfliu.\' kris/lIlai 2. Schisllfra sUIIf .. 'lIsis
Indeterminate I. Notol}'!''''',\' chita/u 2. PCIII .I.!ClSiIfS l}(lIIMOX;" ,\'
3. TeIllUl/OSll ili.'\/w
4. TllYllllicll,IIy" "(/I.dklllli -
5. 7,,,' kiliu/ree
6. Bali/om hrllC:e;
7. !Jarhlls ""k"i 8. C/llIglll1ills dlll.~lIl/io
9. Cros,wcllei!II.\' lalills
10. Cae/.isia (.'/1<11'1"(1
I I. GIYIJlfJ.'ifemUIIJ I1I(1CfI/((/IfJII
12. Labeo pm/Jri(/ltlS
13. ulhe() J;olliflX
Location
Ganga. 13rnhlllflplltm river system Freshwnters of Assam. West Ucngnl Cauvery. I1hawnni river
rre~hwatcr of Kri sil n<l. Dat:j ccli ng, Assam, Orissa, Madhya Prade~h Throughout Illdia Ganga river and its tributaries Freshwaters of PUlljab. Uuar Pradesh , Bihar, Orissa 00011 valky. Kashmir. I'oonell. Assam Freshwaters of Kashmir. Punjab, Ultar Pradesh, Bihar. Mallipur. Assam. West Uengal. Throughout India except Peninsular India Freshwater of Assnm ilud Darjeciillg Cauvery. Godavari. Krishna l'ivcr system, Narmada & Pench river in Madhya Pradesh Rivers of Ilorth cast Bengal and Assam All alollg Hi malayall foot hill~. Darjeeling,WestBengal Western Ghars lIpto Nonh Canara Manipur (previously found in l3ellgal from where it has di '''ppcared)
Kouayam. Kerala State Throughoutilldia
f-reshwaler rivers. streams of Indin Freshwater of Uttar Pr,ldesh, !lihar, Madhya Prade~h ,D;lIjcd ing, Assam, Orissa and Mndras Indinn oceans. constnl waters, estuaries, rivers l'reshwater or SOllih India. Krishna nnd Godavari river systcm Freshwaler of Uttar Pradesh. Orissa. Kerala PeninslItar Illelia Darjceling, Assam Eastern Himalayn und Assalll 13rahnlaplilraalld Ganga drainages along Ihe Himalaya foot hills Drainages of Ihe Gonga and Urahmaputra in river drain(lge in Orissa and Western ghats, soulh 10 Ihe head waters of Kris.hna river Gallg.a. l3rahnmputra river SystClll, Mahanadi ri ver. /lay of !lengal Sikkim NOrlhern hills of Nepal border, Sindh, Punjab. Orissa, Southern India excepl Malabar and Canam Freshwater of As~nlll, Dnrjeeling. Wesl Bengal.l3ihar, Ullar Pradesh, Oris~a
15
14. klll.\·loCi'mlmllf.\' a/'mllflf.'· -
15. My.\'llI .\' tellMw'o 16. M. a(lr Bfilhmaputm. Mahanadi 17. Nwulus /1(/1ulus
18. 0/.1'/"11 /ogicalfdalr/
19. PSI"/orirrllc/II's 1101J1lI/(}pferll
20. PUfI/ius carml/iclIs
21. PUll/illS cOIlc/uJIlius
22. [((lshnl'lI I'ashorll
23. Se/ipil/lw plw.m 24. Si/fJI.ia ellildre"i
25. Si/(mia si/o//{Iiu
26. Tor /l1O.m/ 27. Xellell/{)(/oll ccmcifa
28. iJellgala elollga
COLDWATER FISHES
Endangered I. GYllllwcypr;.,· hislI'asj
Vulnerable
I . Tor pu/ilo ra
2. P",;(orllYlldIllJ /millom
3. Raioll/o.\" Imla
4. Scitiz.O//lOl'lfX klllll{/(}f1(!II.\·i,\' -
Indeterminate
I. BOli(/ allllor/w(!
2. Lepit/opllygopsis ('1Jl1,\' 3. NOclluu:liei/lIs I'(IIJic;(}la •
4. TOI'/Of
5. NO(!IIICU:llcillis c:Iollgaf".\' -
6. Sch;;o//lOl'ox ric/lllrdwJlli-7. PUll this chillilloiC/cs
8. Schi7.ot/lOl'(/x plct,l!,io.\·/OI/1Wi -
9. S. "/'ORasllls
10. Schh.Of/wraichlitYJ e.,·oL'iIIllJ -
II. Sd.izot/wl"lIid.llly., (OIlMipilllli.'i
12. Schiz.opYJ.:op.\'is slolickekae
Throughout India Through NO.1h India River Gang.a. Yamuna .
Throughout India Un~e of Darjeeling.. Himalaya. Meghalayu and Assam
A~sam. Brahlnaputra drainage Freshwater of Nilgiri. v..'ynuad. Canara hills I3rahmuplltra.llttarPradcsll. Bilwr Freshwatcrsorall the Indi,m Slates. most common ill the valley of Ganges Ganga river system and Orissa Frcshwatcrs of Krishna. (iodavary. Cauvery rivcr system l'reshwalcr of Punjab. Uttru' Pradesh. Bihar Hill streams or Himalnyas East coasl of India Bihar, Uttar Pradesh. \Vest Bengal. As~alll
Chusul. Ladakh
All along the Himalaya. Darjcciing Yamuna river in Delhi. liver (jomati Inuia, confined to Ihe hilly ai'cas or the northern provinces (Haryana. Himachal Prauesh. Ultar Pradesh. Ilihar. Assam. West Hcngal. Orissa) Kumalln hills
Kumaun hillsspccially in Ko~i river Peri yar ri vcr and L1kes of Kemla West HimaJaya. Kumaun through Garhwal Himalaya to Yamuna SU liej and Ben., drainages ur Himaehall'rauesh Uttar Pradesh hills, DarjL'Cling. Madhya Pradesh. Bihar. NOrlh BeagaJ. Assam Meghalaya ncar Shillong Sub-Himalayan rnngc Himalayan foot hills. Ganga river system Along Ihe Himalayan foot hills Jammu and KashmirVallcy. Ganga river in Utlar Pradesh and Brahmaputra river in Assanl Illdu~ river and its tributaries ill Ladakh & Kashmir
Kashmir valley and Indus river sy~tem
Lch and headwalers of Indus. also lIiblllariesof the Yarlmndand Oxus river
Source: Mahama e/ til. (1994) and Anon (1994)

prompted the Fisheries Research Committee of
India to ban its propagation in 1959. In spite of
such regulations, the species has spread itsel f not
only into most of the freshwater reservoirs and
other waler bodies but also has found its way into
many hrackishwatcr hodies of the country. The
fish is considered as a pest and menace to the
freshwater aquaculture development.
Si I vcr carp, Hypophthalmiehthys /J/ollitrix was
introduced in India in 1959 and unlike tilapia, it
has not strayed into many reservoirs. However,
si Iver carp has attracted more attention from the
ecologists and fishery managers generating more
animated debates . Most spectacular performance
has been reported from Govind Sagar reservoir,
where after an accidental introduction, the fish
formed a hreeding population and brought about
a phenomenal increase in fish productivity. This
drastically redliced the fishery of the native catla
and T putitom. In 1974-75, when silver carp was
not here, T putitom contributed as much as
20.62% of the total yield, hut constituted only a
meagre amollnt of 2.23% during 1984-R5 with
silver carp introduction. Common carp, Cyprinus
e{//pio was also responsible for a similar situation
(Johal and Tandon, 1983). The near extinction of
snow trout, Schizothora .. '( spp. and Oreinus
sifleeatus is also attributed to the exotic common
carp. The mirror carp, a strain of co I1llll on carp has
already jeopardised the population of a number of
native fish species after its introduction in some
upland lakes of Kumaon Himalayas, the Dallake
in Kashmir, Govind Sagar in Himachal Pradesh
and reservoirs or the north-cast. In Dal lake,
common carp found a favorable environment by
virtue of its shallow lake basin, extensive
submerged vegetation and rich food resources .
The fish propagated profusely by virtue of the
specific ecological advantage and threatened the
fishery of indigenous snow trout's lik e
SchizotllOraiehthys nigor, S. esocinus and S.
earviJrons. The extinction of Osteobral1lCl
be/angeri in Loklok lake ofManipur has also been
documented due to the exotic common carp.
Recently, Tilapia zilli a herbivorous cichlicl has
been· introduced in the Indira Gandhi Canal of
Rajasthan for controlling the aquatic weeds
(Bhatnagar, 1995). The control of floating
macrophytes like Eichhornia and emergent
vegetation like Typha by T. z.illi is doubtful
(Sreenivasan, 1995). Besides this when grass carp.
another exotic species which has proved to be a
voracious feeder of many aquatic vegetation and
native PlIl1tilts plllchelus which too is a potential
species for weed control arc already availahle in
our waters . the introduction of T. z.illi neecls to he
evaluated.
Import of sced of sea bass and sea hream from
abroad for cage culture in Indian waters is being
proposed for which there is ajusti hable ohjection
form the environmentalists, that has resulted in a
stay order by the Calcutta High Court (Sreenivasall ,
1995). The introduction 01' Ni Ie perch (Lales
niloticlIs) into the Lake Victoria would be an apt
comparison, which has resulted ill extinction of
about 50% ofthe400 indigenous species avai lable
in the lake.
India possesses good varieties of catfishes like
Clariasbatrac/tus, HeteroplleustesJossilis. M)'Sfus
seeng!wla. M. aor, M. gulio, Wallago attu, Silolli({
silondia, Pangasius pangasius, Bagarias /Jagarins.
Ompok binwculatus, etc. that are potential
candidate species forculture . Introduction of exotic
catfish species like leta/lints spp. needs to he
considered in details including the possible hazards
of introducing associated viral pathogens.
The African catfish, Ciarias gariepilllls, is another
exolic catfish which has made its way inlci lh~
Indian waters lhrollghBanglaclesh. Thc availability
of the spec ies has already heen reported form
Orissa, Bihar, West Bengal and Anclhra Pradesh.
The species which grows to large sizes (beyond
I .5 mil 0 kg) is known to be high I y predatory as
also cannibalistic. The consequence could be
disastrolls when they find entry into the
neighboring ponds and any other open waters I ike
major riverine and reservoir systcms.

Japanese rainbow trout ancl sock eye salmon were
imported from Japan and Canada respectively
into the Nilgiris streams of Tamil Nadu. Not only
they did nol survive, but brought in diseases like
whirl ing disease, white spot (Ichthyophthyriasis),
costiasis, elc. for the first time in the Nilgiris.
It is learnt that the exotic carp bighead, Aristichthys nobilis has made its entry into the Indian waters
from Bangladesh. According to the available
information, the fish is now available in states like
West Bengal, Bihar, Orissa and Andhra Pradesh,
and some private hatcheries of West Bengal are
producing its seed on a large scale. In spite of the
instructions issued by the Union Department of
Agriculture to the various States requesting them
to destroy the fish and not to encourage its culture,
the species is spreading into other States too . It
may result in threatening the fishery ofcatla in our
reservoirs and rivers.
3. Fish Genetics Research - Implications
Genetic improvements in fish species could be
brought about through genome manipulations,
incorporation of an external gene for producing
transgenic varieties or hormonal manipulations to
achievc higher growth rates. The biohazards of
genetic manipulation in the form of mutants,
deformed specimens and Ihose with an imbalance
in the gonadosomatic functioning are to be
considered in breeding programmes. A major
aspects of concern in farm breeding programmes
is with regard 10 inbreeding depression that has
not taken careofby the fish farmers in the country.
Success in milt cryopreservation offers a tool in
brood stock replenishment and improving
progeny . Indiscriminate use of hormones for
breeding, production of 1l10nosex populations for
somatic growth is an issue to be considered in the
wake of intensifications of fish culture practices
in recent years .
4. Land-water Interactions ,
The unplanned expansion of aquaculture in some
parts of the country has resulted in degradation
17
and in certain cases destruction of the natural
resource systems and e'nvironment in which aqua
culture is practised. Conversion of over 60,000 ha
of paddy fields into aquaculture ponds in Andhra
Pradesh over the last two decades, as al so
unplanned conversion of Kolleru lake area into
fish ponds arc a few examples.
In India, nearly 5334 million tonnes of soil are
eroded from the cultivable lands and forests
annually. On crop land, the erosion can range
from 7 to 120 t/ha/yr. The rivers carry an
approximate 2050 million tonnes of soil of which
nearl y 480111 i II ion tonnes is deposi ted in reservoirs
and 1,570 million tonnes is washed into the sea
every year (Gupta, 1975). For example, Ri vcr
Ganga with only a drainage basin of 1.1 million
sq. kms carries an annual sediment load of 1.46 billion [onnes of soil. The siltation of the rivers
and reservoirs not only results in destruction of
breeding grounds of several fishes but also leads
to reduction of overall productivity . The
deforestation of catchment area resulting in sitation
and often change in rivercourse have also afl:ecled
the fish catch.
Though most of the aquaculture fanns use surface
Hill-off water, ground waler and spring waleI' are
also used during lean season that cause depletions
in ground water table. Further, injudicious
exploitation of underground freshwater may lead
to salination and soil degradation. Salinalion of
soil clue to eflluent di scharge from freshwater
prawn hatcheries being established in large
numbers in recent years is also an area of concern.
5. Environmental Pollution
The rapid industrialization and population
explosion have resulted in ever-increasing disposal
of toxic wastes and sewage respectively to lhe
open water bodies, polluting the major river
systems, that are ultimately used as source or
water for aquaCUlture. It is estimated that nearly
33 million tonnes of sewage are generated daily in
India (1981 census). The amount of sewage
pollution in the country is very well reflected by

the River Ganga, in which more than 70% of the pollution load is contributed by sewage. The sewage generated in 692 cities and large towns all along the basin is estimated at 1,528 .1 million (onnes. The resultant BOD load in Ganga basin is estimated at 2,504 million kg/clay of which domestic source contributes 1,338 million kg/ day. The sewage obtained from the highly industrialized cities like Delhi, Calcutta, Kanpur, etc. is also found to contain synthetic detergents to the tune of 0.02 - 2.0 ppm (Jhingran, 1991).
Sewage disposal today is the foremost problem in many of our water courses. Most of the treatment plants remove a good part of the solid particles,
but only a part of phosphates and nitrates . This leads to eutrophication in water bodies, low dissolved oxygen level and high BOD levels.
In India, although the industrial development has not reached the level attained in the developed countries, the toxic compounds, hitherto unknown, arc being detected in increasing numbers in our water courses owing to their indiscriminate application. It is largely because the production of chemicals resulting in the generation of toxic and hazadous substances has been continuously on increase for last three decades (Table 2). Among the industrial effluents discharged into the water
bodies, while the pulp and paper. dairy, distill ery and cotton textile industries generate putrescihle organic wastes, the industries manufacturing organic chemicals, pesticides, fertilizers, dycs and pigments, paints and varnish. nonferrous metals and steels, etc. generate tox ic and hazadous wastes (Jhingran, 1991). These industrial elTluenls even at comparatively low concentrations cause menace to aquatic environments and the biotic communities including fish and ultimately affect man through the food chain. The industri a l efnuentscontai n wide variety of chemical toxicants and heavy metals. Apart from this, they contribute substantially to the BOD loads. For example, the fertilizer wastes at Allahahad have adversely affected the population of carps, catfishes anc! murrels. Plankton and benthos arc known to
disappear upto a strech of 300 km downstream, due to high pH and ammonia toxicity . Besides this, a few other reports are also available regarding fish mortality due to hazadous and toxic wastes discharged from various industries which arc illustrated in Tahle 3.
I Aquaculture at present is characterised hy I indiscriminate lise of a wide spectrum of organic
! ami inorg~:I1l i c chcmi "als to prc ... e fH or cOnlml the \ diseases . Further, the major source of pesticides in
Tahle 2. Growth of industries generating hazardous wastes
(Production in thousand tonne)
Industries 1960 14)71 1980 1986-87
Pesticidc~ 1.46 :1.0 40.68 56.2
Dyes and pigments 1.15 1. K'i5 :10.85
Organic chemicals & 80 17.100 14. 100 42.500
petrochemicals
Fcrti t izers In 1059 :1005 7( [l)
Steel (Ingots) I:'iUO :1400 SCJOO .9000
Non-felTolls metals 8.5 34.6 &2.9 lB." Callstic soda WI 304 457 7601
Pharmaceuticals 1.2~ 1.79 5.07
Source: Jhingran (t 991)
lR

Table 3. Some fish kill incidences in Indian waters
Place
Kankarni lake. Ahmedabad 1982
1980.1981
I Pollutants
Domestic
Domestic wastc Naini lake. Naintal
R. GOlllti. LlIcknow
It Chaliyar. Alwaye
1983. 1984, 1986
1974
Distillery waste
Pesticide
R. TlIngabhadra. Harihar
R. Ganga. Monghyr
11;1114
1968
1981 . 1982
Rayon polyllbrc
Oil rc1lnery
Tannery R. Adyar. Madllrai
Rihand reservoir 1970. 1978. 1980 Chemical and thcrmalerflllcnts
Source: Jhingran (1991)
most 0 the waleI' bodies is the agricultural run-off. The production and consumption of pesticides have been strikingly increasing ever since they were first introduced. Sharma (1987) reported that44 kinds of pesticides are in use in the country. The average consumption of pesticides in our country increased from 3.2 g/ha in 1954-55 to 336 g/ha in 1980 (Chottoraj, 1987). The increasing use of pesticides and insecticides in the agriculture system, for example, to the tunc of25,OQO lonnes only in the State Andhra Pradesh, is polluting the major water system due to surface run-off that is ultimately usedas:alsowrceofwaterforaquaculturc'. Further, it is r~wor[ed that ahout 2600 tonnes of pesticides are' uscd in an year in the Ganga hasin. A good part of i ts is hou nd to en tcrthe ri ver system and suhsequently the food: chain of the fishes in the ri veri tself as also in aquacu I ture farms drawi ng water from the reverine source. The demand for pesticides in the year 1983 and 1987 were 72,000 tonnes and 100,000 tonnes respectively and it is estimated to reach 200.000 tonnes by the turn of the century. With the intensification of agriculture sector, the use of pesticides has reached as much as 1490-1870 g/ha in USA and Europe, providing basis for their increasing use in our country in the coming years. Besides this , as the country does not possess at present an al ternati ve sound method for control of pests like biological control, the projection given seems to be realistic.
19
Among the insecticides, organochlorines (DDT, DDD, Aldrin, Dieldrin, Toxophane, etc.) are most widely used, sharing about 40%, followed hy organophosphates (Malathion, Parathion, Methyl parathion, Fenthion. Thimet, etc.) and carbamates (Sevin, Sevimox, Carbofuran , Carbaryl. etc.). Many of these pesticides/insecticides are ilOnbiodegradabJe with slow decomposition rales. Highly toxic non-biodegradable chlorinated hydrocarbon and organophosphorus pesticides nol only accumulate in the aquatic biota but are often hi.oLogi£'a'Nly magnified through food chain and ultimately affectthe human popUlation. Moreover, they often combine with other compoltnds in the environment to produce additional toxins (Bandyopadhayay, 1995). Among the toxicants used, organochlorines and carbamates are most toxic and found to persist in soil and water for long time. For example, DDT and DDD have half life of 10-14 years and DDE has been known to have existed for 10 years. and aldrin and dieldrin require about 2.5 years for 95% degradation in soil (Chottoraj , 1987). Further, the carbamate insccticides though known to be less persistent than the organochlorine compounds, arc highly [oxic to wide varieties of invertebrates such as
insects, prawns, crabs, and crey fishes. The study
showed thaI both finfishes and shellfishes arc
extremely sensitive to chlorinated hydrocarbons
and die from suffocation due to interfercnce with

oxygen uptake at gills as well as effect on central
nervol!s system (Rudd , 1964). It is proved these
chemicals destroy larval stages of various aquatic
food organisms as also depress photosynthesis of
plankton (OduTll, 1971).
High doses 01' pesticides causc oedema especially
at the base of the :'iecondary lamcllae due to
increased capillary permeability. Under sublethal
or chron.ic exposures, thc changes observed in
gills are swelling of lamcllarepithelium, necros is,
hyperplasia, epithelial lining, cell swelling and
hypersecretion of mucus. Studies with endosulfan
byNajmi etat. (1992) showed rupture of epithelial
cells of mucosal folds of Clarias batrac/llls.
Experiments conducted by Dutta et al. (1992)
showed malathion exposure to Heteropneustes
j<)Ssilis causes formation of two ncw proteins of
very low mobility in blood serum associated with
noticeable differences in RBC and WBC counts.
Liver being the primary organ for detoxification
of organic zenobiotics, the ,pesticides tend to
accumulate to a high concentral~on in it resulting
in focal necrosis, swelling, pyknosis, cytoplasmic
vaculation, etc . Studies conducted on tilapia, O.
I1lOsswnbicus with five chloril.lated hydrocarbons
DDT, BHC. Endosulfan, Sonatox and Termax,
concluded that aquatic environment contaminated
with pesticides gradually imports abnormalities
in the brood fish causing mortality of spawn, fry
and fingerlings (Pandey and Bhaltacharya, 1995).
Sukumar and Karpagaganapathy (1992) working
with Co/isa lalia showed decline in number 01'
mature oocytes followed by retrogressive nature
01' ovary, hypertrophic and wrinkled lamigenous
lamellae when exposed to carbofuran .
Some pesticides such as DDT anel BHC even at
very low concentrations have been found to be
hi magnified by the aquatic rond chain ending up
in very high levels in fish tissues. Studies carried
out at CIFRI have shown biomagnil'ication of
DDT in plankton, fish, gastropods and bivalves
20
from Hooghly estuary in the order of 2500, 750(),
3660 and I 5ROO"times of the ambient levels or
DDT in water. Another classical example or
biomagnification of DDT has been presented hy
Woodwell et al. (1967) as follows: Water
(0.000005 mg/l) (Plankton O.041llgtl) - Silversielc
minnow (0.23 mg/l) - Sheephead minnow (0.94
mgtl) - Pickerel (predatory fish) 1.33 mg/l) -
Needle fish (predatory !"ish) (2.07 mgtl) - Heron
(3.91 mgtl) - Herring gull heron (3.57 mgtl) -
Herring gull (scavanger) (16 mg/l) - Fish chawk
(Osprey) egg (13.8mg/1 ) - Margemer (fish eating
duck) (22.8 mg/l) - Cormorant (feeds on larger
fish) (26.4 mgtl). It is evident from the above raet
that the conccntration factor (ratio in organ isms to
water) is about hal r mill ion times for fish caters.
The indiscriminate use of antibiotics in aquacu.lture
to combat the di sease problems without
understand ing their modes of action is another
area of concern today. At present, an array of wide
spectrum antibiotics are used in aquaculture to
prevent or control several diseases. Most of the
drugs are bacteriostatic where, bacterial
multiplication is inhibited. Further. the prolonged.
repeated and widespread usc of antibiotics lead to
the developmcnt of resistance in bacterial
populations. In the same way, the rotating usc of
several antibiotics contributes to multiple drug
resistance patterns. In aquatic system , the
antibiotics are applied eilher in the medium or
through feed unlike the direct administration to
the infected ones only in caseofterrcslrial animals.
In slich cases, the organisms, both infected and
healthy ones are subjected to the antibiotics
admini stration and thereby stress . It has been
reported thal the antibiotics not only affected the
physiological state and further the immune system
of the animal!' tnl also resurl in I iocOIlCCnll'lltioll
and later in hiolllagnification in the higher trophic
levels. A stucly showed that a congeneric deri vative
ofthe polycyclic nophthacane carboxamine, used

extensively in aquaculture not only as prophylactic
but also in con troll ing several bacterial diseases at
present, resulted ill 60% reduction in standard
metabolism and about 50% reduction in protein
synthesis in case of carps at the end of96 hours of
administration at 24 h interval dose frequency
(Rao, 1995). Studies also showed the ability of
antibiotics to bind with a number of clements,
particularly Illetal ions, thereby affectingthclllodes
of action and often become ineffective in its
bacterial action.
6. Supplementary Feeding - Issues
The protitability of any modern and scientific
aquaculture practice largely depends on the
supplementary feeds provided to the system . These
aquafeeds and feeding practices followed also
call.se some wastes which arc generally ignored
and not given due attention considering the
profitabilityoftheaquaeulture. Theenvironmental
problems are seldom emphasised till the effects
arc fell. The lure of high production rates over 2d
tlhalyr at least for few years resulted in prol i fication
of shrimp fiinning in many south-cast Asian
countries, as in Thailand and Taiwan. This
continues in other countries to this day despite the
much reported long-term problems in those that
were the pioneers (New, 1995). Without exception,
India too had to face the consequence of the much
talked problem of white shrimp disease even
during a short span 01'2-3 years.
The major impact of feeds and feeding techniques
used in intensive aquaculture consists 01'
hypernutrification, the most important pollutant
heing the nutrients which normally limit primary
productivity, namely inorganic phosphate and
nitrogen. Though both have an impact, phosphate
is generally more important in freshwaters and
nitrogen in marine waters. Large amounts of
nitrogcn and phosphorus accumulate in the
environment in the case of intensive aquaculture
21
practices derived from aquafeeds provideclto the
system. Forexample, at a FeR of 1.5: I, salmon ids
utilize only 25% oflhe nitrogen and phosphorbls in
aquafeeds(DeSilvaandAnderson, 1995). 1()(X,or
the aquafeeci phosphorus dissolves in the eillueni
and is immediately available ror primary
production. the rest65% is particulate and released
slowly. The corresponding values for nitrogen arc
65% dissolved and 10% particulate forms.
According to Macintosh and Phillips (1992), close
to 80 and 90% of the nitrogen and phosphorus
inputs of the feeds respectively are notulilil.ed by
the cultured organisms and as a result are wasted.
They in turn pollute the water and accumulate al
the bottom of the pond as toxic wastes. Toxic
wastes stress the growing conditions and
environment of the cultured organisms.
With the extensive and semi-intensive systems
progressively intensified over the years, reeds
designed for more intensive systems arc often
utilized in less intensive systems. Such feeds arc
formulated for conditions where lillleor no natural
food is available and unnecessary for less intensive
system resulting wastage and pollution (FAO,
1995). Further, the feeds available for shrimps are
often useci for fish culture ofrvice-versa, which
are extremely diverse in character and their
nutritional requirements. The practice is more
common in case of freshwater prawn farming. A I
present, though the farming of freshwater prawns
like Macrohrachilllll roselliJergii and M.
ma/collllsollii is gainingmomenlulll and practised
in a large scale, no speci fic commercial feed is
available for the same. The feed provided is ei Lher
restricted to ricebran-oil eake mixture or the
available commercial formulation of shrimps.
Similar is the case for catfish farming. lrl spite of
the fact that they require lower prolein levels than
the marine shrimps, the prevalent practice of
lIsing shrimp diets containing high protein levels
needs to be reviewed.

The use of single or multi-ingredient moist feeds
in aquaculture has been one of the practices
followed largely by most of the farmers in the
country. In spite of the fact that carp culture has
become an organised industry in recent days with
production levels of 5-8 t/ha/yr recorded by many
farmers of Andhra Pradesh and Punjab, the
supplementary feed provided is limited to bran-oil
cake mixture. The intensive production of carps
resulting in production levels as high as 17.3 Vhal
yr, was also obtained through use of feed in the
moist form (Tripathi et af., 1994). Very little
attention has been given to estimate level of
consumption and wastage of feed supplements
when provided in moist form . The experiments
conducted with saltnonids showed much higher
levels of nutrients in the discharge when provided
in wet form overdry from (Wan'er-Hansen, 1992).
(Table 4).
Pillay ( 1992) noted that the discharge from 50 t/yr
mari ne fish farm is si m i lar to that from the puri fied
sewage from a community of 7000 people.
Bingham (1991) reported that 45,000 t of trash
fish is used in Hongkong to produce 3000tofhigh
value food fish in marine cages, while about
13,500 t of the trash fish pases through the cages
uneaten. A survey conducted by NACA also
reported large proportion of carp faIms using
moist formulated feeds (New, 1995). Moreover,
most of the simple feed mixtures which are
Table 4. Discharge levels III kg per tonnes of
salmon ids produced
Low energy High energy Wet feed
dry feed dry feed
Total N 6O-~O 1. ...... ~ lim
Total P 8-10 3· $ 2U
Solids 300-400 150-300 600
II I) 200-300 150-250 (K)
Source: WaITer - Hansen (1992)
22
commonly used in manycontries undercarpculture
are in moist form (Tables 5 & 6). Moist feeds,
besides polluting environment possess the risk of
disease transfer through the use of unpl;ocessed
animal ingredients . To overcome such problems,
Denmark has banned the use of trash fish sine
1985 (Kiaerskolu, 1992). New ef af. (1993) also
stressed the necessity of ingredient processing
and improvement of moist feed for reduction of
wastage and improved efficiency. Besides the
discharge of nutrients into the environments
through feed, increasing use of various additives
in aquafeeds is also causing concern now-a-days.
The discharge of antibiotics in the effluents or
their carry-over into the aquaproducts may affect
disease resistance in fishes and human beings.
The antibiotics usage is particularly prevalent in
shrimp feeds because shrimp have a nonspecific
immune system. With the increasing fears about
antibiotics residues in human food, Japan, USA
and Europe, the major importers offarmed shrimp
have imposed strict quality definitions on south
east Asian feed stuff industry (New, 1995).
Though aquafeeds are general I y blamed for causi ng
pollution, poor feed management is also equally
responsible. Feed ingredients, form of feed,
proximate composition, etc. along with the feeding
schedule, feed ration as also feeding style decide
the profitability of the culture practices. In many
cases of carp fm'mings feed dough is dumped into
the water. Rarely the feeds are provided in trays or
baskets. Feeding quantity estimation should be
given more attention. In many cases, the am'ount
of feed provided is .never actually consumed by
the farmed organisms . Biomass estimation at
periodical intervals should also be given due
attention for feecling quantity estimation.
There has already been a real ization for the
importance of low-pollution feeds, especially in

case of salmon farming. Thc new salmonid feeds
that have emerged depend on selecting ingredients
with high phosphorus bioavailability and high
digestibility, reducing the feed losses by improved
water stability and balancing diets to prevent
excess of certian nutrients. Reducing protein and
increasing lipid levels have improved growth rates
and FCRand reduced faeces and ammonia nitrogen
excretion . For low-pollutiondiets, although protein
levels are not necessarily being reduced, lipid
levels are being raised to provide high energy and
low FCR feeds. For example, increasing lipid
levels of Atlantic salmon feeds from 22 to 30%
reduced the crlluent nitrogen load by 35% and
phosphorus by about20% (Johnsen and Wandsvik,
1991). Lall (1991) suggested selection of low
phosphorus fish meal in feed for reduction of
phosphorus discharge. The use of partial I y deboned
/'ish meal was also found to reduce the phosphorus
discharge signi ficantly (Jauncey, 1995).
Unlike fish, shrimp can utilize carbohydrate to a
considerably high level to spare protein, as in
lipids. Though the inclusion levels of lipid in
shrimp feed are unlikely to reach levels as in case
Table 5. Percentage of carp farms in Asian
countries feeding formulated feeds in moist
form in 1995
Country
Bangladesh
China
India
R.O. Korea
Malaysia
Myanmar
Pakistan
Thailand
Vietnam
Extensive
50
7
Source: WaITer - Hansen ( 1992)
St.'ml- Intensive
ll'\tcll,,,h'
ii'
(i
;W
4
(1
76
:l
I.~
2
of salmon. the information already available
showed that the ,values are two to three times
higher than 20 years ago (New, 1976). In most
dietary studies, optimal protein requirement is
overestimated. Feeding strategy as well as dietary
protein quality, parlicularlydigestibility and amino
acid profile influence the quantity of nitrogen
excreted (Kaushik and Cowey, 1991). Moreover,
the correct protei n and energy ratio for each spec ies
has become an important consideration in Iced
management.
7. Fish Quarantine
The major diseases associated with fish culture in
south and south-cast Asia include protozoan and
microbial diseases . The protozoan diseases arICct
mainly fry and juveniles whereas microbial
diseases affect both young and adult fishes. The
most prevalent protozoan diseases of freshwater
fish are caused by the holotrichus ci I iates,
!chthyophthirius, trichodinidsandmyxosporidians
(primarily Myxo/)oillS). These protozoans arc most
detrimental and cause great losses of cultured
fishes, be it freshwater or marine species, Many
protozoans are cosmopolitan and their spread is
made easier by the transportation of' live fish
across the national boarder which generally is
done in fry or juvenile stage without quarantine
(Seng, 1987), Research findings have shown thal
many of the fish pathogens that cause sporadic
mortalities or serious epizootics were previously
unknown to the region and were introduced along
with exotic fish species (Shariff, 1987).
Quarantine examinations based only on visual
examinations are not effective in detecting
palhogens associated with fish that are leaving or
entering a country. These factors have resulted in
ineffectiveness of the whole exercise. Certificates
issued to the exporters of fish are now merely
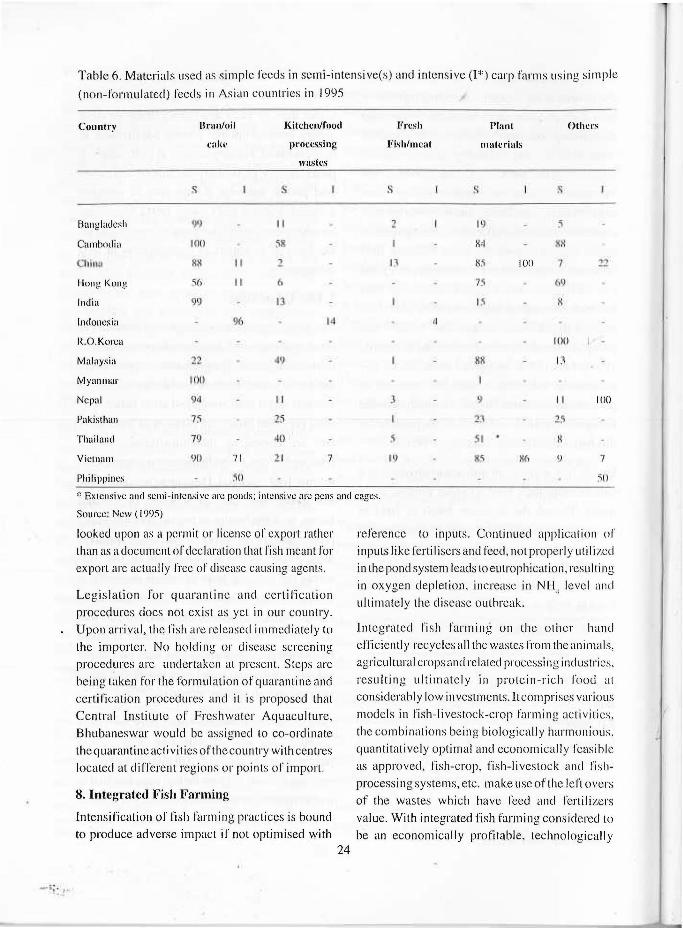
Table 6. Materials lIsed as simple feeds in semi-intensive(s) and intensive (1*) carp farms lIsing simple
(non-formulated) feeds in Asian countries in 1995
Country
Banglmlc~h
Cambodia
HOllg Kung
India
Indonesia
R.O. Korea
Malaysia
Myanmar
Nepal
Pakisthan
Thniland
Vietnam
Philippines
Brlln/oil
cakl'
,<;
I)'
IOU
R~ I I
~ () I I
9
(J(,
22
IOU
<1
75
79
WI 71
~()
Kitchen/food
processing
wastes
S
I I
~)!
.!
6
1:1
V
II
2:i
411
21 7
Fresh Plant Other.,
Fish/meat materials
S .~ S
2 I') ~
K4 8:-1
11 K;'i IOn 7 ... .,
75 6L}
i:'i ,.;
.1
II ~~ I . IIX I.
II 100
1J
I •
7
~ I
.:. Extensive and sell1i-intcn~ivc lIrc ponds: intensive arc pens and cages.
SOlln;c; New (1995)
looked upon as a permit or license of export rather than as a document of declaration that fish meant for
export are actually free of disease causing agents.
Legislation for quarantine and certification procedures docs not exist as yet in our country. Upon arrival, the fish arc rel eased immediately to the importer. No holding or disease screening proccdures are undertakcn at present. Steps are
being taken for the formulation of quarantine and certification procedures and it is proposed that Central Institute of Freshwater Aquaculture, Bhubaneswar would be assigned to co-ordinate the quarantine activities of the country with centres located at different regions or points of import.
8. Integrated Fish Farming
Intensification of fish farming practices is bound to produce adverse impact il' not optimised with
24
reference to inputs. Continued application or inpuL<; like fertilisers and feed , not properly lItili l.cci in the pond system leads to eutrophication, resulting in oxygen depletion, increase in NHI level and ultimately the disease outbreak.
Integrated fish farming on the other hand efficiently recycles all the wastes from the animals, agricultural crops and related processing industries, resulting ultimately in protein-rich rood ,II
considerably low investments. Itcompri ses various
modcis in fish-Ii vestock-crop farm i ng acti vi lies, the combinations being biologically harmonious. quantitatively optimal and economicall y feasible as approved, fish-crop, fish-livestock and fishprocessi ng systems, etc. make use of the left overs
of the wastes which have feed and fertilizers value. With integrated fish farming considereci to be an economically profitable, technologically

sound and environmentally congenial farming practice, it is necessary to maintain the inputs at optimal levels for sustainability without adverse impacts. While the aquatic environments can process a large amount of wastes, their continuous application results in silting up of pond basins and anaerobic conditions. In order to achieve a good production, supplementary feeds are provided over and above the application of organic input which in turn leads to greater accumulation of pond mud year after year. This leads to serious outbreak of fish diseases and oxygen depletion, and threaten the fish I ife. Examples of such incidence in Zhejiang province of China had resulted in a fish loss of over 500 tonnes from about 500 ha area during 1989 due to disease incidence, while in 1990 in Wuxi , Jhiangsu province, oxygen depletion resulted in fish death causing 30% loss of the total farming areas including those species which have high environmental tolerance as common carp, crucian carp and other bottom dwellers (Kuanhong, 1995).
Integrated fish farming however provides for recycling of organic wastes, both plant and animal-
based and could be a potential tool for waste recycling. In this co~text, the design of a wastewater treatment system by CIFA at Cutlack, Orissa using a series of duckweed and lish pond provides for waste utilization and treatment or domestic sewage (Fig. 1,2 and 3). The sewage-fed fish culture, having a long tradition in the country actually provides for positive environmental impact of the aquaculture systems. Organic farming comprisi ng recycling of domestic sewage, processed plant and animal residues, etc. has been the recent trend, highly suitable for an agrarian economy like India, providing for sustainability in aquaculture as also environmental upkeep.
9. Water Budgeting
The country receives an annual rainfall of about 400 million hectare metre (mhm) water, of which 230 mhm goes back into the atmosphere through evapotranspiration. The remaining 170 mhm is carried into the sea by the rivers every year, mllch of it (110 mhm) during rainy season and rest after percolation to underground and subsequent emergence into st reams. Further, the ground water
- .. " fWi lllO I
....
Fig. I. Plan of aquaculture treatmellt system for domestic sewage at
Matagajpur, Cuttack, Orrisa, India
2.5
_. \ 1

lIpto 300 m contains 3,700 mhm, about 10 times the annual rainfall (Parameswaran, 1995).
Theoretically, a large quantum of 170mhm water is available in India for irrigation and other uses, which is estimated to be enough to meet the entire irrigation needs of the country. However, irrigation systems of 40 mhm (30 mhm canal water + 10 mhm well water) only has been developed so far, which irrigate only 25% of the aerable land while the streams carry rest 130 mhm annually. Further, considering various limitations. it is estimated that it is not possible to harness more than 70-80 mhm water.
One of the important items in freshwater aquaculture is the water requirement, either in hatcheries orin grow-out systems, the information on the quantitative aspects being however lacking. Several states treat aquaculture as an industry as in Maharashtra and charge exhorbitantl y for water from reservoirs, while other treat it as an agricultural activity. Even where the irrigation water is given for aquaculture, it is only the surplus and extra water after meeting the needs of agriculture, industries, etc. The left-over water is the only one over which aquaculture can claim (Dehadrai, 1995). It is estimated that freshwater aquaculture at present is utilizing 9.5 billion m' water under the existing 0.745 million ha pond area, which is expected to increase to 36.2 billion m' at the complete development of the remaining 1.755 million ha of existing water bodies and additional creation 01' 25% of them as new ponds i.e. 0.439 million ha. thus, considering the water availability of 70-XO mhm , a share of 5%, (3.6 mhm) must be made available for freshwater aquaculture, by adopting parity and equity between agriculture and fisherie~ especially aquaculture and allotment or water as national policy guidelines. Further, scicntific studies have established that irrigation water could be nutritionally enriched if it passess through fish farms.
quantity of water required for water exchange in aquaculture is not considered as additional water demand from the country's water source, other than the evaporation and seepage losses.
10. Depuration ofFish Cultured in Waste Water
Indian sewage-fed fisheries started in West Bengal around 1925, which presently is being practised over an area of about 4000 ha. Earlier waste water wall, l'bilmrily u:ed in rlsh culture wi thou t l;IK in!;! into consideration the health aspects, but gradually precautionary measures are being incorporateci with regard to health and hygiene. There are potential threats to public health from the fish raised in wastewaters and the degree of risk varies considerably with the types or pathoge.ns concerned . There is little danger of disease from eating of well-cooked fish since the heat destroys pathogens, but the consumption of raw, partially cooked or improper preserved products can be a serious health hazard, generally overlooked . It is generally believed that fish carry human pathogens passively only in their intestines and in their bociy surface. Prior waste treatment pathogen destruction is being suggested. Further, it is essential to eliminate the potential risk to health posed by thc presence of several pathogenic faecal microorganism in fish reared in waste water. Thus, certain measures need to be undertaken. as depuration of fi sh in clean waler ponds before final harvesting. The normal depuration measure consists of holding the fish cultured in sewage waters for a period 01"48-72 hours before marketing the produce.
11. Energy Inputs
The viability of any farming system depends on the economy of returns , in terms of lanel. capital , labour and entrepreneurship. In recent years, this aspect is being evaluated in terms of total energy inputs-environmental, Illanual and mechan ical. Some farming systems are even being threatened
The conjuctive use of water for agriculture and due to high energy demands in terms of manual aquaculture in possible by passing irrigation canal labour, in which context, mechanisation is waler lhrough aquafarms to fields. Thus the assumi ng increa~i"g imporlllrlcc. All tnpts 111IVe
26

Fig. 2. Duckweed
Fig. 3. Treatment of domestic sewage

been made to quantify the energy inputs and
evolve the energy budgets for plant and animal
based farming systems. Such an exercise is totally
lacking in freshwater aquaculture and efforts are
presently underway at preparation of energy budget
models for different freshwater aquaculture
systems.
12. Fish Marketing and Hygiene
With most fish, both marine and freshwater
included, marketed fresh in the country very little
post-harvest processing is carried out. Even the
meagre processing of marine fish is confined to
drying, salting, etc. though icing is a common
practice for short distance transport. With a boom
in freshwater aquaculture, this aspect is receiving
greater attention in recent years .
Improper fish handling including transport offish
in baskets and containers that are repeatedly used
is a source of contamination. Ice used fortemporary
preservation often is a source of contamination of
human pathogens. The absence of a cold chain
with hygienic selling places is of major concern
and a.n environmental issue in fish marketing.
Aquaculture planning needs to consider not only
the development of facilities for culture perse, but
also the post-harvest preservation and marketing
measures. Necessary quality standards have to be
evolved and enforced as in the case of processing
and export of marine produce.
13. Environmental Modification and Recovery
Biopurification of sewage wastes employing
aquatic vegetation has been found to be an effective
and environment-friendly means to combat the
pollution hazards. Bryopohytes, mosses with their
delicate and uncuticularised plant body have a
marked capacity for absorbing and accumulating
pollutants . Some aquatic plants that grow well in
wastewaters like Eichhornia, Wolffia, Lemna, Spiradela, Hydrilla, Ceratopohylul1l, Phragmites,
Scirpus and Typha absorb considerable amount of
nutrient ... and heavy metal 1 as also reduce the BOD levels. It has been calculated that 20-40
nitrogenous waste of over 1000 people and
phosphorus waste of over 800 people (Jhingran,
1991). Biofertilizers, pro{essed organic material
and biofilters are some of the inputs with high
application potentials in aquaculture systems,
providing for environmental modifications as also
products that could be substituted for chemical
inputs or mechanical devices.
Processed organic input ill aquaculture
With a dominance of organic inputs in freshwater
fish culture, cattle dung and poultry droppings are
the two major animal excreta used for the purpose.
As a large fraction of the organic matter appl ied in
the ponds has been observed to remain unutil.ized
with associated environmental problems, the
advantages of processing the organic matter prior
to application are being considered. They incldue
higher mineralisation and nutrient release rates,
reduced in-pond oxygen demand for manure
processing, marginal increase in the nitrogen
content of the substrate due to microbial processing,
low siltation rates, etc. (Ayyappan, 1994). Apart
from cowdung that is traditionally used, several
organic inputs like animal excreta, straw , green
fodder, water hyacinth, etc. have been used as
inputs in bjogas plants. Further, the saving in
fertilization practices with biogas slurry over the
recommended manurial schedule in carp culture
amount to 13.3 - 40.5%. This assumes significance
in view of the increasing costs and scarcity of
inorganic fertilizers, as also associated
environmental impacts of long term use of
inorganic fertili zers . Besides these, the biogas
plant suitably process and recycle several natural
organic resources like aquatic macrophytes. and
agricultural byproducts that are otherwise wasted.
Azolla - A new bio/ertilizer
Azolla. a free floating aquatic fern fixing
atmospheric nitrogen through the cyanobacterium,
Anabaena azollae. present in its dorsal leaves, is
one of the polen tiu.lniLmgenolls biofenilirers_lts high nitrogen-fixing capacity, rapid multiplication
tonnes of Eichhomia is capable of removing the and decomposition rates resulting in quick nutrient 27

release rates have made it an ideal biolcrtilizer I'or farming systems. The normal. doubling time of k:.()l/a is three days and one kilogram of phosphorus applied result s in 4-5 kilogram 01' nitrogen through Azolla i.c. about 1.5 - 2.X tonnes of fresh biomass. For fertilizing I ha ol'water area at the rate olAO t/ha/yr (providing I ()() kg nitrogen . 25 kg phosphorus, <)(J kg potassium and 150(J kg
organic malleI') as a total substitution f0r tilt.: traditional organi c manures and inorganic
fertili7.ers recommended in carp polyculture, about 55() m~ water spreae! area is required (1.5 kg/m2/
week,42t/yr), with total areaoUI(lO mC, accounting
for X% of the area to be fertili7.Cd (Ayyappan el
a/., 1993). While Awl/(/ is useful in aquaculture practices primarily as a nitrogenous biofertilil.er, its high rates of decomposition also make it a suitable substrate for enriching the detritus food chain or ror microbial processing such as composting prior to application in ponds. II can
also servcas an ingredicnt ofsupplemel1tary feeds and as forage for grass carp. A saving to the extent of 4H.5% over the recommendecl manuring schedule IS estimated through Awllo
biofertil ization (Ayyappan, 1994).
Waste Iltilization
Diological treatment of wastewater, already occurring in nature, but standardised with intro·· duct ion ofspecific microbial inoculants or scaled
up designs is a potential area compatible with freshwater aquaculture. The objectives of using sewage for fish culture are two folds: utilii'.ation of
nutrients in wastewater for fish production being the carl ier concept, andusi ng aquaculture as a tool for treatment of sewage and wastewaters being
the recent trend. Further, the aspect of reduction of nutrient and bacterial loads through fish culture has been considered and shown effective with regard to counts 01' total and faecal colil'orllls,
faecal streptococci and Sallllo/l e/la. Fish culture not only reduces tile nutrient load in the waters, but also causes a reduction in bacterial load, as
evide nced fly I II · work in" Nig "dan wage-Ie I fish culture systems. The reduZtion rates in the
bacterial popUlations from the inriuent to the crflucnt during a retention time of 12 days were total viable counts 4.5 x ' I (J" to 1.7 x I O''/ml. total coliform counts 2.7 x I07 to 2.7 x IO'/ml , faec,ti coliform, 4.5 x 10" to 1.3 x 1O'110() mL I'aecal streptococci 1.4 x 10⁴ to 3.3 x 10'/100 ml and Sa/llloll('/Io 2.7 x 10' to 1.2 x loc/ IOO Ill!. Thl'
reduction might have been hrought about by a combination of natural inactivation processes. adsorption to sediments and uptake by fish. Itma)'
be emphasised that all these culture systcm:. are independently economically viahle units and as such would provide considcrable returns (Ogbondeminu and Okoye , 19<)2).
Distillery cl'iluents are also a major resource in the' country with about 150 disti Il eries produci ng <)(H)
million litre.'> of alcohol annually resulting in 10,000 million lilres of spent wash. The etlicacy of aquaculture as a tool for treatment or such wastes has been dcmonstrated at Madras , where the diluent ancr undergoing the hiomethanat ion proccss, is fed into fish ponds. With production rates oJ' 50 I/ha/yr, about 6 ha of land arca has hecn
shown to bc adequate for trcatin¥ I nOm' or efflucnts. This has opencd avenues for utilising a variety of agro-based industrial ernuents as also for treating them through aquaCUlture practices. largely based on microbial processes, in terms of oxidation or nutrient removal through algae and
other macrophytes.
In terms of sol id wastes also, the resource in the country is huge in tcrms 01' agro-rcsicliles
amounting to 321 million metric tonnes per year (Ramachandran and Sinha, 1993). As already mentioiled , on bioconvcrsion of these lignocellulosic wastes, they can he applied [(l fi sh
ponds as manure/fecd which procc<;s also results in usable products likc single cell protein and
biogas.
14. Epilogue
With environmental issues being discLissed with
rL'f I 'cnc~ I ) .1Il)' developmental activities, agricultural or industrial. it is relevant and cssential

that the freshwater aquaculture related
environmental issues arc also analyse!;! for
formulating guidelines for the development of the
sector. Unlike other areas where these issues were
take-up often as a post-mortem, they have heen
discussed even when the sector has not caused
serious prohlems. With intensification of culture
practices heing the trend in recent years. issues as
listed have been foreseen and remedial measures
implemented properly would pave way for not
only increasing productivity but also sustainahle
aquaculture. Fanning systems approach providing
for utilisaltion of wastes from one culture system
as an input or resource for another system. with
proper designs is being discusscd for sustainable
agricultural practices including freshwater
aquaculture.
References
Anon, 1995. Fishing Chimes. 15(8) : 56.
Ayyappan, S., 1994. Environmentalmanagemnt
for increased aquatic productivity. pp. 233-
252. SVlllp. EliI'. Biotech., 28-29 March
1994, NEERI, Nagpur, India
Ayyappan, S., Dash B., Pani. K.C. and
Tripathi, S.D., 1993. Awll([-a new
aquaculture input. National. Meet on
Aquqforming Systems - PJ'(lctices ([nd
Potellfi{{l.l', 10-1 I Feb 1993, Bhubaneswar,
OFS-3.
Bandyopadhyay, B. PoO 1995. Aquatic pollution
with special reference to the effect of
pesticides and insecticides on fish and
fisheries. Fishing Chimes. 15(3): 27-30.
Bhatnagar, S. P. 1995. Rajasthan News letter.
Fishing Chillies, 150)): 56-58.
Bingham. A., 1991. The deeper the beller. Far
Eastern Economic Revicw, October 1991:
27-28.
Choltoraj. A. N., 1987. Some aspects of biological
interaction of insecticides. Pmc. Indian Science Congo Abstract, 3: 1-7.
Dehadrai. P. V .. 1995. Water requirements for
fisheries in India: A scientists perspecti ve.
De Silva, S. S. and Anderson T. A. , 1995. Fish
nutrition in aquaculture. Chapman and Hall.
London, England, 3[9 pp.
Dulla, H. M., Dogra, J. V. V., Singh, N. K., Roy
P. K., Nasal', S. S. T., Adhikari, S., Munshi
J. S. D. and Richmonds. C, 1992. Malathion
induced changes in the serum proteins and
haematological parameters of an Indian
catfish, Hetero/Jnellstes .fc)ssilis (Bloch).
Bull. Ellviron. COlltnlll. Toxico., 49( 1,):
91-97.
FAO, 1995. Review of the state of world fishery
resources: aquaculture. FAO Fisheries Circlllar, 886: 127 pp.
Gupta. G. P., 1975. Sediment production status
report on data collection and utilization.
Soil COliS. Diges., 3(2): 10-21.
Jauncey, K., 1995. Advances in freshwater fish
nutrition. 28 pp. Proceedings of VICT AM
95 Symposium "From Feed to Food" 17-
18 May 1995, Utrecht, Netherlands. Victam
International. Leiden. Netherlands.
Jhingran, A. GoO 1989. Role of exotic fishes In
capture fisheries waters oflndia. III: A. G.
Jhingran and V. V. Sugunan (Eds).
Conservation and management of inland
capture fisheries resources ofIndia.Inland
Fisheries Society of India, CIFRI,
Barackpore, 275 pp.
Jhingran, A. G., 1991. Impact of environmental
stress on freshwater fisheries resources. 1. 11I1({lu/ Fish. Soc. India, 23(2): 20-32.
Johal, M. S. and Tand()(] K. K., 1983. The decline
of native fishes. Punjab Fisheries Bull ..
9(11): 3-15.
Johnsen, F. and 'Yandsvik A., 1991. The impact
of high energy diets on pollution control in
fish farming industry. pp. 51-63. In: C. B.

Cowey and C. Y. Cho (Eds). Nutritional strategies and aquaculture waste. University
of Guelph, Ontario, Canada.
Kaushik, S. J. and Cowey C. B., 1991. Dietary
factors affecting nitrogen excretion by fish. pp. 3-19. In: C. B. Cowey and C. Y. Cho (Eds .). Nutritional s trategies and aquaculture waste. University of Guelph, Ontario, Canada.
Kiaerskou, J., 1991. Production and economics of low pollution diets for the aquaculture industry, pp. 65-76. In: C. B. Cowey and C. Y. Cho (Eds). Nutritional strategies and aquaculture waste. University of Guelph,
Ontario, Canada.
Kuonhong, M., 1995. A few factors related to sustainable management in integrated fishlivestock-crop farming . ADBINACA
Workshop on Aquaculture Sustainability
and the Environment, 6-12 October, 1995,
Beijing, China.
Lall, S. P., 1991. Digestibility, metabolism and excretion of dietary phosphohrs in fish, pp. 21-36. In: C. B. Cowey and C. Y. Cho
(Eds). Nutritional strategies and aquaculture waste. University of Guelph, Ontario,
Canada.
Macintosh, D. J. and Phillips M. J., 1992. Environmental Consideration in shrimp
farming. INFOFISH International, 6/92: 38-42.
Mahanata,P. C.,KapoorD., DayalR. and Ponniah AG., 1994. Prioritization of the Indian fish
species for conservation. pp. 379-385. In:
P. V. Dehadrai, P. Das and S. R. Verina (Eds.). Threatened fishes of India. Proceedings of the National Seminar on Endangered Fishes of India, National Bureau of Fish Genetic Resources, Allahabad, India.
Najrni, T. A, Sharma, V. and Khan, A. H., 1992.
30
Toxic effects of endosulfan on the stomach ofClarias batrqchus (Linn) . Indian 1. Pure Appf. Bio., 7( I): 47-51.
New, M. B., 1976. A review of dietary studies with shrimp and prawns. Aquaculture, 9:
101-144.
New M. B., 1995. Feed management and nutrition of sustainable aquaculture. ADBINACA
Workshop on Aquaculture Sustainability and the Environment, 6-12 October, 1995. Beijing, China.
New, M. B., Tacon, A. G. J. and Csavas I., 1993. Farm-mdae aquafeeds . Proceedings of the FAO/AADCP Region'al Experl
Consultation on Faml-Made Aquafeeds, 14-18 December, 1992. FAO/RAPA, Bangkok, Thailand.
Odum, E. P., 1971 . Fundamentals of ecology. W. B. Saunders Co., 574 pp.
Ogbondeminu, F. S. and Okoye, F. c., 1992. Microbial evaluation of an untre.ated
domestic waste water aquaculture system. 1. Aqua. Trop., 7: 27-34.
Pandey, A K. and Bhattacharya L., 1990. A
differential scenario of five insecticides exposed to Oreochromis mossmnbicu.l',
maturing and matured ova. Second Indian
Fish. Forum, Mangalore, India, 276 pp.
Parameswaran, S., 1995. Toxic wastes - a potential danger to freshwater fisheries and
aquaculture resources. Fishing Chimes, 14(10): 63-68;
Rao, M. B., 1995. The environmental impact of chemical inputs in open aquaculture systems - a perspective. Fisheries Fortune,
Souvenir, 22 pp.
Ramachandran, S . and Sinha S., 1993. Bioconversions. Indian. J. Microbiol., 33(1): 25-34.
Rudd, R. L., 1964. Pesticides and living landscape.

Univ. of Wisconsin Press, Marson, 320 pp.
Sharma, A., 1987. Resources and human welbeing. 74th Session Indian Science Congress Association, Bangalore, pp. 32.
Shariff, M., 1987. Current status of programs for fish health certification and quarantine system. In: J. R. Arthur (Ed.). Fish
Quarantine and Fish Diseases in South and Southeast Asia: 1986 update. Asian Fish. Soc. Spec. Publ. I, 86 p. Asian Fisheries Society, Manila, Philippines.
Sreenivasan, A, 1996. Why exotic species ? Fishing Chimes, 16(1): 9-10.
Sukumar, A. and Karpagagnapathy P. R., 1992. Pesticides induced atresia in ovary of a freshwater fish, Colisa lalia (Hamilton -Buchanan). Bull. Environ. Contam. Toxico., 48(3): 457-462.
Tak-Seng, Leong, 1987. Recent fish disease problems in south and southeast Asia and
31
their economic impacts. In: J. R. Arthur (Ed.). Fish Quarantjne and Fish Diseases in
South and Southeast Asia: 1986 update. Asian Fish. Soc. Spc. Pub!. I, 86 p. Asian Fisheries Society, Manila, Philippines.
Tripathi, S. D., Aravindakshan, P. K., Ayyappan,
S., Jena, J.K., Muduli, H. K., Suresh Chandra and Pani, K. c., 1994. A new high in carp polyculture: 15 tonnes per ha per year. Nat. Symp. Aquacrops. 16-18 November, 1994. Indian Fisheries Association, CIFE, Bombay.
Wan'er - Hansen, I., 1992. The right treatment for wastewater. Fish Farming International, 19(8): 36-37.
Woodwell, G. M., Wurster, c.F. and Isacson,
P. A., 1967. DDT residuces in an east coast
estuary: a case of biological concentration of a persistent insecticide. Science, 156:
821-824.

3 /
Packages of Practices for Sustainable, Ecofriendly Mariculture (Land-based Saline Aquaculture and Seafarming) M. Devaraj, V.K. Pillai, K.K. Appukuttan, C. Suseelan, V.S.R. Murty, P. Kaladharan, G. Sudhakara Rao, N.G.K. Pillai, N.N. Pillai, K. Balan, V. Chandrika, K.C. George and K.S. Sobhana
Cel/tml Maril/I' Fisheries I?eseo)"('h II/ stitllte,
Cochin · 14
I. r nUn IUI' \t<1I'1 , .... ,."'., . ........ ... , •• ~ , . , .. , " ....... ....... ..... ............. .. ......... , .... , ••• , .............. , " .......... ..... 13
Fish Supply and Demand , ... ..... .. , .... ,',., ' , ........ ....... .. , ... ,,, .... , ......... ..... , , .. ,.,., ...... .......... ,.;. , .... :1 3. Current Marine Fisheries Problems and Solutions .. ........ .... , ................... .. .. ........... ,. ........... 36
4. Status of Coastal Shrimp Aquaculture ....................... .................. .. ... .. ..... " ....... ....... ~ .......... 7
5.
6.
7.
R.
Present Status or Seafarming .. ............ " .... , .... .. .......... ,." .... " " ..... .... " ....... , .. ... " ......... , ...... .... 40
Opp l'lUll i tic,' t'orlnlancl Saline Aquacultw'c ..... ................ ........... .......... " ....... " ... ...... ...... ,.41
Diver~ irieation or Maricultul'e .... , .............. " ... , ........... .... .... ,., .. . , .... .......... " ... .... .. ,. , ....... ...... ll J , Package or Mariculture Practices ............. .... .................... , , .. .. ," .. ... .... .... , .. . , ...... .. r ...... . . ..... , .. 42
l) . Stock Enchanccment Programme ... .. , ... , .. " .... ..... ..... " .... , ... ... , .. ....... ,.,., .. , ... ..... ............ .... .... 63
10, COlldusiom; ................ .. " ,,'" ...... . "., ............ ........ ......... .. .... .... ,., ....... , ......... .... ....... .. ,. , ...... ... . 6~
Ref'crences
1. Introduction
The problems of fast growing human population and protein dcficit, particularly in thedeveloping countries, continue to exert pressure Oil the fisheries resources available 1'01' exploitation in the wild waterbodies. The increasingly limited opportunities in the capture fisheries sector have generated considerable interest in aquaculture. The potential of aquaculture in meeting the increasing demands for fishery products, generating income and profits and contributing to sustainable food supplies is considered to be quite significant.
AQUACULTURE AND THE ENVIRONMENT ISBN 81-85340·17-X
3
A recent report of the Consultative Group on International Agricultural Research stated that within the next 15 years, fish farming and scaranching might provide nearly 40% of all fish for the human diet and more than halfofthe value of the global fish catch. According to a report of the FAO, the world aquaculture production is likely to increase by 2.69 times by 2025, growing from 19.3 million tonnes in 1992 to 26.9 million tonnes in 2000 and to 51.8 million tonnes in 2025. Marine finfish production by farming is expected
Copy right © 1999 Asian Fisheries Society, Indian Branch All rights of reproduction in any form reserved

to increase from 0.36 to 1.0 million tonnes,
molluscs from 3.5 million tonnes to 8.9 million
tonnes and seaweeds from 5.4 million tonnes to
9 .8 million tonnes from 1992 to 2025. In India
the 1995 production from coastal mariculture
(mostly extensive to semiintensive systems of
shrimp farming) was reported to be around
85,000 tonnes from an area of O. 12 million ha.
The total mariculture production including
shrimps, bivalves and finfishes is expected to
increase to 2 million tonnes by the year 2025.
There is vast scope for the development of
aquaculture in many areas, particularly in the
tropics. However, the development of aquaculture
is being increasingly subject to a wide range of
environmental, resource and market constraInts
and scrutiny. The interaction of aquaculture with
the environment may result in significant
ecological changes. The expansion of aquaculture
in recent years has led to substantial socioeconomic
benefits. It is genenilly held that the majority of
aquaculture practices have had little adverse
effect on the ecosystems. Nevertheless, some
cases of environmental changes in coastal areas
have occurred due to, for example, intensive cage
culture operations in Europe and shrimp farming
practices in Southeast Asia, Latin America and
the east coast ofIndia. Aquaculture is competing
for land and water resources and, in some cases,
comes into contlicts with other resource users.
There is growing concern about the effects of
aquaculture operations and various types of
industrial, domestic and agricultural pollution on
the environment. In several cases, environmental
problems have resulted from conversion of wetland
habitats, nutrient and organic waste discharges,
introduction of exotic species, chemical usage,
and from the deterioration of water quality and
34
increasing acquisition of suitable sites by the
corporate sector for aquaculture.
The experiences gained from these issues have
emphasised the urgent need for the development
of sustainable aquaculture with due ecological
considerations. It is now widely experienced and
believed that diversification of the species base
of mariculture production systems (growouts) in
polyculture through a careful choice of species,
compatible among themselves, would minimise
the ill effects of monoculture systems.
2. Fish Supply and Demand
The proportion of fish eating people in India
increased from 27.7% in 1987-88 to 39.7% in
1996-97. Assuming that this proportion would
increase at least to 50%, the total fish eating
population in India by 2020 will be around 650
million. Considering the optimum per capita
nutritional requirement of fish of I 1 kg/year,
the total quantity of fish required for domestic
consumption by 2020 will be around 7.2 million
tonnes of which (at the present ratio of2.7 million
tonnes of marine fish production to 2.1 million
tonnes of inland fish production i.e., 56.2%
marine and 43.8% freshwater), 4.1 million tonnes
of fish has to be realised from the marine
fisheries sector and 3.1 million tonnes from
freshwater capture fisheries and aquaculture. The
projected marine products exports by 2020 A.D.
is 0.9 million tonnes, and hence, the total marine
fish production by 2020 A.D. has to be increased
to 5 million tonnes. The current total marine fish
production from the capture fisheries sector' (2.7
million tonnes) and the coastal shrimp aquaculture
sector (0.08 million tonnes) is 2.78 million
tonnes.

Table I. Marine fish production requirements of
India hy 2020 A.D.
Fishery resource potential Marine 3.9 million I Inlan,. 4.5 million I
TOlal X.4 million I
II. Fish production 1994-1)5 (Fif.:ures of Ministry of Agriculture)
Marine 2.69 mill.ionl (.'i6.2'1'r) Inhind 2.10 million t (43 .8% ) Total 4.79 million I
III. Human population amllish requirement :t. Expecled human popubtion hy 202() A.D. IJOO million
h. Exreeted tish eating populalion hy 202() 650 million
c. Per capita nUlritional requirement of fish II kg/yr
d. Estimaled requiremenl of fish lil!' 7.2111.1. domeslic consullirlion by 2020
IV . Marine fish production requirement a. Marine fish rroduction required by 2020 for
dOlliesl ic consumplion (56.2% of 7.2 millioll I) 4.1 nl.l
b. Marine fish rroduction required for exrorl by 2020 0.9 m.!
c. Presenl ex rort 0.3 m.t
d. Total requireme nt by 2020 5.0 m.t
e. Presenl pl'oduction by capture 2.7 nl.!
f. Presenl production by culture 0.081ll.t
g. Total 2.781ll.t
h. Additional quanlity required 2.221ll.t
V. Sources of marine fish by 2020 for domestic ami export markets
a. By conlinuing the current annual yield 2.7X Ill .t (Capture: 2.7: Culture: 0.(8)
h. From future capture lishcries heyond the 50 m depth (total frolll capture fisheries: 2.7 + 0.6 = J.3 x 106t) 0.60 llI .t
c. From future mariculturc (80% shrimps. 10% bivalves & 10% finfishes) 1.62111.1
Tolal 5.00 111.1
This assessment shows that the country h<.ls to
produce an additional 2.22 million tonnes of
manne fish (over and ahovc thc present
production of about 2.78 million tonnes) to mcct
the domestic (4.1 m .t) and export (0.9 n1.l)
requirements by 2020. However, the additional
scope from the marine fisheries sector is only III
the extent of another 0.6 million tonncs; i.c., a
total of ahout 3.3 million tonnes although the
estimated EEZ potential is ahout 4 million
tonnes. Mariculture in coastal shrimp farms is
expected to produce ahout 1.7 million tonncs
including 80% shrimps, 10% hivalves and I ()IY,
finfishes (Tahle I). However, the 10lal seaweed
culture potenti~11 alone is estimated to he over 4
million tonnes, which could be achieved in
phases of, say, 2 million lonnes hy 2020, i.c.,
25% of the global estimated produclion oj' a~1I
10 million tonnes by 2020 (Tahle 2). Besides.
low saline soil water sheds of aboul8.5 million ha
also offer good scope of sa line aquaCUlture
(Tahle 3).
It is possible that any shortfall in the production
from marine capture fisheries or mariculture
would be offset by commensurate production
from the freshwater sector. As against the
projected prociuction of3.lmillion tonnes of fish
from freshwater capture fisheries and aquaculture
by 2020, the production potential of this sector
is estimated to be 4 .5 millioll tonlles.
Table 2 . Aquaculture potential of seaweeds in India by 2020 AD
Resource Pcriod
(in tonncs) lO[)O 2tHI5 2010 20IS 2020
Agarophytcs gO.UOO :D5,00O 5.96.000 6 .. 'iO.OOO 7.0().O()O
Alginophytes 20.000 90.000 1.20.000 1'(,0.000 2.00.000
Carrageenophytcs 40.000 2.85.000 5.04.000 6.50.000 7.00.00D
Edible & Grecn Seaweeds 60.000 90.000 I.RO.OOO JAO.()OD 4.00.000
Total 2.00,000 8.00.000 14.00.000 18.00.000 20.00.0on
(Maximum potential: 4 million tOlllles)
35

Tablc 3. Mariculture potential in India (land-based saline aquaculture and seafarming)
SI. T.A.(ha) P.C.A.(ha) C.C.A.('Ila) CAP. No Million Million Million Tonnc
I. Coastal I and b;l~cd 2_~ 1.2 ll.11 850110 (shrimps)
., Hinterland saline ~..'i 100 ha 2f l soil aquifcroased (Haryana) (milklish.
mullels. pearlspol, shrimp &
giant prawn)
3. Scafarming i) Actual seafurming a) Open sea (EEZ) 202 1.8 2 ha 1.'\
(Inshore 0 to 50m deplh) (during 1996) (mussci) ol Bays, coves & gulfs 10700 ha Nil Nil c) Mainland brack- 2050 ha 5ha (,0
ishwater lakes & (CMFRI (edible estuarine moulhs &llVT) oysler; (Chilka. Pulicat. during Ashtamudi. Vetllbanad etc) 1996)
d) Inland lagoons & lakes 35000 ha Nil Nil ii) Stock enhancement
programme a) Searanching IS 18
(inshore (inshore) Nominal Nominal 01050m (shrimp. pearl oyster. depth) clams and scacucumbcr}
b) At1ificial tish habitat: Bottom artificial 1.8 50 Reefs 10 t during reefs (10% of inshore) Nov. 10 Mar. Floating \ish 1.11 150FADs (12'1., of aggregating devices (10% of inshore) tolal)
T.A. = Total area; P.C.A. = Potential cultivable area; C.C.A. = Current cultivated area; C.A.P. = Current annual production
3. Current Marine Fisheries Problems and Solutions
Marine fisheries in India are characterised by the
problems of stagnation in capture fisheries
production and too many hurdles to coastal
shrimp aquaculture during the current decade.
Environmental and socioeconomic management
of coastal aquaculture through the processes of
diversification of shrimp aquaculture and
seafarming is a challenging task. Coastal
aquaculture and seafarming are very diverse in
terms of the people involved, the resources used,
the farming practices followed, and the
36
environmental charactcristics of the existing and
potential sites. There are, however, opportunities
for greater expansion, adaptation and integration
in the onshore saline aquaculture sector (in
inland saline ecosystem and coastal lanel
ecosystem) and seafarming practices within the
totalmariculturedevclopment process . This could
be achieved by progressivcly :
a. Expanding and diversifying coastal shrimp
aquaculture to include othercompatible candidate
species .
b. Expanding inland saline aquaculture from the
present experimental activities in Hariyana to all

the States in phases (the total hinterland saline
area is about 8.5 million hal
c. Seeking to integrate small scale seafarming
with the seafishing practices
d. Undertaking marine fisheries habitat
enhancement through the construction of artificial
reefs (AF's) and fish aggregating devices (FAD's)
and searanching of premium stocks like shrimps,
lobsters, crabs, groupers, mussels, pearl oysters
etc, for the benefit of the coastal and hinterland
communities and the industry (Table 3)
The implementation of these programmes
would make it necessary to consider allocation
of exclusive fishing and farming sites to the users
over their respective areas of operation and also
the protection of the standing stocks against the
polluting effects of chemical-based industries.
4. Status of Coastal Shrimp Aquaculture
Coastal shrimp hatcheries and growouts have
come up all along the Indian coast (Figs I to 4).
Cultured shrimp (penaeids) production increased
steadily from t990-91 to the peak of about 90,000
tonnes during 1992-93 but declined to the current
(1995- 96) 70,573 tonnes from an area of 0.12
million ha due to problems of diseases which
struck the hatcheries. and farms in the late 1994.
With better farming practices, the production
during 1996- 97 is expected to cross 100,000
tonnes. The current shrimp aquaculture situation
could be characterised as follows:
a) Unfounded fears about the growth of shrimp
farms along the Indian coast, and unnecessary
hurdles to their sustained growth
b) Inadequate handling of the farm effluents till
late 1994, but proper treatment and usc
subsequently
c) Extensive to improved extensive system of
farming by small farmers «5 hal is predominant
(over 80%) while semiintensive to intensive
37
, I ~
system of farming by big farmers is carried out
in only less than 20',Yr, of the cultivated area.
d) Clandestine import of shrimp seedlings from
some Southeast Asian countries during 1992-93
due to heavy seed deficit, paving the way for the
establishment of over 170 hatcheries with 8 billion
seed capacity (Fig. 4).
e) Occasional substandard consignments 01'
imported feeds resulting in environmental and
disease problems, and a serious, but temporary
setback to the industry, especially along the cast
coast; establishment of CP feed mill at Red Hills,
Madras (Chennai) and Higashimaru feed mill at
Shertala, Cochin (Kochi) has reduced the need
for import of feeds.
The problems outlined above arc now being
managed by the industry (small as well as large
farms) through the adoption of:
a) Closed systems of farming 111 the growout
farms involving the application of benovolent
bacterial products.
b) Secondary aquaculture practices in the
reservoirs, Qrain canals and bioponds.
c) Indigenisation of seed and feed production in
commercial terms. The candidate species now
being sought after for secondary aquaculture
inClude the seabass,grey mullets, milk fish,
groupers, breams, red snappers, seacLlcumbers,
pearl oyster, Clams, edible oysters, mussels and
seaweeds.
Seeel production technology for the commercial
shrimp species such as P. indicus, P. monoc/o/l,
P. semisulcatus, P. Inerguiensis and P.japoniclIs
were developed way back in 1985 at the Narakkal
(Kochi) Field Mariculture Centre of the CMFRI.
Based on this technology one hatchery at Mopla
Bay (Kerala) for P. indicus (I Omillioll capacity)
was established and commissioned during

.0 35 30 25 OlO l& 10
A- t4100; P-t2000 s:~ P. lft ~le:II'
P. monodon
Scylla IPP.
A- Eilimated area (ha) p- Annuat production (tonnes) S- Species
A- 15500 P-12800 S- P. monodon
A- 34500 : P- 26000
S - P. monodon Scylla IPP.
A- 2000,P-3000
P. indicul Scylla IPP.
BAY OF BENGAL
ANDAMAN e. NICOBAR ISu..DS
:.L-________ ~-----------LI ~----------~----------~_._----------L_.~--------~ '10" t .". .110' Ill' 10' u · ., L-__________ ~ ____________________ ~ __________________________________ _
Fig. I.
'OOOlla
Cultivated areas and annual production {)f crustaceans in different maritime states of India (1994-95)
30
25
20
I 5
10
~ O~-LrL~~~~-LrL~~~J
~
O~-L~~J.,.~~~~~-L~,-' WB OR AP TN PON KL KA GOA MH GW (~)(51.1I1!50l\lI8)(O ·8 1185 (81 (18'5)(110)(5761
Actual area a\.olloble "'own i'ltraclllU
Fig. 2. Area currently under shrimp farming in different states
Fig. 3.
8
Culturaled shrimp production in di fferent states

• ZII
20
cliiFJlI TOT'~
I c IIoplo Soy hGtch"yof
10 . 10'" .cop·1990
"'t ..... ----..:::-..
IOI .F"' ___ ~
~ Cll'~1
10' :t:r::,'y ~ llchnoloOy·1985
~ '~+:::;CM;F~R~I ~M;ah;:lm~.'------' • "~&'f~~~dl~~~':n"'.~y
Qrovpt-.dbout 20011 y.ar
+ RIII\tI., 1,"1"'0 10 farm.,. andlralntr.
"'0" Total No. Ca~aclty, mill.
Andhro Prad.th 143 .410, In hatchtry and orowout Tomllnadlol I~ 140
""It,. ~ 490 MahClrolhtra I to
+ Dlv.lopment of mh:robtal prodvctl,Of" bla remedial and problotlcs
OuJaral lO' ICl!lln".l. t ItO K.rala • 11 0
To,
eo' .5"
Fig, 4. Shrimp hatcheries and CMFRI's contributions
January-March, 1990. Another shrimp hatchery
for P. monodon (40 million capacity) had been
established at Chirala, Andhra Pradesh under
CMFRI consultancy. This hatchery was
commissioned in March 1995 and 5.2 million
seed (PL 20) was produced in three runs (FigA).
However, it was only with the establishment of
two public sector commercial hatcheries, one each in Andhra Pradesh and Orissa by the Marine
Products Export Development Authority using
imported technologies, private sector hatcheries
began to be established on a large scale.
Most of the formulated feeds used in India are
imported ones and cost above Rs. 60/kg, which
is beyond the reach of the small farmers. The
Mahima shrimp feed developed by the CMFRI is
9
a low cost indigenous formula involving a simple
technology, which is suitable for production in
the farm site itself. The cost of the feed is Rs 30 per kg (half the cost of imported feeds), and its
FCR of 1.5 : I equiva1cntto that of the imported
feeds, and is both farmer friendly and ecofriendly.
Protein rich shrimp diets result in high nitrogen
and phosphorus inputs into the effluents. Therefore, intensive shrimp farms currently tend
to use feed in which the lipid level is increased from 8,5% to 13.5%, carbohydrate from 28,5% to 48.8%, and the protein level reduced from
40% to 20%. The use of such low-protein, high
Iipid- high-carbohydrate, low-pollution shrimp
diets coupled with increased aeration and
probiotics in intensive shrimp farms has been
found to be quite profitable and totally free from

disease problems. Aeration and probiotics speed up aerobic decomposition of organic wastes and enrich the detrital rood chain in shrimp ponds . There is also a tendancy to incorporate in shrimp feeds glucans which stimulate unspecified immune reaction in shrinlp against a wide range of diseases (New, 1996).
h.-i mp Aquacultu re vis-a-ll; Coa btl It g ulation .zone (CRZ ) R ule ' nd Regulations: he aquaculture pol cy recently
declined by Ihe lovI,}11imenl f' IndiH (Ministry t' Agricullmc, r 992) ensures protection of the
con ta l cl1virolllncnl. h poli Y gives exlcn iYe guideline on h)w t11 COD· I' l l environmel I Imuld be protec ted Irom po sihle po tl ulion o r
"lller dan llg S 'Oil.<;cquenl n Ih setting up of
aquaculture farms. While the CRZ rules prohibit any type of construction within theSOOm landward from the HTL (High Tide Line), the aquaculture policy demands ensuring sea front as a c-andiiion 1'01' t;:lI"ti n,g; a arm, which cenai r,ry involves con lructJnn. inc hatcheries am permilled lli thin the Cl~Z, il i only logical thaL :.quacull'llfc i 81, 0 reg Irded fI!' a permIssible ac tivity whhin the CRZ, bUI Wilh appropriat provo rons 1'01' fAll nt treatment lluJ reuse OJ' control lIleas.ur on which Inc aquaculture poli y pronounced hy lhe Governmenl ot'lndla is <lls(:1 quite eloquent. Ttl ' r levonL exirac ts froll~
fhe concerned Acts, Rules find NoLiriC81iOl'ls Ii U1!eu below .c., The N lineatiun t1:lIed the
19th Fehru31'Y, 1991 fJ'ameJ under clioIl 3(1) Hnd 3(2)( ) (I thelilvimnmenl ( rolccllon) Acl 1986 nd Rule5(3)d ofEnvil'Otlme[li (Protection) Rulc',1986. D clarilll? co taistrclch a Coas~aJ
.Regu I alion Zone (O<Z) and Regula.1 i I1g Acti v hies in the CRZ).
a) The 1991 Notification imposes restrictions on
industries, o POr1l tiOI1$ llnrt PI'()CC.'lSf~S ,n the CRZ,
de1ined as the land between the low tide line (LTL) and the high tide line (HTL).
b) Under 2- (iii) of 111 1991 N lification 'euing
40
up and expansion of fish processing units incht ling w<1r~house are prohibited. This restriction seems too harsh and unreasonable
c) Hatcheries, which inevitably require a
waterfront are permissible
d) Para 3 ( I ) prel cri be", dC1:1I'LHICe 0 (;{!l'hU Il 8.c liv.ilie:; within the CRZ. Ical'flllc~ sball he
given for allY nClivi iy wlthin til RZ only if fI req .lres wa terfront ::In o l'e. hme UCllvi t tl:~,
his iml lies rhcLt if the clearance i ubtailltd rom Ihe Mitlj~u')' of Ellvi.I'Oml'enl i1( un~ulturc
arm,\, 'arl be sC I up. Huwev ,' re..'\lrlc~icm.-
I res filled tlndc rJ'ol:lihIlcd uCli .... ilic. such w, cons truction, land r -d :mullion Clc . impOSt: unreasonable burden on the part of the fanners who inevitably require waterfront for the construction and operation of farms .
e) In category III of the CRZ between 200 III to 500 m, agriculture, horticulture, salt manufacture etc are permitted; aquaculture (aquatic agriculture)
i obviously impli I within agric lii ture n, .I
perm is ' lblc <lClivily: cOIl~u'ucti()11 {)f hot' lsl beach res<J11s IS OIl. 0 nllowc I wilh prior approvHI , ill I.hi .. zone. The Aljtm 'lIllurc (Regulation) Ac! 19950flhc txll or Tamil Na ! permi !i IlquHcllltu.rc a livily Witl1 itl the 500 m lOne, a.lll iL with some cnvir I1IllCIl\UIIi<1fcgullrds. Moreovc, i[ 'hOllld be cmph Isil>'ed Ihal 1111; pruscnl c a tal : hl·.imp fa rming u:ctj itie,,, UJ'
restricted only [0 tile . u l t-!l fr\;;ctj.x~ c~~asla! [iil::'as totalling 2.07 million ha (Table 6), which would otherwise remain only fallow. With the
inlrooucli It t' shrimp fU'll1 i ng, beside!; l.ltili l.jl1~
these fallow lands, considerable prosperity has been created in the rural coastal sector.
5. Present Status of Seafarming
here is IlO COnlmel' ial seafml1~ir!g aCli vity In
India at present. However, in order to promote seafarming, the CMFRI has established during
1995 a total of eleven eXI elimcnUll !>Cl1t~trms , one each at:
•
,.

(I) Andhakaranazhi near Cochill for mussel
and pearl culture
(2) Dalavapuram near Quilon for edible
oyster culture
(3 Adimalathura ncarThiruvananthapuram for
mussel and pearl culture
(4) Tuticorin for pearl culture
(5) Tuticorin for edible oyster culture
(6) Mandapam for mussel and pearl culture
(7) Madras (Ennore) for mussel culture
(8 ) Dhm'madam near Calicut for edible
oyster and mussel culture
(9 Padanna near Calicut for edible oyster and
mussel culture
( 10) Mangalore for mussel culture
(II) Karwar for mussel culture
The seafarm (longline system) of 400 m2 at
Adimalathura has been installed over an artificial
reef at a depth of25 m. The results of these farms
are quite encouraging and are dealt with in the
subsequent sections. It should, however, be
mentioned here that consequent on the
establishment of these demonstration farms by
the CMFRI, over 20 mussel and edible oyster
fanns have been established in late 1996 in the northern Kerala backwaters, estuaries and
closeshore bays under financial support from
IRDP- TRYSEM, and these farms are expected to
be harvested in April-May 1997. Similar is the
case with the Ashtamudi backwaters near Quilon
where over a dozen edible oyster farms would
come to the first harvest in January-February
1997 and the second harvest in May 1997.
6. Opportunities for Inland Saline Aquaculture
Results of the culture of marine fish and prawns
in the saline soil ecosystems in Haryana (Tables
4 & 5) conducted by the Central Institute of
41
Fisheries Education (CIFE), Bombay have indicated great potential forsalineaquaculture in
all the hintcrland saline ecosystems which are estimated to be about 8.5 million ha (Table 6).
I
Saline-alkali soils occurring in arid and semiarid
areas in India are considered to be unfit for
agriculture as the soluble salts area great limiting
factor. Special attempts have been made to utilise
these lands for the culture of marine fish and prawns by tapping the ground saline aquifer
through tubewells.
7. Diversification of Mariculture
Depending on the geographical and ecological
diversities, there are vast differences in the
availability and suitability of areas which can be
developed for rnariculture (land-based saline
aquaculture and seafarming) and also in the
candidate species available for cultivation.
While the shrimps and the finfish (grey mullets,
milkfish, pearlspot, seabass, groupers, red
snapper, breams and pompanos) are suitable for
fanning along the entire Indian coast (particularly
along the southwest and southeast coasts), the
other items could be cultured along narrow
geographical ranges; e.g., the seacucumber along
the coasts of Tamil Nadu and Lakshadweep;
pearl oyster along the coasts of Tamil Nadu
(Gulf of Mannar & Palk Bay), Kerala, Gujarat,
Lakshadweep & Andaman Islands; edible oyster
in Andhra, Tamil Nadu, Kerala, Karnataka and
Table 4. Physicochemical properties of water in
the Sultanpur (Haryana) saline aquaculture farm
during 1984-85
Salinity 6.0 to 15.6 ppt
D.O 6.35 to 8.7 mg/l
CO~ 2.5 to 4.1 mg/l
pH 7.3;; 108.'35
Temperature 5.8 to 36.8°C
Total alkalinity 90 to 117 mg/l
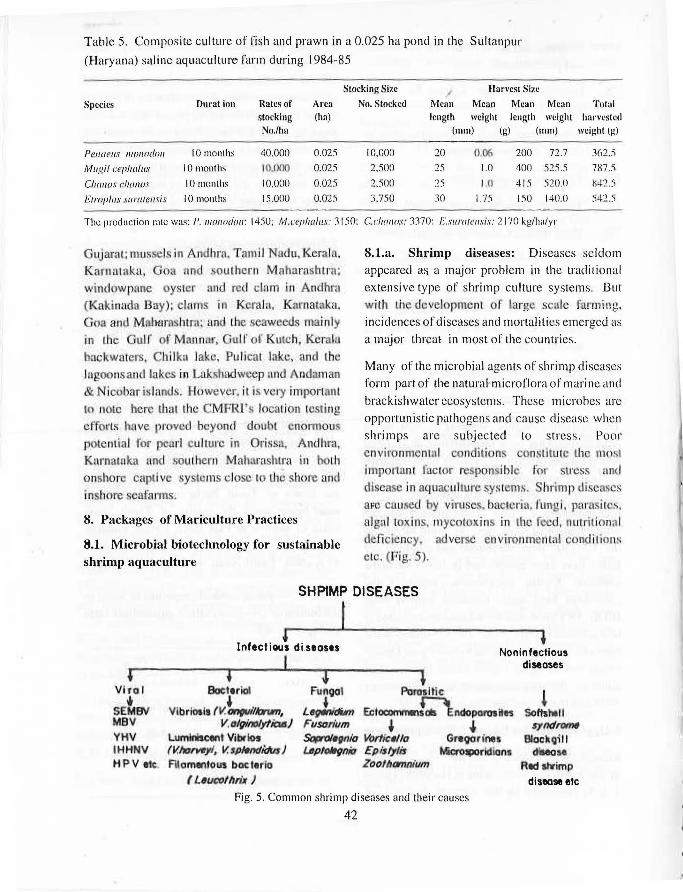
Table 5. Composite culture of fish and prawn in a 0.025 ha pond in the Sultanpur
(Haryana) saline aquaculture farm dlll'ing 1984-85
Stocking Size Harvest Size
Species Durat ion Ratcs of Area No. Stocked Mcnn Mean Mean Mean Total stocking (hn) length weight length weight harvested No.lha (mm) (g) (mm) weight (g)
Pello r! lfs Jl}0110dfJII 10 months 40.000 0.025 10,000 20 0,06 200 72.7 362.5
MlIgi/ce"lw/II.\· 10 months IO,lN1(l 0.025 2.500 25 1.0 400 525.5 7X7.5
C/WI/OS d llIllOS 10 months 10.000 0.025 2.500 25 U 41.'i 520.0 X42.5
E/mp/lts sltl'lllellSis 10 months 15.000 0.025 3.750 30 1.75 l.'i() 140.0 542.5
The production rate was; I', I//OI/odol/ ; 1450; lvI.rep/llI/lIs: 3150; c.('/wI/(}s: 3370: Esltl'lllfm;s: 2170 kg/ha/yr
Ou' ami; mLissel in Andhr<t. Tamil Nadu, Kerala. Kal'tltll.lku, Goa and southern Mahnrusb I < ~
wind{)wp<llle oystc and J' cI c1nm in Andhl CKakimld.a Bay ; clam in Kerahl. Karnataka. Goa and Mahurashtm: and th eaweeds mal Illy in the Gul of MaIlnaf, GLll f of KULCh. KCl'n ~a
ba 'KW lers, Chilk<l lake, Pulical lake, alld (he lagoonsancl lnkes il l Lnklihooweep mal Andaman & Nicol1ar i lands. flow vcr, it is vel)' important 10 nole here lh!\t th(;" CMFRl's localj 11 tcsling efforts have proved hcyoncl dout l normull
pot nli.al fOf peur' uhur' in Oris. a. Andhm K"rn.atak,a an I sou tnem Mahamslufa In b til oosho cup,ive .5-Y -lelllS d o -c I the shore and in bore seUral1n.~ .
8. Packages of Mariculture Practices
8.1. Microbial biotechnology for sustainable shrimp aquaculture
8.1.a. Shrimp diseases: Diseases seldom
appeared a~ a major problem in the traditional
extensive type of shrimp culture systems. But will In development of large scale Fa!"!ni'ng. incidences of diseases and mortalities emerged as
a major threaf in most of the countries.
Many of the microbial agents of shrimp diseases
form part of the natural micro flora of marine and
brackishwater ecosystems. These III icrobes are
opportunistic pathogens and cause disease when
shrimps are subjected to s tress. Poor
en vi 1'011 me tH111 conditions conslltule the rl1f I irnpol'tmJ! uclOr resl>on iblc 1'01 sll·es. an I dJscllSc in aquat:ultun:. ' )ls t ms._ hrimp (l ise!lSc~
IU·'t) cauwd by \linl. el. buctcriH. fungi, p:.l 1'1lsil · s. algal tQx ins. mycotollins in the fe\!.d, nutrit ICIIHl i d~fick:nc;y, adverse envir nmel'lwl conditions etc. (Vi g. 5 .
SHP1MP DISEASES
, Vi r al .. SEMSV M8\1 'tHV IHHNV HPV ~~.
, Infectious disee)!tI
Bott,rial
Vlb t lOll1 (V.~.tnm,
I
V. blglMlylicusJ LutnlniIcent Vibrlot IlI.hanM,Jt II. 1jtJtln(/idu$)
Fllc.rMntous boc ,,,10 (LlIur;ofh~ )
l
Fig. 5. Common shrimp diseases and their causes
42
, Noninfectious
diseases
~ 50&"11
SInd''''''' Bl'aakoill
ctiMOH Reel slwimp
disease etc
..

Table 6. Salt-affected soils in Inclia (area in '000 hal
S'jnh ." COlIstal Hinterland Total
Alldhra 21G3 ~3().O 813.3
Bihar 400.0 400.0
Gujarat lH2,;l 912 ,1 1214.4
Haryann 4550 455.0
Karnataka R(.,O 31 R.O 404.0
Kerala 26.0 26.0
Madhyaprntlcsh 2420 242.0
Mahnrashtra & Goa SS .O 446.0 534.0
Orissa 400.0 400.0
Punjab 519.5 519.5
Rajasthan 1122.0 1122.0
Tamil Naclu R3.5 256.5 340.0
Uttar Pradesh 11,),1 U 1295.0
West Bengal KOtHl Rrl{l,()
Total 2069.1 6496.1 8565.2
(i) Viral diseases: Someofthe important viruses
known to affect P. monodon are: Monodon . baculovirus (MBV), systemic ectodermal and
mesodermal baculovirus (SEMBV), yellowheacl
virus, infectious hypodermal hematopoietic
necrosis virus (IHHNV), hepatopancrcatic
parvo-like virus (HPV), lymphoid organ parvo
like virus (LOPV), type C baculovirus, baculovirus
penae, reo- like viruses etc. Among these
viruses, the whitespot disease causing virus, i.e.,
SEMBV caused severe economic losses in
Japan, China, Thailand, Indonesia and India. In
India, the disease was first noticed towards the
end of 1994 along the east coast. The disease
spread very rapidly to lhe other parts ofthe country
and by 1995 almost all maritime states where
shrimp culture was being carried out were
affected by this disease. Apart ti'om a number
of shrimp species, this virus has been reportcd
to affect other crustaceans including crabs and
barnacles.
In the case of viral diseases , chemotherapy is
not effective once the disease has set in because
viruses are intracellular pathogens and any
chemicals affecting viruses will affect the host
tissue also. Hence, prevention of the disease is the
most important strategy. The methods of
43
prevention include stocking of healthy larvae
maintence of good water quality and pond
condition - disinfection by liming, chlorination.
halogen treatment, use of iodophores, reservoir
concepts etc. prevention of entry of carriers
improving the disease resistance of the host
using immunostimulants
(ii) Bacterial diseases: Vihrio spp are the most
common among the various bacterial agents
known to cause problems in shrimp
culture . These bacteria are the predominant flora
of the marine environment and several
species sllch as ValgillolyticlI.I', V.parahaclIIolyticlI.\·, V. VUIIl(ficlI.I' ctc. have been
involved in shrimp mortalities. Luminiscent
vibrios, V.lwrveyi and V.splendidus cause severe
Illortalities in hatcheries. The filamentous bacteria
such as Leucothrix may be found as
ectocolllmensais and may cause mOrlali ty due to
hypoxia and impairment of moulting.
(iii) Fungal diseases: Among the fungal pathogens
of shrimp, Legenidiul1l is the Illost prevalent in
larval and early postlarval stages. Morlal ity Illay
reach 100%. Fusa rilll1l , Saprolegllia, Leptolegnio etc. are the other fungal pathogens of shrimps.
(iv) Parasitic diseases: Ectocollllllensnis such
as Epistylis, Vorticella and Zoot/wmniul1l attach
on the eyes, gills, appendages and body surfaces
causing respiratory and locomotory ditliculties.
Endoparasites such as the gregarines and the
microsporidians Illay cause mortalities.
(v) Non-infectious diseases:
(a) Chronic softshell syndroll1e - due to nutritional
and environmental factors
(b) Red shrimp disease - due to the presence of
aflatoxins in feed, poor water quality e tc.
(c) Blackgilldisease - duetothepresenceof[oxic
substances in water, organic loading etc.
(d) Dull hardshell disease - due to excessive
calcium and phosphorus mobilisation as a result
of overfeeding

Most of the disease control methods are based on
preventive measures . They are:
i use of healthy postlarvae for stocking
(ii) quarentine measures
(iii) use of adequate balanced diet
(iv) use of genetically resistant stock
(v) use of immunostimulants
(vi) chemotherapy (chemicals and antibiotics
must be used with utmost caution to minimise
the dnllgcr ofresid\J I one I.~ and development or antibiotic resistant strains)
8.1.b. Biotechnological tools for disease problems: Disease problems in aquaculture can
be controlled with the application of variolls
biotechn logic .i methods. The four crilical areas where microbiological and bioLechtrolo ricnl , pproaches have impacted or will signilicantly
impact aquaculture are development of tools for e/lvironmen l~1 management including the use of
probiotius and hioi'cmediation. development of sensitive, rapid and inexpensive diagnostic tools,
development of vaccines against bacterial, viral
and rarasitic p \.hogens, development of toni for
the nonspecific enhancement of immunity
(immunostimulants).
Thc workhonie ofblotcchnulo!"yanHhcmicrobc • and today, they seem to provide many solutions
to manmade prob.lems, Blott-"Chllologicar, answers are emerging rapidly not only for
detoxifying the environment through
bioremediations, bulal " to cnhanc our nalu al resource utilisation by bioconversion and
application of probiotics . The four major categories of biotechnologi_ ll! Ilpplications
involved in solving environmental problems
include: environmental monitoring
bioremediation, ecoprotection .
(i:) EQvil"Ollmcntal ill nit ring.; eady 8()% of sh imp {lisci1~es un:. ctlused by -Ul'CSS induced by environmcntnJ nelms. Bioinditator (such ss th ' Daphnia al1d trout!; in freshwater sy lems could
be used as indicatorsofpollution. Dlli bioindicah J'S 81-C diff icult to malnlnin m; th 'y 011 extremely
sensitive. Hence, si ngle ell. or ,Ill organism un; used as biosensors. Toxins that allec[ the
met bo l i~ln r microorganisms also affect their
respiration. Production of carbondioxide leads to measurable pH changes. Rodtox is a
biosensor de el' }pct! in Japull 1"01' Inea~UI'i l\g Lhe
biological oxygen demHnd(BOD) which indicates
the increased oxygen use by organism~ or the
tox ins based on the inhibition of rospiration.
GBT Tox Alarm is a biosensor from Germany,
which can detect even 0.1 ppm of yunidc. ln lhe US. the luc fCr<lce cnzyme from til lrefly is u 'cd a <l hi . ell. fir . It delecl.<; hmDcellulm' levcls of A l'P, the en rgy in licalOl' (f ri, lng
rganisms. However, thesc setH; I'll could he llSCU ollly to III nil II' th cl"lvimnment in ba l 'he . • l.lllJ
not in a continlJOlls mode,
(ii) Bioremediation and e OPI-O diu":
Detection loe~ nol I aUlo clJJu.. l-!ence. c mplctl w lhlhc t]lie { f bioscn. or , nior mqdiat on ha~ 10 he rest)ncd to, using mi wlcs 01 m'll I catalYlic clfpnhlliti~, _ Bioremediatioll steps
include: (I th selection of mi 1'Ool'ganisms possessing specific ability to detoxify
unfavourable chemicals, (2) development or
enzymes and proteins that can catalytically
convert these wastes, and (3) bioprocess
technology to harness these abilities.
Pseudomonas train detoxify throu.,h a lIumhcl'
of enzymatic steps encoded by genes contained
in ihcirmegapla. mids. Some [I',tills a1'o produce
enzyme. thal can 111' 'akdown Lhe nill'OgenoLls
compounds to ammonia and carbondiox ide ralhcr
than to some other byproducts. Specific,
nonpathogenic, pigmented, spore-forming
bac tc.ri al pecies of lJacil/us isu late 1 f'r III
sediments ofPokkali ponds at Narakkal (Cochin)
, Me found 10 Inhibit !he growLh 0 pathogenJ . ba.ctcri.. like Vibrio anguiilanmr, AemmJll'u:rs and EsdwddLill coli hy compelil ive grow th u r
by p!'O(luciog antugonislrc anLibi Li c",
44

•
Table 7. Species of Bacillus of probiotic value
Species
I. /Jacil/us cerells 1II)'("oid".\·
(Bacil/us suiJ/ilis group)
2- Bacillus lIIel'lIll'rilllll
(/Jw:illus sub/ilis group)
J . n{/(:ilh{.\· flll{cosi.\·
4 , n{/(:il/lls agglfllllem/{{s
:i. n{/(:il/lts ClIr/ilagi,IlJII.\·
(;. /J(fcillus idll,l'lts
"I noc:ilills illfrieatus
Characteristics )
Colonies over the surface with curving tllaments radiating out from the central growth. feathery nppcarancc; growth Illay be dry. gummy. moist white, greyish white . yellowish. brown or black Colonies smooth white butyrus. shiny. rod shaped Gram-positivc
Colonies mucoid, semi-transpnrent, rcslllbling drops of paste Colonies slllall, round, greyish Colonies thick. round & compact. and could he lifted from the agar entirely Colonies dry lustrelcss and laminateci. tinciy wrinkled Colonies widespread. whitish. tlat. mycelium -like ingrowth into the agar, containing filaments with numerous scpW.
Colonies of spore-forms of Bacillus of probiotic
value, most often observed in the aquatic
environments, have been identified to be the 7
species shown in Table 7. All of them can be
mass cultured and used as probiotics in their
logarithmic phase when their enzyme potential
is maximum. They exhibit antagonism towards
other heterotrophs, and hence, could be
successfully used as probiotics to control microbial
diseases in aquaculture ponds. As they are highly
proteolytic, they easily mineralise the faecal
matter and left-over feed putrified by other
heterotrophs. By active mineralisation the pond
environment is made clear. Bacillus can act as a
host defence barrier by making the target
epithelial cells unavailable to pathogens through
competitive exclusion. The antibiotics produced
by these seven spccies are environment friendly .
The Bacillus strains are biodegradable after their
activity. The most effective mode of action of
Bacillus is now known to be by
immunostimulation.
The performance of Bacillus is influenced by the
inoculum level, species of shrimp or other
organisms tested, stage of maturity, level of
stress and quality of the rearing pond
environment. Because of this wiele spectrum of
variables, there is a broad range of response to
probiotics and the plethora of positive responses
span a wide range of experimental protocols.
According to Moriarty (1996), microbial
ecology and biotechnologies have advanced 10
the point that commercial products ancl
Table 8. Commercial probiotic products and immunostimulants lIsed by the aquaculture industry
l'robiotics
I, DMS 1000 series
2. Synerhac J . Wunnpuo-15 1\, Rioslan 'M Bio-brews .~ . Aqua baCIa aid products
6. Aquakalgon+
7. Aqua buck UJl 8. SpecrM bac 9. Il11l11ustilll (purified Beta
1.3-D-glucan) 10. Aquastim
Manllfncturers/conntry
ARDA-TEK Australia
-.do· Team Aqua Corpo-ration, Thailand USA Water Quality Sciences Intcrnalionallnc .. USA Wockhardt Ltd (India) in collahoration with Techniqucs et Biochimie Appliques (TBA). Paris. Ecolllax India Proposed by CMFRI imlllu Dyne Inc. USA
College of Fisheries. Mangalorc, India
45
I'ricc(Rs)
• ,000
-uQ 6 .. UOU ;\,O()U
5,000 5.000
Quantit)·
5 litrcs
-do-25 kg
51itres
5 kg 5 kg

Nutrient cyclini in the water column and pond PVUOID accelermed by the !!ddition of prohioti<; llrQ\I!lCI,~
SJJ[!lIW rollIn'!: ~
Ilvobiolie prodoo J.
R '1111\1" Ac,el~mted ~ . pl'Ulclf1~ su~\Idi!d dec~npo 'iIiQIl! • pol,\'\lOCd }
-4 Auulloniu ~. MlCrobi.1 4 I IlPl~~ ~ Fllvmltllb'~ rklc,~ Nilnl reltluvnloI Willet pl nl; tOil
m \\litter IIl1Jlsfonll!)fl Otl . lrJ1iUs . H;>\) lo~ ic 101. ~t~ IlI.I;II\I f.lit1l:lltl:'lion \l!h~ I' foxi . L w IlrIttielilY ilnd shlim\l rnellll!oll{Cli . Mltituqiru pH I!ltl\\'th
------+-10 Accelerated
blll;lllC1!
/ Settle to pond bottom r decomposition/ ~
Problot(c proll(ICI transformation .protein }~ Ammollia ~.Mlcrobial~ ImplOvcd .polysacohari(les Nlllitc removal of ponti .lIpids H,S tOXIC wastes bottom
other toxic metabolilcs
Fig. 6. Nutrien t cycl ng in the wafer colUfl1ll l'ltld pOI d boUonl Bcce.leralcd by the addi~on of probiQlic- pruduc;l~
technologies are avaHahlc for Irc~ting large .. rea. o water and land to enhanocpopull:lo011 densities of particular microbial specie: or bi chetn ica! activit !>, 1'h nac le.rill lhat arc added mus t be sdecled for specific function {hal \lfe umenahlc to bioremediati oll and udded at it high enough p pulal lon den it)' nnd onder the right environmental cond!11cr:!; . 1 he efficacy of
bioremediation and probiotics depends on the
nature of competition between species or strains
of bacte.ri~. A normal shrimp culture pond has
many diffel cnl types c , iI'tlc(oorganisms. The
most numerous types are those that are very
efficient at reproducing themselves. These types
make use of the detritus that accumulate on the
pond bottom and rapidly build up their biomass
by growing and replicating themselves . But, what
is desired is a major reduction in the detritus
without the growth of biomass. In otherwords, the
types of bacteri a chat we want in the sy tem are
those that are less efticient a[ reproducing
themselves, but are highly efticient at reducing
the amount of detritus in the pond (Fig. 6). A
variety of p robiOlic produc ts are commerciall y
available and are used by the aquaculture
46
industry for environmental management
(Table 8).
(iii) Immunostimulants: Most of the
immul10stitnulamsuscd are of fungal or bacteriai
origin (viz., B I, 3-glucan derived from fungal or
yeast cell wall; Iipopolysaccharides ancl
peptidoglycan derived from bacterial cell wall).
These compounds stimulate the nonspecific defencesy !cOl inlhccl'll taceans by theac Livmi n of lhe prophenol oxid!l~'e system (resulLing ill the
production of melanin at the site of infection
which possesse anlimi rohial properties),
stimulation of phagocytosis and encapsulalion.
However,lheef Icac;yot' thexc immUnO!,limul"nts against viral infections still needs further
investigations.
hnmll lim is an imm U!l{uimulaiii devciope'd by
Immu Dyne Inc., USA, for shrimps and
marketed worldwide . The College of Fisheries,
Mangalore has developed a similar product
called aquastim which has becn ue sfu.tly
applid in commercial farms (Dr. I Kanmasng<l 1". pe ' -'ounl c:oll1munica(iotl)rAs the irlllllune ystern ill hrimps S I'ather weak, weekly "pplical! Ii f quastim is necessary . 'j

Table 9. Economic profile of trade in pearls in India and transfer of technJllogy by CMFRI
_ India's total pearl production
- Country's imports annually _ Production target by pcarl culture in India
Japan 's pearl production - China's pearl production - USA 's pearl production - World production
20 kg SPIC TNFDC Pancharatna 13 kg 2 kg 5 kg
725 kg, worth Rs. 290 milli on IOO(J kg. worth Rs.500 million 63 .375 kg: marine 199.500 kg freshwater 9.375 kg marine 276.6 t ( 199.5 t freshwater: 77.1 t marine)
Table 10. Development of pearl culture technology in India by the CMFRI
I. First pearl production in India II First hatchery production of pearl oyster in India III . Developmcnt of land-based pearl culture technology
IV. Successful location testing for site selection for pearl production
V. Number of pearls produced by CMFRI through an investment of Rs. 8.1 (J.500 at Tuticorin
Number of pearls sold
VI. Technology transfer experiments at Valinokkam. Gulf of MannaI' Tota l expenditure Total pearls produced Pearls given to farmers as wages Balance pearls sold Revenue earned
VII. Establishmcnt of Tamil Nadu Pearls Ltd. Duration Total expenditurc Pearls produced Pearls sold
VIII. Sponsored projects for pearl culture I. Donor
Year of allocatioll Amount Locat ion
2. I)onor Year of allocatioll Amount Period of operation Location
3. Donor Project Period of operation Amount
Ycur Location & Results
July. 1973 August,1981 1995
Tuticorin. Gulf of MannaI' Tuticorin. molluscanshclillshhatchcry Kakinada. VisakhapatlJalll. Madras & Mandapam
Vizhinjam Bay, Kurala Mandapam. Tamilnadu Lakshudweep Gujarat
1976 1985 1986 1987 I 94 Calicut, Andhakaranazhi (Cochin)
No. of pearl oysters harvested
1973-1978 1978-1983 1983-1988 1988-1995 1995 -1996 1994 -1996
00.'> 76H
3576 6365 7583 1173
(180.72 g) for Rs. 1,28,668
1-7- 1991 to 11-8-1992 Rs. 36.312 1.849
5..0 1,599 Rs. 73, 1:14
4 years , Rs. 6.9 million
IJkg 4 kg for Rs. 0.782 million
Depattment of Ocean Developmcnt 1995 Rs. 2.5 million Mandapam Camp ICAR 1996 Rs. 3.0 million
• 8 years Mandapam Camp Dept. of Biotechnology
- Tissue cultured marine pearls May, 1994 to May. 1997 Rs. 2.207 million
47
No. of pearls obtained
428 IJ
139() 2171 2666

8.2Pearl oyster farming and pearl production
The world production of marine pearls was 78 tonnes valued atUS$I092millionduring 1993.
Japan still holds the monopoly in the production
of m'lril1~ pearL. lthough India hact lhe
dislin !iun r (J vel oping the cultured pea rt
Ie hnnlllg]' III 197 , il could nO! c mmercinlly proJuce pearl fol' worf I tr';llc. The country h .. <lmple cor 10 d v -101 amI expand . he cultured peaI'I Industry in eli rfel'cnl locations aI, ng Ix'l th III -. w st and ell t coas[s lIml Ih(;' Alaluman
Lakshadweep Wilt rs (Tllbl c) 10).
MOU's signed or proposed by CMFRI during 1996 for transfer of pearl culture technology I) NCC Blue water, Chandanada, Andhra
Pradesh 2)
1)
Gem Holiday Resorts Ltd., Madras, Tamil
Nadu Balaji Bio-tech Ltd ., Nellore, Andhra Pradesh
4) MIs Sterling Shrimpex (P) Ltd., Chirala, Andhra Pt'adesh
5) Mr. Jagadeswara Rao, Visakhapatnam, Andhra Pradesh
6) Sml. V. Sanda, Visakhapatnam, An'dhra Pradesh
7) MIs Aqua Prime International, Nellore. Andhra Pradesh
Six species of' pearl oysters, namely , Pill ctW/fI fu cata (Gould), P. lI/{lJ'gariti/em (Linnaeus), P. chel1lllitzi (Philippi), p, sugilla(a (Reeve) and p,
atropurpurea (Dunker) have been recorded in the Indian waters . Among these, P . .tilcaf(/ is the mosl
dominunt s pccic..~ , it ceors in large tluml crs in
pearl oy tor ban ' S known 'I.' II f!UI1!' in rh Gulf of MannaI' and in the intertidal reefs known as Ikhaddas' in the Gulf of Kutch , P. fucatu is the
only species which has contributed to the pearl fisheries in these two gulf regions, Along the southwestcoastofInclia, particularly at Vizhinjalll
11. hum marine pearl culture illlhc urhan vicinity ofVisakhnpalnam
(A) Nonrecurring (capital investmcnt) Cost of land (I hal Cost of 16 tanks of 4.000 m' total with hard bottom and roof (@ [{s . 250/m' per tank) Cost of backyard hatchery Cost of pumping, aeration and associated struclllres Power installation and generator Cost of algal production system (lOOt/day) Cost of oyster cages and suspending materials Instruments for lab
Total
(D) Recurring (working capital) Wages Nuclear beads Instruments for implantation Chemicals and glassware Power charges Repairs and replacement
' rOllll
Repayment of term loan (A) with interest spread ovcr 5 years Grand total (e) Revellue Total gross return from 1,25,000 pearls @ 25% yield and Rs , 40/pearl (total implanted oysters 5,00,000) (D) Net profit (C - 13) Percentage of profit
48.
Us. 10.00.000 IO.OO,OOD S,OO.OOO 3.00.00n 2.00.000 2,OO,O()O
10,00.000 2.00.00()
44,00.000
6,00.000 5,00.000
SO.OOO 1,50,000
50.00D 50.000
14.00.000
1.30.00D 27.00.000
50,OO.OOD noo,ooo
RU ~
t

and Calicut, large numbers of spat of P . .fi/cata have been collected from mussel culture ropes
in the 1980s. P. l11argaritifera is confined mostly
to the Andaman Islands where it is common in
some places, but it also occurs in the Vizhinjam
bay in stray numbers. From the Lakshadweep,
spat of P. anomoides has been recorded on the
ridges of rocks and corals.
Raft culture, rack culture, on bottom culture and
onshore culture are the 4 methods of rearing pearl
oysters. Pearl oysters can be successfully reared
in 50 t capacity concrete tanks filled with clean
seawater. Mother oysters/seeded oysters
numbering a minimum of 5 lakhs (maximum
of 10 to 15 lakhs) can be successfully stocked
and grown in tanks of 40001112 each, with a depth
of 1.5 to 2 m (Table II). Besides the above four
methods, longlines and underwater platforms are
also used in some parts of the world.
The colour of the cultured pearls largely follows
the colour' of the nacre of the shell of the pearl
oyster which prqduces the pearl and is genetically
determined. Besides this, the nature of the culture
si te, depth, light penetration, feed, water qual ity,
and the minerals and trace elements in the
seawater also determine the pearl colour to some
extent. Graft tissue preparation is also an important factor in determining the quality of pearls. Now a
days in Japan, various chemicals and drugs are
used to condition the ~ysters and make them grow
healthy and produce good quality pearls. For
obtaining good quality pearls in the seafarms, the
oysters should be grown at depths of 5 to 10m.
Strong sunlight on oysters must be avoided since
sunlight can induce nacre secreting cells to
produce calcite crystals to form prismatic layer
over the nucleus resulting in poor quality of
pearl. Alternatively, pearls could be grown in
shallow depth of I to 2 m in onshore lands and
seafarms by appropriately shutting off the
natural I ight (Figs 7 to 10). There is very high
potential forthecultureofhalfpearls by implanting
a number of half beads in holes made on the same
shell; after implantation the oysters are released
in the growouts, where the mantle secretes the
nacre around the beads, resulting in pearls. The
advantage in half pearl production is that it is
equally costly or even costlier than full pearl, the
technique is much less demanding in skill and
upto 10 half pearls could be produced from a
single oyster. Half pearl production will be part
of the consultancy package proposed to be
offered by the CMFRI since 1997.
.. Plorl aYlttr R"ourc:u
® St a formino
n'
Fig. 7. Pearl culture prospects in India
49
J' ,I, ANOAMAH & HICoeAft
1.t~MlDS •
to"

,;M~IU~J.~.'~ ____________________________ ~
OIl
81 82 83 8~ 8& 86 87 88 89 90 91 92 93 9-4 95 96 'tn,
Fig.S. Pearl oyster spat produced at CMFRI hatchery
,zoo
1000
_00
500
~QO
~oo
o
I_Grode A mGmde B WElGrode C _Grode 0 I t hM . .. d.
// rJ /
J - ~ 7 ~ 77
,-"¥-. '/ 7
' / / / / / /
M 8& M " 88 89 ~ " ~ " " ..... ,
Fig.IO. Grade-wise production of pearls
/
8.3. Edible oyster culture
The edible oysters enjoy wide distribution along the Indian coast. Out of the six species, Crassostrea f1wdrasensis, C. glyphoides, C. rivularis and Saccostrecl cucullata are commercially important. There is increasing interest in oyster culture in the tropical countries in recent years as they are a great delicacy and there is growing demand. Apart from the edibility of the meat, the shells have various industrial and agricultural uses. The edible oysters are euryhaline and occllr in estuaries, creeks, backwaters, lagoons and shallow coastal waters. S. cucullata is a purely marine form. C. gryphoides occurs along north Karnataka, Goa and Maharashtra. C. rivu/aris occurs along the
50
TtlO .... ,.1I 5 r-------------------------------~ /
Doywt.r. haMtf.~ ... ~p.a'i obtaln'd II
I !WItI
1000
It
G 0 117980 81 82 83 8-4 85 88 87 88 89 90 93 9~ ., 96
'''III,t
Fig.9. Pearl production in CMFRI farm at Turicorin
.... u'
$.' I
... "OilU .• "llllCO .... l'UIIOI
" Fig. ll . Distribution of edible oyster in India
and areas suitable for oyster farming '
coastal creeks of Gujarat where they arc exploited mainly for the shells. S. cucu/lara
is distributed throughout the Indian coast on rocky substrata in shallow intertidal areas and withstands surf and wave action (Fig. I I).
The farming methods are broadly divided into: (i) onbottom and, (ii) oftbottom culture. In the onbottom culture, the seed oysters are sown on the ground. The methods involved in off- bottom culture are: (l)rack&tray,(2)rack & string, (3)
stake, and (4) raft. Oysters reach harvestable size (above 80 mill) within 10 to 12 months. They are harvested when the meat attains fairly good weight (Figs 12 & 13).
\roduction rates cliffer according to the culture methods. Through the rack & tray method, the
r

n."Q",111 ft, (Tho",aftd, ) 50 101)
~o M
'0 eo
~o ~
10 1 '0
0, 0 80 81 12 87 88 89 80 91 128!!-.596
Year
I ClOpior'!'t ~ IIII I _Mlal wtlkU Ri."'1I1/t HIJJ J Fig.12 Oyster production and revenue earned by
CMFRI at Turicorn (1979-95) and Dhalavapuram (1994-95)
estimated production was 120t/haJyr atTuticorin
during 1980-86 and by the rack & string method.
it was 80 to 105 t/haJyr at Dhalavapuram in the
Ashtamudi lake (Qui Ion) during 1994-95. The
production rate through the stake method was 20
t/ha/yr at Tuticorin in 1980-86. In the rack & tray
method the rate of return on investment was 30%
and by the string method it was 44.8%. In an area
of! ha.24unitsof300 m2eachcanbeaccomodated
as in the CMFRI's demonstration farms at
Tuticorin and Dhalavapuram in the Ashtamudi
lake (Quilon) (Table 12). The cost of materials
depends on the prevailing market rates.
Production of meat and shell per hectare is
estimated to be 10.2 tonnes and 81 .6 tonnes
respectively. There is good demand for live
shell on oysters in the international market and
the cost of 100 shell on oyster is Rs. 25. The
international ex porI market value of 1 kg of
chilled/frozen oyster meat varies from Rs. ]25 to
300. The empty oyster shells contain 52 to 55%
calcium oxide and are used in the manufacture of
calcium carbide. lime and cement. The shells are
crushed 10 suitable size and used as poultry grit.
The progressive development of edible oyster
hatchery and growout technologies achieved by
the CMFRI is outlined in Table 13, The
experimental work carried oul by the CMFRI at
Athankarai (Mandapam Camp). Pulicat lake and
TUlicol'ill ill Tamil "'OLJ, KakiJltlcia Bay and Bheemunipatnam in AndhraPradesh. Goa, Mulky
51
"111~ .... 'I
/ >'<1 ~
~
3
:i I . 'U 1, (Wu
<It ,g ti l '2 ., e~ ~~
,.or
Fig.13 Edible oyster spat produced at the CMFR I Turicorn hatchery
estuary in Karnataka and Ashtamudi lake and
Dharmadam estuary in Kerala gave highly
encouraging results. suggesting commercial
feasibility of edible oyster culture along the east
and west coasts of India.
Table 12. Production and economics of edible
oyster farming by rack and ren method at
Dalavapuram in a 300 m2 area during 1995
I. Material cost AJIIOllllt in Rs. (a) Poles
Horizontal poles 6 III x 30 1.200 Horizontal poles 2 III x 9 120 vel1ical poles :l In x 126 .520
Total 3,840
(b) Nylon ropes and strings Nylon rope for strings and racks 40 kg 2.800 Number of strings 1060 110
Total (a+b) 6,750
II. Labour cost and other charges Fabrication of oyster strings 11 0 Fablication of racks 240 Harvest 640 Depuration 640 Shucking 880
'rulnl 2,880 Total cost (I + II) 9,630
"I. Production and revenuc Shellon weight of oysters 4,25 tonncs,
Meat weight (\0%) 425 kg
Value of meat @ Rs, 30/kg : Rs, 12.750 Value of shell @ Rs, 3S0/tonne Rs, 1.190 (80% of 4250 kg) Gross revenue 13,940
IV , Net protlt (III - I + II) 4,310

Table 13. D vc\opIIIenlo OJ tcr culture lechnology in the shell . h h tell ry & growout of CMFRI at
Tuticorin, Gulf of Mannar and technology transfer to other locations
I. Development of growout technology 2. Development of hatchery technology 1. Oyster production
4, Spat production
Lab -to- Land programme on oyster farming
6, Sponsored project by NABARD for Rs 8,58,200 for technology demonstration
"1 Areas found suitable for oyster farming based on site selection experiments (good growth rate and survival in all these places)
Ii, Demonstration farms
9. Pri vate oyster farms adopting CMFRf farming technology
11), Mixed fanning trials
t1.4. Mussel culture
IllI
1977 1982
1979- 1996
1982- 1996
1979
1992- 1995
1993-1994
1994-1 996
1995-96
1995-96
The green mussel Perna viridis and the brown mussel P. indica are the two species occurring along the Indian coasts. The green mussel enjoys a wider distribution along theeastand west coasts oflndia including the Andaman Islands, whereas the brown mussel is restricted to the southwest
52
t Location & Rcsult~
Tutieorin. Molluscan shellfish hatchery - do-
Total weight = Meat weight = 1{(!~'enlJe
1,23,341 kg 8,369 kg
R~ . 2.n05( t.4 ,52. IQIIIi II
2 t shellon oyster produced in fanners ' holtlings Revenue earned Rs . 8587.50 Harvest = 47,756 kg (shellon) Meat weight = 2,946 kg Revenue earned = Rs.95,339 Ashtamudyestuary Keral a Munamballl Korapuzha Dharmadum " Karwar Karnataku I) Oalavapuram farm in Ashtamudi = 0.2 ha 2) Chetuvai farm = 0.03 ha 3) Narakkal farm = 0.02 ha 4) Dharllladam farm = 004 fill • glX)ci spnl pj~>clllc[ttJJI frol1l wild - yield in rack & string method . = 80 t/ha - good growth rate and 8-10% meat yield within
6 to 7 months 7 farms at Dalavapuram I limn at Munambam I farm at Padanne
= 0,03 to 0.2 ha each = 0.04 ha = 0.04 ha
-oyster seed for fanning obtained from the wild - seed from Dalavapuram transported to MUllainbam. Narakkaf, Chettuvai, Ohannadam, Padanne and Lakshadweep. -good survival and growth of transplanted seed, At Ohm'madam and Padanne -31'e1:8 Illm;sclll.mvlIl in edible oyster f llCk:--goed !!IOlVth rntt s Ad Kl,lfyivll l frotll \)ct\cm!Ii,!I' lo M~~ 2. S t, of 111111' ':ls hllr"'I:,~Ic:d rom Pndrulne; I I fro III Dhi1lm~m ill M3~ . 19% Ilild ~Qld @ 0114J· per kg sllc.II Oi.I -A bolli 2<J i lCW ",f I'~tc rnt"l~ SU)lJXllleu lIy IRDP. TRY EM cSll'lbii~hcd ill rlie 110 rh I<eflllll .lllui(Ie wafers III
Imc 199 • C,{PCCI d to y jeld OVC!' I ~O loon . of IllIL~:<&I ;« fll1t1 lIbOV\ 200 1() IIIIe.~ 0 f C'Ilibte Qyswr I" ).oj u)' 194)1
co.ast f Illdia. Along !.he ea~t CO' t. the grcCl mussel is I'nuIldOIl smaJJ beet in Ihc Cnilka Ltlkc, Kakinada, Madras, PonQicbcrry. uddalol'c and Porto Nuvo wh ile along the wes,t COO"~I it formli exteilsrvc bed<;; around Qui 10fI , Uepp y. Co Ill.,. Cal icul to Ka .. a god, Mungulot, Ka rwar. ml,
Dh 'llkt creek. M. Iwan and the Gulf of Kutch (Fig. 14).
i.

Methods currently followed in mussel culture
in the tropical and temperate waters fall into four
categories: (I) the sea bottom culture, (2) pole
culture, (3) suspended (raft) culture, and (4)
longline culture. The longline culture is more
profitable than the raft culture (Tables 14 & 15).
The advantage of mussel culture in our tropical
waters compared to the temperate seas is that the
rate of production is very high in the former. In
European waters the seeds attain marketable
size in a period of 12 to 36 months while it takes
only 5 to 6 months in India because of the faster
growth and high productivity in the tropical
waters (Table 16).
8.5. Clam culture
A numberofclam species belonging to thcfamilies
Arcidae, Veneridae, Corbuculidae, Tridacnidac,
Solenidae, Mesodesmatidae, Tellinidae and
Donacidae are exploited along the Indian coast.
The cultivable species belong to the first four
families mentioned above. They include
Anadara granosa, Meretrix meretrix, Katelysio opima and Paphia laterisltlca, Villorita cyprinoides, and Tridacna marina. Of all the
maritime states, Kerala leads the country in clam
production with a current annual catch of 32,927
t which accounts for 72.5 % of thc total clam
landings. The current annual clam landings ill
Karnataka is estimated at 6,592 t although
considerable fluctuations in the landings have
been recorded. The clam production in Goa has
been estimated at 887 t/year and that of
Maharashtra at I, I 00 t/year. Along the east coast
Table 14. Production rates achieved in mussel culture by different methods in various centres
Species
Pema viridi.~
Pemllil/dictt
P. \'iridis P. viridis! 1'. iI/dicit I'. viridis P. viridis
Place
ealiellt (opensca Karwnr(bay) Goa (NlO) (bay) Ratnagiri (opensea) Kovalam. Madras (opcnsea) Vizhinjam (bay) Andhakaranazhi (opensea) Padanne Dharmadam
" 00'
Production rate
4.4 to 12.3kg/m of rope 7.6 to 10 kg/Ill of rope 6 kg/Ill of rope 7 kg/3 m of rope 6.6 kg/Ill of rope
10 kg/Ill of rope 10 kg/Ill of rope
10 kg/Ill of rope 10 kg/Ill of rope
... ~. l · · J
• ....-... lJ oIJftlil IRu ...
". , ...
Fig.14. Distribution of green and brown mussel in India and arcas suitable for farming .
53
Period ~nft Long-line lllck
5 months .. 5 to 6 months + 6 months + 6 months + 4 months +
7 months + 6 months .. 6 months 5 months
I'I'O""" ... -Mllifll" ........
*....:~! "".,100 ft.IU..OI»-
,r.
Fig.IS. Distribution of clams in India and farming-areas

Table 15. Economics of open sea mussel fatming
(0.36 ha area) (Iongline method)
I. Initital investment Cost of construction of a longline unit
(floats, anchors, anchorline, horizontal & velticallilles) Floating platform for watch & ward FRP dinghi & OB engine Spat collectors Others
Total
RlI.
1,28,000 25,000 75,000 10,000 12,000
2,50,000
II. Fixed cost (for one crop of 6 months only per year) Depreciation @ 33.3% 8),250 Interest @ 18% 45,000
Ill. Operational cost (per crop) Seed Materials (cotton cloth, cement block, etc .): !-aboUT
30,000 15,000
1,33,000 22,000 Miscellaneous
Subtotal IV. Total cost (annual) (II + III) V. Expected production V I. Gross revenue at Rs. 10lkg
VII. Net protit (VI - IV)
2,00,000 3.3 lakhs
: 55 tonnes 5.5 lakhs
2.2lakhs
of India, the clam resources are of smaller
magnitude. In Tamil Nadu, the VeJlar estuary and
the Pulicat Lake together contribute annually
1087 t, while in Andhra Pradesh, the annual clam
production was estimated at 2816 t (Fig. 15).
Since clams are cultured on the bottom, site
selection depends on the substratum. The
occurrence of !1atural clam populations is indicative of th~ suitability of the site with
particular reference to the tide level, substratulll
and salinity. Clam farms are located in estuaries,
bays and other sheltered areas close to the shore.
, Clams are rarely grown in ponds, but in recent
years, due to the disease problems in shri Illp
farms, there is growing interest in many Southeast
Asian countries to utilize the shrimp ponds for
clam culture. In Taiwan, Meretrix lusoria is
grown in ponds, formerly used for milkfish and shrimps and also in the outlet and inlet canals of
these ponds. As a result, Taiwan's export of
clam meat which was less than 10,000 tonnes
during 1990 exceeded 25,000 tonnes during 1994. The results of hatchery production of clam
seed (Fig.16), farming and ranching achieved by
the CMFRI since 1978 (Table 17) suggest good
scope for the expansion of clam fanning in shrimp
famls and in protected natural waters (Table 18).
India's export of clam meat has been increasing
steadily over the past few years, particularly to
Japan , Western Europe and USA. The export
increasedfromameagre371 tin 1989 to 800 t in 1993 (Table 19). In terms of value, almost five
fold increase has been recorded from Rs 63.02
lakhs in 1989 to Rs 292.25 lakhs in 1993.
Table 16. Progressive development of mussel culture technology in India by the CMFRI
I, Culture technology
II . Hatchery technology
Ill. Lab-to-Iand programme on mussel culture IV. Experimental mussel farming
V Production rate achieved
V I Sponsored projects for mussel hatchery
Year
1973 1974
1984 1985
1979 1976-82
Location & Rcsult~
Brown mussel culture .at Vizhinjam Bay
Green mussel culture at Calicllt Experimental brown mussel hatchery at Vizhinjam
Experimental green mussel hatchery at Madras
Pilot scale culture at Calicut Raft culture at Madras, Kalwar, Goa, Ratnagiri ,
Tuticorin, Andaman and Nicobar Longline culture at Visakhapatnam, Kakinada,
Andakaranazhi (Cochin) and Karwar
Result 1.5 t harvested from Andakaranazhi in January 1996 and sold @ 14/kg
1995-96 Rack culture at Dhannadam and Padanne
in estuaries
10 kg! 112 year/one metre stli ng on an average in all farms
1994-97 Sponsored by the Dept. of Biotechnology
54

Table 17. Progressive development of clam culture technology in India by the CMFRI
I. Farming technology
2. Hatchery technology
3. Pilot scale seed production
4. Searanching of clam seed
5. Sponsored projects for clam hatchery and ranching
Year
1978
1987
1987 1988
1988-1996 1989-1996
1993-1995
1994-1997
Farming of Alladara grallosa at Kakinada: 0.39 tl I 00 m'/5 months = 39 tlha 2.6 t/625 m'/5.5 months = 41.6 tlha 6.1 t/0.16 han months = 38.1 tlha Survival = 88.6% Developed at the Tuticorin shellfish hatchery for Vil/orito cypril/oides and Meretrix cosf(/ At Tuticorin shellfish hatchery for Meretrix meretrix - do - for AI/ada/'({ lil'lll/OSO and Meretrix casto • do - for Popliia f//a/o[,orico (35,000 to 1.54 million seed per ycar) At Ashtamudi. Madras.Tuticorill, Munambam & Pondicherry Production (P. malabarica) at Ashtamudi : 1.425 kg to 5.93 kg/m'/3.5 months Survival 7.05 to 17.64% Donor: Marine Products Export Development Authority: Amount: Rs 0.362 million Total seed produced = 1.54 million Places where sea ranched = Ashtamudi. Munambam & Ayiramthengu Donor : Dept. of Biotechnology Amount: Rs. 0.8 million Seed produced = about I million
Table 18. Economics of clam culture 8.6. Lobster farming
A. Capital expenditure I. FRP boat with outboard motor B. Operational cost I. Casurilla poles 2. Pen enclosure 3. Seed @ Rs 55/1000
4. Running cost of boat 5. Labour
Amount in Rs. 80,000
6. Harvesting, depuration & shucking of meat :
2,500 IO,OQO
16,50,000 6,()() (1.000
50,000
7. Contingencies 8. Salary to Manager @ Rs. 2,000 for 6 months: 9. Watch and ward for 6 months
C. Interest at 15% for A for one year D. Cost of production I. Depreciation @ 10% of A
2. Operational cost 3. Interest
Total
E. Income Shellon weight of harvested clams Wet meat weight
Shell weight Sale of 105 t meat @ Rs. 25,000 per ton Sale of 525 t shell @ Rs. 1,000 per ton
Total
F. Profit (Rs. 31,50,000 - Rs. 17,74,500)
Net profit on investment
6,000 12,000
12,000
17,54,500
12,000
8,000 17,54,5QO
12,000
17,74,500
700 t 105 t 525 t
26,25,000 5,25,000
31,50,000
13,75,500
77.5%.
55
Spiny lobsters (rock lobsters) are low volume, but high value fisheries which support some of the most valuable marine fisheries resources
worldwide. India earns approximately US $ 15 million each year through the export of lobsters (Fig.17). Though the lobsters are widely
distributed along the Indian coast, the major fisheries are located along the northwest (Maharashtra & Gujarat), the southwest (Kerala
& Tamil Nadu) and the southeast (Tamil Nadu)
coasts. Among the six shallow water species, only Paflulirus polyphagus, P. homarus and P.
omatus are exploited in commercial quantities.
The technology oflobster farming and fattening is already well developed, and the economics quite encouraging (Table 20). High demand for live
and whole cooked lobsters in the international market and the high price offered, make lobster fmming an attractive industry. However, in the
absence of a viable hatchery technology and only limited availability of juveniles and subadults from the wild, scaling up the farming
actjvity has not been possible. The CMFRI has been able to successfully breed the spiny
lobsters and rear the phyllosoma upto the Vlth

Table 19. Export of clam meat
Q
Product~ 1989
Dehydrated Clam meat Q! 42
V: 933
Flozen Boiled Clams Q: 329
V· 5,369
Clam meal Pickle Q!
V·
Quantity in lonnes; V Value in Thousand
•• 90 tI 'l'tu
Fig. I 6 . Production of Paphia malabarica seed in CMFRI hatchery
Fig. I 8. Layout of an indoor lobster culture fadlity d veloped ror the industry hy lhe CMPRI
56
1990
107
2~'i46
414
7.55&
22!10
. 2000 Ino I !l00
12!10
1000
l~tI
5t10 2!10
o
I
1991
164
4.789
1,232
37,392
In ""'.10 /
V .0
Q • .. I .. =
17 . ~ • t . ."
• '"
? -., I o ::
19112
129
3,855
940
31,02R
37
2,025
~ N
Y ~ G\ , '" " '"
yo ...
1993
124
5,669
776
23541
NEG :
15
J,? 57 .. .. I
<It
'" • Fig.17 . Export of lobster tail during 1987-88
to 1994-95
, I I I .. I t t i" , ; I , ~
Fig.19. Schematic diagram of a lobster culture tank developed for the industry by the CMFRI.

Table 20. Economics of spiny lobster culture for producing one tonne lobster in indoor system Assumptions: Species - PlIIllIlirtlS (J/'IIlIIIIS. duration of culture - 6 months. size at stocking - ~50 g. sizc at harves: - :'iOO g.
Illoltality - 10%
A_ Capital cost 12.00
Construction of tanks and overhcad shed; pumps. air blowers and generator: erecting
pUIllP house and pumping system: PVC pipes and fittings for watcr and air distribution:
construction of sump and tlitration system, etc.
l' . Operating cost 4.00
Juveniles. feed, ekctricity, chenlicals & antibiotics and lobster shelters : wages to labourers
and miscellaneous expenses
C. Gross prolit from selling 1000 kg lobsters @ Rs. 800 per kg 11.110 4.00 D, Net profit (depreciation of capital . construction and equipments excluded)
stage as early as 1978. This work which was suspended after the cyclone devastation of the
Institute's mariculture laboratory at Kovalam
(near Madras) ill 1980 is now being revived with
a view to completing the life history successfully, paving the way for a viable hatchery system.
In the matter of growout, eyestalk ahlation
experiments have shown that a group of lobsters of 85 g average weight, after eyestalk ablation,
increased to 432 g in 165 days as compared to the
growth increment of only 57 g for the control group. A lobster growout system designed by the
Institute for the Amalgam Seafood Exports
Cochill consists of a series of circular or square
cement tanks of9 to 16 sq.m area each with either
a Ilowthrough or a semiclosed recirculation
system (Figs 18 & 19).
8.7. Crab culture
During the period 1989-94, India has exported
live mud crabs to the tune of about 630 tonnes valued at Rs . 2.58 million on an average
annually . Among t.he maritime states, Tamil Nadu, Andhra Pradesh and Kerala have already
taken up crab farming as an alternative source of
income generation in the coastal rural sector.
Indo-Pacific in distribution, the mud crabs inhabit
Tahle 21. Economics of three systems of mudcrab farming under taken in the Mother crab farm at Tuticorin
Culture method
Monoculturc 0.5 ha
Polyculturc 0.5 1m
Fattening 0.3 ha
Production & income
Crabs 780 kg Rs . 1.57,200
Crabs I 140 kg Rs 2,32,400
Milkfish 720 kg Rs 28,800
Crabs 560 kg Rs 1,22,850
Total production in all 14 ponds of 5.2 ha
Postharvest mortality 3.8%
Totalincollle
Expenditure
Net prollt
Period of culture
Average net income
=
'"
Expenditure
Cost of seed. feed fencing, power
supply wages etc. Rs 43,860
As above Rs 48,400
As above Rs 56,200
6340 kg
240 kg
Rs 12,20,000
Rs 3,05,000
'" Rs 9,15,000
= 4 months
-= Rs 1,75.961/ haJ4 months
57
Net profiUcrop
Rs I, LU40 (120 days)
Rs 2,12,800 (138 days)
Rs 66,650 (30 days)

Table 22. Achievement · of CMFRI in breedin · and 'ced production 0 crabs
Species Year of work & Authors Results
Mud crab Scyllll sel'l'lI/li 1983 Marichamy & Rajapackiam (1984)
Incubmion period, egg hatching ol1d COlllflktc metamorphosis studied for the fjlfa limt: ill
India
- do - 1983-84 Marichamy & Rajapackiam (1992)
Egg hatching and earl y development upto crab stage studied under controlled cOmmiOJL~
Scyllll /I'l/I/que
iJlIl'i<:lI & s. .l'erl'o/ll
1994-95 M.K. Anil (Personal
communication)
1996 Swimming crab POrlltnUS pelllgiclIs Josileen and others (1 996)
the marine a~ w II a bracki!ihw~\fer envjf(Jnmcnts.
In India, both the species (Scylla sermta and S. ./rallqllebarica) coexi t in thc illshor se , cs.tuurie:. backwalcrs,collstu1 lukL$ n mangrove swamps of all maritime States on thu mainl fld and the creeks and hays of Andmnan and it hat 1 land . They prefer muddy or sandy bottom.
Mudcrab fattening experiments using cyao tranquebari (l wen: carried out ~tt Narakkal in 8
pond oflOOO sq.m at n low slockillg density f 300 water crabs, each of 500 to 550 g during
"
OJ.
9: I
"'UI,IMAH eo..a:eAJt 15lAMO' .
Fig.2Q, Dj~lrl ' uLion nnd 'lbund8n!:e of "v'al'ious seaweed resources along the Indian coastline,
58
a t T llticOI'il\, A IBl1.Ilim1l1ll of ,.'>% ,'IU'Vi\'<lj 01 erab lage obMJ ~d.
Complete larval development of both species studied for the first time in India. Exper,imclllll' ~eed produC1ion lrin'~ yiel('letl 20 to 25% survi val for both species,
l.;trval!'Cllfi"1t Ilfl(lll'CeJ production lillCC " f lllly
cill:rietl 0111 III MnlldarJrlln \vilh II s UI'Vi ~l m r n r SO t~ It~% LIJlto ~oell . V NI,~e IUlll le. ser ,sur"'lv;\! rilles tor sue S!IWIl 111l.te..~.
1996. They were fed daily with salted trash fish at 10% of body weight. Water exchange was
facilitated by mean. . tidal now. S6)~livc harve tiJlg of mud crnbs wasc.micc! OUla! weekly inlel'\lnls, after 2 1 days of tilL! initintion of lh experiment. A total of Rs 8500/- was spent towards the en t of cl'ttb lind the t'eeu. 1 he harvested crabs were sold for a sum ofRs 9600/- in 40 days (Table 21). The experiment is being continued. Crab fattening has to be pursued for a minimum of7 to 8 months with continuous harvesting and stocking to make it an economically viable
'· RESOURCES
Fig.2 I, Standard crop of seaweed resources along the Indian coast

operation. Profitability can be further increased
by polyculture with compatible species of fish
and shell fish.
Experiments conducted at the CMFRT, Tutieorin
during 1983- 8S on the mud crabs Scylla serrato
and S. tranque/Jarica gave encouraging results.
A survival of 15 % was achieved from the egg to
the first instar stage. The techniques have been
further refined as a result of which a survival of
20% has been achieved recently . Similar
experiments conducted in the CMFRl. Cochin on
both these species also gave 20% survival rate.
Experiments currently heing carried out at
Manciapam gave encouraging results and an
economically viable hatc hery technology is
e merging from these efforts.
The CMFRI has carried out hreeciing of the
marine erah PortuflllS peiClgicus and succeeded in
obtaining a survival of 8 to 10% from the egg to
the first instal' stage. Experiments are heing
continued to increase the survival rate and
develop a viable hatchery technology for this
species. Experiments on the hroodstock
development and farmi ng revealed that this species
has great potential for seafarming. Three
generations of P.pe/agiclIs have been
produced successively and being successfully
maintained in the CMFRI Mandapam marine
hatchery (Tahle 22).
Studies on the farming of mud crabs have been
initiated by the Institute as early as 1983 and
being perfected over the years. Recently three
typesoffarming have/ heen undertaken, namely.
monoculture , polyculture and fallening.
Depending on the availability of seed, these
technologies can he advantageously made use or
by the entrepreneurs. Table 21 deals with the
economics of these three methods of farming .
One of the major constraints being faced by the
farmers is the inadequate supply or seed crahs,
as the only source at present is the wild stock
in most of the countries, where crab farming is
attempted. It is , therefore, imperative that concerted
effort is made to develop commercial hatcheries
for adequate and sustained supply of haby crabs
to make mud crab farming an organised
industry. The first commercial mud crab hatchery
established by Indo Marine Aquaculture
(located at Marthanpattinam, Thennampattinam -
609 115, Sirkali Taluk, Nagapatlinum district,
Tamil Nadu) has come into production and sale of
seed in January, 1996.
8.8 Seaweed culture
About 700 species of marine algae have been
recorded from different parts of the Indian coast.
Of these, nearly 60 species are commercially
important, belonging to green, brown anel red
algae which occur along the southeast coast, Tami I
Nadu. Gujarat. Lakshadweep and Andaman &
Nicobar Islands . Fairly rich seaweed beds arc
Table 23. Important Indian seaweeds and their standing <: rOl
AgHrophytes
C;illCi/lIl'ill edu/is
G. cOJ"li(:(lIl1
G. Cl'lISSil
G. fi}I/ilem G, \'errtfcos(/
Ge/idiel/II (/cero.m
Ge/idiuJJi sp.
Standing crop (in tannes)
Cl.OO()
Alginophytc~
S(/I'j!,(/S.I·WI/ spp.
lill'/Jil/(/I'i(/ spp.
HortlllJ/,/ty.\'(/ sp.
C\·.l'IlIsie)'{l sp.
16.000
59
Carrageenophytcs
HYPllell l'lI/ell/i(/e
H 1I1/1.H:i/iJl'lI/S
EUc/leWl/lI sp.
Edihle & green seaweeds
V/m sr. EII/ertIlJlIJI'/}/1lI
COI//er/}11 spp. ClldiUJlI spp.
LIIl/l'el/cill spp.
;\ClII1//IIJ/'/W)'{I
70.0()()
TOlal IOO.OO()

Tahle 24. Methods of seaweed cultivation
Fragment Culture Spore Culture
Methods Methods
I . Coir rope longlinc
2. Coir rope net
L Settling spores on coral stones
2. On gastropod shells
3. Nylon rope "\.yton Ole
<l 1:1 lldc:~~[il1g III PUIu!;\: COIl" fOflC
5. Tying in plastic bags 5. Nylon twine
6. Tying 011 tloating rafls 6. Circular cement blocks
7. Tying the fragments to rocks
CoHlllc ;101) II illdi;\ N ,/lUndl \I
Factories
I. At':\J 5000 130 30 (from 30.000t (from 750t
dry wI) dry wt)
2. Algin 500 28 (from 30001
dry wI)
3. Carrageenan Nil 1\
pr Ii nt in he vicinity of Bombay, Karwar, Ratnagiri, Goa, Varkala, Kadalundi, Vizhinjam, Visakhapatnam and in the coastal lakes of Ashtamudi, Pulicat and Chilka (Fig. 20).
As per the current estimate, the total standing crop of all seaweeds in the Indian waters is more than one hundred thousand LOnnes wei t) ns; 'ling f 6,000 10nncs 0 ngn yielding red seaweed •
16.1lf1O !OIlIIes oj <'ligjn yielding seaweeds am! {he rcrnainillgquanlily isofedible and carrageenan yielding seaweeds (Fig. 21). The important species are listed in Tahle 23. Seaweeds are cultured either hy vegetative propagation using fragments of seaweeds c Hected fromlhe natural ~ds or by spore .. sueh as tetra ·pOI'· or lIrpospOres. The fragments are al 0 ultured by
broadeD tin them ill outdo{ l' rond and tanks (Tahle 24).
Seaweed fanning along the coast of peninsular India has the potential to fetch a return of Rs. 9,0001- per ha per year for an investment of Rs . 36,0001-, assuming the production rate to he 3
60
fold inca; hoftl e [WQcl'ops/hnrvasfs. A production target of 2 million metric lOimes of culti vated seaweeds is proposed to be achieved hy 2020
(Figs 22 & 23). The hike in the production frolll
the current 0.2 mill ion ionn S thr )ugh wild hal'vcsl to 2 million tonnes by fOffiling by 2!J20 j~
po sible Ihrough the following activities:
2)
3)
)
'o/al'g rncOi }r the farming arc s
including the hrackishwatel' lakes
Upgl, tlltion 0 culture rechnolu"y into inl llsi culture and multilillecle: ullure
systems
onshore culture in tanks, ponds and raceways
introduction of high yielding, exotic species and development of high yielding varieties through gencl i I anipulll lron ·
8.9. Seacucumber culture
There ,we more Lhan 200 species ot' seacucumhelin the seas around India, of which 75 species arc distributed in the shallow water. They OCCllr mainly in the Gulf of Mannar ancl Palk Bay, !he And<lm .. n (;IilO Nicohar Islands and the Lakshadweep. In the Gulf of Mannar and Palk Bay Holothuria scabra is the most important species for processing in to beche-de-mcr. In recent years Actinopyga ecnin;' lIm.l 1\, miliaris nre .llso explollcd ill good quantiLic.-.. Holotl!ul'ia llJillifcra and Bohadsdlia mcmtlomtll are IIvallable in sm :.i!!ei' qUilmitlcs only. Although Holot/lllria scC/hra and H. spinifera are not found in the Lakshadweep, Holothuria nobilis and Thelenta anall([S are quite important in this island, where Bohadsc/Ji(1 /l!amW /,O(cl. AccilltJpygcJ
mCluritic/Ha, A. echillites, A. rniliaris, SticllOPUS
vOl'iegafus, S. chlorunotus and Holothuria arm are also availahle to some extent. While the most important species in the Andaman,and Nicobar Islands is H. scabra, smaller quantities of
HoloJhuria atm, A .. nuwric;n/Ill, A. (! hlld(~, Ii, mi1ioris. H . Iwbili . Sli 'hoPJis v(1l'ie~(/Cw' and

tI11' to.,,' f ... DtI ::r.:-:.u-.-_. i~1III1! ",-.1u. "IU~!i!! _ 10'.
U""., ........ - ..... " ..
l .' I
._ij,i.iiiIJ~ ·'
I."""", .... iii
I, ;
'G,OOO I .. J~/,. .. dl<>l )I'h' 11,000 ,., 3 ... .,..1,... ... , .. ll/""
... , . 0>10 I-hIM!!!"" .... ... . I}". '''~ , . . ............ ' ..... u .. ,
~::.::: ... i.:.1'=--t\,GI~.. .. ..... f!ii*!~',.~ 'N nrlWl • • 1iU'~I.I..NIU.fr(L .. t - ... MJ. .....a:,oa .. '"'" .~-,! ".!!'"' •• 'W1 .. ~
ITI'"' .... ,..., ... ~~~~~", .. l'1.
•• i .. i.. '.~.l"O "',JO,)OO( 4'IIIIO""HU",1
Fig.22. Potential areas of seaweed aquaculture along the Indian EEZ
S. chloronotus also occur, but H spinifera is
absent in this island. The record of Thelenota
(manas from the Andamans needs to be checked.
Sea- cucumbers are distributed in the Gulf of
Kutch and in certain other locations along the
coast of the mainland ofIndia, but they are not of
commercial value.
The CMFRI succeeded in the production seed of
Hscabra for the first time in 1988 by induced
breeding through thermal stimulation at the
Tuticorin field mariculture laboratory. (James et
ai., 1989). Since then H scabm seed is being
produced in this hatchery ,on a regular basis.
, .. ~ ... 10 ... ' ..... ,........
1001 1010 loti IH.O ""100 (ADI
Fig.23. Projected Indian marciulture production of seaweeds
Beche-de-mer production is a very ancient industry
in India. The Chinese had constant trade with
southern India for more than thousand years ,
Customs records on the export of Beche-de-mer
from the Madras Presidency are available from
1898 onwards. Since the middle of the last
century a good Beche-de-merprocessing industry
was functioning in the Lakshadweep, but it
ceased in recent times. In the Andamans also
there was good processing activity since the mid
seventies around PortBlair, but it stopped recently
due to the ban imposed by the Andaman and
Nicobar Administration.
Table 25. Annual export of beche-de-mer from India (Q = Quantity in kg V = Value in Rs.)
Country
Taiwan Q y
Hongkong Q y
Singapore Q y
Total Q V
11)1)0
37,338 50,90,987
37,388 50.90.987
1991
984 1.32,645
27,962 85,02,083
28,946 86,34,728
61
1992
'2$~
3,19,038 20,520
18,02,625 18.566
54.68,454
39,341 75,90.117
1993
13.020 10,96,992
6,657 25,76,362
19,677 36,73.354
1994
37.562 65.18.207
8.254 25.86.972
45,816 91.05,179
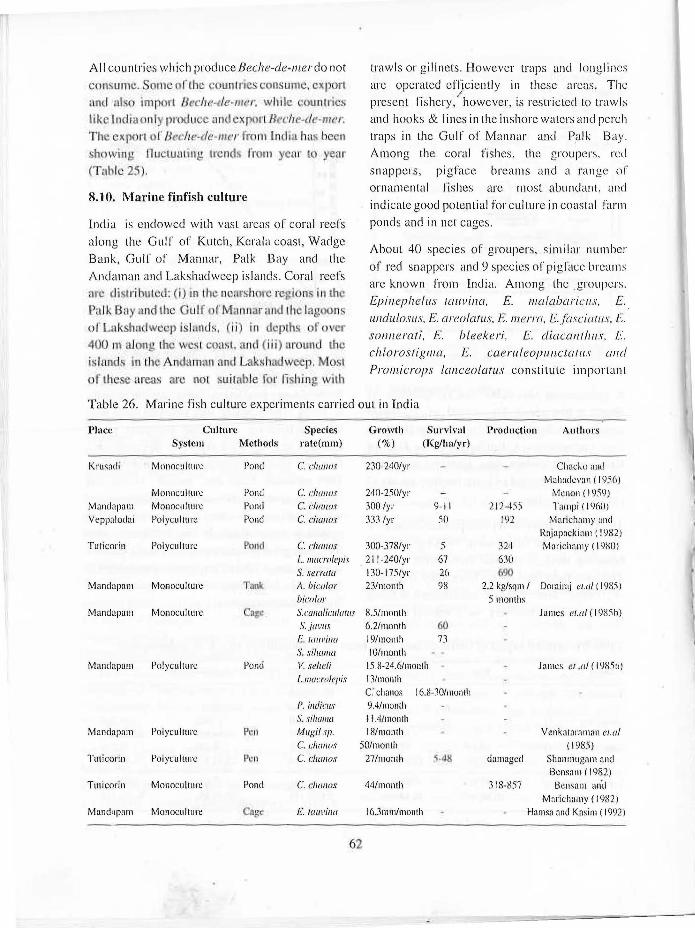
- ,
All countries which produce Beche-de-Illerdo not
C\iI1SUIlW. Some nrlhc oLJ rdric ' consume, exporl
"u1(1 also im]"l(J rl lJt1ci1('-de-fl/(:r. while oUl1lric~
lik Ind ia only pro<iucc :md 'xporLlkdw-de-m'r. ih eX j1(\l't o f Beche-de·mf'1' fro l \ India h;u; h en
'-howing llllC(U<1 Ling Ir nds ffOlIl year to Yf)a ( ahfc. 5
8.10. Marine finfish culture
India is endowed with vast areas of coral reefs
along the Gulf of Kutch, Kerala coast, Wadgc Bank, Gulf or MannaI', Palk Bay and the An(\aman and Lakshadwcep islands. Coral reefs 01'1: eli: I ri huu:tI: (i) III the Ileal'...., ('I reg iO\1,<; i the
Pall; Ba)' and th · Golf 01' M HtlIlar 3Hd lhc la.g< 01]
of Lak hadwcep is.lantls, i i) ill dCPlh!ii or uve 4()O in aJoll lbc cs i 4; t1St, alld (jii af'OullJ lhe
i!;IRlld. ill the Aodam'lIl11nd Lab hndwcep. OSI
. r 111 sc <~reas arc nOL .' 1I1labJe f, I' fi hin with
trawls or gillnets . However traps and longlines
arc operated efl)ciently in these areas. The present fishery, however, is restricted to trawls and hooks & I ines in the inshore waters and perch traps in the Gulf of MannaI' and Palk Bay. Among the coral fishes, the groupers, red snappers, pigfaee breams and a range of ornamental fishes are most abundant. and
indicate good potential for culture in coastal farm ponds and in net cages.
About 40 species of groupers, similar number
of red snappers and 9 species of pigface breams are known from India. Among the groupers, EpiHephelus tauvina, E. moloboricIIs, E.
undulosl/s, E. areolalus, E. mam, E.fo.l'ci(lfll.l', E. sonnerati, E. Meekeri. E. diacolltlill.l', E.
chlorostignw, E. caeru/eopuHctatlls and Promicrops /anceo/atus constitute important
Table 26. Marine fish culture experiments carried out in India
l'lace Culture Species Growth Survival Production Authors System Methods ratc(mm) (%) (Kg/ha/yr)
Krllsadi MonocullUrc Pond C. dlll/iIlI 230-240/yr ChaCKO and Mahadevan ( 1956)
rvlonocullurc Pond C. C/J(//iIlI 240-250/yr Mcnon(1959) Mundapalll MonoclIllUrc Pond C. dlllllOI 300/yr 9-11 212-455 Taillpi ( 1960) Veppalodai PolyclIiturc Pond C. dlllllO.l 333/yr 50 192 Marichamy and
Rajapackiam (19~2) Tuticorin PolyclIllUrc F'mid C. ('/IlI/IOS 100-378/yr 5 324 Marichamy ( 19:\0)
L I//acrolepis 211-240/yr 67 630 S. serrato 130-175/yr 26 690
Mandapalll Monoculture T.mt A. "icII/or 23/l11onth 98 2.2 kg/sqm/ Dorairaj el.al (1985) bicolol' 5 months
Mandapam MonocullUrc rl),'4! S.w/w/it'll/att/s 8.51month James ef.ll/(19~5h) S.jal'lIs 6.2/monlh 00 E. tallvilla 19Imonlh n S. si/II/Illa 10/month
Mandapam Polycuiturc Pond \I. se/teli 15.8·24.6/111011Ih Jamcs et .1// (1985a) L./I/(wrole/Ji.\· 13/mol1th
c: ehal10s 16.8-30/month P. iI/dims 9.4/month S . .l'i//lIIl/(/ 11.4/month
Mandapam PolycllllUrc f't!n MlIgi/sjJ. 18/month Vcnkataraman et.lI/
C. c/WI/OS SO/month ( 1985) Tuticorin Polycllltllrc I'l:n C. C/tllllOS 27/month -48 damaged Shanmugam and
8ensam (1982) TUlicorin MonocullUrc Pond C. c1tllllO.f 44/mol1th ] 18-857 8cnsam and
Mnrichamy (19X2) Mand;.lpam Monoculture C ~t! E'. fliliVillo 16Jmm/mollth Hamsa and Kasim ( 1992)
62

fisheries. The red snappers of commercial
importance inclucle Lutjanlls rivuiatlls. L.
1IIC1la!Joricus, L. Iu/villommo, L. kosmira, L.
orgentimaClIlatLls, L. lI'aigiensis, L. !ineo/atlls, L. gibbus and Pristipol1wides typlls. Among the
pigface breams, Lethrinus ne/m/oslls, L. lent.jan,
L. tIliniatlls. L. e/ongotlls and L. /Jlo/7selloides
are most abundant in the landings ,
During the 1985-94period.an estimated average
annual perch landing of 13,616 t was obtained in
India with groupers ronning 44. 9 o/rJ, pigface
breams 31.1 % and snappers 24.0%. Almost the
entire catch was taken from the grounds in the 0 to
50 m depth. The potential or these rishes in the
Indian EEZ is estimated to be around 40,000 t in
the 0 to 50 m depth zone and 14,600 t in the 50 to
300 rn depth zone. The wide difference between
thc potential and the landings is due to the
grounds not being accessible to trawlers and
setnets. Thererore, fishing by traps andlonglines
needs to be introduced ror the effective
exploitation of these resources.
The coral reefs constitute an important habitat for
a vast range of ornamental fishes of about 300
species. Of these, fishes or the families
Acanthuridae, Pomacentridae, Labridae, Scaridae,
Chaetodontidae, Siganidae, Holocentridae,
Syngnathidae and Balistidae are important.
These fishes are known to be abundant mainly in
the lagoons of the Lakshad weep islands, followed
by the Andamans, Gul f or Mannar, Palk Bay and
Vizhinjam Bay. Currently, there is no exploitation
of these fishes for aquarium purpose. The
CMFRJ has initiated a detailed survey and
assessment of the ornamental fishes of the
Lakshadweep.
In the area of marine fish culture, India is still in
the experimental phase. Experiments on several
species: Chanos chclfIos, Mugil cephalus, Liza
lIlacrolepis, Valamugil seheU, Siganus
canaliculaflls, S. javus, Sillago sihama,
Epinephelus tallvina, Anguilla bicolor bicolor,
63
Lates ca/carijer and Etrop/us sllratensis were
conducted (Table 26). Breeding and hatchery
production of seed and growout technologies
are yet to be c1eveloped. Very recently lucrativc
nursery grounds of grouper seed (of 60 to 26()
mm size) were located along the Gulf of Manllar
coast and live juveniles of E. t{[{{Fino and
E. /Ila/avoriclls are exported live to Hongkong
and Singapore. About 15,000 juveniles arc
collected per month from one coastal nursery
ground near Tuticorin for this purpose. with peak
collection in January and February. The CMFRI
has embarked on a programme of breeding and
hatchery production of seeel of groupers, snappers
and breams. At the Tuticorin farm of the CMFRL
300 juveniles of E. tauvina of 65 to 285 I11Ill
length range (mean 130 mill and 80 g) were
stocked during June-July 1996. By the end or
September 1996 (75 days) the groupers at
Tuticorin attained an average size 01'225 mill and
I 109. At the Mandapam centre 01' the CMFRI
E. tal/VillCl of the length range of 92 to 245 Illlll
and weight range of 10 to 200 g were stocked ill
outdoor cement tanks and fed sardines at the rate
of 10% body weight. In six months, they attained
180 to 360 111m and 160 to 630 g. Eyeball
swelling, tailrot and infection by Caiigu.1
resulted in some mortality. Recently ovaprilll
was injected to E. tal/villa at the rate of 0.5 ml per
kg body weight; in six days, spawning took place
in fish of 2.0 to 2.5 kg wt. A private company
(San net Aqua) is currently operating a net cage at
Tuticorin in the Gulf of Mannar at a depth of 4m
for captive holding and fattening of groupers
(fed on sardines) for live export in ships to
Hongkong. The comnpany has exported in 1996
about 20 tonnes of live groupers.
9. Stock enha~cement programme
9.1. Searanching
Searanching is termecl as production and release
of aquatic organisms into their natural habitats to
augment their stock. It was in the United States
that the idea of searanching originated as back as

ahle 27. Some , c:u:lOching resuUs; global & Indian (;xpericnce
Coulltry Location Species
I. Japan Komancc- Ko-Lagoon KUI'lilna shrilllp
10- Seabrcmn Flounder
16 national and 80 coastal 41 local aqua- species
culture centres
2. U.S.A. Hawaii Striped Illullets
Texas Red drulll Hawaii Threadlln
;l - Bolmi sca Penueid shrimps Yellow sea
4. India Palk Bay l'ellaellS sellli.I·It/ClIIU.I·
(CMFRI) Gulf of Pillc/ada.li/('{//II
MannaI' (Pearl banks)
Ashtamudi Clams estuarine lake in Kerala
1 R70. Since then many countries huve be.ett practisin l1' Ihi. 1'01' enhancing Ihe rCSOlrrce.~ ItS
Ishing pI's. ure i viclently feU on many of the I'C/lOurces. SCllfallching also helps in con ervil lg
the re.'~()ul'ces. Tbe ide{ of s~raltcb i llg in Indiu sta rtctlwilh pead oys!er which appeared to diminish in rll.lmber ince [he Gulf M~nn r pearl fishery 0 1961 uc to many factors_ To overcome the erratic natural popUlation of pearl oysters, it was felt that searanching would be the cOITeclslep. With theestablishmentofamolluscan hatchery at Tuticorin and large scale production of seed, searanching became a reality . Ranching of shrimp secd Jl~ becollle relcvnJU ill the ConIC r dil11ini. hillg returns I"I'OI1l li1£ nH(llrnl reSOD ·CS.
The spiny lobsters, clam, . [InO ~eacucllmbcrs
I) \'el' immense s ope for seamnchingh"causeof Ihe incrca ing J 'manel In the export lI'l'Ide. de rc..1si nd proclu 'lion from rhe fis hery, 8 nd lhe slI 'CC S In hatchery production of rhdr eed (Tllbl e 27),
Japan i the pionc:crin the carallching 0 .1:\ WL ie1Y
64
No.ofseed Year Results nlnched
,
700 million 2.4 times increase in the production of kurllm<l shrimp
16 million Substantial increase in 19 million the wild stock
Pilot scale 197()'; 100% increase in the wild stock
Pilot scale I 970s Signi ncanl increase Pilot scale I 970s Sigllilicant increase
Large scale I 980s Rccapllirc ratc4 to 13.6%: scaranched seed accounl
for > 90% of catch
6 million 1990-94 Augmentated yield 10 million 1985 & Signillcant incre~isc
1990 in adult pearl oyster in the natural beds
0.486 nli II ion 1991-96 Fairly good increase in production
of marine organisms including shellfishes and finfishes. They embarkecl on a stock enhancement programl11~ ( S 'P) in n big Woly involving 16 nationnf amI 43 10 31 aquacuhul' cenU'ns,
f\"leu . ill" (In Ihe problems of NO (:0.1, lui spa ·jcs including Ihe kurumH prawn (Penllt!llsjllpolli("m),
bl.uecl'ah,I'ctI seabre< m (PaJ.:nt,~ mqiur), nb::ll(JPlc and fln!l'j:h. By I'eleasi llg 1l00ul 70{) mir li 'Ill seed
P;jap )/IicliS n Ibel omllnte-Ktl-lagllCII1.,Ihcy have iilcreilsed [he produt: lioll hy2,4 [imcs..Jn lbl: cascol'in Is he ,J111lchinguf 16 n.)itJioll :;calmml1ls and 19 million tlounders resulted in substanlhlll)1 ~lIppl meliling Ihe natural stock_
In \{(1waii, stock cnhancenl'nl pmgrornmc wa.-;
unden ken for III deplCled co SlUr f'ishCl'iCf;, or which Ih IWO highe t Itlllkcd : pecic.,; , t!1c Paci 1('
Ihrcaulin (Polydact,\'[m sexfilis) und Ihe : trip'cd mullel (MugU cf:lplwJl/$ w rc Inkcn up in (he l'il'l.;i
phtt. e <IS tes l . pccj("~ , ilol IltHencry 'leas experiments resulted in 100 % increase in mullel abundance in the nursery habitat. In Texas. consequent on the clecline of the red drum

J
Table 28. Proposed pilot scale searanching programme by CMFIU under the 9th Five Year Plan
Commodity Location Quantity (million) Species
Shrimps Veraval
Karwar
10.0 Pel/aeus pCl/icillafus, l'el/acus IIlcrglliel!sis
5.0 P. IIlcrgrtieusis, l'ampcllacopsis stylijera
Caliclit
Vizhinjam
Mandapalll
Madras
VisakhapatnUill
Vcraval
I(},( Mefapel/aeus dohsol/i, 1',il/dicus 1'. stylifera
1 ;i;0 P,iIllIiCIIS, Metapel/aeus dobso1li 1'. styl(fera
10.0 1'. sClIlisltlcatlts
10.0 1'. il/diclts, 1'. /IIol/odol/
10.0 P. iI/dicus, 1'. /IIollodon
Lohslers 0.2 Pam/lims polyplwgl/s, Thelllls oriel/talis
Caliclil
Yizhinjam
Manuapam
Madras
0.2 P. homarus
0.2 P. homants, 1: oriel/talis
[) ,l P. homam,I'" 1'. omatus
0 .2 P. /wmams, T. orientalis
Pearl Veraval
Yizhinjam
MalldnJlluI1 Yeraval
12.0 l'inctadajl/cata oyster
6.0 P.jllcata
12.0 P.jllcata
Cephalopou 1.0 Sepia p/wraollis, J..oligo duval/celli
Caliclil I .()
(SciaenofJ,I' ocellatus) fishery during the 1 970s,
a stock enhancement programme was started to
recover the resource by the Texas Parks and Wjld
Li fe Department. Stud ies so far conducted revealed
that the stocked fish survived in significant
numhers and thereby enhanced the natural
populations, Stocking hatchery fish along with
stringcnt fish ery and habitat protection measurcs
could revive the red bream popUlation
substantially.
Stock enhancement programmes on pcnaeid
shrimps began in the mid '80s along the coasts
of the Bohai Sca and the central and northcrn
Yellow Sea to build up the collapsed stocks in the
traditional fishing grounds, A remarkablc recapture
rate ranging from 4.0 to 13 .6% was observed
under these programmes. At present the
releascd shrimp accounts for more than 90% of
thc lotal catch.
In India, the CMFRI carricd out preliminary
ranching experimcnts on Penaeu.l' .I'emisltlcatlts in the Palk Bay at Mandapam, clams in the
Ashtamudi lake und pearl oysters ane!
seacucumber in the Gulf of MannaI' with
encouraging results. 6million posliarvac(PL-15
65
S. p/wraollis, L duvaucelli
to 32) of P.semisulcatus produced in thc pilot
prawn hatchery at Manelapam, Tamil Nadu were
searancheel in the Palk Bay from J 990 onwards.
This programme helped in augmenting the
production of P.sernisulcatus in the coastal
waters ofPalk Bay_ The PL - 15 were reared to a
size of over 60 111m in Icngth, A total of 2964
laboratory reared and farm grown p, semiSlllcatus 01' 60 to 110 mm size were tagged and released
into thc Palk Bay. One percent of these shrimps
were obtained from the commercial trawl catches
landed in two nearby landing centres within a
period of 53 days. During this pcriod, the tagged
prawns have migrated to adistanceof30 to 35 km.
The above experiments show thatthesearanched
postlarvac of p, semisulcatus survive, migrate,
grow and get recruited into the fishery in Pal k
Bay (Pillai, et aI., 1991) , A total of J 0 mill ion
pearl oyster spat (0.9 to 11 .3 mm size; average
1.53 to 5.7 mm) was scaranchcd in the Gulf of
MannaI' in 3 pearl oyster beds (paars) in 17
batches during 1985 anel 1990 and 0.486 million
clam spat ranchcd in Ashtamucli lake, Kerala
State in 7 batch~s during 1993-96 as dctailed
here. The first batch of 64,000 seed of Paphio
I/wlabarica measuring 12.4 111m average length

wcr -. ranched ill Asht31l1udi .Iakc (Dfll fl apurwn) 011 18,2,l).3 in"l 25 1\1~ Uj'ca i ll I m ucpttl and Ih
'he was fen cd wilb JI ItIIll rlctlol1 sc eCH, On 11).3.93 Lhey mc.rl. UI'C r _0,4 mill and by 3.5.9.
they gr w I( 30.3 mm, In .h.e san care-a OJ IOutl
of 3D, 00 seed or P,lIIll/11lJarit£, mea, ur-illg 4.9 111m length were I1Hl'cd: i cag S as til ir izoC wa, smull ~) I' pl<lntrn~ in Ih" field, By 3.5.~3 they I.l !lHin 12,2 mill and were rancheu in the Iline
area. These seed were covered with I cm mesh synthetic net to protect them from predators. At Munmnbam P./ilCl/n!Jnrica occurs rarely. Hence a consignment of 8500 seed was ranched in a 10 m2 area on 19.2.93 in 0.5 mclepth. Theclamseecl measured 12.4 mm and they were covered with I cm mesh synthetic net. By the end of April they attained 23.4 mill length.
Taking into account the declining status of some of our prime fisheries, their high economic value and the prospecls of overexploitation of the wild stocks, the following species are proposed for pilot-scale 'uu\llching fOl'stuck enhancement al dif cren t ccnlT ' ulung ,he lndiwl COB' by the 'MFRrllnder the 9~h Five Year Plan (Table2~).
Besidc;'), utlder I he ndin 11-AU1:tra I i an C{)opcmttOI1
in &T, scurant:hillg lUi.," been I'oposcd fur slock enhnnu menl in Ihe Vizhf.njam I llY and Lit C( 1ll igu u!. water able 29).
9.2 Artificial fish habitats
A significant number of maritime nations arc showing increasing interest in artificial aquatic habitat enhancement programmes and about 40 countries in six continents have established such habitats to promote capture: fisheries productivity and production (Robert and Choule, 1983).
he. major bi ci IV of d yclnping arlitlciallet:f habitats is basically to improve the conventional, commercial and recreational fishing and to sustain marinc productivity. A variety of structures are used to attract various species of marine organisms. They range from improvement
66
Table 29. Propo,Sed searanching programmc for
the Vizhinjam bay and the contiguous Gull' or Mannm'- Wadge Bank -Minicoy lagoon - Cochill
coast under the New Horizon Inclia - Australia
cooperation in Science & Technology
Location Species No. of seed to he ranched in 5 years
(in million)
I. Vizhiniam (il Shrimp (l'.s/Y!iFem. M.t/fl/lsfmi, f.im(iru.,'j
(iil Pearl oysler (PJi/c({/({) (iii)Groupcr (E./IIIII·il/lI)
2. Mandapalll (i) Shrimp (I' .il/diclis.
P.sellli.wlclI/IIS) (ii) Pearl oyster (I'..fi/cllw)
(ii i) SUlJr\l 'nnw c.' ~ fI .. \nrJmj) ( IV) lrol p~r (F., (W/I'! wd
3. Tliticorin (i) Shrimp (P.illdiclis. !'-Se/lliSlIlclI/IIS)
(ii) Pearl oyster ({'..Ii/utili) (iii)Seacuclimber (H.sw/mtl (iv) Groupcr (E.WlIl'ill(/)
4. QlIilon (il Shrimp (I'.sll'!i(em. M.do/WIIlJ.I'.illl/iClIS)
5. Alleppey (i) Shrimp (P .. HyliFera. M.do/J.WJlli. l'.illdiclIs)
6. Cochin (i) Shrimp (P.s/y!Uim/.
M.d/lbS/ll/i. ('.il/die1/s)
7. Minicoy (il Pearl oy~ter (P.li,Cl//{f) (ii) SeaclIcul11bcr (H.S(.'II/Jrtt)
Total: Shrimp = 900 : Pearl oyster = 520 : Sea cucumber = 20 : Grouper = 50
All Total = 1490
){
16() I ()
24
16() 10 IR
36
um jo:
11\
J~()
172
:no
:m 2
to the indigenolls structures spread in extensive areas to very sophisticated concrete structures. Artificial fish habitats are being used at present to increase tuna catches in tile tropical Pacific, to augment demersal fish catches in the Southeast A,iaJl Wilt rn, l pr 'lid re<:realionu\ I. hill!" ill lh USA and to culture sheJJri.sh in Europentl wa lel's, J'lincl r I ef Hrc in US~ nv I' ' he 1.1."1 decade cIa c [0 arl i:-:mmI 11 <hing vill'lgc ' :l rO llg Ihe
disU'icl,'l ThifuvHI1 ul thupu am in Kcmla Mlu Ka n,Yaklllnnri lJnd hongall ul dist.\·j IS ill Tam il
a Ill . Work on efficien t d, ign <lnu fat ricuLioll of
allil'ieial feef~ ha'l hecn c Tied OLll lJY (i) lhe Fisheries Cell or the Programme fnl'COllllll'lnjty Devcropmcnl, Thil'lIVananlhapumm, (ii) the 'ouill

Table 30. Species composition in arlificial reefs in
the Thiruvananthapuram and Kanyakumari district
coasls
Local Name
Uralupara
Kanl1an I'olal
Pcrulllkanny
Ayala
Clathy
Vala Mural
Kurali
Kozh'iyala
Kozhuva Para
Chakani Para
Pola
Pam
Kozhuva
Vela Para
Kottan Pam
Vangada
KOlllali Para
Kallu Knnava
Others
Species
Atllie mate
I'riacaflt/llIs crucl/tallls
l'riacal/t/llIs /wal/1rllr
Raslrelliger kal/agllr/a
Abalistes stellatlls 01101111.1 lIiger
AlJlcfll/es Iziaw'
Lellzrilllis lIebll/OSl/.I·
Decapterus russelli
Cal'llllgllides sJl.
Cal'llflgoide.l· sp.
Llllitlllll.I·/lIlillllll.l·
Caraflgoiiles sJl.
Qtyin % in the tolnl
number of fish
41.20%
12.80%
10.30%
6.50'Yr
3.00%
2.70%
2.50%
2.40%
2.40%
2.10%
I.RO%
Cal'llflgoiiles gYl/1l1osletlzlls 1.40%
Carallgoides sJl. 1.20%
Car(lI/goitles sJl. 1.10%
Mega/aspis cordy/a 1.00%
Carallgoides sp. 1.00'Ye
Sepia pkllr{/Ollis 0.60%
6.00%
Towl number of lish 2.632
(Species less than 1% illnulIlocrs :In! included under 'others' except cuttletish)
Source: Al1ificial fish habitats. D'Cruz (199<;) .
Indian Federation of Fishermen, Thiruvananthapuram, (iii) The Waves, Madras and (iv) the Centre for Research on New International Economic Order, Madras.
D'Cruz (1995) observed that the selling up of artificial habitats for fisheries in the vicinity of the villages along thc KanyakumariThiruvananthapuram coasts enabled the fishermen to establish local fi sheries for the low skilled and aged fishermen on regular basis and for the skilled fishermen on occasional basis during the hetter catching season of AFH' s. It indicates that the prime objectiveoftheconstruclionof AFH's
67
is to create convenient and rewardin u rishino to '"
grounds by establishil)g local fisheries, especially during the lean fishing season (December t;) March) . He further showed that the rainy season (southwest monsoon) and the fair weather season (December to February) are the two lean seasons creating difficulties to the fishermen or Thiruvananthapuram coast. According to the fishermen. though there is better availability or fish in the sea during the monsoon, the heavy rains and the sur!' during this season result in lower catches. In the fair weather season, little or no fish is available in the shallow waters due 10
the crystal clear nonturhid seawater. He also observed that in the FAD's hall' or the total species was contributed by Priacanthus ' sp. (49.72%) and about a quarter was contri butcd by Sepia p/w/'{{olli.l'. Eventhough Priacwuhu.\·
sp. dominated in terms of number, a Sepia.l'p.
contributed much higher share in terms 01'
weight. Compared to the AR's, FAD's gave better daily income due to the dominance of the high
Table 31. Species composition in fish aggregating
devices in the Thiruvananthapuram and
Kanyakumari district coasts
Qty in % Local Name Species ill the total
number of 11sh
Kannan Pola I'rilll.'lIIlllillS <.'l'IIellllllll.l' 49.70%
Pri{{(:ClIII/IIIS /ll/lIIrlir
Kallu Kanava Sepill p//(/rt/ollis 23.4()%
Uralupara IIIII/e II/ale 8.30%
Ayala Raslrellijier kllllllgllrw 4.40'lf,
Clathy Aba/iSles sle//alll.l' 2.RO<)f
Odollus lIi~('I'
Mural DII.ulIlJlierillll<.'lIfli I.~()%
Vangada Mega/a.I,/!is cordy/a 1.:l0%
Kozhiyala Deca/llel'lls russelli U (I%
DeCliplel'lls IIIlU'I'OSOIi/(/
Others 7.30'71·
Total number of "sh 1.'),419
(Specie~ less than I % in numbers are included as others) Source: Artificial tish habitats. D'Cruz (1995).

value cuttlefish and squids (Tables 30 & 31).
It has been observed that since the AFH's have
a significant impact on the fisheries of the
artisanal fishing communities, they should be
encouraged on a large scale with the participation
of the community in selected villages for the
henefit of the nonmotorised fishermen who possess
only limited access to the resources.
10. Conclusion
Mariculture provides good opportunities for : (I) seafarming and associated activities of· stock
enhancement through searanching and artificial
fish hahitats, (2) land-hased sal ine aquaculture in
coastal zones using pump-fed or tide-led seawat~I;
or brackish water, and (3) hinterland aquaculture
in saline soil and saline aquifer ecosystems.
Whilecoastal land-based shrimp aquaculture has
grown rapidly in the current decade, the 1994-95
crop failures due to diseases have forced the
industry to adopt ecofriendly systems offarming.
The new approach is essentially of: (I) closed
systems of fanning coupled with the application
101' hiot chnologicai, 1m lerial rrodu Is; and (2 integration of compatible candidate species of
bivalves, fishes, seacucumbers and seaweeds in
the farming systems. The current practices have
the potential to make coastal aquaculture more
sustainable from the biological, ecological, legal,
social and economic points 01· view. As a result
of the adoption of these packages of practices the
industry is set to quickly revive and yield over
one lakh tonnes o/" shrimps during 1996 as
against about 75,000 tonnes during 1995. There
is, however, considerable fear of the outcome of
the Supreme Court case against coastal
aquaculture, which depends critically on access
to the s('(afronl. Seafarming in the open sea and
the contiguous more protected bays, coves, gulfs,
lakes, backwaters , lagoons and estuaries, inspite
of the good potential , remain dormant in India
mainly because of lack of awareness, issues of
ownership of sites, opposition from tr~ditional
fishermen and risks from natural calamities.
68
However, considerable R&D efforts have lken
initiated and pr!yate farms are being established
in the Kerala backwaters (for bivalves and
seaweeds) and also in the opensea in Tamil Nadu
(for groupers and bivalves) and . Kerala (for
bivalves) . Artificial fish habitat construction
and operation by the small scale fishermen in
the inshore fishing grounds has becomc a success
in parts of Kerala and Tamil Nadu and is set to
take off in Maharashtra, Andhra Pradesh and
Orissa. There is considerahle scope for the
expansion of the artificial fish hahitat programme
in all the maritime states where it has substantial
potential to become an industry as in Korea. The
Indian experience of one percent of searanchcd
banana shrimp entering the commercial catch
from Palk Bay from a mere ranching of 10 mill ion
seed over a period of 5 years and the Bohoi Sea
& Yellow Sea experience of about 96% of
searanched shrimp entering the commercial
catch frolll .a massive stocking programme suggest
that the shrimp stocks in the Indian seas,
particularly the gulfs (GulfofKutch, Cam bay and
Mannar), bays (Bays ofVizhinjam, Palk, Kakinada
and Waltair) the open Sandheacls off West
Bengal and the mudbanks of Kerala could he fast
revived and made very productive by searanching.
With an annual 8 billion shrimp seed capacity in
about 170 hatcheries located along the coasts or the maritime states and with only less than h,M
this quantity required for current farming, the
surplus seed could be used for searanching. The
resource for this purpose could be drawn from a
portion of the present one percent cess on
marine products export. The government of
India may consider this question and issue the
necessary guidelines for the implementation of
this programme. Purchase of seed at a prefixed
rate by the government may also serve. as a ,
support price in times of slump IJ1 price.
Simultaneously, finfish, bivalves, ahalones anci
seacucumbers also need to be taken up for
searanching.

The hinterland saline soil aquifer ecosystems are
now known to have the potential to produce at the
rate 01'2 to 3 tonnes of shrimps or marine fish per
hectare in single crops of about 6 months. With
about 8.5 million ha of inland saline ecosystem.
the country has vast scope for progressively
expanding this activity to commerical scales.
There is need to accelerate the R&D in this
regard by involving the State Departments of
risheries and agriculture. universities, NGO's,
cooperatives, farmers' association and
entrepreuners.
References
Appukuttan K.K . and Muthaiah, P.,1996.
Technology of edible oyster culture. Bull.
Cenf. Mar. Fish. Res. Insf., 48: 64-69.
D'Cruz, Titlo. , 1995. Artificial fish hahitats -
impacts on artisanal fisheries. Publ. South
Indian Federation of Fisherrnen Societies,
Trivalldntm, pp. 57
Dorairaj, K., Soundarajan, R. and Kandaswami,
D., 1985. Experimental cultureoftheshort
finned eel Anguilla bicolor hicolor Mc
Chell and. Proc. Symp. Coastal
Aquaculture, 3: 883-891., Mar. Bio. Ass.
India, 12-18 Jan. , 1980
Hamsa , K.M .S.A. and Mohammed Kasim
H.,1992. Growth and production potential
of young grouper Epinephalus tctuvifla
(forskal) reared in fixed net cages., 1. Mar.
Bio. Ass. India, 34( I & 2) : 271-276
Imre Csavas, 1995. "Status and outlook of World
Aquaculture" - Paper presented at the
Symposium on Sustainable Aquaculture.
James , D.B., Rajapandimr, M.E., Baskar, B .K.
and Gopinathan, c.P., 1989. Successful
induced spawning and rearing of the
holothurian Holothllriu (Metriatyla)
scabra Jaeger at Tuticorin. Mar. Fish.
"(for. Servo T&E Ser., 87 : 30-33.
69
James, P.S.B.R., Mohanraj, G., Rengaswamy,
V.S. and Raju, A.,1985. Preliminary
experiments on the culture of grey Illullets
at Mandapam. Proc. Symp. Coast({l
AquacuLture, 3: 791-796. Mar. Bio . .Ass.
India. Cochin 12-18 Jan. , 1980
James, P.S.B.R. Soundarajan. R. and Joseph Xavier
Rodrigo, 1985. Preliminary culture or fin
fishes in cages in the coastal waters ofPalk
Bay at Manclapam. Proc. SYIIIP. Coastoi
Aquaculture, 3: 910-9 I 5., Mar- Bio. Ass.
India, 12-18Jan. , 1980
Josilcen Jose, Arputharnj, M.R. Ramakrishnall.
A. and Viramani, A., 1996. Larval rearing
of the crab POI1/IIItfS pelagicus(Crustacea.
Portunidae) in hatchery at Mandapam
Regional Centre of CMFRI. Mar. Fish.
"ltor. Serv. T&E Sa .. 143: 23- 24.
Kuriakose, P.S. and Appukuttan, K.K., 1990.
Technology of mussel culture. Bull. Cent.
Mar. Fish. Res. Inst .. 48: 70-75.
Marichamy, R. and Rajapackiam, S., 1984. Culture
of larvae of Scylla serrato. Mar. Fish.
h!for. Servo T&E Sa., 58: 13- 15.
Marichamy, R. and Rajapackiam, S., 1992.
Experiments on larval rearing and seed
production of mud crab, Scylla serrato.
Pmc. «l Seminar 011 Mud Crab Culture.
Bay of Bengal Programme Rep., 51: 135-
141.
Ministry of Agriculture, 1992. Guidelines for
Sustai nablcDevelopment and Management
of Brackishwater Aquaculture.
Moriarity, D.J.W. , 1996. Microbial hiotechnology:
.. 1 key ingredient for sustainable
aquaculture. INFO FISH Internatiol1al, No.
4/96 July/ August 1996: 29-33.
Narasimham, K.A. and Lamxilatha, P., 1996. Clam
culture. Bull. Cellt.Mar. Fish. Res. Il1st ..
48: 76-87.

NEW, M.B. 1996. Responsible use of aquaculture
feeds . Aquaculture Asia. I (I): 3-15.
Pillai, N.N. , Radhakrishnan, E.V., Maheshwarudu,
G. , Arputharaj, M.R. and Gopalakrishnan,
K .N ., 1991 .Successful Searanching
ProgrammeorShrimpsbyCMFRI. CMFRI Newsletter, 52: 1-3.
Robert , G.S. and Sonujj Choule, 1983. Artificial
Habitat Technology in the World - Today
and Tomorrow. Paper presented at Japan
- US Symposium on Artificial Habitat for
70
fisheries Proceedings 1991, Tokyo, Japan,
pp. 3-9. ~
Victor, A.C.C. and Velayudhan, T.S. , 1996. Pearl
oysler farming and pearl produclion. Bull Cel/f. Mar. Fish. Res. Insf., 48: 56-63.
Venkatararnan, G., Ammerhamsa, K.M.S. and
Nammalwar, P., 1985. Fish culture in pen s
in the Gulf of Mannar, India. Pmc. Syrllp.
Coastal Aquaculture, 3: 951-954., Mar. Bin. Ass . India, 12- 18 Jan. , 1980, Cochin .

4
Application of Genetics to Aquaculture: Challenges, Strategies and Principles*
MERYL J. WILLIAMS
International Cel1lrefor Livillg Aquatic Resources Manageme1/.t (ICLARM)
Manila, Philippines
I. Introduction ." ... .. ...... .................... .............. ..... ......... .. .......... ... ... ............................ ............. 71
2. Genetic Improvemenl .. ... ........... .. .. ......... ..... .... ................... .... ..... .... .... ...... ......... .. . 1 . .......... .. 72
3. Breeding Strategies ..... ............ .............. . ., ...... .. , ....... ... ....... ...... ......... ....... ........ .. .......... ....... 73
4. Case Studies ..... .. ............. ............. ... ..................................... ......... .. ........ " .............. ........ " .... 7.
References
1. Introduction
I wish to draw your attention to some basic strategies and principles of aquaculture genetics,
as we at ICLARM see them. We are of course guided by our colleagues from the world of plant
and animal breeding. To set the stage for discussion, I wish to paint with a broad brush some challenges ahead of us.
We all are aware of the rapid changes in our world.
The pace has been so overwhelming that the rcsources that support and sustain life on this planet are threatened. The threat comes mainly
from unprecedented world population growth, super fast economic growth, and the ever increasing human demands which are fast exceeding the
limits of earths natural resource systems. About 90 million people are being added on this planet. year after year. We have virtually crossed the
thresholds of ahnost all sectors offood supply due to factors such as overfishing, overgrazing, soil erosion, deforestation, etc. We have to regain control of our destiny.
Capture fisheries, hitherto considered as one of the last frontiers for supply of affordable animal protein, is also severely threatened. Over one
billion people in developing countries depend on fish as the primary source of animal protein. In Asia and the Pacific region, fish provides about 50
to 70% of animal protein and contributes substantially to the economics of the developing nations. Since about 1990, however, the gap
between the demand for and supply of food fish has been rapidly widening due to stagnating production of capture tisheries resulting from overfishing and destructive fishing practices and
* Prepared·by /!1Il!Jekar Ekllllillh. Gelletic: Enhallcement and Breedinf:i ProJ:1'll1ll (GEllP) . ICLARM. Manila. Phitippilles.
AQUACULTURE AND THE ENVIRONMENT ISBN 81·85340·17·X
71
Copy right © 1999 Asian Fisheries Society, Indian Branch
All rights of reproduction in any form reserved
. . ~

. ~,
increasing demand due to population growth and
per capita income. To maintain consumption at
about its current level ( 13.0 kg/caput/year in live
weight equivalent), the Food and Agriculture
Organization of the United Nations predicts that
the world will require food fi sh supplies of about
91 million lonnes. The contribution to food fish
from marine and freshwater fi sheries is likely to
oscillate around 60 million tonnes per year.
Consequently, the balance of31 million tonnes in
the supply of food fish required by the year 20 I 0
would have to come from aquaculture . This
implies a doubling of the estimated 1993
aquacu I ture production of nearly 16m i II ion t~nnes.
We are confronted with the challenge of doubling .
of aquaculture production in about 10 years. Most
, of the ,rroduc(ipn will continue to come from
developing Asian countries and from freshwater
- fish species, in flarticulaf, Asian carps and ti lupias.
which together form the mainstay of many small
scale aquaculture enterprises in the tropica l
developing world.
2. Genetic Improvement
Genetic improvement is one of the promising
approaches to increasing aquaculture yields per
unit area and time, as demonstrated in agriculture
and livestock . Application of genetics in
aquaculture, however. has just begun . Many of
the most widely farmed fish species were not even
bred in captivity until the I 960s. Consequently,
productivity is low and the stocks Ll sed in
aquaculture are generally similar to wild
undomesticated stocks and in some situations
there is strong evidence of genetic deterioration.
This is analogolls to the situation in thc
development of agriculture long before crop plants
and domestic mammals and birds reached their
present level or production efficiency.
Strategic research for genetic improvement of
aquatic organisms in general must consider a
long-term view of the global needs for
documentation/conservation. evaluation, and
util ization of genetic resources. It should consider
72
not only the technical aspects of breed
improvement (sych as genotype x environment
interactions) bUl also the perspectives of users -
farmers and consumers. It should serve thecx isting
and the emergent aquaculture enterprises. Genetic
improvement and development of improved
breed ', howc\'el', is only the haJr Ihe , IPIY . The
other crucial aspect is their djssem i nation to reach
the tnrg teel bClleficial'ies aileel i"'ely, mc.:luumg monitoring of tile impact and adoption ofimprovetl
breeds. Management of and access to gennplaslll
are also becoming increasingly important issues.
uJ\derlh 'new' nnvcnliollon Biolugical Div fli ily. which went into force about three years ago .
It should also be recognized that tropical
aquaculture at present typically involves simple.
low eXlcrn,lI-inpu\ y~ tcms, operaled by sn11l ll
scale farmers. These systems are farfrol1l reachi ng
their opfimal effi~iency . The general economic
and infrastructure development arc also very
incmnp tct . HoweltcJ, a IU "cu llll r~ rcprc:;cn ls a new dimension in farming systems and a potential
new venture for millions of small-scale farmers
whether in the form of fish farms per se or new
components integrated with other agricultural
enterprises. Therefore. genetic improvement
strategies destined to benefit the majority of
peoples in the aquaculture industry should, to the
extent possible, involve relatively minoror gradual
structural changes. The products or genetic
research lllust help to consolidate the pivotal role
of small-scale farmers in food production and
food security.
It is with this basic guiding principles thaI
ICLARM. ii' . -opelalioll with lh Phili ppine national institutions (Bureau of Fisheries and
Aquatic Resources and the Central Luzon State
Un ivcl' ily a nd lnmwcgian lnsii tu l of
Aqua.cultuJ'e (AKVAFORSK), .ini llated lhc glohal projecl on the "Geneti c fmpl'O'i'cmcJ\l r Fal'mc(1 Til apins" ([he GIFT Pro ' cct) I funded hy I he U It i le I Nations De dOl mont Prog! mme 1md the Asi.m DevelopmcntBank. Thi w rk has a.l rcudy leu IH
rhe esmbJi:hmentof': (.\) NallotlalTHapiaBrecding

Programs in the Philippines, Vietnam and Bangladesh; and (b) the International Network on
Genetics in Aquaculture (INGA) participated in
by 14 Asian and African countries.
3. Breeding Strategies
The relatively simple breeding strategies that
ICLARM and its research partners have pioneered
for the developing world, using Nile tilapia as a
test species, are extremely effective contributors
to increasing the productivity and production
efficiency of aquaculture. Conventional selection
programs are well regarded in public opinion. In
one form or the other, they account for most ofthc
improvements that have been made in
domesticatcd plants and animals . They serve a very useful public service function relatively free
of profit motives, intellectual property rights, and
the structural changes for implementing such
programs are relatively minor. Selection, however, is not an exclusive approach. Emergent
biotechnological approaches can be woven into
such breeding programs, after assessing .their
impact on biodiversity, socioeconomics and the
environment.
4. Case Studies
Some approaches to apply the basic principles of
quantitative genetics to aquaculture are focused
below.
The first of these ' is an attempt to demonstrate,
using Indian carp culture as an example, how
relatively minor changes in routine broodstock
management practices can result in maximising
the genetic potential of aquaculture stocks.
The second casc study on Nile ti lapia, through the
GIFT Project, demonstrates the enormous gains
in production efficiency that arc possible from a
systematic selection program. The GIFT research
on Nile tilapia is one major example of
multidisciplinary and participatory research
initiative in the Region. It has successfully
integrated a number of activities along the
73
continuum from the documentation of tilapia
genetic resources ·through to their systematic
evaluation and utilization in national breeding
programs. It has explicitly considered ex-ante the
potential benefits to a spectrum of aquaculture
enterprises, ranging from extcnsi ve small-scale to
semi-intensive medium-scale farms.
4.1. Simple brood stock managementpractices to control indirect selection and inbreeding in aquaculture of Indian major carps
This case study on Indian major carps is based on
a series of studies (spanning about 10 years)
carried out by ICLARM Scientist Ambekar Eknath
along with his research supervisor Prof. Roger
Doyle of the Dalhousie University (Eknath and
Doyle, 1985a, 1985b, 1990; Eknath, 1991). One
of the major conclusions of this study can be
paraphrased as follows:
"Far from being sources of improved fish seed to fish fanners, some Indian carp hatcheries may actually be doing the reverse - inadvertently causing deletel'ious inbreeding and negative
selection (during routine broodstock manageinellt andfishseedproduction) (Ind. thereby. producing slowergrowingfish ". every generation and ever), cycle offish seed production"
Overall, these studies have been considered by
scientist-peers around the world as "pioneering
and bench-mark" studies in tropical fish breeding
and genetics. It has involved a biological system,
the genetics of which were virtually unknown.
There was also was very little background
information to initiate the research with.
It was initiated to explore the widespread concerns
among Indian fish farmers and government
hatchery managers that: (a) growth performance
of Indian carps in aquaculture systems were
declining year after year; (b) culture carp stocks
may be severely inbred; (c) there were increased
incidence of morphological deformities among
some carp species. Through deductive reasoning

i.l' .. after tlCCOuhring for vari ou oliler faclOl's suchaspon I ~r.i l ·z.at ion proCedure .• waler quali!y, am bient temperature, etc.), the hatchery managers had concluded that the problems they encountered were mostly genetic in nature.
The ~l lIdy I 'giln by luying t.luwn u conceplufli !'e:o; HfC h f Hmewllrk to flnury e Ihe va iot! "s-eJe lion pre 'sUI'cs j
, [ha l ~u rtured fi. h stocks have loconlel1d wi th ill 10 t:d <l.qu culluresysloms an lhen has I'l'Oceelcd (0 obtai n (juclnli lllt ive eslimates oj' !celion pre su sad I'"t( s J' inbreeding. It alsu r commend . om pr cLical OIUfiolls to avoid Nuch Inditecl selection and
Inbre«ling.
Research framework
Aquaculture systems can be broadly classified into two categories: "Open" and "Closed" -depending on the way in which young fish arc obtained for rearing and on the scope for possible genetic changes.
[11 theopcn sy lcm,lhe production eyel begins by collecting young fi 'll frmn nature ,wei rcaring them tu harvc [able . ize under contJ"OlIed conditions. Many aqua 1I1IUrc enfcrpl'i es depend orl natural ourees for the rmpply or fj 'b seed, .
Olllbic examples arc milkfi ' h. mullets, arid shellfish farmillg, Since tilt; productiun invari ably cnd . • Ihere i very IiHle scope hr cUlllulative genetic cbanges.
[n the cI ~ed sy, tern of aquacullurc , ind iv iduals raised within the system contribute progeny to the next round of production. This will then accumulate genetic effects from generation to generation. Genetic changes in closed populations can result not only from conscious efforts to directly improve the stocks but also from "indirect" selection brought about by inadvertent aquaculture management practices plus natural selection within the aquaculture realm.
In the case of aquaculture of Indian carps, since the advent of the hypophysation technique of
74
induced spawning In the mid-1950s , carp hatcheries have been virtually closed to genctic exchange wil.l the wild stock. . I-htehll ries routinely raise their own stock of breeders and usually do not receive back mature individuals from grow-out areas. Each carp hatchcry, theref re, c:tn he regarded ;\ . an isnlnlecl, sc!fsustaining, genetically closed unit. Whether or not conscious artificial selection for genetic improvemcnt is practised, there will always be indirect selection pressures exerted by farm management practices such as choice of founding stock, the number of breeders maintained in the hatch-erie , the type of' mating system followed during artificial propagation and seed production, the method of replenishing the broodstock, stocking density, feeding regime, etc. Such accumulation r genetic changes from gL::nerut iO! . to generation will eventually lead to permanent changes in the cultured stocks. The impact orsuch indirect selection can be of same magnitude as
direcl.,col1. 'jou ·seiecljon. andean either !:l L!gm~rH
or di min ish theeffeetiveness of organ i zed selection programs. Therefore, a careful analysis and designing or management practiccs to control the 0 selection free: .. 18 necessary in order to
maximise the genetic potential 01' the cultured stock.
Estimation of indirect selection
An essential pre-requisite for selcction llnalY1;i is data 01 1 eompanlilve pcrl{)m1!mcc of individuals in a population . Specifically , "longitudinal" data on traits such as growth rates, age at first maturity, and general growth performance throughout the life of an individual are necessary. Such data were unavailable from Indian carp hatcheries. Eknath and Doyle (1985a) estimated these growth and reproduction parameters by stati stical manipulation of information from important fish sc'lle fea.lures. namely, number and radial measurements of growlhchccks, circuli 'OUll lS, Imdcil'culu sJ.mcln~.
The approach was to develop a linear structural

h
equation model by specifying a priori the inter
relationships between the "observcd" scale features
and the unobservcd life-history variables to be
estimated. The distribution of variables were
assumed to be m u 1 ti variate normal and the sol u tion
to the structural model was obtained by
confirmatory factor analysis.
The quantitative estimates of various life-history
trajts were then used to determine the mean
superiority of individuals (fora given trait) selected
relative to thc mean population value. In genetic
parlance, this is called intensity of selection. In
the fish hatcheries surveyed in Karnataka State,
the results indicated that the broodstock selection
was sjze selective, exerting strong negativc
selection on pre-spawning growth performancc
and strong positive selcction on age at first
spawning. In other words, there was a tendency in
these hatcheries to brecd inadvertently slower
growing and latcr maturing individuals. Thc rate
of response undcrthis "negative" selection regimen
could not be predicted bccausc heritabilities and
genetic correlations between various life-history
traits are not known. The overlapping generations
and multiple-age structure of the carp populations
is another factor to be considered in determining
the response to selection. Nevertheless, one of the
easiest ways of avoiding such negative selection
is to select broodstock when they are young and
when on Iy fast growing indi viduals have matured .
A hatchery manager may also consider marking
of individuals of different year classes. This way,
relatively larger individuals of a given yearclass
can be chosen for seed production and brood stock
replenishment.
Estimation of rates of inbreeding
Framewo}'kfo}'analysis: Inbreeding can be broadly
defined as the mating together of individuals that
are related to each other by common ancestry.
The degree of relationship between mating pairs
is measured as the coefficient of inbreeding (F).
Inbreeding is acumulative phenomenon. The rate
75
of accumulation of inbreeding per generation is
denoted by F. The key parameter for estimating
rate of inbreeding is the effective population size
(N). F is inversely related Lo Nc
'
In finite genetically closed hatchery popUlations,
inbreeding can occur when individuals for replen
ishment of brood stock come from within the same
hatchery . The parameter, N,. is determined not by
the total number of breeders used for fish seed
production every year but by the number of
individuals that eventually contribute progeny for
the replenishment of the broodstock. Speciiically.
it is the family size and replacement success
which determine Nc
' Family size refers to the
number of progeny of a parent that eventually
become breeding individuals in the next generation.
Nc will also be determined by the number ofmales
and females contributing progeny to the broodstock
pool.
In order to estimate inbreeding the broodstock
management practices should first be mapped and
understood. Since data on pedigree of individuals
andlor direct census data for estimation of
inbreeding using conventional techniques were
not available, Eknath and Doyle (J 990) estimated
Nc and the rate of inbreeding as a function of the
number of individuals entering the broodstock
population each year and the variance of their
reproductive success.
Results from asurvey of .carp hatcheries throughout
Karnataka State indicated that the effective
population size N,. ranged from as low as 3 to a
maximum of only 30, and the rate of inbreeding
ranged from 2% to 17% - an evidence that there
was indeed rapid inbreeding of carp stocks in
hatcheries.
Significance of the study
For the first time, Eknath and Doyle were able to
explore and provide some practical solutions to
the widespread declining growth performance of
hatchery-reared Indian carps. Overall, the reseal'ch
has led to : (a) the undcrstanding of the impact of

"indirect" selection exerted during routine hatchery
management practices; (b) approaches to estimate
(and the first ever estimates) the magnitude of
"indirect" selection and the rates of inbreeding;
(e) practical recommendations to avoid negative
selection and inbreeding. The study also
demonstrates that, even in the absence of an
organized genetic improvement program,
relatively minor changes in routine broodstock
management practices in Indian carp hatcheries
can bring about rapid genetic gains in growth
performance of aquaculture stocks. The key to
this, however, is to maintain proper records of
various hatchery management practices and
performance of stocks at various stages of the
production cycle. Genetic gains in growth
performance in the range of 10- 15% per generation
are possible. Lastly, without this study, an
extremely cost-effective and simple approach to
genetic improvement of carps would almost
certainly have been neglected.
This study has also laid the foundation for several
major aquaculture genetics research initiatives in
India: (a) the India-Norway collaborative research
project on the 'Selective Breeding of Rohu' at the
Central Institute of Freshwater Aquaculture
(CIFA) sponsored by the Indian Council of
Agricultural Research and the NORAD; (b) The
India-UK project on the "Genetic Improvement of
Catla" at the University of Agricultural Sciences,
Bangalore.
Under the auspices of INGA, ICLARM in
partnership with Bangladesh, Peoples Republic
of China, India, Indonesia, Thailand and Vietnam,
will soon initiate a collaborative research and
training project on the Genetic Improvement of
Carps in Asia. This project will be funded partially
by the Asian Development Bank.
This Project seeks to build on early research on
genetic improvement of carps for aquaculture.
The planned major acti vities during the first phase
of the Project (first quarter of 1997 to Dec. 1999)
will include: (a) systematic documentation of carp
76
genetic resources fo)'aquaculturc ; (b) prioritization
of species, fmming systems, and breeding goals;
(c) designing of research activities based on
identified priorities; and (d) start-up of research
activities leading to thedevelopmcntofgenctically
improved carp strains.
Work will begin aftcr an extensivc, objective and
pragmatic research prioritization exercise.
ICLARM and its partners will be (a) assessing
how and to what extent existing carp species/
strains are valued by different groups; (b)
estimating futurc demand by income groups: (c)
analyzing present and future importaneeof various
carp-based farming systems; (d) assessing the
relative economic importance of various traits.
The analysis will be based on field surveys and
sccondary information. Based on the results of the
priorities exercise, location-speci fic genetic
experiments will be initiated.
Systenlatic documentatioll of carp genetic
resources will involve collation of all available
information, including indigenous knowledge in
the participating member-countries. Workshops
will be held prior to and after this exercise anel the
outcome will be a book on "Carp gcnctic resources
for aquaculturc !Il Asia." Training will be
organized by ICLARM and its partners in the
assessment of genetic rcsources, quantitative
genetics, methods for research prioritisation and
applied carp breeding techniques .
4.2. Genetic improvement of Nile tilapia (Oreochromis niloticllS)
Background
Tilapia farming worldwide is now in a dynamic
state of cxpansion to satisfy both the domestic and
international markets. FAOstatistics reporttilapia
culture in at least 75 countries . Although several
tilapia species are cultured, thc most widely
preferred (in over 40 countrics) is the Nile tilapia
Oreochromis niloticus, which contributes about
55% to the global production of about 450,000 ~
(Pullin etal. 1994).

Unlike the farming or many species of indigenous
rish in the tropics and the subtropics, the tilapias
represent a special scenario. The natural tilapia
genetic resources arc restricted to Africa and the
Levant. whereas the main aquaculture industries
are at present in Asia. where they contribute about
10% of the total finfish production from
aquaculture. The glohal outlook forti lapia farm ing
has been dealt with extensively by Pullin et al. (1994). Pullin (in press) has described in detail
the perceived constraints to future expansion of
tilapia culture. These include negative attitudes
and policies, inadequate research support, poor
hreeds , poor non-sustainable farming systems,
and possihle adverse environmental impacts.
Tilapias also have the rare distinction of being the
subject of more research and debate than perhaps
any other tropical farmed fish (Pullin et. al. 1994). In addition to the vast information compiled from
various field and laboratory sources, three
international symposia on tilapias in aquaculture
have been held. The knowledge base, however,
still lacks an interdisciplinary approach to match
development efforts and the needs and
circumstances of producers and consumers (Pullin
and Maclean, 1992).
The focus of this part of the presentation is on the
results of a multidisciplinary research initiative
being carried out by ICLARM and its research
partners - from documentation of tilapia genetic
resources, their systematic characterization,
evaluation. andutiJization in applied national fish
breeding programs, to monitoring of the adoption
of genetically improved tilapia breeds with due
regard to their impact on equity, environment, and
biodiversity.
The need for genetic improvement
As described earlier, natural tilapia genetic
resources are restricted to Africa whereas the
main aquaculture industries are at present in Asia.
The history of introductions oftilapias (described
above) suggests that most farmed tilapias derive
77
from very small founder stocks (as reviewed earlicr
by Pullin and Capifi, 1988; Eknath. 1995). With
the notable exceptions of Israel and to a certain
extent, of Taiwan, genetic improvement rescarch
destined to benefit the existing and the emergent
tilapia industry has scarcely begun. The cost or
lost opportunities has heen considerable. The
stocks in current usc by Asian farmers are close to
wild undomesticated stocks or perhaps worse
(Eknath ef of, 1993).
Application of genetics to tilapia fanning, on the
other hand, can be a complex activity for several
rcasons: (a) diversity of farming systems; (b)
d iversi ty rl l' 11 !;lei. and op]1{) l'mni l i ~ in I iJap i,lgrowing countries; (c) diversity of markets; and
(d) the general lack of infrastructure development
to successfully disseminate the results of genetic
improvement programs to benefit producers and
consumers.
The basic strategy alld principles
Before embarking on a research effort in genctics .
it should be recognized that the tilapia industry at
present is evolving. Aquaculture in general and
tilapia culture in particular, represents a new
dimension in fish farming not only to thc existing
farmers hut also potentially to many new entrants
to aquaCUlture. At present, as seen in the poultry
inJustr , Ihe 'blildy·trd' Iyp Lililp ia farmi ng
coexists with relatively sophisticated mediulll
and large-scale corporate farms. Therefore, equ ity
and socio-cconornic impacts of research arc
important considerations. Also. genetic
improvement strategies destined to bencfit the
aquaculture industry should, to the extent possible.
presume relatively minor or gradual structural
changes. The lessons learned from agriculture
and livestock research cannot he ignored. While
the products of genetic research should assist in
enhancing the competitiveness of the pri vate sector.
it should. at the same time, consolidate the pivotal
role of small-scale farmers in food production and
food secmity.
With these guiding principles, ICLARM initiated
a major strategic research and training initiative in
fish breeding genetics through the UNDP/ADB
funded project known as the "Genetic
Improvement of Farmed Tilapia" (GIFT). The
primary objective was to develop effective ways
of producing improved breeds of Nile tilapia for
low external input aquaculture systems, and to
provide improved breeds to national and regional
testing programs in cooperation with farmers.
4.3. The GIFT project
The Project was established in 1988 through
collaboration among the Philippine national
institutions (Bureau of Fisheries and Aquatic
Resources, the Central Luzon State University
and the University of the Philippines), the
Norwegian Institute of Aquaculture Research
(AKY AFORSK), and ICLARM, and funded by
the UNDP and ADB.
The process
At the very outset, the GIFT team considered the
relative economic importance of each of the diverse
tilapia farmi ng systems. A grow-out period of 90
days was chosen as a representative production
cycle. Research methods forevaluation of culture
performance in these diverse test environments
were then refined.
Based on a 1987 Workshop in Bangkok
recommendations and identification of sources of
pure tilapia stocks, the GIFT team made the first
ever collections in 1988 and direct transfer of Nile
tilapia from Africa to tropical Southeast Asia.
Breeders (150-160) or fingerlings (200-800) were
collected in Egypt, Ghana, Kenya and Senegal, in
collaboration with, among many, the University
of Hamburg, Germany; the Musee Royal de I'
Afrique Centrale, Tervuren, Belgium; the Institute
of Aquatic Biology, Ghana; the Suez Canal
University and the Central Laboratory for
Aquaculture Research, Egypt; and the Baobab
Farms, Mombasa, Kenya. The fish were held in
quarantine at NFFfRCIBFAR. The team worked
with the BFAR Fish Health Unit to develop
78
quarantine protocols: a model for use elsewherc.
Experimental stoc~s of four Phil ippinecommercial
Nile tilapia strains were also gathered. giving a
total of eight strains for study . All eight strains
were described using biochemical and
morphometric techniques and held in a newly
constructed Tilapia Germplasm Reference
Collection Center at the NFFTRC/BFAR .
Spermatozoa from tilapia founder stocks and
selected breeders are also cryoprcscrved, as part
of a small tilapia genebank, for further research.
The Project's first experiment was to investigate
the magnitude of genotype x environment
interactions (GE). A total of 11,400 individually
tagged fingerlings from all eight founder sti'ains
were distributed to I I test environments and
communally reared for about 90 days . The GE
was very low. inoi'<ltiol' IlO Iteed to develop
environment-specific strains for each of the
different famling systems used in the test. Some
of the African strains grew much faster than the
Asian farmed strains.
This GE experiment was followed by a complete
8 x 8 diallel crossing experiment, producing all M possible hybrid crosses among the strains in order
to estimate the magnitude of heterosis or 'hybrid
vigor'. The estimated gain in growth and survival
by crossbreeding was too low to be of significance
in an applied breeding program. A simple pure
breeding strategy was then started by selecting
best growing individuals from the 25 best
perfomling purebred and crossbred groups (out of
the 64 evaluated) to build agenetically mixed base
population (synthetic breed). This synthetic breed
served as the base for further generations of
selection and purebreeding.
Selection means breeding from the 'bes t'
individuals. In one form or another, it accounts for
most of the improvements that have been made in
domesticated plants and animals. There has been
no equivalent effort for fish. The GIFT team
adopted a combined family and within family
selection strategy. The test fish were ranked based

011 'breeding value' - the additive genetic value of
an individual - estimated by evaluating the
performance of the individual itself and its full
and half-sibs. Afteronlyone generation ol'selection
in the synthctic brecd, [hc selected fish grew 26%
faster in on-station trials than the prcvious
generation and 75% faster than the mosteommonly
farmed strain in the Philippines. The tcam has
been evaluating in every successivc gencration,
about20,000 individually tagged fingerlings from
120-200 selected full-sib familics (within 100
half-sib families) in a variety of test environments.
The GIFT strain is now in its sixth generation of
combined family selection . The avcrage genetic
gain per generation across five generations of
sclection carricd out so far has been about 12-
17%. The potential for developing latc-maturing
tilapias and inclusion of this important trait in thc
on-going selection (for growth performancc)
program are being investigated.
Some early impacts
In 1993, the Philippine President, Fidel V. Ramos,
launchcd the national distribution of the GIFT
Breed . The Philippines has since initiated a
National Ti lapia Breeding Program. In preparation
for the development of national tilapia breeding
programs elsewhere in Asia, the social, economic
and environmental impact of ncw tilapia breeds
are being investigated in a range of aquaculturc
systems in Bangladesh, China, Indonesia, Thailand
and Vietnam.
The early achievements of the GIFT Project has
already led to the establishment of an International
Network on Genetics in Aquaculture (Seshu et al.
1994). Thirteen countries are collaborating in
research and exchange of genetic materials,
initially tilapias and carps: Bangladesh, China,
Coted 'Ivoire, Egypt, Fiji, Ghana, India, Indonesia,
Malawi , Malaysia, the Philippines, Thailand and
Vietnam. ICLARM is the mcmber-coordinator.
Nature of GIFT teclinology
The GIFT Project has demonstrated clearly the
79
enormous gains in economic performance of
farmed tilapia that are,possible from a systcmatic
selection program. Without it, an ex.tremely cosI
effective and simple route to genetic improvemenl
would almost certainly have been further neglected
in favor of more costly and complex genetic
managemcnt and biotechnological approaches.
As pointed oul earlier, selective breeding is not an
exclusivc approach. Emergent technologies such
as ploidy manipUlation, lransgenics, eLc., can be
woven into such breeding schemes, after assessing
their environmental and social impacts.
The comparative performance of GIFT and
existing tilapia (mostly 'Israel' strain) strains was
evaluated in 8 provinces of the Philippines ,
representing different agroecological
environments, during 1992 to 1994. ResulLs
revcal that thc GIFT strain has a significant and
positive impact on both average weight and
survival rate. The GIFT strain had 37% highcr
growth rate and about 23% higher survival rale.
To investigate Lhe performance of the GIFT strain
under the di verse en vi ronments ofti lapia producing
countries of Asia , the GIFT tish are being tested in
5 countries outside the Philippines: Bangladesh,
China, Indonesia, Thailand, and Vietnam. In
Bangladesh, where Nilc tilapia has a short history
with very limited brood stock management, thc
GIFT strain appears to be 50% superior, in terms
of growth, to local strain. In China, Indonesia,
Thailand and Vietnam, where there arc longer
histories of tilapia farming, greater climatic
variation, and therefore the possibility of both
natural and artificial selection of local strains to
their environments, the GIFT strain appears to be
about 10-15% superior to local strains in terms of
growth. The on-station data did not show any
definite pattern in tenl1S of survival.
We fitted a stochastic frontier model of average
weight at harvest based on the on-station
experimental data from Bangladesh, China,
Thailand and Vietnam' using the maximum
likelihood estimation technique. The estimated

frontier model shows the maximum hody weight
that can he ohtained from a specific level of
inputs. The yield potential of the GIFT strain is
ahout I I % higher than that of the hest existing
strain . It is worthwhile to note here that the GIFT
strain is performing well in all the location and the
existing strains are location-spec ific; a particular
local strain may he hetter in one location hut not in
another.
The usc of sex-reversal technology with the GIFT
fish can raise the yield potential of Nile tilapia
further. Results of experiments conducted at the
Asian Institute of Technology (AIT), Thailand
indicate that the net yield of sex-reversed GIFT
fish was 28% higher than the yield of sex reversed
Chitlada strain and 24% higher yield was ohserved
for non sex-reversed GIFT fish over Chitlada
strai n. The net yield of sex- reversed GIFT fish
was about 5% higher than that of non sex-reversed
GIFT fish.
Product market effect of GIFT technology
The gain from research in any cOlllmodity illld its
distri~ution among various strata of society
depef)~[1!alllong other factors, price elasticities
of demand for and supply 01' the cQmmodities ,
proportion ill' output consumed at home, qndthe
level of international trade.
As the GIFT technology will enahle the fanners to
produce more using the same level of inputs, the
cost per kilogram of fish produced should decline.
In countries like Taiwan, where the international
trade affects the tilapia price, the adoption of yield
increasi ng GIFT technology may not cause major
pricc reduction and most of the benefit due to the
adoption of technology will accrue to producers in
direct proportion to their sales.
In the Philippines and Thailand. where ahout 80-
90% oftilapia production are marketed, consumers
will generally henefit from technological progress
(the GIFT technology). As tilapia is consumed
mainly hy poor people hecause of its relatively
80
low price and as the price elasticity of demand for
fish is higher f~p poorer people than for the rich ,
yield increases hy usi ng GIFT fish would benefit
mostly these poor consumers.
In countries like Bangladesh, where tilapia fish
farmers consume ahout 70% of their produce, the
major portion of economic gain that is due to the
adoption of GIFT technology will be internalized
by producers, especially the small subsistence
ones. In suhsistence farming , the reduction in
market price due to higher production has relativel y
little intluence on producers' income.
References
Eknath, A.E. and Doyle, RW ., 1985. Indirect
selection for growth and life - history traits
in Indian Carp Aquaculture I. Effects of
broodstock management. Aquaculture
49( 1):73-84.
Eknath. A.E. and Doyle, R.W., 1985. Maximum
likelihood estimation of 'unobservahle'
growth and development rates using scale
data application tocarp aquaculture in India.
AqU({Cllltllre 49( I ):55-71 .
Eknath, A.E., and Doyle, RW., 1990. Effective
population s ize and rate of inbreeding in
aquaculture of Indian major carps.
Aquaculture S5( 14): 293-305.
Eknath, A .E . , 1991 . Simple brood s tock
management to control indirect selection
and inhreeding : lndian carp example .
NAGA:ICLARM Q. 14(2): 13-14.
Pullin,RS.V.,Bimhao, M.A.P. and Bimhao, G.B. ,
1994. World outlook Cor tilapia Carrn i ng .
Paper presented at the First International
Symposium on Aquaculture. 9-1 I, June
1994, VeraCruz, Mexico.
Eknath, A.E., Tayamen , M .M., Palada de Vera.
M .S ., Danting, J.e., Reyes, R.A ., Dionisio,
E.E., Capili, 1.B., Bolivar, H.L., Abella.

T.A., Circa, A.V., Bentsen , H.B., Gjerde,
B., Gjedrem, T. and Pullin , R.S.V., 1993.
Genetic improvement of farmed tilapias:
The growth performance of eight strains of
Oreochromis niloticus tested in different
farm environments. Aquaculture II I (1/
4}: 171-188.
Pullin, R.S.V. and Maclean , .f.L. , 1992. Analysis
of research for the development of tilapia
f ~lI'ming an interdisciplinary approach is
lacking. Neth. 1. Zoo!. 42(213):512-522.
Pullin , R.S.V. and Capilli, J.B., 1988. Genetic
improvement of tilapias: problems ancl
81
~ prospectus.ICLAf?M COIlt: Proc. (15):2SlJ-266.
Eknath, A.E., 1995. The Nile tilapia, p. 176-llJ4.
In: Thorpe, J.E., G.A.E. Gali, J.E. Lannan
and C.E. Nash. (cds .) Conservation ofFish
and Shellfish Resources: Managing
Diversity, Chapter 8. Acade mic Press,
London.
Seshu, D.V., Eknath, A.E. and Pullin, R.S.V .,
1994.lnternalional Network on Genetics in
Aquaculture. International Centre for Living
Aquatic Resources Managemen[' Makati
City.
I~
Ll I3AAAY
~ 1 ~
Gllnl, nl ~ "II I
~ - oBi 014, IIchi. - 082 014,
F"",,r;;~
,Ich Ill8tlMl ;,,;. ; i'f)
( 111\11 fl )
Copyright © 2022 FDOKUMEN