Numerical simulations of super-luminous supernovae of type IIn
24
arXiv:1503.05463v1 [astro-ph.SR] 18 Mar 2015 Mon. Not. R. Astron. Soc. 000, 1–24 (2011) Printed 24 August 2018 (MN L A T E X style file v2.2) Numerical simulations of super-luminous supernovae of type IIn Luc Dessart, 1 Edouard Audit, 2 and D. John Hillier 3 1 : Laboratoire Lagrange, UMR7293, Universit´ e Nice Sophia-Antipolis, CNRS, Observatoire de la Cˆ ote d’Azur, 06300 Nice, France. 2 : CEA, Maison de la Simulation, USR 3441, CEA-CNRS-INRIA- Univ. Paris-Sud - Univ. de Versailles, 91191, Gif-sur-Yvette Cedex, France. 3 : Department of Physics and Astronomy & Pittsburgh Particle Physics, Astrophysics, and Cosmology Center (PITT PACC), University of Pittsburgh, 3941 O’Hara Street, Pittsburgh, PA 15260, USA. Accepted 2015 March 18. Received 2015 March 09; in original form 2015 January 06 ABSTRACT We present numerical simulations that include 1-D Eulerian multi-group radiation- hydrodynamics, 1-D non-Local-Thermodynamic-Equilibrium (non-LTE) radiative transfer, and 2-D polarised radiative transfer for super-luminous interacting supernovae (SNe). Our reference model is a ∼10 M ⊙ inner shell with 10 51 erg ramming into a ∼3M ⊙ cold outer shell (the circumstellar-medium, or CSM) that extends from 10 15 to 2×10 16 cm and moves at 100 km s −1 . We discuss the light curve evolution, which cannot be captured adequately with a grey approach. In these interactions, the shock-crossing time through the optically-thick CSM is much longer than the photon diffusion time. Radiation is thus continuously leaking from the shock through the CSM, in disagreement with the shell-shocked model that is often invoked. Our spectra redden with time, with a peak distribution in the near-UV during the first month gradually shifting to the optical range over the following year. Initially Balmer lines exhibit a narrow line core and the broad line wings that are characteristic of electron scattering in the SNe IIn atmospheres (CSM). At later times they also exhibit a broad blue shifted com- ponent which arises from the cold dense shell. Our model results are broadly consistent with the bolometric light curve and spectral evolution observed for SN 2010jl. Invoking a prolate pole-to-equator density ratio in the CSM, we can also reproduce the ∼2% continuum polarisa- tion, and line depolarisation, observed in SN 2010jl. By varying the inner shell kinetic energy and the mass and extent of the outer shell, a large range of peak luminosities and durations, broadly compatible with super-luminous SNe IIn like 2010jl or 2006gy, can be produced. Key words: radiative transfer – radiation hydrodynamics – polarisation – supernovae: general – supernovae: individual: 2010jl 1 INTRODUCTION Since the original identification of interacting supernovae (SNe; Dopita et al. 1984; Niemela et al. 1985) and the creation of the SN IIn class (Schlegel 1990), the sample of such pe- culiar Type II SNe has grown from a few to a few tens of events. It has also revealed an intriguing diversity, span- ning a range of luminosities, duration, line profile morphol- ogy, with events like SNe 1988Z (Stathakis & Sadler 1991; Turatto et al. 1993), 1994W (Sollerman et al. 1998; Chugai et al. 2004), 2006gy (Smith et al. 2007), and the enigmatic SN 2009ip (Mauerhan et al. 2013; Pastorello et al. 2013; Margutti et al. 2014). The origin of Type IIn SNe is associated with the interaction of fast material with previously-expelled slowly-expanding material (Grasberg & Nadezhin 1986). The resulting shock leads to deceler- ation of the inner shell, acceleration of the outer shell, and con- version of kinetic energy into internal and radiative energy. Be- cause (standard) non-interacting SNe radiate merely 1% of their total energy (the rest being kinetic), interacting SNe can easily reach extraordinary luminosities by tapping this abundant reser- voir of kinetic energy. For example, an interaction extracting 30% of a 10 51 erg ejecta could produce a SN IIn with a luminosity of 10 10 L⊙ for 3 months. Super luminous interacting SNe require both a high kinetic energy in the inner shell and a large mass reservoir in the outer shell (see, e.g., Moriya et al. 2013b). Two good examples of such SNe IIn are SN 2006gy (Smith et al. 2007) and more recently SN 2010jl (Stoll et al. 2011). The latter has extensive photomet- ric and spectroscopic observations (Stoll et al. 2011; Zhang et al. 2012; Ofek et al. 2014; Fransson et al. 2014) and also has spec- tropolarimetric data (Patat et al. 2011; Williams et al. 2014). How stars produce the outer shell is unclear – it may be mate- rial ejected by the pair-production instability (Barkat et al. 1967; Woosley et al. 2007) or it may be material ejected via a super- Eddington wind (Owocki et al. 2004). Here, we simply consider the interaction between a fast moving inner shell and a slowly-moving c 2011 RAS
-
Upload
khangminh22 -
Category
Documents
-
view
1 -
download
0
Transcript of Numerical simulations of super-luminous supernovae of type IIn

arX
iv:1
503.
0546
3v1
[ast
ro-p
h.S
R]
18 M
ar 2
015
Mon. Not. R. Astron. Soc.000, 1–24 (2011) Printed 24 August 2018 (MN LATEX style file v2.2)
Numerical simulations of super-luminous supernovae of type IIn
Luc Dessart,1 Edouard Audit,2 and D. John Hillier3
1: Laboratoire Lagrange, UMR7293, Universite Nice Sophia-Antipolis, CNRS, Observatoire de la Cote d’Azur, 06300 Nice, France.2: CEA, Maison de la Simulation, USR 3441, CEA-CNRS-INRIA- Univ. Paris-Sud - Univ. de Versailles, 91191, Gif-sur-YvetteCedex, France.3: Department of Physics and Astronomy & Pittsburgh ParticlePhysics, Astrophysics, and Cosmology Center (PITT PACC),University of Pittsburgh, 3941 O’Hara Street, Pittsburgh,PA 15260, USA.
Accepted 2015 March 18. Received 2015 March 09; in original form 2015 January 06
ABSTRACTWe present numerical simulations that include 1-D Eulerianmulti-group radiation-hydrodynamics, 1-D non-Local-Thermodynamic-Equilibrium (non-LTE) radiative transfer,and 2-D polarised radiative transfer for super-luminous interacting supernovae (SNe). Ourreference model is a∼10 M⊙ inner shell with 1051 erg ramming into a∼3 M⊙ cold outershell (the circumstellar-medium, or CSM) that extends from1015 to 2×1016 cm and moves at100 km s−1. We discuss the light curve evolution, which cannot be captured adequately with agrey approach. In these interactions, the shock-crossing time through the optically-thick CSMis much longer than the photon diffusion time. Radiation is thus continuously leaking from theshock through the CSM, in disagreement with the shell-shocked model that is often invoked.Our spectra redden with time, with a peak distribution in thenear-UV during the first monthgradually shifting to the optical range over the following year. Initially Balmer lines exhibita narrow line core and the broad line wings that are characteristic of electron scattering inthe SNe IIn atmospheres (CSM). At later times they also exhibit a broad blue shifted com-ponent which arises from the cold dense shell. Our model results are broadly consistent withthe bolometric light curve and spectral evolution observedfor SN 2010jl. Invoking a prolatepole-to-equator density ratio in the CSM, we can also reproduce the∼2% continuum polarisa-tion, and line depolarisation, observed in SN 2010jl. By varying the inner shell kinetic energyand the mass and extent of the outer shell, a large range of peak luminosities and durations,broadly compatible with super-luminous SNe IIn like 2010jlor 2006gy, can be produced.
Key words: radiative transfer – radiation hydrodynamics – polarisation – supernovae: general– supernovae: individual: 2010jl
1 INTRODUCTION
Since the original identification of interacting supernovae (SNe;Dopita et al. 1984; Niemela et al. 1985) and the creation ofthe SN IIn class (Schlegel 1990), the sample of such pe-culiar Type II SNe has grown from a few to a few tensof events. It has also revealed an intriguing diversity, span-ning a range of luminosities, duration, line profile morphol-ogy, with events like SNe 1988Z (Stathakis & Sadler 1991;Turatto et al. 1993), 1994W (Sollerman et al. 1998; Chugai etal.2004), 2006gy (Smith et al. 2007), and the enigmatic SN 2009ip(Mauerhan et al. 2013; Pastorello et al. 2013; Margutti et al. 2014).The origin of Type IIn SNe is associated with the interactionoffast material with previously-expelled slowly-expandingmaterial(Grasberg & Nadezhin 1986). The resulting shock leads to deceler-ation of the inner shell, acceleration of the outer shell, and con-version of kinetic energy into internal and radiative energy. Be-cause (standard) non-interacting SNe radiate merely 1% of theirtotal energy (the rest being kinetic), interacting SNe can easily
reach extraordinary luminosities by tapping this abundantreser-voir of kinetic energy. For example, an interaction extracting 30%of a 1051 erg ejecta could produce a SN IIn with a luminosity of1010 L⊙ for 3 months.
Super luminous interacting SNe require both a high kineticenergy in the inner shell and a large mass reservoir in the outershell (see, e.g., Moriya et al. 2013b). Two good examples of suchSNe IIn are SN 2006gy (Smith et al. 2007) and more recentlySN 2010jl (Stoll et al. 2011). The latter has extensive photomet-ric and spectroscopic observations (Stoll et al. 2011; Zhang et al.2012; Ofek et al. 2014; Fransson et al. 2014) and also has spec-tropolarimetric data (Patat et al. 2011; Williams et al. 2014). Howstars produce the outer shell is unclear – it may be mate-rial ejected by the pair-production instability (Barkat etal. 1967;Woosley et al. 2007) or it may be material ejected via a super-Eddington wind (Owocki et al. 2004). Here, we simply consider theinteraction between a fast moving inner shell and a slowly-moving
c© 2011 RAS

2 Luc Dessart, Edouard Audit, and D.J. Hillier
massive outer shell, and leave aside speculations concerning theirorigin.
Numerical simulations of interacting SNe are generallyundertaken with radiation hydrodynamics (Chugai et al. 2004;Woosley et al. 2007; Moriya et al. 2013b; Whalen et al. 2013),hy-drodynamics combined with a parameterised cooling function(van Marle et al. 2010; Chen et al. 2014), or pure hydrodynamics(by assuming adiabaticity; see, e.g., Blondin et al. 1996).Whenstudying super-luminous SNe IIn, radiation hydrodynamicswitha non-grey (multi-group) treatment is a must because the radia-tion contribution is a sizeable fraction of the pressure/energy in theproblem, the characteristic temperatures of the radiationand of thegas may differ strongly, and the emerging radiation provides essen-tial signatures characterising the event.
The radiative transfer modelling for SNe IIn comes at presentin two flavours. It is either based on the results of radiationhy-drodynamics simulations but limited to a single line, e.g.,Hα(Chugai et al. 2004), or based on an ad-hoc atmospheric structureand the assumption of steady-state radiation through a diffusive op-tically thick inner boundary (Dessart et al. 2009).
In this work, we discuss numerical simulations for super-luminous SNe of type IIn, including studies with radiation hydro-dynamics, radiative transfer, and polarised radiative transfer codes.In Section 2, we first present the multi-group 1-D Eulerian radia-tion hydrodynamics simulations we perform withHERACLES, in-cluding the numerical approach, the standard interaction configu-ration we adopt as initial conditions, and the results for both thedynamics and the radiation. We then present in Section 3 non-LTEradiative-transfer simulations withCMFGEN, which we computefor a number of snapshots using the results from the radiation-hydrodynamical modelling. We discuss line profile broadening, andthe relative roles of expansion and electron scattering. InSection 4,we present polarisation calculations based on theseCMFGENsimu-lations but artificially distorted along an axis of symmetry, in orderto produce prolate density configurations. We assess the level ofasymmetry needed to explain the observed continuum polarisation(and line depolarisation) reported for SN 2010jl. In Section 5, wediscuss the dependency of our results on the interaction properties,varying the kinetic energy of the inner shell and the mass/extent ofthe circumstellar medium (CSM). Finally, in Section 6, we presentour conclusions.
2 RADIATION HYDRODYNAMICS WITH HERACLES
2.1 Numerical approach
HERACLES is a Eulerian multi-dimensional radiation-hydrodynamics code (Gonzalez et al. 2007), with the possibilityfor multi-group radiation transport (Vaytet et al. 2011). Thehydrodynamics is treated using a standard second order Godunovscheme. For the radiation transfer, conduction, flux limited diffu-sion (FLD) and the M1 moment model (Dubroca & Feugeas 1999)are implemented inHERACLES, the latter two with the possibilityof using a multi-group approach. Apart from a comparison test thatuses a grey treatment, the simulations presented in this paper areall done using the multi-group M1 moment model. As explainedbelow, a multi-group treatment is necessary in order to takeintoaccount the large opacity variations with frequency and thestrongimbalance between radiation and gas temperature. The M1 modelhas also some strong benefit compared to the more standardFLD approach. First of all the M1 model is exact in both the
diffusion and the free-streaming limit and is rather accurate inbetween. It is therefore well suited to model regions with low orintermediate optical depth. Furthermore, the M1 method solvesexplicitly for both the energy and the flux through moments ofthe radiative transfer equations. The M1 model can distinguishbetween absorption/emission and scattering opacities. The effectof scattering in regions where the scattering opacity is dominantcan then be taken into account. Finally, the radiative transfer isformulated in the co-moving frame and as is shown in Vaytet etal.(2011) the Doppler and aberrations effects are properly accountedfor, which is important when large velocity gradients are present.
We use the multi-group solver because grey radiation trans-port, often used for simulations of non-interacting Type IISNe, isinadequate in SNe IIn. In non-interacting Type II SNe, the radiationand the gas have similar temperatures everywhere (even identical atlarge optical depths), so that adopting the Rosseland mean opacity,for example, is not a bad representation of the effective opacity ofthe material. In contrast, the radiation produced from the interac-tion in SNe IIn has a characteristic temperature that can vastly differfrom the medium that it traverses, and the total continuum opticaldepth is not much in excess of about ten. In the next section, we il-lustrate the impact on the light curve produced by assuming agreyrather than an energy-dependent LTE opacity for the material.
In this work, we adopt a uniform composition, with a H massfraction of 0.633, He mass fraction of 0.36564, and an iron massfraction of 0.00136 to reflect approximately the near-solarcompo-sition of a blue or a red supergiant (hereafter BSG/RSG) star(forSN 2010jl, Stoll et al. 2011) argue for a sub-solar metallicity, whichmay be important for understanding how these SNe IIn come about,but is irrelevant for the present radiation-hydrodynamicsconsider-ations).
We supply the code with an opacity table for our adopted com-position. We compute our opacities as a function of density,tem-perature and energy group. Energy groups are positioned at strate-gic locations to capture the strong variation in absorptiveopacitywith wavelength. We use one group for the entire Lyman contin-uum (including the X-ray range), two groups for the Balmer con-tinuum, two for the Paschen continuum, and three groups for theBrackett continuum and beyond.1 Our opacity code computes theLTE level populations and ionisation state of the gas, and then usesthe atomic data available withinCMFGEN to compute LTE opaci-ties and to make the opacity table. The domain covered is 10−20 to10−5 g cm−3 in 200 bins, and from 2000 to 500,000 K in 500 bins— we use the nearest edge for requests outside the table bound-aries. Here, we consider the contribution from electron scatteringand bound-free opacity for HI, HeI- II , and FeI-XII . A major lim-itation of our work is that we ignore line opacity and emissivityin our HERACLESsimulations. Metal line blanketing (in particularfrom Fe) would enhance the opacity in the UV (inhibiting furtherthe escape of UV photons). We also neglect cooling due to CNOelements, which requires a non-LTE study with specific allowancefor enhanced photon escape due to the velocity field. Inclusion ofthese effects is left to a future study.
In Fig. 1, we plot the photon mean free path and its inverse
1 We tried using several energy groups to cover the X-ray and the EUVranges better but this caused numerical problems with the radiative trans-fer. The solver struggled converging when an exceedingly small energy/fluxwas present in those energy groups, a situation encounteredoutside of theshocked region. In practice, this should not impact our results sizeably be-cause the optical depth to hard radiation (all Lyman photons) is huge at alltimes considered here.
c© 2011 RAS, MNRAS000, 1–24

Super-luminous Type IIn SNe 3
104 105
Temperature [K]
10−1
100
101
102
103
104
105MeanFreePath[101
5cm
]
ρ=1.16x10⁻¹⁴g cm−3
E.S.
Rosseland Mean
104 105
Temperature [K]
0
1
2
3
4
5
Opacity[10−
15cm
−1]
ρ=1.16x10⁻¹⁴g cm−3
E.S.
Rosseland
103 104
Wavelength [A]
10−8
10−6
10−4
10−2
100
102
104
106
108
1010
MeanFreePath[101
5cm
]
ρ=1.16x10⁻¹⁴g cm−3
T=3011K
Bound-Free
E.S.
103 104
Wavelength [A]
10−2
10−1
100
101
102
103
104
MeanFreePath[101
5cm
]
ρ=1.16x10⁻¹⁴g cm−3
T=12009K
Bound-Free
E.S.
Figure 1. Top row:Illustration of the variation of the photon mean free path (left) and inverse mean free path (right) at a mass density of 1.16×10⁻¹⁴ g cm−3.The electron-scattering opacity (black) is the main contribution to the Rosseland-mean opacity (red; which accounts for bound-bound and bound-free pro-cesses), except in the regions of partial ionisation of H andHe at 8000-20000 K and in the iron-opacity bump in the range 100000-200000 K. The precisetemperature regions where these offsets occur depend on density. The most critical variation in the opacity is associated with the recombination of H andHe, leading to a very small opacity at low temperature.Bottom row:Illustration of the wavelength dependence of the photon mean free path associated withabsorptive processes (blue) at∼ 3000 K (left) and∼ 12000 K (right), corresponding to conditions in which hydrogen is neutral and ionised, respectively. Thefilled dots correspond to the central wavelength of each energy group used for both the opacity table and theHERACLESsimulations.
(i.e., the opacity) against wavelength for different processes at dif-ferent densities and temperatures. In super-luminous SNe IIn thespectrum formation region is typically optically thick in the Ly-man continuum (and at X-ray wavelengths) and high-energy pho-tons will tend to thermalise, even at low electron-scattering opti-cal depth. Longward of the Lyman continuum, electron scatteringopacity typically dominates over absorptive opacities andso low-energy photons will thermalise inefficiently at most times and lo-cations.
The simulations in this work use an ideal gas equation of statewith γ = 5/3.2 We also adopt a mean atomic weight of 1.38 in allsimulations. In practice, this value depends on the ionisation stateof the gas, but in ways that need to be determined by using a generalequation of state — this is left to a forthcoming study.
Our simulations are 1-D and use a uniform radial grid with1600 points, covering from 0.05 to 2× 1016 cm. Degrading the res-
2 We therefore ignore the variations in thermodynamic quantities that arisefrom variations in ionisation.
olution by a factor of four produces the same overall properties(e.g., the bolometric maximum is changed by∼10%), although theshock is less resolved and more numerical diffusion occurs as theinteraction region crosses grid zones in the course of the simula-tion. This has a visible impact on the properties of the forward andreverse shocks and the associated temperature jumps, but itdoesnot influence significantly the energy solved for byHERACLES.Very high resolution simulations that yielded better resolution ofthe shock structure gave, for example, similar results for the prop-erties of the CSM, the shock propagation speed, and the emergentluminosity.
The initial configuration for the interaction is determinedan-alytically. We prescribe a density and a temperature structure forthe inner shell (tagged as the SN ejecta, but the results apply to anyejected shell with similar properties) and the outer shell (we assumethe CSM arises from pre-SN mass loss in the form of a wind). Weadopt a structure for the SN ejecta which is based on the simulationsof core-collapse SNe we perform (Dessart et al. 2010b,a), inprac-tice comparable to the formulation of Chevalier & Irwin (2011) andMoriya et al. (2013b). In the present paper, we are only interested
c© 2011 RAS, MNRAS000, 1–24

4 Luc Dessart, Edouard Audit, and D.J. Hillier
10−1 100 101
Radius [1015cm]
102
103
104
Velocity
[kms−
1]
10−1 100 101
Radius [1015cm]
103
104
Tem
perature
[K]
10−1 100 101
Radius [1015cm]
10−17
10−16
10−15
10−14
10−13
10−12
10−11
Density
[gcm
−3]
10−1 100 101
Radius [1015cm]
0
2
4
6
8
10
Mass[M
⊙]
Figure 2. Initial configuration for the reference interaction model Xsimulated withHERACLES. We show radial profiles of the velocity, the temperature, themass density, and the Lagrangian mass. Global quantities and additional details for this model are given in Table 1 and Section 2.1.
in studying the basic properties of super-luminous SNe IIn and thusfocus on one event (i.e., SN 2010jl), for which we are guided by theparameters of Fransson et al. (2014), who argue for a SN explosionleading to interaction with a dense and extended CSM. We do notinclude any unstable nuclei in the simulation and thus ignore anycontribution from radioactive decay.
For our standard interaction model, named X, we take a9.8 M⊙ inner ejecta (in homologous expansion) with 1051 erg. Itsdensity structure is given by a power law in radius with exponentNρ =8 outside ofV0 ∼3000 km s−1 and constant within it. Itstemperature structure is given by a power law in density withexpo-nentNT =0.4, rising from 2000 K at the ejecta/CSM interface ra-dius located atRt (we enforce a maximum temperature of 65000 Kin the inner ejecta). The SN ejecta is 11.6 d old when the interactionstarts. For the outer shell, which starts atRt =1015 cm, we adopta wind structure with a constant velocity of 100 km s−1 (and con-stant temperature of 2000 K), but split that space into two regionsof distinct density. Below 1016 cm, we prescribe a mass loss rateof 0.1 M⊙ yr−1, and beyond that radius we use a mass loss rate of10−3 M⊙ yr−1 (i.e., two orders of magnitude smaller). The moti-vation for this is three fold. First, the CSM mass should not be un-realistically large. By truncating the high mass loss region, we cancontrol the total CSM mass for any chosen mass loss. Second, thephase of high mass loss in massive stars likeη Car lasts for a periodof the order of ten years, not for centuries. With our choice of outerradius and wind speed, the high mass loss phase has a durationof∼28 yr. Third, the transition to a lower density outer region willfacilitate a reduction in the luminosity at later times, as observed
in SN 2010jl past 300 d (see below, and Fransson et al. 2014). Forconvenience, we interpolate the density at the junction between thetwo shells in order to smooth the profile and avoid an overly abruptchange in luminosity when the shock reaches this region. Theinneredge of the outer shell has a kinematic age of 3.2 yr. The CSM hasa total mass of 2.89 M⊙ and a total kinetic energy of 5.2×1047 erg.To summarise, for the SN ejecta (R < Rt), we adopt:
V (R) = (R/Rt)Vmax ,
V0 = Vmax/3 ,
ρ(V ) = ρ0(V0/V )Nρ for V > V0 ,
ρ(V ) = ρ0 for V < V0 and
T (V ) = 2000 (ρ(V )/ρ(Vmax))NT K .
The proportionality constantsρ0 andVmax are adjusted so that thetotal SN ejecta mass and kinetic energy match the desired values(see Table 1). For the CSM (R > Rt), we adopt:
ρ(R) = M/4πR2V ,
V = 100 km s−1 and ,
T = 2000K
whereM = MCSM,in for R <1016 cm andM = MCSM,out forR >1016 cm.
The initial conditions for model X are shown in Fig. 2. To ex-plore some dependencies of our results, we vary these ejecta/CSMconditions and discuss the implications in Section 5 (see also Ta-ble 1).
c© 2011 RAS, MNRAS000, 1–24

Super-luminous Type IIn SNe 5
Table 1. Summary of simulations performed in this work. The reference model X is discussed in detail through the most part of the paper (Section 2), whileadditional simulations (Xe3 etc.) are discussed in Section5. For all simulations, the minimum and maximum radii of the Eulerian grid are 5×10¹³ and2×1016 cm, and the transition radius between the SN ejecta and the CSM lies at a radiusRt of 1015 cm. In all cases, the mass of the inner shell (the SNejecta) is 9.8 M⊙, and the CSM wind velocity is 100 km s−1. Results from theHERACLESsimulation for each model are given in the last three columns. Thetime to peak is the time to reach maximum from the time when therising bolometric luminosity is only 1% of the value at peak (this way, we cancel the lighttravel time to the outer boundary, where we record the flux). We finally add results from Section 3 for the bolometric correction and colour at peak. Numbersin parenthesis are powers of ten.
model Ekin,SN Vmax,SN Ekin,CSM MCSM MCSM,in MCSM,out Lbol,peak B.C.@peak (V − I)@peak tpeak∫Ldt
[1051 erg] [km s−1] [1051 erg] [M⊙] [M ⊙ yr−1] [erg s−1] [mag] [mag] [d] [1051 erg]
X 1 9608 5.17(-4) 2.89 0.1 0.001 3.024(43) -1.06 0.15 19.4 0.32Xe3 3 16642 9.70(-4) 2.89 0.1 0.001 1.204(44) -1.35 0.11 15.70.88Xe3m6 3 16642 5.15(-3) 17.31 0.6 0.006 2.080(44) -1.39 0.01 55.7 2.05Xe3m6r 3 16642 6.08(-3) 26.73 0.6 0.006 1.818(44) -1.05 0.06 68.3 2.13Xe10 10 30384 2.55(-3) 2.89 0.1 0.001 6.399(44) -1.46 0.13 12.7 2.92Xe10m6 10 30384 1.31(-2) 17.31 0.6 0.006 1.091(45) -1.80 -0.04 34.2 6.89Xm3 1 9608 1.46(-3) 8.66 0.3 0.003 3.906(43) -0.84 0.13 47.9 0.49Xm6 1 9608 2.87(-3) 17.31 0.6 0.006 4.751(43) -0.80 0.27 77.50.63
Figure 3. Bolometric light curve evolution for the SN IIn model X (multi-group; black) and its grey counterpart (blue). We add the bolometric lumi-nosity at the shock (green dashed curve), which differs at times∼<200 d fromthe recorded bolometric luminosity because of optical depth and light traveltime effects (there is an 8 d light travel time to the outer boundary from theinitial location of the interaction region and a∼ 35 d diffusion time throughthe CSM once it has become ionised). For comparison, we show the an-alytical model light curve (red dashed curve) of Fransson etal. (2014) forSN 2010jl.
As the code is Eulerian, the flow constantly leaves the grid atthe outer boundary. Conditions are flow out, for both the gas andthe radiation. At the inner boundary, we use a reflecting conditionfor the radiation (zero flux). For the gas, we use an inflow condi-tion dynamically consistent with the properties of the inner shell.We assign to this injected material a low temperature of 2000K, avelocity that preserves the homologous expansion of the inner shellmaterial (V ∝ R), and a densityρib = ρ1x
3, with x = t/(t+ dt),and whereρ1 is the density in the first active zone,t = Rib/Vib,anddt is the time step. The injected material has no dynamical orradiative influence on the physics of the interaction and ourresults.We continue the simulations until the interaction region moves outof the grid, until the luminosity becomes about 100 times smallerthan at maximum, or when 2 years have passed, whatever comesfirst.
2.2 Results from the HERACLESsimulation
Below, we present the salient features from the interactionsim-ulation, together with illustrations of the bolometric light curve(Fig. 3), the interaction evolution (Figs. 4–7), the properties of thephotosphere and of the dense shell (Fig. 8), the evolution ofthefluid and of the radiation properties versus radius (Fig. 9),and theshock structure (fig. 10). We define the photosphere as the locationwhere the optical depth integrated inwards from the outer boundaryis 2/3. For convenience, we consider only the electron-scatteringopacity when computing the photosphere location. This choice issuitable because the bulk of the emerging radiation emergesin theoptical spectral region where electron scattering is the dominantopacity source. At X-ray and UV wavelengths energy-dependentoptical depths would need to be used.
Initially the CSM, by construction, is at 2000 K and neutral.It has a huge opacity to Lyman-continuum photons but is transpar-ent at longer wavelengths (Fig. 1). However, after about a week,this CSM is ionised (the ionisation is nearly complete for hydro-gen, but only partial for helium). This rapid change occurs as anionisation front sweeps the CSM (see the early migration of thephotosphere, shown as a filled dot, in Fig. 8), triggered by the hugeluminosity arising at the shock. At the onset of interaction, both theCSM density and the ejecta velocity are maximum, so the shockluminosity is at its maximum. The luminosity is dominated bythecontribution from the forward shock and can be estimated withLshock ∼ 2πr2ρcsmv3shock (see, e.g., Chugai & Danziger 1994),which is of the order of 3×1044 erg s−1. As time progresses, thefast ejecta is decelerated by the CSM and the shock luminositydecreases. Within 10 d, the maximum velocity is∼6000 km s−1
and the shock luminosity∼3×1043 erg s−1. These luminosities areextreme. Adopting a representative radiative luminosity of a few1043 erg s−1 crossing the CSM over the first ten days, this amountsto a total radiative energy on the order of 1049 erg, which is 100-1000 times the energy required to ionise the hydrogen atoms in thatH-rich shell. Only a small fraction of this energy is absorbed butthis is more than sufficient to cause rapid ionisation of the CSM.
Once the CSM is ionised, the minimum continuum opacityis set by electron scattering, and is moderate at all wavelengths.Photons, which are injected at the shock, are thermalised due tothe huge X-ray/UV opacity and converted to UV/optical photons.These photons are trapped and escape after diffusing for a timetdiff ∼ τcsm∆R/c, where∆R = Rphot − Rcds, andRphot is
c© 2011 RAS, MNRAS000, 1–24

6 Luc Dessart, Edouard Audit, and D.J. Hillier
Figure 4. Radial slices through the grid showing the temperature, theratio of the internal (i.e., gas) energy and the radiation energy (i.e., the mean intensity),the velocity, the luminosity, the mass density, the reducedflux, the opacity (inverse mean free path) for each group (coloured curves) and for electron scattering(dashed black curve) together with the associated optical depth (integrated inwards from the outer boundary; the dotted black line corresponds toτ = 2/3).The coloured curves correspond to each one of the eight energy groups (ordered from low to high energy/frequency; see labels in bottom right panel anddiscussion in Section 2.1). We use 3 groups longward of the Paschen jump, two groups in the Paschen continuum, two groups in the Balmer continuum, andone group for the Lyman continuum. The time is 4.1 d after the onset of the interaction. The electron scattering contribution is not included in these groups.
the photospheric radius andRcds is the Cold-Dense-Shell (CDS)radius. This CDS is very narrow (i.e.,1013 cm) and is boundedby the reverse shock and the forward shock. As can be seen inFigs. 6–7 and Fig. 10, the forward shock exhibits a Zel’dovich spike(Zel’dovich & Raizer 1967) where the gas temperature becomesvery high before relaxing to its post-shock value. In practice, theCDS is not cold – its temperature at these early times is in excessof 20000 K, having, however, efficiently cooled from X-ray shock
temperatures by radiative emission.3 In our reference simulation(i.e., for this adopted CSM structure) at 10 days after the onset of
3 We obtain higher spike temperatures of>105 K with higher resolution.However, it is in practice difficult to resolve the spike structure given thescale of the problem. Shock temperatures of 107-108 K are obtained if wesimulate the same interaction configuration without radiation transport (i.e.,equivalent to hydrodynamics only). When radiation is included, radiationmediates the properties of the shock. The large heat capacity of the photongas reduces the shock temperature. The diffusion and the escape of radiation
c© 2011 RAS, MNRAS000, 1–24

Super-luminous Type IIn SNe 7
Figure 5. Same as Fig. 4, but now for a time of 29.9 d after the onset of theinteraction.
the interaction,Rphot ∼7×1015 cm, the CSM (electron scattering)optical depth is∼15, and the diffusion time from the shock to thephotosphere is∼35 d.
The light curve we obtain if we assume grey radiation trans-port (within the M1 model) is quite different (blue curve in Fig. 3),especially at early times. The luminosity is maximum at the begin-ning, because the grey opacity is very low for cold gas. In contrast,the opacity to X-rays and UV photons is huge at low temperature.Hence, in the grey case, the photons initially produced at the shocktravel without being absorbed and reach the outer boundary unadul-terated. It is only subsequently that the streaming radiation raises
from the shocked region exacerbates the reduction in temperature of theshocked region compared to a pure hydrodynamics configuration.
the CSM temperature and increases its optical depth, causing a dipand a bump in the light curve, but the corresponding opacity inthe X/UV ranges is still much lower than what it is in Nature. Theradiation properties (bolometric luminosity, but also colours etc.)are thus affected. This test clearly shows that multi-groupradia-tion transport (with groups that span from short to long wavelength,even coarsely) is important when modelling SNe IIn.
The evolution of the photospheric radius is quite complicated.Initially it progresses to larger radii as the CSM becomes moreionised. Once the medium is fully ionised, the photosphericradiusremains almost constant (Fig. 9). Depending on circumstances, thephotospheric radius can then either decrease or increase. First, theCSM may recombine and its opacity to radiation decrease, leadingto a recession of the photosphere. This is not seen in our simulations
c© 2011 RAS, MNRAS000, 1–24

8 Luc Dessart, Edouard Audit, and D.J. Hillier
Figure 6. Same as Fig. 4, but now for a time of 179.9 d after the onset of the interaction.
because the large and sustained supply of radiation from theshockmaintains a high ionisation in the CSM. The other circumstance,which inevitably occurs, is that the shock (and the CDS), eventu-ally overtakesRphot causing the photospheric radius to increaseagain. This occurs in this simulation at∼200 d, which implies thatthe average shock velocity over the first 200 days is∼3000 km s−1
(Fig. 8). Because of expansion, the electron-scattering optical depthof the CDS decreases with time.4
The evolution of the light curve for the first∼200 d is
4 This holds once the CSM is fully ionised. Radial compressionof CSMmaterial by the shock does not change the CSM electron-scattering opticaldepth; this would require lateral compression, inexistentin a spherically-symmetric simulation. Absorptive optical depths may increase (because
essentially at fixedRphot. The morphology of the light curve(Fig. 3) differs from the monotonically decreasing shock luminos-ity because of optical depth effects, very much in the mannerof56Ni powered optically-thick ejecta of standard SNe (Arnett 1982;Chevalier & Irwin 2011; Moriya et al. 2013b). At early times,theLshock is huge but the optical depth is large so radiation energyis stored and released on a diffusion time scale of about a month.Bolometric maximum occurs att ∼ tdiff . Past maximum, the SNradiation exceeds for a while and eventually becomes equal to theshock luminosity. A steady-state configuration sets in because theshock luminosity evolves slowly and the diffusion time is only a
such process are often proportional to the square of the density) but exceptfor the optical depth of the Lyman continuum these also decline.
c© 2011 RAS, MNRAS000, 1–24
Super-luminous Type IIn SNe 9
Figure 7. Same as Fig. 4, but now for a time of 389.9 d after the onset of the interaction.
few days (because the CDS gets closer toRphot). Thus, the bolo-metric evolution over the first 200 d reflects primarily variationsnot in Rphot but in the radiation temperature, itself dependent onthe amount of energy injected and stored between the photosphereand the CDS. For timest < tdiff , this energy accumulates and thetemperature of the optically-thick CSM gas goes up to a maximumaround bolometric maximum. For timest > tdiff , less and lessenergy is stored until the steady-steady state regime is reached. Asthe shock luminosity decreases, the radiation temperaturedecreasestoo and the SN luminosity ebbs.5
5 In theory, the adopted value of the mean atomic weight shouldinfluencethe gas temperature. For partial ionisation, the mean atomic weight couldbe around 0.6-0.7, rather than 1.38, which corresponds to the neutral H-
At the end of the simulation, a total of 0.3×1051 erg has beenradiated, drawn from the 1051 erg of kinetic energy stored in theinner ejecta. There still remains, untapped, 0.7×1051 erg of kineticenergy in the system, contained in the un-shocked SN ejecta (i.e.,the SN ejecta material not affected by the interaction, which rep-resents 50% of the total SN ejecta mass) and in the massive CDS,which still advances through space at∼3000 km s−1. So, for thisconfiguration, we obtain a conversion efficiency of kinetic to ra-diation energy of 30% (little additional kinetic energy will be ex-
rich gas adopted here. We ran a simulation for the reference model X witha value of 0.6, but found very similar results, probably because in super-luminous SNe IIn, the entire material is partially ionised throughout mostof the evolution — the ionisation state of the plasma does notchange.
c© 2011 RAS, MNRAS000, 1–24

10 Luc Dessart, Edouard Audit, and D.J. Hillier
Figure 8. Illustration of the evolution of the material properties atthe photosphere (left; logarithmic scale for abscissa). and at the location of maximumdensity within the dense shell (right). Note the migration of the photosphere to larger radii during the first 8 days, as well as the sudden jump in photosphericproperties at∼ 220 d, when the CSM material exterior to the CDS is no longer optically thick (because the CDS has swept up the dense part of the CSM).
tracted in this interaction because the remaining CSM is very lowdensity). In a multi-dimensional configuration, some kinetic energycould also be stored in the lateral direction. Hence, the present 1-Dsimulation likely overestimates what the equivalent 3-D simulationwould produce. Unlike Moriya et al. (2013b), we make no attemptto estimate this, in part because these lateral motions willbe muchslower than the radial motion of the material and thus cannotrep-resent a large energy loss for the radiation.
In the next section, we will discuss in more detail the radia-tive transfer properties of this interaction. One thing to note is thatdespite the significant optical depth of the configuration, the pho-ton mean free path is non negligible. This is particularly true in theinner ejecta region once expansion has caused significant coolingbecause these regions do not benefit from the shock luminosity (thebulk of the radiation streams radially outwards from the interac-tion). There is a temperature jump ahead of the interaction (Fig. 10)caused by radiation leakage from the shock, as in the phenomenonof shock breakout in core-collapse SNe (Klein & Chevalier 1978).This structure is comoving with the shock, since the conditions thatcause it persist for as long as the shock remains optically-thick.
Our results are in agreement with the radiation hydrodynam-ics simulations of Moriya et al. (2013b). Our simulation also em-phasises that the shell shocked model (Smith & McCray 2007) isnot adequate for optically-thick super-luminous SNe IIn, as alsopointed out by Moriya et al. (2013a). The basic inconsistency withthe shell-shocked model is that it is not possible for a shockto crossa very extended CSM, ionise it, store energy within it, andsubse-quentlylet this shocked material radiate the deposited energy. Thisscenario applies to shocks crossing the interior of a stellar enve-lope (as in successful core-collapse SNe) only because the stellarinterior has a huge optical depth. At every location except for theoutermost stellar layers, the radiation dominated shock progressesoutward faster than the photons it carries in its wake because thephoton mean free path is exceedingly small and photon diffusiontimes exceedingly long compared to the shock-crossing time. In in-teracting SNe, this configuration does not hold at all. Even for veryhigh CSM densities, the shock-crossing time through the CSMwillalways far exceed the diffusion time through the shell so that radi-ation deposited by the shock iscontinuouslybeing radiated by theshocked material. The present simulation shows that the basic lightcurve properties of super luminous SNe can be explained withasimple and physically consistent setup. It also illustrates how the
simplistic “diffusion model” can be misleading, and how an argu-ment based on dimensional analysis can sometimes lead to wrongconclusions.
In our simulations spectrum formation takes place primarilyin the slow moving CSM for about 200 d, but past that the spec-trum formation region will be tied to the much faster moving CDS.The CDS optical depth will be too small to ensure full thermalisa-tion within the slow unshocked material even if the locationwherethe optical depth is 2/3 (i.e., the photosphere), lies there. This im-plies that line profiles should evolve and become more Doppler-broadened as time passes in super-luminous SNe, while line broad-ening by electron scattering would dominate only at early times(Dessart et al. 2009). This behaviour is important to study as it car-ries information on the potentially large residue of kinetic energyleft untapped in the interaction. For example, this matterswhen es-timating the kinetic energy in the inner shell and whether this innershell originates in an energetic explosion that requires the gravita-tional collapse of the iron core of a massive star.
The radiation injected by the shock and crossing the CSMdoes work on the material and accelerates it. This radiativeac-celeration is however modest, and limited to the peak time ofthelight curve, leading to an increase of the CSM velocity from 100to∼200 km s−1 (Fig. 9). At early times, the material that receivesa larger acceleration, just ahead of the shock, lies at a large opticaldepth and is thus less visible that the photons emitted further out,in regions where the acceleration is more modest. At late times,the material ahead of the shock is too optically-thin to receive asignificant acceleration. The radiative acceleration in the HERA-CLESsimulation is likely underestimated because of the neglectofline opacity and the potential boost from line desaturationcausedby velocity gradients (Castor et al. 1975; Owocki 2015). However,our simulations suggest that the radiation arising at the shock onlycause a modest acceleration of the unshocked CSM. This is com-patible with the near-constant width of the narrow P-Cygni profileseen in SN 2010jl (Fransson et al. 2014). As we discuss in the nextsection, this modest acceleration seems an unlikely originof thepeak blueshift seen in the broad emission component of Hα.
c© 2011 RAS, MNRAS000, 1–24
Super-luminous Type IIn SNe 11
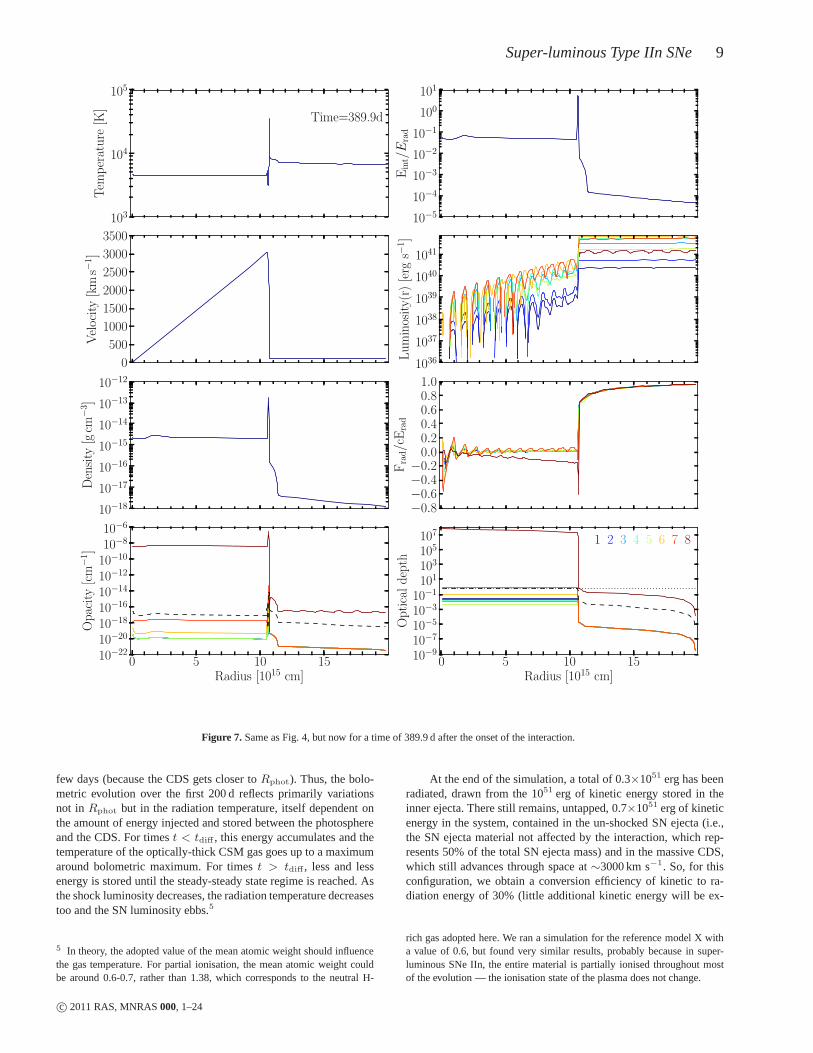
Figure 9. Evolution of the radial profiles for the velocity, luminosity, temperature, and mass density for the reference model X. The epochs shown are 0.01,1,2, 3, 4, 5, 6, 7, 8, 10, 20, 30, 50, 100, 150, 200, 250, 300, 350, 400 d after the onset of the interaction. Dots refer to the location of the photosphere — sucha location exists for about 350 d, first located in the CSM and then in the CDS. Past 350 d, the total electron scattering optical depth is less than 2/3, makingelectron scattering a poor frequency-redistribution mechanism at such late times.
Figure 10. Profiles for the density, temperature, velocity, and bolometric luminosity in the shock region at maximum light (all normalised for visibility) as afunction of radius (left) and mass (right) in the reference model X. The resolution is somewhat too small to fully resolvethe shock structure, a problem thatarises from the Eulerian approach.
c© 2011 RAS, MNRAS000, 1–24

12 Luc Dessart, Edouard Audit, and D.J. Hillier
3 SPECTROSCOPIC MODELLING WITH CMFGEN
3.1 Numerical approach
At selected epochs during the evolution, from 20 to∼ 200 d af-ter the onset of the interaction, we post-process theHERACLES
simulation with the non-LTE radiative transfer codeCMFGEN
(Hillier & Miller 1998; Hillier & Dessart 2012). While thereis noexplicit time-dependence in theCMFGEN simulations undertakenhere, time dependence is implicitly taken into account since weuse the density, temperature, and velocity structures computed withHERACLES.We thus retain a much higher physical consistency thanin Dessart et al. (2009). We use an adaptive grid to resolve care-fully the strongly varying density and temperature profiles, as wellas the optical depth. The grid is truncated at small radii when theinward integrated Rosseland-mean optical depth reaches 30. The fi-nal models discussed here use 100 grid points and adopt a turbulentvelocity of 20 km s−1.
We use the same H, He, and Fe mass fractions as for theradiation-hydrodynamical simulations. We limit the modelatom toH I, HeI, HeII , FeI–VI with the same super-level assignment asin Dessart et al. (2013). Higher ionisation stages are unnecessarysince the gas temperature in the simulations at the times consideredis below∼80000 K (this maximum temperature is limited to a fewzones at the shock and to early times). In the present simulations,the spectrum formation region has a characteristic temperature ofabout 10000 K or less. A discussion of the signatures of ions fromCNO and other intermediate mass elements (which are merely traceelements compared to H and He here) is deferred to a subsequentstudy.
The current version ofCMFGEN does not allow us to calcu-late non-LTE line blanketed model atmospheres for non-monotonicvelocity flows. This property of interacting SNe is however funda-mental and should be taken into account. In this work, to overcomethis limitation and take into account the non-monotonic velocitystructure, we ignore lines when treating the continuous spectrum,but model the lines for the non-LTE analysis using the Sobolevapproximation. Non-monotonic velocity flows do not cause majorissues with the Sobolev approximation6 since it is a local approxi-mation that uses the absolute value of the velocity gradientto com-pute the optical depth (Castor 1970). Since the density and temper-ature structures are taken from the hydrodynamical simulation webelieve this to be a very reasonable first approach.
To compute the observed spectrum we wrote a new routine ca-pable of computing J in the comoving frame in the presence of non-monotonic velocity fields. With this routine we were able to allowfor the influence of (non-coherent) electron scattering which wasiterated to convergence using a simple lambda-iteration. Relativelyminor changes were then made toCMF FLUX (Busche & Hillier
6 One problem we needed to address is that the Sobolev optical depth be-comes infinite for one particular direction when the radial velocity gradientis not positive. This occurs because in a spherical flow the Sobolev opticaldepth is proportional to1/|1 + σµ2|, whereσ ≡ d lnV/d lnR − 1. Theangular factor will be infinite whenµ = ±1/
√−σ. In practical terms
this does not affect the escape probability very much due to the smallsolid angle subtended by the singularity. However, in the standard com-putational approach the angle grid is not well sampled (the sampling be-comes worse as we move away fromµ = 1), and numerical instabilitiesoccurred at one or two depths, which we overcame by limiting the increasein optical depth. In this work we used the simple approach of choosingmax(|1 + σµ2|,−0.2(1 + σ)) for |1 + σµ2| whenσ < 0.
2005) to facilitate the computation of the observed spectrum in theobserver’s frame.
In Dessart et al. (2009), we used a prescription for the den-sity structure of the emitting region and the ansatz was thatanoptically-thick shell was radiating the flux. In that approach, theentire grid was in radiative equilibrium, and the flux was forcedto diffuse through the densest regions of the atmosphere (these re-gions were also the hottest by imposing the diffusion approxima-tion at the base). The dynamical configuration presented in Sec-tion 2 is obviously quite different, but this simplistic treatment is infact not so bad at early times, when the interaction region and theinner CSM are optically thick because in this case the details of theinner boundary conditions are lost. Hence, for as long as thecon-figuration is optically thick, the approach of Dessart et al.(2009)can provide a good match to the observations of some SNe IIn like1994W without being dynamically consistent.
3.2 Spectral evolution
We thus compute non-LTE spectra at 20.8, 41.7, 62.5, 83.3, 104.2,125.0, 145.8, 166.7, 208.3 d after the onset of the interaction. Thespectral evolution shown in Fig. 11 reveals a striking similar-ity to observations of numerous super-luminous SNe IIn, includ-ing SN 2010jl (Zhang et al. 2012; Fransson et al. 2014). The SEDevolves very slowly with time, with a progression towards reddercolours, a diminishing flux shortward of 4000A, and a decreasingionisation visible through the strengthening of FeII lines. H I andHe I lines behave in a more complicated way.
Line profiles prior to 100 days show the distinct symmetricmorphology resulting from frequency redistribution by scatteringwith thermal electrons (Chugai 2001; Dessart et al. 2009), with atypical width of a few 1000 km s−1 — in earlier calculations, wherewe limited the velocities to 100 km s−1 on theCMFGEN grid, weobtained similar profiles. The width of this component only reflectsredistribution of photons in frequency space by electron scattering– it provides no information about the shock velocity. Superposedon the broad wings, is a very narrow component with a P-Cygniprofile morphology. This narrow component corresponds to lineemission and absorption weakly affected by electron scattering,and which preferentially arises from the outer regions of the CSM(which are moving at
∼>100 km s−1 in our model X) where line
opacity may still be large but where the electron-scattering opacityis negligible.
At a qualitative level, the early-time spectra shown in Fig.11are analogous to those computed in Dessart et al. (2009) de-spite the very different approaches in the description of the den-sity/temperature structure.
After 100 days, the line profile morphology changes. In addi-tion to the two components discussed above, we see a blue shiftedemission component that arises from the CDS. It is blue shifted be-cause the CDS is moving at a velocity of∼3000 km s−1 and is op-tically thick in the continuum – line photons emitted in the red areabsorbed by the near side of the CDS. The blueshift of peak emis-sion seen in non-interacting Type II SNe (Dessart & Hillier 2005b)has a similar origin. These Hα properties agree well at the quali-tative level with the observations of SN 2010jl (Zhang et al.2012),although the magnitude of the emission blueshift is overestimatedand the magnitude of the line width is underestimated (Fig. 12).
We give a summary of theCMFGEN model properties in Ta-ble 2. TheCMFGEN bolometric luminosity agrees with theHERA-CLES value to within 5-25% at early times (i.e. prior to∼200 d),which is noteworthy since the two codes differ vastly in the treat-
c© 2011 RAS, MNRAS000, 1–24

Super-luminous Type IIn SNe 13
Figure 11. Montage of spectra at selected epochs (see right label) for our reference model X. The high-frequency patterns in the UV are caused by lineblanketing from FeII and FeIII in this model, while the optical is composed of HI, HeI, and FeII lines. At early times, lines typically show a hybridmorphology with a narrow core and extended wings, up to about2000 km s−1 from line centre. These wings are due to incoherent electronscattering. As timeprogresses, a blue shifted component, associated with emission from the CDS, grows in strength. Line broadening is thencaused by electron scattering andexpansion.
c© 2011 RAS, MNRAS000, 1–24

14 Luc Dessart, Edouard Audit, and D.J. Hillier
Table 2. Summary of properties for theCMFGENsimulations based on the reference interaction model X. We include the properties at the photosphere, at thelocation of maximum density in the interaction region (the CDS), and the properties of the fitted blackbody (see Fig. 13 for an example). We select epochswhen the CDS is well below the photosphere, so that the interaction region is optically thick.
age Lbol MB MV MR MI Rphot Tphot Ne,phot Rcds Tcds Ne,cds Rbb Tbb Lbb
[d] [erg s−1] [mag] [mag] [mag] [mag] [1015 cm] [104 K] [cm−3] [1015 cm] [104 K] [cm−3] [1015 cm] [104 K] [erg s−1]
20.8 2.15(43) -18.61 -18.68 -18.85 -18.86 7.17 1.33 4.36(8)1.25 1.66 1.76(11) 1.172 1.084 2.259(43)41.7 2.23(43) -18.84 -18.98 -19.14 -19.21 7.10 1.27 4.42(8)1.78 1.18 1.33(11) 1.448 1.033 2.371(43)62.5 1.21(43) -18.40 -18.68 -18.90 -19.03 7.02 1.09 4.05(8)2.86 1.01 1.05(11) 1.616 0.879 1.289(43)83.3 9.88(42) -18.16 -18.55 -18.82 -19.01 7.04 1.00 4.00(8)3.37 0.79 3.93(10) 1.848 0.788 1.050(43)104.2 8.65(42) -17.95 -18.43 -18.74 -18.99 7.11 0.97 3.94(8) 3.91 0.76 2.25(10) 2.083 0.715 9.068(42)125.0 7.99(42) -17.74 -18.27 -18.62 -18.89 7.08 0.98 3.96(8) 3.64 0.61 9.24(9) 2.199 0.673 8.496(42)145.8 7.26(42) -17.56 -18.12 -18.49 -18.77 7.15 1.00 3.90(8) 4.94 0.69 9.51(9) 2.199 0.646 7.503(42)
Figure 12. Montage of multi-epoch spectra for Model X (left) and SN 2010jl (right; Zhang et al. 2012) shown in velocity space with respect to the restwavelength of Hα. Qualitatively, the model reproduces well the strengthening of the blue-shifted emission component and the increasing width of the observedHα line profile. Quantitatively, the magnitude of the blueshift is somewhat too high while the width of the emission featureis underestimated.
c© 2011 RAS, MNRAS000, 1–24
Super-luminous Type IIn SNe 15
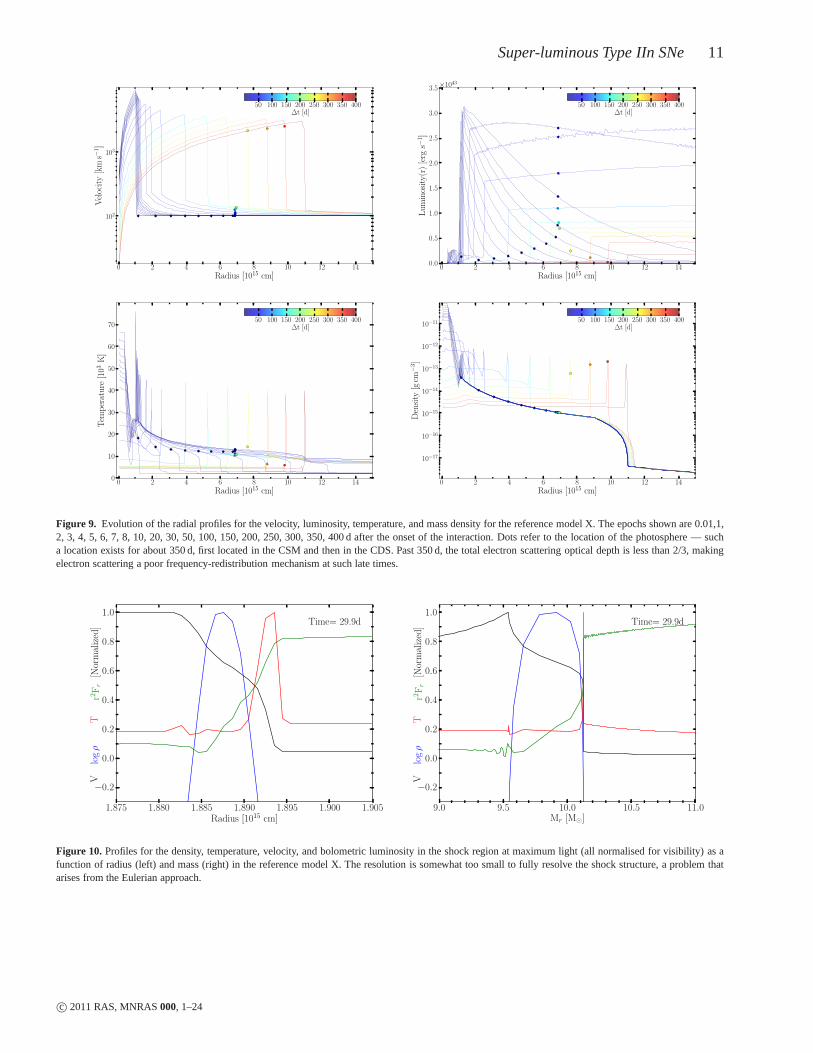
Figure 13. Comparison of the total synthetic flux (black), the contin-uum synthetic flux (blue) and the best match blackbody flux to the opticalrange (red), for the reference model X at 41.7 d after the onset of inter-action. In the same order, the cumulative luminosities are 5.83× 10⁹ L⊙,6.18× 109 L⊙, and 4.45× 10⁹ L⊙. The blackbody radius and temperatureare 1.45× 1015 cm and 10331.6 K. The photospheric radius and tempera-ture at that time are 7.10× 1015 cm and 12670.0 K.
ment of the radiative transfer (M1 method using eight energygroups versus a two-moment solver using 105 energy groups) andof the thermodynamic state of the gas (LTE versus non-LTE) —past 200 d, the bolometric luminosity predicted by the two codesdiffers sizeably (about a factor of 2), probably because non-LTEeffects are stronger (the CDS is no longer embedded within theoptically thick CSM). A mismatch is expected during the first1-2months because light-travel time effects are ignored in thecompu-tation of the flux inCMFGEN (the time dependence of the modelis implicitly taken into account since we fix the temperature, butno explicit time dependence is accounted for when computingtheflux in the formal solution of the radiative transfer equation in CM-FGEN). This matters when the properties of the interaction vary ona short time scale (i.e., comparable to the free-flight time of ∼8 dto the outer boundary, where the luminosity is recorded).
The slow evolution of the SED reflects the slowly varyingshock luminosity (which arises from the smooth variation inboththe ejecta density/velocity profile and from the slowly varying CSMdensity for a wind configuration), leading to a decrease in radi-ation/gas temperature in the optically thick regions of theCSM.Consequently, the electron scattering wings weaken as the ionisa-tion level and the electron scattering optical depth decrease (this iscaused by the shrinking of the spectrum formation region, which isbounded by the fixed photosphere and the outward moving denseshell or shock). For about 200 d after the onset of the interaction, thespectrum formation process is essentially unchanged in this simu-lation.
It is customary in the community to compare the SED with ablackbody. At each epoch, we fit theCMFGEN SED flux ratio be-tween 4800 and 8000A to infer Tbb — we use an iterative proce-dure to find the temperature for which the model and the blackbodyhave between these two wavelengths the same flux ratio to withinone part in 10000). We determine the corresponding blackbody ra-diusRbb by matching the blackbody to the model luminosityLλ atλ (i.e., throughR2
bb = Lλ/4π2Bλ(Tbb)). The total blackbody lu-
minosityLbb is then4πR2bbσT
4bb. An example is shown in Fig. 13.
Although the match is excellent in the fitted range, the SED isnot a
Figure 14. Radial variation of the optical depth associated with electronscattering, various continua, and lines of Hα and HeI 5875A (for which weplot the Sobolev optical depth). Thermalisation in the Lyman continuum isensured, but not in the Balmer and Paschen continua. The large Sobolevlength caused by the small velocity gradient in the CSM causes the Hα lineoptical depth to be very large, and to exceed that in the Lymancontinuum.
blackbody. We find non-planckian effects here associated with di-lution due to electron scattering (causingRbb < Rphot; see, e.g.,Dessart & Hillier 2005a), and flux excess rather than blanketing inthe UV (as if multiple blackbody emitters with different tempera-tures were contributing).
We show the optical depth for electron scattering, selectedcontinuum wavelengths, as well as selected lines in Fig. 14.It is ev-ident that thermalisation is complete for UV photons in thismodel,but photons redder than the Lyman edge poorly thermalise, even atan early epoch of 41.7 d after the onset of interaction. For these,electron scattering is the main source of opacity. The blackbodyradius underestimates the radius of the CDS at all times, althoughthe bulk of the SN flux arises from outside the CDS. Overall, theradiation field in this SN configuration is not well describedby thePlanck distribution. These considerations are confirmed byFig. 15,which illustrates how much smaller the mean intensity is comparedto the Planck function, except at the location of lines. Furthermore,in our reference model, the bulk of the flux arises at all timesfromlayers where the electron scattering optical depth is nevergreaterthan 10, and more typically a few only (see also Fig. 10).
The shallow density structure, the wavelength-dependentopacities, and the strong albedo, lead to a very spatially extendedspectrum formation region. For example, the emission/absorptionof Hα photons occurs throughout the grid, with the exception ofthe outermost regions of the CSM where the density is very low.At early times observed line photons primarily originate atlargerradii because line photons emitted deeper suffer more scatterings,and hence have a greater probability of being absorbed. Linepho-tons that could accrue very large frequency shifts by multiple scat-tering with thermal electrons tend to be absorbed before they canescape. In our reference model, we find that the bulk of Hα photonsarise from regions with an electron scattering optical depth of a few,giving rise to emission in line wings extending to∼3000 km s−1
from line centre, and characterised by a profile with a FWHM of∼1500 km s−1. This is somewhat similar to values in SN 2010jl(Zhang et al. 2012) at early epochs. However at later times the pro-files in SN 2010jl are broader and blue shifted. We also see this
c© 2011 RAS, MNRAS000, 1–24

16 Luc Dessart, Edouard Audit, and D.J. Hillier
Figure 15. Left: Variation of the ratio of the mean intensityJλ and the Planck functionBλ in the simulation at 41.7 d, shown as a function of wavelengthandejecta/CSM location. The label at right gives the electron-scattering optical depthτes associated with each panel. At this time, the CDS is atτes ∼ 10.Right:Variation ofJλ andBλ versus radius and shown for various continuum wavelengths.
effect at late times, with the extra emission associated with theCDS (Fig. 12). The blueshift of the broad Hα line is caused by anoptical depth effect that affects all SNe (Dessart & Hillier2005b;Anderson et al. 2014). At early times, the peak blueshift is not seenbecause the Hα photons emitted from the CDS are unable to es-cape – they undergo numerous electron scatterings and are eventu-ally destroyed by a continuum absorption. All these properties areillustrated in Figs. 16–17.
As found in earlier studies (e.g., Hillier 1991) the adoptedtur-bulent velocity also affects the strength of the electron scatteringwings. This occurs since a larger turbulent velocity increases theSobolev length, and hence leads to an increased probabilitythat aline photon scattering within the Sobolev resonance zone will ex-perience an electron scattering interaction, which, because of thelarge Doppler shift, will cause it to be shifted out of resonance al-lowing it to escape.
4 POLARISATION CALCULATIONS
The dense shell that forms in the interaction is Rayleigh-Taylorunstable and should be simulated in 3-D — this is left for futurework. There is, however, observational evidence from spectropo-larimetric observations that some SNe IIn are asymmetric onlarge
scale (Leonard et al. 2000; Wang et al. 2001; Hoffman et al. 2008;Patat et al. 2011). This we try to address in this section by perform-ing 2-D polarisation calculations.
We post-process theCMFGENsimulation for model X at 41.7 dby computing linear polarisation profiles in the same fashion as de-scribed in Dessart & Hillier (2011). We break spherical symmetryby enforcing a latitudinal variation in density (thus preserving axialsymmetry). In practice, we useρ(r, µ) = ρ(r, µ = 0)(1 + A1µ
2),whereµ ≡ cos θ, andθ is the colatitude. The magnitude of theasymmetry is controlled through the parameterA1, which we varyfrom 0.1, to 0.2, 0.4, 0.8, and 1.6. The resulting axially symmet-ric ejecta has therefore a prolate morphology, with pole-to-equatordensity ratios (at a given radius) of 1.1, 1.2, 1.4, 1.8, and 2.6. Thisadopted type of asymmetry is chosen for its simplicity – otherchoices might also yield similar continuum and line polarisations.
We show the flux in the Hα line and in the overlappingcontinuum in Fig. 18 for an observer along a line-of-sight per-pendicular to the axis of symmetry. Along this direction, thecontinuum polarisation has its maximum value, reaching about1.6% forA1 =1.6. As we progress towards the Hα rest wave-length from continuum regions (i.e.,
∼>3000 km s−1 from line cen-
tre), the polarisation decreases steadily, as observed in SN 2010jl(Patat et al. 2011; Williams et al. 2014) and in some Wolf-Rayet
c© 2011 RAS, MNRAS000, 1–24

Super-luminous Type IIn SNe 17
Figure 16. left: Illustration of the wavelength (λ) and depth (R) dependence of the quantity∑
R>R15δF (R, λ), where δF (R, λ) =
(2π/D2)∫∆R
∆z η(p, z, λ) e−τ(p,z,λ)pdp, andR15 is R in units of 1015 cm. Here,D is the distance;∆R and∆z are the shell thickness in the ra-dial direction and along the ray with impact parameterp, respectively;η(p, z, λ) andτ(p, z, λ) are the emissivity and the ray optical depth at location(p, z)and wavelengthλ. The gray scale in the bottom panel shows how
∑R>R15
δF (R, λ) varies as we progress inwards from the outer boundary, indicatingthe relative flux contributions of different regions. If we chooseR15 as the minimum radius on theCMFGEN grid, we recover the total flux. The grayscalealso shows how lines increasingly broaden (and the peak lineflux decreases) as we progress outwards. The dash-dotted line corresponds to the radius of theelectron-scattering photosphere, and the dashed line (which overlaps with x-abscissa here) corresponds to the CDS radius. The top panel shows selected cuts(see right label) of the quantity
∑R>R15
δF (R, λ). From top to bottom (R15 = 10, 7.2, 5.0, 3.0),∑
R>R15δF (R, λ) represents 4, 45, 77, and 98 per cent
of the total emergent flux at 6800A. Right: Same as left, but now zooming in on the Hα region. The depth variation of the line width, influenced by electronscattering, is evident in the bottom panel.
stars (Schulte-Ladbeck et al. 1991; Harries et al. 1998). Inour sim-ulation, this reduced polarisation across the line is a signature ofthe distinct formation of the continuum and the line. Because of thelower optical depth, continuum photon arise from a much greaterelectron-scattering optical depth than do Hα line photons (Fig. 14).Furthermore, line photons emitted in a recombination process startoff with zero polarisation, and therefore can only accumulate alower polarisation through a reduced number of scatteringsbeforeescape. This depolarisation is maximum within 100 km s−1 of linecentre since over this spectral range, one sees photons thatunder-went essentially no scattering with free electrons (photons scatteredby free electrons receive a wavelength-shift and, statistically, endup somewhere in the wings; see discussion in Dessart et al. 2009).In this context, whatever the imposed deformation on the ejecta, thepolarisation at line centre is zero.7
Surprisingly the polarisation is parallel to the major axis(i.e.,positive; see top panel of Fig. 18) — this property is, naively, not
7 Equivalent simulations for Type II SNe may yield a residual polarisa-tion at line centre because these photons are emitted at a nonnegligibleelectron-scattering optical depth (Dessart & Hillier 2011). Spectrum forma-tion in SNe II-P and SNe IIn is drastically different.
expected since scattering of the light from a point source byan opti-cally thin prolate spheroid has the polarisation at right angles to themajor axis (Brown & McLean 1977). In our convention (and thatof Brown & McLean 1977), the polarisation is positive when itisparallel to the axis of symmetry (for further details, see Section 2 ofDessart & Hillier 2011). The reason for this behaviour in thecur-rent simulation is that the CSM is optically thick, and the observed(and hence scattered) flux predominantly escapes from equatorialregions, where the densities are lowest (Fig 19).
The correspondence between our simulations and the mor-phology of the polarised and of the total fluxes of SN 2010jl sug-gests first that our model for super-luminous SNe IIn like 2010jlis adequate. Secondly, the observed polarisation implies that theionised CSM causing the polarisation is significantly asymmetric.If axially symmetric, a pole to equator density ratio of∼3 couldexplain the observed continuum polarisation. While the CSMisasymmetric, it is however unclear whether the inner shell isalsoasymmetric — it does not need to be. Multi-dimensional radiationhydrodynamics simulations are needed to model the spatial prop-erties of the shocked CSM (for example, in the current context, theshock strength should also be latitude dependent, causing variationsin temperature, ionisation, velocities etc with angle), sothat we can
c© 2011 RAS, MNRAS000, 1–24

18 Luc Dessart, Edouard Audit, and D.J. Hillier
Figure 17. Same as Fig. 16, but now for a time of 208.3 d after the onset of interaction. In the left column, the greyscale is shown on a logarithmic scale. Fromtop to bottom (R15 = 10, 7.2, 6.4),
∑R>R15
δF (R, λ) represents 6, 41, and 94 per cent of the total emergent flux at 6800A. The flux contributions fromthe fast moving CDS and the slow moving CSM are clearly visible. The emission from the CDS is blue shifted, while the CSM emission is symmetric aroundline centre. Electron scattering affects the emitted photons from both components.
better characterise the nature of the asymmetry at the origin of theobserved polarisation in SNe IIn like 2010jl.
5 DEPENDENCY ON SOME MODEL PARAMETERS
Varying the properties of either the CSM mass or the explosionenergy can affect the emergent radiation. This has been discussedin the past for the bolometric luminosity or the colours (see,e.g., Chugai et al. 2004; Woosley et al. 2007; van Marle et al.2010;Moriya et al. 2013b). Here, we repeat such explorations to investi-gate the impact on spectral signatures as well.
5.1 Impact on the bolometric light curve
Taking model X as a reference, we produce models in which theSN ejecta kinetic energy is scaled by a factor of 3 (Xe3) or 10(Xe10). We produce models in which the CSM density is scaled bya factor of 3 (Xm3) or 6 (Xm6). We also consider combinations ofboth, with models Xe3m6 or Xe10m6. Finally, we consider modelXe3m6r, where the high-density CSM extends to 1.5×10¹⁶ cmrather than 1016 cm only. Table 1 summarises these model prop-erties.
These alterations produce a considerable diversity of bolomet-ric light curves (Fig. 20), in directions that are well understood. In-creasing the kinetic energy causes a much greater shock luminosityat all times, but since the CSM structure is not changed, the diffu-sion time through the CSM is unchanged (the time to maximum isdecreased by just a few days for higher SN ejecta kinetic energy).
The bolometric light curves shift upward for increasing energy.The mean radiation-energy density in the CSM also increaseswithshock luminosity, which raises the radiation temperature.Coloursare thus strongly affected, getting bluer for higher energy(see be-low and Table 1 where we give the bolometric correction and thecolourV − I at bolometric maximum).
Varying the CSM mass (corresponding in our approach to achange in mass loss rate) modulates the impedance of the “interac-tion engine”. For larger CSM density and total mass, more kineticenergy is extracted from the SN ejecta. This energy is convertedprimarily into radiation. Consequently, varying the CSM mass af-fects the light curve properties. Higher CSM mass implies higherCSM optical depth and a longer diffusion time, hence a delayedtime of peak. A larger CSM mass buffer implies more kinetic en-ergy is tapped so the bolometric maximum is more luminous. Inthemodel set X, Xm3, Xm6, the total energy radiated is 0.32, 0.49, and0.63×1051 erg (for the same ejecta kinetic energy of 1051 erg), so,the conversion efficiency can be considerably enhanced whentheCSM mass exceeds significantly the SN ejecta mass, with valueshere as high as∼ 70% (models Xe3m6, Xe10m6, or Xm6).
Combinations of higher CSM mass and higher ejecta ki-netic energy (e.g., model Xe3m6) ) shift the reference model(quite suitable to SN 2010jl) to the domain where SN 2006gy lies(Smith et al. 2007), with peak luminosities of the order of a few1044 erg s−1 sustained for 2-3 months and a peak time that occurslater (∼2 months after the onset of the interaction).
Finally, extending the region of high density in the CSM from1016 to 1.5×1016 cm (models Xe3m6r versus model Xe3m6) leads
c© 2011 RAS, MNRAS000, 1–24

Super-luminous Type IIn SNe 19
0
1
2
3
4
5
Flux[normalised] Hα SN 2010jl
−6000 −4000 −2000 0 2000 4000 6000
Velocity [km s−1]
0
1
2
Polarisation[%
]
Figure 18. Top: Total and polarised flux across the Hα line and the over-lapping continuum for different inclinations (90◦ corresponds to an equa-torial view), at 41.7 d after the onset of the interaction (hence close to theepoch of maximum light), showing the larger continuum polarisation, thedepolarisation across the line profile, and the unpolarisedline core. Theprolate asymmetry is characterised by a pole-to-equator density ratio of 2.6(A1 = 1.6). Middle: Same as top, but now showing the percentage polar-isation for different magnitudes of the asymmetry (A1 values between 0.1and 0.6) and for an equatorial view.Bottom:Spectro-polarimetric observa-tions of the Hα line for SN 2010jl on November 18.2UT (Patat et al. 2011),which is within a few days of our model time (left panel). In the context ofour model, the observed polarisation may be interpreted as arising from aprolate CSM with a pole-to-equator density ratio of∼ 3.
Figure 19. Colour map of the specific intensity (scaled by the impact pa-rameterp) on the plane of the sky at−3992 km s−1 from the Hα line centre(this Doppler velocity corresponds to a continuum region — see top panelof Fig. 18), for the model withA1 = 1.6, at 41.7 d after the onset of theinteraction, and seen at a 90◦ inclination (i.e. edge-on). We overplot seg-ments (black bars) showing the local polarisation strengthand orientation(the length corresponding to 100 per cent polarisation is shown at the bot-tom right).
to a sustained high luminosity beyond 300 d. In fact, all the lightcurves in Fig 20 show a break after 150-300 d, except for modelXe3m6r. This light curve break in our simulations is associatedwith the shock (or the CDS) reaching the outer edge of the denserparts of the CSM (the shock in model Xe3m6r has not yet reached1.5×1016 cm at the last time shown in Fig. 20) and starting to en-counter lower density material (see Table 1 for details).
The pre-acceleration of the CSM by the radiation from theshock depends on the adopted configuration. In model X, weobtained a modest enhancement in CSM velocity from 100 to200 km s−1. This pre-acceleration is stronger when we use a largerejecta kinetic energy (stronger shock, higher luminosity)or if the
c© 2011 RAS, MNRAS000, 1–24

20 Luc Dessart, Edouard Audit, and D.J. Hillier
CSM density is increased (there is a delicate balance to get heresince a higher CSM density means a higher opacity and thus moreradiation momentum extracted but it also implies more inertia) —see Fig. 21.
5.2 Impact on maximum light spectra
The diversity in bolometric light curves discussed in the preced-ing section is also strongly present in the spectra at maximum light(Fig. 22). For the highest energy explosion, the shift in temperaturein the ionised CSM leads to a major rise in ionisation for hydro-gen and helium, producing very blue and nearly featureless spectra(whatever blanketing from Fe occurs in the UV and far-UV). Formodels with enhanced CSM mass, the temperature/ionisationcon-ditions are comparable to reference model X, but the line fluxes areincreased. The higher the CSM mass, the redder the colour at peak.
Interestingly, in models with very high CSM mass, althoughthe Balmer line fluxes are much higher, the extent of the elec-tron scattering wings does not increase beyond a maximum of∼3000 km s−1. The likely reason is that line photons do not justscatter off free electrons in the CSM — there is a non-zero prob-ability that they are absorbed in a bound-free or free-free processleading to photon destruction. The broader and blue shiftedlinesseen at late times require that we see photons blue shifted byex-pansion. For the present case, the broader blue-shifted componentseen at late times arises from the CDS. We see a blue-shift since theCDS absorbs emission from the far side of the shell. Thus the Hαblueshift seen in SN 2010jl (Smith et al. 2012; Zhang et al. 2012;Fransson et al. 2014) might simply just stem from an optical-deptheffect, without any dust intervening in the process. As the opticaldepth of the shell declines, we expect the profile to become moresymmetric.
6 CONCLUSION
In this work, we have presented numerical simulations for inter-acting SNe in which both the kinetic energy of the explosively-produced inner shell and the mass of the wind-produced outershellare very large. We used an inner shell kinetic energy of 1051 erg ormore, and a CSM mass of at least 3 M⊙. These simulations corre-spond to possible configurations for super-luminous SNe IIn.
Our contribution is novel because we post-process our multi-group radiation-hydrodynamics simulations with radiative trans-fer tools, to compute non-LTE spectra and polarisation signatures.With this more global approach, we can study the numerous fea-tures that make super-luminous SNe IIn unique.
We find that the light curve of a super-luminous SN IIn is com-posed of several distinct phases. Initially, the cold CSM isneutraland transparent to optical photons. As the interaction starts, the ra-diation from the shock drives an ionisation front through the CSMand makes it optically thick at all wavelengths. This first phasetakes about a week after the onset of the interaction, which cor-responds roughly to the light crossing time through the shell. Atthe time we record the first emerging photons from the SN IIn, theCSM is therefore already optically thick. In our reference model,the photosphere is then located at∼ 7×1015 cm and will remain atthat radius for months. The second phase corresponds to the shockcrossing of the optically thick CSM. In our reference model,thisphases lasts
∼> 200 d. Over this duration, the shock is located below
the photosphere, at an electron-scattering optical depth of about15 initially. Radiation from the shock is thus continuouslyreleased
deep in the CSM and comes out on a diffusion time scale. This con-text is analogous to optically thick ejecta influenced by radioactivedecay, although the shock energy is not all channeled into radiationenergy. Here, the shock luminosity decreases with time becauseof the decreasing shock strength as more and more CSM is beingswept up. Although the CSM hardly expands, the diffusion timescale and the optical depth decrease because of the expansion of theinteraction region. We thus obtain a bell shape morphology for thelight curve around maximum. This variation is not associated by themigration of the photospheric radius, but by the variation in shockluminosity, radiation temperature, and CSM/photospherictemper-ature. Optical depth effects on the light curve persist for as long asthe shock is located below the∼7×1015 cm. The third phase startswhen the shock overtakes this location. The photosphere then fol-lows the dense shell.
Our multi-group radiation hydrodynamics simulation pro-duces the basic light curve morphology of type IIn super-luminousSNe. Our reference model was tuned to roughly match the inferredproperties of SN 2010jl (Fransson et al. 2014), but other simula-tions with different inner-shell kinetic energy and CSM mass en-compass a variety of light curves, including extreme eventslikeSN 2006gy (Smith et al. 2007).
We illustrate the importance of performingmulti-groupradi-ation hydrodynamics. By contrast,grey (i.e., one-group) radiationhydrodynamics simulations do not account adequately for the opac-ity of the material and produce a discrepant SN IIn light curve mor-phology.
Our simulations confirm the earlier work of Moriya et al.(2013b) that the shell shocked model of Smith & McCray (2007)is not physically sound. The reason is that in interacting SNe, evena massive CSM cannot have a continuum optical depth greater thana few tens. Because such CSM are by nature extended, the shock-crossing time far exceeds the time it takes the shock luminosityto diffuse through the optically thick layers. The situation is anal-ogous to shock emergence in an exploding star, except that herethe configuration is quasi steady state — it persists for as longas there is optically-thick CSM material ahead of the shock.Ourresults, which are in agreement with the independent simulationsof Moriya et al. (2013b), provide a simple and physically consis-tent explanation for the light curves of type IIn super-luminousSNe. Overall, the shell-shocked model really belongs to thedomainof (successful) core-collapse SNe in which a radiation-dominatedshock crosses a stellar envelope whose optical depth is hugeevery-where apart from the surface.
The non-LTE radiative transfer simulations, based on the ra-diation hydrodynamics simulations, produce spectra that are ini-tially blue and redden progressively as the CSM/photosphere coolsdown after bolometric maximum. We obtain symmetric emissionprofiles, broadened by non-coherent scattering with free electrons(of thermal origin), with wings that extend up to 3000 km s−1
from line centre, and together with a narrower P-Cygni profile(<100 km s−1) forming in the outer cold CSM. Varying the ejectakinetic energy or the CSM mass alters the shock luminosity, themean radiation energy in the optically thick CSM, and causesclearvariations in colour and ionisation. Varying the CSM density by afactor of 6 changes the strength of recombination lines but doesnot produce broader lines at bolometric maximum, despite the en-hanced electron-scattering optical depth. Photons emitted at an op-tical depthτ performτ 2 scatterings before escaping. If the albedois 99%, photons coming fromτ >10 are likely absorbed within theionised CSM and photons do not obtain arbitrarily large frequency
c© 2011 RAS, MNRAS000, 1–24

Super-luminous Type IIn SNe 21
Figure 20. Light curve diversity obtained by varying some of the parameters of our reference model X (see details in Table 1). Modelswhose name containsen have a SN ejecta kinetic energy scaled by a factorn relative to model X. Models whose name contains mn have a CSM mass loss rate scaled by a factornrelative to model X. Model Xe3m6r differs from the rest because the dense part of the CSM extends to 1.5×1016 cm rather than 1016 cm.
shifts from line centre. Broader electron scattering wingsmay arisefor a greater albedo.
Our simulations indicate that photon absorption is probablyefficient only in the Lyman continuum. At low photon frequen-cies, absorptive processes are weak and therefore photon absorp-tion occurs only if the total optical depth at the site of emission islarge (say above 10) — in our reference simulation with a massloss rate of 0.1 M⊙ yr−1 for the CSM, the maximum CSM con-tinuumτ is only 15. Early on, the optical depth in the CDS is highenough to ensure complete thermalisation. Then, line broadening isprobably dominated by non-coherent scattering with thermal elec-trons. However, at later times, thermalisation does not occur at alldepths in the CSM. In the reference model, this is associatedwithan increased broadening and blueward asymmetry of line profileswith time. These features are also present in the observations ofSN 2010jl (e.g., Hα; Fig. 12) — this suggests a growing contri-bution from Doppler broadening, connected with photon emissionfrom the fast expanding CDS. We believe this hybrid line forma-tion is at the origin of the very large Hα line width in SN 2010jl,as well as the blueshift of its peak emission. Interestingly, the mod-est peak luminosities and the absence of broad lines at all times
in events like SN 1994W (Chugai et al. 2004; Dessart et al. 2009)or SN 2011ht (Humphreys et al. 2012) are perplexing because theemission from the CDS should be seen once the CSM becomestransparent.
To complement our radiation hydrodynamics simulations withHERACLES and our non-LTE radiative transfer simulations withCMFGEN, which assume spherical symmetry, we present some po-larisation simulations for aspherical but axially symmetric configu-rations. Our results for a prolate morphology with a pole-to-equatordensity ratio of∼3 yield a maximum
∼< 2% continuum polarisa-
tion compatible with the value observed for SN 2010jl (Patatet al.2011). In this context, the asymmetry may stem only from theCSM, although both inner and outer shells may be asymmetric.Infuture work, we will extend theHERACLESsimulations to 2-D tostudy large scale asymmetries and to 3-D to study the stability ofthe dense shell.
ACKNOWLEDGMENTS
We thank Ralph Sutherland and Claes Fransson for discussionand comments, and Nando Patat for providing the spectropolari-
c© 2011 RAS, MNRAS000, 1–24

22 Luc Dessart, Edouard Audit, and D.J. Hillier
Figure 21. Velocity profiles from theHERACLES simulations for modelsXe10m6 (top), Xe3m6r (middle), and Xm6 (bottom). The epochsshowncorrespond to 0.01,1, 2, 3, 4, 5, 6, 7, 8, 10, 20, 30, 50, 100, 150, 200, 250,and 300 d after the onset of the interaction. Notice the pre-acceleration thattakes place ahead of the shock.
metric data for SN 2010jl published in Patat et al. (2011). Dessartacknowledges financial support from the European Communitythrough an International Re-integration Grant, under grant num-ber PIRG04-GA-2008-239184, and from “Agence Nationale de laRecherche” grant ANR-2011-Blanc-SIMI-BS56-0007. Hillier ac-knowledges support from STScI theory grant HST-AR-12640.01,and NASA theory grant NNX10AC80G. This material is basedupon work partially supported by the National Science Foundationunder grant number AST-1311993. Hillier would also like to ac-knowledge the hospitality and support of the DistinguishedVisitorprogram at the Research School of Astronomy and Astrophysics
(RSAA) at the Australian National University (ANU). This workwas also supported in part by the National Science Foundation un-der Grant No. PHYS-1066293 and benefited from the hospitalityof the Aspen Center for Physics. This work was granted accesstothe HPC resources of CINES under the allocations c2013046608and c2014046608 made by GENCI (Grand Equipement Nationalde Calcul Intensif). This work also utilised computing resources ofthe Mesocentre SIGAMM, hosted by the Observatoire de la Coted’Azur, Nice, France.
REFERENCES
Anderson, J. P., Dessart, L., Gutierrez, C. P., Hamuy, M., Mor-rell, N. I., Phillips, M., Folatelli, G., Stritzinger, M. D., Freed-man, W. L., Gonzalez-Gaitan, S., McCarthy, P., Suntzeff,N., &Thomas-Osip, J. 2014, MNRAS, 441, 671
Arnett, W. D. 1982, ApJ, 253, 785Barkat, Z., Rakavy, G., & Sack, N. 1967, Physical Review Letters,18, 379
Blondin, J. M., Lundqvist, P., & Chevalier, R. A. 1996, ApJ, 472,257
Brown, J. C. & McLean, I. S. 1977, A&A, 57, 141Busche, J. R. & Hillier, D. J. 2005, AJ, 129, 454Castor, J. I. 1970, MNRAS, 149, 111Castor, J. I., Abbott, D. C., & Klein, R. I. 1975, ApJ, 195, 157Chen, K.-J., Woosley, S., Heger, A., Almgren, A., & Whalen, D. J.2014, ApJ, 792, 28
Chevalier, R. A. & Irwin, C. M. 2011, ApJL, 729, L6Chugai, N. N. 2001, MNRAS, 326, 1448Chugai, N. N., Blinnikov, S. I., Cumming, R. J., Lundqvist, P.,Bragaglia, A., Filippenko, A. V., Leonard, D. C., Matheson,T.,& Sollerman, J. 2004, MNRAS, 352, 1213
Chugai, N. N. & Danziger, I. J. 1994, MNRAS, 268, 173Dessart, L. & Hillier, D. J. 2005a, A&A, 439, 671—. 2005b, A&A, 437, 667—. 2011, MNRAS, 415, 3497Dessart, L., Hillier, D. J., Gezari, S., Basa, S., & Matheson, T.2009, MNRAS, 394, 21
Dessart, L., Hillier, D. J., Waldman, R., & Livne, E. 2013, MN-RAS, 433, 1745
Dessart, L., Livne, E., & Waldman, R. 2010a, MNRAS, 408, 827—. 2010b, MNRAS, 405, 2113Dopita, M. A., Cohen, M., Schwartz, R. D., & Evans, R. 1984,ApJL, 287, L69
Dubroca, B. & Feugeas, J. 1999, CRAS, 329, 915Fransson, C., Ergon, M., Challis, P. J., Chevalier, R. A., France,K., Kirshner, R. P., Marion, G. H., Milisavljevic, D., Smith, N.,Bufano, F., Friedman, A. S., Kangas, T., Larsson, J., Mattila, S.,Benetti, S., Chornock, R., Czekala, I., Soderberg, A., & Soller-man, J. 2014, ApJ, 797, 118
Gonzalez, M., Audit, E., & Huynh, P. 2007, A&A, 464, 429Grasberg, E. K. & Nadezhin, D. K. 1986, Soviet Astronomy Let-ters, 12, 68
Harries, T. J., Hillier, D. J., & Howarth, I. D. 1998, MNRAS, 296,1072
Hillier, D. J. 1991, A&A, 247, 455Hillier, D. J. & Dessart, L. 2012, MNRAS, 424, 252Hillier, D. J. & Miller, D. L. 1998, ApJ, 496, 407Hoffman, J. L., Leonard, D. C., Chornock, R., Filippenko, A.V.,Barth, A. J., & Matheson, T. 2008, ApJ, 688, 1186
Humphreys, R. M., Davidson, K., Jones, T. J., Pogge, R. W.,
c© 2011 RAS, MNRAS000, 1–24
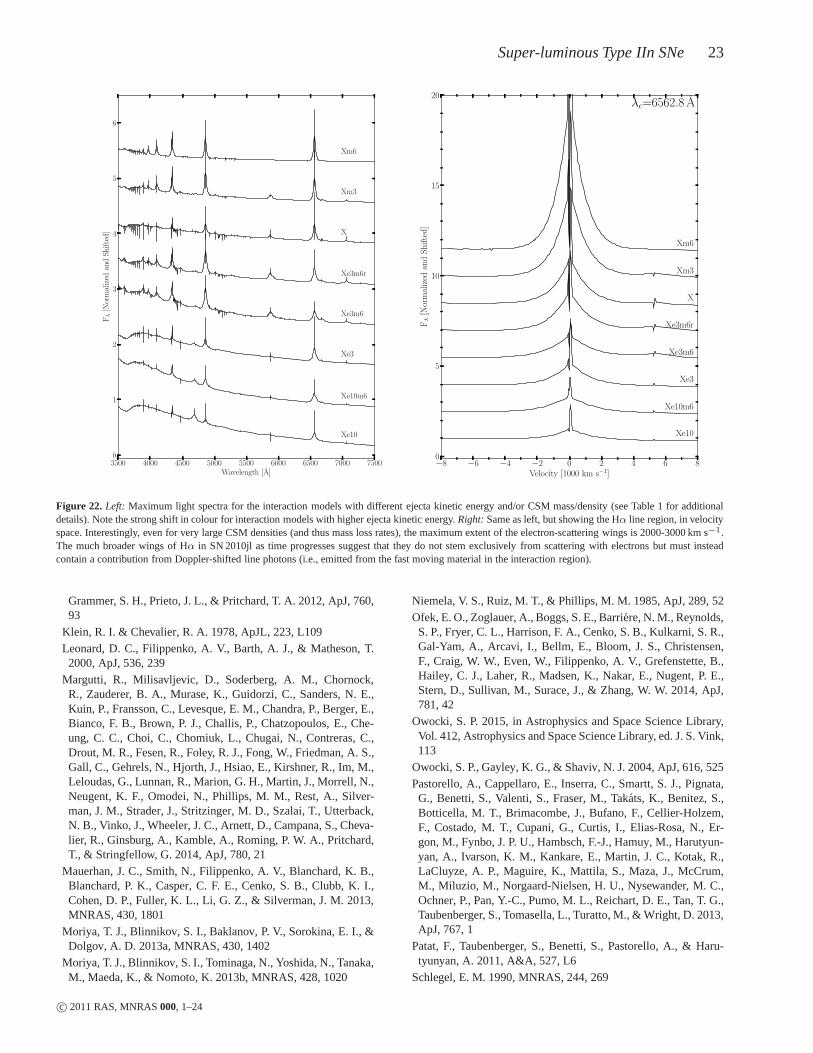
Super-luminous Type IIn SNe 23
Figure 22. Left: Maximum light spectra for the interaction models with different ejecta kinetic energy and/or CSM mass/density (see Table 1 for additionaldetails). Note the strong shift in colour for interaction models with higher ejecta kinetic energy.Right:Same as left, but showing the Hα line region, in velocityspace. Interestingly, even for very large CSM densities (and thus mass loss rates), the maximum extent of the electron-scattering wings is 2000-3000 km s−1.The much broader wings of Hα in SN 2010jl as time progresses suggest that they do not stem exclusively from scattering with electrons but must insteadcontain a contribution from Doppler-shifted line photons (i.e., emitted from the fast moving material in the interaction region).
Grammer, S. H., Prieto, J. L., & Pritchard, T. A. 2012, ApJ, 760,93
Klein, R. I. & Chevalier, R. A. 1978, ApJL, 223, L109Leonard, D. C., Filippenko, A. V., Barth, A. J., & Matheson, T.2000, ApJ, 536, 239
Margutti, R., Milisavljevic, D., Soderberg, A. M., Chornock,R., Zauderer, B. A., Murase, K., Guidorzi, C., Sanders, N. E.,Kuin, P., Fransson, C., Levesque, E. M., Chandra, P., Berger, E.,Bianco, F. B., Brown, P. J., Challis, P., Chatzopoulos, E., Che-ung, C. C., Choi, C., Chomiuk, L., Chugai, N., Contreras, C.,Drout, M. R., Fesen, R., Foley, R. J., Fong, W., Friedman, A. S.,Gall, C., Gehrels, N., Hjorth, J., Hsiao, E., Kirshner, R., Im, M.,Leloudas, G., Lunnan, R., Marion, G. H., Martin, J., Morrell, N.,Neugent, K. F., Omodei, N., Phillips, M. M., Rest, A., Silver-man, J. M., Strader, J., Stritzinger, M. D., Szalai, T., Utterback,N. B., Vinko, J., Wheeler, J. C., Arnett, D., Campana, S., Cheva-lier, R., Ginsburg, A., Kamble, A., Roming, P. W. A., Pritchard,T., & Stringfellow, G. 2014, ApJ, 780, 21
Mauerhan, J. C., Smith, N., Filippenko, A. V., Blanchard, K.B.,Blanchard, P. K., Casper, C. F. E., Cenko, S. B., Clubb, K. I.,Cohen, D. P., Fuller, K. L., Li, G. Z., & Silverman, J. M. 2013,MNRAS, 430, 1801
Moriya, T. J., Blinnikov, S. I., Baklanov, P. V., Sorokina, E. I., &Dolgov, A. D. 2013a, MNRAS, 430, 1402
Moriya, T. J., Blinnikov, S. I., Tominaga, N., Yoshida, N., Tanaka,M., Maeda, K., & Nomoto, K. 2013b, MNRAS, 428, 1020
Niemela, V. S., Ruiz, M. T., & Phillips, M. M. 1985, ApJ, 289, 52Ofek, E. O., Zoglauer, A., Boggs, S. E., Barriere, N. M., Reynolds,S. P., Fryer, C. L., Harrison, F. A., Cenko, S. B., Kulkarni, S. R.,Gal-Yam, A., Arcavi, I., Bellm, E., Bloom, J. S., Christensen,F., Craig, W. W., Even, W., Filippenko, A. V., Grefenstette,B.,Hailey, C. J., Laher, R., Madsen, K., Nakar, E., Nugent, P. E.,Stern, D., Sullivan, M., Surace, J., & Zhang, W. W. 2014, ApJ,781, 42
Owocki, S. P. 2015, in Astrophysics and Space Science Library,Vol. 412, Astrophysics and Space Science Library, ed. J. S. Vink,113
Owocki, S. P., Gayley, K. G., & Shaviv, N. J. 2004, ApJ, 616, 525Pastorello, A., Cappellaro, E., Inserra, C., Smartt, S. J.,Pignata,G., Benetti, S., Valenti, S., Fraser, M., Takats, K., Benitez, S.,Botticella, M. T., Brimacombe, J., Bufano, F., Cellier-Holzem,F., Costado, M. T., Cupani, G., Curtis, I., Elias-Rosa, N., Er-gon, M., Fynbo, J. P. U., Hambsch, F.-J., Hamuy, M., Harutyun-yan, A., Ivarson, K. M., Kankare, E., Martin, J. C., Kotak, R.,LaCluyze, A. P., Maguire, K., Mattila, S., Maza, J., McCrum,M., Miluzio, M., Norgaard-Nielsen, H. U., Nysewander, M. C.,Ochner, P., Pan, Y.-C., Pumo, M. L., Reichart, D. E., Tan, T. G.,Taubenberger, S., Tomasella, L., Turatto, M., & Wright, D. 2013,ApJ, 767, 1
Patat, F., Taubenberger, S., Benetti, S., Pastorello, A., &Haru-tyunyan, A. 2011, A&A, 527, L6
Schlegel, E. M. 1990, MNRAS, 244, 269
c© 2011 RAS, MNRAS000, 1–24
24 Luc Dessart, Edouard Audit, and D.J. Hillier
Schulte-Ladbeck, R. E., Nordsieck, K. H., Taylor, M., Nook,M. A., Bjorkman, K. S., Magalhaes, A. M., & Anderson, C. M.1991, ApJ, 382, 301
Smith, N., Li, W., Foley, R. J., Wheeler, J. C., & et al. 2007, ApJ,666, 1116
Smith, N. & McCray, R. 2007, ApJL, 671, L17Smith, N., Silverman, J. M., Filippenko, A. V., Cooper, M. C.,Matheson, T., Bian, F., Weiner, B. J., & Comerford, J. M. 2012,AJ, 143, 17
Sollerman, J., Cumming, R. J., & Lundqvist, P. 1998, ApJ, 493,933
Stathakis, R. A. & Sadler, E. M. 1991, MNRAS, 250, 786Stoll, R., Prieto, J. L., Stanek, K. Z., Pogge, R. W., Szczygieł,D. M., Pojmanski, G., Antognini, J., & Yan, H. 2011, ApJ, 730,34
Turatto, M., Cappellaro, E., Danziger, I. J., Benetti, S., Gouiffes,C., & della Valle, M. 1993, MNRAS, 262, 128
van Marle, A. J., Smith, N., Owocki, S. P., & van Veelen, B. 2010,MNRAS, 407, 2305
Vaytet, N. M. H., Audit, E., Dubroca, B., & Delahaye, F. 2011,JQSRT, 112, 1323
Wang, L., Howell, D. A., Hoflich, P., & Wheeler, J. C. 2001, ApJ,550, 1030
Whalen, D. J., Even, W., Lovekin, C. C., Fryer, C. L., Stiavelli,M., Roming, P. W. A., Cooke, J., Pritchard, T. A., Holz, D. E.,&Knight, C. 2013, ApJ, 768, 195
Williams, G. G., Dessart, L., Hoffman, J. L., Huk, L. N., Leonard,D. C., Milne, P., Smith, N., & Smith, P. S. 2014, in AmericanAstronomical Society Meeting Abstracts, Vol. 223, 354.22
Woosley, S. E., Blinnikov, S., & Heger, A. 2007, Nature, 450,390Zel’dovich, Y. B. & Raizer, Y. P. 1967, Physics of shock wavesand high-temperature hydrodynamic phenomena
Zhang, T., Wang, X., Wu, C., Chen, J., Chen, J., Liu, Q., Huang,F., Liang, J., Zhao, X., Lin, L., Wang, M., Dennefeld, M., Zhang,J., Zhai, M., Wu, H., Fan, Z., Zou, H., Zhou, X., & Ma, J. 2012,AJ, 144, 131
c© 2011 RAS, MNRAS000, 1–24